FOCUSED VISION DYNAMIC EXECUTION
340
FOCUSED VISION DYNAMIC EXECUTION ANNUAL REPORT 2016
-
Upload
khangminh22 -
Category
Documents
-
view
0 -
download
0
Transcript of FOCUSED VISION DYNAMIC EXECUTION

FOCUSED VISIONDYNAMIC EXECUTIONA N N U A L R E P O R T 2 0 1 6


FOCUSED VISIONDYNAMIC EXECUTION
CONTENTS
2 VISION, MISSION AND FCL GROUP STRATEGIES
3 FCL GROUP AT A GLANCE
6 OUR GLOBAL PRESENCE
8 OUR MILESTONES
10 GROUP STRUCTURE
11 FINANCIAL HIGHLIGHTS
12 BOARD OF DIRECTORS
18 GROUP MANAGEMENT
23 CORPORATE INFORMATION
24 CHAIRMAN’S STATEMENT
27 GROUP CEO’S STATEMENT
30 BUSINESS REVIEW
• SINGAPORE
• AUSTRALIA
• HOSPITALITY
• INTERNATIONAL BUSINESS
68 INVESTOR RELATIONS
70 TREASURY HIGHLIGHTS
72 SUSTAINABILITY REPORT
131 AWARDS AND ACCOLADES
134 ENTERPRISE-WIDE RISK MANAGEMENT
137 CORPORATE GOVERNANCE REPORT
166 FINANCIAL STATEMENTS
304 PARTICULARS OF GROUP PROPERTIES
326 INTERESTED PERSON TRANSACTIONS
327 SHAREHOLDING STATISTICS
329 NOTICE OF ANNUAL GENERAL MEETING
PROXY FORM
FCL FACT SHEET
All figures in this Annual Report are in Singapore dollars unless otherwise specified.
The Frasers Centrepoint group of companies has always shared common ground, in which each entity is built on the foundations of integrity and excellence – key values that continue to guide every aspect of our business operations today. Inspired by our heritage, this year’s annual report features a repeat motif of our logo identity, to reference the Group’s ability to build on these values to strengthen our industry position and deliver sustainable returns to our shareholders. Frasers Centrepoint Limited (FCL) kept its focus on its strategic objectives. FCL’s business strategies in FY2015/16 remain centred around achieving sustainable growth via our core strategies of growing overseas earnings, strengthening our recurring income base and improving capital productivity. As markets evolve and conditions change, the dynamic execution of these strategies will be key to FCL’s ability to continue delivering on its strategic objectives. FCL’s commendable performance this year is testament to the effectiveness of our core strategies. By building on our strong foundations, FCL remains well-positioned to weather headwinds and deliver long-term value to our shareholders.
On the front cover (from top): 357 Collins Street, Melbourne, Victoria, Australia • Fraser Suites Edinburgh, UK • Rhodes Corporate Park, Rhodes, New South Wales, Australia • Watertown, Singapore

VISION
To be our stakeholders’ real estate company of choice
FCL GROUP STRATEGIES
MISSION
Creating value through space for today and tomorrow
SUSTAINABLE EARNINGS GROWTH
Achieve sustainable earnings growth through significant development
project pipeline, investment properties and fee income
OPTIMISE CAPITAL PRODUCTIVITY
Optimise capital productivity through REIT platforms and
active asset management initiatives
BALANCED PORTFOLIO
Grow asset portfolio in a balanced manner across
geographies and property segments
ACHIEVE SUSTAINABLE GROWTH AND DELIVER LONG-TERM SHAREHOLDER VALUE
FR
AS
ER
S C
EN
TR
EP
OIN
T L
IMIT
ED
& S
UB
SID
IAR
IES
2

Frasers Centrepoint Limited is a full-fledged international real estate company and one of Singapore’s top property companies. We invest in, develop and manage properties through three strategic business units – Singapore, Australia and Hospitality. Our business in Singapore, where we are listed and have our roots, focuses on residential, commercial and retail properties, while our Australia business has an additional focus on industrial properties. Our Hospitality business, meanwhile, owns and/or operates serviced apartments and hotels in more than 80 cities across Asia, Australia, Europe, and the Middle East. Over the years, we have developed an intimate knowledge of our core businesses. We also have a presence in our selected secondary markets of China, Southeast Asia and the United Kingdom, in which we invest in, and develop properties, through our International Business arm. We are bound by a common objective across our diverse geographic footprint – to develop real places for real people. Places that are inclusive, where young and old alike can live, work and play. We are proud of the contribution we make to the cities we operate in, from providing homes for families and accommodation for travellers, to efficient spaces that allow businesses to thrive and malls that serve the needs of local communities.
Our diverse portfolio, active management of assets across segments and geographies, and ability to strike the right balance between development, income-yielding assets and optimising capital
FCL GROUP AT A GLANCE
through our Singapore-listed REIT platforms, allow us to generate quality earnings throughout the entire real estate value chain. Combined with our financial and operational discipline, and the thoughtful execution of our strategies, we aim to deliver value to our stakeholders and the communities we serve.
We have a clear vision of the path ahead. Our experienced management team, proven expertise in multiple asset classes, and sound financials, mean we are well equipped to continue growing and creating innovative real estate solutions for today and tomorrow.
PROFIT BEFORE INTEREST AND TAXATION ($’M)
399.0434.1 443.0
564.5 580.0
390.2
704.4765.0
1,104.8
938.2
2007 2008 2009 2010 2011 2012 2013 2014 2015 2016
TOTAL ASSETS ($’M)
24,204
23,067
21,291
12,847
10,357
9,808
9,567
10,112
9,860
9,127
2016
2015
2014
2013
2012
2011
2010
2009
2008
2007
AN
NU
AL
RE
PO
RT
20
16
3

FCL GROUP AT A GLANCE
Frasers Centrepoint’s Singapore portfolio comprises two main divisions, namely the Development Properties and Commercial Properties divisions. The Development Properties division focuses on residential and commercial property development. Under its Frasers Centrepoint Homes brand, it has built and sold more than 17,000 homes in Singapore, with five residential and mixed-use projects under development (including joint-venture projects). Meanwhile, the Commercial Properties division owns and/or manages 12 shopping malls in Singapore under the Frasers Centrepoint Malls brand and 10 office and business space properties in Singapore and Australia. SGX-ST-listed Frasers Centrepoint Trust (FCT) and Frasers Commercial Trust (FCOT) hold six of the malls and six of the office and business spaces respectively.
FCL’s businesses in Australia comprise Frasers Property Australia (FPA) and Frasers Logistics & Industrial Trust (FLT).
FPA (incorporating Australand from August 2014) is one of Australia’s leading property groups, having been involved in property development since 1924. With offices in Sydney, Melbourne, Brisbane and Perth, its current operations are focused on investment in income-producing office and industrial properties, commercial and industrial property development and management and residential development (including land, housing and apartments).
FLT is the largest initial pure-play Australian industrial REIT in Singapore. It has a portfolio comprising 53 industrial properties valued at approximately $1.7 billion as at 30 September 2016.
SINGAPORE AUSTRALIA
Northpoint City, Singapore Discovery Point, Wolli Creek, New South Wales, Australia
FR
AS
ER
S C
EN
TR
EP
OIN
T L
IMIT
ED
& S
UB
SID
IAR
IES
4

The International Business unit comprises FCL’s investments in China, the United Kingdom (UK), Vietnam and Thailand.
China has been an important market for FCL since it built its first residential development – the 452-unit Jingan Four Seasons in Shanghai – in 2001. To date, FCL, through Frasers Property China, has developed close to 8,000 homes in China. It has three projects currently under development – residential projects in Suzhou and Shanghai, and an industrial/logistics park in Chengdu.
FCL made its first foray into the UK in 2000 with the development of Annandale House. Since then, Frasers Property UK has built over 600 homes and marketed various residential and mixed-use developments. It is currently developing three projects in London.
In Vietnam, FCL entered into a conditional agreement to acquire a 70% stake in a joint venture with local partners to develop a residential-cum-commercial project on a one-hectare prime site in Ho Chi Minh City. FCL also has a 75% interest in Me Linh Point, a 22-storey retail/office building in District 1, Ho Chi Minh City.
In Thailand, FCL has a 35.6% stake in the Golden Land Property Development Public Company Limited (Golden Land), which is listed on the Stock Exchange of Thailand. Golden Land’s portfolio comprises residential and commercial property development, as well as property management and property advisory services.
FCL’s hospitality business comprises Frasers Hospitality (FH) and Frasers Hospitality Trust (FHT).
FH has interest in and/or manages Gold-Standard serviced, hotel residences and boutique lifestyle hotels across Asia, Australia, Europe, and the Middle East.
Conceived with the lifestyle preferences of today’s discerning business and leisure travellers in mind, FH has three Gold-Standard serviced residences offerings – Fraser Suites, Fraser Place and Fraser Residence, a modern and stylish brand, Modena by Fraser, and a design-led hotel residence brand, Capri by Fraser. In addition, FH operates the UK boutique hotel brands of Malmaison and Hotel du Vin.
On track to achieve its target of 30,000 units by 2019, FH’s current global portfolio, including those in the pipeline, stands at over 23,400 units in 140 properties located in more than 80 cities worldwide.
FHT is the first global hotel and serviced apartment trust to be listed on the SGX-ST. FHT currently has 14 quality properties strategically located across key gateway cities in Asia, Australia, the United Kingdom and Germany.
HOSPITALITY INTERNATIONAL BUSINESS
Malmaison Manchester, UK Baitang One, Suzhou, China
AN
NU
AL
RE
PO
RT
20
16
5

SINGAPORE
FY2015/16 ($’000)
367,595FY2014/15 ($’000)
494,153
AUSTRALIA
FY2015/16 ($’000)
299,700FY2014/15 ($’000)
316,242
OUR GLOBAL PRESENCE
FY2015/16$938M 39%
32%
12%
13%
4%
SINGAPORE
AUSTRALIA
EUROPE
CHINA
OTHERS1
INDIA
MALAYSIA
NIGERIA2
SAUDI ARABIA
HUNGARYGERMANY
SPAIN
FRANCE
SWITZERLAND
TURKEY
BAHRAIN
UAE
QATAR
PROFIT BEFORE INTEREST AND TAXATION BREAKDOWN BY GEOGRAPHICAL SEGMENT
MALTA2
UNITED KINGDOM
REPUBLIC OF CONGO2
FY2014/15$1,105M 45%4%
29%
19%
3%
1 Includes Indonesia, Japan, Malaysia, New Zealand, the Philippines, Thailand and Vietnam2 Property pending opening
FR
AS
ER
S C
EN
TR
EP
OIN
T L
IMIT
ED
& S
UB
SID
IAR
IES
6

SOUTH KOREA
JAPAN
THAILAND
INDONESIA
SINGAPORE
NEW ZEALAND
PHILIPPINES
MALAYSIA
MYANMAR2
AUSTRALIA
CHINA
BAHRAIN
VIETNAM
CHINA
FY2015/16 ($’000)
120,296FY2014/15 ($’000)
209,572
• RESIDENTIALAustraliaChinaMalaysiaNew ZealandSingaporeThailandUnited KingdomVietnam
• COMMERCIALAustraliaChinaMalaysiaSingaporeThailandVietnam
• INDUSTRIALAustraliaChina
• HOSPITALITYAustraliaBahrainChinaFranceGermanyHungaryIndiaIndonesiaJapanMalaysiaMalta2
Myanmar2
Nigeria2
PhilippinesRepublic of Congo2
QatarSaudi ArabiaSingaporeSouth KoreaSpainSwitzerlandThailandTurkeyUAEUnited KingdomVietnam
26COUNTRIES
82 CITIES
OTHERS
FY2015/16 ($’000)
39,288FY2014/15 ($’000)
37,208
EUROPE
FY2015/16 ($’000)
111,320FY2014/15 ($’000)
47,587
AN
NU
AL
RE
PO
RT
20
16
7

1992Northpoint, Singapore’s pioneer suburban retail mall in Yishun; Bridgepoint, a retail mall in Sydney; and Alexandra Point, CPLs’ first office project, were launched
1993The Anchorage, CPL’s first residential project, was redeveloped from F&N Singapore’s old brewery and soft drink plants
1996CPL’s first overseas office project, Me Linh Point, a commercial and retail centre in Ho Chi Minh City was developed
OUR MILESTONES
1988 Centrepoint Properties Limited (CPL) was listed on the Main Board of the Singapore Exchange (SGX-ST)
1990 CPL became a subsidiary of Fraser and Neave, Limited (F&NL)
1997Alexandra Technopark, CPL’s first business space project was developed and launched
1998CPL’s first two hospitality projects, Fraser Suites and Fraser Place in Singapore, were launched
2000Pavilions on the Bay in Australia and Annandale House in the UK, CPL’s first overseas residential projects, were developed
2001 Jingan Four Seasons in Shanghai was CPL’s first residential project developed in China
2002 CPL launched serviced residences in the UK, South Korea and the Philippines
CPL was delisted from SGX-ST and became a wholly owned subsidiary of F&NL
Alexandra Technopark, Singapore
Northpoint Shopping Centre, Singapore
Jingan Four Seasons, Shanghai, China
FR
AS
ER
S C
EN
TR
EP
OIN
T L
IMIT
ED
& S
UB
SID
IAR
IES
8

2016Frasers Logistics & Industrial Trust was listed on the Main Board of SGX-ST
FCL acquired a 35.6% stake in Golden Land Property Development Public Company Limited (Golden Land) which is listed on the Stock Exchange of Thailand
FCL entered into a conditional agreement to acquire a 70% stake in a joint venture with local partners to develop a residential-cum-commercial project in District 2, Ho Chi Minh City, Vietnam
2006 CPL was rebranded Frasers Centrepoint Limited (FCL)
FCL launched its first REIT, Frasers Centrepoint Trust which is listed on the Main Board of SGX-ST
2015FCL acquired UK leading boutique lifestyle hotel brands Malmaison and Hotel du Vin.
Australand was rebranded as Frasers Property Australia
2008 FCL acquired a stake in Allco Commercial REIT (Allco) and the entire stake of Allco’s manager, and rebranded the REIT Frasers Commercial Trust (FCOT). FCOT is listed on the Main Board of SGX-ST
2013 FCL became a member of TCC Group
2014 FCL was listed by way of introduction on the Main Board of SGX-ST
Frasers Hospitality Trust was listed on the Main Board of SGX-ST. It is the first hotel and serviced residence stapled group with a global mandate, except Thailand, to be listed on the SGX-ST
FCL wholly acquired Australand, an Australian property company
Hotel du Vin Cambridge, UK
FLT's listing ceremony at the Singapore Exchange
AN
NU
AL
RE
PO
RT
20
16
9

GROUPSTRUCTURE
SIN
GA
PO
RE
AU
ST
RA
LIA
HO
SP
ITA
LIT
YIN
TER
NA
TIO
NA
L
Res
iden
tial
Com
mer
cial
Mul
ti-S
egm
ent
Ind
ustr
ial
Hos
pit
alit
yM
ulti
-Seg
men
t
LOG
ISTI
CS
& IN
DU
STR
IAL
FR
AS
ER
S C
EN
TR
EP
OIN
T L
IMIT
ED
& S
UB
SID
IAR
IES
10

20121 20131 20141 2015 2016
Revenue ($’m) 1,412 1,675 2,203 3,562 3,440
Profit before interest, fair value change on investment properties, taxation and exceptional items ($’m) 390 704 765 1,105 938
Profit before taxation ($’m)
Before fair value change on investment properties and exceptional items 330 612 721 955 796
After fair value change on investment properties and exceptional items 721 1,095 807 1,197 960
Attributable profit ($’m)
Before fair value change and exceptional items 252 402 470 544 480
After fair value change and exceptional items 643 722 501 771 597
Earnings per share (cents)2
Attributable profit before fair value change on investment properties and exceptional items 33.5 53.4 19.1 17.2 14.3
Attributable profit after fair value change on investment properties and exceptional items 85.4 95.9 20.4 25.0 18.4
Dividend per share
Ordinary shares (cents) 19.9 19.9 8.6 8.6 8.6
Net asset value (share capital & reserves) ($’m) 4,932 5,433 6,414 6,509 6,661
Net asset value per share ($) 6.11 6.32 2.223 2.25 2.30
Return on average shareholders’ equity (%)
Attributable profit before fair value change on investment properties and exceptional items 5.4 7.3 7.5 7.7 6.3
Notes1 Certain accounting policies or accounting standards had changed in the financial years ended 30 September 2012, 2013 and 2015.
The financial information for the year immediately preceding 2013 had been restated to reflect the relevant changes in the accounting policies or accounting standards. Financial information for 2013 and 2014 have been restated to take into account the retrospective adjustments relating to FRS 110 and FRS 111
2 Based on weighted average number of ordinary shares in issue. Prior to the listing of the Company on SGX-ST on 9 January 2014, in 2012 and 2013, weighted average number of ordinary shares was 753,292,000. In 2014, 2015 and 2016, weighted average number of shares was 2,457,316,000, 2,893,873,000 and 2,898,893,000 respectively
3 Calculated based on 2,889,813,000 shares in issue after the Company’s listing
FINANCIALHIGHLIGHTS
AN
NU
AL
RE
PO
RT
20
16
11

BOARD OF DIRECTORS As at 30 September 2016
CHAROEN SIRIVADHANABHAKDI, 72Non-Executive and Non-Independent Chairman
KHUNYING WANNA SIRIVADHANABHAKDI, 73Non-Executive and Non-Independent Vice Chairman
Date of first appointment as a director : 25 Oct 2013Date of last re-election as a director : 29 Jan 2016Length of service as a director (as at 30 Sep 2016) : 2 years 11 months
Board committee(s) served on• Board Executive Committee (Chairman)
Academic & Professional Qualification(s)• Honorary Doctoral Degree in Buddhism (Social Work) from
Mahachulalongkornrajavidyalaya, Thailand• Honorary Doctorate Degree in Business Administration,
Sasin Graduate Institute of Business Administration of Chulalongkorn University, Thailand
• Honorary Doctoral Degree in Hospitality Industry and Tourism, Christian University of Thailand, Thailand
• Honorary Doctoral Degree in Sciences and Food Technology, Rajamangala University of Technology Lanna, Thailand
• Honorary Doctoral Degree in International Business Administration, University of the Thai Chamber of Commerce, Thailand
• Honorary Doctoral Degree in Management, Rajamangala University of Technology Suvarnabhumi, Thailand
• Honorary Doctor of Philosophy in Business Administration, Mae Fah Luang University, Thailand
• Honorary Doctoral Degree in Business Administration, Eastern Asia University, Thailand
• Honorary Doctoral Degree in Management, Huachiew Chalermprakiet University, Thailand
• Honorary Doctoral Degree in Industrial Technology, Chandrakasem Rajabhat University, Thailand
• Honorary Doctoral Degree in Agricultural Business Administration, Maejo Institute of Agricultural Technology, Thailand
Present Directorships (as at 30 Sep 2016)Listed companies• Berli Jucker Public Company Limited (Chairman)• Big C Supercenter Public Company Limited (Chairman)• Fraser and Neave, Limited (Chairman)• Thai Beverage Public Company Limited (Chairman)
Others• Beer Thai (1991) Public Company Limited (Chairman)• Red Bull Distillery Group of Companies (Chairman)• Southeast Group Co., Ltd. (Chairman)• TCC Corporation Limited (formerly named
TCC Holding Co., Ltd.) (Chairman)• TCC Land Co., Ltd. (Chairman)
Major Appointments (other than Directorships)Nil
Past Directorships in listed companies held over the preceding three years (from 01 Oct 2013 to 30 Sep 2016)Nil
Past Major AppointmentsNil
OthersNil
Date of first appointment as a director : 07 Jan 2014 Date of last re-election as a director : 29 Jan 2016Length of service as a director (as at 30 Sep 2016) : 2 years 8 months
Board committee(s) served onNil
Academic & Professional Qualification(s)• Honorary Doctoral Degree (Management),
Mahidol University, Thailand• Honorary Doctorate of Philosophy (Business Management),
University of Phayao, Thailand• Honorary Doctoral Degree from the Faculty of Business
Administration and Information Technology, Rajamangala University of Technology Tawan-ok, Thailand
• Honorary Doctor of Philosophy in Social Sciences, Mae Fah Luang University, Thailand
• Honorary Doctoral Degree in Business Administration, Chiang Mai University, Thailand
• Honorary Doctoral Degree in Agricultural Business Administration, Maejo Institute of Agricultural Technology, Thailand
• Honorary Doctoral Degree in Bio-technology, Ramkhamhaeng University, Thailand
Present Directorships (as at 30 Sep 2016)Listed companies• Berli Jucker Public Company Limited (Vice Chairman)• Big C Supercenter Public Company Limited (Vice Chairman) • Fraser and Neave, Limited (Vice Chairman)• Thai Beverage Public Company Limited (Vice Chairman)
Others• Beer Thip Brewery (1991) Co., Ltd. (Chairman)• Sangsom Group of Companies (Chairman)• TCC Corporation Limited (formerly named TCC Holding
Co., Ltd.) (Vice Chairman)
Major Appointments (other than Directorships)Nil
Past Directorships in listed companies held over the preceding three years (from 01 Oct 2013 to 30 Sep 2016) Nil
Past Major AppointmentsNil
OthersNilF
RA
SE
RS
CE
NT
RE
PO
INT
LIM
ITE
D &
SU
BS
IDIA
RIE
S
12

CHARLES MAK MING YING, 64Non-Executive and Lead Independent Director
Date of first appointment as a director : 25 Oct 2013Date of last re-election as a director : 30 Jan 2015Length of service as a director (as at 30 Sep 2016) : 2 years 11 months
Board committee(s) served on• Audit Committee (Chairman)• Board Executive Committee (Vice Chairman)• Remuneration Committee• Nominating Committee• Risk Management Committee
Academic & Professional Qualification(s)• Master of Business Administration, PACE University, USA• Bachelor of Business Administration, PACE University, USA
Present Directorships (as at 30 Sep 2016)Listed companiesNil
Major Appointments (other than Directorships)• Morgan Stanley Asia Pacific (Vice Chairman)• Morgan Stanley International Wealth Management
(President)
Past Directorships in listed companies held over the preceding three years (from 01 Oct 2013 to 30 Sep 2016)• Fraser and Neave, Limited
Past Major Appointments• Chairman and Director of Bank Morgan Stanley AG• Director in Morgan Stanley Asia Limited and a member of
Morgan Stanley’s Asia Pacific Executive Committee, the Morgan Stanley Wealth Management Committee and the International Operating Committee
• Managing Director and Head of Morgan Stanley Asia Pacific Private Wealth Management
• Executive Director and Senior Investment Adviser of Morgan Stanley’s Private Wealth Management Group
Others• Senior Advisor to Morgan Stanley Asia’s Investment
Banking Division
PANOTE SIRIVADHANABHAKDI, 39Group Chief Executive Officer (Designate)* and Non-Independent Director
Date of first appointment as a director : 08 Mar 2013Date of last re-election as a director : 29 Jan 2016Length of service as a director (as at 30 Sep 2016) : 3 years 6 months
Board committee(s) served on• Board Executive Committee• Remuneration Committee (stepped down with effect from
1 Oct 2016)• Risk Management Committee
Academic & Professional Qualification(s)• Master of Science in Analysis, Design and Management
of Information Systems, London School of Economics and Political Science, UK
• Bachelor of Science in Manufacturing Engineering, Boston University, USA
• Certificate in Industrial Engineering and Economics, Massachusetts University, USA
Present Directorships (as at 30 Sep 2016)Listed companies• Berli Jucker Public Company Limited• Golden Land Property Development Public Company
Limited (Vice Chairman)• Siam Food Products Public Company Limited• Thai Beverage Public Company Limited• Univentures Public Company Limited
Others• Australand Property Limited• Australand Investments Limited• Frasers Property Limited• Frasers Property Australia Pty Limited• Frasers Hospitality Asset Management Pte Ltd, Manager of
Frasers Hospitality Real Estate Investment Trust• Frasers Hospitality Trust Management Pte Ltd, Manager of
Frasers Hospitality Business Trust• Frasers Logistics & Industrial Asset Management Pte Ltd,
Manager of Frasers Logistics & Industrial Trust• Beer Thip Brewery (1991) Co., Ltd.• Blairmhor Distillers Limited• Blairmhor Limited• InterBev (Singapore) Limited• International Beverage Holdings (China) Limited• International Beverage Holdings Limited• International Beverage Holdings (UK) Limited• Sura Bangyikhan Group of Companies
Major Appointments (other than Directorships)Nil
Past Directorships in listed companies held over the preceding three years (from 01 Oct 2013 to 30 Sep 2016)• Fraser and Neave, Limited
Past Major Appointments• Chief Executive Officer of Univentures Public Company
Limited
OthersNil
* Mr Panote Sirivadhanabhakdi has been appointed Group Chief Executive Officer with effect from 1 Oct 2016
AN
NU
AL
RE
PO
RT
20
16
13

PHILIP ENG HENG NEE, 70Non-Executive and Independent Director
Date of first appointment as a director : 25 Oct 2013Date of last re-election as a director : 30 Jan 2015Length of service as a director (as at 30 Sep 2016) : 2 years 11 months
Board committee(s) served on• Remuneration Committee (Chairman)• Audit Committee
Academic & Professional Qualification(s)• Bachelor of Commerce in Accountancy, University of
New South Wales, Australia• Associate Member, Institute of Chartered Accountants in
Australia
Present Directorships (as at 30 Sep 2016)Listed companies• Ezra Holdings Limited• MDR Limited (Chairman)• PT Adira Dinamika Multi Finance Tbk (Commissioner)• The Hour Glass Limited
Others• Frasers Property Australia Pty Limited• Frasers Centrepoint Asset Management Ltd, Manager of
Frasers Centrepoint Trust• Hektar Asset Management Sdn Bhd• Heliconia Capital Management Pte. Ltd.• KK Women’s and Children’s Hospital Pte. Ltd.• NTUC Income• Singapore Health Services Pte. Ltd.• Vanda 1 Investments Pte. Ltd.
Major Appointments (other than Directorships)Ministry of Foreign Affairs : Singapore’s Non-Resident High Commissioner to Canada
Past Directorships in listed companies held over the preceding three years (from 01 Oct 2013 to 30 Sep 2016)• Asia Pacific Breweries Limited• Fraser and Neave, Limited
Past Major Appointments• Group Managing Director, Jardine Cycle and Carriage Group
OthersNil
CHAN HENG WING, 70Non-Executive and Independent Director
Date of first appointment as a director : 25 Oct 2013Date of last re-election as a director : 29 Jan 2016Length of service as a director (as at 30 Sep 2016) : 2 years 11 months
Board committee(s) served on• Nominating Committee• Risk Management Committee• Remuneration Committee (appointed with effect from 1 Oct 2016)
Academic & Professional Qualification(s)• Master of Science, Columbia Graduate School of Journalism,
USA• Master of Arts, University of Singapore• Bachelor of Arts (Honours), University of Singapore
Present Directorships (as at 30 Sep 2016)Listed companies• Banyan Tree Holdings Ltd.• EC World Asset Management Pte Ltd• Fusang Corp (Labuan)• Fusang Family Office Pte Ltd (S)• Fusang Family Office Pte Ltd (HK)• Fusang Investment Office Pte Ltd (S)• Fusang Investment Office Pte Ltd (HK)
Others• Precious Quay Pte. Ltd.• Precious Treasures Pte. Ltd.
Major Appointments (other than Directorships)• Ministry of Foreign Affairs: Senior Advisor and Non-Resident
High Commissioner to Bangladesh• Milken Institute Asia Center (Chairman)
Past Directorships in listed companies held over the preceding three years (from 01 Oct 2013 to 30 Sep 2016)• Fraser and Neave, Limited
Past Major Appointments• Managing Director, International Relations, Temasek Holdings• Singapore’s Consul General to Hong Kong and Shanghai• Singapore’s Ambassador to Thailand• Press Secretary to Prime Minister Goh Chok Tong• Director of the Media Division, Ministry of Communications
and Information
OthersNil
BOARD OF DIRECTORS As at 30 September 2016
FR
AS
ER
S C
EN
TR
EP
OIN
T L
IMIT
ED
& S
UB
SID
IAR
IES
14

WEERAWONG CHITTMITTRAPAP, 58Non-Executive and Independent Director
WEE JOO YEOW, 69Non-Executive and Independent Director
Date of first appointment as a director : 10 Mar 2014Date of last re-election as a director : 30 Jan 2015Length of service as a director (as at 30 Sep 2016) : 2 years 6 months
Board committee(s) served on• Executive Committee• Audit Committee
Academic & Professional Qualification(s)• Master of Business Administration, New York University, USA• Bachelor of Business Administration (BBA Hons), University
of Singapore
Present Directorships (as at 30 Sep 2015)Listed companies• PACC Offshore Services Holdings Ltd• Oversea-Chinese Banking Corporation Limited• Great Eastern Holdings Limited
Major Appointments (other than Directorships)Nil
Past Directorships in listed companies held over the preceding three years (from 01 Oct 2013 to 30 Sep 2016)Nil
Past Major Appointments• Managing Director and Head of Corporate Banking
Singapore, United Overseas Bank Limited
Others• Mapletree Industrial Trust Management Ltd
Date of first appointment as a director : 25 Oct 2013Date of last re-election as a director : 30 Jan 2015Length of service as a director (as at 30 Sep 2016) : 2 years 11 months
Board committee(s) served on• Nominating Committee (Chairman)• Risk Management Committee
Academic & Professional Qualification(s)• Thai Barrister-at-Law and the first Thai lawyer admitted to the
New York State Bar• Master of Law, University of Pennsylvania, USA• Bachelor of Law, Chulalongkorn University, Thailand
Present Directorships (as at 30 Sep 2016)Listed companies• Berli Jucker Public Company Limited• SCB Life Assurance Public Company Limited• Thai Airways International Public Company Limited• Siam Commercial Bank Public Company Limited• Bangkok Dusit Medical Services Public Company Limited• Big C Supercenter Public Company Limited
Others• National Power Supply Public Company Limited
Major Appointments (other than Directorships)• Thai Institute of Directors (Special Lecturer)
Past Directorships in listed companies held over the preceding three years (from 01 Oct 2013 to 30 Sep 2016)• Minor International Public Company Limited• Fraser and Neave, Limited• Siam Food Public Company Limited• Nok Airlines Public Company Limited• Golden Land Property Development Public Company
Limited• GMM Grammy Public Company Limited
Past Major Appointments• Weerawong, Chinnavat & Peangpanor Limited (Chairman)
OthersNil
AN
NU
AL
RE
PO
RT
20
16
15

SITHICHAI CHAIKRIANGKRAI, 62Non-Executive and Non-Independent Director
Date of first appointment as a director : 07 Aug 2013Date of last re-election as a director : 07 Jan 2014Length of service as a director (as at 30 Sep 2016) : 3 years 1 month
Board committee(s) served on• Board Executive Committee• Audit Committee• Risk Management Committee
Academic & Professional Qualification(s)• Bachelor of Accountancy (First Class Honours), Thammasat
University, Thailand• Diploma in Computer Management, Chulalongkorn
University, Thailand• Certificate of the Mini MBA Leadership Management,
Kasetsart University, Thailand
Present Directorships (as at 30 Sep 2016)Listed companies• Thai Beverage Public Company Limited• Berli Jucker Public Company Limited• Big C Supercenter Public Company Limited• Golden Land Property Development Public Company
Limited• Oishi Group Public Company Limited• Siam Food Products Public Company Limited• Sermsuk Public Company Limited• Univentures Public Company Limited• Fraser and Neave, Limited
Others• InterBev Investment Limited• International Beverage Holdings Limited• Certain Subsidiaries of Thai Beverage Public Company
Limited• Certain Subsidiaries of Berli Jucker Public Company Limited• Certain Subsidiaries of Oishi Group Public Company Limited• Certain Subsidiaries of Siam Food Products Public Company
Limited• Certain Subsidiaries of Sermsuk Public Company Limited
Major Appointments (other than Directorships)• Thai Beverage Public Company Limited (Chief Financial Officer)
Past Directorships in listed companies held over the preceding three years (from 01 Oct 2013 to 30 Sep 2016)Nil
Past Major AppointmentsNil
OthersNil
CHOTIPHAT BIJANANDA, 53Non-Executive and Non-Independent Director
Date of first appointment as a director : 08 Mar 2013Date of last re-election as a director : 29 Jan 2016Length of service as a director (as at 30 Sep 2016) : 3 years 6 months
Board committee(s) served on• Risk Management Committee (Chairman)• Board Executive Committee (Vice Chairman)• Nominating Committee
Academic & Professional Qualification(s)• Master of Business Administration, Finance, University of
Missouri, USA• Bachelor of Laws, Thammasat University, Thailand
Present Directorships (as at 30 Sep 2016)Listed companies• Sermsuk Public Company Limited• Golden Land Property Development Public Company
Limited• Fraser and Neave, Limited• Big C Supercenter Public Company Limited
Others• Australand Property Limited• Australand Investments Limited• Frasers Property Limited• Frasers Property Australia Pty Limited• Southeast Group Co., Ltd. (President)• Southeast Insurance Public Co., Ltd. (Chairman)• Southeast Life Insurance Public Co., Ltd. (Chairman)• Southeast Capital Co., Ltd. (Chairman)• TCC Assets Limited• TCC Technology Co., Ltd.
Major Appointments (other than Directorships)Nil
Past Directorships in listed companies held over the preceding three years (from 01 Oct 2013 to 30 Sep 2016)Nil
Past Major AppointmentsNil
OthersNil
BOARD OF DIRECTORS As at 30 September 2016
FR
AS
ER
S C
EN
TR
EP
OIN
T L
IMIT
ED
& S
UB
SID
IAR
IES
16

An artist's impression of Frasers Tower, Singapore

PANOTE SIRIVADHANABHAKDI, 39Group Chief Executive Officer (Designate)* Frasers Centrepoint Limited
Reporting to the Chairman and Board of Directors, Mr Sirivadhanabhakdi is responsible for developing and driving the Group’s growth strategies and delivering sustainable returns for the business.
Mr Sirivadhanabhakdi helms the overall development and management of the Group’s business, as well as implementation of the Group’s short and long-term business plans in accordance with FCL’s vision and strategies. He provides leadership to all FCL business divisions and prepares the organisation for further development and expansion.
Date of first appointment : 1 Oct 2016
Board committees served on • Board Executive Committee• Remuneration Committee (stepped down with effect from
1 Oct 2016)• Risk Management Committee
Academic & Professional Qualifications• Master of Science in Analysis, Design and Management
of Information Systems, London School of Economics and Political Science, UK
• Bachelor of Science in Manufacturing Engineering, Boston University, USA
• Certificate in Industrial Engineering and Economics, Massachusetts University, USA
Present Directorships (as at 30 Sep 2016)Listed companies• Berli Jucker Public Company Limited• Golden Land Property Development Public Company
Limited (Vice Chairman)• Siam Food Products Public Company Limited• Thai Beverage Public Company Limited• Univentures Public Company Limited
Others• Australand Property Limited• Australand Investments Limited• Frasers Property Limited• Frasers Property Australia Pty Limited• Frasers Hospitality Asset Management Pte Ltd, Manager of
Frasers Hospitality Real Estate Investment Trust• Frasers Hospitality Trust Management Pte Ltd, Manager of
Frasers Hospitality Business Trust• Frasers Logistics & Industrial Asset Management Pte Ltd,
Manager of Frasers Logistics & Industrial Trust• Beer Thip Brewery (1991) Co., Ltd.• Blairmhor Distillers Limited• Blairmhor Limited• InterBev (Singapore) Limited• International Beverage Holdings (China) Limited• International Beverage Holdings Limited• International Beverage Holdings (UK) Limited• Sura Bangyikhan Group of Companies
Major Appointments (other than Directorships)Nil
Past Directorships in listed companies held over the preceding three years (from 01 Oct 2013 to 30 Sep 2016)• Fraser and Neave, Limited
Working Experience• Chief Executive Officer, Univentures Public Company
Limited.
OthersNil
GROUP MANAGEMENT As at 30 September 2016
* Mr Panote Sirivadhanabhakdi has been appointed Group Chief Executive Officer with effect from 1 Oct 2016
FR
AS
ER
S C
EN
TR
EP
OIN
T L
IMIT
ED
& S
UB
SID
IAR
IES
18

MR LIM EE SENG, BBM, 65Group Chief Executive OfficerFrasers Centrepoint Limited
Mr Lim had overall responsibility for driving FCL’s growth strategies and delivering sustainable returns from the business.
Mr Lim provided leadership to FCL’s various business divisions. Under his stewardship, the Group’s presence grew to span over 80 cities across the globe. He constantly sought new opportunities to add to, and extract value from, the FCL portfolio while continually preparing the organisation for further expansion by investing in talent, global systems and processes.
Date of first appointment : 15 Oct 2004Date of retirement : 30 Sep 2016
Board committees served on Nil
Academic & Professional Qualifications• Bachelor of Engineering (Civil Engineering), University of
Singapore• Master of Science (Project Management), National
University of Singapore• Fellow, Singapore Institute of Directors• Member, The Institution of Engineers Singapore
Present Directorships (as at 30 Sep 2016) Listed companiesNil
Listed REITs/Trusts• Frasers Centrepoint Asset Management Ltd, Manager of
Frasers Centrepoint Trust• Frasers Centrepoint Asset Management (Commercial)
Limited, Manager of Frasers Commercial Trust• Frasers Hospitality Asset Management Pte Ltd, Manager of
Frasers Hospitality Real Estate Investment Trust• Frasers Hospitality Trust Management Pte Ltd,
Trustee-Manager of Frasers Hospitality Business Trust• Frasers Logistics & Industrial Asset Management Pte. Ltd.,
Manager of Frasers Logistics & Industrial Trust
Others • Frasers Property Australia Pty Limited• Vacaron Company Sdn Bhd
Major appointments (other than Directorships)• 2nd Vice-President, Real Estate Development Association of
Singapore
Past Directorships in listed companies held over the preceding 3 years (from 01 Oct 2013 to 30 Sep 2016)• Gemdale Properties and Investment Corporation Limited
Working Experience• Managing Director, MCL Land Limited• General Manager (Property Division), First Capital
Corporation Ltd• Project Manager, Singapore Land Ltd
Others• Awarded Public Service Star (BBM) • Former Board member of the Building and Construction
Authority of Singapore • Former Council member of the Singapore Chinese
Chamber of Commerce and Industry
AN
NU
AL
RE
PO
RT
20
16
19
CHIA KHONG SHOONG, 45Chief Corporate Officer and Chief Financial OfficerFrasers Centrepoint Limited
CHRISTOPHER TANG KOK KAI, 55 Chief Executive Officer, Singapore Frasers Centrepoint Limited
As Group Chief Corporate Officer and Chief Financial Officer, Mr Chia oversees several key Group corporate functions as well as its finance, accounting, taxation and treasury functions. The Group corporate functions include Group Strategy and Performance, Group Communications, Group Business Process Design and Technology Solutions, Group Corporate Secretariat and Group Legal. He oversees the development and formulation of Group strategies to streamline business processes, drive synergies and improve profitability. He also assists FCL’s Group Chief Executive Officer in developing the Group’s international businesses.
Date of first appointment : 2 Mar 2009
Academic & Professional Qualifications• Master of Philosophy (Management Studies),
Cambridge University, UK• Bachelor of Commerce (Accounting and Finance),
University of Western Australia
Working Experience• Chief Executive Officer, Australia, New Zealand and UK,
Frasers Centrepoint Limited• Director, Investment Banking and Global Banking,
The Hongkong & Shanghai Banking Corporation Ltd• Vice President, Global Investment Banking, Citigroup /
Salomon Smith Barney / Schroders
Present Directorships (as at 30 Sep 2016)Listed companiesNil
Listed REITs/Trusts• Frasers Centrepoint Asset Management (Commercial)
Limited, Manager of Frasers Commercial Trust
OthersNil
Major Appointments (other than Directorships)Nil
Past Directorships in listed companies held over the preceding 3 years (from 01 Oct 2013 to 30 Sep 2016)• Frasers Centrepoint Asset Management Ltd, Manager of
Frasers Centrepoint Trust
OthersNil
Mr Tang is responsible for driving FCL's Singapore Residential and Commercial Properties businesses. He oversees the Group’s entire value chain of property investment, development, marketing and sales in Singapore, as well as the two REITs – Frasers Centrepoint Trust and Frasers Commercial Trust. Mr Tang will also provide management oversight for the Group’s property development business in China.
Date of first appointment : 1 Apr 2001
Academic & Professional Qualifications• Master of Business Administration, National University of
Singapore• Bachelor of Science, National University of Singapore
Working Experience• Chief Executive Officer, Commercial and Greater China,
Frasers Centrepoint Limited• Chief Executive Office, Frasers Centrepoint Asset
Management Ltd• General Manager, Strategic Planning and Asset
Management, Fraser and Neave, Limited• General Manager, Strategic Planning and Asset
Management, Frasers Centrepoint Limited• Vice President, DBS Bank Ltd• Senior Manager, Strategic Planning and Asset
Management, DBS Land Limited
Present Directorships (as at 30 Sep 2016)Listed companiesNil
Listed REITs/Trusts• Frasers Centrepoint Asset Management Ltd,
Manager of Frasers Centrepoint Trust• Frasers Centrepoint Asset Management (Commercial)
Limited, Manager of Frasers Commercial Trust• Hektar Asset Management Sdn Bhd, Manager of
Hektar REIT
Others• Board of Governors, Republic Polytechnic
Major Appointments (other than Directorships)Nil
Past Directorships in listed companies held over the preceding 3 years (from 01 Oct 2013 to 30 Sep 2016)Nil
OthersNil
GROUP MANAGEMENT As at 30 September 2016
FR
AS
ER
S C
EN
TR
EP
OIN
T L
IMIT
ED
& S
UB
SID
IAR
IES
20

RODNEY VAUGHAN FEHRING, 57Chief Executive OfficerFrasers Property Australia
Mr Fehring is responsible for Frasers Property Australia, which develops, builds and manages residential, commercial, industrial and retail property in Australia and New Zealand. He has 35 years of experience in the property development industry, primarily involved in large-scale urban development and urban renewal schemes.
Date of first appointment : 22 Mar 20101
Academic & Professional Qualifications• Bachelor of Applied Science, La Trobe University, Australia• Graduate Diploma in Sports Administration,
La Trobe University, Australia• Graduate Diploma in Urban & Regional Planning,
RMIT University, Australia• Diploma, Advanced Management Program,
The Wharton School, University of Pennsylvania, USA
Working Experience• Executive General Manager, Residential,
Australand Property Group• Managing Director & CEO of Lend Lease Primelife Ltd• CEO of Delfin Lend Lease Ltd• Executive General Manager (Vic) of Delfin Group Ltd• Chief Operating Officer, Urban Land Corporation, Victoria• General Manager (Property), Australian Defence Industries
Ltd
Present Directorships (as at 30 Sep 2016)Listed companiesNil
Others• Frasers Property Australia Pty Limited
Past Directorships of listed companies held over the preceding 3 years (from 01 Oct 2013 to 30 Sep 2016)• Chairman, Australian Housing and Urban Research
Institute Ltd
Others• Director, Green Building Council of Australia
CHOE PENG SUM, 56 Chief Executive OfficerFrasers Hospitality
Mr Choe oversees Frasers Hospitality’s business from investment, business development, global expansion of the chain of gold-standard serviced residences and hotels worldwide, to funds and asset management of hotels and serviced residences on a global mandate.
Date of first appointment : 1 Apr 1996
Academic & Professional Qualifications• Bachelor of Science with Distinction, Cornell University,
New York, USA• Phi Kappa Phi, Cornell University, New York, USA• President’s Honor Roll, Washington State University, USA• Executive Development Programme, International College
of Hospitality Administration, BRIG, Switzerland
Working Experience• Chief Operating Officer, Frasers Hospitality Pte Ltd• General Manager of Hospitality, Frasers Centrepoint
Limited• Resident Manager, Portman Shangri-La Hotel, Shanghai• Executive Assistant Manager, Shangri-La Hotel, Singapore
Present Directorships (as at 30 Sep 2016)Listed companiesNil
Listed REITs/Trusts• Frasers Hospitality Asset Management Pte Ltd, Manager of
Frasers Hospitality Real Estate Investment Trust
OthersNil
Major Appointments (other than Directorships)• Chairman of Board of Directors, Crest Secondary School• Board member of the Council of Private Education set up
by the Ministry of Education, Singapore• Governing Council member of the Singapore Quality
Awards, Spring Singapore• Singapore’s business representative to ASEAN in the East
Asia Business Council
Past Directorships in listed companies held over the preceding 3 years (from 01 Oct 2013 to 30 Sep 2016)Nil
OthersNil
1 Appointment to Australand Property Group, which was acquired by FCL in 2014
AN
NU
AL
RE
PO
RT
20
16
21
UTEN LOHACHITPITAKS, 43 Chief Investment OfficerFrasers Centrepoint Limited
SEBASTIAN TAN, 53 Chief Human Resources OfficerFrasers Centrepoint Limited
Mr Lohachitpitaks is responsible for FCL Group’s capital markets transactions, managing and monitoring the Group’s portfolio of assets, devising strategies for acquisitions and liaising with investors. He also provides leadership for the Indochina markets, namely Thailand, Cambodia, Laos, Myanmar and Vietnam.
Date of first appointment : 1 Oct 2013
Academic & Professional Qualifications• Master of Business Administration, Assumption University,
Thailand• Bachelor of Business Administration, Assumption University,
Thailand
Working Experience• Managing Director, Strategic Advisory, DBS Bank Ltd• Director, Investment Banking Division, United Overseas
Bank (Thai) Public Company Limited• Vice President, Corporate & Investment Banking Group,
DBS Bank Ltd
Present Directorships (as at 30 Sep 2016)Listed companiesNil
Others• Director, Frasers Property Holding Thailand Co Ltd
Major Appointments (other than Directorships)Nil
Past Directorships in listed companies held over the preceding 3 years (from 01 October 2013 to 30 Sep 2016)Nil
OthersNil
Mr Tan has global responsibilities for all aspects of FCL Group’s Human Resources. He has direct oversight of the Group’s Strategic Talent Management, Rewards and Leadership Development.
Date of appointment : 17 Aug 2015
Academic & Professional Qualifications• Master of Business Administration (Human Resources),
Northern Illinois University, USA• Bachelor of Science (Human Resources), Northern Illinois
University, USA
Working Experience• Group Chief HR Officer, Surbana Corporation• Advisory Director, Temasek Holdings• Managing Director, Human Resources, Temasek Holdings• Director, Human Resources, American Express International
Present Directorships (as at 30 Sep 2016)Listed companiesNil
OthersNil
Major Appointments (other than Directorships)• Programme Director, Graduate HR Certification
Programme, Singapore Management University• Adjunct Faculty, Lee Kong Chian School of Business,
Singapore Management University• External Examiner, HR Programme, Ngee Ann Polytechnic
Past Directorships in listed companies held over the preceding 3 years (from 01 Oct 2012 to 30 Sep 2016)Nil
OthersNil
GROUP MANAGEMENT As at 30 September 2016
FR
AS
ER
S C
EN
TR
EP
OIN
T L
IMIT
ED
& S
UB
SID
IAR
IES
22

CORPORATE INFORMATION
BOARD OF DIRECTORSMr Charoen Sirivadhanabhakdi Non-Executive and Non-Independent Chairman
Khunying Wanna Sirivadhanabhakdi Non-Executive and Non-Independent Vice Chairman
Mr Panote Sirivadhanabhakdi Group Chief Executive Officer and Executive Director (from 1 October 2016)Non-Executive and Non-Independent Director (until 30 September 2016)
Mr Charles Mak Ming Ying Non-Executive and Lead Independent Director
Mr Chan Heng Wing Non-Executive and Independent Director
Mr Philip Eng Heng Nee Non-Executive and Independent Director
Mr Wee Joo Yeow Non-Executive and Independent Director
Mr Weerawong Chittmittrapap Non-Executive and Independent Director
Mr Chotiphat Bijananda Non-Executive and Non-Independent Director
Mr Sithichai Chaikriangkrai Non-Executive and Non-Independent Director
BOARD EXECUTIVE COMMITTEEMr Charoen Sirivadhanabhakdi (Chairman)Mr Charles Mak Ming Ying (Vice Chairman)Mr Chotiphat Bijananda (Vice Chairman)Mr Wee Joo YeowMr Panote Sirivadhanabhakdi Mr Sithichai Chaikriangkrai
RISK MANAGEMENT COMMITTEEMr Chotiphat Bijananda (Chairman)Mr Charles Mak Ming Ying Mr Chan Heng Wing Mr Weerawong ChittmittrapapMr Panote SirivadhanabhakdiMr Sithichai Chaikriangkrai
AUDIT COMMITTEEMr Charles Mak Ming Ying (Chairman)Mr Philip Eng Heng Nee Mr Wee Joo YeowMr Sithichai Chaikriangkrai
NOMINATING COMMITTEEMr Weerawong Chittmittrapap (Chairman)Mr Charles Mak Ming YingMr Chan Heng WingMr Chotiphat Bijananda
REMUNERATION COMMITTEEMr Philip Eng Heng Nee (Chairman)Mr Charles Mak Ming Ying Mr Chan Heng Wing (from 1 October 2016)Mr Panote Sirivadhanabhakdi (until 30 September 2016)
GROUP MANAGEMENTMr Panote SirivadhanabhakdiGroup Chief Executive Officer (from 1 October 2016)
Mr Lim Ee SengGroup Chief Executive Officer (until 30 September 2016)
Mr Chia Khong ShoongChief Corporate Officer (from 1 July 2016)Chief Financial Officer
Mr Christopher Tang Kok KaiChief Executive Officer, Singapore(from 1 July 2016)Chief Executive Officer, Commercial and Greater China (until 30 June 2016)
Mr Rodney Vaughan FehringChief Executive Officer, Frasers Property Australia
Mr Choe Peng SumChief Executive Officer, Frasers Hospitality
Mr Uten LohachitpitaksChief Investment Officer
Mr Sebastian TanChief Human Resources Officer
COMPANY SECRETARYMs Catherine Yeo (from 1 October 2016)Mr Piya Treruangrachada (until 30 September 2016)
REGISTERED OFFICE#21-00 Alexandra Point438 Alexandra RoadSingapore 119958Tel: (65) 6276 4882 Fax: (65) 6276 6328www.fraserscentrepoint.com
SHARE REGISTRARTricor Barbinder Share Registration Services80 Robinson Road#02-00Singapore 068898Tel: (65) 6236 3333Fax: (65) 6236 3405
AUDITORSKPMG LLPPartner-in-charge: Mr Ronald Tay Ser Teck(Appointed on 29 January 2016)
PRINCIPAL BANKERSAustralia and New Zealand Banking Group LimitedBank of China LimitedDBS Bank Ltd.Malayan Banking Berhad Oversea-Chinese Banking Corporation LimitedStandard Chartered BankSumitomo Mitsui Banking Corporation The Bank of Tokyo-Mitsubishi UFJ, Limited United Overseas Bank Limited
AN
NU
AL
RE
PO
RT
20
16
23

CHAIRMAN’S STATEMENT
$3,440 million
Revenue
$480 million
Core Earnings
8.6 centsTotal Dividend
¢
During the year, a number of organisational changes took place
to position FCL for the future. The Group also made significant
strides towards its strategic goal of achieving sustainable
growth. In addition, the Group delivered a healthy set of
full-year results for FY2015/16.
FR
AS
ER
S C
EN
TR
EP
OIN
T L
IMIT
ED
& S
UB
SID
IAR
IES
24

Dear Fellow Shareholders,
FY2015/16 has been another exciting year for Frasers Centrepoint Limited (FCL or the Group). During the year, a number of organisational changes took place to position FCL for the future. The Group also made significant strides towards our strategic goal of achieving sustainable growth. In addition, the Group delivered a healthy set of full-year results for FY2015/16. Revenue, and attributable profit (before fair value change and exceptional items) or core earnings, were $3,440 million and $480 million respectively.
On the back of FCL’s sound financial performance, the Board has proposed a final dividend of 6.2 Singapore cents. Including FCL’s interim dividend of 2.4 Singapore cents, total dividend for FY2015/16 is 8.6 Singapore cents, the same amount as the previous two years.
ORGANISATIONAL CHANGES ENSURE THAT FCL IS FUTURE-READY
The Group’s commendable performance despite market challenges is a reflection of the calibre of FCL’s management team. It is critical that FCL continues to have the right team to steer the Group towards its strategic goals while navigating headwinds. In addition, an organisational structure that ensures the Group is future-ready is of paramount importance.
Building on a solid foundation, positioning for the futureDuring the year, a new organisational structure was put in place for the Group. A key appointment as part of the organisational changes was Mr Panote Sirivadhanabhakdi as Group CEO of FCL on 1 October 2016. Mr Sirivadhanabhakdi took over the helm of FCL from Mr Lim Ee Seng, who retired after 12 years as FCL’s Group CEO. A member of the FCL Board since March 2013, Mr Sirivadhanabhakdi brings with him over 15 years of corporate leadership and senior management experience.
At this point, I would like to put on record the Board’s deep appreciation for Mr Lim’s significant contributions to FCL. Under Mr Lim’s leadership, we established our REIT platforms and substantially enlarged our investment properties portfolio in Singapore. The Group also achieved a scaled platform in Australia and significantly enhanced our presence in secondary markets. In addition, our hospitality business grew by leaps and bounds.
The market environment that FCL will be operating in, and the challenges that the Group will face, will be markedly different in the next decade, and the decades to come. The Board is confident that Mr Sirivadhanabhakdi will build on the strong foundation that Mr Lim has put together for FCL.
MAINTAINING DYNAMISM TO ACHIEVE SUSTAINABLE GROWTH
Operating in an environment where constant change is the new normal, it is critical for FCL to be dynamic and seek opportunities that leverage the Group’s unique advantages.
Well-equipped to allocate capital dynamicallyFY2015/16 marked a significant milestone – the completion of the Group’s family of REIT platforms. Frasers Logistics & Industrial Trust (FLT) was listed in June 2016 as the largest pure-play Australian industrial REIT listed in Singapore. With the listing of FLT, we have a new stream of recurring fee income, and were able to significantly reduce our gearing.
In view of FCL’s strong recurring income base, with more than 60% of the Group’s PBIT in FY2015/16 derived from recurring income sources, as well as the Group’s healthy unrecognised presales level of $3.1 billion, the Board believes that the business is capable of supporting a gearing level of between 80% and 100%.
AN
NU
AL
RE
PO
RT
20
16
25

Given the strength of FCL’s recurring income base as well as our balance sheet, our management team is well equipped to allocate capital dynamically.
Increasingly geographically-diversified earnings base FCL has been on the journey to grow overseas income for some years. With our Australia and Hospitality strategic business units (SBUs) as the bedrock of our overseas income contributions, we can turn more of our attention to our secondary markets under the International Business unit.
Thailand has favourable macro-economic factors for real estate, and is a secondary market where FCL is well positioned to leverage our controlling shareholder, TCC’s, home market advantage to access these opportunities. During the year, FCL gained a foothold in Thailand’s residential and commercial properties segments with our stake in Golden Land Property Development Public Company Limited, which is listed on the Stock Exchange of Thailand.
LIVING AND BREATHING SUSTAINABILITY
FCL published our first Sustainability Report last year. The report, which was prepared in accordance with international standards, is an important part of FCL’s effort to share the Group’s sustainability approach with stakeholders. We put significant effort into creating spaces that can enhance the wellbeing, productivity and enjoyment of users in a manner that is friendly to the environment and local communities. The Group constantly looks at ways to improve, and our progress is reported in this year’s Sustainability Report.
Beyond business approach, the Group also considers a high standard of corporate governance and transparency as a hallmark of a sustainable business. Corporate governance and transparency tenets run deep in FCL. The Group’s core values of integrity, reliability, and trust underpin all that FCL does. We are honoured that FCL has been recognised for corporate transparency for the third year running at the SIAS Investors’ Choice Awards.
By making sustainability core to everything that we do, we believe that FCL has the right foundation to achieve sustainable growth and deliver long-term value to shareholders.
ACKNOWLEDGEMENTS FCL will not be where it is today without the support of our many stakeholders. To my esteemed colleagues on the Board, thank you for the valuable guidance. I extend my sincere appreciation too, to our business partners, financial advisers, bankers, customers and shareholders, for their unwavering support of FCL. On behalf of the Board, I would also like to thank the Boards of FCT, FCOT, FHT, and FLT, for their stewardship of our listed REITs. Last but not least, I would like to express my deep appreciation to our employees for their dedication and hard work.
Charoen SirivadhanabhakdiChairman
CHAIRMAN’S STATEMENT
Frasers Logistics & Industrial Trust was listed on the Main Board of SGX-ST
FR
AS
ER
S C
EN
TR
EP
OIN
T L
IMIT
ED
& S
UB
SID
IAR
IES
26

GROUP CEO’S STATEMENT
64.4%
83.6%
Net Debt to Equity FY2014/15
FY2015/16
Recurring Income Assets
$16.9 billion
Achieving sustainable earnings remains central to the Group’s strategy.
We have done this by growing overseas earnings, strengthening
FCL’s recurring income base and improving capital productivity.
These strategies have served the Group well, as evidenced by FCL’s
track record of growth, and we will stay the course.A
NN
UA
L R
EP
OR
T 2
01
6
27

GROUP CEO’S STATEMENT
Dear Shareholders,
I am humbled that the Independent Directors of FCL proposed my appointment as Group CEO of FCL upon the retirement of Mr Lim Ee Seng. As a member of the Board since March 2013, I have been involved at the Board-level in all the major initiatives undertaken by the Group in the last three years. I have enjoyed working closely with members of FCL’s senior management team during that time, and have the highest regard for the very capable team that Mr Lim has assembled. I am honoured that the Board has given me the mandate to lead FCL, and would like to thank Mr Lim for the solid foundation he has built for the Group. Together with my FCL colleagues, we will work hard to take the Group to even greater heights and deliver long-term value to shareholders.
ACHIEVING SUSTAINABLE GROWTH REMAINS CENTRAL TO THE GROUP’S STRATEGY
Achieving sustainable earnings remains central to the Group’s strategy. We have done this by growing overseas earnings,
strengthening FCL’s recurring income base and improving capital productivity. These strategies have served the Group well, as evidenced by FCL’s track record of growth, and we will stay the course.
As we keep sight of our strategic goal, we must remain flexible in an environment of increasing global volatility and shortening property cycles. The new organisational structure put in place in July enhances Group-level strategic planning and capital allocation discipline. At the corporate level, there is also heightened strategic focus on critical corporate responsibilities.
More focused and more dynamicFCL has always adopted the approach of developing business units with scale and business focus. Together, our businesses in Singapore, Australia and Hospitality account for around 90% of the Group’s total assets. The Australia and Hospitality SBUs each has a CEO at the helm overseeing the entire business. The new organisational structure acknowledges the importance of Singapore as FCL’s largest integrated business unit. Given the scale and maturity of our Singapore operations, it is timely for the Singapore operations to come together under one CEO.
Now FCL’s diversified platform is organised under three SBUs – Singapore, Australia and Hospitality, and an International Business unit comprising the other markets outside of our three SBUs. Placing FCL’s three SBUs of scale in the capable hands of the respective CEOs allows us to allocate capital dynamically.
Striking the right balance between differing capital needsReal estate is a capital intensive industry. It is critical for FCL to strike a balance between funding future growth and maintaining a sustainable level of gearing. Being able to achieve this balance is a key determinant to FCL’s ability to allocate capital dynamically.
Growing recurring income has always been a core strategy to strengthen FCL’s income base. Clear cashflow visibility and stable
10 Siltstone Place, Berrinba, Queensland, Australia

earnings contribution create flexibility for capital management. About 70% of the Group's total assets are recurring income assets, valued at approximately $16.9 billion as at 30 September 2016.
The Group’s REIT platforms are also important contributors to FCL’s recurring income base through fee income, as well as providing an avenue to improve capital productivity. With the listing of FLT in June 2016, the Group now has a REIT platform for each of our four investment properties asset classes.
The listing of FLT not only allowed FCL to add a new source of recurring fee income, it also enabled FCL to significantly reduce our gearing. FCL ended FY2015/16 with a net debt to equity of 64.4%, down from 83.6% last year. On the funding front, FCL further diversified our funding sources with two fixed rate note issuances. Both the $250 million 10-year fixed rate notes, and our first US$200 million 5-year fixed rate notes were well received.
LOOKING AHEAD
In our core markets of Singapore and Australia where FCL has scale and depth, we will look to maintain our market position. Our investment portfolios in both markets continue to perform well, while on the development front, we will selectively tender for sites to replenish our land bank.
The key focus in Singapore for the upcoming year will be the launch of our residential project in Siglap, and pre-leasing in preparation for the completion and opening of both the retail mall at Northpoint City as well as Frasers Tower, our Grade-A office project in the Central Business District (CBD), in 2017 and 2018 respectively.
In Australia, we will concentrate on restocking the Group’s industrial portfolio following the injection of industrial assets into FLT. On the residential front, we have approximately 2,500 residential units planned for release in the next financial year.
The hospitality business remains on track to achieve our target of 30,000 units under management by 2019. Over the course of the year, we acquired a portfolio of four properties as well as two greenfield projects in the UK. In addition, FHT acquired one hotel in Germany from third parties. Our hospitality business ended the year with over 23,400 units under management (including pending openings) in over 80 cities.
The International Business unit grew significantly this year with our investments in Vietnam and Thailand. We will continue to look at opportunities to grow our International Business unit, particularly in markets where we already have a presence, such as China and the UK.
We recognise the slow growth environment going forward, but we will continue to strive to seek opportunities to expand. As we extend our business and asset portfolio in a prudent manner across geographies and property segments, we will place emphasis on recurring income as well as a geographically-diversified earnings base. Concurrently, we are constantly evaluating opportunities to unlock value in our portfolio via asset enhancement and/or repositioning efforts, as well as through injection of stabilised assets into FCL’s REIT platforms.
Panote SirivadhanabhakdiGroup Chief Executive Officer
An artist's impression of Wonderland at Central Park, Sydney, New South Wales, Australia
AN
NU
AL
RE
PO
RT
20
16
29

China Square Central, Singapore An artist's impression of Parc Life EC, Singapore
Watertown, Singapore
S I N G A P O R E

S I N G A P O R E
S I N G A P O R E
The Singapore business comprises the Development Properties and Commercial Properties divisions. The Development Properties division focuses on the development of residential properties for sale. The Commercial Properties division comprises retail, office, business space and mixed-use developments, as well as two listed REITs, namely Frasers Centrepoint Trust (FCT) and Frasers Commercial Trust (FCOT).
Revenue and PBIT for FCL’s Singapore business was $946 million and $428 million, a decrease of 17% and 25% respectively from last year’s results. This was primarily due to the one-off profit recognition from Twin Waterfalls Executive Condominium (EC) in FY2014/15 upon its completion in June 2015 coupled with the loss in share of joint-venture income and fair value gain from One@Changi City which was sold in March 2016. The lumpy recognition of profits from completed projects and asset recycling reflects the inherent cyclical nature of the real estate sector and business. The maiden recognition of profits at North Park Residences, Twin Fountains EC and Waterway Point together with the full year income contribution from 357 Collins Street moderated the decline in FY2015/16.
The property cooling measures introduced in Singapore since 2013 coupled with rising interest rates and a weaker economic outlook continued to weigh down the residential market. Singapore remains the Group’s home market and FCL will continue to pursue opportunities in this market.
Demand for residential property is likely to remain subdued until cooling measures are removed and the global economy improves. Recognising the inherent cyclicality in residential development, the Group has embarked on growing our recurring income base. Contributions from Northpoint City (Retail) and Frasers Tower (Office) are expected to boost results when these projects are completed within the next two years. Our focused and disciplined approach, together with the various initiatives put in place, positions us well to capture opportunities in this sector.
DEVELOPMENT PROPERTIES
In April 2016, we launched Parc Life, a new EC on Sembawang Crescent amid strong competition from several ECs in the vicinity. 119 units were sold during the financial year.
Parc Life, a 628-unit project situated on 238,000 sq ft of land, has a full array of facilities including eight spas, a 50-metre pool and doorstep-access to the 1.2-hectare Canberra Park. Parc Life residents will enjoy the close proximity to Sembawang MRT and Bus Interchange (located a mere 5-minute walk away) as well as the wide variety of amenities from shopping malls to parks.
We continued to see sales momentum improve in other projects such as North Park Residences, RiverTrees Residences, eCO, Watertown and Twin Fountains EC. The Singapore portfolio achieved sales of over 330 units in FY2015/16. On average, 80% of the portfolio of all projects launched during this period was sold, a commendable achievement in view of the challenging residential property market in Singapore.
During the year, Twin Fountains EC and Q Bay Residences received Temporary Occupation Permits (TOP). Our remaining development projects are on schedule for completion.
FY2015/16
Revenue for FCL’s Singapore Business
$946 million
BUSINESSREVIEW
AN
NU
AL
RE
PO
RT
20
16
31

DEVELOPMENT PROJECTS
Project
Effectiveinterest at 30 Sep 16
(%) No. of units
% sold at 30 Sep 16
% Completion at 30 Sep 16
Ave selling price ($ psf)
Est. Saleable
Area ('M sq ft)
Land cost($ psf)
Target completion
date
Soleil @ Sinaran 100.0 417 99.8 100.0 1,446 0.5 510 CompletedWaterfront Isle 50.0 563 100.0 100.0 1,006 0.6 334 CompletedTwin Waterfalls EC 80.0 728 100.01 100.0 712 0.8 270 CompletedPalm Isles 100.0 430 100.0 100.0 851 0.4 325 CompletedQ Bay Residences 33.3 632 100.0 100.0 1,031 0.6 418 CompletedTwin Fountains EC 70.0 418 99.8 100.0 744 0.5 302 CompletedeCO 33.3 750 97.5 93.3 1,294 0.7 534 1QFY16/17Watertown 33.3 992 100.0 85.7 1,170 0.8 482 2QFY16/17RiverTrees Residences 40.0 496 94.4 84.8 1,077 0.5 533 3QFY16/17North Park Residences 100.0 920 73.2 20.8 1,326 0.7 600 4QFY17/18Parc Life EC 80.0 628 18.91 47.0 781 0.7 320 2QFY17/18
1 Including options signed
LAND BANK
Site Location
Effectiveinterest at 30 Sep 16
(%) Est. no. of
units
Est. saleable Area
('M sq ft)Land cost ($ psf ppr) Tenure
Est. launch ready date
Siglap Road East Coast 40.0% 800-900 0.7 $858 Leasehold 3QFY16/17
Total 800-900 0.7
BUSINESSREVIEW – SINGAPORE
Together with Sekisui House Limited and KH Capital Pte Ltd, FCL acquired a site at Siglap/East Coast in 2016 under the Government Land Sales Programme. Around 800 prime residential units will be launched on this site in 2017. This project will offer extensive sea views and seamless accessibility to the future Siglap MRT station on the Thomson-East Coast line.
The July-September 2016 quarter registered the twelfth continuous quarterly decline in overall home
prices and outlook for the residential market remains challenging. Recent launches have seen encouraging responses, demonstrating that quality projects priced at correct levels continue to be attractive and provide a good value proposition. As at 30 September 2016, the Group had approximately $0.7 billion of unrecognised residential development revenue.
FR
AS
ER
S C
EN
TR
EP
OIN
T L
IMIT
ED
& S
UB
SID
IAR
IES
32

Q Bay Residences, Singapore
An artist's impression of RiverTrees Residences, Singapore
An artist's impression of North Park Residences, Singapore
Twin Fountains EC, Singapore
AN
NU
AL
RE
PO
RT
20
16
33

COMMERCIAL PROPERTIES
The Commercial Properties division's portfolio comprises retail, office and business spaces and mixed-used developments in Singapore held by FCL and the REITs, namely FCT and FCOT.
We have interests in and/or manage a commercial portfolio of 22 retail, office and business space properties totalling a net lettable area (NLA) of 6.7 million sq ft. In Singapore, we have interests in and/or manage 12 shopping malls under the Frasers Centrepoint Malls brand. We also have 10 offices and business spaces in Singapore and Australia.
Revenue for the Commercial Properties division increased 3% to $422 million, although PBIT decreased 11% to $299 million mainly due to a one-off fair value gain recorded in the prior year. Excluding our share of fair value changes from joint ventures and associates, particularly the $47 million joint-venture fair value gain for One@Changi City that was recorded last year, PBIT would have increased by 7% to $297 million.
This increase was attributed mainly to stronger performance from FCOT arising from the full-year income contribution from 357 Collins Street, which
BUSINESSREVIEW – SINGAPORE
357 Collins Street, Melbourne, Victoria, Australia
was acquired in August 2015, as well as higher rentals achieved, lower utilities expenses and upfront rental income1 received by Alexandra Technopark. This was further bolstered by profit contributions from Waterway Point, which commenced operations in January 2016, coupled with stronger operating performance at 51 Cuppage Road and at FCT’s Causeway Point.
Alexandra Point, Singapore
1 Upfront rental income received from a pre-terminated lease. The pre-terminated lease was replaced by a new lease with a longer duration
FR
AS
ER
S C
EN
TR
EP
OIN
T L
IMIT
ED
& S
UB
SID
IAR
IES
34

Retail Waterway Point, the waterfront retail mall in Punggol, commenced trading in January 2016. The 370,000-sq-ft mall has a diverse tenant mix of more than 200 tenants to meet the lifestyle and daily needs of the immediate Punggol community and visitors from other parts of Singapore. The mall achieved 95.7% occupancy and has welcomed over 21 million shoppers in the eight months since its opening.
Changi City Point, Singapore
The Centrepoint completed its asset enhancement initiative in September 2016. It now offers a new frontage that provides easy access and heightened visibility of the basement and first floor retail concepts from the street level. The shopping experience has been redesigned to include a wellness zone on level 6 and two new food precincts, Gastro+ and Food Hall, which offer over 30 new dining concepts.
Waterway Point, SingaporeA
NN
UA
L R
EP
OR
T 2
01
6
35

Construction of Northpoint City (Retail), our next key project, is on schedule for completion in the second half of 2017. When completed, Northpoint City (Retail), together with FCT’s Northpoint Shopping Centre, will have over 500 retail outlets. Leasing for Northpoint City (Retail) has commenced.
During the year, we sold our 19.0% interest in Compass Point to our joint-venture partner. This was in line with our strategy to streamline and divest non-core assets to focus on our core activities.
Occupancy for non-REIT retail properties excluding The Centrepoint remained healthy at above 90.0%. The Centrepoint registered lower occupancy as the asset enhancement initiative was completed in September 2016.
Frasers Centrepoint TrustFCT registered its tenth consecutive year of distribution per unit (DPU) growth since its listing. DPU for FY2015/16 rose 1.3% year-on-year to 11.764 cents. In FY2015/16, gross revenue decreased 2.9% to $183.8 million, mainly due to lower contributions from Northpoint as a result of the on-going asset enhancement and change-over in anchor tenant space at Changi City Point. Property expenses in FY2015/16 decreased 7.3% to $54.0 million, mainly due to lower utilities tariff rates and other property expenses. Hence,
net property income (NPI) was $129.9 million, which was $1.2 million or 0.9% lower than the corresponding period last year.
FCT’s property portfolio continued to achieve positive rental reversions during the year. Rentals from renewal and replacement leases from the properties commencing during the period, recorded an average increase of 9.9% over the expiring leases. The average portfolio occupancy was 89.4% as at 30 September 2016.
BUSINESSREVIEW – SINGAPORE
Northpoint Shopping Centre, Singapore Changi City Point, Singapore
Causeway Point, Singapore
FR
AS
ER
S C
EN
TR
EP
OIN
T L
IMIT
ED
& S
UB
SID
IAR
IES
36

Office and Business SpaceFrasers Tower, a premium Grade-A office building, is scheduled for completion in 2018. Nestled in a park of its own, Frasers Tower’s offices along with its vibrant retail spaces will transform the way tenants work. The development features a unique blend of workspace and nature with an open-space communal terrace as well as a variety of indoor and outdoor work areas. It is also a strategic landmark at the gateway of the CBD. Tenants and visitors of Frasers Tower will enjoy seamless connectivity, including direct underground access to Tanjong Pagar MRT station on the East-West line. With a NLA exceeding 687,000 sq ft, leasing for the 38-storey high office tower with an adjacent three-storey retail podium has commenced in end-2016.
In FY2015/16, we sold our stake in One@Changi for $210 million as part of our joint-venture arrangement.
The average occupancy for our Singapore office assets was healthy at 90.2%. These assets achieved an average rental reversion of 5.1% for FY2015/16, a remarkable achievement given the challenging leasing environment in Singapore.
Frasers Commercial TrustFCOT delivered the highest distributable income to unitholders and DPU since its listing in 2006. The distributable income of $77.6 million and DPU of 9.82 cents for FY2015/16 were up 14.5% and 1.1% respectively, compared to the prior financial year.
In FY2015/16, gross revenue increased 10.1% year-on-year to $156.5 million. Accordingly, NPI was up 13.4% year-on-year to $115.6 million. The good performance was attributed to the full-year contribution from 357 Collins Street and the better performance of Alexandra Technopark as a result of higher rentals achieved, lower utilities expenses and upfront rental income received1. The increase was partially reduced
by the weaker Australian dollar during the year and the lower occupancies for China Square Central and Central Park.
FCOT continued to enjoy a healthy average occupancy rate of 93.0% for the portfolio as at 30 September 2016. Despite the challenging leasing environment and the weaker office market outlook in Singapore, FCOT achieved a high tenant retention rate of 86.7% in FY2015/16. Overall, the properties achieved a positive weighted average rental reversion of 6.6%2 during the financial year.
1 Upfront rental income received from a pre-terminated lease. The pre-terminated lease was replaced by a new lease with a longer duration
2 The weighted average rental reversions based on signing rents for the area for new and renewed leases which commenced in 4QFY2015/16 and FY2015/16. For China Square Central, the weighted average rental reversions are for 18 Cross Street office tower only, and excludes the retail podium at 18 Cross Street, and 20 and 22 Cross Street which are partially affected by the construction works for the Hotel and Commercial Project
Caroline Chisholm Centre, Canberra, ACT, Australia
An artist's impression of Frasers Tower, Singapore
AN
NU
AL
RE
PO
RT
20
16
37

COMMERCIAL PORTFOLIO
Effective interest at 30 Sep 16
Book value at 30 Sep 16
Net lettable area Occupancy
Property (%) ($'M) (sq ft) FY15/16 (%) FY14/15 (%)
SINGAPORE: REIT (Frasers Centrepoint Trust)Anchorpoint 41.5 103.0 70,989 96.7 96.9Bedok Point 41.5 108.0 82,713 95.0 84.2Causeway Point 41.5 1,143.0 415,792 99.8 99.5Northpoint1 41.5 672.0 225,032 70.9 98.2YewTee Point 41.5 172.0 73,670 98.7 94.8Changi City Point 41.5 311.0 207,244 81.2 91.1
SINGAPORE: Non-REIT retail assetRobertson Walk 100.0 126.0 97,045 91.2 89.0The Centrepoint 100.0 580.0 307,7136 79.1 61.9Valley Point (Retail) 100.0 50.0 43,216 100.0 90.1Eastpoint Mall2 0.0 NA 213,478 94.1 84.1Waterway Point 33.3 1,016.0 371,181 95.7 90.09
Northpoint City (Retail)3 100.0 1,142.0 317,614 NA NA
Total Retail 2,425,687
SINGAPORE: REIT (Frasers Commercial Trust)55 Market Street 27.2 139.0 71,796 92.0 95.8Alexandra Technopark 27.2 508.05 1,043,891 94.8 94.6China Square Central 27.2 562.5 369,824 88.97 96.28
OVERSEAS: REIT (Frasers Commercial Trust)Australia, Canberra - Caroline Chisholm Centre 27.2 237.0 433,182 100.0 100.0Australia, Perth - Central Park4 13.6 552.2 712,706 80.2 88.6Australia, Melbourne - 357 Collins Street 27.2 266.7 343,616 100.0 98.4
SINGAPORE: Non-REIT office/business park assetAlexandra Point 100.0 296.0 199,592 86.2 91.2Valley Point Office Tower 100.0 272.0 183,141 84.0 91.851 Cuppage Road 100.0 400.0 273,591 84.4 76.6Frasers Tower3 100.0 1,113.0 687,499 NA NA
Total Office/Business Park 4,318,838
Total Commercial Properties 6,744,525
1 Undergoing asset enhancement 2 Managed asset 3 Currently under development. NLA subject to change4 FCOT has 50% indirect interest in the asset5 Book value as reported by FCOT. The Group adjusted the book value to reflect its freehold interest in the property 6 NLA reflects FCL’s strata area. It excludes leased area from MCST7 Committed occupancy as at 30 September 2016. Lower occupancy as certain units were affected by the commencement of construction
for the hotel development and additions and alterations at China Square Central. Refer to FCOT Circular to Unitholders dated 3 June 2015 for details. Occupancy for the office component was 99.4%
8 Committed occupancy as at 30 September 20159 Occupancy based on committed leases
BUSINESSREVIEW – SINGAPORE
FR
AS
ER
S C
EN
TR
EP
OIN
T L
IMIT
ED
& S
UB
SID
IAR
IES
38

One Central Park, Sydney, New South Wales, Australia
1 Burilda Close, Wetherill Park, New South Wales, Australia Riverlight, Hamilton, Queensland, Australia
AU S T R A L I A

AU S T R A L I A
FCL’s businesses in Australia comprise Frasers Property Australia (FPA) and Frasers Logistics & Industrial Trust (FLT).
FPA is one of Australia’s leading diversified property groups with a presence in all its major markets. FPA operates across the residential, industrial, commercial and retail sectors.
Revenue for the Australian business increased by 6% to $1,449 million, driven by residential land and apartment sales, completion of 13 projects in the Commercial and Industrial (C&I) and Retail divisions and passive income from the Investment Property (IP) division.
Impairment losses recognised on development properties, largely from residential projects in Western Australia, and a weaker Australian Dollar, however, resulted in PBIT decreasing 19% to $218 million. Excluding the impairment losses, PBIT would have decreased by 2% to $265 million.
During the year, the Australian business achieved a number of major milestones including the successful listing of FLT on the Main Board of SGX-ST in June 2016, which has enabled the re-capitalisation of FPA’s Industrial operations, and the completion of the active asset management programme which resulted in proceeds of $426 million.
Economic growth in Australia recovered to its historic trend as the economy transitions from resource-focused exports to service-based sectors. Market fundamentals in Australia remain supportive of the residential sector with interest rates forecast to remain low over the near term, population growth still evident and unemployment continuing at low levels on the eastern seaboard. Sales volumes in key markets of Sydney, Melbourne and Brisbane remain consistent. Perth, though, is suffering from rising unemployment and a lack of consumer confidence, leading to weak sales volumes and falling prices from both owner-occupiers and investors across most product types.
FY2015/16
Revenue for Australian business
$1,449 million
BUSINESSREVIEW
Discovery Point, Wolli Creek, New South Wales, Australia
FR
AS
ER
S C
EN
TR
EP
OIN
T L
IMIT
ED
& S
UB
SID
IAR
IES
40

INDUSTRIAL PROPERTY ASSETS
Effective Interest as at
30 Sep 16
Book value as at
30 Sep 16 Lettable area OccupancyProperty Address State (%) ($'M) (sq ft) FY15/16 (%) FY14/15 (%)
Industrial10 Reconciliation Rise, Premulwuy NSW 100.0 35.0 276,686 100.0 100.08 Stanton Road, Seven Hills NSW 100.0 15.8 115,260 100.0 100.02 Wonderland Drive, Eastern Creek NSW 100.0 43.2 316,534 100.0 100.0227 Walters Road, Arndell Park NSW 100.0 28.1 190,876 100.0 100.0Lot 1, 2 Burilda Close, Wetherill Park NSW 100.0 23.4 154,279 41.5 NA1
1 Burilda Close, Wetherill Park2 NSW 100.0 60.6 202,878 100.0 NA1
23 Scanlon Drive, Epping VIC 100.0 13.3 133,053 100.0 100.01 West Park Drive, Derrimut VIC 100.0 8.0 108,479 0.0 76.164 West Park Drive, Derrimut VIC 100.0 16.5 218,905 0.0 100.089-103 South Park Drive, Dandenong South
VIC 100.0 9.3 112,214 0.0 100.0
57 Efficient Drive, Truganina VIC 100.0 22.4 245,848 0.0 NA1
43 Efficient Drive, Truganina VIC 100.0 10.2 NA3 NA NA102 Trade Street, Lytton QLD 100.0 0.04 NA4 NA 0.044 Cambridge Street, Rocklea QLD 100.0 16.0 117,230 100.0 100.0Berrinba, QLD QLD 100.0 20.2 NA3 NA NA
Office20 Lee Street, Henry Deane Building, Sydney
NSW 100.0 68.8 98,078 100.0 100.0
26-30 Lee Street, Gateway Building, Sydney
NSW 100.0 97.9 135,641 100.0 100.0
Tower B, 197-201 Coward Street, Mascot
NSW 100.0 0.05 NA5 NA 59.3
Tower A, 197-201 Coward Street, Mascot
NSW 100.0 0.05 NA5 NA 95.8
1B Homebush Bay Drive, Rhodes NSW 100.0 71.5 137,768 100.0 100.01F Homebush Bay Drive, Rhodes NSW 100.0 111.5 189,923 93.7 93.71D Homebush Bay Drive, Rhodes NSW 100.0 117.7 185,548 100.0 100.0Homebush Bay Drive, Rhodes NSW 100.0 10.4 14,456 100.0 100.02 Southbank Boulevard, Southbank VIC 50.0 231.0 591,167 98.5 96.928 Southbank Boulevard, Southbank VIC 50.0 NA5 NA5 NA 99.9658 Church Street, Richmond VIC 100.0 NA6 NA6 NA 99.4690 Springvale Road & 350 Wellington Road, Mulgrave
VIC 100.0 NA7 NA7 NA 100.0
Freshwater Place, Public Car Park, Southbank
VIC 100.0 16.1 127,251 100.0 100.0
1,046.9 3,672,074 91.1 96.8
1 New asset 2 Asset held for sale. FPA entered into a separate call option agreement with FLT for this property which took effect on 20 June 2016.
Subsequently, FLT exercised the call option to acquire this property on 30 November 20163 Currently under development 4 Asset sold in February 2016 5 Asset was sold in September 2016 6 Asset was sold to US investor Black Rock in March 2016 7 Asset was sold to Stockland in April 2016
AN
NU
AL
RE
PO
RT
20
16
41

RESIDENTIAL DEVELOPMENT
Despite weakness in the Perth market, strength in the major population centres has ensured FPA’s Residential business maintained significant forward sales momentum that will carry into the next financial year and beyond. In FY2015/16, 2,484 residential units were completed and settled, and 2,850 units were sold. Approximately 2,500 units are planned for release in FY2016/17.
In New South Wales, the final residential stage at Central Park in Sydney, called Wonderland, was released comprising 294 apartments. ICON, the final planned residential tower at Discovery Point, also released 243 apartments. Overall, the NSW residential business unit completed and settled 1,031 units during the year, with Discovery Point (575 units) and Putney Hill (232 units) being the main contributors.
In Victoria, three new projects commenced trading. Avondale, in the inner northwest of Melbourne, sold out its first three stages of houses and townhouses. The 43-hectare Point Cook development completed its planning phase and met with strong demand, securing about 180 sales in its first six months of trading. Sunbury Fields, part of a township in Melbourne’s north west, settled 130 contracts worth $28 million.
In Brisbane, Hamilton Reach continued to generate solid demand across multiple price-points, delivering 91 settlements during the year. Completion of a further stage of riverfront apartments was carried forward to the first quarter of the next financial year.
Riverlight, the largest precinct launched to date at Hamilton Reach, with 240 apartments, was well received by the market with 59% of its first stage’s 155 units sold. Strong demand for land and medium-density housing products saw Park Ridge (193 lots) and COVA (100 town houses) settled during the year, with good forward momentum assured as several new projects will commence in early FY2016/17.
Activity in Western Australia has been subdued, consistent with broader market conditions in Perth. Cockburn Central contributed 43 settlements for the year and the Baldivis projects combined to contribute a further 63 lots settled. During the year, Frasers Landing, at Mandurah, south of Perth, was re-launched off the back of new development activity on site.
In New Zealand, the Coast Papamoa Beach land estate was re-designed and re-launched with great success in an increasingly buoyant local market. 189 lots were sold in FY2015/16.
During the year, a 135-hectare site in Bahrs Scrub in Southern Brisbane was acquired and subsequently branded Brookhaven. The land estate will yield approximately 1,350 lots and a 7,000 sq m neighbourhood retail hub, with an estimated gross development value (GDV) of $291 million. Brookhaven is included in the development pipeline and was released to the market in October 2016.
At the close of FY2015/16, the Residential business had 4,155 contracts on hand with an unrecognised revenue of $1.9 billion. It has a strong development pipeline of 16,700 units, representing a GDV of $8.8 billion.
Putney Hill, Ryde, New South Wales, Australia
BUSINESSREVIEW – AUSTRALIA
FR
AS
ER
S C
EN
TR
EP
OIN
T L
IMIT
ED
& S
UB
SID
IAR
IES
42

RESIDENTIAL – DEVELOPMENT PROJECTS
Site1
Effective share as at 30 Sep 16
(%)
Estimated total no. of units2
% Sold @ 30 Sep 16
Target competion
date
Average selling
price ($'M)
Est. saleable area
('M sq ft)
Total GDV ($'M)
Cockburn Central (Cockburn Living, Kingston Stage 4) - H/MD, WA
100.0 60 68.3 Completed 0.5 0.1 30.6
Cockburn Central (Cockburn Living, Vicinity Stage 1) - H/MD, WA
100.0 35 71.4 Completed 0.5 0.0 17.2
Kangaroo Point (Yungaba, Linc) - HD, QLD
100.0 45 97.8 Completed 0.5 0.0 24.5
Kangaroo Point (Yungaba, Affinity) - HD, QLD
100.0 44 77.3 Completed 0.7 0.0 30.0
Cockburn Central (Cockburn Living, Vicinity Stage 2) - H/MD, WA
100.0 71 26.8 Completed 0.5 0.1 34.8
Wolli Creek (Discovery Point, Shore) - HD, NSW
50.0 323 100.0 Completed 0.8 0.3 257.1
Parkville (Parkside Parkville, Thrive) - H/MD, VIC
50.0 134 100.0 Completed 0.5 0.0 70.3
Wolli Creek (Discovery Point, Vivid) - HD, NSW
100.0 162 98.8 Completed 0.7 0.1 119.4
Wolli Creek (Discovery Point, Summit) - Retail, NSW
50.0 1 0.0 Completed 0.7 NA 0.7
East Perth (Queens Riverside, QIII) - HD, WA
100.0 274 90.1 Completed 0.8 0.2 214.1
East Perth (Queens Riverside, QII) - HD, WA
100.0 107 68.2 Completed 0.7 0.1 72.7
East Perth (Queens Riverside, Lily) - HD, WA
100.0 130 21.5 Completed 0.7 0.1 89.4
Ryde (Putney Hill Stage 2, Reserve) - H/MD, NSW
100.0 15 100.0 Completed 1.7 0.0 25.6
Hamilton (Hamilton Reach, Newport) - H/MD, QLD
100.0 34 79.4 1QFY16/17 1.3 0.0 45.6
Campsie (Clemton Park Village, Aspect) - H/MD, NSW
50.0 67 100.0 1QFY16/17 0.6 0.1 40.8
Campsie (Clemton Park Village, Emporium) - H/MD, NSW
50.0 49 100.0 1QFY16/17 0.6 0.0 31.4
Kangaroo Point (Yungaba House/Other) - HD, QLD
100.0 18 22.2 1QFY16/17 2.1 NA 38.2
Campsie (Clemton Park Village, Garden) - H/MD, NSW
50.0 45 91.1 2QFY16/17 0.7 0.0 31.6
Hamilton (Hamilton Reach, Atria North) - H/MD, QLD
100.0 81 87.7 2QFY16/17 0.6 0.1 52.1
Carlton (APT) - H/MD, VIC 65.0 143 99.3 2QFY16/17 0.5 0.1 73.7
Campsie (Clemton Park Village, Podium) - H/MD, NSW
50.0 89 100.0 2QFY16/17 0.6 0.1 57.6
Note: All references to units include apartments, houses and land lots. 1 L – Land, H/MD – Housing/medium density, HD – High density 2 Includes 100% of joint arrangements (Joint operation-JO and Joint venture-JV) and PDAs
AN
NU
AL
RE
PO
RT
20
16
43

BUSINESSREVIEW – AUSTRALIA
Port Coogee, North Coogee, Western Australia, Australia
Cockburn Living, Cockburn Central, Western Australia, AustraliaBrookhaven, Bahrs Scrub, Queensland, Australia
4444

Site1
Effective share as at 30 Sep 16
(%)
Estimated total no. of units2
% Sold @ 30 Sep 16
Target competion
date
Average selling
price ($'M)
Est. saleable area
('M sq ft)
Total GDV ($'M)
Campsie (Clemton Park Village, Piazza) - H/MD, NSW
50.0 40 95.0 2QFY16/17 0.7 0.0 29.2
Campsie (Clemton Park Village, Retail) - H/MD, NSW
50.0 13 0.0 2QFY16/17 50.0 NA 50.0
Chippendale (Central Park, Connor) - HD, NSW
50.0 178 100.0 2QFY16/17 1.0 0.1 182.7
Ryde (Putney Hill Stage 2, Canopy) - H/MD, NSW
100.0 131 97.7 2QFY16/17 0.9 0.1 118.2
Parkville (Parkside Parkville, Flourish) - H/MD, VIC
50.0 81 98.8 3QFY16/17 0.5 0.1 43.0
Coorparoo (Coorparoo Square, Central Tower) - H/MD, QLD
50.0 96 99.0 3QFY16/17 0.5 0.1 51.1
Coorparoo (Coorparoo Square, North Tower) - H/MD, QLD
50.0 155 96.8 3QFY16/17 0.6 0.1 89.7
Botany (Tailor's Walk, Building E) - H/MD, NSW
PDA 59 28.8 3QFY16/17 0.9 0.0 51.4
Botany (Tailor's Walk, Building A) - H/MD, NSW
PDA 19 84.2 4QFY16/17 1.3 0.0 23.9
Sunshine West (Callaway Park) - H/MD, VIC
50.0 666 99.8 1QFY17/18 0.4 NA 239.8
Parkville (Parkside Parkville, Prosper) - H/MD, VIC
50.0 172 94.2 1QFY17/18 0.6 0.1 95.5
Coorparoo (Coorparoo Square, South Tower) - H/MD, QLD
50.0 119 93.3 1QFY17/18 0.6 0.1 65.7
Carlton (Found) - H/MD, VIC 65.0 69 73.9 1QFY17/18 0.6 0.1 43.0
North Ryde (Centrale, Stage 1) - H/MD, NSW
50.0 197 80.7 2QFY17/18 0.8 0.1 156.2
Botany (Tailor's Walk, Building D) - H/MD, NSW
PDA 173 75.7 2QFY17/18 0.9 0.2 161.0
Papamoa (Coast Papamoa Beach) - L3, NZ
75.0 313 84.3 2QFY17/18 0.4 NA 110.5
Hamilton (Hamilton Reach, Riverlight East) - H/MD, VIC
100.0 155 59.4 2QFY17/18 0.6 0.1 94.8
Hamilton (Hamilton Reach, Riverlight North) - H/MD, VIC
100.0 85 9.4 2QFY17/18 0.6 0.1 51.4
Wolli Creek (Discovery Point, Marq) - HD, NSW
100.0 231 84.4 3QFY17/18 0.8 0.2 191.9
North Ryde (Centrale, Stage 2) - H/MD, NSW
50.0 186 69.4 3QFY17/18 0.8 0.1 152.4
Ryde (Putney Hill Stage 2, Peak) - H/MD, NSW
100.0 174 75.9 3QFY17/18 1.0 0.2 181.7
Chippendale (Central Park, Duo) - HD, NSW
50.0 313 73.5 3QFY17/18 1.2 0.2 377.2
RESIDENTIAL – DEVELOPMENT PROJECTS (Cont'd)
Note: All references to units include apartments, houses and land lots. 1 L – Land, H/MD – Housing/medium density, HD – High density 2 Includes 100% of joint arrangements (Joint operation-JO and Joint venture-JV) and PDAs 3 One retail plot of land at Clemton Park
AN
NU
AL
RE
PO
RT
20
16
45

Site1
Effective share as at 30 Sep 16
(%)
Estimated total no. of units2
% Sold @ 30 Sep 16
Target competion
date
Average selling
price ($'M)
Est. saleable area
('M sq ft)
Total GDV ($'M)
Chippendale (Central Park, Wonderland) - HD, NSW
100.0 294 61.2 3QFY17/18 1.1 0.2 335.3
North Coogee (Port Coogee JV1) - L3, WA
50.0 357 96.1 4QFY17/18 0.6 NA 223.8
Cranbourne West (Casiana Grove) - L3, VIC
100.0 729 98.9 4QFY17/18 0.2 NA 162.8
Wolli Creek (Discovery Point, Icon) - HD, NSW
100.0 243 25.5 1QFY18/19 0.8 0.2 195.8
Lidcombe (The Gallery) - H/MD, NSW
100.0 241 79.7 2QFY18/19 0.7 NA 172.1
Parkville (Parkside Parkville, Embrace) - H/MD, VIC
50.0 136 10.3 2QFY18/19 0.6 0.1 80.4
Greenvale (Greenvale Gardens) - L3, VIC
100.0 657 91.9 4QFY18/19 0.3 NA 179.6
Westmeadows (Valley Park) - H/MD3, VIC
PDA 209 57.9 4QFY18/19 0.4 NA 93.3
Sunbury (Sunbury Fields) - L3, VIC
PDA 391 47.1 4QFY18/19 0.2 NA 94.9
Park Ridge (The Rise) - L3, QLD 100.0 379 54.1 1QFY19/20 0.2 NA 67.7
Avondale Heights (Avondale) - H, VIC
PDA 135 33.3 1QFY19/20 0.6 NA 86.8
Hope Island (Cova) - L/H/MD3, QLD
100.0 543 64.3 2QFY19/20 0.4 NA 234.3
Blacktown (Fairwater) - L/H/MD3, NSW
100.0 922 32.8 2021 0.7 NA 685.8
Point Cook (Life, Point Cook) - L3, VIC
50.0 587 30.5 2021 0.3 NA 205.3
North Coogee (Seaspray Island) - L3, WA
50.0 19 31.6 2022 2.1 NA 40.5
Baldivis (Baldivis Grove) - L3, WA
100.0 373 14.2 2023 0.2 NA 77.2
Yanchep (Jindowie) - L3, WA Mgt rights
1,168 26.4 2023 0.3 NA 293.4
Baldivis (Baldivis Parks) - L3, WA
50.0 1,046 21.5 2025 0.2 NA 212.0
Mandurah (Frasers Landing) - L3, WA
75.0 623 25.2 2025 0.2 NA 124.2
Shell Cove (The Waterfront) - L3, NSW
50.0 2,905 69.1 2026 0.3 NA 991.5
Clyde North (Berwick Waters) - L3, VIC
50.0/ PDA
2,324 40.6 2026 0.3 NA 790.4
North Coogee (Port Coogee) - L3, WA
100.0 845 1.9 2027 0.8 NA 676.9
Wallan (Wallara Waters) - L3, VIC 50.0 1,906 29.4 2027 0.2 NA 339.0
RESIDENTIAL – DEVELOPMENT PROJECTS (Cont'd)
BUSINESSREVIEW – AUSTRALIA
Note: All references to units include apartments, houses and land lots. 1 L – Land, H/MD – Housing/medium density, HD – High density 2 Includes 100% of joint arrangements (Joint operation-JO and Joint venture-JV) and PDAs
FR
AS
ER
S C
EN
TR
EP
OIN
T L
IMIT
ED
& S
UB
SID
IAR
IES
46

RESIDENTIAL – LAND BANK
Site1
Effective share as at
30 Sep 16 (%)
Estimated total no. of units2
Estimated total saleable area
('M sq ft)Total GDV
($'M)
Edmondson Park - H/MD, NSW 100.0 1,787 1.7 1,220.5Bahrs Scrub (Brookhaven) - L, QLD 100.0 1,350 NA 291.0Deebing Heights - L, QLD 100.0 962 NA 190.2Burwood East (Burwood Brickworks) - H/MD, VIC 100.0 743 0.9 496.2Hamilton (Hamilton Reach) - H/MD, QLD 100.0 501 0.7 540.7Cockburn Central (Cockburn Living) - H/MD, WA 100.0 356 0.3 182.5Parkville (Parkside Parkville) - H/MD, VIC 50.0 291 0.2 146.5Botany (Tailor's Walk) - H/MD, NSW 100.0 186 0.2 164.6Greenwood - HD/MD, WA PDA3 138 0.1 70.6Carlton - H/MD, VIC 65.0 137 0.1 70.4North Coogee (Port Coogee) - L, WA 50.0 33 NA 48.4Queenstown (Broadview Rise) - L, NZ 75.0 30 NA NARyde (Putney Hill Stage 2) - H/MD, NSW 100.0 22 0.0 47.1Chippendale (Central Park) - HD, NSW 100.0 7 0.0 NAWolli Creek (Discovery Point) - HD, NSW 100.0 1 0.2 29.5Warriewood - L, NSW 100.0 1 NA 7.6
Note: All references to units include apartments, houses and land lots 1 L – Land, H/MD – Housing/medium-density, HD – High-density 2 Includes 100% of joint arrangements (Joint operation-JO and Joint venture-JV) and PDAs 3 PDA – Project development agreement
Avondale, Avondale Heights, Victoria, Australia
AN
NU
AL
RE
PO
RT
20
16
47

COMMERCIAL & INDUSTRIAL
In the industrial market, demand remains strong across the eastern seaboard, with Sydney the strongest of the main industrial markets. In the office market, prime grade office yields in Sydney and Melbourne remain at historical lows driven largely by reduced stock levels and continuing strong new leasing demand.
FPA’s C&I development division delivered 11 facilities in FY2015/16, comprising five facilities to third parties with a GDV of $183 million, and six facilities for FPA’s Investment Properties portfolio with an investment value of $268 million. The committed forward workload at September 2016 is 187,000 sq m with a total end-value of $365 million, and includes 12 assets.
Leasing activity in FY2015/16 was steady with new leases to leading brands including Stanley Black & Decker, Baillieu Carpets, Nick Scali and O-I Glass committing to new facilities. The division’s speculative development programme continued, with leases secured for facilities developed at West Park Industrial Estate in Victoria (CEVA), The Horsley Drive Business
Park (Survitec and Phoenix Transport) in Sydney and at Berrinba (National Tiles and Avery Dennison) in Brisbane.
FPA continues to set industry benchmarks for efficiency in energy and water consumption in industrial facilities. Our speculative facility at Lot 1 Horsley Drive Business Park was the first industrial facility in Australia to achieve a 6 star Green Star rating and our 30,618 sq m O-I Glass facility at Yatala Central was the first industrial facility in Queensland to achieve a 6 star Green Star rating, representing World Leadership.
As low margin inventory is now progressively being converted to high yielding investment assets, the C&I division made four acquisitions during the year, comprising a total of approximately 48 hectares with a projected yield of 203,000 sq m (or GLA). The C&I division has been recapitalised to accelerate the creation of new assets to assist in the generation of increased passive earnings and deliver a growing asset base for FLT.
BUSINESSREVIEW – AUSTRALIA
COMMERCIAL & INDUSTRIAL – DEVELOPMENT PROJECTS
Site
Effective share as at
30 Sep 16 (%)Revenue to
go (%)
Target competion
DateTotal GDV
($'M)
Development for Internal PipelineBerrinba - Avery Dennison & Spec, QLD 100.0 23.0 1QFY16/17 25.4Keysborough - Dana & Spec, VIC 100.0 100.0 1QFY16/17 31.9Westpark/Truganina - CEVA Nissan, VIC 100.0 65.0 2QFY16/17 28.5Yatala - OJI, QLD 100.0 100.0 3QFY16/17 34.6WSPT - Nick Scali & Spec , NSW 100.0 100.0 3QFY16/17 29.8WSPT - Royal Comfort Bedding & Spec, NSW 100.0 100.0 3QFY16/17 28.6Yatala - Beaulieu Carpets, QLD 100.0 100.0 4QFY16/17 33.1Berrinba - National Tiles & Spec 2, QLD 100.0 100.0 4QFY16/17 31.6Keysborough - Stanley Black & Decker, VIC 100.0 100.0 1QFY17/18 27.8
Development for Third Party SaleMulgrave - BMW1 & Spec, VIC 50.0 5.0 1QFY16/17 53.2Rowville - Repco1, VIC 100.0 25.0 1QFY16/17 22.6Keysborough - ARB, VIC 100.0 100.0 3QFY16/17 18.5
Note: Profit on sold sites is recognised on percentage of completion basis 1 Sold site
48
FR
AS
ER
S C
EN
TR
EP
OIN
T L
IMIT
ED
& S
UB
SID
IAR
IES
48

Berrinba, Queensland, Australia
COMMERCIAL & INDUSTRIAL – LAND BANK
Site
Effective share as at
30 Sep 16 (%) Type
Estimated total saleable area
('M sq ft)Total GDV
($'M)
Truganina, VIC 100.0 Industrial 3.4 234.5Keysborough, VIC 100.0 Industrial 2.4 163.1Yatala, QLD 100.0 Industrial 2.1 140.3Eastern Creek, NSW 100.0 Industrial 1.2 82.4Chullora, NSW 100.0 Industrial 0.6 44.4Horsley Park, NSW PDA1 Industrial 0.5 31.5Edmondson Park, NSW 100.0 Retail 0.4 194.8Derrimut, VIC 100.0 Industrial 0.4 25.8Berrinba, QLD 100.0 Industrial 0.3 22.0Eastern Creek, NSW 50.0 Industrial 0.3 21.9Burwood East (Burwood Brickworks), VIC 100.0 Retail 0.3 103.1Richlands, QLD 100.0 Industrial 0.2 16.4Macquarie Park, NSW 50.0 Office 0.2 442.7Gillman, SA 50.0 Industrial 0.2 11.1Beverley, SA 100.0 Industrial 0.1 7.9
1 PDA: Project development agreement
10 Reconciliation Rise, Premulwuy, New South Wales, Australia
AN
NU
AL
RE
PO
RT
20
16
49

RETAIL
In late FY2014/15, a separate retail business unit was formed to concentrate on FPA’s growing retail portfolio of ‘town centre’-type assets that are complementary to our master-planned residential projects.
A highlight for the year was the opening and commencement of trading of Port Coogee Village Shopping Centre in Western Australia in June. With a NLA of 4,480 sq m, the centre comprises a Woolworths supermarket and 11 speciality shops, and adds needed retail amenity to FPA’s flagship Port Coogee development.
We also finalised a development agreement with the Western Sydney Parkland Trust for the development of 15 hectares of zoned retail land on an infill site at Eastern Creek in Sydney. This will allow for the immediate construction of 21,300 sq m of retail space with a further development stage subject to government approval.
The current retail development pipeline consists of 79,931 sq m across six development projects with a GDV of approximately A$525 million. The portfolio includes town centres at Edmondson Park in Sydney and Burwood in Melbourne.
We delivered two retail assets to third parties with a GDV of $47 million.
During the year, the Retail division was also appointed asset manager of FPA’s Central Park shopping centre in Sydney by the joint owners FPA and Sekisui House. As new retail assets are completed and move into the operational phase, we will expand our asset management operations.
BUSINESSREVIEW – AUSTRALIA
An artist's impression of Eastern Creek, Eastern Creek, NSW An artist's impression of Edmondson Park Town Centre, New South Wales, Australia
Central Park Mall, Sydney, New South Wales, Australia
FR
AS
ER
S C
EN
TR
EP
OIN
T L
IMIT
ED
& S
UB
SID
IAR
IES
50

An artist's impression of Eastern Creek, Eastern Creek, NSW An artist's impression of Edmondson Park Town Centre, New South Wales, Australia
Central Park Mall, Sydney, New South Wales, Australia
AN
NU
AL
RE
PO
RT
20
16
51

BUSINESSREVIEW – AUSTRALIA
INVESTMENT PROPERTIES
FPA’s investment portfolio consists of 19 income-earning assets valued at $1 billion at 30 September 2016. These are the remaining assets after the completion of FLT’s listing in June 2016. The portfolio comprises $300 million in industrial assets and $700 million in office assets.
The IP portfolio continued to perform well with 91.1% occupancy. The weighted average lease expiry (WALE) of 3.3 years was affected by industrial leases with less than three years remaining that were not included in the initial FLT portfolio.
The IP division sold four office assets in FY2015/16 for a total of $426 million as part of an ongoing asset management programme. Twenty8 Freshwater Place, a 34,011 sq m Grade-A office tower in Melbourne co-owned with The GPT Group, sold for $290 million (FCL’s share: $145 million); 197–201 Coward Street in Mascot, Sydney, an office complex of 22,628 sq m developed by FPA in 2002, sold for $145 million; the Satellite Corporate Park in Mulgrave, Melbourne, sold for $89 million; and Building 10 at 658 Church Street, Richmond, sold for $47 million.
The 2016 Global Real Estate Sustainability Benchmark (GRESB) results placed FPA’s diversified industrial/office portfolio first in its non-listed peer group, and marked the fourth year of improvement in its GRESB rating.
Frasers Logistics & Industrial Trust (FLT)FLT was successfully listed and commenced trading on the SGX-ST on 21 June 2016, completing the Group’s stable of sector-specific real estate trusts. It had an initial portfolio comprising 51 industrial and logistics properties acquired from FPA’s IP portfolio for approximately $1.6 billion. It is the only Australia-centric industrial REIT listed on the SGX-ST.
FLT exceeded the forecast for distributable income to unitholders by 2.3% for its maiden reporting period, from Listing Day on 20 June 2016 to 30 September 2016. Its DPU for the period was 1.84 cents, 2.8% above forecast.
FPA’s IP division continues to provide property management services to FLT.
77 Atlantic Drive, Keysborough, Victoria, Australia
99 Sandstone Place, Parkinson, Brisbane, Queensland, Australia
FR
AS
ER
S C
EN
TR
EP
OIN
T L
IMIT
ED
& S
UB
SID
IAR
IES
52

32 Gibbon Road, Winston Hills, New South Wales, AustraliaLot 22 Eucalyptus Place, Eastern Creek, New South Wales, Australia
FLT – INDUSTRIAL PORTFOLIO
Effective interest at 30 Sep 16
Book value at 30 Sep 16 Lettable area Occupancy
Property State (%) (A$'M) (sq ft) FY15/16 (%) FY14/15 (%)
18-34 Aylesbury Drive, Altona VIC 20.5 24.1 231,349 100.0 100.0610-638 Heatherton Road, Clayton South
VIC 20.5 20.8 90,277 100.0 100.0
49-75 Pacific Drive, Keysborough VIC 20.5 29.5 270,852 100.0 100.0115-121 South Centre Road, Melbourne Airport
VIC 20.5 5.6 33,207 100.0 100.0
96-106 Link Road, Melbourne Airport
VIC 20.5 24.9 200,198 100.0 100.0
17-23 Jets Court, Melbourne Airport
VIC 20.5 8.0 106,229 100.0 100.0
25-29 Jets Court, Melbourne Airport
VIC 20.5 11.1 167,314 100.0 100.0
28-32 Sky Road East, Melbourne Airport
VIC 20.5 9.5 130,092 100.0 100.0
38-52 Sky Road East, Melbourne Airport
VIC 20.5 27.5 497,626 100.0 100.0
2-46 Douglas Street, Port Melbourne
VIC 20.5 21.9 234,685 100.0 100.0
21-33 South Park Drive, Dandenong South
VIC 20.5 24.3 237,947 100.0 100.0
22-26 Bam Wine Court, Dandenong South
VIC 20.5 22.9 189,509 100.0 100.0
16-32 South Park Drive, Dandenong South
VIC 20.5 13.9 137,014 100.0 100.0
63-79 South Park Drive, Dandenong South
VIC 20.5 15.6 150,296 100.0 100.0
98-126 South Park Drive, Dandenong South
VIC 20.5 35.0 302,057 100.0 100.0
77 Atlantic Drive, Keysborough VIC 20.5 19.2 162,481 100.0 100.017 Pacific Drive and 170-172 Atlantic Drive, Keysborough
VIC 20.5 35.8 322,960 100.0 100.0
78 & 88 Atlantic Drive, Keysborough
VIC 20.5 17.3 145,259 100.0 100.0
150-168 Atlantic Drive, Keysborough
VIC 20.5 35.9 293,553 100.0 100.0
1-13 and 15-27 Sunline Drive, Truganina
VIC 20.5 29.3 281,508 100.0 100.0
468 Boundary Road, Derrimut VIC 20.5 24.8 266,213 100.0 100.0
AN
NU
AL
RE
PO
RT
20
16
53

FLT – INDUSTRIAL PORTFOLIO (Cont'd)
BUSINESSREVIEW – AUSTRALIA
Effective interest at 30 Sep 16
Book value at 30 Sep 16 Lettable area Occupancy
Property State (%) (A$'M) (sq ft) FY15/16 (%) FY14/15 (%)
42 Sunline Drive, Truganina VIC 20.5 16.7 157,540 100.0 100.02-22 Efficient Drive, Truganina VIC 20.5 42.0 412,634 100.0 100.0211A Wellington Road, Mulgrave VIC 20.5 38.2 77,231 100.0 NA²1 Doriemus Drive, Truganina VIC 20.5 84.9 802,406 100.0 NA²111 Indian Drive, Keysborough VIC 20.5 32.6 233,146 100.0 NA²4 Kangaroo Avenue, Eastern Creek¹ NSW 20.5 74.0 436,401 100.0 100.0Lot 5 Kangaroo Avenue, Eastern Creek
NSW 20.5 38.5 248,775 100.0 100.0
Lot 6 Kangaroo Avenue, Eastern Creek
NSW 20.5 64.0 445,636 100.0 100.0
Lot 22 Eucalyptus Place, Eastern Creek
NSW 20.5 27.8 173,019 100.0 100.0
6 Reconciliation Rise, Pemulwuy NSW 20.5 32.9 206,861 100.0 100.08-8A Reconciliation Rise, Pemulwuy
NSW 20.5 36.7 242,306 100.0 100.0
Lot 104 & 105 Springhill Road, Port Kembla
NSW 20.5 26.3 975,866 100.0 100.0
8 Distribution Place, Seven Hills NSW 20.5 23.3 132,600 100.0 100.010 Stanton Road, Seven Hills NSW 20.5 12.6 76,047 100.0 100.099 Station Road, Seven Hills NSW 20.5 17.0 115,949 100.0 100.080 Hartley Street, Smeaton Grange
NSW 20.5 64.0 659,623 100.0 100.0
32 Gibbon Road, Winston Hills NSW 20.5 39.0 178,950 100.0 100.010 Siltstone Place, Berrinba QLD 20.5 14.2 105,454 100.0 100.055-59 Boundary Road, Carole Park
QLD 20.5 16.1 142,622 100.0 100.0
57-71 Platinum Street, Crestmead QLD 20.5 29.6 207,733 100.0 100.051 Stradbroke Street, Heathwood QLD 20.5 23.6 160,554 100.0 100.030 Flint Street, Inala QLD 20.5 25.0 162,018 100.0 100.0286 Queensport Road, North Murarrie
QLD 20.5 36.5 231,758 100.0 100.0
350 Earnshaw Road, Northgate QLD 20.5 53.8 331,302 100.0 100.099 Sandstone Place, Parkinson QLD 20.5 238.7 583,888 100.0 100.099 Shettleston Street, Rocklea QLD 20.5 22.6 163,461 100.0 100.0Lot 1 Pearson Rd, Yatala QLD 20.5 37.0 329,569 100.0 NA²5 Butler Boulevard, Adelaide Airport
SA 20.5 9.0 88,522 100.0 100.0
18-20 Butler Boulevard, Adelaide Airport
SA 20.5 7.8 75,250 100.0 100.0
20-22 Butler Boulevard, Adelaide Airport
SA 20.5 11.2 120,523 100.0 100.0
Lot 102 Coghlan Road, Outer Harbor
SA 20.5 7.2 71,322 100.0 100.0
60 Paltridge Road, Perth Airport WA 20.5 18.2 216,817 52.6 52.6
Total Lettable Area 13,016,409 ¹ Comprises GLA of 15,918 sq m and additional GLA of 24,625 sq m which was completed in June 20162 Under construction as at 30 September 2015
FR
AS
ER
S C
EN
TR
EP
OIN
T L
IMIT
ED
& S
UB
SID
IAR
IES
54

Malmaison Cheltenham, UK
S I N G A P O R EFraser Place Tianjin, China Capri by Fraser, Ho Chi Minh City, Vietnam
H O S P I TA L I T Y

BUSINESSREVIEW
H O S P I TA L I T Y
Frasers Hospitality is an integrated serviced residence and hotel owner-operator with a footprint that spans Europe, the Middle East, Asia and Australia. Its business portfolio consists of serviced residences and hotels held by FHT as well as our non-REIT hospitality assets.
Revenue and PBIT from the hospitality segment rose by 39% and 9% year-on-year to $789 million and $135 million respectively. The increase in revenue and PBIT was largely driven by full year contributions from the Malmaison and Hotel du Vin (MHDV) group of 29 boutique hotels in the UK, Capri by Fraser, Brisbane, Australia and Capri by Fraser, Changi City, Singapore as well as contributions from newly launched properties Capri by Fraser, Frankfurt, Germany, and Capri by Fraser, Barcelona, Spain. Maiden contribution from FHT’s newly acquired Maritim Hotel Dresden in Germany, further boosted revenue and PBIT for Frasers Hospitality. The gains were partly offset by $16 million in mark-to-market losses on a cross-currency interest rate swap.
Looking ahead, there are some bright spots in the hospitality sector, as well as some challenging conditions in certain markets. Australia continues to show promise, particularly Sydney, where we have observed strong occupancy and room rate growth. In Singapore and China, the hospitality segment faces increased pressure from supply of new rooms. Over in Europe, the hospitality industry in the UK was affected by uncertainties caused by Brexit and in France, the impact of terrorist concerns continue to be felt. On the positive side, the weakened pound
FY2015/16
Revenue for Hospitality
$789 million
Fraser Place Setiabudi, Jakarta, Indonesia
sterling should encourage more international tourists to visit the UK, while countries like Spain and Germany appear to be benefitting from the change in choice of European destinations.
FR
AS
ER
S C
EN
TR
EP
OIN
T L
IMIT
ED
& S
UB
SID
IAR
IES
56

Fraser Place Setiabudi, Jakarta, Indonesia
FRASERS HOSPITALITY
In FY2015/16, Frasers Hospitality commenced construction of Capri by Fraser, China Square Central, Singapore, which is slated for completion in 2018. A total of 18 new properties were also added to the portfolio during the year through acquisitions and management contracts and Memoranda of Understanding (MOUs).
A portfolio of four properties in the UK was acquired for a consideration of £36.1 million (approximately $76.3 million) in December 2015. This acquisition follows the purchase of the MHDV group in 2015, an upscale boutique hotel collection. These four properties will be rebranded under MHDV brands to capitalise on the strength of these brands. In line with the aim to grow the brands across key regional city centres in the UK, we also completed the acquisition of two greenfield projects in Stratford-upon-Avon and Aberdeen, and completed a master lease for Malmaison in York, bringing the total number of MHDV properties to 36.
Outside of the UK, Frasers Hospitality signed 12 MOUs and management contracts in FY2015/16. We expanded our market presence to over 80 cities with management contracts in four new cities - Malta, Changsha, Hainan and Tokyo. We also further entrenched our footprint in key cities that Frasers Hospitality currently operates in with management contracts for new properties in Kuala Lumpur, Nanjing, Bangkok and Hanoi.
During the financial year, Frasers Hospitality launched five properties – Fraser Suites Geneva, which is located within the renowned district of Rue de la Rotisserie; the stylish 192-unit Fraser Place Tianjin; Fraser Place Antasya, our second property in Istanbul; Fraser Place Setiabudi, our third property in the bustling city centre of Jakarta; and the green-inspired Modena by Fraser Bangkok.
In addition, as part of Frasers Hospitality’s exclusive partnership with renowned luxury car-maker, Mercedes-Benz, we launched Mercedes-Benz Living @ Fraser at Capri by Fraser, Changi City, Singapore on the heels of the launch last year at Fraser Suites Kensington London. Nine selected apartments were redesigned with the distinctive flair and sophistication of the top of the line Mercedes Benz S-class – from the shimmering Swarovski chandelier made up of 1,233 handcrafted crystals, to calf-leather sofas and definitive high-end Burmester sound systems.
Currently, Frasers Hospitality is managing over 15,000 serviced apartments and hotel rooms with over 8,400 units which will be launched progressively over the next few years. It remains on track to achieve its target of 30,000 units under management by 2019.
AN
NU
AL
RE
PO
RT
20
16
57

BUSINESSREVIEW – HOSPITALITY
SERVICED RESIDENCES – PROPERTIES IN OPERATION
Owned Properties
Effective interest at 30 Sep 16 No. of
unitsOccupancy Average daily rate
Book value at 30 Sep 16
Country Property (%) FY15/16 (%) FY14/15 (%) FY15/16 FY14/15 ('M)Australia Fraser Suites Perth 100.0 236 86.8 89.0 A$295.9 A$314.9 A$115.5
Fraser Place Melbourne 100.0 112 88.0 89.7 A$145.8 A$142.3 A$31.3Capri by Fraser, Brisbane 100.0 239 74.8 63.1 A$205.5 A$218.4 A$93.2
China Fraser Suites Beijing 100.0 357 84.6 87.4 RMB839.3 RMB834.6 RMB1,200.0Indonesia Fraser Residence
Sudirman Jakarta 100.0 108 84.8 82.4 US$132.6 US$141.5 US$34.3UK Fraser Suites Kensington 100.0 70 75.8 75.7 £272.8 £253.7 £119.8 Philippines Fraser Place Manila 100.0 89 79.0 83.1 PHP6,914.7 PHP7,012.3 PHP1,587.0Spain Capri by Fraser,
Barcelona 100.0 97 83.0 68.1 €119.3 €101.4 €19.2Singapore Capri by Fraser,
Changi City 100.0 313 83.2 86.6 $258.9 $252.1 $203.4 Fraser Place Robertson Walk, Singapore 100.0 164 84.1 77.5 $339.8 $355.2 $210.0
Germany Capri by Fraser, Frankfurt 100.0 153 70.5 53.0 €135.2 €168.0 €34.5
Total no. 1,938
Properties under development
Country Property Equity (%) Estimated no. of units
Book value('M)
Targetopening
Germany Capri by Fraser, Berlin 100.0 145 €31.81 3QFY2016/17China Fraser Suites Dalian 100.0 259 RMB481.31 2QFY2017/18Singapore Capri by Fraser, China Square 100.0 306 $152.62 3QFY2018/19
Total no. 710
1 Total acquisition cost2 Total book value of the project as at 30 September 2016
Fraser Suites Dalian, ChinaMercedes-Benz Living @ Fraser, Capri by Fraser, Changi City, Singapore
FR
AS
ER
S C
EN
TR
EP
OIN
T L
IMIT
ED
& S
UB
SID
IAR
IES
58

Managed Properties
OccupancyCountry Property No. of units FY15/16 (%) FY14/15 (%)
Bahrain Fraser Suites Seef Bahrain 90 73.5 80.0Fraser Suites Diplomatic Area Bahrain 114 60.9 64.1
China Fraser Place Shekou Shenzhen 232 92.8 74.5Fraser Residence Shanghai 324 87.8 87.4Fraser Suites Top Glory, Shanghai 187 79.4 89.3Fraser Residence CBD East, Beijing 223 76.3 79.4Fraser Suites Nanjing 210 82.7 75.4Modena by Fraser Shanghai Putuo 348 80.4 74.9Fraser Suites Chengdu 360 60.7 65.1Fraser Suites Suzhou 276 84.4 76.4Modena by Fraser Jinjihu Suzhou 237 70.6 57.1Fraser Suites Guangzhou 332 88.9 81.2Modena by Fraser Wuxi New District 120 73.2 50.9Modena by Fraser Zhuankou Wuhan 172 69.8 57.3Fraser Place Tianjin 192 46.52 NA
France Fraser Suites Harmonie, Paris 134 39.11 80.2Fraser Suites Le Claridge, Paris 114 70.5 78.7
Hungary Fraser Residence Budapest 51 94.8 94.0Indonesia Fraser Residence Menteng Jakarta 128 74.0 43.6
Fraser Place Setiabudi 151 48.22 NAIndia Fraser Suites New Delhi 92 68.7 66.1Japan Fraser Residence Nankai Osaka 114 77.3 82.7UK Fraser Residence Prince of Wales Terrace 18 78.3 79.1
Fraser Residence Bishopgate 26 83.1 94.3Fraser Residence Blackfriars 12 78.7 79.2Fraser Residence Monument 14 81.5 80.2Fraser Residence City 22 83.7 81.3
Malaysia Fraser Place Kuala Lumpur 295 64.0 70.4Capri by Fraser, Kuala Lumpur 240 75.2 72.0Fraser Residence Kuala Lumpur 446 57.9 36.3
Qatar Fraser Suites Doha 138 62.9 75.3Singapore Fraser Residence Orchard 72 73.6 72.3South Korea Fraser Suites Insadong, Seoul 213 65.3 84.6
Fraser Place Central, Seoul 271 79.1 72.0Fraser Place Nandaemum 252 76.6 72.5
Switzerland Fraser Suites Geneva 67 65.5 NAThailand Fraser Suites Sukhumvit, Bangkok 163 84.0 83.5
Modena by Fraser, Bangkok 239 7.72 NATurkey Fraser Place Anthill Istanbul 116 60.6 63.7
Fraser Place Antasya Istanbul 80 55.72 NAUAE Fraser Suites Dubai 180 61.4 72.1Vietnam Fraser Suites Hanoi 185 88.2 94.6
Capri by Fraser, Ho Chi Minh City 175 74.8 63.7
Total no. (under management) 7,425
1 Currently undergoing renovation2 New properties which commenced operation during the financial year
AN
NU
AL
RE
PO
RT
20
16
59

BUSINESSREVIEW – HOSPITALITY
Hotel du Vin Bristol, UK
Malmaison Dundee, UKMalmaison Cheltenham, UK
Fraser Suites Top Glory, Shanghai, China
FR
AS
ER
S C
EN
TR
EP
OIN
T L
IMIT
ED
& S
UB
SID
IAR
IES
60

MHDV Group of Hotels
Effective interest at 30 Sep 16 No. of
units
Average daily rateBook value
at 30 Sep 16Occupancy FY15/16 FY14/15
Country Property (%) FY15/16 (%) FY14/15 (%) (£'M) (£'M) (£'M)
UK Malmaison Aberdeen Master leased 79 69.3 81.7 96.9 126.1 0.0UK Malmaison Belfast 100.0 64 87.2 91.1 96.3 90.6 7.4UK Malmaison Birmingham Master leased 192 85.2 77.0 93.4 90.0 0.0UK Malmaison Dundee Master leased 91 76.2 87.4 73.4 87.6 0.0UK Malmaison Edinburgh 100.0 100 81.7 89.7 93.0 115.1 14.9UK Malmaison Glasgow 100.0 72 79.4 89.7 92.9 96.2 10.5UK Malmaison Leeds 100.0 100 81.9 83.1 92.6 89.8 14.2UK Malmaison Liverpool 100.0 130 80.7 83.4 83.1 76.2 13.9UK London Charterhouse Master leased 97 87.7 93.5 164.9 162.2 0.0UK Malmaison Manchester Master leased 167 87.1 86.8 104.8 93.4 0.0UK Malmaison Newcastle Master leased 122 85.0 90.1 96.2 95.1 0.0UK Malmaison Oxford Master leased 95 88.6 95.5 164.8 179.3 0.0UK Malmaison Reading 100.0 75 79.4 89.3 106.3 104.8 13.2UK Malmaison Brighton Master leased 71 71.5 NA 103.7 NA 0.0UK Malmaison Cheltenham 100.0 61 71.6 NA 120.5 NA 11.7UK Hotel du Vin Birmingham 100.0 66 87.5 80.1 102.1 100.0 10.1UK Hotel du Vin Brighton 100.0 49 87.2 93.3 145.8 164.3 18.5UK Hotel du Vin Bristol 100.0 40 87.5 92.1 131.7 136.4 12.6UK Hotel du Vin Cambridge 100.0 41 85.4 91.4 168.9 175.2 15.4UK Hotel du Vin Cheltenham 100.0 49 82.4 85.1 114.6 106.9 9.0UK Hotel du Vin Edinburgh 100.0 47 86.5 88.7 126.5 166.4 12.3UK Hotel du Vin Glasgow 100.0 49 82.3 90.0 130.4 141.0 11.5UK Hotel du Vin Harrogate 100.0 48 81.1 82.5 110.8 117.3 7.4UK Hotel du Vin Henley 100.0 43 83.0 93.1 132.3 152.3 9.4UK Hotel du Vin Newcastle 100.0 42 75.7 82.5 102.5 101.7 4.7UK Hotel du Vin Poole 100.0 38 83.9 94.2 115.4 138.8 4.0UK Hotel du Vin St Andrews 100.0 40 70.3 82.6 145.1 204.1 6.5UK Hotel du Vin Tunbridge
Wells100.0 34 84.0 82.4 124.1 128.4 9.1
UK Hotel du Vin Wimbledon 100.0 48 77.5 79.9 141.7 172.4 17.4UK Hotel du Vin Winchester 100.0 24 83.9 92.5 140.4 137.6 8.0UK Hotel du Vin York 100.0 44 81.7 88.7 111.6 123.5 10.3UK Hotel du Vin AVG Bristol 100.0 75 80.2 NA 88.9 NA 12.3UK Hotel du Vin Exeter 100.0 59 80.6 NA 109.1 NA 10.4
Total no. of rooms (owned and leased) 2,352
AN
NU
AL
RE
PO
RT
20
16
61

HELD THROUGH FRASERS HOSPITALITY TRUST
Country Property
FCL's effective interest at
30 Sep 16 (%) No. of units
Book value at30 Sep 161
('M)
Australia Fraser Suites Sydney 21.6 201 A$118.5Novotel Rockford Darling Harbour 21.6 230 A$82.0Sofitel Sydney Wentworth 21.6 436 A$262.5
Singapore InterContinental Singapore 21.6 406 $535.0Fraser Suites Singapore 21.6 255 $305.0
United Kingdom Fraser Suites Glasgow 21.6 98 £9.8Fraser Suites Edinburgh 21.6 75 £14.1Fraser Suites Queens Gate London 21.6 105 £58.4Best Western Cromwell London 21.6 85 £17.9Park International London 21.6 171 £40.7Fraser Place Canary Wharf London 21.6 108 £39.8
Japan ANA Crowne Plaza Kobe 21.6 593 ¥14,300.0Malaysia The Westin Kuala Lumpur 21.6 443 RM410.0Germany Maritim Hotel Dresden 21.6 328 €58.9
Total no. of rooms owned and managed 3,534
Total under Frasers Hospitality 15,2492
1 Book value as reported by FHT. The Group adjusted the book value to reflect its freehold interest in the serviced apartments and hotels2 Excluding properties under development
Frasers Hospitality TrustFor FY2015/16, FHT’s gross revenue grew 17.1% year-on-year to $123.6 million while net property income rose 20.6% to $104.2 million. The higher gross revenue and net property income was attributed to the addition of Sofitel Sydney Wentworth and Maritim Hotel Dresden, and better performance of the remaining Sydney properties and ANA Crowne Plaza Kobe. These contributions helped to offset the weaker performance of Singapore and London properties.
Distributable income was $84.9 million, up 10.0% year-on-year. Excluding the effects of the rights issue, FHT’s DPS would have been 6.13 cents, a marginal drop of 1.1% compared to last year.
Maritim Hotel Dresden, Germany
FHT further grew its portfolio with a third-party acquisition. With the completion of the acquisition of Maritim Hotel Dresden in Germany in June 2016, its portfolio comprised eight hotels and six serviced apartments as at 30 September 2016.
BUSINESSREVIEW – HOSPITALITY
FR
AS
ER
S C
EN
TR
EP
OIN
T L
IMIT
ED
& S
UB
SID
IAR
IES
62

Chengdu Logistics Hub, Chengdu, China
Camberwell On The Green, London, United Kingdom
I N T E R N AT I O N A LB U S I N E S S

BUSINESSREVIEW
I N T E R N AT I O N A L B U S I N E S S
Our International Business comprises FCL’s investments in China, the United Kingdom (UK), Vietnam, and Thailand.
CHINA
In China, revenue and PBIT decreased to $96 million and $118 million, down 78% and 44%, respectively. This was mainly due to the absence of the one-off gain from the divestment of a commercial property, Crosspoint, in Beijing last year. A delay in settlement of Phase 3C1 in Suzhou Baitang from the fourth quarter of FY2015/16 to the first quarter of FY2016/17 also affected contributions. The decline was partially offset by the completion of Gemdale Megacity Phase 3C in Songjiang.
In FY2015/16, 21 units at completed phases in Suzhou Baitang were sold while the uncompleted Phases 3B and 3C1 saw sales of 462 units. Sales of 1,195 units was achieved by Gemdale Megacity, with handover for Phase 3C in September 2016. Chengdu Logistics Hub sold 22 units; Phase 4 attained its TOP in August 2016.
Looking ahead, we have a land bank of over 2,700 units, which should underpin contributions from China for the next two to three years. The macro fundamentals for the housing market in China continue to be favourable, providing a positive backdrop for our residential developments in Shanghai and Suzhou. However, our logistics park in Chengdu faces market challenges, with office rentals in Chengdu continuing to decline due to oversupply and stiff competition.
DEVELOPMENT PROJECTS
Project Location
Effective interest at 30 Sep 16
(%)No. of units
% Sold at 30 Sep 16
% Completion at 30 Sep 16
Ave. selling price
(RMB psf)
Est.saleable
area ('M sq ft)
Land cost1
(RMB psf)
Target completion
dateBaitang One (P1B)
Suzhou 100.0 542 100.0 100.0 1,265 0.7 236 Completed
Baitang One (P2A)
Suzhou 100.0 538 99.8 100.0 1,125 0.8 238 Completed
Baitang One (P2B)
Suzhou 100.0 360 98.6 100.0 1,435 0.8 237 Completed
Baitang One (P3A)
Suzhou 100.0 706 100.0 100.0 1,310 0.8 237 Completed
Chengdu Logistics Hub (P2)3
Chengdu 80.0 163 82.8 100.0 805 0.7 26 Completed
Gemdale MegaCity (P2A)2
Shanghai 45.2 1,065 98.7 100.0 1,566 1.5 148 Completed
Gemdale MegaCity (P2B)2
Shanghai 45.2 1,134 99.8 100.0 1,788 1.2 159 Completed
Gemdale MegaCity (P3C)2
Shanghai 45.2 1,446 99.4 100.0 2,151 1.4 146 Completed
Chengdu Logistics Hub (P4)3
Chengdu 80.0 358 4.5 100.0 656 1.8 34 Completed
Baitang One (P3C1)
Suzhou 100.0 706 99.7 87.5 1,833 0.8 238 1QFY16/17
Baitang One (P3B)
Suzhou 100.0 380 6.8 32.0 3,306 0.6 238 4QFY16/17
Gemdale MegaCity (P3A)2
Shanghai 45.2 278 97.1 49.9 3,482 0.3 147 4QFY16/17
Gemdale MegaCity (P3B)2
Shanghai 45.2 575 97.7 66.6 2,470 0.6 147 4QFY16/17
1 Land cost includes land use tax 2 Gemdale MegaCity was accounted as an associate 3 Under Phase 1 of Chengdu Logistics Hub, we have an 80% interest in a warehouse which has a book value of $42.6 million with a net
lettable area of 507,468 sq ft
FR
AS
ER
S C
EN
TR
EP
OIN
T L
IMIT
ED
& S
UB
SID
IAR
IES
64

1 Land cost includes land use tax 2 Gemdale MegaCity was accounted as an associate
Baitang One, Suzhou, China
LAND BANK
Site Location
Effective interest at
30 Sep 16 (%)Est. no. of units
Est.saleable area
('M sq ft)Land cost1
(RMB psf)
Baitang One (3C2) Suzhou 100.0 377 0.5 238
Gemdale Megacity (P4-6)2 Shanghai 45.2 2,192 2.8 200
Residential sub-total 2,569 3.3
Chengdu Logistic Park (P2A) Chengdu 80.0 179 1.0 29
Commercial sub-total 179 1.0
Total 2,748 4.3
AN
NU
AL
RE
PO
RT
20
16
65

UNITED KINGDOM
In the UK, revenue and PBIT increased to $147 million and $47 million, respectively, mainly attributable to sales and profit contribution from Blk 5C of Riverside Quarter as completed units were delivered.
In FY2015/16, sales of about 90 units were achieved while 116 units were settled. Over at Riverside Quarter, sales of ground floor commercial space as well as of latest addition, Five Eastfields, contributed to the units sold. Completed in March 2016 and comprising 99 private apartments, Five Eastfields achieved £61 million in sales during the year.
Seven Eastfields, Camberwell on the Green in southeast London and Sky Gardens, in the Nine Elms, Vauxhall regeneration zone, are expected to be completed in the coming financial year.
On the acquisitions front, we purchased Central House in Aldgate East, a 100,000-sq-ft building currently occupied by London Metropolitan University, for £50 million. Planning is now being sought for a 300,000-sq-ft mixed-use development for commercial and hotel use.
BUSINESSREVIEW – INTERNATIONAL BUSINESS
DEVELOPMENT PROJECTS
Project Location
Effective interest at 30 Sep 16
(%)No. of units1
% Sold at 30 Sep 16
% Completion at 30 Sep 16
Ave. selling price2 (£ psf)
Est.saleable
area ('M sq ft)
Land cost
(£ psf)
Target completion
date
5 Riverside Quarter London 80.0 149 80.0 100.0 949.0 0.1 150 Completed7 Riverside Quarter London 80.0 87 41.0 90.0 1,013.0 0.1 68 1QFY16/17Camberwell on the Green London 80.0 101 47.0 75.0 745.0 0.1 51 1QFY16/17Vauxhall Sky Gardens London 80.0 237 100.0 70.0 923.0 0.2 62 2QFY16/17
LAND BANK
Site Location
Effective interest at
30 Sep 16 (%)Est. no. of units1
Est.saleable area
('M sq ft)Land cost
(£ psf)
Riverside Quarter Phase 9 (consented scheme) London 80.0 133 0.1 73
Central House (commercial mixed development)
London 100.0 NA 0.2 to 0.33 211
1 Includes affordable units2 Price relates to the private residential units3 Subject to planning approval
5 Riverside at Riverside Quarter, London, UK
The uncertainty surrounding Brexit has created some turbulence across all sectors. In the residential market, prime Central London pricing is under pressure although overseas investors are returning to the market to take advantage of the weaker pound.
FR
AS
ER
S C
EN
TR
EP
OIN
T L
IMIT
ED
& S
UB
SID
IAR
IES
66

VIETNAM
In June 2016, FCL entered into a conditional agreement to acquire a 70% stake for approximately $21 million in a joint venture with An Duong Thai Dien Real Estate Trading Investment Joint Stock Company and other local partners. The joint venture will develop a residential-cum-commercial project on a one-hectare prime site in the Thao Dien Ward of Ho Chi Minh City. The site will be served by the city’s first metro line scheduled to be completed in 2020.
FCL also has a 75% interest in Me Linh Point, a 22-storey retail/office building in District 1, Ho Chi Minh City.
THAILAND
In Thailand, the Group acquired a 35.6% stake in Golden Land Property Development Public Company Limited (Golden Land) for $231 million in FY2015/16. Listed on the Stock Exchange of Thailand, Golden Land is one of Thailand’s leading real estate developers engaged in landed residential and integrated mixed-use commercial property development. The investment in Golden Land is in line with the Group’s strategy to grow income from overseas and recurring sources. Golden Land posted 9-month net profit of THB 930 million as at 30 September 2016, and contributed $15 million PBIT to the Group in FY2015/16.
OFFICE PORTFOLIO
Effective interest at 30 Sep 16
Book value at 30 Sep 16
Net lettable area Occupancy
Property (%) (US$'M) (sq ft) FY15/16 (%) FY14/15 (%)
Me Linh Point Tower 75.0 40.5 188,250 98.7 100.0
AN
NU
AL
RE
PO
RT
20
16
67

INVESTOR RELATIONS
OVERVIEW
FCL’s investor relations (IR) team is focused on proactively engaging the financial community and the media to generate awareness and understanding of FCL’s business model, competitive strengths, growth strategy, and investment merits; as well as garner feedback for consideration.
The senior management and IR team regularly engage these stakeholders through multiple platforms. These include one-on-one meetings, results calls and briefings, post-results luncheons, non-deal roadshows (NDRs), and conferences. During the financial year, we attended NDRs and conferences in Bangkok, Hong Kong, Kuala Lumpur, London, Seoul, Sydney, Tokyo, the USA, and Zurich.
PROACTIVE AND REGULAR ENGAGEMENT
As part of our ongoing regular updates on our business, we announce our financial performance on SGXNET every quarter, along with a press release and presentation. We also host quarterly conference calls, during which members of our senior management team present highlights of our financial results and answer questions posed by analysts and institutional investors. We also host in-person briefings of our half-year and full-year results, which are attended by analysts, institutional investors, and the media. A concurrent dial-in facility is also offered for those who wish to attend the briefing, but are unable to do so in person.
All the materials related to FCL’s quarterly announcements of our financial performance, as well as webcasts of the FY2015/16 half-year and full-year results presentations, are publicly available via FCL’s corporate website (www.fraserscentrepoint.com).
The website serves as a resource centre from which the public can access information about FCL. In addition to the aforementioned resources, the website also contains fact sheets about FCL, and provides more insights into our business and properties.
In addition, over the course of the year, FCL participated in 254 meetings with analysts and institutional investors to facilitate understanding of our developments and growth plans. We also organised a property tour for analysts to visit properties in Bangkok owned by the Group’s 35.6%-held associate, Golden Land. The site visit, which included a briefing by the CEO and CFO of Golden Land, helped analysts better understand Golden Land’s business and prospects.
COMMITTED TO STRATEGIC GROWTH AND CORPORATE TRANSPARENCY
For the third consecutive year, FCL was recognised for its deep commitment to uphold high standards of corporate governance. FCL won the runner-up title for the Most Transparent Company Award (Real Estate Category) at the 2016 Investors’ Choice Awards organised by the Securities Investors Association (Singapore) (SIAS).
Our award win serves as strong motivation as we strive towards further excellence in corporate leadership and governance.
For enquiries on FCL, please contact:
Ms Gerry WongHead, Group CommunicationsTel: (65) 6276 4882Email: [email protected]
FR
AS
ER
S C
EN
TR
EP
OIN
T L
IMIT
ED
& S
UB
SID
IAR
IES
68

BROKERAGES COVERING FCL (As of 30 September 2016)
1 2 3 4 5 6 7 8
Bank of America-
Merrill Lynch
CIMB Research
CLSA Daiwa Capital Markets
DBS Bank HSBC JP Morgan Macquarie Securities
Group
FY2015/16 INVESTOR RELATIONS CALENDAR
2015 2016
NOV• Release of FY2014/15
results• Investor meetings in
Singapore and Hong Kong
• Morgan Stanley 14th Annual Asia Pacific Summit
JAN• DBS Pulse of Asia
Conference• Annual General Meeting
FEB• Release of 1Q
FY2015/16 results• Investor meetings in
Singapore and Kuala Lumpur
MAR• Citi Global Property
CEO Conference in the USA
• Investor meetings in the USA
• Investor meetings in Bangkok
APR• Credit Suisse 19th
Annual Asian Investment Conference in Hong Kong
MAY• Release of 2Q
FY2014/15 results• Investor meetings in
Singapore• dbAccess Asia
Conference 2016
JUN• Investor meetings in
Sydney, London and Zurich
JUL• Investor meetings in
Singapore and Hong Kong
AUG• Release of 3Q
FY2014/15 results• Investor meetings in
Singapore• Investor meetings in
Tokyo and Seoul
SEP• Investor meetings in
Hong Kong• UBS Singapore
Corporate Day in Hong Kong
FCL’S CLOSING PRICE AND TRADING VOLUME IN FY2015/16
1.700
1.650
1.600
1.550
1.500
10M
5M
FCL SP Equity - Last Price 1.490High on 11/26/15 1.720Average 1.595Low on 09/21/16 1.470
FCL SP Equity - Last Price 0.261MHigh on 11/26/15 12.048MAverage 0.265MLow on 04/21/16 12600
OCT 15 NOV 15 DEC 15 JAN 16 FEB 16 MAR 16 APR 16 MAY 16 JUN 16 JUL 16 AUG 16 SEP 16
AN
NU
AL
RE
PO
RT
20
16
69

TREASURY HIGHLIGHTS
The Group manages its financial structure prudently to ensure that it will be able to access adequate capital at favourable terms. Our main business segments, Residential, Commercial (retail, office, business space and mixed-use developments), Hospitality and the Asset Management of the four REITs generate cash flows for the Group in Singapore and over 80 cities around the world. Management monitors the Group’s cash flow position, debt maturity profile, funding cost, interest rate and foreign exchange exposures and overall liquidity position on a continuous basis. To ensure that the Group has adequate overall liquidity to finance its operations and investment requirements, the Group maintains available banking facilities with a large number of banks globally. The Group also taps the debt capital markets through its Medium Term Notes (MTN) programmes. In FY2015/16, FCL Treasury raised $250 million 10-year bonds and US$200 million five-year bonds. The REITs raised $100 million of perpetual securities (FHT), $100 million five-year bonds (FCOT) and $50 million five-year bonds (FCT).
In FY2015/16, the Group improved its capital position (net worth increased 11% to $11,843 million) and its cash balance (increased 58% to $2,169 million). The capital position was improved due to contributions from non-controlling interests relating to FLT's listing, the issuance of Perpetual Securities by FHT in 2016 and retained earnings for the year. Net Group Borrowings had decreased from $8.9 billion to $7.6 billion mainly due to the repayment of Frasers Property Australia’s loans with proceeds from the listing of FLT. The increased cash balance is due to cash collection from the strong pipeline of pre-sold development projects in Singapore, China, UK and Australia, stable cash flow generated from investment properties and the monetisation of assets through assets sales and the injection of industrial and logistics properties into FLT.
SOURCE OF FUNDING
Besides cash flow from our businesses, the Group also relies on the debt capital markets, equity capital markets and syndicated and bilateral banking facilities for its funding. As at 30 September 2016, the Group has over $2 billion in unutilised banking facilities that may be used to meet the funding requirements of the Group.
The Group maintains an active relationship with a network of more than 25 banks globally, located in various countries where the Group operates. Our principal bankers include Australia and New Zealand Banking Group Limited, Bank of China Limited, DBS Bank Ltd., Malayan Banking Berhad, Oversea-Chinese Banking Corporation Limited, Standard Chartered Bank, Sumitomo Mitsui Banking Corporation, The Bank of Tokyo-Mitsubishi UFJ, Limited and United Overseas Bank Limited.
The Group continues to adopt the philosophy of engaging the banks as our core business partners and continues to receive very strong support from our relationship banks across all segments of the Group’s businesses. All banking relationships for the entire Group are maintained by Group Treasury in Singapore.
DEBT CAPITAL MARKETS
The Group has various MTN programmes in place to tap the debt capital market. FCL Treasury Pte Ltd has an updated $3 billion (issued: $2,148 million) MTN programme. Our sponsored REITs, FCT, FCOT and FHT, each have their respective MTN programmes: FCT: $1 billion (issued: $270 million); FCOT: $1 billion (issued: $100 million); and FHT: $1 billion (issued: $100 million).
DEBT MATURITY PROFILE – FCL GROUP WITH REITS ($’M)
1,4701,291
2,426 2,542
1,051 1,016
< 1 yr 1 to 2 yrs 2 to 3 yrs 3 to 4 yrs 4 to 5 yrs > 5 yrs
FR
AS
ER
S C
EN
TR
EP
OIN
T L
IMIT
ED
& S
UB
SID
IAR
IES
70

INTEREST RATE PROFILE AND DERIVATIVES
The Group manages its interest cost by maintaining a prudent mix of fixed and floating rate borrowings. On a portfolio basis, 86% of the Group’s borrowings are in fixed rates (including floating rate borrowings that have been fixed with interest rate swaps). The average tenor of the loans is 3 years as at 30 September 2016. The floating rate loan portfolio allows the Group to maintain a flexible maturity profile to support divestments and cash inflows from sales of development property in order that debt can be reduced quickly.
In managing the interest rate profile, the Group takes into account the interest rate outlook, expected cash flow generated from its business operations, holding period of long-term investments and any acquisition and divestments plans.
The Group makes use of interest rate derivatives for the purpose of hedging interest rate risks and managing its portfolio of fixed and floating rate borrowings. The Group does not engage in trading in interest rate derivatives. The Group’s total interest rate derivatives and the mark-to-market values as at 30 September 2016 are disclosed in the financial statement in Note 21.
GEARING AND INTEREST COVER
The Group aims to keep the Group’s net gearing to equity ratio between 80% and 100%. As at 30 September 2016, this ratio was 64%. Net interest expense for the year amounted to $181 million, which includes $39 million that was capitalised as part of Properties Under Development. The net interest cover1 over profit before interest and taxation was at 7 times.
FOREIGN EXCHANGE RISKS AND DERIVATIVES
The Group has exposure to foreign exchange risk as a result of transactions denominated in foreign currencies, arising from normal development and investment activities. Where exposures are certain, it is the Group’s policy to hedge these risks as they arise. The Group uses foreign currency forward contracts and certain currency derivatives to manage these foreign exchange risks.
The Group does not engage in trading of foreign exchange and foreign exchange derivatives. The Group uses foreign exchange contracts and derivatives solely for hedging actual underlying foreign exchange requirements in accordance with hedging limits set by the Audit Committee and the Board under the Group's Treasury Policy. These policies are reviewed regularly by the Audit and Executive Committees to ensure that the Group’s policies and guidelines are in line with the Group’s foreign exchange risk management objectives.
The Group’s foreign exchange contracts and derivatives and the mark-to-market values as at 30 September 2016 are disclosed in the financial statement in Note 21.
1 Net Interest in the profit statement excluding mark to market adjustments on interest rate derivatives and capitalised interest
AN
NU
AL
RE
PO
RT
20
16
71
Community Chest and Frasers Centrepoint Malls launched Play It Forward with the Last Bucket of Balls
First aid training at Fraser Place Manila
S U S TA I N A B I L I T YR E P O R T
Vertical greenery at One Central Park, Sydney, Australia

“Sustainability is core to everything
we do at FCL. From our mission to
create value through space for today
and tomorrow, to our commitment to
maintain a high standard of corporate
governance, environmental and social
practices, to FCL’s strategic objective
that is centred on delivering sustainable
earnings. We are honoured that the
Group has received numerous awards
recognising our efforts and achievements
on this front. We will constantly look
at ways to do even better as we keep
our sights firmly on our vision to be the
real estate company of choice for our
stakeholders.”
Panote SirivadhanabhakdiGroup CEO & Chairman of FCL Sustainability Steering Committee
CONTENTS
74 GROWING SUSTAINABILITY AT FCL
76 KEY HIGHLIGHTS
78 ABOUT THIS REPORT
79 WHAT’S IMPORTANT TO US
88 MANAGING SUSTAINABILITY
90 GOVERNANCE
93 ENVIRONMENT
101 PEOPLE
121 INNOVATION
125 GRI CONTENT INDEX (G4 CORE)

REAL PLACES FOR
REAL PEOPLE
FCL launched our first Green Mark residential project, a year after BCA launched the Green Mark Scheme• The Azure – Gold
FCL became a Founding Member of the Singapore Green Building Council
Central Park in Perth achieved carbon neutrality
FCL received our first Green Mark award for retail mall and office building• Causeway Point – Platinum• Bedok Point – Gold• Alexandra Point – Gold
In this report, our second, we demonstrate how our sustainability drive continues to be embedded within our strategy, and how we support sustainability in our business activities, our sector, and the local and global communities.
At FCL, we are bound by a common objective across our diverse geographic footprint – to develop real places for real people. We aim to deliver value to our stakeholders and the communities we serve. This is a promise we take seriously.
2 0 0 6 2 0 0 9 2 0 1 1
The Azure, Singapore Causeway Point, Singapore Bedok Point, Singapore One Central Park, Sydney, Australia
GROWING SUSTAINABILITY AT FCL
FR
AS
ER
S C
EN
TR
EP
OIN
T L
IMIT
ED
& S
UB
SID
IAR
IES
74

OHSAS 18001:2007 certification attained for all Singapore office properties
Frasers Hospitality (FH) dedicated March as Frasers EnvironmentMonth
One Central Park in Sydney was awarded winner of the International Green Infrastructure Award by the World Green Infrastructure Congress, and Best Tall Building (Asia & Australia) by the Council of Tall Buildings and Urban Habitat
Published our first sustainability report in accordance with the Global Reporting Initiative (GRI) (G4 Core) guidelines
Alexandra Point, Capri by Fraser Changi City, Singapore and Causeway Point in Singapore were named among the Top 10 energy efficient buildings in their respective categories by BCA
The Ponds Shopping Centre in Sydney became the first retailproject to achieve 6 Star Green Star rating by the Green BuildingCouncil of Australia
Frasers Property Australia (FPA) achieved the first Green Star Performance portfolio certification in Australia
FCL was ranked among the Top 10 brands in Singapore by Brand Finance
FCL became a signatory to the United Nation Global Compact
FCL piloted Building Information Modelling-Virtual Design and Construction (BIM-VDC) on a mixed-development in Singapore
FCL dedicated August as Frasers Health & Safety Month
FPA topped the Global Real Estate Sustainability Benchmark (GRESB) 2016 in the global diversified office/industrial/non-listed funds category
FH launched 'Just One' hotel programme with World Wide Fund for Nature (WWF) – Earth Hour to raise $3 million by 2020
2 0 1 4 2 0 1 5 2 0 1 6
Our sustainability journey began long before the publication of our inaugural sustainability report last year. We have come a long way, from our first Building and Construction Authority (BCA) Green Mark building award in 2006, to publishing our first sustainability report last year and being recognised for transparency at the Securities Investors Association Singapore (SIAS) Investors’ Choice Awards for the third year running, and we continue to grow in our sustainability practices.
The Azure, Singapore Causeway Point, Singapore Bedok Point, Singapore One Central Park, Sydney, Australia
More recently, FCL has been ranked among the Top 10 Singapore Brands by Brand Finance with a brand value of $1 billion.
AN
NU
AL
RE
PO
RT
20
16
75

GROWING SUSTAINABILITY AT FCL
In February this year, we became a signatory to the United Nations Global Compact (UNGC). We joined more than 9,000 companies and 3,000 non-business organisations in an innovative and collaborative worldwide movement to shape a sustainable future for the global business community through promoting responsible business practices that will benefit both businesses and the society. In addition, we have joined Global Compact Network Singapore, the local chapter of the UNGC, as a Gold Member.
We support the Sustainable Development Goals (SDGs) adopted by countries of the United Nations, which came into effect on 1 January 2016. We are reviewing our commitments against the 17 SDGs and will focus on specific goals where, given our business, we feel we can maximise our impact on a global scale. We believe that there is strong interconnectedness between our business practices, the community and society. We are confident of delivering value to our stakeholders in the long term, with our success rests on the integration of business and societal needs.
Our commitment to global and national agendas is crystallised through our business processes and activities. During the year, we set up new sustainability sub-committees for Environment, Health & Safety and Innovation to enable a more structured driving force of sustainability initiatives. We have also implemented ISO 14001 across some of our business units to enhance our environmental performance through the systematic management of our environmental responsibilities. In addition, we expanded the coverage of OHSAS 18001 Health & Safety Management System to a wider scope of operations, and put in place policies, procedures and controls to achieve the best possible working conditions and to promote workplace health and safety.
Our performance indicators provide us with a focus for measuring and reporting sustainability and compliance. Unless otherwise stated, performance indicators are for FY2015/16. Our report is guided by the GRI (G4 Core) guidelines and indicators, in line with the material issues we need to address.
WE WELCOME YOUR FEEDBACK AND SUGGESTIONS [G4-31]
We seek to continuously improve our sustainability performance and your feedback is vital to us in achieving our aims. Please write to:
Dr Pang Chin HongAssistant General Manager, Corporate Planning & Chairman, Sustainability Working CommitteeFrasers Centrepoint LimitedEmail: [email protected]
KEY HIGHLIGHTS
Became a signatory to the
United Nations Global Compact (UNGC)
G O V E R N A N C E
Most Transparent Company, Real Estate Category, Runner-Up at SIAS 17th Investors’ Choice Awards 2016
Extended coverage of Environment, Health & Safety policy and management systems aligned with ISO 14001 and OHSAS 18001 to our key operations and corporate office
Established sustainability sub-committees for Environment, Health & Safety, and Innovation
EHS
FR
AS
ER
S C
EN
TR
EP
OIN
T L
IMIT
ED
& S
UB
SID
IAR
IES
76
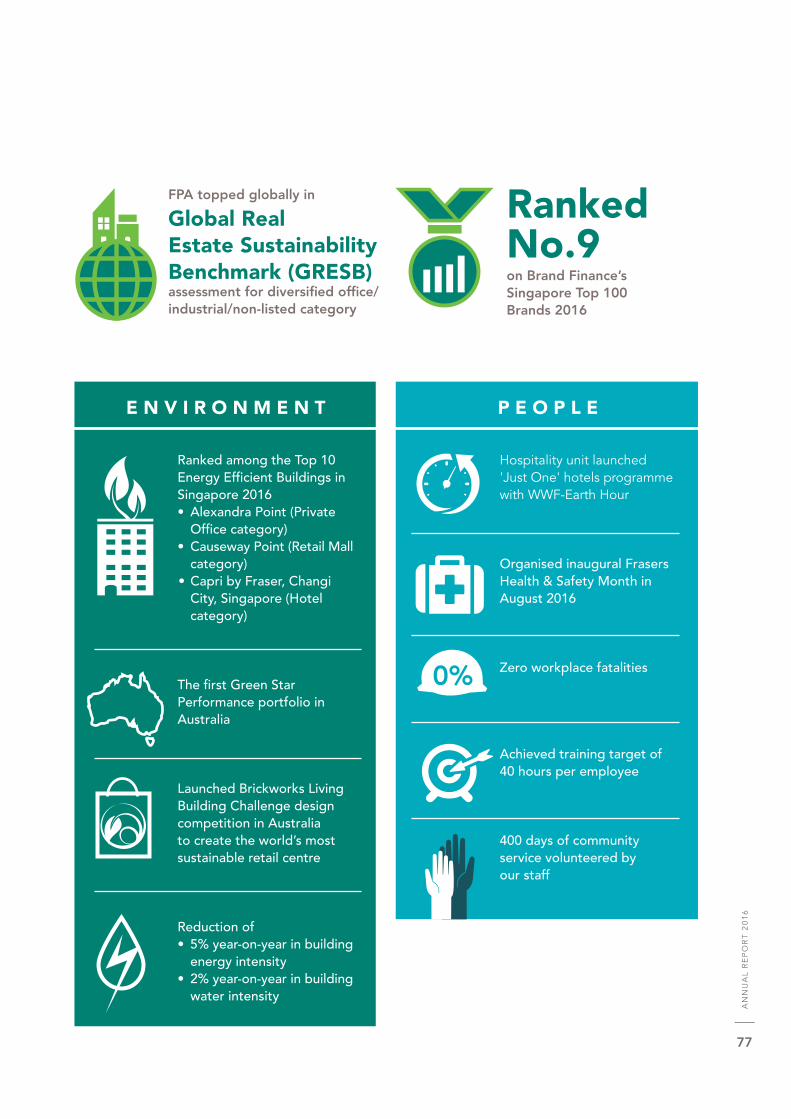
Ranked No.9
FPA topped globally in Global Real Estate Sustainability Benchmark (GRESB) assessment for diversified office/industrial/non-listed category
on Brand Finance’s Singapore Top 100 Brands 2016
E N V I R O N M E N T
Ranked among the Top 10 Energy Efficient Buildings in Singapore 2016
• Alexandra Point (Private Office category)
• Causeway Point (Retail Mall category)• Capri by Fraser, Changi
City, Singapore (Hotel category)
The first Green Star Performance portfolio in Australia
Launched Brickworks Living Building Challenge design competition in Australia to create the world’s most sustainable retail centre
Reduction of • 5% year-on-year in building energy intensity• 2% year-on-year in building water intensity
P E O P L E
Hospitality unit launched 'Just One' hotels programme with WWF-Earth Hour
Organised inaugural Frasers Health & Safety Month in August 2016
Zero workplace fatalities
Achieved training target of 40 hours per employee
400 days of community service volunteered by our staff
0%
AN
NU
AL
RE
PO
RT
20
16
77

ABOUT THIS REPORT [G4-17]
This sustainability report shares detailed information about our material issues, and our societal and environmental impacts from 1 October 2015 to 30 September 2016 (FY2015/16). It follows on from our first sustainability report, which covered the period from 1 October 2014 to 30 September 2015 (FY2014/15). This sustainability report, together with the rest of the Annual Report, will play an integral role in promoting communication and transparent reporting to our stakeholders.
In arriving at this report, we have included our key business divisions1 and our listed REITs, except Frasers Logistics & Industrial Trust (FLT), which was listed on the SGX-ST in June 2016. Our significant locations of operation, Singapore, Australia and China, are included in this report. For FY2016/17, in addition to the above, we shall expand the report scope to include FLT.
Data disclosed in this report relates to the above scope, unless otherwise stated, for assets that we own and/or manage, over which we have operational control. We have included health and safety data of our principal contractors' employees working at our Singapore development sites, as we see this as an area where we have significant influence. For data on our workforce, our report covers our global operations.
We continue to prepare this report with reference to the GRI (G4 Core) requirements and its Construction and Real Estate Sector supplements. We intend to seek external assurance on our sustainability report in the future.
GRI Principles How FCL demonstrates this
Stakeholder inclusiveness We engage and communicate with our stakeholders on an ongoing basis and use our interactions to share knowledge.
Sustainability context We consider the various sustainability issues in a local context, whilst maintaining a global perspective. We regularly refer to national and global agendas, such as the Sustainable Singapore Blueprint and the SDGs, to keep our sustainability activities relevant.
Materiality Please refer to our materiality process on page 79.
Completeness In setting the boundaries of our report, we endeavour to include all relevant factors, locations and operations where we have control and influence over the 10 identified material issues.
Balance We believe honesty and transparency generate trust and respect; we have report-ed on all relevant aspects of our performance and kept our report balanced.
Comparability We benchmark ourselves against our peers’ reports when considering what is material to us and when making our disclosures in order to stay in line with the rest of the industry.
Accuracy and reliability To ensure accuracy of data, we have a number of checks and controls in place. We verify hard data with various sources and benchmark this data against peers and/or external data of similar nature to ensure comparability.
Timeliness We report annually within four months of the end of our financial year and our data refers to the same time period as our Annual Report.
Clarity We aim to disclose clearly and have added notes, explanations and descriptions to our data in order to assist our readers to quickly understand the information they are reading.
1 Singapore, Frasers Hospitality, Frasers Property Australia, Frasers Property China, Frasers Centrepoint Asset Management Ltd, Frasers Centrepoint Asset Management (Commercial) Ltd, Frasers Hospitality Asset Management Pte. Ltd.
FR
AS
ER
S C
EN
TR
EP
OIN
T L
IMIT
ED
& S
UB
SID
IAR
IES
78

WHAT’S IMPORTANT TO US [G4-18, G4-19]
For purposes of reporting, we reviewed the materiality assessment to determine environmental, social and governance issues relevant to our business and our stakeholders. The assessment was based on the international standards for materiality, GRI and AA1000 principles, as well as the application of sector-specific guidance from the GRESB and the GRI G4 Construction & Real Estate Sector supplements. From the materiality assessment, we have identified our top 10 material issues in the following categories:
Economic and financial contribution to our business and our stakeholders (refer to Financial Highlights on page 11, Business Review on pages 30-67 and Financial Statements on pages 166-303)
Anti-corruption
Ethical marketing
Energy use/climate change
Environmental compliance
Water use/ conservation
Health and safety
Labour/management relations
Staff retention and development
Local communities
ECONOMIC PERFORMANCE
GOVERNANCE
ENVIRONMENT
PEOPLE
Bags of donated groceries were distributed to those in need during YewTee Point’s Care and Share Event
Workplace safety at construction site
1
2
3
4
5
6
7
8
9
10
79

WHAT THE SDGS MEAN TO US
As a signatory to the UNGC, we are supportive of the United Nations' adoption of the 2030 Agenda for Sustainable Development, along with the 17 SDGs. We have reviewed the SDGs against our material issues and business operations for relevance and alignment. Seven of these are goals we can contribute meaningfully to as an organisation.
SDGs Material issue How FCL addresses this goal
Goal 3:Good health and wellbeing
Ensure healthy lives and promote well-being for all at all ages.
Health & Safety We prioritise a healthy and safe work environment for staff across our value chain• Consideration of safety in all phases of our business
activities, from design to construction and operations• Implementation of sound workplace safety policy and
management system standards throughout our key operations
• Organisation of year-round wellness and health-related programmes for staff and provision of welfare schemes
• Implementation of the Building Occupants Survey System Australia for FPA’s corporate offices, undertaking Health & Wellbeing strategies in our communities and achieving National Australian Built Environment Rating System (NABERS) Indoor Environment ratings
Goal 7:Affordable and clean energy
Ensure access to affordable, reliable, sustainable and modern energy for all.
Energy use/ Climate change
We target to reduce energy intensity by 15% by FY2024/25 from baseline of FY2014/15• Monitoring of energy consumption (an indirect
greenhouse gas emission) of our business activities and introduction of measures to reduce our carbon footprint
• Constant upgrading of older equipment and carrying out asset enhancement initiatives (AEI) on our buildings to ensure that our facilities are energy efficient and sustainable
• Working to achieve green building status such as the BCA Green Mark award and Australia’s Green Star rating
• Installation of 1.58 MWh of solar photovoltaic cells across seven buildings in Australia
• Purchase of GreenPower, a scheme to displace electricity usage with certified renewable energy, for nine of our buildings in Australia
Goal 8:Decent work and economic growth
Promote sustained, inclusive and sustainable economic growth, full and productive employment and decent work for all.
• Economic & Financial contribution
• Labour/ Management relations
We are a signatory to the Tripartite Alliance for Fair and Progressive Employment Practices (TAFEP) in Singapore• Recruitment and selection of employees on the basis
of merit; rewards are given fairly based on their ability, performance, contribution and experience
• Provision of equal training and development opportunity for staff based on strengths and need
• Provision of student internships to nurture future talents for the industry
WHAT’S IMPORTANT TO US [G4-18, G4-19]
FR
AS
ER
S C
EN
TR
EP
OIN
T L
IMIT
ED
& S
UB
SID
IAR
IES
80

SDGs Material issue How FCL addresses this goal
Goal 9:Industry, Innovation and Infrastructure
Build resilient infrastructure, promote inclusive and sustainable industrialisation and foster innovation.
Economic & Financial contribution
We constantly strive to explore innovative ways to achieve greater efficiencies and enhance the experience of users• Piloting of BIM-VDC in the development of Northpoint
City, which is the first mixed-development in Singapore to use this method
• Launching of the Brickworks Living Building Challenge in Australia, a future-focused design competition to conceptualise a retail centre with rigorous green building performance standards
Goal 10:Reduced inequalities
Reduce inequality within and among countries.
Labour/ Management relations
We adhere to the TAFEP agreement in Singapore, which includes the pledge to reward employees fairly based on their ability, performance, contribution and experience• No discrimination based on age, race, gender• Achievement of an almost gender-balanced workforce
with a gender split of 53% male and 47% female this year
Goal 11:Sustainable cities and communities
Make cities and human settlements inclusive, safe, resilient and sustainable.
• Energy use/ Climate change
• Water use/ conservation
We adhere strictly to development plans in our countries of operation and support building sustainability initiatives, such as energy and water efficiency and waste management• Creation of liveable and vibrant spaces that are
integrated with nature and socially inclusive through Universal Design practices
Goal 17: Partnership for the goals
Strengthen the means of implementation and revitalise the global partnership for sustainable development.
• Economic & Financial contribution
• Local communities
We demonstrate our commitment to global environmental sustainability through partnerships and affiliations with international organisations and industry bodies• Signing on to the UNGC in February 2016• Launching of 'Just One' hotels programme with
WWF-Earth Hour by the Hospitality unit• Participation as a founding member of Better
Buildings Partnership in Australia, delivering a range of sustainability projects and demonstrating green leadership and sustainable innovation with leading commercial landlords in Sydney
AN
NU
AL
RE
PO
RT
20
16
81

SUSTAINABILITY ACROSS OUR REAL ESTATE VALUE CHAIN [G4-12]
As a full-fledged international real estate company, we recognise that we have a long value chain of real estate activities from development and investment, to operations and sales and transactions. We deal with suppliers, contractors, consultants, business partners and customers on a daily basis. We believe that we can influence our value chain on sustainability processes. We assess each step of the value chain and consider, where practical, any sustainability opportunities and risks that may arise.
OUR VALUE CHAIN DEVELOPMENT
• Land acquisition• Design & planning• Construction• Project management
INVESTMENT
• Property acquisition• Asset management
OPERATIONS
• Leasing• Property
management• Customer service
SALES & TRANSACTION
• Property sales (Residential)
• Divestment of non-core/mature assets
• Capital management
WHAT’S IMPORTANT TO US [G4-18, G4-19]
MAIN ACTIVITIES
KEY STAKEHOLDERS
KEY MATERIAL ISSUES
Economic & financial contribution
Anti-corruption
Ethical marketing
Energy use & climate change
Environmental compliance
Water use & conservation
Health & safety
Labour/management relations
Staff retention & development
Local communities
4
4
4
4
4
4
4
4
4
4
4
4
4
4
4
4
4
4
4
4
4
4
4
4
4
4
4
4
4
4
Contractors / Consultants / Suppliers
Customers
Employees
Regulators & Non-Governmental Organisations
Local Community
Investment Community
Joint Venture & Business Partners
$
$
Legend
FR
AS
ER
S C
EN
TR
EP
OIN
T L
IMIT
ED
& S
UB
SID
IAR
IES
82

At the early stage of designing a development, FCL as the owner and project manager, will work closely with the architect and engineers to consider environmental and safety features to be incorporated in the development. We adopt the Design for Safety procedure to address the issues at source, and decide on the green design and technology to be adopted. When it comes to selecting the main building contractor for the construction, we impose stringent criteria, appointing only those who are certified with quality, environment and safety management systems, such as ISO 9001, ISO 14001 and OHSAS 18001.
For residential developments, we always ensure that our sales and marketing communications with homebuyers are accurate and ethical. After the homes are delivered to the buyers, we engage them through surveys to gauge their level of satisfaction. For completed properties that we manage, whether they are commercial, hospitality or industrial, we involve our staff, suppliers, tenants, guests and the community in various aspects of sustainability.
STAKEHOLDER ENGAGEMENT
We hold regular dialogue with our various stakeholders on a number of fronts, including sustainability-related topics. We are mindful that stakeholder engagement is key to a successful sustainability journey, and will share with them our goals and vision to create a more sustainable community.
Contractors / Consultants /Suppliers
Customers
Employees
Investment Community
• Bilateral communication with sales agents, landscaping contractors and cleaning contractors
• Safety briefings, site visits, safety declarations (construction contractors)
• Bilateral communication• Customer service counters and centre management
offices• Events• Surveys and feedback forms
• Performance appraisals on annual basis• Training, including orientation programme for
new staff• Team building activities• Intranet (in Australia and Singapore)• Annual Dinner & Dance• Family Day
• Half-year and full-year results briefings and earnings calls on quarterly basis
• Annual General Meeting, Extraordinary General Meeting
• Local and overseas investor conferences and road shows• Bilateral communication, one-on-one meetings and
site visits
• Quality of services and products
• Performance• Safety
• Quality of services and facilities
• Customer satisfaction• Staff performance
• Performance and skills• Corporate policies• Occupational health
and safety• Staff bonding
• Financial results• Business operations
and performance• Business strategy and
outlook
$
Key stakeholders Form of engagement Key topics
$
AN
NU
AL
RE
PO
RT
20
16
83

Regulators / Non-Governmental Organisations
Joint Venture & Other Business Partners
• Briefings and consultations• Participation in non-governmental organisations
(e.g. Real Estate Developers' Association of Singapore (REDAS), REIT Association of Singapore (REITAS))
• Participation in surveys and focus groups
• Bilateral communication, regular project meetings and site visits
• Regulatory and industry trends
• Project planning and progress update
• Marketing and sales strategy
WHAT’S IMPORTANT TO US [G4-18, G4-19]
Local Community
• Provide feedback channels for the community around our properties
• Consultations (where necessary)• Provide cash and venue sponsorship at our
properties• Staff involvement in the local community and
organisations through volunteerism
• Environmental sustainability awareness
• Corporate social responsibility
Key stakeholders Form of engagement Key topics
FCL's former Group Chief Executive Officer Mr Lim Ee Seng, presented donation cheques totalling $60,000 to representatives from Punggol Group Representation Constituency
FR
AS
ER
S C
EN
TR
EP
OIN
T L
IMIT
ED
& S
UB
SID
IAR
IES
84

PARTNERSHIPS AND AFFILIATIONS
As a major stakeholder in the real estate market, FCL has been actively engaging with various industry bodies, such as the REDAS, REITAS, Workplace Safety and Health Council (WSHC), Singapore Green Building Council (SGBC) and the Green Building Council of Australia (GBCA). This year,
FCL is affiliated with the following industry bodies:
we became a signatory to UNGC and joined the Global Compact Network of Singapore as a Gold Member. In Australia, Mr Rod Fehring, the CEO of FPA was appointed to the board of the GBCA. With our representation in partnerships and affiliations with industry bodies, we believe we can continue to influence and play a role in encouraging the real estate sector’s sustainability initiatives.
Green Building Council of Australia
International Council of Shopping Centers
Real Estate Developers' Association of Singapore
Australia Australia
Real Estate Investment Trust Association of
Singapore
Workplace Safety and Health Council
(Singapore)
AN
NU
AL
RE
PO
RT
20
16
85

FY13/14 FY14/15 FY15/16
CUSTOMERS SATISFACTION
We build a life-long relationship with our customers. We want each customer to enjoy their experience in the homes that we build. We take care and effort to ensure that we create homes of the future which are aesthetically pleasing, of superb quality and surpassing comfort.
In Singapore, to continually engage our customers and keep in touch with their needs and preferences, we conduct two surveys with our homeowners. The first survey – “How was your home collection experience?” – is conducted annually with the objective of measuring our customers’ overall first impression of Frasers Centrepoint's homes, including aspects such as staff service levels, quality of homes and common facilities.
Overall satisfaction levels increased in FY2015/16, with homeowners indicating a higher satisfaction score both in their overall home collection experience and in each individual category. This was only made possible with our staff’s commitment to improvement and attention to detail.
The second survey – “How is everything?” – is conducted on a quarterly basis with homeowners to obtain homeowners’ overall impression of their home, both on a macro level, and through individual
categories – quality of workmanship and customer service recovery services carried out by our contractor.
This year, we again received favourable ratings from our customers, with homeowners indicating a higher level of satisfaction in almost all categories compared to FY2014/15. More homeowners also said they would recommend Frasers Centrepoint's homes to their friends and relatives as indicated by an increase in ratings from 8.9 in FY2014/15 to 9.3 in FY2015/16. We are pleased that these ratings reinforce the strength of our brand and our commitment to excellence.
The Head of Development & Projects, Singapore conducts CARE service standards and service recovery training for the team including the main contractor, site supervisors, projects and managing agent. The objective is to emphasise the importance of delivering a consistently high standard of service to our homeowners. Staff training is also conducted regularly to share on the important lessons learnt for all projects.
All feedback received is discussed during weekly meetings with the Project Team, Main Contractors, Architect and the Managing Agent. The CARE team then follows up with the homeowners and ensures immediate service recovery.
78.0 78.082.0
77.3 76.0 77.8
How was your home collection experience?
How is everything survey?
HOMEBUYERS’ SATISFACTION LEVEL (%)
OFFICE BUILDING TENANTS’ SATISFACTION LEVEL (%)
Satisfied to very satisfied Neutral to satisfied
FY13/14 FY14/15 FY15/16
64
29
70
24
70
24
WHAT’S IMPORTANT TO US [G4-18, G4-19]
FR
AS
ER
S C
EN
TR
EP
OIN
T L
IMIT
ED
& S
UB
SID
IAR
IES
86

TENANTS SATISFACTION
In Singapore, satisfaction surveys are conducted annually with tenants of FCL’s office and business space properties. The survey findings are important to us as we strive to continuously monitor and improve the customer experience for our tenants. For example, in response to tenants’ requests for local, affordable cuisine in Valley Point Office Tower, we brought in a new retail tenant, 85 Redhill, a local ‘multiple offerings under one roof’ concept by Fei Siong, much to the delight of all in the vicinity.
Improvement works in the pipeline include China Square Central, 51 Cuppage Road and Robertson Walk. These works are geared towards bringing a
better customer experience for our tenants, their staff and our shoppers. Such upgrading initiatives also serve to enhance the value and appeal of our properties.
It is also heartening to note that the efforts and hard work of our security team and operations colleagues have been recognised by our tenants through compliments and commendations. The tenants’ satisfaction level has remained a commendable 94% in FY2015/16, with 70% indicating satisfaction levels of “satisfied to very satisfied”.
Improvement works in the pipeline include Robertson Walk (left) and China Square Central (right). Tenants, their staff and shoppers can look forward to a better customer experience when works are completed
AN
NU
AL
RE
PO
RT
20
16
87

MANAGING SUSTAINABILITY [G4-34]
At FCL, the corporate sustainability agenda is driven by our Sustainability Steering Committee (SSC), which is chaired by our Group CEO, Mr Panote Sirivadhanabhakdi. The committee comprises members from top management – the CEOs of all our business units, the Chief Corporate Officer and Chief Financial Officer, as well as the Chief Human Resources (HR) Officer. The SSC spearheads the strategy and initiatives to drive sustainability in the business operations. The SSC meets quarterly to review performance against each of our key material issues. The SSC is supported by a Sustainability Working Committee (SWC), which consists of members from the middle and senior management
of various business units and departments such as Finance, Risk, HR and Communications. The SWC’s main task is to monitor our sustainability performance against our key performance indicators (KPIs), implement action plan, and communicate and report to our stakeholders.
During the year, we also set up new sustainability sub-committees for Environment, Health & Safety and Innovation to drive the respective aspects of sustainability agendas that are of significance to us. We believe this will enable more comprehensive and effective implementation of sustainability initiatives on a group-wide basis.
FCL CorporateSustainability
Sustainability Steering Committee
Sustainability Working Committee
Health & SafetyEnvironment Innovation
Chaired by the Group CEO; with members from the top management• Drive sustainability strategy• Review sustainability
performance against our key material issues
• Approve action plans to improve sustainability practices
• Drive environment outreach and awareness programmes
• Monitor environmental performance against targets and benchmarks
• Facilitate the implementation of ISO 14001 Environment Management System
• Drive health & safety outreach and awareness programmes
• Monitor safety performance against targets and benchmarks
• Facilitate the implementation of OHSAS 18001 Occupational Health & Safety Management System
• Nurture and drive the innovation culture within the Group
• Establish the infrastructure that make idea contribution effective
• Drive innovation-related learning and development activities
Chaired by the Assistant GM (Corporate Planning); with members from the senior and middle management in various business units and departments such as Finance, Risk, HR, Communications• Monitor sustainability
performance against our KPIs• Implement action plans as
approved by the SSC• Sustainability communication
and reporting
FR
AS
ER
S C
EN
TR
EP
OIN
T L
IMIT
ED
& S
UB
SID
IAR
IES
88

In addition, some of our SBUs have also established their own sustainability governance committees to drive sustainability aspects which are of more relevance to their operations. For example, our Hospitality SBU has an environment committee at every property, while FPA has just developed a comprehensive sustainability strategy, A Different Way. It represents our real commitment to creating places where resources are reused, recycled and restored, and new ideas are fostered for everyone’s benefit to lead better and healthier lives.
“One key milestone for FCL over the last two years is the establishment of our Sustainability Committee at both steering and working levels. This has allowed a more coordinated approach to driving sustainable initiatives from the Group's perspective and facilitating effective communication to various stakeholders.”
Dr Pang Chin HongAssistant General Manager, Corporate Planning & Chairman of FCL Sustainability Working Committee
FPA's office in Perth, Australia
AN
NU
AL
RE
PO
RT
20
16
89

GOVERNANCE
Good corporate governance drives good business and sets the tone from the top for good sustainability practices throughout FCL. As a signatory to the 2015 Corporate Governance Statement of Support, FCL has pledged our commitment to uphold high standards in corporate governance. We believe strongly that sustainability responsibilities should be integrated into the corporate governance structure of our business and strive to maintain high standards of integrity, accountability and responsible governance. To this end, we have put in place various corporate policies, programmes and standard operating procedures to guide the management and employees in corporate governance. We have implemented ISO14001 (Environment) and OHSAS 18001 (Health & Safety) Management Systems in our various key business operations and are expanding the coverage of the management systems to a wider scope of operations.
In addition, we became a signatory to the UNGC, the world’s largest corporate sustainability initiative, in early 2016. Together with more than 9,000 companies and 3,000 non-business organisations worldwide, FCL volunteered to pledge to adhere to the ten principles within four broad areas – Human Rights, Labour, Environment and Anti-corruption:
H U M A N R I G H T S
Principle 1Businesses should support and respect the protection of internationally proclaimed human rights; and
Principle 2Make sure that they are not complicit in human rights abuses
L A B O U R
Principle 3Businesses should uphold the freedom of association and the effective recognition of the right of collective bargaining;
Principle 4The elimination of all forms of forced and compulsory labour;
Principle 5The effective abolition of child labour; and
Principle 6The elimination of discrimination in respect of employment and occupation
FR
AS
ER
S C
EN
TR
EP
OIN
T L
IMIT
ED
& S
UB
SID
IAR
IES
90
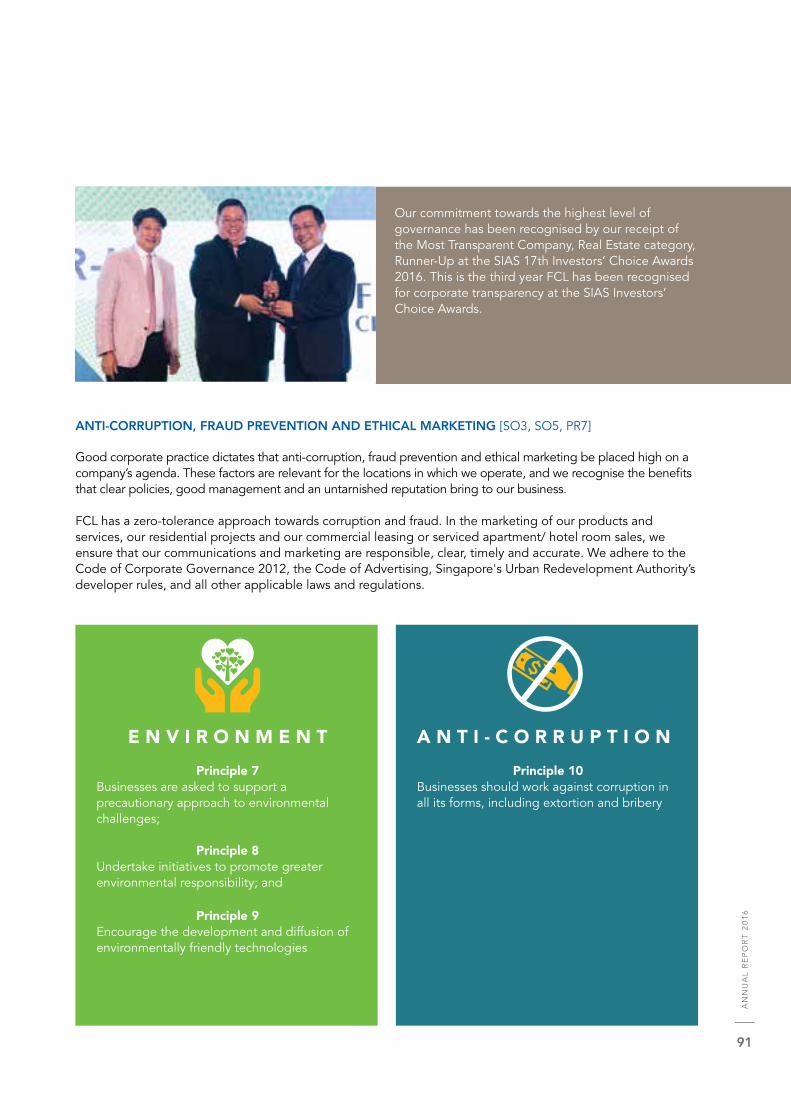
Our commitment towards the highest level of governance has been recognised by our receipt of the Most Transparent Company, Real Estate category, Runner-Up at the SIAS 17th Investors’ Choice Awards 2016. This is the third year FCL has been recognised for corporate transparency at the SIAS Investors’ Choice Awards.
ANTI-CORRUPTION, FRAUD PREVENTION AND ETHICAL MARKETING [SO3, SO5, PR7]
Good corporate practice dictates that anti-corruption, fraud prevention and ethical marketing be placed high on a company’s agenda. These factors are relevant for the locations in which we operate, and we recognise the benefits that clear policies, good management and an untarnished reputation bring to our business.
FCL has a zero-tolerance approach towards corruption and fraud. In the marketing of our products and services, our residential projects and our commercial leasing or serviced apartment/ hotel room sales, we ensure that our communications and marketing are responsible, clear, timely and accurate. We adhere to the Code of Corporate Governance 2012, the Code of Advertising, Singapore's Urban Redevelopment Authority’s developer rules, and all other applicable laws and regulations.
E N V I R O N M E N T
Principle 7Businesses are asked to support a precautionary approach to environmental challenges;
Principle 8Undertake initiatives to promote greater environmental responsibility; and
Principle 9Encourage the development and diffusion of environmentally friendly technologies
A N T I - C O R R U P T I O N
Principle 10Businesses should work against corruption in all its forms, including extortion and bribery
AN
NU
AL
RE
PO
RT
20
16
91

GOVERNANCE
In safeguarding the company’s independence in audit results, our Internal Audit Department reports directly to the Chairman of the Audit Committee. These independent internal audits are designed to improve the effectiveness of risk management, control and governance processes. For further details on our internal audit approach, please refer to pages 137-165 on Corporate Governance.
In FY2015/16, no confirmed cases with regards to bribery and corruption were reported.
Based on investigations conducted in FY2015/16 with regards to complaints received through whistleblower channels, one case was substantiated and appropriate actions were taken.
There were no incidents of non-compliance with regulations and industry codes concerning marketing communications for which fines were issued to the Company.
Corporate Policies Guidance on: External access
Code of Business Conduct
Company values, ethics and conduct in relation to:• Compliance monitoring• Record keeping• Information confidentiality • Conflicts of interest• Insider trading• Relations with key stakeholder
NA
Whistle-Blowing Policy
Provision of a channel for stakeholders and other persons to report any concerns, including: • Improprieties in financial reporting• Professional misconduct• Irregularities or non-compliance with laws and regulations
Available at:www.fraserscentrepoint.com/html/protection.php
Anti-Bribery Policy Prevention and management of bribery and corruption
NA
Policy for Disclosure and Approval of Purchase of Property Projects
Declaration and approval requirements for any interested persons, directors and employees of FCL, when purchasing property developed by FCL
NA
Competition Act Compliance Manual
Compliance with the Competition Act to protect and promote healthy competitive markets in Singapore
NA
Personal Data Protection Act Policy
Compliance with the Personal Data Protection Act 2012 relating to the handling and processing personal data, complaint handling procedures, and avenues for employees, customers, suppliers or other contact persons of FCL to report any concern that the policy may have been breached
Available at:www.fraserscentrepoint.com/html/protection.php
Environment, Health & Safety Policy
Safeguarding the health and safety of all relevant stakeholders and interested parties within its premises and providing an environmental friendly and safe place for them to work in or to conduct their business
NA
FR
AS
ER
S C
EN
TR
EP
OIN
T L
IMIT
ED
& S
UB
SID
IAR
IES
92

COP 21 – SINGAPORE’S PLEDGE
Reduce its emission intensity by 36% from 2005 levels by 2030
Reduce its emissions by 16% below business-as-usual levels by 2020
Stabilise emissions with the aim of peaking around 2030
We are also aligning our practices to support BCA’s second Green Building Master Plan which aims for at least 80% of the buildings in Singapore to achieve the BCA Green Mark Certified rating by 2030. We incorporate energy efficiency measures into the building design and carrying out energy audits every three years. Our efforts not only helped us to maintain our Green Mark awards, but also provided us with the opportunity to review and improve our energy efficiency practices throughout the life of our buildings.
GREENING OUR BUILDINGS
To date, FCL has received a total of 24 BCA Green Mark Awards in Singapore, out of which two were Platinum, 4 GoldPLUS, 15 Gold, and 3 Certified. All of our Singapore office and business space properties have achieved BCA Green Mark Gold or higher, and about half of our Singapore retail properties are BCA Green Mark Gold or above. Furthermore, all our office and business space properties in Singapore have been certified with Eco-Office labels by the Singapore Environment Council.
ENVIRONMENT
At FCL, we are always conscious of the environmental impacts arising from our business activities. We firmly believe that the impact can be managed responsibly in a commercially viable manner, and have therefore been unreserved in our support of the Sustainable Singapore Blueprint 2015 and more recently, Singapore’s Intended Nationally Determined Contributions submitted during the Conference of Parties 21 (COP 21).
24BCA Green
Mark Awards in Singapore
FCL’s efforts to ensure our buildings’ energy performance remains sustainable have been recognised on a national level by BCA. Alexandra Point, Causeway Point and Capri by Fraser, Changi City, Singapore were ranked in the top 10 in the BCA Building Energy Benchmarking Report in their respective Private Office Buildings, Retail Buildings and Hotels categories for the consecutive years. Alexandra Point and Causeway Point achieved Green Mark Platinum, while Capri by Fraser, Changi City, Singapore was awarded Green Mark GoldPLUS. For more information, please refer to BCA Building Energy Benchmarking Report 2016.
Approximately 80% of our investment properties in Australia are Green Star Performance-certified and 20% are NABERS-certified. We have set the requirement for all of our new office, retail and industrial developments in Australia to achieve a minimum 5 Star Green Star Design & As Built rating, representing excellence in sustainable design. This is evident from the latest GRESB results, where our commercial and industrial properties in Australia were ranked first globally for diversified office/industrial/non-listed funds, and second globally for all diversified office/industrial funds (listed and non-listed). Our exemplar performance is evident from the GRESB results with year-on-year improvement.
AN
NU
AL
RE
PO
RT
20
16
93

CREATING ENVIRONMENTAL AWARENESS
We continue our annual participation in Earth Hour organised by the WWF. On 19 March 2016, over a hundred of our global properties across all asset classes switched off non-essential lights in common areas for an hour. As a large commercial landlord and owner-operator of hospitality assets, we have taken the extra step to encourage our stakeholders, tenants, shoppers, guests and patrons of our properties to do their part. In conjunction with Earth Hour, FH has continued to designate March as Frasers Environment Month for the third year running, during which a series of initiatives and campaigns were organised to promote environmental responsibility.
Employees are also engaged through a variety of fun and exciting initiatives that promote sustainability awareness, such as the Soap Box Derby Challenge by the FH team in Singapore. The challenge required employees to form their own teams to build human-sized cars using recyclable materials to participate in a race. Other events were also organised including the Beach Clean Up Challenge at Changi Beach and a visit to Semakau Landfill.
In Australia, the team carries out two major environmental volunteering events every year – Clean Up Australia Day and Schools Tree Day. Some 90 staff volunteered in the former event nationally in March, collecting about 100 bags of rubbish. In conjunction
with city-specific competitions, our Brisbane team was runner-up for the Cleaner Communities Brisbane award for their efforts. Our Australian team participated for the eighth time in the Schools Tree Day this year. 106 staff, with another 53 volunteers planted some 1,505 trees and rejuvenated some outdoor facilities across four schools.
In addition, our Australian team hosted numerous staff engagement activities, including initiating EnviroWeek, during which lunchtime talks on sustainability topics were organised. In conjunction with the World Green Building Week in September, we ran a sustainable design competition for children.
In Singapore, we hosted our Australian sustainability team and Ms Romilly Madew, the CEO of Green Building Council Australia, and her team, during the Singapore Green Building Week in September. We shared our sustainability practices and hosted site visits to our two BCA Green Mark Platinum buildings – Alexandra Point and Causeway Point, which are ranked among the Top 10 Most Efficient Private Office and Retail Buildings in Singapore, respectively. We also extended the same hospitality to a group of Executive Master of Business Administration (EMBA) students and their professor from Boston University in March when they visited us as part of their EMBA field trip to understand the risks and opportunities within the environmental space in Asia.
ENVIRONMENT
FPA staff planted trees and rejuvenated outdoor facilities at four schools on Schools Tree Day
FR
AS
ER
S C
EN
TR
EP
OIN
T L
IMIT
ED
& S
UB
SID
IAR
IES
94

SINGAPORE’S BUILDING ENERGY BENCHMARKING 2016This is an annual publication under the BCA Singapore’s 3rd Green Building Masterplan. Energy consumption data and building-related information are submitted to the BCA on an annual basis for analysis and benchmarking. The report’s objective is to inform owners and their operation teams on how well they have performed and to spur them to initiate and implement progress to improve energy efficiency and reduce energy consumption. The report ranks the Top 10 energy efficient buildings in five categories – government office buildings, private office buildings, hotels, retail buildings and mixed developments.
PRIVATE OFFICE BUILDING CATEGORY – ALEXANDRA POINT Alexandra Point is one of the Top 10 performing private office buildings in Singapore’s BCA Energy Benchmarking for two consecutive years. Although it is not a new building, it managed to clinch the BCA Green Mark Platinum award, with a 33% reduction in energy use (from 2013 to 2014) through the upgrading of the chilled water system (chillers, condenser pumps, chilled water pumps, cooling towers) and air handling units.
RETAIL BUILDING CATEGORY – CAUSEWAY POINTThe BCA awarded Causeway Point the highest Green Mark Platinum Award in 2011, after AEI works on the building significantly improved its environmental features. This is further affirmed by the BCA ranking Causeway Point as among the Top 10 most energy efficient retail malls in 2015 and 2016.
HOTEL CATEGORY – CAPRI BY FRASER, CHANGI CITY, SINGAPORE Capri by Fraser, Changi City, Singapore is part of the mixed office-retail mall-hotel development located at Changi Business Park in Singapore. Awarded Green Mark GoldPLUS since 2011, Capri by Fraser, Changi City, Singapore has also won the Singapore Green Hotel Award in 2013 and 2015. In both 2015 and 2016, BCA ranked Capri by Fraser, Changi City, Singapore as among the Top 10 energy efficient hotels, which further affirmed our environmental sustainability practice.
AN
NU
AL
RE
PO
RT
20
16
95
TOP 10 ENERGY EFFICIENT BUILDINGS IN SINGAPORE 2016

Driving continual improvements in sustainable performance across all operations, the progress of FPA in sustainability is demonstrated by its exemplary performance in the 2016 GRESB rankings.
FPA’s commercial and industrial portfolio is ranked first globally for diversified office/industrial non-listed funds, and second globally for all diversified office/industrial funds (listed and non-listed). This is a great milestone for us since we first participated in the GRESB assessment in 2012. In terms of scoring from seven different aspects, FPA scored 75 overall in the 2016 assessment, achieving a 4 Star score from GRESB.
GRESB Aspects Score (out of 100)
Management 100
Policy & Disclosure 79
Risks & Opportunities 85
Monitoring & EMS 90
Performance Indicators 64
Building Certifications 77
Stakeholder Engagement 66
The results represent a fourth consecutive year of improvement in GRESB scores for FPA, and are also testament to the strong collaboration between FPA’s sustainability and building operation teams.
FPA achieved the first Green Star Performance portfolio certification in Australia, with 69 Green Star-rated building projects. We have also launched several 6 Star Green Star industrial facilities this year. While FPA has been making substantial progress in generating sustainable outcomes for its commercial and industrial assets, we constantly strive to remain a market leader in sustainability in the real estate sector.
FRASERS PROPERTY AUSTRALIA: TOP IN GRESB'S GLOBAL ASSESSMENT FOR DIVERSIFIED OFFICE/INDUSTRIAL/NON-LISTED FUNDS
GRESB is an industry-driven organisation committed to assessing the environmental, social and corporate governance performance
of real estate portfolios. It is widely known as a global standard for assessing sustainability in real estate.
By participating in GRESB, a company’s sustainability performance is assessed based on the following seven aspects:1. Management2. Policy & disclosure3. Risks & opportunities4. Monitoring & Environmental Management System (EMS)5. Performance indicators6. Building certifications7. Stakeholder engagement
In 2016, a record 759 real estate companies and funds participated in GRESB.
Asia-Pacific/Diversified –
Office/Industrial
Global/Diversified – Office/IndustrialGRESB Health &
Well-being
Diversified – Office/Industrial/ Non-listed/Global
Diversified – Office/Industrial
1stOUT OF 3
1stOUT OF 4
1stOUT OF 13
2ndOUT OF 18
FR
AS
ER
S C
EN
TR
EP
OIN
T L
IMIT
ED
& S
UB
SID
IAR
IES
96

ENVIRONMENT
“FPA is driving continual improvements in environmental performance across all our operating sectors and this year’s GRESB result validates our efforts”
Paolo BevilacquaGeneral Manager Sustainability,FPA
ENERGY USE AND GHG EMISSIONS[EN3, EN5, EN6, CRE1, EN16, EN18, EN19, CRE3]
We continue to work towards achieving a property portfolio that is energy efficient. Overall, our building energy consumption and energy intensity have reduced by 8% year-on-year and 5% year-on-year respectively in FY2015/16. We saw a reduction in energy intensity from the Singapore retail and office portfolio to our Australian office assets and global hospitality assets under management. Our carbon footprint (greenhouse gas (GHG) emissions) decreased in tandem from 136,100 to 123,500 tonnes of CO2 equivalent.
In driving improvement, we focused on effective communication with our facilities management team about the Group’s sustainability goals. To demonstrate our commitment to reducing energy use, we have set a 10-year target with a 15% reduction from the baseline of FY2014/15.
Singapore retail – Changi City Point
Fraser Suites Glasgow, Scotland, UK
8%Building Energy
Consumption
5%Building Energy Intensity
97

Hospitality Singapore Office
Australia Office Singapore Retail
Hospitality Singapore Office
Australia Office Singapore Retail
Group Intensity
BUILDING GHG EMISSIONS ('000 tonnes) BUILDING GHG INTENSITY (kg/m2)
FY13/14 FY14/15 FY15/16
135 136
124
70.264.5
100
80
60
40
20
0
ENVIRONMENT
69.1
Notes:• Energy consumption is reported for landlord area for commercial properties and total area for serviced residences and hotels• Energy and GHG data currently covers more than 70% of completed buildings that we own and/or manage with operational control,
except MHDV portfolio and those that we acquired and/or managed less than one year ago• Grid GHG emission factors are from Singapore Energy Statistics 2016, Australia National Greenhouse Gas accounts, China Climate
Change Info-Net, Reliable Disclosure Systems for Europe, German Association of Energy and Water Industries, India's Central Electricity Authority, and the United Kingdom's Department for Environment, Food and Rural Affairs (DEFRA) for Singapore, Australia, China, France, Germany, India and the UK respectively. For all other countries, emission factors are determined from trend analysis based on DEFRA results for previous two years
Hospitality Singapore Office
Australia Office Singapore Retail
Hospitality Singapore Office
Australia Office Singapore Retail
Group Intensity
BUILDING ENERGY CONSUMPTION (GWh) BUILDING ENERGY INTENSITY (kWh/m2)
FY13/14 FY14/15 FY15/16 FY13/14 FY14/15 FY15/16
FY13/14 FY14/15 FY15/16
231 234216
120119 113
250
200
150
100
50
0
FR
AS
ER
S C
EN
TR
EP
OIN
T L
IMIT
ED
& S
UB
SID
IAR
IES
98

Hospitality Singapore Office
Australia Office Singapore Retail
Hospitality Singapore Office
Australia Office Singapore Retail
Group Intensity
BUILDING WATER CONSUMPTION (mil m3) BUILDING WATER INTENSITY (m3/m2)
FY13/14 FY14/15 FY15/16
2.52 2.562.46
1.33 1.27
3.0
2.5
2.0
1.5
1.0
0.5
0.0
1.30
Notes:• Water consumption is reported for landlord area for commercial properties and total area for serviced residences and hotels• The water data covers more than 70% of completed buildings that we own and/or manage with operational control, except MHDV
portfolio and those that we acquired and/or managed less than one year ago
WATER USE AND CONSERVATION [EN8, CRE2]
Our business operations provide us with many opportunities to play a part in conserving water use. Our buildings are fitted with water-saving technologies such as tap flow restrictors/regulators, dual-flush water systems, waterless urinal systems and the Public Utilities Board's (PUB) Water Efficiency Labelling Scheme approved fittings, and recycled water sources such as NEWater and air handling unit (AHU) condensate. In Singapore, we work extensively with the wider community, including public utility providers, to play our part in achieving greater water-efficiency. This year, Causeway Point, East Point Mall, Northpoint, and the Centrepoint attained PUB's Water Efficient Building (Basic) certification, joining Bedok Point, Anchorpoint and YewTee Point, which were previously certified. In Australia, rainwater is collected at most development projects and connected to irrigation and toilet flushing systems for reuse.
Nearly 100% of our water comes from public utilities. We have been increasing our use of recycled water for non-potable applications, such as irrigation, washing, water features and cooling towers. We collect condensate from our AHU for reuse and also
use the PUB’s NEWater, which is recycled water. In our cooling towers, we use water treatment systems that can achieve at least seven cycles of concentration.
Overall, we have achieved a reduction in both water consumption and intensity across our asset portfolio under management. Our total water consumption and water intensity have reduced by 4% year-on-year and 2% year-on-year respectively in FY2015/16. The reduction was mainly attributed to the Singapore retail and Australia office portfolios. To demonstrate our commitment to reducing water use, we have set a 10-year target to reduce our water intensity by 15% on the FY2014/15 baseline by FY2024/25.
FY13/14 FY14/15 FY15/16
4%Building Water
Consumption
2%Building Water Intensity
AN
NU
AL
RE
PO
RT
20
16
99

ENVIRONMENT
WASTE MANAGEMENT [EN23]
Waste minimisation and recycling at commercial buildingsIn land-scarce Singapore, waste generation and disposal remain one of the top environmental issues in the country. As a major property owner and manager, FCL recognises that our commercial buildings produce a significant amount of waste and we are committed to doing our part in waste management.
FCL tracks waste disposal and recycling at our commercial buildings, and implements initiatives to reduce waste generation. We constantly look for ways to spread the awareness of the 3Rs – Reduce, Reuse and Recycle – in our operations.
In FY2015/16, 13,000 tonnes of waste were generated from 14 commercial properties1 in Singapore. The waste intensity has decreased to 25.5 kg/m2 in FY2015/16 from 28.7 kg/m2 a year ago. We will seek to improve the waste intensity in the coming years.
Recycling bins have been made available at our commercial properties to make it convenient for shoppers and tenants to recycle waste. Retail tenants have also been encouraged to segregate their waste before disposal, to improve their recycling efforts. In FY2015/16, 508 tonnes of waste from 14 commercial properties were sent for recycling, with the bulk of it being paper. This is an encouraging increase from the 467 tonnes reported in the previous year.
We have also invited National Environment Agency (NEA) to deliver lunchtime talks to staff and tenants on waste minimisation to further encourage 3R practices in our operations. We constantly monitor our recycling rates and are working on improving recycling efforts at our commercial properties, which include ramping up recycling of other materials such as plastics and metals.
Food waste managementF&B outlets in our shopping malls generate a significant amount of food waste. Consequently, FCL has been looking at adopting initiatives to promote the reduction and recycling in this area. At Valley Point, we are piloting the use of a food waste digester with the possibility of adopting on-site food waste recycling at our other malls. We are also partnering with NEA in its Food Waste Reduction Outreach to reduce food waste at our malls.
Paper recycling and conservation at corporate officePaper comprises the bulk of waste at FCL's corporate office. We emphasise the management of paper use in printing and photocopying, and have been educating staff on the need to move towards going paperless. We use paper which has the Forest Stewardship Council (FSC) or the Programme for the Endorsement of Forest Certification (PEFC) labels, or products under the Singapore Green Label Scheme (SGLS). These products are produced based on sustainably managed forests and controlled sources.
To help monitoring, we track paper usage by employees at our corporate offices. In FY2015/16, 4,591 reams of A4 paper and equivalent were used and we have put in place measures to reduce paper usage. Through setting default double-sided printing, discouraging the printing of materials, and shifting information online, we are progressing towards a paperless environment.
COMPLIANCE WITH REGULATIONS [EN29]
Environmental and safety compliance is a key priority in our business processes, and we make every effort to ensure that we comply with all rules and regulations. Despite these efforts, five of our development projects in Singapore have been fined a total of approximately $70,000 with a total of 15 days of stop-work orders in FY2015/16, while in Australia, the fines amounted to A$8,000. In Singapore, the fines were imposed on our main contractors due to incidents such as excessive noise levels, mosquito breeding and safety breaches. Together with our contractors, we have since taken extra measures to minimise further incidents. We will strive to improve our compliance and aim for zero incidents of non-compliance with environmental laws and regulations in the future.
1 The 14 commercial buildings comprise five office buildings (Valley Point, Alexandra Point, 51 Cuppage Road, China Square Central and Alexandra Technopark) and nine retail malls (East Point Mall, The Centrepoint, Anchorpoint, Bedok Point, Changi City Point, Causeway Point, Northpoint, YewTee Point and Robertson Walk)
REDUCE REUSE RECYCLE
FR
AS
ER
S C
EN
TR
EP
OIN
T L
IMIT
ED
& S
UB
SID
IAR
IES
100

PEOPLE
an increasingly challenging environment. Strong labour and management relations help us remain nimble, and place us in a good position to tap into a wealth of experience brought about by diversity and retained talent. Our fundamental focus is to ensure that each employee remains healthy and has a safe work environment.
SAFETY FIRST [LA5, LA6]
At FCL, safety is a key priority. It is the foundation upon which our project development and building management processes are built.
We are mindful of the vulnerability of our business operations to safety incidents right from the onset of the development cycle. This is due to the nature of the work which involves heavy manpower, the handling of dangerous equipment, and commitments to meeting deadlines.
Our safety criteria apply at various stages of the life-cycle of our buildings.
Stage Safety criteria applied
Design Carry out risk assessment using a Design for Safety procedure. The risk assessment covers design, structure, mechanical and electrical (M&E) function and landscape.
Tender Require building contractors tendering for jobs to have safety standards certification (i.e. OHSAS 18001 standard or its equivalent) in order to qualify for consideration.
Construction Conduct a joint monthly safety committee meeting with our main building contractors, where health and safety issues are discussed. On a quarterly basis, our management carries out safety inspection tours at all our development sites.
Pre-operation (For properties under management)
Carry out risk assessment for daily facilities management activities. Prior to attaining the Temporary Occupation Permit, the main contractor and specialised contractors (e.g. M&E) jointly inspect and train the Facilities Manager (FM) in operations and maintenance procedure.
Operation (For properties under management)
Conduct risk assessment and review risk areas annually. Appointed term contractors are required to submit risk assessment prior to commencing work. Main building contractors who are responsible during the defect liability period have to submit a revised risk assessment for facilities management. As part of day-to-day operations, the FM will carry out checks on lighting, toilets, M&E services and water/electrical meter reading for anomalies. On a monthly basis, our service providers will carry out inspections and maintenance works on air-conditioning and mechanical ventilation system, electrical system/switch board, lift, escalator, fire protection system, sanitary and plumbing system, and landscaping.
OHSAS
Our people are critical for the sustainability of the Group. With the rapidly changing landscape and stakeholder expectations, FCL can only remain relevant and sustainable through the concerted efforts and talents of a skilled and adaptable workforce. Staff training and development remain key priorities, as we ready ourselves to navigate
AN
NU
AL
RE
PO
RT
20
16
101

PEOPLE
Over the years, FCL has established a healthy workplace safety culture that has garnered strong support from the senior management. In strengthening our practices, FCL has implemented workplace safety management systems standards across various key business operations to identify and control hazards, and constantly monitor the performance and areas for improvement. For example, occupational health and safety management systems aligned to OHSAS 18001 and its equivalent have been implemented in our Singapore office and retail malls operation, construction and project development in Australia and corporate offices. Some of our facilities management have also been awarded BizSafe certification by the WSHC and the Ministry of Manpower. In the near future, we have plans to expand our management systems to cover a wider scope of our operations.
Our senior management has been a leading advocate in the real estate industry when it comes to safety. Our Head of Development & Projects, Singapore, Mr Cheang Kok Kheong, is currently the Deputy Chairman of the Industry Committee (Construction & Landscape) in the WSHC. In addition, Mr Cheang frequently shares his experience with industry stakeholders on Design for Safety (DFS) at workshops organised by REDAS, Institute of Engineers Singapore and BCA.
We endeavour to ensure compliance with the latest workplace safety regulations and have in place workplace safety policies and procedures that are communicated to our staff. We regularly send our key technical staff for training on workplace safety practices. Recognising that safety is a joint responsibility, we work closely with our main contractors to ensure that construction sites are conducive not only for our staff, but also the staff of main contractors, sub-contractors and suppliers, and the public where applicable.
Safety talk for cleaners at China Square Central First aid training at Fraser Place Manila
Lifting training at Hotel du Vin Cambridge Wellness training at Fraser Property China's Shanghai office
FR
AS
ER
S C
EN
TR
EP
OIN
T L
IMIT
ED
& S
UB
SID
IAR
IES
102

Live Life Get Active at One Central Park, Sydney
Smoothie Day at Fraser Suites Sydney
Healthy Walk by staff at Fraser Place Shekou Shenzhen
AN
NU
AL
RE
PO
RT
20
16
103

Safety in design and construction has to be addressed at three levels: Planning, Programme and People.
Design for safety (DFS) is the focus at all three levels, where the party creating the risk must address the issue at source. DFS therefore goes beyond the architects and engineers to include the contractors, sub-contractors and workers implementing sequence of works, formworks, tip-enhanced Raman spectroscopy and gondolas.
However, the focus and effectiveness of DFS is at the planning stage, particularly at concept design and design development. Planners, architects, engineers and contractors are most effective when design risk assessment is front loaded.
The guideline in DFS helps reduce accidents and fatalities by addressing risks from design development through construction, to usage and maintenance.
FCL, in partnership with its building consultants and contractors, seeks improvements in productivity through the processes, which mitigates design risk, improves labour efficiency, reduces construction risk and cost with an efficient sequence of work, and improves quality and workmanship.
WHAT IS DESIGN FOR SAFETY?
• Safety in design to reduce dangerous practices
• High risk activities such as working at height
• Materials handling and traffic management
• Personal protective equipment
We are proud that in FY2015/16, our construction sites in Singapore recorded zero fatalities. During the financial year, we had seven projects under construction. The total lost-time injury rate was 1.2 incidents per million man-hours worked and the severity rate was 23.2 lost-days per million man-hours worked.
Our Australian in-house construction operations experienced 12 lost-time injuries during the year, which translates to a lost-time injury rate of 2.2 per million man-hours. The number of lost-days totalled to 201 days, which resulted in a severity rate of 36.2 per million man-hours. This was due to two incidents involving a worker falling from a three-metre height and another worker injuring his finger. Our staff on the ground regularly communicate with and report to both FPA’s Board and Management, and continue to address safety issues and mitigation areas.
We pay specific safety attention to a few areas:
FR
AS
ER
S C
EN
TR
EP
OIN
T L
IMIT
ED
& S
UB
SID
IAR
IES
104

Completed BuildingsFY2015/16
Corporate Office Singapore China Australia Hospitality
Number of fatalities 0 0 0 0 0
Number of lost-time injuries 0 3 1 1 32
Number of lost-days 0 98 4 6 970
Lost-time injury rate (per million man hours) 0 1.4 1.3 78.7 5.5
Severity rate (per million man hours) 0 44.1 5.0 472.1 165.6
Note: Our health and safety data has been aligned to the Singapore’s Ministry of Manpower requirements with the definition of lost-time injury being more than three days’ medical leave due to injury
For the completed properties that FCL manages, there was some variances in the safety performance. For our Singapore commercial buildings, there was an increase in the lost-time injury rate to 1.4, from 0.4 a year ago, while the severity rate jumped to 44.1 from 3.0 a year ago. The increase in severity was due to three injury cases. There were also several injuries reported at our Hospitality SBU. Although the number of lost-time injuries is lower at 32, compared to last year, the lost-time injury rate (5.5 per million man-hours) and severity rate (165.6 per million man-hours) are higher than a year ago. We note that the majority of incidents reported by our Hospitality SBU involved staff who were injured when they tried to lift certain items or they slipped and fell. It is imperative that we put in place processes and provide safety training to keep such incidents to a minimum and we have since embarked on several initiatives to drive home our commitment to workplace safety.
We will continue to improve our safety processes across our various business units and departments. Led by senior management, we have begun refining the Group’s safety policies by first understanding and assessing how each business unit currently practices health and safety management, both on site and at each property. Our aim is to implement a comprehensive set of policies across all our business units and training to share workplace safety best practices across the Group. To further emphasise the importance of health and safety, we organised our inaugural Frasers Health & Safety Month in August 2016, and will make this an annual event.
PEOPLE

Our inaugural Frasers Health & Safety Month was organised in August 2016 with the aim of reinforcing the importance of health & safety (H&S) in the corporate culture, as well as raising awareness of H&S issues among staff. The inaugural theme was “See Something, Do Something”, which revolves around the broad messages of raising awareness among staff, for everyone to take ownership of safety around them while taking steps to stay healthy.
A H&S programme was rolled out during the month, which included activities for the staff across the globe such as the Frasers Global Running Challenge. Property-level events like safety inspections and talks, fire drills, first aid demonstrations and fitness sessions were also organised.
FRASERS HEALTH & SAFETY MONTH 2016
CORPORATE OFFICE OUTREACH PROGRAMMEFrasers H&S Carnival was held at FCL’s corporate office, where it featured H&S awareness activities and a bazaar with vendors selling health- and wellness-related merchandise. A free health screening was also offered to all staff where blood tests and body assessments (e.g. blood pressure, body mass index) were carried out. Staff were then given individual consultations on steps to take to improve their health.
PROPERTY-LEVEL PROGRAMMETo ensure that all staff were engaged in the H&S month, all SBUs carried out H&S activities relevant to their operations at each property/project under management. Activities included:• Workplace safety workshops • First aid, cardiopulmonary resuscitation, fire extinguisher
training • Emergency and fire drills • Health screening and wellness talks• Fitness and sports events • Workplace H&S quiz and discussion• Massage sessions for staff • Non-routine safety checks
FRASERS GLOBAL RUNNING CHALLENGE The Frasers Global Running Challenge was organised as a group-wide activity. The Challenge required staff to accumulate their running mileage for the month of August for submission. The inaugural competition was well received with 114 staff from the Group’s properties worldwide participating in the event. Together, they logged a total distance of 4,139 km.
Through the inaugural H&S outreach programme, we successfully engaged approximately 5,200 staff (including contractors’ staff). To further enhance the H&S culture, we have designated every August to be Frasers Health & Safety Month.
TOUR DE FRASER – A VIRTUAL TOUROne of the more interesting activities organised by our staff this year would be Tour de Fraser by Fraser Suites Glasgow. The team used a stationary bike and cycled 825 km, the distance between all Fraser properties in the UK. This was aimed at promoting both teamwork and exercise. The team achieved the distance in 30 hours, burning an impressive 15,500 calories (the equivalent of 60 Big Macs).
FR
AS
ER
S C
EN
TR
EP
OIN
T L
IMIT
ED
& S
UB
SID
IAR
IES
106

PEOPLE
Planting Day at Capri by Fraser, Ho Chi Minh City
Fire evacuation drill at Fraser Place Tianjin
Safety talk at FPAFrasers Health & Safety Carnival at FCL's corporate office in Singapore

PEOPLE
SOCIAL & FAMILY EVENTS
• Annual Staff Dinner & Dance
• Family Day at Gardens By The Bay
• Eat with Your Family Day• Health Screening• Mental Health and Wellness
Talks• Healthy Cooking Class• Counselling Hotline and
E-Articles• Health Advisory EDMs• Frasers Centrepoint Bursary
Awards • Back to School with Dad
FITNESS PROGRAMME
• Kpop X Fitness • Zumba• Marathon subsidies
SPORTS EVENTS
• SGX Bull Charge Charity Run (Official T-shirt Sponsor)
• Bowling Tournament• REDAS Bowling Friendly• Walk/Jog sessions• Frasers Global Running
Challenge
ENHANCING STAFF WELL-BEING
We believe in the importance of taking care of our staff's well-being. Our Corporate Wellness Committee planned a year-round programme around the themes of team building, personal development and health. This programme was founded on our motto “Make Wellness Part of Your Life: Regular Exercise. Eating Right. Staying Positive”. During our inaugural Frasers Health & Safety Month in August 2016, staff were engaged through a series of events and activities to improve their understanding and awareness of health and safety at FCL. The Frasers Centrepoint Bursary Award is part of our holistic approach towards promoting staff well-being. For the last three years, we have been providing financial assistance to children of our staff to help with their education expenses.
Staff activities and programmes in FY2015/16 included:
Five-year long-service award recipients at the Staff D&D 2016
FR
AS
ER
S C
EN
TR
EP
OIN
T L
IMIT
ED
& S
UB
SID
IAR
IES
108

In Singapore, a joint Staff Dinner & Dance (D&D) was held with our sister companies, Fraser & Neave Limited, Times Publishing, F&N Foods and InterBev, at Marina Bay Sands this year. The event saw a total of 840 attendees from FCL. The theme for the night was “Back to the Future”and staff came dressed as various retro and futuristic movie characters. During the D&D event, long-service awards were presented to a total of 141 FCL staff who have served from five years to 40 years. In China, FCL staff from offices across Shanghai, Chengdu and Suzhou gather every year for a company trip to various parts of China. In 2016, our colleagues chose Jilin, Xuexiang and Harbin for a five-day trip, which also involved a day of team-building activities.
In Australia, the focus remained on employee well-being. Staff activities including health checks, Family Day activities, Employee Assistance Programme/Counselling, Mindful Employer Training, flexible work practices, matching of fundraising for events involving staff participation, SBU team building and planning activities were organised over the course of the year. We also expanded our partnership with Medibank Private for discounts in private health insurance and the establishment of an online health portal for FPA staff.
FCL staff orientation held in Singapore
Five-year long-service award recipients at the Staff D&D 2016
Frasers Suites Sydney staff at the Colour Run 2016

SUPPORTING STRONG FAMILY BONDING
We believe that nurturing strong family bonds is the key to greater work-life harmony for our staff. We organise various activities each year that involve our staff and their families. In May this year, we brought more than 1,600 staff and their family members to Gardens By The Bay for the FCL Family Day. We also supported Eat With Your Family Day by granting our staff early release to spend time with their families. During Chinese New Year, Group HR brought cheer and well-wishes by delivering goodie bags to each staff located at various premises in Singapore.
STAFF MANAGEMENT [LA4]
Staff management is an important aspect of business management. When handled well, it can have a positive impact on the company’s sustainability. With human capital being a critical element of FCL’s business model, it is important for us to pay close attention to this area. FCL is a signatory to the TAFEP in Singapore and is committed to adopting fair employment practices and principles as guided by
TAFEP. We also draw guidance on good practices from the Singapore National Employer Federation, of which FCL is a member.
We are proud that we have maintained a healthy workforce that is diverse in terms of age, gender and skill sets. With operations in more than 80 cities across 26 countries, FCL’s workforce is made up of people of different nationalities. Following the acquisition of the Malmaison Hotel du Vin group, which comprises 29 boutique hotels, in 2015, the UK is currently home to our largest workforce. Our statistics show an almost equal gender balance with a male to female ratio of 53:47. We also have a relatively young workforce, with 53% in the core age group of 30-49 years old. Non-executive staff make up 75% of our workforce, due to the labour-intensive nature of our property management services at retail malls, office buildings and serviced apartments/hotels operations.
Having a diverse talent pool encourages growth, innovation and inclusivity, all of which contribute positively to business performance and the community. As laid down in our Code of Business Conduct, FCL is committed to providing equal employment opportunity based on meritocracy and the elimination of discrimination in support of diversity.
FCL Family Day at Gardens By The Bay
PEOPLE
FR
AS
ER
S C
EN
TR
EP
OIN
T L
IMIT
ED
& S
UB
SID
IAR
IES
110

BY AGE GROUP (%)
BY GENDER (%)
BY TYPE (%)
BY COUNTRY (%)
53
47
75
25
47
6
20
25
2
53
13
34
<30 years old
30-49 years old
>50 years old
Male
Female
Executive
Non-Executive
Singapore
Australia
China
UK/Europe
OthersNote: The data covers all 4,266 FCL staff globally
STAFF RETENTION AND DEVELOPMENT [LA1, LA9, LA11, S04]
Employee retention continues to be an important area of focus for us, as our people drive our success. We seek to retain our knowledge pool, while introducing a managed stream of new talent and skills.
As of 30 September 2016, we have a total of 4,266 employees globally, which is an increase from 4,062 employees a year ago. Our headcount grew, largely due to expansion of our operations in Australia and acquisitions by our Hospitality SBU. Our hiring rate of 47% was higher then our turnover rate of 40%. The hiring rate and turnover rate for Singapore were much lower at 20.7% and 17.2% respectively, well below the national average turnover rate of 22.8%.
We treasure and appreciate our employees by providing a range of benefits and welfare that are aligned with the industry. These include retirement plans (where applicable), parental leave and medical insurance, bonuses and share plans (for relevant staff) in addition to basic salaries. We constantly benchmark our remuneration packages with the market to stay competitive. We also support employees who wish to stay in their jobs post retirement, in accordance with the Retirement and Re-employment Act in Singapore.
4,266Employees Globally
FY2013/14 FY2014/15 FY2015/16
NUMBER OF EMPLOYEES, NEW HIRES AND TURNOVER
No. of employees New hires Turnover
2,350
572421
4,062
12711,038
4,266
2,0231,700
AN
NU
AL
RE
PO
RT
20
16
111

PEOPLE
We are committed to continually investing in and developing our people. We believe that having strong innovative leadership and a dedicated workforce are key in driving and sustaining our growth and success. Our in-house training team creates and provides training for all staff, offering a wide range of courses through our learning directory. Employees may also initiate requests for specific training needs. Through our onboarding programme and regular email updates, employees are kept cognisant of updated policies and procedures. For example, we conducted a training course on “Changes to Companies Act” and “Prevention of Money Laundering & Financing of Terrorism” for all executive staff from our Singapore business units in FY2015/16.
BUILDING CAPABILITIES AND DEVELOPING OUR PEOPLE
We have continued to demonstrate our commitment to building capabilities and enhancing competencies for our employees. In FY2015/16, the total learning hours invested in employees across our global operations increased to 103,697 hours. This is a remarkable 60% jump from 64,670 hours clocked in FY2014/15 due to concerted efforts to enhance our
staff training activities. On average, we achieved the target of 40 training hours per employee, which we had set a year ago. Approximately 56% of total training hours were clocked by non-executive employees, while executives accounted for 44%. We are committed to raising the quality of training and performance next year. We continue to allocate 2% of our payroll costs for training and development purposes.
We have also introduced a new SkillsFuture Learning leave policy for all Singaporean employees in FCL. All Singaporean employees are given two days of learning leave which they may apply for to attend a SkillsFuture course. This is in support of the Singapore government’s SkillsFuture Credit initiative to encourage Singaporeans to develop themselves.
5644
Executive
Non-executive
Hours Per staff
TRAINING HOURS1 TRAINING HOURS BY EMPLOYEE TYPE (%)
FY13/14 FY14/15 FY15/16
27
45,778 64,670
26
40
60%Total Learning Hours
FY2015/16 103,697
FY2014/1564,670
103,697
1 The training data do not capture those from MHDV staff
FR
AS
ER
S C
EN
TR
EP
OIN
T L
IMIT
ED
& S
UB
SID
IAR
IES
112

In FY2015/16, a series of leadership talks was introduced for all our senior leaders to learn from external business leaders and subject matter experts. At this learning platform, the latest in business practices, trends and thought leadership are shared. Our speakers were given opportunities to interact with these leaders who have significant corporate/commercial experiences. Topics shared included mega trends and leadership responses, technology trends and how they are shaping businesses, corporate governance trends and challenges and cultural diversity. A total of four talks were organised, which were attended by 127 leaders and managers.
We also continue to nurture our middle management through our annual Leadership Excellence and Development Programme (L.E.A.D). Over a course of six months, some 20 middle managers went through a series of customised leadership modules which helped sharpen their mindset and strengthened their commitment to the Group. Besides enhancing the
management skills of participants, it also provided participants with a platform to interact with fellow managers, exchange ideas, and learn from each other.
In Australia, FPA has committed to training all relevant staff in sustainability or innovation by 2017.
STRIVE FOR SERVICE EXCELLENCE
Every year, we send our frontline staff for training to improve the service quality. Our efforts have shown good results as seen in the number of our employees who received the Excellent Service Award (EXSA) by SPRING Singapore. The award is given in recognition of individuals who have delivered quality service nationally. In total, there were 118 award recipients from FCL in 2016, comparable to 119 recipients in 2015 and 108 in 2014.
L.E.A.D. Programme participants
AN
NU
AL
RE
PO
RT
20
16
113

PEOPLE
this wide range of activities, we hope to address the varied needs of different sectors of the local communities and make a real difference to those who have been key to our business success.
Globally, the Group has adopted Wellness as our focus for community initiatives. In Australia, through three categories – Restoring Resources, Progressive Thinking and Community Focus – we articulate our commitment to environmental and social sustainability, and document our intentions for the future. Increasing the social value of our communities is one of these goals, and we are now developing a shared value measurement tool. In Singapore, the Group launched the Frasers Centrepoint Wellness Grant for tertiary institutions.
LOCAL COMMUNITIES
As landlords and developers, we regularly interact with our local communities which include tenants, shoppers, homebuyers as well as members of the public. We are aware that our day-to-day operations may affect them, directly or indirectly. FCL, therefore, strives to make those impacts and interactions as positive as possible.
We endeavour to give back to our communities through our Corporate Social Responsibility (CSR) efforts and to play a part in the development of our communities. Our CSR initiatives include fundraising, contributing space for events and outreach activities, engaging with our neighbours, supporting the arts and actively participating in community projects. Through
FCL staff volunteered at and participated in RUN@SUTD, funded by the Frasers Centrepoint Wellness GrantFPA staff volunteering for A ReaL MeaL in Melbourne
Site visit by our Australian sustainability colleagues and the GBCA team at Alexandra Point

Starting with the Singapore University of Technology and Design (SUTD), FCL provided seed funding for student-driven community projects. We plan to extend the grant to more tertiary institutions over time. Involving our peopleWe strive to engage communities through employee interaction and volunteerism. Our staff are therefore encouraged to volunteer their time in support of events and activities that would positively impact their local community. Our staff contributed a total of 400 volunteer days in FY2015/16. Volunteerism activities included FH staff helping to clean beaches, celebrating Ramadhan with children from the Rumah Amal Limpahan Kasih Welfare and Education Centre in Kuala Lumpur, and participating in the Run for
Fun Suzhou whereby registration fees were donated to charitable causes. Staff from the FCL corporate office participated in RUN@SUTD as runners and volunteers. Registration fees for the run were donated to the Singapore Disabled Sports Council.
Raising global environmental awarenessIn support of global environmental sustainability awareness, FH, together with WWF-Earth Hour, launched the ‘Just One’ hotels programme this year. Under this programme, guests are invited to support WWF's critical climate projects by contributing an additional $1 for every night spent at participating FH properties. Through ’Just One’, FH aims to raise at least $3 million by 2020 for WWF as a commitment towards environmental conservation.
FPA staff participated in Clean Up Australia Day in QueenslandEarth Hour celebration at Fraser Residence Kuala Lumpur
FCL's team at the SGX Bull Charge Charity Run 2016
AN
NU
AL
RE
PO
RT
20
16
115

‘JUST ONE’ HOTELS PROGRAMME – PIONEERING A CLIMATE ACTION PROGRAMME WITH WWF-EARTH HOUR
Demonstrating its continued support for global environmental sustainability awareness, FH, together with WWF Earth Hour, launched the ‘Just One’ hotels programme.
Under this pioneer programme, guests are invited to support WWF's critical climate projects. By adding an additional $1 for every night spent at participating FH properties, guests will be donating towards protecting the habitats of millions of wildlife around the world. The funds raised will contribute to WWF climate projects such as WWF's Education programme, which seeks to make environmental education an integral part of the school's curriculum.
Having piloted the programme in July 2016 at all Singapore properties, ‘Just One’ will be rolled out progressively in 2017 in Australia and the UK. The restaurants in the hotel will be the key venue of collecting donations. Adding to the list will be properties from the Middle East, China and the rest of Southeast Asia.
Through ‘Just One’, FH aims to raise at least $3 million by 2020 for WWF as a commitment towards environmental conservation. As a pioneer of the programme, FH also hopes to be an advocate for similar environmental commitments within the sector.
World Wide Fund for Nature (WWF) is an international non-governmental organisation working towards the protection of nature and the planet.
The organisation partners foundations, governments, businesses and communities in conserving the world’s most ecologically important regions and reducing Man’s ecological footprint. As an associate of WWF, Earth Hour Global
is a registered charity delivering an annual worldwide movement in March under the Earth Hour brand to turn off non-essential lights for one hour.
Having started in Sydney in 2006, the brand has grown exponentially over the past decade and has now achieved participation from over 170 countries.
“We are grateful to Frasers Hospitality for their support and commitment towards our vision of collectively creating a better future for our shared home – planet Earth, for ourselves and generations to come.”
Siddarth DasExecutive Director, Earth Hour Global, WWF
FR
AS
ER
S C
EN
TR
EP
OIN
T L
IMIT
ED
& S
UB
SID
IAR
IES
116

PEOPLE
Providing financial assistance This year, we sponsored $130,000 towards various charitable activities and causes. They included the SGX Bull Charge Charity Run in support of the Asian Women’s Welfare Association, Autism Association of Singapore, Fei Yue Community Services and Shared Services for Charities. We also raised a total of $1 million for various causes and activities.
The launch of ‘Play It Forward’, a joint initiative of Frasers Centrepoint Malls and the Community Chest, saw $145,000 raised for Family Service Centres. These community-based focal points of family resources provide social support for families facing difficulties. This year-long initiative involves inviting shoppers to give back to families in need by donating a minimum sum of $5 to experience 15 minutes of play time in a charity ball pool. Frasers Centrepoint Malls matches shoppers’ donations dollar-for-dollar up to $30,000 to spread cheer to families and individuals in need.
Through the Frasers Property Foundation, FPA donated $85,000 to 24 charities this year, in a combination of corporate donations and matching funds raised by staff members. Many of FPA’s initiatives launched in previous years are still going strong. The Central Park Plunge now in its second year, held in support of the Ronald McDonald House,
The Fiona Wood Foundation, Kids’ Camp and Anglicare Western Australia, raised funds in excess of A$460,000. Step Up for MS, one of the iconic events for the Multiple Sclerosis Society of Western Australia, raised funds totalling A$92,879, with the Central Park management team making a donation of A$10,000 towards the cause.
Staff of Frasers Centrepoint Malls and Community Chest at the Launch of ‘Play It Forward’
Central Park Plunge, Perth
AN
NU
AL
RE
PO
RT
20
16
117

PEOPLE
Sharing our spaceWe continue to support the community by contributing our spaces for various charitable and outreach events. We believe that our commercial spaces are where people gather and present opportunities for social engagement.
Several outreach events were held at our malls this year, including awareness sessions conducted by non-profit organisations. Valley Point extended complimentary usage of atrium space to Privilege Enterprise Group, a social enterprise which creates
employment opportunities for people from all walks of life. Funds are earned through the sales of food items at the atrium to support the beneficiaries' education as well as their families. Anchorpoint also shared its atrium space in support of the awareness campaign for the Special Olympics, a grassroots community movement dedicated to empowering and transforming the lives of people with intellectual disabilities. Hair for Hope 2016, Children's Cancer Foundation's signature fundraising event was also held at Waterway Point.
A magic show at Northpoint's Children's Day party Performances at the Singapore Youth Festival held at Causeway Point
Republic Polytechnic's National Pushcart Challenge at Causeway Point
FR
AS
ER
S C
EN
TR
EP
OIN
T L
IMIT
ED
& S
UB
SID
IAR
IES
118

Connecting with our neighboursFCL believes that social inclusivity is valued in FCL as we believe that it is a fundamental block of social cohesion. As part of the Yellow Ribbon Project, Changi City Point arranged for a travelling exhibition to educate the public about the rehabilitation and re-integration of ex-offenders into mainstream society. The campaign seeks to inspire potential volunteers and to reach out to the public.
Encouraging social interaction during festive seasons creates positive memories and helps foster a greater sense of community. We organised neighbourhood celebrations during various festivals and invited members of the community to join
in the fun. Key events included the Mid-Autumn Walk at Bedok Point organised with the People's Association and Kampong Chai Chee Community Centre in Singapore, as well as the Cockburn Billy Cart Festival and Chinese New Year celebrations at Queens Riverside in Australia. In China, our Baitang Neighbourhood Committee in Suzhou held the annual Mid-Autumn Festival celebration on 9 September for Baitang One residents. Our Suzhou office provided space at Baitang One Retail Street Mall (Parkville Point) for the event. Besides being a venue sponsor, we also sponsored prizes worth approximately RMB10,000 for the event’s lucky draw.
Mid-Autumn Festival celebrations at Bedok Point
Performances by musicians with special needs at VSA Annual Art Exhibition at Changi City Point
Chinese New Year celebrations at Queens Riverside, Perth
Donated groceries to those in need within the community at YewTee Point's Care and Share Event
AN
NU
AL
RE
PO
RT
20
16
119

Supporting the Arts and HeritageWe continue to take a keen interest in promoting local arts and heritage. This year, we supported the PAssion Arts Festival where some 50,000 residents created artworks which were attached to the sides of public housing blocks and condominiums across Singapore. We also hosted An Ecstatic Vision at Changi City Point, an art exhibition organised by Very Special Arts (VSA) Singapore to showcase more than 100 pieces of artwork by artists with special needs. FH provided close to $300,000 worth of accommodation for performing arts groups for a number of productions in Singapore, including KidsFest 2016 and Seussical the Musical – ABA Productions Limited; Shakespeare in the Park, Romeo
and Juliet – Singapore Repertory Theatre; Hotel – Wild Rice Limited; and Rent – Pangdemonium Theatre Company Limited.
We are also active in the arts scene in Australia, with FPA jointly sponsoring and hosting the VIVID Arts Festival and Sydney Architecture Festival as well as BEAMS Arts Festival with Sekisui House. For the fourth consecutive year, Central Park Perth held the As We Are art exhibition, featuring the works of disabled artists from Perth. The inspiring exhibition this year provided good exposure for the artists, with the biggest turnout to date and the largest number of attendees on its opening night. The event successfully raised A$9,000 from the artworks sold.
PEOPLE
Shoppers appreciating artwork at VSA Annual Art Exhibition at Changi City Point
Sydney Architecture Festival, Central Park, Sydney
VIVID Arts Festival 2016, Central Park, Sydney
BEAMS Arts Festival 2016, Central Park, Sydney
FR
AS
ER
S C
EN
TR
EP
OIN
T L
IMIT
ED
& S
UB
SID
IAR
IES
120

INNOVATION
What we do today determines our success in the future. Our strategic investment in our people through staff development programmes and managing a talent pool with the right skill sets helps to future-proof our business.
SETTING STANDARDS IN DESIGN AND FEATURES
We have reaped tangible results from the non-financial investments we made. In 2008, FCL was the first developer in Singapore to introduce dual-key apartment units when we launched the Caspian Condominium project, which was since replicated in our other projects including 8@Woodleigh and Esparina Residences Executive Condominium.
This year, we piloted Building Information Modelling – Virtual Design and Construction (BIM-VDC) modelling in the project management of one of our developments, Northpoint City. VDC allows us to virtually explore innovative ways to enhance efficiencies in the built environment, while improving construction quality – a win-win solution with positive impacts to the bottom line, the environment and the retail experience.
In the development of new properties, we look to create vibrant and liveable spaces to live, work, and play in. These spaces are not only socially inclusive, but also integrated with nature and heritage. We therefore strive to achieve the following in the design of new projects to ensure that our developments cater to the varying needs and users' diverse needs:• Seamless connectivity to transport infrastructure and neighbouring
developments (e.g. streets, walkways, buildings, parks)• Intuitive way-finding and enhanced accessibility of amenities and
features for users with diverse abilities and mobility• Creation of communal spaces that are conducive for all age groups
and persons of diverse physical abilities• Incorporation of natural and/or cultural heritage into communal areas
of the development
Esparina Residences Executive Condominium, Singapore
AN
NU
AL
RE
PO
RT
20
16
121

Watertown was designed as the Coastal Town of the 21st Century in Singapore, harnessing the historical and natural beauty of Punggol Waterway while providing seamless 24/7 connectivity to the Waterway and Promenade. The mixed-use development integrates transport infrastructure, family-oriented amenities and the greenery of the Punggol Waterway into its design, ensuring accessibility to people of varying mobility and age groups while creating community spaces for public interactions. In recognition of its user-centric and socially inclusive design, Watertown has been awarded the Universal Design Mark GoldPLUS (Design) Award by BCA.
We continue to embrace Universal Design practices in the development of Northpoint City, which has taken a similar approach. When completed in 2018, Northpoint City will provide barrier-free access and seamless transport connectivity with transportation networks, while integrating public and private spaces for the convenience of users. The development will also weave nature into its design, infusing vibrancy into the Yishun suburb.
CREATING THE WORLD’S MOST SUSTAINABLE RETAIL CENTRE
In Australia, we are proud to have partnered the Living Future Institute of Australia and launched the Brickworks Living Building Challenge. It is a future-focused design competition that calls on design teams, professionals, students and anyone interested
in a regenerative future to re-imagine the possibilities for the sustainable shopping centres of tomorrow. The Living Building Challenge is the world’s most aspirational and rigorous green building performance standard and its certification acts to rapidly diminish the gap between current limits and the end-game positive solutions. With this design competition, we hope to create an opportunity for the world’s most passionate people in sustainability to conceptualise a retail centre design that shifts all our thinking forward.
We believe we have made the right decision in choosing to ride on the spirit of innovation to create a distinct brand differentiation and are excited to see what else the future brings for us as we continue on our journey to build a sustainable company.
LITTLE THINGS THAT MAKE THE DIFFERENCE IN HOSPITALITY
As part of our commitment toward ”Living The Vision”, FH created a system which encourages staff from all our properties to submit innovative ideas to improve guest experience, staff experience and profitability. The result of this initiative was the implementation of ideas such as the creation of a ”culture wall” to motivate and provide a warmer ambience for the back-of-house at various properties. Another staff-initiated activity is the free Mandarin lessons they offer to guests to not only teach the language but also impart knowledge about Chinese culture.
INNOVATION
Watertown, Singapore
FR
AS
ER
S C
EN
TR
EP
OIN
T L
IMIT
ED
& S
UB
SID
IAR
IES
122

VIRTUAL DESIGN AND CONSTRUCTION MODELLING FOR GREATER BUILDING EFFICIENCIES
In developing new properties, FCL is constantly seeking new technology and innovative ways to enhance efficiencies in the built environment, while improving construction quality. FCL takes pride in being one of the first two private developers in Singapore to adopt the Building Information Modelling-Virtual Design and Construction (BIM-VDC) modelling in the project management of one of our developments, Northpoint City. It is also the first mixed development in Singapore to adopt VDC, which is the advanced module of the BIM.
While it has become common for developers in Singapore using the BIM to integrate construction information across various disciplines, FCL took a step further with BIM by utilising VDC to create a virtual prototype of the building design and construction. The prototype provides designers and engineers with
an on-ground experience of the actual construction process, improving predictability before project execution and enhancing project efficiency.
Improved risk awareness: Through visualisation of the construction process, possible clashes on site were detected early and prevented. Actual work was better planned resulting in smoother and safer execution.
Time efficiencies: With need for re-work minimised and coordination among the team improved, FCL achieved three days of lead-time reduction that was useful in supporting other activities.
Resource efficiencies: Reduction in energy use and material wastage during construction and building management was achieved, consequently reducing the impact on the environment.
To share our learnings with the industry, we shared our experience in the use of VDC with the industry, by presenting the case study at the REDAS BIM Symposium in September 2016.
Northpoint City is an exciting integrated development located in the heart of Yishun. Featuring the largest mall in the North of Singapore, Northpoint City will also contain Singapore’s first Community Club within a shopping mall.
A town plaza the size of 10 basketball courts, an air-conditioned bus interchange, and North Park Residences, a 12-block residential development comprising 920 residences, completes the iconic development.
The development will also offer seamless connectivity to public transport and a cycling network to support the government’s plan to go car-lite.
AN
NU
AL
RE
PO
RT
20
16
123

CREATING THE WORLD’S MOST SUSTAINABLE RETAIL CENTRE
In an effort to redevelop and regenerate the former Burwood Brickworks site in Melbourne, FPA has dedicated a new retail project at the site targeting the Living Building Challenge (LBC) standard, one of the most stringent green building certifications in the world. Together with Living Future Institute Australia, the Brickworks LBC design competition was launched, with the aim of unlocking new possibilities in sustainable design in retail. The project prides itself in being the world’s most sustainable retail centre in the making.
To achieve the “Living Building” title, strategies for Brickworks were laid down by FPA in relation to LBC’s performance areas.
Performance Area Strategies
Place • Increase the ecological value of site• Dedicate 20% of site for food-growing• Set aside land away from project in perpetuity• Be car-lite
Water • Achieve a 100% closed loop water system
Energy • Achieve net positive energy (105%) without combustion
Health + Happiness
• Have operable windows in regularly-occupied spaces• Implement volatile organic compounds limits on
interior building product, cleaning protocol using environmental products and indoor air quality testing
• Include elements that nurture the human-nature connection
Materials • Specify, select & install non-red list products• Calculate and offset embodied carbon• Use 30+ ‘Declared’ products and the Forest
Stewardship Council timber throughout• Use ‘Local’ materials, products, consultants • Ensure infrastructure is provided for recycling
Equity • Limited exposed car parking • Minimise impact to local fresh air, natural waterways• Donate a portion from every dollar invested to a
charity of choice• Engage/encourage consultants and sub-contractors to
undertake JUST certification
Beauty • Introduce public art• Have public education about the operation and
performance of the project
Winning design by dwp|suters for the Brickworks Living Building Challenge
The LBC is a sustainable building certification programme created by the International Living Future Institute in 2006. It is a performance-based standard where each development has to comply with 20 general imperatives arranged under seven performance categories before achieving the LBC certification. Known as one of the world’s most exacting green building standards, only 11 “Living Buildings” have been successfully certified.
FR
AS
ER
S C
EN
TR
EP
OIN
T L
IMIT
ED
& S
UB
SID
IAR
IES
124

GRI CONTENT INDEX (G4 CORE)
The report is prepared in accordance to the guidelines laid out by the Global Reporting Initiative (GRI) G4 Core. The table below summarises our disclosure level with reference to GRI indicators.
Fully met Partially met Not covered
GENERAL STANDARD DISCLOSURES
Standard Disclosure Title Page ReferenceDisclosure
LevelSTRATEGY AND ANALYSIS
G4-1 Statement from the most senior decision-maker of the organisation about the relevance of sustainability to the organisation and the organisation’s strategy for addressing sustainability
Chairman's Statement p. 24-26Group CEO's Statement, p. 27-29Sustainability Report, p. 73
ORGANISATIONAL PROFILEG4-3 Name of the organisation FCL Group At A Glance, p. 3 G4-4 Primary brands, products, and services FCL Group At A Glance, p. 3-5 G4-5 Location of the organisation’s headquarters About This Report, p. 78G4-6 Number of countries where the organisation
operates, and names of countries where either the organisation has significant operations or that are specifically relevant to the sustainability topics covered in the report
About This Report, p. 78
G4-7 Nature of ownership and legal form Notes To The Financial Statements, p. 190-303
G4-8 Markets served (including geographic breakdown, sectors served, and types of customers and beneficiaries)
Our Global Presence, p. 6-7
G4-9 Scale of the organisation FCL Group At A Glance, p. 3-5 Staff Retention And Development, p. 111
G4-10 a. total number of employees by employment contract and gender
b. total number of permanent employees by employment type and gender
c. total workforce by employees and supervised workers and by gender
d. total workforce by region and gender
e. report whether a substantial portion of the organisation’s work is performed by workers who are legally recognised as self- employed, or by individuals other than employees or supervised workers, including employees and supervised employees of contractors
f. any significant variations in employment numbers (such as seasonal variations in employment in the tourism or agricultural industries)
Staff Retention And Development, p. 111 No substantial work is performed by workers who are legally recognised as self-employed. there is no significant variation in employment numbers.
G4-11 Employees covered by collective bargaining agreements
There are no collective bargaining agreements in place.
G4-12 The organisation’s supply chain Our Value Chain, p. 82 G4-13 Significant changes during the reporting period
regarding the organisation’s size, structure, ownership, or its supply chain
Added Thai operations with the purchase of a stake in Thailand's Golden Land and etc. Please refer to our announcement in SGX.
AN
NU
AL
RE
PO
RT
20
16
125

G4-14 Whether and how the precautionary approach or principle is addressed by the organisation
Governance, p. 90-92
FCL does not specifically refer to the precautionary approach when managing risk, however, our management approach is risk-based, and underpinned by our internal audit framework.
G4-15 Externally developed economic, environmental and social charters, principles, or other initiatives to which the organisation subscribes or which it endorses
Governance, p. 90-92 Environment, p. 73-100 People, p. 101-120
G4-16 Memberships of associations (such as industry associations) and national or international advocacy organisations
Stakeholder Engagement, p. 83-84Partnerships And Affiliations, p. 85
IDENTIFIED MATERIAL ASPECTS AND BOUNDARIES
G4-17 All entities included or not included in organisation’s financial statements
About This Report, p. 78
G4-18 Process for defining report Content What's Important To Us, p. 79-82
Please refer to our previous report for details of our process for defining report content.
G4-19 The material aspects identified in the process for defining report content
What's Important To Us, p. 79-82
G4-20 For each material aspect, aspect Boundary within the organisation
All the 10 identified material issues have impact both inside and outside the organisation, with the exception of Labour/management relations and Staff retention and development, which are internally focused. Health and safety are of particular importance to construction activities, and as such, we focus on influencing safer operations related to FCL developments, through our construction contractors.
G4-21 Aspect Boundary outside the organisation All the 10 identified material issues have impact both inside and outside the organisation, with the exception of Labour/management relations and Staff retention and development, which are internally focused. Health and safety are of particular importance to construction activities, and as such, we focus on influencing safer operations related to FCL developments, through our construction contractors.
G4-22 Effect of any restatements of information provided in previous reports, and the reasons for such restatements
No restatements
G4-23 Significant changes from previous reporting periods in the scope and aspect Boundaries
No significant changes
GRI CONTENT INDEX (G4 CORE)
FR
AS
ER
S C
EN
TR
EP
OIN
T L
IMIT
ED
& S
UB
SID
IAR
IES
126

STAKEHOLDER ENGAGEMENTG4-24 Stakeholder groups engaged by the organisation Stakeholder Engagement, p. 83-84G4-25 Basis for identification and selection of
stakeholders with whom to engageOur Value Chain, p. 82Stakeholder Engagement, p. 83-84
We have selected Stakeholders based on their interest in our business.
G4-26 Approach to stakeholder engagement, including frequency of engagement by type and by stakeholder group
Stakeholder Engagement, p. 83-84
G4-27 Key topics and concerns raised through stakeholder engagement, and how the organisation has responded
Stakeholder Engagement, p. 83-84
REPORT PROFILEG4-28 Reporting period for information provided About This Report, p. 78G4-29 Date of most recent previous report Our previous sustainability report was
published for our last financial year - 2014/15.
G4-30 Reporting cycle About This Report, p. 78G4-31 Contact point for questions regarding the report
or its contentsWe Welcome Your Feedback And Suggestions, p.78
G4-32 Report on ‘In accordance’ option, Gri Content Index, reference to external assurance
About This Report, p. 78
G4-33 Policy and current practice with regard to seeking external assurance for the report
About This Report, p. 78
GOVERNANCEG4-34 Governance structure of the organisation Managing Sustainability, p. 88
Governance, p. 90-92 G4-58 Internal and external mechanisms for reporting
concerns about ethical and lawful behaviour, and matters related to organisational integrity, such as escalation through line management, whistleblowing mechanisms or hotlines
Governance, p. 90-92 Anti-corruption, Fraud Prevention And Ethical Marketing, p. 91-92
AN
NU
AL
RE
PO
RT
20
16
127

SPECIFIC STANDARD DISCLOSURESCATEGORY: ECONOMICASPECT: ECONOMIC PERFORMANCE
G4-DMA Generic Disclosures on Management approach Group CEO's Statement, p 27-29
G4-EC1 Direct economic value generated and distributed Financial Highlights, p. 11 Financial Statements, p. 167-303
G4-EC3 Coverage of the organisation's defined benefit plan obligations
Staff Management, p.110 Employees are covered by Singapore’s mandatory social security savings plan, the Central Provident Fund (CPF). Across all of our significant locations of operation, we provide our employees with retirement plans (where applicable).
CATEGORY: ENVIRONMENTALASPECT: ENERGY
G4-DMA Generic Disclosures on Management approach Environment, p. 93-100 Energy Use And GHG Emissions, p. 97-98
G4-EN3 Energy consumption within the organisation Energy Use And GHG Emissions, p. 97-98
G4-EN5 Energy intensity Energy Use And GHG Emissions,p. 97-98
G4-EN6 Reduction of energy consumption Energy Use And GHG Emissions,p. 97-98
Baseline of 2015 selected as this was the first year that we formally began to monitor energy (or something similar).
G4-CRE1 Building energy intensity Energy Use And GHG Emissions,p. 97-98
ASPECT: WATERG4-DMA Generic Disclosures on Management approach Environment, p. 93-100
Water Use/Conservation, p. 99G4-EN8 Total water withdrawal by source Water Use/Conservation, p. 99G4-CRE2 Building water intensity Water Use/Conservation, p. 99
ASPECT: EMISSIONSG4-DMA Generic Disclosures on Management approach Environment, p. 93-100
Energy Use And GHG Emissions, p.97-98
G4-EN16 Energy indirect greenhouse gas (GHG) emissions (scope 2)
Energy Use And GHG Emissions,p.97-98 Main emissions source monitored is electricity, therefore, CO2 is the only gas included.
G4-EN18 Greenhouse gas (GHG) emissions intensity Energy Use And GHG Emissions, p. 97-98
GRI CONTENT INDEX (G4 CORE)
FR
AS
ER
S C
EN
TR
EP
OIN
T L
IMIT
ED
& S
UB
SID
IAR
IES
128

G4-EN19 Reduction of greenhouse gas (GHG) emissions Energy Use And GHG Emissions,p. 97-98
G4-CRE3 Greenhouse gas (GHG) emissions intensity from buildings
Energy Use And GHG Emissions,p. 97-98
ASPECT: EFFLUENTS AND WASTEG4-DMA Generic Disclosures on Management approach Environment, p. 93-100G4-EN23 Total weight of waste by type and disposal
methodWaste Management, p.100
ASPECT: COMPLIANCEG4-DMA Generic Disclosures on Management approach Environment, p. 93-100G4-EN29 Non-monetary sanctions for non-compliance with
environmental laws and regulationsCompliance With Regulation, p. 100
CATEGORY: SOCIALSUB-CATEGORY: LABOR PRACTICES AND DECENT WORKASPECT: EMPLOYMENT
G4-DMA Generic Disclosures on Management approach People, p. 100-120G4-LA1 Total number and rates of new employee hires
and employee turnover by age group, gender and region
People, p 111
Breakdown by age group and gender are not available. We aim to report this next year.
G4-LA2 Benefits provided to full-time employees that are not provided to temporary or part-time employees, by significant locations of operation
Labour/Management Relations, p. 110
Temporary or part time employees are not a significant part of FCL’s workforce.
ASPECT: LABOR/MANAGEMENT RELATIONSG4-DMA Generic Disclosures on Management approach People, p. 100-120G4-LA4 Minimum notice periods regarding operational
changes, including whether these are specified in collective agreements. this is currently not covered in group-wide collective agreements
Staff Management, p. 110 This is currently not covered in group- wide collective agreements. The notice period varies.
ASPECT: OCCUPATIONAL HEALTH AND SAFETY
G4-DMA Generic Disclosures on Management approach People, p. 100-120G4-LA5 Workforce represented in formal joint
management-worker health and safety committees that help monitor and advise on occupational health and safety programs
Managing Sustainability, p. 88-89
G4-LA6 Type of injury and rates of injury, occupational diseases, lost days, and absenteeism, and total number of work-related fatalities, by region and by gender
Safety First, p.101-105
There were no incidences of occupational diseases. We do not measure absenteeism.
restateG4-CRE6
Percentage of the organisation operating in verified compliance with an internationally recognised health and safety management system
Safety First, p.101-105
We are implementing ISO 14001 and OHSAS 18001 systems across our organisation.
AN
NU
AL
RE
PO
RT
20
16
129

ASPECT: TRAINING AND EDUCATIONG4-DMA Generic Disclosures on Management approach People, p. 100-120 G4-LA9 Training per year per employee by gender, and by
employee categoryBuilding Capabilities And Developing Our People, p. 112
Breakdown by gender not available. We aim to report this next year.
G4-LA10 Programs for skills management and lifelong learning that support the continued employability of employees and assist them in managing career endings
Staff Retention And Development, p 111-113
G4-LA11 Employees receiving regular performance and career development reviews, by gender and by employee category
Staff Retention And Development,p. 111-113 100% of staff receive annual performance appraisals.
SUB-CATEGORY: SOCIETYASPECT: LOCAL COMMUNITIES
G4-DMA Generic Disclosures on Management approach Local Communities, p. 114-120G4-SO1 Operations with implemented local community
engagement, impact assessments, and development programs
Local Communities, p. 114-120
G4-CRE7 Persons voluntarily and involuntarily displaced and/or resettled by development, broken down by project
FCL only builds on land tendered or selected by the respective governments for this purpose. We rely on the relevant authorities to solve any potential issues of resettlement or displacement before we start our construction projects.
ASPECT: ANTI-CORRUPTIONG4-DMA Generic Disclosures on Management approach Governance, p. 90-92G4-SO3 Operations assessed for risks related to corruption
and the significant risks identifiedAnti-corruption, Fraud Prevention And Ethical Marketing, p. 91-92
G4-SO5 Confirmed incidents of corruption and actions taken
Anti-corruption, Fraud Prevention And Ethical Marketing, p. 91-92
SUB-CATEGORY: PRODUCT RESPONSIBILITYASPECT: MARKETING COMMUNICATIONS
G4-DMA Generic Disclosures on Management approach Anti-corruption, Fraud Prevention And Ethical Marketing, p. 91-92
G4-PR7 Total number of incidents of non-compliance with regulations and voluntary codes concerning marketing communications, including advertising, promotion, and sponsorship, by type of outcomes
Anti-corruption, Fraud Prevention And Ethical Marketing, p. 91-92
GRI CONTENT INDEX (G4 CORE)
FR
AS
ER
S C
EN
TR
EP
OIN
T L
IMIT
ED
& S
UB
SID
IAR
IES
130
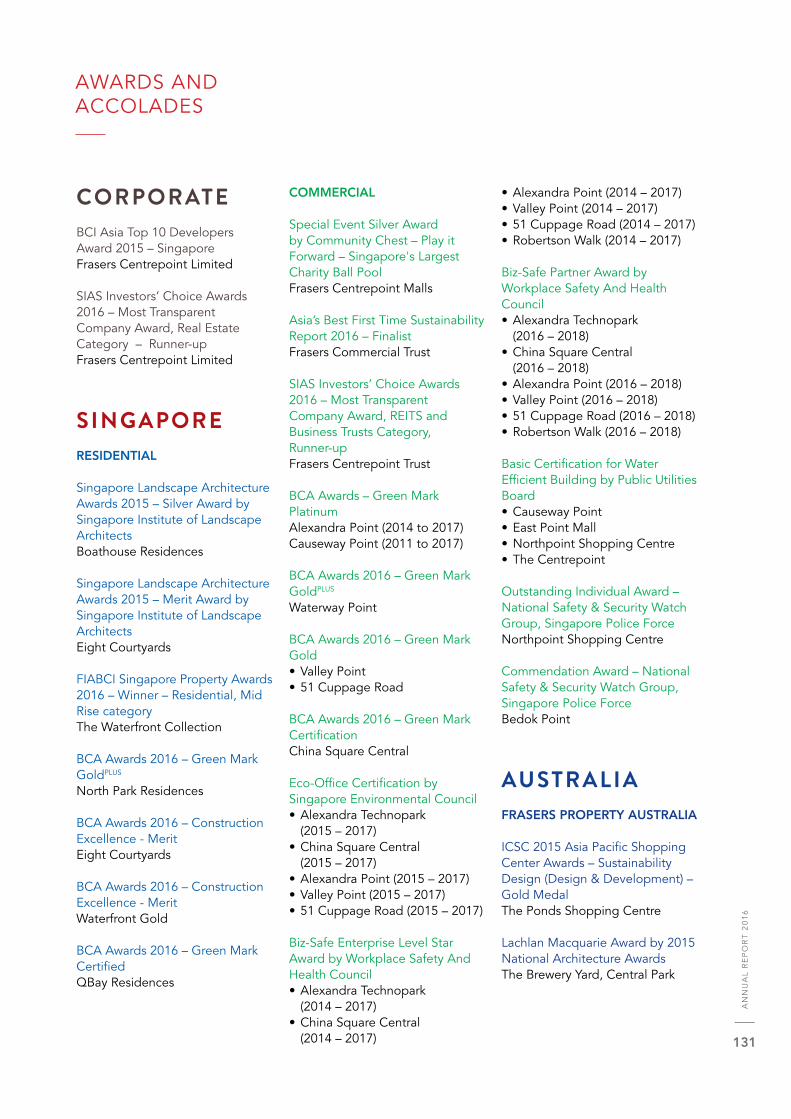
AWARDS AND ACCOLADES
CORPORATE
BCI Asia Top 10 Developers Award 2015 – SingaporeFrasers Centrepoint Limited
SIAS Investors’ Choice Awards 2016 – Most Transparent Company Award, Real Estate Category – Runner-up Frasers Centrepoint Limited
SINGAPORE RESIDENTIAL
Singapore Landscape Architecture Awards 2015 – Silver Award by Singapore Institute of Landscape ArchitectsBoathouse Residences
Singapore Landscape Architecture Awards 2015 – Merit Award by Singapore Institute of Landscape ArchitectsEight Courtyards
FIABCI Singapore Property Awards 2016 – Winner – Residential, Mid Rise categoryThe Waterfront Collection
BCA Awards 2016 – Green Mark GoldPLUS
North Park Residences
BCA Awards 2016 – Construction Excellence - MeritEight Courtyards
BCA Awards 2016 – Construction Excellence - MeritWaterfront Gold
BCA Awards 2016 – Green Mark CertifiedQBay Residences
COMMERCIAL
Special Event Silver Award by Community Chest – Play it Forward – Singapore's Largest Charity Ball PoolFrasers Centrepoint Malls
Asia’s Best First Time Sustainability Report 2016 – Finalist Frasers Commercial Trust
SIAS Investors’ Choice Awards 2016 – Most Transparent Company Award, REITS and Business Trusts Category, Runner-up Frasers Centrepoint Trust
BCA Awards – Green Mark PlatinumAlexandra Point (2014 to 2017)Causeway Point (2011 to 2017)
BCA Awards 2016 – Green Mark GoldPLUS Waterway Point
BCA Awards 2016 – Green Mark Gold• Valley Point • 51 Cuppage Road
BCA Awards 2016 – Green Mark CertificationChina Square Central
Eco-Office Certification by Singapore Environmental Council• Alexandra Technopark
(2015 – 2017)• China Square Central
(2015 – 2017)• Alexandra Point (2015 – 2017)• Valley Point (2015 – 2017)• 51 Cuppage Road (2015 – 2017)
Biz-Safe Enterprise Level Star Award by Workplace Safety And Health Council• Alexandra Technopark
(2014 – 2017)• China Square Central
(2014 – 2017)
• Alexandra Point (2014 – 2017)• Valley Point (2014 – 2017)• 51 Cuppage Road (2014 – 2017)• Robertson Walk (2014 – 2017)
Biz-Safe Partner Award by Workplace Safety And Health Council• Alexandra Technopark
(2016 – 2018)• China Square Central
(2016 – 2018)• Alexandra Point (2016 – 2018)• Valley Point (2016 – 2018)• 51 Cuppage Road (2016 – 2018)• Robertson Walk (2016 – 2018)
Basic Certification for Water Efficient Building by Public Utilities Board• Causeway Point• East Point Mall• Northpoint Shopping Centre• The Centrepoint
Outstanding Individual Award – National Safety & Security Watch Group, Singapore Police ForceNorthpoint Shopping Centre
Commendation Award – National Safety & Security Watch Group, Singapore Police ForceBedok Point
AUSTRALIAFRASERS PROPERTY AUSTRALIA
ICSC 2015 Asia Pacific Shopping Center Awards – Sustainability Design (Design & Development) – Gold MedalThe Ponds Shopping Centre
Lachlan Macquarie Award by 2015 National Architecture AwardsThe Brewery Yard, Central Park
AN
NU
AL
RE
PO
RT
20
16
131

Housing Industry Association NSW Awards 2016 – Best Townhouse/Villa over 10 dwellingsSquire Terraces at Putney Hill, won by Strongbuild
Master Builders Association of NSW Excellence in Construction Awards – Residential & Mixed-Use $50-$100MThe Steps, Central Park
Master Builders Association of NSW Excellence in Construction Awards – Retail Buildings: New Building $10-$20MCentral Park Mall, Central Park
Master Builders Association of NSW Excellence in Construction Awards – Home Units up to $300,000Figtree, Putney Hill
Master Builders Association of NSW Excellence in Construction Awards – Retail $20-$30MThe Ponds Shopping Centre
2015 Green Globe Awards – Built Environment Sustainability: Commercial Properties – Highly CommendedThe Ponds Shopping Centre
National Energy Efficiency Awards 2015 – Best Commercial Building Efficiency Project – Highly CommendedThe Ponds Shopping Centre
Future Green Leader – Winner by Green Building Council of AustraliaOlivia Leal-Walker
2016 UNESCO Asia-Pacific Awards for Cultural Heritage Conservation – New Design in Heritage Contexts – Winner The Brewery Yard
2016 NSW Landscape Architecture Awards – Parks and Open Space Fairwater
Urban Development Institute of Australia (UDIA) NSW Awards for Excellence 2016 – Excellence in Residential DevelopmentFairwater
Urban Development Institute of Australia (UDIA) NSW Awards for Excellence 2016 – Excellence in Environmental Technology & SustainabilityFairwater
Urban Development Institute of Australia (UDIA) NSW Awards for Excellence 2016 – Excellence in Retail DevelopmentThe Ponds Shopping Centre
Urban Development Institute of Australia (UDIA) NSW Awards for Excellence 2016 – Excellence in Mixed-Use DevelopmentDiscovery Point
2016 Chicago Athenaeum International Architecture Awards (Global) – New Buildings and Urban Planning The Brewery Yard, Central Park
Good Design Award – Architectural Design, Urban Design & Public SpacesKensington Street, awarded to Turf Design Studio, Jeppe Aagaard Andersen, Tonkin Zulaikha Greer and Paul Davies & Associates
Good Design Award – Architectural Design, Commercial and Residential ArchitectureOne Central Park
Asia Hotel Design Awards 2016 – Architecture of the YearThe Old Clare Hotel, Central Park
Urban Development Institute of Australia National Awards for Excellence 2016 – Masterplanned DevelopmentDiscovery Point
FRASERS LOGISTICS AND INDUSTRIAL TRUST
SIAS Investors’ Choice Awards 2016 – Most Transparent Company Award, New Issues Category – Runner-up Frasers Logistics and Industrial Trust
HOSPITALIT YHOSPITALITY
World Travel Awards – World’s Leading Serviced Apartments Brand 2014 – 2016 Frasers Hospitality Pte Ltd
World Travel Awards – England's Leading Serviced Apartment Brand 2014 – 2016 Frasers Hospitality Pte Ltd
World Travel Awards – Hungary's Leading Serviced Apartment Brand 2013 – 2016 Frasers Hospitality Pte Ltd
Business Traveller Asia-Pacific Awards 2016 – Best Luxury Serviced Residence BrandFrasers Hospitality Pte Ltd
Expatriate Management and Mobility Awards – Corporate Housing Provider of the Year 2016 – Runner up Frasers Hospitality Pte Ltd
China Travel & Meetings Industry Awards – Serviced Apartment Provider of the YearFrasers Hospitality Pte Ltd
Best Serviced Apartment Operator 2013 - 2016 by Travel Trade Gazette (TTG)Frasers Hospitality Pte Ltd
HRM Asia Readers Choice Awards – Best Serviced Apartment GroupFrasers Hospitality Pte Ltd
AWARDS AND ACCOLADES
FR
AS
ER
S C
EN
TR
EP
OIN
T L
IMIT
ED
& S
UB
SID
IAR
IES
132

Expatriate Management and Mobility Awards – Corporate Housing Provider of the Year 2016 – Highly commendedFrasers Hospitality Pte Ltd
World Travel Awards – World’s Leading Serviced Apartments 2016Fraser Suites Kensington, London
World Travel Awards – Bahrain’s Leading Serviced Apartments 2013 – 2016 Fraser Suites Bahrain
World Travel Awards – Hungary's Leading Serviced Apartments 2013 – 2016 Fraser Residence Budapest
World Travel Awards – Europe's Leading Serviced Apartments 2016 Fraser Suites Kensington, London
World Travel Awards – England's Leading Serviced Apartments 2016 Fraser Suites Kensington, London
Best Smaller Hotel Chain by Business Traveller Awards 2016Hotel du Vin
Golden Pillow Award of China's Hotels 2016 – China's Best Serviced ResidenceModena by Fraser Putuo Shanghai
2016 Experts' Choice Award by TripExpertFraser Place Kuala Lumpur
HRM Asia Readers Choice Awards – Best Business Hotel Capri by Fraser, Changi City, Singapore
Australian Hotels Association Awards – Best Apartment/Suite Accommodation Hotel of the Year Fraser Suites Perth
Best Apartment/Suite Hotel of the Year by Tourism Accommodation AustraliaFraser Suites Sydney
Outstanding Serviced Apartment Group by That’s BeijingFrasers Hospitality Pte Ltd
Outstanding Experience for Best Host Award Year 2015-16 by TravelGuru.comFraser Suites New Delhi
Luxury Travel Guide Awards – Luxury Apartments of the YearFraser Suites New Delhi
Certificate of Excellence 2016 by Trip Advisor• Fraser Suites Sydney• Fraser Suites Perth• Fraser Suites Singapore• Fraser Suites Sukhumvit• Fraser Suites Chengdu• Fraser Suites Guangzhou• Fraser Suites Top Glory
Shanghai• Fraser Suites Insadong, Seoul• Fraser Suites CBD Beijing• Fraser Suites Seef Bahrain• Fraser Suites Diplomatic Area
Bahrain• Fraser Suites Dubai• Fraser Suites Queens Gate• Fraser Suites Edinburgh• Fraser Suites Glasgow• Fraser Suites Harmonie Paris La
Defense• Fraser Suites Le Claridge
Champs-Elysees• Fraser Place Robertson Walk,
Singapore• Fraser Place Kuala Lumpur• Fraser Place Manila• Fraser Place Shekou, Shenzhen• Fraser Place Namdaemun, Seoul• Fraser Place Central Seoul• Fraser Place Anthill Istanbul• Fraser Place Canary Wharf• Fraser Residence Kuala Lumpur• Fraser Residence Sudirman
Jakarta• Fraser Residence Menteng Jakarta• Fraser Residence CBD East Beijing• Fraser Residence Shanghai• Fraser Residence Budapest• Modena by Fraser Zhuankou
Wuhan• Modena by Fraser Putuo Shanghai
• Capri by Fraser, Brisbane, Australia
• Capri by Fraser, Changi City, Singapore
• Capri by Fraser, Kuala Lumpur, Malaysia
• Capri by Fraser, Ho Chi Minh City, Vietnam
• Capri by Fraser, Barcelona, Spain
Travellers’ Choice 2016 by Trip Advisor• Fraser Suites Singapore• Fraser Suites Chengdu• Fraser Place Kuala Lumpur• Fraser Residence Nankai Osaka• Fraser Residence Budapest• Capri by Fraser, Kuala Lumpur,
Malaysia
FRASERS HOSPITALITY TRUST
Singapore Corporate Awards 2016 – Best Annual Report, REITS and Business Trusts category – Merit Frasers Hospitality Trust
INTERNATIONAL CHINA
Sichuan Province Customer Satisfaction Construction Project by Sichuan Province Quality Association A-Space World Plot 4B, Chengdu Logistics Hub
Sichuan Province Construction Decoration Award by Sichuan Province Construction Industry Association A-Space World Plot 3, Chengdu Logistics Hub
Jinrong Cup of Chengdu City Construction Decoration Project by Chengdu City Construction Decoration Association A-Space World Plot 3, Chengdu Logistics Hub
AN
NU
AL
RE
PO
RT
20
16
133

ENTERPRISE-WIDE RISK MANAGEMENT
Enterprise-wide Risk Management (ERM) is an integral part of the business strategy of FCL and its subsidiaries (collectively, the Group). The Group maintains a risk management system to proactively manage risks both at the strategic and operational level to support the achievement of its business objectives and corporate strategies. Through active risk management, Management creates and preserves value for the Group.
The Board of Directors is responsible for governing risks across the Group and ensuring that Management maintains a sound system of risk management and internal controls. It is assisted by the Risk Management Committee (RMC) to oversee the Group’s ERM Framework, determine the risk appetite, assess the Group’s risk profile, material risks, and mitigation plans, and ensuring the effectiveness of risk management policies and procedures. The RMC, which comprises members of the Board, meets regularly to deliberate material risk issues at the Board level. All material risks and risk issues are reported to the RMC for review.
The Group’s risk tolerance statements and risk thresholds have been developed by Management, and approved by the RMC on behalf of the Board. The risk tolerance statements set out the nature and extent of the significant risks that the Group is willing to take in achieving its strategic objectives. The accompanying risk tolerance thresholds, which set the risk boundaries in various strategic and operational areas, are reviewed and monitored closely by the Management. Any risk that has escalated beyond its threshold will be highlighted and addressed, and reported to the RMC.
RISK MANAGEMENT PROCESS
To facilitate a consistent and cohesive approach to ERM, a risk management framework and process have been developed. FCL adopts a robust risk management framework to maintain a high level of corporate discipline and governance. The risk management process is implemented by the Management for the identification and management of risks of the Group. The process consists of risk identification, risk assessment and evaluation, risk treatment, risk monitoring and reporting.
The ERM framework links the Company’s risk management process with the Group’s strategic objectives and operations. Risks are identified and assessed, and mitigating measures developed to address and manage those risks. The ERM framework and process are summarised in an ERM policy for employees.
The risk management process is integrated and coordinated across the businesses of the Group. The ERM framework and processes apply to all business units in the Group. The risk ownership lies with the heads of the respective business units who review risks and mitigating measures every quarter. They are responsible for the development, implementation and practice of ERM within the business unit. Risks that have a material impact on the business units are identified and assessed. The risk exposures and potential mitigating measures are tracked in a risk register maintained in a web-based Corporate Risk Scorecard system. Where applicable, Key Risk Indicators are established to provide an early warning signal to monitor risks. Key material risks and their associated mitigating measures are consolidated at the Group level and reported to the RMC.
The Group proactively manages risks at its operational level. Control self-assessment, which promotes accountability and risk ownership, is implemented for several key business processes. The Group also has in place a Comfort Matrix framework, which provides an overview of the mitigating strategies, and assurance processes of key financial, operational, compliance and information technology risks.
FR
AS
ER
S C
EN
TR
EP
OIN
T L
IMIT
ED
& S
UB
SID
IAR
IES
134

An ERM validation is held at the Management level annually. The heads of business units provide assurance to the Group Chief Executive Officer and Chief Financial Officer that key risks at the business unit level have been identified and the mitigating measures are effective and adequate. The result of the ERM validation for the financial year ended 30 September 2016 was reported and presented to the RMC. At this annual ERM validation, Management provided assurance that the risk management system implemented in the Group is adequate and effective to address risks that are considered relevant and material to the Group’s operations.
The Group enhances its risk management culture through various risk management activities. Risk awareness briefings are conducted for all levels during staff orientation. Refresher sessions are also organised for existing staff when required. Periodic discussions of risks and risks related issues are held at the business unit level where emerging risks are identified and managed.
FCL seeks to improve its risk management processes on an ongoing basis. The Group’s risk management system is benchmarked against the market practice. During the financial year, the Group enhanced its business continuity management capability and operational resilience by establishing a Business Continuity Management Policy to guide the business units in the implementation of business continuity plans. The business continuity plan allows the Group to react to disruptions while continuing with critical business functions. The business continuity effort is overseen by the Business Continuity Management Committee comprising members from the key heads of department.
KEY RISKS
The Management has been actively monitoring the key material risks that affect the Group. Some of the key risks that the Group is exposed to include:
Country Risks (Economic, Political and Regulatory Risks)With diversified worldwide operations, FCL is exposed to developments in major economies and key financial and property markets. The risk of adverse changes in the global economy can reduce profits, result in revaluation losses and affect the Group’s ability to sell its residential development stock.
Changes in regulatory policies may also result in higher operating and investment costs, loss in productivity and disruptions to business operations.
The Group adopts a prudent approach in selecting locations for its investment to mitigate these risks. Measures are in place to monitor the markets closely, such as through maintaining good working relationships and engaging with local authorities, business associations and local contacts, and reviewing expert opinions and market indicators, to keep abreast of economic, political and regulatory changes. Particular emphasis is placed on regulatory compliance in the Group’s operations.
Financial RiskFCL has global operations and has exposure to financial risks such as foreign exchange risk, interest rate risk and liquidity risk. The Group uses derivatives, a mix of fixed and floating rate debt with varying tenors as well as other financial instruments to hedge against foreign exchange and interest rate exposure. Policies and processes are in place to facilitate the monitoring and management of these risks in a timely manner.
To manage liquidity risk, the Group monitors cash flow and maintains sufficient cash or cash equivalents as well as secures funding through multiple sources to ensure that financing, funding, and repayment of debt obligation are fulfilled. The Group’s financial risk management is discussed in more detail in the notes to the financial statements on pages 180 to 303.
AN
NU
AL
RE
PO
RT
20
16
135

Human Capital Risk The Group views its human capital as a key factor for driving growth. As such, managing talent recruitment, succession planning, staff turnover, retention of key personnel and maintenance of a conducive work environment are important to the Group. In view of these considerations, the Human Resources team has developed and implemented effective reward schemes, corporate wellness programmes and staff development initiatives. Details on the various programmes and initiatives can be found in the Sustainability Report section of the Annual Report on pages 72 to 130.
Fraud and Corruption RiskThe Group does not condone any acts of fraud, corruption or bribery by employees in the course of its business activities. The Group has put in place various policies and guidelines, including a Code of Business Conduct and an Anti-Bribery policy to guide the employees on business practices, standards and conduct expected in the course of their employment with the Group. A Whistle-Blowing Policy is also put in place to provide a clearly defined process and independent feedback channel for employees to report any suspected improprieties in confidence and in good faith, without fear of reprisal. The Audit Committee reviews and ensures that independent investigations and appropriate follow-up actions are carried out. More details can be found in the Corporate Governance Section on pages 137 to 165.
Information Technology (IT) RiskThe Group places a high priority on information availability, IT governance and IT security. It has put in place group-wide IT policies and procedures to address evolving IT security threats, such as hacking, malware, mobile threats and data loss. Disaster recovery plans and incident management procedures are developed and tested annually. Measures and considerations have also been taken to safeguard against loss of information, data security, and prolonged service unavailability of critical IT systems. Periodic training is also conducted for new and existing employees to raise IT security awareness. External professional services are engaged to conduct independent vulnerability assessment and penetration tests to further strengthen the IT systems.
Environmental, Health & Safety (EHS) RisksFCL places importance in managing EHS risks in its international operations. It has put in place an EHS policy and EHS Management System in key operation areas to manage the risks. The Group has achieved OHSAS 18001 and ISO14001 certification for some of its key operations. It aims to widen the coverage of both Occupational Health & Safety and Environment Management System to further areas of operations in the future. The Group also manages the environment risks by setting targets in reducing greenhouse gas emission, energy usage and water consumption within its investment portfolio. More details can be found in the Sustainability Report section of the Annual Report on pages 72 to 130.
ENTERPRISE-WIDE RISK MANAGEMENT
FR
AS
ER
S C
EN
TR
EP
OIN
T L
IMIT
ED
& S
UB
SID
IAR
IES
136

AN
NU
AL
RE
PO
RT
20
16
137
CORPORATE GOVERNANCE
Good corporate governance is essential to the success of Frasers Centrepoint Limited’s (“FCL” or the “Company”) businesses and performance. FCL is firmly committed to setting and maintaining high standards of corporate governance and corporate transparency, and adheres to sound corporate policies, business practices and system of internal controls. Operating within such a framework allows FCL to safeguard the assets of FCL and its subsidiaries (the “Group”) and interests of shareholders of the Company (the “Shareholders”) whilst pursuing sustainable growth and enhancement of corporate performance and value for Shareholders.
Listed on 9 January 2014 on Singapore Exchange Securities Trading Limited (the “SGX-ST”), the Company adheres closely to the principles, guidelines and recommendations of the Code of Corporate Governance 2012 (the “Code 2012”).
A. BOARD MATTERS
Principle 1: The Board’s Conduct of Affairs
The board of directors of the Company (the “Board”) is entrusted with oversight of the business performance and affairs of FCL, and is responsible for the Group’s overall entrepreneurial leadership, strategic direction, risk appetite, performance objectives and long-term success. The Board is also responsible for aligning the interests of the Board and the management of the Company (the “Management”) with that of the Shareholders as well as setting good principles of ethics and values.
The Board also (a) reviews annual budgets, financial plans, major acquisitions and divestments, funding and investment proposals, (b) monitors the financial performance of the Group and the Management’s performance, (c) oversees processes for evaluating the adequacy of internal controls, risk management, financial reporting and compliance, (d) assumes responsibility for corporate governance, (e) considers sustainability issues such as environmental and social factors as part of its strategic formulation, and (f) ensures compliance by the Group with relevant laws and regulations.
Delegation of Authority on certain Board Matters
In order for the Board to efficiently discharge its oversight function of FCL, it delegates specific areas of responsibilities to five board committees (the “Board Committees”) namely, the Board Executive Committee (“EXCO”), the Audit Committee (“AC”), the Nominating Committee (“NC”), the Remuneration Committee (“RC”) and the Risk Management Committee (“RMC”). Each Board Committee is governed by clear Terms of Reference which have been approved by the Board. Minutes of all Board Committee meetings are circulated to the Board so that directors of the Company (the “Directors”) are aware of and kept updated as to the proceedings and matters discussed during such meetings.
Corporate Authorisations
The Company adopts a framework of delegated authorisations in its Manual of Authority (“MOA”). The MOA defines the procedures and levels of authorisation required for specified transactions. It also sets out approval limits for operating and capital expenditure as well as acquisitions and disposals of assets and investments. The MOA also contains a schedule of matters specifically reserved to the Board for approval. These include approval of annual budgets, financial plans, business strategies and material transactions, such as major acquisitions, divestments, funding and investment proposals. The MOA authorises the EXCO to approve certain transactions up to specified limits, beyond which the approval of the Board needs to be obtained. Below the Board and EXCO levels, there are appropriate delegation of authority and approval sub-limits at the Management level, to facilitate operational efficiency.

FR
AS
ER
S C
EN
TR
EP
OIN
T L
IMIT
ED
& S
UB
SID
IAR
IES
138
CORPORATE GOVERNANCE
Under the MOA, the following matters are specifically reserved for the approval of the Board:
(1) acquisition of land and properties, redevelopment of existing assets, refurbishment of existing assets, disposal of land and properties and the incurring of unbudgeted capital and development expenditure, where these exceed a value of $1 billion;
(2) new equity investments, increase in equity participation, and disposal or reduction of equity participation, where these exceed a value of $600 million;
(3) approval of the annual capital budget, annual operating budget and staff costs budget;(4) the sales or disposal of the whole or substantially the whole of the undertaking or assets of the Company; and(5) the appointment of Board Committees or Board sub-committees or the determination, amendment or alteration
of the terms of reference (the “Terms of Reference”) of any Board Committees or Board sub-committees.
Conflicts of Interest
To address and manage possible conflicts of interest that may arise between Directors’ interests and those of the Group, the Company has put in place appropriate procedures including (i) requiring any Director to declare any conflict of interest on a transaction or proposed transaction with the Group as soon as practicable after the relevant facts have come to his knowledge; and (ii) requiring such Directors to refrain from participating in meetings or discussions (or relevant segments thereof), in addition to abstaining from voting, on any matter in which they are so interested or conflicted. For purchases of property in FCL property projects, there is also a policy which sets out the process and procedure for disclosing, reporting and obtaining of relevant approvals for property purchases made by any Director, the CEO or any other interested persons (as defined in the SGX-ST Listing Manual) and employees of the Group.
Meetings of the Board and Board Committees
The Board and its various Board Committees meet regularly, and also as required by business needs or if their members deem it necessary or appropriate to do so. For the financial year ended 30 September 2016, the Board met six times. During Board meetings, the Directors actively participate, discuss, deliberate and appraise matters requiring their attention and decision. Time is set aside, where appropriate, after scheduled Board meetings for discussions amongst the Directors without the presence of the Management, so as to facilitate a more effective check on the Management.
The Directors are also given direct access to the management team of the Group’s business divisions through presentations at Board and Board Committee meetings. Where required or requested by Board members, site visits and meetings with personnel from the Group’s business divisions are also arranged for Directors to have an intimate understanding of the key business operations of each division and to promote active engagement with the Group’s key Management. The Company’s Constitution provide for Board members who are unable to attend physical meetings to participate through telephone conference, video conference or any other forms of electronic or instantaneous communication facilities.

AN
NU
AL
RE
PO
RT
20
16
139
CORPORATE GOVERNANCE
The number of Board meetings and Board Committee meetings held in the financial year ended 30 September 2016 and the attendance of Directors at these meetings are as follows:
BoardBoard
EXCO
Audit
Committee
Risk
Management
Committee
Remuneration
Committee
Nominating
Committee
Meetings held for the financial year ended 30 September 2016
6 5 7 4 6 2
Mr Charoen Sirivadhanabhakdi 6 5 – – – –Khunying Wanna Sirivadhanabhakdi 6 – – – – –Mr Charles Mak Ming Ying 6 5 7 4 6 2Mr Chan Heng Wing 6 – – 4 – 2Mr Philip Eng Heng Nee 6 – 7 – 6 –Mr Wee Joo Yeow 6 4 7 – – –Mr Weerawong Chittmittrapap 6 – – 4 – 2Mr Chotiphat Bijananda 6 5 – 4 – 1Mr Panote Sirivadhanabhakdi 6 5 – 4 6 –Mr Sithichai Chaikriangkrai 6 5 7 4 – –
Director Orientation and Training
Upon appointment, each new Director is issued a formal letter of appointment setting out his or her duties and obligations, including his or her responsibilities as fiduciaries, and where appropriate, incorporating processes to deal with possible conflicts of interest that may arise. A comprehensive orientation programme is also conducted to familiarise new appointees with the business activities, strategic directions, policies, key business risks, the regulatory environment in which the Group operates, corporate governance practices of the Group, as well as their statutory and other duties and responsibilities as directors. This programme allows new Directors to get acquainted with senior Management, and fosters better rapport and facilitate communications with the Management.
The Directors are kept continually and regularly updated on the Group’s businesses and the regulatory and industry-specific environments in which the entities of the Group operate. Updates on relevant legal, regulatory and technical developments may be in writing or disseminated by way of presentations and/or handouts. The Board is also regularly updated on the latest key changes to any applicable legislation and changes to the rules of the SGX-ST (the “Listing Rules”) as well as developments in accounting principles, by way of briefings held by the Company’s lawyers and auditors. To ensure the Directors can fulfil their obligations and to continually improve the performance of the Board, all Directors are encouraged to undergo continual professional development during the term of their appointment. In addition, the Directors are also encouraged to be members of the Singapore Institute of Directors (“SID”) and for them to receive journal updates and training from SID to stay abreast of relevant developments in financial, legal and regulatory requirements, and the business environment and outlook. During the financial year ended 30 September 2016, the Board was updated on recent changes to the Companies Act, Chapter 50 and the SGX-ST Listing Manual.

FR
AS
ER
S C
EN
TR
EP
OIN
T L
IMIT
ED
& S
UB
SID
IAR
IES
140
CORPORATE GOVERNANCE
Principle 2: Board Composition and Guidance
Board Composition
As of 30 September 2016, the Board comprise 10 non-executive Directors(1). No alternate directors have been appointed on the Board for the financial year ended 30 September 2016. The current composition of the Board provides an appropriate balance and mix of skills, experience and knowledge relevant to the Group, and is well-diversified in terms of age group, gender and nationality. They are:
Mr Charoen Sirivadhanabhakdi (Chairman)(2)
Khunying Wanna Sirivadhanabhakdi (Vice-Chairman)(2) Mr Charles Mak Ming Ying(3) (6)
Mr Chan Heng Wing(2) (4)
Mr Philip Eng Heng Nee(3)
Mr Wee Joo Yeow(5)
Mr Weerawong Chittmittrapap(3)
Mr Chotiphat Bijananda(2)
Mr Panote Sirivadhanabhakdi(2) (4)
Mr Sithichai Chaikriangkrai(5)
Notes:(1) With effect from 1 October 2016, Mr Panote Sirivadhanabhakdi was appointed as the Group Chief Executive Officer, resulting in the composition
of the Board of Directors to comprise nine non-executive Directors and one executive Director as of 1 October 2016.(2) Mr Charoen Sirivadhanabhakdi, Khunying Wanna Sirivadhanabhakdi, Mr Chan Heng Wing, Mr Chotiphat Bijananda and Mr Panote Sirivadhanabhakdi,
were re-appointed to the Board at the annual general meeting of the Company held on 29 January 2016. (3) Mr Charles Mak Ming Ying, Mr Philip Eng Heng Nee, Mr Wee Joo Yeow and Mr Weerawong Chittmittrapap were re-appointed to the Board at the
annual general meeting of the Company held 30 January 2015.(4) With effect from 1 October 2016, Mr Panote Sirivadhanabhakdi has stepped down as a member of the RC of the Company and Mr Chan Heng
Wing, a non-executive Independent Director of the Company, was appointed as a member of the RC in his place. (5) Mr Sithichai Chaikriangkrai was re-appointed to the Board at the annual general meeting of the Company held on 7 January 2014.(6) Mr Charles Mak Ming Ying was appointed as the Lead Independent Director to the Board on 8 May 2015.
The current Board comprise five independent directors (the “Independent Directors”), namely, Mr Charles Mak Ming Ying, Mr Chan Heng Wing, Mr Philip Eng Heng Nee, Mr Wee Joo Yeow and Mr Weerawong Chittmittrapap. Based on declarations of independence made by each of these Independent Directors, none of them has any relationship with the Company, its related corporations(1), the Group’s 10% Shareholders(2) or FCL’s officers that could interfere, or be reasonably be perceived to interfere, with the exercise of each of their independent business judgment with a view to the best interests of the Company. These five Independent Directors will help to uphold good corporate governance at the Board level and their presence will facilitate the exercise of independent and objective judgment on corporate affairs. Their participation and input will also ensure that key issues and strategies are critically reviewed, constructively challenged, fully discussed and thoroughly examined, and takes into account the long-term interests of FCL and its Shareholders. As of 30 September 2016, none of the Independent Directors have been on the Board for more than nine years.
Notes:(1) The Code 2012 defines “related corporations” as having the same meaning under the Companies Act, Chapter 50 i.e. a corporation that is the
company’s holding company, subsidiary or fellow subsidiary.(2) The Code 2012 defines a ten percent (10%) shareholder as a person who has an interest or interests in one or more voting shares in the company
and the total votes attached to that share, or those shares, is not less than ten percent (10%) of the total votes attached to all the voting shares in the company.
The NC is of the view that the current size and composition of the Board is appropriate for the scope and nature of the Group’s operations, and facilitates effective decision-making. In line with the Code 2012, taking into account the requirements of the Group’s businesses and the need to avoid undue disruptions from changes to the composition of the Board and the Board Committees, the NC is of the view that the current size of the Board is not so large as to be unwieldy, or as would interfere with efficient decision-making. No individual or group dominates the Board’s decision-making process.

AN
NU
AL
RE
PO
RT
20
16
141
CORPORATE GOVERNANCE
The Directors are provided with accurate, complete and timely information and have direct and unrestricted access to the Management. This gives the Board and the Board Committees sufficient time to critically evaluate and consider issues relevant to the Company and its businesses and operations, and also allows the Directors to effectively carry out their duties and discharge their oversight function.
As of 1 October 2016, Mr Panote Sirivadhanabhakdi was appointed as the Group Chief Executive Officer of the Company (the “Group CEO”). Mr Panote Sirivadhanabhakdi is an immediate family member of the Chairman of the Board. The Company notes that it is in compliance with Guideline 2.2 of the Code 2012, as its Independent Directors makes up half of the Board when the Chairman and the Group CEO are immediate family members.
Board Executive Committee (or EXCO)
The current EXCO is made up of the following members:
Mr Charoen Sirivadhanabhakdi(1) ChairmanMr Charles Mak Ming Ying(1) Vice-ChairmanMr Chotiphat Bijananda(1) Vice-ChairmanMr Wee Joo Yeow(2) MemberMr Panote Sirivadhanabhakdi(1) Member
Mr Sithichai Chaikriangkrai(1) Member
Notes:(1) Mr Charoen Sirivadhanabhakdi, Mr Charles Mak Ming Ying, Mr Chotiphat Bijananda, Mr Panote Sirivadhanabhakdi and Mr Sithichai Chaikriangkrai
were appointed to the EXCO on 25 October 2013. (2) Mr Wee Joo Yeow was appointed to the EXCO on 10 March 2014.
The EXCO assumes oversight of the business affairs of FCL and is empowered to exercise the full powers and authority of the Board when the Board does not meet except in respect of matters that specifically require the decision of the Board or any Board Committee. The EXCO formulates the Group’s strategic development initiatives, provides direction for new investments and material financial and non-financial matters to ensure that the Group achieves its desired performance objectives and enhances long-term shareholder value, and oversees the Company’s and the Group’s conduct of business and corporate governance structure. It assists the Board in enhancing its business strategies and contributes towards the strengthening of core competences of the Group.
The EXCO is also empowered to take all possible measures to protect the interests of the Group, review and approve major transactions subject to any specified limits, review and approve corporate values, corporate strategy and corporate objectives, review and approve policies for financial and human resource management, and review both the financial and non-financial performance of the Company and the Group. The EXCO reviews and provides recommendations on matters requiring Board approval, such as country or business strategic matters, business plans, the annual budget, capital structure, dividend policy, investments and divestments. The powers delegated to the EXCO facilitates the decision-making process and allows for quicker response time.
The activities and responsibilities of other Board Committees are described in the following sections of this report.
Board Diversity
The Board views diversity at the Board level as an essential element for driving value in decision- making and proactively seeks as part of its diversity policy, to maintain an appropriate balance of expertise, skills and attributes among the Directors. This is reflected in the diversity of backgrounds and competencies of the Directors, whose competencies range from banking, finance, accounting and legal to relevant industry knowledge, entrepreneurial and management experience, and familiarity with regulatory requirements and risk management. This is beneficial to the Company and the Management as decisions by, and discussions with, the Board would be enriched by the broad range of views and perspectives and the breadth of experience of the Directors. The NC is of the view that there is an appropriate balance of expertise and skills amongst the Directors as they collectively bring with them a broad range of complementary competencies and experience.

FR
AS
ER
S C
EN
TR
EP
OIN
T L
IMIT
ED
& S
UB
SID
IAR
IES
142
CORPORATE GOVERNANCE
Principle 3: Chairman and Chief Executive Officer
As at 30 September 2016, the Chairman and the Group CEO, Mr Lim Ee Seng, are separate persons to ensure an appropriate balance and separation of power and authority, and clear division of responsibilities and accountability. The Chairman, who is non-executive, is not related to the Group CEO and neither is there any business relationship between them. Likewise, none of the chief executive officers of the Group’s business divisions and the Group CEO are related to each other, and neither is there any other business relationship between or among them.
As of 1 October 2016, Mr Panote Sirivadhanabhakdi was appointed as the Group CEO. Mr Panote Sirivadhanabhakdi is an immediate family member of the Chairman of the Board. The Company notes that it is in compliance with Guideline 3.3 of the Code 2012 with the appointment of the Lead Independent Director as described below.
The Chairman leads the Board and ensures its effectiveness by, among other things, steering effective, productive and comprehensive discussions amongst Board members and the Management team on strategic, business and other key issues pertinent to the business and operations of the Group. In addition, the Chairman promotes a culture of openness and debate at the Board and ensures, with the support of the company secretary of FCL (the “Company Secretary”), that Directors are provided with clear, complete and timely information in order to make sound, informed decisions.
The Chairman encourages active and effective engagement, participation by and contribution from all Directors, and facilitates constructive relations among and between them and the Management. With the full support of the Board, the Company Secretary and the Management, the Chairman will spur the Company to promote, attain and maintain highest standards of corporate governance and transparency. With the help of FCL’s corporate services, he also sees to it that there is overall effective communications to and with Shareholders on the performance of the Group. In turn, the CEOs of the Group’s business divisions are responsible for executing the Group’s strategies and policies, and are accountable to the Board for the conduct and performance of the respective business operations under their charge.
Lead Independent Director
Mr Charles Mak Ming Ying, who has been an Independent Director of the Company since 25 October 2013, was appointed as Lead Independent Director on 8 May 2015. The Lead Independent Director is available to Shareholders where they have concerns for which contact through the normal channels of the Chairman, the Group CEO and the chief financial officer of the Company (the “CFO”) is not available.
The Lead Independent Director represents the Independent Directors in responding to Shareholders’ questions that are directed to the Independent Directors as a group, and has the authority to call for meetings of the independent directors, where necessary and appropriate, and to provide feedback to the Chairman after such meetings.
Principle 4: Board Membership
Nominating Committee
The Nominating Committee (or NC) is made up of the following Directors:
Mr Weerawong Chittmittrapap ChairmanMr Charles Mak Ming Ying MemberMr Chan Heng Wing MemberMr Chotiphat Bijananda Member
A majority of the members of this Board Committee, including the Chairman, are independent non-executive Directors. The Lead Independent Director, Mr Charles Mak Ming Ying, is a member of the NC.

AN
NU
AL
RE
PO
RT
20
16
143
CORPORATE GOVERNANCE
The NC is guided by written Terms of Reference approved by the Board and which set out the duties and responsibilities of the NC. The NC’s responsibilities include reviewing the structure, size and composition of the Board, identifying the balance of skills, knowledge and experience required for the Board to discharge its responsibilities effectively, and for nominated candidates to meet the needs and requirements of the Group.
The NC will assess from time to time the independence of each Director, the performance of the Board as a whole, and the contribution of each Director to the effectiveness of the Board. The NC is also required to determine whether Directors who hold multiple board representations are able to and have been devoting sufficient time to discharge their responsibilities adequately.
Annual Review of Directors’ Time Commitments
The Code 2012 requires listed companies to fix the maximum number of board representations on other listed companies that their directors may hold and to disclose this in their annual report. Details of such directorships and other principal commitments of the Directors may be found on pages 12 to 16.
The NC determines annually whether a Director with other listed company board representations and/or other principal commitments is able to and has been adequately carrying out his duties as a director of the Company. In determining whether each Director is able to devote sufficient time and attention to discharge his or her duties, the NC has taken cognizance of the Code 2012 requirement, but is of the view that its assessment should not be restricted to the number of board representations of each Director – and their respective principal commitments – per se. Holistically, the contributions by the Directors to and during meetings of the Board and relevant Board Committees, the value the Directors bring to the Company when they are involved in other boards, the personal capabilities of the Directors, as well as their attendance at such meetings are also taken into account. The NC noted that based on the attendance of Board and Board Committee meetings during the year, all the Directors were able to participate in at least a substantial number of such meetings to carry out their duties. The NC was therefore satisfied that in FY2016, where a Director had other listed company board representations and/or other principal commitments, the Director was able and had been adequately carrying out his duties as a director of the Company.
Process and Criteria for Appointment of New Directors
The NC takes the lead in identifying, evaluating and selecting suitable candidates for new directorships. In its search and selection process, the NC considers factors such as the ability of the prospective candidate to contribute to discussions, deliberations and activities of the Board and Board Committees. It also reviews the composition of the Board – including the mix of expertise, skills and attributes of the Directors – so as to identify needed and/or desired competencies to supplement the Board’s existing attributes. Where it deems necessary or appropriate, the NC may tap on its networking contacts and/or engage external professional headhunters to assist with identifying and shortlisting candidates.
Re-nomination of Directors
The NC also reviews all nominations for appointments and re-appointments to the Board and to the Board Committees, and submits its recommendations for approval by the Board taking into account an appropriate mix of core competencies for the Board to fulfill its roles and responsibilities.
The Company’s Constitution provides that at least one-third of its Directors shall retire from office and are subject to re-election at every annual general meeting of the Company (“AGM”). All Directors are required to retire from office at least once every three years. The NC will assess and evaluate whether Directors retiring at each AGM are properly qualified for reappointment by virtue of their skills, experience and contributions. Newly-appointed Directors during the year must also submit themselves for retirement and re-election at the next AGM immediately following their appointment. The Shareholders approve the appointment or re-appointment of Board members at the AGM.

FR
AS
ER
S C
EN
TR
EP
OIN
T L
IMIT
ED
& S
UB
SID
IAR
IES
144
CORPORATE GOVERNANCE
Independence
The NC determines the independence of each Director annually based on the definitions and guidelines of independence set out in the Code 2012. A Director is considered independent if he has no relationship with the Group or its officers that could interfere, or be reasonably perceived to interfere, with the exercise of his independent business judgement in the best interests of FCL. The Board takes into account the existence of relationships or circumstances, including those identified by the Code 2012, that are relevant in its determination as to whether a Director is independent. Such relationships or circumstances include the employment of a Director by the Company or any of its related corporations during the financial year in question or in any of the previous three financial years; the acceptance by a Director of any significant compensation from the Company or any of its related corporations for the provision of services during the financial year in question or the previous financial year, other than compensation for board service; and a Director being related to any organisation from which FCL or any of its subsidiaries received significant payments or material services during the financial year in question or the previous financial year.
For the financial year ended 30 September 2016, the NC has performed a review of the independence of the Directors as at 30 September 2016 and following its assessment, has determined the status of each Director as follows:
Mr Charoen Sirivadhanabhakdi(1) Non-IndependentKhunying Wanna Sirivadhanabhakdi(1) Non-IndependentMr Charles Mak Ming Ying IndependentMr Chan Heng Wing IndependentMr Philip Eng Heng Nee IndependentMr Wee Joo Yeow IndependentMr Weerawong Chittmittrapap IndependentMr Chotiphat Bijananda(2) Non-IndependentMr Panote Sirivadhanabhakdi(3) Non-IndependentMr Sithichai Chaikriangkrai(4) Non-Independent
Notes:(1) Each of Mr Charoen Sirivadhanabhakdi and Khunying Wanna Sirivadhanabhakdi are directly or indirectly interested in not less than ten percent
(10%) of the total voting shares in the Company through their interests in TCC Assets Limited (“TCCA”) and Thai Beverage Public Company Limited (“ThaiBev”). TCCA has a direct interest of 59.18% in the Company and ThaiBev, through its indirect wholly-owned subsidiary InterBev Investment Limited, holds 28.44% interest in the Company. Mr Charoen Sirivadhanabhakdi is married to Khunying Wanna Sirivadhanabhakdi.
(2) Mr Chotiphat Bijananda is the son-in-law of Mr Charoen Sirivadhanabhakdi and Khunying Wanna Sirivadhanabhakdi and a director of TCCA. (3) Mr Panote Sirivadhanabhakdi being a son of Mr Charoen Sirivadhanabhakdi and Khunying Wanna Sirivadhanabhakdi is an immediate family
member of a ten percent (10%) shareholder of the Company.(4) Mr Sithichai Chaikriangkrai is a director and the chief financial officer of ThaiBev.
Key Information regarding Directors
Key information on the Directors is set out on pages 12 to 16.
Principle 5: Board Performance
The effectiveness of the Board as a whole and the contribution by each Director to the effectiveness of the Board will be assessed annually.
All Directors will be required to assess the performance of the Board and the Board Committees. The assessment cover areas such as Board processes, managing the Company’s performance, effectiveness of the Board and the Board Committees, and Director development.

AN
NU
AL
RE
PO
RT
20
16
145
CORPORATE GOVERNANCE
The Board has implemented formal processes for assessing the effectiveness of the Board and its Board Committees, the contribution by each individual Director to the effectiveness of the Board, as well as the effectiveness of the Chairman of the Board. To ensure that the assessments are done fairly, the Board will appoint an independent third party to facilitate the process of conducting a Board assessment survey from time to time. Ernst & Young LLP has been appointed this year. The Board assessment survey is designed to provide an evaluation of current effectiveness of the Board and to support the Chairman and Board to proactively consider what can enhance the readiness of the Board to address emerging strategic priorities for the Group. As part of the survey, the Directors would be requested to complete an evaluation questionnaire which includes questions on (1) how the Board plays an effective role and adds value on critical issues, (2) how the Board operates to deliver impact and value, and (3) the evaluation of the Board Committees. In particular, the survey will look at the Board’s performance in shaping and adapting strategy, risk and crisis management, overseeing the Group’s performance, CEO performance and succession management and stakeholder communications, as well as areas such as strategic plans and directions, Board composition and structure, the Board’s partnership with the Management and efficiency of Board processes.
In addition to the survey, the contributions and performance of each Director would be assessed by the NC as part of its periodic reviews of the composition of the Board and the various Board Committees. In the process, the NC will identify areas for improving the effectiveness of the Board and the Board Committees. Based on the NC’s review, the Board and the various Board Committees operate effectively and each Director is contributing to the overall effectiveness of the Board.
Principle 6: Access to Information
FCL recognises the importance of providing the Board with accurate and relevant information on a timely basis. The Management provides the Board with detailed Board papers specifying relevant information and commercial rationale for each proposal for which Board approval is sought. Such information includes relevant financial forecasts, risk analyses and assessments, mitigation strategies, feasibility studies and key commercial issues for the Board’s attention and consideration. Reports on major operational matters, business development activities, financial performance, potential investment opportunities and budgets are circulated to the Board periodically.
A calendar of activities is scheduled for the Board a year in advance, with Board papers and agenda items dispatched to the Directors about a week before scheduled meetings as far as possible. This is to give Directors sufficient time to review and consider the matters being tabled and/or discussed so that discussions can be more meaningful and productive. Senior Management from the Company’s business divisions is requested to attend meetings of the Board and the Board Committees in order to provide input and insight into matters being discussed, and to respond to any queries that the Directors may have. The Board also has separate and independent access to the Company’s senior Management and the Company Secretary.
The Company Secretary is responsible for, among other things, ensuring that Board procedures, the Company’s Constitution and relevant rules and regulations, including requirements of the Securities and Futures Act, Chapter 289, the Companies Act, Chapter 50 and the SGX-ST Listing Manual are complied with. The Company Secretary attends all Board meetings, and provides advice and guidance on corporate governance, practices and processes with a view to enhancing long-term shareholder value.
The Company Secretary also facilitates and act as a channel of communications for the smooth flow of information to and within the Board and its various Board Committees, as well as between and with senior Management. Additionally, the Company Secretary solicits and consolidates Directors’ feedback and evaluation from time to time, and arranges for and facilitates orientation programmes for new Directors and assists with their professional development as required. The Company Secretary is the Company’s primary channel of communication with the SGX-ST.
The appointment and removal of the Company Secretary is subject to the approval of the Board. Where it is necessary for the efficacious discharge of their duties, the Directors may seek and obtain independent professional advice at the Company’s expense.

FR
AS
ER
S C
EN
TR
EP
OIN
T L
IMIT
ED
& S
UB
SID
IAR
IES
146
CORPORATE GOVERNANCE
B. REMUNERATION MATTERS
Principle 7: Procedures for Developing Remuneration Policies
Remuneration Committee
As at 30 September 2016, the Remuneration Committee (or RC) is made up of non-executive Directors, the majority of whom, including the Chairman, are Independent Directors. It comprises the following members:
Mr Philip Eng Heng Nee ChairmanMr Charles Mak Ming Ying MemberMr Panote Sirivadhanabhakdi(1) Member
Note:(1) With effect from 1 October 2016, Mr Panote Sirivadhanabhakdi has stepped down as a member of the RC of the Company and Mr Chan Heng
Wing, a non-executive Independent Director of the Company, was appointed as a member of the RC in his place.
The RC’s main responsibility is to assist the Board in establishing a formal and transparent process for developing policies on executive remuneration and development. The RC also reviews remuneration packages and service terms of individual Directors and the Group CEO. When carrying out its duties, the RC reviews and makes recommendations on the remuneration framework for the Board and key management executives (such as the CEOs of the strategic business units of the Company) (the “Key Management Executives”). The RC also oversees the framework for remuneration and other terms of service for other Management personnel of the Company.
Remuneration Framework
The RC reviews on an annual basis the level and mix of remuneration and benefits policies and practices of the Company, where appropriate, including long-term incentives. The RC also reviews and approves the remuneration framework on an annual basis which covers all aspects of remuneration including directors’ fees, salary reviews, allowances, performance bonus, grant of share awards and incentives for Directors and the Key Management Executives of the Group. When conducting such reviews, the RC takes into account the performance of the Company and the Key Management Executives and Directors.
The RC aligns the Group CEO’s leadership – through appropriate remuneration and benefits policies and long-term incentives – with the Company’s strategic objectives and key challenges. Performance targets will also be set for the Group CEO and his performance evaluated yearly.
The RC may from time to time, and where necessary or required, engage external consultants in framing the remuneration policy and determining the level and mix of remuneration for Directors and the Management. Among other things, this helps the Company to stay competitive in its remuneration packages. During the financial year ended 30 September 2016, Hay Group was appointed as remuneration consultants. The Company does not have any relationship with these remuneration consultants which would affect their independence and objectivity.
Principle 8: Level and Mix of Remuneration
In recommending the level and mix of remuneration, the RC seeks to build, motivate and retain Directors and the Key Management Executives. It ensures that competitive remuneration policies and practices are in place to draw and motivate high-performing executives so as to drive the Group’s businesses to greater growth, efficiency and profitability. In its deliberation, the RC takes into consideration industry practices and benchmarks against relevant industry players to ensure that its remuneration and employment conditions are competitive.
The Company’s compensation framework comprises fixed pay and short-term and long-term incentives. The Company subscribes to linking executive remuneration to company and individual performance, based on an annual appraisal of employees and using indicators such as core values, competencies, key result areas, performance rating, and potential of the employees. Long-term incentive schemes are in place to motivate and reward employees and align their interests to maximise long–term shareholder value.

AN
NU
AL
RE
PO
RT
20
16
147
CORPORATE GOVERNANCE
Long Term Incentive Plans
The RC administers the Company’s share-based remuneration incentive plans, namely, the FCL Restricted Share Plan (“RSP”) and the FCL Performance Share Plan (“PSP”)(1).
Note:(1) The RSP and the PSP were approved by the Board and adopted on 25 October 2013.
Through the RSP and the PSP, the Company seeks to foster a greater ownership culture within the Group by aligning more directly the interests of key senior management and senior executives with the interest of the Shareholders, and for such employees to participate and share in the Group’s growth and success.
The RSP is available to a broader base of senior executives compared to the PSP. Its objectives are to increase the Company’s flexibility and effectiveness in its continuing efforts to attract, motivate and retain talented senior executives and to reward these executives for the performance of the Company and that of the individual. The PSP applies to key senior management in key positions who shoulder the responsibility of the Company’s performance and who are able to drive the growth of the Company through superior performance. It serves as further motivation to key senior management in striving for excellence and delivering long-term shareholder value.
Under the RSP and the PSP, the Company grants share-based awards (“Base Awards”) conditional upon pre-determined performance targets being met. These targets are set by the RC in its absolute discretion for the performance conditions to be met over the performance period. The performance period for the RSP and PSP are two years and three years respectively. For the RSP, the pre-set targets are the achievement of Attributable Profit Before Fair Value Adjustment and Exceptional Items and Return on Capital Employed.
For the PSP, the pre-set targets are Return on Invested Capital, Total Shareholders’ Return Relative to FTSE ST Real Estate Index and Absolute Shareholders’ Return as a multiple of Cost of Equity.
The awards represent the right to receive fully paid shares, their equivalent cash value or a combination thereof, free of charge, provided certain prescribed performance conditions are met. The final number of shares to be released will depend on the achievement of the pre-determined targets at the end of the performance period. If such targets are met and/or exceeded, more shares than the Base Awards can be delivered, subject to a maximum percentage of the Base Awards.
The maximum number of Company shares which can be released, when aggregated with the number of new shares issued pursuant to the vesting of awards under the RSP and the PSP will not exceed ten percent (10%) of the issued share capital of the Company.
Policy in Respect of Non-Executive Directors’ Remuneration
The remuneration of non-executive Directors takes into account their level of contribution and their respective responsibilities, being their attendance and time spent at Board meetings and Board Committee meetings. No Director decides his own fees. Directors’ fees will be reviewed periodically to benchmark such fees against the amounts paid by listed industry peers. Each non-executive Director’s remuneration comprises a basic fee, attendance fee and, if the Director is required to travel out of his/her country of residence to attend meetings or events or for any other purpose of the Company, travel allowance. In addition, non-executive Directors who perform additional services in Board Committees are paid an additional fee for such services. The Chairman of each Board Committee is also paid a higher fee compared with the members of the respective committees in view of the greater responsibility carried by that office.
The aggregate Directors’ fees for non-executive Directors is subject to Shareholders’ approval at the AGM. The Chairman and the non-executive Directors will abstain from voting, and will procure their respective associates to abstain from voting in respect of this resolution.

FR
AS
ER
S C
EN
TR
EP
OIN
T L
IMIT
ED
& S
UB
SID
IAR
IES
148
CORPORATE GOVERNANCE
Remuneration Policy in Respect of Executive Directors and Other Key Management Executives
The Company advocates a performance-based remuneration system that is highly flexible and responsive to the market, which also takes into account the Company’s performance and that of its employees. In designing the compensation structure, the RC seeks to ensure that the level and mix of remuneration is competitive, relevant and appropriate in finding a balance between current versus long-term compensation and between cash versus equity incentive compensation. Executives who have a greater ability to influence Group outcomes have a greater proportion of overall reward at risk. The RC exercises broad discretion and independent judgment in ensuring that the amount and mix of compensation are aligned with the interests of the Shareholders and promote the long-term success of the Company.
Performance Indicators for Key Management Executives
As set out above, the Company’s variable remuneration comprises short-term and long-term incentives, taking into account both individual performance and the Company’s performance indicators. In determining the short-term incentives, both Group and strategic business unit financial and non-financial performance are taken into consideration. This is to ensure employees’ remuneration are linked to performance. In awarding individual short-term incentives, the RC also considers individual performance, based on annual appraisals which are based on indicators such as core values, competencies, and key result areas.
In relation to long-term incentives, the Company has implemented the RSP and the PSP as set out above, pursuant to which share-based awards granted to the Key Management Executives are conditional upon performance targets being met. The performance targets of Attributable Profit Before Fair Value Adjustment and Exceptional Items and Return on Capital Employed (in the case of the RSP) and Return on Invested Capital, Total Shareholders’ Return Relative to FTSE ST Real Estate Index and Absolute Shareholders’ Return as a multiple of Cost of Equity (in the case of the PSP) align the interests of the Key Management Executives with the long-term growth and performance of the Company. For the financial year ended 30 September 2016, the majority of pre-determined target performance levels for the RSP and PSP grants were met.
Senior Management participants are required to hold a minimum number of the shares released to them under the RSP and the PSP to maintain a beneficial ownership stake in the Company for the duration of their employment or tenure with the Company.
Currently, the Company does not have claw-back provisions which allow it to reclaim incentive components of remuneration from its Key Management Executives in exceptional circumstances of misstatement of financial results or misconduct resulting in financial loss.

AN
NU
AL
RE
PO
RT
20
16
149
CORPORATE GOVERNANCE
Principle 9: Disclosure on Remuneration
Remuneration of Directors and Top Five Key Management Executives
Information on the remuneration of Directors of the Company and Key Management Executives of the Group for the financial year ended 30 September 2016 are set out below.
Directors of the Company Remuneration
$Mr Charoen Sirivadhanabhakdi –(1)
Khunying Wanna Sirivadhanabhakdi –(1)
Mr Charles Mak Ming Ying 292,000Mr Chan Heng Wing 132,500 Mr Philip Eng Heng Nee 177,500(2)
Mr Wee Joo Yeow 159,500 Mr Weerawong Chittmittrapap 148,500 Mr Chotiphat Bijananda 186,000 Mr Panote Sirivadhanabhakdi 174,500(3)
Mr Sithichai Chaikriangkrai 184,500
Notes:(1) Mr Charoen Sirivadhanabhakdi and Khunying Wanna Sirivadhanabhakdi waived payment of Directors’ fees due to them.(2) Excludes $113,000 and $112,565 being payment of directors’ fees from FCL’s subsidiaries, Frasers Centrepoint Asset Management Ltd and Frasers
Property Australia Pty Ltd respectively. (3) Excludes $57,500 being payment of directors’ fees from FCL’s subsidiary, Frasers Hospitality Asset Management Pte. Ltd.
Remuneration of Group CEO for Year Ended30 September 2016
Remuneration($)
Salary%
Bonus%
Allowances& Benefits
%
Long TermIncentives(1) / Benefits
%Total
%Mr Lim Ee Seng 4,288,921 33 26 3 38 100
Remuneration of Key Management Executives for Year Ended30 September 2016
Salary%
Bonus%
Allowances& Benefits
%
Long TermIncentives(1) / Benefits
%Total
%Between $2,750,001 and $3,000,000Mr Rodney Fehring 36 40 3 21 100Between $1,250,001 and $1,500,000Mr Christopher Tang Kok Kai 41 27 4 28 100Mr Chia Khong Shoong 37 25 4 34 100Between $1,000,001 and $1,250,000Mr Choe Peng Sum 37 22 4 37 100Mr Uten Lohachitpitaks 42 26 4 28 100Aggregate Total Remuneration: $7,696,345
Note: (1) The value of Long Term Incentives was calculated based on the closing share price of $1.665 on 22 December 2015.

FR
AS
ER
S C
EN
TR
EP
OIN
T L
IMIT
ED
& S
UB
SID
IAR
IES
150
CORPORATE GOVERNANCE
There are no existing or proposed service agreements entered into or to be entered into by the Company or any of its subsidiaries with Directors, the Group CEO or other Key Management Executives which provide for compensation in the form of stock options, or pension, retirement or other similar benefits, or other benefits, upon termination of employment.
The Company has not disclosed exact details of the remuneration of each Key Management Executive due to the highly competitive human resource environment and the confidential nature of staff remuneration matters.
As at 30 September 2016, there are no employees within the Group who is an immediate family member of a Director or Group CEO, and whose remuneration exceeds $50,000 during the year. As of 1 October 2016, Mr Panote Sirivadhanabhakdi was appointed as the Group CEO. Mr Panote Sirivadhanabhakdi is an immediate family member of the Chairman of the Board.
Directors’ Fees
The Company’s Board fee structure during the year is as set out below.
Basic Fee ($)
Attendance Fee(for physical
attendance in Singapore or
home country of the Director)
($)
Attendance Fee(for physical attendance
outside Singapore (excluding home country of the
Director))($)
Attendance Fee(for attendance
via tele / videoconference)
($)Board– Chairman 150,000 3,000 4,500 per trip 1,000– Lead Independent Director 95,000 1,500 4,500 per trip 1,000– Member 75,000 1,500 4,500 per trip 1,000Audit Committee and Board EXCO– Chairman 55,000 3,000 4,500 per trip 1,000– Member 30,000 1,500 4,500 per trip 1,000Nominating Committee, Remuneration Committee and Risk Management Committee– Chairman 35,000 3,000 4,500 per trip 1,000– Member 20,000 1,500 4,500 per trip 1,000
Shareholders’ approval will be sought at the forthcoming AGM of the Company on 24 January 2017, for the payment of the Directors’ fees for the financial year ending 30 September 2017 amounting to $2,000,000 (last year: up to $2,000,000).
C. ACCOUNTABILITY AND AUDIT
Principle 10: Accountability
The Board is responsible for providing a balanced and understandable assessment of the Company’s and Group’s performance, position and prospects, including interim and other price sensitive public reports, and reports to regulators (if required).
FCL prepares its financial statements in accordance with the Singapore Financial Reporting Standards prescribed by the Accounting Standards Council. The Board provides Shareholders with quarterly and annual financial reports, and releases its quarterly and full year financial results, other price sensitive information and material corporate developments through announcements to the SGX-ST and, where appropriate, press releases, the Company’s website and media and analysts’ briefings. In communicating and disseminating its results, FCL aims to present a balanced and clear assessment of the Group’s performance, position and prospects.

AN
NU
AL
RE
PO
RT
20
16
151
CORPORATE GOVERNANCE
In order to enable the Board to obtain a timely and informed assessment of the Company’s position, the Board has assessed and requested that the Management furnish accounts to it on a quarterly basis, with monthly management accounts to be provided as the Board may request from time to time. Such reports keep the Board members informed of the Company’s and Group’s performance, position and prospects.
Principle 11: Risk Management and Internal Controls
The Board is responsible for governing risks and ensuring that the Management maintains a sound system of risk management and internal controls. The Company maintains a sound system of risk management and internal controls with a view to safeguard its assets and Shareholders’ interests.
The AC, with the assistance of internal and external auditors, reviews and reports to the Board on the adequacy and effectiveness of the Company’s system of controls, including financial, operational and compliance controls and information technology, established by the Management. In assessing the effectiveness of internal controls, the AC ensures primarily that key objectives are met, material assets are properly safeguarded, fraud or errors in the accounting records are prevented or detected, accounting records are accurate and complete, and reliable financial information is prepared in compliance with applicable internal policies, laws and regulations.
The importance and emphasis placed by the Group on internal controls is underpinned by the fact that the key performance indicators for the Management’s performance takes into account the findings of the internal auditors and the number of unresolved or outstanding issues raised in the process.
Risk Management Committee
The Board, through the RMC, reviews the adequacy and effectiveness of the Group’s risk management framework and systems to ensure that robust risk management and mitigating controls are in place.
The RMC oversees the risk management framework and policies of the Group. It is responsible for, among other things, reviewing the Group’s risk management strategy, policies, enterprise-wide risk management framework, processes and procedures for identifying, measuring, reporting and mitigating key risks in the Group’s businesses and operations. In this regard, key risks and the associated mitigating controls are reported to the Board. Together with the AC, the RMC helps to ensure that the Management maintains a sound system of risk management and internal controls to safeguard the interests of Shareholders and the assets of the Group. Through guidance to, and discussions with the Management, it assists the Board in its determination of the nature and extent of significant risks which the Board is willing to take in achieving the Group’s strategic objectives. The meetings of the RMC are attended by the senior Management of the Group, and serve as a forum to review and discuss material risks and exposures of the Group’s businesses and their strategies to mitigate risks.
The RMC comprises the following members:
Mr Chotiphat Bijananda ChairmanMr Charles Mak Ming Ying MemberMr Chan Heng Wing MemberMr Weerawong Chittmittrapap MemberMr Panote Sirivadhanabhakdi(1) MemberMr Sithichai Chaikriangkrai Member
Note:(1) As of 1 October 2016, Mr Panote Sirivadhanabhakdi was appointed as the Group CEO, resulting in the composition of the RMC to comprise five
non-executive Directors and one executive Director as of 1 October 2016
As of 30 September 2016, all the members of the RMC are non-executive Directors, and comprise three Independent Directors.

FR
AS
ER
S C
EN
TR
EP
OIN
T L
IMIT
ED
& S
UB
SID
IAR
IES
152
CORPORATE GOVERNANCE
Risk Management, Risk Tolerance and Internal Controls
Assisted by the RMC, the Board determines the risk appetite, assesses the Group’s risk profile, material risks, and mitigation plan, and provides valuable advice to the Management in formulating the risk management framework, policies and guidelines, and oversees the Management in the implementation of the risk management and internal control systems.
The Company has adopted an enterprise-wide risk management framework (“ERM Framework”) to enhance its risk management capabilities. The Board is assisted by the RMC to oversee the Group’s ERM Framework. Key risks, mitigating measures and management actions are continually identified, reviewed and monitored as part of the ERM Framework. Where applicable, financial and operational key risk indicators are put in place to track key risk exposures. Apart from the ERM Framework, key business risks are thoroughly assessed by Management and each significant transaction is comprehensively analysed so that Management understands the risks involved before it is embarked upon. An outline of the Group’s ERM Framework is set out on pages 134 to 136.
Periodic updates are provided to the RMC on the Group’s risk profile. These updates include an assessment of the Group’s key risks by major business units, risk categories, and the risk, status and changes in plans undertaken by Management to manage key risks, as well as the risk tolerance status.
The Group’s risk tolerance statements have been developed by the Management, and approved by the RMC on behalf of the Board. The risk tolerance statements set out the nature and extent of the significant risks that the Group is willing to take in achieving its strategic objectives. The accompanying risk tolerance thresholds, which set the risk boundaries in various strategic and operational areas, are reviewed and monitored closely by the Management, and reported to the RMC.
To assist the Company to ascertain the adequacy and effectiveness of the Group’s internal controls, the Management implements a control self-assessment exercise and maps out key risks with the existing assurance processes in a comfort matrix every year. The Management carries out control self-assessment in key areas of their respective businesses and operations to evaluate their internal controls status. Using a comfort matrix of key risks, the material financial, compliance, operational (including information technology) risks of the Company have been documented by the business and operational units and presented against strategies, policies, people, processes, systems, mechanisms and reporting processes that have been put in place.
The heads of business units are required to provide the Company with written assurances as to the adequacy and effectiveness of their system of internal controls and risk management. Assurances are also sought from the Company’s internal auditors based on their independent assessments.
The Board has received assurance from the Group CEO and the CFO of the Company that as at 30 September 2016, (a) the financial records of the Group have been properly maintained and the financial statements for the year ended 30 September 2016 give a true and fair view of the Group’s operations and finances; (b) the system of internal controls in place for the Group is adequate and effective as at 30 September 2016 to address financial, operational, compliance and information technology risks which the Group considers relevant and material to its operations; and (c) the risk management system in place for the Group is adequate and effective as at 30 September 2016 to address risks which the Group considers relevant and material to its operations.
Based on the internal controls established and maintained by the Group, work performed by internal and external auditors, reviews performed by the Management and various Board Committees and assurance from the Group CEO and the CFO, the Board, with the concurrence of the AC, is of the opinion that the Group’s internal controls were adequate and effective as at 30 September 2016 to address financial, operational, compliance and information technology risks, which the Group considers relevant and material to its operations.
Based on the risk management framework established and assurance from the Group CEO and the CFO, the Board is of the view that the Group’s risk management system was adequate and effective as at 30 September 2016 to address risks which the Group considers relevant and material to its operations.

AN
NU
AL
RE
PO
RT
20
16
153
CORPORATE GOVERNANCE
The Board notes that the system of internal controls and risk management provides reasonable, but not absolute, assurance that the Group will not be adversely affected by any event that could be reasonably foreseen as it works to achieve its business objectives. In this regard, the Board also notes that no system of internal controls and risk management can provide absolute assurance against the occurrence of material errors, poor judgment in decision making, human error, losses, fraud or other irregularities.
Principle 12: Audit Committee
Audit Committee
The AC, on behalf of the Board, undertakes the monitoring and review of the system of internal controls. Its main responsibilities are to assist the Board in the discharge of its oversight responsibilities in the areas of internal controls, financial and accounting practices, operational and compliance controls. Significant findings are reported to the Board.
The AC is guided by written Terms of Reference endorsed by the Board and which set out its duties and responsibilities. It is duly authorised to investigate any matter within such Terms of Reference, and has full access to and the co-operation of the Management, as well as the full discretion to invite any Director or executive officer to attend its meetings. Under the Terms of Reference of the AC, a former partner or director of the Company’s existing auditing firm or auditing corporation shall not act as a member of the AC (a) within a period of 12 months commencing on the date of his ceasing to be a partner of the auditing firm or director of the auditing corporation; and in any case (b) for so long as he has any financial interest in the auditing firm or auditing corporation.
The AC comprises the following members:
Mr Charles Mak Ming Ying ChairmanMr Philip Eng Heng Nee MemberMr Wee Joo Yeow MemberMr Sithichai Chaikriangkrai Member
The AC is made up of non-executive Directors, the majority of whom, including the Chairman, are Independent Directors. The members of the AC are appropriately qualified. Mr Philip Eng Heng Nee and Mr Sithichai Chaikriangkrai have recent and relevant accounting and related financial management expertise, and Mr Wee Joo Yeow has in-depth knowledge of the responsibilities of the AC and practical experience and knowledge of the issues and considerations affecting the AC. Their collective wealth of experience and expertise enables them to discharge their responsibilities competently. The Company has also committed reasonable resources to enable the AC to discharge its functions effectively.
During the year, the key activities of the AC included the following:• Reviewing the quarterly and full-year financial results and related SGX-ST announcements, including the
independent auditors’ report, significant financial reporting issues and assessments, to safeguard the integrity in financial reporting, and to ensure compliance with the requirements of the Singapore Financial Reporting Standards.
• Recommending, for the approval of the Board, the quarterly and annual financial results and related SGX-ST announcements.
• Reviewing and evaluating with internal and external auditors, the adequacy and effectiveness of internal control systems, including financial, operational, information technology and compliance controls.
• Reviewing and approving the internal and external audit plans to ensure the adequacy of the audit scope.• Reviewing with internal and external auditors, the audit reports and their recommendations, and monitoring
the timely and proper implementation of any required corrective or improvement measures.• Reviewing the adequacy and effectiveness of the Group’s internal audit function, including the adequacy of
internal audit resources and its appropriate standing within the Group.• Reviewing whistle-blowing investigations within the Group and ensuring appropriate follow-up actions, if
required.

FR
AS
ER
S C
EN
TR
EP
OIN
T L
IMIT
ED
& S
UB
SID
IAR
IES
154
CORPORATE GOVERNANCE
The AC also meets with internal and external auditors without the presence of the Management at least once a year to obtain feedback on the competency and adequacy of the finance function and to ascertain if there are any material weaknesses or control deficiencies in the Group’s financial reporting and operational systems, and at least one of these meetings was conducted without the presence of the Management. In addition, periodic updates on changes in accounting standards and treatment are prepared by external auditors and circulated to members of the AC to keep abreast of such changes and its corresponding impact on the financial statements, if any.
External Auditors
The AC makes recommendations to the Board for approval by Shareholders, the appointment and re-appointment and removal of the Company’s external auditors. The external auditors hold office until their removal or resignation. The AC assesses the external auditors based on factors such as the performance and quality of their audit and the independence of the auditors, and recommends their appointment to the Board. In the AGM held on 29 January 2016, KPMG LLP was appointed by Shareholders as the external auditors of the Company with effect from the financial year ending 30 September 2016. Pursuant to the requirements of the SGX-ST, an audit partner may only be in charge of a maximum of five consecutive annual audits and may then return after two years. KPMG LLP has met this requirement, and the current KPMG LLP audit partner for the Group has been appointed since the AGM held on 29 January 2016.
None of the members of the AC were previous partners or directors of the Company’s auditors KPMG LLP and none of the members of the AC hold any financial interest in the Company’s auditors, KPMG LLP.
During the year, the AC conducted a review of the scope and results of audit by the external auditors and its cost effectiveness, as well as the independence and objectivity of the auditors. It also reviewed all non-audit services provided by the external auditors, and the aggregate amount of audit fees paid to them. For details of fees payable to the external auditors in respect of audit and non-audit services for the year ended 30 September 2016, please refer to Note 4 of the Notes to the Financial Statements on page 215. The AC is satisfied that neither their independence nor their objectivity is put at risk, and that they are still able to meet the audit requirements and statutory obligations of the Company. It is also satisfied with the aggregate amount of audit fees paid to the external auditors.
The Company has complied with Rule 712 of the SGX-ST Listing Manual which requires, amongst others, that a suitable auditing firm should be appointed by the Company having regard to these factors. The Company has also complied with Rule 715 of the SGX-ST Listing Manual which requires that the same auditing firm of the Company audits its Singapore-incorporated subsidiaries and significant associated companies, and for a suitable auditing firm be engaged for its significant foreign-incorporated subsidiaries and associated companies.
Whistle-Blowing Policy
In line with the Company’s commitment of high standards of integrity, transparency and accountability to safeguard shareholders’ interests and the Company’s assets and reputation, the Company has in place a Whistle-Blowing Policy. This Policy provides an independent feedback channel through which matters of concern about possible improprieties in matters of financial reporting, suspected fraud and corruption or other matters may be raised by employees and any other persons in confidence and in good faith, without fear of reprisal. The improprieties that are reportable under the Whistle-Blowing Policy includes:
(a) financial or professional misconduct;(b) improper conduct, dishonest or unethical behaviour, or violence at the workplace;(c) any irregularity or non-compliance with laws/regulations, and/or internal control;(d) conflicts of interest;(e) health/safety of any individual; and(f) any other improprieties or matters that may adversely affect Shareholders’ interest in, and assets of, the
Company and its reputation.

AN
NU
AL
RE
PO
RT
20
16
155
CORPORATE GOVERNANCE
The Whistle-Blowing Policy is covered during staff training and periodic communication. All whistle-blowing complaints which are raised are independently investigated and appropriate actions taken by an independent investigation committee as appropriate, and the outcome of each investigation is reported to the AC. The AC reviews and ensures that independent investigations and any appropriate follow-up actions are carried out.
Principle 13: Internal Audit
The FCL Group Internal Audit (“IA”) Department is responsible for conducting objective and independent assessments on the adequacy and quality of the Group’s system of internal controls, risk management and governance practices. For the financial year ended 30 September 2016, the Head of the FCL Group IA reports directly to the Chairman of the AC and administratively, to the Company Secretary.
For the financial year ended 30 September 2016, in performing IA services, the FCL Group IA adopted and complied with the Standards for the Professional Practice of Internal Auditing set by The Institute of Internal Auditors, Inc. FCL Group IA comprise 19 professional staff. The Head of the FCL Group IA and the FCL Group IA staff are members of The Institute of Internal Auditors, Singapore. To ensure that the internal audit activities are effectively performed, the FCL Group IA recruits and employs suitably qualified staff with the requisite skills and experience. Such staff are given relevant training and development opportunities to update their technical knowledge and auditing skills. All staff members of the FCL Group IA also received relevant technical training and attended seminars organised by The Institute of Internal Auditors, Singapore and other professional bodies.
The FCL Group IA operates within the framework stated in a set of Terms of Reference as contained in the Internal Audit Charter approved by the AC. The AC is responsible for the hiring, removal, evaluation and compensation of the head of the IA function. The IA function adopted a risk-based audit methodology to develop its Audit Plans, and its activities were aligned to key risks of the Group. The results of the risk assessments determined the level of focus and the review intervals for the various activities audited.
During the year ended 30 September 2016, the FCL Group IA conducted its audit reviews based on Internal Audit Plans approved by the AC. The FCL Group IA has unfettered access to all the Group companies’ documents, records, properties and personnel, including the AC members. All audit reports detailing audit findings and recommendations are provided to the Management who would respond on the actions to be taken.
Each quarter, the FCL Group IA would submit quarterly reports to the AC on the status of the Audit Plans and on audit findings and actions taken by the Management on such findings. Key findings are highlighted at AC meetings for discussion and follow-up action. The AC monitors the timely and proper implementation of the appropriate follow-up measures to be undertaken by the Management.
The AC is satisfied that the FCL Group IA has adequate resources and appropriate standing within the Group to perform its functions effectively.

FR
AS
ER
S C
EN
TR
EP
OIN
T L
IMIT
ED
& S
UB
SID
IAR
IES
156
CORPORATE GOVERNANCE
D. SHAREHOLDER RIGHTS AND RESPONSIBILITIES
Principle 14: Shareholder Rights
FCL believes in treating all Shareholders fairly and equitably. It is committed to keeping all Shareholders and other stakeholders and analysts in Singapore and beyond informed of its corporate activities, including changes (if any) in the Company or its businesses which are likely to materially affect the price or value of its shares, in a timely and consistent manner.
Shareholders of FCL will be given the opportunity to participate effectively and vote at general meetings of the Company, where relevant rules and procedures governing such meetings (for instance, how to vote) will be clearly communicated.
Principle 15: Communication with Shareholders
The Company prides itself on its high standards of disclosure and corporate transparency. At the Securities Investors Association (Singapore) (“SIAS”) 17th Investors’ Choice Awards held on 30 September 2016, FCL was presented a runner-up title for the Most Transparent Company Award (Real Estate Category). FCL aims to provide fair, relevant, comprehensive and timely information regarding the Group’s performance and progress to Shareholders and the investment community to enable them to make informed investment decisions. The Group’s dedicated Investor Relations (“IR”) team is tasked with and focuses on facilitating communications between the Company and its Shareholders, as well as with the investment community.
The IR team communicates regularly with Shareholders, as well as with the investment community, through timely disclosures of material and other pertinent information to the SGX-ST, and quarterly results briefings and conference calls. The IR team also conducts roadshows (together with senior Management), and participates in investor seminars and conferences to keep the market and investors apprised of the Group’s corporate developments and financial performance. During the year, the IR team, together with senior Management, engaged with Singapore and foreign investors at conferences, briefings and calls, non-deal roadshows as well as one-on-one and group meetings. The aim of such engagements is to provide Shareholders and investors with prompt disclosure of relevant information, to enable them to have a better understanding of the Company’s businesses and performance. The Company makes available all its briefing materials to analysts and the media, webcasts of its half-year and full-year results briefings, its financial information, its annual reports, and all announcements to the SGX-ST on its website at www.fraserscentrepoint.com, with contact details of the IR team for investors to channel their comments and queries.
Further details on IR’s activities and responsibilities during the year can be found in the Investor Relations section of the Annual Report on pages 68 to 69.
As previously disclosed in the Introductory Document, the Company intends to recommend dividends of up to 75% of its net profit after tax after considering factors such as its level of cash and reserves, results of operations, business prospects, capital requirements and surplus, general financial condition, contractual restrictions, the absence of any circumstances which might reduce the amount of reserves available to pay dividends and other factors relevant to the Board (including the expected financial performance of FCL).

AN
NU
AL
RE
PO
RT
20
16
157
CORPORATE GOVERNANCE
Principle 16: Conduct of Shareholder Meetings
The Board supports and encourages active shareholder participation at AGMs as it believes that general meetings serve as an opportune forum for Shareholders to meet the Board and senior Management, and to interact with them.
The Company’s Constitution allows (a) each Shareholder who is not a relevant intermediary (as defined in the Companies Act, Chapter 50) the right to appoint up to two proxies and (b) each Shareholder who is a relevant intermediary to appoint more than two proxies to attend and vote on their behalf in Shareholders’ meetings. A copy of each of the Annual Report and Notice of AGM are sent to all Shareholders. At general meetings, the Company sets out separate resolutions on each substantially separate issue and Shareholders are given the opportunity to raise questions and clarify any issues that they may have relating to the resolutions to be passed. Board members and senior Management are present at each Shareholders’ meeting to respond to any questions from Shareholders. The Company’s external auditors are also present to address queries about the conduct of audit and the preparation and content of the auditors’ report.
For greater transparency, FCL has implemented electronic poll voting at AGMs. This entails Shareholders being invited to vote on each of the resolutions by poll, using an electronic voting system (instead of voting by hands), thereby allowing all Shareholders present or represented at the meeting to vote on a one share, one vote basis. The voting results of all votes cast for, or against, each resolution is then screened at the meeting and announced to the SGX-ST after the meeting. FCL will continue to use the electronic poll voting system at the forthcoming AGM.
The Company is not implementing absentia voting methods such as voting via mail, e-mail or fax until security, integrity and other pertinent issues are satisfactorily resolved. The Company Secretary prepares minutes of Shareholders’ meetings, which incorporates substantial comments or queries from Shareholders and responses from the Board and Management. These minutes are available to Shareholders upon their requests.
Listing Rule 1207 sub-Rule (19) on Dealings in Securities
The Company has established a procedure for dealings in the securities of the Company, which sets out the implications of insider trading and guidance on such dealings, including the prohibition on dealings with the Company’s securities on short-term considerations. In compliance with Listing Rule 1207(19) of the SGX-ST Listing Manual on best practices on dealing in securities, the Group issues quarterly reminders to its Directors, officers and employees on the restrictions in dealings in listed securities of the Group during the period commencing (i) two weeks prior to the announcement of financial results of each of the first three quarters of the financial year, and (ii) one month before the announcement of full year results, and ending on the date of such announcements. Directors, officers and employees are also reminded not to trade in listed securities of the Group at any time while in possession of unpublished price sensitive information and to refrain from dealing in the Group’s securities on short-term considerations. Directors and CEOs are also required to report their dealings in the Company’s securities within two business days.

FR
AS
ER
S C
EN
TR
EP
OIN
T L
IMIT
ED
& S
UB
SID
IAR
IES
158
CORPORATE GOVERNANCE
GUIDELINES FOR DISCLOSURE
Guideline Questions How has the Company complied?
General (a) Has the Company compiled with all the principles and guidelines of the Code? If not, please state the specific deviations and the alternative corporate governance practices adopted by the Company in lieu of the recommendations in the Code.
(b) In what respect do these alternative corporate governance practices achieve the objectives of the principles and conform to the guidelines in the Code?
(a) Frasers Centrepoint Limited (“FCL” or the “Company”) has complied in all material respects with the principles and guidelines set out in the Code.
(b) See above.
Board Responsibility
Guideline 1.5 What are the types of material transactions which require approval from the Board?
The Company has a Manual of Authority (“MOA”) which contains a schedule of matters specifically reserved to the Board for approval. In addition to matters such as annual budgets, financial plans and business strategies, Board approval is required for material transactions, such as major acquisitions, divestments, funding and investment proposals. The MOA authorises the Board Executive Committee to approve certain transactions up to specified limits beyond which the approval of the Board needs to be obtained.
Members of the Board
Guideline 2.6 (a) What is the Board’s policy with regard to diversity in identifying director nominees?
(b) Please state whether the current composition of the Board provides diversity each of the following – skills, experience, gender and knowledge of the Company, and elaborate with numerical data where appropriate.
(c) What steps has the Board taken to achieve the balance and diversity necessary to maximize its effectiveness?
(a) The Board proactively seeks to maintain an appropriate balance of expertise, skills and attributes among Directors. This is reflected in the diversity of backgrounds and competencies of its Directors.
(b) The current competencies of the Board range from banking, finance and accounting to relevant industry knowledge including management experience and familiarity with regulatory requirements and risk management. Please refer to pages 12 to 16 (Write-up on Directors) and pages 140 to 141 of this Annual Report.
(c) The Board has delegated the Nominating
Committee (the “NC”) to annually review the size and composition of the Board with a view to maintaining an appropriate balance of expertise, skills and attributes taking into account the needs of the FCL and its subsidiaries (the “Group”). Please refer to pages 140 to 141 of this Annual Report. Please also refer to Guideline 4.6 below on the process for Board succession planning.

AN
NU
AL
RE
PO
RT
20
16
159
CORPORATE GOVERNANCE
Guideline Questions How has the Company complied?
Guideline 4.6 Please describe the board nomination process for the Company in the last financial year for (i) selecting and appointing new directors and (ii) re-electing incumbent directors
(i) The NC takes the lead in identifying, evaluating and selecting suitable candidates, factoring in the ability of the prospective candidate to contribute to the Board, as well as taking into account the existing mix of expertise, skills and attributes of the Directors to identify needed and/or desired competencies.
(ii) The NC will assess whether Directors are properly qualified for re-appointment by virtue of their skills, experience and contributions. Please also refer to pages 142 to 143 of this Annual Report.
Guideline 1.6 (a) Are new directors given formal training? If not, please explain why
(b) What are the types of information and training provided to (i) new directors and (ii) existing directors to keep them up-to-date?
(a) Yes. Please also refer to page 139 of this Annual Report.
(b) (i) New Directors are given a letter of appointment setting out, among other things, his or her duties and obligations including his or her responsibilities as fiduciaries and, where appropriate, incorporating processes to deal with possible conflicts of interest that may arise. A comprehensive orientation programme is also conducted to familiarise new appointees with the business activities, strategic directions, policies and corporate governance practices of the Group. Please also refer to page 139 of this Annual Report.
(b) (ii) Directors are regularly updated on the Group’s businesses and the regulatory and industry-specific environments in which the entities of the Group operate. Updates on relevant legal, regulatory and technical developments may be in writing or disseminated by way of briefings, presentations and/or handouts. Directors are also encouraged to be members of the Singapore Institute of Directors (“SID”) and to receive journal updates and training from SID in order to stay abreast of relevant developments in financial, legal and regulatory requirements. Please also refer to page 139 of this Annual Report.

FR
AS
ER
S C
EN
TR
EP
OIN
T L
IMIT
ED
& S
UB
SID
IAR
IES
160
CORPORATE GOVERNANCE
Guideline Questions How has the Company complied?
Guideline 4.4 (a) What is the maximum number of listed company board representations that the Company has prescribed for its directors? What are the reasons for this number?
(b) If a maximum number has not been determined, what are the reasons?
(c) What are the specific considerations in deciding on the capacity of directors?
(a) The Company has not prescribed a maximum number of listed company board representations that a Director may hold. Please also refer to page 143 of this Annual Report.
(b) The NC is tasked with determining whether each Director is able to adequately devote sufficient time to discharging their responsibilities to the Company. The NC has taken cognizance of the recommendations of the Code requirement but is of the view that its assessment of a Director’s ability to devote sufficient time to the discharge of his or her duties should not entail a restriction on the number of other board commitments or their other principal commitments. Please also refer to page 143 of this Annual Report.
(c) The contributions by Directors to and during meetings of the Board and relevant Board Committees as well as their attendance at such meetings are holistically assessed and taken into account by the NC. Please also refer to page 143 of this Annual Report.
Board Evaluation
Guideline 5.1 (a) What was the process upon which the Board reached the conclusion on its performance for the financial year?
(b) Has the Board met its performance objectives?
(a) All Directors will be required to assess the performance of the Board and the Board Committees. The assessment cover areas such as Board processes, managing the Company’s performance, effectiveness of the Board and the Board Committees, and Director development. Please also refer to pages 144 to 145 of this Annual Report.
(b) Based on the NC’s review, the Board and the various Board Committees operate effectively and each Director is contributing to the overall effectiveness of the Board.

AN
NU
AL
RE
PO
RT
20
16
161
CORPORATE GOVERNANCE
Guideline Questions How has the Company complied?
Independence of Directors
Guideline 2.1 Does the Company comply with the guideline on the proportion of independent directors on the Board? If not, please state the reasons for the deviation and the remedial action taken by the Company
As of 1 October 2016, Mr Panote Sirivadhanabhakdi was appointed as the Group Chief Executive Officer of the Company (the “Group CEO”). Mr Panote Sirivadhanabhakdi is an immediate family member of the Chairman of the Board. The Company notes that it is in compliance with Guideline 2.2 of the Code, as its Independent Directors makes up half of the Board when the Chairman and the Group CEO are immediate family members. Please also refer to pages 140 to 142 of this Annual Report.
Guideline 2.3 (a) Is there any director who is deemed to be independent by the Board, notwithstanding the existence of a relationship as stated in the Code that would otherwise deem him not to be independent? If so, please identify the director and specify the nature of such relationship.
(b) What are the Board’s reasons for considering him independent? Please provide a detailed explanation.
(a) No. Please also refer to pages 140 to 144 of this Annual Report.
(b) Not applicable.
Guideline 2.4 Has any independent director served on the Board for more than nine years from the date of his first appointment? If so, please identify the director and set out the Board’s reasons for considering him independent.
No.
Disclosure on Remuneration
Guideline 9.2 Has the Company disclosed each director’s and the CEO’s remuneration as well as a breakdown (in percentage or dollar terms) into base/fixed salary, variable or performance related income/bonuses, benefits –in-kind, stock options granted, share-based incentives and awards, and other long-term incentives? If not, what are the reasons for not disclosing so?
Yes. Please refer to pages 149 to 150 of this Annual Report.

FR
AS
ER
S C
EN
TR
EP
OIN
T L
IMIT
ED
& S
UB
SID
IAR
IES
162
CORPORATE GOVERNANCE
Guideline Questions How has the Company complied?
Guideline 9.3 (a) Has the Company disclosed each key management personnel’s remuneration, in bands of S$250,000 or in more detail, as well as a breakdown (in percentage or dollar terms) into base/fixed salary, variable or performance-related income/bonuses, benefits in kind, stock options granted, share-based incentives and awards, and other long-term incentives? If not, what are the reasons for not disclosing so?
(b) Please disclose the aggregate remuneration paid to the top key management personnel (who are not directors or the CEO).
(a) Yes. Please refer to page 149 of this Annual Report.
(b) The Company has disclosed the aggregate remuneration paid to the top five key management personnel. Please refer to page 149 of this Annual Report.
Guideline 9.4 Is there any employee who is an immediate family member of a director or the CEO, and whose remuneration exceeds S$50,000 during the year? If so, please identify the employee and specify the relationship with the relevant director or the CEO.
As at 30 September 2016, there are no employees within the Group who is an immediate family member of a Director or Group CEO, and whose remuneration exceeds S$50,000 during the year. As of 1 October 2016, Mr Panote Sirivadhanabhakdi was appointed as the Group CEO. Mr Panote Sirivadhanabhakdi is an immediate family member of the Chairman of the Board.
Guideline 9.6 (a) Please describe how the remuneration received by executive directors and key management personnel has been determined by the performance criteria.
(b) What were the performance conditions used to determine their entitlement under the short-term and long-term incentive schemes?
(c) Were all of these performance conditions met? If not, what were the reasons?
(a) Please refer to pages 146 to 148 of this Annual Report.
(b) Please refer to pages 146 to 148 of this Annual Report.
(c) Please refer to pages 146 to 148 of this Annual Report.

AN
NU
AL
RE
PO
RT
20
16
163
CORPORATE GOVERNANCE
Guideline Questions How has the Company complied?
Risk Management and Internal Controls
Guideline 6.1 What types of information does the Company provide to independent directors to enable them to understand its business, the business and financial environment as well as the risks faced by the Company? How frequently is the information provided?
The Management provides the Board with detailed Board papers specifying relevant information and commercial rationale for each proposal for which Board approval is sought. Such information includes relevant financial forecasts, risk analyses and assessments, mitigation strategies, feasibility studies and key commercial issues for the Board’s attention and consideration. Reports on major operational matters, business development activities, financial performance, potential investment opportunities and budgets are circulated to the Board periodically. A calendar of activities is scheduled for the Board a year in advance, with Board papers and agenda items dispatched to the Directors about a week before scheduled meetings as far as possible. This is to give Directors sufficient time to review and consider the matters being tabled and/or discussed so that discussions can be more meaningful and productive. Please refer to page 145 of this Annual Report.
Guideline 13.1 Does the Company have an internal audit function? If not, please explain why
Yes. Please refer to page 155 of this Annual Report.

FR
AS
ER
S C
EN
TR
EP
OIN
T L
IMIT
ED
& S
UB
SID
IAR
IES
164
CORPORATE GOVERNANCE
Guideline Questions How has the Company complied?
Guideline 11.3 (a) In relation to the major risks faced by the Company, including financial, operational, compliance, information technology and sustainability, please state the bases for the Board’s view on the adequacy and effectiveness of the Company’s internal controls and risk management systems.
(b) In respect of the past 12 months, has the Board received assurance from the CEO and the CFO as well as the internal auditor that: (i) the financial records have been properly maintained and the financial statements give true and fair view of the Company’s operations and finances; and (ii) the Company’s risk management and internal control systems are effective? If not, how does the Board assure itself of points (i) and (ii) above?
Please refer to pages 151 to 153 of this Annual Report.
The Board has received assurance from the Group CEO and the CFO of the Company that as at 30 September 2016, (a) the financial records of the Group have been properly maintained and the financial statements for the year ended 30 September 2016 give a true and fair view of the Group’s operations and finances; (b) the system of internal controls in place for the Group is adequate and effective as at 30 September 2016 to address financial, operational, compliance and information technology risks which the Group considers relevant and material to its operations; and (c) the risk management system in place for the Group is adequate and effective as at 30 September 2016 to address risks which the Group considers relevant and material to its operations.
Based on the internal controls established and maintained by the Group, work performed by internal and external auditors, reviews performed by the Management and various Board Committees and assurance from the Group CEO and the CFO, the Board, with the concurrence of the AC, is of the opinion that the Group’s internal controls were adequate and effective as at 30 September 2016 to address financial, operational, compliance and information technology risks, which the Group considers relevant and material to its operations.
Based on the risk management framework established and assurance from the Group CEO and the CFO, the Board is of the view that the Group’s risk management system was adequate and effective as at 30 September 2016 to address risks which the Group considers relevant and material to its operations. Please also refer to pages 152 to 153 of this Annual Report.

AN
NU
AL
RE
PO
RT
20
16
165
CORPORATE GOVERNANCE
Guideline Questions How has the Company complied?
Guideline 12.6 (a) Please provide a breakdown of the fees paid in total to the external auditors for audit and non-audit services for the financial year
(b) If the external auditors have supplied a substantial volume of non-audit services to the Company, please state the bases for the Audit Committee’s view on the independence of the external auditors
(a) Please refer to Note 4 of the Notes to the Financial Statements on page 215 of this Annual Report.
(b) During the year, the Audit Committee (the “AC”) conducted a review of the scope and results of audit by the external auditors and its cost effectiveness, as well as the independence and objectivity of the auditors. It also reviewed all non-audit services provided by the external auditors, and the aggregate amount of audit fees paid to them. For details of fees payable to the external auditors in respect of audit and non-audit services for the year ended 30 September 2016, please refer to Note 4 of the Notes to the Financial Statements on page 215. The AC is satisfied that neither their independence nor their objectivity is put at risk, and that they are still able to meet the audit requirements and statutory obligations of the Company. It is also satisfied with the aggregate amount of audit fees paid to the external auditors.
Guideline 15.4 (a) Does the Company regularly communicate with shareholders and attend to their questions? How often does the Company meet with institutional and retail investors?
(b) Is this done by a dedicated investor relations team (or equivalent)? If not, who performs this role?
(c) How does the Company keep shareholders informed of corporate developments, apart from SGXNET announcements and the annual report?
(a) The Company, through its Investor Relations (the “IR”) team communicates regularly with shareholders and the investment community, with timely disclosures of material and other pertinent information, through regular dialogues and announcements to the SGX-ST. Please refer to page 156 of this Annual Report.
(b) Yes. Please refer to page 156 of this Annual Report.
(c) The IR team together with senior management participates in investor seminars, conferences, one-on-one and group meetings. Please refer to page 156 of this Annual Report.
Guideline 15.5 If the Company is not paying any dividends for the financial year, please explain why.
Not applicable.

FR
AS
ER
S C
EN
TR
EP
OIN
T L
IMIT
ED
& S
UB
SID
IAR
IES
166
FINANCIAL STATEMENTSCONTENTS
167 DIRECTORS’ STATEMENT
174 INDEPENDENT AUDITORS’ REPORT
180 CONSOLIDATED PROFIT STATEMENT
181 CONSOLIDATED STATEMENT OF COMPREHENSIVE INCOME
182 BALANCE SHEETS
183 STATEMENTS OF CHANGES IN EQUITY
187 CONSOLIDATED CASH FLOW STATEMENT
190 NOTES TO THE FINANCIAL STATEMENTS
304 PARTICULARS OF GROUP PROPERTIES
326 INTERESTED PERSON TRANSACTIONS
327 SHAREHOLDING STATISTICS
329 NOTICE OF ANNUAL GENERAL MEETING
PROXY FORM

AN
NU
AL
RE
PO
RT
20
16
167
The Directors have pleasure in presenting their statement together with the audited financial statements of Frasers Centrepoint Limited (the “Company”) and its subsidiaries (the “Group”) for the financial year ended 30 September 2016.
1. OPINION OF THE DIRECTORS
In the opinion of the Directors,
(i) the consolidated financial statements of the Group as set out in pages 180 to 303 are drawn up so as to give a true and fair view of the financial position of the Group and of the Company as at 30 September 2016 and of the financial performance, changes in equity and cash flows of the Group and changes in equity of the Company for the year ended 30 September 2016; and
(ii) at the date of this statement, there are reasonable grounds to believe that the Company will be able to pay its debts as and when they fall due.
2. DIRECTORS
The Directors of the Company in office at the date of this statement are:
Mr Charoen Sirivadhanabhakdi (Chairman) Khunying Wanna Sirivadhanabhakdi (Vice Chairman) Mr Panote Sirivadhanabhakdi Mr Charles Mak Ming Ying Mr Chan Heng Wing Mr Philip Eng Heng Nee Mr Wee Joo Yeow Mr Weerawong Chittmittrapap Mr Chotiphat Bijananda Mr Sithichai Chaikriangkrai
3. ARRANGEMENTS TO ENABLE DIRECTORS TO ACQUIRE SHARES AND DEBENTURES
Neither at the end of, nor at any time during, the financial year was the Company a party to any arrangement whose object was to enable the Directors of the Company to acquire benefits by means of an acquisition of shares in, or debentures of, the Company or any other body corporate, other than as disclosed in this statement.
DIRECTORS’ STATEMENT

FR
AS
ER
S C
EN
TR
EP
OIN
T L
IMIT
ED
& S
UB
SID
IAR
IES
168
4. DIRECTORS’ INTERESTS IN SHARES AND DEBENTURES
(a) The following Directors who held office at the end of the financial year had, according to the register of Directors’ shareholdings, required to be kept under Section 164 of the Companies Act of Singapore (Chapter 50), an interest in the shares in or debentures of the Company and its related corporations (other than wholly-owned subsidiaries) as stated below:
Direct Interest Deemed Interest
Name of DirectorAs at
1 Oct 2015As at
30 Sep 2016As at
1 Oct 2015As at
30 Sep 2016
Charoen Sirivadhanabhakdi– Frasers Centrepoint Limited
• Ordinary Shares – – 2,541,007,768 (1) 2,541,007,768 (1)
– FCL Treasury Pte. Ltd.• S$600,000,000 4.88%
Subordinated Perpetual Securities (Series 3) (S$)
– – S$250,000,000 (2) S$250,000,000 (2)
• S$700,000,000 5.00% Subordinated Perpetual
Securities (Series 5) (S$)
– – S$300,000,000 (3) S$300,000,000 (3)
– Fraser and Neave, Limited• Ordinary Shares – – 1,270,503,884 (4) 1,270,503,884 (4)
– Fraser & Neave Holdings Bhd• Ordinary Shares – – 203,470,910 (5) 203,470,910 (5)
– TCC Assets Limited• Ordinary Shares 25,000 25,000 – –
Khunying Wanna Sirivadhanabhakdi– Frasers Centrepoint Limited
• Ordinary Shares – – 2,541,007,768 (1) 2,541,007,768 (1)
– FCL Treasury Pte. Ltd.• S$600,000,000 4.88%
Subordinated Perpetual Securities (Series 3) (S$)
– – S$250,000,000 (2) S$250,000,000 (2)
• S$700,000,000 5.00% Subordinated Perpetual
Securities (Series 5) (S$)
– – S$300,000,000 (3) S$300,000,000 (3)
– Fraser and Neave, Limited• Ordinary Shares – – 1,270,503,884 (4) 1,270,503,884 (4)
– Fraser & Neave Holdings Bhd• Ordinary Shares – – 203,470,910 (5) 203,470,910 (5)
– TCC Assets Limited• Ordinary Shares 25,000 25,000 – –
(1) As of 30 September 2016, Charoen Sirivadhanabhakdi and his spouse, Khunying Wanna Sirivadhanabhakdi are deemed to be interested in an aggregate of 2,541,007,768 shares in the Company.
Each of Charoen Sirivadhanabhakdi and Khunying Wanna Sirivadhanabhakdi owns 50% of the issued and paid-up share capital of TCC Assets Limited (“TCCA”), and is therefore deemed to be interested in all of the 1,716,160,124 shares in the Company in which TCCA has an interest.
Charoen Sirivadhanabhakdi and Khunying Wanna Sirivadhanabhakdi also jointly hold a 51% direct interest in Siriwana Company Limited, which in turn holds an approximate 45.27% direct interest in Thai Beverage Public Company Limited (“ThaiBev”).
Further, Charoen Sirivadhanabhakdi and Khunying Wanna Sirivadhanabhakdi also jointly hold a 100% direct interest in MM Group Limited (“MM Group”). MM Group holds a 100% direct interest in each of Maxtop Management Corp. (“Maxtop”), Risen Mark Enterprise Ltd. (“RM”) and Golden Capital (Singapore) Limited (“GC”). Maxtop holds a 17.23% direct interest in ThaiBev; RM holds a 3.32% direct interest in ThaiBev; and GC holds a 0.06% direct interest in ThaiBev.
ThaiBev holds a 100% direct interest in International Beverage Holdings Limited, which in turn holds a 100% direct interest in InterBev Investment Limited (“IBIL”). Each of Charoen Sirivadhanabhakdi and Khunying Wanna Sirivadhanabhakdi is therefore deemed to be interested in all of the 824,847,644 shares in the Company in which IBIL has an interest.
DIRECTORS’ STATEMENT

AN
NU
AL
RE
PO
RT
20
16
169
4. DIRECTORS’ INTERESTS IN SHARES AND DEBENTURES (CONT’D)
(2) As at 30 September 2016, TCC Prosperity Limited (“TCCP”) holds an aggregate of S$250 million perpetual securities issued by FCL Treasury Pte. Ltd. on 24 September 2014. Charoen Sirivadhanabhakdi and Khunying Wanna Sirivadhanabhakdi own all the shares in TCCP in equal shares, and therefore are deemed to be interested in the perpetual securities in which TCCP has an interest.
(3) As at 30 September 2016, TCC Prosperity Limited (“TCCP”) holds an aggregate of S$300 million perpetual securities issued by FCL Treasury Pte. Ltd. on 9 March 2015. Charoen Sirivadhanabhakdi and Khunying Wanna Sirivadhanabhakdi own all the shares in TCCP in equal shares, and therefore are deemed to be interested in the perpetual securities in which TCCP has an interest.
(4) As at 30 September 2016: – TCCA holds 858,080,062 shares in Fraser and Neave, Limited (“F&N”); and – IBIL holds 412,423,822 shares in F&N.
Each of Charoen Sirivadhanabhakdi and Khunying Wanna Sirivadhanabhakdi is therefore deemed to be interested in all of the shares in F&N in which TCCA and IBIL have an interest.
(5) As at 30 September 2016, F&N holds 203,470,910 shares in Fraser & Neave Holdings Bhd.
Therefore, each of Charoen Sirivadhanabhakdi and Khunying Wanna Sirivadhanabhakdi has a deemed interest in all of the shares in Fraser & Neave Holdings Bhd in which F&N has an interest.
(b) There was no change in any of the abovementioned interests in the Company between the end of the financial year and 21 October 2016, other than as disclosed in this statement.
(c) By virtue of Section 4 of the Singapore Securities and Futures Act, Chapter 289, each of Charoen Sirivadhanabhakdi and Khunying Wanna Sirivadhanabhakdi is deemed to have interests in the shares of the subsidiaries held by the Company and in the shares of the subsidiaries held by F&N.
(d) Except as disclosed in this statement, no Director who held office at the end of the financial year had any interest in shares in, or debentures of, the Company, or its related corporations, either at the beginning of the financial year, or date of appointment if later, or at the end of the financial year.
5. SHARE OPTIONS AND SHARE PLANS
(a) Share Options
The Company does not have any share option scheme or plans in place, or such scheme of plans that entitled holders to participate, by virtue of the scheme or plans, in any share issue of any other corporation.
(b) Share Plans
On 25 October 2013, F&N, which was then the sole shareholder of the Company, approved the adoption of the FCL Restricted Share Plan (“RSP”) and FCL Performance Share Plan (“PSP”, and together with the RSP, the “Share Plans”).
The Share Plans are administered by the Remuneration Committee which, as at the date of this statement, comprise the following three non-executive Directors who do not participate in the Share Plans:
Mr Philip Eng Heng Nee (Chairman) Mr Charles Mak Ming Ying Mr Chan Heng Wing*
*Note: Mr Chan Heng Wing was appointed as a member of the Remuneration Committee in place of Mr Panote Sirivadhanabhakdi on 1 October 2016.
DIRECTORS’ STATEMENT

FR
AS
ER
S C
EN
TR
EP
OIN
T L
IMIT
ED
& S
UB
SID
IAR
IES
170
5. SHARE OPTIONS AND SHARE PLANS (CONT’D)
(c) Share Grants under RSP and PSP
(i) Under the Share Plans, the Company grants awards to eligible participants annually, referred to herein as “RSP Awards” and “PSP Awards”, respectively. The grant (“Base Award”) represents the right to receive fully paid shares, their equivalent cash value or combinations thereof, free of charge, provided that certain prescribed performance conditions are met. The Remuneration Committee that administers this scheme has absolute discretion in the granting of awards under the Share Plans. The vesting of the RSP Base Award and the PSP Base Award are conditional on the achievement of pre-determined targets set for a two-year performance period and a three-year performance period respectively. An achievement factor will be determined based on the level of achievement of the pre-determined targets at the end of the respective performance period. The achievement factor will be applied to the relevant Base Award to determine the final number of shares to vest under the RSP Awards and PSP Awards (as the case may be, the “Final Award”). The achievement factor ranges from 0% to 150% for RSP and from 0% to 200% for PSP.
At the end of the performance period and after the achievement factor is determined, 50% of the RSP Final Awards will be released upon vesting and the balance will be released in equal number of shares over the subsequent two years upon the fulfilment of service requirements. All PSP Final Awards will be released to the participants at the end of the three-year performance period upon vesting. Pre-determined targets are set by the Remuneration Committee at their absolute discretion for the performance conditions to be met over the performance period. For the RSP, the targets set are the achievement of Attributable Profit Before Fair Value Adjustment and Exceptional Items (“APBFE”) and Return on Capital Employed (“ROCE”). For the PSP, the pre-set targets are based on Return on Invested Capital (“ROIC”), Total Shareholders’ Return Relative to FTSE ST Real Estate Index and Absolute Shareholders’ Return as a multiple of Cost of Equity.
Senior management participants are required to hold a minimum number of the shares released to them under the RSP and PSP to maintain a beneficial ownership stake in the Company for the duration of their employment or tenure with the Company.
No awards have been granted to controlling shareholders or their associates, or parent group directors and employees under the Share Plans.
No awards have been granted to Directors of the Company.
DIRECTORS’ STATEMENT

AN
NU
AL
RE
PO
RT
20
16
171
5. SHARE OPTIONS AND SHARE PLANS (CONT’D)
(c) Share Grants under RSP and PSP (cont’d)
(i) No employee other than Mr Lim Ee Seng, the former Group Chief Executive Officer who retired on 30 September 2016, and Mr Rod Fehring, Chief Executive Officer of Frasers Property Australia, have each received 5% or more of the total number of shares available/delivered for the financial year ended 30 September 2016, pursuant to grants under the Share Plans. Details of conditional awards available to Mr Lim and Mr Fehring under the Share Plans are as follows:
LIM EE SENG Grant Date
Balance as at 1.10.2015 or Grant Date if
later
Additional Awards / (Awards
Reduced) due to
Achievement Factor Vested
Balance as at 30.9.2016
RSP Awards– Replacement FCL
Awards*03.10.2014 446,129 – (297,004) 149,125
– Year 1 03.10.2014 574,627 137,873 (356,250) 356,250– Year 2 19.08.2015 603,538 – – 603,538– Year 3 22.12.2015 684,171 – – 684,171
Sub-Total 2,308,465 137,873 (653,254) 1,793,084
PSP Awards– Replacement FCL
Awards **03.10.2014 278,516 (11,116) (267,400) –
– Year 1 03.10.2014 354,839 – – 354,839– Year 2 19.08.2015 258,659 – – 258,659– Year 3 22.12.2015 293,216 – – 293,216
Sub-Total 1,185,230 (11,116) (267,400) 906,714Total 3,493,695 126,757 (920,654) 2,699,798
* The Replacement FCL Awards were granted to replace the 270,246 Outstanding F&N Awards. ** The Replacement FCL Awards were granted to replace the 179,828 Outstanding F&N Awards.
ROD FEHRING Grant Date
Balance as at 1.10.2015 or Grant Date if
later
Additional Awards / (Awards
Reduced) due to
Achievement Factor Vested
Balance as at 30.9.2016
RSP Awards– Year 2 19.08.2015 245,000 – – 245,000– Year 3 22.12.2015 534,000 – – 534,000
Total 779,000 – – 779,000
DIRECTORS’ STATEMENT

FR
AS
ER
S C
EN
TR
EP
OIN
T L
IMIT
ED
& S
UB
SID
IAR
IES
172
6. AUDIT COMMITTEE
The Audit Committee carried out its functions in accordance with Section 201B(5) of the Companies Act of Singapore (Chapter 50), which include, inter alia, the following:
(i) reviewed the quarterly and full-year financial statements of the Company and of the Group for the financial year and the independent auditors’ report for the full-year prior to approval by the Board;
(ii) reviewed the internal and external audit plans to ensure the adequacy of the audit scope;
(iii) reviewed the adequacy and effectiveness of the Group and the Company’s internal controls, including financial, operational and compliance controls and risk management;
(iv) reviewed with internal and external auditors, the respective audit reports and their recommendations, and monitoring the timely and proper implementation of any required corrective or improvement measures;
(v) reviewed the adequacy and effectiveness of the Group’s internal audit function, including the adequacy of internal audit resources and its appropriate standing within the Group;
(vi) met with the external and internal auditors, in each case without the presence of the Company’s management to review various audit matters as well as the assistance given by the Company’s management to the external and internal auditors;
(vii) reviewed the cost effectiveness, the independence and the objectivity of external auditors, including the nature and extent of non-audit services provided by the external auditors;
(viii) recommended to the Board the appointment, re-appointment and removal of the external auditors, and reviewed and approved the remuneration and terms of engagement of the external auditors; and
(ix) reviewed interested person transactions in accordance with the requirements of the Singapore Exchange Securities Trading Limited’s Listing Manual.
Further details regarding the Audit Committee are disclosed in the Corporate Governance Report.
Having reviewed the non-audit services provided by the external auditors to the Group, the Audit Committee is satisfied that the nature and extent of such services would not affect the independence of external auditors, and has recommended to the Board of Directors the re-appointment of KPMG LLP as auditors of the Company at the forthcoming Annual General Meeting.
DIRECTORS’ STATEMENT

AN
NU
AL
RE
PO
RT
20
16
173
7. AUDITORS
The auditors, KPMG LLP, have expressed their willingness to accept re-appointment as auditors.
On behalf of the Board
Charles Mak Ming Ying Sithichai ChaikriangkraiDirector Director
Singapore28 November 2016
DIRECTORS’ STATEMENT

FR
AS
ER
S C
EN
TR
EP
OIN
T L
IMIT
ED
& S
UB
SID
IAR
IES
174
REPORT ON THE AUDIT OF THE FINANCIAL STATEMENTS
Opinion
We have audited the accompanying financial statements of Frasers Centrepoint Limited (the “Company”) and its subsidiaries (the “Group”), which comprise the balance sheets of the Group and the Company as at 30 September 2016, the profit statements, statements of comprehensive income, statements of changes in equity of the Group and Company and the cash flow statements of the Group for the year then ended, and notes to the financial statements, including a summary of significant accounting policies and other explanatory information, as set out on pages 180 to 303.
In our opinion, the accompanying consolidated financial statements of the Group and the balance sheet and statement of changes in equity of the Company are properly drawn up in accordance with the provisions of the Companies Act, Chapter 50 and the Singapore Financial Reporting Standards (“FRS”) to give a true and fair view of the financial position of the Group and the Company as at 30 September 2016 and the financial performance, changes in equity and cash flows of the Group and the changes in equity of the Company for the year ended on that date.
Basis for opinion
We conducted our audit in accordance with Singapore Standards on Auditing (“SSA”). Our responsibilities under those standards are further described in the Auditors’ responsibilities for the audit of the financial statements section of our report. We are independent of the Group in accordance with the Accounting and Corporate Regulatory Authority (“ACRA”) Code of Professional Conduct and Ethics for Public Accountants and Accounting Entities (“ACRA Code”), together with the ethical requirements that are relevant to our audit of the financial statements in Singapore, and we have fulfilled our other ethical responsibilities in accordance with the ACRA Code. We believe that the audit evidence we have obtained is sufficient and appropriate to provide a basis for our opinion.
Key audit matters
Key audit matters are those matters that, in our professional judgement, were of most significance in our audit of the financial statements of the current period. These matters were addressed in the context of our audit of the financial statements as a whole, and in forming our opinion thereon, and we do not provide a separate opinion on these matters.
Valuation of investment properties (Refer to Note 11 to the financial statements)
Risk:
The Group owns a portfolio of investment properties (including investment properties under construction) comprising serviced residences, commercial and industrial properties that are leased to third parties under operating leases, located mainly in Australia, Singapore and United Kingdom. Investment properties represent the largest category of assets on the balance sheet, at $13.49 billion as at 30 September 2016.
These investment properties are stated at their fair values based on independent external valuations except for certain overseas properties whereby valuations are performed internally. In addition, investment properties under construction are stated at their fair values as determined by valuers which involves estimating the fair value of the completed investment property and then deducting from that amount the estimated costs to complete the construction and a reasonable profit margin on construction and development.
The valuation process involves significant judgement in determining the appropriate valuation methodology to be used, and in estimating the underlying assumptions to be applied. The valuations are sensitive to key assumptions applied in deriving future cash flows, the capitalisation rates, discount rates and terminal yield rates; where a change in the assumptions can have a significant impact to the valuation.
INDEPENDENT AUDITORS’ REPORTMEMBERS OF THE COMPANY FRASERS CENTREPOINT LIMITED

AN
NU
AL
RE
PO
RT
20
16
175
Our response:
We evaluated the qualifications and competence of the valuers and held discussions with the valuers to understand their valuation methods and assumptions and basis used, where appropriate.
We considered the valuation methodologies used against those applied by valuers for similar property types. We tested the integrity of inputs of the projected cash flows used in the valuation to supporting leases and other documents. We evaluated the appropriateness of the discount, capitalisation and terminal yield rates used in the valuation by comparing them against historical rates and available industry data, taking into consideration comparability and market factors. Where the rates were outside the expected range, we undertook further procedures to understand the effect of additional factors and, when necessary, held further discussions with the valuers. In addition, for investment properties under construction, we evaluated the estimated cost to complete by comparing the cost incurred to date to management budgets and, where the works were contracted to third parties, agreed to the contracts. We have also tested significant items of the cost components to source documents to ascertain the existence and accuracy of those cost components.
We also assessed whether the disclosures in the financial statements appropriately described the subjectivity and judgements inherent in the valuations and met the requirements of the relevant accounting standards.
Our findings:
We found the valuers to be objective and competent. The valuers are members of generally-recognised professional bodies for valuers. The valuation methodologies used are in line with generally accepted market practices and the key assumptions used are within the range of market data. For investment properties under construction, the estimated cost to complete were found to be supported. We also found the disclosures in the financial statements to be appropriate in their description of the degree of subjectivity and judgement in the key assumptions used in the valuations, including the inter-relationship between the key unobservable inputs and the fair values.
Recoverability of intangible assets (Refer to Note 16 to the financial statements)
Risk:
The Group has goodwill and other intangible assets comprising brands, favorable leases and others with an aggregate carrying value of $681.74 million as at 30 September 2016. These assets are impaired when their individual carrying value or the carrying value of the cash generating unit (“CGU”) of which the goodwill or intangible asset is allocated to, exceeds their recoverable amount. The recoverable amount is the higher of their fair value less costs of disposal and its value in use. Estimating the recoverable amount involves significant judgement in determining an appropriate model and the underlying assumptions to be applied; coupled with the inherent estimation uncertainties that arise when estimating and discounting future cash flows and estimating earnings multiples. The recoverable amount is sensitive to inputs and assumptions underlying the models used. Some of the key inputs and assumptions relate to expectations of future cash flows, growth rates used for extrapolation purposes, discount rates and earnings multiples.
Our response:
We evaluated the Group’s methodology and identification of CGU and assessed indicators of impairment for intangible assets where appropriate.
For goodwill, intangible assets with infinite useful life and intangible assets with indicators of impairment, we evaluated the cash flows used in the model against the understanding we obtained about the business through our audit and assess if these cash flows were reasonable. We challenged the appropriateness of key assumptions used by the Group in its impairment testing comprising the discount rate, growth rate and earnings multiples by comparing these to externally available market data for reasonableness. We also assessed whether or not the assumptions showed any evidence of management bias with a particular focus on the risk that the forecasted cash flows may not support the carrying value of the intangible assets.
INDEPENDENT AUDITORS’ REPORTMEMBERS OF THE COMPANY FRASERS CENTREPOINT LIMITED

FR
AS
ER
S C
EN
TR
EP
OIN
T L
IMIT
ED
& S
UB
SID
IAR
IES
176
We considered the adequacy of the Group’s disclosure and the requirements of accounting standards in respect of impairment testing.
Our findings:
The methodology and model used by the Group is supported by generally accepted market practices and we found that the assumptions and resulting estimates were balanced and the disclosures in the financial statement to be appropriate.
Foreseeable losses on properties held for sale(Refer to Note 20 to the financial statements)
Risk:
The Group has significant residential, industrial and commercial properties held for sale located primarily in Australia, China, Singapore and United Kingdom. These properties have a carrying value of $4.0 billion as at 30 September 2016 and are stated at the lower of their cost and their net realisable values. In arriving at estimates of net realisable values, we considered comparable properties and recent selling prices less the estimated costs of completion and the estimated costs necessary to make the sale. The determination of the estimated net realisable value of these properties is critically dependent upon the Group’s expectations of future selling prices.
The amount of unsold residential properties for sale in Singapore is not significant. However, weak demand and the consequential oversupply of properties for sale, arising from a challenging economic environment in certain states in China and Australia, might exert downward pressure on transaction volumes and properties prices in these markets. There is therefore a risk that the estimates of net realisable values may exceed future selling prices, resulting in more losses when properties are sold.
Our response:
We challenged the Group’s forecast selling prices by comparing the forecast selling prices to, where applicable, recently transacted prices and prices of comparable properties located in the same vicinity as the development or completed project. We focused our work on projects with slower-than-expected sales or with low or negative margins. For projects with units which are expected to sell below costs, we checked the computations of the foreseeable losses. We also considered the adequacy of the disclosures in respect of the allowance for foreseeable losses presented in the financial statements for these properties.
Our findings:
In estimating future selling price for the purpose of management’s assessment, the Group takes into account macroeconomic and real estate price trend information and planned capital management considerations. Management has applied its knowledge of the business in its regular review of these estimates.
We found that reasonable estimates were made in the determination of net realisable values and allowance for foreseeable losses. We also found the disclosures to be appropriate in describing the allowance for foreseeable losses made for development properties held for sale.
INDEPENDENT AUDITORS’ REPORTMEMBERS OF THE COMPANY FRASERS CENTREPOINT LIMITED

AN
NU
AL
RE
PO
RT
20
16
177
Accounting for investments in REITs(Refer to Note 13(a) to the financial statements)
Risk:
The Group’s capital management strategy involves the holding of a number of listed real estate investment trusts (“REIT”), which are managed by the Group. The Group holds differing levels of equity stakes in these REITs.
The accounting treatment for the investments in REITs is dependent on the Group’s relationship with the REITs. The determination of the Group’s relationship with these REITs is the result of accounting judgement on many factors principally, the extent of its voting stake holding, the relationship with other stakeholders, the constitutional arrangements for the trust, its manager and its trustee, and the extent to which the Group’s equity stake increases when management fees are paid in additional trust units. REITs that are determined to be subsidiaries are consolidated into the Group’s financial statements, whereas REITs that are determined to be associates are equity-accounted for. An inappropriate classification can have a material effect on the financial statements.
Our response:
We assessed the Group’s processes for the review and the determination of the accounting for its investments in REITs. We examined the legal documents and business arrangements relating to the constitution of the REITs, decision-making over their activities and operations of the manager. We also considered the economic stakes of the Group held through ownership interests in the REITs and the management fee arrangements; and the disclosure of the assessment of the relationships with the REITs.
Our findings:
The Group has processes in place to periodically review and re-assess its relationship with the REITs it manages and whether previously applied accounting treatments remain appropriate.
The judgements exercised by the Group in these processes reflect realistic assessments of its relationship with the REITs. The disclosures on the basis of accounting for the Group’s interests in these REITs are appropriate.
Other matter
The financial statements of the Company for the year ended 30 September 2015 were audited by another auditor who expressed an unmodified opinion on those statements on 19 November 2015.
Other information
Management is responsible for the other information. The other information comprises: Vision, Mission and FCL Group Strategies, FCL Group at a Glance, Our Global Presence, Our Milestones, Group Structure, Financial Highlights, Board of Directors, Group Management, Corporate Information, Chairman’s Statement, Group CEO’s Statement, Business Review, Investor Relations, Treasury Highlights, Sustainability Report, Awards and Accolades, Enterprise-wide Risk Management, Corporate Governance Report, Directors’ Statement, Particulars of Group Properties, Interested Person Transactions and FCL Fact Sheet, but does not include the financial statements and our auditors’ report thereon, which we obtained prior to the date of this auditors’ report, and Shareholding Statistics and Notice of Annual General Meeting (the “Reports”), which are expected to be made available to us after that date.
Our opinion on the financial statements does not cover the other information and we will not express any form of assurance conclusion thereon.
INDEPENDENT AUDITORS’ REPORTMEMBERS OF THE COMPANY FRASERS CENTREPOINT LIMITED

FR
AS
ER
S C
EN
TR
EP
OIN
T L
IMIT
ED
& S
UB
SID
IAR
IES
178
In connection with our audit of the financial statements, our responsibility is to read the other information identified above when it becomes available and, in doing so, consider whether the other information is materially inconsistent with the financial statements or our knowledge obtained in the audit, or otherwise appears to be materially misstated.
If, based on the work we have performed on the other information that we obtained prior to the date of this auditors’ report, we conclude that there is a material misstatement of this other information, we are required to report that fact. We have nothing to report in this regard.
When we read the other information made available to us after the date of this report, if we conclude that there is a material misstatement therein, we are required to communicate the matter to the directors of the Company and take appropriate actions in accordance with SSAs.
Responsibilities of management and directors for the financial statements
Management is responsible for the preparation of financial statements that give a true and fair view in accordance with the provisions of the Act and FRSs, and for devising and maintaining a system of internal accounting controls sufficient to provide a reasonable assurance that assets are safeguarded against loss from unauthorised use or disposition; and transactions are properly authorised and that they are recorded as necessary to permit the preparation of true and fair financial statements and to maintain accountability of assets.
In preparing the financial statements, management is responsible for assessing the Group’s ability to continue as a going concern, disclosing, as applicable, matters related to going concern and using the going concern basis of accounting unless management either intends to liquidate the Group or to cease operations, or has no realistic alternative but to do so.
The directors’ responsibilities include overseeing the Group’s financial reporting process.
Auditors’ responsibilities for the audit of the financial statements
Our objectives are to obtain reasonable assurance about whether the financial statements as a whole are free from material misstatement, whether due to fraud or error, and to issue an auditors’ report that includes our opinion. Reasonable assurance is a high level of assurance, but is not a guarantee that an audit conducted in accordance with SSAs will always detect a material misstatement when it exists. Misstatements can arise from fraud or error and are considered material if, individually or in the aggregate, they could reasonably be expected to influence the economic decisions of users taken on the basis of these financial statements.
As part of an audit in accordance with SSAs, we exercise professional judgement and maintain professional scepticism throughout the audit. We also:
• Identify and assess the risks of material misstatement of the financial statements, whether due to fraud or error, design and perform audit procedures responsive to those risks, and obtain audit evidence that is sufficient and appropriate to provide a basis for our opinion. The risk of not detecting a material misstatement resulting from fraud is higher than for one resulting from error, as fraud may involve collusion, forgery, intentional omissions, misrepresentations, or the override of internal controls.
• Obtain an understanding of internal control relevant to the audit in order to design audit procedures that are appropriate in the circumstances, but not for the purpose of expressing an opinion on the effectiveness of the Group’s internal controls.
• Evaluate the appropriateness of accounting policies used and the reasonableness of accounting estimates and related disclosures made by management.
INDEPENDENT AUDITORS’ REPORTMEMBERS OF THE COMPANY FRASERS CENTREPOINT LIMITED

AN
NU
AL
RE
PO
RT
20
16
179
• Conclude on the appropriateness of management’s use of the going concern basis of accounting and, based on the audit evidence obtained, whether a material uncertainty exists related to events or conditions that may cast significant doubt on the Group’s ability to continue as a going concern. If we conclude that a material uncertainty exists, we are required to draw attention in our auditors’ report to the related disclosures in the financial statements or, if such disclosures are inadequate, to modify our opinion. Our conclusions are based on the audit evidence obtained up to the date of our auditors’ report. However, future events or conditions may cause the Group to cease to continue as a going concern.
• Evaluate the overall presentation, structure and content of the financial statements, including the disclosures, and whether the financial statements represent the underlying transactions and events in a manner that achieves fair presentation.
• Obtain sufficient appropriate audit evidence regarding the financial information of the entities or business activities within the Group to express an opinion on the consolidated financial statements. We are responsible for the direction, supervision and performance of the group audit. We remain solely responsible for our audit opinion.
We communicate with the directors regarding, among other matters, the planned scope and timing of the audit and significant audit findings, including any significant deficiencies in internal control that we identify during our audit.
We also provide the directors with a statement that we have complied with relevant ethical requirements regarding independence, and to communicate with them all relationships and other matters that may reasonably be thought to bear on our independence, and where applicable, related safeguards.
From the matters communicated with the directors, we determine those matters that were of most significance in the audit of the financial statements of the current period and are therefore the key audit matters. We describe these matters in our auditors’ report unless law or regulation precludes public disclosure about the matter or when, in extremely rare circumstances, we determine that a matter should not be communicated in our report because the adverse consequences of doing so would reasonably be expected to outweigh the public interest benefits of such communication.
REPORT ON OTHER LEGAL AND REGULATORY REQUIREMENTS
In our opinion, the accounting and other records required by the Act to be kept by the Company and by those subsidiary corporations incorporated in Singapore of which we are the auditors have been properly kept in accordance with the provisions of the Act.
The engagement partner on the audit resulting in this independent auditors’ report is Ronald Tay Ser Teck.
KPMG LLPPublic Accountants andChartered Accountants
Singapore28 November 2016
INDEPENDENT AUDITORS’ REPORTMEMBERS OF THE COMPANY FRASERS CENTREPOINT LIMITED

FR
AS
ER
S C
EN
TR
EP
OIN
T L
IMIT
ED
& S
UB
SID
IAR
IES
180
Group2016 2015
Note $’000 $’000
REVENUE 3 3,439,592 3,561,525Cost of sales 4a (2,406,856) (2,479,360)
GROSS PROFIT 1,032,736 1,082,165Other income/(losses) 4b (6,527) (8,400)Administrative expenses 4c (259,387) (248,433)
TRADING PROFIT 4 766,822 825,332Share of results of joint ventures and associates, net of tax 14 171,377 279,430
PROFIT BEFORE INTEREST, FAIR VALUE CHANGE, TAXATION AND EXCEPTIONAL ITEMS 938,199 1,104,762
Interest income 5 25,296 36,799Interest expense 6 (167,504) (186,157)
NET INTEREST EXPENSE (142,208) (149,358)
PROFIT BEFORE FAIR VALUE CHANGE, TAXATION AND EXCEPTIONAL ITEMS 795,991 955,404Fair value change on investment properties 11 159,711 243,350
PROFIT BEFORE TAXATION AND EXCEPTIONAL ITEMS 955,702 1,198,754Exceptional items 7 4,641 (2,205)
PROFIT BEFORE TAXATION 960,343 1,196,549Taxation 8 (194,197) (184,174)
PROFIT FOR THE YEAR 766,146 1,012,375
ATTRIBUTABLE PROFIT: – before fair value change and exceptional items 479,863 543,830 – fair value change 106,250 219,612 – exceptional items 11,106 7,832
597,219 771,274Non-controlling interests 168,927 241,101
PROFIT FOR THE YEAR 766,146 1,012,375
EARNINGS PER SHARE 9Basic earnings per share 18.4¢ 25.0¢Diluted earnings per share 18.2¢ 24.9¢
The accompanying notes form an integral part of the financial statements.
CONSOLIDATED PROFIT STATEMENT FOR THE YEAR ENDED 30 SEPTEMBER 2016

AN
NU
AL
RE
PO
RT
20
16
181
Group2016 2015
$’000 $’000
PROFIT FOR THE YEAR 766,146 1,012,375
OTHER COMPREHENSIVE INCOME
Items that may be reclassified subsequently to profit statement:Net fair value change of cash flow hedges (123,726) 33,718Foreign currency translation 21,143 (475,431)Share of other comprehensive income of joint ventures and associates (56) 175Realisation of reserves on disposal of a joint venture and an associate – (1,277)
Other comprehensive income for the year, net of tax (102,639) (442,815)
TOTAL COMPREHENSIVE INCOME FOR THE YEAR 663,507 569,560
ATTRIBUTABLE TO: – shareholders of the Company 427,323 357,834 – holders of perpetual securities 64,456 46,924 – non-controlling interests 171,728 164,802
TOTAL COMPREHENSIVE INCOME FOR THE YEAR 663,507 569,560
The accompanying notes form an integral part of the financial statements.
CONSOLIDATED STATEMENT OF COMPREHENSIVE INCOME FOR THE YEAR ENDED 30 SEPTEMBER 2016

FR
AS
ER
S C
EN
TR
EP
OIN
T L
IMIT
ED
& S
UB
SID
IAR
IES
182
Group Company30 September 30 September 30 September 30 September
2016 2015 2016 2015Note $’000 $’000 $’000 $’000
NON-CURRENT ASSETSInvestment properties 11 13,494,019 12,951,192 1,600 1,600Property, plant and equipment 12 1,972,282 1,991,014 1 –Investments in: – subsidiaries 13 – – 1,799,896 1,672,524 – joint ventures 14 240,213 334,928 500 500 – associates 14 552,800 250,460 – –Financial assets 15 2,162 2,165 2,148 2,148Intangible assets 16 681,736 721,164 – –Prepayments 17 3,074 8,349 – –Other receivables 18 228,644 241,476 1,414,431 2,721,722Deferred tax assets 19 55,160 169,724 – –Derivative financial instruments 21 2,136 55,935 225 19,463
17,232,226 16,726,407 3,218,801 4,417,957
CURRENT ASSETSInventory 5,679 7,473 – –Properties held for sale 20 3,997,551 3,922,672 – –Prepaid land and development costs 17 60,455 19,877 – –Other prepayments 17 52,602 41,328 51 47Trade and other receivables 18 677,821 843,505 1,960,927 293,465Derivative financial instruments 21 9,361 20,167 – 5,352Bank deposits 22 437,337 – – –Cash and cash equivalents 22 1,731,343 1,373,140 67,516 9,064Assets held for sale 23 – 112,123 – –
6,972,149 6,340,285 2,028,494 307,928
TOTAL ASSETS 24,204,375 23,066,692 5,247,295 4,725,885
CURRENT LIABILITIESTrade and other payables 24 1,694,961 1,314,648 196,222 29,865Derivative financial instruments 21 46,924 24,602 263 8,006Provision for taxation 236,971 192,953 14,905 12,510Loans and borrowings 25 1,470,116 1,020,137 – –
3,448,972 2,552,340 211,390 50,381
NET CURRENT ASSETS 3,523,177 3,787,945 1,817,104 257,54720,755,403 20,514,352 5,035,905 4,675,504
NON-CURRENT LIABILITIESOther payables 24 290,426 253,751 1,308 207,077Derivative financial instruments 21 89,994 36,592 32,484 19,617Deferred tax liabilities 19 206,078 317,736 – –Loans and borrowings 25 8,325,421 9,255,320 – –
8,911,919 9,863,399 33,792 226,694
NET ASSETS 11,843,484 10,650,953 5,002,113 4,448,810
SHARE CAPITAL AND RESERVESShare capital 26 1,766,800 1,759,858 1,766,800 1,759,858Retained earnings 5,222,073 4,995,420 3,033,213 2,490,922Other reserves 27 (327,733) (245,798) 202,100 198,030Equity attributable to Owners of the Company 6,661,140 6,509,480 5,002,113 4,448,810NON-CONTROLLING INTERESTS – PERPETUAL SECURITIES 29 1,391,783 1,293,254 – –
8,052,923 7,802,734 5,002,113 4,448,810NON-CONTROLLING INTERESTS – OTHERS 3,790,561 2,848,219 – –TOTAL EQUITY 11,843,484 10,650,953 5,002,113 4,448,810
The accompanying notes form an integral part of the financial statements.
BALANCE SHEETS AS AT 30 SEPTEMBER 2016

AN
NU
AL
RE
PO
RT
20
16
183
Attributable to Owners of the Company
Share Capital
(Note 26)Retained Earnings
Other Reserves,(Note 27)
Equity Attributable
to Owners of the
Company,Total
Non-Controlling
Interest –PerpetualSecurities(Note 29) Total
Non-ControllingInterests –
OthersTotal
Equity$’000 $’000 $’000 $’000 $’000 $’000 $’000 $’000
Group2016
Opening balance at 1 October 2015 1,759,858 4,995,420 (245,798) 6,509,480 1,293,254 7,802,734 2,848,219 10,650,953Profit for the year – 532,763 – 532,763 64,456 597,219 168,927 766,146
Other comprehensive incomeNet fair value change of cash flow hedges – – (103,204) (103,204) – (103,204) (20,522) (123,726)Foreign currency translation – – (2,180) (2,180) – (2,180) 23,323 21,143Share of other comprehensive income of joint ventures and associates – (20,588) 20,532 (56) – (56) – (56)Other comprehensive income for the year, net of tax – (20,588) (84,852) (105,440) – (105,440) 2,801 (102,639)Total comprehensive income for the year – 512,175 (84,852) 427,323 64,456 491,779 171,728 663,507
Contributions by and distributions to ownersOrdinary shares issued 6,942 – (6,942) – – – – –Employee share-based expense – – 10,189 10,189 – 10,189 – 10,189Dividends paid (Note 30) – (69,909) (179,491) (249,400) – (249,400) (206,821) (456,221)Dividends proposed (Note 30) – (179,800) 179,800 – – – – –Total contributions by and distributions to owners 6,942 (249,709) 3,556 (239,211) – (239,211) (206,821) (446,032)
Changes in ownership interests in subsidiariesUnits issued to non-controlling interests – – – – – – 1,000,475 1,000,475Acquisition of non-controlling interests in subsidiaries without change in control – (42,173) – (42,173) – (42,173) 411 (41,762)Change in interests in subsidiaries without change in control – 16,544 (639) 15,905 – 15,905 (4,658) 11,247Issuance costs incurred by subsidiaries – (10,184) – (10,184) – (10,184) (18,793) (28,977)Total changes in ownership interests in subsidiaries – (35,813) (639) (36,452) – (36,452) 977,435 940,983Total transactions with owners in their capacity as owners 6,942 (285,522) 2,917 (275,663) – (275,663) 770,614 494,951
Contributions by and distributions to perpetual securities holdersIssue of perpetual securities, net of costs – – – – 98,529 98,529 – 98,529Distributions to perpetual securities holders – – – – (64,456) (64,456) – (64,456)Total contributions by and distributions to perpetual securities holders – – – – 34,073 34,073 – 34,073
Closing balance at 30 September 2016 1,766,800 5,222,073 (327,733) 6,661,140 1,391,783 8,052,923 3,790,561 11,843,484
The accompanying notes form an integral part of the financial statements.
STATEMENTS OF CHANGES IN EQUITY FOR THE YEAR ENDED 30 SEPTEMBER 2016

FR
AS
ER
S C
EN
TR
EP
OIN
T L
IMIT
ED
& S
UB
SID
IAR
IES
184
Attributable to Owners of the Company
Share Capital
(Note 26)Retained Earnings
Other Reserves,(Note 27)
Equity Attributable
to Owners of the
Company,Total
Non-Controlling
Interest –PerpetualSecurities(Note 29) Total
Non-ControllingInterests –
OthersTotal
Equity$’000 $’000 $’000 $’000 $’000 $’000 $’000 $’000
Group2015
Opening balance at 1 October 2014 1,753,977 4,543,167 117,154 6,414,298 597,654 7,011,952 2,611,598 9,623,550Profit for the year – 724,350 – 724,350 46,924 771,274 241,101 1,012,375
Other comprehensive incomeNet fair value change of cash flow hedges – – 24,839 24,839 – 24,839 8,879 33,718Foreign currency translation – – (390,253) (390,253) – (390,253) (85,178) (475,431)Share of other comprehensive income of joint ventures and associates – – 175 175 – 175 – 175Realisation of reserves on disposal of a joint venture and an associate – – (1,277) (1,277) – (1,277) – (1,277)Other comprehensive income for the year, net of tax – – (366,516) (366,516) – (366,516) (76,299) (442,815)Total comprehensive income for the year – 724,350 (366,516) 357,834 46,924 404,758 164,802 569,560
Contributions by and distributions to ownersOrdinary shares issued 5,881 – (5,881) – – – – –Employee share-based expense – – 9,003 9,003 – 9,003 – 9,003Dividends paid (Note 30) – (69,803) (179,168) (248,971) – (248,971) (185,938) (434,909)Dividends proposed (Note 30) – (179,491) 179,491 – – – – –Total contributions by and distributions to owners 5,881 (249,294) 3,445 (239,968) – (239,968) (185,938) (425,906)
Changes in ownership interests in subsidiariesDilution of interests in subsidiaries without change in control – (22,223) 45 (22,178) – (22,178) 259,039 236,861Issuance costs incurred by subsidiaries – (580) 74 (506) – (506) (1,282) (1,788)Total changes in ownership interests in subsidiaries – (22,803) 119 (22,684) – (22,684) 257,757 235,073Total transactions with owners in their capacity as owners 5,881 (272,097) 3,564 (262,652) – (262,652) 71,819 (190,833)
Contributions by and distributions to perpetual securities holdersIssue of perpetual securities, net of costs – – – – 695,600 695,600 – 695,600Distributions to perpetual securities holders – – – – (46,924) (46,924) – (46,924)Total contributions by and distributions to perpetual securities holders – – – – 648,676 648,676 – 648,676
Closing balance at 30 September 2015 1,759,858 4,995,420 (245,798) 6,509,480 1,293,254 7,802,734 2,848,219 10,650,953
The accompanying notes form an integral part of the financial statements.
STATEMENTS OF CHANGES IN EQUITY FOR THE YEAR ENDED 30 SEPTEMBER 2016 (CONT’D)

AN
NU
AL
RE
PO
RT
20
16
185
ShareCapital
(Note 26)RetainedEarnings
OtherReserves(Note 27)
HedgingReserve
Share-basedCompensation
ReserveDividendReserve
Total Equity
$’000 $’000 $’000 $’000 $’000 $’000 $’000
Company2016
Opening balance at 1 October 2015 1,759,858 2,490,922 198,030 3,217 15,322 179,491 4,448,810
Profit for the year – 792,000 – – – – 792,000
Other comprehensive incomeNet fair value change of cash
flow hedges – – 483 483 – – 483Total comprehensive income for the year – 792,000 483 483 – – 792,483
Contributions by and distributions to ownersOrdinary shares issued 6,942 – (6,942) – (6,942) – –Employee share-based expense – – 10,220 – 10,220 – 10,220Dividends paid (Note 30) – (69,909) (179,491) – – (179,491) (249,400)Dividends proposed (Note 30) – (179,800) 179,800 – – 179,800 –Total contributions by and distributions to owners 6,942 (249,709) 3,587 – 3,278 309 (239,180)
Closing balance at 30 September 2016 1,766,800 3,033,213 202,100 3,700 18,600 179,800 5,002,113
The accompanying notes form an integral part of the financial statements.
STATEMENTS OF CHANGES IN EQUITY FOR THE YEAR ENDED 30 SEPTEMBER 2016 (CONT’D)
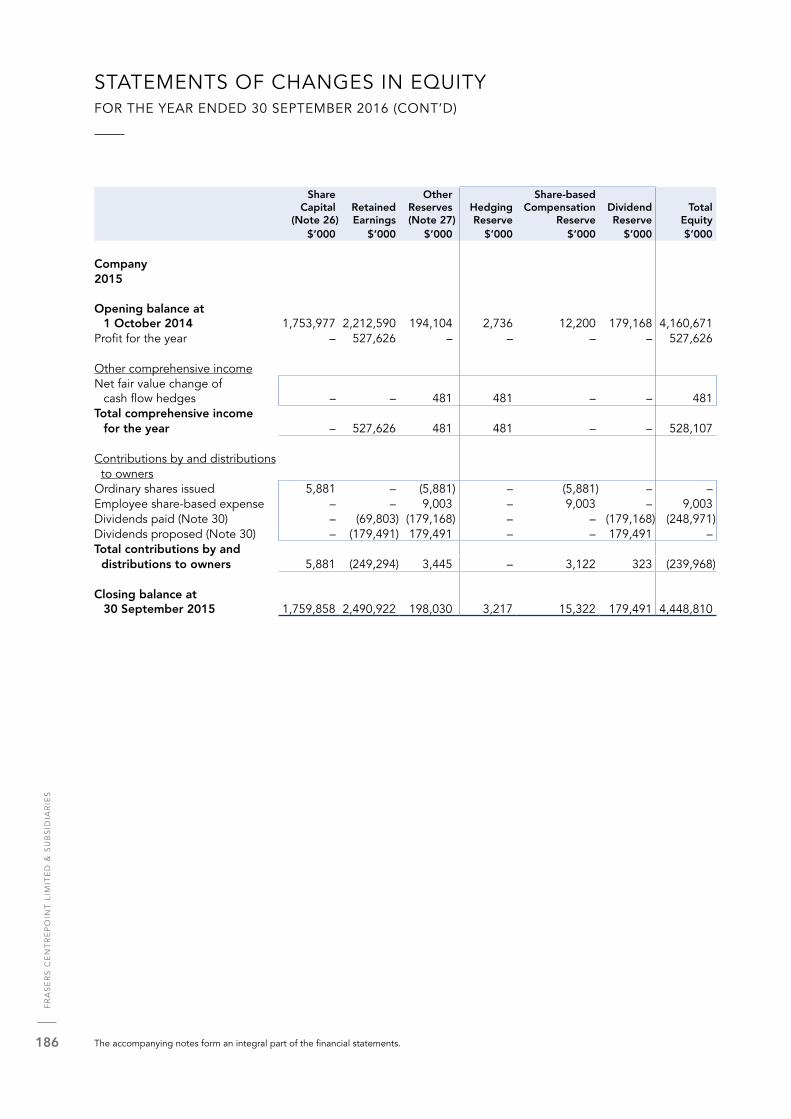
FR
AS
ER
S C
EN
TR
EP
OIN
T L
IMIT
ED
& S
UB
SID
IAR
IES
186
ShareCapital
(Note 26)RetainedEarnings
OtherReserves(Note 27)
HedgingReserve
Share-basedCompensation
ReserveDividendReserve
Total Equity
$’000 $’000 $’000 $’000 $’000 $’000 $’000
Company2015
Opening balance at 1 October 2014 1,753,977 2,212,590 194,104 2,736 12,200 179,168 4,160,671
Profit for the year – 527,626 – – – – 527,626
Other comprehensive incomeNet fair value change of
cash flow hedges – – 481 481 – – 481Total comprehensive income for the year – 527,626 481 481 – – 528,107
Contributions by and distributions to ownersOrdinary shares issued 5,881 – (5,881) – (5,881) – –Employee share-based expense – – 9,003 – 9,003 – 9,003Dividends paid (Note 30) – (69,803) (179,168) – – (179,168) (248,971)Dividends proposed (Note 30) – (179,491) 179,491 – – 179,491 –Total contributions by and distributions to owners 5,881 (249,294) 3,445 – 3,122 323 (239,968)
Closing balance at 30 September 2015 1,759,858 2,490,922 198,030 3,217 15,322 179,491 4,448,810
The accompanying notes form an integral part of the financial statements.
STATEMENTS OF CHANGES IN EQUITY FOR THE YEAR ENDED 30 SEPTEMBER 2016 (CONT’D)

AN
NU
AL
RE
PO
RT
20
16
187
Group2016 2015
Note $’000 $’000
CASH FLOW FROM OPERATING ACTIVITIESProfit after taxation 766,146 1,012,375Adjustments for: Depreciation of property, plant and equipment 12 52,877 40,027 Fair value change on investment properties (159,711) (243,350) Share of results of joint ventures and associates, net of tax 14 (171,377) (279,430) Amortisation of intangible assets 16 1,646 741 Loss on disposal of property, plant and equipment 4b 849 388 Allowance for doubtful trade receivables, net 4a 2,504 154 Bad debts written off 103 10 Write-down to net realisable value of properties held for sale 4a 47,110 45,417 Employee share-based expense 4c 10,189 9,003 Goodwill on acquisition of subsidiaries written off 7 1,129 – Gain on acquisition of an associate 7 (954) – Gain on disposal of a subsidiary 4b – (37,506) Gain on disposal of joint ventures and associates 7 (15,483) (13,954) Net fair value change on foreign currency forward contracts 4b (13,960) 10,346 Interest income 5 (25,296) (36,799) Interest expense 6 167,504 186,157 Tax expense 8 194,197 184,174 Exchange difference 29,835 (234,493)
Operating cash flow before working capital changes 887,308 643,260Change in trade and other receivables 156,698 436,097Change in trade and other payables 424,654 (628,293)Change in properties held for sale (241,446) 327,262Change in inventory 4,172 (155)
Cash generated from operations 1,231,386 778,171Income taxes paid (134,407) (94,107)
Net cash generated from operating activities 1,096,979 684,064
CASH FLOW FROM INVESTING ACTIVITIESAcquisition of/development expenditure on investment properties 11 (717,619) (1,526,508)Purchase of property, plant and equipment 12 (62,269) (45,280)Proceeds from disposal of investment properties 11 452,141 –Proceeds from disposal of property, plant and equipment 88 2Investments in/loans to joint ventures and associates (374,725) (151,823)Repayments of loans from joint ventures and associates 40,223 93,896Dividends from joint ventures and associates 196,535 349,924Settlement of hedging instruments 31,176 25,489Interest received 17,547 34,981Acquisition of subsidiaries, net of cash acquired 13b (77,010) (257,698)Disposal of a subsidiary, net of cash disposed of 78,933 (9,820)Proceeds from disposal of joint ventures and associates 17,875 86,307Proceeds from disposal of assets held for sale 112,746 –Purchase of structured deposits (437,337) –
Net cash used in investing activities (721,696) (1,400,530)
The accompanying notes form an integral part of the financial statements.
CONSOLIDATED CASH FLOW STATEMENT FOR THE YEAR ENDED 30 SEPTEMBER 2016

FR
AS
ER
S C
EN
TR
EP
OIN
T L
IMIT
ED
& S
UB
SID
IAR
IES
188
Group2016 2015
Note $’000 $’000
CASH FLOW FROM FINANCING ACTIVITIESContributions from non-controlling interests of subsidiaries
without change in control 1,000,475 236,861Dividends paid to non-controlling interests (206,821) (185,938)Dividends paid to shareholders (249,400) (248,971)Proceeds from bank borrowings 2,335,102 4,319,825Repayment of bank borrowings (3,275,214) (3,881,100)Proceeds from issue of retail bonds, net of costs 521,401 497,518Proceeds from issue of perpetual securities, net of costs 29 98,529 695,600Distributions to perpetual securities holders (64,456) (46,924)Interest paid (165,687) (166,057)Issuance costs (23,665) (1,788)Repayment of amounts due to non-controlling interests (26,487) –
Net cash (used in)/generated from financing activities (56,223) 1,219,026
Net change in cash and cash equivalents 319,060 502,560Cash and cash equivalents at beginning of year 1,367,505 867,938Effects of exchange rate on opening cash 41,632 (2,993)
Cash and cash equivalents at end of year 1,728,197 1,367,505
Cash and cash equivalents at end of period: Fixed deposits, current 587,768 642,127 Cash and bank balances 1,143,575 731,013
22 1,731,343 1,373,140Bank overdraft, unsecured 25 (3,146) (5,635)
Cash and cash equivalents at end of year 1,728,197 1,367,505
Analysis of Acquisitions of Subsidiaries
Net assets acquired: Property, plant and equipment 76,126 548,137 Intangible assets – 204,103 Inventories 2,378 24,422 Trade and other payables (2,647) (85,062) Provision for taxation (66) – Non-current liabilities – (493,979) Cash and cash equivalents 1,388 28,088
Fair value of net assets 77,179 225,709Goodwill on acquisition of subsidiaries 1,129 60,077Exchange difference 90 –
Consideration paid in cash 78,398 285,786Cash and cash equivalents of subsidiaries acquired (1,388) (28,088)
Cash flow on acquisition, net of cash and cash equivalents acquired 13b 77,010 257,698
CONSOLIDATED CASH FLOW STATEMENT FOR THE YEAR ENDED 30 SEPTEMBER 2016 (CONT’D)

AN
NU
AL
RE
PO
RT
20
16
189
Group2016 2015
Note $’000 $’000
Analysis of Disposal of Subsidiary
Net assets disposed: Property, plant and equipment – (19) Properties held for sale – (62,313) Trade and other receivables – (1,128) Cash and cash equivalents – (9,820) Trade and other payables – 2,414 Provision for taxation – 3,109 Loans and borrowings – 26,330
– (41,427)Gain on disposal – (37,506)
Consideration received – (78,933)Less: Cash of subsidiary disposed of – 9,820Less: Cash held in escrow account 18 – 78,933
Net cash outflow on disposal of subsidiary – 9,820
The accompanying notes form an integral part of the financial statements.
CONSOLIDATED CASH FLOW STATEMENT FOR THE YEAR ENDED 30 SEPTEMBER 2016 (CONT’D)

FR
AS
ER
S C
EN
TR
EP
OIN
T L
IMIT
ED
& S
UB
SID
IAR
IES
190
NOTES TO THE FINANCIAL STATEMENTSFOR THE YEAR ENDED 30 SEPTEMBER 2016
These notes form an integral part of the financial statements.
The financial statements for the financial year ended 30 September 2016 were authorised for issue in accordance with a resolution of the Directors on 28 November 2016.
1. CORPORATE INFORMATION
Frasers Centrepoint Limited (the “Company”) is a limited liability company incorporated and domiciled in Singapore. On 9 January 2014, the Company commenced trading on the Main Board of the Singapore Exchange Securities Trading Limited (“SGX-ST”). TCC Assets Limited, incorporated in the British Virgin Islands, is the immediate and ultimate holding company.
The registered office and principal place of business of the Company is located at 438 Alexandra Road, #21-00 Alexandra Point, Singapore 119958.
The principal activity of the Company is investment holding.
The principal activities of the significant subsidiaries, joint arrangements and associates are set out in Note 40.
2. SUMMARY OF SIGNIFICANT ACCOUNTING POLICIES
2.1 Basis of Preparation
The complete set of consolidated financial statements of the Company and its subsidiaries (collectively, the “Group”) and the Group’s interest in equity-accounted investees as at and for the year ended 30 September 2016 are prepared in accordance with Singapore Financial Reporting Standards (“FRS”).
The consolidated financial statements of the Group and the balance sheet and statement of changes in equity of the Company are prepared on the historical cost basis except as disclosed in the accounting policies below.
The financial statements are presented in Singapore Dollars (“$” or “S$”). All financial information presented in Singapore Dollars has been rounded to the nearest thousand, unless otherwise stated.
The Group and the Company have applied the same accounting policies and methods of computation in the preparation of the financial statements for the current financial year and are consistent with those used in the previous financial year.
2.2 Significant Accounting Judgements and Estimates
The preparation of the Group’s consolidated financial statements in conformity with FRS requires management to make judgements, estimates and assumptions that affect the application of accounting policies and the reported amounts of assets, liabilities, income and expenses and the disclosure of contingent liabilities at the balance sheet date. The estimates and associated assumptions are based on historical experience and various other factors that are believed to be reasonable under the circumstances, the results of which form the basis of making judgements about carrying values of assets and liabilities and which are not readily apparent from other sources.
Estimates and underlying assumptions are revised on an ongoing basis. Revisions to accounting estimates are recognised in the period in which the estimate is revised, if the revision affects only that period, or in the period of the revision and future periods, if the revision affects both current and future periods.

AN
NU
AL
RE
PO
RT
20
16
191
NOTES TO THE FINANCIAL STATEMENTSFOR THE YEAR ENDED 30 SEPTEMBER 2016
2. SUMMARY OF SIGNIFICANT ACCOUNTING POLICIES (CONT’D)
2.2 Significant Accounting Judgements and Estimates (cont’d)
(a) Key Sources of Estimation Uncertainty
The key assumptions concerning the future and other key sources of estimation uncertainty at the reporting date, that have a significant risk of causing a material adjustment to the carrying amounts of assets and liabilities within the next financial year are discussed below.
(i) Revenue Recognition and Estimation of Total Development Costs
For Singapore property development projects under progressive payment scheme, the Group recognises revenue and cost of sales from development properties held for sale based on the percentage of completion method. The stage of completion is measured in accordance with the accounting policy stated in Note 2.18. Estimates are required in determining the total estimated development costs which will affect the stage of completion. In making these assumptions, the Group relies on references to information such as current offers and/or recent contracts with contractors and suppliers, estimation of construction and material costs based on historical experience, and the work of professional surveyors and architects. Revenue from development properties held for sale is disclosed in Note 3.
(ii) Valuation of Completed Investment Properties
The Group’s completed investment properties are stated at their fair values, which are determined annually. The fair values are based on independent professional valuations conducted annually, except for certain overseas properties whereby valuations are performed internally every year and at least once every two years; independent professional valuations are obtained for cross-checking purposes. The fair value of completed investment properties is determined using a combination of the market comparison method, discounted cash flow method and capitalisation method. These estimated market values may differ from the prices at which the Group’s completed investment properties could be sold at a particular time, since actual selling prices are negotiated between willing buyers and sellers. Also, certain estimates require an assessment of factors not within the directors’ control, such as overall market conditions. As a result, actual results of operations and realisation of these completed investment properties could differ from the estimates set forth in these financial statements, and the difference could be significant. The carrying amount of completed investment properties is disclosed in the Group’s balance sheet.
The Group’s valuation policies and procedures are disclosed in Notes 11 and 34.
(iii) Valuation of Investment Properties under Construction (“IPUC”)
IPUC are measured at fair value if they can be reliably determined. If fair values cannot be reliably determined, then IPUC are recorded at cost. The fair values of IPUC are determined using a combination of market comparison method, discounted cash flow method and residual land value method which considers the significant risks which are relevant to the development process, including but not limited to construction and letting risks.
The Group’s valuation policies and procedures are disclosed in Notes 11 and 34.

FR
AS
ER
S C
EN
TR
EP
OIN
T L
IMIT
ED
& S
UB
SID
IAR
IES
192
NOTES TO THE FINANCIAL STATEMENTSFOR THE YEAR ENDED 30 SEPTEMBER 2016
2. SUMMARY OF SIGNIFICANT ACCOUNTING POLICIES (CONT’D)
2.2 Significant Accounting Judgements and Estimates (cont’d)
(a) Key Sources of Estimation Uncertainty (cont’d)
(iv) Net Realisable Value of Properties Held for Sale
Properties held for sale are carried at lower of cost and net realisable value.
A write-down to net realisable value is made for properties held for sale when the net realisable value has fallen below cost. In arriving at estimates of net realisable values, management considers factors such as current market conditions, recent selling prices of the development properties and comparable development properties less the estimated costs of completion and the estimated costs necessary to make the sale.
The carrying amounts of properties held for sale are disclosed in Note 20.
(v) Impairment of Intangible Assets – Goodwill and Brands
Impairment exists when the carrying value of an asset or cash generating unit (“CGU”) exceeds its recoverable amount, which is the higher of its fair value less costs of disposal and its value in use. The fair value less costs of disposal calculation is based on available data from binding sales transactions, conducted at arm’s length, for similar assets or observable market prices less incremental costs for disposing of the asset. The value in use calculation is based on a discounted cash flow (“DCF”) model. The cash flows are derived from the budget for the next five years and do not include restructuring activities that the Group is not yet committed to or significant future investments that will enhance the asset’s performance of the CGU being tested. The recoverable amount is sensitive to the discount rate used for the DCF model as well as the expected future cash-inflows and the growth rate used for extrapolation purposes. These estimates are most relevant to goodwill recognised by the Group. The key assumptions used to determine the recoverable amount for the different CGUs are disclosed and further explained in Note 16.
The valuations of the goodwill arising from business combinations and Brands are disclosed in Notes 13(b) and 16.
(vi) Income Taxes
The Group has exposure to income taxes in numerous jurisdictions. Significant assumptions are required in determining the group-wide provision for income taxes. The ultimate tax determination of taxability of income and deductibility of expenses from certain transactions are uncertain during the ordinary course of business. The tax computations of newly created tax consolidated groups arising from business combinations would also be subject to uncertainty and formal assessment by tax authorities. The Group recognises the liabilities for expected tax issues based on estimates of whether additional taxes will be due. Where the final tax outcome of these matters is different from the amounts that were initially recognised, such differences will impact the income tax and deferred tax provisions in the period in which such determination is made. The carrying amounts of provision for taxation, deferred tax assets and liabilities are as disclosed in the Group’s balance sheet.

AN
NU
AL
RE
PO
RT
20
16
193
NOTES TO THE FINANCIAL STATEMENTSFOR THE YEAR ENDED 30 SEPTEMBER 2016
2. SUMMARY OF SIGNIFICANT ACCOUNTING POLICIES (CONT’D)
2.2 Significant Accounting Judgements and Estimates (cont’d)
(a) Key Sources of Estimation Uncertainty (cont’d)
(vii) Land Appreciation Tax
Under the Provisional Regulations on Land Appreciation Tax (“LAT”) implemented upon the issuance of the Provisional Regulations of the People’s Republic of China on 27 January 1995, all gains arising from the transfer of real estate property in China effective from 1 January 1994 are subject to LAT at progressive rates ranging from 30% to 60% on the appreciation of land value, being the proceeds of sales of properties less deductible expenditure including amortisation of land use rights, borrowing costs and all property development expenditure.
The subsidiaries of the Group engaging in property development business in China are subject to land appreciation tax. However, the implementation of this tax varies amongst China cities and the Group has not finalised its land appreciation tax returns with various tax authorities. Accordingly, significant judgement is required in determining the amount of land appreciation and related taxes. The ultimate tax determination is uncertain during the ordinary course of business. The Group recognises these liabilities based on management’s best estimates. When the final tax outcome of these matters is different from the amounts that were initially recorded, such differences will impact the provisions for land appreciation tax in the period in which such determination is made.
(b) Critical Judgements made in Applying Accounting Policies
In the process of applying the Group’s accounting policies, management has made the following judgements, apart from those involving estimations, which have significant effects on the amounts recognised in the consolidated financial statements:
(i) Operating Lease Commitments – Group as Lessor
The Group has entered into commercial property leases on its investment property portfolio. The Group has determined, based on an evaluation of the terms and conditions of the arrangements, that it retains all the significant risks and rewards of ownership of these properties which are leased out on operating leases.
(ii) Classification of Property
In determining whether a property is classified as investment property or property, plant and equipment, the Group determines the business model and how much space is allocated to ancillary services. The Group further analyses whether the quantum of other income derived from ancillary services rendered is significant as compared to total revenue and other qualitative factors such as the accommodation and amenities offerings.

FR
AS
ER
S C
EN
TR
EP
OIN
T L
IMIT
ED
& S
UB
SID
IAR
IES
194
NOTES TO THE FINANCIAL STATEMENTSFOR THE YEAR ENDED 30 SEPTEMBER 2016
2. SUMMARY OF SIGNIFICANT ACCOUNTING POLICIES (CONT’D)
2.2 Significant Accounting Judgements and Estimates (cont’d)
(b) Critical Judgements made in Applying Accounting Policies (cont’d)
(iii) Business Combinations
The Group acquires subsidiaries that own real estate. At the time of acquisition, the Group considers whether each acquisition represents the acquisition of a business or the acquisition of an asset. The Group accounts for an acquisition as a business combination where an integrated set of activities is acquired in addition to the property. More specifically, consideration is made of the extent to which significant processes are acquired and, in particular, the extent of services provided by the subsidiary (e.g. maintenance, cleaning, security, bookkeeping, hotel services). For example, the Group assessed the acquisitions of the subsidiaries as disclosed in Note 13(b) as purchases of businesses because of the strategic management function and associated processes purchased along with the investment and development properties.
When the acquisition of a subsidiary does not represent a business, it is accounted for as an acquisition of a group of assets and liabilities. The cost of the acquisition is allocated to the assets and liabilities acquired based upon their relative fair values, and no goodwill or deferred tax is recognised.
2.3 Basis of Consolidation and Business Combinations
(a) Basis of Consolidation
The financial year of the Company and all its subsidiaries ends on 30 September unless otherwise stated. The consolidated financial statements incorporate the financial statements of the Company and all its subsidiaries made up to 30 September. The financial statements of subsidiaries are prepared using consistent accounting policies. Adjustments are made to any dissimilar material accounting policies to conform to the Group’s significant accounting policies. A list of the Group’s significant subsidiaries is shown in Note 40.
The consolidated financial statements comprise the financial statements of the Company and its subsidiaries as at the reporting date.
All intra-group balances, income and expenses and unrealised gains and losses resulting from intra-group transactions and dividends are eliminated in full.
Subsidiaries are consolidated from the date of acquisition, being the date on which the Group obtains control, and continue to be consolidated until the date that such control ceases.
Losses within a subsidiary are attributed to the non-controlling interest (“NCI”) even if that results in a deficit balance.

AN
NU
AL
RE
PO
RT
20
16
195
NOTES TO THE FINANCIAL STATEMENTSFOR THE YEAR ENDED 30 SEPTEMBER 2016
2. SUMMARY OF SIGNIFICANT ACCOUNTING POLICIES (CONT’D)
2.3 Basis of Consolidation and Business Combinations (cont’d)
(b) Business Combinations
Business combinations are accounted for by applying the acquisition method. Identifiable assets acquired, liabilities and contingent liabilities assumed in a business combination are measured initially at their fair values at the acquisition date. Acquisition-related costs, other than those associated with the issue of debt or equity securities, incurred in connection with a business combination are recognised as expenses in the periods in which the costs are incurred and the services are received.
When the Group acquires a business, it assesses the financial assets and liabilities assumed for appropriate classification and designation in accordance with the contractual terms, economic circumstances and pertinent conditions as at the acquisition date.
Any contingent consideration payable is recognised at fair value at the acquisition date and included in the consideration transferred. Subsequent changes to the fair value of the contingent consideration is recognised in the profit statement. If the contingent consideration is classified as equity, it is not remeasured until it is finally settled within equity.
In business combinations achieved in stages, previously held equity interests in the acquiree are remeasured to fair value at the acquisition date and any corresponding gain or loss is recognised in the profit statement.
The Group elects for each individual business combination, whether NCI in the acquiree (if any), that are present ownership interests and entitle their holders to a proportionate share of net assets in the event of liquidation, is recognised on the acquisition date at fair value, or at the NCI’s proportionate share of the acquiree’s identifiable net assets. Other components of NCI are measured on their acquisition date at fair value, unless another measurement basis is required by another FRS.
Any excess of the sum of the fair value of the consideration transferred in the business combination, the amount of NCI in the acquiree (if any), and the fair value of the Group’s previously held equity interest in the acquiree (if any), over the net fair value of the acquiree’s identifiable assets and liabilities is recorded as goodwill. The accounting policy for goodwill is disclosed in Note 2.9(a). When the excess is negative, a bargain purchase is recognised in the profit statement on the acquisition date.
The consideration transferred does not include amounts related to the settlement of pre-existing relationships. Such amounts are generally recognised in profit statement.
When share-based payment awards (replacement awards) are exchanged for awards held by the acquiree’s employees (acquiree’s awards) and relate to past services, then all or a portion of the amount of the acquirer’s replacement awards is included in measuring the consideration transferred in the business combination. This determination is based on the market-based value of the replacement awards compared with the market-based value of the acquiree’s awards and the extent to which the replacement awards relate to past and/or future service.

FR
AS
ER
S C
EN
TR
EP
OIN
T L
IMIT
ED
& S
UB
SID
IAR
IES
196
NOTES TO THE FINANCIAL STATEMENTSFOR THE YEAR ENDED 30 SEPTEMBER 2016
2. SUMMARY OF SIGNIFICANT ACCOUNTING POLICIES (CONT’D)
2.3 Basis of Consolidation and Business Combinations (cont’d)
(b) Business Combinations (cont’d)
Transactions with NCI
NCI represent the equity in subsidiaries not attributable, directly or indirectly, to owners of the Company and are presented separately in the consolidated profit statement and consolidated statement of comprehensive income, and within equity in the consolidated balance sheet, separately from the equity attributable to owners of the Company. Changes in the Company’s ownership interest in a subsidiary that do not result in a loss of control are accounted for as equity transactions. In such circumstances, the carrying amounts of the controlling and non-controlling interests are adjusted to reflect the changes in their relative interests in the subsidiary. Any difference between the amount by which the NCI is adjusted and the fair value of the consideration paid or received is recognised directly in equity and attributable to owners of the Company.
Loss of Control
Upon the loss of control, the Group derecognises the assets and liabilities of the subsidiary, any NCI and the other components of equity related to the subsidiary. Any surplus or deficit arising on the loss of control is recognised in profit statement. If the Group retains any interest in the previous subsidiary, then such interest is measured at fair value at the date that control is lost. Subsequently, it is accounted for as an equity-accounted investee or as an available-for-sale financial asset depending on the level of influence retained.
A change in the ownership interest of a subsidiary, without a loss of control, is accounted for as an equity transaction.
(c) Property Acquisitions and Business Combinations
Where property is acquired, via corporate acquisitions or otherwise, management considers the substance of the assets and activities of the acquired entity in determining whether the acquisition represents the acquisition of a business. The basis of the judgement is set out in Note 2.2(b)(v).
Where such acquisitions are not judged to be an acquisition of a business, they are not treated as business combinations. In such cases, the acquirer shall identify and recognise the individual identifiable asset acquired and liabilities assumed. The cost to acquire the corporate entity is allocated between the identifiable assets and liabilities of the entity based on their relative fair values at the acquisition date. Such a transaction or event does not give rise to goodwill.
2.4 Investments in Subsidiaries
A subsidiary is an investee that is controlled by the Group. The Group controls an investee when it is exposed, or has rights, to variable returns from its involvement with the investee and has the ability to affect those returns through its power over the investee. In the Company’s separate financial statements, investments in subsidiaries are carried at cost less impairment losses.

AN
NU
AL
RE
PO
RT
20
16
197
NOTES TO THE FINANCIAL STATEMENTSFOR THE YEAR ENDED 30 SEPTEMBER 2016
2. SUMMARY OF SIGNIFICANT ACCOUNTING POLICIES (CONT’D)
2.5 Joint Arrangements and Associates
A joint arrangement is a contractual arrangement whereby two or more parties have joint control. Joint control is the contractually agreed sharing of control of an arrangement, which exists only when decisions about the relevant activities require the unanimous consent of the parties sharing control.
A joint arrangement is classified either as joint operation or joint venture, based on the rights and obligations of the parties to the arrangement.
To the extent the joint arrangement provides the Group with rights to the assets and obligations for the liabilities relating to the arrangement, the arrangement is a joint operation. To the extent the joint arrangement provides the Group with rights to the net assets of the arrangement, the arrangement is a joint venture.
(a) Joint Operations
The Group recognises in relation to its interest in a joint operation, its:
– assets, including its share of any assets held jointly; – liabilities, including its share of any liabilities incurred jointly; – revenue from the sale of its share of the output arising from the joint operation; – share of the revenue from the sale of the output by the joint operation; and – expenses, including its share of any expenses incurred jointly.
The Group accounts for the assets, liabilities, revenues and expenses relating to its interests in a joint operation in accordance with the accounting policies applicable to the particular assets, liabilities, revenues and expenses.
(b) Joint Ventures and Associates
An associate is an entity over which the Group has significant influence over the financial and operating policy decisions of the investee but does not have control or joint control of those policies. Significant influence is presumed to exist when the Group holds 20% or more of the voting power of another entity.
The Group accounts for its investments in associates and joint ventures using the equity method from the date on which it becomes an associate or a joint venture.
On acquisition of the investment, any excess of the cost of the investment over the Group’s share of the net fair value of the investee’s identifiable assets and liabilities is accounted as goodwill and is included in the carrying amount of the investment. Any excess of the Group’s share of the net fair value of the investee’s identifiable assets and liabilities over the cost of the investment is included as income in the determination of the entity’s share of the associate’s or joint venture’s profit or loss in the period in which the investment is acquired.
Under the equity method, the investments in associates or joint ventures are carried on the balance sheet at cost plus post-acquisition changes in the Group’s share of net assets of the associates or joint ventures. The profit statement reflects the share of results of the operations of the associates or joint ventures. Distributions received from associates or joint ventures reduce the carrying amount of the investment. Where there has been a change recognised in other comprehensive income (“OCI”) by the associates or joint ventures, the Group recognises its share of such changes in OCI. Unrealised gains and losses resulting from transactions between the Group and associates or joint ventures are eliminated to the extent of the interest in the associates or joint ventures.

FR
AS
ER
S C
EN
TR
EP
OIN
T L
IMIT
ED
& S
UB
SID
IAR
IES
198
NOTES TO THE FINANCIAL STATEMENTSFOR THE YEAR ENDED 30 SEPTEMBER 2016
2. SUMMARY OF SIGNIFICANT ACCOUNTING POLICIES (CONT’D)
2.5 Joint Arrangements and Associates (cont’d)
(b) Joint Ventures and Associates (cont’d)
When the Group’s share of losses in an associate or joint venture equals or exceeds its interest in the associate or joint venture, the Group does not recognise further losses, unless it has incurred obligations or made payments on behalf of the associate or joint venture.
After application of the equity method, the Group determines whether it is necessary to recognise an additional impairment loss on the Group’s investments in associates or joint ventures. The Group determines at the end of each reporting period whether there is any objective evidence that the investment in the associate or joint venture is impaired. If this is the case, the Group calculates the amount of impairment as the difference between the recoverable amount of the associate or joint venture and its carrying value and recognises the amount in profit statement.
Goodwill that forms part of the carrying amount of an investment in an associate is not recognised separately, and therefore is not tested for impairment separately. Instead, the entire amount of the investment in an associate is tested for impairment as a single asset when there is objective evidence that the investment in an associate may be impaired.
The financial statements of joint ventures and associates are prepared at the same reporting date as the Group. Where the accounting period of the joint ventures and associates is not co-terminous with that of the Group, the share of results is arrived at from the last audited financial statements available and unaudited management financial statements to the end of the accounting period. Where necessary, adjustments are made to bring the accounting policies in line with those of the Group.
In the Company’s separate financial statements, interests in joint ventures and associates are carried at cost less impairment losses.
2.6 Investment Properties
(a) Completed Investment Properties
Completed investment properties are held either to earn rental income or for capital appreciation or both, rather than for use in the production or supply of goods or services, or for administrative purposes, or for sale in the ordinary course of business and are treated as non-current assets.
Completed investment properties are measured at cost on initial recognition. Costs include expenditure that is directly attributable to the acquisition of investment properties. Subsequent to recognition, completed investment properties are measured at fair value and gains or losses arising from changes in the fair value of completed investment properties are included in the profit statement in the year in which they arise.
Completed investment properties are derecognised when either they have been disposed of or when the completed investment properties are permanently withdrawn from use and no future economic benefit is expected from its disposal. Any gains or losses on the retirement or disposal of a completed investment property are recognised in the profit statement in the year of retirement or disposal. When an investment property that was previously classified as property, plant and equipment is sold, any related amount included in the revaluation reserve is transferred to retained earnings.

AN
NU
AL
RE
PO
RT
20
16
199
NOTES TO THE FINANCIAL STATEMENTSFOR THE YEAR ENDED 30 SEPTEMBER 2016
2. SUMMARY OF SIGNIFICANT ACCOUNTING POLICIES (CONT’D)
2.6 Investment Properties (cont’d)
(a) Completed Investment Properties (cont’d)
Transfers are made to or from completed investment properties only when there is a change in use. For a transfer from completed investment property to owner-occupied property, the deemed cost for subsequent accounting is the fair value at the date of change in use. For a transfer from owner-occupied property to completed investment property, the property is accounted for in accordance with the accounting policy for property, plant and equipment up to the date of change in use.
(b) Investment Properties under Construction
IPUC are initially stated at cost, which includes cost of land and construction, related overhead expenditure and financing charges incurred during the period of construction and up to the completion of construction.
IPUC are subsequently measured at fair value annually and on completion, with changes in fair values being recognised in the profit statement when fair value can be measured reliably.
When completed, IPUC are transferred to completed investment properties.
IPUC for which fair value cannot be determined reliably is measured at cost less impairment.
2.7 Properties Held for Sale (a) Development Properties Held for Sale
Development properties held for sale are properties acquired or being constructed for sale in the ordinary course of business, rather than to be held for the Group’s own use, rental or capital appreciation.
Development properties held for sale are held as inventories and are measured at the lower of cost and net realisable value.
The costs of development properties held for sale include:
– freehold and leasehold rights for land;– amounts paid to contractors for construction; and– borrowing costs, planning and design costs, costs of site preparation, professional fees for legal
services, property transfer taxes, construction overheads and other related costs.
Non-refundable commissions paid to sales or marketing agents on the sale of real estate units are expensed when incurred.
Net realisable value of development properties held for sale is the estimated selling price in the ordinary course of the business, based on market prices at the end of the reporting period and discounted for the time value of money if material, less the estimated costs of completion and the estimated costs necessary to make the sale.

FR
AS
ER
S C
EN
TR
EP
OIN
T L
IMIT
ED
& S
UB
SID
IAR
IES
200
NOTES TO THE FINANCIAL STATEMENTSFOR THE YEAR ENDED 30 SEPTEMBER 2016
2. SUMMARY OF SIGNIFICANT ACCOUNTING POLICIES (CONT’D)
2.7 Properties Held for Sale (cont’d) (a) Development Properties Held for Sale (cont’d)
Development properties held for sale are stated at cost plus attributable profits less progress billings if their revenue is recognised based on percentage of completion method (see accounting policy for revenue recognition disclosed in Note 2.18).
Where revenue is recognised upon completion, development properties held for sale are stated at cost and payments received from purchasers prior to completion are included in “trade and other payables” as “progress billings received in advance”.
Progress billings not yet paid by customers are included within “trade and other receivables”.
The costs of development properties recognised in profit statement on disposal are determined with reference to the specific costs incurred on the property sold.
When completed, development properties held for sale are transferred to completed properties held for sale.
(b) Completed Properties Held for Sale
Completed properties held for sale are stated at the lower of cost and net realisable value. Costs include cost of land and construction, related overhead expenditure, and financing charges and other related costs incurred during the period of development.
A write-down to net realisable value is made when it is anticipated that the net realisable value has fallen below cost.
2.8 Property, Plant and Equipment
Property, plant and equipment are stated at cost less accumulated depreciation and any impairment. The cost of an asset comprises its purchase price and any directly attributable costs of bringing the asset to working condition for its intended use and estimate of the costs of dismantling and removing the items and restoring the site on which they are located when the Group has an obligation to remove the asset or restore the site. Expenditure for additions, improvements and renewals are capitalised and expenditure for maintenance and repair are charged to the profit statement. Where parts of an item of property, plant and equipment have different useful lives, they are accounted for as separate items (major components) of property, plant and equipment. When assets are sold or retired, their cost and accumulated depreciation are removed from the financial statements and any gain or loss resulting from their disposal is included in the profit statement.
Property, plant and equipment except freehold lands, leasehold lands of more than 100 years and assets under construction, are depreciated on the straight line method so as to write-off the cost of the assets over their estimated useful lives. No depreciation is provided on freehold lands, leasehold lands of more than 100 years and assets under construction. The estimated useful lives of the Group’s property, plant and equipment are as follows:
Leasehold lands (less than 100 years) Lease termBuildings 50 yearsEquipment, furniture and fittings 5 to 10 yearsMotor vehicles 7 yearsOthers1 5 to 10 years
1 Others comprise computer hardware and software and office renovations.

AN
NU
AL
RE
PO
RT
20
16
201
NOTES TO THE FINANCIAL STATEMENTSFOR THE YEAR ENDED 30 SEPTEMBER 2016
2. SUMMARY OF SIGNIFICANT ACCOUNTING POLICIES (CONT’D)
2.8 Property, Plant and Equipment (cont’d)
Depreciation is recognised from the date that the property, plant and equipment are installed and are ready for use, or in respect of internally constructed assets, from the date that the asset is completed and ready for use.
The carrying values of property, plant and equipment are reviewed for impairment when events or changes in circumstances indicate that the carrying value may not be recoverable.
The estimated useful lives, depreciation method and residual values are reviewed periodically to ensure that the method and period of depreciation are consistent with the expected pattern of economic benefits from items of property, plant and equipment.
Assets under construction are stated at cost and are not depreciated. Expenditure relating to assets under construction (including borrowing costs) are capitalised when incurred. Depreciation will commence when the development is completed.
Reclassification to Investment Property
When the use of a property changes from owner-occupied to investment property, the property is remeasured to fair value and reclassified accordingly. Any gain arising on remeasurement is recognised in profit statement to the extent that it reverses a previous impairment loss on the specific property, with any remaining gain recognised in OCI and presented in the revaluation reserve in equity. Any loss is recognised immediately in profit statement. When the property is sold, the related amount in the revaluation reserve is transferred to retained earnings.
2.9 Intangible Assets
Intangible assets acquired separately are measured initially at cost. The cost of intangible assets acquired in a business combination is their fair value as at the date of acquisition. Following initial acquisition, intangible assets are carried at cost less any accumulated amortisation and any accumulated impairment losses. Internally generated intangible assets, excluding capitalised development costs, are not capitalised and expenditure is reflected in profit statement in the year in which the expenditure is incurred.
The useful lives of intangible assets are assessed as either finite or indefinite.
Intangible assets with finite useful lives are amortised over the estimated useful lives and assessed for impairment whenever there is an indication that the intangible assets may be impaired. The amortisation period and the amortisation method are reviewed at least at each financial year end. Changes in the expected useful life or the expected pattern of consumption of future economic benefits embodied in the asset is accounted for by changing the amortisation period or method, as appropriate, and are treated as changes in accounting estimates. The amortisation expense on intangible assets with finite useful lives is recognised in profit statement in the expense category consistent with the function of the intangible asset.
Intangible assets with indefinite useful lives or not yet available for use are tested for impairment annually, or more frequently if the events and circumstances indicate that the carrying value may be impaired either individually or at the cash-generating unit level. Such intangible assets are not amortised. The useful life of an intangible asset with an indefinite useful life is reviewed annually to determine whether the useful life assessment continues to be supportable. If not, the change in useful life from indefinite to finite is made on a prospective basis.

FR
AS
ER
S C
EN
TR
EP
OIN
T L
IMIT
ED
& S
UB
SID
IAR
IES
202
NOTES TO THE FINANCIAL STATEMENTSFOR THE YEAR ENDED 30 SEPTEMBER 2016
2. SUMMARY OF SIGNIFICANT ACCOUNTING POLICIES (CONT’D)
2.9 Intangible Assets (cont’d)
Gains or losses arising from derecognition of an intangible asset are measured as the difference between the net disposal proceeds and the carrying amount of the asset and are recognised in profit statement when the asset is derecognised.
(a) Goodwill
Goodwill acquired in a business combination is initially measured at cost. Following initial recognition, goodwill is measured at cost less accumulated impairment losses.
Goodwill is reviewed for impairment, at least annually or more frequently if events or changes in circumstances indicate that the carrying value may be impaired.
(b) Brands
The brands were acquired in business combinations. The useful lives of the brands are estimated to be indefinite because based on the current market share of the brands, management believes there is no foreseeable limit to the period over which the brands are expected to generate net cash inflows for the Group.
(c) Favourable Leases
Favourable leases acquired in a business combination are initially measured at cost and are amortised on a straight line basis over the lease term of 35 to 70 years.
2.10 Non-Derivative Financial Assets
(a) Initial Recognition and Measurement
Non-derivative financial assets within the scope of FRS 39 are classified as either non-derivative financial assets at fair value through profit or loss, loans and receivables, held-to-maturity investments, or available-for-sale financial assets, as appropriate. Non-derivative financial assets are recognised when, and only when, the Group becomes a party to the contractual provisions of the financial instrument.
When non-derivative financial assets are recognised initially, they are measured at fair value, plus, in the case of non-derivative financial assets not at fair value through profit or loss, directly attributable transaction costs. The Group determines the classification of its non-derivative financial assets at initial recognition.
(b) Subsequent Measurement
The subsequent measurement of non-derivative financial assets depends on their classification as follows:
(i) Loans and Receivables
Non-derivative financial assets with fixed or determinable payment that are not quoted in an active market are classified as loans and receivables. Subsequent to initial recognition, loans and receivables are measured at amortised cost using the effective interest method, less impairment. Gains and losses are recognised in the profit statement when the loans and receivables are derecognised or impaired, and through the amortisation process.

AN
NU
AL
RE
PO
RT
20
16
203
NOTES TO THE FINANCIAL STATEMENTSFOR THE YEAR ENDED 30 SEPTEMBER 2016
2. SUMMARY OF SIGNIFICANT ACCOUNTING POLICIES (CONT’D)
2.10 Non-Derivative Financial Assets (cont’d)
(b) Subsequent Measurement (cont’d)
(ii) Available-for-Sale Financial Assets
Available-for-sale financial assets are those that are not classified in any of the other categories. After initial recognition, available-for-sale financial assets are measured at fair value, with any resultant gain or loss recognised in OCI, except that impairment losses, foreign exchange gains and losses on debt instruments and interest calculated using the effective interest method are recognised in profit statement. The cumulative gain or loss previously recognised in OCI is reclassified from equity to profit statement as a reclassification adjustment when the financial asset is derecognised.
Investments in equity instruments whose fair value cannot be reliably measured are measured at cost less impairment loss.
(c) Derecognition
A non-derivative financial asset is derecognised when the contractual rights to receive cash flows from the asset have expired, or it transfers the rights to receive the contractual cash flows on the non-derivative financial asset in a transaction in which substantially all the risks and rewards of ownership of the non-derivative financial asset are transferred, or it neither transfers nor retains substantially all of the risks and rewards of ownership and does not retain control over the transferred asset. Any interest in transferred non-derivative financial assets that is created or retained by the Group is recognised as a separate asset or liability.
On derecognition of a non-derivative financial asset in its entirety, the difference between the carrying amount and the sum of the consideration received (including any new asset obtained less any new liability assumed) and any cumulative gain or loss that has been recognised in OCI is recognised in the profit statement.
Non-derivative financial assets and liabilities are offset and the net amount presented in the statement of financial position when, and only when, the Group has a legal right to offset the amounts and intends either to settle on a net basis or to realise the asset and settle the liability simultaneously.
2.11 Cash and Cash Equivalents
Cash on hand and in banks and fixed deposits which are held to maturity are classified and accounted for as loans and receivables under FRS 39. The accounting policy is stated in Note 2.10.
2.12 Non-Derivative Financial Liabilities
(a) Initial Recognition and Measurement
Non-derivative financial liabilities within the scope of FRS 39 are classified as other financial liabilities. The non-derivative financial liabilities are recognised when, and only when, the Group becomes a party to the contractual provisions of the financial instrument.
Non-derivative financial liabilities are recognised initially at fair value plus directly attributable transaction costs.

FR
AS
ER
S C
EN
TR
EP
OIN
T L
IMIT
ED
& S
UB
SID
IAR
IES
204
NOTES TO THE FINANCIAL STATEMENTSFOR THE YEAR ENDED 30 SEPTEMBER 2016
2. SUMMARY OF SIGNIFICANT ACCOUNTING POLICIES (CONT’D)
2.12 Non-Derivative Financial Liabilities (cont’d)
(b) Subsequent Measurement
Subsequent to initial recognition, non-derivative financial liabilities are measured at amortised cost using the effective interest method.
(c) Derecognition
A non-derivative financial liability is derecognised when the obligation under the liability is discharged or cancelled or has expired.
Where an existing non-derivative financial liability is replaced by another from the same lender on substantially different terms, or the terms of an existing liability are substantially modified, such an exchange or modification is treated as a derecognition of the original liability and the recognition of a new liability, and the difference in the respective carrying amounts is recognised in the profit statement. Non-derivative financial assets and liabilities are offset and the net amount presented in the balance sheet when, and only when, the Group has a legal right to offset the amounts and intends either to settle on a net basis or to realise the asset and settle the liability simultaneously.
2.13 Derivative Financial Instruments
The Group uses derivative financial instruments to hedge against risks associated with foreign currency and interest rate fluctuations. Embedded derivatives are separated from the host contract and accounted for separately if the economic characteristics and risks of the host contract and the embedded derivative are not closely related, a separate instrument with the same terms as the embedded derivative would meet the definition of a derivative, and the combined instrument is not measured at fair value through the profit statement. Foreign exchange forward contracts are used to hedge its risks associated primarily with foreign currency fluctuations. Interest rate swap contracts are used to hedge its risks associated with interest rate fluctuations. Cross currency interest rate swaps and cross currency swaps are also used to hedge its risks associated with foreign currency and interest rate fluctuations. It is the Group’s policy not to trade in derivative financial instruments. Derivatives are initially recognised at fair value; any attributable transaction costs are recognised in the profit statement on the date a derivative contract is entered into. Subsequent to initial recognition, derivatives are measured at their fair value. The changes in fair value of any derivative instruments that do not qualify for hedge accounting are recognised immediately in the profit statement. The Group applies hedge accounting for certain hedging relationships which qualify for hedge accounting. For the purpose of hedge accounting, these hedges are classified as cash flow hedges. On initial designation of the derivative as the hedging instrument, the Group formally documents the relationship between the hedging instrument and the hedged item, including the risk management objectives and strategy in undertaking the hedge transaction and the hedged risk, together with the methods that will be used to assess the effectiveness of the hedging relationship. The Group makes an assessment, both at the inception of the hedge relationship as well as on an ongoing basis, of whether the hedging instruments are expected to be ‘highly effective’ in offsetting the changes in the fair value or cash flows of the respective hedged items attributable to the hedged risk, and whether the actual results of each hedge are within a range of 80% to 125%.

AN
NU
AL
RE
PO
RT
20
16
205
NOTES TO THE FINANCIAL STATEMENTSFOR THE YEAR ENDED 30 SEPTEMBER 2016
2. SUMMARY OF SIGNIFICANT ACCOUNTING POLICIES (CONT’D)
2.13 Derivative Financial Instruments (cont’d)
Cash Flow Hedges For cash flow hedges, the effective portion of the gain or loss on the hedging instrument is recognised directly in OCI in hedging reserve, while any ineffective portion is recognised immediately in the profit statement. Amounts recognised in OCI are transferred to the profit statement when the hedged transaction affects profit statement, such as when the hedged financial income or financial expense is recognised or when a forecast sale occurs. Where the hedged item is a non-financial asset or non-financial liability, the amounts accumulated in equity is retained in OCI and reclassified to the profit statement in the same period or periods during which the non-financial item affects profit or loss. If the hedging instrument no longer meets the criteria for hedge accounting, expires or is sold, terminated or exercised, or the designation is revoked, then hedge accounting is discontinued prospectively. If the forecast transaction is no longer expected to occur, amounts previously recognised in shareholders’ equity are transferred to the profit statement.
Hedge of Net Investment in a Foreign Operation
The Group applies hedge accounting to foreign currency differences arising between the functional currency of the foreign operation and the parent’s functional currency, regardless of whether the net investment is held directly or through an intermediate parent.
In the entities’ financial statements, foreign currency differences arising from the retranslation of a financial liability designated as a hedge of a net investment in a foreign operation are recognised in the profit statement. On consolidation, such differences are recognised in OCI and presented in the foreign currency translation reserve in the shareholders’ equity, to the extent that the hedge is effective. To the extent that the hedge is ineffective, such differences are recognised in the profit statement. When the hedged net investment is disposed off, the cumulative amount in OCI is transferred to the profit statement.
2.14 Provisions
Provisions are recognised when there is a present obligation (legal or constructive) as a result of a past event and it is probable that an outflow of resources embodying economic benefits will be required to settle the obligation, and a reliable estimate can be made of the amount of the obligation.
Provisions are reviewed at each reporting date and adjusted to reflect the current best estimate. If it is no longer probable that an outflow of economic resources will be required to settle the obligation, the provision is reversed. Where the effect of time value of money is material, provisions are discounted using a current pre-tax rate that reflects, where appropriate, the risks specific to the liability. When discounting is used, the increase in the provision due to the passage of time is recognised as a finance cost.

FR
AS
ER
S C
EN
TR
EP
OIN
T L
IMIT
ED
& S
UB
SID
IAR
IES
206
NOTES TO THE FINANCIAL STATEMENTSFOR THE YEAR ENDED 30 SEPTEMBER 2016
2. SUMMARY OF SIGNIFICANT ACCOUNTING POLICIES (CONT’D)
2.15 Impairment
(a) Impairment of Non-Financial Assets
The Group assesses at each reporting date whether there is an indication that an asset may be impaired. If any such indication exists, the Group makes an estimate of the asset’s recoverable amount.
An impairment loss is recognised if the carrying amount of an asset or its related CGU exceeds its recoverable amount.
The recoverable amount of an asset or CGU is the greater of its value in use and its fair value less costs to sell. In assessing value in use, the estimated future cash flows are discounted to their present value using a pre-tax discount rate that reflects current market assessments of the time value of money and the risks specific to the asset or CGU. For the purpose of impairment testing, assets that cannot be tested individually are grouped together into the smallest group of assets that generates cash inflows from continuing use that are largely independent of the cash inflows of other assets or CGUs. Subject to an operating segment ceiling test, for the purposes of goodwill impairment testing, CGUs to which goodwill has been allocated are aggregated so that the level at which impairment testing is performed reflects the lowest level at which goodwill is monitored for internal reporting purposes. Goodwill acquired in a business combination is allocated to groups of CGUs that are expected to benefit from the synergies of the combination.
Impairment losses of continuing operations are recognised in profit statement, except for assets that are previously revalued where the revaluation was taken to OCI. In this case, the impairment is also recognised in OCI up to the amount of any previous revaluation. Impairment losses recognised in respect of CGUs are allocated first to reduce the carrying amount of any goodwill allocated to the CGU (group of CGUs) and then to reduce the carrying amounts of the other assets in the CGU (group of CGUs) on a pro rata basis.
For assets excluding goodwill, an assessment is made at each reporting date as to whether there is any indication that previously recognised impairment losses may no longer exist or may have decreased. If such indication exists, the recoverable amount is estimated. A previously recognised impairment loss is reversed only if there has been a change in the estimates used to determine the asset’s recoverable amount since the last impairment loss was recognised. If that is the case, the carrying amount of the asset is increased to its recoverable amount. That increased amount cannot exceed the carrying amount that would have been determined, net of depreciation, had no impairment loss been recognised for the asset in prior years. Reversal of an impairment loss is recognised in the profit statement unless the asset is measured at revalued amount, in which case the reversal is treated as a revaluation increase. After such a reversal, the depreciation charge is adjusted in future periods to allocate the asset’s revised carrying amount, less any residual value, on a systematic basis over its remaining useful life.
The Group does not reverse in a subsequent period, any impairment loss recognised for goodwill.

AN
NU
AL
RE
PO
RT
20
16
207
NOTES TO THE FINANCIAL STATEMENTSFOR THE YEAR ENDED 30 SEPTEMBER 2016
2. SUMMARY OF SIGNIFICANT ACCOUNTING POLICIES (CONT’D)
2.15 Impairment (cont’d)
(b) Impairment of Financial Assets
The Group assesses at each reporting date whether there is any objective evidence that a financial asset or group of financial assets is impaired.
(i) Financial Assets Carried at Amortised Cost
For financial assets carried at amortised cost, the Group first assesses whether objective evidence of impairment exists individually for financial assets that are individually significant, or collectively for financial assets that are not individually significant. If the Group determines that no objective evidence of impairment exists for an individually assessed financial asset, whether significant or not, it includes the asset in a group of financial assets with similar credit risk characteristics and collectively assesses them for impairment. Assets that are individually assessed for impairment and for which an impairment loss is, or continues to be recognised are not included in a collective assessment of impairment.
In assessing collective impairment, the Group uses historical trends of the probability of default, the timing of recoveries and the amount of loss incurred, adjusted for management’s judgement as to whether current economic and credit conditions are such that the actual losses are likely to be greater or less than suggested by historical trends.
If there is objective evidence that an impairment loss on loans and receivables or held-to-maturity investments carried at amortised cost has been incurred, the amount of the loss is measured as the difference between the asset’s carrying amount and the present value of estimated future cash flow discounted at the financial asset’s original effective interest rate. If a loan has a variable interest rate, the discount rate for measuring any impairment loss is the current effective interest rate. The carrying amount of the asset is reduced through the use of an allowance account. The amount of the loss is recognised in the profit statement.
When the asset becomes uncollectible, the carrying amount of impaired financial asset is reduced directly or if an amount was charged to the allowance account, the amounts charged to the allowance account are written off against the carrying value of the financial asset.
To determine whether there is objective evidence that an impairment loss on financial assets has been incurred, the Group considers factors such as the probability of insolvency or significant financial difficulties of the debtor and default or significant delay in payments.
If, in a subsequent period, the amount of the impairment loss decreases and the decrease can be related objectively to an event occurring after the impairment was recognised, the previously recognised impairment loss is reversed. Any subsequent reversal of an impairment loss is recognised in the profit statement, to the extent that the carrying value of the asset does not exceed its amortised cost at the reversal date.

FR
AS
ER
S C
EN
TR
EP
OIN
T L
IMIT
ED
& S
UB
SID
IAR
IES
208
NOTES TO THE FINANCIAL STATEMENTSFOR THE YEAR ENDED 30 SEPTEMBER 2016
2. SUMMARY OF SIGNIFICANT ACCOUNTING POLICIES (CONT’D)
2.15 Impairment (cont’d)
(b) Impairment of Financial Assets (cont’d)
(ii) Available-for-Sale Financial Assets
In the case of equity investments classified as available-for-sale, objective evidence of impairment include (i) significant financial difficulty of the issuer or obligor, (ii) information about significant changes with an adverse effect that have taken place in the technological, market, economic or legal environment in which the issuer operates, and indicates that the cost of the investment in equity instrument may not be recovered; and (iii) a significant or prolonged decline in the fair value of the investment below its costs. ‘Significant’ is to be evaluated against the original cost of the investment and ‘prolonged’ against the period in which the fair value has been below its original cost.
If an available-for-sale financial asset is impaired, an amount comprising the difference between its cost (net of any principal payment and amortisation) and its current fair value, less any impairment loss previously recognised in the profit statement, is transferred from equity to the profit statement. Reversals in respect of equity instruments classified as available-for-sale are not recognised in the profit statement. Increase in the fair value after impairment are recognised directly in OCI. Reversals of impairment losses on debt instruments are reversed through the profit statement, if the increase in fair value of the instrument can be objectively related to an event occurring after the impairment loss was recognised in the profit statement.
2.16 Income Taxes
Tax expense comprises current and deferred tax. Current tax and deferred tax is recognised in profit statement except to the extent that it relates to a business combination, or items recognised directly in equity or in OCI.
Current tax is the expected tax payable or receivable on the taxable income or loss for the year, using tax rates enacted or substantively enacted at the reporting date, and any adjustment to tax payable in respect of previous years. The amount of current tax payable or receivable is the best estimate of the tax amount expected to be paid or received that reflects uncertainty related to income taxes, if any.
Deferred tax is recognised in respect of temporary differences between the carrying amounts of assets and liabilities for financial reporting purposes and the amounts used for taxation purposes. Deferred tax is not recognised for:
– temporary differences on the initial recognition of assets or liabilities in a transaction that is not a business combination and that affects neither accounting nor taxable profit or loss;
– temporary differences related to investments in subsidiaries, associates and joint arrangements to the extent that the Group is able to control the timing of the reversal of the temporary difference and it is probable that they will not reverse in the foreseeable future; and
– taxable temporary differences arising on the initial recognition of goodwill.

AN
NU
AL
RE
PO
RT
20
16
209
NOTES TO THE FINANCIAL STATEMENTSFOR THE YEAR ENDED 30 SEPTEMBER 2016
2. SUMMARY OF SIGNIFICANT ACCOUNTING POLICIES (CONT’D)
2.16 Income Taxes (cont’d)
The measurement of deferred taxes reflects the tax consequences that would follow the manner in which the Group expects, at the reporting date, to recover or settle the carrying amount of its assets and liabilities. For investment property that is measured at fair value, the presumption that the carrying amount of the investment property will be recovered through sale has not been rebutted. Deferred tax is measured at the tax rates that are expected to be applied to temporary differences when they reverse, based on the laws that have been enacted or substantively enacted by the reporting date.
Deferred tax assets and liabilities are offset if there is a legally enforceable right to offset current tax liabilities and assets, and they relate to taxes levied by the same tax authority on the same taxable entity, or on different tax entities, but they intend to settle current tax liabilities and assets on a net basis or their tax assets and liabilities will be realised simultaneously.
A deferred tax asset is recognised for unused tax losses, tax credits and deductible temporary differences, to the extent that it is probable that future taxable profits will be available against which they can be utilised. Deferred tax assets are reviewed at each reporting date and are reduced to the extent that it is no longer probable that the related tax benefit will be realised.
2.17 Borrowing Costs
Borrowing costs are capitalised as part of the cost of a qualifying asset if they are directly attributable to the acquisition, construction or production of that asset. Capitalisation of borrowing costs commences when the activities to prepare the asset for its intended use or sale are in progress and the expenditure and borrowing costs are incurred. Borrowing costs are capitalised until the assets are substantially completed for their intended use or sale. All other borrowing costs are expensed in the period they occur using the effective interest method. Borrowing costs consist of interest and other costs that an entity incurs in connection with the borrowing of funds.
2.18 Revenue Recognition
Revenue is recognised to the extent that it is probable that the economic benefits will flow to the Group and the revenue can be reliably measured, regardless of when the payment is made. Revenue is measured at the fair value of consideration received or receivable, taking into account contractually defined terms of payment and excluding taxes or duty. The following specific recognition criteria must also be met before revenue is recognised:
(a) Properties Held for Sale
(i) Sale of Completed Properties
Revenue from completed properties is recognised when the risks and rewards of ownership have been transferred to the purchaser either through the transfer of legal title or equitable interest in the properties, which is normally on unconditional exchange of contracts. For conditional exchanges, sales are recognised only when all the significant conditions are satisfied.

FR
AS
ER
S C
EN
TR
EP
OIN
T L
IMIT
ED
& S
UB
SID
IAR
IES
210
NOTES TO THE FINANCIAL STATEMENTSFOR THE YEAR ENDED 30 SEPTEMBER 2016
2. SUMMARY OF SIGNIFICANT ACCOUNTING POLICIES (CONT’D)
2.18 Revenue Recognition (cont’d)
(a) Properties Held for Sale (cont’d)
(ii) Sale of Properties under Development
The Group recognises revenue on properties under development when the significant risks and rewards of ownership have been transferred to the purchasers. For residential development projects under progressive payment scheme in Singapore, whereby the legal terms in the sales contracts result in continuous transfer of work-in-progress to the purchasers, revenue is recognised based on the percentage of completion method. Under the percentage of completion method, profit is brought into profit statement only in respect of finalised sales contracts and to the extent that such profit relates to the progress of construction work. The progress of construction work is measured by the proportion of the construction and related costs incurred to date to the estimated total construction and related costs for each project.
For executive condominium projects in Singapore, residential development projects under deferred payment scheme in Singapore and overseas development projects, revenue will be recognised upon the transfer of significant risks and rewards of ownership, which generally coincides with the time the development units are delivered to the purchasers.
(b) Rental Income
Rental and related income from completed investment properties are recognised on a straight line basis over the lease term commencing on the date from which the lessee is entitled to exercise its right to use the leased asset.
(c) Hotel Income
Revenue from hotel operations is recognised on an accrual basis, upon rendering of the relevant services.
(d) Dividends
Dividend income is recognised when the Group’s right to receive the payment is established.
(e) Interest Income
Interest income is recognised using the effective interest method.
(f) Management Fees
Management fee is recognised on an accrual basis.
2.19 Foreign Currencies
(a) Functional Currency
Items included in the financial statements of each entity in the Group are measured using the currency that best reflects the economic substance of the underlying events and circumstances relevant to the entity (the “functional currency”). The consolidated financial statements and financial statements of the Company are presented in Singapore dollars, the functional currency of the Company.
AN
NU
AL
RE
PO
RT
20
16
211
NOTES TO THE FINANCIAL STATEMENTSFOR THE YEAR ENDED 30 SEPTEMBER 2016
2. SUMMARY OF SIGNIFICANT ACCOUNTING POLICIES (CONT’D)
2.19 Foreign Currencies (cont’d)
(b) Foreign Currency Transactions Transactions in foreign currencies are measured in the respective functional currencies of the Company and its subsidiaries at rates of exchange approximating those ruling at transaction dates. Monetary assets and liabilities denominated in foreign currencies are translated at the rates ruling at the reporting date. The foreign currency gain or loss on monetary items is the difference between amortised cost in the functional currency at the beginning of the year, adjusted for effective interest and payments during the year, and the amortised cost in foreign currency translated at the exchange rate at the end of the year. Non-monetary assets and liabilities that are measured in terms of historical cost in a foreign currency are translated using the exchange rates ruling at the initial transaction dates. Non-monetary items measured at fair value in a foreign currency are translated using the exchange rates at the date when the fair value was measured.
Foreign currency differences arising on the settlement of monetary items or on translating monetary items at the reporting date are recognised in the profit statement except for:
(i) available for sale equity instruments (except impairment in which case foreign currency differences that have been recognised in OCI are reclassified to profit statement);
(ii) a financial liability designated as a hedge of the net investment in a foreign operation to the extent that the hedge is effective;
(iii) qualifying cash flow hedges to the extent the hedges are effective.
(c) Foreign Currency Translation
The results and financial position of foreign operations are translated into Singapore dollars using the following procedures:
– assets and liabilities for each balance sheet presented are translated at the closing rate ruling at that reporting date; and
– income and expenses for each profit statement are translated at average exchange rates for the year, which approximates the exchange rates at the dates of the transactions.
All resulting exchange differences are taken directly to OCI and accumulated in the foreign currency translation reserve in equity.
However, if the foreign operation is a non-wholly-owned subsidiary, then the relevant proportionate share of the translation difference is allocated to the NCI. When a foreign operation is disposed of such that control, significant influence or joint control is lost, the cumulative amount in the translation reserve related to that foreign operation is reclassified to profit statement as part of the gain or loss on disposal. When the Group disposes of only part of its interest in a subsidiary that includes a foreign operation while retaining control, the relevant proportion of the cumulative amount is reattributed to NCI. When the Group disposes of only part of its investment in an associate or joint venture that includes a foreign operation while retaining significant influence or joint control, the relevant proportion of the cumulative amount is reclassified to profit statement as part of the gain or loss on disposal.

FR
AS
ER
S C
EN
TR
EP
OIN
T L
IMIT
ED
& S
UB
SID
IAR
IES
212
NOTES TO THE FINANCIAL STATEMENTSFOR THE YEAR ENDED 30 SEPTEMBER 2016
2. SUMMARY OF SIGNIFICANT ACCOUNTING POLICIES (CONT’D)
2.19 Foreign Currencies (cont’d)
(c) Foreign Currency Translation (cont’d)
When the settlement of a monetary item receivable from or payable to a foreign operation is neither planned nor likely to occur in the foreseeable future, foreign exchange gains and losses arising from such a monetary item that are considered to form part of a net investment in a foreign operation are recognised in OCI and are accumulated in the foreign currency translation reserve in equity.
2.20 Employee Benefits
(a) Defined Contribution Plan
As required by law, the Group makes contributions to state pension schemes in accordance with local regulatory requirements. The pension contributions are recognised as compensation expense in the same period as the employment that gives rise to the contribution.
(b) Employee Leave Entitlement
Employee entitlements to annual leave are recognised when they accrue to employees. A provision is made for the estimated liability for leave as a result of services rendered by employees up to the reporting date.
(c) Share Plans
For equity-settled share-based payment transactions, the fair value of the services received is recognised as an expense with a corresponding increase in equity over the vesting period during which the employees become unconditionally entitled to the equity instrument. The fair value of the services received is determined by reference to the fair value of the equity instrument granted at the grant date. At each reporting date, the number of equity instruments that are expected to be vested are estimated. The impact of the revision of the original estimates is recognised as an expense and as a corresponding adjustment to equity over the remaining vesting period, unless the revision to the original estimates is due to market conditions. No adjustment is made if the revision or actual outcome differs from the original estimates due to market conditions.
For cash-settled share-based payment transactions, the fair value of the goods or services received is recognised as an expense with a corresponding increase in liability. The fair value of the services received is determined by reference to the fair value of the liability. Until the liability is settled, the fair value of the liability is re-measured at each reporting date and at the date of settlement, with any changes in fair value recognised for the period.
The proceeds received from the exercise of the equity instruments, net of any directly attributable transaction costs, are credited to share capital when the equity instruments are exercised.
2.21 Assets Held for Sale
Assets that are expected to be recovered primarily through sale rather than through continuing use, are classified as held for sale. Immediately before classification as held for sale, the assets are remeasured in accordance with the applicable FRSs. Therefore, the assets are generally measured at the lower of their carrying amount and fair value less costs to sell. Impairment losses on initial classification as held for sale or distribution and subsequent gains or losses on remeasurement are recognised in profit statement.

AN
NU
AL
RE
PO
RT
20
16
213
NOTES TO THE FINANCIAL STATEMENTSFOR THE YEAR ENDED 30 SEPTEMBER 2016
2. SUMMARY OF SIGNIFICANT ACCOUNTING POLICIES (CONT’D)
2.22 Leases
The determination of whether an arrangement is, or contains a lease is based on the substance of the arrangement at inception date: whether fulfilment of the arrangement is dependent on the use of a specific asset or assets and the arrangement conveys a right to use the asset, even if that right is not explicitly specified in an arrangement.
(a) As Lessee
Finance leases which transfer to the Group substantially all the risks and rewards incidental to ownership of the leased item, are capitalised at the inception of the lease at the fair value of the leased asset or, if lower, at the present value of the minimum lease payments. Any initial direct costs are also added to the amount capitalised. Lease payments are apportioned between the finance charges and reduction of the lease liability so as to achieve a constant rate of interest on the remaining balance of the liability. Finance charges are charged to profit statement. Contingent rents, if any, are charged as expenses in the periods in which they are incurred.
Capitalised leased assets are depreciated over the shorter of the estimated useful life of the asset and the lease term, if there is no reasonable certainty that the Group will obtain ownership by the end of the lease term.
Operating lease payments are recognised as an expense in profit statement on a straight-line basis over the lease term. The aggregate benefit of incentives provided by the lessor is recognised as a reduction of rental expense over the lease term on a straight-line basis.
(b) As Lessor
Leases where the Group retains substantially all the risks and rewards of ownership of the asset are classified as operating leases. Initial direct costs incurred in negotiating an operating lease are added to the carrying amount of the leased asset and recognised over the lease term on the same bases as rental income. The accounting policy for rental income is stated in Note 2.18. Contingent rents are recognised as revenue in the period in which they are earned.
2.23 Exceptional Items
Exceptional items are one-off items of income and expense of such size, nature or incidence that their disclosure is relevant to explain the performance of the Group and Company for the year arising from non-recurring and non-operating transactions.
2.24 Share Capital, Perpetual Securities and Issuance Expenses
Proceeds from issuance of ordinary shares are recognised as share capital in equity and incidental costs directly attributable to the issuance of such shares are deducted against share capital. Proceeds from issuance of perpetual securities are recognised in equity and incidental costs directly attributable to the issuance of perpetual securities are deducted against the proceeds from the issue.

FR
AS
ER
S C
EN
TR
EP
OIN
T L
IMIT
ED
& S
UB
SID
IAR
IES
214
NOTES TO THE FINANCIAL STATEMENTSFOR THE YEAR ENDED 30 SEPTEMBER 2016
2. SUMMARY OF SIGNIFICANT ACCOUNTING POLICIES (CONT’D)
2.25 Contingencies
A contingent liability is:
– a possible obligation that arises from past events and whose existence will be confirmed only by the occurrence or non-occurrence of one or more uncertain future events not wholly within the control of the Group and the Company; or
– a present obligation that arises from past events but is not recognised because it is not probable that an outflow of resources embodying economic benefits will be required to settle the obligation or the amount of obligation cannot be measured with sufficient reliability.
Contingent liabilities are not recognised on the balance sheet of the Group and the Company, except for contingent liabilities assumed in a business combination that are present obligations and which the fair values can be reliably determined.
3. REVENUE
Group2016 2015
$’000 $’000
Properties held for sale: – recognised on completed contract method 1,800,307 2,180,230 – recognised on percentage of completion method 152,076 119,827
1,952,383 2,300,057
Rent and related income 865,949 837,139Hotel income 581,102 374,457Fee income and others 40,158 49,872
3,439,592 3,561,525

AN
NU
AL
RE
PO
RT
20
16
215
NOTES TO THE FINANCIAL STATEMENTSFOR THE YEAR ENDED 30 SEPTEMBER 2016
4. TRADING PROFIT
Trading profit includes the following:
Group2016 2015
Note $’000 $’000
(a) Cost of Sales includes:
Cost of properties held for sale (1,606,411) (1,855,959)Write-down to net realisable value of properties held for sale 20 (47,110) (45,417)Operating costs of investment properties that generated rental income (308,181) (217,435)Operating costs of hotels (318,115) (153,722)Depreciation of property, plant and equipment 12 (43,044) (31,315)Staff costs (225,778) (148,117)Defined contribution plans (13,957) (12,679)Allowance for doubtful trade receivables 18 (3,190) (782)Write-back of allowance for doubtful trade receivables 18 686 628
(b) Other Income/(Losses) includes:
Fair value gain/(loss) on foreign currency forward contracts 13,960 (10,346)Foreign exchange loss (26,466) (41,435)Loss on disposal of property, plant and equipment (849) (388)Gain on disposal of a subsidiary – 37,506Others 6,828 6,263
(6,527) (8,400)
(c) Administrative Expenses includes:
Depreciation of property, plant and equipment 12 (9,833) (8,712)Amortisation of intangible assets 16 (1,646) (741)Audit fees paid to: – auditors of the Company (1,272) (1,127) – other auditors (2,309) (1,921)Non-audit fees paid to: – auditors of the Company (557) (304) – other auditors (1,044) (604)Directors of the Company: – Fee (955) (919) – Remuneration of members of Board Committees (783) (706)Key executive officers: – Remuneration (8,123) (6,437) – Provident fund contribution (104) (69) – Employee share-based expense (2,930) (2,464)Staff costs (128,288) (101,616)Defined contribution plans (9,098) (6,821)Employee share-based expense (7,259) (4,052)

FR
AS
ER
S C
EN
TR
EP
OIN
T L
IMIT
ED
& S
UB
SID
IAR
IES
216
NOTES TO THE FINANCIAL STATEMENTSFOR THE YEAR ENDED 30 SEPTEMBER 2016
5. INTEREST INCOME
Group2016 2015
$’000 $’000
Interest income from loans and receivables: – Related companies 10,235 11,791 – Non-controlling interest – 3,234 – Fixed deposits and bank balances 15,061 15,974
25,296 30,999Interest rate swaps: – Unrealised – 1,653 – Realised – 4,147
25,296 36,799
6. INTEREST EXPENSE
Group2016 2015
$’000 $’000
Interest expense: – Loans and borrowings (157,867) (152,451) – Related parties (78) (43)
(157,945) (152,494)Interest rate swaps: – Unrealised (1,852) (30,584) – Realised (7,707) (3,079)
(167,504) (186,157)
7. EXCEPTIONAL ITEMS
Group2016 2015
$’000 $’000
Gain on disposal of joint ventures and associates 15,483 13,954Transaction costs on acquisition of subsidiaries and associates (2,228) (3,582)(Transaction costs)/write-back of transaction costs on acquisition of property, plant and equipment 145 (12,577)Transaction costs on transfer of investment properties to a REIT (8,584) –Goodwill on acquisition of subsidiaries written off (Note 13(b)) (1,129) –Gain on acquisition of an associate (Note 14(a)) 954 –
4,641 (2,205)

AN
NU
AL
RE
PO
RT
20
16
217
NOTES TO THE FINANCIAL STATEMENTSFOR THE YEAR ENDED 30 SEPTEMBER 2016
8. TAXATION
(a) Major Components of Income Tax Expense
The major components of income tax expense for the years ended 30 September are:
Group2016 2015
$’000 $’000
Based on profit for the year: – Current taxation (139,711) (134,278) – Withholding tax (28,842) (12,757) – Deferred taxation (48,458) (32,229)
(217,011) (179,264)
Over/(under) provision in prior years: – Current taxation 5,618 10,293 – Deferred taxation 17,196 (15,203)
22,814 (4,910)(194,197) (184,174)
(b) Tax Recognised in OCI
2016 2015Before
tax$’000
Taxexpense
$’000
Netof tax$’000
Beforetax
$’000
Taxexpense
$’000
Netof tax$’000
Group
Net fair value of change of cash flow hedges (123,726) – (123,726) 33,718 – 33,718Foreign currency translation 21,143 – 21,143 (475,431) – (475,431)Share of other comprehensive income of joint ventures and associates (56) – (56) 175 – 175Realisation of reserves on disposal of a joint venture and an associate – – – (1,277) – (1,277)
(102,639) – (102,639) (442,815) – (442,815)
(c) Reconciliation between Tax Expense and Accounting Profit
Group2016 2015
$’000 $’000
Profit before taxation 960,343 1,196,549Less: Share of results of joint ventures and associates, net of tax (171,377) (279,430)Profit before share of results of joint ventures and associates and taxation 788,966 917,119

FR
AS
ER
S C
EN
TR
EP
OIN
T L
IMIT
ED
& S
UB
SID
IAR
IES
218
NOTES TO THE FINANCIAL STATEMENTSFOR THE YEAR ENDED 30 SEPTEMBER 2016
8. TAXATION (CONT’D)
(c) Reconciliation between Tax Expense and Accounting Profit (cont’d)
A reconciliation of the statutory tax rate to the Group’s effective tax rate applicable to profit before taxation and share of results of joint ventures and associates for the years ended 30 September are as follows:
Group2016 2015
% %
Singapore statutory rate 17.0 17.0Effect of different tax rates of other countries 6.3 4.8Income not subject to tax (0.6) (1.9)Expenses not deductible for tax purposes 1.1 1.8Losses not allowed to be set off against future taxable profits 2.0 1.5Utilisation of previously unrecognised tax losses (2.9) (0.3)(Over)/under provision in prior years (1.4) 0.5Income from REITs not subject to tax (2.0) (2.2)Tax benefits on current losses not recognised 0.2 1.0Tax effect of fair value change on investment properties 1.6 (1.4)Withholding tax 2.5 1.4Tax effect arising from the formation of Australia tax consolidated group 2.4 (2.0)Tax effect of distributions to perpetual securities holders (1.4) (0.8)Others (0.2) 0.7Effective tax rate 24.6 20.1
During the current year, certain subsidiaries in Singapore have transferred losses of $8,252,000 (Year of Assessment (“YA”) 2015: $26,386,000) arising from YA 2016 to set off against the taxable income of other companies in the Group. Of the tax losses transferred to date under the Singapore group relief system, tax benefits of $894,000 (2015: $1,007,000) have been recognised during the financial year 2016. Potential tax benefits of $10,038,000 (2015: $8,563,000) in respect of the remaining tax losses have not been recognised as they are subject to compliance with the relevant tax legislation governing group relief and agreement of the Inland Revenue Authority of Singapore.
As at 30 September 2016, certain subsidiaries have unutilised tax losses of approximately $183,776,000 (2015: $293,986,000) and unabsorbed capital allowances of $156,432,000 (2015: $174,630,000) available for set off against future taxable profits. These tax losses and capital allowances can be carried forward with no expiry dates. Deferred tax assets of $68,692,000 (2015: $98,659,000) in respect of these losses and capital allowances have not been recognised due to uncertainty of their recoverability. The utilisation of tax losses and capital allowances is subject to the agreement of the respective tax authorities and compliance with certain provisions of the tax legislations of the respective jurisdictions in which the Group operates.

AN
NU
AL
RE
PO
RT
20
16
219
NOTES TO THE FINANCIAL STATEMENTSFOR THE YEAR ENDED 30 SEPTEMBER 2016
9. EARNINGS PER SHARE
Earnings per share is computed by dividing the Group’s attributable profit (after adjusting for distributions to perpetual securities holders of $64,456,000 (2015: $46,924,000)) by the weighted average number of ordinary shares in issue during the financial year. In respect of diluted earnings per share, the denominator is adjusted for the effects of dilutive potential ordinary shares, which comprise share awards granted to employees. The following table reflects the profit and share data used in the computation of basic and diluted earnings per share for the years ended 30 September:
Group2016 2015
$’000 $’000
Attributable profit to shareholders of the Company: – before fair value change and exceptional items 415,407 496,906 – after fair value change and exceptional items 532,763 724,350
No. of Shares‘000 ‘000
Weighted average number of ordinary shares in issue 2,898,893 2,893,873Effects of dilution – share plans 21,409 16,353Weighted average number of ordinary shares for diluted earnings per share computation 2,920,302 2,910,226
Earnings Per Ordinary Share (“EPS”)(a) Basic earnings per share: – before fair value change and exceptional items 14.3¢ 17.2¢ – after fair value change and exceptional items 18.4¢ 25.0¢
(b) On a fully diluted basis: – before fair value change and exceptional items 14.2¢ 17.1¢ – after fair value change and exceptional items 18.2¢ 24.9¢

FR
AS
ER
S C
EN
TR
EP
OIN
T L
IMIT
ED
& S
UB
SID
IAR
IES
220
NOTES TO THE FINANCIAL STATEMENTSFOR THE YEAR ENDED 30 SEPTEMBER 2016
10. SEGMENT INFORMATION
In June 2016, the Group announced a series of key organisational changes.
The organisational changes comprise the formation of the following strategic business units (“SBU”):
(i) Singapore SBU, which integrates the Singapore Residential and Commercial Properties development and operations. Singapore Commercial Properties include the ownership/management of retail, commercial and industrial properties held by Frasers Centrepoint Trust (“FCT”), Frasers Commercial Trust (“FCOT”) and non-REIT entities.
(ii) Australia SBU, which consists both non-REIT entities and Frasers Logistics and Industrial Trust (“FLT”) and the development, ownership and operation of residential, commercial and industrial properties in Australia and New Zealand.
(iii) Hospitality SBU, which encompasses the Group’s hospitality operations and the ownership/operation of hotels and serviced apartments held by Frasers Hospitality Trust (“FHT”) and non-REIT entities.
(iv) International Business, which comprises development and commercial operations in China, the UK, Vietnam and Thailand.
Management determines the business segments based on the reports reviewed and used by the Group CEO (the chief operating decision maker) for strategic decisions making and resources allocation. The Group CEO reviews internal management reports of each SBU at least quarterly.
Geographically, management reviews the performance of the businesses in Singapore, Australia, Europe, China and Others. Geographical segment revenue is based on the geographical location of the customers. Geographical segment assets are based on the geographical location of the assets.
Information regarding the results of each reportable segment is included below. Performance is measured based on segment profit before interest, fair value change, taxation and exceptional items (“PBIT”), as included in the internal management reports that are reviewed by the Group CEO. Segment PBIT is used to measure performance as management believes that such information is the most relevant in evaluating the results of certain segments relative to other entities that operate within these industries. Group financing (including finance costs) and income taxes are managed on a group basis and are not allocated to operating segments. Segment assets and liabilities are presented net of inter-segment balances. Inter-segment pricing is determined on arm’s length basis.
The comparative business segment information have been restated to reflect the above organisational changes.

AN
NU
AL
RE
PO
RT
20
16
221
NOTES TO THE FINANCIAL STATEMENTSFOR THE YEAR ENDED 30 SEPTEMBER 2016
10. SEGMENT INFORMATION (CONT’D)
Year ended 30 September 2016
The following table presents financial information regarding business segments:
Business SegmentSingapore
SBUAustralia
SBUHospitality
SBUInternational
BusinessCorporate
and Others Eliminations Group$’000 $’000 $’000 $’000 $’000 $’000 $’000
Revenue – external 946,152 1,449,354 789,477 253,368 1,241 – 3,439,592Revenue – inter-segment 801 – – – 15,080 (15,881) –Revenue – intra-segment(1) 56,710 5,242 148,726 – 14,026 (224,704) –Total revenue 1,003,663 1,454,596 938,203 253,368 30,347 (240,585) 3,439,592
Subsidiaries 360,880 217,678 134,307 82,456 (28,499) – 766,822Joint ventures and associates 67,360 79 703 103,235 – – 171,377PBIT 428,240 217,757 135,010 185,691 (28,499) – 938,199Interest income 25,296Interest expense (167,504)Profit before fair value change,
taxation and exceptional items 795,991
Fair value change on investment properties (30,535) 200,279 (10,207) 174 – – 159,711
Profit before taxation and exceptional items 955,702
Exceptional items 14,860 (7,961) (2,638) 380 – – 4,641Profit before taxation 960,343Taxation (194,197)Profit for the year 766,146
Non-current assets 8,741,698 3,283,127 4,266,992 69,778 22,458 – 16,384,053Current assets 1,181,141 2,375,457 162,021 1,068,100 16,750 – 4,803,469Investments in joint ventures and associates 248,602 51,546 113 492,752 – – 793,013Tax assets 55,160Bank deposits 437,337Cash and cash equivalents 1,731,343Total assets 24,204,375
Liabilities 376,521 526,657 221,892 877,942 119,293 – 2,122,305Loans and borrowings 9,795,537Tax liabilities 443,049Total liabilities 12,360,891
Other Segment InformationAdditions to non-current assets 278,512 351,971 135,199 567 13,639 – 779,888Depreciation 1,126 9,321 42,364 73 – – 52,884Amortisation 89 – 1,067 490 – – 1,646Write-down to net realisable value of properties held for sale – 47,110 – – – – 47,110
Attributable profit before fair value change and exceptional items(2) 177,916 77,276 24,662 147,871 52,138 – 479,863Fair value change (41,721) 162,544 (14,677) 104 – – 106,250Exceptional items 14,860 (1,323) (2,811) 380 – – 11,106Attributable profit 151,055 238,497 7,174 148,355 52,138 – 597,219

FR
AS
ER
S C
EN
TR
EP
OIN
T L
IMIT
ED
& S
UB
SID
IAR
IES
222
NOTES TO THE FINANCIAL STATEMENTSFOR THE YEAR ENDED 30 SEPTEMBER 2016
10. SEGMENT INFORMATION (CONT’D)
Year ended 30 September 2016 (cont’d)
The following table presents financial information regarding geographical segments:
Geographical Segment Singapore$’000
Australia$’000
Europe$’000
China$’000
Others(3)
$’000Group$’000
Total revenue 1,029,923 1,630,785 509,601 116,770 152,513 3,439,592PBIT 367,595 299,700 111,320 120,296 39,288 938,199
Non-current assets 9,363,764 4,723,421 1,520,991 264,679 511,198 16,384,053Current assets 1,221,237 2,354,240 654,293 511,915 61,784 4,803,469Investments in joint ventures
and associates 248,267 51,546 – 248,394 244,806 793,013Tax assets 55,160Bank deposits 437,337Cash and cash equivalents 1,731,343Total assets 24,204,375
Liabilities 469,708 568,515 337,896 679,369 66,817 2,122,305Loans and borrowings 9,795,537Tax liabilities 443,049Total liabilities 12,360,891
Other segment informationAdditions to non-current assets 295,394 355,539 125,638 695 2,622 779,888Depreciation 10,103 19,469 18,732 1,464 3,116 52,884Amortisation 89 – 1,557 – – 1,646Write-down to net realisable value of properties held for sale – 45,128 – – 1,982 47,110Exceptional items 14,845 (7,945) (2,638) – 379 4,641
(1) Intra-segment revenue arises mainly from master lease and management fee income within the same SBU.(2) The attributable profit disclosed includes inter-segment interest income and expense, in order to reflect the cost of financing of the
Group’s internal funds between segments.(3) Others – Japan, Thailand, New Zealand, Vietnam, the Philippines, Indonesia and Malaysia.

AN
NU
AL
RE
PO
RT
20
16
223
NOTES TO THE FINANCIAL STATEMENTSFOR THE YEAR ENDED 30 SEPTEMBER 2016
10. SEGMENT INFORMATION (CONT’D)
Year ended 30 September 2015
The following table presents financial information regarding business segments:
Business SegmentSingapore
SBUAustralia
SBUHospitality
SBUInternational
BusinessCorporate
and Others Eliminations Group$’000 $’000 $’000 $’000 $’000 $’000 $’000
Revenue – external 1,137,187 1,372,934 566,255 483,488 1,661 – 3,561,525Revenue – inter-segment 645 – – – 14,116 (14,761) –Revenue – intra-segment(1) 57,376 10,364 132,676 – 9,125 (209,541) –Total revenue 1,195,208 1,383,298 698,931 483,488 24,902 (224,302) 3,561,525
Subsidiaries 424,795 226,624 122,626 126,598 (75,311) – 825,332Joint ventures and associates 148,139 43,369 1,852 86,070 – – 279,430PBIT 572,934 269,993 124,478 212,668 (75,311) – 1,104,762Interest income 36,799Interest expense (186,157)Profit before fair value
change, taxation and exceptional items 955,404
Fair value change on investment properties 54,821 79,096 109,288 145 – – 243,350
Profit before taxation and exceptional items 1,198,754
Exceptional items – (286) (15,873) 13,954 – – (2,205)Profit before taxation 1,196,549Taxation (184,174)Profit for the year 1,012,375
Non-current assets 8,520,781 71,626 4,355,718 3,011,331 11,839 – 15,971,295Current assets 1,465,317 780,762 130,452 2,401,718 188,896 – 4,967,145Investments in joint ventures and associates 358,050 182,375 – 33,448 11,515 – 585,388Tax assets 169,724Cash and cash equivalents 1,373,140Total assets 23,066,692
Liabilities 467,765 370,194 232,373 358,819 200,442 – 1,629,593Loans and borrowings 10,275,457Tax liabilities 510,689Total liabilities 12,415,739
Other segment informationAdditions to non-current assets 796,629 235,117 537,664 24 2,354 – 1,571,788Additions to intangible assets – – 264,180 – – – 264,180Depreciation 912 6,723 27,554 91 4,782 – 40,062Amortisation 46 – 164 490 41 – 741Write-down to net realisable
value of properties held for sale – – – 45,417 – – 45,417
Attributable profit before fair value change and exceptional items(2) 269,962 73,102 25,702 184,958 (9,894) – 543,830
Fair value change 75,132 89,315 55,071 94 – – 219,612Exceptional items – (286) (5,836) 13,954 – – 7,832Attributable profit 345,094 162,131 74,937 199,006 (9,894) – 771,274

FR
AS
ER
S C
EN
TR
EP
OIN
T L
IMIT
ED
& S
UB
SID
IAR
IES
224
NOTES TO THE FINANCIAL STATEMENTSFOR THE YEAR ENDED 30 SEPTEMBER 2016
10. SEGMENT INFORMATION (CONT’D)
Year ended 30 September 2015 (cont’d)
The following table presents financial information regarding geographical segments:
Geographical Segment Singapore$’000
Australia$’000
Europe$’000
China$’000
Others(3)
$’000Group$’000
Total revenue 1,226,264 1,549,816 194,437 458,344 132,664 3,561,525PBIT 494,153 316,242 47,587 209,572 37,208 1,104,762
Non-current assets 9,114,971 4,415,963 1,615,943 283,739 540,679 15,971,295Current assets 1,521,928 2,451,158 417,911 508,190 67,958 4,967,145Investments in joint ventures and
associates 369,124 33,448 – 182,375 441 585,388Tax assets 169,724Cash and cash equivalents 1,373,140Total assets 23,066,692
Liabilities 557,095 469,887 213,186 336,428 52,997 1,629,593Loans and borrowings 10,275,457Tax liabilities 510,689Total liabilities 12,415,739
Other segment informationAdditions to non-current assets 1,162,199 260,044 147,183 362 2,000 1,571,788Additions to intangible assets – – 264,180 – – 264,180Depreciation 11,947 21,545 3,187 977 2,406 40,062Amortisation 87 – 654 – – 741Write-down to net realisable value of properties held for sale – – 13,115 32,302 – 45,417Exceptional items 1,111 (13,958) (6,435) – 17,077 (2,205)
(1) Intra-segment revenue arises mainly from master lease and management fee income within the same SBU.(2) The attributable profit disclosed includes inter-segment interest income and expense, in order to reflect the cost of financing of the
Group’s internal funds between segments.(3) Others – Japan, Thailand, New Zealand, Vietnam, the Philippines, Indonesia and Malaysia.

AN
NU
AL
RE
PO
RT
20
16
225
NOTES TO THE FINANCIAL STATEMENTSFOR THE YEAR ENDED 30 SEPTEMBER 2016
11. INVESTMENT PROPERTIES
CompletedInvestmentProperties
$’000
InvestmentProperties
UnderConstruction
$’000
TotalInvestmentProperties
$’000
GroupBalance SheetAt 1 October 2014 10,413,240 1,010,133 11,423,373Currency re-alignment (378,458) (4,303) (382,761)Transfer from prepayments – 290,704 290,704Transfer upon completion 209,777 (209,777) –Transfer to property, plant and equipment (Note 12) (90,931) – (90,931)Additions 325,943 1,200,565 1,526,508Fair value change 184,299 – 184,299
At 30 September 2015 and 1 October 2015 10,663,870 2,287,322 12,951,192Currency re-alignment 26,029 165 26,194Reclassification from properties held for sale – 78,886 78,886Transfer upon completion 353,604 (353,604) –Additions 229,776 487,843 717,619Disposals (452,141) – (452,141)Fair value change 165,086 7,183 172,269At 30 September 2016 10,986,224 2,507,795 13,494,019
2016 2015$’000 $’000
Profit StatementRental income from completed investment properties: – Minimum lease payments 852,255 827,703 – Contingent rent based on tenants’ turnover 13,694 9,436
865,949 837,139
Direct operating expenses (including repairs and maintenance) arising from: – Rental generating properties 308,181 217,435
CompletedInvestmentProperties
$’000
CompanyBalance SheetAt 1 October 2014, 30 September 2015 and 30 September 2016 1,600

FR
AS
ER
S C
EN
TR
EP
OIN
T L
IMIT
ED
& S
UB
SID
IAR
IES
226
NOTES TO THE FINANCIAL STATEMENTSFOR THE YEAR ENDED 30 SEPTEMBER 2016
11. INVESTMENT PROPERTIES (CONT’D)
(a) Completed Investment Properties
Completed investment properties comprise serviced residences, commercial and industrial properties that are leased mainly to third parties under operating leases (Note 37).
Completed investment properties are stated at fair value which has been determined based on valuations performed by valuers at the reporting date.
Investment properties amounting to approximately $383,000,000 (2015: $773,000,000) have been mortgaged to certain financial institutions as securities for credit facilities.
(b) Investment Properties under Construction
IPUC are valued annually by valuers by estimating the fair values of the completed investment properties and then deducting from those amounts the estimated costs to complete the construction and a reasonable profit margin on construction and development. The estimated cost to complete is determined based on the construction cost per square metre in the pertinent area.
IPUC amounting to approximately $2,255,000,000 (2015: $2,076,600,000) have been mortgaged to certain financial institutions as securities for credit facilities.
(c) The fair value change on investment properties recognised in the consolidated profit statement has been adjusted for the following:
Group2016 2015
$’000 $’000
Fair value change on investment properties 172,269 184,299Fair value gain on investment properties acquired from a joint venture – 52,782Other movements (12,558) 6,269Fair value change on investment properties in consolidated profit statement 159,711 243,350
Included in other movements are net long term lease incentives under certain incentive reimbursement arrangements upon the injection of investment properties into a REIT, net leasing fees capitalised and effects of recognising accounting income on a straight-line basis over the lease term.

AN
NU
AL
RE
PO
RT
20
16
227
NOTES TO THE FINANCIAL STATEMENTSFOR THE YEAR ENDED 30 SEPTEMBER 2016
12. PROPERTY, PLANT AND EQUIPMENT
FreeholdLands
LeaseholdLands Buildings
Assets under
Construction
Equipment,Furniture
and Fittings Others Total$’000 $’000 $’000 $’000 $’000 $’000 $’000
Group
CostAt 1 October 2014 207,108 334,502 821,798 2,973 87,292 1,242 1,454,915Currency re-alignment (15,797) (174) (49,537) (281) (2,823) 75 (68,537)Acquisition of subsidiaries 112,502 49,849 352,149 3,124 36,263 – 553,887Additions – – 15,366 3,160 24,575 2,179 45,280Disposals/write-offs – – – – (808) (6) (814)Disposal of a subsidiary – – – – (162) – (162)Transfer from investment
properties 15,067 – 75,864 – – – 90,931Transfer upon completion – – – (190) 190 – –
At 30 September 2015and 1 October 2015 318,880 384,177 1,215,640 8,786 144,527 3,490 2,075,500
Currency re-alignment (9,465) (10,944) (73,920) (1,105) (16,875) (77) (112,386)Acquisition of subsidiaries 22,838 – 50,623 – 2,665 – 76,126Additions – – 8,854 21,409 31,851 155 62,269Disposals/write-offs – – (61) – (2,199) (132) (2,392)Reclassification – – – (2,567) 4,741 (2,174) –Transfer upon completion – – – (3,331) 3,331 – –At 30 September 2016 332,253 373,233 1,201,136 23,192 168,041 1,262 2,099,117
Accumulated DepreciationAt 1 October 2014 – 1,448 3,999 – 33,536 1,030 40,013
Currency re-alignment – 2 (646) – (187) 59 (772)Charge for the year 2015 – 3,978 22,380 – 13,390 314 40,062Acquisition of subsidiaries – – – – 5,750 – 5,750Disposals/write-offs – – – – (418) (6) (424)Disposal of a subsidiary – – – – (143) – (143)
At 30 September 2015 and1 October 2015 – 5,428 25,733 – 51,928 1,397 84,486
Currency re-alignment – (36) (664) – (8,310) (70) (9,080)Charge for the year 2016 – 4,590 24,317 – 23,927 50 52,884Disposals/write-offs – – – – (1,357) (98) (1,455)Reclassification – – – – 255 (255) –At 30 September 2016 – 9,982 49,386 – 66,443 1,024 126,835
Net Book ValueAt 30 September 2016 332,253 363,251 1,151,750 23,192 101,598 238 1,972,282At 30 September 2015 318,880 378,749 1,189,907 8,786 92,599 2,093 1,991,014

FR
AS
ER
S C
EN
TR
EP
OIN
T L
IMIT
ED
& S
UB
SID
IAR
IES
228
NOTES TO THE FINANCIAL STATEMENTSFOR THE YEAR ENDED 30 SEPTEMBER 2016
12. PROPERTY, PLANT AND EQUIPMENT (CONT’D)
Equipment,Furniture and
Fittings$’000
Company
CostAt 1 October 2014, 30 September 2015 and 1 October 2015 53Additions 1Fully depreciated (53)At 30 September 2016 1
Accumulated DepreciationAt 1 October 2014, 30 September 2015 and 1 October 2015 53Fully depreciated (53)Charge for the year 2016 –*At 30 September 2016 –*
Net Book ValueAt 30 September 2016 1At 30 September 2015 –
* Denotes amounts less than $1,000.
The depreciation charge for the year is included in the financial statements as follows:
Group Company2016 2015 2016 2015
$’000 $’000 $’000 $’000
Charged to profit statement (Note 4) 52,877 40,027 – –Capitalised in properties held for sale 7 35 – –
52,884 40,062 – –
Included in property, plant and equipment are certain hotel properties of the Group with carrying amount of $267,187,000 (2015: $264,097,000) which are pledged to certain financial institutions to secure credit facilities.

AN
NU
AL
RE
PO
RT
20
16
229
NOTES TO THE FINANCIAL STATEMENTSFOR THE YEAR ENDED 30 SEPTEMBER 2016
13. INVESTMENTS IN AND BALANCES WITH SUBSIDIARIES
Company2016 2015
Note $’000 $’000
Investments in subsidiariesShares, at cost 1,880,386 1,753,014Less: Allowance for impairment (80,490) (80,490)
1,799,896 1,672,524
Balances with subsidiariesAmounts due from subsidiaries: – Interest free 1,399,656 1,244,624 – Interest bearing 1,973,289 1,767,488
18 3,372,945 3,012,112
Amounts due to subsidiaries: – Interest free (188,743) (228,572)
24 (188,743) (228,572)
Net balances with subsidiaries 3,184,202 2,783,540
Amounts due from subsidiaries: – Current 1,958,514 290,390 – Non-current 1,414,431 2,721,722
18 3,372,945 3,012,112
Amounts due to subsidiaries: – Current (187,435) (21,495) – Non-current (1,308) (207,077)
24 (188,743) (228,572)
Net balances with subsidiaries 3,184,202 2,783,540
Amounts due from subsidiaries are non-trade related, unsecured and payable in cash. In respect of interest bearing amounts, interest of between 0.2% to 4.0% (2015: 0.2% to 4.0%) per annum was charged.
Amounts due to subsidiaries are non-trade related, interest free, unsecured and payable in cash.
Balances with subsidiaries which are payable on demand have been classified as current, while balances with no fixed terms of repayment and not expected to be repaid within the next 12 months have been classified as non-current. The non-current loans due from subsidiaries form part of the Company’s net investment in subsidiaries where settlement is neither planned nor likely to occur in the foreseeable future.
Details of significant subsidiaries are included in Note 40.

FR
AS
ER
S C
EN
TR
EP
OIN
T L
IMIT
ED
& S
UB
SID
IAR
IES
230
NOTES TO THE FINANCIAL STATEMENTSFOR THE YEAR ENDED 30 SEPTEMBER 2016
13. INVESTMENTS IN AND BALANCES WITH SUBSIDIARIES (CONT’D)
(a) Interest in Subsidiaries with Material NCI
The following subsidiaries have NCI that are material to the Group.
Name
Principal Placeof Business/
Country of IncorporationOwnership
Interest held by NCI2016 2015
Frasers Centrepoint Trust Singapore 58.5% 58.7%Frasers Commercial Trust Singapore 72.9% 72.8%Frasers Hospitality Trust Singapore 78.4% 79.7%Frasers Logistics & Industrial Trust Singapore 79.5% –
The Group assessed that it controls FCT, FCOT, FHT and FLT, although the Group owns less than half of the ownership interest and voting power of FCT, FCOT, FHT and FLT. The activities of FCT, FCOT, FHT and FLT are managed by the Group’s wholly-owned subsidiaries, namely, Frasers Centrepoint Asset Management Ltd. (“FCAM”), Frasers Centrepoint Asset Management (Commercial) Ltd. (“FCAMC”), Frasers Hospitality Asset Management Pte. Ltd. (“FHAM”) and Frasers Logistics & Industrial Asset Management Pte. Ltd. (“FLIAM”), respectively (collectively, the “REIT Managers”). The REIT Managers have decision-making authority over FCT, FCOT, FHT and FLT, subject to oversight by the trustee of the respective REITs. The Group’s overall exposure to variable returns, both from the REIT Managers’ remuneration and their interests in the REITs, is significant and any decisions made by the REIT Managers affect the Group’s overall exposure.
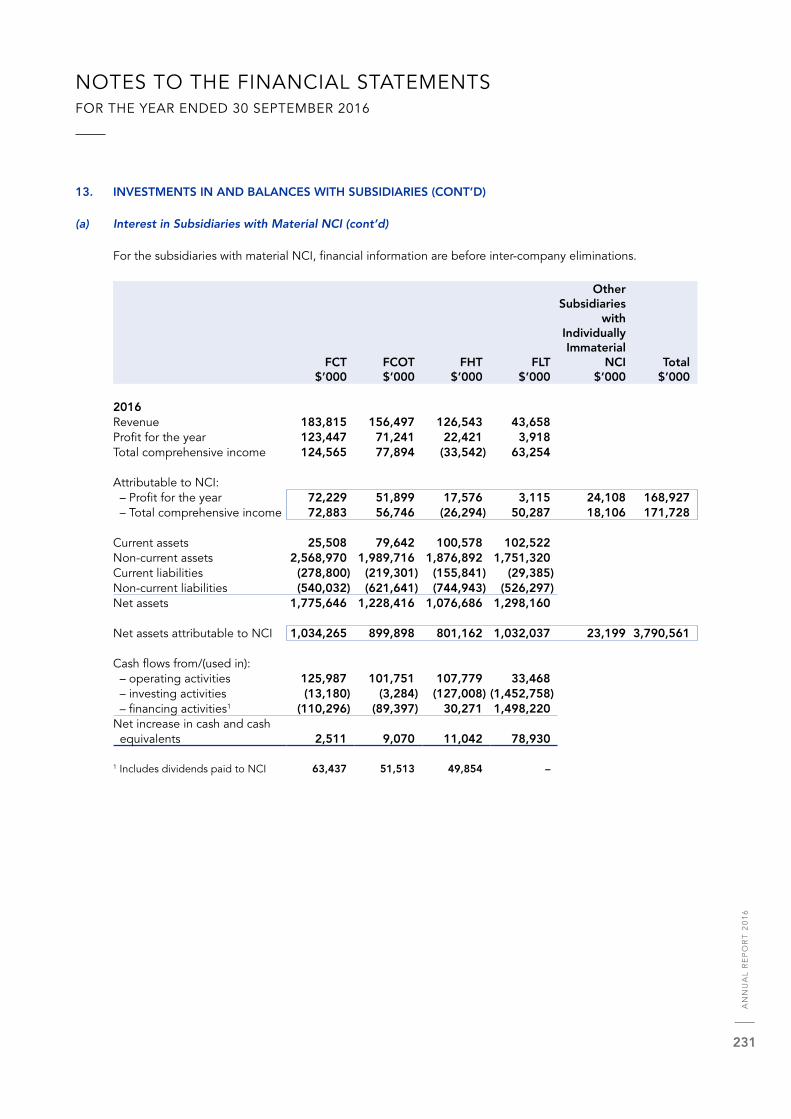
AN
NU
AL
RE
PO
RT
20
16
231
NOTES TO THE FINANCIAL STATEMENTSFOR THE YEAR ENDED 30 SEPTEMBER 2016
13. INVESTMENTS IN AND BALANCES WITH SUBSIDIARIES (CONT’D)
(a) Interest in Subsidiaries with Material NCI (cont’d)
For the subsidiaries with material NCI, financial information are before inter-company eliminations.
FCT$’000
FCOT$’000
FHT$’000
FLT$’000
OtherSubsidiaries
withIndividuallyImmaterial
NCI$’000
Total$’000
2016Revenue 183,815 156,497 126,543 43,658Profit for the year 123,447 71,241 22,421 3,918Total comprehensive income 124,565 77,894 (33,542) 63,254
Attributable to NCI: – Profit for the year 72,229 51,899 17,576 3,115 24,108 168,927 – Total comprehensive income 72,883 56,746 (26,294) 50,287 18,106 171,728
Current assets 25,508 79,642 100,578 102,522Non-current assets 2,568,970 1,989,716 1,876,892 1,751,320Current liabilities (278,800) (219,301) (155,841) (29,385)Non-current liabilities (540,032) (621,641) (744,943) (526,297)Net assets 1,775,646 1,228,416 1,076,686 1,298,160
Net assets attributable to NCI 1,034,265 899,898 801,162 1,032,037 23,199 3,790,561
Cash flows from/(used in): – operating activities 125,987 101,751 107,779 33,468 – investing activities (13,180) (3,284) (127,008) (1,452,758) – financing activities1 (110,296) (89,397) 30,271 1,498,220Net increase in cash and cash equivalents 2,511 9,070 11,042 78,930
1 Includes dividends paid to NCI 63,437 51,513 49,854 –

FR
AS
ER
S C
EN
TR
EP
OIN
T L
IMIT
ED
& S
UB
SID
IAR
IES
232
NOTES TO THE FINANCIAL STATEMENTSFOR THE YEAR ENDED 30 SEPTEMBER 2016
13. INVESTMENTS IN AND BALANCES WITH SUBSIDIARIES (CONT’D)
(a) Interest in Subsidiaries with Material NCI (cont’d)
FCT$’000
FCOT$’000
FHT$’000
OtherSubsidiaries
withIndividuallyImmaterial
NCI$’000
Total$’000
2015Revenue 189,242 142,187 112,305Profit for the year 171,464 75,198 84,800Total comprehensive income 158,746 31,506 46,150
Attributable to NCI: – Profit for the year 100,615 54,737 67,568 18,181 241,101 – Total comprehensive income 93,153 22,935 36,773 11,941 164,802
Current assets 21,598 79,230 62,684Non-current assets 2,527,149 1,955,211 1,882,795Current liabilities (327,670) (39,406) (30,529)Non-current liabilities (466,533) (788,163) (822,217)Net assets 1,754,544 1,206,872 1,092,733
Net assets attributable to NCI 1,027,887 882,828 890,968 46,536 2,848,219
Cash flows from/(used in): – operating activities 120,004 88,574 42,647 – investing activities (620) (197,286) (214,753) – financing activities1 (144,928) 124,185 186,462Net (decrease)/increase in cash and cash equivalents (25,544) 15,473 14,356
1 Includes dividends paid to NCI 62,048 50,870 55,753

AN
NU
AL
RE
PO
RT
20
16
233
NOTES TO THE FINANCIAL STATEMENTSFOR THE YEAR ENDED 30 SEPTEMBER 2016
13. INVESTMENTS IN AND BALANCES WITH SUBSIDIARIES (CONT’D)
(a) Interest in Subsidiaries with Material NCI (cont’d)
(i) FCT
Payment of Management Fees by Way of Units in FCT
The Group, through its subsidiary, FCAM as the manager of FCT, received the following units in FCT (“FCT units”) in payment of 20% to 50% of its management fees for the year from 1 October 2015 to 30 September 2016:
Relevant Period Date Received
No. of
Units
Received
Issued
Price
Value of
Units
Received
Aggregate of
FCT Units
held by FCAM
Aggregate of
FCT Units held
by the Group$ $
1 July 2015 to 26 October 2015 371,296 1.8925 702,678 29,581,336 379,252,336 30 September 2015
1 October 2015 to 25 January 2016 394,269 1.8319 722,261 29,975,605 379,646,605 31 December 2015
1 January 2016 to 25 April 2016 898,068 2.0011 1,797,124 30,873,673 380,544,673 31 March 2016
1 April 2016 to 17 July 2016 865,668 2.0038 1,734,626 31,739,341 381,410,341 30 June 2016
4,956,689
The payment of such fees in the form of units is provided for in the Trust Deed constituting FCT dated 5 June 2006. The issued price is the volume weighted average price of the units traded on the SGX-ST for the last ten business days of the relevant period.
With the above payments of management fees by way of units in FCT, the Group and FCAM hold an aggregate of 381,410,341 units and 31,739,341 units in FCT, representing 41.5% and 3.5% of the total issued FCT units, respectively.

FR
AS
ER
S C
EN
TR
EP
OIN
T L
IMIT
ED
& S
UB
SID
IAR
IES
234
NOTES TO THE FINANCIAL STATEMENTSFOR THE YEAR ENDED 30 SEPTEMBER 2016
13. INVESTMENTS IN AND BALANCES WITH SUBSIDIARIES (CONT’D)
(a) Interest in Subsidiaries with Material NCI (cont’d)
(ii) FCOT
Payment of Management Fees by Way of Units in FCOT
The Group, through its subsidiary, FCAMC as the manager of FCOT, received the following units in FCOT (“FCOT units”) in payment of approximately 23% to 40% of its management fees for the year from 1 October 2015 to 30 September 2016:
Relevant Period Date Received
No. of
Units
Received
Issued
Price
Value of
Units
Received
Aggregate of
FCOT Units
held by FCAMC
Aggregate of
FCOT Units
held by
the Group$ $
1 July 2015 to 27 October 2015 711,903 1.3402 954,092 89,235,276 213,720,255 30 September 2015
1 October 2015 to 22 January 2016 617,585 1.2719 785,506 89,852,861 214,337,840 31 December 2015
1 January 2016 to 25 April 2016 1,037,965 1.3057 1,355,271 90,890,826 215,375,805 31 March 2016
1 April 2016 to 22 July 2016 267,630 1.2472 333,788 91,158,456 215,643,435 30 June 2016
3,428,657
The payment of such management fees in the form of units is provided for in the Trust Deed constituting FCOT dated 12 September 2005. The issued price is the volume weighted average price of the units traded on the SGX-ST for the last ten business days of the relevant period.
With the above payments of management fees by way of units in FCOT, the Group and FCAMC hold an aggregate of 215,643,435 units and 91,158,456 units in FCOT, representing 27.1% and 11.6% of the total issued FCOT units, respectively.

AN
NU
AL
RE
PO
RT
20
16
235
NOTES TO THE FINANCIAL STATEMENTSFOR THE YEAR ENDED 30 SEPTEMBER 2016
13. INVESTMENTS IN AND BALANCES WITH SUBSIDIARIES (CONT’D)
(a) Interest in Subsidiaries with Material NCI (cont’d)
(iii) FHT
Payment of Management Fees by Way of Units in FHT
The Group, through its subsidiaries, FHAM and Frasers Hospitality Pte. Ltd. (“FHPL”) as the managers of FHT (the “FHT managers”), received units in FHT (“FHT units”) in payment of 100% of their management fees.
On 5 May 2016, nomination agreements were signed between the FHT managers and FCL Investment Pte. Ltd. (“FCLI”) where the FHT managers may nominate FCLI to receive such FHT units issued to them pursuant to payment of management fees, in exchange for a cash consideration (“Nomination Agreements”).
The following FHT units were issued in payment of 100% of their management fees for the year from 1 October 2015 to 30 September 2016:
Relevant Period Date Received
No. ofUnits
ReceivedIssued
Price
Value ofUnits
Received
Aggregate of
FHT Unitsheld bythe FHT
managers
Aggregate of
FHT Unitsheld by FCLI
Aggregate of
FHT Unitsheld by
the Group$ $
1 July 2015 to 30 September 2015
3 November 2015 10,647,549 0.7716 8,215,999 24,032,748 262,378,000 286,410,748
1 October 2015 to 5 May 2016 10,656,290 0.7642 8,143,535 24,032,748 273,034,290 297,067,038 31 March 2016
16,359,534
The payment of such management fees in the form of units is provided for in the Trust Deed constituting FHT dated 12 June 2014. The issued price is the volume weighted average price of the units traded on the SGX-ST for the last ten business days of the relevant period.
Payment of Acquisition Fees by Way of Units in FHT
The Group, through FHAM, received 1,159,146 units in FHT at a price of $0.78 per unit, in payment of acquisition fee of $902,280 in respect of the acquisition by FHT of Maritim Hotel Dresden in Germany. FHAM nominated these units to be received and held by FCLI in accordance with the Nomination Agreements.
With the above payments of management fees and acquisition fees by way of units in FHT, the Group, FCLI and the FHT managers hold an aggregate of 298,226,184 units, 274,193,436 units, 24,032,748 units in FHT, representing 21.6%, 19.9% and 1.7% of the total issued FHT units, respectively.

FR
AS
ER
S C
EN
TR
EP
OIN
T L
IMIT
ED
& S
UB
SID
IAR
IES
236
NOTES TO THE FINANCIAL STATEMENTSFOR THE YEAR ENDED 30 SEPTEMBER 2016
13. INVESTMENTS IN AND BALANCES WITH SUBSIDIARIES (CONT’D)
(b) Acquisitions of Subsidiaries
(i) On 17 June 2015, Frasers Hospitality UK Holdings Limited (“FHUK”), a wholly-owned subsidiary of the Company, completed the acquisition of 100% shareholding interest in MHDV Holdings (UK) Limited (“MHDV”), a company incorporated in the United Kingdom, for approximately S$285,800,000 (Sterling Pound (“GBP”) 136,100,000).
The Group engaged an independent firm to perform Purchase Price Allocation (“PPA”) for MHDV. Based on the PPA, the goodwill was provisionally determined at $60,077,000 as of 30 September 2015. The PPA was finalised during the current financial year and the effects of the finalisation of the PPA are as follows:
ProvisionalFair ValuePreviously As
Recognised Adjustments Finalised$’000 $’000 $’000
Goodwill 60,077 403 60,480Brands 158,346 – 158,346Favourable leases 45,757 (487) 45,270Property, plant and equipment 548,137 – 548,137Current assets 24,422 – 24,422Current liabilities (85,062) – (85,062)Non-current liabilities (493,979) 84 (493,895)
As the finalised PPA was not materially different from the provisional allocation in the previous financial year, the comparative figures of the Group have not been restated to reflect the PPA finalisation.

AN
NU
AL
RE
PO
RT
20
16
237
NOTES TO THE FINANCIAL STATEMENTSFOR THE YEAR ENDED 30 SEPTEMBER 2016
13. INVESTMENTS IN AND BALANCES WITH SUBSIDIARIES (CONT’D)
(b) Acquisitions of Subsidiaries (cont’d)
(ii) On 9 Dec 2015, MHDV completed the acquisition of 100% shareholding interest in Golden Tent Limited (“GTL”), a company incorporated in Hong Kong Special Administrative Region of the People’s Republic of China. GTL and its subsidiary carry on the business of operating hotels in the United Kingdom, namely The Montpellier Chapter, The Magdalen Chapter, Hotel Seattle and The Avon Gorge Hotel.
The addition of the four properties through GTL will enable MHDV to further expand into the fast-growing UK hospitality segment, which is in line with the Group’s expansion strategy of the Malmaison and Hotel du Vin lifestyle brands within the region.
The consideration was approximately S$78,398,000 (GBP37,075,000) and was arrived at on a willing-buyer-willing-seller basis, taking into account the net tangible asset value of GTL and its subsidiary of approximately S$77,179,000 (GBP36,498,000).
The fair value of the identifiable assets and liabilities of GTL as at acquisition date were:
Finalised Accounting of the Acquisition of GTL
Fair ValueRecognised on
Acquisition$’000
Property, plant and equipment 76,126Inventories 2,378Cash and cash equivalents 1,388
79,892Trade and other payables (2,647)Provision for taxation (66)Total identifiable net assets at fair value 77,179Goodwill on acquisition written off to profit statement (Note 7) 1,129Exchange difference 90Total consideration 78,398Cash of subsidiaries acquired (1,388)Net cash outflow on acquisition of subsidiaries 77,010

FR
AS
ER
S C
EN
TR
EP
OIN
T L
IMIT
ED
& S
UB
SID
IAR
IES
238
NOTES TO THE FINANCIAL STATEMENTSFOR THE YEAR ENDED 30 SEPTEMBER 2016
13. INVESTMENTS IN AND BALANCES WITH SUBSIDIARIES (CONT’D)
(b) Acquisitions of Subsidiaries (cont’d)
Transaction Costs
Transaction costs related to the acquisition of $1,541,000 have been recognised in the “Exceptional Items” in the Group’s profit statement for the year ended 30 September 2016.
Measurement of Fair Values
Assets Acquired Valuation Technique
Property, plant and equipment 10 years discounted cash flow method, having regard to comparable evidence and current market sentiment
Goodwill Arising from Acquisition
The Group engaged an independent firm to perform valuations of the properties of GTL. Based on the external valuations, the goodwill of $1,129,000, constituting the residual excess of consideration paid over the fair values of identifiable net assets, has been written off in the “Exceptional Items” in the Group’s profit statement for the year ended 30 September 2016.
Impact of the Acquisition on Profit Statement
From the acquisition date, GTL has contributed $23,876,000 and $3,733,000, to the Group’s revenue and profit for the year, respectively. If the business combination had taken place at the beginning of the year, the contribution by GTL to the Group’s revenue and profit for the year would have been $28,607,000 and $4,022,000, respectively.
(c) Acquisition of Additional Interest in Subsidiaries
On 21 December 2015, the Company acquired 100% of the issued and paid-up share capital of SQ International (Australia) Pte. Ltd. (“SQIA”), a newly-incorporated company in Singapore, from SQ International Pte. Ltd (the “SQIA Acquisition”). SQIA was renamed Frasers (Australia) Investments Pte. Ltd. (“FAI”) on 5 August 2016. FAI is the legal and beneficial owner of 25 issued and paid-up ordinary shares and 75 issued and paid-up preference shares in Frasers (Australia) Pte. Ltd. (“FAPL”). The remaining 75 issued and paid-up ordinary shares and 125 issued and paid-up preference shares in FAPL are directly held by the Company. Following completion of the SQIA Acquisition, FAI became a wholly-owned subsidiary of the Group and the Group’s shareholding interest in FAPL increased to 100%.
Subsidiary
AdditionalInterestsin FAPL
Acquired
CarryingValue of
SubsidiaryAcquired
ConsiderationPaid
Excess ofConsideration
Paid$’000 $’000 $’000
FAI 25% (6,801) 35,372 42,173
The differences between the consideration paid and the carrying value of the subsidiary acquired are recognised as a reduction in retained earnings.

AN
NU
AL
RE
PO
RT
20
16
239
NOTES TO THE FINANCIAL STATEMENTSFOR THE YEAR ENDED 30 SEPTEMBER 2016
14. INVESTMENTS IN AND BALANCES WITH JOINT VENTURES AND ASSOCIATES
Group Company2016 2015 2016 2015
Note $’000 $’000 $’000 $’000
Investments in joint venturesInvestments, at cost 74,669 50,339 500 500Share of post-acquisition reserves 165,544 284,589 – –
240,213 334,928 500 500
Investments in associatesInvestments, at cost 398,733 167,535 – –Share of post-acquisition reserves 154,067 82,925 – –
552,800 250,460 – –
Total investments in joint ventures and associates 793,013 585,388 500 500
Balances with joint venturesLoans to joint ventures: 18 – Non-current 165,965 120,106 – – – Current 285,202 261,257 – –Loans from joint ventures: 24 – Current (109) (115) – –
451,058 381,248 – –
Balances with associatesLoans to associates: 18 – Non-current 14,500 78,531 – – – Current – – – –*Loan from an associate: 24 – Non-current – (92,575) – – – Current (85,947) – – –
(71,447) (14,044) – –*
* Denotes amount less than $1,000.
The loans to joint ventures bear interest at 1.0% to 4.7% (2015: 1.1% to 4.6%) per annum, are unsecured, payable in cash and have no fixed repayment terms.
The loans from joint ventures are interest free, unsecured and are repayable in cash within the next 12 months.
The non-current loan to an associate is unsecured, interest free, payable in cash and has no fixed repayment terms.
The loan from an associate of $85,947,000 (2015: $92,575,000) bears interest at 5.3% (2015: 5.3%) per annum, is unsecured and is repayable in August 2017.

FR
AS
ER
S C
EN
TR
EP
OIN
T L
IMIT
ED
& S
UB
SID
IAR
IES
240
NOTES TO THE FINANCIAL STATEMENTSFOR THE YEAR ENDED 30 SEPTEMBER 2016
14. INVESTMENTS IN AND BALANCES WITH JOINT VENTURES AND ASSOCIATES (CONT’D)
(a) Acquisition of an Associate
On 14 January 2016, the Group, through its wholly-owned subsidiary, Frasers Property Holdings (Thailand) Co., Ltd. (“FPHT”), completed the acquisition of 685,700,997 new ordinary shares in Golden Land Property Development Public Company Limited (“Gold”), representing 29.5% shareholding interest in Gold. The business of Gold comprises residential and commercial property development and property management and property advisory service in Thailand. The consideration is approximately S$195,000,000 (Thai Baht (“Baht”) 4,971,000,000), at a subscription price of approximately S$0.29 (Baht 7.25) per share. On 2 March 2016, FPHT completed the open-market purchase of 142,000,000 additional shares at an average price of approximately S$0.261 (Baht 6.50) per share, increasing FPHT’s interest in Gold to 35.6%. The aggregate consideration for the additional shares is approximately S$36,000,000 (Baht 923,000,000).
The Group engaged an independent firm to perform PPA for Gold. Based on the PPA, part of the consideration paid for the net assets has been identified and allocated to property, plant and equipment, investment properties, properties held for sale and deferred tax liabilities. The PPA was finalised during the current financial year. The excess of fair values of the identifiable assets over the consideration is recorded as a gain on acquisition of an associate of $954,000 under “Exceptional Items” in the profit statement (Note 7).
The market value of the Group’s interest in Gold as at 30 September 2016 is S$193,980,000.
(b) Incorporation of a Joint Venture
On 15 February 2016, FCL Topaz Pte. Ltd., a wholly-owned subsidiary of FCL, together with Sekisui House, Ltd. and KH Capital Pte. Ltd., incorporated a joint venture company, East Vue Pte. Ltd. (“East Vue”), in Singapore. The formation of East Vue is to undertake the development of a private condominium land parcel at Siglap Road acquired in April 2016. The site is expected to launch in 2017.
(c) Disposal of an Associate
On 9 December 2015, FCL Centrepoint Pte. Ltd., a wholly-owned subsidiary of FCL, entered into a deed to sell its entire equity interest in an associate, Gemshine Investments (S) Pte. Ltd. (“Gemshine”), to Lexis 88 Investments (Mauritius) Limited and novate its share of intercompany loans for the consideration of $19,618,020 (“the Shares Consideration”) and $60,692,040, respectively (collectively, the “Aggregate Consideration”). The Aggregate Consideration was arrived at on a willing-buyer-willing-seller basis. The Shares Consideration was arrived at taking into account, amongst others, the value of the property and a sum based on the adjusted cash and net liabilities of Gemshine and its subsidiaries as at 30 September 2015. The sale was completed on 1 February 2016 and the Aggregate Consideration was settled in cash.
The gain on disposal of Gemshine of $14,860,000 is classified as “Exceptional Items” in the profit statement (Note 7).

AN
NU
AL
RE
PO
RT
20
16
241
NOTES TO THE FINANCIAL STATEMENTSFOR THE YEAR ENDED 30 SEPTEMBER 2016
14. INVESTMENTS IN AND BALANCES WITH JOINT VENTURES AND ASSOCIATES (CONT’D)
No disclosure of fair value is made for material joint ventures as they are not quoted on any market.
Except for Gold and Supreme Asia Investments Limited and its subsidiary (“SAI group”), the Group’s joint ventures and associates are individually immaterial.
The following table analyses, in aggregate, the carrying amount and share of profit and OCI of the joint ventures.
Group2016 2015
$’000 $’000
Group’s interest in net assets at beginning of the year 334,928 589,385
Group’s share of: – Profit after taxation 69,845 231,167 – OCI (228) 45Total comprehensive income 69,617 231,212Addition during the year 22,952 –Disposal during the year – (124,666)Dividends received during the year (188,125) (344,996)Currency re-alignment 841 (16,007)
Carrying amount of interest at end of the year 240,213 334,928

FR
AS
ER
S C
EN
TR
EP
OIN
T L
IMIT
ED
& S
UB
SID
IAR
IES
242
NOTES TO THE FINANCIAL STATEMENTSFOR THE YEAR ENDED 30 SEPTEMBER 2016
14. INVESTMENTS IN AND BALANCES WITH JOINT VENTURES AND ASSOCIATES (CONT’D)
The following table summarises the financial information of each of the Group’s material associates based on their consolidated financial information prepared in accordance with FRS, modified for fair value adjustments on acquisition and differences in the Group’s accounting policies. The table also analyses, in aggregate, the carrying amount and share of profit and OCI of the remaining individually immaterial associates.
ImmaterialGold SAI group Associates Total
$’000 $’000 $’000 $’000
2016
Revenue 313,261 719,178
Profit after taxation 41,208 208,881OCI – –Total comprehensive income 41,208 208,881
Attributable to: – NCI (269) 7,224 – Investee’s shareholders 41,477 201,657
Current assets 515,958 1,139,264Non-current assets 724,473 214,342Current liabilities (123,632) (811,668)Non-current liabilities (438,143) –Net assets 678,656 541,938
Attributable to: – NCI (7,357) 16,969 – Investee’s shareholders 686,013 524,969
Group’s interest in net assets at beginning of the year – 182,375 68,085 250,460
Group’s share of: – Profit/(loss) after taxation 14,774 88,461 (1,703) 101,532 – OCI – – 172 172Total comprehensive income 14,774 88,461 (1,531) 101,704Addition during the year 231,200 – – 231,200Disposal during the year – – (3,628) (3,628)Dividends received during the year (1,616) (2,788) (4,006) (8,410)Currency re-alignment – (19,654) 1,128 (18,526)
Carrying amount of interest at end of the year 244,358 248,394 60,048 552,800

AN
NU
AL
RE
PO
RT
20
16
243
NOTES TO THE FINANCIAL STATEMENTSFOR THE YEAR ENDED 30 SEPTEMBER 2016
14. INVESTMENTS IN AND BALANCES WITH JOINT VENTURES AND ASSOCIATES (CONT’D)
ImmaterialSAI group Associates Total
$’000 $’000 $’000
2015
Revenue 806,568
Profit after taxation 190,619OCI –Total comprehensive income 190,619
Attributable to: – NCI 6,348 – SAI group’s shareholders 184,271
Current assets 823,491Non-current assets 279,543Current liabilities (724,184)Net assets 378,850
Attributable to: – NCI 13,445 – SAI group’s shareholders 365,405
Group’s interest in net assets at beginning of the year 88,937 127,289 216,226
Group’s share of: – Profit after taxation 86,063 6,007 92,070 – OCI – 130 130Total comprehensive income 86,063 6,137 92,200Disposal during the year – (48,181) (48,181)Dividends received during the year – (4,576) (4,576)Currency re-alignment 7,375 (12,584) (5,209)
Carrying amount of interest at end of the year 182,375 68,085 250,460

FR
AS
ER
S C
EN
TR
EP
OIN
T L
IMIT
ED
& S
UB
SID
IAR
IES
244
NOTES TO THE FINANCIAL STATEMENTSFOR THE YEAR ENDED 30 SEPTEMBER 2016
15. FINANCIAL ASSETS
Group Company2016 2015 2016 2015
$’000 $’000 $’000 $’000
Available-for-sale financial assets:UnquotedEquity investments, at cost 3,303 3,303 3,303 3,303Allowance for impairment (1,155) (1,155) (1,155) (1,155)
2,148 2,148 2,148 2,148
QuotedEquity investments 14 17 – –Total available-for-sale financial assets 2,162 2,165 2,148 2,148
The unquoted equity investments are measured at cost less impairment losses as there are no active markets for these investments (Note 34(e)).
16. INTANGIBLE ASSETS
Goodwill BrandsFavourable
Leases Others Total$’000 $’000 $’000 $’000 $’000
CostAt 1 October 2014 496,516 – – 10,397 506,913Currency re-alignment (50,640) 3,846 1,112 – (45,682)Acquisition of subsidiaries (Note 13(b)) 60,077 158,346 45,757 – 264,180
At 30 September 2015 and 1 October 2015 505,953 162,192 46,869 10,397 725,411Currency re-alignment 4,531 (28,804) (8,246) – (32,519)Adjustments on finalisation of PPA (Note 13(b)) 403 – (487) – (84)Write-off against reserves – – – (5,312) (5,312)At 30 September 2016 510,887 133,388 38,136 5,085 687,496
Accumulated AmortisationAt 1 October 2014 – – – 3,500 3,500Currency re-alignment – – 6 – 6Amortisation – – 164 577 741
At 30 September 2015 and 1 October 2015 – – 170 4,077 4,247Currency re-alignment – – (133) – (133)Amortisation – – 1,067 579 1,646At 30 September 2016 – – 1,104 4,656 5,760
Net Book ValueAt 30 September 2016 510,887 133,388 37,032 429 681,736At 30 September 2015 505,953 162,192 46,699 6,320 721,164

AN
NU
AL
RE
PO
RT
20
16
245
NOTES TO THE FINANCIAL STATEMENTSFOR THE YEAR ENDED 30 SEPTEMBER 2016
16. INTANGIBLE ASSETS (CONT’D)
(a) Goodwill
The Group’s goodwill is denominated in the respective functional currencies of the acquired subsidiaries and is subject to currency fluctuations.
The carrying value was assessed for impairment based on CGUs during the financial year.
2016 2015$’000 $’000
Carrying value of capitalised goodwill in the following business segments: – Australia SBU 397,339 381,816 – Singapore SBU 62,601 62,601 – Hospitality SBU 50,947 61,536
510,887 505,953
(i) Australia SBU
Management adopted a fair value less costs to sell approach to impairment test. The recoverable amount of the CGU of Frasers Property Limited (“FPL”) are estimated based on a 3-year average forecast PBIT earnings amount and an earnings multiple of 12.5 (2015: 12.5). The PBIT earnings was capitalised at multiples consistent with the valuation reports prepared by external professional advisors to assess the offer by the Group to acquire FPL. The earnings multiple determined takes into consideration market participants’ multiples used in mergers and acquisitions, market trading ranges and research reports. Management believes the earnings multiple applied is sustainable in view of the current and anticipated business conditions.
The recoverable amount yields sufficient head room at the reporting date which indicates no impairment required.
As at 30 September 2016, the carrying value of goodwill is Australian Dollar (“A$”) 381,396,000 (2015: A$381,396,000).
(ii) Singapore SBU
The Group recorded goodwill upon the acquisition of FCOT and FCAMC. For the purposes of impairment testing, the goodwill is allocated to FCAMC which holds the management contracts for FCOT.
The recoverable amount has been determined based on value in use calculations using a projection of the net management fee income covering a 10-year period. The pre-tax discount applied to the projections is 10% (2015: 10%) and the forecast growth rate used beyond the 10-year period is 2% (2015: 2%). Based on the recoverable amount, no impairment is necessary.
As at 30 September 2016, the carrying value of goodwill is S$62,601,000 (2015: S$62,601,000).

FR
AS
ER
S C
EN
TR
EP
OIN
T L
IMIT
ED
& S
UB
SID
IAR
IES
246
NOTES TO THE FINANCIAL STATEMENTSFOR THE YEAR ENDED 30 SEPTEMBER 2016
16. INTANGIBLE ASSETS (CONT’D)
(a) Goodwill (cont’d)
(iii) Hospitality SBU
Based on the finalised PPA, goodwill on the acquisition of MHDV was determined at S$60,480,000 (GBP 28,800,000) (Note 13).
For the purposes of impairment testing, the carrying amount of goodwill on the acquisition of MHDV has been allocated to the Malmaison hotels (S$26,535,000 (GBP15,000,000)) and Hotel du Vin hotels (S$24,412,000 (GBP13,800,000)) CGUs.
As at 30 September 2016, the carrying value of goodwill is GBP28,800,000 (2015: GBP28,608,000).
The recoverable amount of these two CGUs were based on its respective value in use, determined by discounting the projected cash flows over 7 years to be generated from the continuing use of the CGU. Cash flows beyond these periods are extrapolated using the estimated terminal growth rates stated in the table below which are within management’s expectation of the long term average growth rates of the industry and countries in which the two CGUs operate.
The key assumptions used in the estimation of the value in use were as follows:
Malmaison hotelsCGU
%
Hotel du Vin hotelsCGU
%
Discount rate 7.0 7.0Terminal value growth rate 2.0 – 3.0 3.0
The recoverable amount yields sufficient headroom at the reporting date which indicates no impairment required.

AN
NU
AL
RE
PO
RT
20
16
247
NOTES TO THE FINANCIAL STATEMENTSFOR THE YEAR ENDED 30 SEPTEMBER 2016
16. INTANGIBLE ASSETS (CONT’D)
(b) Brands
Brands relate to the “Malmaison” and “Hotel du Vin” brand names that the Group acquired in the prior year. Based on the finalised PPA, the amount has been valued at $158,346,000 (Note 13). As the brands are determined to have indefinite useful lives, no amortisation has been charged for the year.
The methodology and key assumptions used in estimation of the recoverable amounts of Malmaison hotels and Hotel du Vin hotels CGUs are set out in Note 16(a)(iii).
(c) Favourable Leases
Based on the finalised PPA, favourable leases attributable to the Malmaison hotels CGU has been valued at $45,270,000 (Note 13). Amortisation of $1,067,000 (2015: $164,000) was charged to the profit statement.
The methodology and key assumptions used in estimation of the recoverable amounts of the Malmaison hotels CGU are set out in Note 16(a)(iii).
17. PREPAYMENTS
Group Company2016 2015 2016 2015
$’000 $’000 $’000 $’000
Non-currentPrepayments 3,074 8,349 – –
CurrentPrepaid land and development costs 60,455 19,877 – –Other prepayments 52,602 41,328 51 47
113,057 61,205 51 47Total prepayments 116,131 69,554 51 47
Prepaid land and development costs relate to tender deposits and related costs paid in respect of tender of Changjiang Road, Dalian, China for the development of serviced residences.

FR
AS
ER
S C
EN
TR
EP
OIN
T L
IMIT
ED
& S
UB
SID
IAR
IES
248
NOTES TO THE FINANCIAL STATEMENTSFOR THE YEAR ENDED 30 SEPTEMBER 2016
18. TRADE AND OTHER RECEIVABLES
Group Company2016 2015 2016 2015
Note $’000 $’000 $’000 $’000
Other receivables (non-current)Amounts due from subsidiaries 13 – – 1,414,431 2,721,722Loans to joint ventures 14 165,965 120,106 – –Loans to associates 14 14,500 78,531 – –Receivables from joint development agreements 43,804 37,096 – –Sundry debtors 4,375 5,743 – –
228,644 241,476 1,414,431 2,721,722
Trade receivables (current)Trade receivables 65,030 72,886 1,238 617Sales proceeds and progress billing receivables 159,544 208,397 – –
224,574 281,283 1,238 617
Other receivables (current)Tax recoverable 11,033 13,558 1,103 –Accrued interest income 15,088 7,301 – –Staff loans and advances 702 1,124 – –Other deposits 36,659 7,034 – 2Insurance claims receivable – 6,707 – –Proceeds from disposal of subsidiary held in escrow account – 78,933 – –Receivables from joint development agreements 33,791 34,032 – –Recoverable development costs 12,506 18,743 – –Amounts due from subsidiaries 13 – – 1,958,514 290,390Amounts due from related companies 321 3,406 – 1,091Loans to joint ventures 14 285,202 261,257 – –Loans to associates 14 – – – –*Loan to a non-controlling interest – 84,969 – –Sundry debtors 57,945 45,158 72 1,365
453,247 562,222 1,959,689 292,848
Total trade and other receivables (current) 677,821 843,505 1,960,927 293,465
Total trade and other receivables (current and non-current) 906,465 1,084,981 3,375,358 3,015,187
* Denotes amount less than $1,000.

AN
NU
AL
RE
PO
RT
20
16
249
NOTES TO THE FINANCIAL STATEMENTSFOR THE YEAR ENDED 30 SEPTEMBER 2016
18. TRADE AND OTHER RECEIVABLES (CONT’D)
Trade Receivables
Trade receivables comprise mainly rental receivables, are non-interest bearing and are recognised at their original invoiced amounts which represent their fair values on initial recognition.
Sales Proceeds and Progress Billing Receivables
Sales proceeds receivables relate to the balance of sales proceeds from completed properties held for sale which will be received upon issue of notice of vacant possession, certificate of statutory completion, expiry of defect liability period and/or title subdivision.
Progress billing receivables relate to the outstanding balance of progress billings which are due after the purchasers receive the notices to make payments.
Receivables from Joint Development Agreements
The timing of expected receipts of cash flows associated with current and non-current receivables from joint development agreements are based on cash flow forecast carried out in conjunction with detailed reviews of the project feasibility studies.
Amounts due from Related Companies
Amounts due from related companies are non-trade related, unsecured, interest free and repayable on demand in cash.
Loan to a Non-Controlling Interest
In 2015, the loan to a NCI was related to the NCI’s share of shareholders’ loan contributions to a subsidiary, Frasers (Australia) Pte. Ltd., paid on behalf by FCL Clover Pte. Ltd., another subsidiary of the Company. The amount was repayable in cash and bore interest at a fixed rate of 8% per annum.
In conjunction with the SQIA acquisition (Note 13(c)), this loan was fully settled during the year.
There is no concentration of credit risk with respect to the trade receivables of the Group as they consist of a large number of customers that are geographically dispersed. The Group does not have any significant credit risk exposure to a single customer or group of customers. The Group generally holds collateral in the form of bank deposits, bank guarantees or mortgages over assets until completion.
The credit risk associated with receivables from joint ventures is monitored through management’s review of project feasibilities and the Group’s ongoing involvement in the operations of these entities.

FR
AS
ER
S C
EN
TR
EP
OIN
T L
IMIT
ED
& S
UB
SID
IAR
IES
250
NOTES TO THE FINANCIAL STATEMENTSFOR THE YEAR ENDED 30 SEPTEMBER 2016
18. TRADE AND OTHER RECEIVABLES (CONT’D)
(a) Credit Risk by Strategic Business Units
The maximum exposure to credit risk for trade receivables and sales proceeds receivable at the reporting date by strategic business units is as follows:
Group Company2016 2015 2016 2015
$’000 $’000 $’000 $’000
Singapore SBU 82,296 165,318 – –Australia SBU 96,379 54,120 – –Hospitality SBU 38,829 58,855 – –International Business 3,324 516 – –Corporate and Others 3,746 2,474 1,238 617
224,574 281,283 1,238 617
(b) Trade Receivables that are Past Due but Not Impaired
The Group had trade receivables amounting to $21,063,000 (2015: $17,763,000) that are past due at reporting date but not impaired. These receivables are unsecured and the aging analysis at the reporting date is as follows:
Group2016 2015
$’000 $’000
Trade receivables past due:1 to 30 days 16,068 10,18031 to 60 days 2,618 3,62061 to 90 days 1,215 1,459More than 90 days 1,162 2,504
21,063 17,763

AN
NU
AL
RE
PO
RT
20
16
251
NOTES TO THE FINANCIAL STATEMENTSFOR THE YEAR ENDED 30 SEPTEMBER 2016
18. TRADE AND OTHER RECEIVABLES (CONT’D)
(c) Trade Receivables that are Impaired
The Group’s trade receivables that are impaired at the reporting date and the movements of the allowance account used to record the impairment are as follows:
GroupCollectively Impaired Individually Impaired
2016 2015 2016 2015$’000 $’000 $’000 $’000
Trade receivables – nominal amounts 4,434 5,038 4,326 1,908Allowance for impairment (2,096) (2,013) (4,326) (1,908)
2,338 3,025 – –
Movements in allowance account:At 1 October 2,013 2,291 1,908 1,855Currency re-alignment 83 (278) (57) 27Charge for the year (Note 4(a)) 11 11 3,179 771Write-back of allowance (Note 4(a)) (11) (11) (675) (617)Written off – – (29) (128)At 30 September 2,096 2,013 4,326 1,908
Trade and other receivables that are individually determined to be impaired at the reporting date relate to debtors that are in significant financial difficulties and have defaulted on payments. These receivables are not secured by any collateral or credit enhancements.
Based on the Group’s historical experience in the collection of receivables, management believes that no additional credit risk beyond that provided for is inherent in the Group’s trade and other receivables.

FR
AS
ER
S C
EN
TR
EP
OIN
T L
IMIT
ED
& S
UB
SID
IAR
IES
252
NOTES TO THE FINANCIAL STATEMENTSFOR THE YEAR ENDED 30 SEPTEMBER 2016
19. DEFERRED TAX ASSETS AND LIABILITIES
The deferred tax assets and liabilities prior to offsetting of balances within the same jurisdiction are as follows:
Group(Charged)/credited to
Balance Sheet Profit Statement2016 2015 2016 2015
$’000 $’000 $’000 $’000
Deferred tax assetsFair value adjustments – – – (1,403)Provisions, expenses and income taken in a different period 23,220 24,708 (196) 2,606Employee benefits 6,260 4,723 1,233 349Unabsorbed losses and capital allowances 99,013 98,797 (3,488) (39,165)Others 23,905 34,290 (27,587) (36,849)Gross deferred tax assets 152,398 162,518 (30,038) (74,462)
Deferred tax liabilitiesFair value adjustments (171,540) (167,395) (10,599) (24,525)Provisions, expenses and income taken in a different period (99,004) (88,085) (16,540) 67,454Differences in depreciation (12,466) (12,493) 216 (1,524)Others (20,306) (42,557) 25,700 (14,375)Gross deferred tax liabilities (303,316) (310,530) (1,223) 27,030
Deferred tax assets and liabilities are offset when there is a legally enforceable right to set off current tax assets against current tax liabilities and when the deferred taxes relate to the same tax jurisdiction. The amounts, determined after appropriate offsetting, are shown on the balance sheet.
Group2016 2015
$’000 $’000
Deferred tax assets 55,160 169,724Deferred tax liabilities (206,078) (317,736)
(150,918) (148,012)

AN
NU
AL
RE
PO
RT
20
16
253
NOTES TO THE FINANCIAL STATEMENTSFOR THE YEAR ENDED 30 SEPTEMBER 2016
20. PROPERTIES HELD FOR SALE
Group2016 2015
$’000 $’000
Development properties held for saleProperties in the course of development, at cost 3,331,291 3,701,765Write-down to net realisable value (94,165) (110,437)
3,237,126 3,591,328Development profit 117,806 61,155
3,354,932 3,652,483Progress payments received and receivable (206,356) (115,720)
3,148,576 3,536,763
Completed properties held for saleCompleted units, at cost 899,902 407,247Write-down to net realisable value (50,927) (21,338)
848,975 385,909
Total properties held for sale 3,997,551 3,922,672
Movements in write-down to net realisable value are as follows:
Group2016 2015
$’000 $’000
Development properties held for saleAt 1 October (110,437) (93,725)Currency re-alignment 1,174 8,912Charge for the year (Note 4(a)) (27,842) (25,624)Sold during the year 31,099 –Transfer to completed properties held for sale 11,841 –At 30 September (94,165) (110,437)
Completed properties held for saleAt 1 October (21,338) (1,298)Currency re-alignment 906 (247)Charge for the year (Note 4(a)) (19,268) (19,793)Sold during the year 614 –Transfer from development properties held for sale (11,841) –At 30 September (50,927) (21,338)
(a) During the year, net interest expense of $39,140,000 (2015: $61,498,000) arising from borrowings obtained specifically for the projects was capitalised as cost of development properties held for sale.
The borrowing costs of loans used to finance the projects have been capitalised at interest rates of between 1.8% and 4.4% (2015: 2.5% and 4.9%) per annum.
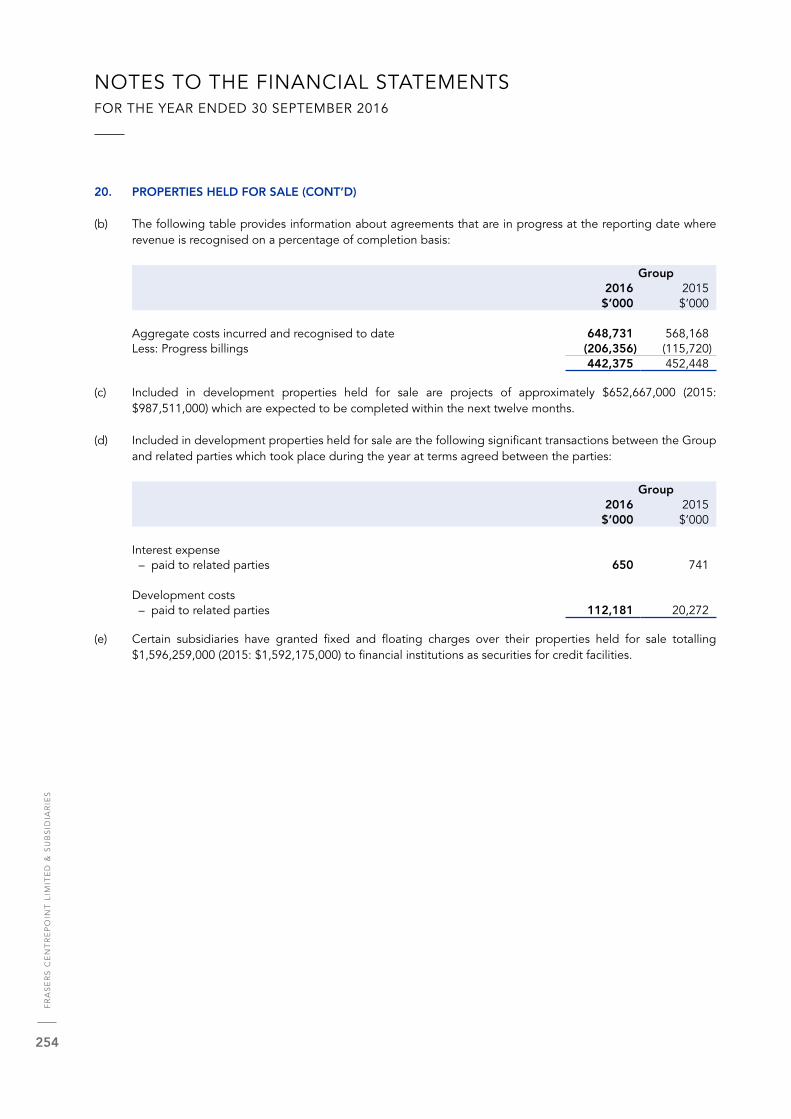
FR
AS
ER
S C
EN
TR
EP
OIN
T L
IMIT
ED
& S
UB
SID
IAR
IES
254
NOTES TO THE FINANCIAL STATEMENTSFOR THE YEAR ENDED 30 SEPTEMBER 2016
20. PROPERTIES HELD FOR SALE (CONT’D)
(b) The following table provides information about agreements that are in progress at the reporting date where revenue is recognised on a percentage of completion basis:
Group2016 2015
$’000 $’000
Aggregate costs incurred and recognised to date 648,731 568,168Less: Progress billings (206,356) (115,720)
442,375 452,448
(c) Included in development properties held for sale are projects of approximately $652,667,000 (2015: $987,511,000) which are expected to be completed within the next twelve months.
(d) Included in development properties held for sale are the following significant transactions between the Group and related parties which took place during the year at terms agreed between the parties:
Group2016 2015
$’000 $’000
Interest expense – paid to related parties 650 741
Development costs – paid to related parties 112,181 20,272
(e) Certain subsidiaries have granted fixed and floating charges over their properties held for sale totalling $1,596,259,000 (2015: $1,592,175,000) to financial institutions as securities for credit facilities.

AN
NU
AL
RE
PO
RT
20
16
255
NOTES TO THE FINANCIAL STATEMENTSFOR THE YEAR ENDED 30 SEPTEMBER 2016
21. DERIVATIVE FINANCIAL INSTRUMENTS
Group Company2016 2015 2016 2015
$’000 $’000 $’000 $’000
AssetsCross currency interest rate swaps/ cross currency swaps 4,689 10,594 225 –Interest rate swaps 1,446 58,178 – 19,463Foreign currency forward contracts 5,362 7,330 – 5,352
11,497 76,102 225 24,815
Comprise: – Current 9,361 20,167 – 5,352 – Non-current 2,136 55,935 225 19,463
11,497 76,102 225 24,815
LiabilitiesCross currency interest rate swaps/ cross currency swaps 19,328 1,318 – –Interest rate swaps 107,541 51,360 32,557 20,018Foreign currency forward contracts 10,049 8,516 190 7,605
136,918 61,194 32,747 27,623
Comprise: – Current 46,924 24,602 263 8,006 – Non-current 89,994 36,592 32,484 19,617
136,918 61,194 32,747 27,623
(a) Cross Currency Interest Rate Swaps/Cross Currency Swaps
The Group enters into cross currency interest rate swaps and cross currency swaps to hedge its exposure to interest rate risks associated with movements in interest rates which impact the borrowing costs of the Group and also to hedge exposure to exchange rate risks on foreign currency borrowings.
The Group and the Company have cross currency interest rate swap and cross currency swap arrangements in place for the following amounts:
Group Company2016 2015 2016 2015
$’000 $’000 $’000 $’000
Notional amountsWithin one year 112,744 – – –Between one to three years 218,193 100,000 – –After three years 421,600 227,768 34,075 –
752,537 327,768 34,075 –
Cross currency swaps with a carrying amount of $705,000 (2015: Nil) were designated as hedge instruments for net investment hedges to hedge foreign exchange risks arising from the Group’s net investments. There was no ineffectiveness recognised from these hedges.

FR
AS
ER
S C
EN
TR
EP
OIN
T L
IMIT
ED
& S
UB
SID
IAR
IES
256
NOTES TO THE FINANCIAL STATEMENTSFOR THE YEAR ENDED 30 SEPTEMBER 2016
21. DERIVATIVE FINANCIAL INSTRUMENTS (CONT’D)
(b) Interest Rate Swaps
Derivative financial instruments are used by the Group to hedge exposure to interest rate risks associated with movements in interest rates on the borrowings of the Group.
The Group and the Company have interest rate swap arrangements in place for the following amounts:
Group Company2016 2015 2016 2015
$’000 $’000 $’000 $’000
Notional amountsWithin one year 2,031,979 549,429 88,595 –Between one to three years 2,750,665 2,676,440 1,000,000 91,124After three years 2,006,033 3,517,270 518,800 1,495,200
6,788,677 6,743,139 1,607,395 1,586,324
At 30 September 2016, the fixed interest rates of the outstanding interest rate swap contracts ranged between 0.4% to 4.5% (2015: 1.0% to 3.5%) per annum.
Interest rate swaps with a carrying amount of $105,494,000 (2015: $33,062,000) were designated as hedge instruments for cash flow hedges, to hedge interest rate risks arising from variable rate borrowings. There was no ineffectiveness recognised from these hedges.
(c) Foreign Currency Forward Contracts
Foreign currency forward contracts are used by the Group to hedge exposure to exchange rate risks on foreign currency receivables and payables, cash and cash equivalents and borrowings. The carrying amounts of the foreign currency forward contracts are accounted for at fair value through profit statement.
The Group and the Company have foreign currency forward contract arrangements in place for the following amounts:
Group Company2016 2015 2016 2015
$’000 $’000 $’000 $’000
Notional amountsWithin one year 794,294 813,568 102,000 421,558Between one to three years 46,881 – – –
841,175 813,568 102,000 421,558

AN
NU
AL
RE
PO
RT
20
16
257
NOTES TO THE FINANCIAL STATEMENTSFOR THE YEAR ENDED 30 SEPTEMBER 2016
22. BANK DEPOSITS AND CASH AND CASH EQUIVALENTS
Group Company2016 2015 2016 2015
$’000 $’000 $’000 $’000
Bank depositsStructured deposits 437,337 – – –
Cash and cash equivalentsFixed deposits 522,545 525,687 20,000 –Cash in banks and in hand 1,117,713 690,197 47,516 9,064
Amounts held under “Project Account Rules – 1997 Ed”: – Fixed deposits 65,223 116,440 – – – Cash in banks 25,862 40,816 – –
91,085 157,256 – –Total cash and cash equivalents 1,731,343 1,373,140 67,516 9,064Total bank deposits and cash and cash equivalents 2,168,680 1,373,140 67,516 9,064
(a) Bank deposits comprise the following Chinese Renminbi (“RMB”) structured deposits:
Group2016 2015 Interest
RateAmount Amount Maturity$’000 RMB’000 $’000 RMB’000 %
Principal protected deposits Linked to United States Dollar (“US$”)/S$ 61,309 300,000 – – 2.7 18 October 2016
81,746 400,000 – – 2.7 17 October 201620,436 100,000 – – 2.8 25 November 2016
Total principal protected deposits(1) 163,491 800,000 – –
Credit-linked deposits Linked to US$ LIBOR 6,131 30,000 – – 2.8 3 March 2017
102,183 500,000 – – 3.1 3 March 2017108,314 530,000 – –
Other deposits 46,714 228,580 – – 3.0 13 January 2017118,818 581,400 – – 3.0 1 March 2017165,532 809,980 – –
Total credit-linked deposits(2) 273,846 1,339,980 – –
Total structured deposits 437,337 2,139,980 – –
(1) Principal protected at maturity.(2) Credit-linked deposits are linked to certain financing obtained by FCL Treasury Pte. Ltd. (“FCLT”), a wholly-owned subsidiary of the
Company (Note 25).

FR
AS
ER
S C
EN
TR
EP
OIN
T L
IMIT
ED
& S
UB
SID
IAR
IES
258
NOTES TO THE FINANCIAL STATEMENTSFOR THE YEAR ENDED 30 SEPTEMBER 2016
22. BANK DEPOSITS AND CASH AND CASH EQUIVALENTS (CONT’D)
(b) Cash in banks earns interest at floating rates based on daily bank deposit rates. The tenure of short-term deposits vary between one day and three months depending on the immediate cash requirements of the Group, and earn interest at the respective short-term deposit rates.
(c) The withdrawals from amounts held under “Project Account Rules – 1997 Ed” are restricted to payments for development expenditure incurred on properties developed for sale.
(d) For the purpose of the consolidated cash flow statement, cash and cash equivalents comprise the following at the reporting date:
Group
2016 2015Note $’000 $’000
Fixed deposits and cash in banks and in hand 1,731,343 1,373,140Bank overdrafts 25 (3,146) (5,635)
Cash and cash equivalents in the consolidated cash flow statement 1,728,197 1,367,505
23. ASSETS HELD FOR SALE
On 19 September 2015, the Group, through its wholly-owned subsidiary Frasers Property Australia (“FPA”), entered into a conditional sale and purchase agreement with Ascendas Real Estate Investment Trust (“A-REIT”) for FPA’s 19.9% ownership interest in the Australand Logistics Joint Venture (“ALJV”) property assets for S$112,123,000 (A$112,000,000). The underlying property value in the joint venture (“JV”) recorded a fair value uplift of S$25,528,000 (A$25,500,000) to reflect the contract price of the assets. As at 30 September 2015, the Group’s revalued 19.9% ownership interest in ALJV was transferred to assets held for sale and was appropriately carried at the lower of cost and fair value less selling costs. The transaction was completed on 18 November 2015.

AN
NU
AL
RE
PO
RT
20
16
259
NOTES TO THE FINANCIAL STATEMENTSFOR THE YEAR ENDED 30 SEPTEMBER 2016
24. TRADE AND OTHER PAYABLES
Group Company2016 2015 2016 2015
Note $’000 $’000 $’000 $’000
Trade payables 472,436 380,433 1,074 186
Other payables (current)Amounts due to non-controlling interests 4,156 132,479 – –Interest payable 45,297 43,480 – –Accrued operating expenses and sundry creditors 407,498 335,339 7,713 8,178Land vendor liabilities 66,461 39,077 – –Rental deposits 56,130 45,238 – –Deposits 67,327 58,882 – –Amounts due to subsidiaries 13 – – 187,435 21,495Amounts due to related companies 669 843 – 6Loan from an associate 14 85,947 – – –Loans from joint ventures 14 109 115 – –Progress billings received in advance 488,931 278,762 – –
1,222,525 934,215 195,148 29,679Total trade and other payables (current) 1,694,961 1,314,648 196,222 29,865
Other payables (non-current)Sundry creditors 67,504 35,142 – –Land vendor liabilities 146,844 75,508 – –Rental deposits 33,192 50,526 – –Amounts due to subsidiaries 13 – – 1,308 207,077Amounts due to non-controlling interests 42,886 – – –Loan from an associate 14 – 92,575 – –
290,426 253,751 1,308 207,077Total trade and other payables (current and non-current) 1,985,387 1,568,399 197,530 236,942
Trade Payables
Trade payables are non-interest bearing and are generally settled on 30 to 60 days term.
Amounts due to Non-Controlling Interests
Current amounts due to non-controlling interests are non-trade in nature, unsecured, repayable in cash on demand and interest free.
Included in non-current amounts due to non-controlling interests is $28,932,000 (2015: Nil) which bears interest at a range between 1.9% and 2.8% (2015: Nil), are non-trade in nature, unsecured and with no fixed term of repayment.

FR
AS
ER
S C
EN
TR
EP
OIN
T L
IMIT
ED
& S
UB
SID
IAR
IES
260
NOTES TO THE FINANCIAL STATEMENTSFOR THE YEAR ENDED 30 SEPTEMBER 2016
24. TRADE AND OTHER PAYABLES (CONT’D)
Sundry Creditors
Included in non-current sundry creditors are unfavourable leases of $11,537,000 (2015: $14,597,000) relating to a lease liability for effects of unfavourable leases recognised on acquisition of MHDV (Note 13) and is amortised over the lease terms of the hotel properties.
Amounts due to Related Companies
Amounts due to related companies are non-trade related, interest free, unsecured and repayable in cash. The current amounts are repayable upon demand.
Land Vendor Liabilities When a subsidiary enters into unconditional contracts with land vendors to purchase properties for future development that contain deferred payment terms, these liabilities are disclosed at their present value.
The amount owing to land vendors of $146,844,000 (2015: $75,508,000) is secured over the properties until the balance of the purchase monies has been paid or settlement of the acquisition has occurred.
25. LOANS AND BORROWINGS
WeightedAverageEffective
Interest Rate Group Company2016 2015 2016 2015 2016 2015
% % $’000 $’000 $’000 $’000
Repayable within one year:UnsecuredBank loans 2.2 4.1 1,052,700 640,173 – –Medium Term Notes 2.9 – 30,000 – – –Bank overdrafts – – 3,146 5,635 – –
SecuredBank loans 3.1 2.3 384,270 374,329 – –
1,470,116 1,020,137 – –
Repayable after one year:UnsecuredBank loans 2.5 2.9 4,587,183 6,107,626 – –Medium Term Notes 3.4 3.4 1,081,541 544,193 – –Other bonds 3.4 3.5 529,268 524,877 – –
SecuredBank loans 1.9 2.9 2,096,135 2,047,742 – –Other bonds 4.9 4.9 31,294 30,882 – –
8,325,421 9,255,320 – –
Total loans and borrowings 9,795,537 10,275,457 – –

AN
NU
AL
RE
PO
RT
20
16
261
NOTES TO THE FINANCIAL STATEMENTSFOR THE YEAR ENDED 30 SEPTEMBER 2016
25. LOANS AND BORROWINGS (CONT’D)
(a) The secured bank loans and other bonds are secured by certain subsidiaries by way of fixed and floating charges over certain assets and mortgages on freehold and leasehold land under development as disclosed in Notes 11, 12 and 20.
(b) Maturity of non-current loans and borrowings is as follows:
Group Company2016 2015 2016 2015
$’000 $’000 $’000 $’000
Between 1 and 2 years 1,119,011 1,667,498 – –Between 3 and 5 years 6,190,504 6,817,991 – –After 5 years 1,015,906 769,831 – –At 30 September 8,325,421 9,255,320 – –
(c) As at 30 September 2016, the Group and the Company had interest rate swaps in place, which have the economic effect of converting borrowings from variable rates to fixed rates. The fair values and the terms of these interest rate swaps are discussed in Notes 21 and 34.
(d) FCLT has a S$3,000,000,000 Multicurrency Debt Issuance Programme, which is unconditionally and irrevocably guaranteed by the Company.
(e) The Group, through its subsidiary, FCT, established a S$1,000,000,000 Multicurrency Debt Issuance Programme.
(f) The Group, through its subsidiary, FCOT, established a S$1,000,000,000 Multicurrency Medium Term Note Programme.
(g) The Group, through its subsidiary, FHT, established a S$1,000,000,000 Multicurrency Debt Issuance Programme.
(h) Included in other bonds are:
Unsecured
(i) Retail bonds of S$497,886,000 (2015: S$497,518,000) issued by FCLT. The bonds mature 7 years from 22 May 2015, are unsecured and are unconditionally and irrevocably guaranteed by the Company.
(ii) Bonds of S$31,382,000 (JPY 2.35 billion) (2015: S$27,359,000 (JPY 2.35 billion)) issued by FHT. The Japanese Yen denominated bonds mature 5 years from 14 July 2014 and are unsecured.
Secured
(iii) Senior bonds of S$31,294,000 (MYR 94,886,000) (2015: S$30,882,000 (MYR 94,846,000)) issued by FHT. The Malaysian Ringgit denominated bonds mature 5 years from 14 July 2014 and are secured by the Westin Kuala Lumpur.

FR
AS
ER
S C
EN
TR
EP
OIN
T L
IMIT
ED
& S
UB
SID
IAR
IES
262
NOTES TO THE FINANCIAL STATEMENTSFOR THE YEAR ENDED 30 SEPTEMBER 2016
26. SHARE CAPITAL
Group and Company2016 2015
No. of Shares $’000 No. of Shares $’000
Issued and fully paid:Ordinary SharesAt 1 October 2,895,009,863 1,759,858 2,889,812,572 1,753,977
Issued during the year: – pursuant to the vesting of shares awarded under the share plans 4,986,581 6,942 5,197,291 5,881At 30 September 2,899,996,444 1,766,800 2,895,009,863 1,759,858
The holders of ordinary shares are entitled to receive dividends as and when declared by the Company. All shares carry one vote per share without restriction.
The ordinary shares have no par value.
27. OTHER RESERVES
Group Company2016 2015 2016 2015
$’000 $’000 $’000 $’000
Hedging reserve (75,374) 27,804 3,700 3,217Foreign currency translation reserve (471,347) (468,446) – –Share-based compensation reserve 18,600 15,353 18,600 15,322Dividend reserve 179,800 179,491 179,800 179,491Other reserves 20,588 – – –
(327,733) (245,798) 202,100 198,030

AN
NU
AL
RE
PO
RT
20
16
263
NOTES TO THE FINANCIAL STATEMENTSFOR THE YEAR ENDED 30 SEPTEMBER 2016
27. OTHER RESERVES (CONT’D)
The movement of other reserves is as follows:
HedgingReserve
ForeignCurrency
TranslationReserve
Share-based
CompensationReserve
DividendReserve
OtherReserve Total
$’000 $’000 $’000 $’000 $’000 $’000
Group2016Opening balance at
1 October 2015 27,804 (468,446) 15,353 179,491 – (245,798)
Other comprehensive incomeNet fair value change of cash flow hedges (103,204) – – – – (103,204)Foreign currency translation – (2,180) – – – (2,180)Share of other comprehensive
income of joint ventures and
associates (56) – – – 20,588 20,532Other comprehensive income for the year (103,260) (2,180) – – 20,588 (84,852)
Contributions by and distributions to ownersOrdinary shares issued – – (6,942) – – (6,942)Employee share-based expense – – 10,189 – – 10,189Dividends paid (Note 30) – – – (179,491) – (179,491)Dividends proposed (Note 30) – – – 179,800 – 179,800Total contributions by and
distributions to owners – – 3,247 309 – 3,556
Changes in ownership interests in subsidiariesChange in interests in subsidiaries without change in control 82 (721) – – – (639)Total change in ownership interests in subsidiaries 82 (721) – – – (639)
Closing balance at 30 September 2016 (75,374) (471,347) 18,600 179,800 20,588 (327,733)

FR
AS
ER
S C
EN
TR
EP
OIN
T L
IMIT
ED
& S
UB
SID
IAR
IES
264
NOTES TO THE FINANCIAL STATEMENTSFOR THE YEAR ENDED 30 SEPTEMBER 2016
27. OTHER RESERVES (CONT’D)
HedgingReserve
Fair ValueAdjustment
Reserve
ForeignCurrency
TranslationReserve
Share-basedCompensation
ReserveDividendReserve
OtherReserve Total
$’000 $’000 $’000 $’000 $’000 $’000 $’000
Group2015Opening balance at 1 October 2014 2,790 671 (78,238) 12,231 179,168 532 117,154
Other comprehensive incomeNet fair value change of cash flow hedges 24,839 – – – – – 24,839Foreign currency translation – – (390,253) – – – (390,253)Share of other comprehensive income of joint ventures and associates 175 – – – – – 175Realisation of reserves on disposal of a joint venture and an associate – (671) – – – (606) (1,277)Other comprehensive income for the year 25,014 (671) (390,253) – – (606) (366,516)
Contributions by and distributions to owners
Ordinary shares issued – – – (5,881) – – (5,881)Employee share-based expense – – – 9,003 – – 9,003Dividends paid (Note 30) – – – – (179,168) – (179,168)Dividends proposed (Note 30) – – – – 179,491 – 179,491Total contributions by and distributions to owners – – – 3,122 323 – 3,445
Changes in ownership interests in subsidiariesDilution of interests in subsidiaries without change in control – – 45 – – – 45Issuance costs incurred by subsidiaries – – – – – 74 74Total change in ownership interests in subsidiaries – – 45 – – 74 119
Closing balance at 30 September 2015 27,804 – (468,446) 15,353 179,491 – (245,798)
(a) Hedging Reserve
The hedging reserve comprises the effective portion of the cumulative net change in the fair value of hedging instruments related to hedged transactions that have not yet occurred.

AN
NU
AL
RE
PO
RT
20
16
265
NOTES TO THE FINANCIAL STATEMENTSFOR THE YEAR ENDED 30 SEPTEMBER 2016
27. OTHER RESERVES (CONT’D)
(b) Foreign Currency Translation Reserve
The foreign currency translation reserve represents exchange differences arising from the translation of the financial statements of foreign operations whose functional currencies are different from that of the Group’s presentation currency. It is also used to record the effect of hedging net investment in foreign operations and translating foreign currency loans which form part of the Group’s net investment in foreign operations.
(c) Share-based Compensation Reserve
The share-based compensation reserve comprises the cumulative value of employee services received for the issue of the shares under the share plans of the Company (Note 28).
(d) Dividend Reserve
Dividend reserve relates to proposed final dividend of 6.2 cents (2015: 6.2 cents) per share (Note 30).
(e) Other Reserve
Included in other reserves are statutory reserves which relate to appropriation of funds from the net profit of subsidiaries and associates in China and Thailand, respectively, in accordance with the local laws.
28. SHARE PLANS
(a) FCL Restricted Share Plan (“RSP”)
The RSP is a share-based incentive plan for senior executives and key senior management, which was approved by shareholders of the Company at an Extraordinary General Meeting held on 25 October 2013.
Information regarding the RSP are as follows:
(i) Depending on the achievement of pre-determined targets over a 2-year period for the RSP, the final number of restricted shares awarded could range between 0% to 150% of the initial grant of the restricted shares.
(ii) 50% of the RSP final awards will vest at the end of the 2-year performance period. The balance will vest equally over the subsequent two years with fulfilment of service requirements.
The expense recognised in the profit statement granted under the RSP during the financial year is $9,662,000 (2015: $7,562,000).

FR
AS
ER
S C
EN
TR
EP
OIN
T L
IMIT
ED
& S
UB
SID
IAR
IES
266
NOTES TO THE FINANCIAL STATEMENTSFOR THE YEAR ENDED 30 SEPTEMBER 2016
28. SHARE PLANS (CONT’D)
(a) FCL Restricted Share Plan (“RSP”) (cont’d)
The estimated fair value of shares granted during the year ranges from $1.42 to $1.54 (2015: $1.42 to $1.54). The fair value of equity-settled contingent award of shares are determined using Monte Carlo Valuation Model, which involves projection of future outcomes using statistical distributions of key random variables including share price and volatility of returns. The inputs to the model used are as follows:
2016 2015
Dividend yield (%) 3.96 4.26Expected volatility (%) 19.33 18.78Risk-free interest rate (%) 1.95 to 2.32 1.48 to 1.98Expected life (years) 2.03 to 4.03 1.36 to 3.36Share price at date of grant ($) 1.67 1.64
(b) FCL Performance Share Plan (“PSP”)
The PSP is a share-based incentive plan for senior executives and key senior management, which was approved by shareholders of the Company at an Extraordinary General Meeting held on 25 October 2013.
Information regarding the PSP are as follows:
(i) Depending on the achievement of pre-determined targets over a 3-year period, the final number of restricted shares awarded could range between 0% to 200% of the initial grant of the restricted shares.
(ii) 100% of the final PSP awards will vest at the end of the 3-year performance period.
The expense recognised in the profit statement granted under the PSP during the financial year is $558,000 (2015: $1,441,000).
The estimated fair value of shares granted during the year is $1.04 (2015: $1.01). The fair value of equity-settled contingent award of shares are determined using Monte Carlo Valuation Model, which involves projection of future outcomes using statistical distributions of key random variables including share price and volatility of returns. The inputs to the model used are as follows:
2016 2015
Dividend yield (%) 3.96 4.26Expected volatility (%) 19.33 18.78Cost of equity (%) 7.20 6.10Risk-free interest rate (%) 2.15 1.75Expected life (years) 3.03 2.36Share price at date of grant ($) 1.67 1.64

AN
NU
AL
RE
PO
RT
20
16
267
NOTES TO THE FINANCIAL STATEMENTSFOR THE YEAR ENDED 30 SEPTEMBER 2016
28. SHARE PLANS (CONT’D)
(c) RSP and PSP granted
The third grant of RSP and PSP (“Year 3”) was made on 22 December 2015. The details of the shares awarded under the RSP and PSP in aggregate are as follows:
RSP Shares Grant Date
Balance as at1 October 2015
or Grant Dateif Later Cancelled
AchievementFactor Vested
Balance as at30 September
2016or Grant Date
if Later
Replacement FCL Awards* 3 October 2014 3,015,881 (25,650) – (1,986,731) 1,003,500Year 1 3 October 2014 4,009,127 (49,600) 870,973 (2,440,050) 2,390,450Year 2 19 August 2015 7,592,138 (637,000) – – 6,955,138Year 3 22 December 2015 10,127,771 (728,000) – – 9,399,771
24,744,917 (1,440,250) 870,973 (4,426,781) 19,748,859
* The Replacement FCL Awards were granted to replace the 1,844,401 Outstanding F&N Awards.
PSP Shares Grant Date
Balance as at1 October 2015
or Grant Dateif Later Cancelled
AchievementFactor Vested
Balance as at30 September
2016or Grant Date
if Later
Replacement FCL Awards** 3 October 2014 598,655 – (38,855) (559,800) –Year 1 3 October 2014 667,839 – – – 667,839Year 2 19 August 2015 469,059 – – – 469,059Year 3 22 December 2015 523,616 – – – 523,616
2,259,169 – (38,855) (559,800) 1,660,514
** The Replacement FCL Awards were granted to replace the 370,246 Outstanding F&N Awards.

FR
AS
ER
S C
EN
TR
EP
OIN
T L
IMIT
ED
& S
UB
SID
IAR
IES
268
NOTES TO THE FINANCIAL STATEMENTSFOR THE YEAR ENDED 30 SEPTEMBER 2016
28. SHARE PLANS (CONT’D)
(c) RSP and PSP granted (cont’d)
The first grant of RSP and PSP for the FY2014 (“Year 1”) was also made on 3 October 2014. The second grant of RSP and PSP (“Year 2”) was made on 19 August 2015. The details of the shares awarded under the RSP and PSP in aggregate are as follows:
RSP Shares Grant Date
Balance as at1 October 2014
or Grant Dateif Later Cancelled
AchievementFactor Vested
Balance as at30 September
2015or Grant Date
if Later
Replacement FCL Awards* 3 October 2014 7,041,253 (96,335) 286,954 (4,215,991) 3,015,881Year 1 3 October 2014 4,111,627 (102,500) – – 4,009,127Year 2 19 August 2015 7,592,138 – – – 7,592,138
18,745,018 (198,835) 286,954 (4,215,991) 14,617,146
* The Replacement FCL Awards were granted to replace the 1,844,401 Outstanding F&N Awards.
PSP Shares Grant Date
Balance as at1 October 2014
or Grant Dateif Later Cancelled
AchievementFactor Vested
Balance as at30 September
2015or Grant Date
if Later
Replacement FCL Awards** 3 October 2014 1,200,527 – 379,428 (981,300) 598,655Year 1 3 October 2014 667,839 – – – 667,839Year 2 19 August 2015 469,059 – – – 469,059
2,337,425 – 379,428 (981,300) 1,735,553
** The Replacement FCL Awards were granted to replace the 370,246 Outstanding F&N Awards.

AN
NU
AL
RE
PO
RT
20
16
269
NOTES TO THE FINANCIAL STATEMENTSFOR THE YEAR ENDED 30 SEPTEMBER 2016
29. PERPETUAL SECURITIES
The Group’s perpetual securities comprise perpetual securities issued by its subsidiaries, FCLT and FHT (the “Issuers”).
Issue Date Principal Amount
Issued under FCLT’s S$3,000,000,000 Multicurrency Debt Issuance Programme: – 4.88% subordinated perpetual securities 24 September 2014 $600,000,000 – 5.00% subordinated perpetual securities 9 March 2015 $700,000,000
Issued under FHT’s S$1,000,000,000 Multicurrency Debt Issuance Programme: – 4.45% subordinated perpetual securities 12 May 2016 $100,000,000
On 12 May 2016, the Group, through its subsidiary FHT, issued $100,000,000 in aggregate principal amount of perpetual securities.
Issuance costs of $1,471,000 was recognised in equity as a deduction from proceeds.
Distributions are payable semi-annually in arrears. The rates of distribution are subject to revision in accordance with the terms and conditions of the securities. Subject to such conditions, the Issuers may elect to defer making distributions on the perpetual securities, and is not subject to any limits as to the number of times a distribution can be deferred.
As the perpetual securities have no fixed maturity date and the payment of distributions is at the discretion of the Issuers, the Issuers are considered to have no contractual obligations to repay the principal or to pay any distributions, and the perpetual securities do not meet the definition for classification as a financial liability under FRS 32 Financial Instruments: Disclosure and Presentation. The whole instrument is presented within equity, and distributions are treated as dividends.
The perpetual securities constitute direct, unconditional, subordinated and unsecured obligations of the Issuers and shall at all times rank pari passu, without any preference or priority among themselves, and pari passu with any Parity Obligations (as defined in the Conditions) of the Issuers. The securities may be redeemed at the option of the Issuers on any distribution payment date as specified in the Conditions and otherwise upon the occurrence of certain redemption events as specified in the Conditions.
30. DIVIDENDS
Company2016 2015
$’000 $’000
Dividends on Ordinary Shares:Interim paid2.4 cents (2015: 2.4 cents) per share, tax exempt 69,909 69,803
Final proposed6.2 cents (2015: 6.2 cents) per share, tax exempt 179,800 179,491
249,709 249,294
The final dividends are proposed by the Directors after the reporting date and subject to the approval of shareholders at the next annual general meeting of the Company.

FR
AS
ER
S C
EN
TR
EP
OIN
T L
IMIT
ED
& S
UB
SID
IAR
IES
270
NOTES TO THE FINANCIAL STATEMENTSFOR THE YEAR ENDED 30 SEPTEMBER 2016
31. FINANCIAL REPORTING STANDARDS (“FRS”) AND INTERPRETATIONS OF FRS (“INT FRS”) FRS and INT FRS not yet effective
There are a number of standards, interpretations, and amendments of standards that have been issued but not yet effective and the Group and the Company have not early adopted any of these standards.
In addition, Singapore incorporated companies listed on the SGX will apply a new financial reporting framework identical to the International Financial Reporting Standards (“IFRS”) for the financial year ending 31 December 2018 onwards. Singapore incorporated companies listed on the SGX will have to assess the impact of IFRS1 First time adoption of IFRS when transitioning to the new reporting framework.
Description
Effective forAnnual PeriodBeginning on
or After
FRS 114 Regulatory Deferral Accounts 1 January 2016
Amendments to FRS 27 Equity Method in Separate Financial Statements 1 January 2016
Amendments to FRS 16 and FRS 38 Clarification of Acceptable Methods of Depreciation and Amortisation
1 January 2016
Amendments to FRS 111 Accounting for Acquisition of Interests in Joint Operations
1 January 2016
Amendments to FRS 110 and FRS 28 Sale for Contribution of Assets between an Investor and its Associate or Joint Venture
1 January 2016
Improvements to FRSs (November 2014)
(a) Amendments to FRS 105 Non-current Assets Held for Sale and Discontinued Operations
1 January 2016
(b) Amendments to FRS 107 Financial Instruments: Disclosures 1 January 2016
(c) Amendments to FRS 19 Employee Benefits 1 January 2016
(d) Amendments to FRS 34 Interim Financial Reporting 1 January 2016
Amendments to FRS 1 Disclosure Initiative 1 January 2016
Amendments to FRS 110, FRS 112 and FRS 28
Investment Entity: Applying the Consolidation Exception
1 January 2016
Amendments to FRS 12 Recognition of Deferred Tax Assets for Unrealised Losses
1 January 2017
FRS 115 Revenue from Contracts with Customers 1 January 2018
FRS 109 Financial Instruments 1 January 2018
FRS 116 Leases 1 January 2019

AN
NU
AL
RE
PO
RT
20
16
271
NOTES TO THE FINANCIAL STATEMENTSFOR THE YEAR ENDED 30 SEPTEMBER 2016
31. FINANCIAL REPORTING STANDARDS (“FRS”) AND INTERPRETATIONS OF FRS (“INT FRS”) (CONT’D)
With the exception of FRS 115, FRS 116 and FRS 109, the adoption of the other standards above will have no material impact on the financial statements in the period of initial application. The nature of the impending changes in accounting policy on adoption of FRS 115, FRS 116 and FRS 109 are described below.
FRS 115 Revenue from Contracts with Customers
FRS 115 establishes a comprehensive framework for determining whether, how much and when revenue is recognised. It also introduces new cost guidance which requires certain costs of obtaining and fulfilling contracts to be recognised as separate assets when specified criteria are met.
When effective, FRS 115 replaces existing revenue recognition guidance, including FRS 18 Revenue, FRS 11 Construction Contracts, INT FRS 113 Customer Loyalty Programmes, INT FRS 115 Agreements for the Construction of Real Estate, INT FRS 118 Transfers of Assets from Customers and INT FRS 31 Revenue – Barter Transactions Involving Advertising Services.
Either a full or modified retrospective application is required for annual periods beginning on or after 1 January 2018 with early adoption permitted. The Group is currently assessing the impact of FRS 115 and plans to adopt the new standard on the required effective date.
FRS 109 Financial Instruments
FRS 109 replaces most of the existing guidance in FRS 39 Financial Instruments: Recognition and Measurement. It includes revised guidance on classification and measurement of financial instruments, a new expected credit loss model for calculating impairment on financial assets and new general hedge accounting requirements. It also carries forward the guidance on recognition and derecognition of financial instruments from FRS 39.
FRS 109 is effective for financial periods beginning on or after 1 January 2018 with early adoption permitted. The Group plans to adopt the new standard on the required effective date.
FRS 116 Leases
FRS 116 eliminates the lessee’s classification of leases as either operating leases or finance leases and introduces a single lessee accounting model. Applying the new model, a lessee is required to recognise right-of-use (ROU) assets and lease liabilities for all leases with a term of more than 12 months, unless the underlying asset is of low value. FRS 116 substantially carries forward the lessor accounting requirements in FRS 17 Leases. Accordingly, a lessor continues to classify its leases as operating leases or finance leases, and to account for these two types of leases using the FRS 17 operating lease and finance lease accounting models respectively. However, FRS 116 requires more extensive disclosures to be provided by a lessor. When effective, FRS 116 replaces existing lease accounting guidance, including FRS 17, INT FRS 104 Determining whether an Arrangement contains a Lease, INT FRS 15 Operating Leases – Incentives, and INT FRS 27 Evaluating the Substance of Transactions Involving the Legal Form of a Lease.
FRS 116 is effective for annual periods beginning on or after 1 January 2019, with early adoption permitted if FRS 115 is also applied. The Group is currently assessing the impact of FRS 116 and plans to adopt the new standard on the required effective date.

FR
AS
ER
S C
EN
TR
EP
OIN
T L
IMIT
ED
& S
UB
SID
IAR
IES
272
NOTES TO THE FINANCIAL STATEMENTSFOR THE YEAR ENDED 30 SEPTEMBER 2016
32. SIGNIFICANT RELATED PARTY TRANSACTIONS
The Group considers the Directors of the Company, and Key Executive Officers comprising the Group CEO, key management officers of the corporate office and CEOs of the strategic business units, to be key management personnel in accordance with FRS 24 Related Party Disclosures.
Sale and Purchase of Goods and Services
In addition to those related party information disclosed elsewhere in the financial statements, the following significant transactions between the Group and related parties took place during the period at terms agreed between the parties:
Group2016 2015
$’000 $’000
Rental and service charge income – received from related companies (2,843) (2,843)
Hotel and other income – received from related companies (240) (286)
Management fees – received from joint ventures (1,567) (2,143) – paid to a related company – 1,245 – paid to a related party 180 180
Purchases – paid to related companies 502 129
Interest (income)/expense – received from related parties (15,061) (15,025) – paid to related parties 78 43
Marketing fees – received from joint ventures (653) (586)
Accounting and secretarial fees – received from joint ventures (662) (789)

AN
NU
AL
RE
PO
RT
20
16
273
NOTES TO THE FINANCIAL STATEMENTSFOR THE YEAR ENDED 30 SEPTEMBER 2016
33. FINANCIAL RISK MANAGEMENT
The Group and the Company are exposed to financial risks arising from its operations and the use of financial instruments. The key financial risks include credit risk, liquidity risk, interest rate risk and foreign currency risk.
The Group has risk management policies and guidelines governing all investments, which set out its overall business strategies, its tolerance for risk and its general risk management philosophy and has established processes to monitor and control hedging transactions in a timely and accurate manner. All investment opportunities are reviewed regularly by the Executive Committee of the Board to ensure that the Group’s policy guidelines are adhered to.
(a) Credit Risk
Credit risk is the risk of loss that may arise on outstanding financial instruments should a counterparty default on its obligations.
As at the reporting date, the Group’s and the Company’s maximum exposure to credit risk in the event that the counterparties fail to perform their obligations is represented by the carrying amount of each class of financial assets recognised in the balance sheets, including derivatives with positive fair values.
As at 30 September 2016, 100% (2015: 100%) of the Company’s receivables are due from subsidiaries. There is no significant credit risk as these companies are of good credit standing.
The Group has guidelines governing the monitoring of credit risk. Contractual deposits are collected and scheduled progress payments are received from the buyers of development properties held for sale when due. Titles to development properties held for sale are only transferred upon full settlement. Rental deposits are collected from tenants and debts are monitored regularly to minimise risk of non-payment.
Cash and fixed deposits are placed with reputable financial institutions. Information regarding financial assets that are either past due or impaired and the aging analysis of trade receivables is disclosed in Note 18.
With respect to derivative financial instruments, credit risk arises from the potential failure of counterparties to meet their obligations under the contract or arrangement. The Group’s maximum credit risk exposure for cross currency interest rate swaps, cross currency swaps, foreign currency swap contracts and interest rate swap contracts are limited to the fair value adjustments of these contracts. It is the Group’s and the Company’s policy to enter into financial instruments with a diversity of credit worthy counterparties. The Group and the Company do not expect to incur material credit losses on their financial assets or other financial instruments.

FR
AS
ER
S C
EN
TR
EP
OIN
T L
IMIT
ED
& S
UB
SID
IAR
IES
274
NOTES TO THE FINANCIAL STATEMENTSFOR THE YEAR ENDED 30 SEPTEMBER 2016
33. FINANCIAL RISK MANAGEMENT (CONT’D)
(b) Liquidity Risk
Liquidity risk is the risk that the Group and Company will encounter difficulty in meeting financial obligations due to shortage of funds. The Group adopts a prudent approach to managing its liquidity risk. The Group always maintains sufficient cash and has available funding through a diverse source of uncommitted credit facilities from various banks and a related company. Surplus cash from subsidiaries are transferred to the Company in accordance with its group policy for management of liquidity of the companies in the Group.
The following are the expected contractual undiscounted cash flows of financial liabilities and derivative financial instruments, including interest payments and excluding the impact of netting agreements.
Contractual Cash FlowsCarryingamount Total
1 yearor less
1 to 5years
Over 5years
$'000 $'000 $'000 $'000 $'000
Group2016
Financial liabilities, at amortised costLoans and borrowings (9,795,537) (10,567,405) (1,690,805) (7,797,752) (1,078,848)Trade and other payables# (1,496,456) (1,496,456) (1,206,030) (221,663) (68,763)
(11,291,993) (12,063,861) (2,896,835) (8,019,415) (1,147,611)
Derivative financial assets/(liabilities), at fair valueInterest rate swaps (net-settled) (106,095) (107,705) (35,755) (71,950) –Forward foreign exchange contracts (gross-settled) (4,687) – outflow (827,710) (827,710) – – – inflow 821,901 821,901 – –Cross currency interest rate swaps/ cross currency swaps
(gross-settled) (14,639) – outflow (817,119) (128,767) (688,352) – – inflow 802,826 128,693 674,133 –
(125,421) (127,807) (41,638) (86,169) –(11,417,414) (12,191,668) (2,938,473) (8,105,584) (1,147,611)
# Exclude progress billings received in advance.

AN
NU
AL
RE
PO
RT
20
16
275
NOTES TO THE FINANCIAL STATEMENTSFOR THE YEAR ENDED 30 SEPTEMBER 2016
33. FINANCIAL RISK MANAGEMENT (CONT’D)
(b) Liquidity Risk (cont’d)
Contractual Cash FlowsCarryingamount Total
1 yearor less
1 to 5years
Over 5years
$'000 $'000 $'000 $'000 $'000
Group2015
Financial liabilities, at amortised costLoans and borrowings (10,275,457) (13,416,004) (1,319,292) (11,281,922) (814,790)Trade and other payables# (1,289,637) (1,298,572) (1,040,874) (221,757) (35,941)
(11,565,094) (14,714,576) (2,360,166) (11,503,679) (850,731)
Derivative financial assets/(liabilities), at fair valueInterest rate swaps (net-settled) 6,818 10,114 (4,125) 14,239 –Forward foreign exchange contracts (gross-settled) (1,186) – outflow (818,649) (818,649) – – – inflow 818,090 818,090 – –Cross currency interest rate swaps/ cross currency swaps (gross-settled) 9,276 – outflow (357,468) (8,792) (348,676) – – inflow 367,959 7,771 360,188 –
14,908 20,046 (5,705) 25,751 –(11,550,186) (14,694,530) (2,365,871) (11,477,928) (850,731)
# Exclude progress billings received in advance.
The table below indicates the periods in which the cash flows associated with the cash flow hedges are expected to occur:
Group2016 2015
$'000 $'000
1 year or less (50,585) (13,227)1 to 5 years (57,581) 48,709
(108,166) 35,482

FR
AS
ER
S C
EN
TR
EP
OIN
T L
IMIT
ED
& S
UB
SID
IAR
IES
276
NOTES TO THE FINANCIAL STATEMENTSFOR THE YEAR ENDED 30 SEPTEMBER 2016
33. FINANCIAL RISK MANAGEMENT (CONT’D)
(b) Liquidity Risk (cont’d)
Contractual Cash FlowsCarryingamount Total
1 yearor less
1 to 5years
Over 5years
$'000 $'000 $'000 $'000 $'000
Company2016
Financial liabilities, at amortised costTrade and other payables (8,787) (8,787) (8,787) – –Amounts due to subsidiaries (188,743) (188,743) (187,435) (1,308) –Recognised liabilities (197,530) (197,530) (196,222) (1,308) –Corporate guarantees – (6,974,672) (6,974,672) – –
(197,530) (7,172,202) (7,170,894) (1,308) –
Derivative financial assets/(liabilities), at fair valueInterest rate swaps (net-settled) (32,557) (32,716) (73) (32,643) –Forward foreign exchange contracts (gross-settled) (190) – outflow (102,663) (102,663) – – – inflow 102,417 102,417 – –Cross currency interest rate swaps/ cross currency swaps (gross-settled) 225 – outflow (38,332) (870) (37,462) – – inflow 38,436 780 37,656 –
(32,522) (32,858) (409) (32,449) –(230,052) (7,205,060) (7,171,303) (33,757) –
2015
Financial liabilities, at amortised costTrade and other payables (8,370) (8,370) (8,370) – –Amounts due to subsidiaries (228,572) (228,572) (21,495) (205,433) (1,644)Recognised liabilities (236,942) (236,942) (29,865) (205,433) (1,644)Corporate guarantees – (7,232,201) (7,232,201) – –
(236,942) (7,469,143) (7,262,066) (205,433) (1,644)
Derivative financial assets/(liabilities), at fair valueInterest rate swaps (net-settled) (555) (427) (402) (25) –Forward foreign exchange contracts (gross-settled) (2,253) – outflow (426,879) (426,879) – – – inflow 425,068 425,068 – –
(2,808) (2,238) (2,213) (25) –(239,750) (7,471,381) (7,264,279) (205,458) (1,644)

AN
NU
AL
RE
PO
RT
20
16
277
NOTES TO THE FINANCIAL STATEMENTSFOR THE YEAR ENDED 30 SEPTEMBER 2016
33. FINANCIAL RISK MANAGEMENT (CONT’D)
(b) Liquidity Risk (cont’d)
The maturity analyses show the contractual undiscounted cash flows of the Group’s and the Company’s financial liabilities on the basis of their earliest possible contractual maturity. The cash inflows/(outflows) disclosed relate to those instruments held for risk management purposes and which are usually not closed out prior to contractual maturity. The disclosure shows net cash flow amounts for derivatives that are net cash-settled and gross cash inflow and outflow amounts for derivatives that have simultaneous gross cash settlement e.g. forward exchange contracts. Net-settled derivative financial assets are included in the maturity analyses as they are held to hedge the cash flow variability of the Group’s floating rate loans.
(c) Interest Rate Risk
Interest rate risk is the risk that the fair value or future cash flows of the Group’s and the Company’s financial instruments will fluctuate because of changes in market interest rates. The Group’s and the Company’s exposure to interest rate risk is in respect of debt obligations and deposits with related companies and financial institutions.
The Group manages its interest rate exposure by maintaining a mix of fixed and floating rate debts with varying tenors. To manage this mix in a cost-efficient manner, the Group uses hedging instruments such as interest rate swaps and cross currency interest rate swaps to minimise its exposure to interest rate volatility.
Sensitivity Analysis for Interest Rate Risk
A change of 100 basis points in interest rates at the reporting date would have increased (decreased) equity and profit before tax by the amounts shown below. This analysis assumes that all other variables, in particular foreign currency rates, remain constant.
Profit before tax Equity100 bp 100 bp 100 bp 100 bp
Increase Decrease Increase Decrease$’000 $’000 $’000 $’000
Group2016
Variable rate instruments not hedged (13,251) 13,251 – –Interest rate swaps/cross currency
interest rate swaps 5,135 (5,135) 134,556 (134,556)Cash flow sensitivity (net) (8,116) 8,116 134,556 (134,556)
2015
Variable rate instruments not hedged (29,435) 29,435 – –Interest rate swaps/cross currency interest rate swaps 10,521 (10,521) 159,482 (159,482)Cash flow sensitivity (net) (18,914) 18,914 159,482 (159,482)

FR
AS
ER
S C
EN
TR
EP
OIN
T L
IMIT
ED
& S
UB
SID
IAR
IES
278
NOTES TO THE FINANCIAL STATEMENTSFOR THE YEAR ENDED 30 SEPTEMBER 2016
33. FINANCIAL RISK MANAGEMENT (CONT’D)
(d) Foreign Currency Risk
The purpose of the Group’s and the Company’s foreign currency hedging activities is to protect against the volatility associated with future cash flow arising from investments in and loans granted to foreign subsidiaries. The Group and the Company primarily utilise foreign currency forward contracts and cross currency swaps to hedge foreign currency denominated investments and loans to foreign subsidiaries. Under this programme, increases or decreases in the Company’s foreign currency denominated investments and loans are partially offset by gains and losses on the hedging instruments. The Company does not use foreign currency forward contracts or other hedging instruments for trading purposes. In addition to transactional exposures, the Group is also exposed to foreign exchange movements on its net investment in foreign subsidiaries. The Group uses foreign currency borrowings as a natural hedge against the activities of the foreign subsidiaries.
The Group’s exposure to foreign currencies as at 30 September 2016 and 30 September 2015, after taking into account foreign currency forward contracts and cross currency swaps, was as follows:
SingaporeDollar$’000
AustralianDollar$’000
ChineseRenminbi
$’000
SterlingPound$’000
UnitedStatesDollar$’000
Group2016
Financial AssetsTrade and other receivables 135 216,789 56,877 320,820 36,130Cash and cash equivalents 72,085 24,773 3 20,579 1,499
Financial LiabilitiesTrade and other payables (20,238) (13,930) (54,928) (279) (44,070)Loans and borrowings (219,361) – (167,520) (83,986) (356,996)Net statement of financial position
exposure (167,379) 227,632 (165,568) 257,134 (363,437)Less:Foreign currency forward contracts/ cross currency swaps 219,000 (136,711) 115,315 (254,518) 336,658Net currency exposure 51,621 90,921 (50,253) 2,616 (26,779)
2015
Financial AssetsTrade and other receivables 193 237,811 205,009 256,598 37,761Cash and cash equivalents – 77,897 – 1,206 45,424
Financial LiabilitiesTrade and other payables (19,849) – (126,444) – (49,624)Loans and borrowings (219,531) – (125,454) (102,071) (91,711)Net statement of financial position
exposure (239,187) 315,708 (46,889) 155,733 (58,150)Less:Foreign currency forward contracts/ cross currency swaps 219,000 (238,645) – (148,634) 81,171Net currency exposure (20,187) 77,063 (46,889) 7,099 23,021

AN
NU
AL
RE
PO
RT
20
16
279
NOTES TO THE FINANCIAL STATEMENTSFOR THE YEAR ENDED 30 SEPTEMBER 2016
33. FINANCIAL RISK MANAGEMENT (CONT’D)
(d) Foreign Currency Risk (cont’d)
The Group has the following outstanding foreign currency forward contracts and cross currency swaps to hedge future receipts of distribution, net of anticipated payments in foreign currencies.
Group 2016 2015
$’000 $’000
Notional amountsS$ 142,744 742 A$ 129,494 29,954 GBP 10,478 8,813 Others 4,132 1,693
286,848 41,202
The Company’s exposure to foreign currencies as at 30 September 2016 and 30 September 2015, after taking into account foreign currency forward contracts, was as follows:
AustralianDollar$’000
United StatesDollar$’000
Company2016
Financial AssetsTrade and other receivables 48,980 9,573Cash and cash equivalents 27 162Currency exposure 49,007 9,735
2015
Financial AssetsTrade and other receivables 47,042 9,411Cash and cash equivalents 4 56Currency exposure 47,046 9,467

FR
AS
ER
S C
EN
TR
EP
OIN
T L
IMIT
ED
& S
UB
SID
IAR
IES
280
NOTES TO THE FINANCIAL STATEMENTSFOR THE YEAR ENDED 30 SEPTEMBER 2016
33. FINANCIAL RISK MANAGEMENT (CONT’D)
(d) Foreign Currency Risk (cont’d)
Sensitivity Analysis for Foreign Currency Risk
The following table demonstrates the sensitivity analysis of the Group’s exposure to foreign currency risk on its financial assets and liabilities as at the end of the financial year by a reasonably possible change in the S$, A$, RMB, GBP and US$ against the respective functional currencies of the Group entities, with all other variables held constant:
Group CompanyProfit before
Taxation EquityProfit before
Taxation Equity$’000 $’000 $’000 $’000
30 September 2016
S$ – Strengthened 1% 516 – – –– Weakened 1% (516) – – –
A$ – Strengthened 1% 909 – 490 –– Weakened 1% (909) – (490) –
RMB – Strengthened 1% (503) – – –– Weakened 1% 503 – – –
GBP – Strengthened 1% 26 1,127 – –– Weakened 1% (26) (1,127) – –
US$ – Strengthened 1% (268) – 97 –– Weakened 1% 268 – (97) –
30 September 2015
S$ – Strengthened 1% (202) – – –– Weakened 1% 202 – – –
A$ – Strengthened 1% 771 – 470 –– Weakened 1% (771) – (470) –
RMB – Strengthened 1% (469) – – –– Weakened 1% 469 – – –
GBP – Strengthened 1% 71 – – –– Weakened 1% (71) – – –
US$ – Strengthened 1% 230 – 95 –– Weakened 1% (230) – (95) –

AN
NU
AL
RE
PO
RT
20
16
281
NOTES TO THE FINANCIAL STATEMENTSFOR THE YEAR ENDED 30 SEPTEMBER 2016
34. FAIR VALUE OF ASSETS AND LIABILITIES
(a) Fair Value Hierarchy
The Group categorises fair value measurements using a fair value hierarchy that is dependent on the valuation inputs used as follows:
Level 1: Quoted prices (unadjusted) in active markets for identical assets or liabilities.
Level 2: Inputs other than quoted prices included within Level 1 that are observable for the asset or liability, either directly (i.e., as prices) or indirectly (i.e., derived from prices).
Level 3: Inputs for the asset or liability that are not based on observable market data (unobservable inputs).
Fair value measurements that use inputs of different hierarchy levels are categorised in its entirety in the same level of the fair value hierarchy as the lowest level input that is significant to the entire measurement.

FR
AS
ER
S C
EN
TR
EP
OIN
T L
IMIT
ED
& S
UB
SID
IAR
IES
282
NOTES TO THE FINANCIAL STATEMENTSFOR THE YEAR ENDED 30 SEPTEMBER 2016
34. FAIR VALUE OF ASSETS AND LIABILITIES (CONT’D)
(b) Classifications and Fair Values
The following tables show the carrying amounts and fair values of assets and liabilities, including their levels in the fair value hierarchy. It does not include fair value information for short term trade and other receivables, cash and cash equivalents, trade and other payables and short-term bank borrowings as their carrying amounts are reasonable approximation of fair values.
Fair ValueCarryingAmount
Level 1 Level 2 Level 3 Total TotalNote $’000 $’000 $’000 $’000 $’000
Group2016
Assets and Liabilities measured at Fair Value:Financial AssetsAvailable-for-sale financial assets: – Quoted investments 15 14 – – 14 14Derivative financial assets: – Cross currency interest rate swaps/ cross currency swaps 21 – 4,689 – 4,689 4,689 – Interest rate swaps 21 – 1,446 – 1,446 1,446 – Foreign currency forward
contracts 21 – 5,362 – 5,362 5,362
Non-Financial AssetsInvestment properties 11 – – 13,494,019 13,494,019 13,494,019
14 11,497 13,494,019 13,505,530 13,505,530
Financial LiabilitiesDerivative financial liabilities: – Cross currency interest rate swaps/ cross currency swaps 21 – 19,328 – 19,328 19,328 – Interest rate swaps 21 107,541 – 107,541 107,541 – Foreign currency forward
contracts 21 – 10,049 – 10,049 10,049– 136,918 – 136,918 136,918
Liabilities not carried at Fair Value but for which Fair Value are disclosed:Financial LiabilitiesBank borrowings (non-current) 25 – 8,397,918 – 8,397,918 8,325,421

AN
NU
AL
RE
PO
RT
20
16
283
NOTES TO THE FINANCIAL STATEMENTSFOR THE YEAR ENDED 30 SEPTEMBER 2016
34. FAIR VALUE OF ASSETS AND LIABILITIES (CONT’D)
(b) Classifications and Fair Values (cont’d)
Fair ValueCarryingAmount
Level 1 Level 2 Level 3 Total TotalNote $’000 $’000 $’000 $’000 $’000
Group2015
Assets and Liabilities measured at Fair Value:Financial AssetsAvailable-for-sale financial assets: – Quoted investments 15 17 – – 17 17Derivative financial assets: – Cross currency interest rate swaps/ cross currency swaps 21 – 10,594 – 10,594 10,594 – Interest rate swaps 21 – 58,178 – 58,178 58,178 – Foreign currency forward
contracts 21 – 7,330 – 7,330 7,330
Non-Financial AssetsInvestment properties 11 – – 12,951,192 12,951,192 12,951,192
17 76,102 12,951,192 13,027,311 13,027,311
Financial LiabilitiesDerivative financial liabilities: – Cross currency interest rate swaps/ cross currency swaps 21 – 1,318 – 1,318 1,318 – Interest rate swaps 21 – 51,360 – 51,360 51,360 – Foreign currency forward
contracts 21 – 8,516 – 8,516 8,516– 61,194 – 61,194 61,194
Liabilities not carried at Fair Value but for which Fair Value are disclosed:Financial LiabilitiesBank borrowings (non-current) 25 – 9,248,578 – 9,248,578 9,255,320

FR
AS
ER
S C
EN
TR
EP
OIN
T L
IMIT
ED
& S
UB
SID
IAR
IES
284
NOTES TO THE FINANCIAL STATEMENTSFOR THE YEAR ENDED 30 SEPTEMBER 2016
34. FAIR VALUE OF ASSETS AND LIABILITIES (CONT’D)
(b) Classifications and Fair Values (cont’d)
Fair ValueCarryingAmount
Level 1 Level 2 Level 3 Total TotalNote $’000 $’000 $’000 $’000 $’000
Company2016
Assets and Liabilities measured at Fair Value:Financial AssetsDerivative financial assets: – Cross currency interest rate swaps/ cross currency swaps 21 – 225 – 225 225
Non-Financial AssetInvestment property 11 – – 1,600 1,600 1,600
– 225 1,600 1,825 1,825
Financial LiabilitiesDerivative financial liabilities: – Interest rate swaps 21 – 32,557 – 32,557 32,557 – Foreign currency forward contracts 21 – 190 – 190 190
– 32,747 – 32,747 32,747
2015
Assets and Liabilities measured at Fair Value:Financial AssetsDerivative financial assets: – Interest rate swaps 21 – 19,463 – 19,463 19,463 – Foreign currency forward contracts 21 – 5,352 – 5,352 5,352
Non-Financial AssetInvestment property 11 – – 1,600 1,600 1,600
– 24,815 1,600 26,415 26,415
Financial LiabilitiesDerivative financial liabilities: – Interest rate swaps 21 – 20,018 – 20,018 20,018 – Foreign currency forward contracts 21 – 7,605 – 7,605 7,605
– 27,623 – 27,623 27,623

AN
NU
AL
RE
PO
RT
20
16
285
NOTES TO THE FINANCIAL STATEMENTSFOR THE YEAR ENDED 30 SEPTEMBER 2016
34. FAIR VALUE OF ASSETS AND LIABILITIES (CONT’D)
(c) Determination of Fair Value
The following valuation methods and assumptions are used to estimate the fair values of the following significant classes of assets and liabilities:
(i) Derivatives
Forward currency forward contracts, cross currency interest rate swaps, cross currency swaps and interest rate swaps are valued using valuation techniques with market observable inputs. The most frequently applied valuation techniques include forward pricing and swap models, using present valuation calculations. The models incorporate various inputs including the credit quality of counterparties, foreign exchange spot and forward rates, interest rate and forward rate curves.
(ii) Non-Derivative Financial Liabilities
Fair value, which is determined for disclosure purposes, is calculated based on the present value of future principal and interest cash flows, discounted using the market rate of interest at the reporting date.
(iii) Other Financial Assets and Liabilities
The fair value of quoted securities is their quoted bid price at the reporting date. The carrying amounts of financial assets and liabilities with a maturity of less than one year (including trade and other receivables, cash and cash equivalents and trade and other payables) are assumed to approximate their fair values because of the short period to maturity. All other financial assets and liabilities are discounted to determine their fair values. Where discounted cash flow techniques are used, estimated future cash flows are based on management’s best estimates and the discount rate is a market-related rate for a similar instrument in the balance sheet.

FR
AS
ER
S C
EN
TR
EP
OIN
T L
IMIT
ED
& S
UB
SID
IAR
IES
286
NOTES TO THE FINANCIAL STATEMENTSFOR THE YEAR ENDED 30 SEPTEMBER 2016
34. FAIR VALUE OF ASSETS AND LIABILITIES (CONT’D)
(c) Determination of Fair Value (cont’d)
(iv) Investment Properties
The Group’s investment property portfolio is mostly valued by external and independent valuers at least once every two years. The fair values are based on open market values, being the estimated amount for which a property could be exchanged on the date of the valuation between a willing buyer and a willing seller in an arm’s length transaction wherein the parties had each acted knowledgeably and without compulsion. The valuers have considered valuation techniques including market comparison method, capitalisation method and discounted cash flow method in arriving at the open market value as at the reporting date. In determining the fair value, the valuers have used valuation techniques which involve certain estimates. The key assumptions used to determine the fair value of investment properties include market-corroborated capitalisation rate, terminal yield and discount rate. IPUC are stated at fair value which has been determined based on valuations performed at reporting date. Valuations are performed by accredited independent valuers with recognised and relevant professional qualification or internal valuers with recent experience in the location and category of the properties being valued. The fair values of IPUC are determined using a combination of capitalisation approach, discounted cash flow method and residual land value method, where appropriate.
The valuations are based on open market values on the highest and best use basis.
The market comparison method involves the analysis of comparable sales of similar properties and adjusting the sale prices to that reflective of the investment properties.
The capitalisation method capitalises the estimated net income of the property for perpetuity or the balance term of the lease tenure at a capitalisation rate that is appropriate for the type of use, tenure and reflective of the quality of the investment. Capital adjustments are then made to derive the capital value of the property.
The discounted cash flow method involves the estimation and projection of net cash flows over a period and discounting the stream of net cash flow (including estimated terminal net cash flow) at an estimated required rate of return to arrive at the net present value.
In the residual land value method of valuation, the value of the property in its existing partially completed state of construction taking into account the cost of work done is arrived at by deducting estimated cost to complete and other relevant costs from the gross development value of the proposed development, assuming satisfactory completion.
In relying on the valuation reports, management has exercised its judgement and is satisfied that the valuation methods and estimates are reflective of current market conditions.
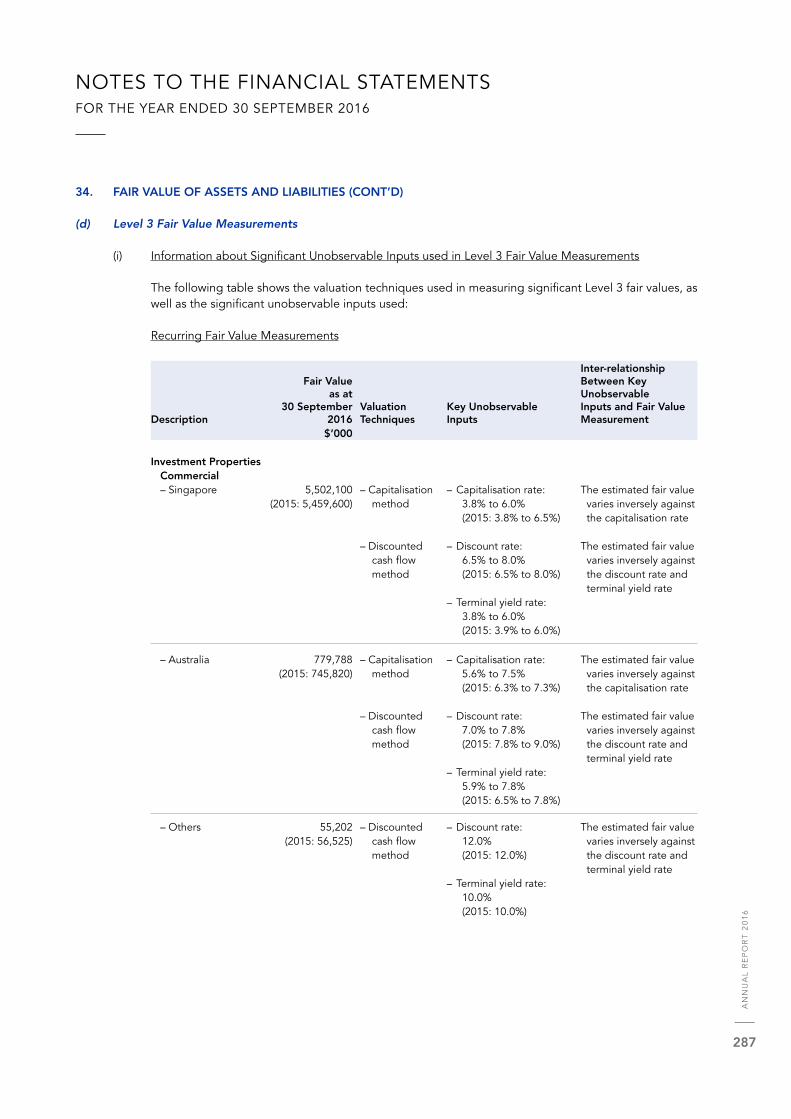
AN
NU
AL
RE
PO
RT
20
16
287
NOTES TO THE FINANCIAL STATEMENTSFOR THE YEAR ENDED 30 SEPTEMBER 2016
34. FAIR VALUE OF ASSETS AND LIABILITIES (CONT’D)
(d) Level 3 Fair Value Measurements
(i) Information about Significant Unobservable Inputs used in Level 3 Fair Value Measurements
The following table shows the valuation techniques used in measuring significant Level 3 fair values, as well as the significant unobservable inputs used:
Recurring Fair Value Measurements
Description
Fair Valueas at
30 September 2016
ValuationTechniques
Key UnobservableInputs
Inter-relationshipBetween Key UnobservableInputs and Fair ValueMeasurement
$’000
Investment PropertiesCommercial– Singapore 5,502,100 – Capitalisation – Capitalisation rate: The estimated fair value
(2015: 5,459,600) method 3.8% to 6.0% varies inversely against (2015: 3.8% to 6.5%) the capitalisation rate
– Discounted – Discount rate: The estimated fair value cash flow 6.5% to 8.0% varies inversely against method (2015: 6.5% to 8.0%) the discount rate and
terminal yield rate– Terminal yield rate:
3.8% to 6.0% (2015: 3.9% to 6.0%)
– Australia 779,788 – Capitalisation – Capitalisation rate: The estimated fair value
(2015: 745,820) method 5.6% to 7.5% varies inversely against (2015: 6.3% to 7.3%) the capitalisation rate
– Discounted – Discount rate: The estimated fair value cash flow 7.0% to 7.8% varies inversely against method (2015: 7.8% to 9.0%) the discount rate and
terminal yield rate– Terminal yield rate:
5.9% to 7.8% (2015: 6.5% to 7.8%)
– Others 55,202 – Discounted – Discount rate: The estimated fair value
(2015: 56,525) cash flow 12.0% varies inversely against method (2015: 12.0%) the discount rate and
terminal yield rate– Terminal yield rate:
10.0% (2015: 10.0%)

FR
AS
ER
S C
EN
TR
EP
OIN
T L
IMIT
ED
& S
UB
SID
IAR
IES
288
NOTES TO THE FINANCIAL STATEMENTSFOR THE YEAR ENDED 30 SEPTEMBER 2016
34. FAIR VALUE OF ASSETS AND LIABILITIES (CONT’D)
(d) Level 3 Fair Value Measurements (cont’d)
(i) Information about Significant Unobservable Inputs used in Level 3 Fair Value Measurements (cont’d)
Recurring Fair Value Measurements (cont’d)
Description
Fair Valueas at
30 September 2016
ValuationTechniques
Key UnobservableInputs
Inter-relationshipBetween Key UnobservableInputs and Fair ValueMeasurement
$’000
Investment Properties under Construction
Commercial– Singapore 2,255,000 – Capitalisation – Capitalisation rate: The estimated fair value
(2015: 2,076,642) method 3.8% to 4.9% varies inversely against (2015: 3.8% to 4.9%) the capitalisation rate
– Residual land – Total gross The estimated fair value value method development values: would increase with
$3,074,700,000 higher gross (2015: $4,076,700,000) development
value and decrease– Total estimated with higher cost to
construction cost to completion completion: $461,981,000 (2015: $636,682,000)
Investment Properties
Hospitality– Singapore 759,400 – Capitalisation – Capitalisation rate: The estimated fair value
(2015: 763,400) method 3.8% to 5.4% varies inversely against (2015: 3.8% to 6.0%) the capitalisation rate
– Discounted – Discount rate: The estimated fair value cash flow 6.0% to 7.5% varies inversely against method (2015: 6.0% to 8.0%) the discount rate and
terminal yield rate– Terminal yield rate:
3.8% to 5.6% (2015: 3.8% to 6.0%)
– Australia 179,240 – Capitalisation – Capitalisation rate: The estimated fair value
(2015: 175,696) method 7.0% varies inversely against (2015: 7.0%) the capitalisation rate
– Discounted – Discount rate: The estimated fair value cash flow 8.8% varies inversely against method (2015: 9.0%) the discount rate and
terminal yield rate– Terminal yield rate:
7.0% (2015: 7.0%)
– Market – Transacted price The estimated fair value comparison of comparable varies with different method properties(1): adjustment factors
$651 psf to $1,422 psf used (2015: $526 psf to $1,253 psf)

AN
NU
AL
RE
PO
RT
20
16
289
NOTES TO THE FINANCIAL STATEMENTSFOR THE YEAR ENDED 30 SEPTEMBER 2016
34. FAIR VALUE OF ASSETS AND LIABILITIES (CONT’D)
(d) Level 3 Fair Value Measurements (cont’d)
(i) Information about Significant Unobservable Inputs used in Level 3 Fair Value Measurements (cont’d)
Recurring Fair Value Measurements (cont’d)
Description
Fair Valueas at
30 September 2016
ValuationTechniques
Key UnobservableInputs
Inter-relationshipBetween Key UnobservableInputs and Fair ValueMeasurement
$’000
Investment Properties (cont’d)Hospitality (cont’d)– Europe 608,666 – Capitalisation – Capitalisation rate: The estimated fair value
(2015: 610,133) method 5.5% to 9.1% varies inversely against (2015: 5.3% to 7.5%) the capitalisation rate
– Discounted – Discount rate: The estimated fair value cash flow 7.3% to 11.1% varies inversely against method (2015: 8.3% to 10.0%) the discount rate and
terminal yield rate– Terminal yield rate:
5.5% to 9.1% (2015: 5.8% to 8.3%)
– Market – Transacted price The estimated fair value comparison of comparable varies with different method properties(1): adjustment factors
$1,742 psf to $3,715 psf used (2015: $2,011 psf to $4,457 psf)
– China 245,232 – Capitalisation – Capitalisation rate: The estimated fair value
(2015: 263,242) method 2.4% varies inversely against (2015: 2.4%) the capitalisation rate
– Discounted – Discount rate: The estimated fair value cash flow 5.4% varies inversely against method (2015: 5.4%) the discount rate and
terminal yield rate– Terminal yield rate:
2.4% (2015: 2.4%)
– Others 92,196 – Discounted – Discount rate: The estimated fair value
(2015: 95,013) cash flow 7.5% varies inversely against method (2015: 8.5%) the capitalisation rate
– Capitalisation rate: The estimated fair value 9.2% varies inversely against (2015: 8.0%) the discount rate and
terminal yield rate– Terminal yield rate:
9.2% (2015: 8.0%)
– Market – Transacted price The estimated fair value comparison of comparable varies with different method properties(1): adjustment factors
used $219 psf to $238 psf (2015: $237 psf to $273 psf)

FR
AS
ER
S C
EN
TR
EP
OIN
T L
IMIT
ED
& S
UB
SID
IAR
IES
290
NOTES TO THE FINANCIAL STATEMENTSFOR THE YEAR ENDED 30 SEPTEMBER 2016
34. FAIR VALUE OF ASSETS AND LIABILITIES (CONT’D)
(d) Level 3 Fair Value Measurements (cont’d)
(i) Information about Significant Unobservable Inputs used in Level 3 Fair Value Measurements (cont’d)
Recurring Fair Value Measurements (cont’d)
Description
Fair Valueas at
30 September 2016
ValuationTechniques
Key UnobservableInputs
Inter-relationshipBetween Key UnobservableInputs and Fair ValueMeasurement
$’000
Investment Propertiesunder ConstructionHospitality– Singapore 173,144 – Capitalisation – Capitalisation rate: The estimated fair value
(2015: 155,000) approach 5.0% varies inversely against (2015: 5.0%) the capitalisation rate
– Europe 49,281 – Capitalisation – Capitalisation rate: The estimated fair value
(2015: 41,799) approach 5.8% varies inversely against (2015: 6.0%) the capitalisation rate
– Discounted – Discount rate: The estimated fair value cash flow 7.8% varies inversely against approach (2015: 8.0%) the discount rate
Investment Properties
Frasers Property 1,016,624 – Capitalisation – Capitalisation rate: The estimated fair value Australia (2015: 2,494,441) approach 6.3% to 8.0% varies inversely against
(2015: 6.5% to 11.0%) the capitalisation rate
– Discounted – Discount rate: The estimated fair value cash flow 7.5% to 9.0% varies inversely against approach (2015: 8.3% to 11.0%) the discount rate and
terminal yield rate– Terminal yield rate:
6.5% to 8.5% (2015: 6.5% to 10.0%)
Investment Properties
under ConstructionFrasers Property 30,370 – Capitalisation – Capitalisation rate: The estimated fair value Australia (2015: 13,881) approach 6.3% to 7.0% varies inversely against
(2015: 6.5% to 11.0%) the capitalisation rate
– Discounted – Discount rate: The estimated fair value cash flow 7.3% varies inversely against approach (2015: 8.3% to 11.0%) the discount rate and
terminal yield rate– Terminal yield rate:
6.8% to 7.3% (2015: 7.3%)
Investment Properties
FLT 1,747,776 – Capitalisation – Capitalisation rate: The estimated fair value– Australia (2015: Nil) approach 6.0% to 11.8% varies inversely against
(2015: Nil) the capitalisation rate
– Discounted – Discount rate: The estimated fair value cash flow 7.3% to 9.5% varies inversely against approach (2015: Nil) the discount rate and
terminal yield rate– Terminal yield rate:
6.3% to 22.8% (2015: Nil)
(1) Adjustments are made for any difference in the location, tenure, size and condition of the specific property.

AN
NU
AL
RE
PO
RT
20
16
291
NOTES TO THE FINANCIAL STATEMENTSFOR THE YEAR ENDED 30 SEPTEMBER 2016
34. FAIR VALUE OF ASSETS AND LIABILITIES (CONT’D)
(d) Level 3 Fair Value Measurements (cont’d)
(i) Information about Significant Unobservable Inputs used in Level 3 Fair Value Measurements (cont’d)
Key unobservable inputs correspond to:
• Capitalisation rate corresponds to a rate of return on a property based on the income that the property is expected to generate.
• Discount rate represents the required rate of return, adjusted for a risk premium that reflects the risks relevant to an asset.
• Terminal yield rate reflects an exit capitalisation rate applied to a projected terminal cash flow.
(ii) Movements in Level 3 Assets Measured at Fair Value
The movements of financial and non-financial assets and measured at fair value classified under Level 3, have been disclosed in Note 11.
(iii) Valuation Policies and Procedures
The significant non-financial asset of the Group categorised within Level 3 of the fair value hierarchy is investment properties. Generally, the fair values of investment properties are determined at least once every two years by independent professional valuers. Investment properties that are not independently valued are carried at fair value determined by directors’ valuation.
Frasers Property Australia’s investment properties division includes a valuation team (the “FPA Valuation Team”) where each member of this team is professionally qualified and is an accredited property valuer. The FPA Valuation Team performs the underlying valuations that support the directors’ valuation.
The independent professional valuers and FPA Valuation Team (the “Valuers”) are experts who possess the relevant credentials and knowledge on the subject of property valuation, valuation methodologies and FRS 113 fair value measurement guidance to perform the valuation. For valuations performed by the Valuers, the appropriateness of the valuation methodologies and assumptions adopted are reviewed along with the appropriateness and reliability of the inputs (including those developed internally by the Group) used in the valuations.

FR
AS
ER
S C
EN
TR
EP
OIN
T L
IMIT
ED
& S
UB
SID
IAR
IES
292
NOTES TO THE FINANCIAL STATEMENTSFOR THE YEAR ENDED 30 SEPTEMBER 2016
34. FAIR VALUE OF ASSETS AND LIABILITIES (CONT’D)
(d) Level 3 Fair Value Measurements (cont’d)
(iii) Valuation Policies and Procedures (cont’d)
In selecting the appropriate valuation models and inputs to be adopted for each valuation that uses significant non-observable inputs, the Valuers are required to recalibrate the valuation models and inputs to actual market transactions (which may include transactions entered into by the Group with third parties as appropriate) that are relevant to the valuation if such information are reasonably available. For valuations that are sensitive to the unobservable inputs used, the Valuers are required, to the extent practicable to use a minimum of two valuation approaches to allow for cross-checks.
Significant changes in fair value measurements from period to period are evaluated for reasonableness. Key drivers of the changes are identified and assessed for reasonableness against relevant information from independent sources, or internal sources if necessary and appropriate.
In accordance with the Group’s reporting policies, the valuation process and the results of the independent valuations and directors’ valuation are reviewed at least once a year by the Executive Committee of the Board and the Audit Committee before the results are presented to the Board of Directors for approval.
(e) Fair Value of Financial Instruments by Classes that are not Carried at Fair Value and whose Carrying Amounts are not Reasonable Approximation of Fair Value
(i) Other Receivables (Non-Current) and Other Payables (Non-Current)
No disclosure of fair value is made for non-current other receivables and other payables as it is not practicable to determine their fair values with sufficient reliability since the balances have no fixed terms of repayment. The Group and the Company do not anticipate that the carrying amounts recorded at the end of the financial year would be significantly different from the values that would eventually be received or settled.
(ii) Available-for-Sale Financial Assets – Unquoted Equity Investments, at Cost
Unquoted equity investments represent ordinary shares that are not quoted on any market and do not have any comparable industry peer that is listed. Fair value information has not been disclosed for these investments carried at cost less impairment because fair value cannot be measured reliably. The Group does not intend to dispose of these investments in the foreseeable future.
(iii) Rental Deposits Payables (Non-Current)
No disclosure of fair value is made for rental deposits payables as the Group does not anticipate that the carrying amounts recorded at the end of the financial year would be significantly different from the values that would eventually be received or settled.

AN
NU
AL
RE
PO
RT
20
16
293
NOTES TO THE FINANCIAL STATEMENTSFOR THE YEAR ENDED 30 SEPTEMBER 2016
35. CLASSIFICATION OF FINANCIAL INSTRUMENTS
Set out below is a comparison by category of carrying amounts of all the Group’s and the Company’s financial instruments that are carried in the financial statements.
Loans andReceivables
Derivativesused forHedging
Fair ValuethroughProfit or
LossAvailable-
for-Sale
Liabilities atAmortised
Cost$’000 $’000 $’000 $’000 $’000
Group2016
AssetsFinancial assets – – – 2,162 –Trade and other receivables# 895,432 – – – –Derivative financial instruments – 319 11,178 – –Bank deposits and cash and cash equivalents 2,168,680 – – – –
3,064,112 319 11,178 2,162 –
LiabilitiesTrade and other payables* – – – – 1,496,456Derivative financial instruments – 106,940 29,978 – –Loans and borrowings – – – – 9,795,537
– 106,940 29,978 – 11,291,993
2015
AssetsFinancial assets – – – 2,165 –Trade and other receivables# 1,071,423 – – – –Derivative financial instruments – 56,757 19,345 – –Bank deposits and cash and cash equivalents 1,373,140 – – – –
2,444,563 56,757 19,345 2,165 –
LiabilitiesTrade and other payables* – – – – 1,289,637Derivative financial instruments – 19,574 41,620 – –Loans and borrowings – – – – 10,275,457
– 19,574 41,620 – 11,565,094
# Exclude tax recoverable. * Exclude progress billings received in advance.

FR
AS
ER
S C
EN
TR
EP
OIN
T L
IMIT
ED
& S
UB
SID
IAR
IES
294
NOTES TO THE FINANCIAL STATEMENTSFOR THE YEAR ENDED 30 SEPTEMBER 2016
35. CLASSIFICATION OF FINANCIAL INSTRUMENTS (CONT’D)
Loans andReceivables
Derivativesused forHedging
Fair ValuethroughProfit or
LossAvailable-
for-Sale
Liabilities atAmortised
Cost$’000 $’000 $’000 $’000 $’000
Company2016
AssetsFinancial assets – – – 2,148 –Trade and other receivables 3,342,874 – – – –Cash and cash equivalents 67,516 – – – –Derivative financial instruments – 225 – – –
3,410,390 225 – 2,148 –
LiabilitiesTrade and other payables – – – – 197,305Derivative financial instruments – 32,557 190 – –
– 32,557 190 – 197,305
2015
AssetsFinancial assets – – – 2,148 –Trade and other receivables 3,015,187 – – – –Cash and cash equivalents 9,064 – – – –Derivative financial instruments – 19,463 5,352 – –
3,024,251 19,463 5,352 2,148 –
LiabilitiesTrade and other payables – – – – 236,942Derivative financial instruments – 20,018 7,605 – –
– 20,018 7,605 – 236,942

AN
NU
AL
RE
PO
RT
20
16
295
NOTES TO THE FINANCIAL STATEMENTSFOR THE YEAR ENDED 30 SEPTEMBER 2016
36. CAPITAL MANAGEMENT
The primary objective of the Group’s capital management is to ensure that it maintains healthy capital ratios in order to support its business and maximise shareholder value.
The Group manages its capital structure and makes adjustments to it, in light of changes in economic conditions. To maintain or adjust the capital structure, the Group may adjust the dividend payment to shareholders, return capital to shareholders or issue new shares.
No changes were made in the objectives, policies or processes during the years ended 30 September 2016 and 30 September 2015.
The Group monitors capital using a gearing ratio, which is net debt divided by total equity, as follows:
Group2016 2015
$’000 $’000
Bank deposits 437,337 –Cash and cash equivalents 1,731,343 1,373,140Loans and borrowings (9,795,537) (10,275,457)Net borrowings (7,626,857) (8,902,317)Total equity 11,843,484 10,650,953Net borrowings over total equity ratio 0.64 0.84
Certain entities in the Group are required to comply with certain externally imposed capital requirements in respect of some of their external borrowings, and these have been complied with during the year.
37. COMMITMENTS
(a) Capital Commitments
Capital and development expenditures contracted for as at the end of the reporting period but not recognised in the financial statements are as follows:
Group2016 2015
$’000 $’000
Commitments in respect of contracts placed for: – estimated development costs for properties held for sale 829,155 1,530,907 – capital expenditure costs for investment properties 513,963 559,019 – share of joint ventures’ and associates’ capital and development expenditure 98,010 261,717 – others 148,386 242,787
1,589,514 2,594,430

FR
AS
ER
S C
EN
TR
EP
OIN
T L
IMIT
ED
& S
UB
SID
IAR
IES
296
NOTES TO THE FINANCIAL STATEMENTSFOR THE YEAR ENDED 30 SEPTEMBER 2016
37. COMMITMENTS (CONT’D)
(b) Operating Lease Commitments – as Lessee
Future minimum rental payable under non-cancellable operating leases at the end of the reporting period is as follows:
Group Company2016 2015 2016 2015
$’000 $’000 $’000 $’000
Within 1 year 37,124 27,976 – –From 1 year to 5 years 133,156 92,010 – –After 5 years 637,852 626,463 – –
808,132 746,449 – –
The operating leases do not contain any escalation clauses and do not provide for contingent rents. The lease terms do not contain restrictions on the Group activities concerning dividends, additional debts or entering into other leasing agreements.
Rental expense recognised in the profit statement is as follows:
Group2016 2015
$’000 $’000
Minimum lease payments 39,871 15,606
(c) Operating Lease Commitments – as Lessor
The Group has entered into commercial property leases on its investment properties and properties held for sale. These non-cancellable leases have remaining non-cancellable lease terms of between 2 to 8 years. Future minimum rental receivable under non-cancellable operating leases at the end of the reporting period is as follows:
Group Company2016 2015 2016 2015
$’000 $’000 $’000 $’000
Within 1 year 498,276 519,080 – –From 1 year to 5 years 1,052,686 1,086,566 – –After 5 years 601,638 448,197 – –
2,152,600 2,053,843 – –
Rental income from investment properties is disclosed in Note 11.

AN
NU
AL
RE
PO
RT
20
16
297
NOTES TO THE FINANCIAL STATEMENTSFOR THE YEAR ENDED 30 SEPTEMBER 2016
38. CONTINGENCIES
Guarantee Contracts
(i) As at 30 September 2016, the Company has provided bankers’ guarantees of $4,183,000 (2015: $45,840,000) to unrelated parties in respect of performance contracts on behalf of certain subsidiaries. No liability is expected to arise.
(ii) As at 30 September 2016, the Company has provided unconditional and irrevocable corporate guarantees for up to $6,948,493,000 (2015: $7,206,022,000) for loans and borrowings and perpetual securities issued by certain subsidiaries.
(iii) The Company has provided an unconditional and irrevocable corporate guarantee for up to $26,179,000 to finance the payment of development charge and construction cost of the New Wing of The Centrepoint by The Management Corporation Strata Title Plan No. 1298 (“MCST 1298”). The corporate guarantee will only be discharged upon full repayment of the loan by MCST 1298. As at 30 September 2016, the outstanding loan by MCST 1298 is $25,179,000 (2015: $25,679,000).
(iv) A wholly-owned subsidiary of the Group has provided RMB 202,977,000 (2015: RMB 297,800,000) corporate guarantees to banks in China in connection with loans provided by the banks to the subsidiary’s property buyers, covering the period from loan contract date to the property delivery date.
39. SUBSEQUENT EVENTS
(i) On 10 October 2016, the Group, through FPHT, entered into a conditional share subscription agreement with TICON Industrial Connection Public Company Limited (“TICON”) for the subscription of up to 735,000,000 newly issued ordinary shares in TICON, each of Baht 1.00 par value (the “New Shares”), at the subscription price of Baht 18.00 per New Share (the “Transaction”). The total consideration payable for all 735,000,000 New Shares is Baht 13.23 billion (approximately S$520 million). Following the Transaction, the Group will hold up to approximately 40% of TICON’s enlarged total issued shares.
(ii) On 14 October 2016, the Group, through its subsidiary, FHT, issued 441,549,281 new Rights Stapled Securities at an issue price of $0.603 on the basis of 32 Rights Stapled Securities for every 100 existing stapled securities in FHT. The Group, through its wholly-owned subsidiaries, FCLI, FHAM and FHPL, fully subscribed for their respective allotted Rights Stapled Securities of 95,432,377 in aggregate (the “Rights Subscription”). Following the Rights Subscription, the Group holds approximately 21.6% in FHT.
(iii) On 4 November 2016, FCT entered into sale and purchase agreements for the acquisition of strata lots comprised in the retail podium of Yishun 10 Cinema Complex for a total consideration of $37.75 million (the “Acquisition”). The Acquisition was completed on 16 November 2016.
(iv) As announced on 21 November 2016, the Group, through FPHT, purchased in the open-market on the Stock Exchange of Thailand, an additional 99,941,933 shares in Gold. The total aggregate consideration is Baht 614.6 million (approximately S$24.7 million). Pursuant to this acquisition, FPHT’s interest in Gold increased from approximately 35.6% to approximately 39.9%.

FR
AS
ER
S C
EN
TR
EP
OIN
T L
IMIT
ED
& S
UB
SID
IAR
IES
298
NOTES TO THE FINANCIAL STATEMENTSFOR THE YEAR ENDED 30 SEPTEMBER 2016
40. SIGNIFICANT SUBSIDIARIES, JOINT ARRANGEMENTS AND ASSOCIATES
EffectivePrincipal Activities Shareholding
2016 2015
Subsidiaries of the Company
Country of Incorporation and Place of Business: Singapore
(a) FCL (China) Pte. Ltd. Investment holding 100% 100%
(a) FCL (Fraser) Pte. Ltd. Investment holding 100% 100%
(a) FCL Amber Pte. Ltd. Investment holding 100% 100%
(a) FCL Aquamarine Pte. Ltd. Investment holding 100% 100%
(a) FCL Assets Pte. Ltd. Investment holding 100% 100%
(a) FCL Centrepoint Pte. Ltd. Investment holding 100% 100%
(a) FCL China Development Pte. Ltd. Investment holding 100% 100%
(a) FCL Emerald (1) Pte. Ltd. Investment holding 100% 100%
(a) FCL Emerald (2) Pte. Ltd. Investment holding 100% 100%
(a) FCL Investments Pte. Ltd. Investment holding 100% 100%
(a) FCL Tampines Court Pte. Ltd. Investment holding 100% 100%
(a) FCL Topaz Pte. Ltd. Investment holding 100% 100%
(a) FCL Trust Holdings (Commercial) Pte. Ltd. Investment holding 100% 100%
(a) FCL Trust Holdings Pte. Ltd. Investment holding 100% 100%
(a) Fraser Suites Jakarta Pte. Ltd. Investment holding 100% 100%
(a) Frasers (Australia) Pte. Ltd. Investment holding 100% 75%
(a) Frasers (NZ) Pte. Ltd. Investment holding 75% 75%
(a) Frasers (Thailand) Pte. Ltd. Investment holding 100% 100%
(a) Frasers (UK) Pte. Ltd. Investment holding 75% 75%
(a) Frasers Amethyst Pte. Ltd. Investment holding 100% 100%
(a) Frasers Centrepoint Asset Management Investment holding 100% 100%(Malaysia) Pte. Ltd.
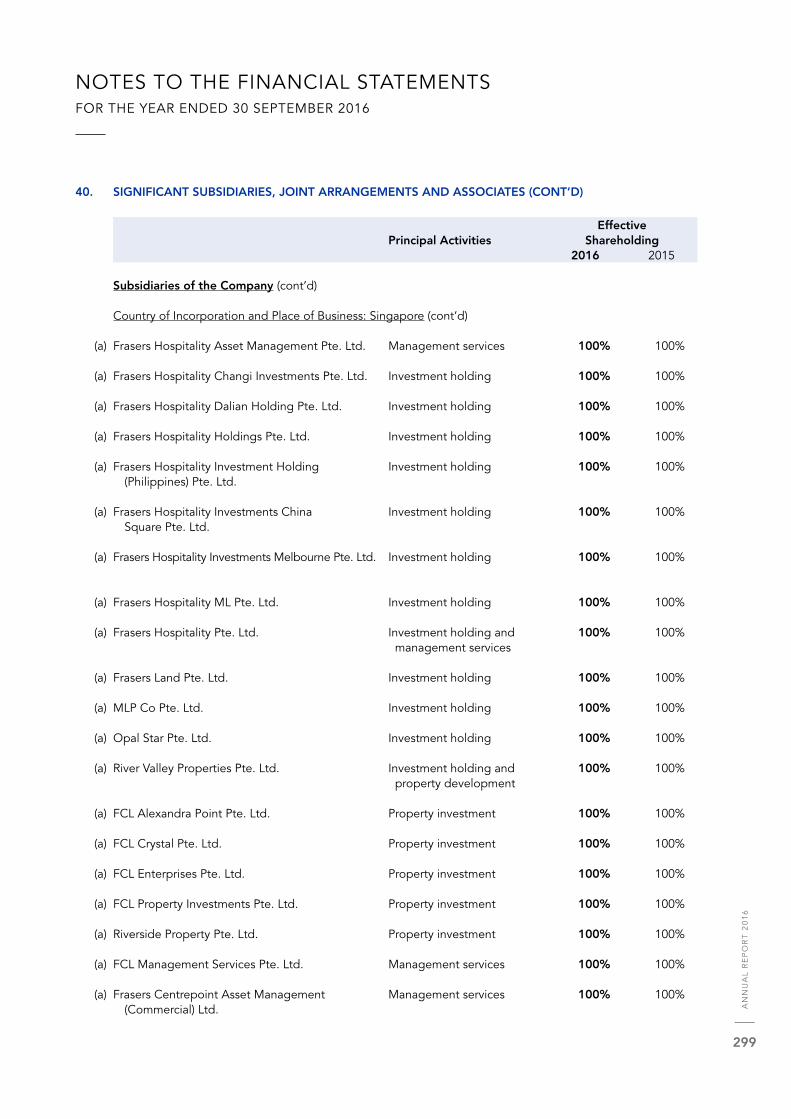
AN
NU
AL
RE
PO
RT
20
16
299
NOTES TO THE FINANCIAL STATEMENTSFOR THE YEAR ENDED 30 SEPTEMBER 2016
40. SIGNIFICANT SUBSIDIARIES, JOINT ARRANGEMENTS AND ASSOCIATES (CONT’D)
EffectivePrincipal Activities Shareholding
2016 2015
Subsidiaries of the Company (cont’d)
Country of Incorporation and Place of Business: Singapore (cont’d)
(a) Frasers Hospitality Asset Management Pte. Ltd. Management services 100% 100%
(a) Frasers Hospitality Changi Investments Pte. Ltd. Investment holding 100% 100%
(a) Frasers Hospitality Dalian Holding Pte. Ltd. Investment holding 100% 100%
(a) Frasers Hospitality Holdings Pte. Ltd. Investment holding 100% 100%
(a) Frasers Hospitality Investment Holding Investment holding 100% 100%(Philippines) Pte. Ltd.
(a) Frasers Hospitality Investments China Investment holding 100% 100%Square Pte. Ltd.
(a) Frasers Hospitality Investments Melbourne Pte. Ltd. Investment holding 100% 100%
(a) Frasers Hospitality ML Pte. Ltd. Investment holding 100% 100%
(a) Frasers Hospitality Pte. Ltd. Investment holding and 100% 100% management services
(a) Frasers Land Pte. Ltd. Investment holding 100% 100%
(a) MLP Co Pte. Ltd. Investment holding 100% 100%
(a) Opal Star Pte. Ltd. Investment holding 100% 100%
(a) River Valley Properties Pte. Ltd. Investment holding and 100% 100% property development
(a) FCL Alexandra Point Pte. Ltd. Property investment 100% 100%
(a) FCL Crystal Pte. Ltd. Property investment 100% 100%
(a) FCL Enterprises Pte. Ltd. Property investment 100% 100%
(a) FCL Property Investments Pte. Ltd. Property investment 100% 100%
(a) Riverside Property Pte. Ltd. Property investment 100% 100%
(a) FCL Management Services Pte. Ltd. Management services 100% 100%
(a) Frasers Centrepoint Asset Management Management services 100% 100%(Commercial) Ltd.

FR
AS
ER
S C
EN
TR
EP
OIN
T L
IMIT
ED
& S
UB
SID
IAR
IES
300
NOTES TO THE FINANCIAL STATEMENTSFOR THE YEAR ENDED 30 SEPTEMBER 2016
40. SIGNIFICANT SUBSIDIARIES, JOINT ARRANGEMENTS AND ASSOCIATES (CONT’D)
EffectivePrincipal Activities Shareholding
2016 2015
Subsidiaries of the Company (cont’d)
Country of Incorporation and Place of Business: Singapore (cont’d)
(a) Frasers Centrepoint Asset Management Ltd. Management services 100% 100%
(a) Frasers Centrepoint Property Management Management services 100% 100%Services Pte. Ltd.
(a) Frasers Hospitality Group Pte. Ltd. Management services 100% 100%
(a) Frasers Hospitality Trust Management Pte. Ltd. Trustee-manager 100% 100%
(a) Frasers Logistics & Industrial Asset Management Management services 100% 100%Pte. Ltd. (formerly FCL Gold Pte. Ltd.)
(a) FCL Investments (Industrial) Pte. Ltd. Investment holding 100% 100%(formerly East Harmony Pte. Ltd.)
(a) FCL Treasury Pte. Ltd. Treasury services 100% 100%
Country of Incorporation and Place of Business: Hong Kong
(a) Excellent Esteem Limited Investment holding 100% 100%
Subsidiaries of the Group
Country of Incorporation and Place of Business: Singapore
(a) Frasers Property (Europe) Holdings Pte. Ltd. Investment holding 80% 80%
(a) Singapore Logistics Investments Pte. Ltd. Investment holding 80% 80%
(a) River Valley Apartments Pte. Ltd. Property investment 100% 100%
(a) River Valley Tower Pte. Ltd. Property investment 100% 100%
(a) Aquamarine Star Trust Property investment and 100% 100% development
(a) North Gem Trust Property investment and 100% 100% development
(a) FCL Admiralty Pte. Ltd. Property development 70% 70%
(a) North Gem Development Pte. Ltd. Property development 100% 100%
(a) Sembawang Residences Pte. Ltd. Property development 80% 80%
(a) FCOT Treasury Pte. Ltd. Treasury services 27.15% 27.21%
(a) FH-REIT Treasury Pte. Ltd. Treasury services 21.61% 20.32%
(a) Frasers Hospitality Changi Trust Property investment 100% 100%
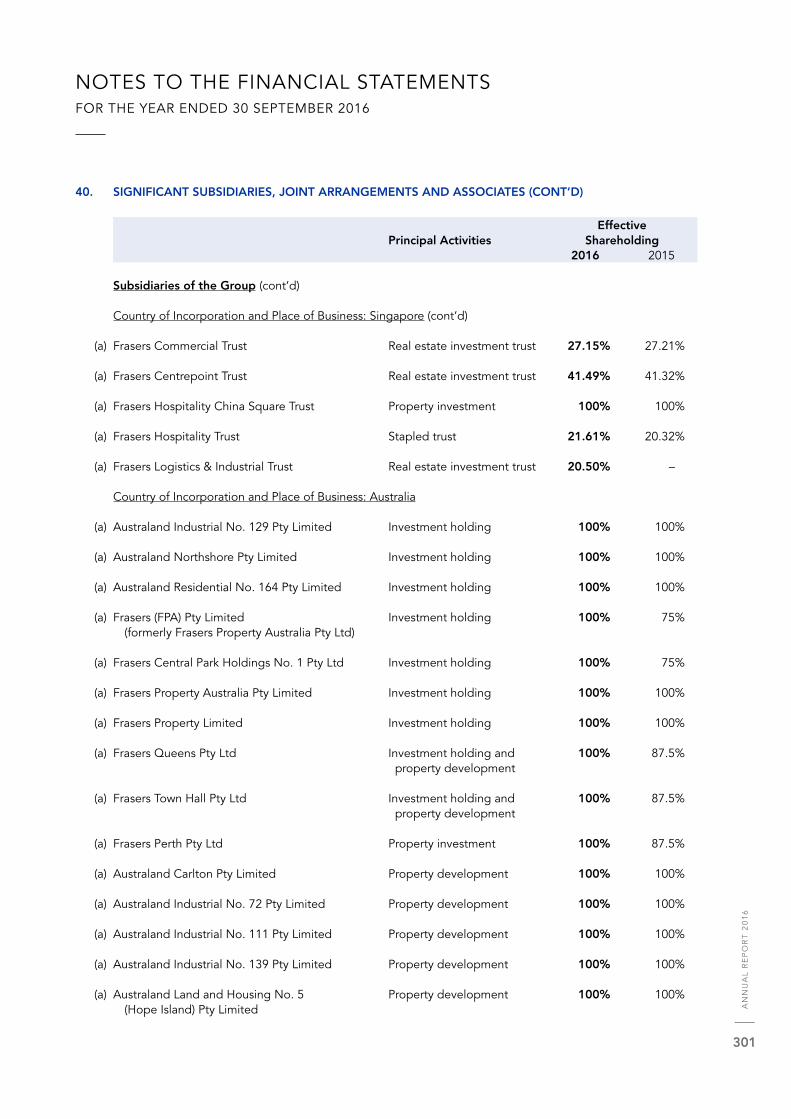
AN
NU
AL
RE
PO
RT
20
16
301
NOTES TO THE FINANCIAL STATEMENTSFOR THE YEAR ENDED 30 SEPTEMBER 2016
40. SIGNIFICANT SUBSIDIARIES, JOINT ARRANGEMENTS AND ASSOCIATES (CONT’D)
EffectivePrincipal Activities Shareholding
2016 2015
Subsidiaries of the Group (cont’d)
Country of Incorporation and Place of Business: Singapore (cont’d)
(a) Frasers Commercial Trust Real estate investment trust 27.15% 27.21%
(a) Frasers Centrepoint Trust Real estate investment trust 41.49% 41.32%
(a) Frasers Hospitality China Square Trust Property investment 100% 100%
(a) Frasers Hospitality Trust Stapled trust 21.61% 20.32%
(a) Frasers Logistics & Industrial Trust Real estate investment trust 20.50% –
Country of Incorporation and Place of Business: Australia
(a) Australand Industrial No. 129 Pty Limited Investment holding 100% 100%
(a) Australand Northshore Pty Limited Investment holding 100% 100%
(a) Australand Residential No. 164 Pty Limited Investment holding 100% 100%
(a) Frasers (FPA) Pty Limited Investment holding 100% 75%(formerly Frasers Property Australia Pty Ltd)
(a) Frasers Central Park Holdings No. 1 Pty Ltd Investment holding 100% 75%
(a) Frasers Property Australia Pty Limited Investment holding 100% 100%
(a) Frasers Property Limited Investment holding 100% 100%
(a) Frasers Queens Pty Ltd Investment holding and 100% 87.5% property development
(a) Frasers Town Hall Pty Ltd Investment holding and 100% 87.5% property development
(a) Frasers Perth Pty Ltd Property investment 100% 87.5%
(a) Australand Carlton Pty Limited Property development 100% 100%
(a) Australand Industrial No. 72 Pty Limited Property development 100% 100%
(a) Australand Industrial No. 111 Pty Limited Property development 100% 100%
(a) Australand Industrial No. 139 Pty Limited Property development 100% 100%
(a) Australand Land and Housing No. 5 Property development 100% 100%(Hope Island) Pty Limited

FR
AS
ER
S C
EN
TR
EP
OIN
T L
IMIT
ED
& S
UB
SID
IAR
IES
302
NOTES TO THE FINANCIAL STATEMENTSFOR THE YEAR ENDED 30 SEPTEMBER 2016
40. SIGNIFICANT SUBSIDIARIES, JOINT ARRANGEMENTS AND ASSOCIATES (CONT’D)
EffectivePrincipal Activities Shareholding
2016 2015
Subsidiaries of the Group (cont’d)
Country of Incorporation and Place of Business: Australia (cont’d)
(a) Australand Residential No. 143 Pty Limited Property development 100% 100%
(a) Australand Residential No. 166 Pty Limited Property development 100% 100%
(a) Australand Valley Park Pty Limited Property development 100% 100%
(a) Bayslore Pty Limited Property development 100% 100%
(a) Frasers Broadway Pty Ltd Property development 100% 75%
(a) Frasers Central Park Equity No. 2 Pty Ltd Property development 100% 75%
(a) PDI (Qld) Pty Limited Property development 100% 100%
(a) Port Catherine Developments Pty Ltd Property development 100% 100%
(a) Australand Property Limited Management services 100% 100%
(a) Frasers Property (APG) Pty Limited Management services 100% 100%
(a) Frasers AHL Pty Ltd Investment holding and trustee-manager
100% 100%
(a) Ananke Holdings Pty Limited Hotel operator 100% 100%
Country of Incorporation and Place of Business: United Kingdom
(a) Frasers Hospitality SPC 1 Limited Investment holding 100% 100%
(a) Frasers Hospitality UK Holdings Limited Investment holding 100% 100%
(a) Frasers Property (UK) Limited Investment holding 80% 80%
(a) Malmaison and Hotel du Vin Property Investment holding 100% 100%Holdings Limited
(a) Malmaison and Hotel du Vin Holdings Limited Investment holding 100% 100%
(a) Malmaison Hotels Limited Investment holding 100% 100%
(a) Malmaison Resources Limited Investment holding 100% 100%
(c) Frasers Residential Investment Partnership LP Property investment 100% 100%
(a) Malmaison Trading Limited Property investment 100% 100%
(a) Frasers (Riverside Quarter) Ltd Property development 80% 80%

AN
NU
AL
RE
PO
RT
20
16
303
NOTES TO THE FINANCIAL STATEMENTSFOR THE YEAR ENDED 30 SEPTEMBER 2016
40. SIGNIFICANT SUBSIDIARIES, JOINT ARRANGEMENTS AND ASSOCIATES (CONT’D)
EffectivePrincipal Activities Shareholding
2016 2015
Subsidiaries of the Group (cont’d)
Country of Incorporation and Place of Business: United Kingdom (cont’d)
(a) Frasers Projects Ltd Property development 80% 80%
(a) Hotel du Vin Trading Limited Hotel Trading Company 100% 100%
Country of Incorporation and Place of Business: China
(1) (a) Beijing Fraser Suites Real Estate Property investment 100% 100%Management Co., Ltd.
(1) (a) Chengdu Sino Singapore Southwest Property investment 80% 80%Logistics Co., Ltd
(1) (a) Singlong Property Development Property development 100% 100%(Suzhou) Co., Ltd
Country of Incorporation and Place of Business: Hong Kong
(a) Ace Goal Limited Investment holding 100% 100%
(a) Superway Logistics Investments Investment holding 80% 80%(Hong Kong) Limited
Associates of the Group
Country of Incorporation and Place of Business: British Virgin Islands
(b) Supreme Asia Investments Limited Investment holding 43.3% 43.3%
Country of Incorporation and Place of Business: China
(1) (c) Shanghai Zhong Jun Property Real Property development 45.2% 45.2%Estate Development Co., Ltd
Country of Incorporation and Place of Business: Thailand
(1) (a) Golden Land Property Development Investment holding 35.6% –Public Company Limited
Joint Arrangements of the Group
The joint ventures and joint operations are individually immaterial to the group.
(a) Audited by KPMG in the respective countries.(b) Not required to be audited under laws of the country of incorporation.(c) Audited by other firms.Note (1) Accounting year end is 31 December.

FR
AS
ER
S C
EN
TR
EP
OIN
T L
IMIT
ED
& S
UB
SID
IAR
IES
304
PARTICULARS OF GROUP PROPERTIESAS AT 30 SEPTEMBER 2016
COMPLETED INVESTMENT PROPERTIES
Book Value$'000
Singapore
Alexandra Point A 24-storey office building at 438 Alexandra Road. 296,000Freehold, lettable area – 18,542 sqm
Robertson Walk & Fraser Place Robertson Walk
A 10-storey commercial-cum-serviced apartment complex with a 2-storey basement carpark, a 2-storey retail podium and 164 serviced apartment units at Robertson Walk Shopping Centre and Fraser Place Robertson Walk, 11 Unity Street.
336,000
Leasehold (lease expires year 2840)Lettable area :Retail – Robertson Walk 9,016 sqm
Serviced Apartments – Fraser Place 17,694 sqm 26,710 sqm
The Centrepoint A 7-storey shopping-cum-residential complex with 2 basement floors at The Centrepoint, 176 Orchard Road.
580,000
Freehold and leasehold (lease expires year 2078), lettable area – 28,587 sqm
Valley Point A 20-storey commercial-cum-serviced apartment complex with a 5-storey covered carpark, a 5-storey podium block, a 2-storey retail podium and 255 serviced apartment units at Valley Point Shopping Centre/Office Tower and Fraser Suites River Valley, River Valley Road.
322,000
Leasehold (lease expires year 2876)Lettable area :Retail – Valley Point 4,015 sqmOffice – River Valley Tower 17,014 sqm 21,029 sqm
51 Cuppage Road A 10-storey commercial building at 51 Cuppage Road. 400,000Leasehold (lease expires year 2095), lettable area – 25,417 sqm
Centrepoint Apartment An apartment unit. 1,600Lettable area – 81 sqm
Capri by Fraser, Changi City 313 units of hotel residences at Changi Business Park Central 1. 203,400Leasehold (lease expires year 2069), lettable area -10,583 sqm
Australia
Fraser Place Melbourne 112 serviced apartment units in 2 blocks of high rise buildings at 19 Exploration Lane, Melbourne, Victoria 3000.
30,679
Freehold, lettable area – 3,801 sqm
Frasers Property Australia Group's Completed Investment Properties
A car park comprising 267 public car parking spaces at Freshwater Place, Public Car Park, Southbank, Victoria.
16,148
Lettable area – 11,822 sqm
A property comprising a warehouse and a single storey office at 64 West Park Drive, West Park, Derrimut, Victoria.
16,460
Lettable area – 20,337 sqm

AN
NU
AL
RE
PO
RT
20
16
305
PARTICULARS OF GROUP PROPERTIESAS AT 30 SEPTEMBER 2016
COMPLETED INVESTMENT PROPERTIES (CONT’D)
Book Value$'000
Australia (cont’d)
Frasers Property Australia Group’s Completed Investment Properties (cont’d)
A property comprising an industrial facility with a warehouse and an attached single-level office building at 89-103 South Park Drive, Dandenong South, Victoria.
9,272
Lettable area – 10,425 sqm
A property comprising a warehouse and distribution facility at 44 Cambridge Street, Rocklea, Queensland.
15,966
Lettable area – 10,891 sqm
A property comprising a warehouse facility and a single-level office at 1 West Park Drive, Derrimut, Victoria.
8,022
Lettable area – 10,078 sqm
A property comprising the common facilities including a café, childcare centre, car wash, gym, pool and common parking areas at Homebush Bay Drive, Rhodes Corporate Park, Rhodes, New South Wales.
10,418
Lettable area – 1,343 sqm
A property comprising a warehouse at Lot 1, 2 Burilda Close, Wetherill Park, New South Wales.
23,441
Lettable area – 14,333 sqm
A property comprising 2 warehouses at 57 Efficient Drive, Truganinga, Victoria.
22,399
Lettable area- 22,840 sqm
A property comprising office accommodation at 1F Homebush Bay Drive, Rhodes Corporate Park, Rhodes, New South Wales.
111,473
Lettable area – 17,644 sqm
A 8-storey office building at 20 Lee Street, Henry Deane Building, Railway Square, Sydney, New South Wales.
68,759
Lettable area – 9,112 sqm
A property comprising a warehouse and an attached 2-storey office at 23 Scanlon Drive, Epping, Victoria.
13,335
Lettable area – 12,361 sqm
A property comprising a warehouse and a 2-storey office component at 227 Walters Road, Arndell Park, New South Wales.
28,129
Lettable area – 17,733 sqm
A property comprising a 2-level office and warehouse at 8 Stanton Road, Seven Hills, New South Wales.
15,835
Lettable area – 10,708 sqm
A 8-storey building with a terrace area on level 7 at 26-30 Lee Street, Gateway Building, Sydney, New South Wales.
97,929
Lettable area – 12,601 sqm

FR
AS
ER
S C
EN
TR
EP
OIN
T L
IMIT
ED
& S
UB
SID
IAR
IES
306
PARTICULARS OF GROUP PROPERTIESAS AT 30 SEPTEMBER 2016
COMPLETED INVESTMENT PROPERTIES (CONT’D)
Book Value$'000
Australia (cont’d)
Frasers Property Australia Group’s Completed Investment Properties (cont’d)
A property comprising an industrial facility with full vehicular access and a single-level office at 10 Reconciliation Rise, Dremulwuy, New South Wales.
35,004
Lettable area – 25,705 sqm
A 6-level office accommodation and a café at 1B Homebush Bay Drive, Rhodes Corporate Park, Rhodes, New South Wales.
71,467
Lettable area – 12,799 sqm
A commercial office building with a 5-level office accommodation at 1D Homebush Bay Drive, Rhodes Corporate Park, Rhodes, New South Wales.
117,723
Lettable area – 17,238 sqm
An office tower with retail, food and amenity at Freshwater Place Office Tower, 2 Southbank Boulevard, Southbank, Victoria (50% interest).
230,967
Lettable area – 54,922 sqm
A property comprising a 3-level office and warehouse at 2 Wonderland Drive, Eastern Creek, New South Wales.
43,235
Lettable area – 29,047 sqm
A property comprising of a warehouse at 1 Burilda Close, Wetherill Park, New South Wales.
60,642
Lettable area – 18,848 sqm
Vietnam
Me Linh Point A 22-storey retail/office building with 2 basements at Me Linh Point Tower, 2 Ngo Duc Ke Street, District 1, Ho Chi Minh City.
55,201
Leasehold (lease expires year 2045), lettable area – 17,489 sqm
China
Fraser Suites CBD, Beijing A building comprising residential apartments (3rd to 23rd level) and clubhouse (2nd level) at 12 Jin Tong Xi Road, Chaoyang District, Beijing.
245,232
Leasehold : Residential (lease expires year 2073) Clubhouse (lease expires year 2043)Lettable area – 28,448 sqm
Philippines
Fraser Place Manila 89 serviced apartment units with 116 car park lots in the East Tower of Fraser Place Forbes Tower, Valero Street, Salcedo Village, Makati City, Manila.
45,464
Freehold, lettable area – 17,046 sqm

AN
NU
AL
RE
PO
RT
20
16
307
COMPLETED INVESTMENT PROPERTIES (CONT’D)
Book Value$'000
Europe
Capri by Fraser, Barcelona 97 serviced apartments at Sancho de Avila, 32-34 Barcelona, Spain. 27,608Freehold, lettable area – 3,626 sqm
Fraser Suites Kensington 70 residential apartments at Fraser Suites Kensington, 75 Stanhope Gardens London SW7 5RN.
211,926
Freehold, lettable area – 6,743 sqm
Capri by Fraser, Frankfurt 153 serviced apartments at 42 Europa-allee, 60327, Frankfurt am Maine, Germany.
47,960
Freehold, lettable area – 5,688 sqm
Flat 3 at Queens Gate Garden
An apartment unit at 39A Queens Gate Gardens, London SW7 5RR, United Kingdom.
1,876
Freehold, lettable area – 74 sqm
Indonesia
Fraser Residence Sudirman 108 serviced apartments units in Fraser Tower of Fraser Residence Sudirman Jakarta, The Peak Sudirman Jakarta, Jl. Setiabudi Raya No. 9, Jakarta, Sudirman, Jakarta 12910.
46,732
Freehold, lettable area – 11,324 sqm
HELD THROUGH FRASERS CENTREPOINT TRUST
Singapore
Causeway Point A 7-storey retail mall (including 1 basement level) and a 7-level carpark (B2, B3 and 2nd-6th levels) at 1 Woodlands Square.
1,143,000
Leasehold (lease expires year 2094), lettable area – 38,628 sqm
Northpoint A 6-storey retail mall (including 2 basement levels) and a 3-level carpark (B1-B3) at 930 Yishun Avenue 2.
672,000
Leasehold (lease expires year 2089), lettable area – 20,906 sqm
Changi City Point A 3-storey retail mall (including 1 basement level) at 5 Changi Business Park Central 1.
311,000
Leasehold (lease expires year 2069), lettable area – 19,253 sqm
Bedok Point A 5-storey retail mall (including 1 basement level) and 1 basement carpark at 799 New Upper Changi Road.
108,000
Leasehold (lease expires year 2077), lettable area – 7,684 sqm
YewTee Point A 2-storey retail mall (including 1 basement level) and 1 basement carpark at 21 Choa Chu Kang North 6.
172,000
Leasehold (lease expires year 2105), lettable area – 6,844 sqm
Anchorpoint A 2-storey retail mall (including 1 basement level) and an adjacent 2-storey restaurant building at 368 and 370 Alexandra Road.
103,000
Freehold, lettable area – 6,595 sqm
PARTICULARS OF GROUP PROPERTIESAS AT 30 SEPTEMBER 2016

FR
AS
ER
S C
EN
TR
EP
OIN
T L
IMIT
ED
& S
UB
SID
IAR
IES
308
COMPLETED INVESTMENT PROPERTIES (CONT’D)
Book Value$'000
HELD THROUGH FRASERS COMMERCIAL TRUST
Singapore
China Square Central 15-storey office and retail tower with basement carpark and heritage shophouses at 18, 20 & 22 Cross Street, China Square Central.
562,500
Leasehold (lease expires year 2096), lettable area – 34,357 sqm
Alexandra Technopark1 High-tech business space development comprising 2 air-conditioned buildings of 8 and 9 storeys with basement carpark at 438A and 438B Alexandra Road.
566,000
Freehold, lettable area – 96,980 sqm
55 Market Street 16-storey office and retail building at 55 Market Street. 139,000Leasehold (lease expires year 2825), lettable area – 6,670 sqm
Australia
Central Park 47-storey office tower at 152-158 St Georges Terrace, Perth. 276,077Freehold, lettable area – 33,106 sqm
Caroline Chisholm Centre 5-storey office complex at Block 4 Section 13, Tuggeranong. 237,010Leasehold (lease expires year 2101), lettable area – 40,244 sqm
357 Collins Street 25-storey office and retail building at 357 Collins St, Melbourne. 266,701Freehold, lettable area – 31,923 sqm
HELD THROUGH FRASERS HOSPITALITY TRUST
Singapore
Fraser Suites Singapore1 255 serviced apartment units at 491A River Valley Road, Singapore 248372.
346,000
Freehold, lettable area – 22,214 sqm
Australia
Fraser Suites Sydney1 201 serviced apartment units at Fraser Suites Sydney, 488 Kent Street, Sydney NSW 2000.
148,561
Freehold, lettable area – 12,137 sqm
United Kingdom
Fraser Place Canary Wharf1 2 buildings of 108 residential apartments at 80 Boardwalk Place, London E14 5SF, United Kingdom.
73,590
Freehold, lettable area – 4,460 sqm
Fraser Suites Glasgow1 A 4-storey building of 98 serviced apartments at 1-19 Albion Street, Glasgow G1 1LH, Scotland, United Kingdom.
19,282
Freehold, lettable area – 4,964 sqm
PARTICULARS OF GROUP PROPERTIESAS AT 30 SEPTEMBER 2016

AN
NU
AL
RE
PO
RT
20
16
309
COMPLETED INVESTMENT PROPERTIES (CONT’D)
Book Value$'000
HELD THROUGH FRASERS HOSPITALITY TRUST (CONT’D)
United Kingdom (cont’d)
Fraser Suites Edinburgh1 A 8-storey building of 75 residential apartments at 12-26 St Giles Street, Edinburgh EH1 1PT, Scotland, United Kingdom.
26,181
Freehold, lettable area – 2,333 sqm
Fraser Suites Queens Gate1 105 residential apartments at 39B Queens Gate Gardens, London SW7 5RR, United Kingdom.
110,032
Freehold, lettable area – 4,188 sqm
Germany
Maritim Hotel Dresden 328 hotel rooms at Ostra-Ufer 2, 01067 Dresden, Germany. 90,211Freehold, lettable area – 25,916 sqm
HELD THROUGH FRASERS LOGISTICS & INDUSTRIAL TRUST
Australia
Aylesbury Drive Trust A 2 adjoining office and warehouse facilities, located at 18-34 Aylesbury Drive, Altona, Victoria.
25,107
Freehold, lettable area – 21,493 sqm
Heatherton Road Trust A A warehouse facility and a free-standing 2-level office, located at 610-638 Heatherton Road, Clayton South, Victoria.
21,617
Freehold, lettable area – 8,387 sqm
Pacific Drive Trust A A large industrial warehouse and an attached 2-level office building, located at 49-75 Pacific Drive, Keysborough, Victoria.
30,733
Freehold, lettable area – 25,163 sqm
South Centre Road Trust A An industrial facility, a substantial 2-level office and a ground floor café, located at 115-121 South Centre Road, Melbourne Airport, Victoria.
5,834
Leasehold (lease expires year 2048), lettable area – 3,085 sqm
Link Road Trust A A 3-level office attached by a 1st floor walkway to the warehouse, located at 96-106 Link Road, Melbourne Airport, Victoria.
25,941
Leasehold (lease expires year 2048), lettable area – 18,599 sqm
Jets Court Trust A 2 warehouse and distribution facilities with associated office accommodation, located at 17-23 Jets Court, Melbourne Airport, Victoria.
8,334
Leasehold (lease expires year 2048), lettable area – 9,869 sqm
Jets Court Trust B 2 adjoining warehouse facilities, each with front office accommodation, located at 25-29 Jets Court, Melbourne Airport, Victoria.
11,564
Leasehold (lease expires year 2048), lettable area – 15,544 sqm
Sky Road East Trust A A warehouse distribution facility and a 2-level office, located at 28-32 Sky Road East, Melbourne Airport, Victoria.
9,897
Leasehold (lease expires year 2048), lettable area – 12,086 sqm
PARTICULARS OF GROUP PROPERTIESAS AT 30 SEPTEMBER 2016

FR
AS
ER
S C
EN
TR
EP
OIN
T L
IMIT
ED
& S
UB
SID
IAR
IES
310
COMPLETED INVESTMENT PROPERTIES (CONT’D)
Book Value$'000
HELD THROUGH FRASERS LOGISTICS & INDUSTRIAL TRUST (CONT’D)
Australia (cont’d)
Sky Road East Trust B A warehouse and distribution facility with a single-level office, located at 38-52 Sky Road East, Melbourne Airport, Victoria.
28,650
Leasehold (lease expires year 2048), lettable area – 46,231 sqm
Douglas Street Trust A 2 freestanding industrial facilities with a 2-level office attached to a warehouse with car parking for approximately 311 vehicles, located at 2-46 Douglas Street, Port Melbourne, Victoria.
22,815
Leasehold (lease expires year 2053), lettable area – 21,803 sqm
South Park Drive Trust A A warehouse facility, 2-level office and showroom, located at 21-33 South Park Drive, Dandenong South, Victoria.
25,264
Freehold, lettable area – 22,106 sqm
Bam Wine Court Trust A A single-level office and temperature-controlled warehouse, located at 22-26 Bam Wine Court, Dandenong South, Victoria.
23,805
Freehold, lettable area – 17,606 sqm
South Park Drive Trust D A storage and distribution facility, with associated office area, canopy, hardstand and 69 parking lots, located at 16-32 South Park Drive, Dandenong South, Victoria.
14,481
Freehold, lettable area – 12,729 sqm
South Park Drive Trust B A warehouse facility with 2-level office, located at 63-79 South Park Drive, Dandenong South, Victoria.
16,252
Freehold, lettable area – 13,963 sqm
South Park Drive Trust C Industrial office and warehouse facility, located at 98-126 South Park Drive, Dandenong South, Victoria.
36,463
Freehold, lettable area – 28,062 sqm
Atlantic Drive Trust D A warehouse and attached 2-storey office/display centre, located at 77 Atlantic Drive, Keysborough, Victoria.
20,003
Freehold, lettable area – 15,095 sqm
Pacific & Atlantic Drive Trust A
2 warehouse and office facilities under 1 roofline, located at 17 Pacific Drive and 170-172 Atlantic Drive, Keysborough, Victoria.
37,296
Freehold, lettable area – 30,004 sqm
Atlantic Drive Trust B 2 adjoining distribution facilities with associated mezzanine level office areas, located at 78 & 88 Atlantic Drive, Keysborough, Victoria.
18,023
Freehold, lettable area – 13,495 sqm
Atlantic Drive Trust C 2 adjoining distribution facilities with associated mezzanine level office areas, located at 150-168 Atlantic Drive, Keysborough, Victoria.
37,401
Freehold, lettable area – 27,272 sqm
PARTICULARS OF GROUP PROPERTIESAS AT 30 SEPTEMBER 2016

AN
NU
AL
RE
PO
RT
20
16
311
COMPLETED INVESTMENT PROPERTIES (CONT’D)
Book Value$'000
HELD THROUGH FRASERS LOGISTICS & INDUSTRIAL TRUST (CONT’D)
Australia (cont’d)
Sunline Drive Trust A 2 attached warehouses, each with internal office accommodation, located at 1-13 and 15-27 Sunline Drive, Truganina, Victoria.
30,525
Freehold, lettable area – 26,153 sqm
Boundary Road Trust A A distribution facility and incorporate a single-level office which is attached to a large warehouse, located at 468 Boundary Road, Derrimut, Victoria.
25,837
Freehold, lettable area – 24,732 sqm
Sunline Drive Trust B 1 office and warehouse, located at 42 Sunline Drive, Truganina, Victoria. 17,398Freehold, lettable area – 14,636 sqm
Efficient Drive Trust A 3 office and warehouse accommodations, located at 2-22 Efficient Drive, Truganina, Victoria.
43,756
Freehold, lettable area – 38,335 sqm
Wellington Road Trust A 1 office/showroom development and 330 car parking bays, located at 211A Wellington Road, Mulgrave, Victoria.
39,797
Freehold, lettable area – 7,175 sqm
Doriemus Drive Trust A Office warehouse, located at 1 Doriemus Drive, Truganina, Victoria. 88,449Freehold, lettable area – 74,545 sqm
Kangaroo Avenue Trust C 1 office/warehouse distribution centre, located at Lot 6 Kangaroo Avenue, Eastern Creek, New South Wales.
66,675
Freehold, lettable area – 41,401 sqm
Kangaroo Avenue Trust B 2 adjoining offices and warehouse, located at Lot 5 Kangaroo Avenue, Eastern Creek, New South Wales.
40,109
Freehold, lettable area – 23,112 sqm
Eucalyptus Place Trust A Office/warehouse facility, located at Lot 22 Eucalyptus Place, Eastern Creek, New South Wales.
28,962
Freehold, lettable area – 16,074 sqm
Reconciliation Rise Trust A A warehouse and office, located at 6 Reconciliation Rise, Pemulwuy,New South Wales.
34,275
Freehold, lettable area – 19,218 sqm
Reconciliation Rise Trust B Industrial distribution facility, located at 8-8A Reconciliation Rise, Pemulwuy, New South Wales.
38,234
Freehold, lettable area – 22,511 sqm
Springhill Road Trust A A port related automotive vehicle storage and distribution facility, located at Lot 104 & 105 Springhill Road, Port Kembla,New South Wales.
27,399
Leasehold (lease expires year 2050, with 6 options to renew for 5 years each), lettable area – 90,661 sqm
PARTICULARS OF GROUP PROPERTIESAS AT 30 SEPTEMBER 2016

FR
AS
ER
S C
EN
TR
EP
OIN
T L
IMIT
ED
& S
UB
SID
IAR
IES
312
COMPLETED INVESTMENT PROPERTIES (CONT’D)
Book Value$'000
HELD THROUGH FRASERS LOGISTICS & INDUSTRIAL TRUST (CONT’D)
Australia (cont’d)
Distribution Place Trust A 2-storey office and warehouse facility, located at 8 Distribution Place, Seven Hills, New South Wales.
24,222
Freehold, lettable area – 12,319 sqm
Stanton Road Trust A 2-level office accommodation, undercover parking and a warehouse, located at 10 Stanton Road, Seven Hills, New South Wales.
13,127
Freehold, lettable area – 7,065 sqm
Station Road Trust A Warehouse and associated offices, located at 99 Station Road, Seven Hills, New South Wales.
17,711
Freehold, lettable area – 10,772 sqm
Hartley Street Trust A Distribution facility with warehouse, located at 80 Hartley Street, Smeaton Grange, New South Wales.
66,675
Freehold, lettable area – 61,281 sqm
Gibbon Road Trust A 2 adjoining office and warehouse units, located at 32 Gibbon Road, Winston Hills, New South Wales.
40,630
Freehold, lettable area – 16,625 sqm
Kangaroo Avenue Trust A 2 separate standalone distribution facilities, located at 4 Kangaroo Avenue, Eastern Creek, New South Wales.
77,093
Freehold, lettable area – 40,543 sqm
Siltstone Place Trust A Office/warehouse distribution centre, located at 10 Siltstone Place, Berrinba, Queensland.
14,794
Leasehold (lease expires year 2115), lettable area – 9,797 sqm
Boundary Road Trust B Warehouse with ancillary office spaces, located at 55-59 Boundary Road, Carole Park, Queensland.
16,773
Leasehold (lease expires year 2115), lettable area – 13,250 sqm
Platinum Street Trust A Warehouse and manufacturing facility, located at 57-71 Platinum Street, Crestmead, Queensland.
30,837
Leasehold (lease expires year 2115), lettable area – 19,299 sqm
Stradbroke Street Trust A Warehouse and production facility with associated office accommodation, located at 51 Stradbroke Street, Heathwood, Queensland.
24,586
Leasehold (lease expires year 2115), lettable area – 14,916 sqm
Flint Street Trust A Warehouse and office facility, located at 30 Flint Street, Inala, Queensland.
26,045
Leasehold (lease expires year 2115), lettable area – 15,052 sqm
Queensport Road Trust A Warehouse and manufacturing facility, with a detached 2-level office building, located at 286 Queensport Road, North Murarrie, Queensland.
38,026
Leasehold (lease expires year 2115), lettable area – 21,531 sqm
PARTICULARS OF GROUP PROPERTIESAS AT 30 SEPTEMBER 2016

AN
NU
AL
RE
PO
RT
20
16
313
COMPLETED INVESTMENT PROPERTIES (CONT’D)
Book Value$'000
HELD THROUGH FRASERS LOGISTICS & INDUSTRIAL TRUST (CONT’D)
Australia (cont’d)
Earnshaw Road Trust A 2-level office and warehouse, located at 350 Earnshaw Road, Northgate, Queensland.
56,049
Leasehold (lease expires year 2115), lettable area – 30,779 sqm
Sandstone Place Trust A Warehouse and distribution centre, together with a 2-storey office, located at 99 Sandstone Place, Parkinson, Queensland.
248,678
Leasehold (lease expires year 2115), lettable area – 54,245 sqm
Shettleston Street Trust A Warehouse and distribution facility with a single-level office, located at 99 Shettleston Street, Rocklea, Queensland.
23,545
Leasehold (lease expires year 2115), lettable area – 15,186 sqm
Butler Boulevard Trust B 4 various-sized industrial units with associated offices, located at 5 Butler Boulevard, Adelaide Airport, South Australia.
9,376
Leasehold (lease expires year 2048, option to renew for 49 years), lettable area – 8,224 sqm
Butler Boulevard Trust C Office and warehouse facility, located at 20-22 Butler Boulevard, Adelaide Airport, South Australia.
11,668
Leasehold (lease expires year 2048, option to renew for 49 years), lettable area – 11,197 sqm
Butler Boulevard Trust A Office and warehouse facility, located at 18-20 Butler Boulevard, Adelaide Airport, South Australia.
8,126
Leasehold (lease expires year 2048, option to renew for 49 years), lettable area – 6,991 sqm
Coghlan Road Trust A Office and warehouse facility, located at Lot 102 Coghlan Road, Outer Harbor, South Australia.
7,449
Freehold, lettable area – 6,626 sqm
Paltridge Road Trust A A complex comprising an office warehouse building, located at 60 Paltridge Road, Perth Airport, Western Australia.
18,961
Leasehold (lease expires year 2033), lettable area – 20,143 sqm
Pearson Road Trust A Office and warehouse facility, located at Lot 1 Pearson Rd, Yatala, Queensland.
38,547
Leasehold (lease expires year 2115), lettable area – 30,618 sqm
Indian Drive Trust A Office and warehouse development, located at 111 Indian Drive, Truganina, Victoria.
33,963
Freehold, lettable area – 21,660 sqm
TOTAL COMPLETED INVESTMENT PROPERTIES 10,986,224
PARTICULARS OF GROUP PROPERTIESAS AT 30 SEPTEMBER 2016

FR
AS
ER
S C
EN
TR
EP
OIN
T L
IMIT
ED
& S
UB
SID
IAR
IES
314
PARTICULARS OF GROUP PROPERTIESAS AT 30 SEPTEMBER 2016
INVESTMENT PROPERITIES UNDER CONSTRUCTION
Book Value$'000
Singapore
Frasers Tower A commercial development at Cecil Street/Telok Ayer Street. 1,113,000Leasehold (lease expires year 2112), gross floor area – 77,162 sqm
North Point City A mixed commercial and residential development integrated with bus interchange and community club at Yishun Avenue 2/Yishun Central.
1,142,000
Leasehold (lease expires year 2114), gross floor area – approximately 44,017 sqm
Capri by Fraser, 298 units of hotel residences at 181 South Bridge Road. 173,144 China Square Leasehold (lease expires year 2096), gross floor area – 16,000 sqm
Europe
Fraser Suites Hamburg 147 serviced apartment units at Rodingsmarkt 2, Hamburg, Germany. 49,281Freehold, lettable area – 5,273 sqm
Australia
Frasers Property Australia Group's Investment Properties Under Construction
A property comprising of a warehouse at Lot 101 Wayne Dr Berrinba, Queensland.
20,214
A property comprising of a warehouse at 43 Efficient Drive, Truganinga, Victoria.
10,156
TOTAL INVESTMENT PROPERTIES UNDER CONSTRUCTION 2,507,795
TOTAL PROPERTIES (CLASSIFIED AS INVESTMENT PROPERTIES) 13,494,019
1 Due to consolidation of the REITs, the carrying values of these properties have been adjusted to reflect FCL Group's freehold interest in the properties.

AN
NU
AL
RE
PO
RT
20
16
315
PROPERTY, PLANT AND EQUIPMENT
Book Value$'000
Australia
Capri by Fraser, Brisbane 239 units of hotel residences at 80 Albert St, Brisbane QLD 4000, Australia.
92,702
Freehold, gross floor area – 14,217 sqm
Fraser Suites Perth 236 apartments and suites at 10 Adelaide Terrace, East Perth WA 6004, Australia.
120,348
Freehold, gross floor area – 27,447 sqm
United Kingdom
Malmaison Belfast A boutique hotel situated at 34-38 Victoria Street, Belfast, BT1 3GH, Northern Ireland. The property provides a 64 bedroom boutique hotel, a 60 cover restaurant, bar, gym and meeting rooms for a total capacity of 40.
13,045
Freehold, gross floor area – 3,600 sqm
Malmaison Edinburgh A boutique hotel situated at 1 Tower Place, Edinburgh, EH6 7BZ, Scotland. The property provides a 100 bedroom boutique hotel, a 53 cover restaurant, bar, gym and meeting rooms for a total capacity of 70.
26,422
Freehold, gross floor area – 6,340 sqm
Malmaison Glasgow A boutique hotel situated at 278 West George Street, Glasgow, G2 4LL, Scotland. The property provides a 72 bedroom boutique hotel, a 106 cover restaurant, 2 bars, gym and meeting rooms for a total capacity of 45.
18,587
Freehold, gross floor area – 4,408 sqm
Malmaison Leeds A boutique hotel situated at 1 Swinegate, Leeds, LS1 4AG, England. The property provides a 100 bedroom boutique hotel, a 96 cover restaurant, bar, gym and meeting rooms for a total capacity of 45.
25,187
Freehold, gross floor area – 7,920 sqm
Malmaison Liverpool A boutique hotel situated at 7 William Jessop Way, Liverpool, L3 1QZ, England. Occupying floors ground to sixth, the boutique hotel provides 130 bedrooms, a 65 cover Brasserie restaurant, 2 private dining rooms (Kitchen & Boudoir with 18 covers), a 70 seat Mal Bar, a small gym and four meeting rooms with a maximum capacity of 100.
24,513
Leasehold (lease expires year 2146), gross floor area – 8,250 sqm
Malmaison Reading A boutique hotel situated at 18-20 Station Road, Reading, RG1 1JX, England. The property provides a 75 bedroom boutique hotel, a 76 cover restaurant, bar, gym and meeting rooms for a total capacity of 25.
23,289
Leasehold (lease expires year 2894), gross floor area – 1,804 sqm
Hotel du Vin Birmingham A boutique hotel situated at Church Street, Birmingham, B3 2NR, England. The property provides a 66 bedroom boutique hotel, a 85 cover restaurant, bar, gym and meeting rooms for a total capacity of 90.
17,916
Leasehold (lease expires year 2150), gross floor area – 4,510 sqm
PARTICULARS OF GROUP PROPERTIESAS AT 30 SEPTEMBER 2016

FR
AS
ER
S C
EN
TR
EP
OIN
T L
IMIT
ED
& S
UB
SID
IAR
IES
316
PROPERTY, PLANT AND EQUIPMENT (CONT’D)
Book Value$'000
United Kingdom (cont’d)
Hotel du Vin Brighton A boutique hotel situated at Ship Street, Brighton, BN1 1AD, England. The property provides a 49 bedroom boutique hotel, a 80 cover restaurant, bar, and meeting rooms for a total capacity of 110.
32,805
Freehold, gross floor area – 5,693 sqm
Hotel du Vin Bristol A boutique hotel situated at The Sugar House, Narrow Lewins Mead, Bristol, BS1 2NU, England. The property provides a 40 bedroom boutique hotel, a 80 cover restaurant, bar and 3 meeting rooms for a maximum capacity of 72.
22,241
Freehold, gross floor area – 3,272 sqm
Hotel du Vin Cambridge A boutique hotel situated at 15-19 Trumpington Street, Cambridge, CB2 1QA, England. The property provides a 41 bedroom boutique hotel, a 82 cover restaurant, bar and two meeting rooms for a maximum capacity of 24.
27,319
Leasehold (lease expires year 2105), gross floor area – 4,320 sqm
Hotel du Vin Cheltenham A boutique hotel situated at Parabola Road, Cheltenham, Gloucestershire, GL50 3AQ, England. The property provides a 49 bedroom boutique hotel, a 110 cover restaurant, bar and meeting rooms for a total capacity of 40.
15,994
Freehold, gross floor area – 3,625 sqm
Hotel du Vin Edinburgh A boutique hotel situated at 11 Bistro Place, Edinburgh, EH1 1EZ, Scotland. The property provides a 47 bedroom boutique hotel, a 80 cover restaurant, bar and meeting rooms with capacity of 36.
21,734
Freehold, gross floor area – 4,126 sqm
Hotel du Vin Glasgow A boutique hotel situated at Devonshire Gardens, Glasgow, G12 0UX, Scotland. The property provides a 49 bedroom boutique hotel, a 80 cover restaurant, bar, gym and meeting rooms for a maximum capacity of 50.
20,330
Freehold, gross floor area – 5,280 sqm
Hotel du Vin Harrogate A boutique hotel situated at Prospect Place, Harrogate, North Yorkshire, HG1 1LB, England. The property provides a 48 bedroom boutique hotel, a 90 cover restaurant, bar and meeting rooms for a total capacity of 60.
13,034
Freehold, gross floor area – 7,552 sqm
Hotel du Vin Henley-on-Thames
A boutique hotel situated at New Street, Henley-on-Thames, Oxfordshire, RG9 2BP, England. The property provides a 43 bedroom boutique hotel, a 80 cover restaurant, bar and meeting rooms for a total capacity of 56.
16,681
Freehold, gross floor area – 5,260 sqm
Hotel du Vin Newcastle-upon-Tyne
A boutique hotel situated at Allan House, City Road, Newcastle-upon-Tyne, NE1 2BE, England. The property provides a 42 bedroom boutique hotel, a 84 cover restaurant, bar and meeting rooms for a max capacity of 36.
8,348
Freehold, gross floor area – 3,491 sqm
PARTICULARS OF GROUP PROPERTIESAS AT 30 SEPTEMBER 2016

AN
NU
AL
RE
PO
RT
20
16
317
PROPERTY, PLANT AND EQUIPMENT (CONT’D)
Book Value$'000
United Kingdom (cont’d)
Hotel du Vin Poole A boutique hotel situated at The Quay, Thames Street, Poole, BH15 1JN, England. The property provides a 38 bedroom boutique hotel, a 85 cover restaurant, bar and meeting rooms for a total capacity of 30.
7,115
Freehold and leasehold (lease expires year 2078), gross floor area – 2,610 sqm
Hotel du Vin St Andrews A boutique hotel situated at 40 The Scores, St Andrews, KY16 9AS, Scotland. The property provides a 40 bedroom boutique hotel, a 56 cover restaurant, bar and meeting rooms for a total capacity of 120.
11,474
Freehold, gross floor area – 3,974 sqm
Hotel du Vin Tunbridge Wells
A boutique hotel situated at Crescent Road, Tunbridge Wells, TN1 2LY, England. The property provides a 34 bedroom boutique hotel, a 88 cover restaurant, bar and meeting rooms with a maximum capacity of 80.
16,143
Freehold, gross floor area – 2,916 sqm
Hotel du Vin Wimbledon A boutique hotel situated at Cannizaro House, West Side Common, London, SW19 4 UE, England. The property provides a 48 bedroom boutique hotel, a 60 cover restaurant, bar and meeting rooms for a total capacity of 120.
30,811
Leasehold (lease expires year 2111), gross floor area – 4,531 sqm
Hotel du Vin Winchester A boutique hotel situated at 14 Southgate Street, Winchester, Hampshire, SO23 9EF, England. The property provides a 24 bedroom boutique hotel, a 60 cover restaurant, bar and meeting rooms for a total capacity of 50.
14,224
Freehold, gross floor area – 2,225 sqm
Hotel du Vin York A boutique hotel situated at 89 The Mount, York, YO24 1AX, England. The property provides a 44 bedroom boutique hotel, a 70 cover restaurant, bar and meeting rooms for a total capacity of 30.
18,245
Freehold, gross floor area – 4,210 sqm
Malmaison Cheltenham A boutique hotel situated on Bayshill Road, Cheltenham, Gloucestershire, GL50 3AS, England. The property provides a 61 bedroom hotel, a 74 cover restaurant, bar and meeting rooms for a total capacity of 38.
20,727
Freehold, gross floor area – 3,226 sqm
Hotel du Vin Avon Gorge A boutique hotel situated on Sion Hill, Clifton, Bristol, BS8 4LD, England. The property provides a 75 bedroom hotel, a 50 cover restaurant, bar and meeting rooms for a total capacity of 80.
21,735
Freehold, gross floor area – 5,219 sqm
Hotel du Vin Exeter A boutique hotel situated on Magdalen Street, Exeter, Devon, EX2 4HY, England. The property provides a 59 bedroom boutique hotel, a 80 cover restaurant, bar and meeting rooms for a total capacity of 24.
18,357
Freehold, gross floor area – 2,293 sqm
PARTICULARS OF GROUP PROPERTIESAS AT 30 SEPTEMBER 2016

FR
AS
ER
S C
EN
TR
EP
OIN
T L
IMIT
ED
& S
UB
SID
IAR
IES
318
PROPERTY, PLANT AND EQUIPMENT (CONT’D)
Book Value$'000
HELD THROUGH FRASERS HOSPITALITY TRUST
Singapore
InterContinental Singapore 406 hotel rooms at 80 Middle Road, Singapore 188966. 498,487 Leasehold (lease expires year 2089), gross floor area – 49,987 sqm
Malaysia
The Westin Kuala Lumpur 443 hotel rooms at 199 Jalan Bukit Bintang, Kuala Lumpur, 55100, Malaysia.
146,839
Freehold, gross floor area – 79,593 sqm
Japan
ANA Crown Plaza Kobe 593 hotel rooms at 1-Chome, Kitano-Cho, Chuo-Ku, Kobe, 650-0002, Japan.
150,272
Freehold, gross floor area – 136,657 sqm
Australia
Novotel Rockford Darling Harbour
230 hotel rooms at Novotel Rockford Darling Harbour, 17 Little Pier Street, Darling Harbour, NSW 2000, Australia.
66,898
Leasehold (lease expires year 2098), gross floor area – 12,128 sqm
Sofitel Sydney Wentworth 436 hotel rooms at 61 – 101 Phillip Street, Sydney NSW 2000, Australia. 189,983 Freehold, gross floor area – 33,589 sqm
United Kingdom
Park International London 171 hotel rooms at 117-129 Cromwell Road, South Kensington, London, SW7 4DS, United Kingdom.
66,606
Leasehold (lease expires year 2089), gross floor area – 6,825 sqm
Best Western Cromwell London
85 hotel rooms at 108, 110 and 112 Cromwell Road, London, SW7 4ES, United Kingdom.
28,843
Leasehold (lease expires year 2089), gross floor area – 2,512 sqm
LAND AND BUILDING – HOTELS 1,847,254
OTHER EQUIPMENT, FURNITURE AND FITTINGS 125,028
TOTAL PROPERTY, PLANT AND EQUIPMENT 1,972,282
PARTICULARS OF GROUP PROPERTIESAS AT 30 SEPTEMBER 2016

AN
NU
AL
RE
PO
RT
20
16
319
COMPLETED PROPERTIES HELD FOR SALE
Effective Group
Interest %
Singapore
Soleil @ Sinaran Leasehold land of approximately 12,468 sqm situated at Sinaran Drive. The development has a gross floor area of 44,878 sqm and consists of 417 condominium units.
100.0
Holland Park Freehold land of approximately 2,801 sqm at Holland Park for the development of 2 good class bungalows for sale.
100.0
Twin Fountains Leasehold land (lease expires year 2111) of approximately 16,504 sqm at Woodlands Ave 6 (Woodlands Planning Area) for the development of 418 executive condominium units of approximately 45,769 sqm of gross floor area for sale.
70.0
Twin Waterfalls Leasehold land (lease expires year 2110) of approximately 25,164 sqm at Punggol Walk for the development of 728 executive condominium units of approximately 76,713 sqm of gross floor area for sale.
80.0
Australia
Lumiere Freehold land of approximately 3,966 sqm situated at former Regent Theatre, Frontages on George Street, Bathurst & Kent Street, Sydney, New South Wales. The development has a gross floor area of 61,146 sqm and consists of 1 retail podium, 456 residential units, 201 serviced apartments, 3 retail units and 19 commercial suites.
87.5
Central Park Freehold land of approximately 48,000 sqm situated at Broadway, Sydney, New South Wales for a proposed mixed development of approximately 2,069 residential apartment units of approximately 107,287 sqm of gross floor area for sale and commercial space of approximately 21,715 sqm of gross floor area for sale.
37.5
Putney Hill Freehold land of approximately 113,500 sqm situated at Putney, Sydney, New South Wales for a proposed development comprising 145 apartments and 16 houses of approximately 15,321 sqm of gross floor area for sale.
75.0
Queens Riverside Freehold land of approximately 11,895 sqm situated at East Perth for a proposed mixed development comprises approximately 500 private apartment units and 12 commercial space of a total of approximately 41,287 sqm of gross floor area for sale.
87.5
China
Chengdu Logistics Hub
Leasehold land of approximately 195,846 sqm situated at Chengdu. Phase 1 of the development has a gross floor area of 161,288 sqm and consists of 136 office units, 27 warehouses and 766 car park lots. Phase 2 has a gross floor area of 154,049 sqm and consists of 149 office units, 14 retail units and 119 car park lots. Phase 4 consists of 270 office units and 88 retail units.
80.0
Baitang One Leasehold land of approximately 314,501 sqm situated at Gongye Yuan District, Nan Shi Jie Dong, Suzhou. Phase 1 of the development has a gross floor area of 132,520 sqm and consists of 968 apartment units. Phase 2 has a gross floor area of 154,049 sqm and consists of 898 apartment units. Phase 3A has a gross floor area of 77,711 sqm and consists of 706 apartment units.
100.0
United Kingdom
Wandsworth Riverside Quarter
Freehold land of approximately 20,531 sqm situated at south bank of River Thames, London for a proposed residential and commercial developement of 510 residential units and ancillary office and retail space of a total of approximately 32,236 sqm of gross floor area for sale.
80.0
PARTICULARS OF GROUP PROPERTIESAS AT 30 SEPTEMBER 2016

FR
AS
ER
S C
EN
TR
EP
OIN
T L
IMIT
ED
& S
UB
SID
IAR
IES
320
DEVELOPMENT PROPERTIES HELD FOR SALE
Stage of Completion
%
Estimated Date of Completion
Effective Group
Interest %
Singapore
Parc Life Leasehold land (lease expires year 2113) of approximately 22,190 sqm at Sembawang Crescent (Sembawang Planning Area) for the development of 628 executive condominium units consisting 7 blocks of 16-storey and 4 blocks of 15-storey residential units with e-deck, swimming pool, ancillary facilities and a basement carpark of approximately 62,066 sqm gross floor area for sale.
47 2nd Quarter 2018 80.0
North Park Residences
Leasehold land (lease expires year 2114) of approximately 41,085 sqm at Yishun Avenue 2/Yishun Central for a proposed 3-storey podium block consisting of 173 shops & 94 restaurants, childcare, community club and bus interchange as well as 920 condominium units of approximately 77,335 sqm of gross floor area for sale.
21 4th Quarter 2018 100.0
Australia
Frasers Landing A residential development comprising 487 land lots to go.
22 2nd Quarter 2025 56.3
Central Park – JVs A residential development comprising 575 apartment lots to go.
73 1st Quarter 2019 37.5
Central Park – Broadway
A residential development comprising 301 apartment lots to go.
2 3rd Quarter 2018 75.0
Putney Hill A residential development comprising 331 apartment lots to go.
58 3rd Quarter 2018 75.0
Port Coogee A residential development comprising 831 apartment and land lots to go.
2 3rd Quarter 2026 100.0
Discovery Point Shared Works
A residential development comprising 489 apartment lots to go.
41 1st Quarter 2020 100.0
Jandakot – Cockburn Central
A residential development comprising 437 apartment lots to go.
50 1st Quarter 2022 100.0
Ashlar Golf Course A residential development comprising 793 apartment, house and land lots to go.
14 1st Quarter 2020 100.0
Cova – Hope Island A residential development comprising 224 MD housing, house and land lots to go.
59 1st Quarter 2019 100.0
Yungabah A residential development comprising 28 apartment lots to go.
85 3rd Quarter 2017 100.0
PARTICULARS OF GROUP PROPERTIESAS AT 30 SEPTEMBER 2016

AN
NU
AL
RE
PO
RT
20
16
321
DEVELOPMENT PROPERTIES HELD FOR SALE (CONT’D)
Stage of Completion
%
Estimated Date of Completion
Effective Group
Interest %
Australia (cont’d)
Northshore – Hamilton
A residential development comprising 850 apartment, MD housing, house and land lots to go.
23 3rd Quarter 2023 100.0
Casiana Grove 865 Frank Road
A residential development comprising 54 land lots to go.
93 3rd Quarter 2017 100.0
Lidcombe Village Civil
A residential development comprising 81 apartment, MD housing, house and land lots to go.
37 1st Quarter 2018 100.0
Baldivis Grove A residential development comprising 326 land lots to go.
13 1st Quarter 2022 100.0
Greenvale A residential development comprising 76 MD housing and land lots to go.
88 1st Quarter 2018 100.0
Clemton Park A residential development comprising 291 MD housing lots to go.
61 1st Quarter 2017 50.0
Discovery Point Co A residential development comprising 7 apartment lots to go.
99 1st Quarter 2017 50.0
East Baldivis A residential development comprising 860 MD housing and land lots to go.
18 1st Quarter 2024 50.0
Sunshine A residential development comprising 11 house and land lots to go.
98 1st Quarter 2017 50.0
Wallan A residential development comprising 1,414 land lots to go.
26 3rd Quarter 2026 50.0
Parkville A residential development comprising 722 apartment lots to go.
36 3rd Quarter 2021 50.0
Carlton A residential development comprising 349 apartment and MD housing lots to go.
55 4th Quarter 2018 65.0
Avondale A residential development comprising 135 MD housing lots to go.
– 4th Quarter 2018 100.0
Point Cook A residential development comprising 587 MD housing and land lots to go.
– 3rd Quarter 2020 50.0
Botany A residential development comprising 437 apartment and MD housing lots to go.
– 2nd Quarter 2018 100.0
Coorparoo A residential development comprising 370 apartment lots to go.
– 4th Quarter 2017 50.0
Park Ridge A residential development comprising 186 land lots to go.
51 4th Quarter 2018 100.0
PARTICULARS OF GROUP PROPERTIESAS AT 30 SEPTEMBER 2016

FR
AS
ER
S C
EN
TR
EP
OIN
T L
IMIT
ED
& S
UB
SID
IAR
IES
322
DEVELOPMENT PROPERTIES HELD FOR SALE (CONT’D)
Stage of Completion
%
Estimated Date of Completion
Effective Group
Interest %
Australia (cont’d)
Prospect Park – Burwood
A residential development comprising 743 MD housing, land and apartment lots to go.
– 1st Quarter 2024 100.0
North Ryde A residential development comprising 383 apartment lots to go.
– 2nd Quarter 2018 50.0
Warriewood A development comprising 1 superlot to go. – 2nd Quarter 2017 100.0
Edmondson Park A residential development comprising 1,787 apartment lots to go.
– 1st Quarter 2025 100.0
Brookhaven A residential development comprising 1,350 land lots to go.
– 1st Quarter 2024 100.0
Deebing Heights A residential development comprising 962 land lots to go.
– 1st Quarter 2025 100.0
Shell Cove A residential development comprising 1,024 MD housing, house and land lots to go.
65 1st Quarter 2025 50.0
Berwick Waters A residential development comprising 1,570 land lots to go.
32 3rd Quarter 2025 50.0
Sunbury Fields A residential development comprising 261 land lots to go.
33 3rd Quarter 2018 100.0
Westmeadows A residential development comprising 151 MD housing and land lots to go.
28 3rd Quarter 2018 100.0
Port Coogee JV1 A residential development comprising 14 land lots to go.
96 3rd Quarter 2017 50.0
Seaspray A residential development comprising 13 land lots to go.
32 3rd Quarter 2021 50.0
ART A residential development comprising 33 land lots to go.
– 3rd Quarter 2019 50.0
Greenwood A residential development comprising 138 apartment and MD housing lots to go.
– 2nd Quarter 2020 100.0
Rowville – Repco, Victoria
Built form project with estimated gross lettable area of 4,000 sqm.
75 1st Quarter 2017 100.0
Avery Dennison & Spec, Queensland
Built form project with estimated gross lettable area of 15,441 sqm.
77 1st Quarter 2017 100.0
Dana & Spec, Victoria
Built form project with estimated gross lettable area of 25,418 sqm.
– 1st Quarter 2017 100.0
PARTICULARS OF GROUP PROPERTIESAS AT 30 SEPTEMBER 2016

AN
NU
AL
RE
PO
RT
20
16
323
DEVELOPMENT PROPERTIES HELD FOR SALE (CONT’D)
Stage of Completion
%
Estimated Date of Completion
Effective Group
Interest %
Australia (cont’d)
CEVA Nissan, Victoria
Built form project with estimated gross lettable area of 23,035 sqm.
35 2nd Quarter 2017 100.0
OJI, Queensland Built form project with estimated gross lettable area of 25,000 sqm.
– 3rd Quarter 2017 100.0
Bealieau, Queensland
Built form project with estimated gross lettable area of 22,875 sqm.
– 4th Quarter 2017 100.0
National Tiles & Spec, Queensland
Built form project with estimated gross lettable area of 19,452 sqm.
– 4th Quarter 2017 100.0
Nick Scali & Spec, New South Wales
Built form project with estimated gross lettable area of 19,950 sqm.
– 3rd Quarter 2017 100.0
Royal Comfort Bedding, New South Wales
Built form project with estimated gross lettable area of 18,770 sqm.
– 3rd Quarter 2017 100.0
ARB, Victoria Built form project with estimated gross lettable area of 16,000 sqm.
– 3rd Quarter 2017 100.0
Stanley Black & Decker, Victoria
Built form project with estimated gross lettable area of 19,530 sqm.
– 1st Quarter 2018 100.0
BMW & Spec, Victoria
Built form project with estimated gross lettable area of 10,295 sqm.
– 2nd Quarter 2017 50.0
Eastern Creek, New South Wales
Industrial type of estate with an estimated total saleable area of 111,877 sqm.
– 1st Quarter 2020 100.0
Macquarie Park, New South Wales
Office type of estate with an estimated total saleable area of 15,620 sqm.
– 4th Quarter 2017 50.0
Derrimut, Victoria Industrial type of estate with an estimated total saleable area of 34,980 sqm.
– 2nd Quarter 2017 100.0
Keysborough, Victoria
Industrial type of estate with an estimated total saleable area of 221,412 sqm.
38 4th Quarter 2018 100.0
Truganina, Victoria Industrial type of estate with an estimated total saleable area of 318,311 sqm.
41 4th Quarter 2020 100.0
Richlands, Queensland
Industrial type of estate with an estimated total saleable area of 22,226 sqm.
– 1st Quarter 2018 100.0
Berrinba, Queensland
Industrial type of estate with an estimated total saleable area of 29,859 sqm.
– 4th Quarter 2018 100.0
PARTICULARS OF GROUP PROPERTIESAS AT 30 SEPTEMBER 2016

FR
AS
ER
S C
EN
TR
EP
OIN
T L
IMIT
ED
& S
UB
SID
IAR
IES
324
DEVELOPMENT PROPERTIES HELD FOR SALE (CONT’D)
Stage of Completion
%
Estimated Date of Completion
Effective Group
Interest %
Australia (cont’d)
Yatala, Queensland Industrial type of estate with an estimated total saleable area of 190,469 sqm.
44 2nd Quarter 2021 100.0
Beverley, South Australia
Industrial type of estate with an estimated total saleable area of 10,705 sqm.
33 4th Quarter 2017 100.0
Eastern Creek, New South Wales
Industrial type of estate with an estimated total saleable area of 14,833 sqm.
97 1st Quarter 2018 50.0
Burwood Retail, Victoria
Retail type of estate with an estimated total saleable area of 25,000 sqm.
– 1st Quarter 2019 100.0
Western Sydney Parklands Trust, New South Wales
Industrial type of estate with an estimated total saleable area of 42,818 sqm.
79 4th Quarter 2017 100.0
Gillman, South Australia
Industrial type of estate with an estimated total saleable area of 15,016 sqm.
– 1st Quarter 2018 50.0
Edmondson Park, New South Wales
Retail type of estate with an estimated total saleable area of 38,000 sqm.
– 2nd Quarter 2024 100.0
Chullora, New South Wales
Industrial type of estate with an estimated total saleable area of 60,207 sqm.
– 3rd Quarter 2018 100.0
China
Chengdu Logistics Hub
Leasehold land (lease expires year 2057) of approximately 195,846 sqm situated at Chengdu for a proposed industrial/commercial development of approximately 548,065 sqm gross floor area for sale, which is separated into Phase 1 of 161,288 sqm and Phase 2 to 4 of 386,777 sqm. Phase 1, 2 and 4 of the development were completed. Phase 3 was sold in September 2012. Phase 2A is yet to be developed.
– 2nd Quarter 2018 100.0
Baitang One Leasehold land (lease expires year 2074) of approximately 314,501 sqm situated at Gongye Yuan district, Nan Shi Jie Dong, Suzhou for a residential development of a total of approximately 555,285 sqm of gross floor area for sale, which is separated into Phase 1 of 132,520 sqm, Phase 2 of 149,710 sqm and Phase 3 of 273,055 sqm. Phases 1, 2 and 3A of the development were completed.– Phase 3b 32 4th Quarter 2017 100.0– Phase 3c1 87 1st Quarter 2017 100.0– Phase 3c2 – 4th Quarter 2018 100.0
PARTICULARS OF GROUP PROPERTIESAS AT 30 SEPTEMBER 2016

AN
NU
AL
RE
PO
RT
20
16
325
DEVELOPMENT PROPERTIES HELD FOR SALE (CONT’D)
Stage of Completion
%
Estimated Date of Completion
Effective Group
Interest %
New Zealand
Broadview Rise Freehold land of approximately 13,275 sqm situated at South Island, Queenstown for a proposed development of 43 luxury residential apartments of approximately 8,410 sqm of gross floor area for sale.
– 4th Quarter 2017 75.0
Coast at Papamoa Freehold land of approximately 271,168 sqm situated at Tauranga, North Island for a proposed development of approximately 350 land lots of approximately 139,906 sqm of lot area for sale.
– 1st Quarter 2019 75.0
United Kingdom
Wandsworth Riverside Quarter
Freehold land of approximately 20,531 sqm situated at south bank of River Thames, London for a proposed residential and commercial development of 510 residential units and ancillary office and retail space of a total of approximately 32,236 sqm of gross floor area for sale.– 7 Riverside Quarter– 9 Riverside Quarter
90–
1st Quarter 20171st Quarter 2020
80.080.0
Vauxhall Sky Gardens
Freehold land of approximately 1,700 sqm situated at Vauxhall, London. The 36 storey tower development has a gross floor area of approximately 21,000 sqm and consists of approximately 237 private apartments and affordable units.
70 2nd Quarter 2017 80.0
Camberwell Green Freehold land of approximately 2,310 sqm situated at 1 – 6 Camberwell Green and 307 – 311 Camberwell New Road SE5, London. The development consists of 92 private apartments, 9 share ownership units and commercial.
75 1st Quarter 2017 80.0
Brown Street project
Freehold land of approximately 3,157 sqm situated at Brown Street, Glasgow.
– – 80.0
Baildon project Freehold land of approximately 5,870 sqm situated at Baildon.
– – 80.0
PARTICULARS OF GROUP PROPERTIESAS AT 30 SEPTEMBER 2016

FR
AS
ER
S C
EN
TR
EP
OIN
T L
IMIT
ED
& S
UB
SID
IAR
IES
326
INTERESTED PERSON TRANSACTIONS
Particulars of interested person transactions ("IPTs") for the period from 1 October 2015 to 30 September 2016 as required under Rule 907 of the SGX Listing Manual are set out below.
Aggregate value of all IPTs during the financial Aggregate value of all
year under review IPTs conducted during(excluding transactions the financial yearless than $100,000 and under review undertransactions conducted shareholders' mandate
under shareholders' pursuant to Rule 920mandate pursuant (excluding transactions
to Rule 920) less than $100,000)Name of interested person $’000 $’000
TCC Group of Companies (1)
– Purchase of products and obtaining of services – 16,748
– Lease of retail/office/hotel space 245 4,823
– Extension of loans and interest charged – 2,580
– Acquisition of interest in an associate 198,853 –
– Issue of units in FLT 79,999 –
Frasers Hospitality Trust– Provision of services – 120
Lim Ee Seng, Group Chief Executive Officer– Issue of FCL Fixed Rate Notes due April 2026 500 –
Note :
(1) This refers to the companies and entities in the TCC Group which are controlled by Mr Charoen Sirivadhanabhakdi and Khunying Wanna Sirivadhanabhakdi.
MATERIAL CONTRACTS (RULE 1207 (8) OF THE SGX LISTING MANUAL)
There were no material contracts entered into by the Company or any of its subsidiaries involving the interests of any Director or controlling shareholder of the Company during the financial year under review, save as disclosed above and in this Annual Report.

AN
NU
AL
RE
PO
RT
20
16
327
SHAREHOLDING STATISTICS AS AT 13 DECEMBER 2016
Class of Shares – Ordinary sharesVoting Rights – One vote per share
DISTRIBUTION OF SHAREHOLDERS BY SIZE OF SHAREHOLDINGS
Size of HoldingNo. of
Shareholders %No. of Shares %
1 – 99 66 0.82 2,038 0.00100 – 1,000 429 5.33 295,059 0.011,001 – 10,000 5,099 63.38 25,547,209 0.8810,001 – 1,000,000 2,428 30.18 137,038,296 4.731,000,001 and above 23 0.29 2,737,113,842 94.38TOTAL 8,045 100.00 2,899,996,444 100.00
TWENTY LARGEST SHAREHOLDERS(AS SHOWN IN THE REGISTER OF MEMBERS AND DEPOSITORY REGISTER)
No. Shareholder's NameNo. of
Shares Held %*
1 DBS Nominees Pte Ltd 877,241,411 30.252 United Overseas Bank Nominees Pte Ltd 862,445,922 29.743 InterBev Investment Limited 824,847,644 28.444 Citibank Nominees Singapore Pte Ltd 82,170,665 2.835 DBS Vickers Securities (Singapore) Pte Ltd 20,973,720 0.726 HSBC (Singapore) Nominees Pte Ltd 13,180,320 0.457 Raffles Nominees (Pte) Ltd 13,109,942 0.458 UOB Kay Hian Pte Ltd 10,885,196 0.389 Lee Seng Tee 5,000,000 0.1710 Phay Thong Huat Pte Ltd 3,618,000 0.1211 DB Nominees (Singapore) Pte Ltd 3,073,730 0.1112 Lim Ee Seng 2,799,954 0.1013 CIMB Securities (Singapore) Pte Ltd 2,304,741 0.0814 The Titular Roman Catholic Archbishop of Kuala Lumpur 2,013,440 0.0715 Maybank Kim Eng Securities Pte Ltd 1,943,577 0.0716 Choo Meileen 1,812,130 0.0617 Chee Swee Cheng & Co Pte Ltd 1,693,220 0.0618 OCBC Securities Private Ltd 1,671,380 0.0619 OCBC Nominees Singapore Pte Ltd 1,521,320 0.0520 Phillip Securities Pte Ltd 1,355,218 0.05
TOTAL 2,733,661,530 94.26
Note:
* Percentage is based on 2,899,996,444 shares as at 13 December 2016. There are no Treasury Shares as at 13 December 2016.

FR
AS
ER
S C
EN
TR
EP
OIN
T L
IMIT
ED
& S
UB
SID
IAR
IES
328
SHAREHOLDING STATISTICS AS AT 13 DECEMBER 2016
SUBSTANTIAL SHAREHOLDERS (AS SHOWN IN THE REGISTER OF SUBSTANTIAL SHAREHOLDERS)
Direct Interest Deemed InterestNo. of Shares %* No. of Shares %*
TCC Assets Limited 1,716,160,124 59.18 – –InterBev Investment Limited 824,847,644 28.44 – –International Beverage Holdings Limited (1) – – 824,847,644 28.44Thai Beverage Public Company Limited (2) – – 824,847,644 28.44Siriwana Company Limited (3) – – 824,847,644 28.44MM Group Limited (4) – – 824,847,644 28.44Maxtop Management Corp. (4) – – 824,847,644 28.44Risen Mark Enterprise Ltd. (4) – – 824,847,644 28.44Golden Capital (Singapore) Limited (4) – – 824,847,644 28.44Charoen Sirivadhanabhakdi (5) – – 2,541,007,768 87.62Khunying Wanna Sirivadhanabhakdi (5) – – 2,541,007,768 87.62
To the best of the Company’s knowledge and based on records of the Company as at 13 December 2016, approximately 12%* of the issued shares of the Company are held in the hands of the public and this complies with Rule 723 of the Listing Manual.
Notes:
* Percentage is based on 2,899,996,444 shares as at 13 December 2016. There are no Treasury Shares as at 13 December 2016.
(1) International Beverage Holdings Limited (“IBHL”) holds a 100% direct interest in InterBev Investment Limited (“IBIL”) and is therefore deemed to be interested in all of the shares of Frasers Centrepoint Limited (“FCL”) in which IBIL has an interest.
(2) Thai Beverage Public Company Limited (“ThaiBev”) holds a 100% direct interest in IBHL, which in turn holds a 100% direct interest in IBIL. ThaiBev is therefore deemed to be interested in all of the shares of FCL in which IBIL has an interest.
(3) Siriwana Company Limited holds an approximately 45.27% direct interest in ThaiBev;
– ThaiBev holds a 100% direct interest in IBHL; and – IBHL holds a 100% direct interest in IBIL.
Siriwana Company Limited is therefore deemed to be interested in all of the shares of FCL in which IBIL has an interest.
(4) MM Group Limited (“MM Group”) holds a 100% direct interest in each of Maxtop Management Corp. (“Maxtop”), Risen Mark Enterprise Ltd. (“RM”) and Golden Capital (Singapore) Limited (“GC”);
– Maxtop holds a 17.23% direct interest in ThaiBev; – RM holds a 3.32% direct interest in ThaiBev; – GC holds a 0.06% direct interest in ThaiBev. – ThaiBev holds a 100% direct interest in IBHL; and – IBHL holds a 100% direct interest in IBIL.
MM Group is therefore deemed to be interested in all of the shares of FCL in which IBIL has an interest.
(5) Each of Charoen Sirivadhanabhakdi and his spouse, Khunying Wanna Sirivadhanabhakdi, owns 50% of the issued and paid-up share capital of TCC Assets Limited (“TCCA”), and is therefore deemed to be interested in all of the shares of FCL in which TCCA has an interest.
Charoen Sirivadhanabhakdi and Khunying Wanna Sirivadhanabhakdi also jointly hold:
– a 51% direct interest in Siriwana Company Limited, which in turn holds an approximate 45.27% direct interest in ThaiBev; and – a 100% direct interest in MM Group. MM Group holds a 100% direct interest in each of Maxtop, RM and GC. Maxtop holds a 17.23% direct
interest in ThaiBev; RM holds a 3.32% direct interest in ThaiBev; and GC holds a 0.06% direct interest in ThaiBev.
ThaiBev holds a 100% direct interest in IBHL, which in turn holds a 100% direct interest in IBIL. Each of Charoen Sirivadhanabhakdi and Khunying Wanna Sirivadhanabhakdi is therefore deemed to be interested in all of the shares of FCL in which IBIL has an interest.

AN
NU
AL
RE
PO
RT
20
16
329
FRASERS CENTREPOINT LIMITED(Incorporated in Singapore)(Company Registration No. 196300440G)
NOTICE OF ANNUAL GENERAL MEETINGDate : 24 January 2017 Place : Ballrooms II and III, Level 2, InterContinental Singapore, 80 Middle Road, Singapore 188966
NOTICE IS HEREBY GIVEN that the 53rd Annual General Meeting of FRASERS CENTREPOINT LIMITED (the “Company”) will be held at Ballrooms II and III, Level 2, InterContinental Singapore, 80 Middle Road, Singapore 188966 on Tuesday, 24 January 2017 at 2.00 p.m. for the following purposes:
ROUTINE BUSINESS
(1) To receive and adopt the Directors’ statement and audited financial statements for the year ended 30 September 2016 and the auditors’ report thereon.
(2) To approve a final tax-exempt (one-tier) dividend of 6.2 cents per share in respect of the year ended 30 September 2016.
(3) To pass the following resolutions on the recommendation of the Nominating Committee and endorsement of the Board of Directors in respect of appointment of Directors (see note (a) of the explanatory notes):
(a) “That Mr Philip Eng Heng Nee, who will retire by rotation pursuant to article 94 of the Constitution of the Company and who, being eligible, has offered himself for re-election, be and is hereby re-appointed as a Director of the Company.”
Subject to his re-appointment, Mr Eng, who is considered an independent Director, will be re-appointed as the Chairman of the Remuneration Committee and a member of the Audit Committee.
(b) “That Mr Charles Mak Ming Ying, who will retire by rotation pursuant to article 94 of the Constitution of the Company and who, being eligible, has offered himself for re-election, be and is hereby re-appointed as a Director of the Company.”
Subject to his re-appointment, Mr Mak, who is considered an independent Director, will be re-appointed as the Vice Chairman of the Board Executive Committee, the Chairman of the Audit Committee, a member of the Risk Management Committee, a member of the Nominating Committee and a member of the Remuneration Committee.
(c) “That Mr Wee Joo Yeow, who will retire by rotation pursuant to article 94 of the Constitution of the Company and who, being eligible, has offered himself for re-election, be and is hereby re-appointed as a Director of the Company.”
Subject to his re-appointment, Mr Wee, who is considered an independent Director, will be re-appointed as a member of the Board Executive Committee and a member of the Audit Committee.
(d) “That Mr Sithichai Chaikriangkrai, who will retire by rotation pursuant to article 94 of the Constitution of the Company and who, being eligible, has offered himself for re-election, be and is hereby re-appointed as a Director of the Company.”
Subject to his re-appointment, Mr Sithichai will be re-appointed as a member of the Board Executive Committee, a member of the Risk Management Committee and a member of the Audit Committee.
NOTICE OF ANNUAL GENERAL MEETING

FR
AS
ER
S C
EN
TR
EP
OIN
T L
IMIT
ED
& S
UB
SID
IAR
IES
330
(4) To approve Directors’ fees of up to S$2,000,000 payable by the Company for the year ending 30 September 2017 (last year: up to S$2,000,000).
(5) To re-appoint KPMG LLP as the auditors of the Company, and to authorise the Directors to fix their remuneration.
SPECIAL BUSINESS
To consider and, if thought fit, to pass, with or without modifications, the following resolutions, which will be proposed as Ordinary Resolutions:
(6) “That authority be and is hereby given to the Directors of the Company to:
(a) (i) issue shares of the Company (“shares”) whether by way of rights, bonus or otherwise; and/or
(ii) make or grant offers, agreements or options (collectively, “Instruments”) that might or would require shares to be issued, including but not limited to the creation and issue of (as well as adjustments to) warrants, debentures or other instruments convertible into shares,
at any time and upon such terms and conditions and for such purposes and to such persons as the Directors may in their absolute discretion deem fit; and
(b) (notwithstanding the authority conferred by this Resolution may have ceased to be in force) issue shares in pursuance of any Instrument made or granted by the Directors while this Resolution was in force,
provided that:
(1) the aggregate number of shares to be issued pursuant to this Resolution (including shares to be issued in pursuance of Instruments made or granted pursuant to this Resolution) does not exceed 50% of the total number of issued shares, excluding treasury shares (as calculated in accordance with sub-paragraph (2) below), of which the aggregate number of shares to be issued other than on a pro rata basis to shareholders of the Company (including shares to be issued in pursuance of Instruments made or granted pursuant to this Resolution) shall not exceed 20% of the total number of issued shares, excluding treasury shares (as calculated in accordance with sub-paragraph (2) below);
(2) (subject to such manner of calculation as may be prescribed by the Singapore Exchange Securities Trading Limited (the “SGX-ST”)) for the purpose of determining the aggregate number of shares that may be issued under sub-paragraph (1) above, the percentage of issued shares shall be based on the total number of issued shares, excluding treasury shares, at the time this Resolution is passed, after adjusting for:
(i) new shares arising from the conversion or exercise of any convertible securities or share options or vesting of share awards which are outstanding or subsisting at the time this Resolution is passed; and
(ii) any subsequent bonus issue, consolidation or subdivision of shares;
(3) in exercising the authority conferred by this Resolution, the Company shall comply with the provisions of the Listing Manual of the SGX-ST for the time being in force (unless such compliance has been waived by the SGX-ST) and the Constitution for the time being of the Company; and
NOTICE OF ANNUAL GENERAL MEETING

AN
NU
AL
RE
PO
RT
20
16
331
(4) (unless revoked or varied by the Company in general meeting) the authority conferred by this Resolution shall continue in force until the conclusion of the next Annual General Meeting of the Company or the date by which the next Annual General Meeting of the Company is required by law to be held, whichever is the earlier.”
(7) “That authority be and is hereby given to the Directors of the Company to:
(a) grant awards in accordance with the provisions of the FCL Restricted Share Plan (the “Restricted Share Plan”) and/or the FCL Performance Share Plan (the “Performance Share Plan”); and
(b) allot and issue such number of ordinary shares of the Company as may be required to be delivered pursuant to the vesting of awards under the Restricted Share Plan and/or the Performance Share Plan,
provided that the aggregate number of new ordinary shares allotted and issued and/or to be allotted and issued, when aggregated with existing ordinary shares (including shares held in treasury) delivered and/or to be delivered, pursuant to the Restricted Share Plan and the Performance Share Plan, shall not exceed 10% of the total number of issued ordinary shares of the Company, excluding treasury shares, from time to time.”
(8) “That:
(a) approval be and is hereby given, for the purposes of Chapter 9 of the Listing Manual (“Chapter 9”) of the Singapore Exchange Securities Trading Limited, for the Company, its subsidiaries and associated companies that are considered to be “entities at risk” under Chapter 9, or any of them, to enter into any of the transactions falling within the types of Mandated Transactions described in Appendix 1 to the Letter to Shareholders dated 5 January 2017 (the “Letter”), with any party who is of the class of Mandated Interested Persons described in Appendix 1 to the Letter, provided that such transactions are made on normal commercial terms and in accordance with the review procedures for such Mandated Transactions (the “IPT Mandate”);
(b) the IPT Mandate shall, unless revoked or varied by the Company in general meeting, continue in force until the conclusion of the next Annual General Meeting of the Company; and
(c) the Directors of the Company and/or any of them be and are hereby authorised to complete and do all such acts and things (including executing all such documents as may be required) as they and/or he may consider expedient or necessary or in the interests of the Company to give effect to the IPT Mandate and/or this Resolution.”
(9) “That:
(a) for the purposes of Sections 76C and 76E of the Companies Act, Chapter 50 (the “Companies Act”), the exercise by the Directors of the Company of all the powers of the Company to purchase or otherwise acquire issued ordinary shares of the Company (“Shares”) not exceeding in aggregate the Maximum Percentage (as hereafter defined), at such price or prices as may be determined by the Directors from time to time up to the Maximum Price (as hereafter defined), whether by way of:
(i) market purchase(s) on the Singapore Securities Exchange Trading Limited (the “SGX-ST”) transacted through the SGX-ST trading system and/or any other securities exchange on which the Shares may for the time being be listed and quoted (“Other Exchange”); and/or
(ii) off-market purchase(s) (if effected otherwise than on the SGX-ST or, as the case may be, Other Exchange) in accordance with any equal access scheme(s) as may be determined or formulated by the Directors as they consider fit, which scheme(s) shall satisfy all the conditions prescribed by the Companies Act,
NOTICE OF ANNUAL GENERAL MEETING

FR
AS
ER
S C
EN
TR
EP
OIN
T L
IMIT
ED
& S
UB
SID
IAR
IES
332
and otherwise in accordance with all other laws and regulations and rules of the SGX-ST or, as the case may be, Other Exchange as may for the time being be applicable, be and is hereby authorised and approved generally and unconditionally (the “Share Purchase Mandate”);
(b) unless varied or revoked by the Company in general meeting, the authority conferred on the Directors of the Company pursuant to the Share Purchase Mandate may be exercised by the Directors at any time and from time to time during the period commencing from the date of the passing of this Resolution and expiring on the earliest of:
(i) the date on which the next Annual General Meeting of the Company is held;
(ii) the date by which the next Annual General Meeting of the Company is required by law to be held; and
(iii) the date on which purchases and acquisitions of Shares pursuant to the Share Purchase Mandate are carried out to the full extent mandated;
(c) in this Resolution:
“Average Closing Price” means the average of the closing market prices of a Share over the five consecutive market days on which the Shares are transacted on the SGX-ST or, as the case may be, Other Exchange, immediately preceding the date of the market purchase by the Company or, as the case may be, the date of the making of the offer pursuant to the off-market purchase, and deemed to be adjusted, in accordance with the listing rules of the SGX-ST, for any corporate action that occurs after the relevant five-day period;
“date of the making of the offer” means the date on which the Company makes an offer for the purchase or acquisition of Shares from holders of Shares, stating therein the relevant terms of the equal access scheme for effecting the off-market purchase;
“Maximum Percentage” means that number of issued Shares representing 2% of the issued Shares as at the date of the passing of this Resolution (excluding any Shares which are held as treasury shares as at that date); and
“Maximum Price” in relation to a Share to be purchased or acquired, means the purchase price (excluding related brokerage, commission, applicable goods and services tax, stamp duties, clearance fees and other related expenses) which shall not exceed 105% of the Average Closing Price of the Shares; and
(d) the Directors of the Company and/or any of them be and are hereby authorised to complete and do all such acts and things (including executing all such documents as may be required) as they and/or he may consider expedient or necessary or in the interests of the Company to give effect to the transactions contemplated and/or authorised by this Resolution.”
By Order of the BoardCatherine YeoCompany Secretary
Singapore, 5 January 2017
NOTICE OF ANNUAL GENERAL MEETING

AN
NU
AL
RE
PO
RT
20
16
333
Notes:
1. (a) A member who is not a relevant intermediary is entitled to appoint not more than two proxies to attend, speak and vote at the meeting. Where such member’s form of proxy appoints more than one proxy, the proportion of his shareholding concerned to be represented by each proxy shall be specified in the form of proxy.
(b) A member who is a relevant intermediary is entitled to appoint more than two proxies to attend, speak and vote at the meeting, but each proxy must be appointed to exercise the rights attached to a different share or shares held by such member. Where such member’s form of proxy appoints more than two proxies, the number and class of shares in relation to which each proxy has been appointed shall be specified in the form of proxy.
“Relevant intermediary” has the meaning ascribed to it in Section 181 of the Companies Act, Chapter 50.
2. A proxy need not be a member of the Company.
3. The instrument appointing a proxy or proxies (a form is enclosed) must be deposited at the Share Registration Office of the Company at Tricor Barbinder Share Registration Services (a division of Tricor Singapore Pte. Ltd.), 80 Robinson Road #11-02, Singapore 068898, not less than 72 hours before the time appointed for holding the meeting.
Explanatory notes:
(a) Detailed information on the Directors who are proposed to be re-appointed can be found under “Board of Directors” and “Corporate Governance” in the Company’s Annual Report 2016.
(b) The Ordinary Resolution proposed in item (6) above is to authorise the Directors of the Company from the date of the Annual General Meeting until the next Annual General Meeting to issue shares and/or make or grant instruments that might require shares to be issued, and to issue shares in pursuance of such instruments, up to a limit of 50% of the total number of issued shares of the Company, excluding treasury shares, with a sub-limit of 20% for issues other than on a pro rata basis, calculated as described in the Resolution.
(c) The Ordinary Resolution proposed in item (7) above is to authorise the Directors of the Company to offer and grant awards and to issue ordinary shares of the Company pursuant to the FCL Restricted Share Plan (the “Restricted Share Plan”) and the FCL Performance Share Plan (the “Performance Share Plan”) provided that the aggregate number of new ordinary shares allotted and issued and/or to be allotted and issued, when aggregated with existing ordinary shares (including shares held in treasury) delivered and/or to be delivered, pursuant to the Restricted Share Plan and the Performance Share Plan, shall not exceed 10% of the total number of issued ordinary shares of the Company, excluding treasury shares, over the 10-year duration of the Restricted Share Plan and the Performance Share Plan.
(d) The Ordinary Resolution proposed in item (8) above is to renew the mandate to enable the Company, its subsidiaries and associated companies that are considered to be “entities at risk” under Chapter 9 of the Listing Manual, or any of them, to enter into certain interested person transactions with specified classes of interested persons, as described in the Letter to Shareholders dated 5 January 2017 (the “Letter”). Please refer to the Letter for more details.
NOTICE OF ANNUAL GENERAL MEETING

FR
AS
ER
S C
EN
TR
EP
OIN
T L
IMIT
ED
& S
UB
SID
IAR
IES
334
(e) The Ordinary Resolution proposed in item (9) above is to renew the mandate to allow the Company to purchase or otherwise acquire its issued ordinary shares, on the terms and subject to the conditions set out in the Resolution.
The Company intends to use internal resources or external borrowings or a combination of both to finance the purchase or acquisition of its ordinary shares. The amount of financing required for the Company to purchase or acquire its ordinary shares, and the impact on the Company’s financial position cannot be ascertained as at the date of this Notice as these will depend on the number of ordinary shares purchased or acquired, whether the purchase or acquisition is made out of capital or profits, and the price at which such ordinary shares were purchased or acquired and whether the ordinary shares purchased or acquired are held in treasury or cancelled.
Purely for illustrative purposes only, the financial effects of an assumed purchase or acquisition of 57,999,928 ordinary shares on 13 December 2016 (the “Latest Practicable Date”), representing 2% of the issued ordinary shares (excluding treasury shares) as at that date, at the maximum price of S$1.62 for one ordinary share (being the price equivalent to 5% above the average of the closing market prices of the ordinary shares for the five consecutive market days on which the ordinary shares were traded on the Singapore Exchange Securities Trading Limited immediately preceding the Latest Practicable Date), in the case of a market purchase and an off-market purchase respectively, based on the audited financial statements of the Company and its subsidiaries for the financial year ended 30 September 2016 and certain assumptions, are set out in paragraph 3.7 of the Letter.
Please refer to the Letter for more details.
Personal data privacy:
By submitting an instrument appointing a proxy(ies) and/or representative(s) to attend, speak and vote at the Annual General Meeting (“AGM”) and/or any adjournment thereof, a member of the Company (i) consents to the collection, use and disclosure of the member’s personal data by the Company (or its agents or service providers) for the purpose of the processing, administration and analysis by the Company (or its agents or service providers) of proxies and representatives appointed for the AGM (including any adjournment thereof) and the preparation and compilation of the attendance lists, minutes and other documents relating to the AGM (including any adjournment thereof), and in order for the Company (or its agents or service providers) to comply with any applicable laws, listing rules, take-over rules, regulations and/or guidelines (collectively, the “Purposes”), (ii) warrants that where the member discloses the personal data of the member’s proxy(ies) and/or representative(s) to the Company (or its agents or service providers), the member has obtained the prior consent of such proxy(ies) and/or representative(s) for the collection, use and disclosure by the Company (or its agents or service providers) of the personal data of such proxy(ies) and/or representative(s) for the Purposes, and (iii) agrees that the member will indemnify the Company in respect of any penalties, liabilities, claims, demands, losses and damages as a result of the member’s breach of warranty.
NOTICE OF ANNUAL GENERAL MEETING

FRASERS CENTREPOINT LIMITED(Company Registration No. 196300440G)(Incorporated in Singapore)
PROXY FORMANNUAL GENERAL MEETING
IMPORTANT
1. Relevant intermediaries as defined in Section 181 of the Companies Act, Chapter 50 may appoint more than two proxies to attend, speak and vote at the Annual General Meeting.
2. For CPF/SRS investors who have used their CPF/SRS monies to buy shares in Frasers Centrepoint Limited, this form of proxy is not valid for use and shall be ineffective for all intents and purposes if used or purported to be used by them. CPF/SRS investors should contact their respective Agent Banks/SRS Operators if they have any queries regarding their appointment as proxies.
3. By submitting an instrument appointing a proxy(ies) and/or representative(s), the member accepts and agrees to the personal data privacy terms set out in the Notice of Annual General Meeting dated 5 January 2017.
I/We ________________________________________ (Name) ____________________________________ (NRIC/Passport/Co Reg Number)
of ______________________________________________________________________________________________________________ (Address)
being a member/members of Frasers Centrepoint Limited (the “Company”), hereby appoint:
Name Address NRIC/Passport Number
Proportion ofShareholdings
No. of Shares %
and/or (delete as appropriate)
Name Address NRIC/Passport Number
Proportion ofShareholdings
No. of Shares %
or failing him/them, the Chairman of the Annual General Meeting (“AGM”) as my/our proxy/proxies to attend, speak and vote for me/us on my/our behalf at the AGM of the Company to be held at 2.00 p.m. on 24 January 2017 at Ballrooms II and III, Level 2, InterContinental Singapore, 80 Middle Road, Singapore 188966, and at any adjournment thereof. I/We direct my/our proxy/proxies to vote for or against the resolutions to be proposed at the AGM as indicated below. If no specific direction as to voting is given, the proxy/proxies may vote or abstain from voting at his/their discretion, as he/they may on any other matter arising at the AGM.
NO. RESOLUTIONS RELATING TO:No. of Votes
For*No. of Votes
Against*ROUTINE BUSINESS
1. To receive and adopt the Directors’ statement and audited financial statements for the year ended 30 September 2016 and the auditors’ report thereon.
2. To approve a final tax-exempt (one-tier) dividend of 6.2 cents per share in respect of the year ended 30 September 2016.
3. (a) To re-appoint Director: Mr Philip Eng Heng Nee(b) To re-appoint Director: Mr Charles Mak Ming Ying(c) To re-appoint Director: Mr Wee Joo Yeow(d) To re-appoint Director: Mr Sithichai Chaikriangkrai
4. To approve Directors’ fees of up to S$2,000,000 payable by the Company for the year ending 30 September 2017 (last year: up to S$2,000,000).
5. To re-appoint KPMG LLP as the auditors of the Company and to authorise the Directors to fix their remuneration.SPECIAL BUSINESS
6. To authorise Directors to issue shares and to make or grant convertible instruments.7. To authorise Directors to grant awards and to allot and issue shares pursuant to the
FCL Restricted Share Plan and/or the FCL Performance Share Plan.8. To approve the proposed renewal of the mandate for interested person transactions.9. To approve the proposed renewal of the share purchase mandate.
* Voting will be conducted by poll. If you wish to exercise all your votes “For” or “Against” the relevant resolution, please tick (ü) within the relevant box provided. Alternatively, if you wish to exercise your votes both “For” and “Against” the relevant resolution, please indicate the number of shares in the boxes provided.
Dated this _____________ day of _____________________ 2017.
Total Number of Shares held (Note 1)
Signature(s) of Member(s) or Common Seal
IMPORTANT: PLEASE READ NOTES OVERLEAF

NOTES TO PROXY FORM:1. If the member has shares entered against his name in the Depository Register (maintained by The Central Depository (Pte) Limited), he should insert that number
of shares. If the member has shares registered in his name in the Register of Members (maintained by or on behalf of the Company), he should insert that number of shares. If the member has shares entered against his name in the Depository Register and registered in his name in the Register of Members, he should insert the aggregate number of shares. If no number is inserted, this form of proxy will be deemed to relate to all the shares held by the member.
2. (a) A member who is not a relevant intermediary is entitled to appoint not more than two proxies to attend, speak and vote at the meeting. Where such member’s form of proxy appoints more than one proxy, the proportion of his shareholding concerned to be represented by each proxy shall be specified in the form of proxy.
(b) A member who is a relevant intermediary is entitled to appoint more than two proxies to attend, speak and vote at the meeting, but each proxy must be appointed to exercise the rights attached to a different share or shares held by such member. Where such member’s form of proxy appoints more than two proxies, the number and class of shares in relation to which each proxy has been appointed shall be specified in the form of proxy.
“Relevant intermediary” has the meaning ascribed to it in Section 181 of the Companies Act, Chapter 50.3. A proxy need not be a member of the Company.4. The instrument appointing a proxy or proxies must be deposited at the Share Registration Office of the Company at Tricor Barbinder Share Registration Services
(a division of Tricor Singapore Pte. Ltd.), 80 Robinson Road #11-02, Singapore 068898, not less than 72 hours before the time appointed for holding the meeting.5. Completion and return of this instrument appointing a proxy or proxies shall not preclude a member from attending and voting at the meeting. Any appointment
of a proxy or proxies shall be deemed to be revoked if a member attends the meeting in person, and in such event, the Company reserves the right to refuse to admit any person or persons appointed under the instrument of proxy, to the meeting.
6. The instrument appointing a proxy or proxies must be under the hand of the appointor or of his attorney duly authorised in writing. Where the instrument appointing a proxy or proxies is executed by a corporation, it must be executed either under its common seal or under the hand of its attorney or a duly authorised officer.
7. Where an instrument appointing a proxy or proxies is signed on behalf of the appointor by an attorney, the letter or power of attorney or a duly certified copy thereof must (failing previous registration with the Company) be lodged with the instrument of proxy, failing which the instrument may be treated as invalid.
8. The Company shall be entitled to reject an instrument appointing a proxy or proxies which is incomplete, improperly completed, illegible or where the true intentions of the appointor are not ascertainable from the instructions of the appointor specified in the instrument (including any related attachment). In addition, in the case of a member whose shares are entered in the Depository Register, the Company may reject an instrument appointing a proxy or proxies if the member, being the appointor, is not shown to have shares entered against his name in the Depository Register as at 72 hours before the time appointed for holding the meeting, as certified by The Central Depository (Pte) Limited to the Company.
AffixPostageStamp
THE COMPANY SECRETARYFRASERS CENTREPOINT LIMITED
c/o Tricor Barbinder Share Registration Services(A division of Tricor Singapore Pte. Ltd.)
80 Robinson Road #11-02Singapore 068898
fold and seal here
fold here
fold here


FRASERS CENTREPOINT LIMITEDCompany Registration Number: 196300440G
438 Alexandra Road#21-00 Alexandra PointSingapore 119958
Phone: +65 6276 4882Fax: +65 6276 6328
fraserscentrepoint.com