FN-444 Chapter 12
36
Solutions to Questions - Chapter 12 Financial Leverage and Financing Alternatives Question 12-1 What is financial leverage? Why is a one-year measure of return on investment inadequate in determining whether positive or negative financial leverage exists? Financial leverage is defined as benefits that may result to an investor by borrowing money at a rate of interest that is lower than the expected rate of return on total funds invested in a property. To determine whether leverage is positive (favorable) or negative (unfavorable), the investor needs to determine whether the IRR (calculated over the entire holding period) is greater than the cost of borrowed funds. A first-year measure of return such as the overall capitalization rate can not be used because it does not explicitly consider the benefits that accrue to the investor over time from changes in income and value that do not affect the cost of debt. Question 12-2 What is the break-even mortgage interest rate (BEIR) in the context of financial leverage? Would you ever expect an investor to pay a break-even interest rate when financing a property? Why or why not? The BEIR is the maximum interest rate that could be paid on the debt before the leverage becomes unfavorable. It represents the interest rate where the leverage is neutral (neither favorable or unfavorable). The BEIR remains constant regardless of the amount borrowed (that is 60, 70, or 80 percent of the property value). An equity investor probably would not pay a break-even interest rate when financing a property because the investor just earns the same after-tax rate of return as a lender on the same project. Borrowing at the BEIR provides no risk premium to the investor. Normally, a risk premium is required because the equity investor bears the risk of variations in the performance of the property. Question 12-3 What is positive and negative financial leverage? How are returns or losses magnified as the degree of leverage increases? How does leverage on a before-tax basis differ from leverage on an after-tax basis? When the before-tax or after-tax IRR are higher with debt than without debt, we say that the investment has positive or favorable financial leverage. When returns are lower with debt than without debt we say that the investment has negative or unfavorable financial leverage. Positive leverage occurs when the unlevered IRR is greater than the interest rate paid on the debt. Negative leverage occurs when the unlevered IRR is less than the interest rate paid on the debt. Returns and losses are magnified by the greater the amount of debt, the greater the return or loss to the equity investor. Leverage on a before-tax basis differs from leverage on an after-tax basis because interest is tax deductible. Therefore, we must consider the after-tax cost of debt which is different than the before-tax cost of debt. 12-1
-
Upload
independent -
Category
Documents
-
view
6 -
download
0
Transcript of FN-444 Chapter 12
Solutions to Questions - Chapter 12Financial Leverage and Financing Alternatives
Question 12-1What is financial leverage? Why is a one-year measure of return on investment inadequate in determining whether positive or negative financial leverage exists?Financial leverage is defined as benefits that may result to an investor by
borrowing money at a rate of interest that is lower than the expected rate of return on total funds invested in a property.
To determine whether leverage is positive (favorable) or negative (unfavorable), the investor needs to determine whether the IRR (calculated over the entire holding period) is greater than the cost of borrowed funds. A first-year measure of return such as the overall capitalization rate can notbe used because it does not explicitly consider the benefits that accrue to the investor over time from changes in income and value that do not affect thecost of debt.
Question 12-2What is the break-even mortgage interest rate (BEIR) in the context of financial leverage? Would you
ever expect an investor to pay a break-even interest rate when financing a property? Why or why not?The BEIR is the maximum interest rate that could be paid on the debt before
the leverage becomes unfavorable. It represents the interest rate where the leverage is neutral (neither favorable or unfavorable).
The BEIR remains constant regardless of the amount borrowed (that is 60, 70, or 80 percent of the property value).
An equity investor probably would not pay a break-even interest rate when financing a property because the investor just earns the same after-tax rate of return as a lender on the same project. Borrowing at the BEIR
provides no risk premium to the investor. Normally, a risk premium is required because the equity investor bears the risk of variations in the performance of the property.
Question 12-3What is positive and negative financial leverage? How are returns or losses magnified as the degree of
leverage increases? How does leverage on a before-tax basis differ from leverage on an after-tax basis?When the before-tax or after-tax IRR are higher with debt than without debt, we say that the investment has positive or favorable financial leverage. When returns are lower with debt than without debt we say that the investment has negative or unfavorable financial leverage.Positive leverage occurs when the unlevered IRR is greater than the interest rate paid on the debt. Negative leverage occurs when the unlevered IRR is less than the interest rate paid on the debt.Returns and losses are magnified by the greater the amount of debt, the
greater the return or loss to the equity investor.Leverage on a before-tax basis differs from leverage on an after-tax basis
because interest is tax deductible. Therefore, we must consider the after-tax cost of debt which is different than the before-tax cost of debt.
12-1
Question 12-4In what way does leverage increase the riskiness of a loan?Leverage increases the standard deviation of return regardless of whether it
is positive or negative. This means the investment is clearly riskier when leverage is used.
Because the NOI does not change when more debt is used, increasing the amount of debt increases the debt service relative to NOI. Therefore, the debt coverage ratio (DCR) may exceed the lender’s limits. With higher loan-to- value ratios and declining debt coverage ratios, risk to the lender increases. As a result, the interest rate on additional debt will also increase.
Question 12-5What is meant by a participation loan? What does the lender participate in? Why would a lender want
to make a participation loan? Why would an investor want to obtain a participation loan?A participation loan is where in return for a lower stated interest rate on
the loan, the lender participates in some way in the income or cash flow from the property. The lender’s rate of return depends, in part, on the performance
of the property. Participations are highly negotiable and there is no standard way of structuring them.
A lender’s motivation for making a participation loan includes how risky the loan is perceived relative to a fixed interest rate loan. The lender does not participate in any losses and still receives some minimum interest rate
(unless the borrower defaults). Additionally, the participation provides the lender with somewhat of a hedge against unanticipated inflation because the NOI and resale prices for an income property often increase as a result of inflation. To some extent this protects the lender’s real rate of return.
12-2

An investors motivation is that the participation may be very little or zero for one or more years. This is because the loan is often structured so that the participation is based on income or cash flow above some specified break- even point. During this time period, the borrower will be paying less than would have been paid with a straight loan. This may be quite desirable for the investor since NOI may be lower during the first couple of years of ownership, especially ona new project that is not fully rented.
Question 12-6What is meant by a sale-leaseback? Why would a building investor want to do a sale-leaseback of the
land? What is the benefit to the party that purchases the land under a sale-leaseback?When land is already owned and is then sold to an investor with a simultaneous
agreement to lease the land from the party it is sold to, this is called a sale-leaseback of the land.
One motivation for the sale-leaseback of the land is that it is a way of obtaining 100 percent financing on the land.
A second benefit is that lease payments are 100 percent tax deductible. With a mortgage, only the interest is tax deductible. The investor may deduct the same depreciation charges whether or not the land is owned, since land cannot be depreciated. This results in the same depreciation for a smaller equity investment.
The investor may have the option of purchasing the land back at the end of thelease if it is desirable to do so.
Question 12-7Why might an investor prefer a loan with a lower interest rate and a participation?An investor’s motivation is that the participation may be very little or zero
for one or more years. This is because the loan is often structured so that the participation is based on income or cash flow above some specified break- even point. During this time period, the borrower will be paying less than would have been paid with a straight loan. This may be quite desirable for the investor since NOI may be lower during the first couple of years of ownership, especially ona new project that is not fully rented.
Question 12-8Why might a lender prefer a loan with a lower interest rate and a participation?A lender’s motivation for making a participation loan includes how risky the
loan is perceived relative to a fixed interest rate loan. The lender does not participate in any losses and still receives some minimum interest rate
(unless the borrower defaults). Additionally, the participation provides the lender with somewhat of a hedge against unanticipated inflation because the NOI and resale prices for an income property often increase as a result of inflation. To some extent this protects the lender’s real rate of return.
Question 12-9How do you think participations affect the riskiness of a loan?There is clearly some uncertainty associated with the receipt of a
participation since it depends on the performance of the property. The lender does not participate in any losses and still receives some minimum interest rate (unless the borrower defaults). Additionally, the participation provides the
12-3
lender with somewhat of a hedge against unanticipated inflation because the NOI and resale prices for an income property often increase as a result of inflation. To some extent this protects the lender’s real rate of return.
Question 12-10What is the motivation for a sale-leaseback of the land?One motivation for the sale-and-leaseback of the land is that it is a way of
obtaining 100 percent financing on the land. A second benefit is that lease payments are 100 percent tax deductible. With a mortgage, only the interest is
tax deductible. The investor may deduct the same depreciation charges whetheror not the land is owned, since land cannot be depreciated. This results in thesame depreciation for a smaller equity investment.
The investor may have the option of purchasing the land back at the end of thelease if it is desirable to do so.
Question 12-11What criteria should be used to choose between two financing alternatives?Assuming the two financing alternatives are for roughly the same amount of funds (so financial risk due to leverage is the same), the alternative with the lowest effective interest cost should be chosen. This alternative should also result in the highest IRR on equity.
12-4

Question 12-12What is the traditional cash equivalency approach to determine how below-market rate loans affect
value?Cash equivalency was introduced in Chapter 9 where it was demonstrated that a buyer would be willing to pay more for a property with a below market interestrate loan. In that chapter, the present value of interest savings was used toindicate the additional amount which might be paid for a property. This same approach could be used to determine the additional amount that might be paid for income producing properties as analyzed in this chapter.
Question 12-13How can the effect of below-market rate loans on value be determined using investor criteria?Note: This question is not explicitly covered in the chapter. It requires students to think about how concepts from earlier chapters dealing with valuation and cash equivalency might be applied to evaluate a below-market rate loan on income property.Evaluating a below-market rate loan is like comparing two financing alternatives where one is at the market rate and one has a below-market rate. All else being equal, the below market interest rate loan should result in a higher IRRE for the property than would result with a market rate loan. The investor might therefore be willing to pay more for the property, as long as the IRRE is at least as much as it would be with the market interest rate loan.
12-5
Solutions to Problems - Chapter 12Financial Leverage and Financing Alternatives
INTRODUCTION
The problems in this chapter are designed to reinforce the students’ understanding of alternative methods of structuring debt financing and how financing can affect the cash flows and the leverage of the real estate project. The conditions necessary for positive financing leverage and how the use financial leverage affectsrisk are also discussed.
The third problem extends problem 5 in chapter 10 which involved calculation of the expected return and standard deviation for an investment. In this chapter financingis added to the problem. Instructors should emphasize that the risk (measured b thestandard deviation) will always increase with leverage. However, whether the expected return increases depends on whether leverage is favorable or unfavorable.
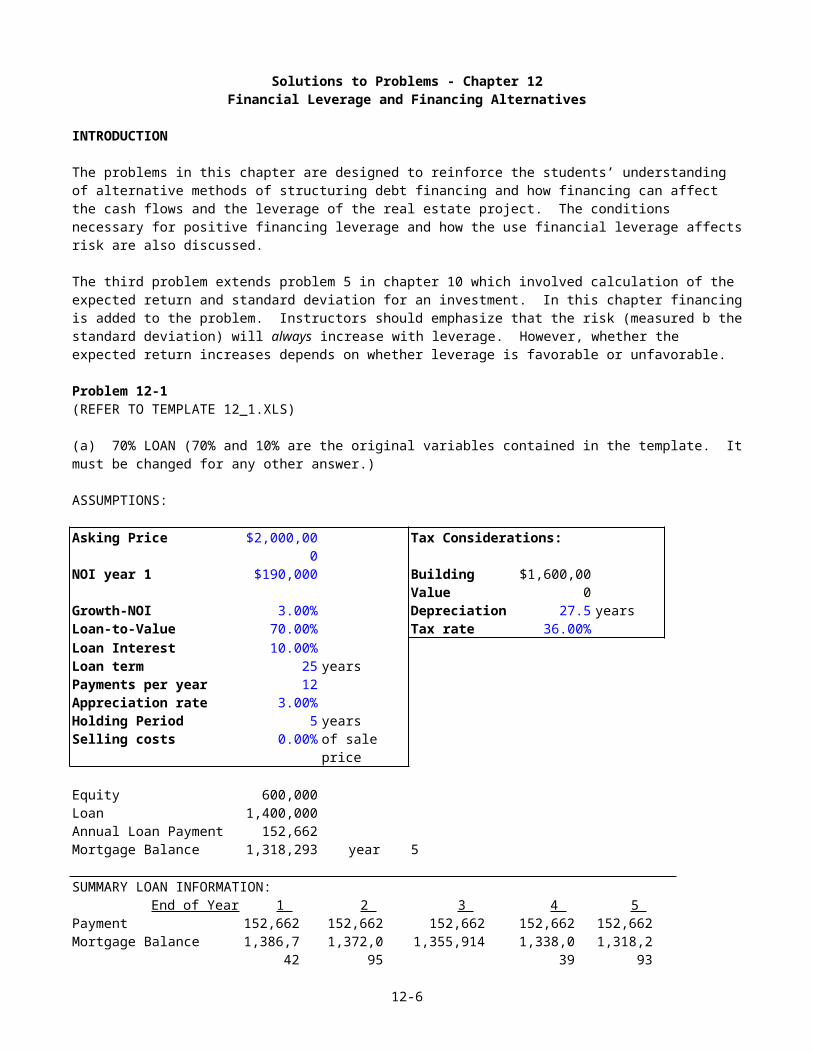
Problem 12-1(REFER TO TEMPLATE 12_1.XLS)
(a) 70% LOAN (70% and 10% are the original variables contained in the template. Itmust be changed for any other answer.)
ASSUMPTIONS:
Asking Price $2,000,000
Tax Considerations:
NOI year 1 $190,000 Building Value
$1,600,000
Growth-NOI 3.00% Depreciation 27.5 yearsLoan-to-Value 70.00% Tax rate 36.00%Loan Interest 10.00%Loan term 25 yearsPayments per year 12 Appreciation rate 3.00%Holding Period 5 yearsSelling costs 0.00% of sale
price
Equity 600,000 Loan 1,400,000 Annual Loan Payment 152,662 Mortgage Balance 1,318,293 year 5
SUMMARY LOAN INFORMATION:End of Year 1 2 3 4 5
Payment 152,662 152,662 152,662 152,662 152,662Mortgage Balance 1,386,7
421,372,0
951,355,914 1,338,0
391,318,2
93
12-6
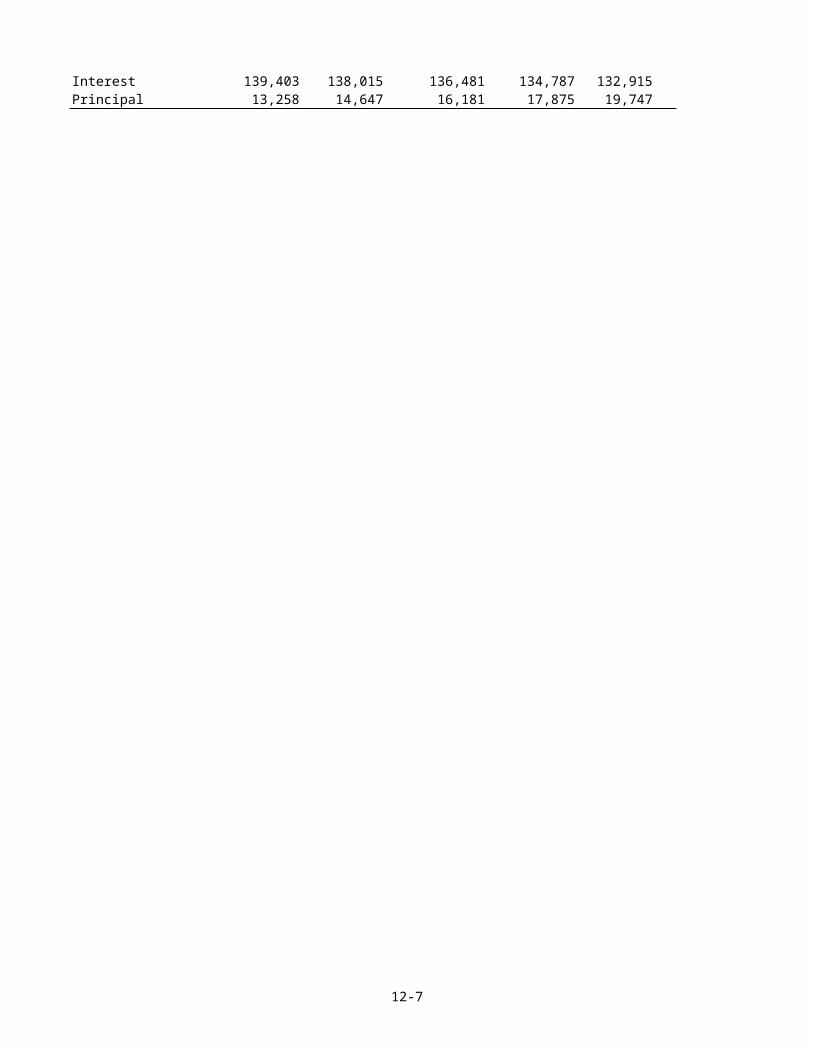
Interest 139,403 138,015 136,481 134,787 132,915Principal 13,258 14,647 16,181 17,875 19,747
12-7
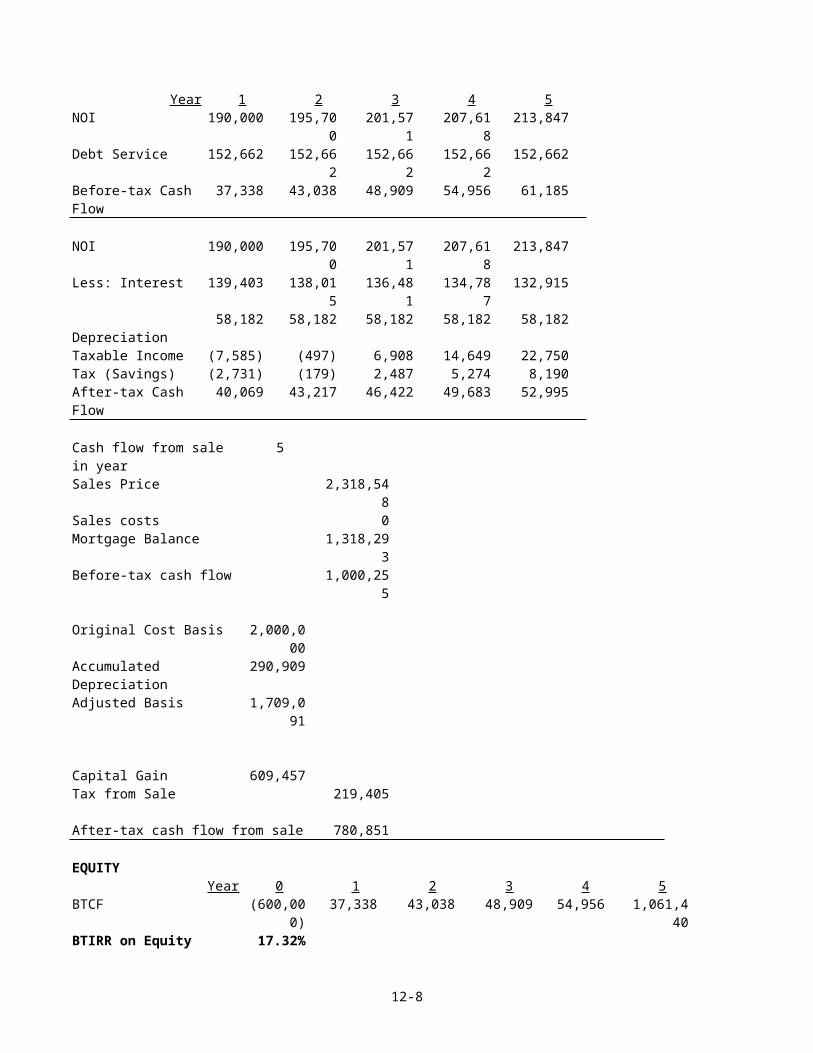
Year 1 2 3 4 5NOI 190,000 195,70
0201,57
1207,61
8213,847
Debt Service 152,662 152,662
152,662
152,662
152,662
Before-tax Cash Flow
37,338 43,038 48,909 54,956 61,185
NOI 190,000 195,700
201,571
207,618
213,847
Less: Interest 139,403 138,015
136,481
134,787
132,915
Depreciation
58,182 58,182 58,182 58,182 58,182
Taxable Income (7,585) (497) 6,908 14,649 22,750Tax (Savings) (2,731) (179) 2,487 5,274 8,190After-tax Cash Flow
40,069 43,217 46,422 49,683 52,995
Cash flow from sale in year
5
Sales Price 2,318,548
Sales costs 0Mortgage Balance 1,318,29
3Before-tax cash flow 1,000,25
5
Original Cost Basis 2,000,000
Accumulated Depreciation
290,909
Adjusted Basis 1,709,091
Capital Gain 609,457Tax from Sale 219,405
After-tax cash flow from sale 780,851
EQUITYYear 0 1 2 3 4 5
BTCF (600,000)
37,338 43,038 48,909 54,956 1,061,440
BTIRR on Equity 17.32%
12-8
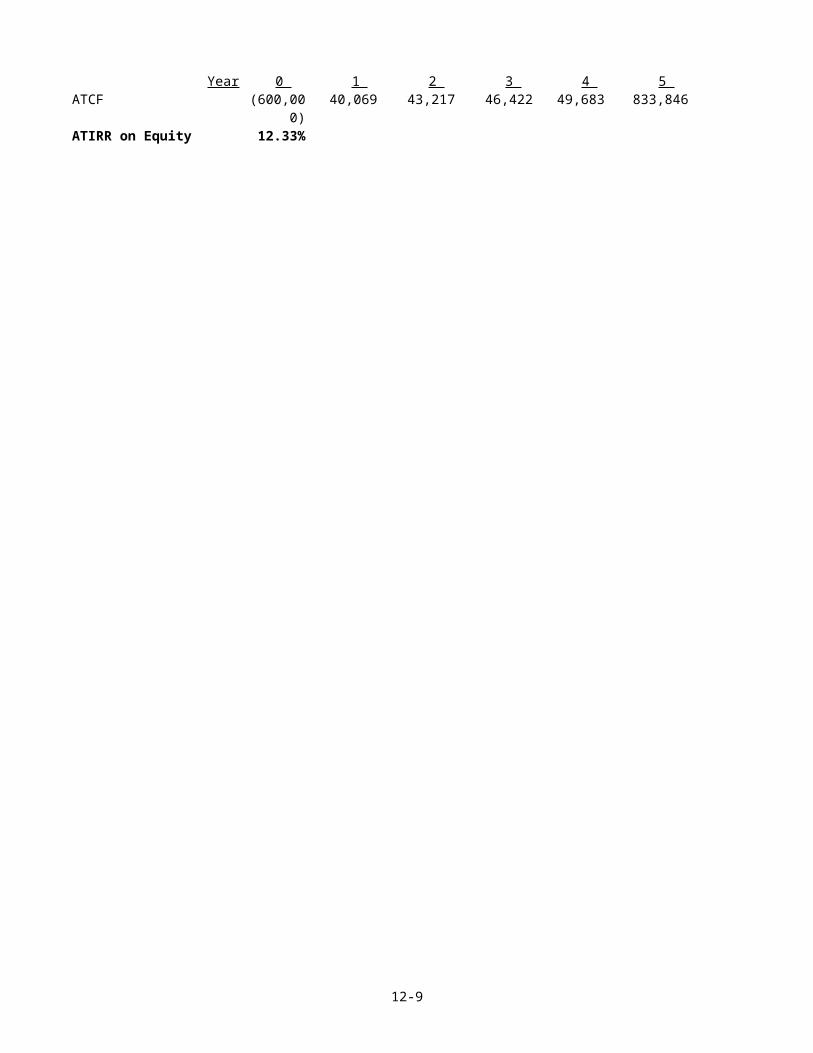
Year 0 1 2 3 4 5 ATCF (600,00
0)40,069 43,217 46,422 49,683 833,846
ATIRR on Equity 12.33%
12-9
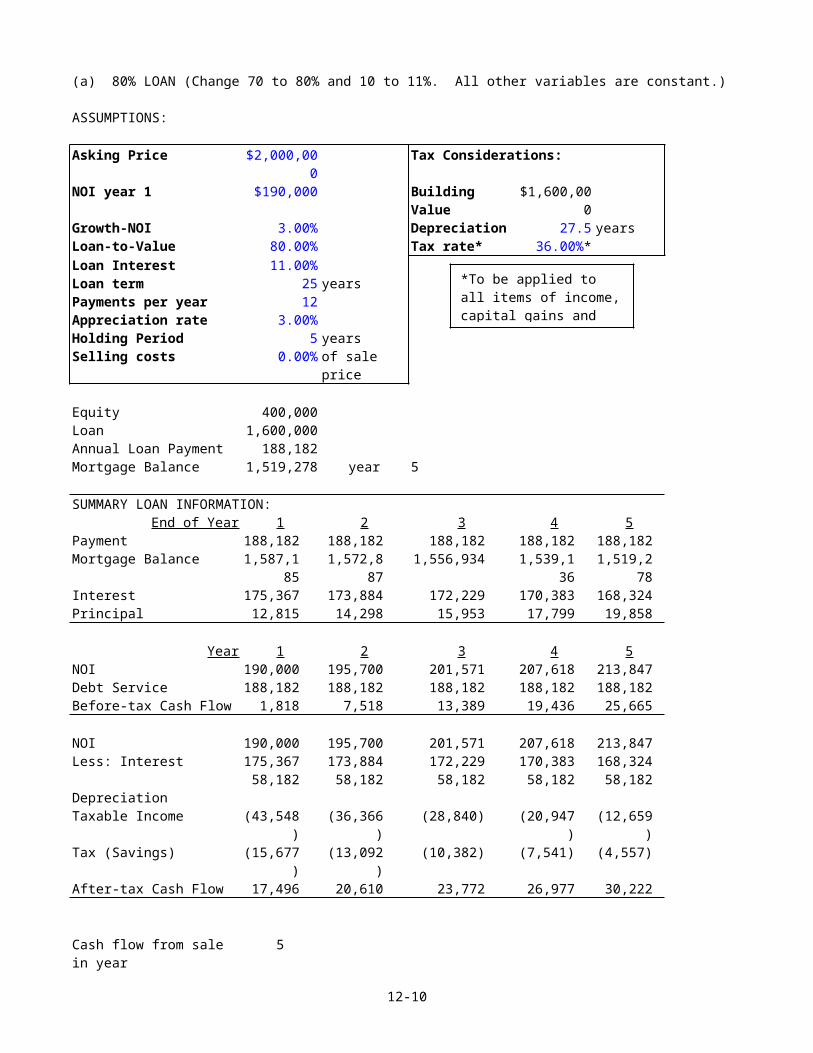
(a) 80% LOAN (Change 70 to 80% and 10 to 11%. All other variables are constant.)
ASSUMPTIONS:
Asking Price $2,000,000
Tax Considerations:
NOI year 1 $190,000 Building Value
$1,600,000
Growth-NOI 3.00% Depreciation 27.5 yearsLoan-to-Value 80.00% Tax rate* 36.00%*Loan Interest 11.00%Loan term 25 yearsPayments per year 12 Appreciation rate 3.00%Holding Period 5 yearsSelling costs 0.00% of sale
price
Equity 400,000 Loan 1,600,000 Annual Loan Payment 188,182 Mortgage Balance 1,519,278 year 5
SUMMARY LOAN INFORMATION:End of Year 1 2 3 4 5
Payment 188,182 188,182 188,182 188,182 188,182Mortgage Balance 1,587,1
851,572,8
871,556,934 1,539,1
361,519,2
78Interest 175,367 173,884 172,229 170,383 168,324Principal 12,815 14,298 15,953 17,799 19,858
Year 1 2 3 4 5NOI 190,000 195,700 201,571 207,618 213,847Debt Service 188,182 188,182 188,182 188,182 188,182Before-tax Cash Flow 1,818 7,518 13,389 19,436 25,665
NOI 190,000 195,700 201,571 207,618 213,847Less: Interest 175,367 173,884 172,229 170,383 168,324 Depreciation
58,182 58,182 58,182 58,182 58,182
Taxable Income (43,548)
(36,366)
(28,840) (20,947)
(12,659)
Tax (Savings) (15,677)
(13,092)
(10,382) (7,541) (4,557)
After-tax Cash Flow 17,496 20,610 23,772 26,977 30,222
Cash flow from sale in year
5
12-10
*To be applied to all items of income,capital gains and
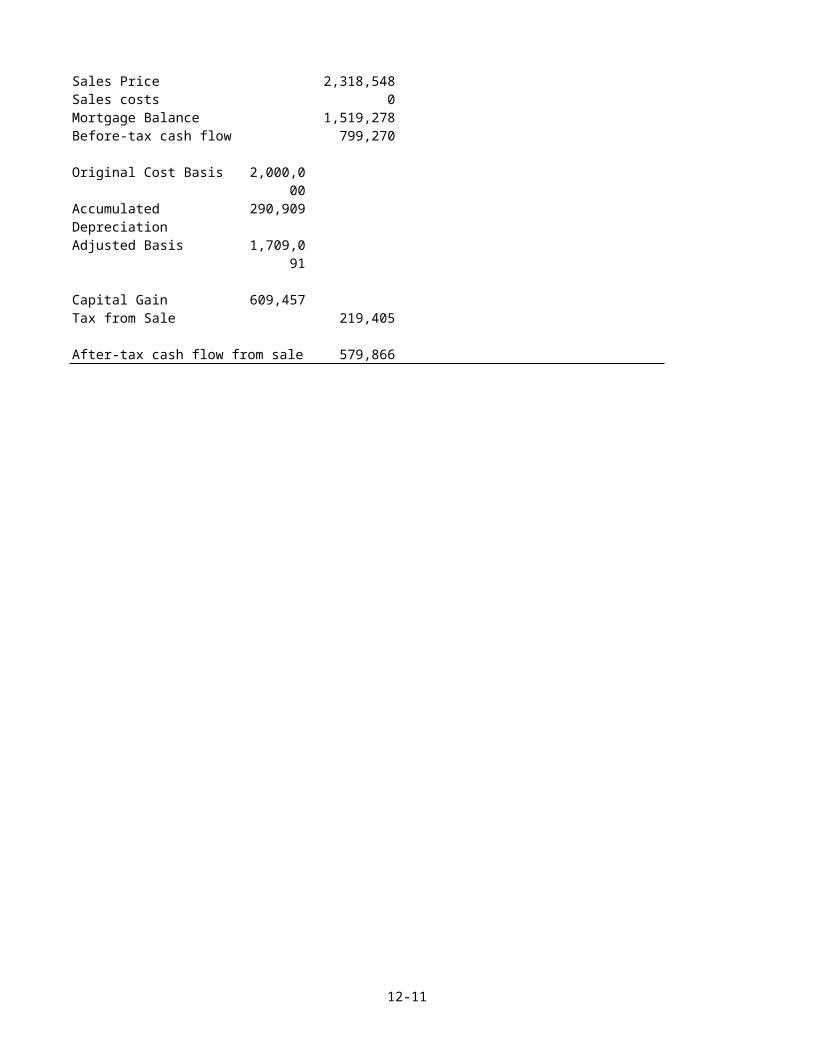
Sales Price 2,318,548Sales costs 0Mortgage Balance 1,519,278Before-tax cash flow 799,270
Original Cost Basis 2,000,000
Accumulated Depreciation
290,909
Adjusted Basis 1,709,091
Capital Gain 609,457Tax from Sale 219,405
After-tax cash flow from sale 579,866
12-11

EQUITYYear 0 1 2 3 4 5
BTCF (400,000)
1,818 7,518 13,389 19,436 824,935
BTIRR on Equity 17.12%
Year 0 1 2 3 4 5 ATCF (400,00
0)17,496 20,610 23,772 26,977 610,08
8 ATIRR on Equity 12.74%
(b) BEIR(To calculate the Break Even Interest Rate (BEIR), the ATIRR must first be calculated as if there were no financing.)
NO LOAN (Change 80 to 0%. All other variables are constant.)
ASSUMPTIONS:
Asking Price $2,000,000
Tax Considerations:
NOI year 1 $190,000 Building Value
$1,600,000
Growth-NOI 3.00% Depreciation 27.5 yearsLoan-to-Value 0.00% Tax rate 36.00%Loan Interest 11.00%Loan term 25 yearsPayments per year 12 Appreciation rate 3.00%Holding Period 5 yearsSelling costs 0.00% of sale
price
Equity 2,000,000 Loan 0 Annual Loan Payment 0 Mortgage Balance 0 year 5
SUMMARY LOAN INFORMATION:End of Year 1 2 3 4 5
Payment 0 0 0 0 0Mortgage Balance 0 0 0 0 0Interest 0 0 0 0 0Principal 0 0 0 0 0
12-12
*To be applied to all items of income,capital gains and
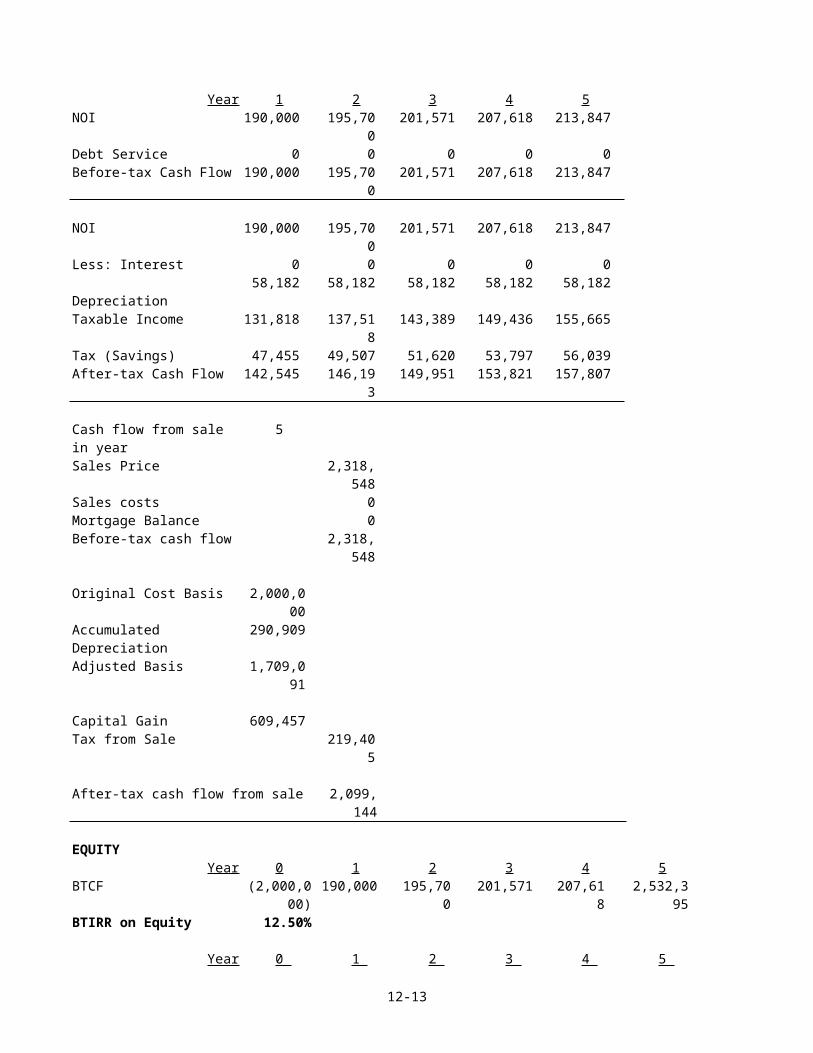
Year 1 2 3 4 5NOI 190,000 195,70
0201,571 207,618 213,847
Debt Service 0 0 0 0 0Before-tax Cash Flow 190,000 195,70
0201,571 207,618 213,847
NOI 190,000 195,700
201,571 207,618 213,847
Less: Interest 0 0 0 0 0 Depreciation
58,182 58,182 58,182 58,182 58,182
Taxable Income 131,818 137,518
143,389 149,436 155,665
Tax (Savings) 47,455 49,507 51,620 53,797 56,039After-tax Cash Flow 142,545 146,19
3149,951 153,821 157,807
Cash flow from sale in year
5
Sales Price 2,318,548
Sales costs 0Mortgage Balance 0Before-tax cash flow 2,318,
548
Original Cost Basis 2,000,000
Accumulated Depreciation
290,909
Adjusted Basis 1,709,091
Capital Gain 609,457Tax from Sale 219,40
5
After-tax cash flow from sale 2,099,144
EQUITYYear 0 1 2 3 4 5
BTCF (2,000,000)
190,000 195,700
201,571 207,618
2,532,395
BTIRR on Equity 12.50%
Year 0 1 2 3 4 5
12-13

ATCF (2,000,000)
142,545 146,193 149,951 153,821
2,256,951
ATIRR on Equity 8.31%Break-even Interest Rate
12.99%
(c) The incremental amount of financing is $200,000. The incremental payment is $2,960 and the incremental loan balance is $200,985. Thus, $200,000 = $2,960 (MPVIFA, ?%, 5 yrs) + $200,985 (MPVIF, ?%, 5 yrs).
Using a financial calculator, the yield is 17.82%. If the incremental cost of the 80% loan is greater than the unlevered IRR of the investment, the additional financing is not justified.
12-14
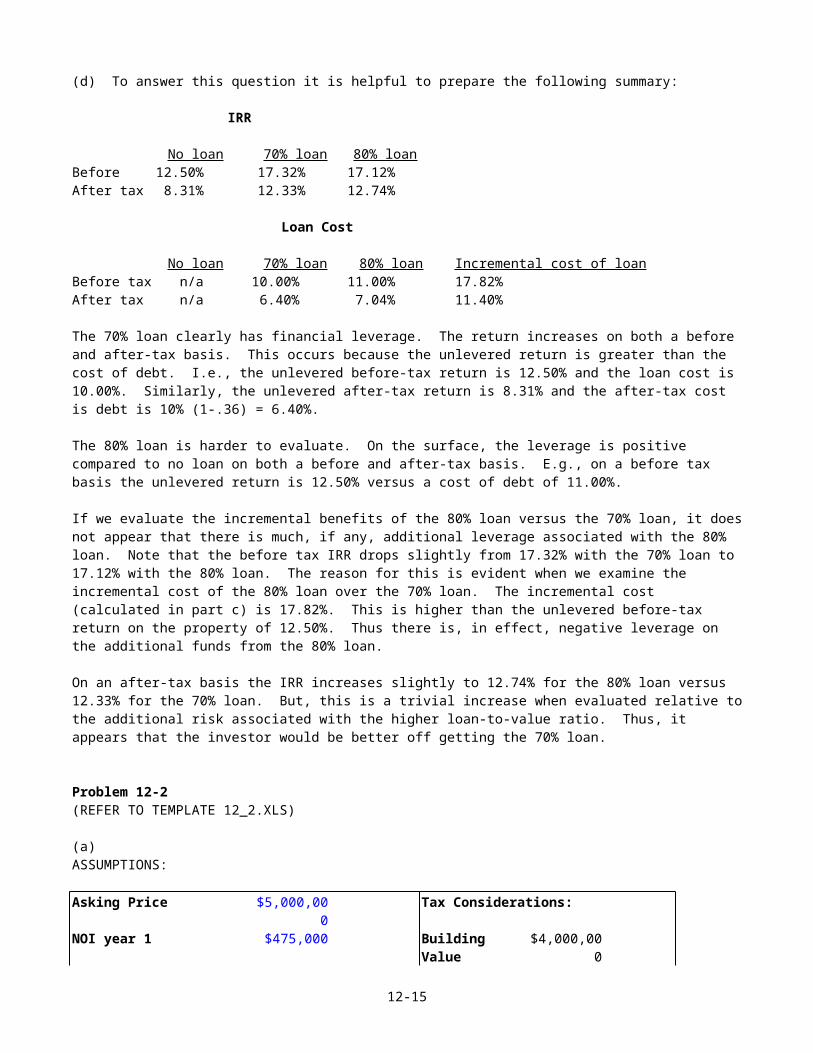
(d) To answer this question it is helpful to prepare the following summary:
IRR
No loan 70% loan 80% loanBefore 12.50% 17.32% 17.12%After tax 8.31% 12.33% 12.74%
Loan Cost
No loan 70% loan 80% loan Incremental cost of loanBefore tax n/a 10.00% 11.00% 17.82%After tax n/a 6.40% 7.04% 11.40%
The 70% loan clearly has financial leverage. The return increases on both a before and after-tax basis. This occurs because the unlevered return is greater than the cost of debt. I.e., the unlevered before-tax return is 12.50% and the loan cost is 10.00%. Similarly, the unlevered after-tax return is 8.31% and the after-tax cost is debt is 10% (1-.36) = 6.40%.
The 80% loan is harder to evaluate. On the surface, the leverage is positive compared to no loan on both a before and after-tax basis. E.g., on a before tax basis the unlevered return is 12.50% versus a cost of debt of 11.00%.
If we evaluate the incremental benefits of the 80% loan versus the 70% loan, it doesnot appear that there is much, if any, additional leverage associated with the 80% loan. Note that the before tax IRR drops slightly from 17.32% with the 70% loan to 17.12% with the 80% loan. The reason for this is evident when we examine the incremental cost of the 80% loan over the 70% loan. The incremental cost (calculated in part c) is 17.82%. This is higher than the unlevered before-tax return on the property of 12.50%. Thus there is, in effect, negative leverage on the additional funds from the 80% loan.
On an after-tax basis the IRR increases slightly to 12.74% for the 80% loan versus 12.33% for the 70% loan. But, this is a trivial increase when evaluated relative tothe additional risk associated with the higher loan-to-value ratio. Thus, it appears that the investor would be better off getting the 70% loan.
Problem 12-2(REFER TO TEMPLATE 12_2.XLS)
(a)ASSUMPTIONS:
Asking Price $5,000,000
Tax Considerations:
NOI year 1 $475,000 Building Value
$4,000,000
12-15
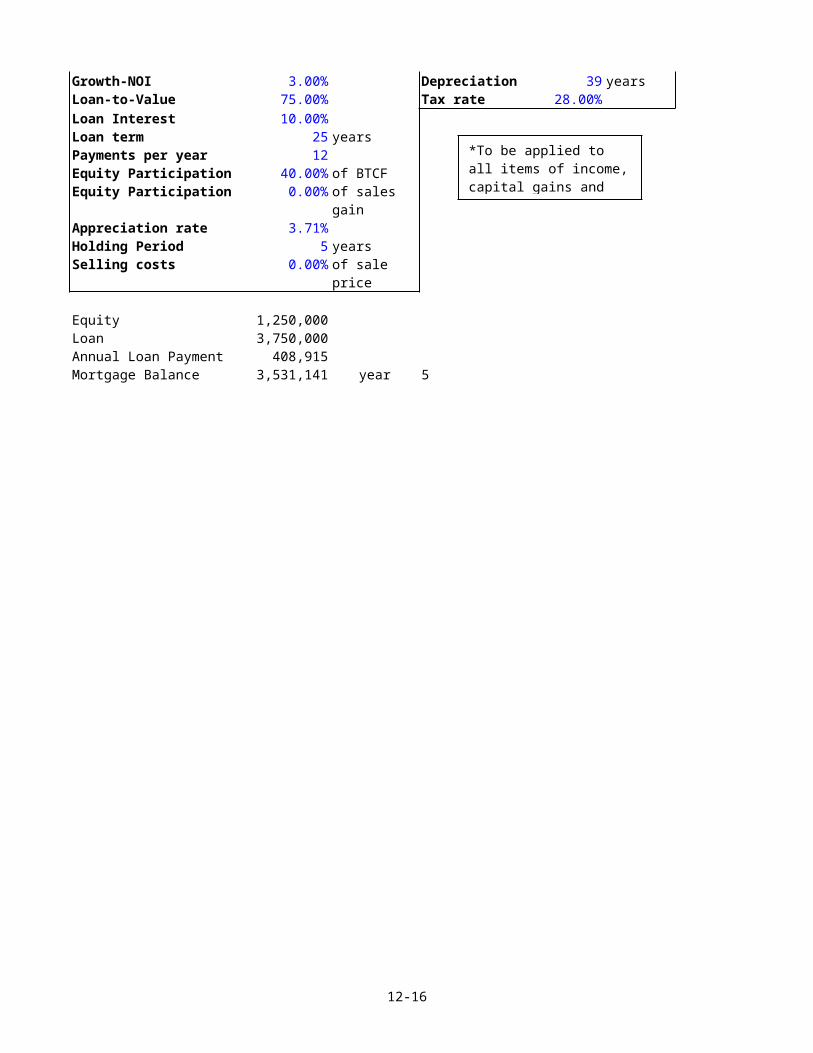
Growth-NOI 3.00% Depreciation 39 yearsLoan-to-Value 75.00% Tax rate 28.00%Loan Interest 10.00%Loan term 25 yearsPayments per year 12 Equity Participation 40.00% of BTCFEquity Participation 0.00% of sales
gainAppreciation rate 3.71%Holding Period 5 yearsSelling costs 0.00% of sale
price
Equity 1,250,000 Loan 3,750,000 Annual Loan Payment 408,915 Mortgage Balance 3,531,141 year 5
12-16
*To be applied to all items of income,capital gains and

SUMMARY LOAN INFORMATION:End of Year 1 2 3 4 5
Payment 408,915 408,915 408,915 408,915 408,915
Mortgage Balance 3,714,486
3,675,254
3,631,913
3,584,034
3,531,141
Interest 373,402 369,683 365,575 361,036 356,023
Principal 35,514 39,233 43,341 47,879 52,893
Year 1 2 3 4 5 NOI 475,000 489,25
0503,92
8519,04
5534,617
Debt Service 408,915 408,915
408,915
408,915
408,915
Before-tax Cash Flow 66,085 80,335 95,012 110,130
125,701
Equity Participation 26,434 32,134 38,005 44,052 50,281Cash Flow after Participation
39,651 48,201 57,007 66,078 75,421
NOI 475,000 489,250
503,928
519,045
534,617
Less: Interest 373,402 369,683
365,575
361,036
356,023
Depreciation 102,564 102,564
102,564
102,564
102,564
Participation 26,434 32,134 38,005 44,052 50,281Taxable Income (27,400
)(15,13
1)(2,216
)11,393 25,749
Tax (Savings) (7,672) (4,237)
(621) 3,190 7,210
ATCF after Participation
47,323 52,437 57,628 62,888 68,211
Cash flow from sale inyear
5
Sales Price 6,000,000Sales costs 0Mortgage Balance 3,531,141Before-tax cash flow 2,468,859Participation in Gain 0BTCF after Participation
2,468,859
Sales Price 6000000Sales Costs 0
12-17
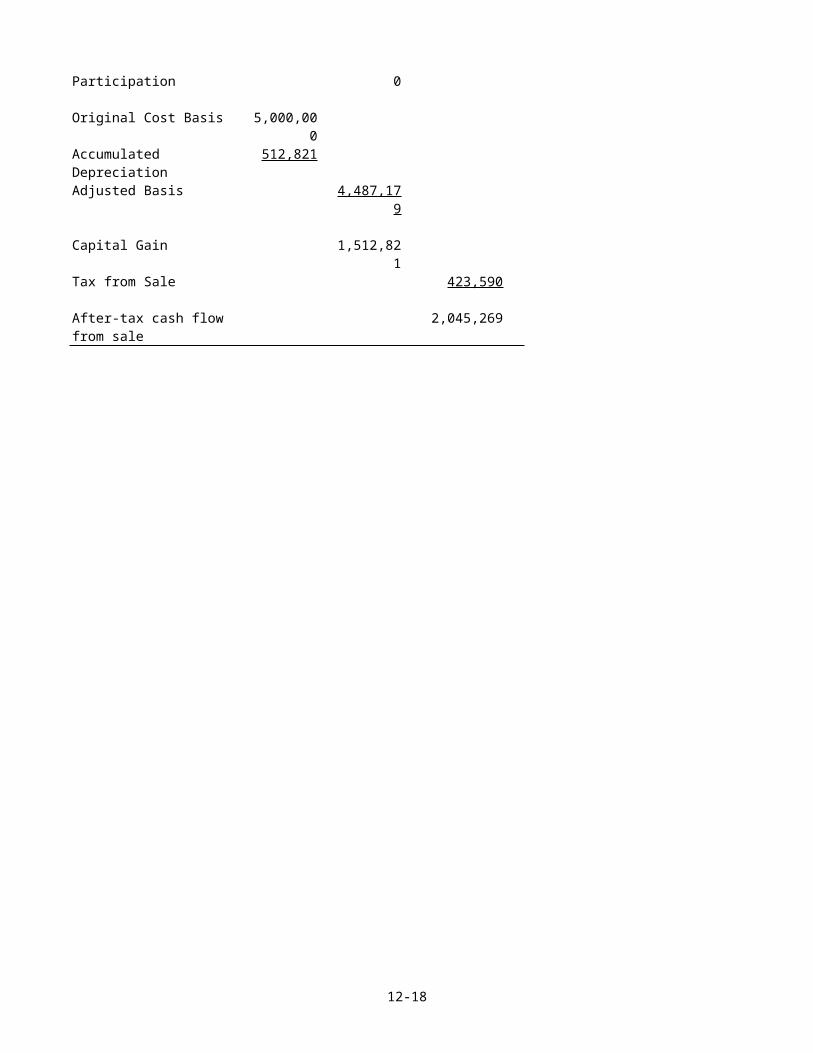
Participation 0
Original Cost Basis 5,000,000
Accumulated Depreciation
512,821
Adjusted Basis 4,487,179
Capital Gain 1,512,821
Tax from Sale 423,590
After-tax cash flow from sale
2,045,269
12-18
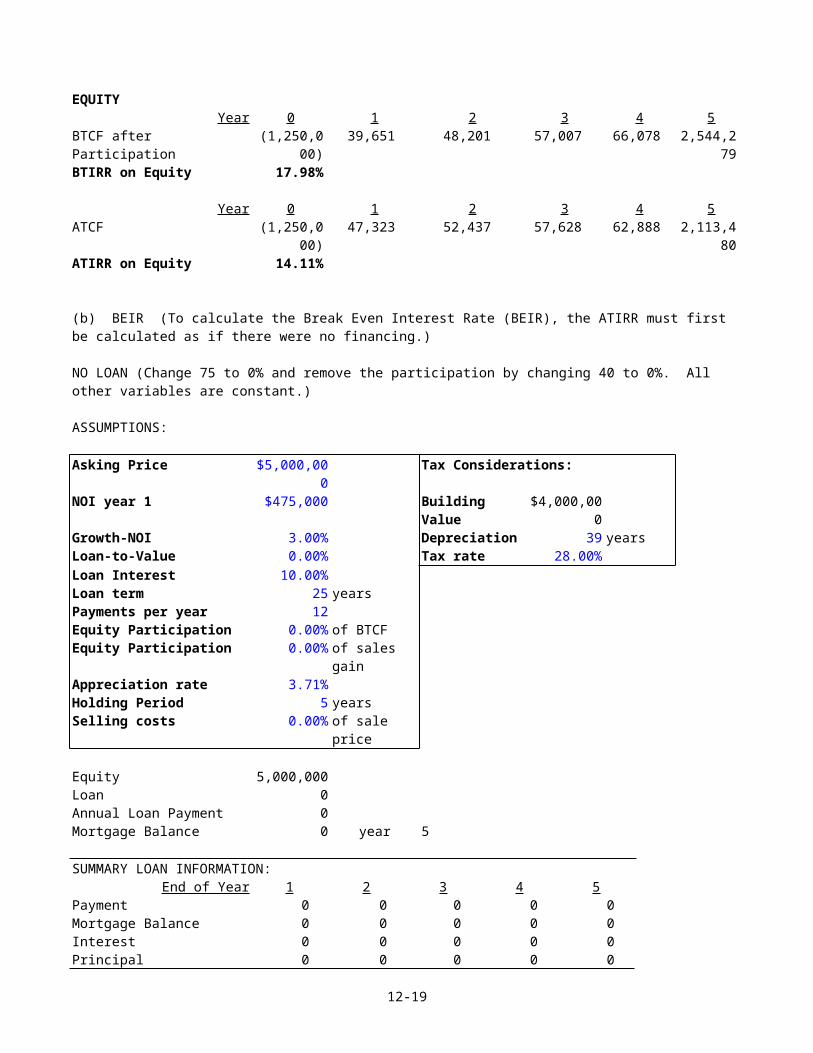
EQUITYYear 0 1 2 3 4 5
BTCF after Participation
(1,250,000)
39,651 48,201 57,007 66,078 2,544,279
BTIRR on Equity 17.98%
Year 0 1 2 3 4 5ATCF (1,250,0
00)47,323 52,437 57,628 62,888 2,113,4
80ATIRR on Equity 14.11%
(b) BEIR (To calculate the Break Even Interest Rate (BEIR), the ATIRR must first be calculated as if there were no financing.)
NO LOAN (Change 75 to 0% and remove the participation by changing 40 to 0%. All other variables are constant.)
ASSUMPTIONS:
Asking Price $5,000,000
Tax Considerations:
NOI year 1 $475,000 Building Value
$4,000,000
Growth-NOI 3.00% Depreciation 39 yearsLoan-to-Value 0.00% Tax rate 28.00%Loan Interest 10.00%Loan term 25 yearsPayments per year 12 Equity Participation 0.00% of BTCFEquity Participation 0.00% of sales
gainAppreciation rate 3.71%Holding Period 5 yearsSelling costs 0.00% of sale
price
Equity 5,000,000 Loan 0 Annual Loan Payment 0 Mortgage Balance 0 year 5
SUMMARY LOAN INFORMATION:End of Year 1 2 3 4 5
Payment 0 0 0 0 0Mortgage Balance 0 0 0 0 0Interest 0 0 0 0 0Principal 0 0 0 0 0
12-19
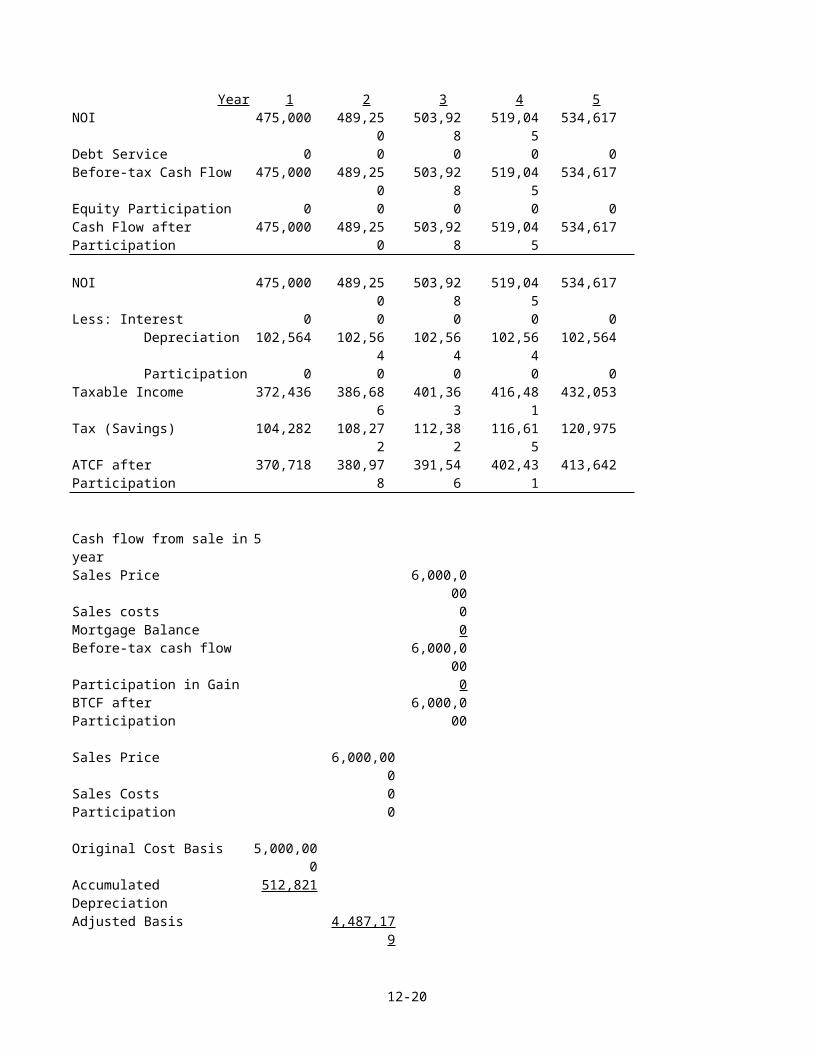
Year 1 2 3 4 5NOI 475,000 489,25
0503,92
8519,04
5534,617
Debt Service 0 0 0 0 0Before-tax Cash Flow 475,000 489,25
0503,92
8519,04
5534,617
Equity Participation 0 0 0 0 0Cash Flow after Participation
475,000 489,250
503,928
519,045
534,617
NOI 475,000 489,250
503,928
519,045
534,617
Less: Interest 0 0 0 0 0 Depreciation 102,564 102,56
4102,56
4102,56
4102,564
Participation 0 0 0 0 0Taxable Income 372,436 386,68
6401,36
3416,48
1432,053
Tax (Savings) 104,282 108,272
112,382
116,615
120,975
ATCF after Participation
370,718 380,978
391,546
402,431
413,642
Cash flow from sale inyear
5
Sales Price 6,000,000
Sales costs 0Mortgage Balance 0Before-tax cash flow 6,000,0
00Participation in Gain 0BTCF after Participation
6,000,000
Sales Price 6,000,000
Sales Costs 0 Participation 0
Original Cost Basis 5,000,000
Accumulated Depreciation
512,821
Adjusted Basis 4,487,179
12-20
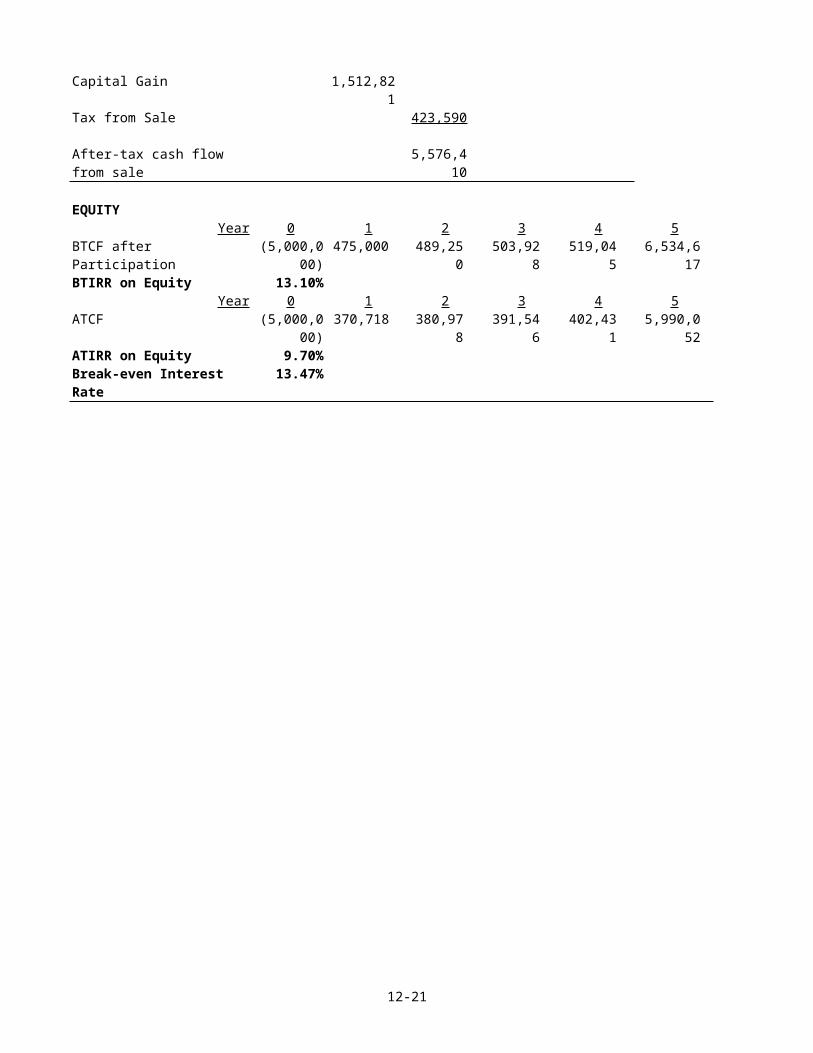
Capital Gain 1,512,821
Tax from Sale 423,590
After-tax cash flow from sale
5,576,410
EQUITYYear 0 1 2 3 4 5
BTCF after Participation
(5,000,000)
475,000 489,250
503,928
519,045
6,534,617
BTIRR on Equity 13.10%Year 0 1 2 3 4 5
ATCF (5,000,000)
370,718 380,978
391,546
402,431
5,990,052
ATIRR on Equity 9.70%Break-even Interest Rate
13.47%
12-21

(b) continued - Projected cost of participation.
Cost of ParticipationYear 0 1 2 3 4 5
Debt service 408,915 408,915 408,915 408,915 408,915Loan balance 3,531,14
1Participation 26,434 32,134 38,005 44,052 50,281Loan amount -
3,750,000Cash flows to lender -
3,750,000435,349 441,049 446,920 452,967 3,990,33
7IRR on Loan 10.95%
Using a financial calculator, the IRR of the cash flows to the lender is 10.95%. This is the effective before tax cost of the loan including the participation. (Note that this was done with annual cash flows for simplicity.)
(c) Summary
IRR
No loan With loanBefore tax 13.10 17.98After tax 9.70 14.11
Yes, there is favorable leverage. The IRR increases on both a before and after-tax basis.
Problem 12-3(REFER TO TEMPLATE 12_3AB.XLS) (8% interest rate and 3% NOI and appreciation are theoriginal variables contained in the template. It must be changed for any other answer.)
(a)
Asking Price $1,500,000
Rent year 1 $120,000 Growth-NOI 3.00%Loan-to-Value 70.00%Loan Interest 8.00%Loan term 25 yearsAppreciation rate 3.00%Holding Period 5 yearsSelling costs 0.00% of sale
price
12-22

Required DCR 1.20
Equity 450,000 Loan 1,050,000 Annual Loan Payment 97,249 Mortgage Balance 968,876 year 5
Year 1 2 3 4 5NOI 120,000 123,600 127,308 131,127 135,061Debt Service 97,249 97,249 97,249 97,249 97,249BTCF 22,751 26,351 30,059 33,878 37,812
DCR 1.23 1.27 1.31 1.35 1.39
12-23
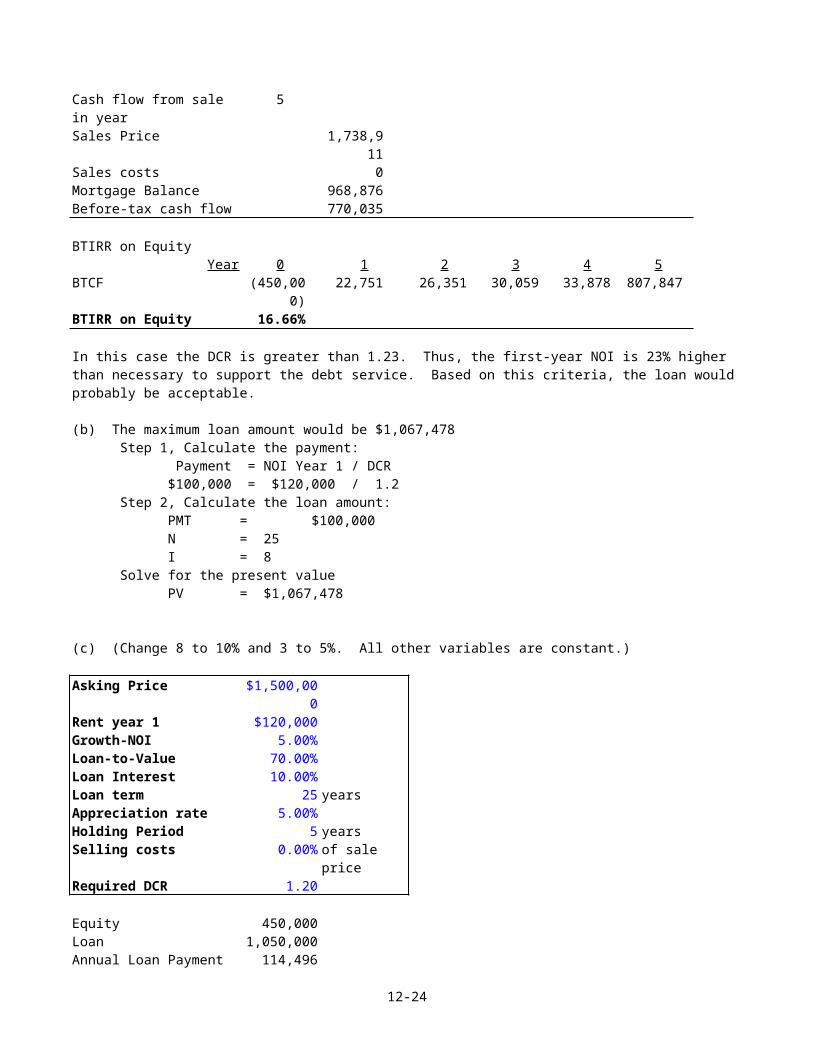
Cash flow from sale in year
5
Sales Price 1,738,911
Sales costs 0Mortgage Balance 968,876Before-tax cash flow 770,035
BTIRR on EquityYear 0 1 2 3 4 5
BTCF (450,000)
22,751 26,351 30,059 33,878 807,847
BTIRR on Equity 16.66%
In this case the DCR is greater than 1.23. Thus, the first-year NOI is 23% higher than necessary to support the debt service. Based on this criteria, the loan would probably be acceptable.
(b) The maximum loan amount would be $1,067,478Step 1, Calculate the payment:
Payment = NOI Year 1 / DCR$100,000 = $120,000 / 1.2
Step 2, Calculate the loan amount:PMT = $100,000N = 25I = 8
Solve for the present valuePV = $1,067,478
(c) (Change 8 to 10% and 3 to 5%. All other variables are constant.)
Asking Price $1,500,000
Rent year 1 $120,000 Growth-NOI 5.00%Loan-to-Value 70.00%Loan Interest 10.00%Loan term 25 yearsAppreciation rate 5.00%Holding Period 5 yearsSelling costs 0.00% of sale
priceRequired DCR 1.20
Equity 450,000 Loan 1,050,000 Annual Loan Payment 114,496
12-24

Mortgage Balance 988,720 year 5
Year 1 2 3 4 5NOI 120,000 126,000 132,300 138,915 145,861Debt Service 114,496 114,496 114,496 114,496 114,496BTCF 5,504 11,504 17,804 24,419 31,364
DCR 1.05 1.10 1.16 1.21 1.27
12-25
Cash flow from sale in year
5
Sales Price 1,914,422
Sales costs 0Mortgage Balance 988,720Before-tax cash flow 925,703
BTIRR on EquityYear 0 1 2 3 4 5
BTCF (450,000)
5,504 11,504 17,804 24,419 957,067
BTIRR on Equity 18.25%
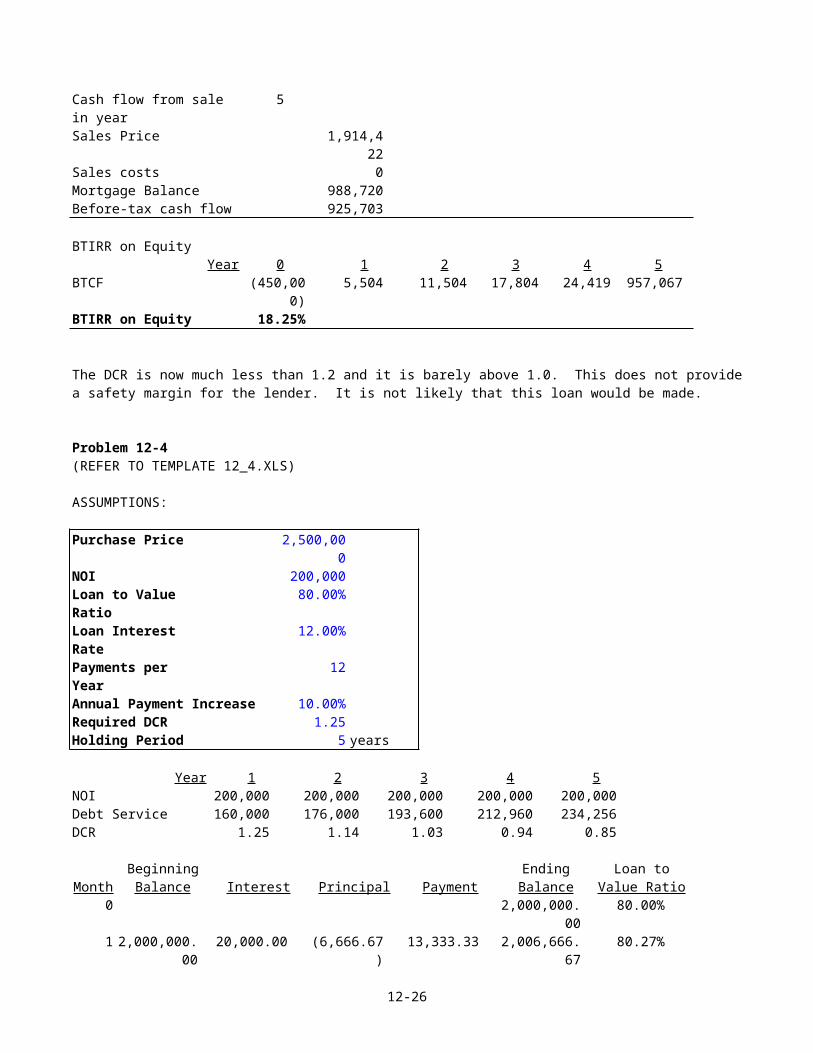
The DCR is now much less than 1.2 and it is barely above 1.0. This does not providea safety margin for the lender. It is not likely that this loan would be made.
Problem 12-4(REFER TO TEMPLATE 12_4.XLS)
ASSUMPTIONS:
Purchase Price 2,500,000
NOI 200,000 Loan to Value Ratio
80.00%
Loan Interest Rate
12.00%
Payments per Year
12
Annual Payment Increase 10.00%Required DCR 1.25 Holding Period 5 years
Year 1 2 3 4 5NOI 200,000 200,000 200,000 200,000 200,000Debt Service 160,000 176,000 193,600 212,960 234,256DCR 1.25 1.14 1.03 0.94 0.85
Beginning Ending Loan toMonth Balance Interest Principal Payment Balance Value Ratio
0 2,000,000.00
80.00%
1 2,000,000.00
20,000.00 (6,666.67)
13,333.33 2,006,666.67
80.27%
12-26

2 2,006,666.67
20,066.67 (6,733.33)
13,333.33 2,013,400.00
80.54%
3 2,013,400.00
20,134.00 (6,800.67)
13,333.33 2,020,200.67
80.81%
4 2,020,200.67
20,202.01 (6,868.67)
13,333.33 2,027,069.34
81.08%
5 2,027,069.34
20,270.69 (6,937.36)
13,333.33 2,034,006.70
81.36%
6 2,034,006.70
20,340.07 (7,006.73)
13,333.33 2,041,013.43
81.64%
7 2,041,013.43
20,410.13 (7,076.80)
13,333.33 2,048,090.23
81.92%
8 2,048,090.23
20,480.90 (7,147.57)
13,333.33 2,055,237.80
82.21%
9 2,055,237.80
20,552.38 (7,219.04)
13,333.33 2,062,456.85
82.50%
10 2,062,456.85
20,624.57 (7,291.24)
13,333.33 2,069,748.08
82.79%
11 2,069,748.08
20,697.48 (7,364.15)
13,333.33 2,077,112.23
83.08%
12 2,077,112.23
20,771.12 (7,437.79)
13,333.33 2,084,550.02
83.38%
13 2,084,550.02
20,845.50 (6,178.83)
14,666.67 2,090,728.85
83.63%
14 2,090,728.85
20,907.29 (6,240.62)
14,666.67 2,096,969.48
83.88%
15 2,096,969.48
20,969.69 (6,303.03)
14,666.67 2,103,272.50
84.13%
16 2,103,272.50
21,032.73 (6,366.06)
14,666.67 2,109,638.56
84.39%
12-27
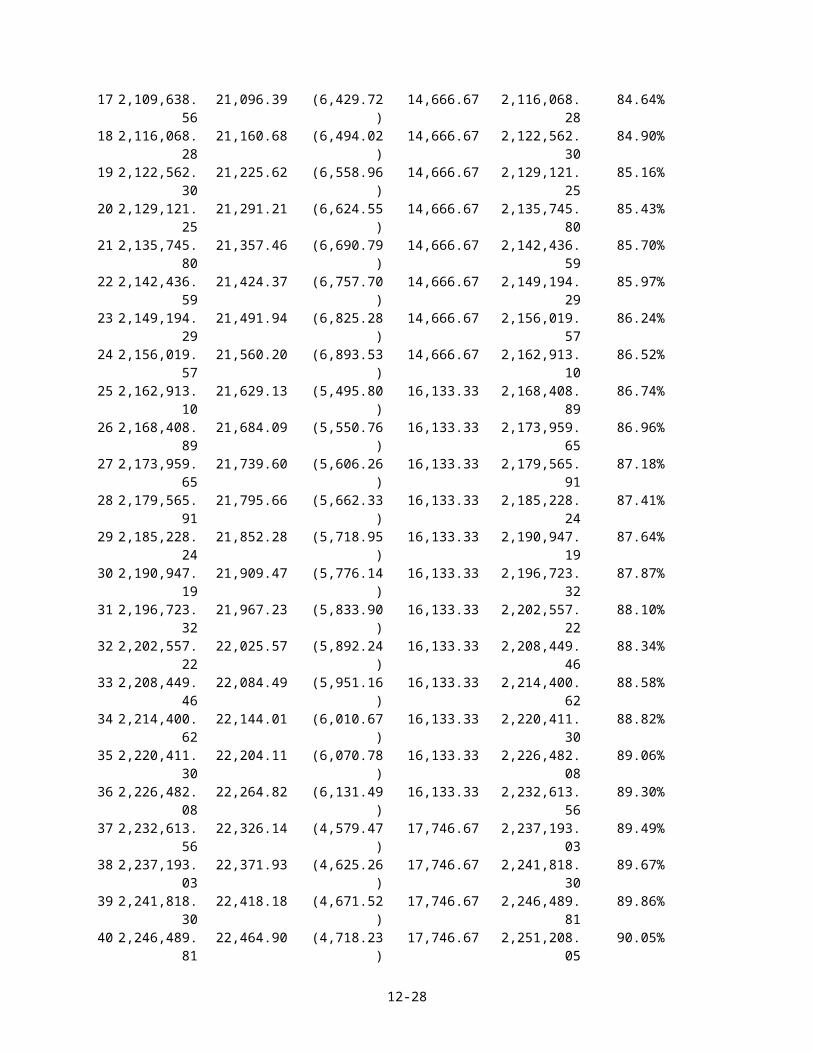
17 2,109,638.56
21,096.39 (6,429.72)
14,666.67 2,116,068.28
84.64%
18 2,116,068.28
21,160.68 (6,494.02)
14,666.67 2,122,562.30
84.90%
19 2,122,562.30
21,225.62 (6,558.96)
14,666.67 2,129,121.25
85.16%
20 2,129,121.25
21,291.21 (6,624.55)
14,666.67 2,135,745.80
85.43%
21 2,135,745.80
21,357.46 (6,690.79)
14,666.67 2,142,436.59
85.70%
22 2,142,436.59
21,424.37 (6,757.70)
14,666.67 2,149,194.29
85.97%
23 2,149,194.29
21,491.94 (6,825.28)
14,666.67 2,156,019.57
86.24%
24 2,156,019.57
21,560.20 (6,893.53)
14,666.67 2,162,913.10
86.52%
25 2,162,913.10
21,629.13 (5,495.80)
16,133.33 2,168,408.89
86.74%
26 2,168,408.89
21,684.09 (5,550.76)
16,133.33 2,173,959.65
86.96%
27 2,173,959.65
21,739.60 (5,606.26)
16,133.33 2,179,565.91
87.18%
28 2,179,565.91
21,795.66 (5,662.33)
16,133.33 2,185,228.24
87.41%
29 2,185,228.24
21,852.28 (5,718.95)
16,133.33 2,190,947.19
87.64%
30 2,190,947.19
21,909.47 (5,776.14)
16,133.33 2,196,723.32
87.87%
31 2,196,723.32
21,967.23 (5,833.90)
16,133.33 2,202,557.22
88.10%
32 2,202,557.22
22,025.57 (5,892.24)
16,133.33 2,208,449.46
88.34%
33 2,208,449.46
22,084.49 (5,951.16)
16,133.33 2,214,400.62
88.58%
34 2,214,400.62
22,144.01 (6,010.67)
16,133.33 2,220,411.30
88.82%
35 2,220,411.30
22,204.11 (6,070.78)
16,133.33 2,226,482.08
89.06%
36 2,226,482.08
22,264.82 (6,131.49)
16,133.33 2,232,613.56
89.30%
37 2,232,613.56
22,326.14 (4,579.47)
17,746.67 2,237,193.03
89.49%
38 2,237,193.03
22,371.93 (4,625.26)
17,746.67 2,241,818.30
89.67%
39 2,241,818.30
22,418.18 (4,671.52)
17,746.67 2,246,489.81
89.86%
40 2,246,489.81
22,464.90 (4,718.23)
17,746.67 2,251,208.05
90.05%
12-28
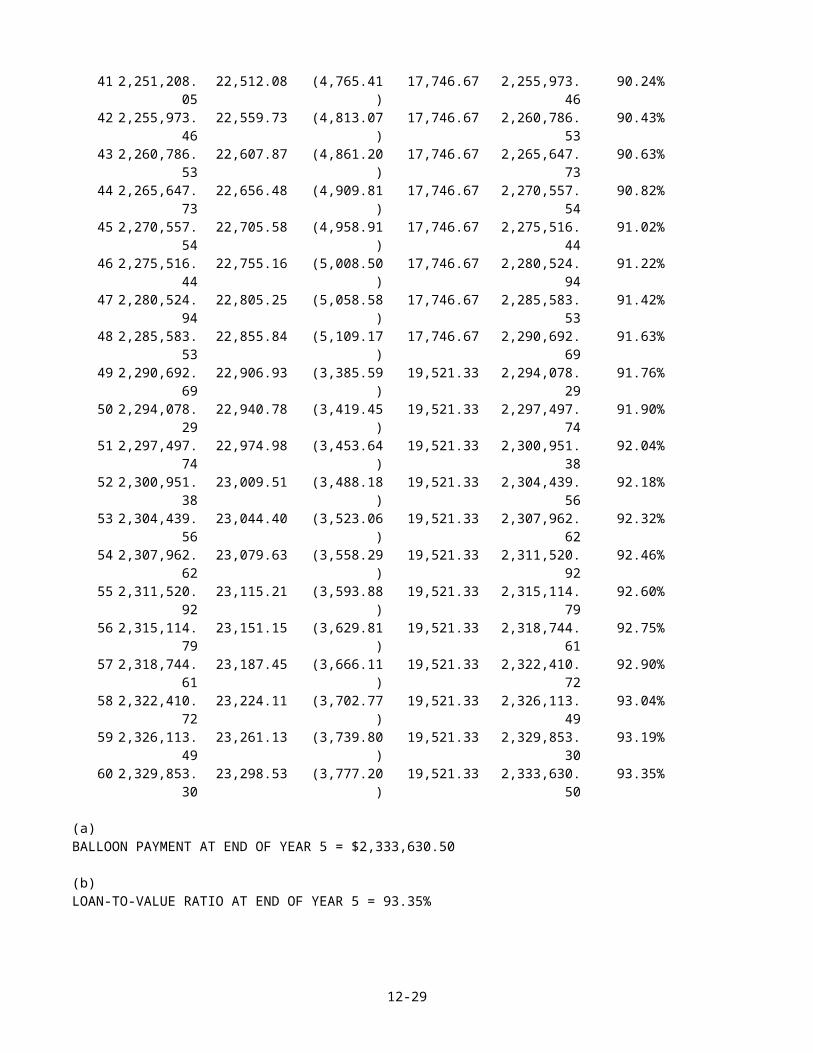
41 2,251,208.05
22,512.08 (4,765.41)
17,746.67 2,255,973.46
90.24%
42 2,255,973.46
22,559.73 (4,813.07)
17,746.67 2,260,786.53
90.43%
43 2,260,786.53
22,607.87 (4,861.20)
17,746.67 2,265,647.73
90.63%
44 2,265,647.73
22,656.48 (4,909.81)
17,746.67 2,270,557.54
90.82%
45 2,270,557.54
22,705.58 (4,958.91)
17,746.67 2,275,516.44
91.02%
46 2,275,516.44
22,755.16 (5,008.50)
17,746.67 2,280,524.94
91.22%
47 2,280,524.94
22,805.25 (5,058.58)
17,746.67 2,285,583.53
91.42%
48 2,285,583.53
22,855.84 (5,109.17)
17,746.67 2,290,692.69
91.63%
49 2,290,692.69
22,906.93 (3,385.59)
19,521.33 2,294,078.29
91.76%
50 2,294,078.29
22,940.78 (3,419.45)
19,521.33 2,297,497.74
91.90%
51 2,297,497.74
22,974.98 (3,453.64)
19,521.33 2,300,951.38
92.04%
52 2,300,951.38
23,009.51 (3,488.18)
19,521.33 2,304,439.56
92.18%
53 2,304,439.56
23,044.40 (3,523.06)
19,521.33 2,307,962.62
92.32%
54 2,307,962.62
23,079.63 (3,558.29)
19,521.33 2,311,520.92
92.46%
55 2,311,520.92
23,115.21 (3,593.88)
19,521.33 2,315,114.79
92.60%
56 2,315,114.79
23,151.15 (3,629.81)
19,521.33 2,318,744.61
92.75%
57 2,318,744.61
23,187.45 (3,666.11)
19,521.33 2,322,410.72
92.90%
58 2,322,410.72
23,224.11 (3,702.77)
19,521.33 2,326,113.49
93.04%
59 2,326,113.49
23,261.13 (3,739.80)
19,521.33 2,329,853.30
93.19%
60 2,329,853.30
23,298.53 (3,777.20)
19,521.33 2,333,630.50
93.35%
(a)BALLOON PAYMENT AT END OF YEAR 5 = $2,333,630.50
(b)LOAN-TO-VALUE RATIO AT END OF YEAR 5 = 93.35%
12-29
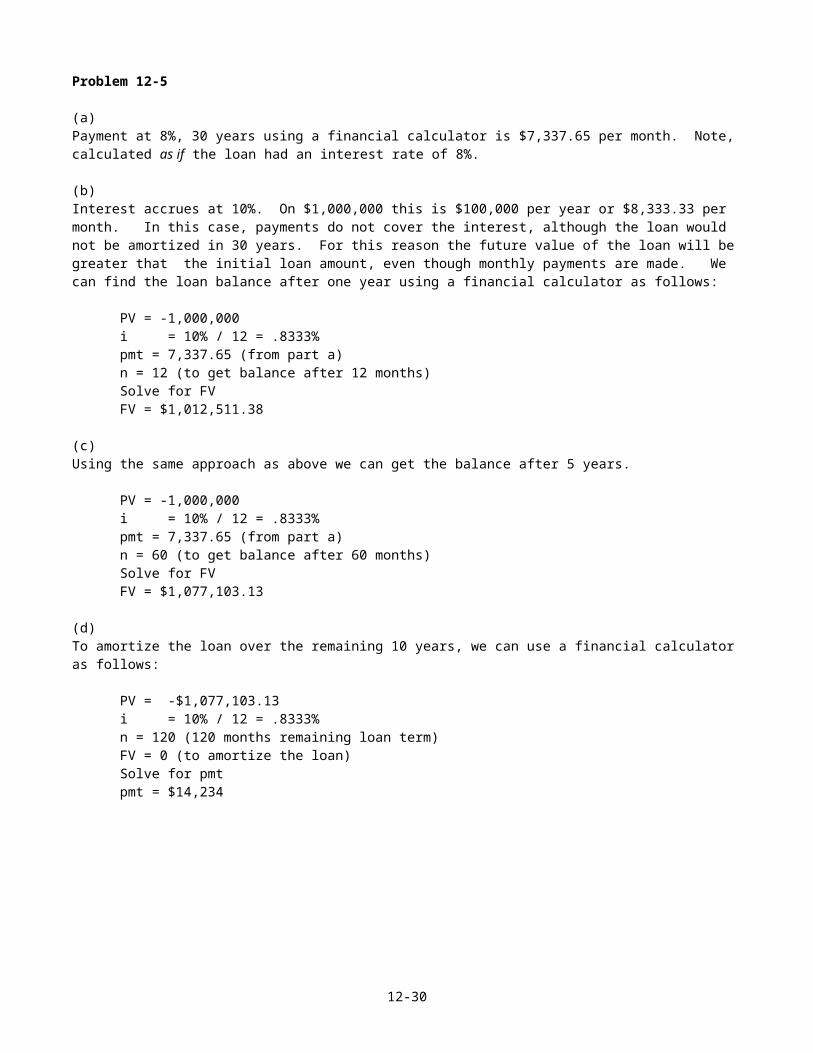
Problem 12-5
(a)Payment at 8%, 30 years using a financial calculator is $7,337.65 per month. Note, calculated as if the loan had an interest rate of 8%.
(b)Interest accrues at 10%. On $1,000,000 this is $100,000 per year or $8,333.33 per month. In this case, payments do not cover the interest, although the loan would not be amortized in 30 years. For this reason the future value of the loan will be greater that the initial loan amount, even though monthly payments are made. We can find the loan balance after one year using a financial calculator as follows:
PV = -1,000,000i = 10% / 12 = .8333%pmt = 7,337.65 (from part a)n = 12 (to get balance after 12 months)Solve for FVFV = $1,012,511.38
(c)Using the same approach as above we can get the balance after 5 years.
PV = -1,000,000i = 10% / 12 = .8333%pmt = 7,337.65 (from part a)n = 60 (to get balance after 60 months)Solve for FVFV = $1,077,103.13
(d)To amortize the loan over the remaining 10 years, we can use a financial calculator as follows:
PV = -$1,077,103.13i = 10% / 12 = .8333%n = 120 (120 months remaining loan term)FV = 0 (to amortize the loan)Solve for pmtpmt = $14,234
12-30
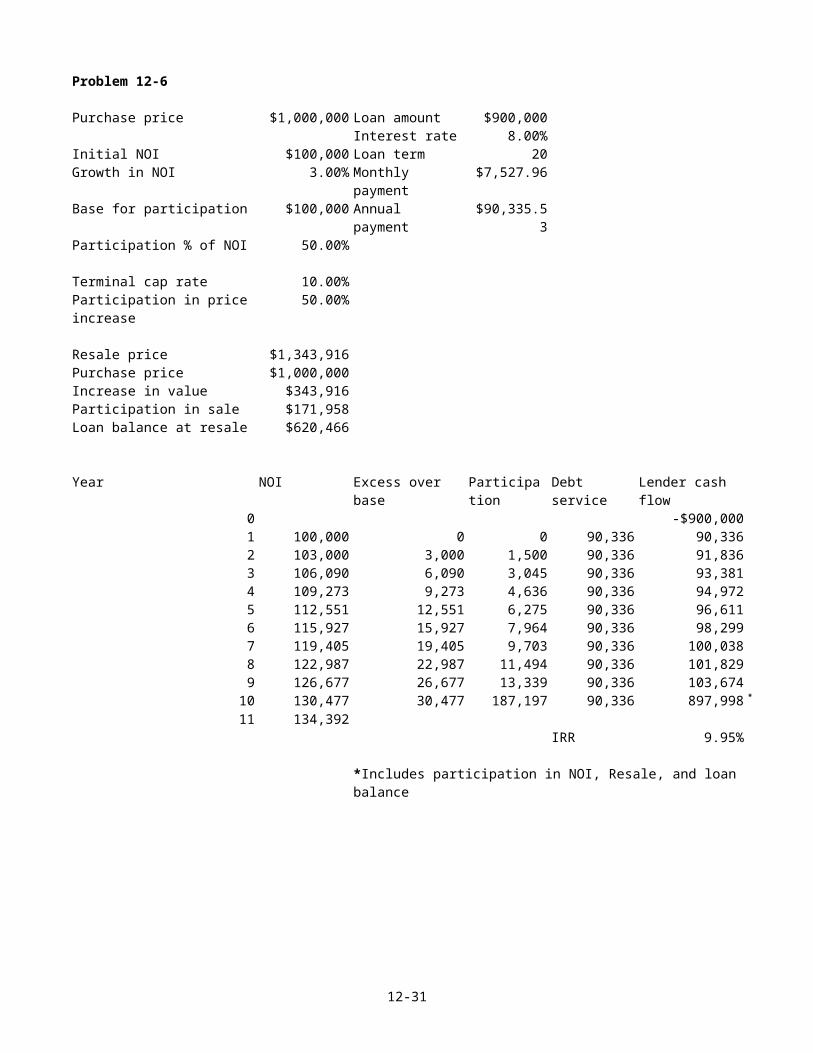
Problem 12-6
Purchase price $1,000,000 Loan amount $900,000Interest rate 8.00%
Initial NOI $100,000 Loan term 20Growth in NOI 3.00% Monthly
payment$7,527.96
Base for participation $100,000 Annual payment
$90,335.53
Participation % of NOI 50.00%
Terminal cap rate 10.00%Participation in priceincrease
50.00%
Resale price $1,343,916Purchase price $1,000,000Increase in value $343,916Participation in sale $171,958Loan balance at resale $620,466
Year NOI Excess over base
Participation
Debt service
Lender cash flow
0 -$900,0001 100,000 0 0 90,336 90,3362 103,000 3,000 1,500 90,336 91,8363 106,090 6,090 3,045 90,336 93,3814 109,273 9,273 4,636 90,336 94,9725 112,551 12,551 6,275 90,336 96,6116 115,927 15,927 7,964 90,336 98,2997 119,405 19,405 9,703 90,336 100,0388 122,987 22,987 11,494 90,336 101,8299 126,677 26,677 13,339 90,336 103,67410 130,477 30,477 187,197 90,336 897,998 *
11 134,392IRR 9.95%
*Includes participation in NOI, Resale, and loanbalance
12-31
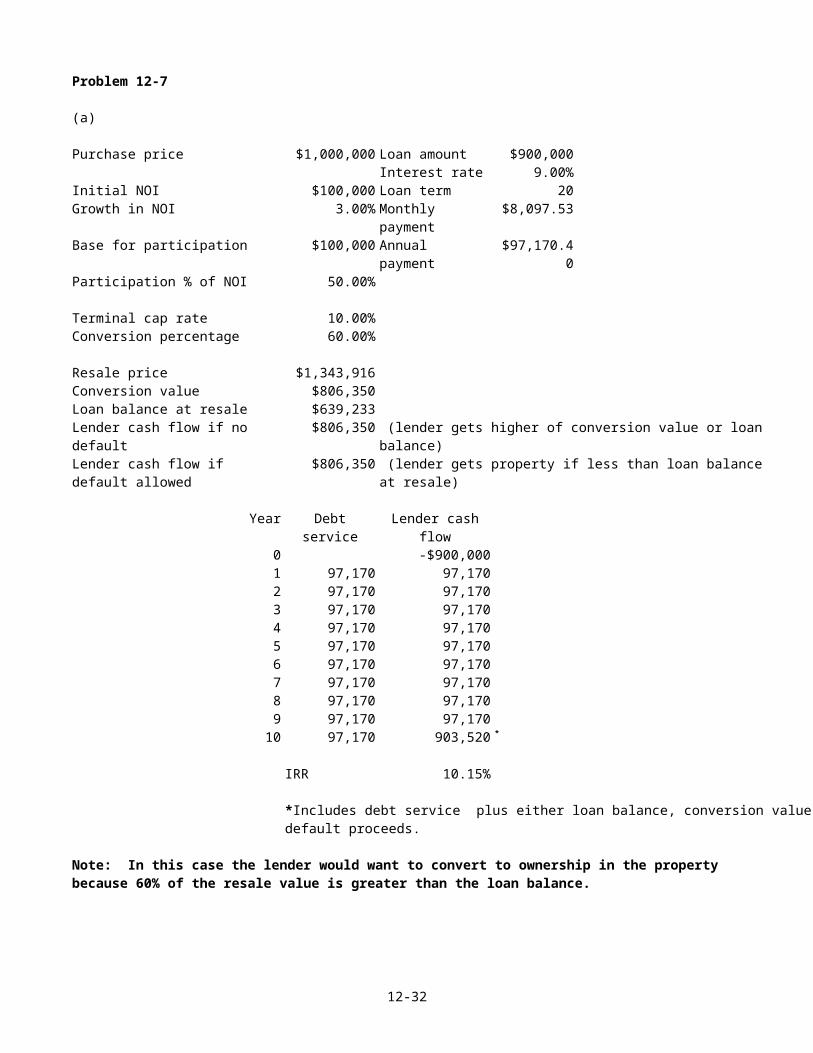
Problem 12-7
(a)
Purchase price $1,000,000 Loan amount $900,000Interest rate 9.00%
Initial NOI $100,000 Loan term 20Growth in NOI 3.00% Monthly
payment$8,097.53
Base for participation $100,000 Annual payment
$97,170.40
Participation % of NOI 50.00%
Terminal cap rate 10.00%Conversion percentage 60.00%
Resale price $1,343,916Conversion value $806,350Loan balance at resale $639,233Lender cash flow if no default
$806,350 (lender gets higher of conversion value or loanbalance)
Lender cash flow if default allowed
$806,350 (lender gets property if less than loan balanceat resale)
Year Debtservice
Lender cashflow
0 -$900,0001 97,170 97,1702 97,170 97,1703 97,170 97,1704 97,170 97,1705 97,170 97,1706 97,170 97,1707 97,170 97,1708 97,170 97,1709 97,170 97,17010 97,170 903,520 *
IRR 10.15%
*Includes debt service plus either loan balance, conversion value ordefault proceeds.
Note: In this case the lender would want to convert to ownership in the property because 60% of the resale value is greater than the loan balance.
12-32

(b)
Purchase price $1,000,000 Loan amount $900,000Interest rate 9.00%
Initial NOI $100,000 Loan term 20Growth in NOI 3.00% Monthly
payment$8,097.53
Base for participation $100,000 Annual payment
$97,170.40
Participation % of NOI 50.00%
Terminal cap rate 10.00%Conversion percentage 60.00%
Resale price $1,000,000Conversion value $600,000Loan balance at resale $639,233Lender cash flow if no default
$639,233 (lender gets higher of conversion value or loanbalance)
Lender cash flow if default allowed
$639,233 (lender gets property if less than loan balanceat resale)
Year Debtservice
Lender cashflow
0 -$900,0001 97,170 97,1702 97,170 97,1703 97,170 97,1704 97,170 97,1705 97,170 97,1706 97,170 97,1707 97,170 97,1708 97,170 97,1709 97,170 97,17010 97,170 736,403 *
IRR 8.88%
*Includes debt service plus either loan balance, conversion value ordefault proceeds.
Note: In this case the lender would not want to convert because the mortgage balance after 10 years is greater than 60% of the resale value. Thus, the return isessentially the same as the interest rate on the mortgage of 9%. The rounding (8.88% vs. 9.0%) is due to the fact that we assumed all the cash flows occurred at the end of each year rather than monthly.
12-33
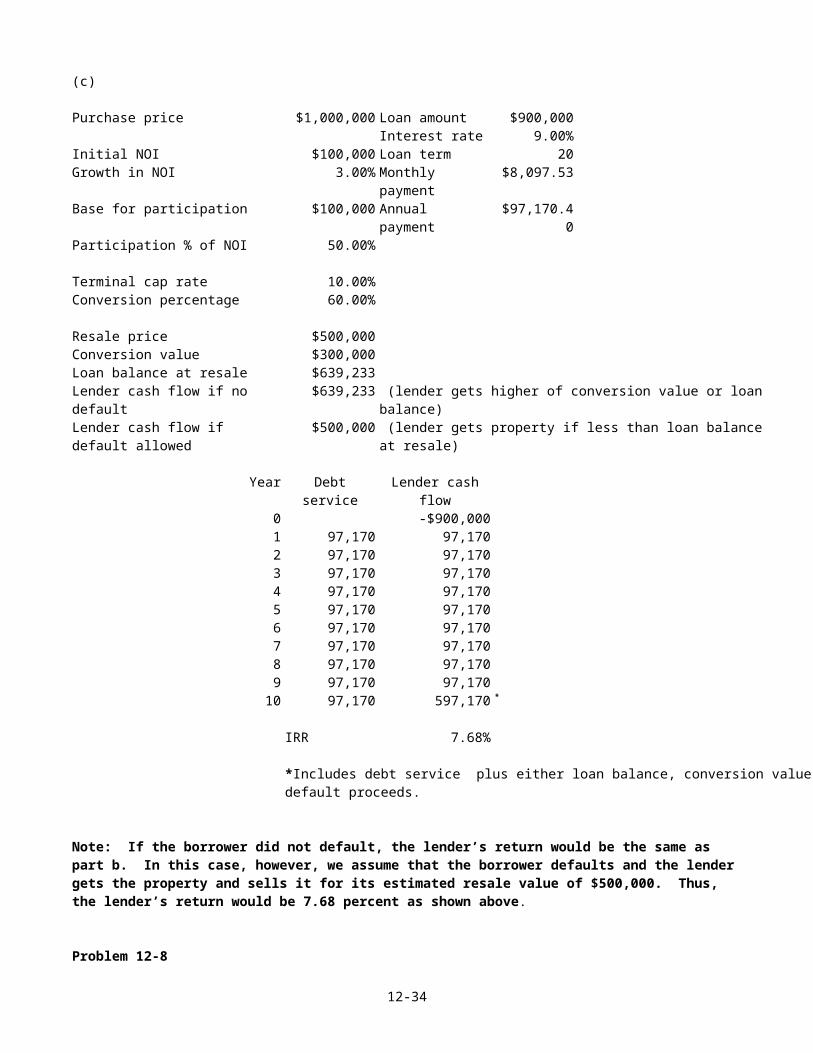
(c)
Purchase price $1,000,000 Loan amount $900,000Interest rate 9.00%
Initial NOI $100,000 Loan term 20Growth in NOI 3.00% Monthly
payment$8,097.53
Base for participation $100,000 Annual payment
$97,170.40
Participation % of NOI 50.00%
Terminal cap rate 10.00%Conversion percentage 60.00%
Resale price $500,000Conversion value $300,000Loan balance at resale $639,233Lender cash flow if no default
$639,233 (lender gets higher of conversion value or loanbalance)
Lender cash flow if default allowed
$500,000 (lender gets property if less than loan balanceat resale)
Year Debtservice
Lender cashflow
0 -$900,0001 97,170 97,1702 97,170 97,1703 97,170 97,1704 97,170 97,1705 97,170 97,1706 97,170 97,1707 97,170 97,1708 97,170 97,1709 97,170 97,17010 97,170 597,170 *
IRR 7.68%
*Includes debt service plus either loan balance, conversion value ordefault proceeds.
Note: If the borrower did not default, the lender’s return would be the same as part b. In this case, however, we assume that the borrower defaults and the lender gets the property and sells it for its estimated resale value of $500,000. Thus, the lender’s return would be 7.68 percent as shown above.
Problem 12-8
12-34
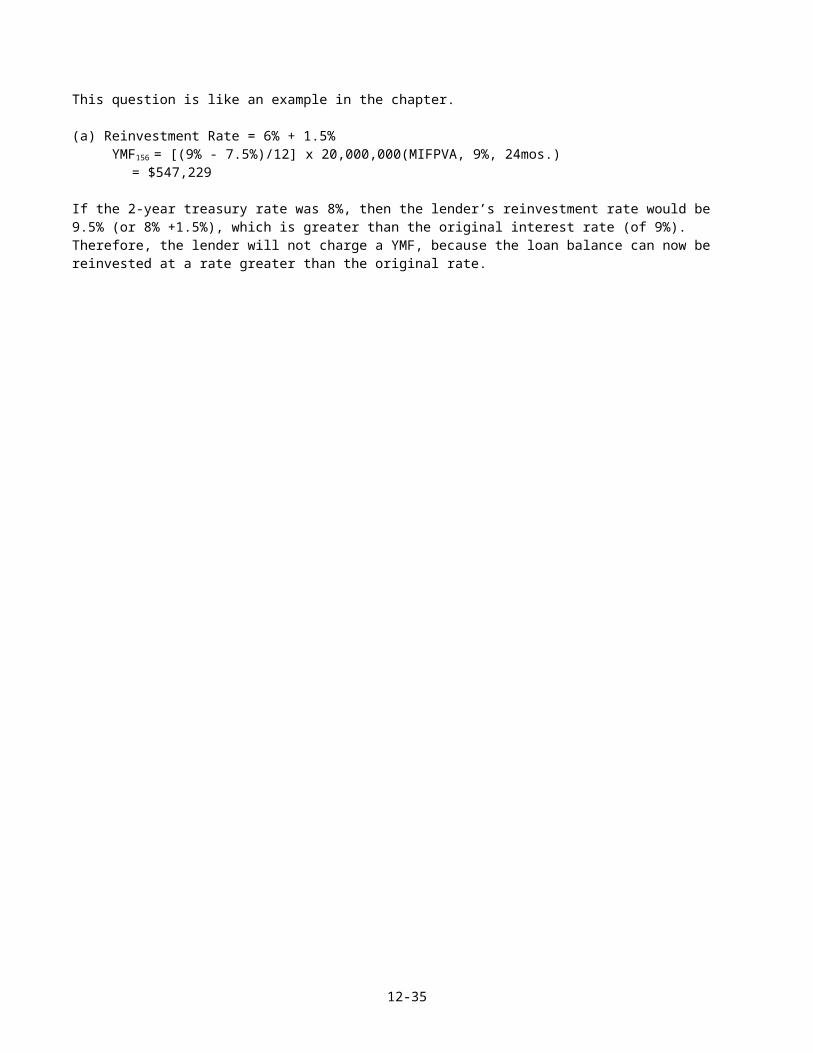
This question is like an example in the chapter.
(a) Reinvestment Rate = 6% + 1.5% YMF156 = [(9% - 7.5%)/12] x 20,000,000(MIFPVA, 9%, 24mos.) = $547,229
If the 2-year treasury rate was 8%, then the lender’s reinvestment rate would be 9.5% (or 8% +1.5%), which is greater than the original interest rate (of 9%). Therefore, the lender will not charge a YMF, because the loan balance can now be reinvested at a rate greater than the original rate.
12-35

Problem 12-9
The before tax IRR on equity is now 16.86% and the after tax IRR on Equity is 12.83%. The lender’s return is 11.04%.
Problem 12-10
The IRR on equity increases to 23.87% with an 80% loan from 20.98% with a 70% loan. (The loan-to-value ratio is changed in the “yield – debt financing” menu in ARGUS.)
12-36