Flow visualization study of an HVAC module operated in water
11
VTMS-082 Flow visualization study of an HVAC module operated in water Asad. M. Sardar Air International US Inc. William. K. George Jr. Department of Thermal and Fluid Dynamics Chalmers University of Technology 412 96 Gothenburg, Sweden. James R. Sonnenmeier, Department of Mechanical Engineering Pennsylvania State University at Erie Erie, PA. Scott Woodward School of Engineering, SUNY at Buffalo, Buffalo, NY 14260 Copyright © 2001 Society of Automotive Engineers, Inc. ABSTRACT Centrifugal blowers serve as the primary source of airflow and aero-acoustic noise in automotive HVAC modules. Flow field measurements inside blowers indicate very complex flow patterns. A detailed flow visualization study was conducted on an actual HVAC fan module operated in water under dynamically similar conditions as those in air with the purpose of studying the complex flow patterns in order to improve the aerodynamic performance of the fan/scroll casing and diffuser components. Fan-scroll/ diffuser interaction was also studied as function of fan speed. Conventional and special (shear thickening) dye injection flow visualization techniques were used to study the complex 3- dimensional vortical and unsteady flow patterns that occur in typical HVAC fans. A major advantage of the flow visualization technique using shear-thickening dye is its usefulness in high the Reynolds number flows that are typically encountered inside HVAC modules. An additional advantage of this dye injection technique is that it can be used with different colored dyes to show regions of flow mixing and track unsteady flow features. Using water as the medium for model testing, the scaling laws indicated that a 1 to 1 scale model was sufficient for the proper application of low speed flow visualization techniques. The experimental testing identified both qualitatively and quantitatively flow structures possibly responsible for noise augmentation and loss of aerodynamic efficiency. Flow visualization was able to indicate the large-scale flow patterns through the blower. It also clearly showed areas of flow separation (which is the major cause of aerodynamic inefficiency and noise production) and recirculation within the blower housing. INTRODUCTION Visualization of flow can provide important information on flow mechanisms that are associated with many problems of aerodynamic and fluid-solid body interaction. In the field of standard automotive HVAC systems, the primary comp onent of aerodynamic interest is the fan or blower and its interaction/coupling with the downstream components, such as the diffuser and evaporator. The blower/diffuser also serve as the primary source of aerodynamic noise and a primary source of overall inefficiency of the whole HVAC system. Optimization of the blower/diffuser combination is often highly desirable once the downstream system resistances are set (evaporator, heater core, ducts etc.). There are many ways of optimizing blowers/diffusers. Presently, 2-D and 3-D CFD methods are very popular (Clausel and Gilette (1997) and Guzy (1995)), in addition to physical experimental testing of mockup parts. The latter is very time- consuming and generally based upon the development engineers’ intuition and or the use of ad hoc trial and error methods to obtain a solution. Often the solution in one case may not lead to a solution in another yet similar case. CFD techniques have their limitations too, starting with their inability to resolve accurately the very high Reynolds number flows that are often observed in complex flow in industrial systems (such as HVAC's). They are also prone to be less effective in case of 3-dimensional turbulent flow through complex geometries. On the other hand, from the perspective of qualitative (yet more realistic) flow analysis, flow visualization techniques using smoke injection (in case of gas flows) and dye injection
-
Upload
khangminh22 -
Category
Documents
-
view
0 -
download
0
Transcript of Flow visualization study of an HVAC module operated in water

VTMS-082
Flow visualization study of an HVAC module operated in water
Asad. M. Sardar Air International US Inc.
William. K. George Jr. Department of Thermal and Fluid Dynamics Chalmers University of Technology 412 96 Gothenburg, Sweden.
James R. Sonnenmeier, Department of Mechanical Engineering Pennsylvania State University at Erie Erie, PA.
Scott Woodward School of Engineering, SUNY at Buffalo, Buffalo, NY 14260
Copyright © 2001 Society of Automotive Engineers, Inc. ABSTRACT
Centrifugal blowers serve as the primary source of airflow and aero-acoustic noise in automotive HVAC modules. Flow field measurements inside blowers indicate very complex flow patterns. A detailed flow visualization study was conducted on an actual HVAC fan module operated in water under dynamically similar conditions as those in air with the purpose of studying the complex flow patterns in order to improve the aerodynamic performance of the fan/scroll casing and diffuser components. Fan-scroll/diffuser interaction was also studied as function of fan speed. Conventional and special (shear thickening) dye injection flow visualization techniques were used to study the complex 3-dimensional vortical and unsteady flow patterns that occur in typical HVAC fans. A major advantage of the flow visualization technique using shear-thickening dye is its usefulness in high the Reynolds number flows that are typically encountered inside HVAC modules. An additional advantage of this dye injection technique is that it can be used with different colored dyes to show regions of flow mixing and track unsteady flow features. Using water as the medium for model testing, the scaling laws indicated that a 1 to 1 scale model was sufficient for the proper application of low speed flow visualization techniques. The experimental testing identified both qualitatively and quantitatively flow structures possibly responsible for noise augmentation and loss of aerodynamic efficiency. Flow visualization was able to indicate the large-scale flow patterns through the blower. It also clearly showed areas of flow separation (which is the major cause of aerodynamic inefficiency and noise production) and recirculation within the blower housing.
INTRODUCTION
Visualization of flow can provide important information on flow mechanisms that are associated with many problems of aerodynamic and fluid-solid body interaction. In the field of standard automotive HVAC systems, the primary comp onent of aerodynamic interest is the fan or blower and its interaction/coupling with the downstream components, such as the diffuser and evaporator. The blower/diffuser also serve as the primary source of aerodynamic noise and a primary source of overall inefficiency of the whole HVAC system. Optimization of the blower/diffuser combination is often highly desirable once the downstream system resistances are set (evaporator, heater core, ducts etc.). There are many ways of optimizing blowers/diffusers. Presently, 2-D and 3-D CFD methods are very popular (Clausel and Gilette (1997) and Guzy (1995)), in addition to physical experimental testing of mockup parts. The latter is very time-consuming and generally based upon the development engineers’ intuition and or the use of ad hoc trial and error methods to obtain a solution. Often the solution in one case may not lead to a solution in another yet similar case. CFD techniques have their limitations too, starting with their inability to resolve accurately the very high Reynolds number flows that are often observed in complex flow in industrial systems (such as HVAC's). They are also prone to be less effective in case of 3-dimensional turbulent flow through complex geometries. On the other hand, from the perspective of qualitative (yet more realistic) flow analysis, flow visualization techniques using smoke injection (in case of gas flows) and dye injection
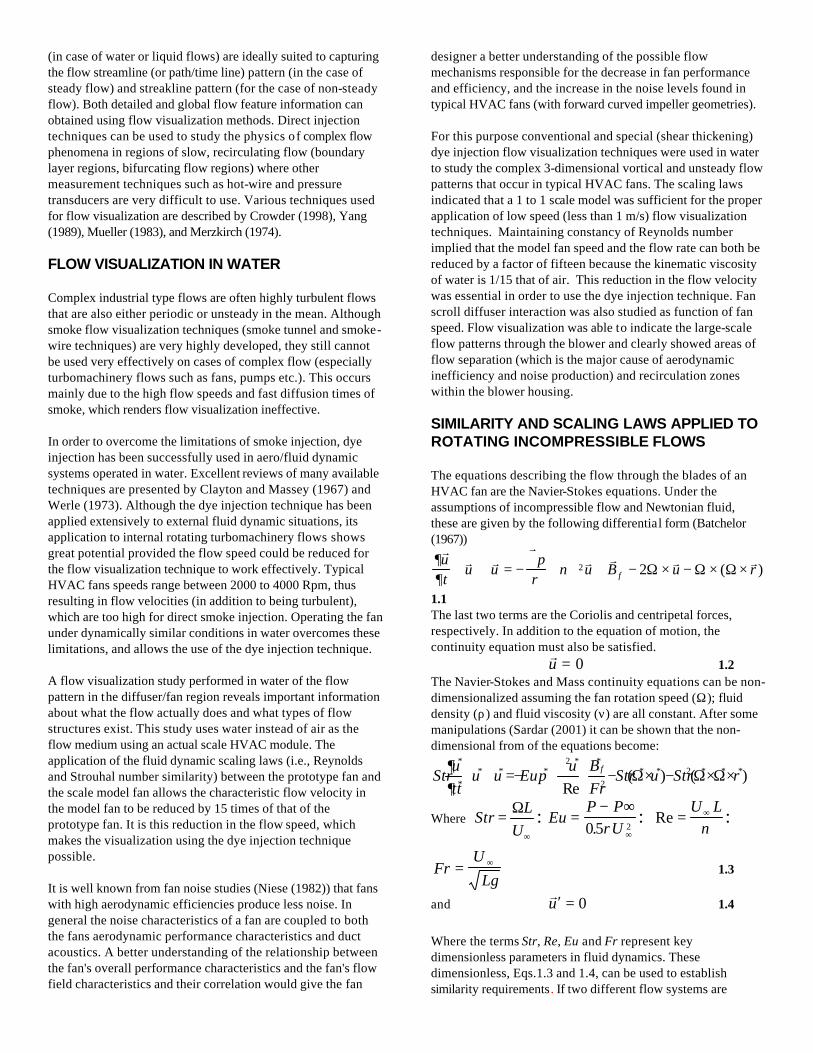
(in case of water or liquid flows) are ideally suited to capturing the flow streamline (or path/time line) pattern (in the case of steady flow) and streakline pattern (for the case of non-steady flow). Both detailed and global flow feature information can obtained using flow visualization methods. Direct injection techniques can be used to study the physics of complex flow phenomena in regions of slow, recirculating flow (boundary layer regions, bifurcating flow regions) where other measurement techniques such as hot-wire and pressure transducers are very difficult to use. Various techniques used for flow visualization are described by Crowder (1998), Yang (1989), Mueller (1983), and Merzkirch (1974). FLOW VISUALIZATION IN WATER
Complex industrial type flows are often highly turbulent flows that are also either periodic or unsteady in the mean. Although smoke flow visualization techniques (smoke tunnel and smoke-wire techniques) are very highly developed, they still cannot be used very effectively on cases of complex flow (especially turbomachinery flows such as fans, pumps etc.). This occurs mainly due to the high flow speeds and fast diffusion times of smoke, which renders flow visualization ineffective. In order to overcome the limitations of smoke injection, dye injection has been successfully used in aero/fluid dynamic systems operated in water. Excellent reviews of many available techniques are presented by Clayton and Massey (1967) and Werle (1973). Although the dye injection technique has been applied extensively to external fluid dynamic situations, its application to internal rotating turbomachinery flows shows great potential provided the flow speed could be reduced for the flow visualization technique to work effectively. Typical HVAC fans speeds range between 2000 to 4000 Rpm, thus resulting in flow velocities (in addition to being turbulent), which are too high for direct smoke injection. Operating the fan under dynamically similar conditions in water overcomes these limitations, and allows the use of the dye injection technique. A flow visualization study performed in water of the flow pattern in the diffuser/fan region reveals important information about what the flow actually does and what types of flow structures exist. This study uses water instead of air as the flow medium using an actual scale HVAC module. The application of the fluid dynamic scaling laws (i.e., Reynolds and Strouhal number similarity) between the prototype fan and the scale model fan allows the characteristic flow velocity in the model fan to be reduced by 15 times of that of the prototype fan. It is this reduction in the flow speed, which makes the visualization using the dye injection technique possible. It is well known from fan noise studies (Niese (1982)) that fans with high aerodynamic efficiencies produce less noise. In general the noise characteristics of a fan are coupled to both the fans aerodynamic performance characteristics and duct acoustics. A better understanding of the relationship between the fan's overall performance characteristics and the fan's flow field characteristics and their correlation would give the fan
designer a better understanding of the possible flow mechanisms responsible for the decrease in fan performance and efficiency, and the increase in the noise levels found in typical HVAC fans (with forward curved impeller geometries). For this purpose conventional and special (shear thickening) dye injection flow visualization techniques were used in water to study the complex 3-dimensional vortical and unsteady flow patterns that occur in typical HVAC fans. The scaling laws indicated that a 1 to 1 scale model was sufficient for the proper application of low speed (less than 1 m/s) flow visualization techniques. Maintaining constancy of Reynolds number implied that the model fan speed and the flow rate can both be reduced by a factor of fifteen because the kinematic viscosity of water is 1/15 that of air. This reduction in the flow velocity was essential in order to use the dye injection technique. Fan scroll diffuser interaction was also studied as function of fan speed. Flow visualization was able to indicate the large-scale flow patterns through the blower and clearly showed areas of flow separation (which is the major cause of aerodynamic inefficiency and noise production) and recirculation zones within the blower housing. SIMILARITY AND SCALING LAWS APPLIED TO ROTATING INCOMPRESSIBLE FLOWS
The equations describing the flow through the blades of an HVAC fan are the Navier-Stokes equations. Under the assumptions of incompressible flow and Newtonian fluid, these are given by the following differential form (Batchelor (1967))
∂∂ ρ
νr r r
rr r r ru
tu u
pu B u rf+ ⋅ ∇ = −
∇+ ∇ + − × − × ×2 2Ω Ω Ω( )
1.1 The last two terms are the Coriolis and centripetal forces, respectively. In addition to the equation of motion, the continuity equation must also be satisfied.
∇ ⋅ =ru 0 1.2
The Navier-Stokes and Mass continuity equations can be non-dimensionalized assuming the fan rotation speed (Ω); fluid density (ρ) and fluid viscosity (ν) are all constant. After some manipulations (Sardar (2001) it can be shown that the non-dimensional from of the equations become:
)()(Re
2
2
2∗∗∗∗∗
∗∗∗∗∗
∗
∗
×Ω×Ω−×Ω−+∇+∇−=∇⋅+ rStruStrFrBu
pEuuuttu
Str f
∂∂
Where ∞
Ω=U
LStr : Eu
P PU
=− ∞
∞05 2. ρ: Re = ∞U L
ν:
FrU
Lg= ∞ 1.3
and 0=′⋅∇ ur
1.4
Where the terms Str, Re, Eu and Fr represent key dimensionless parameters in fluid dynamics. These dimensionless, Eqs.1.3 and 1.4, can be used to establish similarity requirements. If two different flow systems are
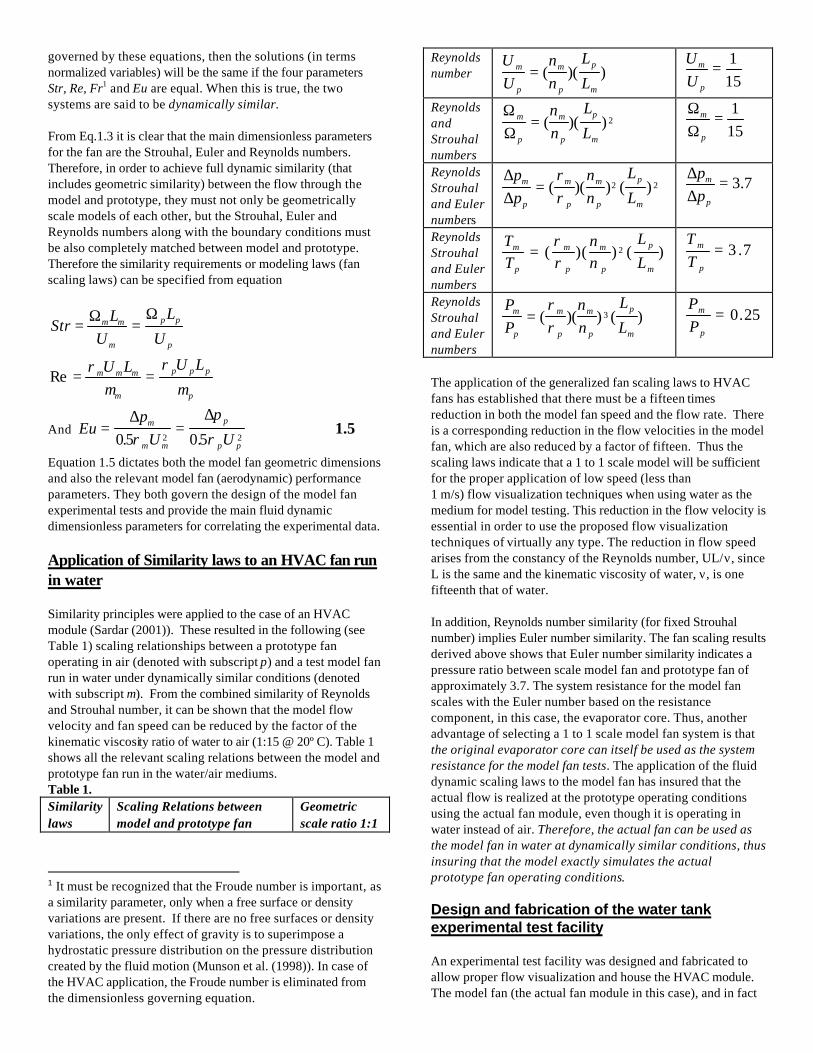
governed by these equations, then the solutions (in terms normalized variables) will be the same if the four parameters Str, Re, Fr1 and Eu are equal. When this is true, the two systems are said to be dynamically similar. From Eq.1.3 it is clear that the main dimensionless parameters for the fan are the Strouhal, Euler and Reynolds numbers. Therefore, in order to achieve full dynamic similarity (that includes geometric similarity) between the flow through the model and prototype, they must not only be geometrically scale models of each other, but the Strouhal, Euler and Reynolds numbers along with the boundary conditions must be also completely matched between model and prototype. Therefore the similarity requirements or modeling laws (fan scaling laws) can be specified from equation
p
pp
m
mm
U
L
UL
StrΩ
=Ω=
p
ppp
m
mmmLULU
µ
ρ
µρ ==Re
And Eup
U
p
Um
m m
p
p p
= =∆ ∆
05 052 2. .ρ ρ 1.5
Equation 1.5 dictates both the model fan geometric dimensions and also the relevant model fan (aerodynamic) performance parameters. They both govern the design of the model fan experimental tests and provide the main fluid dynamic dimensionless parameters for correlating the experimental data.
Application of Similarity laws to an HVAC fan run in water Similarity principles were applied to the case of an HVAC module (Sardar (2001)). These resulted in the following (see Table 1) scaling relationships between a prototype fan operating in air (denoted with subscript p) and a test model fan run in water under dynamically similar conditions (denoted with subscript m). From the combined similarity of Reynolds and Strouhal number, it can be shown that the model flow velocity and fan speed can be reduced by the factor of the kinematic viscosity ratio of water to air (1:15 @ 20º C). Table 1 shows all the relevant scaling relations between the model and prototype fan run in the water/air mediums. Table 1. Similarity laws
Scaling Relations between model and prototype fan
Geometric scale ratio 1:1
1 It must be recognized that the Froude number is important, as a similarity parameter, only when a free surface or density variations are present. If there are no free surfaces or density variations, the only effect of gravity is to superimpose a hydrostatic pressure distribution on the pressure distribution created by the fluid motion (Munson et al. (1998)). In case of the HVAC application, the Froude number is eliminated from the dimensionless governing equation.
Reynolds number
UU
L
Lm
p
m
p
p
m
= ( )( )νν
151=
p
m
UU
Reynolds and Strouhal numbers
ΩΩ
m
p
m
p
p
m
L
L= ( )( )
νν
2 151=
ΩΩ
p
m
Reynolds Strouhal and Euler numbers
∆∆
pp
L
Lm
p
m
p
m
p
p
m
= ( )( ) ( )ρρ
νν
2 2 7.3=∆∆
p
m
pp
Reynolds Strouhal and Euler numbers
TT
L
Lm
p
m
p
m
p
p
m
= ( )( ) ( )ρρ
νν
2 7.3=p
m
TT
Reynolds Strouhal and Euler numbers
PP
L
Lm
p
m
p
m
p
p
m
= ( )( ) ( )ρρ
νν
3 25.0=p
m
PP
The application of the generalized fan scaling laws to HVAC fans has established that there must be a fifteen times reduction in both the model fan speed and the flow rate. There is a corresponding reduction in the flow velocities in the model fan, which are also reduced by a factor of fifteen. Thus the scaling laws indicate that a 1 to 1 scale model will be sufficient for the proper application of low speed (less than 1 m/s) flow visualization techniques when using water as the medium for model testing. This reduction in the flow velocity is essential in order to use the proposed flow visualization techniques of virtually any type. The reduction in flow speed arises from the constancy of the Reynolds number, UL/ν, since L is the same and the kinematic viscosity of water, ν, is one fifteenth that of water. In addition, Reynolds number similarity (for fixed Strouhal number) implies Euler number similarity. The fan scaling results derived above shows that Euler number similarity indicates a pressure ratio between scale model fan and prototype fan of approximately 3.7. The system resistance for the model fan scales with the Euler number based on the resistance component, in this case, the evaporator core. Thus, another advantage of selecting a 1 to 1 scale model fan system is that the original evaporator core can itself be used as the system resistance for the model fan tests. The application of the fluid dynamic scaling laws to the model fan has insured that the actual flow is realized at the prototype operating conditions using the actual fan module, even though it is operating in water instead of air. Therefore, the actual fan can be used as the model fan in water at dynamically similar conditions, thus insuring that the model exactly simulates the actual prototype fan operating conditions. Design and fabrication of the water tank experimental test facility
An experimental test facility was designed and fabricated to allow proper flow visualization and house the HVAC module. The model fan (the actual fan module in this case), and in fact

the entire HVAC assembly (see Fig. 1), was placed in a large lexan tank (volume of about 400 gallons).
Fig.1 HVAC fan module used in the flow visualization study That motor was coupled via a gear reduction of 15 times to achieve the correct model fan speed (see Fig. 2). The geometric dimensions of the 400-gallon tank were 6 ft x 3 ft x 3 ft . The test HVAC model had maximum dimensions of 1.3 ft x 1 ft x 1 ft . The water tank was fabricated using clear lexan sheet material, with tank walls of half-inch thickness and a tank floor of 1-in. thick clear lexan. The tank wall was fastened with screws and was made watertight using silicon sealant at all the wall junctions to prevent leakage. The tank walls were braced (supported) using steel plates in order to distribute the load along the walls due to the water pressure. A steel frame was made for the tank in order to provide extra support at the corners and sides. This also allowed for ease of transportation of the tank.
Fig.2 The fan drive system used in the water tank test facility. The model fan was submerged under water, such that the inlet of the fan was at a depth of 18 inches under the water surface. In addition, the model fan was placed in the center of the tank width-wise; but lengthwise the fan was positioned at 26 in. from one of the end walls, so that there is sufficient space available for the exit flow to diffuse before returning to the fan inlet side. The size of the tank was large enough to ensure that the exit flow from the evaporator is decoupled from the flow at the fan inlet. This was verified by using both tufts and conventional dye to observe the return flow pattern along the exterior of the HVAC model fan. Both the flow visualization techniques confirmed that the flow entering the fan inlet orifice
was similar to a potential flow pattern that is analogous to the flow pattern at the inlet of a suction duct from an infinite environment (for example the flow into the Borda's mouthpiece (Batchelor (1967)). The actual HVAC module was modified to allow for the application of the visualization techniques by replacement of key sections of the module casing with clear lexan panels (with a thickness of 1/16 inch). Regions of the fan scroll, and the diffuser walls were cut out and the lexan put in its place, as shown in Figs. 3a and 3b.
Fig.3a Location of flow visualization windows: side view.
Fig.3b. Location of dye injection points on the HVAC module. The HVAC model was completely submerged inside the water tank and was held in place by four aluminum threaded rods connected to the top plate which was placed on top of the steel frame around the tank, (Fig. 4). Fig.4. The water tank facility used for flow visualization inside
an actual automotive HVAC module. The dc motor and reduction gear was rigidly connected to the top Plexiglass plates. The fan shaft was properly aligned and connected to the output of the reduction gear via two concentric aluminum shafts. The fan shaft was press fitted to the fan impeller and secured by an additional setscrew.
It was important that the model fan be rigidly supported inside the tank since the fan experiences angular torques and rectilinear motion in both the horizontal directions. Proper fastening and supporting the fan model to the top Plexiglass plate via four struts achieved this. Fan casing vibration and oscillations can cause interference with the fan's internal flow field. For example, pulsatile or unsteady oscillations in the flow field could cause flow features, which are not attributable to the flow field generated by the HVAC fan when operating in an undisturbed environment. It was shown from the fan scaling laws (see Table 1) that full dynamic similarity is achieved if the mo del fan speed is reduced to 1/15th of that the prototype (for a one-to-one scale ratio between the model operating in water and prototype operating in air). This model fan speed reduction was achieved through a reduction gear (worm type), acting with a horizontal input and vertical output. The speed reduction gear was coupled to a dc motor (1/4 hp and 3600 rpm max.), which ran off a variable dc power supply (e.g., 30 V and 20 amps max.). The speed of the fan was determined by using a stroboscope on the motor output shaft (i.e., the input to the reduction gear). The fan speed was altered by varying the input voltage and letting the current draw be set by the fan /system coupling itself, which served as an indicator for system resistance. The fan speed was mo nitored by a stroboscope. Notice that the fan speed can be reduced independent of the system resistance (backpressure) using this method of fan testing. Experimental methodology
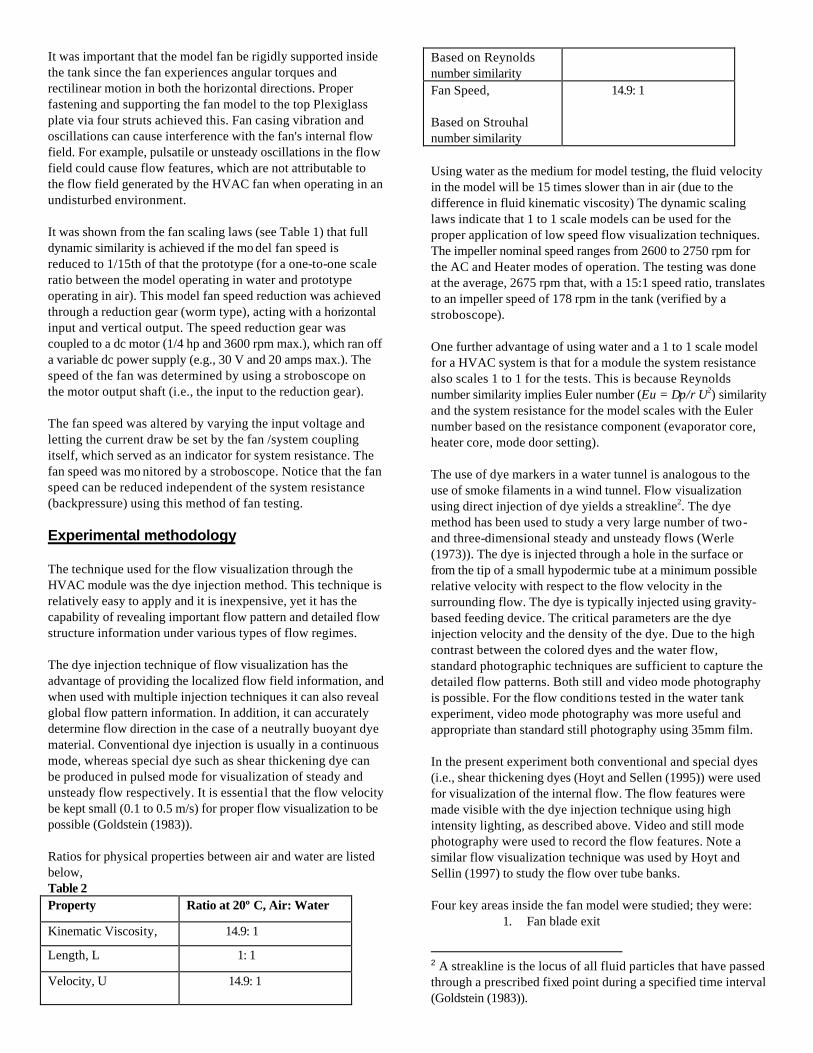
The technique used for the flow visualization through the HVAC module was the dye injection method. This technique is relatively easy to apply and it is inexpensive, yet it has the capability of revealing important flow pattern and detailed flow structure information under various types of flow regimes. The dye injection technique of flow visualization has the advantage of providing the localized flow field information, and when used with multiple injection techniques it can also reveal global flow pattern information. In addition, it can accurately determine flow direction in the case of a neutrally buoyant dye material. Conventional dye injection is usually in a continuous mode, whereas special dye such as shear thickening dye can be produced in pulsed mode for visualization of steady and unsteady flow respectively. It is essential that the flow velocity be kept small (0.1 to 0.5 m/s) for proper flow visualization to be possible (Goldstein (1983)). Ratios for physical properties between air and water are listed below, Table 2 Property Ratio at 20º C, Air: Water
Kinematic Viscosity, 14.9: 1
Length, L 1: 1
Velocity, U
14.9: 1
Based on Reynolds number similarity Fan Speed, Based on Strouhal number similarity
14.9: 1
Using water as the medium for model testing, the fluid velocity in the model will be 15 times slower than in air (due to the difference in fluid kinematic viscosity) The dynamic scaling laws indicate that 1 to 1 scale models can be used for the proper application of low speed flow visualization techniques. The impeller nominal speed ranges from 2600 to 2750 rpm for the AC and Heater modes of operation. The testing was done at the average, 2675 rpm that, with a 15:1 speed ratio, translates to an impeller speed of 178 rpm in the tank (verified by a stroboscope). One further advantage of using water and a 1 to 1 scale model for a HVAC system is that for a module the system resistance also scales 1 to 1 for the tests. This is because Reynolds number similarity implies Euler number (Eu = ∆p/ρU2) similarity and the system resistance for the model scales with the Euler number based on the resistance component (evaporator core, heater core, mode door setting). The use of dye markers in a water tunnel is analogous to the use of smoke filaments in a wind tunnel. Flow visualization using direct injection of dye yields a streakline2. The dye method has been used to study a very large number of two- and three-dimensional steady and unsteady flows (Werle (1973)). The dye is injected through a hole in the surface or from the tip of a small hypodermic tube at a minimum possible relative velocity with respect to the flow velocity in the surrounding flow. The dye is typically injected using gravity-based feeding device. The critical parameters are the dye injection velocity and the density of the dye. Due to the high contrast between the colored dyes and the water flow, standard photographic techniques are sufficient to capture the detailed flow patterns. Both still and video mode photography is possible. For the flow conditions tested in the water tank experiment, video mode photography was more useful and appropriate than standard still photography using 35mm film. In the present experiment both conventional and special dyes (i.e., shear thickening dyes (Hoyt and Sellen (1995)) were used for visualization of the internal flow. The flow features were made visible with the dye injection technique using high intensity lighting, as described above. Video and still mode photography were used to record the flow features. Note a similar flow visualization technique was used by Hoyt and Sellin (1997) to study the flow over tube banks. Four key areas inside the fan model were studied; they were:
1. Fan blade exit
2 A streakline is the locus of all fluid particles that have passed through a prescribed fixed point during a specified time interval (Goldstein (1983)).

2. Fan scroll cut-off 3. Fan throat 4. Diffuser and Upstream of evaporator core.
The dye was injected using 1 mm hypodermic needles at the locations shown in Fig.3b. With the conventional dye, different colors were used to highlight critical flow features such as flow swirl and vortices, and indicate flow direction and flow migration patterns inside the fan/scroll/diffuser. Manual dye injection was done using standard syringes (20-30 cc.), for both the conventional dye and the shear thickening dye. In a few cases, however, a variable displacement pump was used to dispense the dye-streak flow at constant rate. The dye injection was used for both the plan view and side view visualization video/photographs. In all cases the strobe lamps illumination was used from lamps (500-1500Watts) located outside the of the water tank. Two types of videos were used for most of the photography; they were: a standard Panasonic VHS camcorder and a professional Panasonic HVHS (with double resolution) video camera. Standard photography (35mm-film) and videos (mentioned above) documented all the flow visualization results. The video results proved to be much more useful in showing the progressive fluid motions, and in highlighting critical unsteady flow phenomena. They also showed the presence of remarkable 3-D flow patterns within the HVAC fan module. From the videos, still images were captured using special frame grabbing software, which were digitized on a PC and placed on it in jpeg/tiff format. This method is far superior and more appropriate for still shots in unsteady flow using present-day technology, than the standard photography method. FLOW VISUALIZATION RESULTS
One set of tests results was conducted by varying fan input voltage from 6 to 16 volts in steps of 2 volts, which resulted in the prototype equivalent fan speed variation from between 800 rpm to about 3200 rpm. The flow visualization results indicated that the local flow characteristics are strongly dependent on the fan speed. In particular, there is more recirculating flow around the fan impeller and at the cut-off region of the fan throat exit for low fan speeds (i.e., model <150 rpm, which translates to prototype < 2250 rpm), compared to high fan speeds (model > 150 rpm) \it at fixed downstream system resistance. At the higher fan speed settings above (model > 150 rpm and prototype < 2250 rpm), the flow features were relatively insensitive to fan speed variation at fixed backpressure (See Figs. 5 and 6).
Fig.5 Fan throat region: 0.25H, fan operating at (8 volts and 1200 Rpm. Fig.6. Fan throat region: 0.25H, fan operating at 14 volts and 2200 Rpm
Fan cut-off region Fan cut-off region: unsteady vortical flow with flow reversal/recirculation was observed at adjacent to the cut-off at a height of 0.25H (where H is the fan throat height) from the bottom of the fan scroll and spanned an area of about 30% of the fan throat cross-sectional (see Figs.7 to 9). The main characteristic of the flow near the cut-off is the fact that the flow reverses direction along the cut-off wall (before entering the diffuser), and flows back into the scroll area, that is, between the cut-off and the fan impeller.
Fig.7 Fan cut-off region at 0.25H and 10V using milk-dye.
Fig.8 Fan cut-off region at 0.5H using milk-dye.
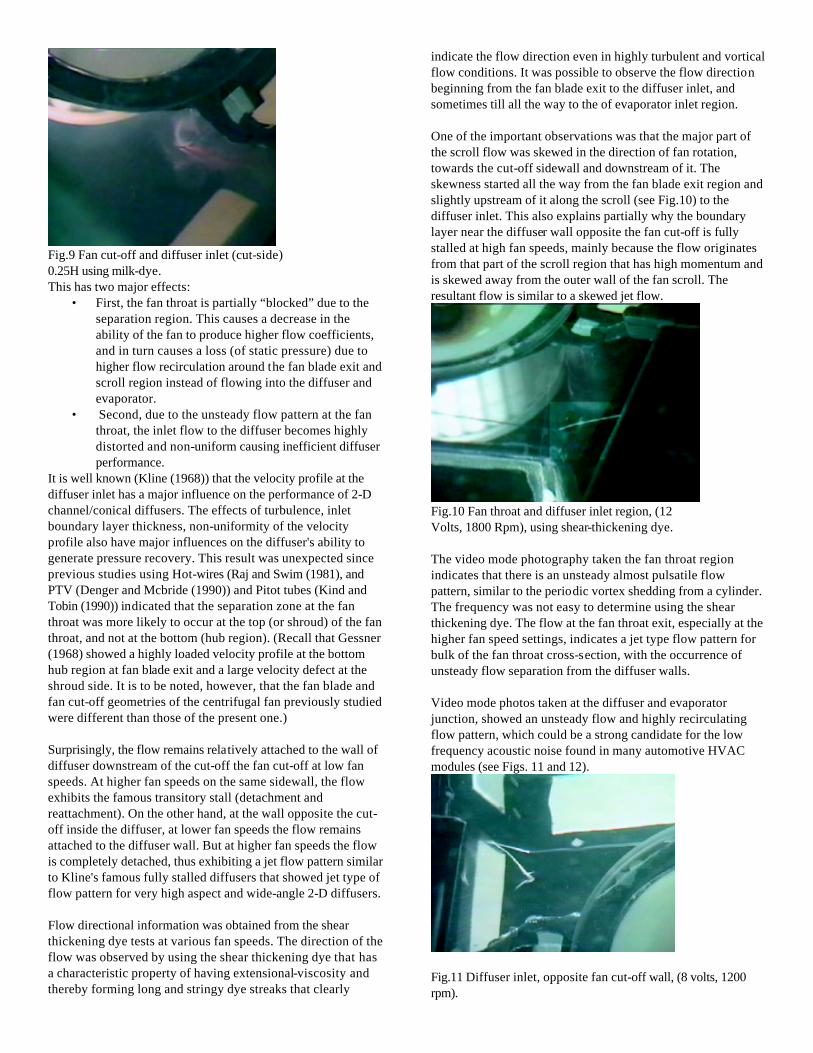
Fig.9 Fan cut-off and diffuser inlet (cut-side) 0.25H using milk-dye. This has two major effects:
• First, the fan throat is partially “blocked” due to the separation region. This causes a decrease in the ability of the fan to produce higher flow coefficients, and in turn causes a loss (of static pressure) due to higher flow recirculation around the fan blade exit and scroll region instead of flowing into the diffuser and evaporator.
• Second, due to the unsteady flow pattern at the fan throat, the inlet flow to the diffuser becomes highly distorted and non-uniform causing inefficient diffuser performance.
It is well known (Kline (1968)) that the velocity profile at the diffuser inlet has a major influence on the performance of 2-D channel/conical diffusers. The effects of turbulence, inlet boundary layer thickness, non-uniformity of the velocity profile also have major influences on the diffuser's ability to generate pressure recovery. This result was unexpected since previous studies using Hot-wires (Raj and Swim (1981), and PTV (Denger and Mcbride (1990)) and Pitot tubes (Kind and Tobin (1990)) indicated that the separation zone at the fan throat was more likely to occur at the top (or shroud) of the fan throat, and not at the bottom (hub region). (Recall that Gessner (1968) showed a highly loaded velocity profile at the bottom hub region at fan blade exit and a large velocity defect at the shroud side. It is to be noted, however, that the fan blade and fan cut-off geometries of the centrifugal fan previously studied were different than those of the present one.) Surprisingly, the flow remains relatively attached to the wall of diffuser downstream of the cut-off the fan cut-off at low fan speeds. At higher fan speeds on the same sidewall, the flow exhibits the famous transitory stall (detachment and reattachment). On the other hand, at the wall opposite the cut-off inside the diffuser, at lower fan speeds the flow remains attached to the diffuser wall. But at higher fan speeds the flow is completely detached, thus exhibiting a jet flow pattern similar to Kline's famous fully stalled diffusers that showed jet type of flow pattern for very high aspect and wide-angle 2-D diffusers. Flow directional information was obtained from the shear thickening dye tests at various fan speeds. The direction of the flow was observed by using the shear thickening dye that has a characteristic property of having extensional-viscosity and thereby forming long and stringy dye streaks that clearly
indicate the flow direction even in highly turbulent and vortical flow conditions. It was possible to observe the flow direction beginning from the fan blade exit to the diffuser inlet, and sometimes till all the way to the of evaporator inlet region. One of the important observations was that the major part of the scroll flow was skewed in the direction of fan rotation, towards the cut-off sidewall and downstream of it. The skewness started all the way from the fan blade exit region and slightly upstream of it along the scroll (see Fig.10) to the diffuser inlet. This also explains partially why the boundary layer near the diffuser wall opposite the fan cut-off is fully stalled at high fan speeds, mainly because the flow originates from that part of the scroll region that has high momentum and is skewed away from the outer wall of the fan scroll. The resultant flow is similar to a skewed jet flow.
Fig.10 Fan throat and diffuser inlet region, (12 Volts, 1800 Rpm), using shear-thickening dye. The video mode photography taken the fan throat region indicates that there is an unsteady almost pulsatile flow pattern, similar to the periodic vortex shedding from a cylinder. The frequency was not easy to determine using the shear thickening dye. The flow at the fan throat exit, especially at the higher fan speed settings, indicates a jet type flow pattern for bulk of the fan throat cross-section, with the occurrence of unsteady flow separation from the diffuser walls. Video mode photos taken at the diffuser and evaporator junction, showed an unsteady flow and highly recirculating flow pattern, which could be a strong candidate for the low frequency acoustic noise found in many automotive HVAC modules (see Figs. 11 and 12).
Fig.11 Diffuser inlet, opposite fan cut-off wall, (8 volts, 1200 rpm).
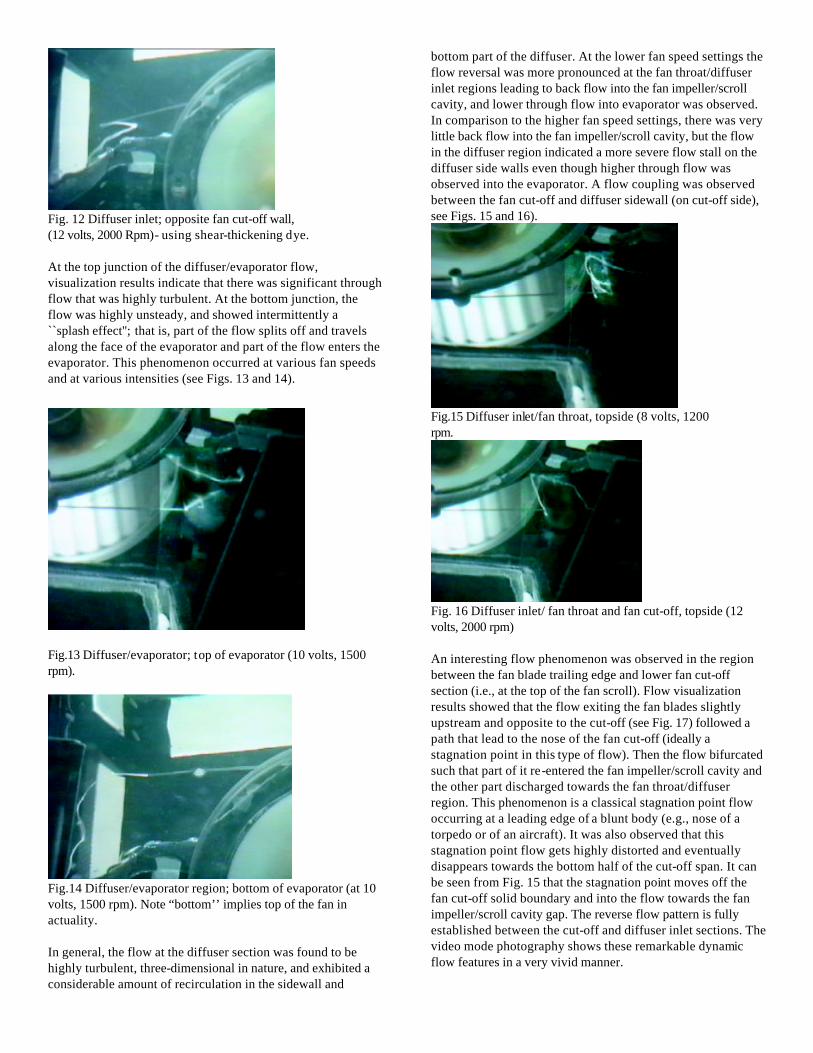
Fig. 12 Diffuser inlet; opposite fan cut-off wall, (12 volts, 2000 Rpm)- using shear-thickening dye. At the top junction of the diffuser/evaporator flow, visualization results indicate that there was significant through flow that was highly turbulent. At the bottom junction, the flow was highly unsteady, and showed intermittently a ``splash effect''; that is, part of the flow splits off and travels along the face of the evaporator and part of the flow enters the evaporator. This phenomenon occurred at various fan speeds and at various intensities (see Figs. 13 and 14).
Fig.13 Diffuser/evaporator; top of evaporator (10 volts, 1500 rpm).
Fig.14 Diffuser/evaporator region; bottom of evaporator (at 10 volts, 1500 rpm). Note “bottom’’ implies top of the fan in actuality. In general, the flow at the diffuser section was found to be highly turbulent, three-dimensional in nature, and exhibited a considerable amount of recirculation in the sidewall and
bottom part of the diffuser. At the lower fan speed settings the flow reversal was more pronounced at the fan throat/diffuser inlet regions leading to back flow into the fan impeller/scroll cavity, and lower through flow into evaporator was observed. In comparison to the higher fan speed settings, there was very little back flow into the fan impeller/scroll cavity, but the flow in the diffuser region indicated a more severe flow stall on the diffuser side walls even though higher through flow was observed into the evaporator. A flow coupling was observed between the fan cut-off and diffuser sidewall (on cut-off side), see Figs. 15 and 16).
Fig.15 Diffuser inlet/fan throat, topside (8 volts, 1200 rpm.
Fig. 16 Diffuser inlet/ fan throat and fan cut-off, topside (12 volts, 2000 rpm) An interesting flow phenomenon was observed in the region between the fan blade trailing edge and lower fan cut-off section (i.e., at the top of the fan scroll). Flow visualization results showed that the flow exiting the fan blades slightly upstream and opposite to the cut-off (see Fig. 17) followed a path that lead to the nose of the fan cut-off (ideally a stagnation point in this type of flow). Then the flow bifurcated such that part of it re-entered the fan impeller/scroll cavity and the other part discharged towards the fan throat/diffuser region. This phenomenon is a classical stagnation point flow occurring at a leading edge of a blunt body (e.g., nose of a torpedo or of an aircraft). It was also observed that this stagnation point flow gets highly distorted and eventually disappears towards the bottom half of the cut-off span. It can be seen from Fig. 15 that the stagnation point moves off the fan cut-off solid boundary and into the flow towards the fan impeller/scroll cavity gap. The reverse flow pattern is fully established between the cut-off and diffuser inlet sections. The video mode photography shows these remarkable dynamic flow features in a very vivid manner.

Fig. 17 Fan cut-off, topside (8 volts, 1200 rpm.
Fig.18: Diffuser inlet/fan throat, topside (8 volts, 1200 rpm)
Fig.19 Diffuser inlet/ fan throat and fan cut-off, topside (12 volts, 2000 rpm) using shear-thickening dye injection. Shear layer formation at diffuser inlet and fan blade exit Present results showed the existence of a large-scale vortical flow structure at the fan throat (see Figs. 18 and 19), which extended well into the diffuser region. This causes a total pressure loss, and decreases the efficiency of the diffuser. This can be interpreted as swirling flow with lower velocities in the core region. Similarly a single large-scale vortex was observed at the exit of the Large Scale Blower (LSB) fan (Sardar (2001)) using the tuft flow visualization technique. Flow visualization studies using shear thickening dye also highlighted the dynamics of the vortical structure, which was unsteady in nature. Its core width and length varied, not only with fan speed, but also showed variation at fixed fan speed. Identification of this type of flow phenomena was possible only with video mode photography. The unsteady vortex at the fan throat is indicative of a more complex flow interaction among the flow from the rotating fan blades, fan cut-off and fan scroll. Notice that the presence of flow swirl cannot be attributed to the diffuser, since the flow visualization tests on the LSB fan (Sardar (2001)) were conducted without any diffuser or extra outlet ducting, but showed precisely the presence of a single large vortex. Some researchers have
noticed a double vortex structure at the exit of centrifugal fan with backward curved blades (Cau et al. (1987)) similar to the occurrence of the classical double vortex in the circular pipes. Flow visualization using the shear thickening dye injection can be used as an unstable/unsteady flow diagnostic technique for the detection of transitory stall, rotating stall in fan blades for centrifugal fans. Greitzer’s (1981) review on the stability of pumping systems has indicated that stall can occur in an intermittent and progressive fashion in centrifugal fans, unlike the stall in axial compressors that occurs abruptly at reduced flow rates.
Fig. 20 shows the flow reversal at the Fan cut-off region. It also shows the variation of flow direction variation along the span of the cut-off wall.
Fig. 21 Fan blade exit and scroll flow towards the bottom fan at 12volts.
Fig.22 Fan throat/diffuser inlet region (at 10Volts). Figs. 9_18 to 9_22 show flow reversal patterns at the lower fan speed than at higher fan speed. Note that at fixed downstream system resistance (at a constant load), a lower fan speed implies a lower volume flow rate. At the lower volume flow rates, flow reversal is stronger and more widespread toward the

cut-off side than at higher volume flow rates (and at higher fan speeds at constant load). In fact, the flow reverses back into the fan region from the diffuser side and from the fan impeller and cut-off side towards the fan throat. The flow pattern observed at fan throat exit is highly skewed and shows a major shift in direction (near the cut-off wall) as fan speed is altered. The flow pattern in the diffuser region just upstream of the evaporator also changes drastically with changes in fan speed (or voltage input to blower motor). At a fixed system resistance fan operation, a higher fan input voltage (i.e., higher fan speed) results in a much smoother flow pattern (less large-scale fluctuation compared to highly pulsatile and oscillatory flow pattern observed at the lower fan speed settings) across the fan throat. In addition, at the higher fan speed (or flow rate) the flow was observed to be more uniform across the evaporator face compared to large-scale fluctuation and recirculation observed at the low flow rate. CONCLUSION
The application of the generalized (viscous) fan scaling laws to HVAC fans for the purpose of comparing model and prototype testing between and air/water systems was presented. The scaling laws indicate that a 1 to 1 scale model will be sufficient for the proper application of low speed (less than 1 m/s) flow visualization techniques when using water as the medium for model testing. This reduction in the flow velocity is essential in order to use the proposed flow visualization techniques of virtually any type. The reduction in flow speed arises from the constancy of the Reynolds number, UL/ν, since L is the same and the kinematic viscosity of water, ν, is one fifteenth that of water. Further, a fifteen times reduction in the flow velocity in the model fan implies that the model fan speed and the flow rate are reduced by a factor of fifteen. Application of the fluid dynamic similarity laws shows a three times scale model operated in water could provide an even more substantial reduction of flow velocity. Although the scale change is only 3, the reduction in velocity is 45, and in fan speed 135! Obviously such a model could create considerable opportunities for the experimentalist to visualize and measure the flow, and perhaps provide even be the difference between the success and failure of a measurement program. Moreover, if the above scaling relations presented above are adhered to, even accurate predictions of the air values for torque, power, etc. can be made from measurements taken in water. This can be used to great advantage in testing, since the order of magnitude differences make some measurements easier and more accurate in water, while others are better made in air. Flow visualization studies on an actual HVAC indicated that the major advantage of the using the shear-thickening dye over the convenient dye. The shear-thickening dye was very effective in showing regions of reversing flow, oscillatory flow, sudden changes in flow direction, the convecting flow path and presence of large shear even under very turbulent flow conditions. Conventional dye could not track the flow due it
rapid diffusion characteristics and was not very useful in identifying flow features at high flow velocities. ACKNOWLEDGMENTS
The authors would like to express their deep appreciation to Dr. Steven P. Capp of Delphi Systems Inc. for his many helpful comments throughout the course of this work. This study was an outgrowth of work originally funded by Delphi Systems Inc., and their initial support is gratefully acknowledged. Dr. Sardar is further indebted to Air International US Inc (Mr. Norm Golm in particular) for its continuing support.
REFERENCES
1. J. Clauzel and P. Gilette. CFD Turbine Blade Analysis of an A/C Automotive Blower. SAE Technical Paper No. 970111 (Reprint from SP-1239). International Congress & Exposition, Detroit Michigan, Feb 24-27, 1997.
2. S. C. Guzy. Centrifugal fan blade design using two-dimensional blade passage analysis program. Master’s Thesis, State University of New York at Buffalo, June 1995.
3. J. P. Crowder, in Handbook of Flow Visualization (ed). CRC Press, sections 38-1 to 38-42, 1998.
4. Wen-Jei. Yang. (Ed.) Handbook of Flow Visualization. Hemisphere Publishing Corp., 1989.
5. T. J. Mueller. Flow visualization by direct injection, in Fluid Mechanics Measurements. pp. 307-375, R. J. Goldstien (Ed.), Hemisphere, New York, 1983
6. W. Merzkirch. Flow visualization. 2nd ed., Academic Press, New York, 1974
7. J. P. Clayton and B. S. Massey. Flow visualization of in water: A review. J. Sci. Instruments, 44:2-11, 1967
8. H. Werle. Hydrodynamic flow visualization. Annu. Rev. Fluid Mechanics, 5:361-382, 1973.
9. G. K. Batchelor. An Introduction to Fluid Dynamics. Cambridge University Press, London, 1967.
10. A. M. Sardar. Centrifugal fans: Similarity, Scaling Laws, and Fan Performance. Ph. D. Thesis, State University of New York at Buffalo, June 2001.
11. Munson et al. Fluid Mechanics, McGraw-Hill, 1998. 12. R. J. Goldstien. Fluid Mechanics Measurements.
Hemisphere publishing Corp., 1983. 13. T. Hoyt, J. Sellin. A turbulent-flow dye-streak technique.
Experiments in Fluids, 20, 1995. 14. T. Hoyt, J. Sellin. Flow over tube banks- a flow
visualization study. Journal of Fluids engineering, 119, 1997.
15. S. J. Kline. On the nature of stall. Journal of basic Engineering, pages 305-320, September 1959.
16. F. B.Gessner. An experimental study of the centrifugal fan inlet flow and its influence on fan performance. Technical Report Paper No. 67-Fe-21, ASME, 1968.
17. G. Cau, N. Mandas, and F. Nurzia. Measurements of primary and secondary flows in an industrial forward-curved centrifugal fan. Journal of Fluids Engineering, 109:353-358, December 1987.

18. E. M. Greitzer. The Stability of Pumping Systems – The Freeman Scholar Lecture. Journal of Fluids Engineering, Trans. ASME, Vol. 103:193-242, June 1987.
19. W. Niese. Review of noise reduction methods for centrifugal fans. Journal of Engineering for Industry, 104:151-161, May 1982.
20. D. Raj, W. B. Swim. Measurements of the mean flow velocity and velocity fluctuations at the exit of an FC centrifugal fan rotor. Journal of Engineering for Power, 103:393-399, April 1981.
21. G. R. Denger, M. W. Mcbride. Three-dimensional flow field characteristics measured in a forward-curved centrifugal
blower-using particle tracing Velocimetry (PTV). In proceedings of the Fluid Measurement and Instrumentation Forum, ASME, 95:49-56, 1990.
22. R. J, Kind, M. G. Tobin. Flow in a centrifugal fan of the squirrel-cage type. ASME Journal of Fluids engineering, 112:84-90, January 1990.
CONTACT
Dr. Asad Sardar (E-mail: [email protected]).