Flat lens for pulse focusing of elastic waves in thin plates
17
HAL Id: hal-01680699 https://hal.univ-antilles.fr/hal-01680699 Submitted on 6 Jun 2019 HAL is a multi-disciplinary open access archive for the deposit and dissemination of sci- entific research documents, whether they are pub- lished or not. The documents may come from teaching and research institutions in France or abroad, or from public or private research centers. L’archive ouverte pluridisciplinaire HAL, est destinée au dépôt et à la diffusion de documents scientifiques de niveau recherche, publiés ou non, émanant des établissements d’enseignement et de recherche français ou étrangers, des laboratoires publics ou privés. Flat lens for pulse focusing of elastic waves in thin plates Marc Dubois, M. Farhat, E. Bossy, S. Enoch, S. Guenneau, P. Sebbah To cite this version: Marc Dubois, M. Farhat, E. Bossy, S. Enoch, S. Guenneau, et al.. Flat lens for pulse focusing of elastic waves in thin plates. Applied Physics Letters, American Institute of Physics, 2013, 103 (7), pp.071915. 10.1063/1.4818716. hal-01680699
-
Upload
khangminh22 -
Category
Documents
-
view
1 -
download
0
Transcript of Flat lens for pulse focusing of elastic waves in thin plates

HAL Id: hal-01680699https://hal.univ-antilles.fr/hal-01680699
Submitted on 6 Jun 2019
HAL is a multi-disciplinary open accessarchive for the deposit and dissemination of sci-entific research documents, whether they are pub-lished or not. The documents may come fromteaching and research institutions in France orabroad, or from public or private research centers.
L’archive ouverte pluridisciplinaire HAL, estdestinée au dépôt et à la diffusion de documentsscientifiques de niveau recherche, publiés ou non,émanant des établissements d’enseignement et derecherche français ou étrangers, des laboratoirespublics ou privés.
Flat lens for pulse focusing of elastic waves in thin platesMarc Dubois, M. Farhat, E. Bossy, S. Enoch, S. Guenneau, P. Sebbah
To cite this version:Marc Dubois, M. Farhat, E. Bossy, S. Enoch, S. Guenneau, et al.. Flat lens for pulse focusing ofelastic waves in thin plates. Applied Physics Letters, American Institute of Physics, 2013, 103 (7),pp.071915. �10.1063/1.4818716�. �hal-01680699�
1
Flat lens for pulse focusing of elastic waves in thin plates
M. Dubois1, M. Farhat2,3, E. Bossy1, S. Enoch2, S. Guenneau2, P. Sebbah1
1 Institut Langevin, ESPCI ParisTech, CNRS 7587, 1 Rue Jussieu, 75238 Paris Cedex 05, France.
2 Aix-Marseille Université, CNRS, Ecole Centrale Marseille, Institut Fresnel, 13013 Marseille, France
3Institute of Condensed Matter Theory and Solid State Optics, Abbe Center of Photonics, Friedrich-Schiller-
Universität Jena, D-07743 Jena, Germany
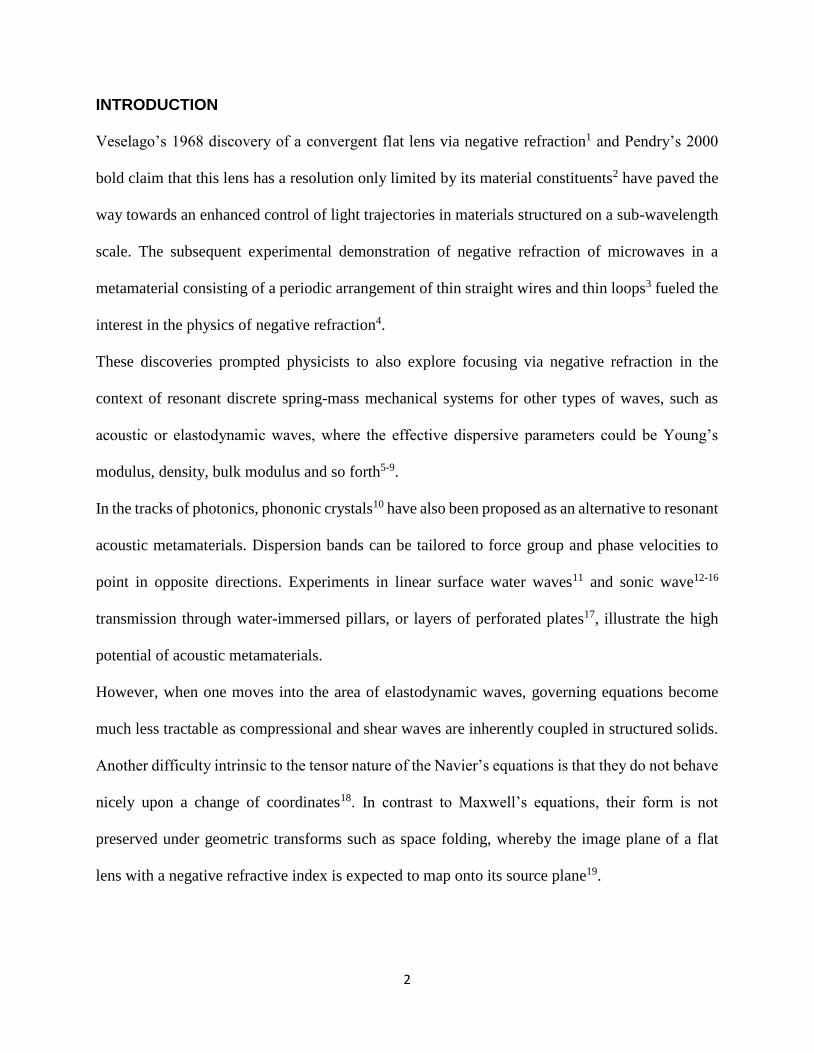
The ability of left-handed materials to overcome the diffraction limit was first
considered as one of the most exciting and challenging outcome of the negative refraction
concept. Flat lens focusing of elastic waves is however a challenge. We demonstrate
broadband focusing of elastic waves at 10 kHz carrier frequency, below the first stop band,
in a 45°-tilted square array of circular air holes perforated in a Duraluminium thin plate.
By adjusting the relative thickness of the outer plate we achieve large-angle negative
refraction with diffraction-limited lateral resolution. We find good agreement with a simple
beam-lattice model and finite-difference time-domain simulations.
2
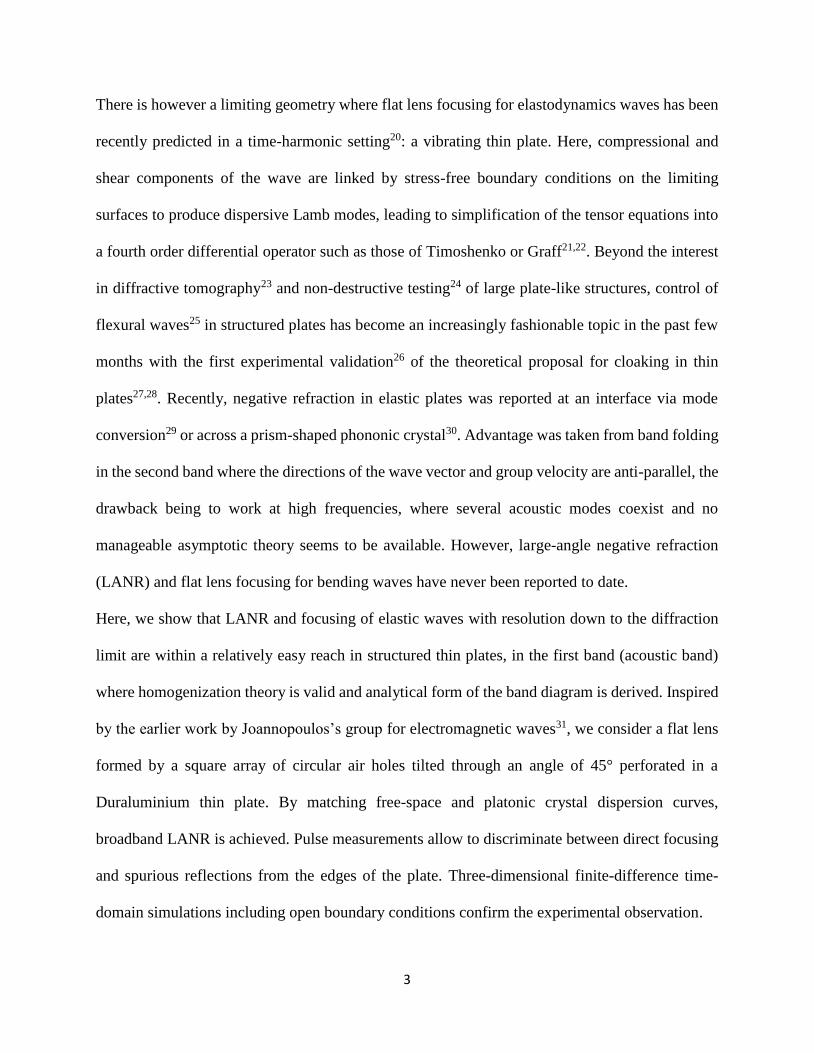
INTRODUCTION
Veselago’s 1968 discovery of a convergent flat lens via negative refraction1 and Pendry’s 2000
bold claim that this lens has a resolution only limited by its material constituents2 have paved the
way towards an enhanced control of light trajectories in materials structured on a sub-wavelength
scale. The subsequent experimental demonstration of negative refraction of microwaves in a
metamaterial consisting of a periodic arrangement of thin straight wires and thin loops3 fueled the
interest in the physics of negative refraction4.
These discoveries prompted physicists to also explore focusing via negative refraction in the
context of resonant discrete spring-mass mechanical systems for other types of waves, such as
acoustic or elastodynamic waves, where the effective dispersive parameters could be Young’s
modulus, density, bulk modulus and so forth5-9.
In the tracks of photonics, phononic crystals10 have also been proposed as an alternative to resonant
acoustic metamaterials. Dispersion bands can be tailored to force group and phase velocities to
point in opposite directions. Experiments in linear surface water waves11 and sonic wave12-16
transmission through water-immersed pillars, or layers of perforated plates17, illustrate the high
potential of acoustic metamaterials.
However, when one moves into the area of elastodynamic waves, governing equations become
much less tractable as compressional and shear waves are inherently coupled in structured solids.
Another difficulty intrinsic to the tensor nature of the Navier’s equations is that they do not behave
nicely upon a change of coordinates18. In contrast to Maxwell’s equations, their form is not
preserved under geometric transforms such as space folding, whereby the image plane of a flat
lens with a negative refractive index is expected to map onto its source plane19.
3
There is however a limiting geometry where flat lens focusing for elastodynamics waves has been
recently predicted in a time-harmonic setting20: a vibrating thin plate. Here, compressional and
shear components of the wave are linked by stress-free boundary conditions on the limiting
surfaces to produce dispersive Lamb modes, leading to simplification of the tensor equations into
a fourth order differential operator such as those of Timoshenko or Graff21,22. Beyond the interest
in diffractive tomography23 and non-destructive testing24 of large plate-like structures, control of
flexural waves25 in structured plates has become an increasingly fashionable topic in the past few
months with the first experimental validation26 of the theoretical proposal for cloaking in thin
plates27,28. Recently, negative refraction in elastic plates was reported at an interface via mode
conversion29 or across a prism-shaped phononic crystal30. Advantage was taken from band folding
in the second band where the directions of the wave vector and group velocity are anti-parallel, the
drawback being to work at high frequencies, where several acoustic modes coexist and no
manageable asymptotic theory seems to be available. However, large-angle negative refraction
(LANR) and flat lens focusing for bending waves have never been reported to date.
Here, we show that LANR and focusing of elastic waves with resolution down to the diffraction
limit are within a relatively easy reach in structured thin plates, in the first band (acoustic band)
where homogenization theory is valid and analytical form of the band diagram is derived. Inspired
by the earlier work by Joannopoulos’s group for electromagnetic waves31, we consider a flat lens
formed by a square array of circular air holes tilted through an angle of 45° perforated in a
Duraluminium thin plate. By matching free-space and platonic crystal dispersion curves,
broadband LANR is achieved. Pulse measurements allow to discriminate between direct focusing
and spurious reflections from the edges of the plate. Three-dimensional finite-difference time-
domain simulations including open boundary conditions confirm the experimental observation.
4
THEORY AND NUMERICS
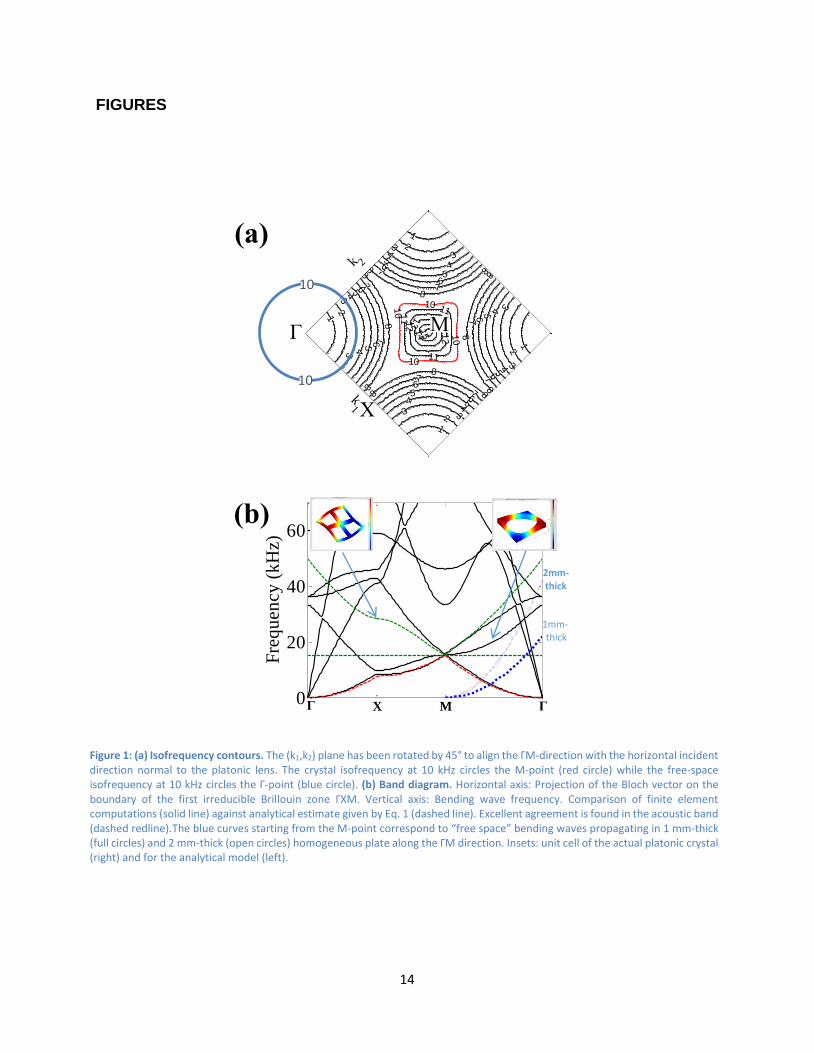
We first compute the equifrequency contour and the band structure (Fig. 1) of the elastodynamic
equations in a platonic crystal: A transversely infinite thin plate structured with a square lattice of
see-through holes. We use Finite Element Method by enforcing Floquet-Bloch conditions on the
opposite vertical boundaries of an elementary cell (a thin box) containing a see-through stress-free
circular cylindrical hole and stress-free top and bottom boundaries (see right inset in Fig.1b). The
effect of the crystal anisotropy and its dependence on geometric parameters (hole radius, r, lattice
constant, l, plate thickness, h) is well understood by the graphical representation of the
isofrequency surfaces (Fig. 1a), which describe the variation of the wave vector with direction and
frequency. Isofrequency contours of the lowest dispersion curve (in red in Fig. 1b) display the
hallmark of LANR in the Γ-M direction: isofrequency surfaces become convex everywhere about
the M-point in the reciprocal space, and the size of the isofrequency contours shrinks with
increasing frequency. The direction of energy transport, determined by the group velocity, vg,
which is perpendicular to the isofrequencies, points inward around the M-point (Fig. 1d), as
opposed to outward around the Γ-point at lower frequencies32.
Remarkably, we find that the acoustic band can be approximated in closed form if one considers
that the flexions of a periodically perforated plate can be mimicked by the flexions of a lattice of
beams33 (see left inset in Fig.1b). Floquet-Bloch bending waves propagating in such a lattice are
described by the dispersion relation20, 33:
sin(𝛽𝑙) [cos(𝑘1𝑙) + cos(𝑘2𝑙) − 2 cos(𝛽𝑙)][cos(𝑘1𝑙) + cos(𝑘2𝑙) − 2 cos h(𝛽𝑙)] = 0 (1)
with 2l the pitch of the array and k1 and k2 the components of the Bloch vector k. We define the
reduced frequency β with 𝛽2 = 𝑝√𝜌ℎ/𝐷 with p the pulsation, D = Eh3/12(1-ν2), the flexural
rigidity, ν the Poisson’s ratio, E the Young’s modulus, h the plate thickness and the plate density.
5
The second factor in this equation provides us with the dashed curves in Fig. 1b. The match
between asymptotics and numerics computed by finite elements method (solid curves in Fig. 1b)
is sharp in the acoustic band. Beyond the acoustic band, the asymptotic model breaks down when
the flexural wave starts sensing the specific shape of air holes, i.e. when we move away from the
homogenization regime.
To demonstrate LANR and flat lens focusing, we now consider a rectangular lens formed by a 45°-
tilted (Γ-M direction) finite-sized section of the platonic crystal perforated in a larger thin plate.
The lens interface, which is optimally oriented with respect to the Γ-M direction, introduces a
mismatch between the isofrequency contours outside and within the platonic crystal (blue and red
contours in Fig. 1a) at the working frequency where negative refraction is expected (above the X-
point). Nevertheless, better adjustment of isofrequency contours is still possible by taking
advantage of an extra degree of freedom offered by the plate geometry: The “free-space” bending-
wave dispersion relation34 is independently adjustable by varying the thickness h of the plate (with
h << λ). The effect of increasing the plate thickness outside the platonic crystal is seen in Fig. 1b
where the point at crossing of the two dispersion curves is brought closer to the working frequency.
Consequently, negative refraction operates on a larger angle32.
EXPERIMENTS
A 2mm-thick Duraluminium rectangular plate35 (500 mm x 300 mm) was first thinned down to
1mm in its central region (98 mm x 300 mm). A regular square lattice of 104 circular holes with
radius 6mm was then computer-aided perforated in this region. The structured plate is shown in
the inset of Fig. 3. The platonic crystal has a lattice constant l = 15 mm, resulting in a surface
filling-fraction of 50% and rectangular dimensions L = 98mm x H = 234mm. The square lattice

6
orientation is 45° with the edges of the plate (Γ-M direction). The edges of the plate are covered
by a 2mm-thick layer of blue-tack on both sides over 2cm, which turns out to be a good absorber
in the kHz range. A 3dB attenuation of the reflected wave at the edges is thus achieved, which is
enough to observe focusing of a short pulse before edge reflections become significant.
Phenyl salicylate (Salol-melting point of 43°C) is used to bond and couple a 1cm-diameter
piezoelectric ceramic pastille (PKS1-4A1 MuRata Shock Sensor) on the plate along its main
median at a distance L/5=1.8 cm from the lattice. A digitized acoustic Gaussian pulse centered at
f0 with bandwidth σ is digital-to-analog converted and amplified before being emitted by the
pastille. In the kHz range, only zero-order symmetric, S0, and anti-symmetric, A0, modes can
propagate in the plate22.
On the other side of the plate, the acoustic field velocity, 𝑣(𝒓, 𝑡) = 𝐴(𝒓, 𝑡) cos(2𝜋𝑓0𝑡 + 𝜑(𝒓, 𝑡)),
is measured at every point at the surface of the plate by a laser vibrometer (Polytec sensor head
OFV505, controller OFV5000). The vibrometer is only sensitive to vertical-displacement velocity
and therefore measures preferentially the anti-symmetric mode A0. An X-Y stage allows scanning
of the probe across the plate, including the crystal. The spatial resolution of the scan is 2mm ×
2mm. The vertical-displacement velocity, 𝑣(𝒓, 𝑡), is measured and the slowly varying envelope,
A(r,t), and phase, φ(r,t) are extracted using the Hilbert transform.
The amplitude-squared, |A(r,t)|2 and the phase φ(r,t) of the velocity field at t = 833 µs are shown
in Fig. 2 for carrier frequencies f0 = 5 kHz and 10 kHz. For a pulse with f0 = 5 kHz and σ = 3.0
kHz, the divergent wavefront issued from the source is seen to traverse the platonic crystal without
much distortion (Fig. 2a,b). This is consistent with the corresponding isofrequency, which
surrounds the Γ-point. Above the X-point, at f0 = 10 kHz, propagation operates a dramatic change
(fig. 2c,d): A convergent wavefront emerges from the platonic crystal and the acoustic pulse
7
refocuses at a distance 0.4L, where L is the lens thickness, and reaches its peak value at t = 833 µs,
348 µs after the initial pulse, which corresponds to the travel time within the periodic lattice. The
lensing effect is best illustrated in the movie36 where the time evolution of the slowly varying
envelope squared |A(r,t)|2 of the velocity-field crossing the sample is shown for an acoustic pulse
centered at f0 = 10 kHz and σ = 2.3 kHz. The contrast is blatant in the phase representation between
the diverging propagating wavefront at f0 = 5 kHz (Fig. 2a) and the wavefront emerging from the
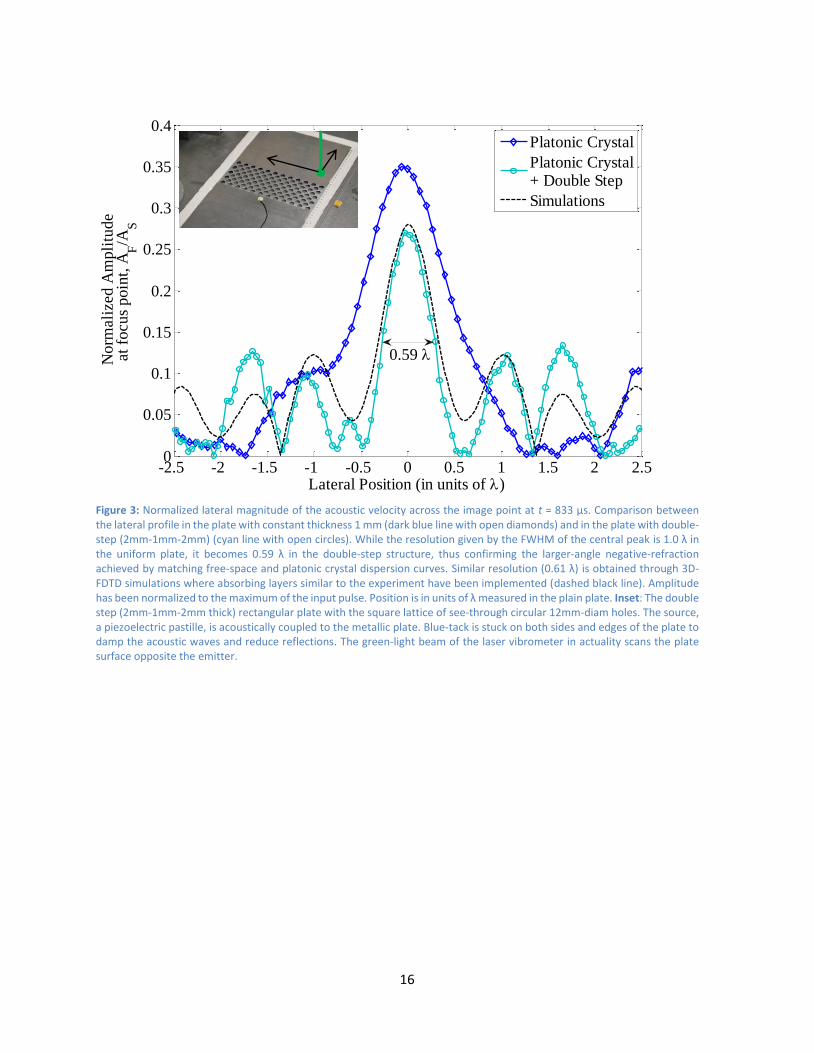
focal point at f0 = 10 kHz (Fig. 2d). We define the lateral resolution as the full width at half
maximum (FWHM) of the lateral amplitude-profile of the image spot. A lateral resolution of 0.59
λ is achieved (Fig. 3, open circles), where λ = 44.7 mm is the wavelength of Lamb waves in the
plate at 10 kHz. A comparison of the maximum amplitude at the focal point, AF, and at the first
side lobes, ASL, gives a lateral contrast |AF- ASL| / |AF + ASL| = 0.63. Interestingly enough, significant
transmission, AF /AS = 27 %, is achieved, where AS is the maximum amplitude at the source
position. To assess the effect of the double-step geometry, we reproduce the experiment in a plate
with identical platonic structure but uniform thickness of 1mm. In this case, the resolution at focus
is no better than 1.05 λ (Fig. 3, open diamonds). This confirms that the double-step geometry we
use to better match the equifrequency contours indeed significantly improves the LANR. Focusing
is also observed with a source displaced laterally from the median (x-axis) by L/2, which rules out
any symmetry spurious effect which might result from residual reflections.
The experimental results were systematically compared to three-dimensional Finite Difference
Time Domain (3D-FDTD) numerical simulations37,38. The effect of air loading was neglected in
the simulations. The plate was assumed to stand in vacuum: Stress-free boundary conditions were
applied on the upper and lower surfaces of the plate, and vacuum within the simulation domain
was simply modeled by a material with vanishing elastic constants. Initially, 3 dB-absorbing

8
boundary layers (ABL)39 were used to reproduce the experimental conditions. The numerically-
computed intensity and phase distributions are shown in Fig. 2e,f, and the lateral profile is given
in Fig. 3 (dashed line). The similarity with experimental data is striking for the intensity and phase
spatial distribution at t = 833 µs, as well as for the lateral resolution (0.61 λ). Numerical
simulations were reproduced using highly absorbing boundary layers with 54 dB attenuation to
simulate a transversely unbounded plate and test the dependence of the refocusing resolution on
the boundary conditions. We confirm that multiple reflections at the edges of the plate do not
artificially contribute to the lateral resolution before the pulse is refocused.
We find that focusing is effective from 8 kHz to 12 kHz leading to broadband lensing effect with
Δf/f0 = 40%. The quality of the focus only degrades at higher frequencies where isofrequency
contours shrink around the M-point whereas the free-space isofrequency circle increases: The
larger mismatch between the two contours reduces the angular aperture of the refocused beam.
CONCLUSION
In conclusion, we have theoretically investigated and experimentally demonstrated focusing of
elastic waves in a thin plate by a flat lens simply realized with a square array of circular see-through
holes. The fact that focusing occurs at a frequency in the homogenization domain (i.e. deep down
on the acoustic band) allows for an accurate asymptotic estimate by mimicking the dynamics of
the structured plate by that of flexural waves propagating within a lattice of beams. We point out
that on average, the shape of holes does not affect the lower part of the acoustic band, which is
obviously no longer the case when one moves towards higher frequencies. Working at low
frequencies is advantageous since a single Lamb mode is excited in this spectral regime where the
wavelength is much larger than the thickness of the plate, reducing greatly the complexity due to
9
multi-mode conversion. Meanwhile, since we operate below the stop band, Bragg refraction is
absent and relatively good transmission is achieved even when a double-step is added to the plate
to better match isofrequency contours. Finally, this geometry opens the way to explore
experimentally flat lens super-focusing by replacing the non-resonant holes by subwavelength
resonant scatterers such as blind holes or pillars40.
ACKNOWLEDGEMENTS
M.D. acknowledges PhD funding from the Direction Générale de l’Armement (DGA).
S.G. is thankful for an ERC starting grant funding (ANAMORPHISM).
P. S. is thankful to the Agence Nationale de la Recherche support under grant ANR PLATON n°
12-BS09-003-01.
Supplementary Information accompanies this paper.
10
REFERENCES
1 V.G. Veselago, Sov. Phys. Usp. 10 (4), 509–514 (1968)
2 J. B. Pendry, Phys. Rev. Lett. 85, 3966 (2000).
3 D. R. Smith, W. J. Padilla, V. C. Vier, S. C. Nemat-Nasser, and S. Schultz, Phys. Rev. Lett.
84, 4184 (2000).
4 S. A. Ramakrishna, Rep. Prog. Phys. 68, 449 (2005).
5 Z. Liu, X. Zhang, Y. Mao, Y. Y. Zhu, Z. Yang, C. T. Chan, P. Sheng, Science 289, 1734
(2000); P. Sheng, Physica B. 394, 256-261 (2007).
6 A. B. Movchan and S. Guenneau, Phys. Rev. B70,125116, (2004).
7 S. Guenneau, A.B. Movchan, S.A. Ramakrishna and G. Petursson, New Journal of Physics
9, 399 (2007).
8 J. Li and C.T. Chan, Phys. Rev. E 70, 055602 (2004).
9 N. Fang, D. Xi, J. Xu, M. Ambati, W. Srituravanich, C. Sun and X. Zhang, Nature Materials
5, 452 (2006); S. Zang, L. Yin, N. Fang, Phys. Rev. Lett. 102 (19): 194301 (2009).
10 M.S. Kushwaha, P. Halevi, L. Dobrzynski, and B. Djafari-Rouhani, Phys. Rev. Lett. 71,
2022–2025 (1993).
11 X. Hu, Y. Shen, X. Liu, R. Fu, and J. Zi, Phys. Rev. E 69, 030201R (2004).
12 M. Ke, Z. Liu, C. Qiu, W. Wang, and J. Shi, W. Wen and P. Sheng, Phys. Rev. B 72,
064306 (2005).
13 L. Feng, X.-P.Liu, M.-H.Lu, Y.-B.Chen, Y.-F.Chen, Y.-W.Mao, J. Zi, Y.-Y.Zhu, S.-
N.Zhu, and N.-B.Ming, Phys. Rev. Lett.96, 014301 (2006).
11
14 M. Ke, Z. Li, Z. Cheng, J. Li, P. Peng, J. Shi, Solid State Communications 142, 177–180
(2007).
15 A. Sukhovich, L. Jing,, and J. H. Page, Phys. Rev B 77, 014301 (2008).
16 A. Sukhovich, B. Merheb, K. Muralidharan, J. O. Vasseur, Y. Pennec, P. A. Deymier, and
J. H. Page, Phys. Rev. Lett. 102, 154301 (2009).
17 J. Christensen, and F. J. García de Abajo, Phys. Rev. Lett. 108, 124301 (2012).
18 G. W. Milton, M. Briane, and J. R. Willis, New Journal of Physics 8, 248 (2006).
19 U. Leonhardt, T.G. Philbin, New J. Phys. 8, 247(2006).
20 M. Farhat, S. Guenneau, S. Enoch, A.B. Movchan, and G. Petursson, Appl. Phys. Lett. 96,
081909 (2010).
21 S. Timoshenko, Theory of Plates and Shells McGraw-Hill, New York, 1940.
22 K. F. Graff, Wave Motion in Elastic Solids Dover, New York, 1975.
23 C.H. Wang, L.R.F. Rose, in: D.O. Thompson, D.E. Chimenti (Eds.), Review of QNDE,
vol. 22, AIP, New York, pp. 1615–1622 (2003).
24 P. Fromme, P. Wilcox, M.J.S. Lowe, P. Cawley, IEEE Trans. Ultra. Fer.Freq. Cont. 53, pp.
777–786 (2006).
25 A. B. Movchan, N. V. Movchan, and R. C. McPhedran, Proc. R. Soc. London, Ser. A 463,
2505 (2007).
26 N. Stenger, M. Wilhelm, and M. Wegener, Phys. Rev. Lett. 108, 014301 (2012) &
Viewpoint by R. McPhedran and A. Movchan in Physics 5, 2 (2012).
27 M. Brun, S. Guenneau and A.B. Movchan, Appl. Phys. Lett.94, 061903 (2009).

12
28 M. Farhat, S. Guenneau, S. Enoch and A.B. Movchan, Physical Review B 79, 033102
(2009).
29 S. Bramhavar, C. Prada, A. A. Maznev, A. G. Every, T. B. Norris, and T. W. Murray, Phys.
Rev. B 83, 014106 (2011).
30 J. Pierre, O. Boyko, L. Belliard, J. O. Vasseur, and B. Bonello, Appl. Phys. Lett. 97, 121919
(2010).
31 C. Luo, S. G. Johnson, J. D. Joannopoulos, and J. B. Pendry, Phys. Rev. B 65, 201104
(2002).
32 See supplementary material at [URL to be inserted by AIP] for a sketch of the anisotropic
propagation in the platonic crystal responsible for the large angle negative refraction.
33 See supplementary material at [URL to be inserted by AIP] for more details on the
analytic model used to derive Eq. 1.
34 The “free-space” bending-wave dispersion relation writes 𝑝 = 𝑐𝑃𝑘2ℎ/√12, where p is the
pulsation, k the wavenumber of the flexural waves and 𝑐𝑝 = [𝐸
𝜌(1−𝜈2)]
1 2⁄ the plate-wave
velocity, with ν the Poisson’s ratio, E the Young’s modulus, h the plate thickness and
the density of the plate.
35 Elastic constants of Duraluminium :E = 74.9GPa, ν = 0.334, ρ = 2790 kg/m3.
36 See supplementary material at [URL to be inserted by AIP] for a movie of the measured
time evolution of the pulse propagation and flat lens refocusing.
37 J. Virieux, Geophysics 51, 889–901 (1986).

13
38 E. Bossy, M. Talmant, and P. Laugier, J Acoust. Soc. Am. 115, 2314-2324(2004). See also
http://www.simsonic.fr/
39 R. W. Graves, Bulletin of the Seismological Society of America 86, pp. 1091 (1996).
40 M. A. Al-Lethawe, M. Addouche, A. Khelif and S. Guenneau, New J. Phys. 14, 123030
(2012).
41 R. Merlin, Appl. Phys. Lett. 84, 1290 (2004).
42 G. W.Milton, N. A. P. Nicorovici, R. C. McPhedran, & V. A. Podolskiy, Proc. of the R.
Soc. A 461, 3999 (2005).
14
FIGURES
(a) 1
1
1
1
2
2
2
2
33
33 3
3
3 3
4
4
44
44
44
5
5
5
5
55
55
6
6
6
6
6
6
6
6
7
7
7
7
7
77
7
8
8
8
8
8
8 8
8
8
8
8
8
10
10
10
10 11
11
11
12
12
13
13
14
15
k1
k 2
Γ
X
M
10
10
0
20
40
60
Fre
qu
ency
(k
Hz)
(b)
2mm- thick
1mm- thick
X M Γ Γ
Figure 1: (a) Isofrequency contours. The (k1,k2) plane has been rotated by 45° to align the ΓM-direction with the horizontal incident direction normal to the platonic lens. The crystal isofrequency at 10 kHz circles the M-point (red circle) while the free-space isofrequency at 10 kHz circles the Γ-point (blue circle). (b) Band diagram. Horizontal axis: Projection of the Bloch vector on the boundary of the first irreducible Brillouin zone ΓXM. Vertical axis: Bending wave frequency. Comparison of finite element computations (solid line) against analytical estimate given by Eq. 1 (dashed line). Excellent agreement is found in the acoustic band (dashed redline).The blue curves starting from the M-point correspond to “free space” bending waves propagating in 1 mm-thick (full circles) and 2 mm-thick (open circles) homogeneous plate along the ΓM direction. Insets: unit cell of the actual platonic crystal (right) and for the analytical model (left).

15
Experiment
5kHz
Experiment
10kHz
Simulation
10kHz
Intensity
Min
Max
Phase
-
+
Figure 2 : Snapshot at time t = 833 µs of the amplitude squared (top) and phase (bottom) of the acoustic velocity field measured on the image side where focusing is expected (The full picture is available in the movie36). (a)&(b): Experiment at f0 = 5 kHz carrier frequency, which shows a divergent wavefront.(c)&(d): Experiment at f0 = 10 kHz carrier frequency, which shows refocusing. (f)&(g): 3D-FDTD simulation also at f0 = 10 kHz. Note the velocity-field oscillations at the interface between the array of air holes and the homogeneous plate (left edge in (a),(c)&(e)), which are one of the hallmarks of focusing through a negatively refracting lens41,42.
(a) (c) (e)
(b) (d) (f)
16
-2.5 -2 -1.5 -1 -0.5 0 0.5 1 1.5 2 2.50
0.05
0.1
0.15
0.2
0.25
0.3
0.35
0.4
Lateral Position (in units of )
No
rmali
zed
Am
pli
tud
eat
focu
s p
oin
t, A
F/A
SPlatonic Crystal
Platonic Crystal+ Double Step
Simulations
0.59
Figure 3: Normalized lateral magnitude of the acoustic velocity across the image point at t = 833 µs. Comparison between the lateral profile in the plate with constant thickness 1 mm (dark blue line with open diamonds) and in the plate with double-step (2mm-1mm-2mm) (cyan line with open circles). While the resolution given by the FWHM of the central peak is 1.0 λ in the uniform plate, it becomes 0.59 λ in the double-step structure, thus confirming the larger-angle negative-refraction achieved by matching free-space and platonic crystal dispersion curves. Similar resolution (0.61 λ) is obtained through 3D-FDTD simulations where absorbing layers similar to the experiment have been implemented (dashed black line). Amplitude has been normalized to the maximum of the input pulse. Position is in units of λ measured in the plain plate. Inset: The double step (2mm-1mm-2mm thick) rectangular plate with the square lattice of see-through circular 12mm-diam holes. The source, a piezoelectric pastille, is acoustically coupled to the metallic plate. Blue-tack is stuck on both sides and edges of the plate to damp the acoustic waves and reduce reflections. The green-light beam of the laser vibrometer in actuality scans the plate surface opposite the emitter.