Fixed Satellite Services Addressing structural question marks CONTENTS
68
Equity Research 30 September 2014 Barclays Capital Inc. and/or one of its affiliates does and seeks to do business with companies covered in its research reports. As a result, investors should be aware that the firm may have a conflict of interest that could affect the objectivity of this report. Investors should consider this report as only a single factor in making their investment decision. This research report has been prepared in whole or in part by equity research analysts based outside the US who are not registered/qualified as research analysts with FINRA. PLEASE SEE ANALYST CERTIFICATION(S) AND IMPORTANT DISCLOSURES BEGINNING ON PAGE 61. Fixed Satellite Services Addressing structural question marks The market has focused in the past two years on key areas of structural concern for the Fixed Satellite Services (FSS) industry. Year-to-date, good short-term delivery and a market preference for bond-like equities have led Eutelsat and SES to outperform. But we believe the structural debate continues to hold back investor interest. We address three areas: 1) compression in Video, 2) government budget impacts, and 3) oversupply risks in Data (including High Throughput Satellites – HTS). We aim to separate out where there could be real reasons for concern and the timeframes involved. We then model what could be a sensible “normal year” revenue and EBITDA growth for FSS operators within each subcategory in Video, Government and Data. Looking at mix, we conclude that SES can grow EBITDA at 4.0% in a “normal year”, while Eutelsat can achieve 3.8%. We use these growth rates to consider what multiples could be sensible, based on a regression of valuation vs growth for “peers” in infrastructure, telco and media. On EV/EBITDA vs EBITDA growth, Eutelsat looks better value but 1) SES has a major tax advantage; 2) SES’s cash flow momentum and dividend growth give it advantages; and 3) we still have some short-term government concerns at Eutelsat. So we reiterate our Overweight on SES and Equal Weight on Eutelsat. Compression – not as big a problem as has been suggested: We have investigated the issue of compression vs the shift from SD to HD to Ultra HD. We conclude: 1) the shift to MPEG-4 only matters when removing the last MPEG-2 box and early indications suggest planning for Ultra HD will at least offset MPEG-2 removal; 2) this is less relevant in EM (operators went straight to MPEG-4) or free-TV (unlikely to invest in new boxes). Government – concerns on growth, but expect fewer shocks: We split government revenues into component parts and use industry forecasts where possible (e.g. for Unmanned Aerial Vehicles – UAVs) to model future growth. While we do not expect strong growth over the medium term, with US budget pressures here to stay, we do see room for modest growth, with more reliability. Governments beyond the US should support growth over time. Oversupply – new operators can impact Data; HTS a problem for specific uses: Supply should outstrip demand over the next few years due to small national operators and High Throughput Satellites. But 1) this is unlikely to impact Direct-To-Home (DTH); 2) HTS impacts are likely to be specific and somewhat smaller than has been suggested; and 3) the key risks from oversupply are in fairly small corners of revenue for the FSS operators. SES – reiterate Overweight: We expect solid delivery, and maintain our view that 10% dividend growth makes this one of the most attractive income stories in the market. Eutelsat – reiterate Equal Weight: Trends have started to improve, and valuation is not stretched, but some further short-term risks around Data and Multi-Usage prevent us from being more positive here. INDUSTRY UPDATE European Media POSITIVE Unchanged European Media Nick Dempsey +44 (0)20 3134 5888 [email protected] Barclays, London Andrew Ross +44 (0)20 7773 3023 [email protected] Barclays, London Julien Roch +44 (0)20 3134 3323 [email protected] Barclays, London
-
Upload
independent -
Category
Documents
-
view
2 -
download
0
Transcript of Fixed Satellite Services Addressing structural question marks CONTENTS

Equity Research30 September 2014
Barclays Capital Inc. and/or one of its affiliates does and seeks to do business with companies covered in its research reports. As a result, investors should be aware that the firm may have a conflict of interest that could affect the objectivity of this report.
Investors should consider this report as only a single factor in making their investment decision.
This research report has been prepared in whole or in part by equity research analysts based outside the US who are not registered/qualified as research analysts with FINRA.
PLEASE SEE ANALYST CERTIFICATION(S) AND IMPORTANT DISCLOSURES BEGINNING ON PAGE 61.
Fixed Satellite Services
Addressing structural question marks The market has focused in the past two years on key areas of structural concern for the Fixed Satellite Services (FSS) industry. Year-to-date, good short-term delivery and a market preference for bond-like equities have led Eutelsat and SES to outperform. But we believe the structural debate continues to hold back investor interest. We address three areas: 1) compression in Video, 2) government budget impacts, and 3) oversupply risks in Data (including High Throughput Satellites – HTS). We aim to separate out where there could be real reasons for concern and the timeframes involved. We then model what could be a sensible “normal year” revenue and EBITDA growth for FSS operators within each subcategory in Video, Government and Data. Looking at mix, we conclude that SES can grow EBITDA at 4.0% in a “normal year”, while Eutelsat can achieve 3.8%. We use these growth rates to consider what multiples could be sensible, based on a regression of valuation vs growth for “peers” in infrastructure, telco and media. On EV/EBITDA vs EBITDA growth, Eutelsat looks better value but 1) SES has a major tax advantage; 2) SES’s cash flow momentum and dividend growth give it advantages; and 3) we still have some short-term government concerns at Eutelsat. So we reiterate our Overweight on SES and Equal Weight on Eutelsat.
Compression – not as big a problem as has been suggested: We have investigated the issue of compression vs the shift from SD to HD to Ultra HD. We conclude: 1) the shift to MPEG-4 only matters when removing the last MPEG-2 box and early indications suggest planning for Ultra HD will at least offset MPEG-2 removal; 2) this is less relevant in EM (operators went straight to MPEG-4) or free-TV (unlikely to invest in new boxes).
Government – concerns on growth, but expect fewer shocks: We split government revenues into component parts and use industry forecasts where possible (e.g. for Unmanned Aerial Vehicles – UAVs) to model future growth. While we do not expect strong growth over the medium term, with US budget pressures here to stay, we do see room for modest growth, with more reliability. Governments beyond the US should support growth over time.
Oversupply – new operators can impact Data; HTS a problem for specific uses: Supply should outstrip demand over the next few years due to small national operators and High Throughput Satellites. But 1) this is unlikely to impact Direct-To-Home (DTH); 2) HTS impacts are likely to be specific and somewhat smaller than has been suggested; and 3) the key risks from oversupply are in fairly small corners of revenue for the FSS operators.
SES – reiterate Overweight: We expect solid delivery, and maintain our view that 10% dividend growth makes this one of the most attractive income stories in the market.
Eutelsat – reiterate Equal Weight: Trends have started to improve, and valuation is not stretched, but some further short-term risks around Data and Multi-Usage prevent us from being more positive here.
INDUSTRY UPDATE
European Media POSITIVE Unchanged
European Media Nick Dempsey +44 (0)20 3134 5888 [email protected] Barclays, London
Andrew Ross +44 (0)20 7773 3023 [email protected] Barclays, London
Julien Roch +44 (0)20 3134 3323 [email protected] Barclays, London

Barclays | Fixed Satellite Services
30 September 2014 2
CONTENTS
EXECUTIVE SUMMARY .................................................................................... 3 1: How will compression impact Video growth? ................................................................................ 3 2: What will the trends be in Government going forward? ............................................................... 6 3: Are there oversupply risks from new operators and HTS? ........................................................... 8 Putting it together – revenue and EBITDA growth by segment .................................................... 10
VALUATION: ETL LOOKS CHEAPER BUT IT’S NOT THE FULL PICTURE12
PAY-OFF BETWEEN COMPRESSION AND RESOLUTION: ACCRETIVE OR DILUTIVE? ................................................................................................... 17 Quick summary of our conclusions ..................................................................................................... 17 Intro: BSkyB slide showed capacity reduction as HD increased .................................................... 17 1) Channel growth running ahead of revenue growth – why? .................................................. 19 2) Practicalities of how compression could affect FSS players .................................................. 21 DTH market growth: assuming 2% for Europe and 8% for EM .................................................... 27
GOVERNMENT: SHORT-TERM WEAKNESS; RETURN TO GROWTH OVER TIME ........................................................................................................ 29 What will be the short-term trends in US gov satcom spend? ...................................................... 31 What are the long-term trends for FSS operators? .......................................................................... 34 Building a model to forecast growth in US military satcom ........................................................... 36 Gov market revenue growth: expect 2.5% in a normal year .......................................................... 43
DO WE NEED TO WORRY ABOUT OVERSUPPLY? .................................. 44 Transponder supply set to outstrip demand on a global basis ...................................................... 44 How can we predict where there could be problems? .................................................................... 46 Potential impact on different areas of Data revenue from HTS..................................................... 49 Conclusion on Data: 1-3% growth overall in this area .................................................................... 55 Implications for normal year growth at ETL and SES ....................................................................... 55
KEY FINANCIALS .............................................................................................. 57 SES financials ............................................................................................................................................. 57 Eutelsat financials ..................................................................................................................................... 59

Barclays | Fixed Satellite Services
30 September 2014 3
EXECUTIVE SUMMARY
Sentiment on Eutelsat and SES took a hit in 2012 and 2013, as Eutelsat in particular saw significant downgrades. During that period of weak momentum, it became easier for investors to listen to structural bear arguments on these names. This year, delivery has been more solid and sentiment has gradually improved, driving a rerating. But structural questions remain critical for these stories. We believe that that there are clear attractions in a business model with 1) multi-year contracts driving visibility, 2) reducing capex per transponder and 3) high dividend yields with relatively predictable dividend growth. But those attractions are only worth focusing on if we can get comfortable with the structural question marks.
So in this note, we get under the skin of three areas of structural concern: 1) the impact of compression technology on growth in the Video segment; 2) likely mid-term progress in Government, which has recently been weak; and 3) risks from oversupply, especially in the broad Data segment, from High Throughput Satellites and new operators. We do not just debate these issues, we model out the likely “normal year” revenue and EBITDA growth potential in each subsegment of the industry – and then look at mix to see what kind of “normal year” growth each of Eutelsat and SES can realistically achieve.
We use this growth to cross-check our valuation for both Eutelsat and SES. Benchmarking the performance of Fixed Satellite Services (FSS) operators in terms of growth can be challenging, given they are at different stages of their internal capex/launch/revenue cycles. And taking a historical growth average may not capture future structural concerns. So we run a regression of EV/EBITDA vs EBITDA growth for comparable sectors such as Infrastructure, Telco and Cable – and then we compare the “normal year” EBITDA growth for Eutelsat and SES.
We show below our conclusions on the key structural question marks. Below that, we show our assumptions on “normal year” growth for the different satellite revenue streams and the implications for SES and Eutelsat – and our thoughts on valuation.
1: How will compression impact Video growth? We have investigated the issue of compression vs the shift from SD to HD to Ultra HD. This has been a hot topic in the investment community in the last year or more.
This is the bear argument (as we understand it):
1. FSS operators have been saying for years that the payoff between increasing compression and the shift to HD and Ultra HD will be accretive for transponder demand.
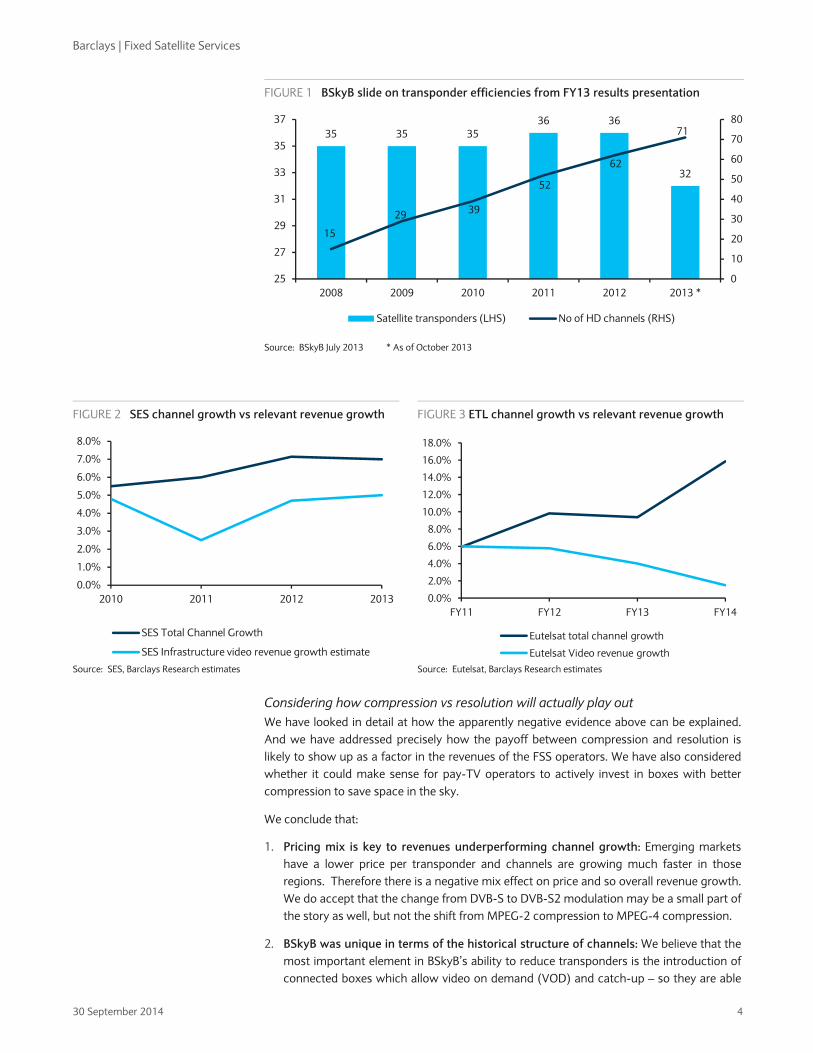
2. But as shown below in Figure 1, BSkyB has recently been able to reduce its transponder needs despite a major increase in HD channels, while revenue growth at SES and Eutelsat (even adjusted for some factors like German analogue switch-off) has underperformed channel growth in the past few years (as shown in Figure 2 and Figure 3 below).
3. HEVC (High Efficiency Video Coding) compression is coming and there could be a scenario where better compression starts to impact the industry before Ultra HD demand arrives.
4. Therefore it seems likely that compression is actually winning the battle and industry-wide Video growth will be lower than many expect going forward.
Barclays | Fixed Satellite Services
30 September 2014 4
FIGURE 1 BSkyB slide on transponder efficiencies from FY13 results presentation
Source: BSkyB July 2013 * As of October 2013
FIGURE 2 SES channel growth vs relevant revenue growth
FIGURE 3 ETL channel growth vs relevant revenue growth
Source: SES, Barclays Research estimates Source: Eutelsat, Barclays Research estimates
Considering how compression vs resolution will actually play out We have looked in detail at how the apparently negative evidence above can be explained. And we have addressed precisely how the payoff between compression and resolution is likely to show up as a factor in the revenues of the FSS operators. We have also considered whether it could make sense for pay-TV operators to actively invest in boxes with better compression to save space in the sky.
We conclude that:
1. Pricing mix is key to revenues underperforming channel growth: Emerging markets have a lower price per transponder and channels are growing much faster in those regions. Therefore there is a negative mix effect on price and so overall revenue growth. We do accept that the change from DVB-S to DVB-S2 modulation may be a small part of the story as well, but not the shift from MPEG-2 compression to MPEG-4 compression.
2. BSkyB was unique in terms of the historical structure of channels: We believe that the most important element in BSkyB’s ability to reduce transponders is the introduction of connected boxes which allow video on demand (VOD) and catch-up – so they are able
35 35 3536 36
32
15
29 39
52
62
71
0
10
20
30
40
50
60
70
80
25
27
29
31
33
35
37
2008 2009 2010 2011 2012 2013 *
Satellite transponders (LHS) No of HD channels (RHS)
0.0%
1.0%
2.0%
3.0%
4.0%
5.0%
6.0%
7.0%
8.0%
2010 2011 2012 2013
SES Total Channel Growth
SES Infrastructure video revenue growth estimate
0.0%
2.0%
4.0%
6.0%
8.0%
10.0%
12.0%
14.0%
16.0%
18.0%
FY11 FY12 FY13 FY14
Eutelsat total channel growth
Eutelsat Video revenue growth

Barclays | Fixed Satellite Services
30 September 2014 5
to switch off quite a few carousel channels (the ones with films starting every 15 minutes) and “+1” channels, replicating channels an hour later. Our work suggests that BSkyB was an outlier in terms of having so many of those channels, so its ability to reduce space in the sky is more or less unique among pay-TV operators.
3. Timing of MPEG-4 impact is complex – we care about the number of channels broadcast: The shift to MPEG-4 only matters when removing the last MPEG-2 box, which has not happened anywhere yet. It is not true that as MPEG-4 boxes start to increase in the customer mix there are gradual negative effects. Satellite operators care about the number of channels broadcast and if you switch the SD channels to MPEG-4 compression in the broadcast, then no one with an MPEG-2 box can see them. So you need to wait until there are no more MPEG-2 customers (or until there are so few that it makes sense to squeeze them out).
That might suggest that there is a “cliff” still to come when TV groups remove the last MPEG-2 box and have the double benefit of A) no longer simulcasting channels in both SD and HD, and B) being able to apply MPEG-4 compression to SD channels. However, early indications from CanalSat and Sky Deutschland suggest that this “cliff” will be smoothed out by the renewal process for multi-year contracts. We think that TV operators will plan for significantly increased numbers of HD channels and the start of Ultra HD, at least offsetting MPEG-2 removal in their transponder demand expectations.
4. HEVC boxes – it is exactly the same as the move from MPEG-2 to MPEG-4: We will see a rise in the number of set-top boxes with HEVC compression (the next step in compression which is now becoming available, and goes hand in hand with Ultra HD). But this is not particularly relevant to satellite operators until MPEG-4 boxes are replaced in very large numbers (which will be many years in the future, we think). Because, following the example of SD/MPEG-2 and HD/MPEG-4, as long as there are significant numbers of customers with MPEG-4 boxes, then channels that are shown in Ultra-HD (viewable only by customers with HEVC boxes) will need to be simulcast in HD.
FIGURE 4 Forecasts for HD and Ultra HD as % of total channels in 2022 vs 2012
Source: Euroconsult 2013 (as shown in Eutelsat presentation from December 2013)
5. You only need a suggestion that Ultra HD will ultimately be important: Satellite operators do not need to see major take-up of Ultra HD channels any time soon, in order to remain relaxed about future Video transponder demand. They just need to see the early signs of take-up in the next five years to encourage TV customers to plan ahead for the kind of capacity that will be needed in an Ultra HD world. Figure 4 above shows Euroconsult’s expectations for HD and Ultra HD channels, with Ultra HD established in
85%
38%
91%
67%
95%
78% 92
%
78% 97
%
80% 90
%
68%
15%
60%
9%
32%
5%
21%
8%
21%
3%
19% 10
%
31%
2.4% 1.4% 1.5% 1.0% 0.8% 1.0%
0%
20%
40%
60%
80%
100%
SD HD Ultra HD

Barclays | Fixed Satellite Services
30 September 2014 6
the mix in 2022, in developed markets, but still small. This does not look great, but it is all you need (along with a further ramp-up in HD as shown).
6. Box replacement in order to save on satellite capacity makes little economic sense: We have looked at whether an operator like BSkyB could look to change the pattern discussed above by investing in a complete switch to HEVC boxes, purely to save space in the sky. We calculate that rolling out HEVC boxes in one go to all of Sky’s subscribers would cost BSkyB c.£1bn (c.£100 per box to 10m subscribers). And we assume that the benefits offered by enhanced compression would save c.£60m per year. This assumes no change at all in the current mix of channels between SD, HD and Ultra HD. So that would be a <6% return on investment, or put another way, the NPV of the savings would be c.£500-600m vs the £1bn investment.
7. This is all less relevant in EM where operators went straight to MPEG-4. It is also less important for free-TV customers, who are unlikely to invest in new boxes to squeeze out the last MPEG-2 customers.
Expect 2% European Video growth; 8% EM Video growth In developed markets, which essentially means Europe for the major satellite operators, we expect only modest underlying growth in channels, driven by the effects of HD/Ultra HD (partially offset by compression effects) as discussed above. We also see only very small increases coming from price. So we assume “normal year” growth of 2% for developed market Video revenues.
In developing markets, we note a number of strong forecasts for channel growth and expected transponder demand from DTH (pay and free-to-air) in Latin America, South Asia, South East Asia and Africa (as discussed at the end of our section on Video and compression below). We assume “normal year” revenue growth of 8% in developing market Video.
2: What will the trends be in Government going forward? We have looked to size the market for Government spending on commercial satellite capacity and break it down into its component parts. We base our estimates for the total pie and the share of each player below on comments from Intelsat on its share of this market – and then the comments from Eutelsat, SES and Intelsat about how much of their revenues derive from Government.
FIGURE 5 US dominates government satellite spend (2013)
FIGURE 6 Estimated share of US gov satellite spend (2013)
Source: Company information, Barclays Research Source: Company information, Barclays Research
We segment the US Department of Defense (DoD) spend on commercial satellite capacity in Figure 8 below based on comments made by Eutelsat on the different components of its Multi-Usage revenues. The DoD is by far the largest part of this global market: we assume it
US Gov91%
Other Govs9%
$1bn
$100m
Intelsat45%
SES15%
Eutelsat12%
Others28%
$447m$294m
$154m
$120m
Barclays | Fixed Satellite Services
30 September 2014 7
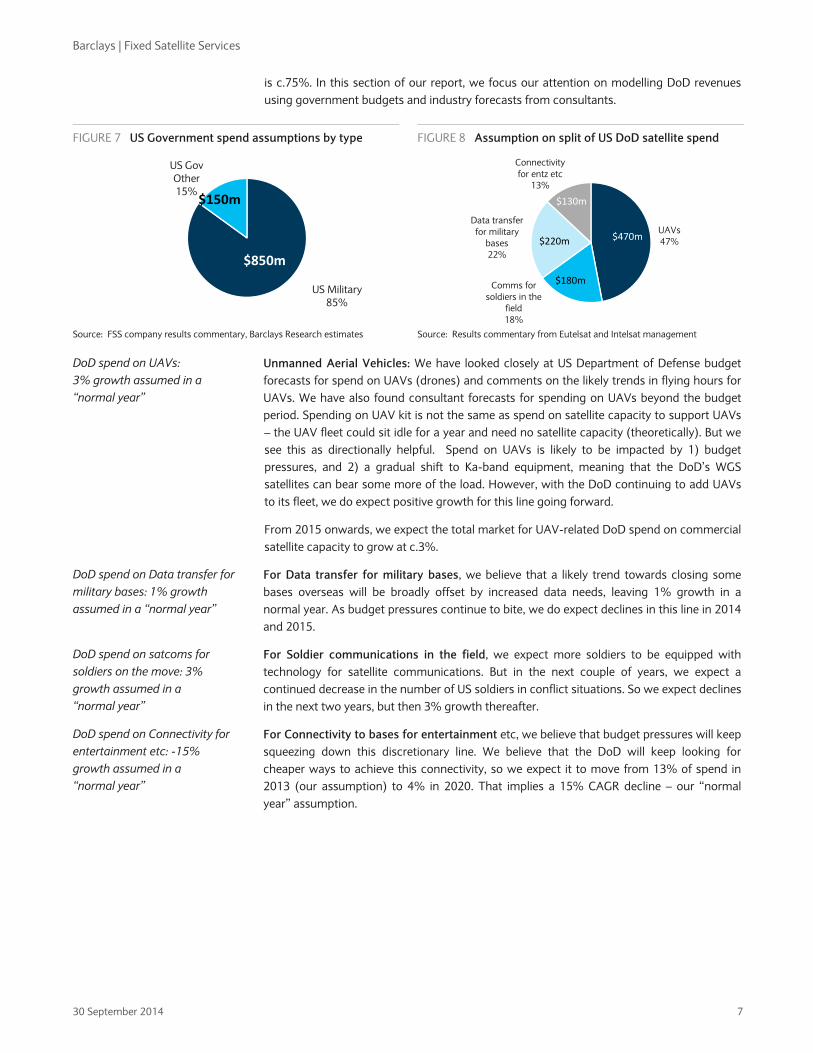
is c.75%. In this section of our report, we focus our attention on modelling DoD revenues using government budgets and industry forecasts from consultants.
FIGURE 7 US Government spend assumptions by type
FIGURE 8 Assumption on split of US DoD satellite spend
Source: FSS company results commentary, Barclays Research estimates Source: Results commentary from Eutelsat and Intelsat management
Unmanned Aerial Vehicles: We have looked closely at US Department of Defense budget forecasts for spend on UAVs (drones) and comments on the likely trends in flying hours for UAVs. We have also found consultant forecasts for spending on UAVs beyond the budget period. Spending on UAV kit is not the same as spend on satellite capacity to support UAVs – the UAV fleet could sit idle for a year and need no satellite capacity (theoretically). But we see this as directionally helpful. Spend on UAVs is likely to be impacted by 1) budget pressures, and 2) a gradual shift to Ka-band equipment, meaning that the DoD’s WGS satellites can bear some more of the load. However, with the DoD continuing to add UAVs to its fleet, we do expect positive growth for this line going forward.
From 2015 onwards, we expect the total market for UAV-related DoD spend on commercial satellite capacity to grow at c.3%.
For Data transfer for military bases, we believe that a likely trend towards closing some bases overseas will be broadly offset by increased data needs, leaving 1% growth in a normal year. As budget pressures continue to bite, we do expect declines in this line in 2014 and 2015.
For Soldier communications in the field, we expect more soldiers to be equipped with technology for satellite communications. But in the next couple of years, we expect a continued decrease in the number of US soldiers in conflict situations. So we expect declines in the next two years, but then 3% growth thereafter.
For Connectivity to bases for entertainment etc, we believe that budget pressures will keep squeezing down this discretionary line. We believe that the DoD will keep looking for cheaper ways to achieve this connectivity, so we expect it to move from 13% of spend in 2013 (our assumption) to 4% in 2020. That implies a 15% CAGR decline – our “normal year” assumption.
US Military85%
US Gov Other15%
$850m
$150m
UAVs47%
Comms for soldiers in the
field18%
Data transfer for military
bases22%
Connectivity for entz etc
13%
$220m
$180m
$470m
$130m
DoD spend on UAVs: 3% growth assumed in a “normal year”
DoD spend on Data transfer for military bases: 1% growth assumed in a “normal year”
DoD spend on satcoms for soldiers on the move: 3% growth assumed in a “normal year”
DoD spend on Connectivity for entertainment etc: -15% growth assumed in a “normal year”
Barclays | Fixed Satellite Services
30 September 2014 8
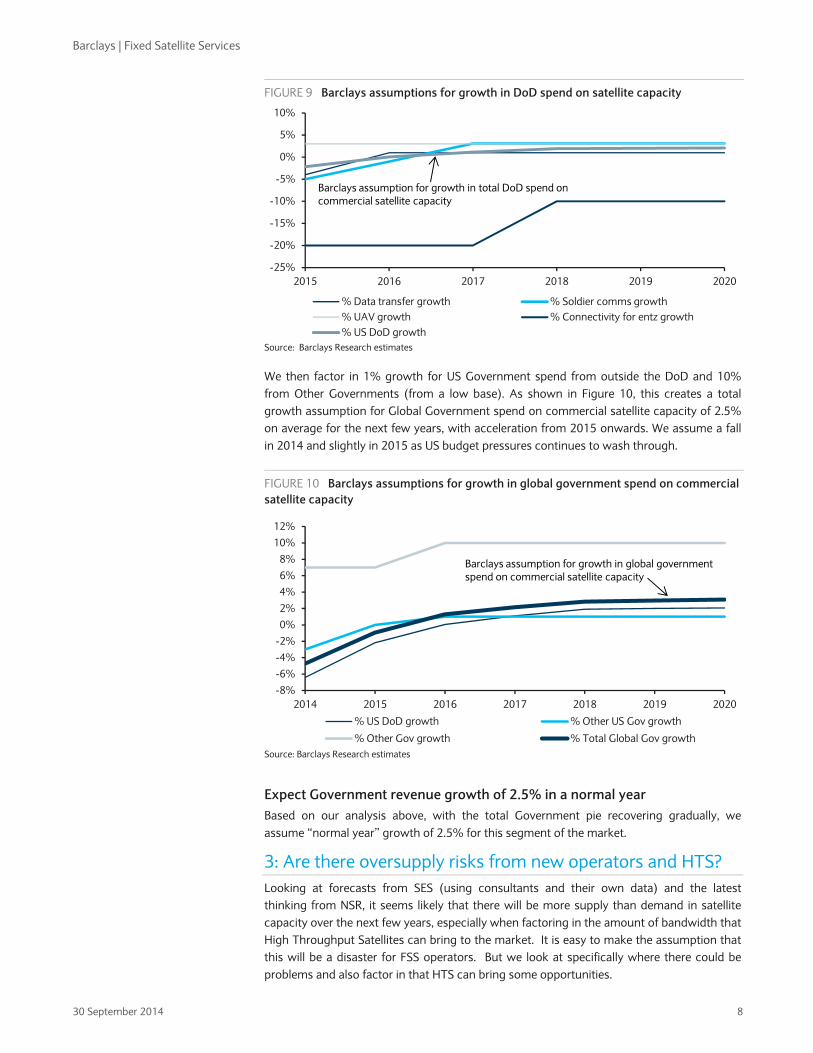
FIGURE 9 Barclays assumptions for growth in DoD spend on satellite capacity
Source: Barclays Research estimates
We then factor in 1% growth for US Government spend from outside the DoD and 10% from Other Governments (from a low base). As shown in Figure 10, this creates a total growth assumption for Global Government spend on commercial satellite capacity of 2.5% on average for the next few years, with acceleration from 2015 onwards. We assume a fall in 2014 and slightly in 2015 as US budget pressures continues to wash through.
FIGURE 10 Barclays assumptions for growth in global government spend on commercial satellite capacity
Source: Barclays Research estimates
Expect Government revenue growth of 2.5% in a normal year Based on our analysis above, with the total Government pie recovering gradually, we assume “normal year” growth of 2.5% for this segment of the market.
3: Are there oversupply risks from new operators and HTS? Looking at forecasts from SES (using consultants and their own data) and the latest thinking from NSR, it seems likely that there will be more supply than demand in satellite capacity over the next few years, especially when factoring in the amount of bandwidth that High Throughput Satellites can bring to the market. It is easy to make the assumption that this will be a disaster for FSS operators. But we look at specifically where there could be problems and also factor in that HTS can bring some opportunities.
-25%
-20%
-15%
-10%
-5%
0%
5%
10%
2015 2016 2017 2018 2019 2020
% Data transfer growth % Soldier comms growth% UAV growth % Connectivity for entz growth% US DoD growth
Barclays assumption for growth in total DoD spend on commercial satellite capacity
-8%-6%-4%-2%0%2%4%6%8%
10%12%
2014 2015 2016 2017 2018 2019 2020
% US DoD growth % Other US Gov growth
% Other Gov growth % Total Global Gov growth
Barclays assumption for growth in global government spend on commercial satellite capacity

Barclays | Fixed Satellite Services
30 September 2014 9
We conclude that the main area of risk from oversupply is Data, given that 1) DTH requires long-term contracts and is very sticky (so is hard for smaller operators to break into), and it is also not an application appropriate for High Throughput Satellites; and 2) Government applications would face some strategic risks using space on smaller, government-owned operators (but HTS could have an impact within Government over time).
We consider the various different FSS satellite applications within the Data umbrella below, and our assumptions on exposure to these for Eutelsat and SES. We see most risk to growth from HTS oversupply in IP Trunking and Mobile Backhaul. But in the latter we do actually expect strong underlying demand growth. We expect some risks to pricing at Enterprise VSAT from smaller operator launches, but conclude that HTS are not well-suited to most VSAT configurations, given that HTS works better for point-to-point, not a network containing multiple locations over a wide area.
In the area of Mobility, in particular, we see potential for good growth from a low base for the FSS players, although competition is likely to be intense. We also see some potential for further growth in consumer broadband.
FIGURE 11 Different elements of the Data segment for FSS, including the % share of SES and ETL’s group revenues
Types of FSS Data Revenues DescriptionAssumed % of
SES Group 2014 Assumed % of
ETL Group FY15
Enterprise VSAT Creating networks using Very Small Aperture Terminals to enable sharing of information such as point-of-sale
transactions, maritime communications, distance learning, sharing of medical records, disaster recovery or other sharing
of corporate data in remote areas.
11% 9%
IP Trunking Linking local networks to the internet backbone using a satellite connection. This is relevant in areas where terrestrial
infrastructure is inadequate.
3% 3%
Mobile Backhaul Linking cell site towers to the core mobile network, supporting voice and data typically for 2G, 3G and 4G-LTE. Again this is
useful in remote areas where the infrastructure is lacking.
4% 3%
Consumer/ Small Business Broadband Providing fibre-type speeds via satellite to consumers who are off the grid or are unable to received good broadband speeds.
1.5% 7%
Mobility Providing high-speed broadband connectivity in a maritime context (drilling offshore, cruise ships, commercial shipping)
or for aeroplanes (commercial or private)
0.5% 1.0%
Total Data Applications ex Government 20.0% 23.0%Source: Barclays Research estimates (based on comments by Eutelsat and SES management – we use FY15 assumptions for Eutelsat to include full Satmex impact)
Expect Data revenue growth of 1-3% in a normal year Based on our analysis of oversupply risks from new operators and HTS, but strong transponder demand in areas, we expect “normal year” growth rates by application shown below. Depending on mix, this implies Data revenue growth of 1-3% in a “normal year”.
FIGURE 12 Normal year revenue growth potential for different Data applications
Normal year growth
Enterprise VSAT 2%
Trunking -15%
Mobile Backhaul 3%
Consumer Broadband 6%
Mobility 15%Source: Barclays Research estimates

Barclays | Fixed Satellite Services
30 September 2014 10
Putting it together – revenue and EBITDA growth by segment In the table below, we show our “normal year” revenue assumptions for each sub-sector of Fixed Satellite Services. We assume very little operational gearing – as there is not much in this model. So the EBITDA growth rates are only very slightly ahead of the revenue growth.
FIGURE 13 Barclays assumptions for “normal year” growth by FSS revenue stream
Sector Subsector Revenue growth EBITDA growth
Data Applications Enterprise VSAT 2.0% 2.0%
Trunking -15.0% -17.0%
Mobile Backhaul 3.0% 3.0%
Consumer Broadband 6.0% 6.0%
Mobility 15.0% 15.0%
Government Government applications 2.5% 3.0%
Video Developed markets 2.0% 2.5%
Emerging markets 8.0% 8.5%
Source: Barclays Research estimates
Assumed “normal year” EBITDA growth for Eutelsat and SES
FIGURE 14 ETL splits by type Our weighted average “normal year” EBITDA growth assumption for Eutelsat is 3.9%. Clearly
there are some assumptions on the splits here. We have discussed the Data splits in moredetail above (and in the Data section). Within Video Services, we have assumed that theyhave substantial EM revenues, but that they are still weighted to developed markets. Given fairly low assumptions on transponder demand in Eastern Europe, we class that as adeveloped market.
The table below shows that when applying Eutelsat’s splits (containing some assumptions) toour suggested “normal year” growth rates in Figure 13 above, the weighted average EBITDA growth is 3.8%.
Source: Barclays Research estimates
FIGURE 15 Barclays assumptions on Eutelsat revenue splits – and weighted ave growth
Category Split of revenues
Enterprise VSAT 9.0%
IP Trunking 3.0%
Mobile Backhaul 3.0%
Consumer/ Small Business Broadband 7.0%
Mobility 1.0%
Total Data Applications ex Government 23.0%
Developed markets 41.0%
Emerging markets 23.0%
Video Services 64.0%
Government 11%
Other 2.0%
Weighted Average Growth
Eutelsat Group Weighted Revenue Growth 3.5%
Eutelsat Group Weighted EBITDA Growth 3.8%Source: Barclays Research estimates
Video Servs64%
Value-Added Servs8%
Data15%
Multi-Usage (DoD)11%
Other2%

Barclays | Fixed Satellite Services
30 September 2014 11
At SES, we run the same analysis for the Infrastructure business and then deal with Services separately. We make an assumption on the splits for Infrastructure, as shown below, based on their 2012 revenues (the list time this pie chart was provided). We assume that Services is more weighted to Government and Network Services, and less to Media.
FIGURE 16 SES revenue splits 2012 inc Services
FIGURE 17 SES revenue splits 2012 just in Infrastructure
Source: SES (Investor Day 2013) Source: SES, Barclays Research estimates
FIGURE 18 Barclays assumptions on SES Infrastructure splits – and weighted ave growth
Category Split of revenues
Enterprise VSAT 11.0%
IP Trunking 2.5%
Mobile Backhaul 3.5%
Consumer/ Small Business Broadband 1.5%
Mobility 0.5%
Total Data Applications ex Government 19%
Developed markets 44%
Emerging markets 28%
Video Services 71%
Government 10%
Weighted Average Growth
Weighted average revenue growth 3.6%
Weighted average EBITDA growth 3.9%Source: Barclays Research estimates
As our thinking on the different revenue categories within the FSS business is mostly relevant for SES’s Infrastructure business, we have made an extra step to factor in their Services business as well. We assume continued strong growth in the European Services business (including HD+), but low growth in the US Government Services business, implying 4.5% EBITDA growth in a “normal year”. This means that the implied “normal year” growth for SES Group is very similar to the Infrastructure number – 4.0%.
FIGURE 19 Factoring in Services as well
Split of revenues "Normal year" EBITDA growth
SES Infrastructure 79% 3.9%
SES Services 21% 4.5%
SES Group 100% 4.0%Source: Barclays Research estimates
Media67%
Network Services
20%
Govt & Institutions
13%
Media71%
Network Services
19%
Govt & Institutions
10%

Barclays | Fixed Satellite Services
30 September 2014 12
VALUATION: ETL LOOKS CHEAPER BUT IT’S NOT THE FULL PICTURE
So we have devoted this report to creating what we believe to be “normal year” EBITDA growth for Eutelsat and SES. How can we use those numbers to consider valuation for the two names?
We have run a regression of 2014 EV/EBITDA vs 2014-16 EBITDA growth for the areas of the market which we think are comparable to the satellite names: EU telecoms, US cable and satellite and EU infrastructure (primarily toll roads and airports). We do not put the current multiples and growth for the Fixed Satellite Services names on this chart. Instead we look at where they “should” be valued based on the 3.8% “normal year” EBITDA growth at Eutelsat and the 4.0% at SES.
FIGURE 20 EV/EBITDA vs EBITDA growth regression exercise for comparable sectors
Source: Barclays Research estimates (Barclays forecasts used for the other sectors)
As shown in the table below, the implied EV/EBITDA multiple for SES is 8.0x and for Eutelsat 7.9x. Eutelsat is not too far off that, whereas SES is clearly higher at 9.6x. This already factors in a value of €600m for O3b. So why are we Overweight on SES and Equal Weight on Eutelsat?
FIGURE 21 ETL looks broadly in-line; SES more expensive
2014E EV/EBITDA implied Actual trading 2014E EV/EBITDA
SES 8.0x 9.6x
Eutelsat 7.9x 8.4x
Source: Barclays Research estimates
Looking at sustainable tax advantage SES has a sustainable 15% tax rate. It might well vary slightly from that level, but its location in Luxembourg gives it good protection on a low tax rate. At the same time, Eutelsat is based in France and has a high tax rate. Again that could vary over time, but we would expect a substantial difference between the two to persist over time. Based on Eutelsat at 37% and SES at 15%, an NPV of the difference implies that we should remove €3.6bn from SES’s EV to make a fairer comparison. On that basis, SES would be on 7.2x EV/EBITDA. Perhaps investors will not be ready to assume that the tax disparity continues forever, but we clearly need to build it into our thinking.
EU Telco Incumbents
EU Telco Challengers
US Cable & Satellite
EU Infrastructurey = 52.195x + 5.8695R² = 0.8076
6.0x
6.5x
7.0x
7.5x
8.0x
8.5x
9.0x
9.5x
10.0x
10.5x
2.0% 3.0% 4.0% 5.0% 6.0% 7.0% 8.0% 9.0% 10.0%
Eutelsat
SES

Barclays | Fixed Satellite Services
30 September 2014 13
FIGURE 22 SES’s tax advantage is worth 2.4x on EV/EBITDA multiple
Tax calculation details
SES Tax Rate 15%
Eutelsat Tax Rate 37.0%
Difference 22.5%
Discount Rate 8.0%
NPV 3599
Multiple of EBITDA 2.4Source: Barclays Research estimates
We would also suggest that the average tax rate for the sectors shown above is in the 30% region, so SES has a sustainable advantage compared to nearly all comparable companies. An NPV of the difference between a 15% and 30% tax rate at SES points to €2.5bn or 1.6x SES EBITDA. So when making a comparison with the regression chart above, a tax-adjusted 2014E EV/EBITDA for SES would be 8.0x – or in other words broadly in line with where it “should be” on the chart.
So when adjusting for tax, SES looks more or less fairly valued for its growth potential vs its peer group sectors. And the tax gap is significant when valuing SES and Eutelsat.
Infrastructure peers are above the line on the regression The sector that is probably the most comparable to satellites in terms of long-term contracts and broad resilience is the European Infrastructure sector. In the regression of EV/EBITDA vs EBITDA growth above, that sector is perched above the line. We suggest that reliability vs telco sectors should argue for a higher multiple for the same growth rate for both infrastructure and satellite players. Clearly satellites have not been as reliable in the past few years as they were previously – primarily driven by the US Government. But our work on the structural issues in this report suggests to us that there are large parts of the business that should deliver reliable growth for many years.
So SES’s position on the line when adjusted for tax still looks attractive to us, given that the higher-quality business models in this group appear to be above the line.
Looking at the power of SES’s balance sheet Because the progress of FSS players in terms of revenue and capex is lumpy, we show a theoretical exercise below, modelling out the potential EPS growth SES could achieve with normal year EBITDA growth of 4.0%. Starting with our forecasts in Year 1, we show a five-year theoretical forecast period with 3.6% revenue growth and 4.0% EBITDA growth each year. Given all of the FSS operators are gradually seeing lower capex per transponder, we also assume that depreciation grows slightly slower than revenue, leaving 4.5% EBITA growth.

Barclays | Fixed Satellite Services
30 September 2014 14
FIGURE 23 Theoretical progress on revenues, EBITDA and EBITA
Source: Barclays Research (actual forecasts in Year 1, theoretical exercise for following years)
Then we model out what we would expect to be a standard cash flow scenario as well, with 1) cash interest and tax matching our P&L interest and tax (shown further down), 2) capex higher than in the current year and higher than our short-term forecasts because there will be some replacement capex from 2019 or 2020 onwards, and 3)dividends growing 10% p.a. as management has guided. On that basis, the model delevers by 0.2x each year.
FIGURE 24 Theoretical progress on cash flow for the SES model
€Millions Y1 Y2 Y3 Y4 Y5 Y6
EBITDA 1,448 1,506 1,566 1,629 1,694 1,761
Cash interest (172) (163) (154) (146) (139) (133)
Cash tax (108) (127) (135) (143) (151) (160)
Capital Expenditure (494) (548) (568) (589) (610) (633)
Free Cash Flow 638 668 709 751 792 836
Dividends (430) (473) (521) (573) (630) (693)
Net Cash / (Debt) (3,594) (3,400) (3,212) (3,034) (2,872) (2,729)
Net Debt/EBITDA 2.5x 2.3x 2.1x 1.9x 1.7x 1.5xSource: Barclays Research estimates (actual forecasts in Year 1, theoretical exercise for following years)
We then show the rest of the theoretical P&L before the impact of uses of cash. We leave a €51m negative in the associates line each year, which is what we model for its share of O3b losses this year. If this number reduces, it will clearly support SES’s EPS growth in the short term, but this is a “normal year” exercise so we leave the same number each year.
€ Millions YR 1 YR 2 YR 3 YR 4 YR 5 YR 6 CAGR
Revenues 1,959 2,030 2,104 2,181 2,260 2,343 ---> % Growth 3.6% 3.6% 3.6% 3.6% 3.6% 3.6%Operating Costs (511) (524) (538) (552) (567) (582) ---> % Revenues 26.1% 25.8% 25.6% 25.3% 25.1% 24.8%EBITDA (ex associates) 1,448 1,506 1,566 1,629 1,694 1,761 ---> % Growth 4.0% 4.0% 4.0% 4.0% 4.0% 4.0% ---> % Margin 73.9% 74.2% 74.4% 74.7% 74.9% 75.2%Depreciation (483) (497) (511) (527) (542) (558) ---> % Growth 2.9% 2.9% 2.9% 2.9% 2.9%EBITA (inc associates) 965 1,009 1,055 1,102 1,152 1,203 ---> % Growth 4.5% 4.5% 4.5% 4.5% 4.5% 4.5% ---> % Margin 49.3% 49.7% 50.1% 50.5% 50.9% 51.4%
Barclays | Fixed Satellite Services
30 September 2014 15
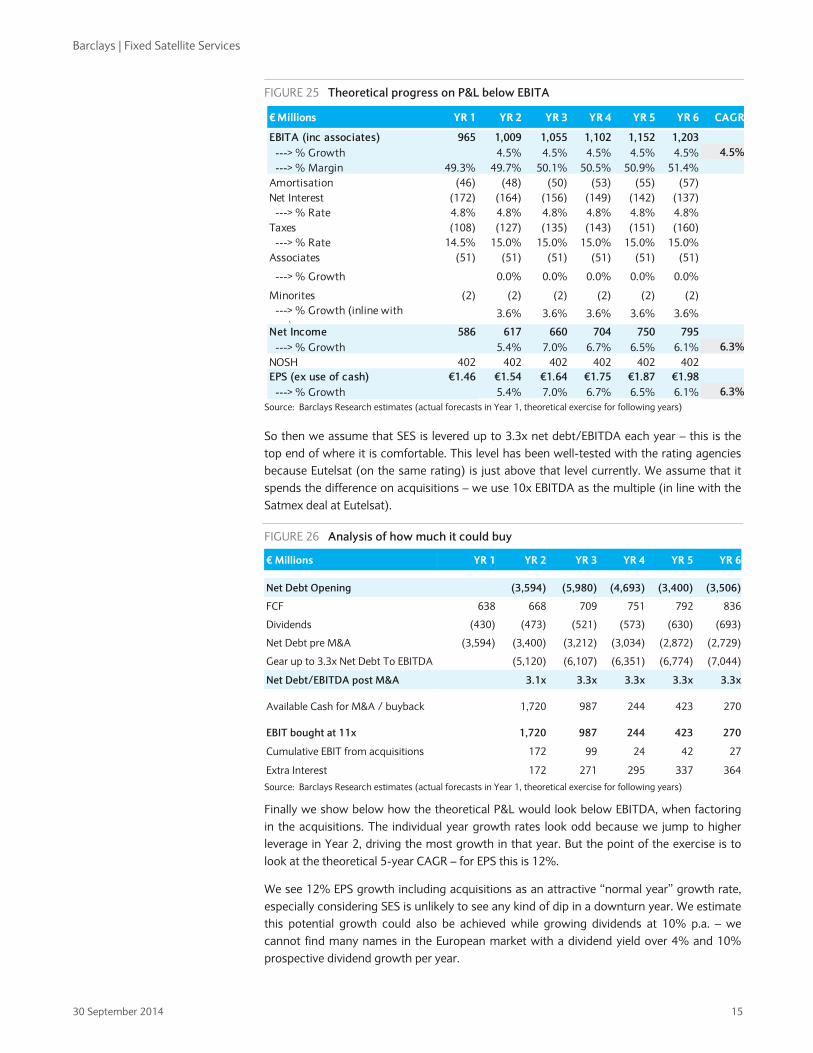
FIGURE 25 Theoretical progress on P&L below EBITA
Source: Barclays Research estimates (actual forecasts in Year 1, theoretical exercise for following years)
So then we assume that SES is levered up to 3.3x net debt/EBITDA each year – this is the top end of where it is comfortable. This level has been well-tested with the rating agencies because Eutelsat (on the same rating) is just above that level currently. We assume that it spends the difference on acquisitions – we use 10x EBITDA as the multiple (in line with the Satmex deal at Eutelsat).
FIGURE 26 Analysis of how much it could buy
€ Millions YR 1 YR 2 YR 3 YR 4 YR 5 YR 6
Net Debt Opening (3,594) (5,980) (4,693) (3,400) (3,506)
FCF 638 668 709 751 792 836
Dividends (430) (473) (521) (573) (630) (693)
Net Debt pre M&A (3,594) (3,400) (3,212) (3,034) (2,872) (2,729)
Gear up to 3.3x Net Debt To EBITDA (5,120) (6,107) (6,351) (6,774) (7,044)
Net Debt/EBITDA post M&A 3.1x 3.3x 3.3x 3.3x 3.3x
Available Cash for M&A / buyback 1,720 987 244 423 270
EBIT bought at 11x 1,720 987 244 423 270
Cumulative EBIT from acquisitions 172 99 24 42 27
Extra Interest 172 271 295 337 364
Source: Barclays Research estimates (actual forecasts in Year 1, theoretical exercise for following years)
Finally we show below how the theoretical P&L would look below EBITDA, when factoring in the acquisitions. The individual year growth rates look odd because we jump to higher leverage in Year 2, driving the most growth in that year. But the point of the exercise is to look at the theoretical 5-year CAGR – for EPS this is 12%.
We see 12% EPS growth including acquisitions as an attractive “normal year” growth rate, especially considering SES is unlikely to see any kind of dip in a downturn year. We estimate this potential growth could also be achieved while growing dividends at 10% p.a. – we cannot find many names in the European market with a dividend yield over 4% and 10% prospective dividend growth per year.
€ Millions YR 1 YR 2 YR 3 YR 4 YR 5 YR 6 CAGR
EBITA (inc associates) 965 1,009 1,055 1,102 1,152 1,203 ---> % Growth 4.5% 4.5% 4.5% 4.5% 4.5% 4.5% ---> % Margin 49.3% 49.7% 50.1% 50.5% 50.9% 51.4%Amortisation (46) (48) (50) (53) (55) (57)Net Interest (172) (164) (156) (149) (142) (137) ---> % Rate 4.8% 4.8% 4.8% 4.8% 4.8% 4.8%Taxes (108) (127) (135) (143) (151) (160) ---> % Rate 14.5% 15.0% 15.0% 15.0% 15.0% 15.0%Associates (51) (51) (51) (51) (51) (51)
---> % Growth 0.0% 0.0% 0.0% 0.0% 0.0%
Minorites (2) (2) (2) (2) (2) (2) ---> % Growth (inline with
)3.6% 3.6% 3.6% 3.6% 3.6%
Net Income 586 617 660 704 750 795 ---> % Growth 5.4% 7.0% 6.7% 6.5% 6.1% 6.3%NOSH 402 402 402 402 402 402 EPS (ex use of cash) €1.46 €1.54 €1.64 €1.75 €1.87 €1.98 ---> % Growth 5.4% 7.0% 6.7% 6.5% 6.1% 6.3%

Barclays | Fixed Satellite Services
30 September 2014 16
FIGURE 27 Theoretical progress in P&L including impact of acquisitions
Source: Barclays Research estimates
Conclusion on valuation So though SES looks like it has too high an EV/EBITDA multiple for its “normal year” EBITDA growth potential, we think that this comparison is unfair because 1) SES has a sustainably low tax rate; 2) we see strong cash generation and balance sheet headroom as having the potential to drive much stronger EPS growth than you would expect for 4% EBITDA growth; and 3) the Infrastructure sector is the best comp, in our view, and it trades on a premium within the regression analysis above. We therefore believe that SES can rerate further, as solid delivery underpins the reliability of the business.
For both SES and Eutelsat, we use a DCF to drive our price targets – we think this works well for satellites, given relatively visible mid-term cash flow growth. Our DCF drives a price target of €26.50 for Eutelsat and €31.40 for SES.
€ Millions YR 1 YR 2 YR 3 YR 4 YR 5 YR 6 CAGR
EBITDA post M&A 1,448 1,678 1,837 1,924 2,031 2,126 D&A post M&A (529) (545) (562) (579) (597) (615)EBIT post M&A 919 1,133 1,275 1,345 1,434 1,510 Net Interest post M&A (172) (216) (237) (238) (243) (246)Taxes post M&A (108) (138) (156) (166) (179) (190)Associates (51) (51) (51) (51) (51) (51)Minorities (2) (2) (2) (2) (2) (2)Net Income (inc M&A) 586 727 829 888 959 1,021 ---> % Growth 24.1% 14.1% 7.1% 8.0% 6.5% 11.8%NOSH 402 402 402 402 402 402 EPS (inc M&A) €1.46 €1.81 €2.06 €2.21 €2.39 €2.54 ---> % Growth 24.1% 14.1% 7.1% 8.0% 6.5% 11.8%

Barclays | Fixed Satellite Services
30 September 2014 17
PAY-OFF BETWEEN COMPRESSION AND RESOLUTION: ACCRETIVE OR DILUTIVE?
The likely impact of changes in compression technology on the FSS business has been one of the hottest areas of debate in the last couple of years. In this section, we look at this issue from several angles:
1) Has channel growth clearly outstripped Video revenue growth for the big players? If so, what could be the reasons for that?
2) Where could compression actually impact the business of FSS players in the next few years? (It’s not straightforward!)
3) Could it ever make sense for a pay TV group to invest in better compression to save space in the sky?
4) What are the prospects for Ultra HD?
Quick summary of our conclusions We make the following conclusions:
1. For Eutelsat and SES, revenue growth in the areas closest to DTH has been underperforming channel growth – but the key reasons are mix (lower priced geographies growing faster), timing of renewals, and probably the shift from DVB-S to DVB-S2 modulation. But it is not because of the shift from MPEG-2 to MPEG-4 compression;
2. The shift to MPEG-4 only matters when you remove the last MPEG-2 box – that is achievable for some pay TV groups in the next couple of years but the example of CanalSat suggests that when customers renew, their expectations for future increases in HD and then Ultra HD channels will more than offset the short-term benefits of applying MPEG-4 compression to the SD channels;
3. The issue of removing the last MPEG-2 box is only really relevant for pay TV customers in Europe: in many EM territories, operators moved straight to MPEG-4 boxes and therefore the next compression issue will only come when they move to HEVC boxes in quite a few years’ time, while Eutelsat (for example) has just under half of its DTH revenues from free TV customers, who are much less likely to make a major investment to squeeze out remaining MPEG-2 boxes.
Overall we do not see compression as a drag on revenue growth for SES and Eutelsat in the next few years. The moment to worry would be if the customers of satellite operators had been taking more capacity with a view to offering Ultra HD in the future, but then Ultra HD never takes off. Based on predictions for Ultra HD take-up, that seems unlikely but is clearly not impossible.
Intro: BSkyB slide showed capacity reduction as HD increased We start with background on the debate over compression. SES and Eutelsat have suggested for years that the shift from Standard Definition to High Definition is a growth driver, while the future shift to Ultra HD would also be accretive. The idea is that an HD channel takes up more space on a transponder, and Ultra HD more again, even factoring in better compression technologies (pay TV businesses have rolled out boxes with MPEG-4 compression as they have moved into HD). And then those benefits get partially offset because when SD channels are broadcast in MPEG-4 compression, they take up less space in the sky (but you can only get this benefit in practice when the last MPEG-2 customer has

Barclays | Fixed Satellite Services
30 September 2014 18
migrated). The net effect of all of this should be positive for satellite operator revenues, according to SES and Eutelsat.
A slide in BSkyB’s FY13 results (July-13) suggested this was not working. Sky has reduced transponders, while HD channels have gone to 71 from 15 in the past five years.
FIGURE 28 BSkyB slide on transponder efficiencies from FY13 results presentation
Source: BSkyB July 2013 * As of October 2013
So what was actually going on here? In its FY13 annual report, BSkyB noted that it has a contract with SES for 32 transponders and that until 3 October 2013 it would have a contract with Arqiva for a further four transponders, with Arqiva acting as an intermediary (the four transponders were on the Eutelsat 28A satellite). So first of all the drop from 36 to 32 transponders in 2013 is due to the four Arqiva transponders dropping out. That fact is relevant for SES but clearly does not alter the point that BSkyB now needs fewer transponders.
We see several reasons for Sky’s ability to reduce capacity in the sky:
• The upgrade from the DVB-S diffusion mode to DVB-S2 (a separate area where changes in compression can have an effect) has enabled BSkyB to squeeze more channels on to a transponder. For example, using MPEG-4 compression you can fit 26 channels on to a transponder with DVB-S2 vs 20 transponders with DVB-S. This is separate from the debate about the shift from MPEG-2 to MPEG-4. We think this has had a modest effect.
• But there is another important factor: BSkyB has been reducing their number of catch-up channels (+1) and pay-per-view carousels (with movies starting every 15 minutes to replicate an on-demand environment). As it has moved to using connected boxes to support catch-up services like iPlayer, and to deliver on-demand movies and box sets, it has been able to reduce the number of channels needed.
It is difficult to know how much these “one-off” channel reductions have driven the reduction in capacity needed, but the satellite operators believe that this is the most important reason. Can other payTV operators make similar savings? We have not done a comprehensive review, but looking at the channels on Sky Deutschland and Sky Italia, for example, there are far fewer of either category of channel (+1 or pay-per-view carousels). And moving into emerging markets, use of channels for these purposes is very rare. So it looks as though this is a legacy issue relating specifically to BSkyB.
35 35 3536 36
32
15
29 39
52
62
71
0
10
20
30
40
50
60
70
80
25
27
29
31
33
35
37
2008 2009 2010 2011 2012 2013 *
Satellite transponders (LHS) No of HD channels (RHS)
BSkyB’s reduction in transponders probably relates more to reductions in catch-up channels and carousel channels than to compression
Barclays | Fixed Satellite Services
30 September 2014 19
1) Channel growth running ahead of revenue growth – why? This has been a thorny issue in the last year. The bear argument in relation to channel growth goes like this:
• Every quarter we can track the growth in the number of channels on the FSS players’ services, and we can also see Video revenues for Eutelsat and Infrastructure revenues for SES (which are clearly weighted to Video);
• Revenue growth has been underperforming channel growth;
• Something is driving this differential and it seems likely that this relates to compression.
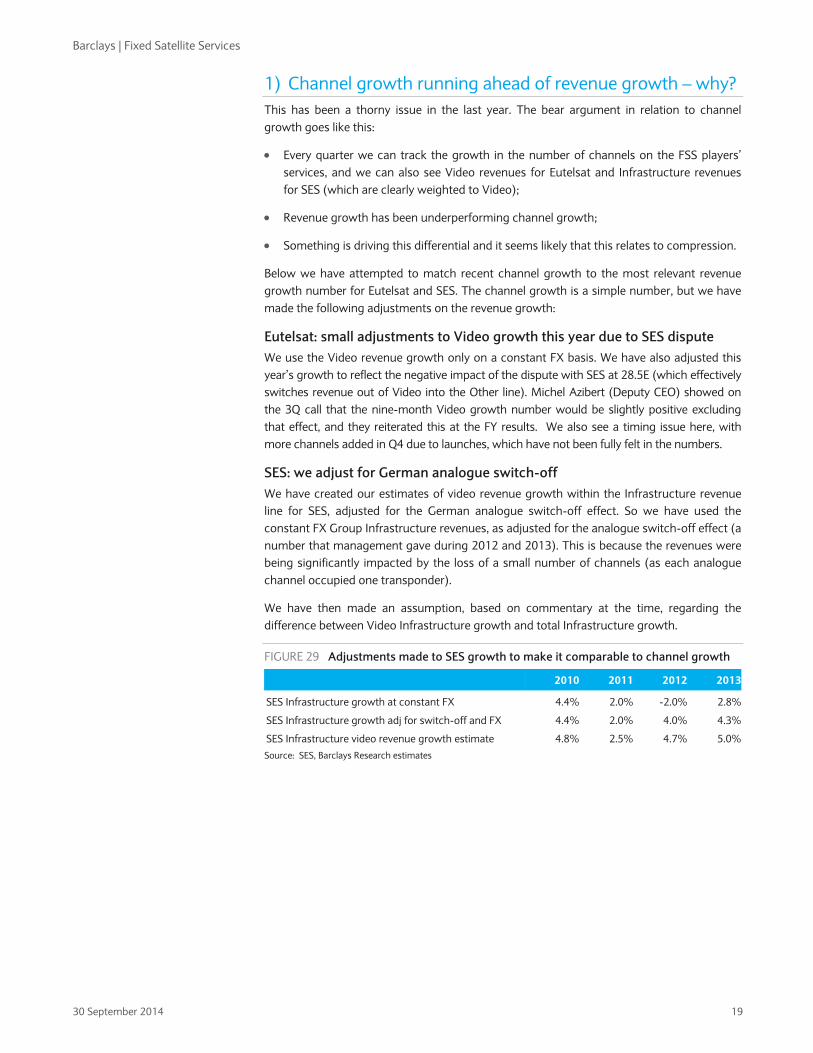
Below we have attempted to match recent channel growth to the most relevant revenue growth number for Eutelsat and SES. The channel growth is a simple number, but we have made the following adjustments on the revenue growth:
Eutelsat: small adjustments to Video growth this year due to SES dispute We use the Video revenue growth only on a constant FX basis. We have also adjusted this year’s growth to reflect the negative impact of the dispute with SES at 28.5E (which effectively switches revenue out of Video into the Other line). Michel Azibert (Deputy CEO) showed on the 3Q call that the nine-month Video growth number would be slightly positive excluding that effect, and they reiterated this at the FY results. We also see a timing issue here, with more channels added in Q4 due to launches, which have not been fully felt in the numbers.
SES: we adjust for German analogue switch-off We have created our estimates of video revenue growth within the Infrastructure revenue line for SES, adjusted for the German analogue switch-off effect. So we have used the constant FX Group Infrastructure revenues, as adjusted for the analogue switch-off effect (a number that management gave during 2012 and 2013). This is because the revenues were being significantly impacted by the loss of a small number of channels (as each analogue channel occupied one transponder).
We have then made an assumption, based on commentary at the time, regarding the difference between Video Infrastructure growth and total Infrastructure growth.
FIGURE 29 Adjustments made to SES growth to make it comparable to channel growth
2010 2011 2012 2013
SES Infrastructure growth at constant FX 4.4% 2.0% -2.0% 2.8%
SES Infrastructure growth adj for switch-off and FX 4.4% 2.0% 4.0% 4.3%
SES Infrastructure video revenue growth estimate 4.8% 2.5% 4.7% 5.0%Source: SES, Barclays Research estimates
Barclays | Fixed Satellite Services
30 September 2014 20
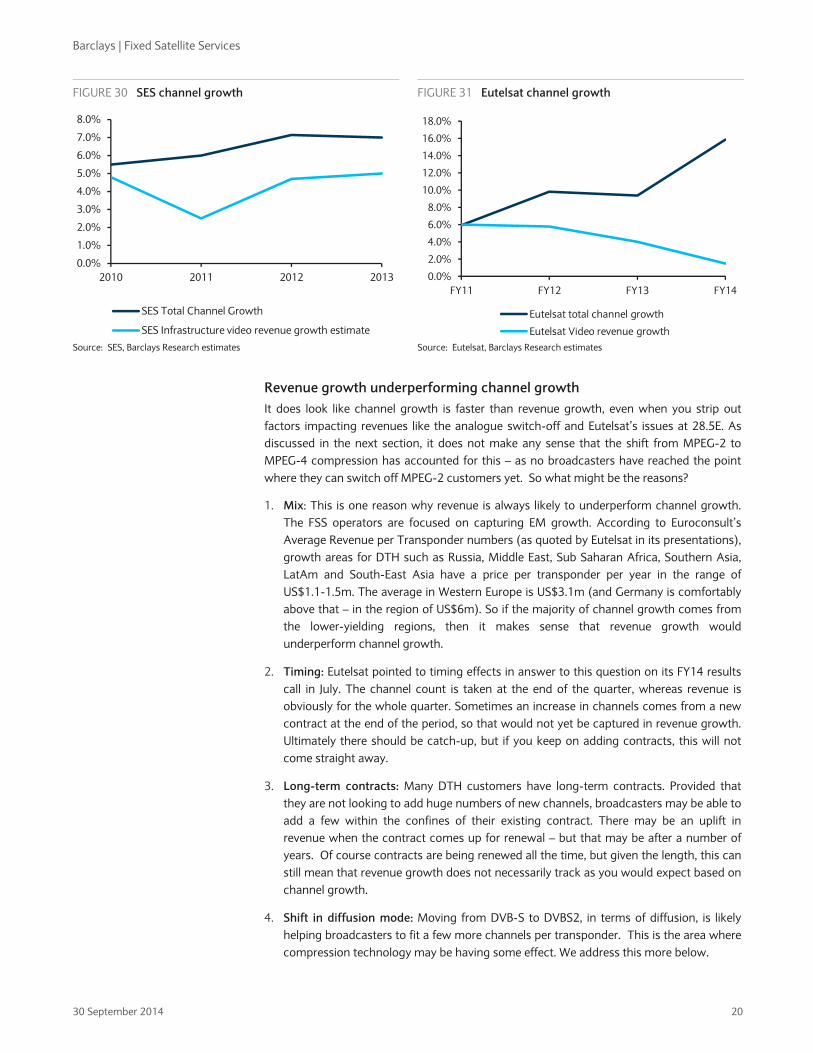
FIGURE 30 SES channel growth
FIGURE 31 Eutelsat channel growth
Source: SES, Barclays Research estimates Source: Eutelsat, Barclays Research estimates
Revenue growth underperforming channel growth It does look like channel growth is faster than revenue growth, even when you strip out factors impacting revenues like the analogue switch-off and Eutelsat’s issues at 28.5E. As discussed in the next section, it does not make any sense that the shift from MPEG-2 to MPEG-4 compression has accounted for this – as no broadcasters have reached the point where they can switch off MPEG-2 customers yet. So what might be the reasons?
1. Mix: This is one reason why revenue is always likely to underperform channel growth. The FSS operators are focused on capturing EM growth. According to Euroconsult’s Average Revenue per Transponder numbers (as quoted by Eutelsat in its presentations), growth areas for DTH such as Russia, Middle East, Sub Saharan Africa, Southern Asia, LatAm and South-East Asia have a price per transponder per year in the range of US$1.1-1.5m. The average in Western Europe is US$3.1m (and Germany is comfortably above that – in the region of US$6m). So if the majority of channel growth comes from the lower-yielding regions, then it makes sense that revenue growth would underperform channel growth.
2. Timing: Eutelsat pointed to timing effects in answer to this question on its FY14 results call in July. The channel count is taken at the end of the quarter, whereas revenue is obviously for the whole quarter. Sometimes an increase in channels comes from a new contract at the end of the period, so that would not yet be captured in revenue growth. Ultimately there should be catch-up, but if you keep on adding contracts, this will not come straight away.
3. Long-term contracts: Many DTH customers have long-term contracts. Provided that they are not looking to add huge numbers of new channels, broadcasters may be able to add a few within the confines of their existing contract. There may be an uplift in revenue when the contract comes up for renewal – but that may be after a number of years. Of course contracts are being renewed all the time, but given the length, this can still mean that revenue growth does not necessarily track as you would expect based on channel growth.
4. Shift in diffusion mode: Moving from DVB-S to DVBS2, in terms of diffusion, is likely helping broadcasters to fit a few more channels per transponder. This is the area where compression technology may be having some effect. We address this more below.
0.0%
1.0%
2.0%
3.0%
4.0%
5.0%
6.0%
7.0%
8.0%
2010 2011 2012 2013
SES Total Channel Growth
SES Infrastructure video revenue growth estimate
0.0%
2.0%
4.0%
6.0%
8.0%
10.0%
12.0%
14.0%
16.0%
18.0%
FY11 FY12 FY13 FY14
Eutelsat total channel growth
Eutelsat Video revenue growth

Barclays | Fixed Satellite Services
30 September 2014 21
So in conclusion, when you make an apples-for-apples comparison, channel growth has been somewhat higher than revenue growth. But there are a number of reasons why we should expect that – and only one of those relates to compression.
2) Practicalities of how compression could affect FSS players It is not true that every time a broadcaster moves a customer to a box with MPEG-4 compression it reduces the space needed in the sky. What matters is what you are broadcasting, not the receiving equipment of the viewers.
For example, when BSkyB broadcasts Sky Sports 1 SD, they need to broadcast it in MPEG-2 because otherwise customers who do not yet have an MPEG-4 box cannot see it. Then they also broadcast Sky Sports 1 HD in MPEG-4. The industry refers to this as simulcasting. The HD channel in MPEG-4 is incremental revenue for a satellite operator (compared to before there were MPEG-4 boxes or demand for HD). So in practical terms, the proportion of boxes that have MPEG-4 can move from 10% to 95% within the mix of subscribers, without impacting the spend of that broadcaster on satellites. At 90% or 95%, the pay TV business might look to actively squeeze out the remaining MPEG-2 boxes.
So the moment where compression changes could matter is when broadcasters (pay TV or free TV) are able to stop simulcasting MPEG-2 and MPEG-4 broadcasts – and can instead move to broadcasting all the channels (SD and HD) in MPEG-4. That moment comes when the last MPEG-2 box has gone. None of the major European pay TV or free TV platforms has made that change yet.
So do we need to worry about a “cliff” when MPEG-2 boxes are removed? We consider a theoretical worked example to address this question.
Broadcaster A has 50 channels of content and currently has half of its viewers using MPEG-2 boxes and half using MPEG-4 boxes. Broadcaster A shows 10 of its channels in HD, which means that it needs to broadcast 60 channels: 50 in SD and 10 in HD, as shown below.
FIGURE 32 Broadcaster A’s initial mix of channels and the no of transponders needed
Under current conditions
Channels Compression used for broadcast
Channels per txpd
Transponders needed
No of channels (in terms of content) 50
No of channels shown in SD 50 MPEG-2 12 4.2
No of channels shown in HD 10 MPEG-4 7 1.4
Total 60 5.6 Source: Barclays Research
The channels per transponder shown in the table above derive from Eutelsat’s guide to how many channels fit on a transponder based on a range of combinations of compression and resolution. We show this below.
FIGURE 33 Channels per transponder (36Mhz) with different compression/resolution
Format Diffusion Mode MPEG-2 MPEG-4 HEVC
SD DVB-S 12 20
DVB-S2 - 26 50?
HD DVB-S 2 to 3 5
DVB-S2 3 to 4 6 to 8 12 to 15
Ultra HD (4K) DVB-S2 1 to 2 3 to 4Source: Eutelsat 2013
Move from MPEG-2 to MPEG-4 is not about mix – you only get an effect when the last MPEG-2 box has gone
Barclays | Fixed Satellite Services
30 September 2014 22
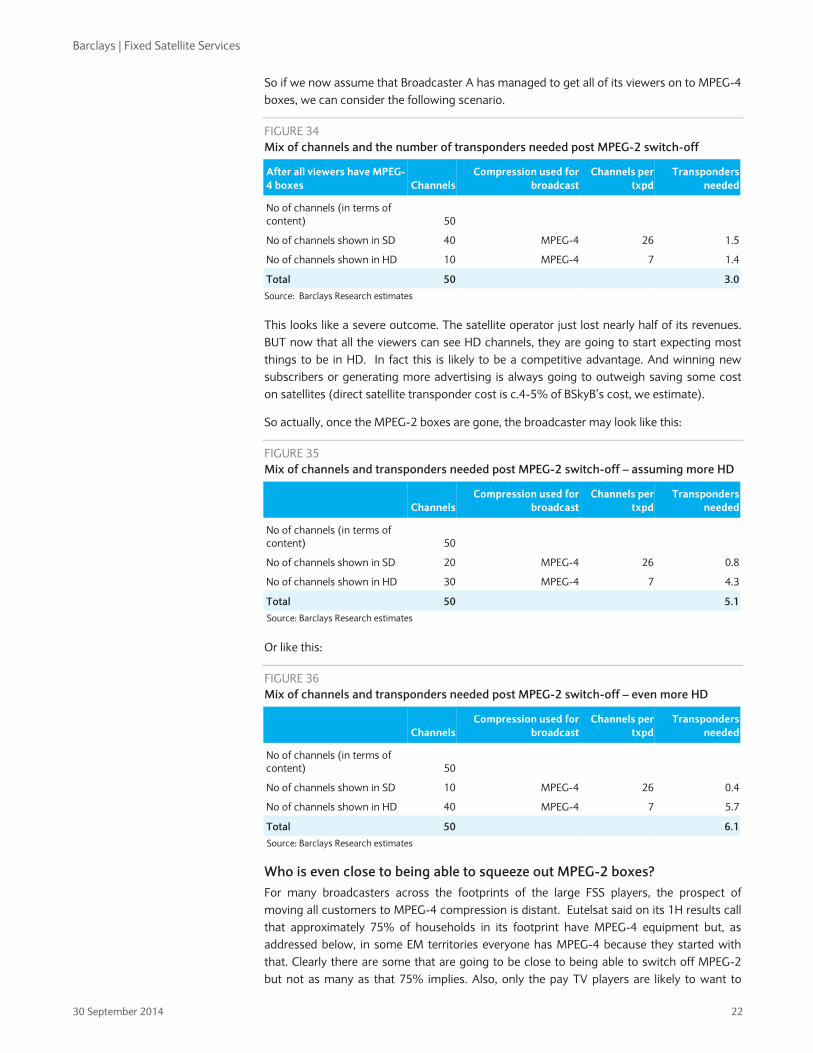
So if we now assume that Broadcaster A has managed to get all of its viewers on to MPEG-4 boxes, we can consider the following scenario.
FIGURE 34 Mix of channels and the number of transponders needed post MPEG-2 switch-off
After all viewers have MPEG-4 boxes Channels
Compression used for broadcast
Channels per txpd
Transponders needed
No of channels (in terms of content) 50
No of channels shown in SD 40 MPEG-4 26 1.5
No of channels shown in HD 10 MPEG-4 7 1.4
Total 50 3.0Source: Barclays Research estimates
This looks like a severe outcome. The satellite operator just lost nearly half of its revenues. BUT now that all the viewers can see HD channels, they are going to start expecting most things to be in HD. In fact this is likely to be a competitive advantage. And winning new subscribers or generating more advertising is always going to outweigh saving some cost on satellites (direct satellite transponder cost is c.4-5% of BSkyB’s cost, we estimate).
So actually, once the MPEG-2 boxes are gone, the broadcaster may look like this:
FIGURE 35 Mix of channels and transponders needed post MPEG-2 switch-off – assuming more HD
ChannelsCompression used for
broadcast Channels per
txpdTransponders
needed
No of channels (in terms of content) 50
No of channels shown in SD 20 MPEG-4 26 0.8
No of channels shown in HD 30 MPEG-4 7 4.3
Total 50 5.1 Source: Barclays Research estimates
Or like this:
FIGURE 36 Mix of channels and transponders needed post MPEG-2 switch-off – even more HD
ChannelsCompression used for
broadcast Channels per
txpdTransponders
needed
No of channels (in terms of content) 50
No of channels shown in SD 10 MPEG-4 26 0.4
No of channels shown in HD 40 MPEG-4 7 5.7
Total 50 6.1 Source: Barclays Research estimates
Who is even close to being able to squeeze out MPEG-2 boxes? For many broadcasters across the footprints of the large FSS players, the prospect of moving all customers to MPEG-4 compression is distant. Eutelsat said on its 1H results call that approximately 75% of households in its footprint have MPEG-4 equipment but, as addressed below, in some EM territories everyone has MPEG-4 because they started with that. Clearly there are some that are going to be close to being able to switch off MPEG-2 but not as many as that 75% implies. Also, only the pay TV players are likely to want to
Barclays | Fixed Satellite Services
30 September 2014 23
make the relevant investment to squeeze out MPEG-2 boxes: free TV players have never been in the business of spending heavily to subsidise boxes. Lastly, we believe that the risk of churn increases when pay TV operators choose to make changes to equipment – so there are some risks involved in squeezing out the last boxes as well.
CanalSat is a very interesting example: it is talking about being all MPEG-4 by July 2015, so is the pioneer here. So where does it fit in terms of the theoretical example above? According to SES, it renewed two years ago with 24 transponders, which included two incremental transponders – and it has doubled the number of HD channels in the past two years. So it is not expecting to make savings in the sky when it removes the last MPEG-2 box – or at least it is not expecting to make savings over time: its renewal was for 10 years.
Sky Deutschland has talked about removing its last box next year. It has said that it is so far undecided about whether to use this situation to make cost savings or to expand its HD line-up. Given Sky D’s focus on growth, we see the latter as the more likely option.
What will the revenue pattern be before MPEG-2 switch-off? For broadcasters who have both MPEG-2 and MPEG-4 subscribers, spend on satellite capacity is likely to increase modestly, as they choose to simulcast a few more of their SD channels in HD, to improve the offering for customers who have MPEG-4 boxes. This is assuming that they cannot pull off the same “tricks” as BSkyB in terms of removing catch-up and carousel channels. It also assumes that they do not change their diffusion from DVB-S to DVB-S2 (we address this below).
Compression not as widespread an issue among FSS customers as you think There are two factors here: 1) Free TV broadcasters are important customers for FSS operators; and 2) Emerging Markets Pay TV broadcasters have often started off in MPEG-4.
1. We tend to think of FSS operators as servicing pay TV operators because there are obvious large customers like BSkyB, Canal+, Sky Deutschland, Sky Italia and Cyfrowy Polsat. But Eutelsat management has noted that just under 50% of their customers are free-to-air broadcasters. SES is less exposed to free at c.[X%]. HD channels are still rare on free TV but are starting (e.g. the BBC). And free-to-air broadcasters are not in the business of subsidising boxes so will not be looking to aggressively squeeze out customers with MPEG-2 equipment. So we would expect free TV broadcasters to continue in their current pattern for a very long time.
2. In regions like Latin America, Indonesia, the Philippines and parts of sub-Saharan Africa, pay TV is still a fairly new business and so when set-top boxes were rolled out, they were all MPEG-4 from the start. Therefore there is no “cliff” to worry about – the benefits in terms of satellite capacity that comes with MPEG-4 are already being felt by these customers. The geographies where MPEG-2 boxes are likely to be prevalent (where the FSS operators also have DTH customers) are: Western Europe, Eastern Europe and Russia, and the Middle East.
Who is exposed where? Eutelsat has more exposure to free TV but less to EM regions where all the boxes are MPEG-4 already, while SES is the opposite. It is difficult to tell whether these two factors balance each other out: so we cannot say that one of these two is more exposed to compression risks than the other. Intelsat has fairly limited DTH business in the regions where there are still MPEG-2 boxes.
What about shifting from DVB-S to DVB-S2? Changing the “diffusion mode” from DVB-S to DVB-S2 can be done through software updates and this can somewhat reduce the capacity that broadcasters need on satellites.
CanalSat is looking to switch off MPEG-2 but increased transponders at last renewal
Sky Deutschland is approaching the same situation – undecided whether to make savings or expand HD

Barclays | Fixed Satellite Services
30 September 2014 24
Referring to Figure 33 above, the place to focus is on HD delivered in MPEG-4. Using DVB-S, you can fit five channels on to a transponder. But using DVB-S2 you can fit six to eight. Why should we not be focused on the difference between 20 channels in DVB-S vs 26 channels in DVB-S2 for SD in MPEG-4? Because as shown in our example above, most TV groups are not broadcasting SD channels in MPEG-4 – they will not be able to do that until they squeeze out MPEG-2 boxes. For Eutelsat, 10% of channels currently broadcast are in HD, while for SES it is 30%.
So moving to DVB-S2 from DVB-S still has the capacity to be a modest headwind to transponder demand as more operators update software across customer boxes and save on the space taken up by HD channels specifically.
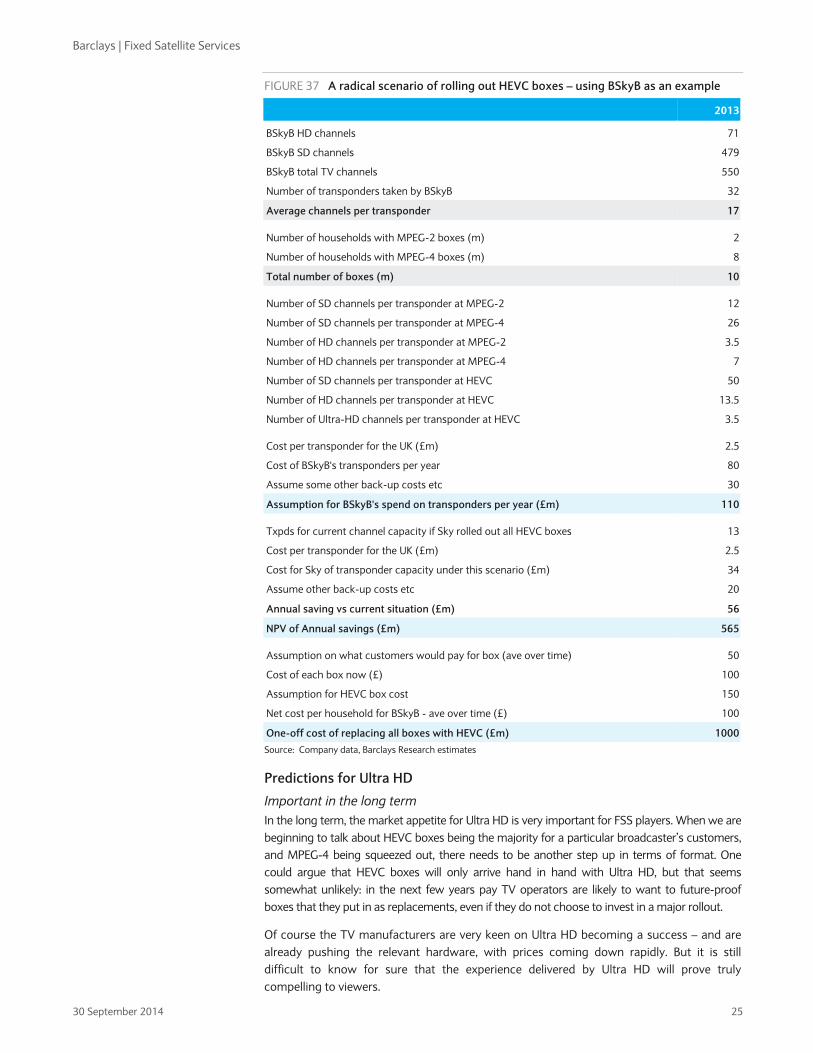
It makes no economic sense to invest in boxes to reduce satellite capacity Our work below, using BSkyB as an example, suggests that investment in new set-top boxes specifically to save spending on satellite capacity does not make economic sense. We use a radical example. We calculate that rolling out HEVC boxes in one go to all of Sky’s subscribers would cost c.£1bn. And we assume that the benefits offered by enhanced compression would save c.£60m per year. This assumes no change at all in the current mix of channels between SD, HD and Ultra HD. So that would be a <6% return on investment, or put another way, the NPV of the savings would be £500-600m vs the £1bn investment.
We think it is important to stress this – as it seems unlikely that any TV operator would set about replacing boxes just to save satellite costs. So pay TV operators are likely to roll out boxes with better compression for two reasons: 1) because they want to offer better resolution to their customers (e.g. HD or Ultra HD); or 2) because they need to replace old boxes anyway, and they want to future-proof the new boxes.
Barclays | Fixed Satellite Services
30 September 2014 25
FIGURE 37 A radical scenario of rolling out HEVC boxes – using BSkyB as an example
2013
BSkyB HD channels 71
BSkyB SD channels 479
BSkyB total TV channels 550
Number of transponders taken by BSkyB 32
Average channels per transponder 17
Number of households with MPEG-2 boxes (m) 2
Number of households with MPEG-4 boxes (m) 8
Total number of boxes (m) 10
Number of SD channels per transponder at MPEG-2 12
Number of SD channels per transponder at MPEG-4 26
Number of HD channels per transponder at MPEG-2 3.5
Number of HD channels per transponder at MPEG-4 7
Number of SD channels per transponder at HEVC 50
Number of HD channels per transponder at HEVC 13.5
Number of Ultra-HD channels per transponder at HEVC 3.5
Cost per transponder for the UK (£m) 2.5
Cost of BSkyB's transponders per year 80
Assume some other back-up costs etc 30
Assumption for BSkyB's spend on transponders per year (£m) 110
Txpds for current channel capacity if Sky rolled out all HEVC boxes 13
Cost per transponder for the UK (£m) 2.5
Cost for Sky of transponder capacity under this scenario (£m) 34
Assume other back-up costs etc 20
Annual saving vs current situation (£m) 56
NPV of Annual savings (£m) 565
Assumption on what customers would pay for box (ave over time) 50
Cost of each box now (£) 100
Assumption for HEVC box cost 150
Net cost per household for BSkyB - ave over time (£) 100
One-off cost of replacing all boxes with HEVC (£m) 1000Source: Company data, Barclays Research estimates
Predictions for Ultra HD
Important in the long term In the long term, the market appetite for Ultra HD is very important for FSS players. When we are beginning to talk about HEVC boxes being the majority for a particular broadcaster’s customers, and MPEG-4 being squeezed out, there needs to be another step up in terms of format. One could argue that HEVC boxes will only arrive hand in hand with Ultra HD, but that seems somewhat unlikely: in the next few years pay TV operators are likely to want to future-proof boxes that they put in as replacements, even if they do not choose to invest in a major rollout.
Of course the TV manufacturers are very keen on Ultra HD becoming a success – and are already pushing the relevant hardware, with prices coming down rapidly. But it is still difficult to know for sure that the experience delivered by Ultra HD will prove truly compelling to viewers.

Barclays | Fixed Satellite Services
30 September 2014 26
Not dramatically important in the next five years If some Ultra HD channels arrive on TV platforms in developed markets in the next few years and the number of compatible devices continues to ramp up, that will be taken as a good indicator for the long term. And potentially when broadcasters come to renew long-term contracts, the satellite operators may benefit from mid-term planning, which would include thoughts on Ultra HD. As Ultra-HD ready TVs start to move below $1,000, this scenario of early progress seems likely.
Though Ultra HD channels are unlikely to become significant in number in the next five years, it seems highly likely that these would be incremental, with broadcasters simulcasting the same channels in HD/MPEG-4 and Ultra HD/HEVC (just as they do currently with SD in MPEG-2 and HD in MPEG-4). But we would not expect the number of channels to be large enough to generate game-changing revenue. It is more important that we can gain confidence regarding Ultra HD’s place within the future mix.
Consultant forecasts on Ultra HD point to fairly slow take-up Euroconsult’s forecasts below point to a very small proportion of channels being in Ultra HD, even by 2022. But they do expect a big increase in HD by that time and it is important to remember that it only matters that Ultra HD is shown to be “here to stay” – not really how many channels there are. Because broadcasters will be planning for a time when Ultra HD becomes a more important part of the mix.
FIGURE 38 Forecasts for HD and Ultra HD as % of total channels in 2022 vs 2012
Source: Euroconsult 2013 (as shown in Eutelsat presentation from December 2013)
Separately, as shown in SES’s 2014 Investor Day presentation, IHS predicts that there will be 200 Ultra HD channels and 100m Ultra HD screens by 2020 globally and 1,000 Ultra HD channels and >500m Ultra HD screens by 2025. Again this shows that the numbers will be small but that Ultra HD is expected at least to be an established part of the mix.
Conclusion: Slightly accretive in next five years; longer-term Ultra HD is key So we have narrowed the debate on compression vs resolution to the following positives and negatives:
Positives:
1. More simulcasting of HD and SD channels by broadcasters who will have MPEG-2 boxes in their mix for some time;
2. Major ramp-up of HD channels when broadcasters move to all MPEG-4 boxes;
3. Broadcasters planning for Ultra HD in the future when renewing contracts.
85%
38%
91%
67%
95%
78% 92
%
78% 97
%
80% 90
%
68%
15%
60%
9%
32%
5%
21%
8%
21%
3%
19% 10
%
31%
2.4% 1.4% 1.5% 1.0% 0.8% 1.0%
0%
20%
40%
60%
80%
100%
SD HD Ultra HD
Barclays | Fixed Satellite Services
30 September 2014 27
Negatives:
1. Ongoing shift from DVB-S to DVB-S2 modulation (which does not need a box roll-out);
2. When MPEG-2 boxes are eliminated, double negative of a) no longer needing to simulcast channels and b) applying MPEG-4 compression to SD channels.
Neutral factors:
1. Anything that happens in DTH regions that started with all boxes carrying MPEG-4 and DVB-S2 (some emerging markets).
Small positive contribution to annual growth in relevant areas The key swing factors here are how aggressively pay TV groups ramp up HD channels within their mix when they do finally remove MPEG-2 boxes, and what their future views are on Ultra HD. We believe that as broadcasters renew their capacity, the primary motivation will be to have enough capacity to deliver HD and later Ultra HD – and that this motivation will smooth out the bump of squeezing out MPEG-2 boxes. Our view is therefore that there should be modest increases in capacity demands. But the shift from DVB-S to DVB-S2 will likely take the edge off those increases. So we expect a very small positive contribution to growth from the balance between compression and new formats over the next five years.
Beyond the next five years, Ultra HD take-up becomes critical. If broadcasters start to think that Ultra HD will not be a differentiator, then they will gradually replace existing boxes with HEVC ones and simply reduce demand in the sky. If Ultra HD takes off as the consultants suggest (becoming a small but permanent part of the mix with more significant growth beyond 2020) then we believe that this balancing act can continue to fall on the side of positive growth for the FSS operators.
DTH market growth: assuming 2% for Europe and 8% for EM In developed markets, which essentially means Europe for the major satellite operators, we expect little underlying growth in channels apart from the effects of HD/Ultra HD (partially offset by compression effects) as discussed above. We also see only very small increases coming from price.
Therefore we expect “normal year” revenue growth in developed market DTH to be about 2%.
Developing markets – a key source of capacity demand In developing markets, we see benefits coming through from significant increases in channels, as well as the move to HD (as shown in Figure 38). We have focused in this report on the compression issue – but we consider below a few forecasts which justify our thinking that this will be an area of strong revenue growth:
• At SES’s 2014 Investor Day, the company referred to its own forecast that the number of TV channels in Asia Pacific should double over the next five years.
• In a Eutelsat presentation, citing Euroconsult from 2013, the company points to a 4% channel growth CAGR from 2012 to 2022 in the EMEA and LatAm regions combined. Given that growth in Western Europe is likely to be fairly modest, this points to higher single-digit growth in the developing markets within that universe (LatAm, Africa and Eastern Europe).
• At SES’s 2013 investor day, it pointed to an expected 8.8% CAGR increase in Ku-band transponder demand from Latin American DTH between 2012 and 2020, and 9.8% for

Barclays | Fixed Satellite Services
30 September 2014 28
South-East Asian DTH over the same period. This was based on the company’s own analysis, using the work of consultants.
• Also at SES’s 2013 investor day, it pointed to Pay DTH in LatAm, Free-to-Air DTH in South Asia and combined Pay DTH and Free-to-Air DTH in South-East Asia as some of the most important drivers of transponder demand between 2012 and 2020. Those areas combined were forecast to drive 426 extra transponders (36 MHz transponder equivalents) of demand over that timeframe. In the same presentation, SES pointed to a global increase in transponder demand of 1,580 between 2012 and 2020. So just those applications within those markets represent c.25% of the forecast increase in demand.
We do not see reasons to doubt the potential for strong growth in transponder demand for Video uses in developing markets. We feel justified in going for strong growth in revenues in a “normal year” for emerging market DTH therefore: we assume 8%. Within this, we do not assume much increase in pricing.

Barclays | Fixed Satellite Services
30 September 2014 29
GOVERNMENT: SHORT-TERM WEAKNESS; RETURN TO GROWTH OVER TIME
This is the area of the satellite industry that has seen most change in terms of short-term progress. At Eutelsat, the Multi-Usage line (nearly all of which is the US Department of Defense) grew 30% in FY09, 30% in FY10, 28% in FY11 and 36% in 1H12. Since 2H12, excluding acquisitions, change of scope and FX, this line has seen double-digit declines. This has raised the profile of Government offerings among satellite investors – as a problem!
We see two key questions:
1. How will revenues trend in this area in the next year or so?
2. What are the likely long-term trends for commercial satellite operators?
We address those below, but we start with some key points of background.
Overview of global government satellite services market The US government is the single largest user of satellite capacity in the world – and it dominates government usage of commercial satellite operators. In 2011, 85-90% of SES’s government revenues were with the US government (with small amounts of government revenue in emerging market segments). Eutelsat has said that “nearly all” of its Multi-Usage revenue line is with the US Department of Defense. Intelsat mentions Australia and European government customers but only in passing and we assume they are a small part of their mix. So we assume that at least 90% of global government spend on commercial FSS capacity is from the US government.
US government and military spend on commercial satellite capacity We will mention the proprietary satellite operations of the US government below, but in this section we focus on sizing the market for government spend on commercial satellite capacity, and looking at the shares of the key players.
The charts below show our assumptions on the size of this market and the shares of the key players. The logic for our market sizing and share assumptions is set out below.
FIGURE 39 US dominates government satellite spend (2013)
FIGURE 40 Estimated share of US gov satellite spend (2013)
Source: Company information, Barclays Research estimates Source: Company information, Barclays Research estimates
• Intelsat has stated that 20% of its 2012 revenues were from government and group revenues were $2,610m in 2012. So its 2012 government revenues were $522m.
• The company mention the Australian Defence Force and the European Aeronautic Defense and Space Company as customers, but we assume these are a small part of the
US Gov90%
Other Govs10%
$1bn
$100m
Intelsat44%
SES15%
Eutelsat12%
Others29%
$447m$294m
$154m
$120m
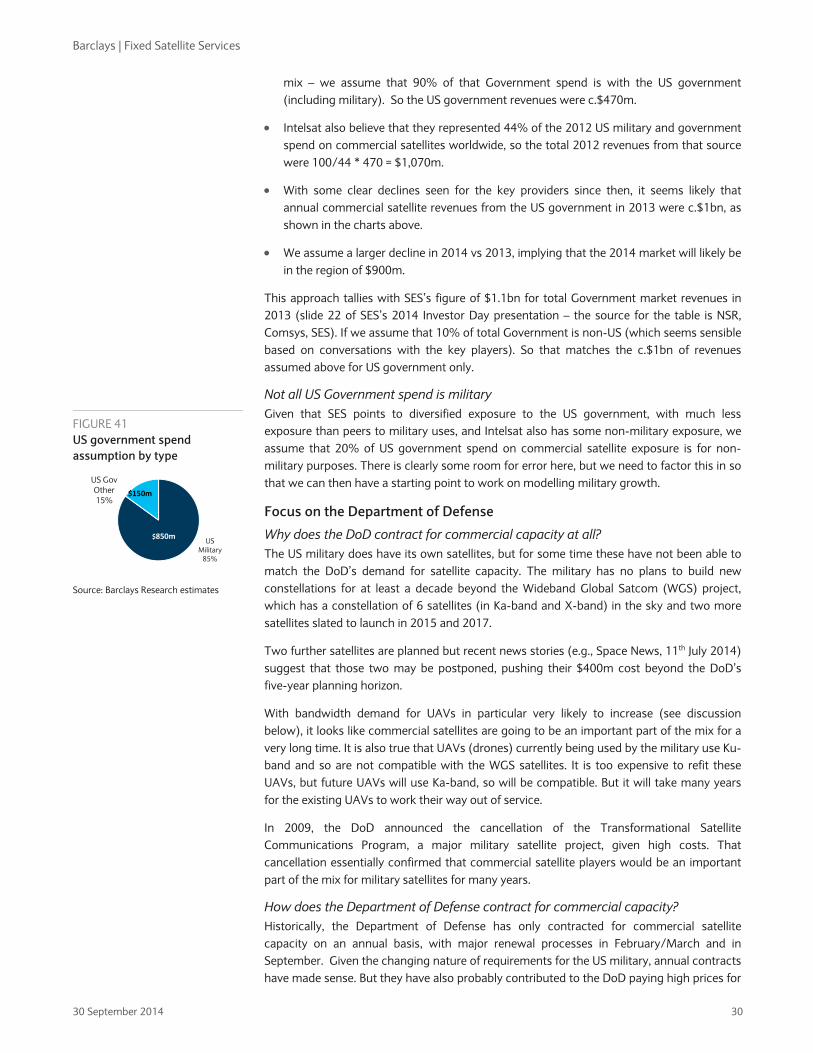
Barclays | Fixed Satellite Services
30 September 2014 30
mix – we assume that 90% of that Government spend is with the US government (including military). So the US government revenues were c.$470m.
• Intelsat also believe that they represented 44% of the 2012 US military and government spend on commercial satellites worldwide, so the total 2012 revenues from that source were 100/44 * 470 = $1,070m.
• With some clear declines seen for the key providers since then, it seems likely that annual commercial satellite revenues from the US government in 2013 were c.$1bn, as shown in the charts above.
• We assume a larger decline in 2014 vs 2013, implying that the 2014 market will likely be in the region of $900m.
This approach tallies with SES’s figure of $1.1bn for total Government market revenues in 2013 (slide 22 of SES’s 2014 Investor Day presentation – the source for the table is NSR, Comsys, SES). If we assume that 10% of total Government is non-US (which seems sensible based on conversations with the key players). So that matches the c.$1bn of revenues assumed above for US government only.
Not all US Government spend is military Given that SES points to diversified exposure to the US government, with much less exposure than peers to military uses, and Intelsat also has some non-military exposure, we assume that 20% of US government spend on commercial satellite exposure is for non-military purposes. There is clearly some room for error here, but we need to factor this in so that we can then have a starting point to work on modelling military growth.
Focus on the Department of Defense
Why does the DoD contract for commercial capacity at all? The US military does have its own satellites, but for some time these have not been able to match the DoD’s demand for satellite capacity. The military has no plans to build new constellations for at least a decade beyond the Wideband Global Satcom (WGS) project, which has a constellation of 6 satellites (in Ka-band and X-band) in the sky and two more satellites slated to launch in 2015 and 2017.
Two further satellites are planned but recent news stories (e.g., Space News, 11th July 2014) suggest that those two may be postponed, pushing their $400m cost beyond the DoD’s five-year planning horizon.
With bandwidth demand for UAVs in particular very likely to increase (see discussion below), it looks like commercial satellites are going to be an important part of the mix for a very long time. It is also true that UAVs (drones) currently being used by the military use Ku-band and so are not compatible with the WGS satellites. It is too expensive to refit these UAVs, but future UAVs will use Ka-band, so will be compatible. But it will take many years for the existing UAVs to work their way out of service.
In 2009, the DoD announced the cancellation of the Transformational Satellite Communications Program, a major military satellite project, given high costs. That cancellation essentially confirmed that commercial satellite players would be an important part of the mix for military satellites for many years.
How does the Department of Defense contract for commercial capacity? Historically, the Department of Defense has only contracted for commercial satellite capacity on an annual basis, with major renewal processes in February/March and in September. Given the changing nature of requirements for the US military, annual contracts have made sense. But they have also probably contributed to the DoD paying high prices for
FIGURE 41 US government spend assumption by type
Source: Barclays Research estimates
US Military
85%
US Gov Other15%
$850m
$150m

Barclays | Fixed Satellite Services
30 September 2014 31
satellite capacity, given that if they really need more capacity, they have historically had to go into negotiations every year. There have also historically been several intermediaries/integrators operating in between the DoD and satellite operators. As an indication, Eutelsat recently reclassified some revenues from their Data business into Multi-Usage (DoD) because they received new information from the intermediaries about who was the end user of their capacity.
In the Future Commercial Satellite Communications Services Acquisition (FCSA) structure, the US government is looking to simplify the way that it purchases commercial satellite capacity. Part of this is the “Pathfinder” projects. For example, SES recently announced that the US Air Force Space and Missile Systems Center is contracting an undisclosed satellite, which is in inclined orbit, for the rest of its life – for $8.2m. This is the result of a direct tender process, with no intermediaries involved. This is significant also because it is multi-year deal (we do not know how long is left on the inclined satellite but very likely more than one year).
So looking beyond budgetary constraints, commercial satellite operators could potentially benefit from removal of the middle men in some cases – and could also get some longer-term contracts which would make government revenue streams less volatile.
What difference has sequestration made? Intelsat, in particular, has suggested that some of the government spend on commercial satellites pre the US budget crisis will never come back. This is not because there are not long-term growth opportunities in the sector for any real structural reasons, it is because amid the intensity of running military campaigns in several different parts of the world at the same time, different parts of the DoD were contracting capacity without enough internal communication (e.g. between the Navy and Air Force). So areas of duplication were discovered, and that has been corrected.
Beyond that step-down effect, sequestration has seen large US government departments hunting for any discretionary spend to cut. In military sitcom, the axe has fallen on satellite communication for bases, for troop entertainment, etc. This is by far the least mission-critical of the military uses for commercial satellite capacity. They have looked to cut this spend heavily, replacing with ground infrastructure or other cheaper solutions.
We do not see reasons why the US budget crisis should have any long-term impact on the drivers behind government demand for capacity on commercial satellites.
What will be the short-term trends in US gov satcom spend? This is a key point of uncertainty for the FSS industry in the next year, in our view. There are two elements to consider for each of the big three FSS players: 1) when the impact of known contract losses/lower renewals will wash through, and 2) what the renewal/new contract situation will look like in the next 12 months. Point number 1) is much easier to answer.
In summary, the operators have been seeing some better signs in terms of new contracts being won, but 1) the negative effects of losing significant levels of business over the last 12 months (longer for Eutelsat) need to wash through before any better revenue trends can be seen; and 2) there remains considerable uncertainty on whether there will be more contract losses during 2H14 and 1H15. Overall, we expect revenue declines to continue in this segment for all of the operators in calendar 2015, but expect a lower rate of decline than in 2H13 or calendar 2014.

Barclays | Fixed Satellite Services
30 September 2014 32
Eutelsat: through the worst? Eutelsat has had a rough ride in Multi-Usage, its US government business, as shown below. So the worst was pretty bad. We are expecting rates of decline to moderate somewhat from here.
FIGURE 42 Eutelsat organic revenue growth at Multi-Usage (incl. Barclays forecasts)
Source: Company data, Barclays Research estimates
In the year to June 2014, Eutelsat saw revenue growth of 8.5% to €158m in their Multi-Usage line (which is essentially all with the Department of Defense). That sounds like a very strong rate of growth but we need to unpick that number:
1. The Eutelsat 172A acquisition boosted Q1 and adds c.4.5pts to FY14 Multi-Usage growth;
2. The Satmex acquisition contributed €9m to growth in FY14 or 6.5pts (as shown in management’s FY results presentation);
3. Some Data contracts were reclassified as Multi-Usage in FY14, adding c.8pts to FY14 growth (these are contracts handled through intermediaries where Eutelsat has now been able to get more precise information on the end customer);
4. FX was a drag of c.4pts (although they do have some hedges in place).
So an organic growth number is c.-7% (and they confirmed this during the FY results meeting and call).
This is better than the FY13 growth. The reported growth then was -0.7% but this was boosted by about 3pts from FX and we estimated that the Eutelsat 172A acquisition added 11pts to growth. So we estimated that the organic decline was c.-14% in FY13 (they were less specific on this than in FY14).
Looking forward to FY15: still an uncertain picture There are two key renewal “seasons” in the year for contracts with the DoD: in February/March and in September. In February/March 2014, renewals were -20% (a bit worse than expected) but there were new contracts in there. We had expected organic growth in this division to weaken through the year and therefore deliver worse than -7% for FY14. But the new contracts must have been more substantial than had been expected.
In FY15 we see very slightly better underlying declines: -6%, implying flat reported growth, given that there is still half a year’s contribution from Satmex to come through.
-20%
-15%
-10%
-5%
0%
5%
10%
15%
20%
25%
30%
35%
FY08 FY09 FY10 FY11 FY12 FY13 FY14 FY15E FY16E FY17E
Multi-Usage organic revenue growth

Barclays | Fixed Satellite Services
30 September 2014 33
The new contracts achieved in February and March 2014 will clearly continue to contribute. But the obvious swing factor will be the renewal rate in September and the following Feb/March. Regardless of the budgetary environment for the US DoD, there remains uncertainty over those renewals: there are also questions about where the DoD need capacity vs Eutelsat’s availability and competition from other operators (who have all suffered to one degree or another in the weaker budgetary environment).
Overall, the momentum from new contracts suggests that we are unlikely to return to clear double-digit declines in this line in FY15, but making an accurate prediction remains the hardest element of modelling Eutelsat on a one-year basis.
SES: feeling a hit now but starting to win good new business too For some time, SES looked to be immune to the US government impacts that were hurting Eutelsat. But they have started to see some declines this year in their North America business. It looks as though those issues started in 2H13, with constant FX revenue growth down c.10%, but there was a one-off benefit in 3Q12 which made for a tough comp. In 1H14 North America was down 13.5% at constant FX, but once again there was the effect of a positive one-off in the previous year (in 2Q13). Excluding that, North America growth was still down in the mid- to high-single-digit range in 1H14.
This is not actually too dissimilar to Eutelsat’s recent performance, but the weakness is likely to be more short-lived at SES, based on management’s comments at 1Q14 and 1H14 results:
1Q14: “[We have seen] lower SES government services business due to the non-renewals of certain contracts which started in the second half of 2013, and also due to the non-renewal of the CHIRP hosted payload contract in January 2014 [a double-digit million annual impact]. Having said that, and on a positive note, what we have observed is that our US government business has generated, during the first quarter of 2014, new business that is 20% ahead of the new business that was generated the same time last year.”
1H14: “Importantly in North America, as we continue to face headwinds as a result of the budget sequestration, we’ve developed very significant traction in creating new business. In fact, it has been significantly ahead of our track record last year.”
So the CHIRP contract (with the US Air Force), which dropped out at the beginning of 2014, is probably a drag of 3-4pts of growth on the North America line, and it seems likely that over time the new wins will start balancing out lost contracts. That does not mean that this business will necessarily return to growth in 2015 (we have -4%) but the contract wins do suggest that momentum is going in the right direction.
Intelsat: pain working its way through gradually The Government line started to feel pain in 3Q13, with US DoD and other government budget pressures driving “price concessions…, consolidation of capacity, and some cancellations” (Dave McGlade, CEO Intelsat – JPM Global TMT Conference May 2014). Similarly to Eutelsat and SES, Intelsat needs several quarters for these effects to wash through. The company has guided to a reduction of 15-20% for this year. It is down 15% in 1H14 but is not changing that guidance.
The company refers to needing to work the negative effects through the system, with the weakness coming from “price concessions we have to have made, consolidation of capacity, and some cancellations.” They expect negative effects to run through into 2015.
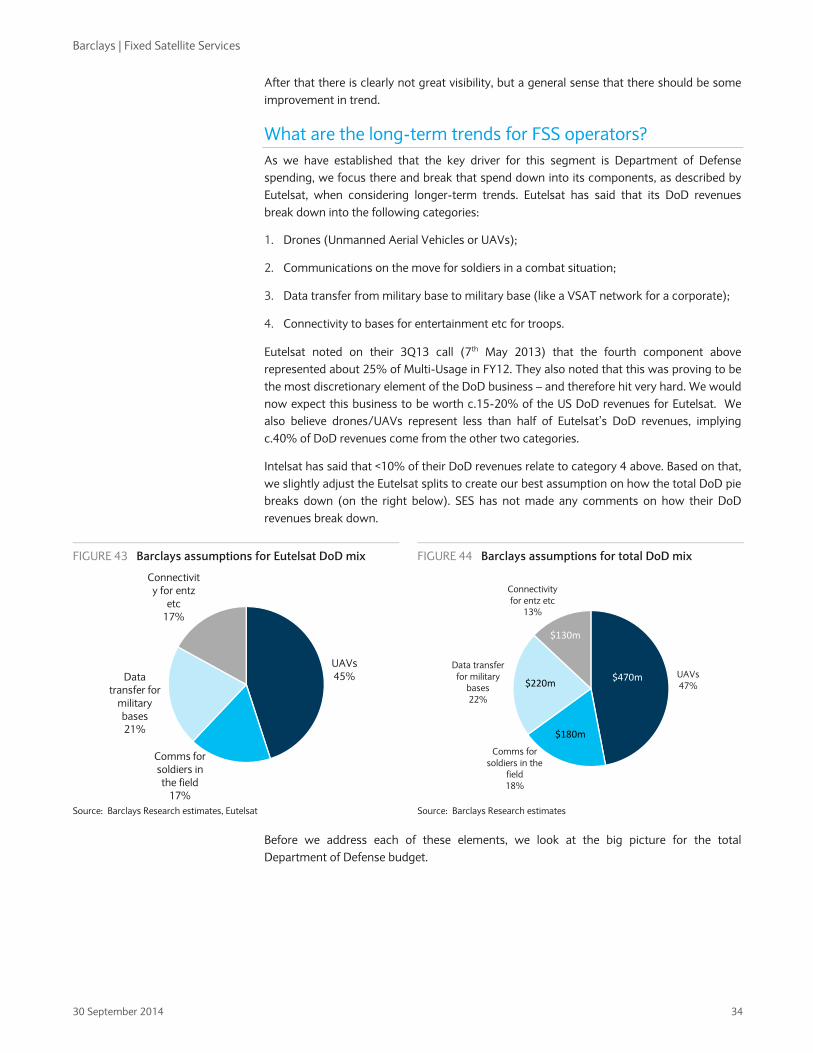
Barclays | Fixed Satellite Services
30 September 2014 34
After that there is clearly not great visibility, but a general sense that there should be some improvement in trend.
What are the long-term trends for FSS operators? As we have established that the key driver for this segment is Department of Defense spending, we focus there and break that spend down into its components, as described by Eutelsat, when considering longer-term trends. Eutelsat has said that its DoD revenues break down into the following categories:
1. Drones (Unmanned Aerial Vehicles or UAVs);
2. Communications on the move for soldiers in a combat situation;
3. Data transfer from military base to military base (like a VSAT network for a corporate);
4. Connectivity to bases for entertainment etc for troops.
Eutelsat noted on their 3Q13 call (7th May 2013) that the fourth component above represented about 25% of Multi-Usage in FY12. They also noted that this was proving to be the most discretionary element of the DoD business – and therefore hit very hard. We would now expect this business to be worth c.15-20% of the US DoD revenues for Eutelsat. We also believe drones/UAVs represent less than half of Eutelsat’s DoD revenues, implying c.40% of DoD revenues come from the other two categories.
Intelsat has said that <10% of their DoD revenues relate to category 4 above. Based on that, we slightly adjust the Eutelsat splits to create our best assumption on how the total DoD pie breaks down (on the right below). SES has not made any comments on how their DoD revenues break down.
FIGURE 43 Barclays assumptions for Eutelsat DoD mix
FIGURE 44 Barclays assumptions for total DoD mix
Source: Barclays Research estimates, Eutelsat Source: Barclays Research estimates
Before we address each of these elements, we look at the big picture for the total Department of Defense budget.
UAVs45%
Comms for soldiers in the field
17%
Data transfer for
military bases21%
Connectivity for entz
etc17%
UAVs47%
Comms for soldiers in the
field18%
Data transfer for military
bases22%
Connectivity for entz etc
13%
$220m
$180m
$470m
$130m

Barclays | Fixed Satellite Services
30 September 2014 35
FIGURE 45 There still remains a relatively wide range of potential outcomes for total budget authority…
FIGURE 46 …and hardware outlays
Source: Barclays Research, DoD, OMB, CBO, CSBA Note: FY2013 Budget Authority Adjusted Downward to Account for use of Prior Year Unobligated Funds Note: Units shown is $Bn
Source: Barclays Research, DoD, OMB, CBO, CSBA Note: Units shown is $Bn
The important thing to understand is that there is quite a wide range of outcomes for total DoD spending over the next few years, depending on whether you go with the President’s FY2015 budget or with the numbers implied by a sequester-level budget. These charts are taken from Let the Budget Battle Begin, a note from 5th March 2014 by Carter Copeland, the Barclays US Aerospace & Defense analyst. But little has changed in the budgetary environment since then. So even before we drill down into likely spend on the different components of the satellite business, it is important to note that there remains multi-year uncertainty on the whole pie of Department of Defense spending.
$475
$500
$525
$550
$575
FY14 FY15E FY16E FY17E FY18E FY19E
Total Budget Authority
President's FY2015 BudgetSequester‐Level Budget
$150
$160
$170
$180
$190
CY13 CY14E CY15E CY16E CY17E CY18E CY19E
Hardware Outlays
President's FY2015 BudgetSequester‐Level Budget
Barclays | Fixed Satellite Services
30 September 2014 36
Building a model to forecast growth in US military satcom It is not straightforward to model out growth in this area. But below, we break it down into the component pieces discussed above and look to use industry forecasts to help us estimate how each line might progress.
Focus on UAVs (47% of the US DoD satellite capacity spend, we estimate) Comments in the 2013-2038 version of the Unmannned Systems Integrated Roadmap document (published in December 2013) do not make great reading for commercial satellite players. But the DoD is incentivised to sound negative in these documents because they are in a permanent negotiation, which does need to be considered.
“A significant cost of current unmanned systems architectures is the procurement of satellite bandwidth through commercial leases. Most bandwidth used in support of deployed unmanned systems missions was procured individually, under unfavorable terms. By aggregating commercial SATCOM leases across multiple unmanned systems, DoD could significantly reduce costs in the future …
In addition to more efficient commercial leases, the overall cost of satellite bandwidth can be further reduced by leveraging more DoD SATCOM assets. Wideband global satellite (WGS) can be used in conjunction with DoD enterprise gateways to offload unmanned systems data traffic from commercial transponders. However, this strategy is not feasible today due to a lack of installed Ka band terminals on unmanned platforms.”
The impact of organisational efficiencies is already being felt within spend on commercial satellite capacity, as discussed above in the paragraph “How does the Department of Defense contract for commercial capacity?”. But of course there could be further impacts in the future from this.
Then in terms of the impact of the WGS system, we believe that it will take quite a few years for the issue of installed Ka-band terminals on UAVs to wash through. And it seems likely that demand will increase in the medium term so that the WGS factor will not destroy growth for commercial operators.
Considering procurement budgets for UAVs It is not possible to see the line within the US DoD budget for spend on satellite capacity on commercial satellites. We believe that looking at procurement budgets for UAVs could be helpful for predicting future spend on satellite capacity for UAVs by the DoD, although this is a far from perfect metric. For example, in a particular year, even if the DoD spent nothing incremental on UAVs themselves, they could be involved in conflict situations that meant much more use of the fleet of drones that they already have. In that case, they would need to contract for more commercial satellite capacity.
The other issue is that the historical budget predictions in these roadmap documents have not proved to be in any way accurate! The three charts below show the expectations for spending on procurement of UAVs for the following five years from starting points of 2009, 2011 and 2014. Each of these paints a “flat-to-down” picture (well the 2014 picture shows growth but 2013 was clearly a much higher number than 2014). However, in 2009 the prediction for 2011 was $1,705m, while the actual number shown in 2011 was $3,352m – almost double the amount. Likewise, the 2011 roadmap pointed to 2014 spend of $3,363m, whereas the most up-to-date expectation is for $1,505m: less than half.
In addition, if new UAVs are being procured, the old ones are not necessarily going away, so as long as they keep spending each year, the fleet of UAVs should increase.

Barclays | Fixed Satellite Services
30 September 2014 37
The changing shape of US military operations and then the sequestration budget crisis have driven this shape of squeezing up and squeezing down of expectations for spending. This shape has coincided with the strong growth in spend on commercial satellite capacity between 2009 and 2012, and then the reductions since then.
The good news is that even in a time of significant budget constraints, procurement spending on UAVs is not expected to get worse in the next few years.
FIGURE 47 Air Unmanned Systems Funding – Procurement – US gov budget ($bn): 2013
Source: Unmannned Systems Integrated Roadmap 2013-2038
FIGURE 48 Air Unmanned Systems Funding – Procurement – US gov budget ($bn): 2011
Source: Unmannned Systems Integrated Roadmap 2011-2036
0
500
1,000
1,500
2,000
2,500
2014 2015 2016 2017 2018
Air Unmanned Systems Funding - Procurement
2,700
2,800
2,900
3,000
3,100
3,200
3,300
3,400
3,500
2011 2012 2013 2014 2015
Air Unmanned Systems Funding - Procurement

Barclays | Fixed Satellite Services
30 September 2014 38
FIGURE 49 Air Unmanned Systems Funding – Procurement – US gov budget ($bn): 2009
Source: Unmannned Systems Integrated Roadmap 2009-2034
Consultant forecasts for UAV spend The chart below shows forecasts from Teal Group for spend on UAV procurement by the DoD made in 2012. So this is essentially Teal’s extension of the budget forecasts above, but it was done before the full effect of sequestration problems (this is the most recent data we have, taken from the UAS Manufacturing Trends briefing from the Congressional Research Service in January 2013). But Teal Group has reduced its overall long-term assumptions for UAV spend since 2012, as discussed on its website.
FIGURE 50 UAV procurement budget forecast (made in 2012) in $bn
Source: Teal Group 2012 (as shown in UAS Manufacturing Trends from the Congressional Research Service (Jan13))
Conclusion from looking at UAV spending expectations In the end, the important thing is that procurement spend on UAVs is expected to continue, thus expanding the size of the US UAV fleet. The exact speed of that expansion is very difficult to predict, as the last few years have shown.
What can we learn about flight hours? The Unmanned Systems integrated roadmap (2011-2031) highlighted that the CAGR in unmanned system flight hours had grown at a double-digit CAGR over the previous few years.
0
500
1,000
1,500
2,000
2,500
2009 2010 2011 2012 2013
Air Unmanned Systems Funding - Procurement
1.0
1.5
2.0
2.5
3.0
3.5
4.0
2013 2014 2015 2016 2017 2018 2019 2020 2021 2022
US Procurement

Barclays | Fixed Satellite Services
30 September 2014 39
FIGURE 51 UAV flight hours increased dramatically from the mid-2000s
Source: US Department of Defense: Unmanned Systems Integrated Roadmap (2011-2031)
In terms of US Army plans for UAVs (only one part of the mix as shown above), Colonel Timothy Baxter, an Army UAS project manager, stated at a briefing in March 2014 that Army UAV flight hours are likely to reduce significantly as overseas operations wind down. An article in Defense News (19th March 2014) noted that it took 20 years for Army UAVs to reach 1 million annual flight hours in 2010, but only a few more years to reach 2 million. But they now expect it to take considerably longer to reach the 3 million hours mark.
We do not have a holistic picture across the different forces on flight hours (the Integrated Roadmap stopped giving these numbers after the 2011 edition), but we would expect a much more measured picture over the next few years – barring a major escalation of some current conflicts.
What about other countries? Forecasts from the Teal Group made in 2012 point to much more growth in spend on UAVs likely to come from the rest of the world. Clearly some countries (like China and India) have their own satellites and would be somewhat unlikely to purchase space on western commercial satellites. But we do think that spending on UAVs from countries outside the US should prove a modest support to government demand growth on commercial FSS satellites, with this component also growing within the mix over time, supporting the total growth number.
050,000
100,000150,000200,000250,000300,000350,000400,000450,000500,000550,000600,000650,000
1996 1997 1998 1999 2000 2001 2002 2003 2004 2005 2006 2007 2008 2009 2010 2011
Estimate for 4th Qtr
Navy & USMC
Army
Air Force

Barclays | Fixed Satellite Services
30 September 2014 40
FIGURE 52 UAV procurement budget forecast (made in 2012) in $bn
Source: Teal Group 2012 (as shown in UAS Manufacturing Trends from the Congressional Research Service (Jan13))
Conclusion on the UAV component of the business Based on: 1) lower intensity of flight hours for US DoD UAVs; 2) ongoing DoD expenditure on new UAVs but at a much slower rate than over the past 5 years; 3) the eventual role of the DoD’s WGS Ka-band satellites; and 4) general DoD budget pressures, we opt for a 5% annual increase in transponder demand for the UAV component of the US DoD commercial satellite business, but with some ongoing pricing pressure, taking revenue growth to c.4% and EBITDA growth also to c.4%. We expect slower growth in 2014 (+1%) as the process of budget consolidation and a sharper procurement focus washes through.
Focus on Data Transfer to bases (22% of US DoD spend, we estimate) This business is similar to the VSAT networks discussed in our section on High Throughput Satellites. This is an area where we have far less to work with. There are many hundreds of US military bases outside the US – it is difficult to get consistent figures. How this number is likely to flex likely depends on conflict situations and the DoD budget.
Closing military bases within the US is a hot political issue: the DoD has an ongoing battle with Congress to close some bases within the US (there is excess capacity), but the impact on jobs in a local area makes this hard for politicians to allow. Therefore it seems likely that DoD budget pressures could lead to a modest reduction in the number of overseas bases over the next few years.
On the other hand it seems likely that data transfer to overseas bases will become a more important function over time.
We assume a reduction in spend on this element in the next couple of years and then flattish spend thereafter.
Focus on soldier comms in the field (18% of US DoD spend, we estimate) Barclays US Aerospace and Defense analyst, Carter Copeland, expects the number of US soldiers in major conflict areas to be close to zero by 2016, which is clearly a major decline compared to 3-5 years ago. This suggests an ongoing negative trend for this component of the business.
However, there will always be a base level of usage due to training, which is still pretty significant.
Clearly the key driver of this line will be whether the DoD puts more soldiers back into conflict situations at any time in the next few years. We do not assume they do, and we
0
1
2
3
4
5
6
7
8
2013 2014 2015 2016 2017 2018 2019 2020 2021 2022
US Procurement ROW Procurement

Barclays | Fixed Satellite Services
30 September 2014 41
factor in declines in 2015 and 2016. But after that, we assume that more soldiers begin to use this kit and assume some modest growth.
Focus on comms for entertainment etc (13% of US DoD spend, we estimate) This is the area of spend that Eutelsat in particular has highlighted as the most discretionary for the DoD. This is providing broadband connections to bases for non-military purposes such as entertainment.
We expect the DoD to continue looking for other cheaper alternatives here and therefore assume that this declines from 13% of the total to only 3% by 2020.
This implies a revenue fall of 15% in a normal year going forward (we assume worse for the next two years).
Putting these assumptions into our model On the next page, we show our model for growth in global government spend on commercial satellite operators.
Putting together our work above on the different elements of US Department of Defense spending, we expect declines in 2014 and 2015 for DoD spend and then a gradual return to 2-3% growth (no more).
For the portion of US government spending on commercial satellite capacity that is not with the DoD, we assume a decline in 2014 due to ongoing budget pressures but then c.1% growth going forward.
The last piece of our model is spending from other governments on commercial satellite capacity (which we assume is focused on military uses, particularly UAVs). Based on UAV spending forecasts, we assume that this accelerates over several years to growth of c.10% and stays there for some years.
Overall, our assumptions point to an overall decline in the Government segment revenues in 2014 (for the market as a whole), a much smaller decline in 2015 and then a gradual recovery to c.3% growth over time.
We set our “normal year” growth for this revenue stream at 2.5%. We assume no operational gearing and therefore our “normal year” EBITDA number is 2.5% as well.

Barclays | Fixed Satellite Services
30 September 2014 42
FIGURE 53 Barclays model for Government expenditure on commercial satellite capacity
$m 2013 2014E 2015E 2016E 2017E 2018E 2019E 2020E
UAVs 400 403 416 428 441 454 468 482
% of total 47.0% 50.7% 53.4% 55.0% 56.0% 56.6% 57.2% 57.7%
% growth yoy 1.0% 3.0% 3.0% 3.0% 3.0% 3.0% 3.0%
Communications on the move for soldiers 153 141 134 132 136 140 145 149
% of total 18.0% 17.7% 17.2% 17.0% 17.3% 17.5% 17.7% 17.8%
% growth yoy -8.0% -5.0% -1.0% 3.0% 3.0% 3.0% 3.0%
Data transfer from base to base 187 174 167 169 170 172 174 175
% of total 22.0% 21.9% 21.5% 21.7% 21.6% 21.4% 21.2% 21.0%
% growth yoy -7.0% -4.0% 1.0% 1.0% 1.0% 1.0% 1.0%
Connectivity for entertainment etc 110.5 77 62 50 40 36 32 29
% of total 13.0% 9.7% 8.0% 6.4% 5.0% 4.4% 3.9% 3.5%
% growth yoy -30.0% -20.0% -20.0% -20.0% -10.0% -10.0% -10.0%
Total DoD spend 850 796 778 779 787 802 818 835
% of total 100.0% 100.0% 100.0% 100.0% 100.0% 100.0% 100.0% 100.0%
% growth yoy -6.4% -2.2% 0.1% 1.1% 1.9% 2.0% 2.1%
DoD spend 850 796 778 779 787 802 818 835
% of total 85% 85% 84% 84% 84% 84% 84% 85%
% growth yoy -6.4% -2.2% 0.1% 1.1% 1.9% 2.0% 2.1%
Other US Government spend 150 146 146 147 148 150 151 153
% of total 15% 15% 16% 16% 16% 16% 16% 15%
% growth yoy -3% 0% 1% 1% 1% 1% 1%
Total US Government spend 1000 941 924 926 936 952 970 988
% of total 100.0% 100.0% 100.0% 100.0% 100.0% 100.0% 100.0% 100.0%
% growth yoy -5.9% -1.8% 0.2% 1.1% 1.8% 1.8% 1.9%
US Government spend 1000 941 924 926 936 952 970 988
% of total 91% 90% 89% 88% 87% 86% 85% 84%
% growth yoy -5.9% -1.8% 0.2% 1.1% 1.8% 1.8% 1.9%
Other Government spend 100 107 114 126 139 152 168 184
% of total 9% 10% 11% 12% 13% 14% 15% 16%
% growth yoy 7% 7% 10% 10% 10% 10% 10%
Total Government spend 1100 1048 1038 1051 1074 1105 1137 1172
% of total 100% 100% 100% 100% 100% 100% 100% 100%
% growth yoy -4.7% -0.9% 1.3% 2.2% 2.8% 3.0% 3.1%
Source: Barclays Research estimates

Barclays | Fixed Satellite Services
30 September 2014 43
FIGURE 54 Barclays assumption for growth in global government spend on commercial satellite capacity
Source: Barclays Research estimates
Gov market revenue growth: expect 2.5% in a normal year So after taking some time to recover, we expect the total Government market for the FSS industry to be able to grow revenues at 2.5% in a normal year, as shown on the chart above.
Comparing consultant forecasts In 2013, NSR forecast CAGR of 4.6% revenue growth from 2012 to 2017 for global government and military applications in C- and Ku-band.
In 2013, SES showed a satellite capacity CAGR forecast of 2.5% for Military and 5.4% for Enterprise & Government for 2012-2020 globally (again C/Ku-band only).
Both of these forecasts do not capture Ka-band growth. The SES forecast probably implies 3-4% capacity growth for Government & Military combined.
Since those forecasts were set, there has been some incrementally negative news on government satcom spending: we would expect them to come down somewhat.
Therefore we see only a small negative disparity between our “normal year” revenue growth of 2.5% and the forecasts shown above.
-8%
-6%-4%-2%
0%2%
4%6%
8%10%12%
2014 2015 2016 2017 2018 2019 2020
% US DoD growth % Other US Gov growth
% Other Gov growth % Total Global Gov growth
Barclays assumption for growth in global government spend on commercial satellite capacity
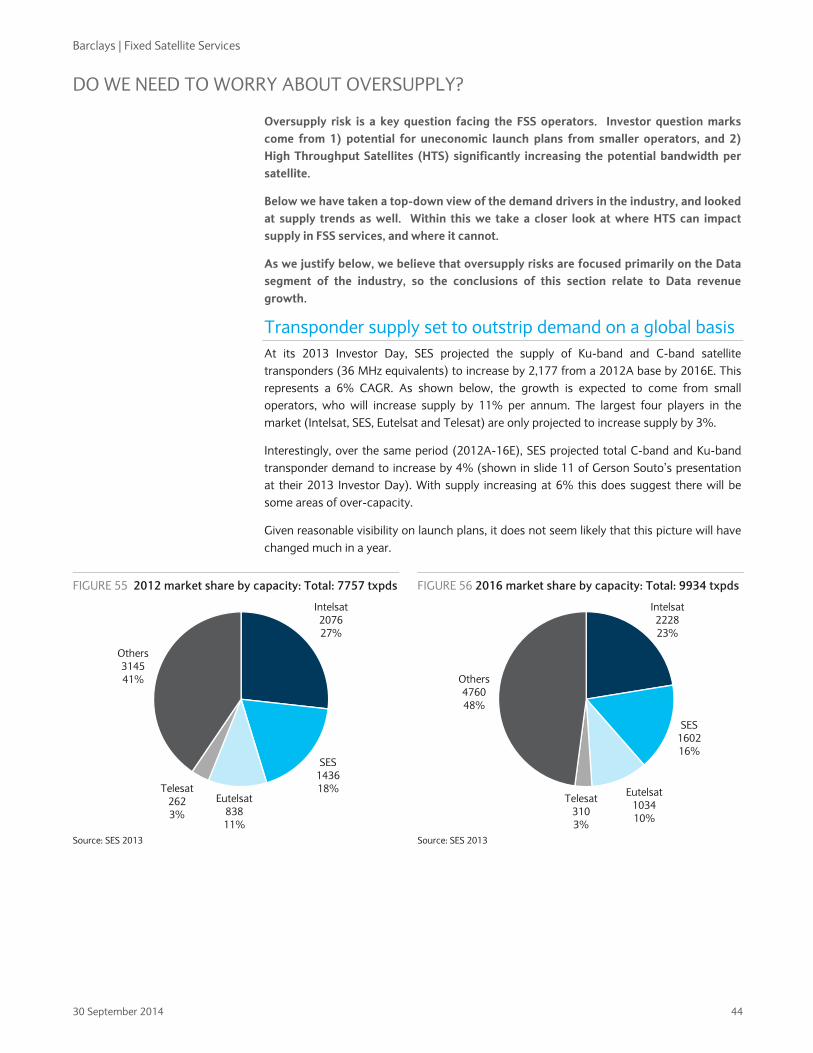
Barclays | Fixed Satellite Services
30 September 2014 44
DO WE NEED TO WORRY ABOUT OVERSUPPLY?
Oversupply risk is a key question facing the FSS operators. Investor question marks come from 1) potential for uneconomic launch plans from smaller operators, and 2) High Throughput Satellites (HTS) significantly increasing the potential bandwidth per satellite.
Below we have taken a top-down view of the demand drivers in the industry, and looked at supply trends as well. Within this we take a closer look at where HTS can impact supply in FSS services, and where it cannot.
As we justify below, we believe that oversupply risks are focused primarily on the Data segment of the industry, so the conclusions of this section relate to Data revenue growth.
Transponder supply set to outstrip demand on a global basis At its 2013 Investor Day, SES projected the supply of Ku-band and C-band satellite transponders (36 MHz equivalents) to increase by 2,177 from a 2012A base by 2016E. This represents a 6% CAGR. As shown below, the growth is expected to come from small operators, who will increase supply by 11% per annum. The largest four players in the market (Intelsat, SES, Eutelsat and Telesat) are only projected to increase supply by 3%.
Interestingly, over the same period (2012A-16E), SES projected total C-band and Ku-band transponder demand to increase by 4% (shown in slide 11 of Gerson Souto’s presentation at their 2013 Investor Day). With supply increasing at 6% this does suggest there will be some areas of over-capacity.
Given reasonable visibility on launch plans, it does not seem likely that this picture will have changed much in a year.
FIGURE 55 2012 market share by capacity: Total: 7757 txpds
FIGURE 56 2016 market share by capacity: Total: 9934 txpds
Source: SES 2013 Source: SES 2013
Intelsat207627%
SES143618%
Eutelsat83811%
Telesat2623%
Others314541%
Intelsat222823%
SES160216%
Eutelsat103410%
Telesat3103%
Others476048%
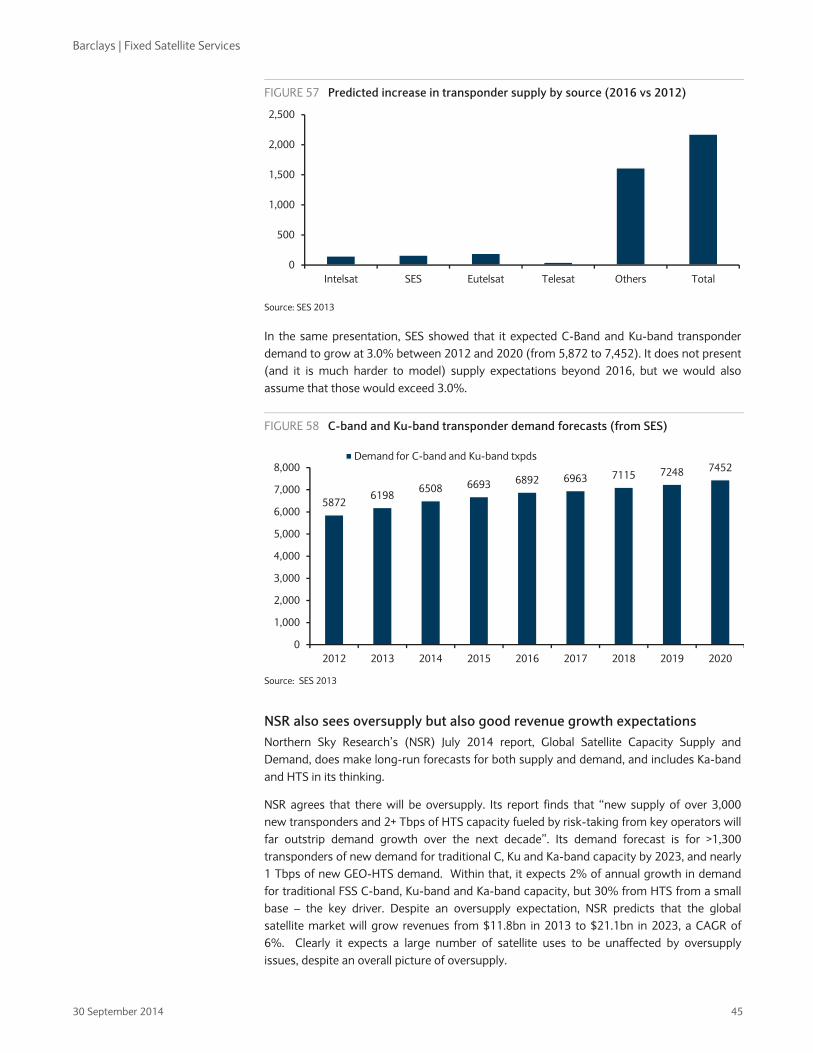
Barclays | Fixed Satellite Services
30 September 2014 45
FIGURE 57 Predicted increase in transponder supply by source (2016 vs 2012)
Source: SES 2013
In the same presentation, SES showed that it expected C-Band and Ku-band transponder demand to grow at 3.0% between 2012 and 2020 (from 5,872 to 7,452). It does not present (and it is much harder to model) supply expectations beyond 2016, but we would also assume that those would exceed 3.0%.
FIGURE 58 C-band and Ku-band transponder demand forecasts (from SES)
Source: SES 2013
NSR also sees oversupply but also good revenue growth expectations Northern Sky Research’s (NSR) July 2014 report, Global Satellite Capacity Supply and Demand, does make long-run forecasts for both supply and demand, and includes Ka-band and HTS in its thinking.
NSR agrees that there will be oversupply. Its report finds that “new supply of over 3,000 new transponders and 2+ Tbps of HTS capacity fueled by risk-taking from key operators will far outstrip demand growth over the next decade”. Its demand forecast is for >1,300 transponders of new demand for traditional C, Ku and Ka-band capacity by 2023, and nearly 1 Tbps of new GEO-HTS demand. Within that, it expects 2% of annual growth in demand for traditional FSS C-band, Ku-band and Ka-band capacity, but 30% from HTS from a small base – the key driver. Despite an oversupply expectation, NSR predicts that the global satellite market will grow revenues from $11.8bn in 2013 to $21.1bn in 2023, a CAGR of 6%. Clearly it expects a large number of satellite uses to be unaffected by oversupply issues, despite an overall picture of oversupply.
0
500
1,000
1,500
2,000
2,500
Intelsat SES Eutelsat Telesat Others Total
58726198
6508 6693 6892 6963 7115 7248 7452
0
1,000
2,000
3,000
4,000
5,000
6,000
7,000
8,000
2012 2013 2014 2015 2016 2017 2018 2019 2020
Demand for C-band and Ku-band txpds
Barclays | Fixed Satellite Services
30 September 2014 46
How can we predict where there could be problems? There are many areas of that FSS business that are unlikely to feel much impact from the trend towards global oversupply that we discussed above. We consider where there could be impact from the point of view of geography and revenue type.
Where geographically is the oversupply likely to be most intense? On Slide 6 of the first presentation from SES’s 2013 Investor Day (http://www.ses.com/15433026/130619_CEO_Web.pdf), it shows the geographies where new satellites (either in construction or in planning) will be launched by National Satellite Operators (NSOs). These operators comprise the bulk of the Other category in Figure 57 above and therefore the key area of uncertainty for future oversupply risk. This is as of the end of 2012, but the picture is unlikely to have changed dramatically. So the key areas for the “under construction” and “in concept” satellites are:
• Latin America (all over)
• Middle East
• Parts of North, East and Central Africa
• Parts of the former USSR
• Parts of South East Asia
• Australia
So the most overlap with the international players is in Latin America, parts of Africa, the Middle East and South East Asia.
What are satellites launched by NSOs being used for already? A quick review of the services being offered by NSOs suggests that their satellites have a variety of uses from government services to consumer broadband to enterprise connectivity to DTH. Overall, there seems to be less of a focus on DTH among these operators – probably because it is difficult for them to deliver 100% reliability.
Who is most exposed? SES has exposure to LatAm, South East Asia and parts of Africa. In South East Asia, SES seems most focused on DTH and already has a strong positioning there. This is also an area of strong demand, so it seems unlikely that NSO launches are going to derail its business in that part of the world. Africa has been an area of oversupply for some time, with new terrestrial infrastructure a key reason. It is difficult to know whether NSO launches are making or will make that notably worse – but it is an area that all of the FSS players accept as a challenge on the pricing front in the next few years.
Eutelsat is exposed to data in the Middle East and North Africa and to a much smaller extent in sub-Saharan Africa.
What areas of satellite business could be affected?
Supply and demand worries are less relevant for established DTH business For the Video business (c.65% of Eutelsat and c.70% of SES), supply and demand is not such a worry. Certainly where a satellite operator has an established neighbourhood such as Italy for Eutelsat, or Germany/UK for SES, customers are not able to switch without very dramatic costs. And even looking at a market like South East Asia, SES has enough dishes pointing at its satellites to make the business very sticky (across India and South East Asia they serve c.20m households). Therefore, those operators are only going to launch a new satellite for DTH if it is clear that there is enough specific DTH demand in those areas from

Barclays | Fixed Satellite Services
30 September 2014 47
existing or new customers. The large operators also put in place very long-term contracts with their customers, who have long-term investment plans – so even brand new DTH customers are likely to be attracted by the extra confidence that comes with choosing a major player, not a small, government-owned satellite business with several satellites.
So we think that it would be wrong to worry significantly about the impact of oversupply on DTH revenue streams.
Data is more at risk but risks differ by application We focus below on the potential risks to the Data business from High Throughput Satellites. But thinking more generally about oversupply risks in this area:
1. Video and Government customers are likely to be much more careful about which satellite operators they use, given a) the long-term relationship needed for DTH customers and b) potential strategic implications for government uses;
2. If transponder oversupply is likely to hit any part of the business, it is likely to be in Data.
The pie charts below show company data/Barclays estimates on how much the Data segment represents for Eutelsat and SES. For SES, we take a splits chart for 2012 from its 2013 investor day and make a small change to create our assumption for 2014E splits (Government and Institutions was slightly higher in 2012 and Media slightly lower). For Eutelsat, we use the FY15 forecasts in our model – this year makes most sense given that it includes a full year of Satmex
FIGURE 59 SES revenue by application (2014E)
FIGURE 60 Eutelsat revenue by application (FY15E)
Source: Barclays Research estimates based on SES actual data for 2012 Source: Barclays Research forecasts for FY15
But what uses of satellite capacity are contained within the broad segment of Data? In the table below, we classify SES’s “Network Services” and Eutelsat’s combined Data and Value-Added Services as “Total Data Applications ex Government”. Within that category, we use comments from management in the past to make some assumptions about the mix of applications between the five categories of Data shown below.
Media68%
Network Services
20%
Govt & Institutions
12%
Video Services
64%
Data15%
Value-Added
Services (Broadband & Mobility)
8%
Multi-Usage (Govt)11%
Other2%
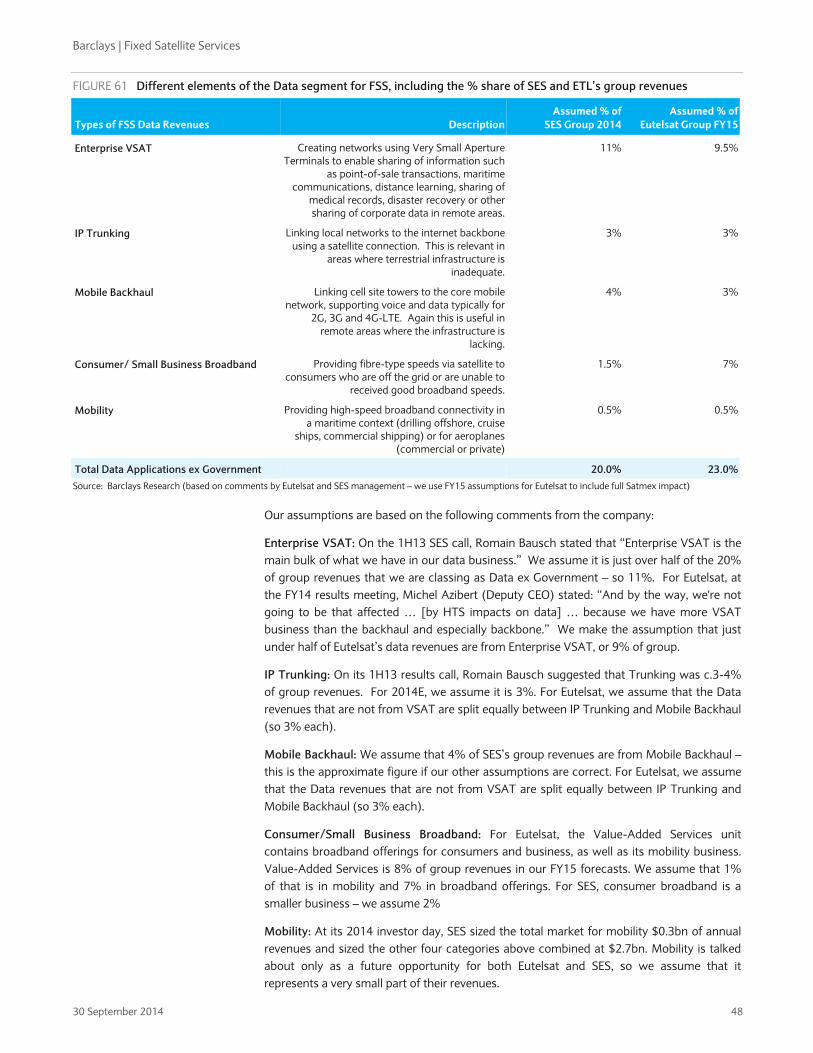
Barclays | Fixed Satellite Services
30 September 2014 48
FIGURE 61 Different elements of the Data segment for FSS, including the % share of SES and ETL’s group revenues
Types of FSS Data Revenues DescriptionAssumed % of
SES Group 2014 Assumed % of
Eutelsat Group FY15
Enterprise VSAT Creating networks using Very Small Aperture Terminals to enable sharing of information such
as point-of-sale transactions, maritime communications, distance learning, sharing of
medical records, disaster recovery or other sharing of corporate data in remote areas.
11% 9.5%
IP Trunking Linking local networks to the internet backbone using a satellite connection. This is relevant in
areas where terrestrial infrastructure is inadequate.
3% 3%
Mobile Backhaul Linking cell site towers to the core mobile network, supporting voice and data typically for
2G, 3G and 4G-LTE. Again this is useful in remote areas where the infrastructure is
lacking.
4% 3%
Consumer/ Small Business Broadband Providing fibre-type speeds via satellite to consumers who are off the grid or are unable to
received good broadband speeds.
1.5% 7%
Mobility Providing high-speed broadband connectivity in a maritime context (drilling offshore, cruise
ships, commercial shipping) or for aeroplanes (commercial or private)
0.5% 0.5%
Total Data Applications ex Government 20.0% 23.0%Source: Barclays Research (based on comments by Eutelsat and SES management – we use FY15 assumptions for Eutelsat to include full Satmex impact)
Our assumptions are based on the following comments from the company:
Enterprise VSAT: On the 1H13 SES call, Romain Bausch stated that “Enterprise VSAT is the main bulk of what we have in our data business.” We assume it is just over half of the 20% of group revenues that we are classing as Data ex Government – so 11%. For Eutelsat, at the FY14 results meeting, Michel Azibert (Deputy CEO) stated: “And by the way, we're not going to be that affected … [by HTS impacts on data] … because we have more VSAT business than the backhaul and especially backbone.” We make the assumption that just under half of Eutelsat’s data revenues are from Enterprise VSAT, or 9% of group.
IP Trunking: On its 1H13 results call, Romain Bausch suggested that Trunking was c.3-4% of group revenues. For 2014E, we assume it is 3%. For Eutelsat, we assume that the Data revenues that are not from VSAT are split equally between IP Trunking and Mobile Backhaul (so 3% each).
Mobile Backhaul: We assume that 4% of SES’s group revenues are from Mobile Backhaul – this is the approximate figure if our other assumptions are correct. For Eutelsat, we assume that the Data revenues that are not from VSAT are split equally between IP Trunking and Mobile Backhaul (so 3% each).
Consumer/Small Business Broadband: For Eutelsat, the Value-Added Services unit contains broadband offerings for consumers and business, as well as its mobility business. Value-Added Services is 8% of group revenues in our FY15 forecasts. We assume that 1% of that is in mobility and 7% in broadband offerings. For SES, consumer broadband is a smaller business – we assume 2%
Mobility: At its 2014 investor day, SES sized the total market for mobility $0.3bn of annual revenues and sized the other four categories above combined at $2.7bn. Mobility is talked about only as a future opportunity for both Eutelsat and SES, so we assume that it represents a very small part of their revenues.

Barclays | Fixed Satellite Services
30 September 2014 49
Potential impact on different areas of Data revenue from HTS
What is a High Throughput Satellite? HTS’s use many narrowly-focused beams (spot beams) to squeeze much higher throughput out of orbital spectrum. This technology can “re-use” spectrum: Hughes has described how its SPACEWAY 3 satellite can achieve frequency re-use of 24 times – so they can produce an effective 12 GHz of capacity from the 500 MHz allocated to the satellite. This makes bandwidth theoretically much cheaper. So ViaSat refers to supplying one gigabit per second for less than $3m on ViaSat-1 (stated at launch by the CEO, Mark Dankberg), whereas Ku-band FSS bandwidth can cost over $100m per gigabit per second. These were figures given in 2011, and the alternatives to HTS are now cheaper (especially Ka-band transponders not in an HTS configuration), but HTS can still deliver bandwidth to customers for much cheaper prices than satellite alternatives.
HTS’s do not necessarily need to use Ka-band transponders (like KA-SAT and ViaSat-1). Intelsat’s planned EPIC platform (with the first satellite launching in 2015) will focus – at least initially – on Ku-band. The term instead refers to the spot beam configuration.
Why are satellite investors worried about HTS? The 2013 report from Euroconsult, High Throughput Satellites: the Quest for Market Fit, forecast (according to its press release) that total HTS capacity supply would nearly triple to 1,400 Gbps by 2016, and then suggested that global demand for traffic carried over HTS systems would reach 980 Gbps by 2022. This looks like an oversupply situation, and understandably creates concerns that HTS can drive the next wave of data oversupply in regions which have already suffered from that – for example Sub-Saharan Africa and the Middle East.
We think it is important to note straight away that those Euroconsult figures are not exactly what they seem. Nathan de Ruiter, a senior consultant in Euroconsult’s Satcom practice, made the following comments on HTS in a December 2013 article in Space News:
The large influx of this capacity to the market [from HTS] has created some concerns about the risk of oversupply in regions such as Latin America, the Middle East and Africa, and Asia Pacific. However, regional high-throughput supply has to be analyzed with caution as it does not mean that this capacity is available to a single end user at one location. In reality, the available supply at any given point generally is around 2 percent of the total supply available for the region, due to the narrow spot beam technology of high-throughput satellite systems.
That is not to say that HTS cannot deliver significant new bandwidth at low costs for some uses, but the full power of these satellites is misleading given that it is not possible to use all of it within the spot beam configuration.
HTS can also not be used for every aspect of satellite communication, by any means. Below we look at where we believe these satellites could have an impact, and consider the exposure of FSS players to these areas.
Looking more closely at how HTS will be used by the industry Following the publication of Northern Sky Research’s latest Global Satellite Capacity Supply & Demand report (July 2014), its analyst Blaine Curcio noted (in a press release accompanying the report) that: “concerns about cannibalization by HTS are rather overplayed – indeed, we find that, simply put, some applications are better-suited for HTS, such as broadband, whereas others, such as video distribution and [Direct to Home] DTH, will remain firmly rooted in traditional FSS. There will be some battleground applications, such as commercial mobility, but both traditional FSS and HTS will continue to enjoy their ‘bread and butter’ applications moving forward.”

Barclays | Fixed Satellite Services
30 September 2014 50
What are HTS definitely not useful for? HTS’s are not well designed for the delivery of DTH video services. DTH is a point to multi-point application, with one broadcaster delivering video to many satellite dishes over a very wide area. A spotbeam architecture could only be useful to deliver video to a very specific area.
This is also true for the provision of video to cable groups on behalf of content businesses. SES and Intelsat generate revenues in the US, in particular, from delivering the content of businesses like ESPN and HBO to multiple cable networks – ensuring consistency and quality. HTS is very unlikely to get into this business.
What are HTS’s definitely good for? By far the most common use of HTS so far is for consumer broadband, as this technology allows satellite broadband to be priced at much lower levels. Eutelsat’s Tooway broadband via its KA-SAT bird costs c.€35 per month for 22Mbps of download speed and 6Mbps of upload speed (with 10GB of monthly data). This is based on UK intermediaries. That pricing is significantly better than the satellite industry could ever manage using Ku-band satellites. For customers who are not able to access good quality ADSL or fibre easily, this becomes an attractive option. The market in Europe has developed more slowly than Eutelsat had originally hoped, given reliance on a range of intermediaries and the need for new equipment. But KA-SAT growth is now good, contributing well to Eutelsat’s Value-Added Services unit.
Where else are HTS very likely to take share from FSS over time? On its FY14 results call, Eutelsat management noted that “with regards to the HTS satellite focusing on the data market, as you said, they would come with significantly lower price than the regular capacity, which might obviously shift part of the business, the business which is not so sticky, which is generally speaking the point-to-point business, the backhaul and the backbone and the trunking.”
Management teams at FSS operators have been accepting for some time that there will be an impact in these areas – we address those below:
Wireless Backhaul – likely to shift to HTS but over time: Mobile operators need to connect their local network to an internet gateway. In developed countries, backhaul is generally done using fibre, but in emerging markets, especially rural or remote areas, satellite is one option for wireless backhaul services. Where fibre cannot be laid economically, the key alternative to satellite is the building of towers which can deliver point to point microwave links.
In NSR’s webinar on Wireless Backhaul and Video Offload via Satellite (June 2014), its analysts concluded that HTS should be a clear winner over Fixed Satellite Services in wireless backhaul, because it can deliver bandwidth much cheaper and is well-adapted for a point-to-point offering such as a link from a local network to an internet gateway. They did, however, assume that the shift will happen gradually, given that changes in equipment will be needed and ROI justifications will be needed on a case by case basis.
This is a key stated application for O3b’s MEO-HTS high-speed, low-latency constellation. O3b is focused on supporting an upgrade from 2G to 3G in emerging market locations.
Wireless Backhaul – overall demand should be strong: Wireless backhaul is a market that is predicted to increase significantly in terms of the bandwidth that is demanded, because of major increases in mobile data in EM. In its 2014 investor day presentation (Gerson Souto slide 14), SES cites an Ericsson forecast that Mobile Data Traffic is likely to increase globally 10x between 2013 and 2019. At its 2013 Investor Day, SES pointed to a 2012-2020 CAGR forecast for demand in Wireless Backhaul of +6.6% (its forecasts derive from consultants and its own information).

Barclays | Fixed Satellite Services
30 September 2014 51
Wireless Backhaul conclusions: It seems likely that there will be significant extra demand and supply in this area over the next few years. We would assume that HTS (including O3b’s MEO-HTS) will reduce pricing significantly, but that demand will grow significantly. We assume that this drives slight growth in overall Wireless Backhaul revenues, with more volume but lower price, but there is clearly room for debate here.
Trunking – another offering well-suited to HTS: One of the earliest telecoms uses for satellites was providing local communications networks with remote access to the internet backbone – something that is clearly most useful in emerging markets. This is used by local telcos and ISPs, in areas where a terrestrial fibre backbone is not easily accessed.
This is another area that most satellite operators agree will see revenues shift to HTS and MEO-HTS (such as O3b). There are also threats from increasing terrestrial offerings.
We assume that satellite demand reduces in Trunking AND that prices are squeezed by HTS. We therefore assume double-digit revenue declines in this area in a “normal year”.
Where is there still significant debate among services currently offered by FSS? VSAT Networks: As discussed above, this is easily the most important Data revenue stream for the major FSS players. According to SES’s 2013 investor day presentation, demand for VSAT in key emerging markets is expected to be strong for many years.
FIGURE 62 Demand seen to be high for VSAT in LatAm and Africa
2012-2020 Transponder demand growth
Latin America Enterprise VSAT (Ku-band) 9.1%
Sub-Saharan Africa Enterprise VSAT (Ku-band) 6.5%
Sub-Saharan Africa Enterprise VSAT (C-band) 6.5%Source: SES 2013
Also, the key FSS operators suggest that HTS’s are not well designed for VSAT networks: spotbeam technology works well for point-to-point communications (e.g. trunking where the single hub of a local network is connected up to the internet backbone) but not for a point to multi-point network where multiple locations need to be connected together – because if those locations are geographically diverse then it is difficult for spotbeams to connect them all at the same time. A standard geostationary Ku-band or C-band satellite can cover a very wide area for a network like this.
But where VSAT networks are highly data-intensive, and a very large pipe is needed, it could be that HTS will have a role in the coming years. Intelsat certainly believes that its EPIC project will have the capability of offering services to VSAT customers with HTS levels of bandwidth, but with wide coverage. The most data-intensive customers of VSAT networks are also some of the largest: the oil and gas segment. So HTS could potentially take some share in the VSAT market, but this is an area that is currently very much up for debate.
Won’t HTS allow FSS players to tap into new revenue pools? Of course the major FSS players have HTS capacity and more is coming in terms of their launch plans. In our “normal year” revenue growth assumptions for the different components of Data (shown below), we factor in both HTS and standard satellite capacity. So, for example, our +6% assumption for the consumer broadband revenue stream would be a clearly negative number if we were just referring to the growth potential for non-HTS capacity.
Mobility – major opportunity but many players chasing it This would be the subject of a whole other report, but there is clearly an emerging opportunity for FSS operators in delivering connectivity to planes, cruise ships and oil rigs. It seems likely that Mobile Satellite Services (MSS) operators will continue to dominate across the broad
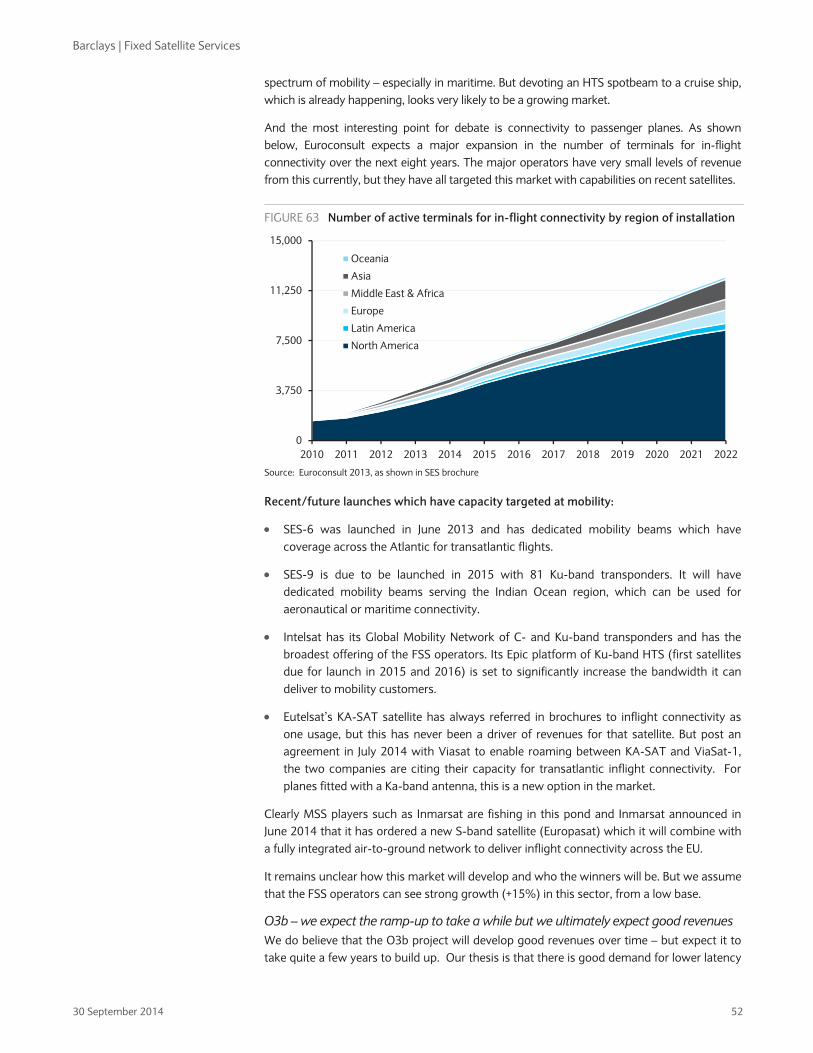
Barclays | Fixed Satellite Services
30 September 2014 52
spectrum of mobility – especially in maritime. But devoting an HTS spotbeam to a cruise ship, which is already happening, looks very likely to be a growing market.
And the most interesting point for debate is connectivity to passenger planes. As shown below, Euroconsult expects a major expansion in the number of terminals for in-flight connectivity over the next eight years. The major operators have very small levels of revenue from this currently, but they have all targeted this market with capabilities on recent satellites.
FIGURE 63 Number of active terminals for in-flight connectivity by region of installation
Source: Euroconsult 2013, as shown in SES brochure
Recent/future launches which have capacity targeted at mobility:
• SES-6 was launched in June 2013 and has dedicated mobility beams which have coverage across the Atlantic for transatlantic flights.
• SES-9 is due to be launched in 2015 with 81 Ku-band transponders. It will have dedicated mobility beams serving the Indian Ocean region, which can be used for aeronautical or maritime connectivity.
• Intelsat has its Global Mobility Network of C- and Ku-band transponders and has the broadest offering of the FSS operators. Its Epic platform of Ku-band HTS (first satellites due for launch in 2015 and 2016) is set to significantly increase the bandwidth it can deliver to mobility customers.
• Eutelsat’s KA-SAT satellite has always referred in brochures to inflight connectivity as one usage, but this has never been a driver of revenues for that satellite. But post an agreement in July 2014 with Viasat to enable roaming between KA-SAT and ViaSat-1, the two companies are citing their capacity for transatlantic inflight connectivity. For planes fitted with a Ka-band antenna, this is a new option in the market.
Clearly MSS players such as Inmarsat are fishing in this pond and Inmarsat announced in June 2014 that it has ordered a new S-band satellite (Europasat) which it will combine with a fully integrated air-to-ground network to deliver inflight connectivity across the EU.
It remains unclear how this market will develop and who the winners will be. But we assume that the FSS operators can see strong growth (+15%) in this sector, from a low base.
O3b – we expect the ramp-up to take a while but we ultimately expect good revenues We do believe that the O3b project will develop good revenues over time – but expect it to take quite a few years to build up. Our thesis is that there is good demand for lower latency
0
3,750
7,500
11,250
15,000
2010 2011 2012 2013 2014 2015 2016 2017 2018 2019 2020 2021 2022
Oceania
Asia
Middle East & Africa
Europe
Latin America
North America
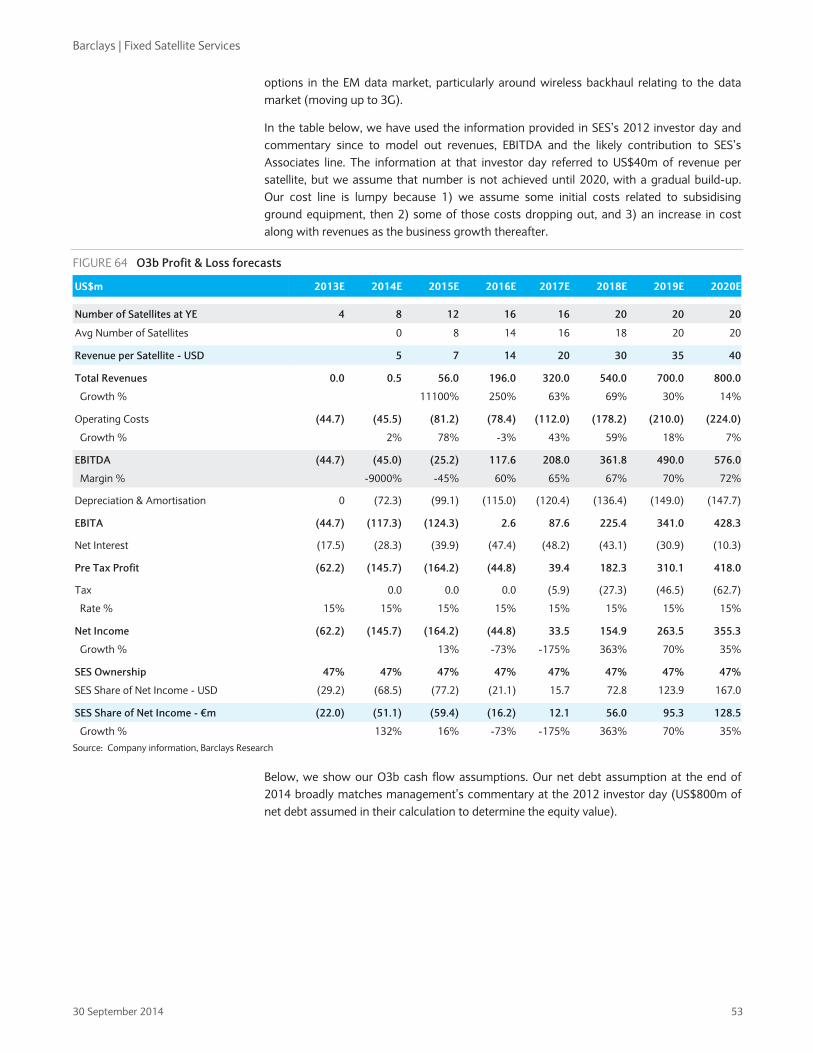
Barclays | Fixed Satellite Services
30 September 2014 53
options in the EM data market, particularly around wireless backhaul relating to the data market (moving up to 3G).
In the table below, we have used the information provided in SES’s 2012 investor day and commentary since to model out revenues, EBITDA and the likely contribution to SES’s Associates line. The information at that investor day referred to US$40m of revenue per satellite, but we assume that number is not achieved until 2020, with a gradual build-up. Our cost line is lumpy because 1) we assume some initial costs related to subsidising ground equipment, then 2) some of those costs dropping out, and 3) an increase in cost along with revenues as the business growth thereafter.
FIGURE 64 O3b Profit & Loss forecasts
US$m 2013E 2014E 2015E 2016E 2017E 2018E 2019E 2020E
Number of Satellites at YE 4 8 12 16 16 20 20 20
Avg Number of Satellites 0 8 14 16 18 20 20
Revenue per Satellite - USD 5 7 14 20 30 35 40
Total Revenues 0.0 0.5 56.0 196.0 320.0 540.0 700.0 800.0
Growth % 11100% 250% 63% 69% 30% 14%
Operating Costs (44.7) (45.5) (81.2) (78.4) (112.0) (178.2) (210.0) (224.0)
Growth % 2% 78% -3% 43% 59% 18% 7%
EBITDA (44.7) (45.0) (25.2) 117.6 208.0 361.8 490.0 576.0
Margin % -9000% -45% 60% 65% 67% 70% 72%
Depreciation & Amortisation 0 (72.3) (99.1) (115.0) (120.4) (136.4) (149.0) (147.7)
EBITA (44.7) (117.3) (124.3) 2.6 87.6 225.4 341.0 428.3
Net Interest (17.5) (28.3) (39.9) (47.4) (48.2) (43.1) (30.9) (10.3)
Pre Tax Profit (62.2) (145.7) (164.2) (44.8) 39.4 182.3 310.1 418.0
Tax 0.0 0.0 0.0 (5.9) (27.3) (46.5) (62.7)
Rate % 15% 15% 15% 15% 15% 15% 15% 15%
Net Income (62.2) (145.7) (164.2) (44.8) 33.5 154.9 263.5 355.3
Growth % 13% -73% -175% 363% 70% 35%
SES Ownership 47% 47% 47% 47% 47% 47% 47% 47%
SES Share of Net Income - USD (29.2) (68.5) (77.2) (21.1) 15.7 72.8 123.9 167.0
SES Share of Net Income - €m (22.0) (51.1) (59.4) (16.2) 12.1 56.0 95.3 128.5
Growth % 132% 16% -73% -175% 363% 70% 35%Source: Company information, Barclays Research
Below, we show our O3b cash flow assumptions. Our net debt assumption at the end of 2014 broadly matches management’s commentary at the 2012 investor day (US$800m of net debt assumed in their calculation to determine the equity value).

Barclays | Fixed Satellite Services
30 September 2014 54
FIGURE 65 O3b cash flow forecasts
US$m 2013A 2014E 2015E 2016E 2017E 2018E 2019E 2020E
EBITDA -45.0 -25.2 117.6 208.0 361.8 490.0 576.0
Working Capital 0 0 0 0 0 0 0
Tax 0.0 0.0 0.0 (5.9) (27.3) (46.5) (62.7)
Interest (28.3) (39.9) (47.4) (48.2) (43.1) (30.9) (10.3)
Capex (360.0) (140.0) (200.0) (60.0) (160.0) 0.0 0.0
Cash Flow (433.3) (205.1) (129.8) 93.9 131.3 412.6 503.0
Ending Net Debt (350.0) (783.3) (988.4) (1,118.2) (1,024.3) (893.0) (480.4) 22.6
Interest Rate 5.0% 5.0% 4.5% 4.5% 4.5% 4.5% 4.5% 4.5%
Net Interest (17.5) (28.3) (39.9) (47.4) (48.2) (43.1) (30.9) (10.3) Source: Company data, Barclays Research
In our DCF, we factor in capex for future expansion in our terminal growth calculation, use a 1% terminal growth rate and a 9.5% WACC. That all yields a value of €802m for SES’s share of the equity value of O3b. In our valuation of SES, we take a haircut to that and use €600m, given more uncertainty on this than the rest of their business.
FIGURE 66 DCF unlevered cash flow assumptions
US$m 2015E 2016E 2017E 2018E 2019E 2020E Terminal
EBITDA (25.2) 117.6 208.0 361.8 490.0 576.0 576.0
Less Capex (140.0) (200.0) (60.0) (160.0) 0.0 0.0 (150.7)
Working Capital 0.0 0.0 0.0 0.0 0.0 0.0 0.0
Taxes at 15% 24.8 12.4 (22.2) (30.3) (73.5) (86.4) (63.8)
Unlevered FCF (140.4) (70.0) 125.8 171.5 416.5 489.6 361.5Source: Barclays Research estimates
FIGURE 67 DCF assumptions and outcome
DCF assumptions and outcome
Terminal growth assumption 1.0%
WACC 9.5%
NPV of 2015-2020 577
NPV of Terminal Value (US$m) 2,492
Total Enterprise Value implied (US$m) 3,069
Net Debt in 2014 (US$m) (783.3)
Total Equity Value implied (US$m) 2,286
SES's share of equity value (US$m) 1,074
SES's share of equity value (€m) 802 Source: Barclays Research estimates
Oversupply not related to HTS – another drag As discussed at the beginning of this section, oversupply in the industry is likely to come from smaller operators as well as HTS. And it seems likely that it is in Data segments where this could have an effect on pricing, rather than Video or Government. So even areas like VSAT networks (where we assume that HTS have only modest negative impacts for technical reasons) are likely to see some pricing pressure from the capacity coming on stream from those smaller operators.
In our assumptions on the “normal year” growth potential of the various segments within Data (set out below), we take into account risks to pricing from oversupply unrelated to HTS.

Barclays | Fixed Satellite Services
30 September 2014 55
Conclusion on Data: 1-3% growth overall in this area We show below our assumed “normal year” growth for the different elements of Data for FSS operators. We take into account:
• Oversupply from smaller operator launches;
• Oversupply from HTS;
• Good underlying demand in some segments;
• Potential for FSS operators to create new revenue pools using their own HTS.
We find it hard to be bullish on the Data segment given oversupply risks, even with good demand in some areas. Depending on mix, our assumptions below point to aggregate growth for the key FSS players in Data of 1-3%.
FIGURE 68 Normal year revenue growth potential for different Data applications
Normal year growth
Enterprise VSAT 2%
Trunking -15%
Mobile Backhaul 3%
Consumer Broadband 6%
Mobility 15%Source: Barclays Research
Implications for normal year growth at ETL and SES Below, we take the estimated splits of Eutelsat and SES’s revenues from Figure 61 above and show these as their mix within the specific area of Data ex Government. So we estimated that Data ex Government was 20% of SES’s revenues, and that 11% of SES’s revenues were specifically Enterprise VSAT. Therefore we show below that we estimate Enterprise VSAT to be 55% of SES’s Data ex Government revenues.
SES: excluding O3b low growth likely in Data in a “normal year” We exclude O3b from this analysis and assume that “normal year” growth in this segment for SES is c.1%. Factored into this number is the good demand in EM for Enterprise VSAT and Mobile Backhaul, but likely pressure on price from oversupply across the data segment.
FIGURE 69 “Normal year” Data ex Government growth for SES
SES Splits within
Data Normal year growth Total Data Normal Year
growth
Enterprise VSAT 55% 2%
Trunking 15% -10%
Mobile Backhaul 20% 2%
Consumer Broadband 8% 6%
Mobility 3% 15%
Total Data Applications ex Government 100% 1%Source: Barclays Research estimates
Eutelsat: weighting to consumer broadband (KA-SAT) means better growth Eutelsat’s higher exposure to consumer broadband gets it higher “normal year” growth in Data ex Government. Clearly the growth in KA-SAT’s consumer broadband offering in the

Barclays | Fixed Satellite Services
30 September 2014 56
next couple of years will likely be higher than 2% – but this is a ramp-up phase and we are talking about a sustainable “normal year” growth rate.
FIGURE 70 “Normal year” Data ex Government growth for Eutelsat
ETL splits
within DataNormal year
growth Total Data normal
year growth
Enterprise VSAT 39% 2%
Trunking 13% -10%
Mobile Backhaul 13% 2%
Consumer Broadband 30% 6%
Mobility 4% 15%
Total Data Applications ex Government 100% 2%Source: Barclays Research estimates

Barclays | Fixed Satellite Services
30 September 2014 57
KEY FINANCIALS
SES financials
FIGURE 71 SES summary profit & loss statement
Source: Company information, Barclays Research estimates
December Year End (€m) 2011A 2012A 2013A 2014E 2015E 2016E 2017E 2018E 2019E
N. America post eliminations 367.4 422.1 398.0 360.1 355.6 363.8 372.9 384.3 394.7
- - - -> constant currency growth -4.7% -2.9% -8.0% -3.8% 2.6% 2.7% 3.0% 2.7%International post eliminations 410.7 482.6 528.0 562.3 598.0 632.0 749.3 824.6 872.1
- - - -> constant currency growth 8.4% 12.8% 9.1% 3.4% 6.0% 15.8% 8.6% 5.3%Europe post eliminations 955.1 923.3 936.4 1,036.5 1,084.5 1,134.0 1,170.6 1,206.7 1,247.4 - - - -> reported growth 9.6% -3.3% 1.4% 10.7% 4.6% 4.6% 3.2% 3.1% 3.4%
- - - -> constant currency growth 8.4% 1.4% 10.7% 4.6% 4.6% 3.2% 3.1% 3.4%Total Group Revenue 1,733.2 1,828.0 1,862.4 1,958.9 2,038.1 2,129.9 2,292.8 2,415.6 2,514.2
- - - -> constant currency growth 6.9% 0.9% 3.4% 6.2% 2.7% 4.7% 6.9% 4.9% 3.9%
- - - -> reported growth -0.1% 5.5% 1.9% 5.2% 2.7% 4.7% 6.9% 4.9% 3.9%
N. America / International EBITDA 574.0 671.7 679.5 680.5 702.6 732.8 832.5 899.2 942.3
- - - -> margin 73.8% 74.2% 73.4% 73.8% 73.7% 73.6% 74.2% 74.4% 74.4%Europe EBITDA 733.3 710.4 719.6 802.2 836.1 873.3 903.7 934.0 968.2
- - - -> margin 76.8% 76.9% 76.8% 77.4% 77.1% 77.0% 77.2% 77.4% 77.6%
Elimination / Unallocated (32.7) (35.4) (34.3) (34.7) (35.7) (37.2) (38.3) (39.4) (40.6)Total Reported EBITDA 1,274.6 1,346.7 1,364.7 1,448.0 1,502.9 1,569.0 1,697.9 1,793.8 1,869.8
- - - -> margin 73.5% 73.7% 73.3% 73.9% 73.7% 73.7% 74.1% 74.3% 74.4%
- - - -> reported growth -1.7% 5.7% 1.3% 6.1% 3.8% 4.4% 8.2% 5.6% 4.2%
Depreciation (431.7) (515.6) (466.5) (482.6) (488.6) (479.9) (465.4) (456.4) (442.5)
Amortisation (34.7) (40.5) (47.0) (46.1) (45.6) (45.1) (44.7) (44.2) (43.8)Operating Profit 808.2 790.6 851.2 919.4 968.8 1,044.0 1,187.7 1,293.1 1,383.5
- - - -> margin 46.6% 43.2% 45.7% 46.9% 47.5% 49.0% 51.8% 53.5% 55.0%Net Interest (158.5) (169.6) (173.5) (172.3) (162.8) (151.6) (128.6) (107.0) (93.0)Pre-Tax Profit (Headline) 684.4 661.5 724.7 793.1 851.6 937.5 1,103.9 1,230.4 1,334.3
Pre-Tax Profit 649.7 621.0 677.7 747.0 806.0 892.4 1,059.2 1,186.1 1,290.5
Taxation (Reported) (16.0) 42.2 (87.5) (108.3) (116.9) (133.9) (158.9) (177.9) (193.6)
Tax Rate (Reported) (%) 2.5% (6.8%) 12.9% 14.5% 14.5% 15.0% 15.0% 15.0% 15.0%
Share of associates' result (O3b) (8.4) (14.0) (21.7) (51.1) (59.4) (16.2) 12.1 56.0 95.3
Minorities (0.3) (0.3) (2.0) (2.0) (2.0) (2.0) (2.0) (2.0) (2.0)Net Income Reported 617.7 648.9 566.4 585.6 627.7 740.3 910.4 1,062.2 1,190.1
Net Income (pre Amort / Except) 607.3 577.0 607.3 625.0 666.7 778.6 948.3 1,099.8 1,227.4
Weighted Ave Economic Shrs (m) 395.4 401.0 401.6 401.6 401.6 401.6 401.6 401.6 401.6EPS (Reported - A Shares) 1.56 1.62 1.41 1.46 1.56 1.84 2.27 2.64 2.96 - Growth 25.9% 3.6% -12.8% 3.4% 7.2% 17.9% 23.0% 16.7% 12.0%
EPS Headline 1.54 1.44 1.51 1.56 1.66 1.94 2.36 2.74 3.06
- Growth 10.9% -6.3% 5.1% 2.9% 6.7% 16.8% 21.8% 16.0% 11.6%
Dividend per Share 0.88 0.97 1.07 1.17 1.29 1.42 1.56 1.72 1.89 - Growth 10.0% 10.2% 10.0% 10.0% 10.0% 10.0% 10.0% 10.0% 10.0%

Barclays | Fixed Satellite Services
30 September 2014 58
FIGURE 72 SES summary cash flow statement
Source: Company information, Barclays Research estimates
FIGURE 73 SES summary balance sheet
Source: Company information, Barclays Research estimates
December Year End (€m) 2011A 2012A 2013A 2014E 2015E 2016E 2017E 2018E 2019E
Profit before taxes 639 636 678 747 806 892 1,059 1,186 1,290
Cash taxes (64) (38) (31) (97) (93) (107) (127) (142) (155)
Net fin charges on non-op activities 126 132 148 146 138 129 109 91 79
Depreciation & Amortisation 470 556 514 529 534 525 510 501 486
Change in Working Capital (73) (21) (142) (22) (22) (22) (22) (22) (22)
Net Cashflow from Ops (reported) 1,082 1,235 1,148 1,284 1,344 1,398 1,510 1,593 1,657
Purchase of intangible assets (3) (2) (6) (6) (6) (6) (6) (6) (6)
Capex: Satellites and other PPE (835) (634) (378) (494) (487) (438) (425) (535) (310)
Acquisitions (7) (68) 0 0 0 0 0 0 0
Net Cashflow from investing (850) (698) (422) (500) (492) (443) (430) (541) (316)
Total Dividends (317) (351) (390) (430) (473) (520) (572) (629) (692)
Share Issues / Redemptions (£m) 30 44 45 0 0 0 0 0 0
Net fin charges on non-op activities (119) (195) (180) (146) (138) (129) (109) (91) (79)
Net Cashflow from Financing (406) (501) (526) (577) (612) (649) (682) (720) (771)
Net cash inflow/outflow (175) 36 200 208 240 306 398 332 569
Net foreign exchange movements (8) (13) (50) 0 0 0 0 0 0
Year End Net Cash / (Debt) (3,977) (3,984) (3,802) (3,594) (3,354) (3,048) (2,650) (2,318) (1,749)
Net Debt/ EBITDA (x) 3.1x 3.0x 2.8x 2.5x 2.2x 1.9x 1.6x 1.3x 0.9x
Free Cash Flow 118 467 618 638 714 826 970 961 1,261
December Year End (€m) 2011A 2012A 2013A 2014E 2015E 2016E 2017E 2018E 2019E
Non-Current Assets
Property Plant & Equipment 5,009 5,099 4,848 4,859 4,857 4,815 4,774 4,853 4,721
Intangible Assets 2,913 2,864 2,750 2,753 2,756 2,760 2,765 2,771 2,778
Other Non-Current Assets 308 342 307 307 307 307 307 307 307
Total Non-Current Assets 8,230 8,305 7,905 7,918 7,920 7,882 7,846 7,931 7,805
Current Assets
Stock & Debtors 422 452 630 662 694 726 758 790 822
Cash & cash equivalents 218 240 544 544 544 544 644 844 1,044
Total Current Assets 640 696 1,184 1,206 1,238 1,270 1,402 1,634 1,866
Total Assets 8,870 9,001 9,089 9,125 9,158 9,152 9,248 9,565 9,671
Non-current bank debt 3,580 3,068 3,542 2,990 2,750 2,445 2,147 2,015 1,645
Other non-current liabilities 1,095 1,065 1,062 1,056 1,062 1,056 1,062 1,056 1,062
Total Non-Current Liabilities 4,675 4,133 4,604 4,046 3,812 3,500 3,209 3,070 2,707
Current bank debt 617 1,160 804 804 804 804 804 804 804
Other Current Liabilities 961 823 782 792 802 812 823 833 843
Total Current Liabilities 1,578 1,983 1,586 1,596 1,606 1,616 1,626 1,636 1,646
Net Assets 2,617 2,886 2,899 3,483 3,740 4,035 4,413 4,858 5,318
Shareholder Equity 2,534 2,806 2,821 3,405 3,662 3,957 4,335 4,780 5,241
Minority interests 83.1 79.4 78.2 78.2 78.3 78.3 78.4 78.4 76.4
Total Equity 2,617 2,886 2,899 3,483 3,740 4,035 4,413 4,858 5,318
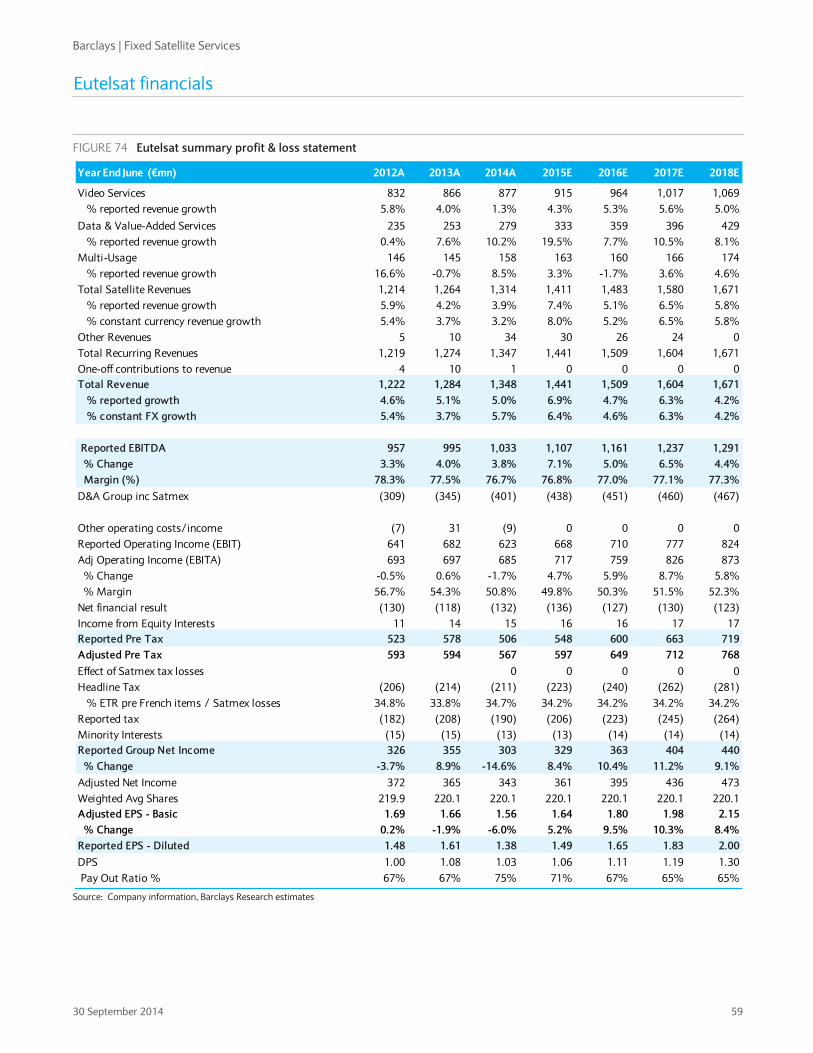
Barclays | Fixed Satellite Services
30 September 2014 59
Eutelsat financials
FIGURE 74 Eutelsat summary profit & loss statement
Source: Company information, Barclays Research estimates
Year End June (€mn) 2012A 2013A 2014A 2015E 2016E 2017E 2018E
Video Services 832 866 877 915 964 1,017 1,069 % reported revenue growth 5.8% 4.0% 1.3% 4.3% 5.3% 5.6% 5.0%
Data & Value-Added Services 235 253 279 333 359 396 429 % reported revenue growth 0.4% 7.6% 10.2% 19.5% 7.7% 10.5% 8.1%Multi-Usage 146 145 158 163 160 166 174 % reported revenue growth 16.6% -0.7% 8.5% 3.3% -1.7% 3.6% 4.6%Total Satellite Revenues 1,214 1,264 1,314 1,411 1,483 1,580 1,671 % reported revenue growth 5.9% 4.2% 3.9% 7.4% 5.1% 6.5% 5.8% % constant currency revenue growth 5.4% 3.7% 3.2% 8.0% 5.2% 6.5% 5.8%Other Revenues 5 10 34 30 26 24 0Total Recurring Revenues 1,219 1,274 1,347 1,441 1,509 1,604 1,671One-off contributions to revenue 4 10 1 0 0 0 0Total Revenue 1,222 1,284 1,348 1,441 1,509 1,604 1,671 % reported growth 4.6% 5.1% 5.0% 6.9% 4.7% 6.3% 4.2% % constant FX growth 5.4% 3.7% 5.7% 6.4% 4.6% 6.3% 4.2%
Reported EBITDA 957 995 1,033 1,107 1,161 1,237 1,291 % Change 3.3% 4.0% 3.8% 7.1% 5.0% 6.5% 4.4% Margin (%) 78.3% 77.5% 76.7% 76.8% 77.0% 77.1% 77.3%D&A Group inc Satmex (309) (345) (401) (438) (451) (460) (467)
Other operating costs/income (7) 31 (9) 0 0 0 0Reported Operating Income (EBIT) 641 682 623 668 710 777 824Adj Operating Income (EBITA) 693 697 685 717 759 826 873 % Change -0.5% 0.6% -1.7% 4.7% 5.9% 8.7% 5.8% % Margin 56.7% 54.3% 50.8% 49.8% 50.3% 51.5% 52.3%Net financial result (130) (118) (132) (136) (127) (130) (123)Income from Equity Interests 11 14 15 16 16 17 17Reported Pre Tax 523 578 506 548 600 663 719Adjusted Pre Tax 593 594 567 597 649 712 768Effect of Satmex tax losses 0 0 0 0 0Headline Tax (206) (214) (211) (223) (240) (262) (281) % ETR pre French items / Satmex losses 34.8% 33.8% 34.7% 34.2% 34.2% 34.2% 34.2%Reported tax (182) (208) (190) (206) (223) (245) (264)Minority Interests (15) (15) (13) (13) (14) (14) (14)Reported Group Net Income 326 355 303 329 363 404 440 % Change -3.7% 8.9% -14.6% 8.4% 10.4% 11.2% 9.1%Adjusted Net Income 372 365 343 361 395 436 473Weighted Avg Shares 219.9 220.1 220.1 220.1 220.1 220.1 220.1Adjusted EPS - Basic 1.69 1.66 1.56 1.64 1.80 1.98 2.15 % Change 0.2% -1.9% -6.0% 5.2% 9.5% 10.3% 8.4%Reported EPS - Diluted 1.48 1.61 1.38 1.49 1.65 1.83 2.00DPS 1.00 1.08 1.03 1.06 1.11 1.19 1.30 Pay Out Ratio % 67% 67% 75% 71% 67% 65% 65%

Barclays | Fixed Satellite Services
30 September 2014 60
FIGURE 75 Eutelsat summary cash flow statement
Source: Company information, Barclays Research estimates
FIGURE 76 Eutelsat summary balance sheet
Source: Company information, Barclays Research estimates
Year End June (€mn) 2012A 2013A 2014A 2015E 2016E 2017E 2018E
Operating Profit (adjusted) - EBITA 693 697 685 717 759 826 873Depreciation 264 299 348 389 402 411 418Provisions (7) 8 28 28 28 28 28Tax paid (net) (211) (178) (218) (200) (216) (183) (169)Net Interest (117) (140) (127) (136) (127) (130) (123)Other 11 32 (43) 13Change in Working Capital (37) (26) (10) (5) (5) (5) (5)Operating Cash Flow (after Ch in WC) 595 691 663 807 856 960 1,037Capex: acquisition satellites & other PPE (488) (386) (440) (473) (464) (497) (461)Acquisitions and disposals 0 0 (566) 45 0 0 0Other 8 (261) 18 3Net cash used in investing activities (479) (647) (987) (425) (461) (494) (458)Total dividends paid (227) (230) (250) (227) (233) (243) (262)Performance incentives, LT leases & other (53) (11) (9) (25) (35) (35) (35)Net cash used in financing activities (280) (240) (259) (252) (268) (278) (297)Net Cash Inflow/Outflow (164) (196) (582) 130 126 187 282Debt taken on with acquisitions 0 0 (261) 0 0 0 0
Other (12) (77) (76) 0 0 0 0
Ch. In present value of LT lease obligations 0 0 (213) (120) (180) 0 0Y/E Cash Position (2,374) (2,647) (3,779) (3,769) (3,823) (3,635) (3,354) - as a multiple of EBITDA 2.5x 2.7x 3.7x 3.4x 3.3x 2.9x 2.6x
Free Cash Flow (Op Cashflow - capex) 107 305 224 309 357 428 541 - Growth -39.6% 183.9% -26.6% 38.1% 15.4% 19.9% 26.5%FCF per share 0.49 1.39 1.02 1.40 1.62 1.94 2.46Normalised Free Cash Flow 195 291 263 407 456 560 637
Year End June (€mn) 2012A 2013A 2014A 2015E 2016E 2017E 2018E
Goodwill 808 856 1,104 1,104 1,104 1,104 1,104Intangible Assets 638 640 799 750 701 652 603Total Satellite Assets 2,888 3,258 4,080 3,417 3,529 3,703 3,836Other Non-Current Assets 221 279 319 322 324 327 329Total Non-Current Assets 4,555 5,032 6,302 5,592 5,658 5,786 5,872
Cash & cash equivalents 125 278 326 303 303 303 303Other current assets 291 294 378 447 525 604 682Total Current Assets 416 573 704 750 829 907 986
Total Assets 4,970 5,605 7,006 6,342 6,487 6,693 6,858Non-current bank debt 2,421 2,849 3,814 3,990 4,044 3,856 3,575Other non-current liabilities 396 449 728 (343) (513) (466) (416)Total Non-Current Liabilities 2,817 3,298 4,542 3,647 3,531 3,391 3,159Current bank debt 53 36 49 49 49 49 49Current other debt 79 41 35 71 108 145 182Other current liabilities 174 248 349 376 403 430 457Total Current Liabilities 306 324 433 497 561 624 688
Total Liabilities 3,123 3,622 4,975 4,144 4,091 4,015 3,847
Net Assets 1,848 1,983 2,031 2,198 2,395 2,678 3,011
Total Equity 1,848 1,983 2,031 2,198 2,395 2,678 3,011

Barclays | Fixed Satellite Services
30 September 2014 61
ANALYST(S) CERTIFICATION(S):
We, Nick Dempsey, Andrew Ross and Julien Roch, hereby certify (1) that the views expressed in this research report accurately reflect our personal views about any or all of the subject securities or issuers referred to in this research report and (2) no part of our compensation was, isor will be directly or indirectly related to the specific recommendations or views expressed in this research report.
IMPORTANT DISCLOSURES CONTINUED
Barclays Research is a part of the Corporate and Investment Banking division of Barclays Bank PLC and its affiliates (collectively and each individually, "Barclays"). For current important disclosures regarding companies that are the subject of this research report, please send a written request to: Barclays Research Compliance, 745 Seventh Avenue, 14th Floor, New York, NY 10019 or refer to http://publicresearch.barclays.com or call 212-526-1072.
The analysts responsible for preparing this research report have received compensation based upon various factors including the firm's totalrevenues, a portion of which is generated by investment banking activities.
Research analysts employed outside the US by affiliates of Barclays Capital Inc. are not registered/qualified as research analysts with FINRA. These analysts may not be associated persons of the member firm and therefore may not be subject to NASD Rule 2711 and incorporated NYSE Rule 472 restrictions on communications with a subject company, public appearances and trading securities held by a research analyst’s account.
Analysts regularly conduct site visits to view the material operations of covered companies, but Barclays policy prohibits them from accepting payment or reimbursement by any covered company of their travel expenses for such visits.
In order to access Barclays Statement regarding Research Dissemination Policies and Procedures, please refer tohttps://live.barcap.com/publiccp/RSR/nyfipubs/disclaimer/disclaimer-research-dissemination.html. In order to access Barclays Research Conflict Management Policy Statement, please refer to: https://live.barcap.com/publiccp/RSR/nyfipubs/disclaimer/disclaimer-conflict-management.html.
The Corporate and Investment Banking division of Barclays produces a variety of research products including, but not limited to, fundamental analysis, equity-linked analysis, quantitative analysis, and trade ideas. Recommendations contained in one type of research product may differfrom recommendations contained in other types of research products, whether as a result of differing time horizons, methodologies, orotherwise.
Primary Stocks (Ticker, Date, Price)
Eutelsat Communications (ETL.PA, 26-Sep-2014, EUR 25.43), Equal Weight/Positive, A/D/F/J/K/L/N
SES SA (SESFd.PA, 26-Sep-2014, EUR 27.70), Overweight/Positive, A/D/J/K/L/M/N
Disclosure Legend:
A: Barclays Bank PLC and/or an affiliate has been lead manager or co-lead manager of a publicly disclosed offer of securities of the issuer in theprevious 12 months.
B: An employee of Barclays Bank PLC and/or an affiliate is a director of this issuer.
C: Barclays Bank PLC and/or an affiliate is a market-maker and/or liquidity provider in equity securities issued by this issuer or one of its affiliates.
D: Barclays Bank PLC and/or an affiliate has received compensation for investment banking services from this issuer in the past 12 months.
E: Barclays Bank PLC and/or an affiliate expects to receive or intends to seek compensation for investment banking services from this issuer within the next 3 months.
F: Barclays Bank PLC and/or an affiliate beneficially owned 1% or more of a class of equity securities of the issuer as of the end of the month prior to the research report's issuance.
G: One of the analysts on the coverage team (or a member of his or her household) owns shares of the common stock of this issuer.
H: This issuer beneficially owns 5% or more of any class of common equity securities of Barclays Bank PLC.
I: Barclays Bank PLC and/or an affiliate has a significant financial interest in the securities of this issuer.
J: Barclays Bank PLC and/or an affiliate trades regularly in the securities of this issuer.
K: Barclays Bank PLC and/or an affiliate has received non-investment banking related compensation from this issuer within the past 12 months.
L: This issuer is, or during the past 12 months has been, an investment banking client of Barclays Bank PLC and/or an affiliate.
M: This issuer is, or during the past 12 months has been, a non-investment banking client (securities related services) of Barclays Bank PLCand/or an affiliate.
N: This issuer is, or during the past 12 months has been, a non-investment banking client (non-securities related services) of Barclays Bank PLC and/or an affiliate.
O: Barclays Capital Inc., through Barclays Market Makers, is a Designated Market Maker in this issuer's stock, which is listed on the New York Stock Exchange. At any given time, its associated Designated Market Maker may have "long" or "short" inventory position in the stock; and its associated Designated Market Maker may be on the opposite side of orders executed on the floor of the New York Stock Exchange in the stock.
P: A partner, director or officer of Barclays Capital Canada Inc. has, during the preceding 12 months, provided services to the subject company for remuneration, other than normal course investment advisory or trade execution services.
Q: Barclays Bank PLC and/or an affiliate is a Corporate Broker to this issuer.

Barclays | Fixed Satellite Services
30 September 2014 62
IMPORTANT DISCLOSURES CONTINUED
R: Barclays Capital Canada Inc. and/or an affiliate has received compensation for investment banking services from this issuer in the past 12months.
S: Barclays Capital Canada Inc. is a market-maker in an equity or equity related security issued by this issuer.
T: Barclays Bank PLC and/or an affiliate is providing equity advisory services to this issuer.
Risk Disclosure(s)
Master limited partnerships (MLPs) are pass-through entities structured as publicly listed partnerships. For tax purposes, distributions to MLP unitholders may be treated as a return of principal. Investors should consult their own tax advisors before investing in MLP units.
Guide to the Barclays Fundamental Equity Research Rating System:
Our coverage analysts use a relative rating system in which they rate stocks as Overweight, Equal Weight or Underweight (see definitions below) relative to other companies covered by the analyst or a team of analysts that are deemed to be in the same industry (the "industry coverage universe").
In addition to the stock rating, we provide industry views which rate the outlook for the industry coverage universe as Positive, Neutral or Negative (see definitions below). A rating system using terms such as buy, hold and sell is not the equivalent of our rating system. Investors should carefully read the entire research report including the definitions of all ratings and not infer its contents from ratings alone.
Stock Rating
Overweight - The stock is expected to outperform the unweighted expected total return of the industry coverage universe over a 12-month investment horizon.
Equal Weight - The stock is expected to perform in line with the unweighted expected total return of the industry coverage universe over a 12-month investment horizon.
Underweight - The stock is expected to underperform the unweighted expected total return of the industry coverage universe over a 12-month investment horizon.
Rating Suspended - The rating and target price have been suspended temporarily due to market events that made coverage impracticable or tocomply with applicable regulations and/or firm policies in certain circumstances including where the Corporate and Investment Banking Division of Barclays is acting in an advisory capacity in a merger or strategic transaction involving the company.
Industry View
Positive - industry coverage universe fundamentals/valuations are improving.
Neutral - industry coverage universe fundamentals/valuations are steady, neither improving nor deteriorating.
Negative - industry coverage universe fundamentals/valuations are deteriorating.
Below is the list of companies that constitute the "industry coverage universe":
European Media
ATRESMEDIA (A3M.MC) Axel Springer AG (SPRGn.DE) British Sky Broadcasting Group PLC (BSY.L)
Daily Mail & General Trust PLC (DMGOa.L) Eutelsat Communications (ETL.PA) Havas SA (EURC.PA)
Informa PLC (INF.L) ITV Plc (ITV.L) JC Decaux SA (JCDX.PA)
Lagardere SCA (LAGA.PA) M6-Metropole Television SA (MMTP.PA) Mediaset Espana (TL5.MC)
Mediaset SpA (MS.MI) Omnicom Group Inc. (OMC) Pearson plc (PSON.L)
ProsiebenSat. 1 Media AG (PSMGn.DE) Publicis Groupe SA (PUBP.PA) Reed Elsevier NV (ELSN.AS)
Reed Elsevier PLC (REL.L) Rightmove Plc (RMV.L) RTL Group PLC (AUDKt.BR)
Schibsted ASA (SBST.OL) SES SA (SESFd.PA) Sky Deutschland AG (SKYDn.DE)
Solocal Group (LOCAL.PA) Television Francaise 1 SA (TFFP.PA) Trinity Mirror PLC (TNI.L)
UBM Plc (UBM.L) Vivendi SA (VIV.PA) Wolters Kluwer NV (WLSNc.AS)
WPP (WPP.L) Zoopla (ZPLAZ.L)
Distribution of Ratings:
Barclays Equity Research has 2589 companies under coverage.
44% have been assigned an Overweight rating which, for purposes of mandatory regulatory disclosures, is classified as a Buy rating; 55% ofcompanies with this rating are investment banking clients of the Firm.
40% have been assigned an Equal Weight rating which, for purposes of mandatory regulatory disclosures, is classified as a Hold rating; 46% of companies with this rating are investment banking clients of the Firm.
14% have been assigned an Underweight rating which, for purposes of mandatory regulatory disclosures, is classified as a Sell rating; 42% of companies with this rating are investment banking clients of the Firm.
Guide to the Barclays Research Price Target:

Barclays | Fixed Satellite Services
30 September 2014 63
IMPORTANT DISCLOSURES CONTINUED
Each analyst has a single price target on the stocks that they cover. The price target represents that analyst's expectation of where the stock will trade in the next 12 months. Upside/downside scenarios, where provided, represent potential upside/potential downside to each analyst's price target over the same 12-month period.
Barclays offices involved in the production of equity research:
London
Barclays Bank PLC (Barclays, London)
New York
Barclays Capital Inc. (BCI, New York)
Tokyo
Barclays Securities Japan Limited (BSJL, Tokyo)
São Paulo
Banco Barclays S.A. (BBSA, São Paulo)
Hong Kong
Barclays Bank PLC, Hong Kong branch (Barclays Bank, Hong Kong)
Toronto
Barclays Capital Canada Inc. (BCCI, Toronto)
Johannesburg
Absa Bank Limited (Absa, Johannesburg)
Mexico City
Barclays Bank Mexico, S.A. (BBMX, Mexico City)
Taiwan
Barclays Capital Securities Taiwan Limited (BCSTW, Taiwan)
Seoul
Barclays Capital Securities Limited (BCSL, Seoul)
Mumbai
Barclays Securities (India) Private Limited (BSIPL, Mumbai)
Singapore
Barclays Bank PLC, Singapore branch (Barclays Bank, Singapore)

Barclays | Fixed Satellite Services
30 September 2014 64
IMPORTANT DISCLOSURES CONTINUED
Eutelsat Communications (ETL FP / ETL.PA) Stock Rating Industry View
EUR 25.43 (26-Sep-2014) EQUAL WEIGHT POSITIVE
Rating and Price Target Chart - EUR (as of 26-Sep-2014) Currency=EUR
Date Closing Price Rating Adjusted Price Target
01-Aug-2014 25.40 25.25
16-May-2014 24.47 24.00
17-Feb-2014 22.74 22.50
10-Feb-2014 22.65 22.60
27-Jan-2014 22.19 22.75
19-Sep-2013 22.83 24.50
07-Aug-2013 21.61 23.00
08-May-2013 24.74 Equal Weight 26.00
11-Feb-2013 25.92 30.00
24-Jan-2013 25.42 29.00
01-Aug-2012 24.90 30.00
20-Jun-2012 23.24 31.00
11-May-2012 23.52 32.50
21-Feb-2012 28.22 34.50
26-Jan-2012 28.83 35.50
Source: Thomson Reuters, Barclays Research
Historical stock prices and price targets may have been adjusted for stock splits and dividends.
Source: IDC, Barclays Research
Link to Barclays Live for interactive charting
A: Barclays Bank PLC and/or an affiliate has been lead manager or co-lead manager of a publicly disclosed offer of securities of EutelsatCommunications in the previous 12 months.
D: Barclays Bank PLC and/or an affiliate has received compensation for investment banking services from Eutelsat Communications in the past 12months.
F: Barclays Bank PLC and/or an affiliate beneficially owned 1% or more of a class of equity securities of Eutelsat Communications as of the end ofthe month prior to the research report's issuance.
J: Barclays Bank PLC and/or an affiliate trades regularly in the securities of Eutelsat Communications.
K: Barclays Bank PLC and/or an affiliate has received non-investment banking related compensation from Eutelsat Communications within thepast 12 months.
L: Eutelsat Communications is, or during the past 12 months has been, an investment banking client of Barclays Bank PLC and/or an affiliate.
N: Eutelsat Communications is, or during the past 12 months has been, a non-investment banking client (non-securities related services) ofBarclays Bank PLC and/or an affiliate.
Valuation Methodology: Our target price of €26.50 is based on our DCF, with a 2.0% terminal growth rate and 7.4% WACC.
Risks which May Impede the Achievement of the Barclays Research Price Target: Risks are 1) satellite anomalies causing potential loss ofrevenues; 2) increased competition from fibre; and 3) increased transponder supply from emerging markets operators.
Closing Price Target Price Rating Change
Jan- 2012 Jul- 2012 Jan- 2013 Jul- 2013 Jan- 2014 Jul- 2014
20
22
24
26
28
30
32
34
36

Barclays | Fixed Satellite Services
30 September 2014 65
IMPORTANT DISCLOSURES CONTINUED
SES SA (SESG FP / SESFd.PA) Stock Rating Industry View
EUR 27.70 (26-Sep-2014) OVERWEIGHT POSITIVE
Rating and Price Target Chart - EUR (as of 26-Sep-2014) Currency=EUR
Date Closing Price Rating Adjusted Price Target
28-Jul-2014 27.40 30.25
12-May-2014 27.22 29.30
24-Feb-2014 25.01 27.30
27-Jan-2014 24.16 Overweight 26.50
11-Nov-2013 22.78 21.70
19-Sep-2013 21.40 Underweight 20.15
07-Aug-2013 21.55 22.75
20-May-2013 24.20 24.40
25-Feb-2013 23.00 24.00
24-Jan-2013 21.73 23.40
14-Sep-2012 20.75 21.50
Source: Thomson Reuters, Barclays Research
Historical stock prices and price targets may have been adjusted for stock splits and dividends.
Source: IDC, Barclays Research
Link to Barclays Live for interactive charting
A: Barclays Bank PLC and/or an affiliate has been lead manager or co-lead manager of a publicly disclosed offer of securities of SES SA in theprevious 12 months.
D: Barclays Bank PLC and/or an affiliate has received compensation for investment banking services from SES SA in the past 12 months.
J: Barclays Bank PLC and/or an affiliate trades regularly in the securities of SES SA.
K: Barclays Bank PLC and/or an affiliate has received non-investment banking related compensation from SES SA within the past 12 months.
L: SES SA is, or during the past 12 months has been, an investment banking client of Barclays Bank PLC and/or an affiliate.
M: SES SA is, or during the past 12 months has been, a non-investment banking client (securities related services) of Barclays Bank PLC and/or anaffiliate.
N: SES SA is, or during the past 12 months has been, a non-investment banking client (non-securities related services) of Barclays Bank PLCand/or an affiliate.
Valuation Methodology: Our price target of €31.40 is based on a DCF with a 1.0% terminal growth rate and 8.4% WACC.
Risks which May Impede the Achievement of the Barclays Research Price Target: Risks to the downside are 1) satellite launch risk, 2) cashreturns being pushed out even further than expected, 3) signs of structural risks impacting in the short term
Closing Price Target Price Rating Change
Jan- 2012 Jul- 2012 Jan- 2013 Jul- 2013 Jan- 2014 Jul- 2014
16
18
20
22
24
26
28
30
32

DISCLAIMER:
This publication has been prepared by the Corporate and Investment Banking division of Barclays Bank PLC and/or one or more of its affiliates (collectivelyand each individually, "Barclays"). It has been issued by one or more Barclays legal entities within its Corporate and Investment Banking division as providedbelow. It is provided to our clients for information purposes only, and Barclays makes no express or implied warranties, and expressly disclaims all warrantiesof merchantability or fitness for a particular purpose or use with respect to any data included in this publication. Barclays will not treat unauthorizedrecipients of this report as its clients. Prices shown are indicative and Barclays is not offering to buy or sell or soliciting offers to buy or sell any financialinstrument.
Without limiting any of the foregoing and to the extent permitted by law, in no event shall Barclays, nor any affiliate, nor any of their respective officers,directors, partners, or employees have any liability for (a) any special, punitive, indirect, or consequential damages; or (b) any lost profits, lost revenue, loss ofanticipated savings or loss of opportunity or other financial loss, even if notified of the possibility of such damages, arising from any use of this publication orits contents.
Other than disclosures relating to Barclays, the information contained in this publication has been obtained from sources that Barclays Research believes tobe reliable, but Barclays does not represent or warrant that it is accurate or complete. Barclays is not responsible for, and makes no warranties whatsoever asto, the content of any third-party web site accessed via a hyperlink in this publication and such information is not incorporated by reference.
The views in this publication are those of the author(s) and are subject to change, and Barclays has no obligation to update its opinions or the information inthis publication. The analyst recommendations in this publication reflect solely and exclusively those of the author(s), and such opinions were preparedindependently of any other interests, including those of Barclays and/or its affiliates. This publication does not constitute personal investment advice or takeinto account the individual financial circumstances or objectives of the clients who receive it. The securities discussed herein may not be suitable for allinvestors. Barclays recommends that investors independently evaluate each issuer, security or instrument discussed herein and consult any independentadvisors they believe necessary. The value of and income from any investment may fluctuate from day to day as a result of changes in relevant economicmarkets (including changes in market liquidity). The information herein is not intended to predict actual results, which may differ substantially from thosereflected. Past performance is not necessarily indicative of future results.
This material has been issued and approved for distribution in the UK and European Economic Area (“EEA”) by Barclays Bank PLC. It is being made availableprimarily to persons who are investment professionals as that term is defined in Article 19 of the Financial Services and Markets Act 2000 (FinancialPromotion) Order 2005. It is directed at, and therefore should only be relied upon by, persons who have professional experience in matters relating toinvestments. The investments to which it relates are available only to such persons and will be entered into only with such persons. Barclays Bank PLC isauthorised by the Prudential Regulation Authority and regulated by the Financial Conduct Authority and the Prudential Regulation Authority and is amember of the London Stock Exchange.
The Corporate and Investment Banking division of Barclays undertakes U.S. securities business in the name of its wholly owned subsidiary Barclays CapitalInc., a FINRA and SIPC member. Barclays Capital Inc., a U.S. registered broker/dealer, is distributing this material in the United States and, in connectiontherewith accepts responsibility for its contents. Any U.S. person wishing to effect a transaction in any security discussed herein should do so only bycontacting a representative of Barclays Capital Inc. in the U.S. at 745 Seventh Avenue, New York, New York 10019.
Non-U.S. persons should contact and execute transactions through a Barclays Bank PLC branch or affiliate in their home jurisdiction unless local regulationspermit otherwise.
Barclays Bank PLC, Paris Branch (registered in France under Paris RCS number 381 066 281) is regulated by the Autorité des marchés financiers and theAutorité de contrôle prudentiel. Registered office 34/36 Avenue de Friedland 75008 Paris.
This material is distributed in Canada by Barclays Capital Canada Inc., a registered investment dealer and member of IIROC (www.iiroc.ca).
Subject to the conditions of this publication as set out above, the Corporate & Investment Banking Division of Absa Bank Limited, an authorised financialservices provider (Registration No.: 1986/004794/06. Registered Credit Provider Reg No NCRCP7), is distributing this material in South Africa. Absa BankLimited is regulated by the South African Reserve Bank. This publication is not, nor is it intended to be, advice as defined and/or contemplated in the (SouthAfrican) Financial Advisory and Intermediary Services Act, 37 of 2002, or any other financial, investment, trading, tax, legal, accounting, retirement, actuarialor other professional advice or service whatsoever. Any South African person or entity wishing to effect a transaction in any security discussed herein shoulddo so only by contacting a representative of the Corporate & Investment Banking Division of Absa Bank Limited in South Africa, 15 Alice Lane, Sandton,Johannesburg, Gauteng 2196. Absa Bank Limited is a member of the Barclays group.
In Japan, foreign exchange research reports are prepared and distributed by Barclays Bank PLC Tokyo Branch. Other research reports are distributed toinstitutional investors in Japan by Barclays Securities Japan Limited. Barclays Securities Japan Limited is a joint-stock company incorporated in Japan withregistered office of 6-10-1 Roppongi, Minato-ku, Tokyo 106-6131, Japan. It is a subsidiary of Barclays Bank PLC and a registered financial instruments firmregulated by the Financial Services Agency of Japan. Registered Number: Kanto Zaimukyokucho (kinsho) No. 143.
Barclays Bank PLC, Hong Kong Branch is distributing this material in Hong Kong as an authorised institution regulated by the Hong Kong MonetaryAuthority. Registered Office: 41/F, Cheung Kong Center, 2 Queen's Road Central, Hong Kong.
Information on securities/instruments that trade in Taiwan or written by a Taiwan-based research analyst is distributed by Barclays Capital SecuritiesTaiwan Limited to its clients. The material on securities/instruments not traded in Taiwan is not to be construed as 'recommendation' in Taiwan. BarclaysCapital Securities Taiwan Limited does not accept orders from clients to trade in such securities. This material may not be distributed to the public media orused by the public media without prior written consent of Barclays.
This material is distributed in South Korea by Barclays Capital Securities Limited, Seoul Branch.
All equity research material is distributed in India by Barclays Securities (India) Private Limited (SEBI Registration No: INB/INF 231292732 (NSE), INB/INF011292738 (BSE) | Corporate Identification Number: U67120MH2006PTC161063 | Registered Office: 208 | Ceejay House | Dr. Annie Besant Road | ShivsagarEstate | Worli | Mumbai - 400 018 | India, Phone: + 91 22 67196363). Other research reports are distributed in India by Barclays Bank PLC, India Branch.
Barclays Bank PLC Frankfurt Branch distributes this material in Germany under the supervision of Bundesanstalt für Finanzdienstleistungsaufsicht (BaFin).
This material is distributed in Malaysia by Barclays Capital Markets Malaysia Sdn Bhd.
This material is distributed in Brazil by Banco Barclays S.A.
This material is distributed in Mexico by Barclays Bank Mexico, S.A.
Barclays Bank PLC in the Dubai International Financial Centre (Registered No. 0060) is regulated by the Dubai Financial Services Authority (DFSA). Principalplace of business in the Dubai International Financial Centre: The Gate Village, Building 4, Level 4, PO Box 506504, Dubai, United Arab Emirates. Barclays

Bank PLC-DIFC Branch, may only undertake the financial services activities that fall within the scope of its existing DFSA licence. Related financial products orservices are only available to Professional Clients, as defined by the Dubai Financial Services Authority.
Barclays Bank PLC in the UAE is regulated by the Central Bank of the UAE and is licensed to conduct business activities as a branch of a commercial bankincorporated outside the UAE in Dubai (Licence No.: 13/1844/2008, Registered Office: Building No. 6, Burj Dubai Business Hub, Sheikh Zayed Road, DubaiCity) and Abu Dhabi (Licence No.: 13/952/2008, Registered Office: Al Jazira Towers, Hamdan Street, PO Box 2734, Abu Dhabi).
Barclays Bank PLC in the Qatar Financial Centre (Registered No. 00018) is authorised by the Qatar Financial Centre Regulatory Authority (QFCRA). BarclaysBank PLC-QFC Branch may only undertake the regulated activities that fall within the scope of its existing QFCRA licence. Principal place of business in Qatar:Qatar Financial Centre, Office 1002, 10th Floor, QFC Tower, Diplomatic Area, West Bay, PO Box 15891, Doha, Qatar. Related financial products or servicesare only available to Business Customers as defined by the Qatar Financial Centre Regulatory Authority.
This material is distributed in the UAE (including the Dubai International Financial Centre) and Qatar by Barclays Bank PLC.
This material is distributed in Saudi Arabia by Barclays Saudi Arabia ('BSA'). It is not the intention of the publication to be used or deemed asrecommendation, option or advice for any action (s) that may take place in future. Barclays Saudi Arabia is a Closed Joint Stock Company, (CMA License No.09141-37). Registered office Al Faisaliah Tower, Level 18, Riyadh 11311, Kingdom of Saudi Arabia. Authorised and regulated by the Capital MarketAuthority, Commercial Registration Number: 1010283024.
This material is distributed in Russia by OOO Barclays Capital, affiliated company of Barclays Bank PLC, registered and regulated in Russia by the FSFM.Broker License #177-11850-100000; Dealer License #177-11855-010000. Registered address in Russia: 125047 Moscow, 1st Tverskaya-Yamskaya str. 21.
This material is distributed in Singapore by the Singapore branch of Barclays Bank PLC, a bank licensed in Singapore by the Monetary Authority of Singapore.For matters in connection with this report, recipients in Singapore may contact the Singapore branch of Barclays Bank PLC, whose registered address is OneRaffles Quay Level 28, South Tower, Singapore 048583.
Barclays Bank PLC, Australia Branch (ARBN 062 449 585, AFSL 246617) is distributing this material in Australia. It is directed at 'wholesale clients' as definedby Australian Corporations Act 2001.
IRS Circular 230 Prepared Materials Disclaimer: Barclays does not provide tax advice and nothing contained herein should be construed to be tax advice.Please be advised that any discussion of U.S. tax matters contained herein (including any attachments) (i) is not intended or written to be used, and cannotbe used, by you for the purpose of avoiding U.S. tax-related penalties; and (ii) was written to support the promotion or marketing of the transactions or othermatters addressed herein. Accordingly, you should seek advice based on your particular circumstances from an independent tax advisor.
© Copyright Barclays Bank PLC (2014). All rights reserved. No part of this publication may be reproduced or redistributed in any manner without the priorwritten permission of Barclays. Barclays Bank PLC is registered in England No. 1026167. Registered office 1 Churchill Place, London, E14 5HP. Additionalinformation regarding this publication will be furnished upon request.

US08-000001