FIT-OUT COST GUIDE - CoreNet Global
23
EMEA FIT-OUT COST GUIDE 2018/19 EDITION
-
Upload
khangminh22 -
Category
Documents
-
view
2 -
download
0
Transcript of FIT-OUT COST GUIDE - CoreNet Global

EM
EA
FIT
-O
UT
CO
ST
GU
IDE
20
18
/1
9 E
DIT
ION
EMEAFIT-OUTCOSTGUIDE2 0 1 8 / 1 9 E D I T I O N

MATTHEW EASTWOODHead of EMEA ProjectsCBRE Global Workplace Solutions, EMEA
CBRE PROJECT MANAGEMENT 21 EMEA FIT-OUT COST GUIDE
Welcome to the Fit-Out Cost Guide 2018/19, the publication that remains the most comprehensive analysis of office fit-out pricing in Europe, the Middle East and Africa.
Since its inception in 2013, the Guide has sought to answer the question most commonly asked by our clients: “How much will it cost me to…?”. By building on the quantity and quality of our data, our guides have become increasingly powerful tools which help build stage one cost plans, verify third-party programmes, and normalise in-house benchmarking. Now, in our sixth year of producing the Guide, we can also provide detailed analysis of trends in the fit-out market across the region.
This year we are excited to introduce the Fit-Out Online Calculator to the Guide, a tool which allows its user to create fit-out project budgets online, see page 41 for more information.
We know that technology impacts real estate performance and potential, revealing dynamic insights and actionable strategies. That’s why CBRE has made notable investments to bolster our technology suite, including Kahua, our cloud-based and collaborative project management solution, Floored, our interactive 3D environment creation tool, and our new employee experience capability, CBRE360.
As the Guide has developed, experts from across CBRE have increasingly contributed. Workplace, sustainability, and transaction management teams all help to create an inclusive publication which accurately reflects our fully integrated service offering.
On a final note, I want to mention our people, who are at the heart of our strategy. CBRE strives to provide a working environment that attracts and develops the best talent, and celebrates the success of every individual. I am proud that the EMEA projects team is one of the most diverse in Global Workplace Solutions, and we are committed to continuing to bring in people from all different backgrounds.
Our ability to tap into the best talent, benefit from local expertise and use the latest technology, means that CBRE continues to lead the industry. It also allows us to produce the most comprehensive reference guide for real estate professionals, forming part of a global suite.
I want to thank everyone who has contributed to this year’s Fit-Out Cost Guide, and thank you for your continued interest in our work. We hope you enjoy this edition.
CONTENTS FOREWORD
2 FOREWORD
3 WORKPLACE TRENDS
5 TRADITIONAL VS. AGILE WORKPLACE
6 LAYOUTS
7 SPECIFICATIONS (LOW, MEDIUM, HIGH)
14 PRICING ASSUMPTIONS
15 CAT B CONSTRUCTION COSTS
17 TECHNOLOGY
21 FURNITURE
24 PROFESSIONAL FEES
25 BUSINESS TRANSITION & MOVE MANAGEMENT
27 REINSTATEMENT
29 PROCUREMENT & PROGRAMME
31 CAPITAL PLANNING
33 CONSTRUCTION SERVICES
34 TAX DEPRECIATION
35 SUSTAINABILITY
37 REGIONAL MARKET OUTLOOK
39 FIT-OUT COST INDEX | EMEA
40 FIT-OUT COST INDEX | GLOBAL
41 NEW FOR 2018 | ONLINE CALCULATOR
42 BUILD YOUR BUDGET MATRIX
44 KEY CONTACTS

80%have or will have a wellness programme
56%see user experience and productivity as key reasons for future technology investments
62%plan to increase real estate technology investment
46%see innovation and talent as the main reasons for using flexible office space
47%expect to hire data scientists within the real estate team
55%favour co-working as the most popular flexible space type
74%expect to provide more collaboration/social space
92%have a preference for wellness capable buildings
45%expect to have significant use of flexible offices by 2021
EMEA FIT-OUT COST GUIDE CBRE PROJECT MANAGEMENT 43
TECHNOLOGYTechnology continues to be one of the major catalysts for change – enabling us to work anywhere and at any time. But within real estate teams, the use of data is also undergoing a significant transformation with building-related intelligence, such as energy consumption and space utilisation, being supplemented by technologies that enhance the user experience.
This include wayfinding apps, connected sensors, wearables and personal environment control systems, all of which can make things like finding a room or colleague easier and quicker, resulting in greater productivity. As for the foreseeable future, organisations are already looking at next generation technology applications, including connected digital devices, augmented reality and robotics.
WELLNESSThe wellness agenda is becoming more established and is increasingly considered a central part of the real estate proposition. A growing number of organisations are actively promoting both physical and mental health for employees by providing amenities such as on-site gyms or membership schemes, healthy food options, good access to daylight, ‘sit-stand’ desks and mental health awareness events. While for some organisations this has been their modus operandi for many years, aspects of their wellness programmes may have been considered ‘perks’ to help attract and retain staff. At times of economic downturn these ‘perks’ may well have been in the front-line for potential cuts. Happily, the situation today is noticeably different, with good physical and mental health increasingly recognised as a necessity rather than a ‘nice to have’.
Recent research conducted by the University of Twente and CBRE confirms the relationship between people's working environment and their health, wellbeing and ability to perform1. In some cases productivity improved by 45%.
1 Source: Healthy Offices, University of Twente and CBRE
Statistics Source: CBRE, EMEA Occupier Survey 2018
Workplace trends have become a hot topic across our industry and are passionately debated on all forms of media. This level of attention is driven by a shared sense of frustration that too many workplaces are failing to satisfy the necessary levels of user experience, including lack of adequate support for ‘wellness’ in the workplace.
TRENDS OBSERVED IN THE LAST 12 MONTHS
The most noticeable trend in the past year has been the number of organisations taking steps to address this imbalance by enhancing the user experience and general wellness of employees within the workplace.
Apart from the ever-present requirement to reduce real estate and facilities costs, three major trends this year include; the increasing use of flexible office space, greater investment in real estate technology systems and a keener focus on wellness. All three support an overarching requirement to improve user experience, for both employees and visitors.
FLEXIBLE OFFICE SPACEA growing number of companies are making use of third-party flexible office space as part of their broader real estate strategies. Whereas this has previously focused on the use of serviced/furnished offices to provide short-term expansion or swing space, there is now a greater interest in and demand for co-working spaces. These tend to be designed with the individual in mind, providing a wide range of space-types and amenities, often with concierge support, enabling users to choose where and how they work. This degree of choice typically results in individuals being happier and therefore more productive. This in turn tends to encourage greater innovation; the life-blood of all successful organisations. The challenge for companies that place teams in co-working environments is that these teams sometimes resist the idea of returning to their old ‘corporate’ workspaces, and retention of key talent can become an issue. The solution may, in due course, be the integration of co-working type concepts within existing corporate real-estate portfolios, thereby avoiding the need to use third-party spaces.
WORKPLACE TRENDS

Traditional
Space designation
Area net (sq m)
Work settings
Open plan desks 299 47
Desks in shared room 85 12
Private offices 133 7
Meeting rooms 146 7
Informal meeting spaces 18 2
Tea point 14
Support space 51
Reception 42
Circulation space 212
Total 1,000 75
Agile
Space designation
Area net (sq m)
Work settings
Open plan desks/benches 365 70
Study pods (open plan) 70 14
Meeting rooms 110 8
Quiet rooms 24 4
Informal meeting spaces 44 4
Coffee lounge 60 5
Recreation room 10
Support space 35
Reception/lounge 70
Circulation space 212
Total 1,000 105
EMEA FIT-OUT COST GUIDE CBRE PROJECT MANAGEMENT 65
The terms ‘traditional’ and ‘agile’ refer here to the design of office interiors, usually reflecting the function and culture of the occupying organisation. There is, of course, a broad spectrum of workplace models in existence across the region, but these can be distilled broadly into these two types.
TRADITIONALThe traditional layout is characterised by the space having a large number of private offices, the size, location and specification of which are determined by the occupier’s status within the organisation. Executive assistants typically sit directly outside their managers’ offices, while the rest of the workforce is accommodated either in open plan or group rooms. There is no desk sharing. Desks tend to be large and often incorporate furniture screens to provide an element of privacy. There is usually a high dependency on paper storage in these environments and little in the way of supplementary workspaces, apart from a suite of predominantly large meeting rooms.
AGILEThe agile layout is characterised by a wide range of work settings which support ‘activity-based working’. This is a shared working environment with few, if any, desks or rooms allocated to individuals. Personal lockers are provided in place of under-desk pedestals. The space is designed to foster high-levels of interaction and knowledge sharing by providing a wide choice of meeting spaces, both open and enclosed. A number of small rooms and semi-enclosed spaces support the need for individual focused work. The emphasis of the agile workplace is very much on the user experience and the wellness and wellbeing of employees. The space itself is designed to be flexible, adaptable and dynamic.
TRADITIONALAREA SCHEDULE
AGILE
This guide presents general arrangements of an office floor plate of 1,000 sq m (10,764 sq ft) usable area to suit both traditional and agile ways of working.
The workplace settings in the agile layout reflect the collaborative and flexible work environment, whereas the traditional layout focuses more on private work settings.
It is likely many businesses will choose a hybrid of the two working styles depending on their needs and operations. The three specification levels of low, medium and high, as outlined in the following pages, are compatible with either layout.
TRADITIONAL VS. AGILE WORKPLACE LAYOUTS
ASSUMPTIONS
EMEA FIT-OUT COST GUIDE CBRE PROJECT MANAGEMENT 87
RECEPTION
COFFEE LOUNGE
COLLABORATION AREAMEETING ROOMWORKPOINTS
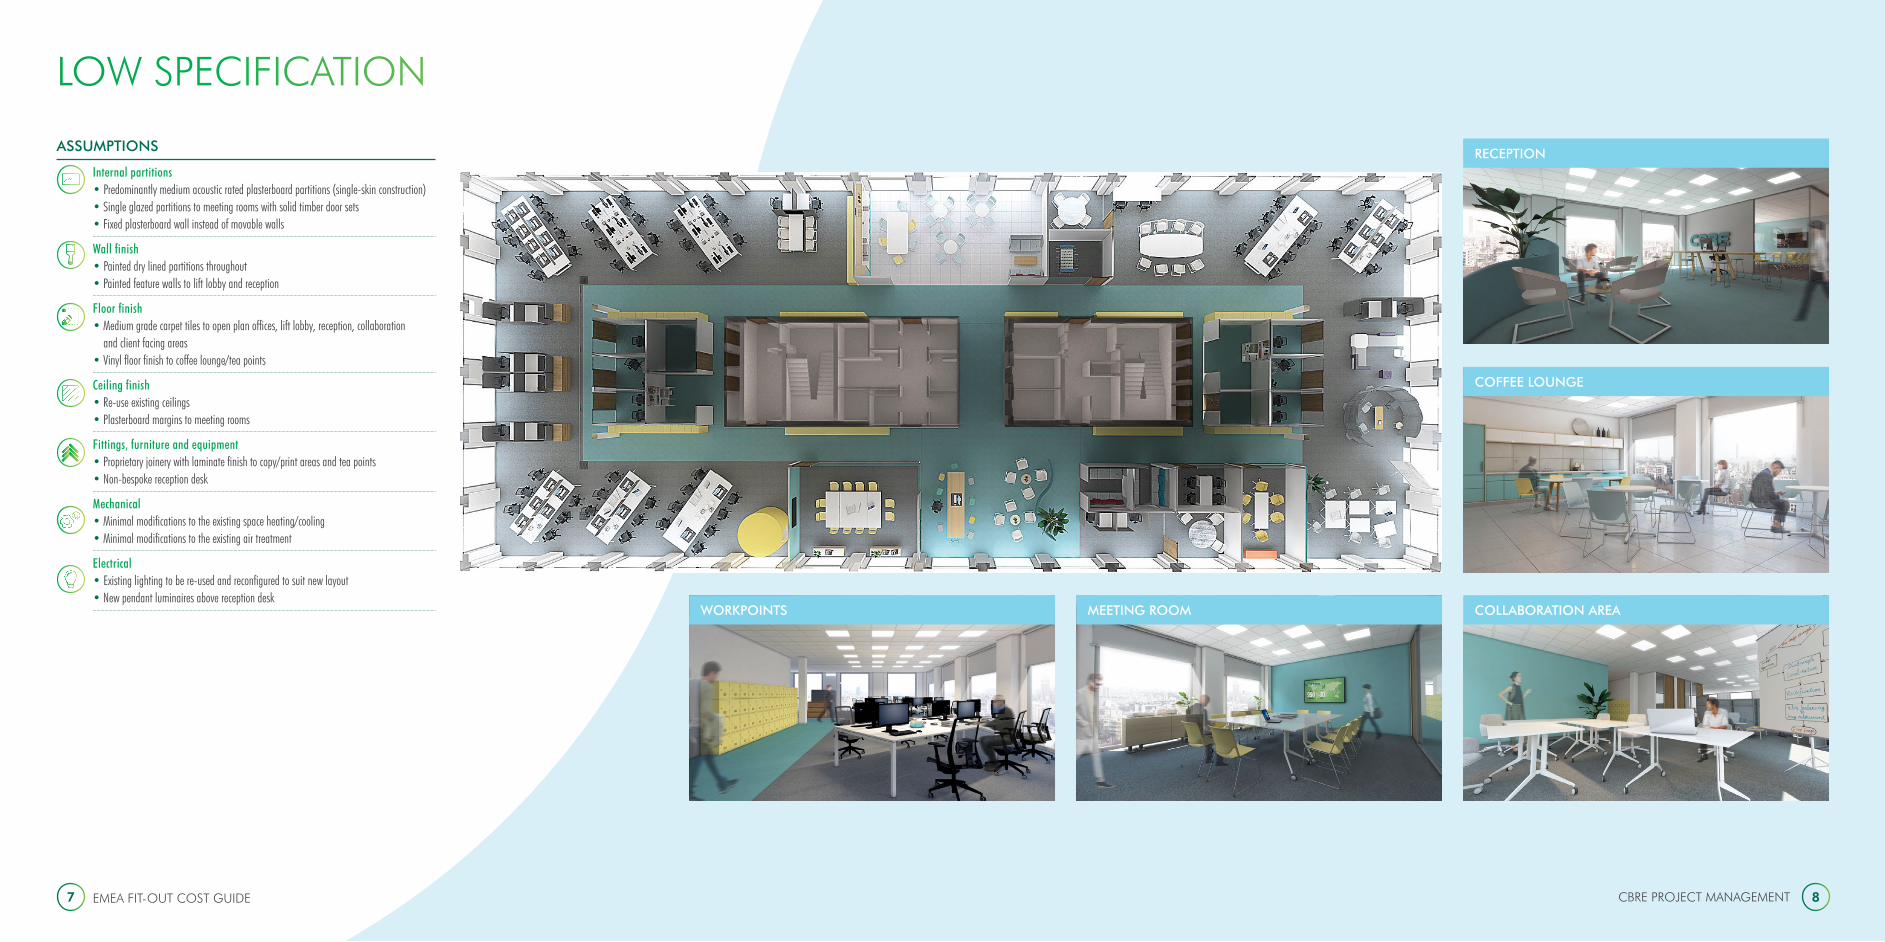
LOW SPECIFICATION
Internal partitions • Predominantly medium acoustic rated plasterboard partitions (single-skin construction) • Single glazed partitions to meeting rooms with solid timber door sets • Fixed plasterboard wall instead of movable walls
Wall finish • Painted dry lined partitions throughout • Painted feature walls to lift lobby and reception
Floor finish • Medium grade carpet tiles to open plan offices, lift lobby, reception, collaboration and client facing areas • Vinyl floor finish to coffee lounge/tea points
Ceiling finish • Re-use existing ceilings • Plasterboard margins to meeting rooms
Fittings, furniture and equipment • Proprietary joinery with laminate finish to copy/print areas and tea points • Non-bespoke reception desk
Mechanical • Minimal modifications to the existing space heating/cooling • Minimal modifications to the existing air treatment
Electrical • Existing lighting to be re-used and reconfigured to suit new layout • New pendant luminaires above reception desk

ASSUMPTIONS
EMEA FIT-OUT COST GUIDE CBRE PROJECT MANAGEMENT 109
MEDIUM SPECIFICATION
RECEPTION
COFFEE LOUNGE
COLLABORATION AREAMEETING ROOMWORKPOINTS
Internal partitions • Increased use of glazed partitions instead of plasterboard • Acoustic-rated single glazed partitions to meeting rooms with framed glazed door sets • Acoustic treatment to partitions (double-skin construction with acoustic infills) • Hardwood veneer and medium acoustic rated manually operated movable walls
Wall finish • Painted dry lined partitions throughout • Painted feature wall to client facing meeting rooms • Back painted glass feature walls to lift lobby and reception • Floor to ceiling photo/graphics wallpaper applied in four locations
Floor finish • Medium-grade carpet tiles to open plan offices, collaboration and client facing areas • Ceramic tiles to lift lobby, reception and coffee lounge/tea points
Ceiling finish • New feature plasterboard ceilings to reception, lift lobby, client-facing areas and coffee lounge • Plasterboard margins to meeting rooms
Fittings, furniture and equipment • Resin top finish to tea points with high gloss laminate cupboards • Proprietary laminate joinery for copy/print joinery • Bespoke hardwood and glass reception desk
Mechanical • Moderate modifications to the existing space heating/cooling and air treatment
Electrical • Existing lighting to be re-used and reconfigured to suit new layout, supplemented by new luminaires to collaboration spaces • Specialist lighting to reception, client facing and coffee lounge spaces • Modifications to existing BMS and lighting controls

ASSUMPTIONS
EMEA FIT-OUT COST GUIDE CBRE PROJECT MANAGEMENT 1211
HIGH SPECIFICATION
RECEPTION
COFFEE LOUNGE
COLLABORATION AREAMEETING ROOMWORKPOINTS
Internal partitions • Increased use of glazed partitions instead of plasterboard • High acoustic rated double glazed partitions to meeting rooms with framed glazed door sets • Acoustic treatment to partitions (slab-to-slab construction or acoustic infills above ceiling and within floor void) • Hardwood veneer and high acoustic rated semi-automatic movable walls
Wall finish • Painted dry lined partitions throughout • Applied finishes to feature walls in client meeting rooms • Stone feature walls to lift lobby • Video wall to reception • Floor to ceiling photo/graphics wallpaper applied in four locations
Floor finish • High grade carpet tiles to open plan offices, collaboration and client facing areas • Porcelain tiles or stone to lift lobby and reception • Hardwood flooring to coffee lounge/tea points
Ceiling finish • New feature timber raft ceiling to reception and client facing meeting rooms • New feature plasterboard ceilings to lift lobby, internal meeting rooms and coffee lounge with plasterboard margins • New metal plank ceiling system throughout office space
Fittings, furniture and equipment • Resin top finish to tea point with high gloss laminate cupboards • Specialist joinery for copy/print areas • Bespoke joinery construction (encasement) for video wall to reception • Booth seating (adjacent to reception) built as joinery item rather than as furniture solution • Bespoke illuminated glass and stainless steel reception desk with integrated data and power
Mechanical • Moderate modifications to the existing space heating, cooling and air treatment • Local temperature control /adjustment in meeting rooms and booths
Electrical • Existing lighting re-used and part new lighting to office areas • High-end specialist lighting to reception, client facing, collaborative and coffee lounge spaces • Modifications to BMS and lighting controls with scene setting

EMEA FIT-OUT COST GUIDE CBRE PROJECT MANAGEMENT 1413
A detailed quantity measure has been carried out using the traditional and agile layouts for the three levels of specifications (low, medium and high).
These layouts have been priced locally within each market to capture the costing information along with typical procurement and programme data. Prices for each of the 64 EMEA locations identified in this guide are based on the following assumptions:
• The building is located in a central business district
• The space leased is in good CAT A condition and costs are based on a full new CAT B fit-out
• Costs take into account a reconfiguration of existing CAT A installations to suit the CAT B design and upgrades where stated in the specification
• The base building and CAT B design are considered to hold no abnormalities
• The costs assume that the base-build and landlord provided CAT A has the necessary infrastructure (e.g. sufficient HVAC and power) to support the intended fit-out
• This is a generic design which does not take into account cultural differences and country specific space planning considerations or local regulations
• The base date for the pricing information in this document is August 2018.
• All pricing is in Euros and exchange rates are accurate to this date
• Pricing is based on the construction costs for the agile layout. The cost variance with the traditional layout is marginal; from data collection as a benchmark the traditional layout construction costs are on average 5% more expensive
CATEGORY A FIT-OUT (WARM SHELL) CATEGORY B FIT-OUT (TENANT FIT-OUT)
• Raised access floor • Suspended ceiling• Mechanical and electrical services above the ceiling from the riser to
suit an open plan regular grid • Decoration/finishes to the internal face of the perimeter and
core walls• Blinds
• Upgrades to landlord’s CAT A provisions• Adaption of suspended ceiling, raised floor and M&E to coordinate
with final tenant layout • Installation of floor boxes, below-floor power and data cabling • Tenant improvements including internal partitioning, joinery, floor,
wall and ceiling finishes• Corporate branding, statutory, wayfinding and safety signage • IT provisions • Security installations • Audio visual equipment• Furniture
PRICING ASSUMPTIONS
CBRE Barcelona Office

COUNTRY CITY LOW SPECIFICATION MEDIUM SPECIFICATION HIGH SPECIFICATION CONSTRUCTION INFLATION
(€ / sq m) (€ / sq m) (€ / sq m)
Angola Luanda 1,027 1,244 1,916 8 - 12%
Austria Vienna 558 737 1,140 3 - 4%
Belgium Brussels 460 616 876 1 - 2%
Botswana Gaborone 777 930 1,478 3 - 6%
Bulgaria Sofia 276 399 550 2 - 4%
Croatia Zagreb 355 444 694 1 - 3%
Czech Republic Prague 361 464 725 2 - 3%
Denmark* Copenhagen 570 757 1,168 0 - 1%
Egypt Cairo 603 862 1,217 8 - 12%
Estonia Tallinn 431 572 857 2 - 3%
Ethiopia Addis Ababa 861 1,048 1,610 8 - 12%
Finland* Helsinki 714 887 1,440 1 - 3%
France Paris 733 876 1,367 2 - 3%
Germany* Berlin 650 898 1,340 1 - 3%
Germany* Frankfurt 654 904 1,404 1 - 3%
Germany* Hamburg 674 946 1,439 1 - 3%
Germany* Munich 684 966 1,491 1 - 3%
Germany* Stuttgart 660 933 1,419 1 - 3%
Ghana Accra 813 988 1,523 8 - 10%
Greece Athens 300 396 627 0 - 2%
Hungary* Budapest 424 573 898 3 - 6%
Ireland Dublin 469 605 937 5 - 7%
Israel Tel Aviv 494 681 1,040 1 - 3%
Italy Milan 487 638 977 0 - 1%
Italy Rome 482 633 969 0 - 1%
Ivory Coast Abidjan 934 1,275 1,942 3 - 6%
Kazakhstan Almaty 364 480 755 7 - 9%
Kenya Nairobi 846 1,030 1,582 4 - 6%
Kuwait Kuwait City 649 851 1,314 2 - 4%
Latvia Riga 454 534 842 1 - 3%
Lebanon Beirut 711 931 1,326 5 - 7%
Lithuania Vilnius 488 578 875 2 - 4%
COUNTRY CITY LOW SPECIFICATION MEDIUM SPECIFICATION HIGH SPECIFICATION CONSTRUCTION INFLATION
(€ / sq m) (€ / sq m) (€ / sq m)
Luxembourg Luxembourg 619 875 1,223 1 - 2%
Morocco Casablanca 405 506 754 2 - 4%
Netherlands Amsterdam 496 655 1,002 4 - 6%
Nigeria Abuja 1,034 1,361 1,936 8 - 12%
Norway* Oslo 754 1,043 1,593 1 - 3%
Oman Muscat 607 811 1,162 2 - 4%
Poland Warsaw 357 456 722 5 - 6%
Portugal Lisbon 395 529 811 1 - 3%
Qatar Doha 711 991 1,434 2 - 4%
Romania Bucharest 346 452 683 5 - 8%
Russia Moscow 443 602 932 3 - 6%
Saudi Arabia Riyadh 690 920 1,316 2 - 4%
Serbia* Belgrade 324 420 649 1 - 3%
Slovakia* Bratislava 319 528 720 1 - 3%
South Africa Cape Town 499 678 1,077 4 - 6%
South Africa Johannesburg 483 659 1,048 4 - 6%
Spain Barcelona 438 552 874 1 - 3%
Spain Madrid 447 571 881 1 - 3%
Sweden* Stockholm 736 1,029 1,381 2 - 4%
Switzerland Geneva 834 1,063 1,597 0 - 1%
Switzerland Zurich 838 1,071 1,578 0 - 1%
Turkey Istanbul 299 441 626 10 - 15%
UAE Abu Dhabi 701 931 1,334 2 - 4%
UAE Dubai 711 946 1,414 2 - 4%
Uganda Kampala 809 985 1,512 3 - 6%
UK Aberdeen 429 543 811 2 - 4%
UK Belfast 360 477 736 2 - 4%
UK Glasgow 429 523 801 2 - 4%
UK London 538 734 1,144 2 - 4%
UK Manchester 427 576 818 2 - 4%
Ukraine Kiev 311 403 629 5 - 8%
Zambia Lusaka 748 894 1,424 6 - 9%EMEA FIT-OUT COST GUIDE CBRE PROJECT MANAGEMENT 1615
The CAT B cost data for the three levels of fit-out specification have been normalised across all locations.
Using this data, the adjacent table outlines the CAT B construction costs of the 1,000 sq m agile layout illustrated on pages 6 - 12.
Our pricing data indicates that the traditional layout is on average 5% more expensive due to increased partitioning and M&E associated with greater cellularisation of the space.
NOTEAll prices have been aligned to show CAT B construction costs only.
Includes: internal partitions, M&E reconfiguration, doors and ironmongery, wall, floor and ceiling finishes, specialist joinery, fixtures and fittings, structured cabling and comms room fit-out, internal signage, branding, contractor preliminaries and overhead and profit.
Excludes: technology (page 17), furniture (page 21), professional fees (page 24), contingencies and taxes.
* CAT B construction works may be delivered by the landlord in these locations and associated costs could be factored in the lease agreement.
All costs shown are in sq m, to convert these to sq ft: 1 sq m = 10.764 sq ft.
CAT B CONSTRUCTION COSTS (READY RECKONER)
WALL MOUNTED DISPLAYCompany information or internal marketing
WIRELESS NETWORK Fast wireless network throughout building
VIDEO DISPLAY WALL Live company information or news feeds
MULTIPLE DISPLAY WALLS Interactive LED screens creating an immersive experience
LARGE MEETING ROOM Built in ceiling speakers and microphones for video and audio conferencing
INTERACTIVE AV Linked to desktop PCs and laptops. Conferencing cameras and microphones
CENTRAL COMMS ROOM All AV and IT equipment located centrally along with BMS and CCTV management
Small meeting room
Medium meeting room
Large meeting room
Informal meeting space
Alternative workspace
AGILE AV SPECIFICATION DESCRIPTION
Space type Low Medium High
Reception area Company information or brand specific content displayed on LED signage screen
Multiple LED screens displaying specifically developed content
Video wall or bespoke AV installation providing bespoke, interactive or real-time information specific to client brand
Desk area No AV TV screen fed direct from building TV distribution
TV/signage screen fed from client IPTV or signage system
Lift lobby No AV TV screen fed direct from building TV distribution
TV/signage screen fed from client IPTV or signage system
Large meeting rooms
Single LED screen with wired presentation facilities and a desktop conference phone
Dual LED screen with the addition of wireless presentation system, touch screen controls and built in audio conferencing with ceiling speakers
As per the medium specification with the addition of HD video conferencing and interactive collaboration tools such as interactive touch screen LED screens
Medium meeting room
Single LED screen with wired presentation facilities and an IP conference phone
Single LED screen with wireless presentation facilities and an IP conference phone
Interactive screen with wireless presentation and IP conference phone and VC camera
Small meeting rooms
No AV IP desk phone IP desk Phone and VC camera
Informal meeting spaces
No AV Content sharing screens Content sharing and collaboration screens
Alternative workspaces
Large LED screen with wireless presentation wipe clean whiteboard
Wireless presentation to large LED Screen, video and audio conference enabled
Interactive whiteboard, LED screen and collaboration facilities with immersive features
Comms room Centralised AV equipment Centralised AV equipment Centralised AV equipment
TRADITIONAL AV SPECIFICATION DESCRIPTION
Space type Low Medium High
Reception area Company information or brand specific content displayed on LED signage screen
Multiple LED screens displaying specifically developed content
Video wall or bespoke AV installation providing bespoke or real-time information specific to client brand
Desk area No AV TV screen fed direct from building TV distribution
TV/signage screen fed from client IPTV or signage system
Lift lobby No AV TV screen fed direct from building TV distribution
TV/signage screen fed from client IPTV or signage system
Large meeting rooms
Single LED screen with wired presentation facilities and a desktop conference phone
Dual LED screen with the addition of wireless presentation system, touch screen controls and built in audio conferencing with ceiling speakers
As per the medium specification with the addition of HD video conferencing and interactive collaboration tools such as touch screen LED screens
Medium meeting room
Single LED screen with wired presentation facilities and an IP conference phone
Single LED screen with wireless presentation facilities and an IP conference phone
Interactive touch screen with wireless presentation and IP conference phone and VC camera
Small meeting rooms
No AV IP desk phone IP desk phone and VC camera
Comms room Centralised AV equipment Centralised AV equipment Centralised AV equipment
EMEA FIT-OUT COST GUIDE CBRE PROJECT MANAGEMENT 1817
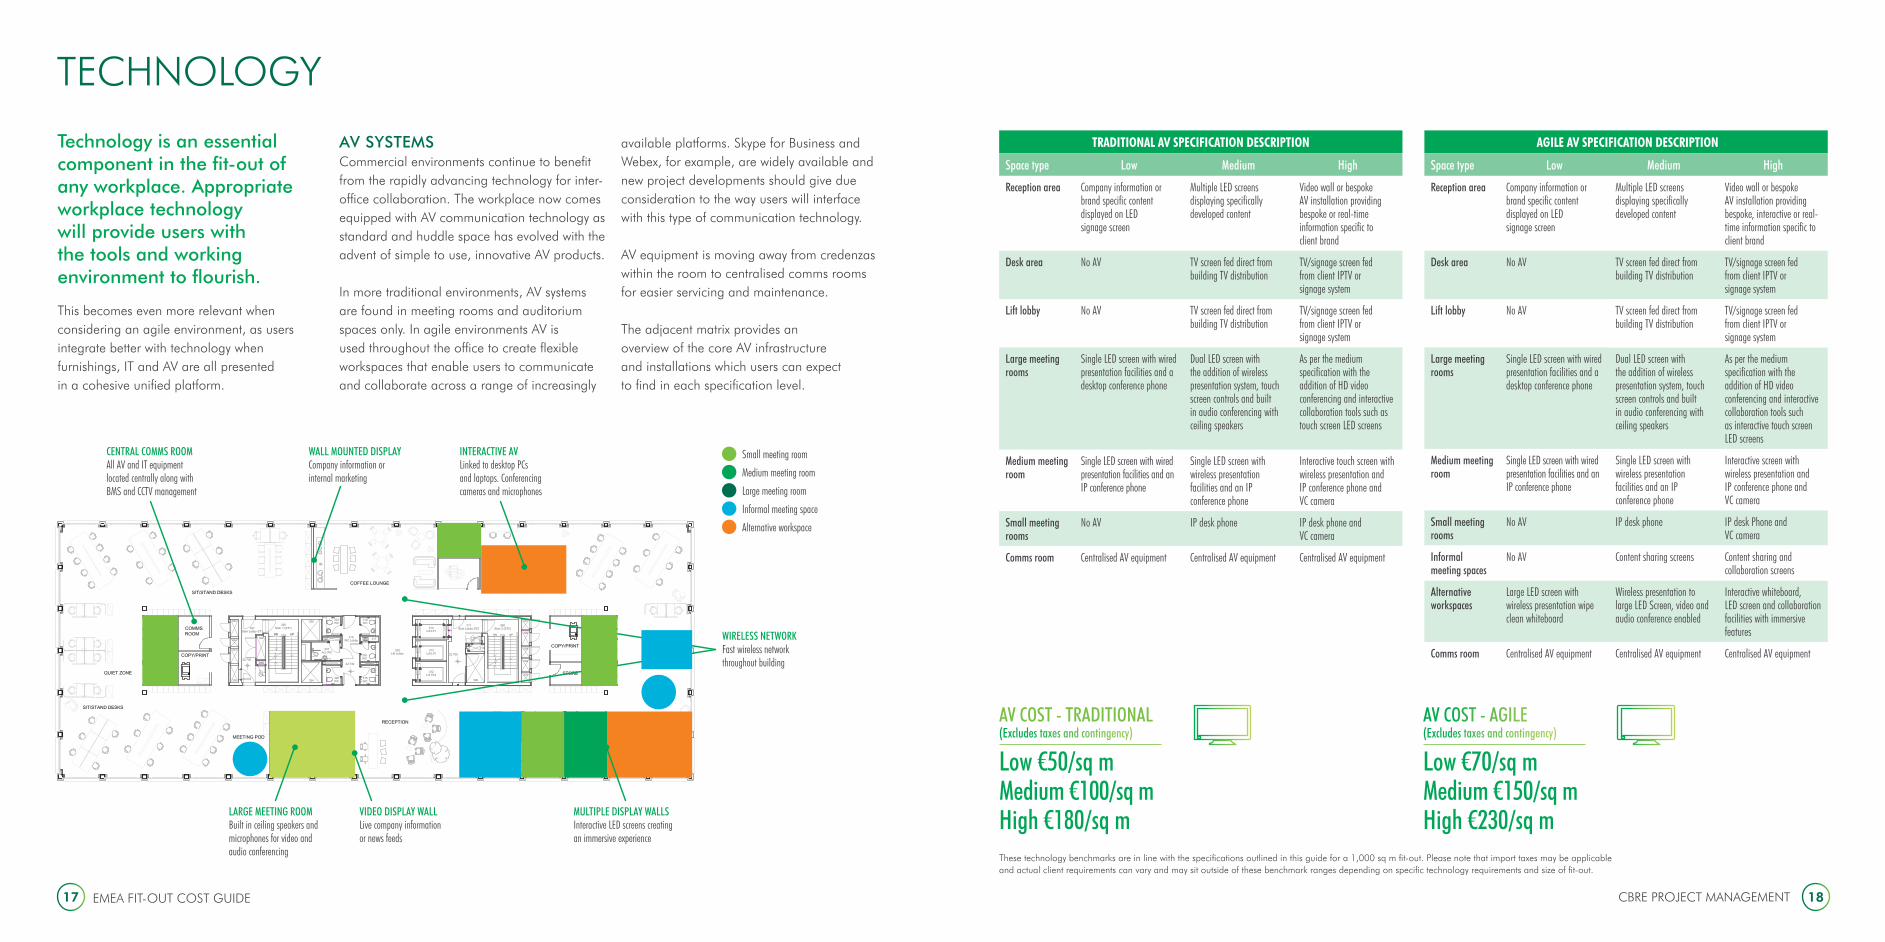
Technology is an essential component in the fit-out of any workplace. Appropriate workplace technology will provide users with the tools and working environment to flourish.
This becomes even more relevant when considering an agile environment, as users integrate better with technology when furnishings, IT and AV are all presented in a cohesive unified platform.
AV SYSTEMSCommercial environments continue to benefit from the rapidly advancing technology for inter-office collaboration. The workplace now comes equipped with AV communication technology as standard and huddle space has evolved with the advent of simple to use, innovative AV products.
In more traditional environments, AV systems are found in meeting rooms and auditorium spaces only. In agile environments AV is used throughout the office to create flexible workspaces that enable users to communicate and collaborate across a range of increasingly
available platforms. Skype for Business and Webex, for example, are widely available and new project developments should give due consideration to the way users will interface with this type of communication technology.
AV equipment is moving away from credenzas within the room to centralised comms rooms for easier servicing and maintenance.
The adjacent matrix provides an overview of the core AV infrastructure and installations which users can expect to find in each specification level.
TECHNOLOGY
AV COST - TRADITIONAL(Excludes taxes and contingency)
Low €50/sq mMedium €100/sq mHigh €180/sq m
AV COST - AGILE(Excludes taxes and contingency)
Low €70/sq mMedium €150/sq mHigh €230/sq m
These technology benchmarks are in line with the specifications outlined in this guide for a 1,000 sq m fit-out. Please note that import taxes may be applicable and actual client requirements can vary and may sit outside of these benchmark ranges depending on specific technology requirements and size of fit-out.

SECURITY COST(Excludes taxes and contingency)
€35 / sq m
IT COST(Excludes taxes and contingency)
€60 - €120 / sq m
CBRE PROJECT MANAGEMENT 2019 EMEA FIT-OUT COST GUIDE
SECURITYTenant security systems typically consist of two main elements, electronic access control and CCTV.
These systems monitor the point of entry into the tenant’s office demise and to secure areas such as the IT comms room, high value storage or the HR office. In a multi tenanted building the landlord will have already installed security systems managing access and monitoring for the main building entrances and common areas. The security system can operate standalone within the tenant
demise or be interfaced with a compatible landlord system, which provides opportunities to streamline system administration and enhance the visitor management process.
Both CCTV and access control systems will typically be Internet Protocol (IP) based, meaning they connect over the structured cabling and network infrastructure. This deployment methodology removes the requirement for multiple types of cabling. This provides opportunities to interface the security systems with any other IP based systems to
create workflows, collate data and cause and effect based outcomes which is the basis for starting to create a ‘Smart Building’.
The management interface for security systems will be accessible over the network or consolidated to view alongside other building systems.
IT Tenants’ IT installations typically include structured cabling (included in the Cat B construction costs), and wired and wireless network equipment.
Monitors and desk phones are considered user’s equipment and typically don’t sit within the fit-out budget; however, the placement of these components is essential to any workplace strategy. Clients’ existing equipment may not enable changes in the working styles and practices, which are often the driving force behind office relocations, so proper advice should be taken on how to engage with the latest technology early in the planning stages.
Wi-Fi technology is sufficiently reliable as a primary method of connectivity for user devices within an agile working environment, but there will always be a requirement for a
structured cabling system. This will typically be installed within the raised floor and ceiling void to provide connection for fixed IT, AV, security and any other IP based products. The growth in integrated and smart buildings is motivating an increase in IP devices that are network connected, this will need to be given due consideration when producing technology budgets. Although additional IT infrastructure is required to support these systems, this is offset by savings in other packages.
As more systems become IP-based, the reliance on connectivity to the Local Area Network (LAN) means that new switches and firewalls are typically procured rather than relocated during an office move. One of the drivers for this is that contractors are reliant on network connectivity to commission IP-based building systems.
Wireless access points installed within or beneath the ceiling void will provide users with connectivity to the Internet and the ability to work anywhere within the office. Full Wi-Fi coverage within the office is a key requirement for agile and traditional office working environments.
It is critical that IT budgeting is considered early in the project and with a holistic view in order to achieve the savings that smart building technology, the Internet of Things (IoT) and systems convergence can offer.
MARK SIMMONS Consultancy Director
t: +44 (0) 203 126 4986 e: [email protected]
CBRE Barcelona Office

The cost of furniture will vary depending on layout, specification and location.
The adjacent tables can be used to generate a furniture budget by selecting the appropriate furniture base cost for the desired layout and specification. The corresponding percentage for installation, logistics and import tax should be added to this base cost for the locations in question.
COUNTRY INSTALL (%) LOGISTICS (%) IMPORT TAX (%) TIME (WEEKS)
Angola varies varies varies varies
Austria 8% 2% 0% 5
Belgium 6% 4% 0% 5
Botswana 9% 30% 20% 14
Bulgaria 8% 6% 0% 5
Croatia 7% 8% 0% 6
Czech Republic 6% 5% 0% 7
Denmark 8% 8% 0% 5
Egypt 8% 24% 60% 12
Estonia 6% 9% 0% 6
Ethiopia 9% 30% 30% 14
Finland 8% 12% 0% 6
France 6% 4% 0% 14
Germany 6% 2% 0% 5
Ghana 9% 24% 20% 12
Greece 8% 16% 0% 6
Hungary 6% 9% 0% 6
Ireland 6% 6% 0% 6
Israel 8% 20% 12% 8
Italy 8% 6% 0% 5
Ivory Coast 9% 24% 20% 14
Kazakhstan 7% 24% 15% 9
Kenya 9% 30% 25% 12
Kuwait 9% 20% 5% 12
Latvia 6% 9% 0% 6
Lebanon 9% 20% 50% 8
COUNTRY INSTALL (%) LOGISTICS (%) IMPORT TAX (%) TIME (WEEKS)
Lithuania 6% 9% 0% 6
Luxembourg 6% 4% 0% 5
Morocco 15% 15% 25% 8
Netherlands 6% 4% 0% 5
Nigeria varies varies varies varies
Norway 8% 12% 0% 6
Oman 8% 20% 5% 12
Poland 6% 9% 0% 5
Portugal 6% 4% 0% 5
Qatar 7% 20% 5% 11
Romania 7% 10% 0% 5
Russia 6% 14% 25% 8
Saudi Arabia 8% 20% 20% 12
Serbia 8% 14% 20% 6
Slovakia 6% 9% 0% 7
South Africa 8% 21% 20% 12
Spain 6% 8% 0% 5
Sweden 8% 10% 0% 6
Switzerland 8% 8% 0% 5
Turkey 8% 12% 7% 6
UAE 7% 20% 5% 11
Uganda 9% 30% 25% 14
UK 6% 6% 0% 6
Ukraine 8% 12% 0% 8
Zambia 9% 30% 25% 14
FURNITURE BENCHMARK COSTS
Low Specification (€ / sq m) Medium Specification (€ / sq m) High Specification (€ / sq m)
Traditional 90 115 165
Agile 140 165 210
EMEA FIT-OUT COST GUIDE CBRE PROJECT MANAGEMENT 2221
As we move from traditional to agile workspaces, the tools to communicate, design and manage change become more developed. We see a greater focus on wellness. This is not exclusive to either agile or traditional spaces, which can be equally successful depending on the culture, processes, furnishings, technology and activities of a team using the space.
Stress, chronic health conditions and working in 'sick buildings' are a large contributory factor for companies to develop wellness programmes. Historically the focus of these has been physical health; meanwhile, stress is a clear driver behind chronic illness. Well-being must come before wellness to get to the root of the problem: the source of employee stress can be the very structure and culture of the workplace.
Most companies overall expenditure is significantly larger than their investments in real estate and workplace buildings; however, building and furniture is gaining attention because of the impact it (along with other factors) can have in reducing stress and chronic illness, contributing to the bottom line.
Researchers behind the The Healthy Workplace Nudge: How Healthy People, Culture and Buildings Lead to High Performance discovered
that a human approach is more effective for fostering well-being and employee health. The new view is that leaders who value their employees humanise the workplace.
To understand how workplace design contributes to employee well-being, researchers borrowed the concept of the 'nudge' from behavioural economics. Specific cues within the workspace can 'nudge' people into healthier behaviours. These rely on furniture, alongside architecture and space elements, that promote healthier choices for employees.
MOVEPhysical environments play a vital role in nudging people to move. Elements like highly visible stairs, height-adjustable tables, and shared storage all promote regular movement. Workspaces that nudge people to move enhance well-being, as humans are designed to move.
FOCUSWhile we need to work together to achieve great things, we also need time to ourselves. Creating intelligent workspaces nudges people to focus by making it easy for them to:
• Find the best place to do their work without distractions
• Find their way around with a minimum of main path intersections
• View what’s outside to give their eyes and minds a break
• Locate respite areas for quiet reflection and relaxation
CONNECTWe need interaction to thrive. Spaces that allow us to connect (formally and informally) signal to employees the value of working together in a variety of ways. Nudges to increase connection and engagement include:
• Conveniently located small work places that prompt face-to-face interaction without disrupting other employees
• Social and interaction spaces that nudge workers to slow down, seek nourishment, and chat with others
• Department/team area design cues that define an area and increase a sense of group identity – this can foster social cohesion and reduce stress
Harnessing the power of the Workplace Nudge to help people move, focus, and connect makes healthier choices easier for all. In turn, organisations – and their bottom lines – thrive.
MARTIN EVETTSGeneral Manager, UK & Irelandt: +44 (0)7894 255 672e: [email protected]
FURNITURE

An estimate of professional fees can be calculated based on a percentage of capital costs for appointments.
On a typical project of this size and complexity the expected professional fees include architectural design, M&E services design, project management, cost management and others (including acoustician, building control and planning). These services will provide design, consultancy and management required to deliver a project from inception through to project closeout.
The adjacent fees are typical for a CAT B fit-out project of 1,000 sq m.
Please note that these fees can vary depending on project specifics, complexity, procurement route, size and scope of
appointment. The fees specified in this table exclude brokerage fees,
client insurances, legal fees and transaction management.
COUNTRY FEES (% OF PROJECT COSTS)
Angola 22%
Austria 18%
Belgium 15%
Botswana 19%
Bulgaria 15%
Croatia 18%
Czech Republic 18%
Denmark 24%
Egypt 15%
Estonia 13%
Ethiopia 17%
Finland 16%
France 18%
Germany 23%
Ghana 20%
Greece 18%
Hungary 13%
Ireland 13%
Israel 14%
Italy 14%
Ivory Coast 21%
Kazakhstan 17%
Kenya 20%
Kuwait 18%
Latvia 13%
Lebanon 17%
COUNTRY FEES (% OF PROJECT COSTS)
Lithuania 13%
Luxembourg 22%
Morocco 14%
Netherlands 17%
Nigeria 22%
Norway 19%
Oman 18%
Poland 14%
Portugal 19%
Qatar 19%
Romania 17%
Russia 12%
Saudi Arabia 17%
Serbia 18%
Slovakia 15%
South Africa 18%
Spain 18%
Sweden 16%
Switzerland 24%
Turkey 16%
UAE 19%
Uganda 20%
UK 15%
Ukraine 16%
Zambia 19%
CBRE Madrid Office CBRE PROJECT MANAGEMENT 2423 EMEA FIT-OUT COST GUIDE
PROFESSIONAL FEES
A matrix to assist clients to build their own budget using the cost data provided in this guide can be found on page 42.

TYPE OF MOVE SAME FLOOR (€ PER PERSON)
BETWEEN FLOORS* (€ PER PERSON)
BETWEEN BUILDINGS** (€ PER PERSON)
Crate only (personal effects) € 25 € 29 € 35
Crate plus desk move € 41 € 50 € 82
Crate plus desk and desktop IT move € 55 € 72 € 143
EMEA FIT-OUT COST GUIDE25 26CBRE PROJECT MANAGEMENT
BUSINESS TRANSITION & MOVE MANAGEMENT
Move management and physical relocation is an integral part of a CAT B project and takes place either during or upon completion of the fit-out works. Moves have the potential to disrupt business continuity, which can impact productivity.
Careful organisation and sequence planning is essential to minimise disruption. This usually involves a move consultant working with a range of client department representatives to identify the current set-up to plan for and accommodate activities critical for business continuity and accurate movement of employees, furniture and equipment.
The move consultant is responsible for all aspects of change management and implements a comprehensive communications plan at all levels to ensure everyone affected is kept up to date with proposals and has input into the project, ensuring that where possible their needs are met.
They also work with a client-specified physical move provider, or leverage CBRE’s preferred supplier list, acting as principal to command preferential rates.
CBRE’s Business Transition and Move Management service is available globally, with teams sharing best practice across regions, including banking/finance, technology, retail, pharmaceutical, industrial and legal. Using the latest technology, we maintain up-to-date client space allocation data at all times, and our workplace specialists work with clients on accommodation and workplace strategies to optimise space utilisation, ensuring best value throughout the project and a successful outcome.
Beyond business transition, clients often require clearing or disposal of redundant furniture and fittings. Our accreditation to BS EN ISO 14001 provides an environmental management system that allows us to manage the entire clearance process on their behalf. We seek to re-use, re-purpose, donate or environmentally dispose of surplus furniture and effects, taking full legal responsibility and promoting client corporate social responsibility.
* Within the same building with full use of a lift/elevator** New location within 10 miles of original building
CBRE Wuhan Office

Lease reinstatement (also known as ‘dilapidations’) is the process whereby tenants are obliged to restore the space to a pre-agreed state at the end of the term.
A tenant’s liability is defined by the terms of the individual lease and the nature of local property markets. In some countries where the landlord provides the fit-out, they will take on most obligations to repair it, reflecting the cost in the rent. In others, the tenant is responsible for reversing any alterations that they have made.
The lease defines the tenant’s reinstatement liability. However, a landlord may or may not enforce the terms of the lease and instead decide to accept a financial settlement. In some locations it is not the culture to pursue potential claims. As a result, leases and responsibilities are rarely alike and generalising is difficult. It is therefore important to review each case individually and note that these figures will not reflect every situation. Here, the likely nature of the lease reinstatement obligations has been assessed and the typical cost of completing works to comply with the tenant’s responsibilities has been calculated, assuming moderate wear based on a 1,000 sq m office.
COUNTRY CITY RATE (€ / SQ M)
TYPICAL REINSTATEMENT COST (€) LEASE LIABILITY ASSUMPTION
Angola Luanda € 7 € 7,000 Re-decoration and clearing of space
Austria Vienna € 120 € 120,000 Full removal of fit-out
Belgium Brussels € 175 € 175,000 Full removal of fit-out and repair
Botswana Gaborone € 110 € 110,000 Full removal of fit-out
Croatia Zagreb € 7 € 7,000 Re-decoration and clearing of space
Czech Republic Prague € 7 € 7,000 Re-decoration and clearing of space
Denmark Copenhagen € 200 € 200,000 Full removal of fit-out
Egypt Cairo € 9 € 9,000 Re-decoration and clearing of space
Ethiopia Addis Ababa € 125 € 125,000 Full removal of fit-out
Finland Helsinki € 18 € 18,000 Re-decoration and clearing of space
France Paris € 185 € 185,000 Full removal of fit-out and repair
Germany Berlin € 120 € 120,000 Full removal of fit-out and repair
Germany Frankfurt € 130 € 130,000 Full removal of fit-out and repair
Germany Hamburg € 120 € 120,000 Full removal of fit-out and repair
Germany Munich € 135 € 135,000 Full removal of fit-out and repair
Germany Stuttgart € 130 € 130,000 Full removal of fit-out and repair
Ghana Accra € 8 € 8,000 Re-decoration and clearing of space
Greece Athens € 80 € 80,000 Full removal of fit-out
Hungary Budapest € 80 € 80,000 Full removal of fit-out
Ireland Dublin € 175 € 175,000 Full removal of fit-out and repair
Israel Tel Aviv € 10 € 10,000 Re-decoration and clearing of space
Italy Milan € 175 € 175,000 Full removal of fit-out and repair
Italy Rome € 175 € 175,000 Full removal of fit-out and repair
Ivory Coast Abidjan € 140 € 140,000 Full removal of fit-out
Kazakhstan Astana € 10 € 10,000 Clear space only
Kenya Nairobi € 140 € 140,000 Full removal of fit-out and repair
Kuwait Kuwait City € 190 € 190,000 Full removal of fit-out
Luxembourg Luxembourg € 190 € 190,000 Full removal of fit-out and repair
Morocco Casablanca € 55 € 55,000 Full removal of fit-out
COUNTRY CITY RATE (€ / SQ M)
TYPICAL REINSTATEMENT COST (€) LEASE LIABILITY ASSUMPTION
Netherlands Amsterdam € 12 € 12,000 Re-decoration and clearing of space
Nigeria Abuja € 140 € 140,000 Full removal of fit-out
Norway Oslo € 18 € 18,000 Re-decoration and clearing of space
Oman Muscat € 175 € 175,000 Full removal of fit-out
Poland Warsaw € 35 € 35,000 Re-decoration and clearing of space
Portugal Lisbon € 95 € 95,000 Full removal of fit-out
Qatar Doha € 210 € 210,000 Full removal of fit-out and repair
Romania Bucharest € 90 € 90,000 Full removal of fit-out
Russia Moscow € 75 € 75,000 Re-decoration and recarpeting
Saudi Arabia Riyadh € 175 € 175,000 Partial removal of fit-out (often negotiated)
Serbia Belgrade € 160 € 160,000 Full removal of fit-out and repair
Slovakia Bratislava € 95 € 95,000 Full removal of fit-out and repair
South Africa Cape Town € 80 € 80,000 Full removal of fit-out
South Africa Johannesburg € 80 € 80,000 Full removal of fit-out
Spain Barcelona € 110 € 110,000 Full removal of fit-out
Spain Madrid € 110 € 110,000 Full removal of fit-out
Sweden Stockholm € 18 € 18,000 Re-decoration and clearing of space
Switzerland Geneva € 170 € 170,000 Full removal of fit-out and repair
Switzerland Zurich € 170 € 170,000 Full removal of fit-out and repair
Turkey Istanbul € 14 € 14,000 Re-decoration and clearing of space
UAE Abu Dhabi € 200 € 200,000 Full removal of fit-out
UAE Dubai € 200 € 200,000 Full removal of fit-out
Uganda Kampala € 135 € 135,000 Full removal of fit-out
UK Aberdeen € 175 € 175,000 Full removal of fit-out and repair
UK Belfast € 170 € 170,000 Full removal of fit-out and repair
UK Glasgow € 180 € 180,000 Full removal of fit-out and repair
UK London € 230 € 230,000 Full removal of fit-out and repair
UK Manchester € 180 € 180,000 Full removal of fit-out and repair
Zambia Lusaka € 135 € 135,000 Full removal of fit-out
EMEA FIT-OUT COST GUIDE CBRE PROJECT MANAGEMENT 2827
REINSTATEMENT
KEY ASSUMPTIONS
1. All tenant chattels (furniture, AV, IT and security, etc.) are removed by the tenant and the cost of removal is therefore excluded from the rates.
2. Where stated all tenant fit-out and alterations are to be removed and none are retained by the landlord as improvements.
3. No allowance is made for loss of rent, non-recoverable VAT or professional fees not directly related to the reinstatement costs.
4. Base date for prices and exchange rates is August 2018.
5. All works will be undertaken as a single contract and within normal working hours.
6. General wear and tear rather than major disrepair will be present to the floor.
7. Tenants are on internal repairing leases and therefore only have a responsibility within their demise which does not extend to any elements of the common parts (structure, frame, sanitary accommodation, windows, central M&E plant).
8. The space was provided on a standard UK CAT A basis with suspended ceilings, raised access floor and carpet.
9. No structural reinstatement works are needed.
NOTE
In some emerging markets lease reinstatement is in its infancy. Consequently, it is not possible to draw conclusions for the reinstatement estimates for countries not listed on this schedule.
WEEKS
WEEKS0 5 10 15 20 25 30 35 40 45
0 5 10 15 20 25 30 35 40 45
Traditional/Design & BuildTraditionalIreland
UK
UK & IRELAND
Design & Build
Design & BuildTraditional
Design & Build
Traditional
Construction Management
Design & Build
AustriaBelgium
FranceGermany
LuxembourgNetherlandsSwitzerland
WESTERN EUROPE
Traditional/Design & Build
TraditionalTraditional
TraditionalTraditional
TraditionalTraditionalTraditional
Construction Management
Design & Build
Design & Build
TraditionalDesign & BuildDesign & Build
BulgariaCroatia
Czech RepublicEstonia
HungaryKazakhstan
LatviaLithuania
PolandRomania
RussiaSerbia
SlovakiaUkraine
CENTRAL & EASTERN EUROPE
Construction ManagementTraditionalDesign & BuildDesign & Build
DenmarkFinlandNorwaySweden
NORDICS
TraditionalDesign & Build
PortugalSpain
TraditionalTurkey
TraditionalTraditionalTraditional
GreeceIsraelItaly
SOUTHERN EUROPE & MEDITERRANEAN
TraditionalTraditionalTraditionalTraditionalDesign & BuildTraditional
KuwaitLebanon
OmanQatar
Saudi ArabiaUAE
MIDDLE EAST
Design & BuildTraditional
Traditional
TraditionalMorocco
South AfricaUgandaZambia
Design & BuildNigeria
TraditionalTraditional
Design & BuildDesign & BuildDesign & BuildDesign & Build
Traditional
AngolaBotswana
EgyptEthiopia
GhanaIvory Coast
Kenya
AFRICA
TYPICAL PROCUREMENT ROUTE AND PROGRAMMECOUNTRY PROCUREMENT ROUTE PROGRAMME
Inception
Design
Tender
Construction
Handover
EMEA FIT-OUT COST GUIDE29
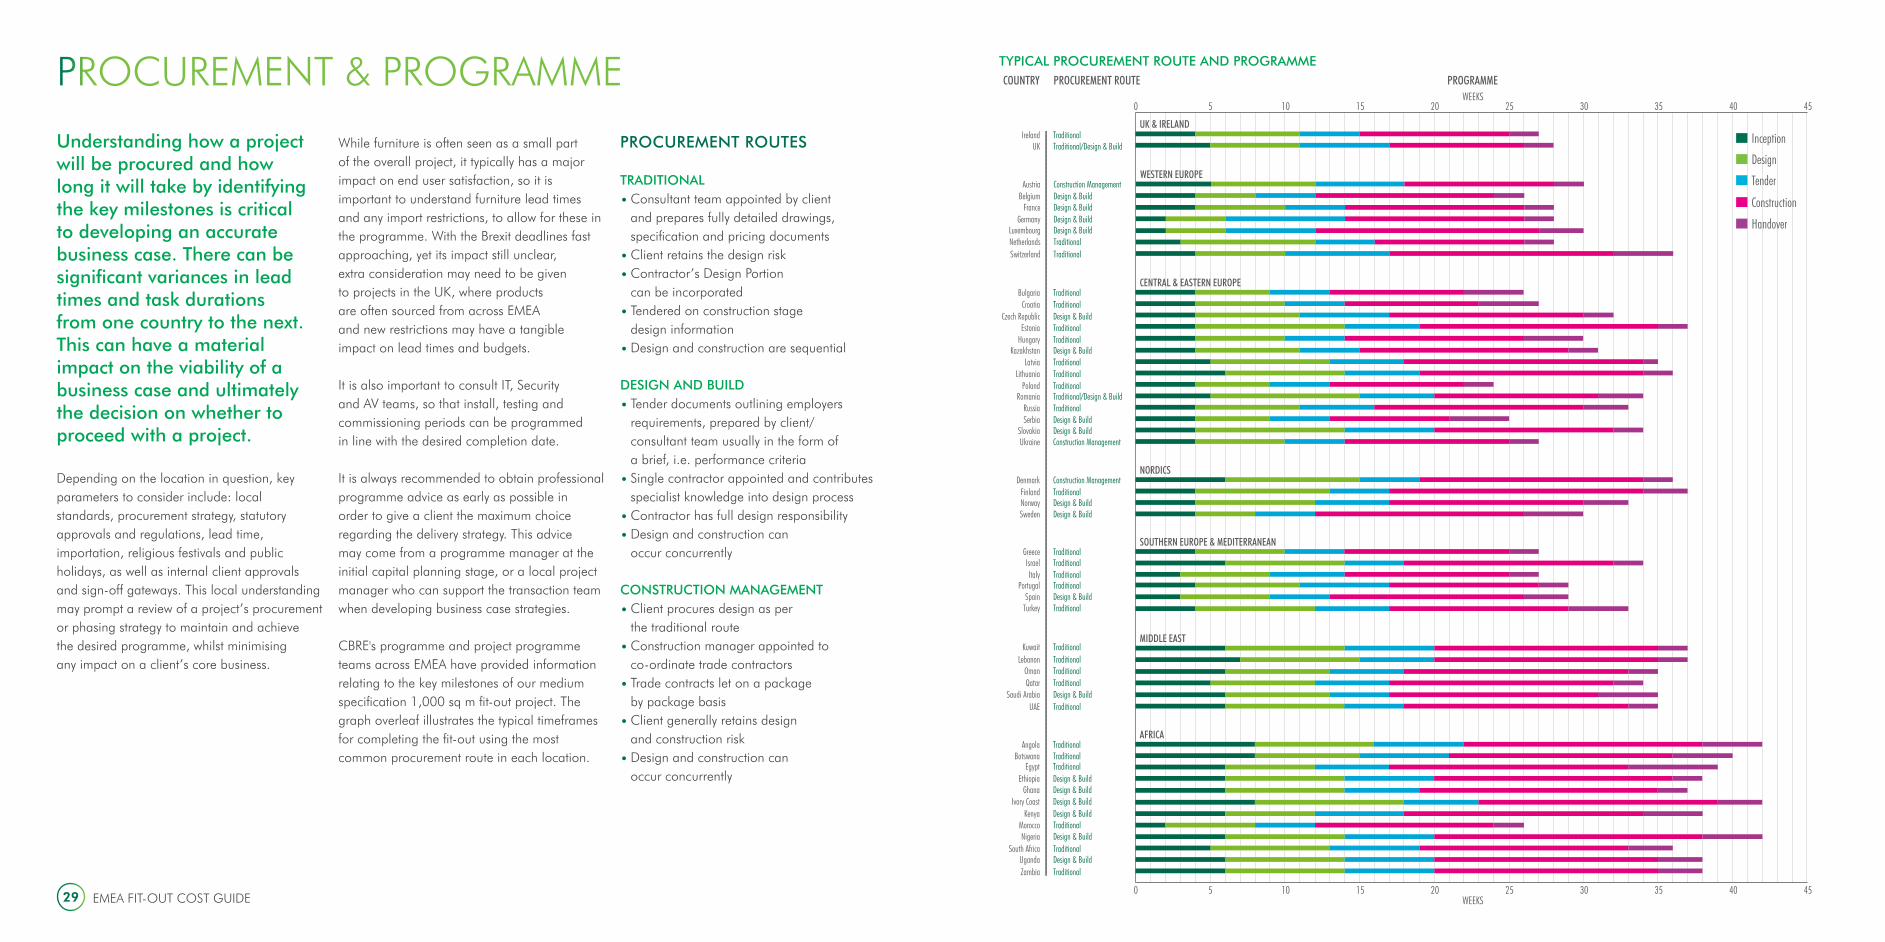
PROCUREMENT & PROGRAMME
Understanding how a project will be procured and how long it will take by identifying the key milestones is critical to developing an accurate business case. There can be significant variances in lead times and task durations from one country to the next. This can have a material impact on the viability of a business case and ultimately the decision on whether to proceed with a project.
Depending on the location in question, key parameters to consider include: localstandards, procurement strategy, statutory approvals and regulations, lead time, importation, religious festivals and public holidays, as well as internal client approvals and sign-off gateways. This local understanding may prompt a review of a project’s procurement or phasing strategy to maintain and achieve the desired programme, whilst minimising any impact on a client’s core business.
While furniture is often seen as a small part of the overall project, it typically has a major impact on end user satisfaction, so it is important to understand furniture lead times and any import restrictions, to allow for these in the programme. With the Brexit deadlines fast approaching, yet its impact still unclear, extra consideration may need to be given to projects in the UK, where products are often sourced from across EMEA and new restrictions may have a tangible impact on lead times and budgets.
It is also important to consult IT, Security and AV teams, so that install, testing and commissioning periods can be programmed in line with the desired completion date.
It is always recommended to obtain professional programme advice as early as possible in order to give a client the maximum choice regarding the delivery strategy. This advice may come from a programme manager at the initial capital planning stage, or a local project manager who can support the transaction team when developing business case strategies.
CBRE's programme and project programme teams across EMEA have provided information relating to the key milestones of our medium specification 1,000 sq m fit-out project. The graph overleaf illustrates the typical timeframes for completing the fit-out using the most common procurement route in each location.
PROCUREMENT ROUTES
TRADITIONAL
• Consultant team appointed by client and prepares fully detailed drawings, specification and pricing documents
• Client retains the design risk
• Contractor’s Design Portion can be incorporated
• Tendered on construction stage design information
• Design and construction are sequential
DESIGN AND BUILD
• Tender documents outlining employers requirements, prepared by client/consultant team usually in the form of a brief, i.e. performance criteria
• Single contractor appointed and contributes specialist knowledge into design process
• Contractor has full design responsibility
• Design and construction can occur concurrently
CONSTRUCTION MANAGEMENT
• Client procures design as per the traditional route
• Construction manager appointed to co-ordinate trade contractors
• Trade contracts let on a package by package basis
• Client generally retains design and construction risk
• Design and construction can occur concurrently

CBRE Milan OfficeEMEA FIT-OUT COST GUIDE31 32CBRE PROJECT MANAGEMENT
CAPITAL PLANNING
Real estate is a significant cost for any business. If running costs and real estate assets are managed effectively, then real estate departments can make a positive impact towards achieving overall organisational objectives.
Real estate decisions are often based on triggers, which may include lease dates, user requirements, maintenance, regulatory requirements, departmental adjacencies and headcount changes. Often projects are initiated to solve short-term objectives, without consideration for how individual investment may impact on the organisation’s wider portfolio.
Taking a long-term view to optimise and improve real estate assets can save organisations significant costs and ensure buildings are serving them in the best way possible, now and in the future.
Capital planning is the holistic process associated with managing an organisation’s capital investment in their real estate portfolio. It starts long before the start of any single project and is regularly reviewed and revised. By following this process, organisations can target the optimal condition of their assets and create an action plan which pinpoints where investment is required, estimate costs and timeframes. The main output is an optimised pipeline of projects which are prioritised according to company objectives and strategies.
Effective capital planning can provide a competitive advantage by enabling an organisation to gain a better understanding of its property portfolio, overarching strategy, and associated P&L impact. This business information enables better decision making, resulting in improved outcomes.
The capital planning process, illustrated opposite, allows an organisation to strategically align real estate initiatives with company goals and contribute to overall success. By aligning on the overarching portfolio strategy for a planned pipeline of projects, departments can better share information, and collaboration between real estate teams and the wider organisation is significantly improved.
CBRE provides capital planning expertise to clients across the globe. Our highly experienced team combines surveying experience and strategic understanding to develop a pipeline of projects which is aligned with client needs. As part of this process, CBRE can provide cashflow and depreciation forecasts to create rationalised capital plans that enhance forecasting accuracy and spend efficiency.
Maintain Relationships
& RepeatCommunication
ResultsStrategic Planning
Project Pipeline
Scope, Programme & Priority
Analysis & ReviewBudgets
Cashflow Forecast &
Depreciation
Continue to maintain the relationships between the real estate department and business groups. The plan should be fluid and have the ability to be amended as business needs change, and then period-ically updated in a rolling capital plan.
Good communication between real estate department and internal business groups is key. Strong relationships provide greater visibility and enable quick decision making.
Real estate performance can be measured in many ways. Success may vary depending upon short or long-term goals, which may include improved employee experience, reduced cost per head, and reduced P&L impact.
Bottom up and top down discussion should inform capital plans. Bottom up includes internal alignment of departmental and end user requirements. Top down looks to understand how the current portfolio is utilised, and how optimal this is.
This consolidated list of investments forms a pipeline of projects, and is reviewed and signed-off by senior leadership. If amendments are required to projects, then the previous stages can be repeated as necessary.
For each investment opportunity, the scope, programme and key require-ments are established. Where these are unknown or unclear, assumptions are made for the most likely scenario.
An aggregated view of potential real estate initiatives showing scope, budget, priority, programme, cash-flow and depreciation impact can be reviewed, revised and optimised.
Budgets for each potential investment are estimated. This is usually completed using historic client information, benchmarks or by consulting a cost expert.
Using the estimated budget and pro-gramme assumptions, the spending profile of each investment can be modelled and the corresponding P&L impact can be assessed.
CAPITAL PLANNING PROCESSThe capital planning process can be split into nine stages.
COUNTRYESTIMATED
QUALIFYING PERCENTAGE
YEAR 1 (€)
YEARS 2-5 (€)
YEARS 6-10 (€)
YEARS 11+ (€)
TOTAL TAXSAVED (€)
Austria 95% 18,000 71,000 89,000 416,000 594,000
Belgium 65% 57,000 229,000 33,000 153,000 472,000
Bulgaria 90% 58,000 97,000 15,000 55,000 225,000
Croatia 85% 84,000 174,000 56,000 68,000 382,000
Czech Republic 80% 49,000 132,000 86,000 114,000 381,000
Denmark 70% 62,000 191,000 33,000 99,000 385,000
Finland 70% 75,000 155,000 30,000 90,000 350,000
France 95% 92,000 179,000 161,000 280,000 712,000
Germany 95% 170,000 179,000 161,000 203,000 713,000
Hungary 90% 61,000 80,000 7,000 54,000 202,000
Ireland 71% 17,000 67,000 50,000 - 134,000
Italy 80% 61,000 246,000 50,000 126,000 483,000
Luxembourg 65% 46,000 183,000 69,000 125,000 423,000
Norway 85% 64,000 212,000 104,000 109,000 489,000
Poland 80% 24,000 98,000 122,000 135,000 379,000
Portugal 85% 54,000 181,000 85,000 126,000 446,000
Romania 60% 11,000 46,000 57,000 126,000 240,000
Saudi Arabia 85% 76,000 236,000 38,000 76,000 426,000
South Africa 90% 80,000 321,000 122,000 107,000 630,000
Spain 85% 57,000 196,000 128,000 150,000 531,000
Sweden 70% 94,000 155,000 29,000 107,000 385,000
Switzerland 95% 49,000 198,000 73,000 109,000 429,000
UAE* 80% 62,000 181,000 68,000 90,000 401,000
UK 74% 62,000 133,000 82,000 75,000 352,000
Ukraine 80% 52,000 207,000 34,000 68,000 361,000
*Applies only to ‘oil and gas’ producing companies and ‘foreign banks’ who have agreed corporate tax rates within specific tax decrees or with the rulers of the Emirate State in which they operate.
EMEA FIT-OUT COST GUIDE CBRE PROJECT MANAGEMENT 3433
CONSTRUCTION SERVICES TAX DEPRECIATION
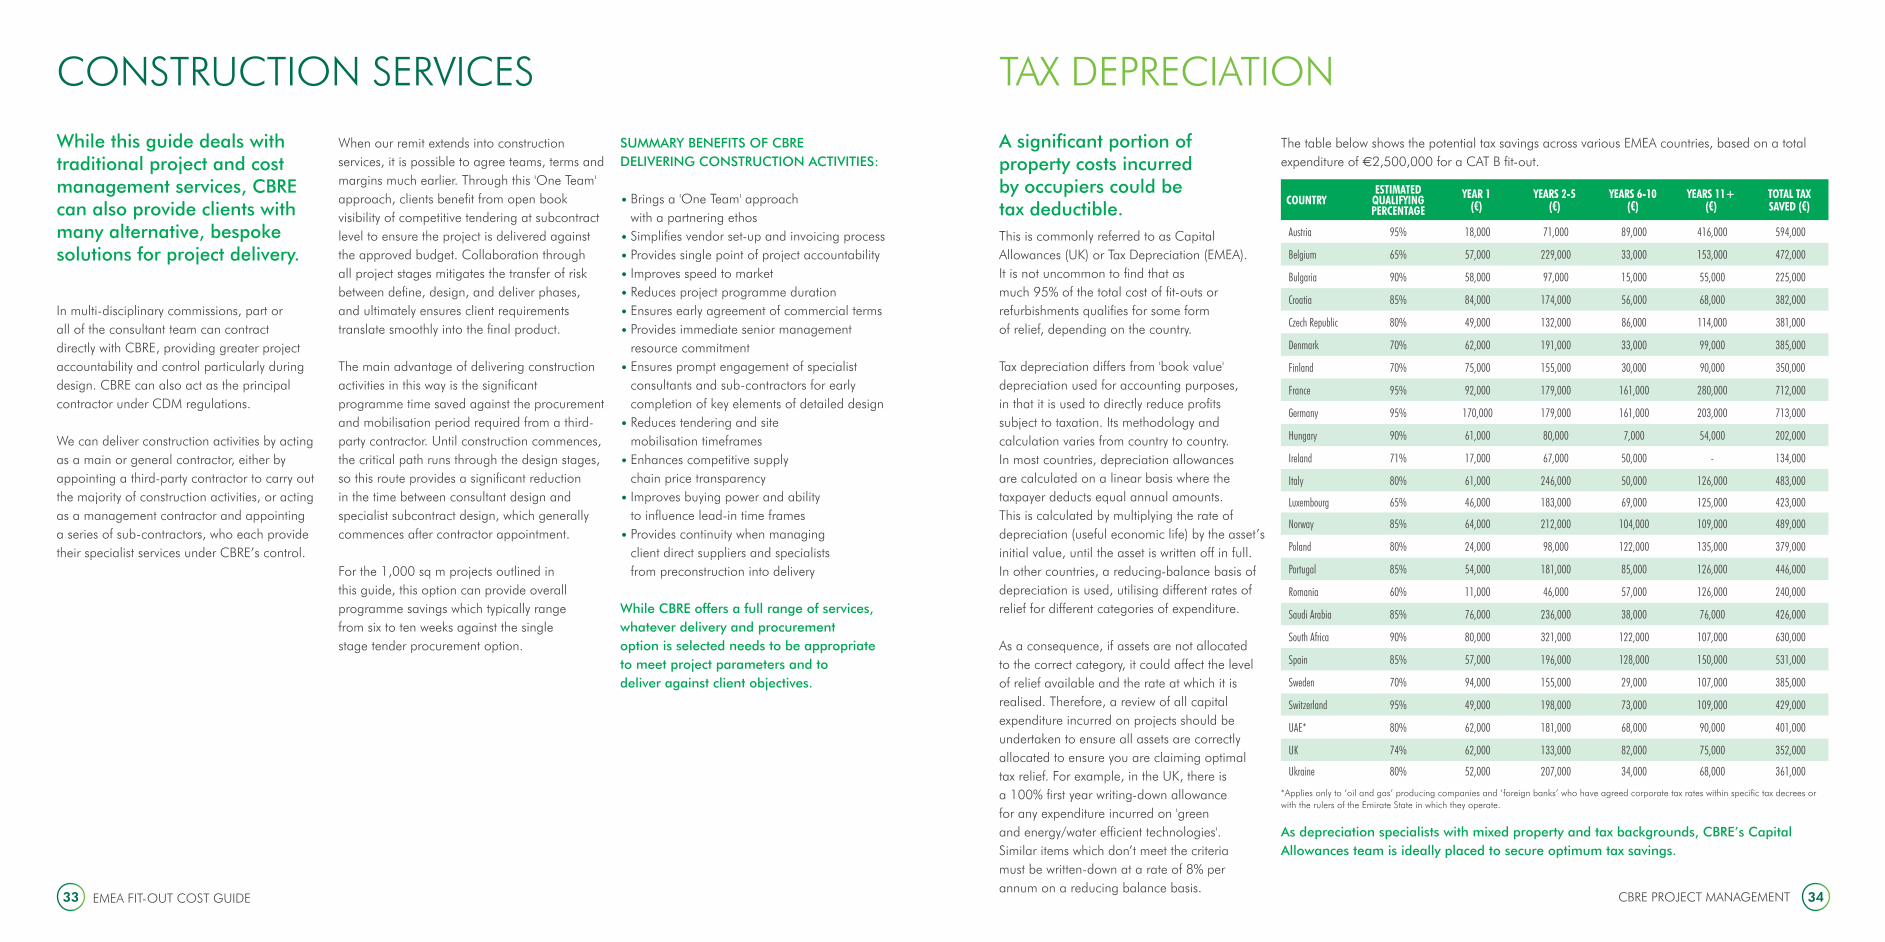
While this guide deals with traditional project and cost management services, CBRE can also provide clients with many alternative, bespoke solutions for project delivery.
In multi-disciplinary commissions, part or all of the consultant team can contract directly with CBRE, providing greater project accountability and control particularly during design. CBRE can also act as the principal contractor under CDM regulations.
We can deliver construction activities by acting as a main or general contractor, either by appointing a third-party contractor to carry out the majority of construction activities, or acting as a management contractor and appointing a series of sub-contractors, who each provide their specialist services under CBRE’s control.
When our remit extends into construction services, it is possible to agree teams, terms and margins much earlier. Through this 'One Team' approach, clients benefit from open book visibility of competitive tendering at subcontract level to ensure the project is delivered against the approved budget. Collaboration through all project stages mitigates the transfer of risk between define, design, and deliver phases, and ultimately ensures client requirements translate smoothly into the final product.
The main advantage of delivering construction activities in this way is the significant programme time saved against the procurement and mobilisation period required from a third-party contractor. Until construction commences, the critical path runs through the design stages, so this route provides a significant reduction in the time between consultant design and specialist subcontract design, which generally commences after contractor appointment.
For the 1,000 sq m projects outlined in this guide, this option can provide overall programme savings which typically range from six to ten weeks against the single stage tender procurement option.
SUMMARY BENEFITS OF CBRE DELIVERING CONSTRUCTION ACTIVITIES:
• Brings a 'One Team' approach with a partnering ethos
• Simplifies vendor set-up and invoicing process
• Provides single point of project accountability
• Improves speed to market
• Reduces project programme duration
• Ensures early agreement of commercial terms
• Provides immediate senior management resource commitment
• Ensures prompt engagement of specialist consultants and sub-contractors for early completion of key elements of detailed design
• Reduces tendering and site mobilisation timeframes
• Enhances competitive supply chain price transparency
• Improves buying power and ability to influence lead-in time frames
• Provides continuity when managing client direct suppliers and specialists from preconstruction into delivery
While CBRE offers a full range of services, whatever delivery and procurement option is selected needs to be appropriate to meet project parameters and to deliver against client objectives.
A significant portion of property costs incurred by occupiers could be tax deductible.This is commonly referred to as Capital Allowances (UK) or Tax Depreciation (EMEA).It is not uncommon to find that as much 95% of the total cost of fit-outs or refurbishments qualifies for some form of relief, depending on the country.
Tax depreciation differs from 'book value' depreciation used for accounting purposes, in that it is used to directly reduce profits subject to taxation. Its methodology and calculation varies from country to country.In most countries, depreciation allowances are calculated on a linear basis where the taxpayer deducts equal annual amounts. This is calculated by multiplying the rate of depreciation (useful economic life) by the asset’s initial value, until the asset is written off in full. In other countries, a reducing-balance basis of depreciation is used, utilising different rates of relief for different categories of expenditure.
As a consequence, if assets are not allocated to the correct category, it could affect the level of relief available and the rate at which it is realised. Therefore, a review of all capital expenditure incurred on projects should be undertaken to ensure all assets are correctly allocated to ensure you are claiming optimal tax relief. For example, in the UK, there is a 100% first year writing-down allowance for any expenditure incurred on 'green and energy/water efficient technologies'. Similar items which don’t meet the criteria must be written-down at a rate of 8% per annum on a reducing balance basis.
The table below shows the potential tax savings across various EMEA countries, based on a total expenditure of €2,500,000 for a CAT B fit-out.
As depreciation specialists with mixed property and tax backgrounds, CBRE’s Capital Allowances team is ideally placed to secure optimum tax savings.
EMEA FIT-OUT COST GUIDE CBRE PROJECT MANAGEMENT 3635
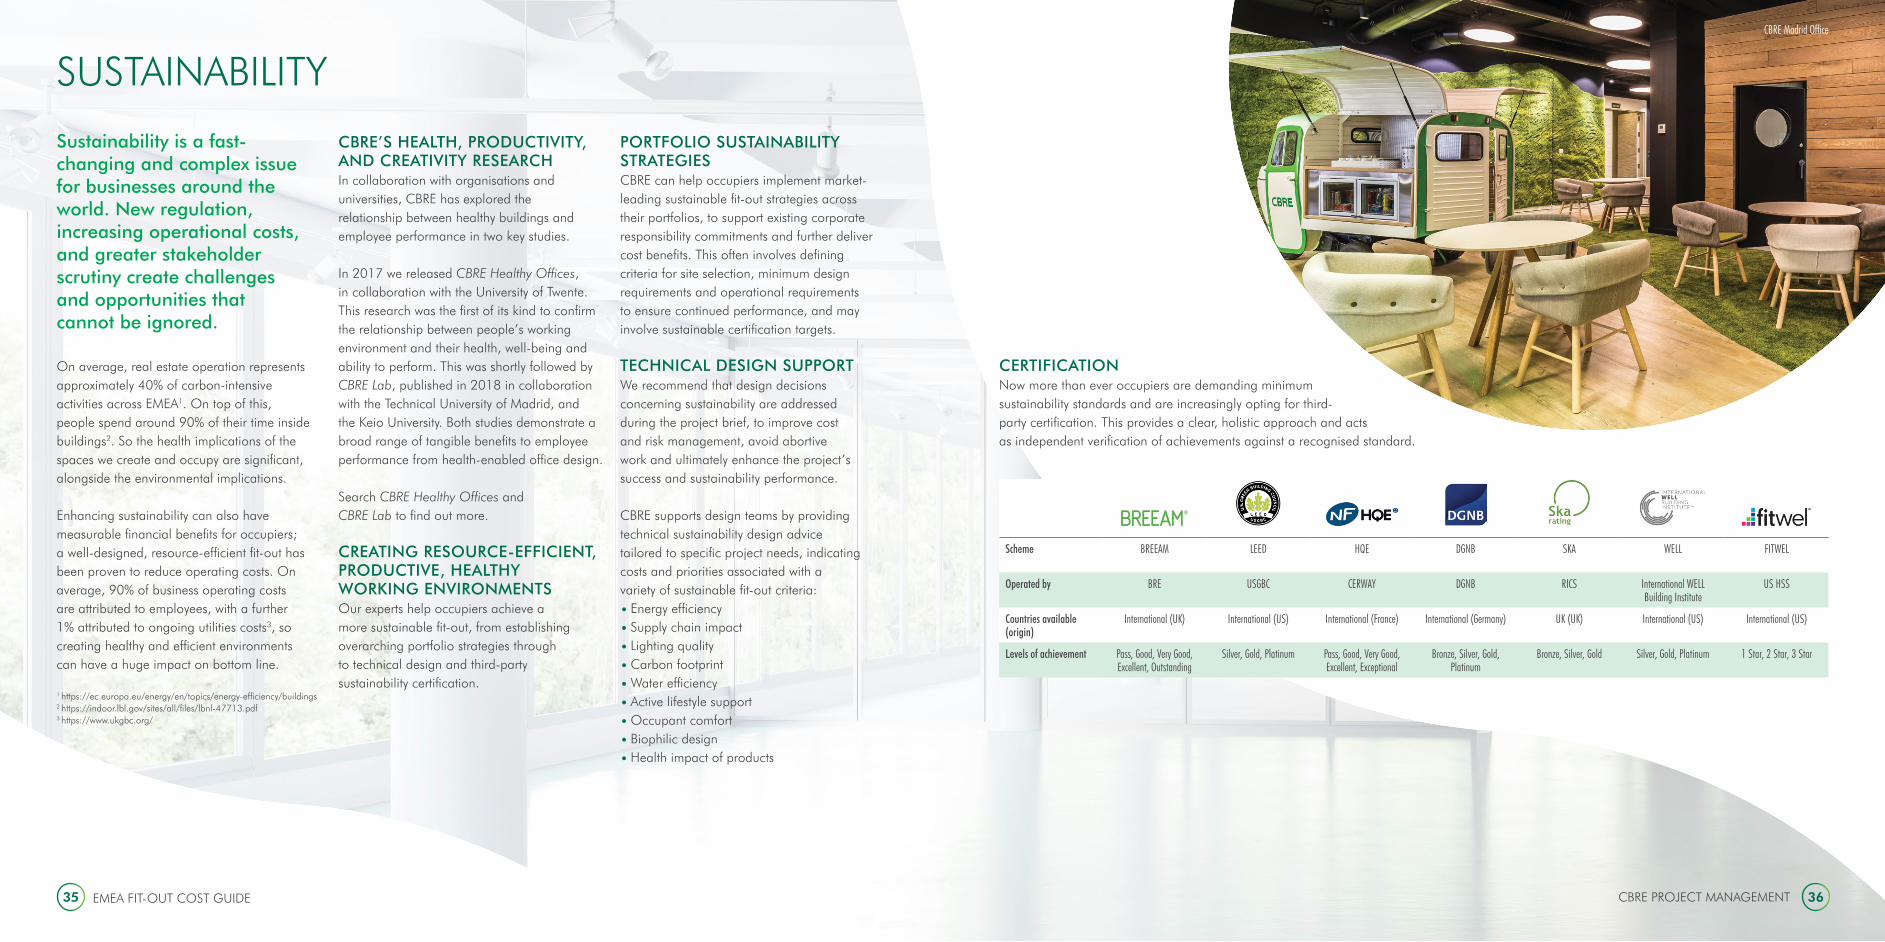
Scheme BREEAM LEED HQE DGNB SKA WELL FITWEL
Operated by BRE USGBC CERWAY DGNB RICS International WELL Building Institute
US HSS
Countries available (origin)
International (UK) International (US) International (France) International (Germany) UK (UK) International (US) International (US)
Levels of achievement Pass, Good, Very Good, Excellent, Outstanding
Silver, Gold, Platinum Pass, Good, Very Good, Excellent, Exceptional
Bronze, Silver, Gold, Platinum
Bronze, Silver, Gold Silver, Gold, Platinum 1 Star, 2 Star, 3 Star
SUSTAINABILITY
Sustainability is a fast-changing and complex issue for businesses around the world. New regulation, increasing operational costs, and greater stakeholder scrutiny create challenges and opportunities that cannot be ignored.
On average, real estate operation represents approximately 40% of carbon-intensive activities across EMEA1. On top of this, people spend around 90% of their time inside buildings2. So the health implications of the spaces we create and occupy are significant, alongside the environmental implications.
Enhancing sustainability can also have measurable financial benefits for occupiers; a well-designed, resource-efficient fit-out has been proven to reduce operating costs. On average, 90% of business operating costs are attributed to employees, with a further 1% attributed to ongoing utilities costs3, so creating healthy and efficient environments can have a huge impact on bottom line.
1 https://ec.europa.eu/energy/en/topics/energy-efficiency/buildings2 https://indoor.lbl.gov/sites/all/files/lbnl-47713.pdf3 https://www.ukgbc.org/
CBRE’S HEALTH, PRODUCTIVITY, AND CREATIVITY RESEARCHIn collaboration with organisations and universities, CBRE has explored the relationship between healthy buildings and employee performance in two key studies.
In 2017 we released CBRE Healthy Offices, in collaboration with the University of Twente. This research was the first of its kind to confirm the relationship between people’s working environment and their health, well-being and ability to perform. This was shortly followed by CBRE Lab, published in 2018 in collaboration with the Technical University of Madrid, and the Keio University. Both studies demonstrate a broad range of tangible benefits to employee performance from health-enabled office design.
Search CBRE Healthy Offices and CBRE Lab to find out more.
CREATING RESOURCE-EFFICIENT, PRODUCTIVE, HEALTHY WORKING ENVIRONMENTSOur experts help occupiers achieve a more sustainable fit-out, from establishing overarching portfolio strategies through to technical design and third-party sustainability certification.
PORTFOLIO SUSTAINABILITY STRATEGIESCBRE can help occupiers implement market-leading sustainable fit-out strategies across their portfolios, to support existing corporate responsibility commitments and further deliver cost benefits. This often involves defining criteria for site selection, minimum design requirements and operational requirements to ensure continued performance, and may involve sustainable certification targets.
TECHNICAL DESIGN SUPPORTWe recommend that design decisions concerning sustainability are addressed during the project brief, to improve cost and risk management, avoid abortive work and ultimately enhance the project’s success and sustainability performance.
CBRE supports design teams by providing technical sustainability design advice tailored to specific project needs, indicating costs and priorities associated with a variety of sustainable fit-out criteria:
• Energy efficiency
• Supply chain impact
• Lighting quality
• Carbon footprint
• Water efficiency
• Active lifestyle support
• Occupant comfort
• Biophilic design
• Health impact of products
CERTIFICATIONNow more than ever occupiers are demanding minimum sustainability standards and are increasingly opting for third-party certification. This provides a clear, holistic approach and acts as independent verification of achievements against a recognised standard.
CBRE Madrid Office

38CBRE PROJECT MANAGEMENT37 EMEA FIT-OUT COST GUIDE
REGIONAL MARKET OUTLOOK
ECONOMIC OUTLOOKThe world economy expanded at its fastest rate for six years in 2017, driven by a coordinated acceleration in almost all developed economies and continued strong growth in emerging Asia. Despite a mild slowdown in Europe, 2018 is expected to see more of the same, but as we approach the end of a long expansionary cycle, a period of weaker growth is in prospect.
This is largely driven by recent, and expected further, tightening in US monetary policy starting to impact the US economy and producing a mild cyclical downturn starting in mid-2019. This has knock-on effects through trade and finance to other parts of the world, which see an upward drift in long-term interest rates and a slowdown in growth in late 2019 and 2020. While we do not anticipate a major financial crash, this period still represents a meaningful slowdown - even assuming some of the accompanying downside risks such as a trade war do not materialise.
A feature of this outlook is that we do not expect interest rates to rise back to the levels that were prevalent before the financial crisis, but rather a cyclical rise associated with rising inflationary pressure particularly in the USA. Once economies begin to slow, we expect monetary authorities to have the scope to lower interest rates to something closer to the levels that have prevailed over the past five years. This lays the ground for economies to start building recovery momentum by 2021. So all in all, a relatively mild end to this cycle but with various risks that could accentuate the short-term slowdown.
Europe itself presents a mixed picture, with some substantial differences between the major economies both in terms of the current cyclical position and medium-term outlook. The economy of the EU-28 as a whole expanded by 0.4% in the second quarter of this year, a slight slowdown from the growth rates recorded through 2017. Nevertheless, the annual rate of growth, 2.2%, is still indicative of a reasonable rate of expansion. Among the larger economies, Spain, Sweden and the Netherlands are seeing growth above this level, as are several other CEE markets, notably Poland. At the other end of the spectrum, Italy and the UK are seeing weaker, and in the former case deteriorating, growth.
This period of growth has so far been achieved with only moderate increases in price inflation. Across the EU, inflation has been ticking up slightly in the early part of 2018, but still only to 2.2% as of July, and fuelled mainly by services and energy. Price inflation is higher in the UK, France and Spain, and lower in the Netherlands, Italy and Ireland. While there are some short-term indications of rising price pressures, overall we expect inflation to remain broadly subdued, and associated with 10-year bond yields settling at around 3% in the very long run, rather than the 5% level that was more typical before the financial crisis.
Looking at future growth prospects, there are big differences within the Continental European outlook with Spain and Ireland forecast to grow at an average annual rate of around 2.2% while the rest of the Eurozone at a more sedate
1.4%. Central Europe and Sweden are also expected to outperform. The UK by contrast, having outgrown much of the rest of Europe in early stages of the recovery, has entered a period of slower growth partly associated with uncertainty arising from the EU referendum. It has seen sub-2% growth for each of the past two years, with further deterioration in the growth rate expected over the short term. While there is considerable uncertainty surrounding the outcome of Brexit negotiations, we expect corporate and consumer confidence to improve once the future is clearer, leading to a reasonably strong cyclical recovery.
Outside Europe, many markets in sub-Saharan Africa will continue to see strong economic and population growth associated with diversification away from primary industries and commodities. Inflation remains high relative to European levels, but generally expected to trend downwards. One risk concerns the possibility of debt-servicing problems in the event of a sharp rise in US interest rates, given the accumulation of dollar-denominated debt in some countries. In the Middle East a period of more stable oil prices, and associated growth in public and investment spending, should benefit some economies.
OFFICE MARKET OVERVIEWRENTSThe CBRE EMEA office rent index rose by 3.5% in the year to Q2 2018. Indeed, the index has had sustained growth of over 3.5% per annum over the past four quarters compared with 2.5-3% per annum over the previous two years. This indicates that demand stemming from late-cycle economic growth continues to push rents upwards.
Again, market conditions vary widely. Several have seen rental growth of over 10% over the past year, including Oslo, Stockholm, Glasgow, Bristol and St Petersburg. Berlin is also in this group, and indeed German markets generally are performing well with Munich and Hamburg also seeing positive real growth.
The major markets in Spain and Italy have seen growth of 5%+ over the past year, with Dublin and Paris not far behind. At the other end of the spectrum Dubai and Abu Dhabi have posted steep falls, with Vienna and the City of London seeing more moderate declines.
CEE is something of a mixed picture. Several markets, including Warsaw and Moscow, are static due to high levels of vacancy counteracting strong demand growth; while others such as Prague and Budapest are starting to see upward pressure.
OFFICE MARKET DYNAMICSThe demand side of the market remains strong in many cities, with leasing activity maintaining recent levels and even accelerating in some places. In aggregate terms, take-up across the main EMEA markets reached around 3.8 million sq m in the second quarter, 10% up on the same quarter in 2017. Taking the first half of the year as a whole, leasing levels are over 8% up on the first half of last year.
The figures are somewhat stronger than this in CEE, mainly due to robust take-up in Moscow (up 30% vs Q2 2017) and Warsaw (14%) with Bucharest and Belgrade also performing well. Most of the larger Western European markets are also up, including London (up 3.8% vs Q2 2017), Paris (27%), Munich (53%), Milan (14%) and Vienna (18%).
Supply levels across the region have generally continued to fall, now standing at around 8%. Cities in which vacancy rates have tightened by over a percentage point in the past year include Warsaw, Madrid, Frankfurt, Amsterdam, Berlin and St Petersburg. Cities with mid-year vacancy rates below 5% include Berlin, Munich, London and Vienna while a number of cities have vacancy rates approaching or above 10% including Frankfurt, Madrid, Warsaw and Milan.
In some of these markets high aggregate vacancy reflects the co-existence of high-supply, often poor quality, decentralised districts with much more supply-constrained central areas.
As a result, declining aggregate vacancy in combination with still restrained development levels, is accentuating the level of competition faced by occupiers looking to acquire space from existing stock. In some places the shortage of large units is sufficiently acute that occupiers with substantial requirements are having to either consider slightly decentralised locations or initiate pre-lets.
EMEA FIT-OUT COST GUIDE CBRE PROJECT MANAGEMENT 4039
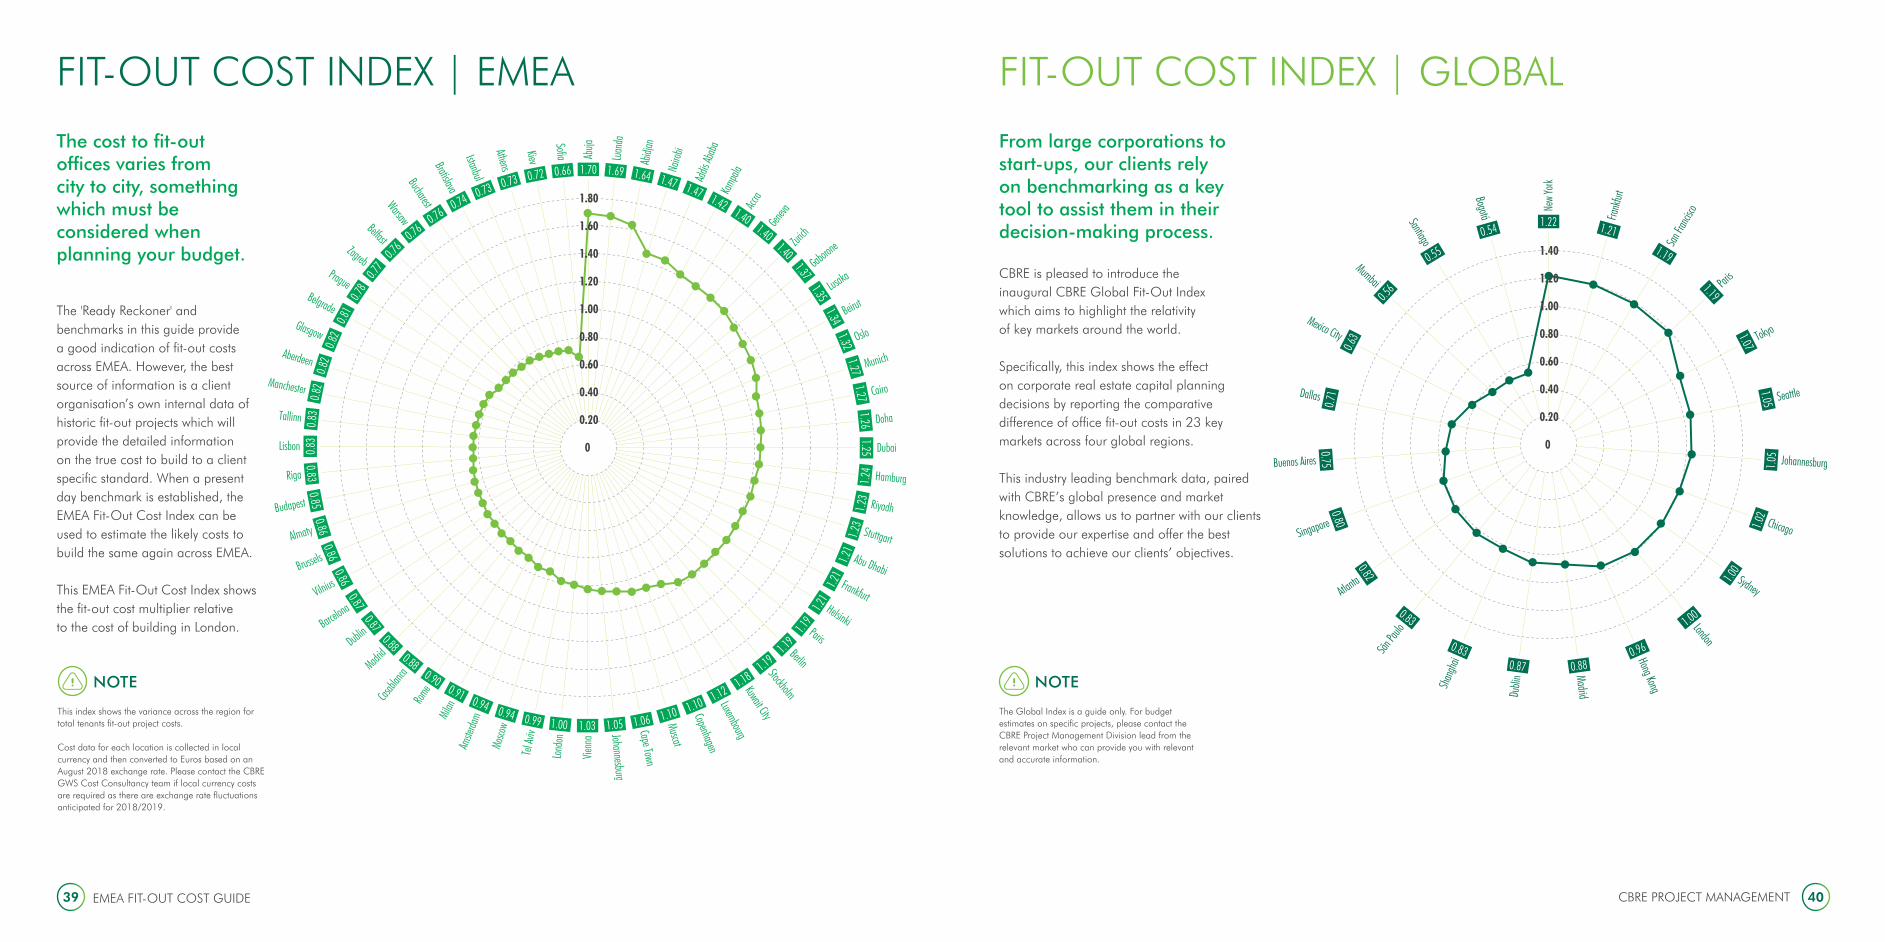
FIT-OUT COST INDEX | EMEA
The cost to fit-out offices varies from city to city, something which must be considered when planning your budget.
The 'Ready Reckoner' and benchmarks in this guide provide a good indication of fit-out costs across EMEA. However, the best source of information is a client organisation’s own internal data of historic fit-out projects which will provide the detailed information on the true cost to build to a client specific standard. When a present day benchmark is established, the EMEA Fit-Out Cost Index can be used to estimate the likely costs to build the same again across EMEA.
This EMEA Fit-Out Cost Index shows the fit-out cost multiplier relative to the cost of building in London.
From large corporations to start-ups, our clients rely on benchmarking as a key tool to assist them in their decision-making process.
CBRE is pleased to introduce the inaugural CBRE Global Fit-Out Index which aims to highlight the relativity of key markets around the world.
Specifically, this index shows the effect on corporate real estate capital planning decisions by reporting the comparative difference of office fit-out costs in 23 key markets across four global regions.
This industry leading benchmark data, paired with CBRE’s global presence and market knowledge, allows us to partner with our clients to provide our expertise and offer the best solutions to achieve our clients’ objectives.
NOTE
This index shows the variance across the region for total tenants fit-out project costs.
Cost data for each location is collected in local currency and then converted to Euros based on an August 2018 exchange rate. Please contact the CBRE GWS Cost Consultancy team if local currency costs are required as there are exchange rate fluctuations anticipated for 2018/2019.
NOTE
The Global Index is a guide only. For budget estimates on specific projects, please contact the CBRE Project Management Division lead from the relevant market who can provide you with relevant and accurate information.
FIT-OUT COST INDEX | GLOBAL
0.20
0.40
0.60
0.80
1.00
1.20
1.40
1.60
1.80
0
0.20
0.40
0.60
0.80
1.00
1.20
1.40
0

COUNTRY CITY CAT B AGILE€ / SQ M
FURNITURETRADITIONAL
€ / SQ MFURNITURE AGILE
€ / SQ MSECURITY€ / SQ M
AV TRADITIONAL€ / SQ M
AV AGILE€ / SQ M FEES
IT€ / SQ M
CONTIN-GENCY
TRADITIONAL FIT-OUT TOTAL
€ / SQ M
AGILE FIT-OUT TOTAL
C / SQ M
Select location Determine spec
Select traditional or agile layout and spec level (inc install, logistics and import tax)
Benchmark (inc import tax)
Select traditional or agile layout and spec level (inc install, logistics and import tax)
Apply %
Select spec (inc import tax)
Apply % Range
LOW MED HIGH LOW MED HIGH LOW MED HIGH LOW, MED & HIGH LOW MED HIGH LOW MED HIGH LOW HIGH LOW HIGH LOW HIGH
Angola Luanda 1,027 1,244 1,916 90+ 115+ 165+ 140+ 165+ 210+ 35+ 50+ 100+ 180+ 70+ 150+ 230+ 22% 60+ 120+ 10% 1752+ 3348+ 1774+ 3340+
Austria Vienna 558 737 1,140 99 127 182 154 182 231 35 50 100 180 70 150 230 18% 60 120 10% 1,068 2,204 1,127 2,255
Belgium Brussels 460 616 876 99 127 182 154 182 231 35 50 100 180 70 150 230 15% 60 120 10% 912 1,801 976 1,868
Botswana Gaborone 777 930 1,478 143 183 262 223 262 334 42 60 120 216 84 180 276 19% 72 144 10% 1,471 2,875 1,553 2,946
Bulgaria Sofi a 276 399 550 103 131 188 160 188 239 35 50 100 180 70 150 230 15% 60 120 10% 671 1,374 750 1,466
Croatia Zagreb 355 444 694 104 132 190 161 190 242 35 50 100 180 70 150 230 18% 60 120 10% 796 1,606 872 1,690
Czech Republic Prague 361 464 725 100 128 183 155 183 233 35 50 100 180 70 150 230 18% 60 120 10% 799 1,639 873 1,719
Denmark Copenhagen 570 757 1,168 104 133 191 162 191 244 35 50 100 180 70 150 230 24% 60 120 10% 1,142 2,363 1,208 2,419
Egypt Cairo 603 862 1,217 173 221 317 269 317 403 56 80 160 288 112 240 368 15% 96 192 10% 1,300 2,668 1,422 2,797
Estonia Tallinn 431 572 857 104 132 190 161 190 242 35 50 100 180 70 150 230 13% 60 120 10% 864 1,756 932 1,826
Ethiopia Addis Ababa 861 1,048 1,610 152 194 279 237 279 355 46 65 130 234 91 195 299 17% 78 156 10% 1,590 3,072 1,674 3,144
Finland Helsinki 714 887 1,440 108 138 198 168 198 252 35 50 100 180 70 150 230 16% 60 120 10% 1,271 2,593 1,325 2,629
France Paris 733 876 1,367 99 127 182 154 182 231 35 50 100 180 70 150 230 18% 60 120 10% 1,307 2,514 1,354 2,550
Germany Berlin 650 898 1,340 97 124 178 151 178 227 35 50 100 180 70 150 230 23% 60 120 10% 1,239 2,572 1,292 2,610
Germany Frankfurt 654 904 1,404 97 124 178 151 178 227 35 50 100 180 70 150 230 23% 60 120 10% 1,243 2,664 1,297 2,697
Germany Hamburg 674 946 1,439 97 124 178 151 178 227 35 50 100 180 70 150 230 23% 60 120 10% 1,272 2,713 1,324 2,744
Germany Munich 684 966 1,491 97 124 178 151 178 227 35 50 100 180 70 150 230 23% 60 120 10% 1,286 2,788 1,338 2,815
Germany Stuttgart 660 933 1,419 97 124 178 151 178 227 35 50 100 180 70 150 230 23% 60 120 10% 1,253 2,684 1,306 2,717
Ghana Accra 813 988 1,523 138 176 252 214 252 321 42 60 120 216 84 180 276 20% 72 144 10% 1,526 2,948 1,602 3,012
Greece Athens 300 396 627 112 143 205 174 205 260 35 50 100 180 70 150 230 18% 60 120 10% 730 1,534 816 1,628
Hungary Budapest 424 573 898 104 132 190 161 190 242 35 50 100 180 70 150 230 13% 60 120 10% 856 1,811 924 1,878
Ireland Dublin 469 605 937 101 129 185 157 185 235 35 50 100 180 70 150 230 13% 60 120 10% 910 1,855 974 1,919
Israel Tel Aviv 494 681 1,040 126 161 231 196 231 294 39 56 112 202 78 168 258 14% 67 134 10% 1,004 2,113 1,087 2,193
Italy Milan 487 638 977 103 131 188 160 188 239 35 50 100 180 70 150 230 14% 60 120 10% 945 1,927 1,009 1,990
Italy Rome 482 633 969 103 131 188 160 188 239 35 50 100 180 70 150 230 14% 60 120 10% 937 1,916 1,002 1,979
Ivory Coast Abidjan 934 1,275 1,942 138 176 252 214 252 321 42 60 120 216 84 180 276 21% 72 144 10% 1,707 3,559 1,775 3,595
Kazakhstan Almaty 364 480 755 131 168 241 204 241 307 40 58 115 207 81 173 265 17% 69 138 10% 863 1,803 962 1,910
Kenya Nairobi 846 1,030 1,582 148 189 271 230 271 344 44 63 125 225 88 188 288 20% 75 150 10% 1,594 3,075 1,676 3,145
Kuwait Kuwait City 649 851 1,314 121 154 221 188 221 281 37 53 105 189 74 158 242 18% 63 126 10% 1,228 2,514 1,298 2,571
Latvia Riga 454 534 842 104 132 190 161 190 242 35 50 100 180 70 150 230 13% 60 120 10% 895 1,737 961 1,808
Lebanon Beirut 711 931 1,326 161 206 295 251 295 376 53 75 150 270 105 225 345 17% 90 180 10% 1,433 2,790 1,539 2,900
Lithuania Vilnius 488 578 875 104 132 190 161 190 242 35 50 100 180 70 150 230 13% 60 120 10% 938 1,780 1,003 1,849
COUNTRY CITY CAT B AGILE€ / SQ M
FURNITURETRADITIONAL
€ / SQ MFURNITURE AGILE
€ / SQ MSECURITY€ / SQ M
AV TRADITIONAL€ / SQ M
AV AGILE€ / SQ M FEES
IT€ / SQ M
CONTIN-GENCY
TRADITIONAL FIT-OUT TOTAL
€ / SQ M
AGILE FIT-OUT TOTAL
C / SQ M
Select location Determine spec
Select traditional or agile layout and spec level (inc install, logistics and import tax)
Benchmark (inc import tax)
Select traditional or agile layout and spec level (inc install, logistics and import tax)
Apply %
Select spec (inc import tax)
Apply % Range
LOW MED HIGH LOW MED HIGH LOW MED HIGH LOW, MED & HIGH LOW MED HIGH LOW MED HIGH LOW HIGH LOW HIGH LOW HIGH
Luxembourg Luxembourg 619 875 1,223 99 127 182 154 182 231 35 50 100 180 70 150 230 22% 60 120 10% 1,187 2,392 1,244 2,439
Morocco Casablanca 405 506 754 140 178 256 217 256 326 44 63 125 225 88 188 288 14% 75 150 10% 925 1,818 1,027 1,934
Netherlands Amsterdam 496 655 1,002 99 127 182 154 182 231 35 50 100 180 70 150 230 17% 60 120 10% 975 2,000 1,038 2,060
Nigeria Abuja 1,034 1,361 1,936 90+ 115+ 165+ 140+ 165+ 210+ 35+ 50+ 100+ 180+ 70+ 150+ 230+ 22% 60+ 120+ 10% 1762+ 3377+ 1783+ 3367+
Norway Oslo 754 1,043 1,593 108 138 198 168 198 252 35 50 100 180 70 150 230 19% 60 120 10% 1,357 2,867 1,410 2,894
Oman Muscat 607 811 1,162 120 153 219 186 219 279 37 53 105 189 74 158 242 18% 63 126 10% 1,170 2,304 1,242 2,371
Poland Warsaw 357 456 722 104 132 190 161 190 242 35 50 100 180 70 150 230 14% 60 120 10% 774 1,593 848 1,673
Portugal Lisbon 395 529 811 99 127 182 154 182 231 35 50 100 180 70 150 230 19% 60 120 10% 851 1,768 922 1,843
Qatar Doha 711 991 1,434 119 152 218 185 218 277 37 53 105 189 74 158 242 19% 63 126 10% 1,321 2,695 1,386 2,742
Romania Bucharest 346 452 683 105 135 193 164 193 246 35 50 100 180 70 150 230 17% 60 120 10% 780 1,582 858 1,668
Russia Moscow 443 602 932 131 167 239 203 239 305 44 63 125 225 88 188 288 12% 75 150 10% 949 1,999 1,040 2,096
Saudi Arabia Riyadh 690 920 1,316 133 170 244 207 244 311 42 60 120 216 84 180 276 17% 72 144 10% 1,316 2,588 1,396 2,662
Serbia Belgrade 324 420 649 128 163 234 199 234 298 42 60 120 216 84 180 276 18% 72 144 10% 820 1,685 921 1,801
Slovakia Bratislava 319 528 720 104 132 190 161 190 242 35 50 100 180 70 150 230 15% 60 120 10% 729 1,602 806 1,683
South Africa Cape Town 499 678 1,077 134 171 246 209 246 313 42 60 120 216 84 180 276 18% 72 144 10% 1,067 2,284 1,161 2,375
South Africa Johannesburg 483 659 1,048 134 171 246 209 246 313 42 60 120 216 84 180 276 18% 72 144 10% 1,046 2,244 1,140 2,337
Spain Barcelona 438 552 874 103 131 188 160 188 239 35 50 100 180 70 150 230 18% 60 120 10% 908 1,849 978 1,921
Spain Madrid 447 571 881 103 131 188 160 188 239 35 50 100 180 70 150 230 18% 60 120 10% 921 1,859 990 1,930
Sweden Stockholm 736 1,029 1,381 106 136 195 165 195 248 35 50 100 180 70 150 230 16% 60 120 10% 1,299 2,510 1,350 2,549
Switzerland Geneva 834 1,063 1,597 104 133 191 162 191 244 35 50 100 180 70 150 230 24% 60 120 10% 1,521 2,979 1,568 3,004
Switzerland Zurich 838 1,071 1,578 104 133 191 162 191 244 35 50 100 180 70 150 230 24% 60 120 10% 1,527 2,953 1,574 2,979
Turkey Istanbul 299 441 626 114 146 210 178 210 267 37 54 107 193 75 161 246 16% 64 128 10% 733 1,543 822 1,642
UAE Abu Dhabi 701 931 1,334 119 152 218 185 218 277 37 53 105 189 74 158 242 19% 63 126 10% 1,307 2,557 1,373 2,611
UAE Dubai 711 946 1,414 119 152 218 185 218 277 37 53 105 189 74 158 242 19% 63 126 10% 1,321 2,667 1,386 2,716
Uganda Kampala 809 985 1,512 148 189 271 230 271 344 44 63 125 225 88 188 288 20% 75 150 10% 1,542 2,978 1,627 3,053
UK Aberdeen 429 543 811 101 129 185 157 185 235 35 50 100 180 70 150 230 15% 60 120 10% 872 1,717 939 1,790
UK Belfast 360 477 736 101 129 185 157 185 235 35 50 100 180 70 150 230 15% 60 120 10% 780 1,618 852 1,696
UK Glasgow 429 523 801 101 129 185 157 185 235 35 50 100 180 70 150 230 15% 60 120 10% 872 1,704 939 1,777
UK London 538 734 1,144 101 129 185 157 185 235 35 50 100 180 70 150 230 15% 60 120 10% 1,018 2,161 1,078 2,212
UK Manchester 427 576 818 101 129 185 157 185 235 35 50 100 180 70 150 230 15% 60 120 10% 869 1,726 937 1,799
Ukraine Kiev 311 403 629 108 138 198 168 198 252 35 50 100 180 70 150 230 16% 60 120 10% 730 1,504 811 1,595
Zambia Lusaka 748 894 1,424 148 189 271 230 271 344 44 63 125 225 88 188 288 19% 75 150 10% 1,445 2,833 1,534 2,913
CBRE PROJECT MANAGEMENT 43CBRE PROJECT MANAGEMENT 42
BUILD YOUR BUDGET MATRIX
EMEA FIT-OUT COST GUIDE41
NEW FOR 2018 | ONLINE CALCULATOR
We are excited for the launch of our new Fit-Out Online Calculator, offering unrivalled insights into project costs across the region, and allowing you to produce, compare and download project information for easy benchmarking.
KEY FEATURES:
• Furniture, IT, professional fees, AV and other costs all included
• Ability to add and compare past projects
• Ability to compare traditional and agile costs
• Ability to duplicate projects for easy benchmarking
• All 64 key EMEA locations in the Fit-Out Cost Guide included
• Indicative timeframes and schedules incorporated
Visit www.cbre.com/fit-out-emea to access the tool. Simply log in with your LinkedIn account and get started!

EM
EA
FIT
-O
UT
CO
ST
GU
IDE
20
18
/1
9 E
DIT
ION
cbre.com
Cover: CBRE Paris Office
KEY CONTACTS
DISCLAIMER 2018 CBRECBRE Ltd has taken every care in the preparation of this report. The sources of information used are believed to be accurate and reliable, but no guarantee of accuracy or completeness can be given. Neither CBRE, nor any CBRE company, nor any director, representative or employee of CBRE company, accepts liability for any direct or consequential loss arising from the use of this document or its content. The information and opinions contained in this report are subject to change without notice.
No part or parts of this report may be stored in a retrieval system or reproduced or transmitted in reprographics, recording or otherwise, now known or to be devised without prior consent from CBRE.
EMEA GWS PROJECT MANAGEMENT
MATTHEW EASTWOODHead of Occupier Project Management EMEAt: +44 (0) 7960 879 605e: [email protected]
NICHOLAS WINTERClient Solutionst: +44 (0) 203 257 6732e: [email protected]
EMEA GWS COST CONSULTANCY
SAM BARNESCost Consultancy Platform t: +44 (0) 7796 192 042 e: [email protected]
PENNY MOCINICost Consultancy Platform t: +44 (0) 7920 701 025e: [email protected]
AUTHORS
NIKA BIOUKISenior Programme Managert: +44 (0) 7584 600 813 e: [email protected]
RUMANA URMESenior Cost Managert: +44 (0) 7919 044 151 e: [email protected]