
FISCAL YEARS ENDED MAY 31, 2020 Prepared by
162
WATER AUTHORITY OF WESTERN NASSAU COUNTY COMPREHENSIVE ANNUAL FINANCIAL REPORT FISCAL YEARS ENDED MAY 31, 2020 AND 2019 (WITH INDEPENDENT AUDITORS’ REPORT THEREON) Prepared by: Michael J. Tierney Superintendent Water Authority of Western Nassau County, New York
-
Upload
khangminh22 -
Category
Documents
-
view
0 -
download
0
Transcript of FISCAL YEARS ENDED MAY 31, 2020 Prepared by
WATER AUTHORITY OF WESTERN NASSAU COUNTY COMPREHENSIVE ANNUAL FINANCIAL REPORT
FISCAL YEARS ENDED MAY 31, 2020 AND 2019 (WITH INDEPENDENT AUDITORS’ REPORT THEREON)
Prepared by: Michael J. Tierney
Superintendent Water Authority of Western Nassau County, New York

WATER AUTHORITY OF WESTERN NASSAU COUNTY COMPREHENSIVE ANNUAL FINANCIAL REPORT
FISCAL YEARS ENDED MAY 31, 2020 AND 2019 (WITH INDEPENDENT AUDITORS’ REPORT THEREON)
TABLE OF CONTENTS
Page
Section A: Introductory Section
Transmittal Letter 1 GFOA Certificate of Achievement for Excellence in Financial Reporting 21 Organizational Chart 22 List of Members of the Board of Directors 23
Section B: Financial Section Independent Auditors’ Report 25 Management’s Discussion and Analysis 27 Basic Financial Statements Statements of Net Position, May 31, 2020 and 2019 45 Statements of Revenues, Expenses and Change in Net Position, for the Years Ended May 31, 2020 and 2019 47 Statements of Cash Flows, for the Years Ended May 31, 2020 and 2019 48 Notes to the Financial Statements 50 Required Supplementary Information Schedule of Changes in the Total OPEB Liability and the Related Ratios, Years Ended May 31, 2020 and 2019 89 Schedule of the Water Authority’s Proportionate Share of the Net Pension Liability - 90 New York State Employees’ Retirement System, Last Five Fiscal Years Schedule of Contributions to the New York State Employees’ Retirement System, Last Ten Fiscal Years 91
Section C: Statistical Section Financial Trends Statements of Net Position, Last Ten Fiscal Years Ended May 31, 2020 93 Statements of Revenues, Expenses and Changes in Net Position, Last Ten Fiscal Years Ended May 31, 2020 95 Operating Revenue by Source, Last Ten Fiscal Years Ended May 31, 2020 96 Operating Expenses, Last Ten Fiscal Years Ended May 31, 2020 97 Non-Operating Revenues and Expenses, Last Ten Fiscal Years Ended May 31, 2020 98 Historical Collection Rates, Last Ten Fiscal Years Ended May 31, 2020 99 Revenue Capacity Water Produced and Consumed, Last Ten Fiscal Years Ended May 31, 2020 101 Billed Water Sales – By Service Area, Last Ten Fiscal Years Ended May 31, 2020 102 Number of Water Customers, by Type, Last Ten Fiscal Years Ended May 31, 2020 103 Quarterly Billed Water Rates, Last Ten Fiscal Years Ended May 31, 2020 104 Annual Billings of Ten Largest Customers, Last Ten Fiscal Years Ended May 31, 2020 105
WATER AUTHORITY OF WESTERN NASSAU COUNTY COMPREHENSIVE ANNUAL FINANCIAL REPORT
FISCAL YEARS ENDED MAY 31, 2020 AND 2019 (WITH INDEPENDENT AUDITORS’ REPORT THEREON)
TABLE OF CONTENTS
(CONTINUED)
Page
Section C: Statistical Section (continued) Debt Capacity Amounts, Ratios and Per Capita Outstanding Debt, Last Ten Fiscal Years Ended May 31, 2020 107 Debt Maturity Schedule by Series, May 31, 2020 108 Outstanding Principal and Unamortized Premium by Bond Series, May 31, 2020 109 Schedule of Debt Service, May 31, 2020 110 Debt Service Coverage, Last Ten Fiscal Years Ended May 31, 2020 111 Water Authority Per Capita Indebtedness, Last Ten Fiscal Years Ended May 31, 2020 112 Demographic and Economic Information Water Service Area Villages, Annual Estimates of Resident Population, July 1, 2010 to 2019 113 Service Area population, Median Age, Median Household Income and 114 Occupied Housing Units Nassau County, New York, Population, Total Personal Income, 115 Per Capita Personal Income and Unemployment Rate, 2010 to 2019 Nassau County, New York, Annual Average Employment by Industry, Last Ten Years 116 Nassau County, New York, Average Annual Employment by Industry 2010, 2019, and Second Quarter 2020 118 Operating Information Statistical Summary and Flash Report, Last Ten Fiscal Years Ended May 31, 2020 119 Monthly Water Production (Gallons), Last Ten Fiscal Years Ended May 31 and Last Ten Fiscal Years Average 120 Annual Water Consumption (Gallons) Billed by Month, Last Ten Fiscal Years Ended May 31, 2020 121 Annual Water Consumption by Service Area (Thousand Gallons), Last Ten Fiscal Years Ended May 31, 2020 122 Active Meters by Size, Fiscal Year Ended May 31, 2020 123 Customer Bills by Service Area, Last Ten Fiscal Years Ended May 31, 2020 124 Completed Capital Projects, Last Ten Fiscal Years Ended May 31, 2020 125 Number of Employees by Function, Last Ten Fiscal Years Ended May 31, 2020 126 Operating Capacity, Last Ten Fiscal Years Ended May 31, 2020 127 Well Station Description, Fiscal Year Ended May 31, 2020 128 Schedule of Insurance in Force, Fiscal Year Ended May 31, 2020 129
Section D: Compliance Section Report on Compliance and on Internal Control over Financial Reporting Based on an Audit of Financial Statements Performed in Accordance with Government Auditing Standards 131
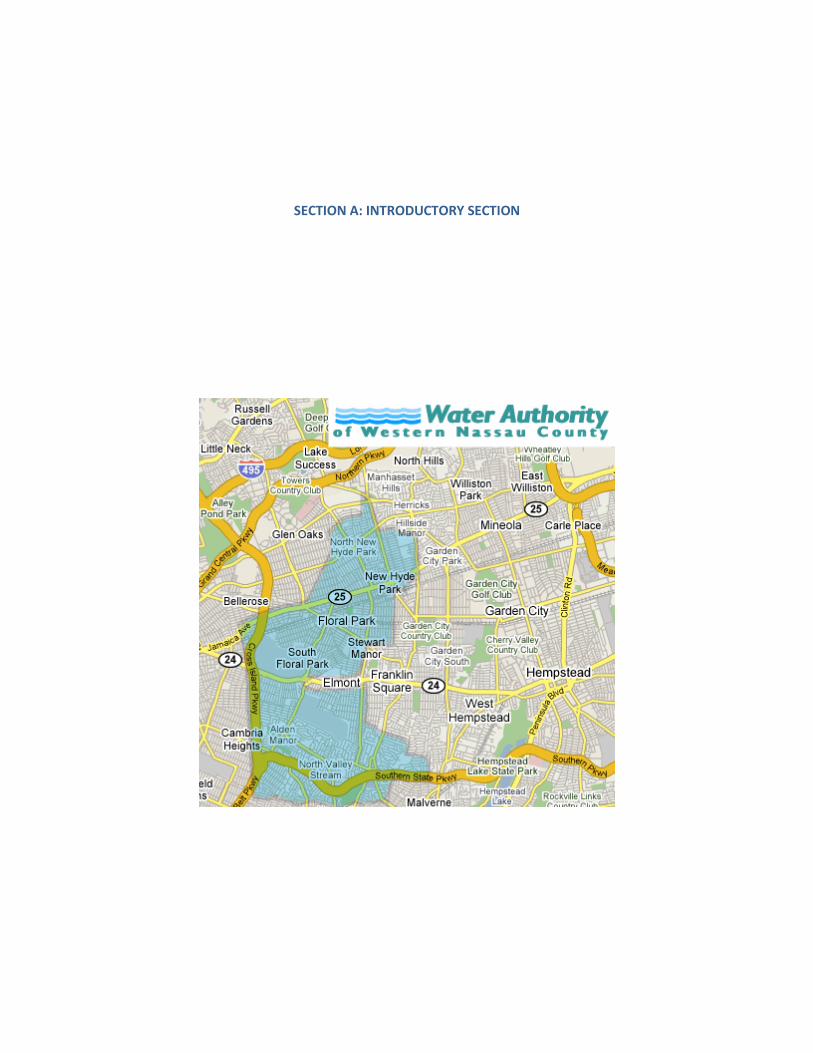
SECTION A: INTRODUCTORY SECTION

Water Authority o f W e s t e r n N a s s a u C o u n t y
1580 Union Turnpike, New Hyde Park, NY 11040-1762
(516) 327-4000 Fax: (516) 327-4087
[1]
LETTER OF TRANSMITTAL October 30, 2020 The Honorable Members of the Board of Directors and our Customers Water Authority of Western Nassau County 1580 Union Turnpike, New Hyde Park, NY 11040-1762 The Department of Accounting is pleased to transmit the Comprehensive Annual Financial Report ("CAFR") of the Water Authority of Western Nassau County, ("the Water Authority") for the fiscal year ended May 31, 2020. This letter of transmittal is designed to complement the Management's Discussion and Analysis (“MD&A”) and should be read in conjunction with it. The Water Authority's MD&A can be found on pages 27-44, immediately following the report of the independent auditors. INTRODUCTION Management Representation New York State Public Authorities Law requires that every public authority publish, within 90 days of the close of each fiscal year, a complete set of audited financial statements. This report is published to fulfil that requirement for the fiscal year ended May 31, 2020. This report was prepared by the Accounting Department of the Water Authority in conformance with the current accounting and financial reporting principles promulgated by the Governmental Accounting Standards Board (“GASB”), on a consistent basis. The presentation of data is designed to comply with the guidelines recommended by the Government Finance Officers Association of the United States and Canada (“GFOA”). Management assumes full responsibility for the completeness and reliability of the information contained in this report, based upon a comprehensive framework of internal controls that it has established for this purpose. Because the cost of internal control should not exceed anticipated benefits, the objective is to provide reasonable, rather than absolute, assurance that the financial statements are free of any material misstatements. To the best of our knowledge and belief, the information provided in the comprehensive annual financial report (CAFR) is accurate in all material respects and is reported in a manner designed to present fairly the financial position and results of operations of the Water Authority. All disclosures necessary to enable the reader to gain an understanding of the Water Authority’s financial and operational activities have been included. Tabriztchi & Company, CPA, P.C., Independent Certified Public Accountants, have issued an unmodified (“clean”) opinion on the financial statements of the Water Authority of Western Nassau County, for the year ended May 31, 2020. The independent auditors’ report is located at the front of the financial section of this report, pages 25 to 26.
[2]
Organization of Report The CAFR is presented in four sections as follows:
1. The Introductory Section (Section A) includes this transmittal letter, excerpts from the charter, organization chart, and the list of principal officials, and is intended to familiarize the reader with the organizational structure of the Water Authority and the nature and scope of the services provided. This letter is designed to complement the MD&A and should be read in conjunction with it. The Introductory Section can be found on pages 1 through 23.
2. The Financial Section B (Section B) includes the independent auditors’ report on the basic financial statements, the management’s discussion and analysis (MD&A) of the Water Authority’s overall financial position and results of operations, the audited financial statements, including the accompanying note disclosures and the required supplemental schedules. The Water Authority’s MD&A, basic financial statements, including notes and the required supplemental schedules can be found on pages 25 through 91.
3. The Statistical Section (Section C) contains comprehensive statistical data on the Water
Authority’s financial trends, revenue capacity, debt capacity, demographic and economic environment and operating information for the past ten years. The Water Authority’s Statistical Section can be found on pages 93 through 129.
4. The Compliance Section (Section D) contains the independent auditors’ report on compliance and on internal control over financial reporting based on an audit of financial statements performed in accordance with government auditing standards. The report is presented on pages 131 and 132.
Organization’s Profile The Water Authority was established on July 25, 1990, pursuant to the “Water Authority of Western Nassau County Act” of the State of New York, as amended on July 31, 1992 and codified under Title 8-C of Article 5 of the Public Authorities Law. On May 28, 1996, the Water Authority, by exercise of the power of eminent domain, acquired the water supply and distribution system situated in the District previously owned by the Jamaica Water Supply Company. The Water Authority serves a population of approximately 120,000 within the Town of Hempstead and the Town of North Hempstead. The Water Authority is neither required to pay taxes, special ad valorem levies or special assessments upon the real property owned by it, nor is required to pay any filing, recording or transfer fees or taxes in relation to instruments filed, recorded or transferred by or on its behalf. The Water Authority may pay or enter into agreements with any municipality to pay annual amounts for the real property located in that municipality that constitutes a part of the District. The drilling of wells and acquisition of water are subject to the Jurisdiction of the State of New York, Department of Environmental Conservation (“DEC”). The powers of DEC in this respect are statewide and extend on all water service providers. The mission of the Water Authority is as follows: To satisfy customer expectations for high quality, reliable water service provided in a responsive and efficient manner at the lowest reasonable price.
[3]
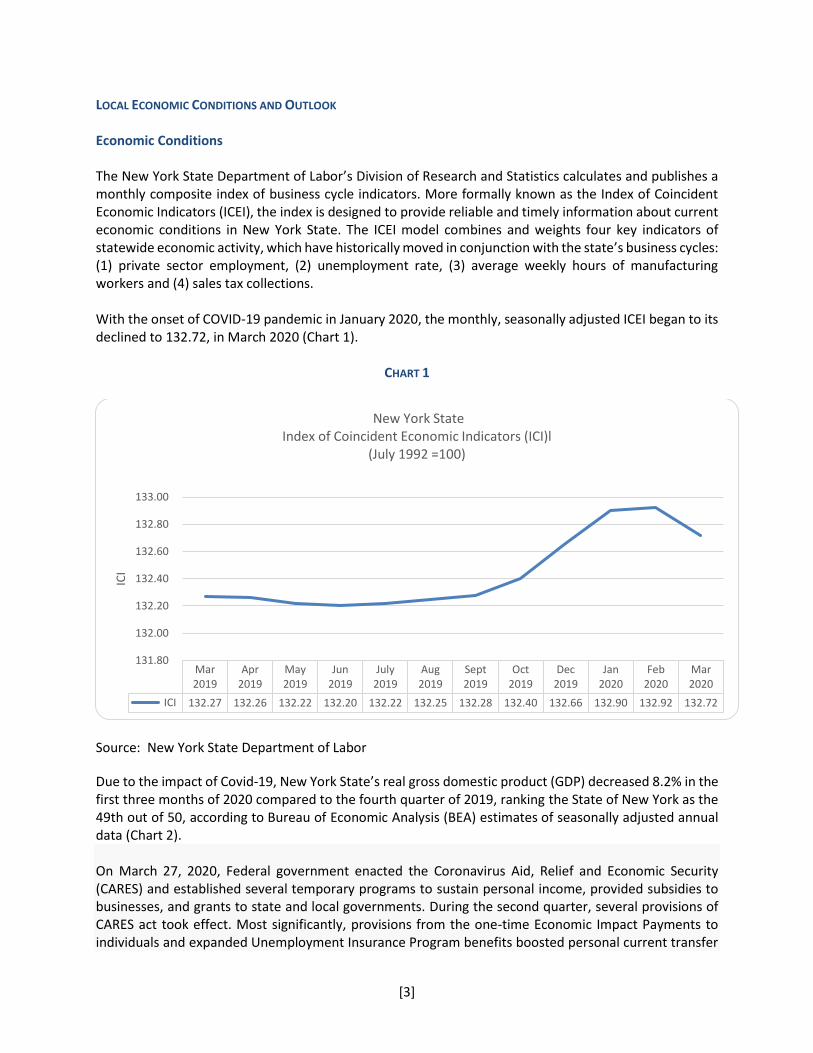
LOCAL ECONOMIC CONDITIONS AND OUTLOOK Economic Conditions The New York State Department of Labor’s Division of Research and Statistics calculates and publishes a monthly composite index of business cycle indicators. More formally known as the Index of Coincident Economic Indicators (ICEI), the index is designed to provide reliable and timely information about current economic conditions in New York State. The ICEI model combines and weights four key indicators of statewide economic activity, which have historically moved in conjunction with the state’s business cycles: (1) private sector employment, (2) unemployment rate, (3) average weekly hours of manufacturing workers and (4) sales tax collections. With the onset of COVID-19 pandemic in January 2020, the monthly, seasonally adjusted ICEI began to its declined to 132.72, in March 2020 (Chart 1).
CHART 1
Source: New York State Department of Labor
Due to the impact of Covid-19, New York State’s real gross domestic product (GDP) decreased 8.2% in the first three months of 2020 compared to the fourth quarter of 2019, ranking the State of New York as the 49th out of 50, according to Bureau of Economic Analysis (BEA) estimates of seasonally adjusted annual data (Chart 2). On March 27, 2020, Federal government enacted the Coronavirus Aid, Relief and Economic Security (CARES) and established several temporary programs to sustain personal income, provided subsidies to businesses, and grants to state and local governments. During the second quarter, several provisions of CARES act took effect. Most significantly, provisions from the one-time Economic Impact Payments to individuals and expanded Unemployment Insurance Program benefits boosted personal current transfer
Mar2019
Apr2019
May2019
Jun2019
July2019
Aug2019
Sept2019
Oct2019
Dec2019
Jan2020
Feb2020
Mar2020
ICI 132.27 132.26 132.22 132.20 132.22 132.25 132.28 132.40 132.66 132.90 132.92 132.72
131.80
132.00
132.20
132.40
132.60
132.80
133.00
ICI
New York State Index of Coincident Economic Indicators (ICI)l
(July 1992 =100)
[4]
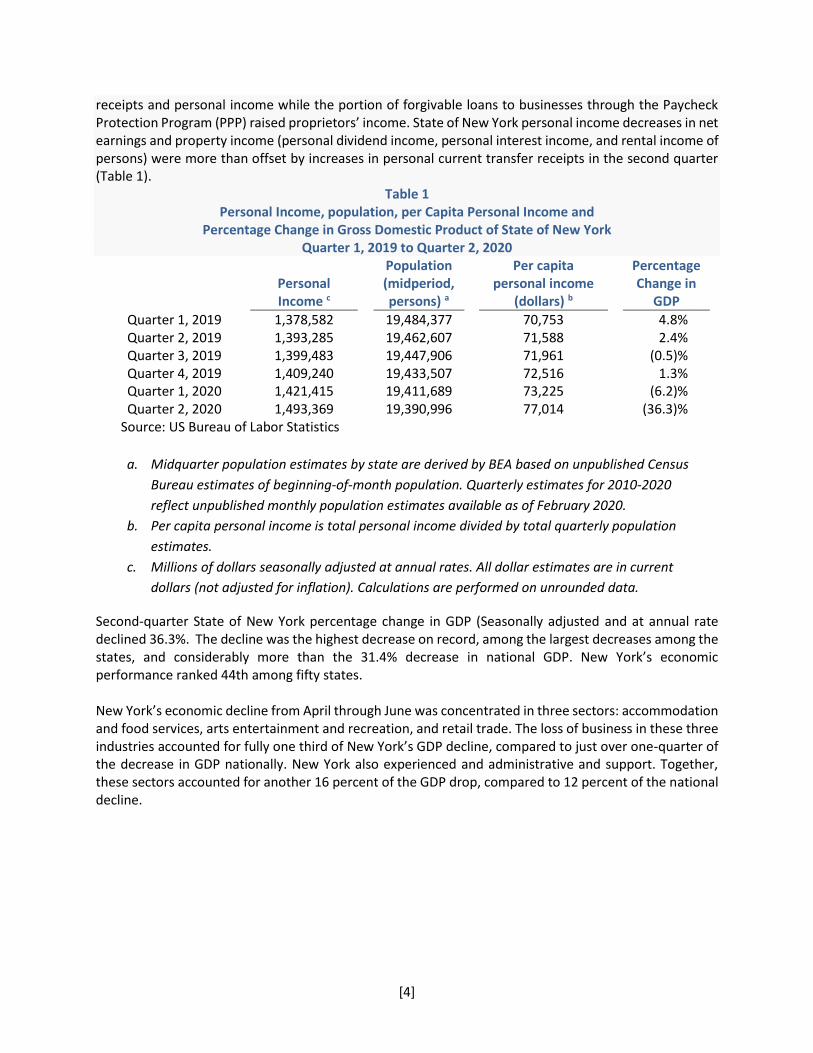
receipts and personal income while the portion of forgivable loans to businesses through the Paycheck Protection Program (PPP) raised proprietors’ income. State of New York personal income decreases in net earnings and property income (personal dividend income, personal interest income, and rental income of persons) were more than offset by increases in personal current transfer receipts in the second quarter (Table 1).
Table 1 Personal Income, population, per Capita Personal Income and
Percentage Change in Gross Domestic Product of State of New York Quarter 1, 2019 to Quarter 2, 2020
Personal Income c
Population (midperiod, persons) a
Per capita personal income
(dollars) b
Percentage Change in
GDP
Quarter 1, 2019 1,378,582 19,484,377 70,753 4.8% Quarter 2, 2019 1,393,285 19,462,607 71,588 2.4% Quarter 3, 2019 1,399,483 19,447,906 71,961 (0.5)% Quarter 4, 2019 1,409,240 19,433,507 72,516 1.3% Quarter 1, 2020 1,421,415 19,411,689 73,225 (6.2)% Quarter 2, 2020 1,493,369 19,390,996 77,014 (36.3)%
Source: US Bureau of Labor Statistics
a. Midquarter population estimates by state are derived by BEA based on unpublished Census
Bureau estimates of beginning-of-month population. Quarterly estimates for 2010-2020
reflect unpublished monthly population estimates available as of February 2020.
b. Per capita personal income is total personal income divided by total quarterly population
estimates. c. Millions of dollars seasonally adjusted at annual rates. All dollar estimates are in current
dollars (not adjusted for inflation). Calculations are performed on unrounded data.
Second-quarter State of New York percentage change in GDP (Seasonally adjusted and at annual rate declined 36.3%. The decline was the highest decrease on record, among the largest decreases among the states, and considerably more than the 31.4% decrease in national GDP. New York’s economic performance ranked 44th among fifty states. New York’s economic decline from April through June was concentrated in three sectors: accommodation and food services, arts entertainment and recreation, and retail trade. The loss of business in these three industries accounted for fully one third of New York’s GDP decline, compared to just over one-quarter of the decrease in GDP nationally. New York also experienced and administrative and support. Together, these sectors accounted for another 16 percent of the GDP drop, compared to 12 percent of the national decline.
[5]
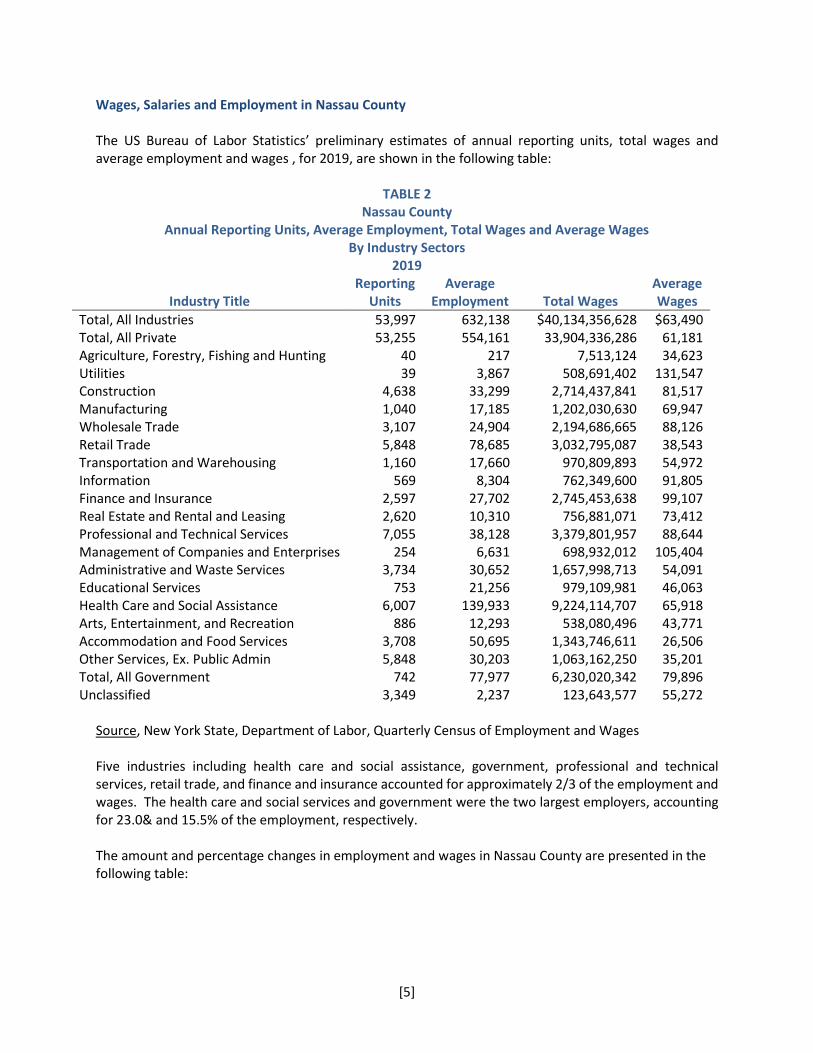
Wages, Salaries and Employment in Nassau County The US Bureau of Labor Statistics’ preliminary estimates of annual reporting units, total wages and average employment and wages , for 2019, are shown in the following table:
TABLE 2 Nassau County
Annual Reporting Units, Average Employment, Total Wages and Average Wages By Industry Sectors
2019
Industry Title Reporting
Units Average
Employment Total Wages Average Wages
Total, All Industries 53,997 632,138 $40,134,356,628 $63,490 Total, All Private 53,255 554,161 33,904,336,286 61,181 Agriculture, Forestry, Fishing and Hunting 40 217 7,513,124 34,623 Utilities 39 3,867 508,691,402 131,547 Construction 4,638 33,299 2,714,437,841 81,517 Manufacturing 1,040 17,185 1,202,030,630 69,947 Wholesale Trade 3,107 24,904 2,194,686,665 88,126 Retail Trade 5,848 78,685 3,032,795,087 38,543 Transportation and Warehousing 1,160 17,660 970,809,893 54,972 Information 569 8,304 762,349,600 91,805 Finance and Insurance 2,597 27,702 2,745,453,638 99,107 Real Estate and Rental and Leasing 2,620 10,310 756,881,071 73,412 Professional and Technical Services 7,055 38,128 3,379,801,957 88,644 Management of Companies and Enterprises 254 6,631 698,932,012 105,404 Administrative and Waste Services 3,734 30,652 1,657,998,713 54,091 Educational Services 753 21,256 979,109,981 46,063 Health Care and Social Assistance 6,007 139,933 9,224,114,707 65,918 Arts, Entertainment, and Recreation 886 12,293 538,080,496 43,771 Accommodation and Food Services 3,708 50,695 1,343,746,611 26,506 Other Services, Ex. Public Admin 5,848 30,203 1,063,162,250 35,201 Total, All Government 742 77,977 6,230,020,342 79,896 Unclassified 3,349 2,237 123,643,577 55,272
Source, New York State, Department of Labor, Quarterly Census of Employment and Wages Five industries including health care and social assistance, government, professional and technical services, retail trade, and finance and insurance accounted for approximately 2/3 of the employment and wages. The health care and social services and government were the two largest employers, accounting for 23.0& and 15.5% of the employment, respectively. The amount and percentage changes in employment and wages in Nassau County are presented in the following table:
[6]
TABLE 3 Nassau County
Change in Average Employment, and Average Wages By Industry Sectors
2018 to 2019 2018 to 2019 Change in
Industry Title Average Employment Average Wages
Total, All Industries Number Percent Amount Percent
Total, All Private (707) -0.1% $1,734 2.9%
Agriculture, Forestry, Fishing and Hunting 4 1.9% (842) -2.4%
Utilities (33) -0.8% 3,400 2.7%
Construction (90) -0.3% 4,766 6.2%
Manufacturing (609) -3.4% 2,065 3.0%
Wholesale Trade (675) -2.6% 3,131 3.7%
Retail Trade (2,363) -2.9% 2,382 6.6%
Transportation and Warehousing 1,541 9.6% (1,333) -2.4%
Information (1,559) -15.8% 4,263 4.9%
Finance and Insurance (993) -3.5% 4,748 5.0%
Real Estate and Rental and Leasing (297) -2.8% 2,504 3.5%
Professional and Technical Services (907) -2.3% 4,002 4.7%
Management of Companies and Enterprises (740) -10.0% 2,528 2.5%
Administrative and Waste Services 453 1.5% 4,207 8.4%
Educational Services 100 0.5% (205) -0.4%
Health Care and Social Assistance 5,909 4.4% (122) -0.2%
Arts, Entertainment, and Recreation (181) -1.5% 2,825 6.9%
Accommodation and Food Services (546) -1.1% 1,354 5.4%
Other Services, Ex. Public Admin (554) -1.8% (455) -1.3%
Total, All Government 458 0.6% 741 0.9%
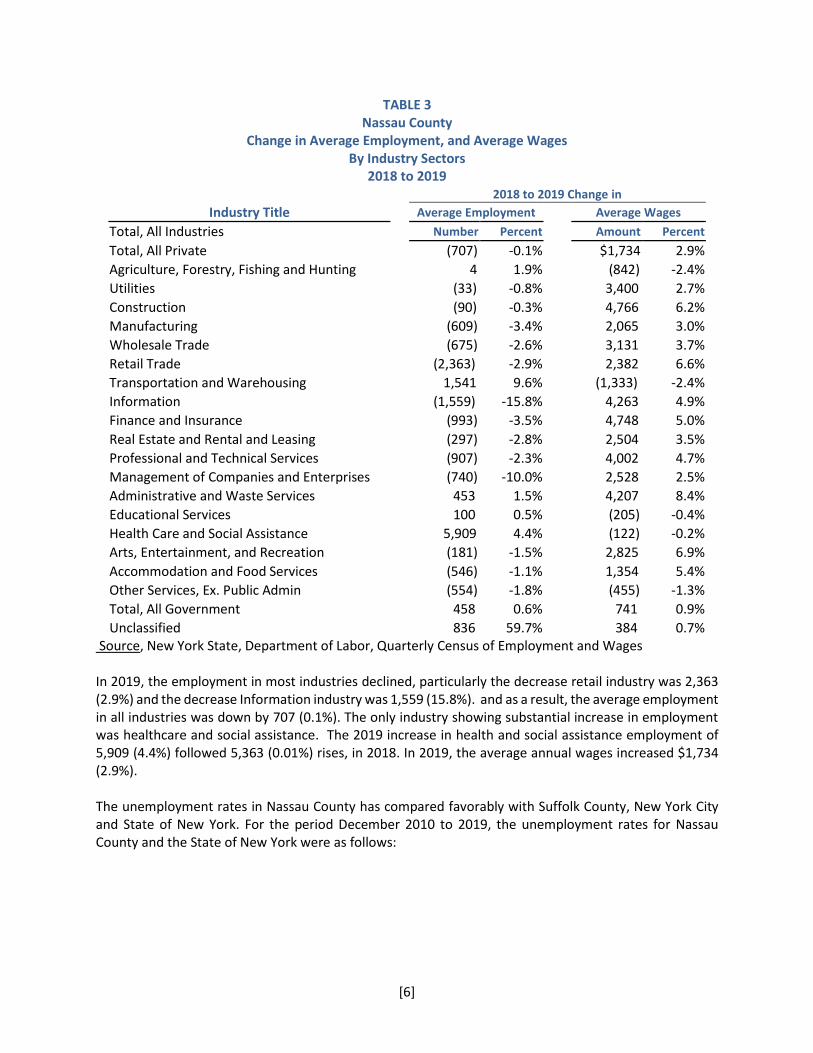
Unclassified 836 59.7% 384 0.7% Source, New York State, Department of Labor, Quarterly Census of Employment and Wages In 2019, the employment in most industries declined, particularly the decrease retail industry was 2,363 (2.9%) and the decrease Information industry was 1,559 (15.8%). and as a result, the average employment in all industries was down by 707 (0.1%). The only industry showing substantial increase in employment was healthcare and social assistance. The 2019 increase in health and social assistance employment of 5,909 (4.4%) followed 5,363 (0.01%) rises, in 2018. In 2019, the average annual wages increased $1,734 (2.9%). The unemployment rates in Nassau County has compared favorably with Suffolk County, New York City and State of New York. For the period December 2010 to 2019, the unemployment rates for Nassau County and the State of New York were as follows:
[7]
TABLE 4 Nassau County
Annual Average Unemployment Rates 2010 to 2019
Year Nassau County New York State
2010 7.1% 8.6% 2011 6.8% 8.3% 2012 7.0% 8.5% 2013 5.9% 7.7% 2014 4.8% 6.3% 2015 4.2% 5.3% 2016 3.9% 4.9% 2017 4.1% 4.7% 2018 3.6% 4.1% 2019 3.4% 4.0%
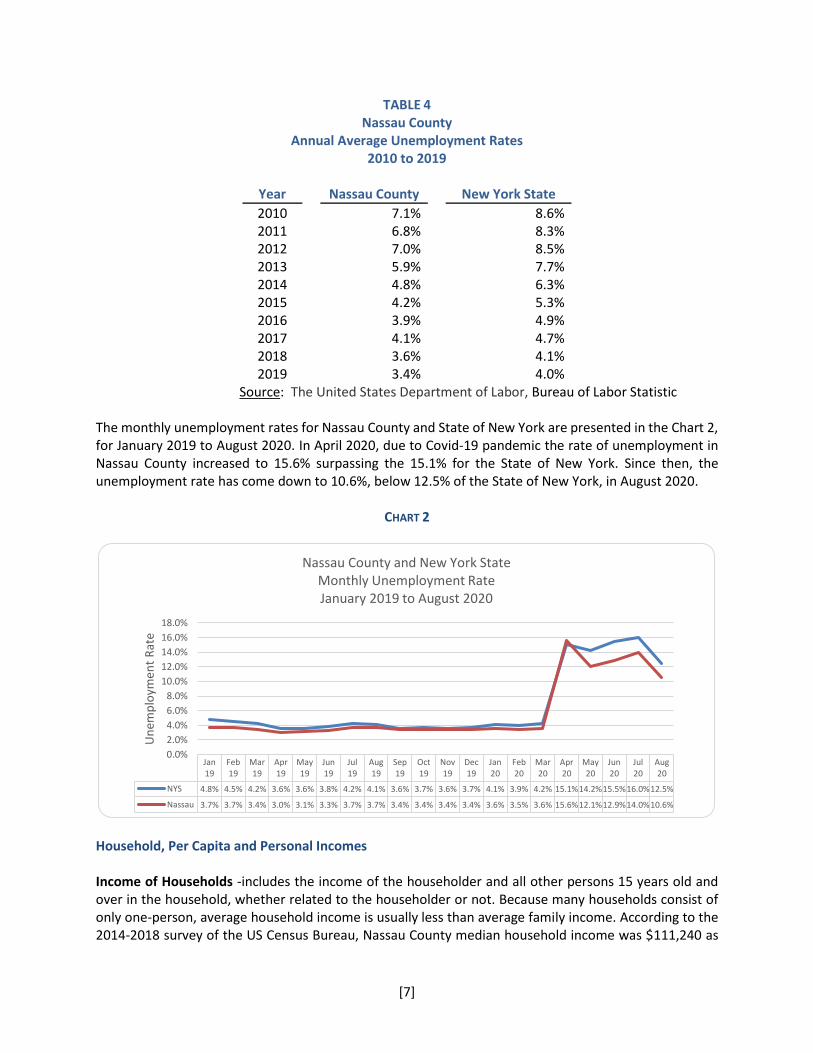
Source: The United States Department of Labor, Bureau of Labor Statistic The monthly unemployment rates for Nassau County and State of New York are presented in the Chart 2, for January 2019 to August 2020. In April 2020, due to Covid-19 pandemic the rate of unemployment in Nassau County increased to 15.6% surpassing the 15.1% for the State of New York. Since then, the unemployment rate has come down to 10.6%, below 12.5% of the State of New York, in August 2020.
CHART 2
Household, Per Capita and Personal Incomes Income of Households -includes the income of the householder and all other persons 15 years old and over in the household, whether related to the householder or not. Because many households consist of only one-person, average household income is usually less than average family income. According to the 2014-2018 survey of the US Census Bureau, Nassau County median household income was $111,240 as
Jan19
Feb19
Mar19
Apr19
May19
Jun19
Jul19
Aug19
Sep19
Oct19
Nov19
Dec19
Jan20
Feb20
Mar20
Apr20
May20
Jun20
Jul20
Aug20
NYS 4.8% 4.5% 4.2% 3.6% 3.6% 3.8% 4.2% 4.1% 3.6% 3.7% 3.6% 3.7% 4.1% 3.9% 4.2% 15.1%14.2%15.5%16.0%12.5%
Nassau 3.7% 3.7% 3.4% 3.0% 3.1% 3.3% 3.7% 3.7% 3.4% 3.4% 3.4% 3.4% 3.6% 3.5% 3.6% 15.6%12.1%12.9%14.0%10.6%
0.0%
2.0%
4.0%
6.0%
8.0%
10.0%
12.0%
14.0%
16.0%
18.0%
Un
emp
loym
ent
Rat
e
Nassau County and New York StateMonthly Unemployment RateJanuary 2019 to August 2020
[8]
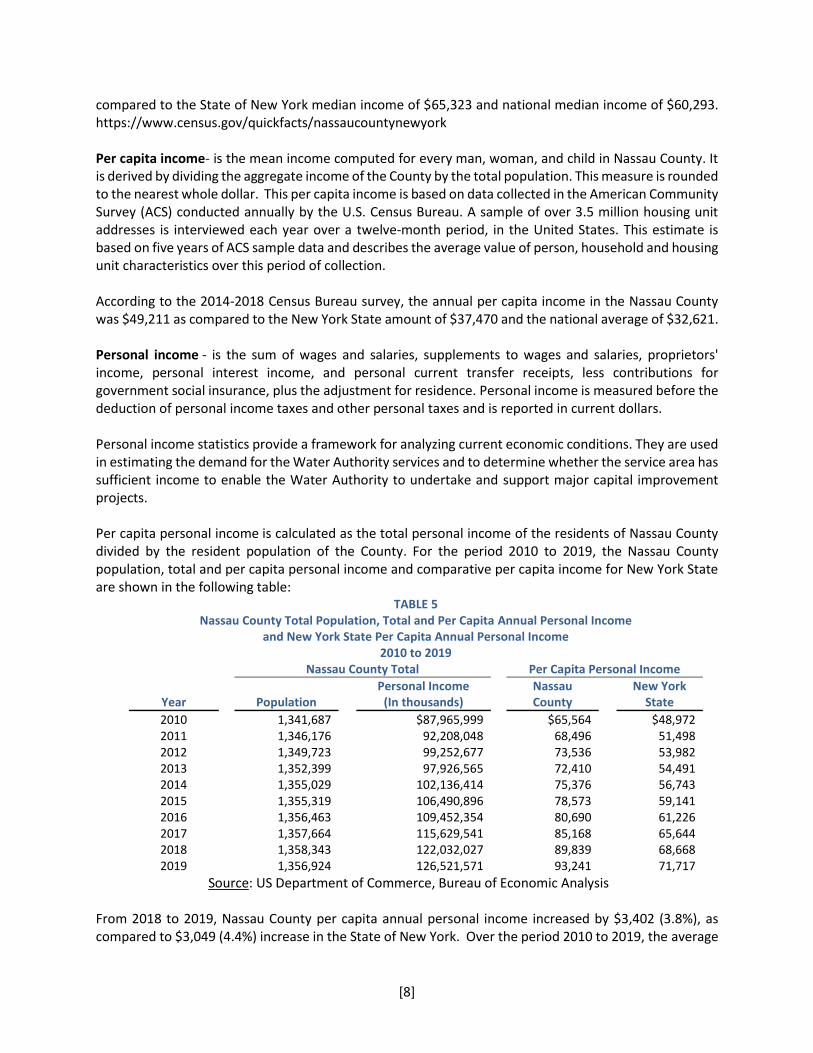
compared to the State of New York median income of $65,323 and national median income of $60,293. https://www.census.gov/quickfacts/nassaucountynewyork Per capita income- is the mean income computed for every man, woman, and child in Nassau County. It is derived by dividing the aggregate income of the County by the total population. This measure is rounded to the nearest whole dollar. This per capita income is based on data collected in the American Community Survey (ACS) conducted annually by the U.S. Census Bureau. A sample of over 3.5 million housing unit addresses is interviewed each year over a twelve-month period, in the United States. This estimate is based on five years of ACS sample data and describes the average value of person, household and housing unit characteristics over this period of collection. According to the 2014-2018 Census Bureau survey, the annual per capita income in the Nassau County was $49,211 as compared to the New York State amount of $37,470 and the national average of $32,621. Personal income - is the sum of wages and salaries, supplements to wages and salaries, proprietors' income, personal interest income, and personal current transfer receipts, less contributions for government social insurance, plus the adjustment for residence. Personal income is measured before the deduction of personal income taxes and other personal taxes and is reported in current dollars. Personal income statistics provide a framework for analyzing current economic conditions. They are used in estimating the demand for the Water Authority services and to determine whether the service area has sufficient income to enable the Water Authority to undertake and support major capital improvement projects. Per capita personal income is calculated as the total personal income of the residents of Nassau County divided by the resident population of the County. For the period 2010 to 2019, the Nassau County population, total and per capita personal income and comparative per capita income for New York State are shown in the following table:
TABLE 5
Nassau County Total Population, Total and Per Capita Annual Personal Income
and New York State Per Capita Annual Personal Income
2010 to 2019
Nassau County Total Per Capita Personal Income Personal Income Nassau New York
Year Population (In thousands) County State 2010 1,341,687 $87,965,999 $65,564 $48,972 2011 1,346,176 92,208,048 68,496 51,498 2012 1,349,723 99,252,677 73,536 53,982 2013 1,352,399 97,926,565 72,410 54,491 2014 1,355,029 102,136,414 75,376 56,743 2015 1,355,319 106,490,896 78,573 59,141 2016 1,356,463 109,452,354 80,690 61,226 2017 1,357,664 115,629,541 85,168 65,644 2018 1,358,343 122,032,027 89,839 68,668 2019 1,356,924 126,521,571 93,241 71,717
Source: US Department of Commerce, Bureau of Economic Analysis From 2018 to 2019, Nassau County per capita annual personal income increased by $3,402 (3.8%), as compared to $3,049 (4.4%) increase in the State of New York. Over the period 2010 to 2019, the average
[9]
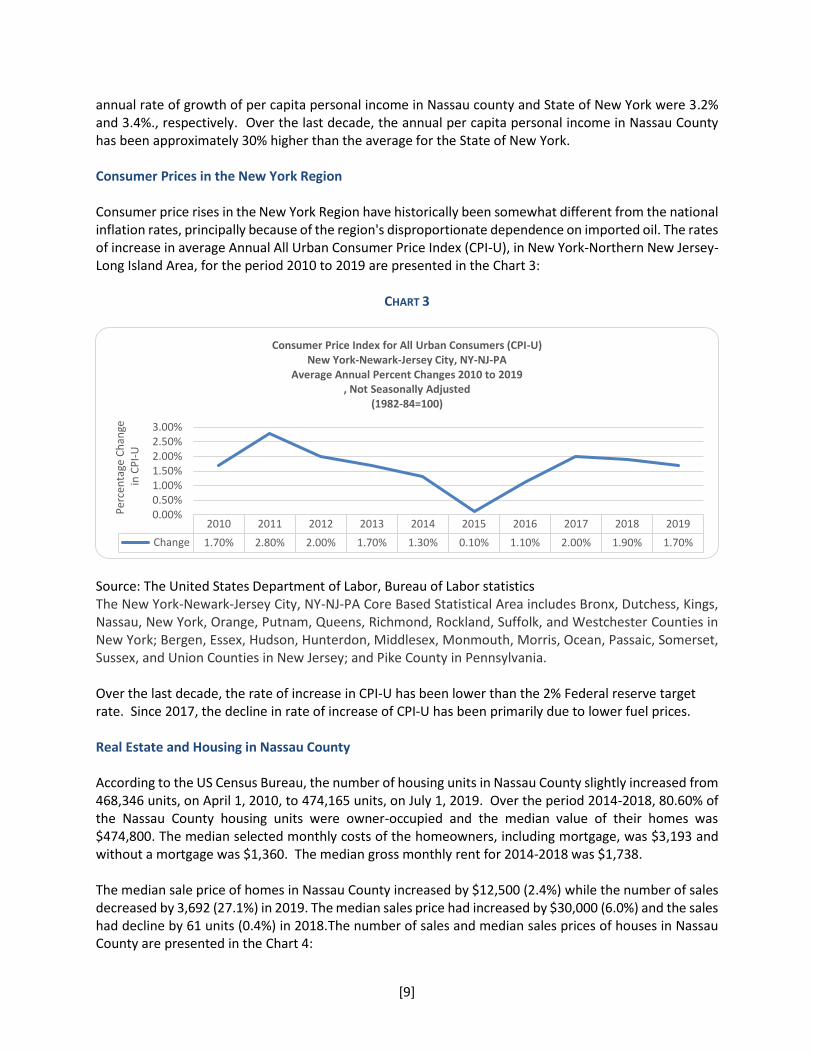
annual rate of growth of per capita personal income in Nassau county and State of New York were 3.2% and 3.4%., respectively. Over the last decade, the annual per capita personal income in Nassau County has been approximately 30% higher than the average for the State of New York. Consumer Prices in the New York Region Consumer price rises in the New York Region have historically been somewhat different from the national inflation rates, principally because of the region's disproportionate dependence on imported oil. The rates of increase in average Annual All Urban Consumer Price Index (CPI-U), in New York-Northern New Jersey-Long Island Area, for the period 2010 to 2019 are presented in the Chart 3:
CHART 3
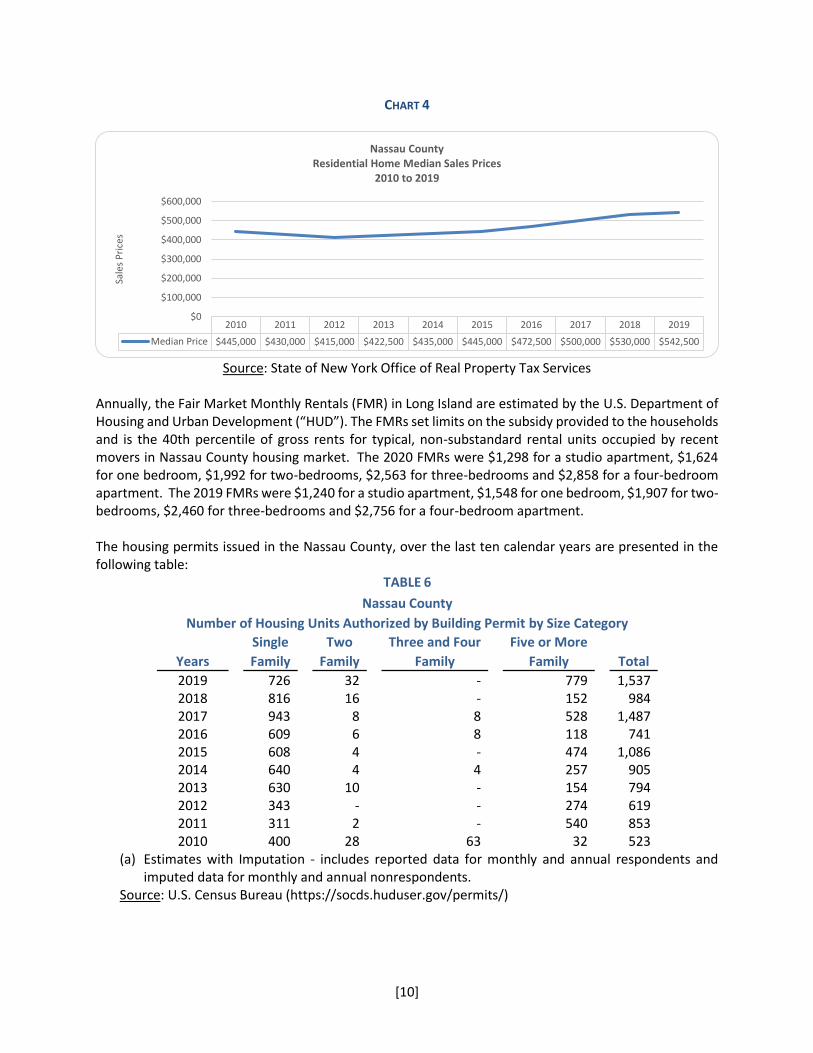
Source: The United States Department of Labor, Bureau of Labor statistics The New York-Newark-Jersey City, NY-NJ-PA Core Based Statistical Area includes Bronx, Dutchess, Kings, Nassau, New York, Orange, Putnam, Queens, Richmond, Rockland, Suffolk, and Westchester Counties in New York; Bergen, Essex, Hudson, Hunterdon, Middlesex, Monmouth, Morris, Ocean, Passaic, Somerset, Sussex, and Union Counties in New Jersey; and Pike County in Pennsylvania. Over the last decade, the rate of increase in CPI-U has been lower than the 2% Federal reserve target rate. Since 2017, the decline in rate of increase of CPI-U has been primarily due to lower fuel prices. Real Estate and Housing in Nassau County According to the US Census Bureau, the number of housing units in Nassau County slightly increased from 468,346 units, on April 1, 2010, to 474,165 units, on July 1, 2019. Over the period 2014-2018, 80.60% of the Nassau County housing units were owner-occupied and the median value of their homes was $474,800. The median selected monthly costs of the homeowners, including mortgage, was $3,193 and without a mortgage was $1,360. The median gross monthly rent for 2014-2018 was $1,738. The median sale price of homes in Nassau County increased by $12,500 (2.4%) while the number of sales decreased by 3,692 (27.1%) in 2019. The median sales price had increased by $30,000 (6.0%) and the sales had decline by 61 units (0.4%) in 2018.The number of sales and median sales prices of houses in Nassau County are presented in the Chart 4:
2010 2011 2012 2013 2014 2015 2016 2017 2018 2019
Change 1.70% 2.80% 2.00% 1.70% 1.30% 0.10% 1.10% 2.00% 1.90% 1.70%
0.00%0.50%1.00%1.50%2.00%2.50%3.00%
Per
cen
tage
Ch
ange
in C
PI-
U
Consumer Price Index for All Urban Consumers (CPI-U)New York-Newark-Jersey City, NY-NJ-PA
Average Annual Percent Changes 2010 to 2019, Not Seasonally Adjusted
(1982-84=100)
[10]
CHART 4
Source: State of New York Office of Real Property Tax Services Annually, the Fair Market Monthly Rentals (FMR) in Long Island are estimated by the U.S. Department of Housing and Urban Development (“HUD”). The FMRs set limits on the subsidy provided to the households and is the 40th percentile of gross rents for typical, non-substandard rental units occupied by recent movers in Nassau County housing market. The 2020 FMRs were $1,298 for a studio apartment, $1,624 for one bedroom, $1,992 for two-bedrooms, $2,563 for three-bedrooms and $2,858 for a four-bedroom apartment. The 2019 FMRs were $1,240 for a studio apartment, $1,548 for one bedroom, $1,907 for two-bedrooms, $2,460 for three-bedrooms and $2,756 for a four-bedroom apartment. The housing permits issued in the Nassau County, over the last ten calendar years are presented in the following table:
TABLE 6
Nassau County
Number of Housing Units Authorized by Building Permit by Size Category
Years
Single
Two
Three and Four
Five or More
Total Family Family Family Family
2019 726 32 - 779 1,537 2018 816 16 - 152 984 2017 943 8 8 528 1,487 2016 609 6 8 118 741 2015 608 4 - 474 1,086 2014 640 4 4 257 905 2013 630 10 - 154 794 2012 343 - - 274 619 2011 311 2 - 540 853 2010 400 28 63 32 523
(a) Estimates with Imputation - includes reported data for monthly and annual respondents and imputed data for monthly and annual nonrespondents.
Source: U.S. Census Bureau (https://socds.huduser.gov/permits/)
2010 2011 2012 2013 2014 2015 2016 2017 2018 2019
Median Price $445,000 $430,000 $415,000 $422,500 $435,000 $445,000 $472,500 $500,000 $530,000 $542,500
$0
$100,000
$200,000
$300,000
$400,000
$500,000
$600,000
Sale
s P
rice
s
Nassau CountyResidential Home Median Sales Prices
2010 to 2019
[11]
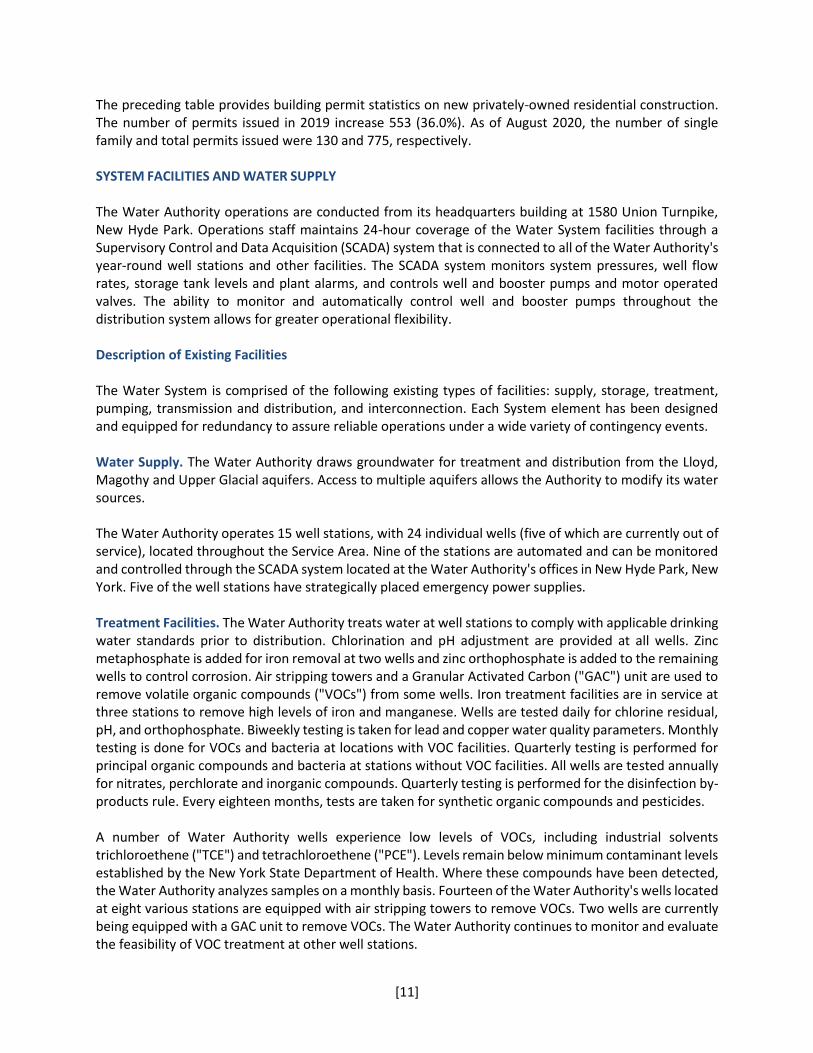
The preceding table provides building permit statistics on new privately-owned residential construction. The number of permits issued in 2019 increase 553 (36.0%). As of August 2020, the number of single family and total permits issued were 130 and 775, respectively. SYSTEM FACILITIES AND WATER SUPPLY The Water Authority operations are conducted from its headquarters building at 1580 Union Turnpike, New Hyde Park. Operations staff maintains 24-hour coverage of the Water System facilities through a Supervisory Control and Data Acquisition (SCADA) system that is connected to all of the Water Authority's year-round well stations and other facilities. The SCADA system monitors system pressures, well flow rates, storage tank levels and plant alarms, and controls well and booster pumps and motor operated valves. The ability to monitor and automatically control well and booster pumps throughout the distribution system allows for greater operational flexibility. Description of Existing Facilities The Water System is comprised of the following existing types of facilities: supply, storage, treatment, pumping, transmission and distribution, and interconnection. Each System element has been designed and equipped for redundancy to assure reliable operations under a wide variety of contingency events. Water Supply. The Water Authority draws groundwater for treatment and distribution from the Lloyd, Magothy and Upper Glacial aquifers. Access to multiple aquifers allows the Authority to modify its water sources. The Water Authority operates 15 well stations, with 24 individual wells (five of which are currently out of service), located throughout the Service Area. Nine of the stations are automated and can be monitored and controlled through the SCADA system located at the Water Authority's offices in New Hyde Park, New York. Five of the well stations have strategically placed emergency power supplies. Treatment Facilities. The Water Authority treats water at well stations to comply with applicable drinking water standards prior to distribution. Chlorination and pH adjustment are provided at all wells. Zinc metaphosphate is added for iron removal at two wells and zinc orthophosphate is added to the remaining wells to control corrosion. Air stripping towers and a Granular Activated Carbon ("GAC") unit are used to remove volatile organic compounds ("VOCs") from some wells. Iron treatment facilities are in service at three stations to remove high levels of iron and manganese. Wells are tested daily for chlorine residual, pH, and orthophosphate. Biweekly testing is taken for lead and copper water quality parameters. Monthly testing is done for VOCs and bacteria at locations with VOC facilities. Quarterly testing is performed for principal organic compounds and bacteria at stations without VOC facilities. All wells are tested annually for nitrates, perchlorate and inorganic compounds. Quarterly testing is performed for the disinfection by-products rule. Every eighteen months, tests are taken for synthetic organic compounds and pesticides. A number of Water Authority wells experience low levels of VOCs, including industrial solvents trichloroethene ("TCE") and tetrachloroethene ("PCE"). Levels remain below minimum contaminant levels established by the New York State Department of Health. Where these compounds have been detected, the Water Authority analyzes samples on a monthly basis. Fourteen of the Water Authority's wells located at eight various stations are equipped with air stripping towers to remove VOCs. Two wells are currently being equipped with a GAC unit to remove VOCs. The Water Authority continues to monitor and evaluate the feasibility of VOC treatment at other well stations.
[12]
All of the Water Authority's wells currently comply with all applicable drinking water standards. Storage Facilities. Storage tanks help satisfy peak demands beyond pump capacity and to assure an adequate supply of water during emergencies. At seven well stations, the Authority maintains steel or concrete water storage tanks of varying capacities. The tanks are located in both high and low-pressure zones for system redundancy. Total storage capacity is 11.9 million gallons. Transmission and Distribution Facilities. The existing water distribution system is comprised of approximately 1,238,000 linear feet of 2 to 16-inch diameter water mains and piping, valves and appurtenances. The majority (90%) of the water mains are of unlined cast iron, with the remainder being mostly cement lined ductile iron pipe. The mains are located below public streets or under private property pursuant to easements. Portions of the original distribution system are unlined cast iron pipe over 90 years old. In addition, approximately 800 linear feet is comprised of 4-inch or smaller diameter cast and wrought iron pipe. The Authority's practice is to remove and replace, when identified, those mains that do not comply with current best practices, including unlined cast iron pipe and 4-inch or smaller diameter pipe. Interconnection Facilities. The Water System is connected to adjacent public water supplies at eleven Nassau County locations. The Water System interconnects with the Garden City Park Water District at two metered locations, one of which permits two-way flow and one which flows only to the Garden City Park system. There are four metered, two-way flow interconnections with the Franklin Square Water District, two metered two-way flow interconnections with the New York American Water Company, one unmetered two-way flow interconnection with the Manhasset/Lakeville Water District and two metered two-way flow interconnections with the Village of Garden City. There are also 6 interconnections between the Water System and the NYC Department of Environmental Protection system. The Water System operates independently of adjacent systems. The Water Authority strives to provide a high level of service to its customers and to fully maintain Water System assets. The Water Authority programs include a flushing program performed twice annually to clear sediment from older, undersized distribution mains; valve, hydrant and interconnection maintenance; a water conservation program; equipment preventive maintenance schedules; summertime grounds keeping and maintenance programs; an annual leak detection program; cross training among Water Authority staff to improve emergency response; and hydrant painting. The Water Authority routinely evaluates the cost-effective use of outside service contractors for certain of these programs. FINANCIAL INFORMATION Internal Control Environment Management of the Water Authority is responsible for establishing and maintaining an internal control structure designed to ensure that assets of the water utility are protected from loss, theft, or misuse, and to ensure that adequate accounting data are compiled to allow for the accurate presentation of financial statements in conformity with generally accepted accounting principles (“GAAP”). The internal control structure is designed to provide reasonable, but not absolute, assurance that these objectives are met. The concept of reasonable assurance recognizes that the cost of controls should not outweigh their benefit.
[13]
Budget Formulation and Control The Water Authority considers budget preparation and implementation as an important tool in planning operations and maintaining its fiscal responsibility and accountability. Annual operating and capital budgets are prepared by management and approved by the Board of Directors. The purpose of the budget process is to authorize and control expenditures, evaluate projected revenue to determine the Water Authority’s ability to meet its obligations under various bond covenants and to provide analysis for planning purposes.
Board of Directors of the Water Authority approved the following changes in employee wages and benefits in its May 27, 2020 meeting:
1. The employee annual salaries were approved to increase 3.25% effective June 1, 2020, 3.00%
effective June 1, 2021, 3.00% effective June 1, 2022, 3.00% effective June 1, 2023 and a 2.75% effective June 1, 2024.
2. The rates of required employee contributions toward the premiums for medical, dental and vision
insurance coverage for all employees were reduced to 7.5% of the cost of the premiums effective
June 1, 2020. Currently, the tier 1-employees contribute 10% and the tier 2-employees
contribute 15% of the premiums.
3. The contribution of the Water Authority towards retiree health insurance was changed to 80%,
for the cost of the premiums for individual and family coverage. Currently, Tier 1- retiree pays
40% of the cost of individual retiree medical coverage, and 60% of the cost of spousal coverage and Tier 2 -retiree pays 50% of the cost of individual retiree medical coverage, and 65% of the
cost of spousal coverage. Financial Reporting Financial statements, consisting of a statement of net position, a statement of revenues and expenses and changes in net position and a report of cash balances and investments are prepared monthly, usually within two weeks of the last day of the month. A monthly presentation is made to the Board of Directors, comparing actual results of operations with the approved budget as well as prior year results. If unforeseen circumstances arise which alter the projections used in the budget process, a revision may be prepared by the Director of Finance, Accounting and Customer Service at the request of the Water Authority Superintendent for consideration and approval by the Board of Directors. The New York State Public Authorities Accountability Act (PAAA) of 2005 imposed increased reporting and auditing requirements on public authorities, called for board member training and the disclosure of executive compensation rates, required each public authority to adopt a code of ethics, directed them to make their annual reports and required documentation available online, and restricted their power to dispose of real property for less than fair market value or without public bidding. The PAAA was followed in 2009 by enactment of the Public Authorities Reform Act, which gave the Authorities Budget Office the power to promulgate regulations, to initiate formal investigations, and to publicly warn and censure noncompliant authorities. Significantly, the act also clarified that board members operate as fiduciaries and are responsible for carrying out their duties with a reasonable degree of diligence, care, skill, and
[14]
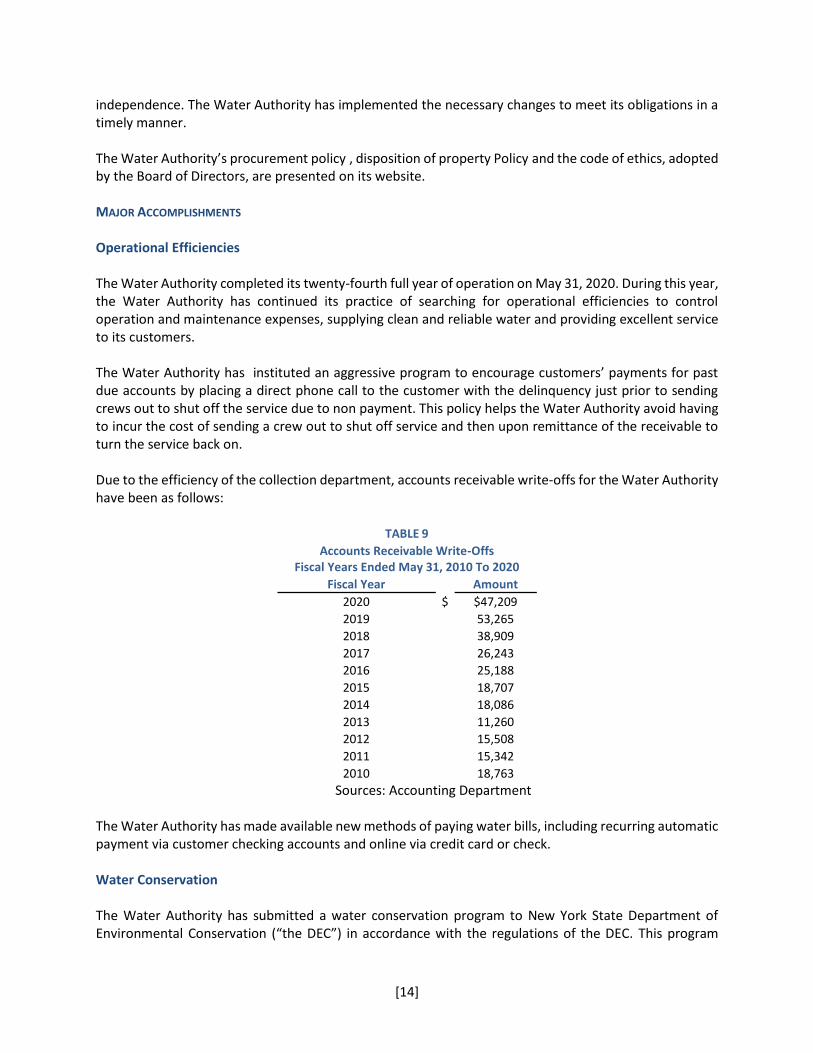
independence. The Water Authority has implemented the necessary changes to meet its obligations in a timely manner. The Water Authority’s procurement policy , disposition of property Policy and the code of ethics, adopted by the Board of Directors, are presented on its website. MAJOR ACCOMPLISHMENTS Operational Efficiencies The Water Authority completed its twenty-fourth full year of operation on May 31, 2020. During this year, the Water Authority has continued its practice of searching for operational efficiencies to control operation and maintenance expenses, supplying clean and reliable water and providing excellent service to its customers. The Water Authority has instituted an aggressive program to encourage customers’ payments for past due accounts by placing a direct phone call to the customer with the delinquency just prior to sending crews out to shut off the service due to non payment. This policy helps the Water Authority avoid having to incur the cost of sending a crew out to shut off service and then upon remittance of the receivable to turn the service back on. Due to the efficiency of the collection department, accounts receivable write-offs for the Water Authority have been as follows:
TABLE 9
Accounts Receivable Write-Offs Fiscal Years Ended May 31, 2010 To 2020
Fiscal Year Amount
2020 $ $47,209
2019 53,265
2018 38,909
2017 26,243
2016 25,188
2015 18,707
2014 18,086
2013 11,260
2012 15,508
2011 15,342
2010 18,763
Sources: Accounting Department
The Water Authority has made available new methods of paying water bills, including recurring automatic payment via customer checking accounts and online via credit card or check. Water Conservation The Water Authority has submitted a water conservation program to New York State Department of Environmental Conservation (“the DEC”) in accordance with the regulations of the DEC. This program
[15]
includes universal metering, public education, outdoor water use restrictions, water conservation kits, residential and commercial water use audits, proactive bill audits and customer service line replacements. A program was established using seasonal employees who patrol the service territory during peak demand periods to assure water usage regulation compliance. According to the Board adopted terms, the first recorded violation is assigned a written warning; the second, third, fourth and fifth and any further violation is assessed a $50, $75, $150 and $300 service charge, respectively. This program has proven to be effective in raising the awareness of customers to the water usage restrictions at a low operating cost to the Water Authority Water Quality Report In accordance with New York State Public Health Law and Federal regulations, the Water Authority issued its 2019 Annual Water Quality Report. This report provides information about the quality of the drinking water, including a summary of the laboratory results for all testing performed by an independent laboratory, during 2019. The report informs that the Water Authority was in compliance with applicable State requirements regarding drinking water quality and operating, reporting and notification procedures. During the 2019 calendar year, the Water Authority conducted more than 36,500 tests for over 150 drinking water contaminants. In 2019, as in years past, the tap water met all United States Environmental Protection Agency (“EPA”) and State of New York drinking water health standards. System Improvements The Water Authority has the sole authority to fix the water rates and collect charges that are necessary for the payment of its operating expenses and principal and interest on its bonds. No governmental board, agency, corporation, or officer of the State has jurisdiction or control over the water rates or charges. Section 1198-d (9) of the Act expressly declares that neither the New York State Public Service Commission nor any other control board or commission of like character has jurisdiction over the Water Authority in the management and control of its properties and operations or any power over rates fixed or charges collected by the Water Authority. The Act requires that the rates or charges to be changed only following a public hearing session. All customers are subject to basic service charge of $48.42, which represents the minimum charge billed whether or not the customer uses any water. The basic service charge entitles a customer to use up to 9,000 gallons each 90 day (100 gallons per day). This charge includes the cost of maintaining and reading meters, along with certain other costs of services provided by the Water Authority. Both residential and commercial customers are billed quarterly for the preceding three-month period. All bills are due upon receipt and become delinquent if payment is not received within 30 days of the bill date indicated on the front of the bill. Customers are subject to an additional charge of 1% per month for any unpaid balance if payment is not received within 30 days of the bill date indicated on the front of the bill. If the Water Authority fails to bill the customer for usage or service, it has six months from the time the error is discovered to issue a back bill. The back-billing period will be limited to a maximum of 24 months unless there is evidence that the customer caused or contributed to the error. If there is such evidence, the back-billing period will be limited to a maximum of six years.
[16]
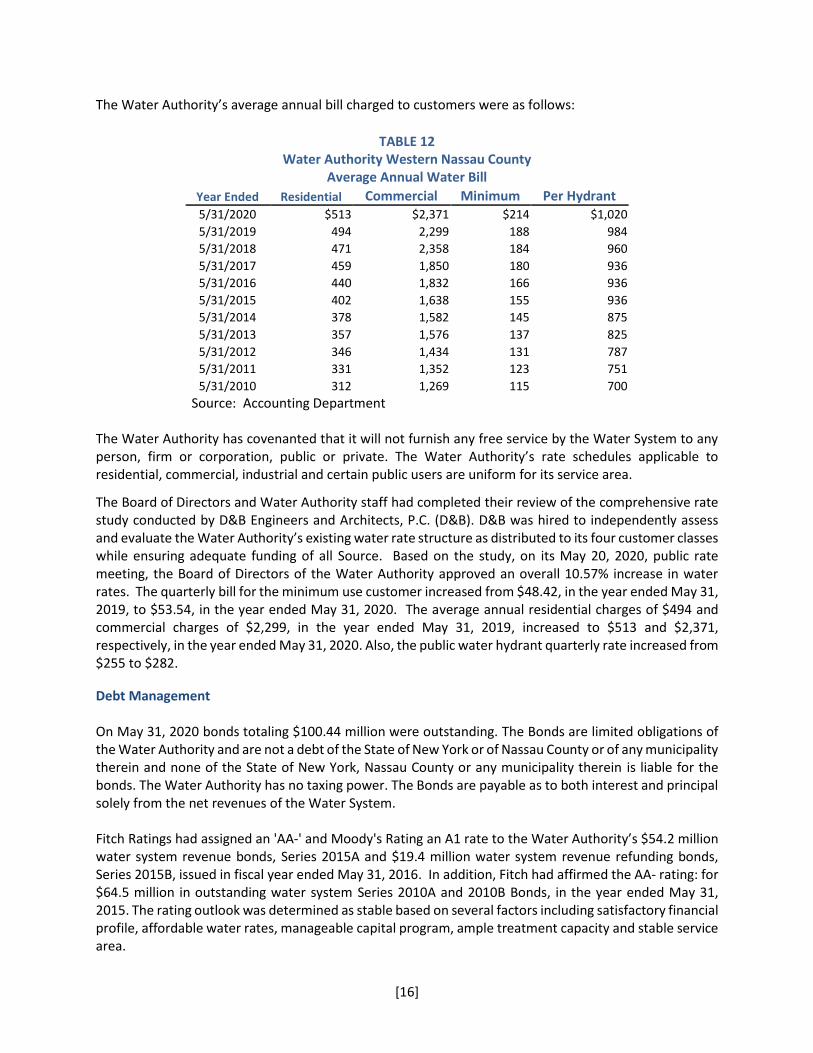
The Water Authority’s average annual bill charged to customers were as follows:
TABLE 12 Water Authority Western Nassau County
Average Annual Water Bill
Year Ended Residential Commercial Minimum Per Hydrant 5/31/2020 $513 $2,371 $214 $1,020
5/31/2019 494 2,299 188 984
5/31/2018 471 2,358 184 960
5/31/2017 459 1,850 180 936
5/31/2016 440 1,832 166 936
5/31/2015 402 1,638 155 936
5/31/2014 378 1,582 145 875
5/31/2013 357 1,576 137 825
5/31/2012 346 1,434 131 787
5/31/2011 331 1,352 123 751
5/31/2010 312 1,269 115 700
Source: Accounting Department The Water Authority has covenanted that it will not furnish any free service by the Water System to any person, firm or corporation, public or private. The Water Authority’s rate schedules applicable to residential, commercial, industrial and certain public users are uniform for its service area.
The Board of Directors and Water Authority staff had completed their review of the comprehensive rate study conducted by D&B Engineers and Architects, P.C. (D&B). D&B was hired to independently assess and evaluate the Water Authority’s existing water rate structure as distributed to its four customer classes while ensuring adequate funding of all Source. Based on the study, on its May 20, 2020, public rate meeting, the Board of Directors of the Water Authority approved an overall 10.57% increase in water rates. The quarterly bill for the minimum use customer increased from $48.42, in the year ended May 31, 2019, to $53.54, in the year ended May 31, 2020. The average annual residential charges of $494 and commercial charges of $2,299, in the year ended May 31, 2019, increased to $513 and $2,371, respectively, in the year ended May 31, 2020. Also, the public water hydrant quarterly rate increased from $255 to $282.
Debt Management On May 31, 2020 bonds totaling $100.44 million were outstanding. The Bonds are limited obligations of the Water Authority and are not a debt of the State of New York or of Nassau County or of any municipality therein and none of the State of New York, Nassau County or any municipality therein is liable for the bonds. The Water Authority has no taxing power. The Bonds are payable as to both interest and principal solely from the net revenues of the Water System. Fitch Ratings had assigned an 'AA-' and Moody's Rating an A1 rate to the Water Authority’s $54.2 million water system revenue bonds, Series 2015A and $19.4 million water system revenue refunding bonds, Series 2015B, issued in fiscal year ended May 31, 2016. In addition, Fitch had affirmed the AA- rating: for $64.5 million in outstanding water system Series 2010A and 2010B Bonds, in the year ended May 31, 2015. The rating outlook was determined as stable based on several factors including satisfactory financial profile, affordable water rates, manageable capital program, ample treatment capacity and stable service area.
[17]
0n June 2020, Fitch Ratings affirmed the AA- rating for the approximately $100.44 million outstanding (on May 31, 2020) water system revenue bonds, series 2010B, 2015A, and 2015B. In addition, Fitch assigned the authority an Issuer Default Rating (IDR) of AA- with the Rating Outlook determined as stable. The AA- IDR and bond rating reflect the Water Authority’s leverage in the context of its very strong revenue defensibility and very low operating risk profile, both assessed as 'aa'. The Water Authority's revenue defensibility is supported by its rate setting autonomy and very strong rate flexibility. A low operating cost burden and low life cycle investment needs with annual capital spending greatly outpacing depreciation drive the 'aa' operating risk profile assessment. While Fitch expects the authority's leverage to increase following a planned $50 million issuance, leverage metrics should decrease over the rating period and continue to support the current rating.
The ongoing coronavirus outbreak and related government containment measures worldwide creates an uncertain global environment for the water sector. While the Water Authority’s recently available performance data has not indicated impairment, with residential usage increasing and no significant decline in financial results, material changes in revenue and cost profile could occur in the coming weeks and months as economic activity suffers and government restrictions are in place. Under requirements stipulated in the bond resolutions, a trustee has been assigned to hold proceeds from the related bond issues. In addition, the trustee is required to hold funds deposited from time to time to pay registered owners (bondholders). The trustee is required to invest and reinvest funds as instructed by an authorized representative of the Water Authority. Additional information on long-term debt is included in Management Discussion and Analysis, page 39 and note 5 to the financial statements, pages 68 to 72. Asset Management After the issuance of Series 2015 Revenue Bonds, the total depreciable and non-depreciable capital assets have increased from $72.9 million on May 31, 2016 to $103 million on May 31, 2020. Included in those expenditures were a Headquarters Project, three iron removal facilities, construction of new VOC removal facilities, installation of approximately 2,600 feet of a new 12-inch transmission water main, radio read and meter replacement program, compliance with New York State Department of Health regulations, increased level of capital main, service and hydrant replacement programs, other projects for well screen replacements, station repair, technology improvements, security system at all sites, vehicle, tools and work equipment replacements, meter and booster upgrades. The Water Authority completed the construction of its new headquarters located at 1580 Union Turnpike, New Hyde Park, New York. This two-story facility was built on existing Water Authority owned property which also contains two active wells and a Volatile Organic Compound Treatment facility, as well as a separate garage and generator. The Water Authority saves approximately $400,000 per year by eliminating the rental cost, property taxes and maintenance costs previously incurred at its prior headquarters in New Hyde Park. Three Iron Removal Plant Projects were completed and put into operation. Annually, over 675 million gallons of water is treated and supplied to the customers in those distribution areas. The Water Authority completed the rehabilitation of its elevated water storage Tank No. 19, located in New Hyde Park. The tank has a capacity of approximately 1,265,000 gallons of water and serves the Water Authority’s customers in New Hyde Park, Bellerose and the northern portion of Floral Park. The project
[18]
included physical changes necessary to comply with current Department of Health standards, repairs to the tank and power washing and sandblasting to remove dirt and old coatings. After the repairs and cleaning were completed, the interior and exterior surfaces of the tank were painted. The paint that was used is approved for use on water storage tanks by the New York State Department of Health. Also, completed was a comprehensive water rate study conducted by D&B Engineers and Architects, P.C., the company retained by the Water Authority to perform the study. The broad objective of the study was to develop a rate structure based on meter size and usage to adequately fund all water operations, capital and debt service costs while promoting water conservation. The study also included a review of miscellaneous rate charges including such items as frozen meters, no-access fees, turn-on/off charges, etc. The Water Authority plans on holding an open public session prior to taking action on the rate study findings. Planned Improvements Capital projects have continued to require a large share of the Water Authority’s budget, staff time and focus. The Water Authority has implemented a comprehensive capital improvement program with the goal of improving the water system’s aging infrastructure through increased system capacity and dependability. Specifically, target areas include upgrading storage and delivery, enhancing water quality, identifying and complying with pending regulatory requirements, protecting the water source and its watershed, and reducing unaccounted-for water. Security improvements to protect its assets base are underway and will continue through subsequent years. The Water Authority prepares and updates annually its Capital Improvement Plan (“CIP”), which establishes programmatic goals for the Water System and reviews the present condition and forecasted needs of the Water System facilities over the next five fiscal years. Individual projects are researched and prioritized. The updated CIP with detailed assumptions and considerations is submitted to the Board of Directors for approval. The Board of Directors reviews and approves all capital expenditure payments and publishes the related information together with the minutes of the Board on the Water Authority website. The Water Authority is committed to a best practices approach to managing its infrastructure capital assets that provides a means to protect, maintain, or improve the asset value of our water distribution system and wastewater collection systems with planned maintenance and repair based on predicted deterioration of the systems. Major parts of the asset management program are the five - year capital plan, the geographical information system (GIS), the financial rate model, the work order system and the SCADA system. Capital spending will continue to rise as the Water Authority executes its expanded $87.1 million fiscal 2021 through 2025 capital program of which substantial portion addresses regulatory needs pertaining to 1,4-dioxane and perfluoroalkyl and polyfluoroalkyl substances (PFAs). The NYS Department of Health requirements will be implemented by wellhead rehabilitation over the next several years. Approximately $50 million of bond funding for the program is expected along with about $7.9 million in grants
Additional information on capital assets is included in Management Discussion and Analysis, page 34 to 38 and note 4 to the financial statements, pages 66 to 67.
[19]
Cash Management The New York State investment statutes govern the Water Authority’s cash investment policies. The Water Authority is authorized to use demand deposits accounts, certificates of deposit, and the US Treasury Bills and Notes. The Water Authority investment policy is to match the maturity of the investment in the US Treasury obligations with its capital expenditure needs. Under the Bond Covenants and policies of the Board, the Water Authority maintains Rate Stabilization and Bond reserve Funds to ensure the stability of revenues and debt service payments. On May 31, 2020, the balances of Rate Stabilization and Bond Reserve Funds were $2.0 million and $9.1 million, respectively. Risk Management The Water Authority maintains comprehensive liability and workers' compensation insurance in accordance with the levels required in our Bond Resolution. All insurance coverage is obtained through commercial insurance companies. In addition to its insurance coverage, the Water Authority is very proactive in safety training and follows all OSHA safety requirements to preserve a safe operating environment for its employees. The Water Authority has elected to self-insure itself for state unemployment insurance. Independent Audit The Water Authority is required to have an annual audit by independent auditors. Tabriztchi & Co., CPA, P.C., Certified Public Accountants, Astoria, New York has conducted an annual audit of the Water Authority's financial statements for the year ended May 31, 2020. The independent auditor's report relating to the audit of the Water Authority's general-purpose financial statements is included in Section B of this report, pages 25 to 26. A report on compliance and on internal control over financial reporting based on an audit of financial statements performed in accordance with government auditing standards is also included in section D, pages 131 and 132. SEC REQUIREMENT Securities and Exchange Commission (SEC) Rule 15c2-12 requires dealers, when underwriting certain types of municipal securities, to ensure that the governmental unit issuing the bonds enters into an agreement to provide certain important information to the Municipal Securities Rulemaking Board (“MSRB”) about the securities on an ongoing basis. This information generally reflects the financial health or operating condition of the state or local government as it changes over time, or the occurrence of specific events that can have an impact on key features of the bonds. The continuing disclosure agreements for new issues, normally require providing Annual Financial Information and the Event Information. Annual Financial Information comprises of operating data and the audited financial statements. The Event Information includes items such as: principal and interest payment delinquencies, non-payment related defaults, unscheduled draws on debt service reserves reflecting financial difficulties, adverse tax opinions or events affecting the tax-exempt status of the security, bond calls and tender offers, defeasances, rating changes and bankruptcy, insolvency or receivership.
[20]
The events, listed in the rule, should be disclosed in a timely manner, not more than 10 business days after the event. Certain information is being provided by the Water Authority in order that participating underwriters may comply with Rule 12c2-12 promulgated by the Securities and Exchange Commission. These disclosures made by the Water Authority can be found on the financial and statistical sections of this Comprehensive Annual Financial Report for the year ended May 31, 2020. AWARD AND ACKNOWLEDGMENT The Government Finance Officers Association (GFOA) awarded a Certificate of Achievement for excellence in Financial Reporting to the Water Authority of Western Nassau County for its comprehensive annual financial report (CAFR) for the fiscal year ended May 31, 2019. This was the ninth consecutive year that the Water Authority has received this prestigious award. In order to be awarded a Certificate of Achievement, the government has to publish an easily readable and efficiently organized CAFR that satisfied both generally accepted accounting principles and applicable legal requirements. A Certificate of Achievement is valid for a period of one year only. We believe that our current CAFR continues to meet the Certificate of Achievement Program’s requirements and we are submitting it to the GFOA to determine its eligibility for another certificate. The preparation of this report would not have been possible without the effort and dedication of the staff of the Accounting department of the Water Authority. I wish to thank all of the Water Authority Departments for their assistance in providing the data necessary to prepare this report. I would also like to express my appreciation to our independent auditors, Tabriztchi & Co., CPA, P.C. for their assistance and dedication in the preparation of this report. Respectfully submitted,
Michael J. Tierney Superintendent New Hyde Park, New York
[21]
Government Finance Officers Association
Certificate of Achievement
for Excellence in Financial
Reporting Presented to
Water Authority of Western Nassau County, New York
For its Comprehensive Annual Financial Report
For the Fiscal Year Ended
May 31, 2019
Executive Director/CEO
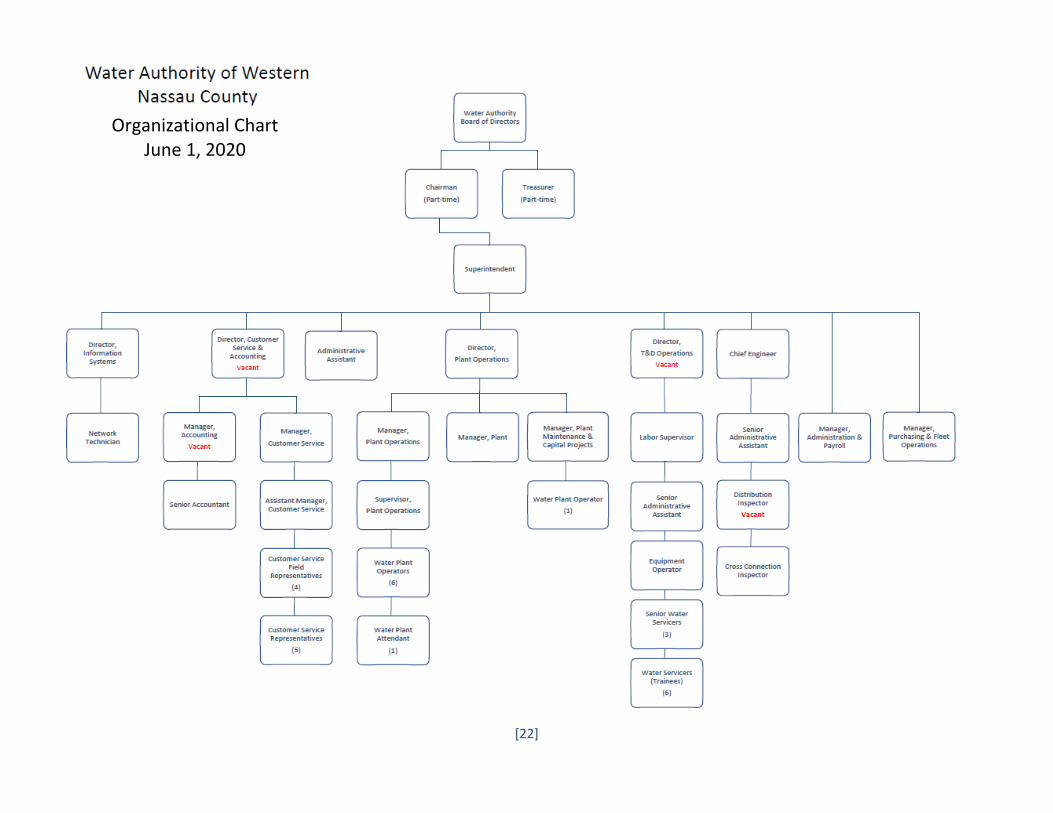
[22]
Organizational Chart June 1, 2020
[23]
COMPREHENSIVE ANNUAL REPORT FISCAL YEAR ENDED MAY 31, 2020
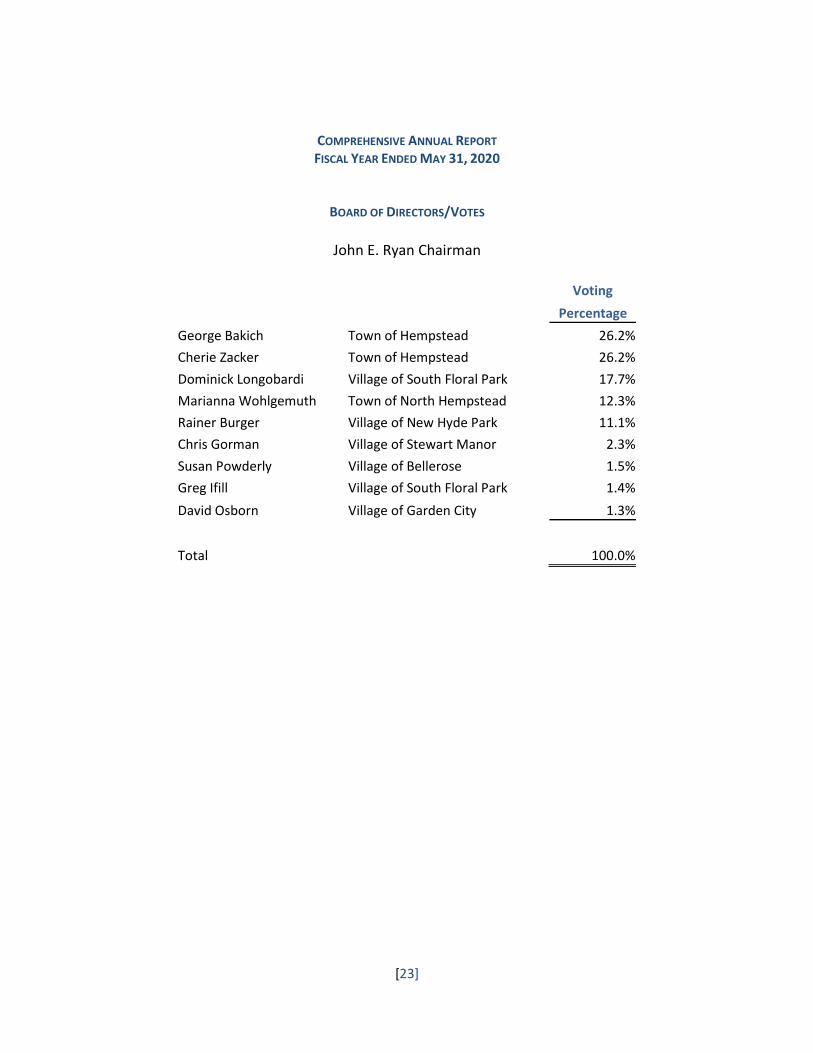
BOARD OF DIRECTORS/VOTES
John E. Ryan Chairman
Voting
Percentage
George Bakich Town of Hempstead 26.2%
Cherie Zacker Town of Hempstead 26.2%
Dominick Longobardi Village of South Floral Park 17.7%
Marianna Wohlgemuth Town of North Hempstead 12.3%
Rainer Burger Village of New Hyde Park 11.1%
Chris Gorman Village of Stewart Manor 2.3%
Susan Powderly Village of Bellerose 1.5%
Greg Ifill Village of South Floral Park 1.4%
David Osborn Village of Garden City 1.3%
Total 100.0%

[24]
THIS PAGE INTENTIONALLY LEFT BLANK
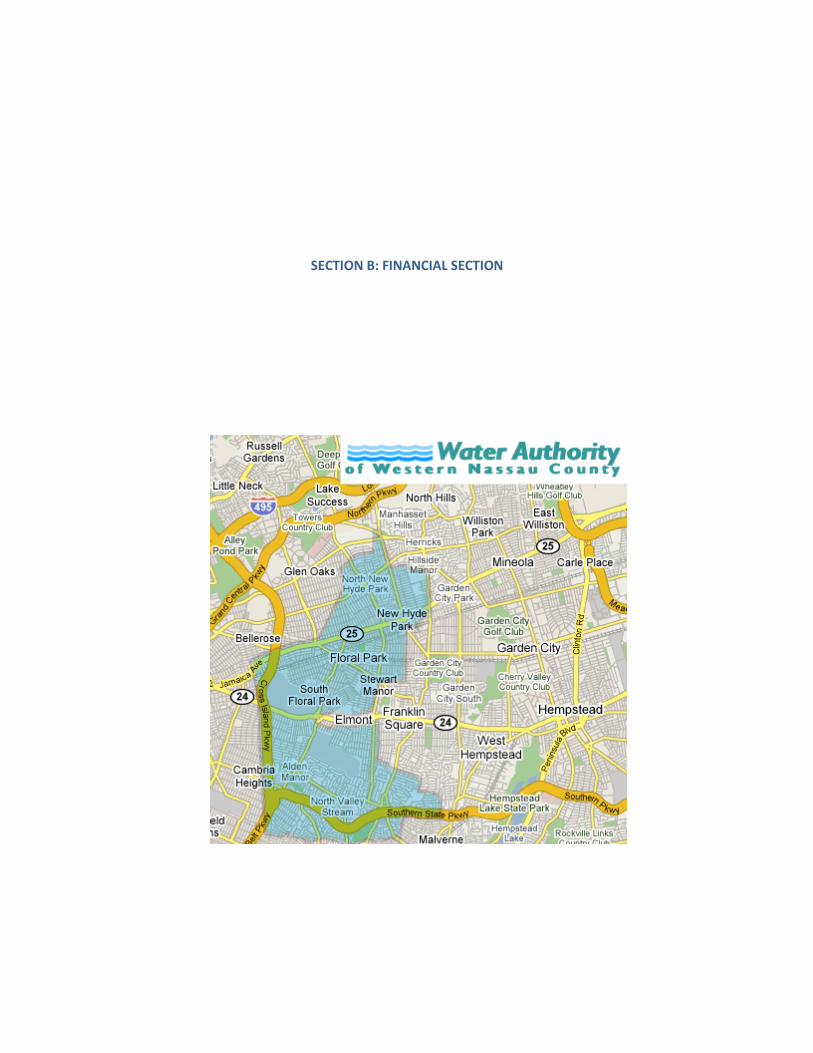
SECTION B: FINANCIAL SECTION

4102 31st Ave, Ste. A, Astoria NY 11103 Tel : 516-746-4200 Fax: 516-746-7900
Email : [email protected] www.Tabrizcpa.com
[25]
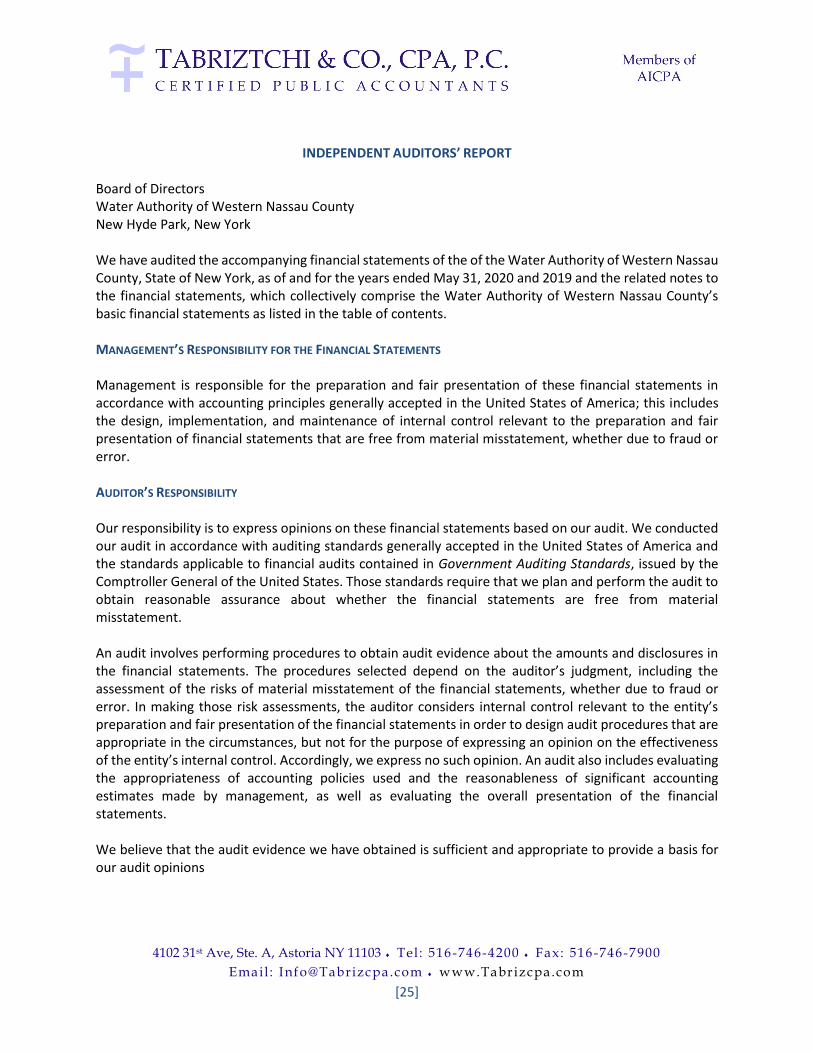
INDEPENDENT AUDITORS’ REPORT
Board of Directors Water Authority of Western Nassau County New Hyde Park, New York We have audited the accompanying financial statements of the of the Water Authority of Western Nassau County, State of New York, as of and for the years ended May 31, 2020 and 2019 and the related notes to the financial statements, which collectively comprise the Water Authority of Western Nassau County’s basic financial statements as listed in the table of contents. MANAGEMENT’S RESPONSIBILITY FOR THE FINANCIAL STATEMENTS Management is responsible for the preparation and fair presentation of these financial statements in accordance with accounting principles generally accepted in the United States of America; this includes the design, implementation, and maintenance of internal control relevant to the preparation and fair presentation of financial statements that are free from material misstatement, whether due to fraud or error. AUDITOR’S RESPONSIBILITY Our responsibility is to express opinions on these financial statements based on our audit. We conducted our audit in accordance with auditing standards generally accepted in the United States of America and the standards applicable to financial audits contained in Government Auditing Standards, issued by the Comptroller General of the United States. Those standards require that we plan and perform the audit to obtain reasonable assurance about whether the financial statements are free from material misstatement. An audit involves performing procedures to obtain audit evidence about the amounts and disclosures in the financial statements. The procedures selected depend on the auditor’s judgment, including the assessment of the risks of material misstatement of the financial statements, whether due to fraud or error. In making those risk assessments, the auditor considers internal control relevant to the entity’s preparation and fair presentation of the financial statements in order to design audit procedures that are appropriate in the circumstances, but not for the purpose of expressing an opinion on the effectiveness of the entity’s internal control. Accordingly, we express no such opinion. An audit also includes evaluating the appropriateness of accounting policies used and the reasonableness of significant accounting estimates made by management, as well as evaluating the overall presentation of the financial statements. We believe that the audit evidence we have obtained is sufficient and appropriate to provide a basis for our audit opinions
[26]
OPINIONS In our opinion, the financial statements referred to above present fairly, in all material respects, the respective financial position of the Water Authority of Western Nassau County, as of May 31, 2020 and 2019 and the respective changes in financial position and, cash flows thereof for the years then ended in conformity with U.S. generally accepted accounting principles. OTHER MATTERS Accounting principles generally accepted in the United States of America require that the management’s discussion and analysis require that the Management’s Discussion the Schedule of Changes in the Net Pension Liability and Related Ratios, and the Schedule of Contributions as listed in the table of contents, be presented to supplement the basic financial statements, as listed in the table of contents, be presented to supplement the basic financial statements. Such information, although not a part of the basic financial statements, is required by the Governmental Accounting Standards Board, who considers it to be an essential part of financial reporting for placing the basic financial statements in an appropriate operational, economic, or historical context. We have applied certain limited procedures to the required supplementary information in accordance with auditing standards generally accepted in the United States of America, which consisted of inquiries of management about the methods of preparing the information and comparing the information for consistency with management’s responses to our inquiries, the basic financial statements, and other knowledge we obtained during our audit of the basic financial statements. We do not express an opinion or provide any assurance on the information because the limited procedures do not provide us with sufficient evidence to express an opinion or provide any assurance. Other Information Our audit was conducted for the purpose of forming opinions on the financial statements that collectively comprise the Water Authority of Nassau County’s basic financial statements. The introductory section and statistical section are presented for purposes of additional analysis and are not a required part of the basic financial statements. The introductory and statistical sections have not been subjected to the auditing procedures applied in the audit of the basic financial statements and, accordingly, we do not express an opinion or provide any assurance on them. OTHER REPORTING REQUIRED BY GOVERNMENT AUDITING STANDARDS In accordance with Government Auditing Standards, we have also issued our report dated August 30, 2019, on our consideration of the Water Authority of Western Nassau County’s internal control over financial reporting and on our tests of its compliance with certain provisions of laws, regulations, contracts, and grant agreements and other matters. The purpose of that report is to describe the scope of our testing of internal control over financial reporting and compliance and the results of that testing, and not to provide an opinion on internal control over financial reporting or on compliance. That report is an integral part of an audit performed in accordance with Government Auditing Standards in considering the Water Authority of Western Nassau County’s internal control over financial reporting and compliance.
Garden City, New York October 30, 2020
MANAGEMENT’S DISCUSSION AND ANALYSIS

THE WATER AUTHORITY OF WESTERN NASSAU COUNTY MANAGEMENT’S DISCUSSION AND ANALYSIS
[27]
The Water Authority of Western Nassau County (the "Water Authority") was established to provide potable water to portions of western Nassau County that encompass the Incorporated Villages of Bellerose, Floral Park, New Hyde Park, South Floral Park, Stewart Manor and portions of Garden City and Valley Stream. The service area also includes the unincorporated areas of Bellerose Terrace, Elmont, Floral Park, Floral Park Centre, New Hyde Park and portions of Franklin Square and North Valley Stream. OVERVIEW OF THE FINANCIAL STATEMENTS This financial report consists of four sections: (1) Management’s Discussion and Analysis (this section); (2) the Financial Statements; (3) Notes to the Financial Statements that explain in more detail some of the information in the Financial Statements and (4) required supplementary information. Management’s Discussion and Analysis (“MD&A”) serves as an introduction to the basic financial statements and provides supplementary information. The MD&A represents management's examination and analysis of the Water Authority’s financial condition and performance. Summary financial statements data, key financial and operational indicators used in the Water Authority’s strategic plan, operating plan, bond covenants and other management tools were used for this analysis. The information contained in this analysis should be used by the reader in conjunction with the information contained in the audited financial statements and the notes to those financial statements. The financial statements report information about the Water Authority. The Water Authority applied full accrual accounting methods as used by similar business activities in the private sector. The statements offer short and long-term financial information. However, rate-regulated accounting principles applicable to private sector utilities are not used by government utilities. The financial statements include the Statement of Net Position; Statement of Revenues, Expenses and Changes in Net Position; Statement of Cash Flows, and the Notes to the Financial Statements. The Statement of Net Position provides information about the nature and amount of investment in resources (assets) and obligations to the Water Authority’s creditors (liabilities), as well as deferred outflows and inflows of resources, with the difference between these amounts being reported as net position. The Statement of Net Position represents the difference between all other elements in a statement of financial position in three components: net investment in capital assets; restricted (distinguishing between major categories or restrictions) and unrestricted. It also provides the basis for computing rate of return, evaluating the capital structure, and assessing the liquidity and financial flexibility of the Water Authority. Over time, increases or decreases in net position serve as a useful indicator of whether the financial position of the Water Authority is improving or deteriorating. The Statement of Revenues, Expenses and Changes in Net Position presents the results of the activities of the Water Authority and information as to how the net position changed during the year. All changes in net position are reported as soon as the underlying event giving rise to the change occurs, regardless of the timing of the related cash flows. This statement also provides information about whether the Water Authority has successfully recovered its costs through its user fees and other charges, its profitability and credit worthiness. The Statement of Cash Flows presents the changes in cash and cash equivalents resulting from operating, investing, and capital financing and non-capital financing activities. The statements present cash receipts
THE WATER AUTHORITY OF WESTERN NASSAU COUNTY MANAGEMENT’S DISCUSSION AND ANALYSIS
[28]
and cash disbursements information, without consideration of the earning events, when an obligation arises or depreciation of capital assets. The notes to the financial statements provide required disclosures and other information that are essential to a full understanding of material data provided in the statements. The notes present information about the Water Authority’s accounting policies, significant account balances and activities, material risks, obligations, commitments, contingencies and subsequent events, if any. In addition to the basic financial statements and accompanying notes, this report also presents certain required supplementary information concerning the Water Authority’s progress in funding its obligation to provide pension and OPEB benefits to its employees. This section presents management’s analysis of the Water Authority’s financial conditions and activities for the fiscal years ended May 31, 2020 and May 31, 2019. Please read this information in conjunction with the financial statements, notes to the financial statements and the supplementary required information which follow this section. FINANCIAL HIGHLIGHTS Management believes the Water Authority’s financial condition is strong and improving. The Water Authority is well within its debt covenants and the more stringent financial policies and guidelines set by its Board. The following are financial highlights: ▪ Total assets as of May 31, 2020 were $152.4 million, deferred outflows were $3.2 million and exceeded
total liabilities of $123.9 million and deferred inflows of $1.5 million by $30.1 million (i.e., net position). Of the total net position, $32.2 million was invested in capital assets, $2.0 million in restricted net position and unrestricted net position had a deficit balance of $4.1 million. The deficit in the unrestricted net position has been the result of implementing Government Accounting Standards Board Statement 75, Accounting and financial reporting for postemployment benefits other than pensions and recognizing additional long-term liability for other post-employment benefits, since May 31, 2018.
▪ Total assets decreased by $1.3 million (0.9%) between May 31, 2019 and May 31, 2020. Net position increased by $2.3 million (8.3%) over the same period last year and the economic and financial position of the Water Authority improved.
▪ Operating revenues were $18.0 million, showing an increase of $0.5 million (3.0%), as compared to $0.5 million (2.5%) decline in the previous year. The increased revenues from residential water sales were $0.7 million (5.7%) and decrease in commercial municipal and other water sale revenues was $.1 million (2.3%). The residential water sales were affected by the rate increases of 3.83% offset by approximately 1.0% lower consumption.
▪ Total operating expenses increased by $0.7 million (5.6%), from $11.8 million to $12.4 million, for the fiscal years ended May 31, 2019 and May 31, 2020. The rise in operating expenses was primarily the net result of $0.6 million (7.7%) increase in operations expenses. The total operating expenses had increased $0.2 million (1.7%) in the previous year, principally due to higher operations expenses.
▪ Operating income for the fiscal years ended May 31, 2020 and 2019 were $5.6 and $5.8 million. The decrease in operating income of $.1 million (2.2%), in the current year, follows the decrease $0.7 million (10.2%), in the previous year. The decrease in operating income is related to lower water sales.
THE WATER AUTHORITY OF WESTERN NASSAU COUNTY MANAGEMENT’S DISCUSSION AND ANALYSIS
[29]
▪ The total principal payment and premium amortization of the Water Authority’s long-term bonded debt was $3.0 million (2.7%). On May 31, 2020, the outstanding principal balance and unamortized premium of the Water Authority’s bonds payable were $100 million and $8 million, respectively.
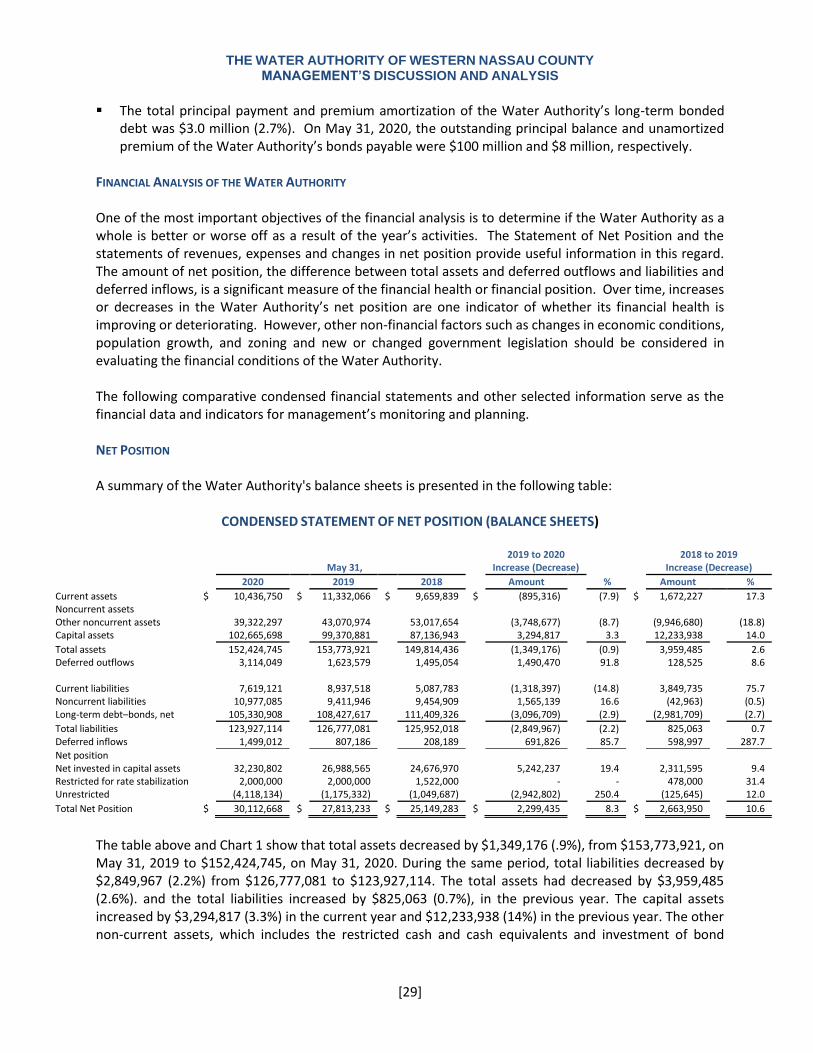
FINANCIAL ANALYSIS OF THE WATER AUTHORITY One of the most important objectives of the financial analysis is to determine if the Water Authority as a whole is better or worse off as a result of the year’s activities. The Statement of Net Position and the statements of revenues, expenses and changes in net position provide useful information in this regard. The amount of net position, the difference between total assets and deferred outflows and liabilities and deferred inflows, is a significant measure of the financial health or financial position. Over time, increases or decreases in the Water Authority’s net position are one indicator of whether its financial health is improving or deteriorating. However, other non-financial factors such as changes in economic conditions, population growth, and zoning and new or changed government legislation should be considered in evaluating the financial conditions of the Water Authority. The following comparative condensed financial statements and other selected information serve as the financial data and indicators for management’s monitoring and planning. NET POSITION A summary of the Water Authority's balance sheets is presented in the following table:
CONDENSED STATEMENT OF NET POSITION (BALANCE SHEETS)
2019 to 2020 2018 to 2019 May 31, Increase (Decrease) Increase (Decrease) 2020 2019 2018 Amount % Amount %
Current assets $ 10,436,750 $ 11,332,066 $ 9,659,839 $ (895,316) (7.9) $ 1,672,227 17.3 Noncurrent assets Other noncurrent assets 39,322,297 43,070,974 53,017,654 (3,748,677) (8.7) (9,946,680) (18.8) Capital assets 102,665,698 99,370,881 87,136,943 3,294,817 3.3 12,233,938 14.0
Total assets 152,424,745 153,773,921 149,814,436 (1,349,176) (0.9) 3,959,485 2.6 Deferred outflows 3,114,049 1,623,579 1,495,054 1,490,470 91.8 128,525 8.6
Current liabilities 7,619,121 8,937,518 5,087,783 (1,318,397) (14.8) 3,849,735 75.7 Noncurrent liabilities 10,977,085 9,411,946 9,454,909 1,565,139 16.6 (42,963) (0.5) Long-term debt–bonds, net 105,330,908 108,427,617 111,409,326 (3,096,709) (2.9) (2,981,709) (2.7)
Total liabilities 123,927,114 126,777,081 125,952,018 (2,849,967) (2.2) 825,063 0.7 Deferred inflows 1,499,012 807,186 208,189 691,826 85.7 598,997 287.7
Net position Net invested in capital assets 32,230,802 26,988,565 24,676,970 5,242,237 19.4 2,311,595 9.4 Restricted for rate stabilization 2,000,000 2,000,000 1,522,000 - - 478,000 31.4 Unrestricted (4,118,134) (1,175,332) (1,049,687) (2,942,802) 250.4 (125,645) 12.0
Total Net Position $ 30,112,668 $ 27,813,233 $ 25,149,283 $ 2,299,435 8.3 $ 2,663,950 10.6
The table above and Chart 1 show that total assets decreased by $1,349,176 (.9%), from $153,773,921, on May 31, 2019 to $152,424,745, on May 31, 2020. During the same period, total liabilities decreased by $2,849,967 (2.2%) from $126,777,081 to $123,927,114. The total assets had decreased by $3,959,485 (2.6%). and the total liabilities increased by $825,063 (0.7%), in the previous year. The capital assets increased by $3,294,817 (3.3%) in the current year and $12,233,938 (14%) in the previous year. The other non-current assets, which includes the restricted cash and cash equivalents and investment of bond
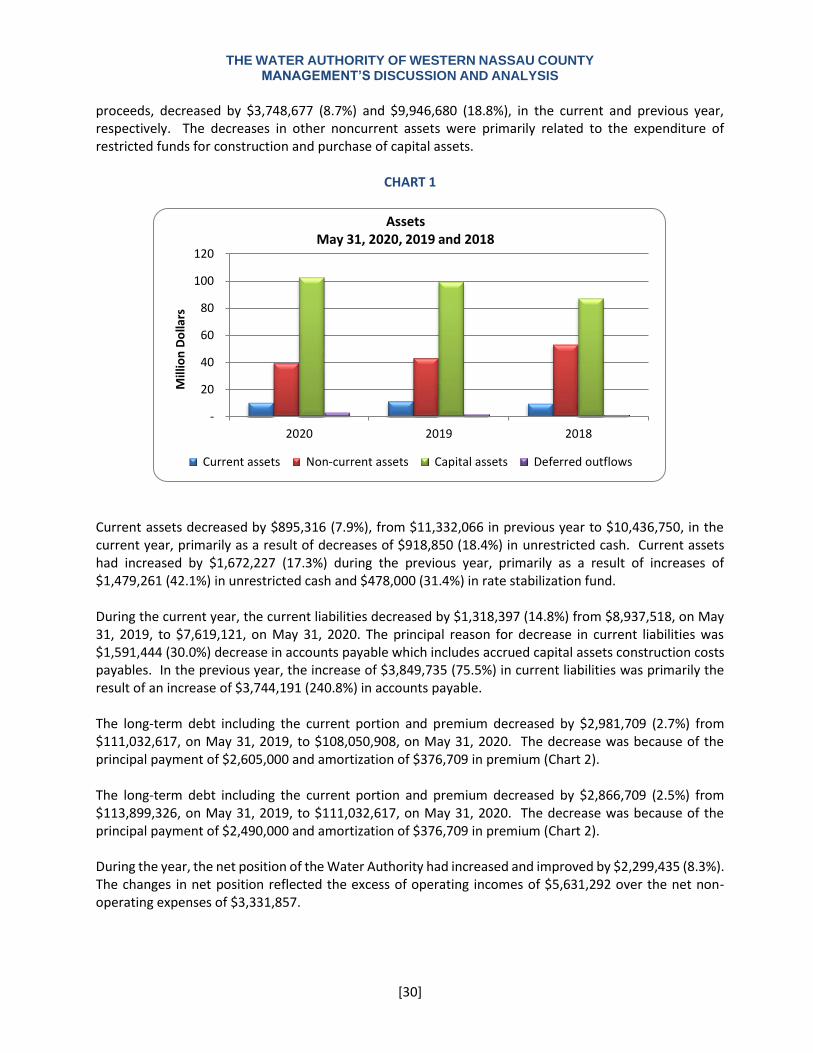
THE WATER AUTHORITY OF WESTERN NASSAU COUNTY MANAGEMENT’S DISCUSSION AND ANALYSIS
[30]
proceeds, decreased by $3,748,677 (8.7%) and $9,946,680 (18.8%), in the current and previous year, respectively. The decreases in other noncurrent assets were primarily related to the expenditure of restricted funds for construction and purchase of capital assets.
CHART 1
Current assets decreased by $895,316 (7.9%), from $11,332,066 in previous year to $10,436,750, in the current year, primarily as a result of decreases of $918,850 (18.4%) in unrestricted cash. Current assets had increased by $1,672,227 (17.3%) during the previous year, primarily as a result of increases of $1,479,261 (42.1%) in unrestricted cash and $478,000 (31.4%) in rate stabilization fund. During the current year, the current liabilities decreased by $1,318,397 (14.8%) from $8,937,518, on May 31, 2019, to $7,619,121, on May 31, 2020. The principal reason for decrease in current liabilities was $1,591,444 (30.0%) decrease in accounts payable which includes accrued capital assets construction costs payables. In the previous year, the increase of $3,849,735 (75.5%) in current liabilities was primarily the result of an increase of $3,744,191 (240.8%) in accounts payable. The long-term debt including the current portion and premium decreased by $2,981,709 (2.7%) from $111,032,617, on May 31, 2019, to $108,050,908, on May 31, 2020. The decrease was because of the principal payment of $2,605,000 and amortization of $376,709 in premium (Chart 2). The long-term debt including the current portion and premium decreased by $2,866,709 (2.5%) from $113,899,326, on May 31, 2019, to $111,032,617, on May 31, 2020. The decrease was because of the principal payment of $2,490,000 and amortization of $376,709 in premium (Chart 2). During the year, the net position of the Water Authority had increased and improved by $2,299,435 (8.3%). The changes in net position reflected the excess of operating incomes of $5,631,292 over the net non-operating expenses of $3,331,857.
-
20
40
60
80
100
120
2020 2019 2018
Mill
ion
Do
llars
AssetsMay 31, 2020, 2019 and 2018
Current assets Non-current assets Capital assets Deferred outflows
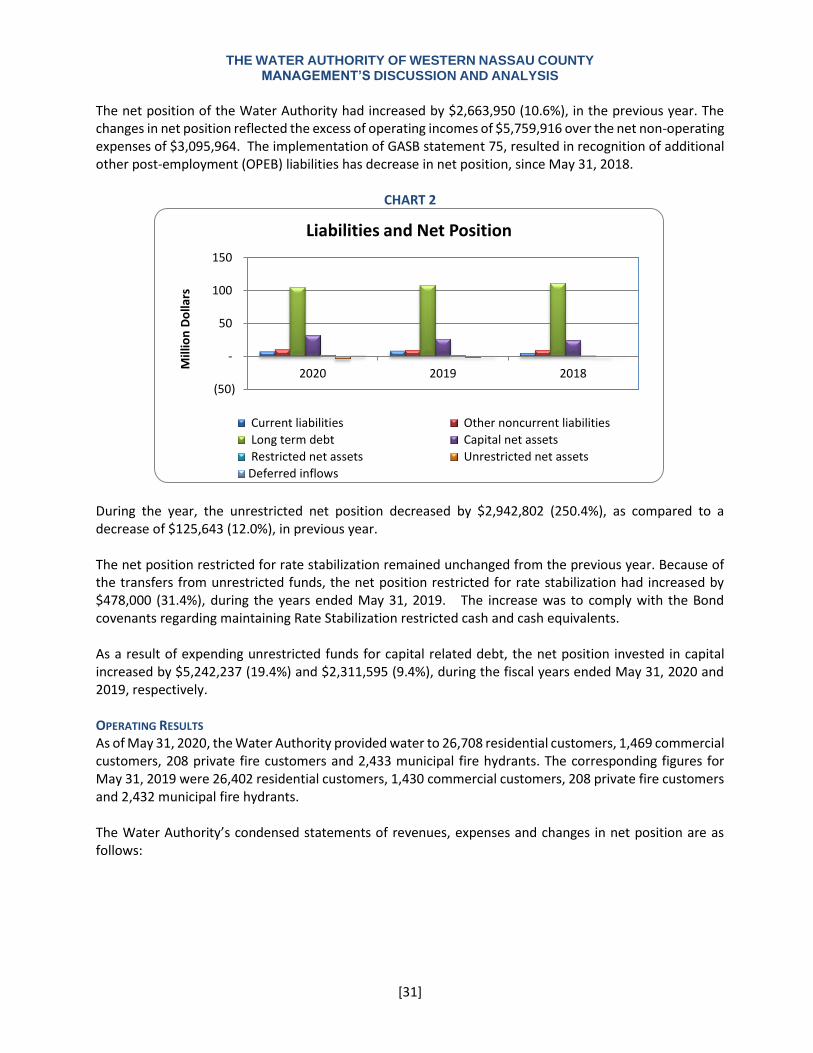
THE WATER AUTHORITY OF WESTERN NASSAU COUNTY MANAGEMENT’S DISCUSSION AND ANALYSIS
[31]
The net position of the Water Authority had increased by $2,663,950 (10.6%), in the previous year. The changes in net position reflected the excess of operating incomes of $5,759,916 over the net non-operating expenses of $3,095,964. The implementation of GASB statement 75, resulted in recognition of additional other post-employment (OPEB) liabilities has decrease in net position, since May 31, 2018.
CHART 2
During the year, the unrestricted net position decreased by $2,942,802 (250.4%), as compared to a decrease of $125,643 (12.0%), in previous year. The net position restricted for rate stabilization remained unchanged from the previous year. Because of the transfers from unrestricted funds, the net position restricted for rate stabilization had increased by $478,000 (31.4%), during the years ended May 31, 2019. The increase was to comply with the Bond covenants regarding maintaining Rate Stabilization restricted cash and cash equivalents. As a result of expending unrestricted funds for capital related debt, the net position invested in capital increased by $5,242,237 (19.4%) and $2,311,595 (9.4%), during the fiscal years ended May 31, 2020 and 2019, respectively. OPERATING RESULTS As of May 31, 2020, the Water Authority provided water to 26,708 residential customers, 1,469 commercial customers, 208 private fire customers and 2,433 municipal fire hydrants. The corresponding figures for May 31, 2019 were 26,402 residential customers, 1,430 commercial customers, 208 private fire customers and 2,432 municipal fire hydrants. The Water Authority’s condensed statements of revenues, expenses and changes in net position are as follows:
(50)
-
50
100
150
2020 2019 2018
Mill
ion
Do
llars
Liabilities and Net Position
Current liabilities Other noncurrent liabilities
Long term debt Capital net assets
Restricted net assets Unrestricted net assets
Deferred inflows
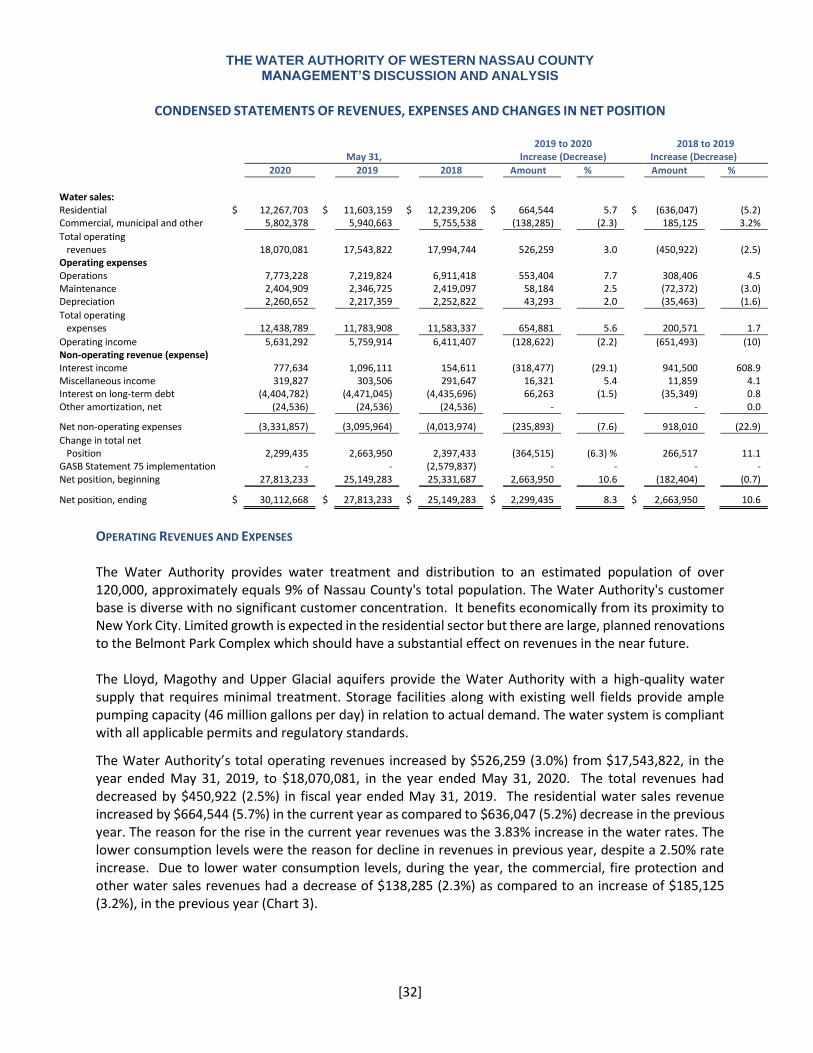
THE WATER AUTHORITY OF WESTERN NASSAU COUNTY MANAGEMENT’S DISCUSSION AND ANALYSIS
[32]
CONDENSED STATEMENTS OF REVENUES, EXPENSES AND CHANGES IN NET POSITION
2019 to 2020 2018 to 2019 May 31, Increase (Decrease) Increase (Decrease)
2020 2019 2018 Amount % Amount % Water sales:
Residential $ 12,267,703 $ 11,603,159 $ 12,239,206 $ 664,544 5.7 $ (636,047) (5.2) Commercial, municipal and other 5,802,378 5,940,663 5,755,538 (138,285) (2.3) 185,125 3.2%
Total operating revenues
18,070,081 17,543,822 17,994,744 526,259 3.0 (450,922) (2.5)
Operating expenses Operations 7,773,228 7,219,824 6,911,418 553,404 7.7 308,406 4.5 Maintenance 2,404,909 2,346,725 2,419,097 58,184 2.5 (72,372) (3.0) Depreciation 2,260,652 2,217,359 2,252,822 43,293 2.0 (35,463) (1.6)
Total operating expenses
12,438,789 11,783,908 11,583,337 654,881 5.6 200,571 1.7
Operating income 5,631,292 5,759,914 6,411,407 (128,622) (2.2) (651,493) (10) Non-operating revenue (expense) Interest income 777,634 1,096,111 154,611 (318,477) (29.1) 941,500 608.9 Miscellaneous income 319,827 303,506 291,647 16,321 5.4 11,859 4.1 Interest on long-term debt (4,404,782) (4,471,045) (4,435,696) 66,263 (1.5) (35,349) 0.8 Other amortization, net (24,536) (24,536) (24,536) - - 0.0
Net non-operating expenses
(3,331,857) (3,095,964) (4,013,974) (235,893) (7.6) 918,010 (22.9)
Change in total net Position
2,299,435 2,663,950 2,397,433 (364,515) (6.3) % 266,517 11.1
GASB Statement 75 implementation - - (2,579,837) - - - - Net position, beginning 27,813,233 25,149,283 25,331,687 2,663,950 10.6 (182,404) (0.7)
Net position, ending $ 30,112,668 $ 27,813,233 $ 25,149,283 $ 2,299,435 8.3 $ 2,663,950 10.6
OPERATING REVENUES AND EXPENSES The Water Authority provides water treatment and distribution to an estimated population of over 120,000, approximately equals 9% of Nassau County's total population. The Water Authority's customer base is diverse with no significant customer concentration. It benefits economically from its proximity to New York City. Limited growth is expected in the residential sector but there are large, planned renovations to the Belmont Park Complex which should have a substantial effect on revenues in the near future. The Lloyd, Magothy and Upper Glacial aquifers provide the Water Authority with a high-quality water supply that requires minimal treatment. Storage facilities along with existing well fields provide ample pumping capacity (46 million gallons per day) in relation to actual demand. The water system is compliant with all applicable permits and regulatory standards.
The Water Authority’s total operating revenues increased by $526,259 (3.0%) from $17,543,822, in the year ended May 31, 2019, to $18,070,081, in the year ended May 31, 2020. The total revenues had decreased by $450,922 (2.5%) in fiscal year ended May 31, 2019. The residential water sales revenue increased by $664,544 (5.7%) in the current year as compared to $636,047 (5.2%) decrease in the previous year. The reason for the rise in the current year revenues was the 3.83% increase in the water rates. The lower consumption levels were the reason for decline in revenues in previous year, despite a 2.50% rate increase. Due to lower water consumption levels, during the year, the commercial, fire protection and other water sales revenues had a decrease of $138,285 (2.3%) as compared to an increase of $185,125 (3.2%), in the previous year (Chart 3).
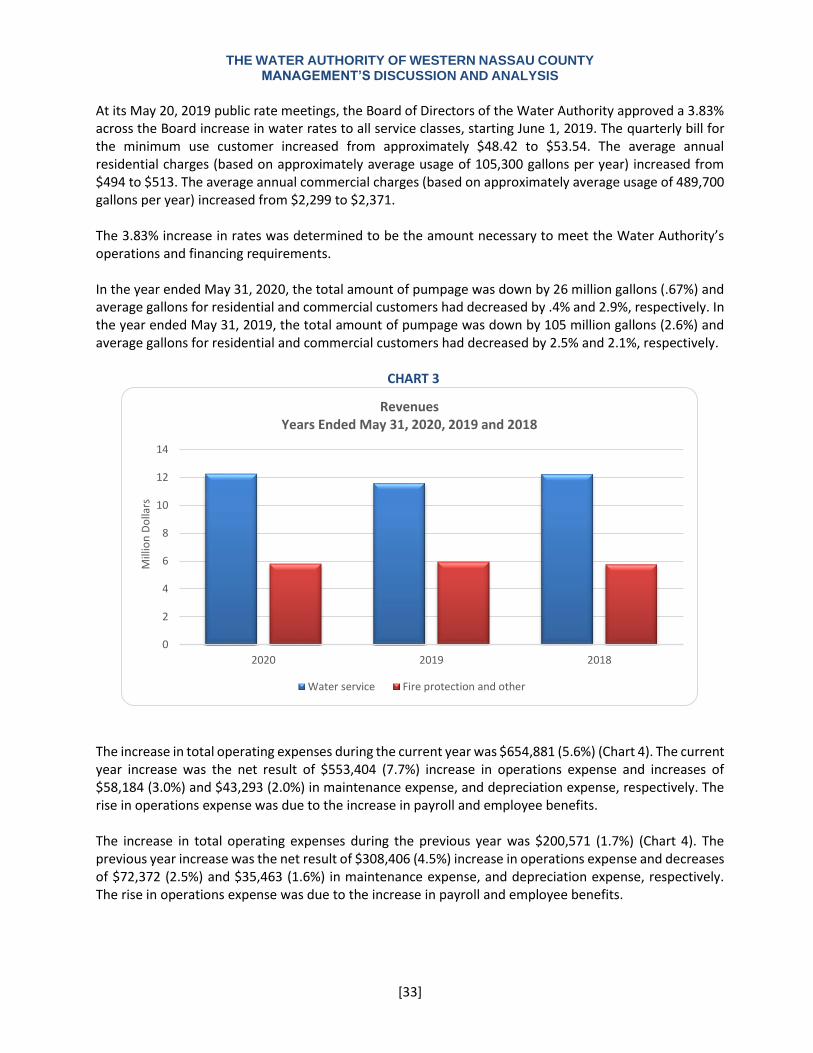
THE WATER AUTHORITY OF WESTERN NASSAU COUNTY MANAGEMENT’S DISCUSSION AND ANALYSIS
[33]
At its May 20, 2019 public rate meetings, the Board of Directors of the Water Authority approved a 3.83% across the Board increase in water rates to all service classes, starting June 1, 2019. The quarterly bill for the minimum use customer increased from approximately $48.42 to $53.54. The average annual residential charges (based on approximately average usage of 105,300 gallons per year) increased from $494 to $513. The average annual commercial charges (based on approximately average usage of 489,700 gallons per year) increased from $2,299 to $2,371. The 3.83% increase in rates was determined to be the amount necessary to meet the Water Authority’s operations and financing requirements. In the year ended May 31, 2020, the total amount of pumpage was down by 26 million gallons (.67%) and average gallons for residential and commercial customers had decreased by .4% and 2.9%, respectively. In the year ended May 31, 2019, the total amount of pumpage was down by 105 million gallons (2.6%) and average gallons for residential and commercial customers had decreased by 2.5% and 2.1%, respectively.
CHART 3
The increase in total operating expenses during the current year was $654,881 (5.6%) (Chart 4). The current year increase was the net result of $553,404 (7.7%) increase in operations expense and increases of $58,184 (3.0%) and $43,293 (2.0%) in maintenance expense, and depreciation expense, respectively. The rise in operations expense was due to the increase in payroll and employee benefits. The increase in total operating expenses during the previous year was $200,571 (1.7%) (Chart 4). The previous year increase was the net result of $308,406 (4.5%) increase in operations expense and decreases of $72,372 (2.5%) and $35,463 (1.6%) in maintenance expense, and depreciation expense, respectively. The rise in operations expense was due to the increase in payroll and employee benefits.
0
2
4
6
8
10
12
14
2020 2019 2018
Mill
ion
Do
llars
RevenuesYears Ended May 31, 2020, 2019 and 2018
Water service Fire protection and other
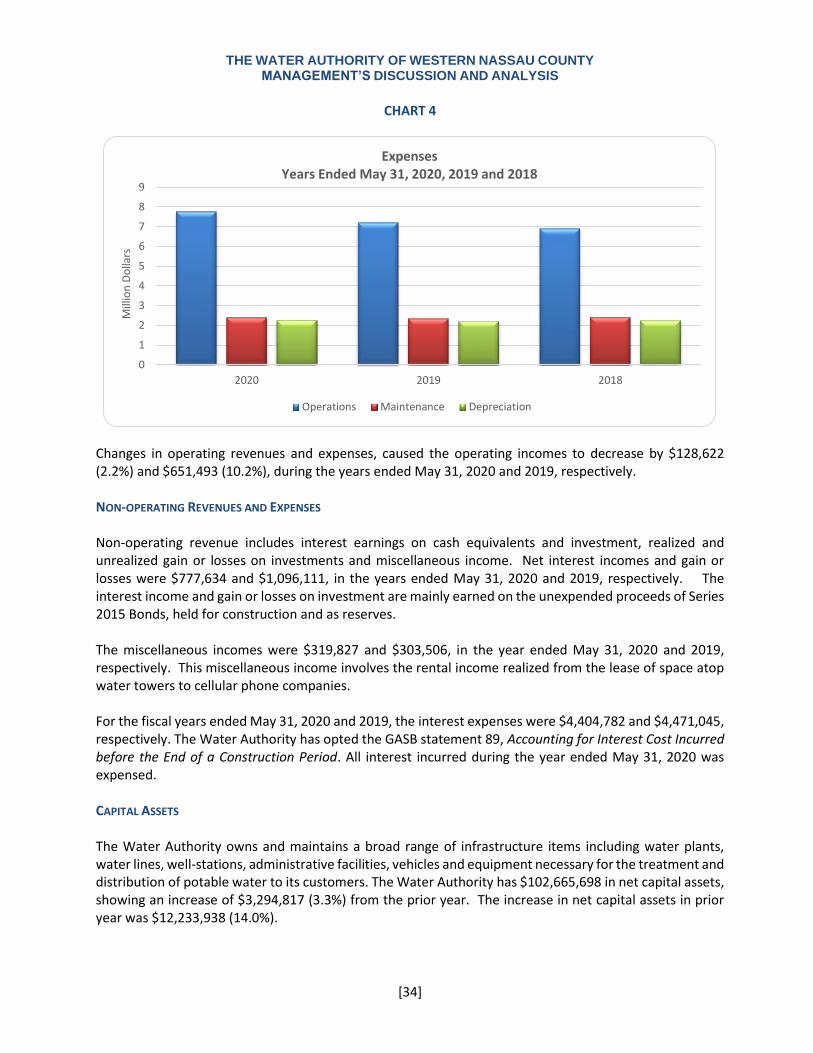
THE WATER AUTHORITY OF WESTERN NASSAU COUNTY MANAGEMENT’S DISCUSSION AND ANALYSIS
[34]
CHART 4
Changes in operating revenues and expenses, caused the operating incomes to decrease by $128,622 (2.2%) and $651,493 (10.2%), during the years ended May 31, 2020 and 2019, respectively. NON-OPERATING REVENUES AND EXPENSES Non-operating revenue includes interest earnings on cash equivalents and investment, realized and unrealized gain or losses on investments and miscellaneous income. Net interest incomes and gain or losses were $777,634 and $1,096,111, in the years ended May 31, 2020 and 2019, respectively. The interest income and gain or losses on investment are mainly earned on the unexpended proceeds of Series 2015 Bonds, held for construction and as reserves. The miscellaneous incomes were $319,827 and $303,506, in the year ended May 31, 2020 and 2019, respectively. This miscellaneous income involves the rental income realized from the lease of space atop water towers to cellular phone companies. For the fiscal years ended May 31, 2020 and 2019, the interest expenses were $4,404,782 and $4,471,045, respectively. The Water Authority has opted the GASB statement 89, Accounting for Interest Cost Incurred before the End of a Construction Period. All interest incurred during the year ended May 31, 2020 was expensed. CAPITAL ASSETS The Water Authority owns and maintains a broad range of infrastructure items including water plants, water lines, well-stations, administrative facilities, vehicles and equipment necessary for the treatment and distribution of potable water to its customers. The Water Authority has $102,665,698 in net capital assets, showing an increase of $3,294,817 (3.3%) from the prior year. The increase in net capital assets in prior year was $12,233,938 (14.0%).
0
1
2
3
4
5
6
7
8
9
2020 2019 2018
Mill
ion
Do
llars
ExpensesYears Ended May 31, 2020, 2019 and 2018
Operations Maintenance Depreciation
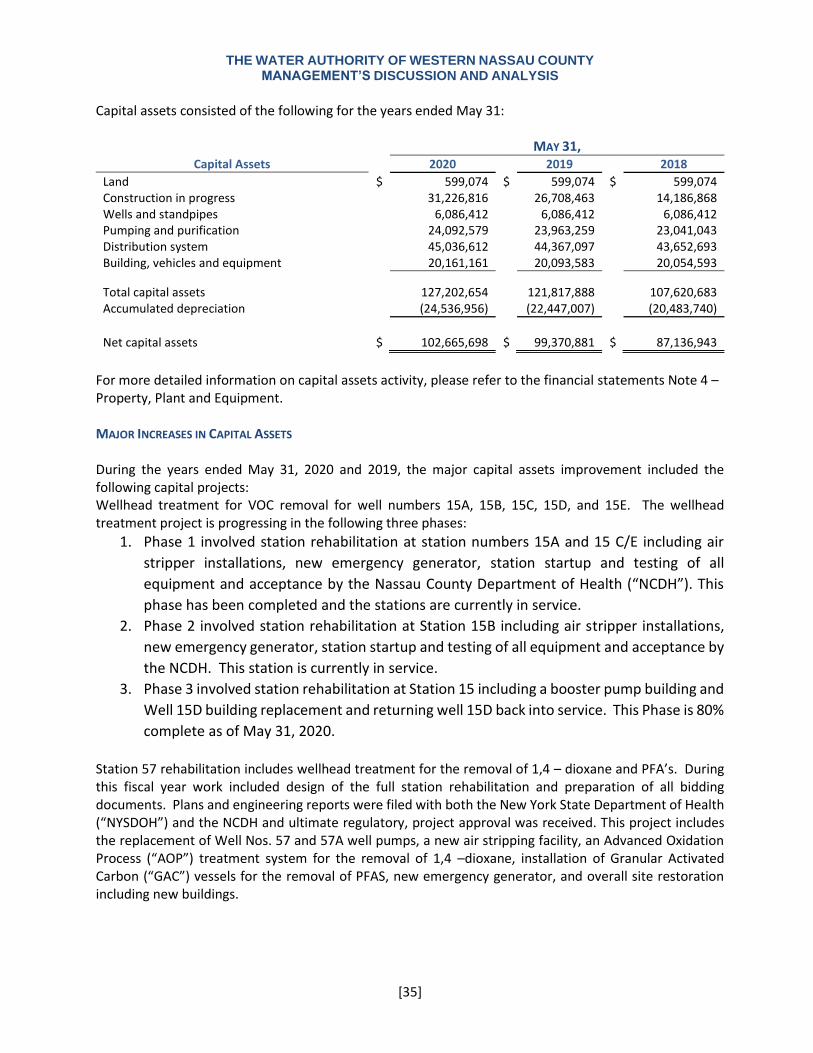
THE WATER AUTHORITY OF WESTERN NASSAU COUNTY MANAGEMENT’S DISCUSSION AND ANALYSIS
[35]
Capital assets consisted of the following for the years ended May 31:
MAY 31, Capital Assets 2020 2019 2018
Land $ 599,074 $ 599,074 $ 599,074 Construction in progress 31,226,816 26,708,463 14,186,868 Wells and standpipes 6,086,412 6,086,412 6,086,412 Pumping and purification 24,092,579 23,963,259 23,041,043 Distribution system 45,036,612 44,367,097 43,652,693 Building, vehicles and equipment 20,161,161 20,093,583 20,054,593
Total capital assets
127,202,654 121,817,888 107,620,683 Accumulated depreciation (24,536,956) (22,447,007) (20,483,740)
Net capital assets
$ 102,665,698 $ 99,370,881 $ 87,136,943
For more detailed information on capital assets activity, please refer to the financial statements Note 4 – Property, Plant and Equipment. MAJOR INCREASES IN CAPITAL ASSETS During the years ended May 31, 2020 and 2019, the major capital assets improvement included the following capital projects: Wellhead treatment for VOC removal for well numbers 15A, 15B, 15C, 15D, and 15E. The wellhead treatment project is progressing in the following three phases:
1. Phase 1 involved station rehabilitation at station numbers 15A and 15 C/E including air
stripper installations, new emergency generator, station startup and testing of all
equipment and acceptance by the Nassau County Department of Health (“NCDH”). This
phase has been completed and the stations are currently in service.
2. Phase 2 involved station rehabilitation at Station 15B including air stripper installations,
new emergency generator, station startup and testing of all equipment and acceptance by
the NCDH. This station is currently in service.
3. Phase 3 involved station rehabilitation at Station 15 including a booster pump building and
Well 15D building replacement and returning well 15D back into service. This Phase is 80%
complete as of May 31, 2020. Station 57 rehabilitation includes wellhead treatment for the removal of 1,4 – dioxane and PFA’s. During this fiscal year work included design of the full station rehabilitation and preparation of all bidding documents. Plans and engineering reports were filed with both the New York State Department of Health (“NYSDOH”) and the NCDH and ultimate regulatory, project approval was received. This project includes the replacement of Well Nos. 57 and 57A well pumps, a new air stripping facility, an Advanced Oxidation Process (“AOP”) treatment system for the removal of 1,4 –dioxane, installation of Granular Activated Carbon (“GAC”) vessels for the removal of PFAS, new emergency generator, and overall site restoration including new buildings.
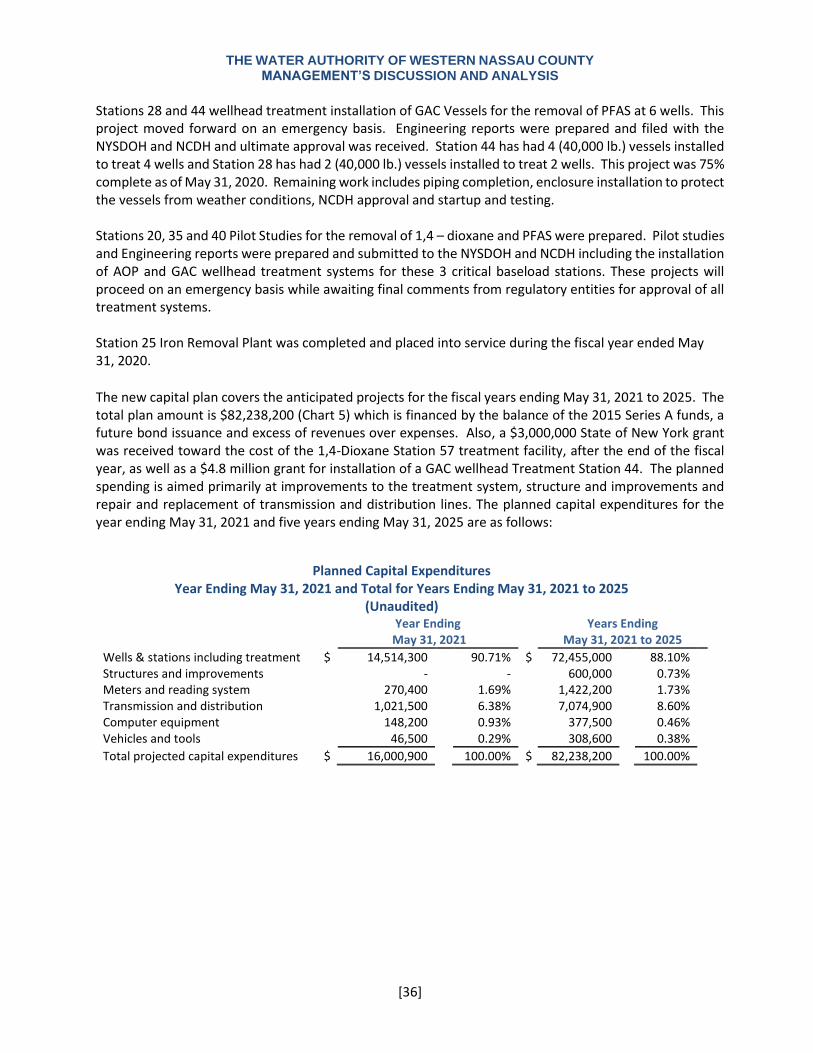
THE WATER AUTHORITY OF WESTERN NASSAU COUNTY MANAGEMENT’S DISCUSSION AND ANALYSIS
[36]
Stations 28 and 44 wellhead treatment installation of GAC Vessels for the removal of PFAS at 6 wells. This project moved forward on an emergency basis. Engineering reports were prepared and filed with the NYSDOH and NCDH and ultimate approval was received. Station 44 has had 4 (40,000 lb.) vessels installed to treat 4 wells and Station 28 has had 2 (40,000 lb.) vessels installed to treat 2 wells. This project was 75% complete as of May 31, 2020. Remaining work includes piping completion, enclosure installation to protect the vessels from weather conditions, NCDH approval and startup and testing. Stations 20, 35 and 40 Pilot Studies for the removal of 1,4 – dioxane and PFAS were prepared. Pilot studies and Engineering reports were prepared and submitted to the NYSDOH and NCDH including the installation of AOP and GAC wellhead treatment systems for these 3 critical baseload stations. These projects will proceed on an emergency basis while awaiting final comments from regulatory entities for approval of all treatment systems. Station 25 Iron Removal Plant was completed and placed into service during the fiscal year ended May 31, 2020.
The new capital plan covers the anticipated projects for the fiscal years ending May 31, 2021 to 2025. The total plan amount is $82,238,200 (Chart 5) which is financed by the balance of the 2015 Series A funds, a future bond issuance and excess of revenues over expenses. Also, a $3,000,000 State of New York grant was received toward the cost of the 1,4-Dioxane Station 57 treatment facility, after the end of the fiscal year, as well as a $4.8 million grant for installation of a GAC wellhead Treatment Station 44. The planned spending is aimed primarily at improvements to the treatment system, structure and improvements and repair and replacement of transmission and distribution lines. The planned capital expenditures for the year ending May 31, 2021 and five years ending May 31, 2025 are as follows:
Planned Capital Expenditures Year Ending May 31, 2021 and Total for Years Ending May 31, 2021 to 2025
(Unaudited) Year Ending Years Ending
May 31, 2021 May 31, 2021 to 2025
Wells & stations including treatment $ 14,514,300 90.71% $ 72,455,000 88.10% Structures and improvements - - 600,000 0.73% Meters and reading system 270,400 1.69% 1,422,200 1.73% Transmission and distribution 1,021,500 6.38% 7,074,900 8.60% Computer equipment 148,200 0.93% 377,500 0.46% Vehicles and tools 46,500 0.29% 308,600 0.38%
Total projected capital expenditures $ 16,000,900 100.00% $ 82,238,200 100.00%
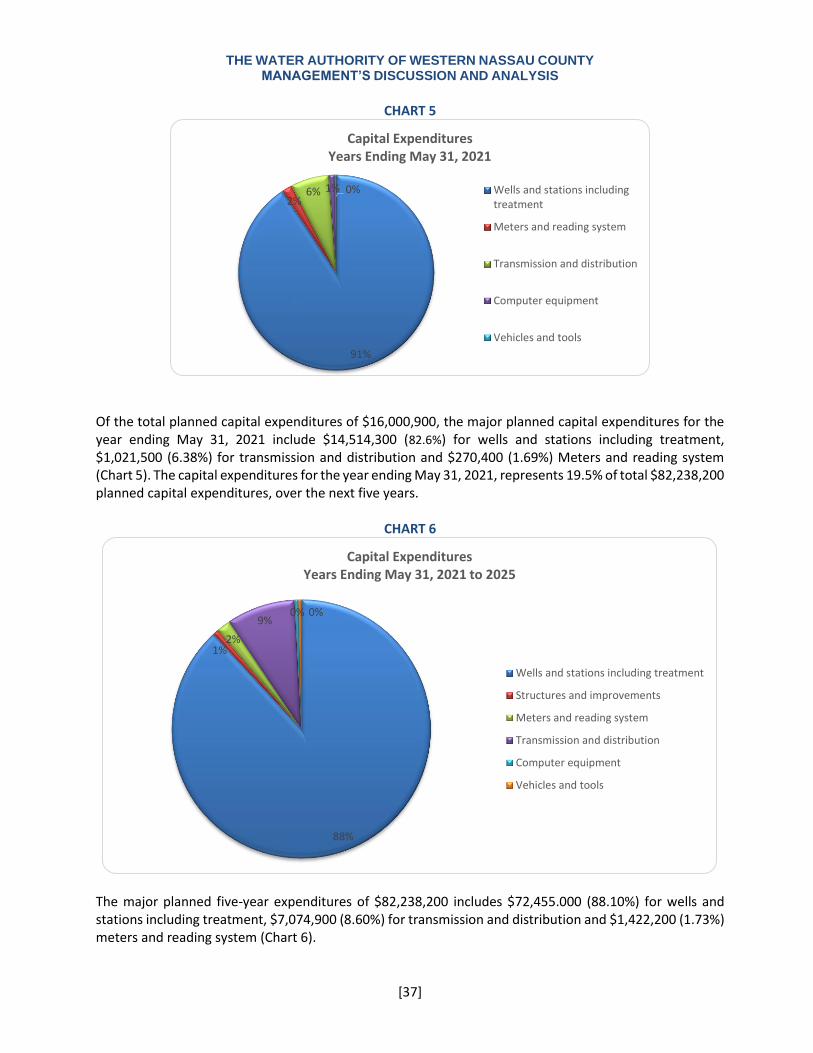
THE WATER AUTHORITY OF WESTERN NASSAU COUNTY MANAGEMENT’S DISCUSSION AND ANALYSIS
[37]
CHART 5
Of the total planned capital expenditures of $16,000,900, the major planned capital expenditures for the year ending May 31, 2021 include $14,514,300 (82.6%) for wells and stations including treatment, $1,021,500 (6.38%) for transmission and distribution and $270,400 (1.69%) Meters and reading system (Chart 5). The capital expenditures for the year ending May 31, 2021, represents 19.5% of total $82,238,200 planned capital expenditures, over the next five years.
CHART 6
The major planned five-year expenditures of $82,238,200 includes $72,455.000 (88.10%) for wells and stations including treatment, $7,074,900 (8.60%) for transmission and distribution and $1,422,200 (1.73%) meters and reading system (Chart 6).
91%
2%6% 1% 0%
Capital ExpendituresYears Ending May 31, 2021
Wells and stations includingtreatment
Meters and reading system
Transmission and distribution
Computer equipment
Vehicles and tools
88%
1%2%
9%0% 0%
Capital ExpendituresYears Ending May 31, 2021 to 2025
Wells and stations including treatment
Structures and improvements
Meters and reading system
Transmission and distribution
Computer equipment
Vehicles and tools
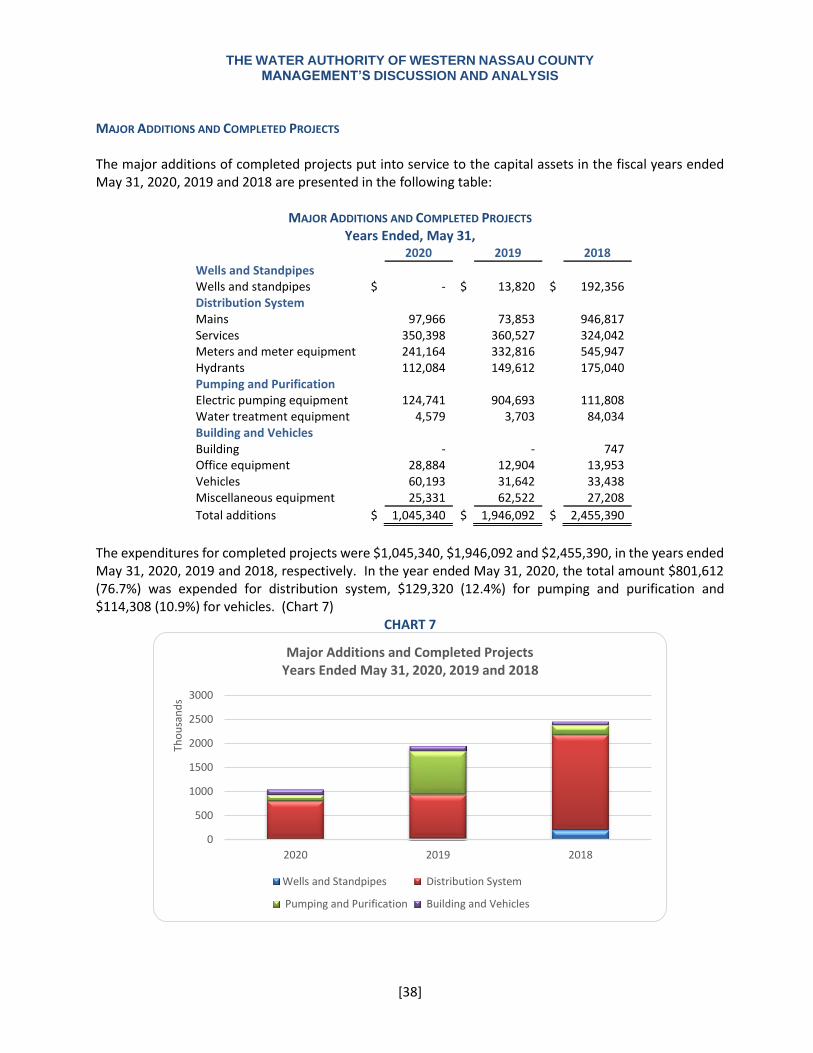
THE WATER AUTHORITY OF WESTERN NASSAU COUNTY MANAGEMENT’S DISCUSSION AND ANALYSIS
[38]
MAJOR ADDITIONS AND COMPLETED PROJECTS The major additions of completed projects put into service to the capital assets in the fiscal years ended May 31, 2020, 2019 and 2018 are presented in the following table:
MAJOR ADDITIONS AND COMPLETED PROJECTS Years Ended, May 31,
2020 2019 2018
Wells and Standpipes Wells and standpipes $ - $ 13,820 $ 192,356 Distribution System Mains 97,966 73,853 946,817 Services 350,398 360,527 324,042 Meters and meter equipment 241,164 332,816 545,947 Hydrants 112,084 149,612 175,040 Pumping and Purification Electric pumping equipment 124,741 904,693 111,808 Water treatment equipment 4,579 3,703 84,034 Building and Vehicles Building - - 747 Office equipment 28,884 12,904 13,953 Vehicles 60,193 31,642 33,438 Miscellaneous equipment 25,331 62,522 27,208
Total additions $ 1,045,340 $ 1,946,092 $ 2,455,390
The expenditures for completed projects were $1,045,340, $1,946,092 and $2,455,390, in the years ended May 31, 2020, 2019 and 2018, respectively. In the year ended May 31, 2020, the total amount $801,612 (76.7%) was expended for distribution system, $129,320 (12.4%) for pumping and purification and $114,308 (10.9%) for vehicles. (Chart 7)
CHART 7
0
500
1000
1500
2000
2500
3000
2020 2019 2018
Tho
usa
nd
s
Major Additions and Completed ProjectsYears Ended May 31, 2020, 2019 and 2018
Wells and Standpipes Distribution System
Pumping and Purification Building and Vehicles
THE WATER AUTHORITY OF WESTERN NASSAU COUNTY MANAGEMENT’S DISCUSSION AND ANALYSIS
[39]
LONG-TERM DEBT REVENUE SERIES 2005 BONDS On May 28, 1996, the Water Authority issued $34,460,000 Water System Revenue Bonds, Series 1996 to finance the cost of acquisition and certain construction expenditures of the water system, including initial working capital of the Water Authority and the costs of the utility assets and additional improvements to the water system. The $33,875,000 Water System Revenue Bonds, Series 2005 (the “Series 2005 Bonds”) were applied to advance refund Water Authority’s outstanding Water System Revenue Bonds, Series 1996 and to finance the cost of acquisition and construction of improvements to the Water System, fund a deposit to the Reserve Account and pay certain costs of issuance relating to the Series 2005 Bonds. REVENUE SERIES 2010 BONDS The Water Revenue Bonds, Series 2010 were dated April 1, 2010 and issued on April 15, 2010, with accrued interest. The Series 2010 Revenue Bonds include the Water System Revenue Bonds, Series 2010A, with aggregate principal balance of $6,925,000, and Series 2010B, federally taxable, Build America Bonds, with aggregate principal balance of $33,965,000. The Series 2010A Bonds were issued to finance costs of acquisition, improvements and additions to the water system, to fund a deposit to the Reserve Account, and to pay certain costs of issuance relating to the Series 2010A Bonds. The Series 2010B Bonds were issued to finance the cost of acquisition, improvements and additions to the water system, including the construction of the Water Authority’s headquarters, to fund a deposit to the Reserve Account, and to pay costs of issuance relating to the Series 2010B Bonds. Moody’s and Fitch Ratings affirmed the “A1” and 'AA-' rating of the Water Authority’s Series 2015 Bonds. As of May 31, 2020, all proceeds of Series 2010A bonds have been expended for construction of capital assets and all Series A 2010 Bonds have been paid off. REVENUE SERIES 2015 BONDS During the year ended May 31, 2015, the Water Authority completed new financing to fund future construction plans and to refund the 2005 Series A and B Bonds. Water System Series 2015A Revenue (Construction) Bonds and Water System Series 2015B Revenue (Refunding) Bonds were issued on April 22, 2015. The 2015A Bonds consist of $21,660,000 (4.563 % average interest) Serial Bonds, $17,640,000 (5% interest) Term Bonds due April 1, 2040, $10,000,000 (5 % interest) Term Bonds due April 1, 2045 and $4,900,000 (4% interest) Term Bonds due April 1, 2045. The 2015B Bonds consist of $19,400,000 (4.506% average interest) Serial Bonds. A portion of the proceeds of the Bonds, along with funds transferred from amounts on deposit in the debt service funds, debt service reserve funds were deposited as cash and held in an irrevocable trust (the “Escrow Fund”) and were used solely to refund the $23,885,000 outstanding balance of the Series 2005 Bonds. The net present value of the economic gain from refunding the 2005 Series A and B Bonds was $4,023,167 (16.84%) of refunded Bonds and deferred inflows from refunding gain was $1,028,663.
THE WATER AUTHORITY OF WESTERN NASSAU COUNTY MANAGEMENT’S DISCUSSION AND ANALYSIS
[40]
CASH AND INVESTMENTS The total amounts of unrestricted and restricted cash, cash equivalents and investment in the US Treasury Securities were $43,487,606 and $49,623,711 and $57,630,669, on May 31, 2020, 2019 and 2018, respectively. The reductions of $6,136,105 (12.4%) and $8,006,958 (13.9%) in cash, cash equivalents and investment, in the current and previous year, respectively, were mainly the result of expenditures pertaining to capital assets. On May 31, 2020, the amount of restricted cash and cash equivalents held in the Construction Fund was $25,130,629, in view of the planned capital expenditures of $16,000,900 for the year ending May 31, 2021. The amount of cash, cash equivalents in Bond reserve Funds was $3,572,658, as required by the bond covenants. During the current year, the sources of cash flows included $5,984,043 from operation and $16,543,047 from interest and maturity of the treasury notes investment. The amounts of cash used for the acquisition and construction of capital assets and payment of related interest was $12,897,782. During the previous year, the sources of cash flows included $9,904,059 from operation and $9,542,710 from interest and maturity of the treasury notes investment. The amounts of cash used for the acquisition and construction of capital assets and payment of related interest was $19,007,128. The Water Authority’s investment strategy is designed to eliminate the default risk and to maximize interest income by matching the maturities of the investments with the cash requirements of construction activities. The strategy minimizes the risk of having to liquidate the investment to pay construction under unfavorable market interest conditions. All of the Water Authority’s investments are in the US Treasury Notes and Bonds with maturities of less than three years. All deposits were with a major national bank and were insured by FDIC or collateralized over 102% by the securities held by the Bank of New York Mellon under a tri-party collateral agreement. Debt Service Coverage: The Water Authority’s debt coverage ratio was as follows:
Cash Available and Debt Service Requirement Amount
Operating income $ 5,631,292
Add: Depreciation and amortization 2,260,652
Noncash operation and maintenance expenses 582,457
Interest and other income 1,097,461
Total cash available for coverage 9,571,862
Debt service requirements:
Interest payments 4,690,411
Principal payments 2,605,000
Total debt service requirements $ 7,295,411
Coverage Ratio 1.31
Coverage requirement as per Water System Revenue Bonds, Series 2010 and 2005 1.20
For more detailed information on long-term debt activity, please refer to the financial statements Note 5 – Revenue Bonds Payable.
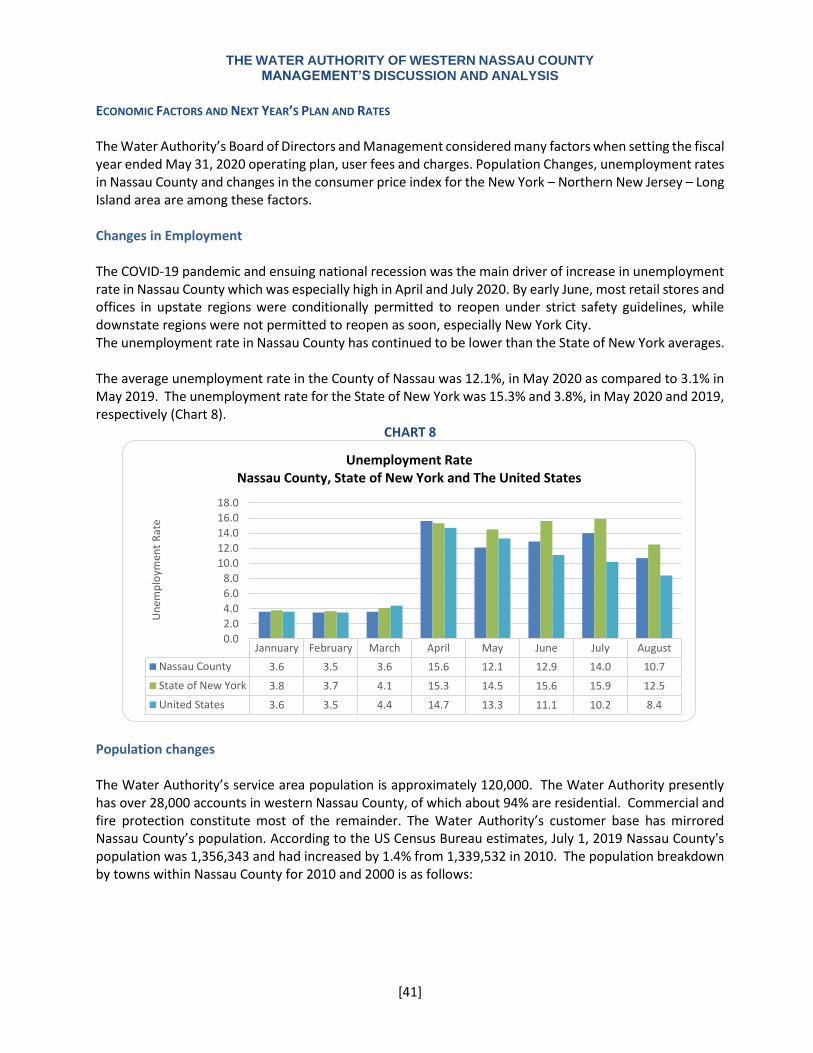
THE WATER AUTHORITY OF WESTERN NASSAU COUNTY MANAGEMENT’S DISCUSSION AND ANALYSIS
[41]
ECONOMIC FACTORS AND NEXT YEAR’S PLAN AND RATES The Water Authority’s Board of Directors and Management considered many factors when setting the fiscal year ended May 31, 2020 operating plan, user fees and charges. Population Changes, unemployment rates in Nassau County and changes in the consumer price index for the New York – Northern New Jersey – Long Island area are among these factors. Changes in Employment The COVID-19 pandemic and ensuing national recession was the main driver of increase in unemployment rate in Nassau County which was especially high in April and July 2020. By early June, most retail stores and offices in upstate regions were conditionally permitted to reopen under strict safety guidelines, while downstate regions were not permitted to reopen as soon, especially New York City. The unemployment rate in Nassau County has continued to be lower than the State of New York averages. The average unemployment rate in the County of Nassau was 12.1%, in May 2020 as compared to 3.1% in May 2019. The unemployment rate for the State of New York was 15.3% and 3.8%, in May 2020 and 2019, respectively (Chart 8).
CHART 8
Population changes The Water Authority’s service area population is approximately 120,000. The Water Authority presently has over 28,000 accounts in western Nassau County, of which about 94% are residential. Commercial and fire protection constitute most of the remainder. The Water Authority’s customer base has mirrored Nassau County’s population. According to the US Census Bureau estimates, July 1, 2019 Nassau County's population was 1,356,343 and had increased by 1.4% from 1,339,532 in 2010. The population breakdown by towns within Nassau County for 2010 and 2000 is as follows:
Jannuary February March April May June July August
Nassau County 3.6 3.5 3.6 15.6 12.1 12.9 14.0 10.7
State of New York 3.8 3.7 4.1 15.3 14.5 15.6 15.9 12.5
United States 3.6 3.5 4.4 14.7 13.3 11.1 10.2 8.4
0.0
2.0
4.0
6.0
8.0
10.0
12.0
14.0
16.0
18.0
Un
emp
loym
ent
Rat
e
Unemployment RateNassau County, State of New York and The United States
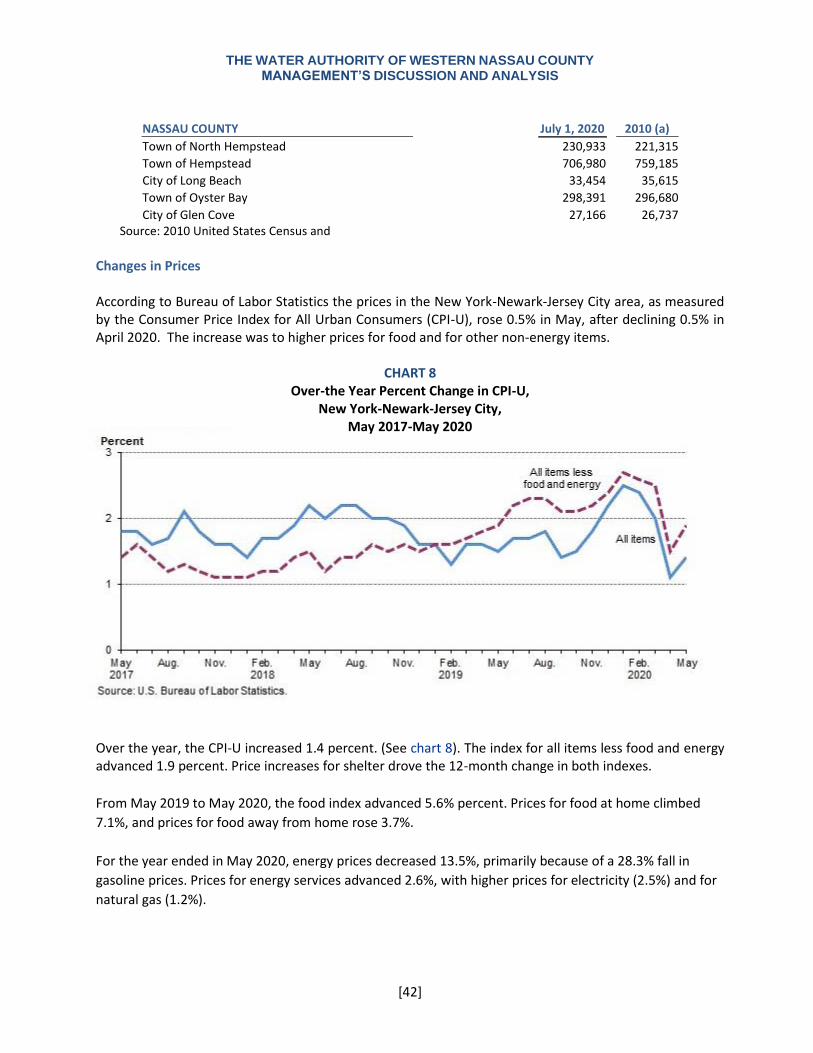
THE WATER AUTHORITY OF WESTERN NASSAU COUNTY MANAGEMENT’S DISCUSSION AND ANALYSIS
[42]
NASSAU COUNTY July 1, 2020 2010 (a)
Town of North Hempstead 230,933 221,315
Town of Hempstead 706,980 759,185
City of Long Beach 33,454 35,615
Town of Oyster Bay 298,391 296,680
City of Glen Cove 27,166 26,737 Source: 2010 United States Census and
Changes in Prices According to Bureau of Labor Statistics the prices in the New York-Newark-Jersey City area, as measured by the Consumer Price Index for All Urban Consumers (CPI-U), rose 0.5% in May, after declining 0.5% in April 2020. The increase was to higher prices for food and for other non-energy items.
CHART 8
Over-the Year Percent Change in CPI-U, New York-Newark-Jersey City,
May 2017-May 2020 Over the year, the CPI-U increased 1.4 percent. (See chart 8). The index for all items less food and energy advanced 1.9 percent. Price increases for shelter drove the 12-month change in both indexes.
From May 2019 to May 2020, the food index advanced 5.6% percent. Prices for food at home climbed
7.1%, and prices for food away from home rose 3.7%.
For the year ended in May 2020, energy prices decreased 13.5%, primarily because of a 28.3% fall in
gasoline prices. Prices for energy services advanced 2.6%, with higher prices for electricity (2.5%) and for
natural gas (1.2%).
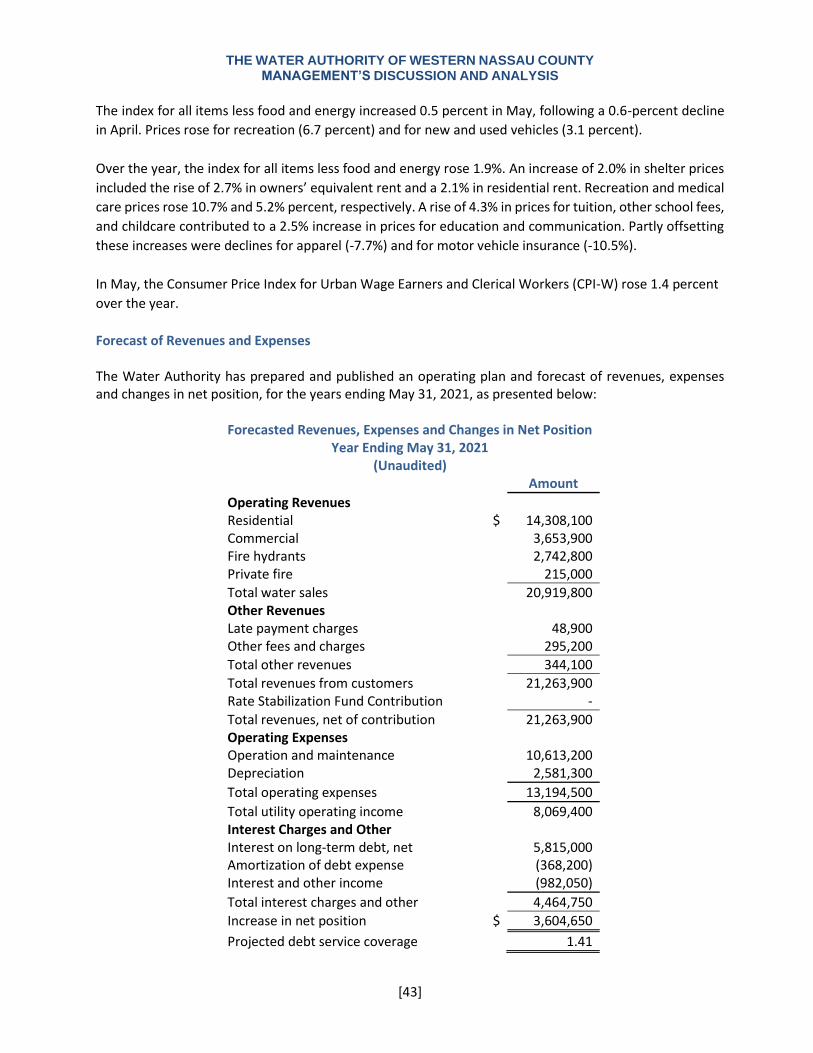
THE WATER AUTHORITY OF WESTERN NASSAU COUNTY MANAGEMENT’S DISCUSSION AND ANALYSIS
[43]
The index for all items less food and energy increased 0.5 percent in May, following a 0.6-percent decline
in April. Prices rose for recreation (6.7 percent) and for new and used vehicles (3.1 percent).
Over the year, the index for all items less food and energy rose 1.9%. An increase of 2.0% in shelter prices
included the rise of 2.7% in owners’ equivalent rent and a 2.1% in residential rent. Recreation and medical
care prices rose 10.7% and 5.2% percent, respectively. A rise of 4.3% in prices for tuition, other school fees,
and childcare contributed to a 2.5% increase in prices for education and communication. Partly offsetting
these increases were declines for apparel (-7.7%) and for motor vehicle insurance (-10.5%).
In May, the Consumer Price Index for Urban Wage Earners and Clerical Workers (CPI-W) rose 1.4 percent
over the year.
Forecast of Revenues and Expenses The Water Authority has prepared and published an operating plan and forecast of revenues, expenses and changes in net position, for the years ending May 31, 2021, as presented below:
Forecasted Revenues, Expenses and Changes in Net Position
Year Ending May 31, 2021 (Unaudited)
Amount
Operating Revenues Residential $ 14,308,100 Commercial 3,653,900 Fire hydrants 2,742,800 Private fire 215,000
Total water sales 20,919,800 Other Revenues Late payment charges 48,900 Other fees and charges 295,200
Total other revenues 344,100
Total revenues from customers 21,263,900 Rate Stabilization Fund Contribution -
Total revenues, net of contribution 21,263,900 Operating Expenses Operation and maintenance 10,613,200 Depreciation 2,581,300
Total operating expenses 13,194,500
Total utility operating income 8,069,400 Interest Charges and Other Interest on long-term debt, net 5,815,000 Amortization of debt expense (368,200) Interest and other income (982,050)
Total interest charges and other 4,464,750
Increase in net position $ 3,604,650
Projected debt service coverage 1.41
THE WATER AUTHORITY OF WESTERN NASSAU COUNTY MANAGEMENT’S DISCUSSION AND ANALYSIS
[44]
In planning the future revenues, the key considerations have been the forecast of water consumption and adjustment of the water rates to meet the debt service requirements, expected rises in capital and operating costs. For the year ending May 31, 2021, the total water sales revenues are estimated at $20,919,800, as compared to the actual revenues of $18,070,081, for 2020. The rise in the estimated revenues reflects the 10.57% increase in the water rates. Total operating and maintenance expenses are projected to increase by $435,063 (4.2%), from the actual amount of $10,178,137, in the current year, to $10,613,200, in the year ending May 31, 2021. The projected nonoperating revenues and expenses are expected to remain relatively the same as the current year. Primarily, as a net result of the changes in water sales revenues and expenses, the net position is projected to increase by $3,604,650 (11.97%) and the debt coverage ratio to be 1.41%. CONTACTING THE WATER AUTHORITY’S FINANCIAL MANAGEMENT This financial report is designed to provide our customers, creditors and public with a general overview of the Water Authority’s finances and to demonstrate the Water Authority’s accountability for the money it receives. If you have questions about this report or need additional information, contact the Water Authority’s Superintendent at 1580 Union Turnpike, New Hyde Park, NY 11040.
BASIC FINANCIAL STATEMENTS

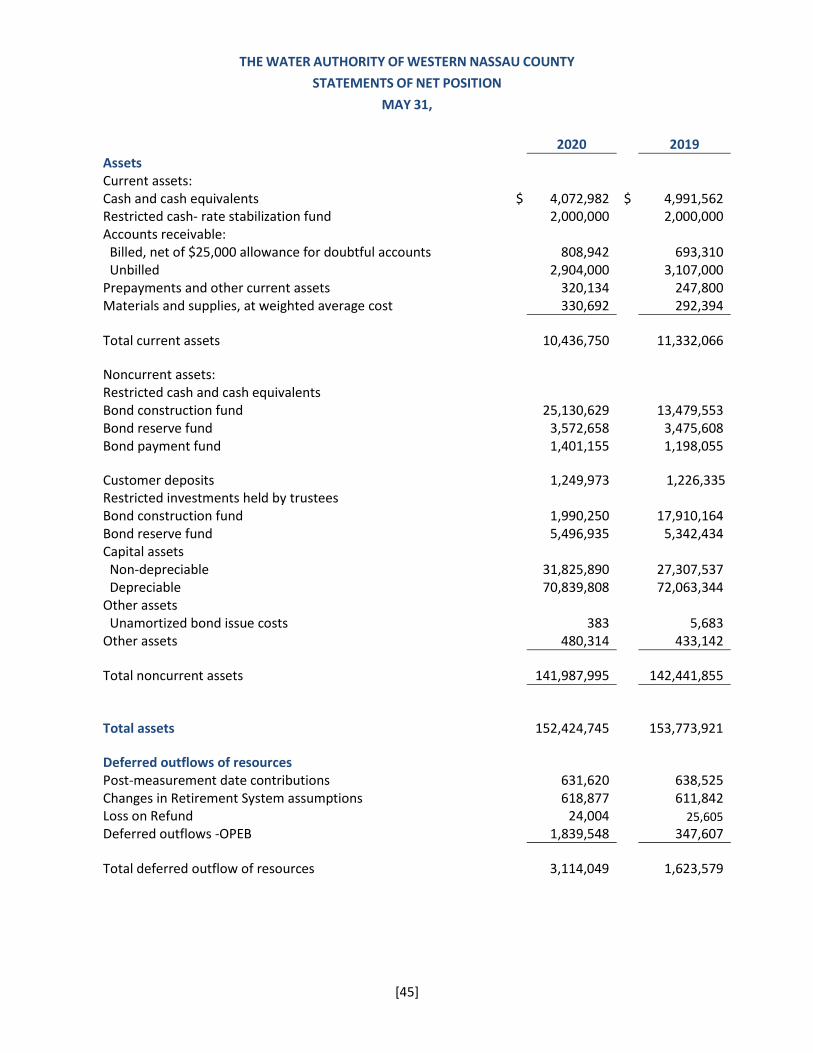
THE WATER AUTHORITY OF WESTERN NASSAU COUNTY
STATEMENTS OF NET POSITION
MAY 31,
[45]
2020 2019
Assets
Current assets:
Cash and cash equivalents $ 4,072,982 $ 4,991,562 Restricted cash- rate stabilization fund 2,000,000 2,000,000 Accounts receivable: Billed, net of $25,000 allowance for doubtful accounts 808,942 693,310 Unbilled 2,904,000 3,107,000 Prepayments and other current assets 320,134 247,800 Materials and supplies, at weighted average cost 330,692 292,394
Total current assets 10,436,750 11,332,066
Noncurrent assets: Restricted cash and cash equivalents Bond construction fund 25,130,629 13,479,553 Bond reserve fund 3,572,658 3,475,608 Bond payment fund 1,401,155 1,198,055
Customer deposits 1,249,973 1,226,335 Restricted investments held by trustees Bond construction fund 1,990,250 17,910,164 Bond reserve fund 5,496,935 5,342,434 Capital assets Non-depreciable 31,825,890 27,307,537 Depreciable 70,839,808 72,063,344 Other assets Unamortized bond issue costs 383 5,683 Other assets 480,314 433,142
Total noncurrent assets 141,987,995 142,441,855
Total assets 152,424,745
153,773,921
Deferred outflows of resources Post-measurement date contributions 631,620 638,525 Changes in Retirement System assumptions 618,877 611,842 Loss on Refund 24,004 25,605
Deferred outflows -OPEB 1,839,548 347,607
Total deferred outflow of resources 3,114,049 1,623,579
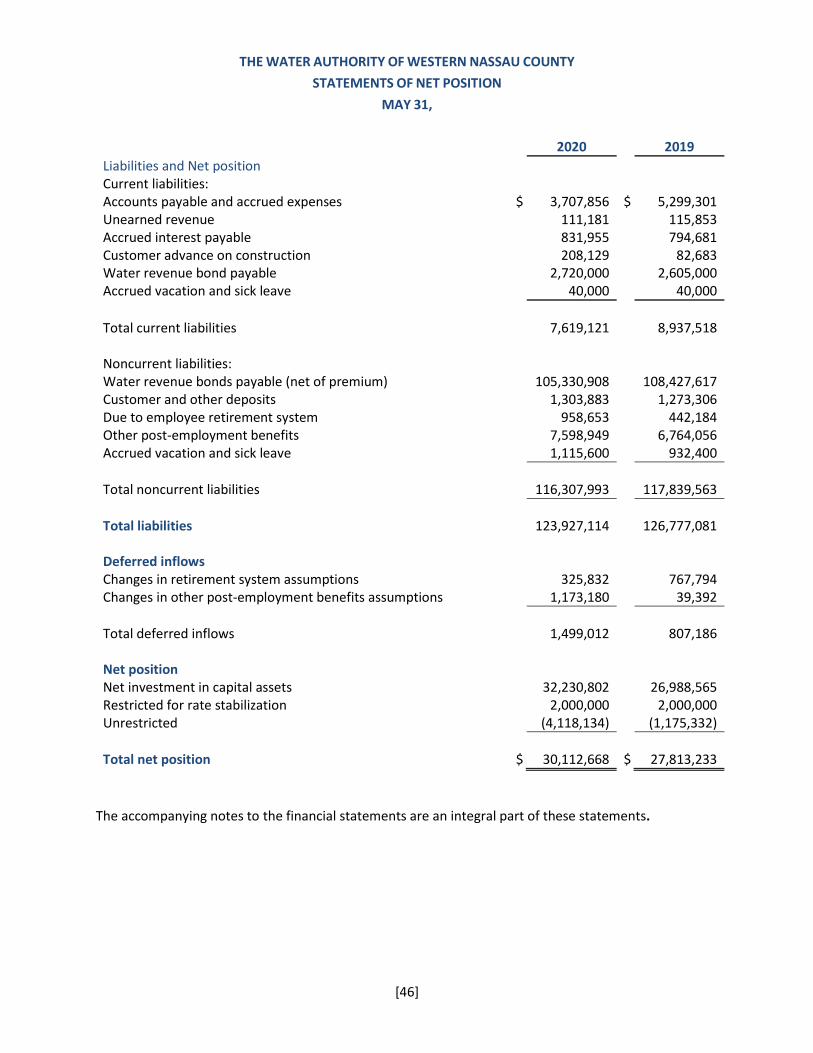
THE WATER AUTHORITY OF WESTERN NASSAU COUNTY
STATEMENTS OF NET POSITION
MAY 31,
[46]
The accompanying notes to the financial statements are an integral part of these statements.
2020 2019
Liabilities and Net position
Current liabilities:
Accounts payable and accrued expenses $ 3,707,856 $ 5,299,301 Unearned revenue 111,181 115,853 Accrued interest payable 831,955 794,681 Customer advance on construction 208,129 82,683 Water revenue bond payable 2,720,000 2,605,000 Accrued vacation and sick leave 40,000 40,000
Total current liabilities 7,619,121 8,937,518
Noncurrent liabilities:
Water revenue bonds payable (net of premium) 105,330,908 108,427,617 Customer and other deposits 1,303,883 1,273,306 Due to employee retirement system 958,653 442,184 Other post-employment benefits 7,598,949 6,764,056 Accrued vacation and sick leave 1,115,600 932,400
Total noncurrent liabilities 116,307,993 117,839,563
Total liabilities 123,927,114 126,777,081
Deferred inflows Changes in retirement system assumptions 325,832 767,794 Changes in other post-employment benefits assumptions 1,173,180 39,392
Total deferred inflows 1,499,012 807,186
Net position Net investment in capital assets 32,230,802 26,988,565 Restricted for rate stabilization 2,000,000 2,000,000 Unrestricted (4,118,134) (1,175,332)
Total net position $ 30,112,668 $ 27,813,233
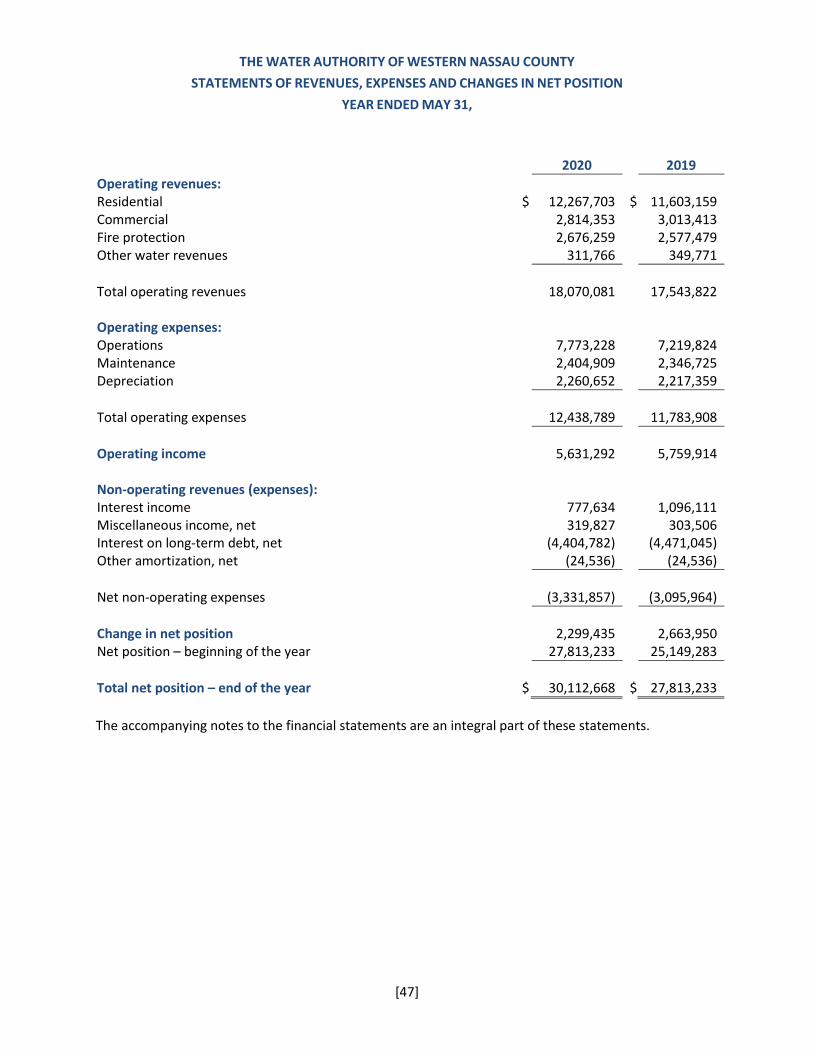
THE WATER AUTHORITY OF WESTERN NASSAU COUNTY
STATEMENTS OF REVENUES, EXPENSES AND CHANGES IN NET POSITION
YEAR ENDED MAY 31,
[47]
2020 2019
Operating revenues: Residential $ 12,267,703 $ 11,603,159 Commercial 2,814,353 3,013,413 Fire protection 2,676,259 2,577,479 Other water revenues 311,766 349,771
Total operating revenues 18,070,081 17,543,822
Operating expenses: Operations 7,773,228 7,219,824 Maintenance 2,404,909 2,346,725 Depreciation 2,260,652 2,217,359
Total operating expenses 12,438,789 11,783,908
Operating income 5,631,292 5,759,914
Non-operating revenues (expenses): Interest income 777,634 1,096,111 Miscellaneous income, net 319,827 303,506 Interest on long-term debt, net (4,404,782) (4,471,045) Other amortization, net (24,536) (24,536)
Net non-operating expenses (3,331,857) (3,095,964)
Change in net position 2,299,435 2,663,950 Net position – beginning of the year 27,813,233 25,149,283
Total net position – end of the year $ 30,112,668 $ 27,813,233
The accompanying notes to the financial statements are an integral part of these statements.
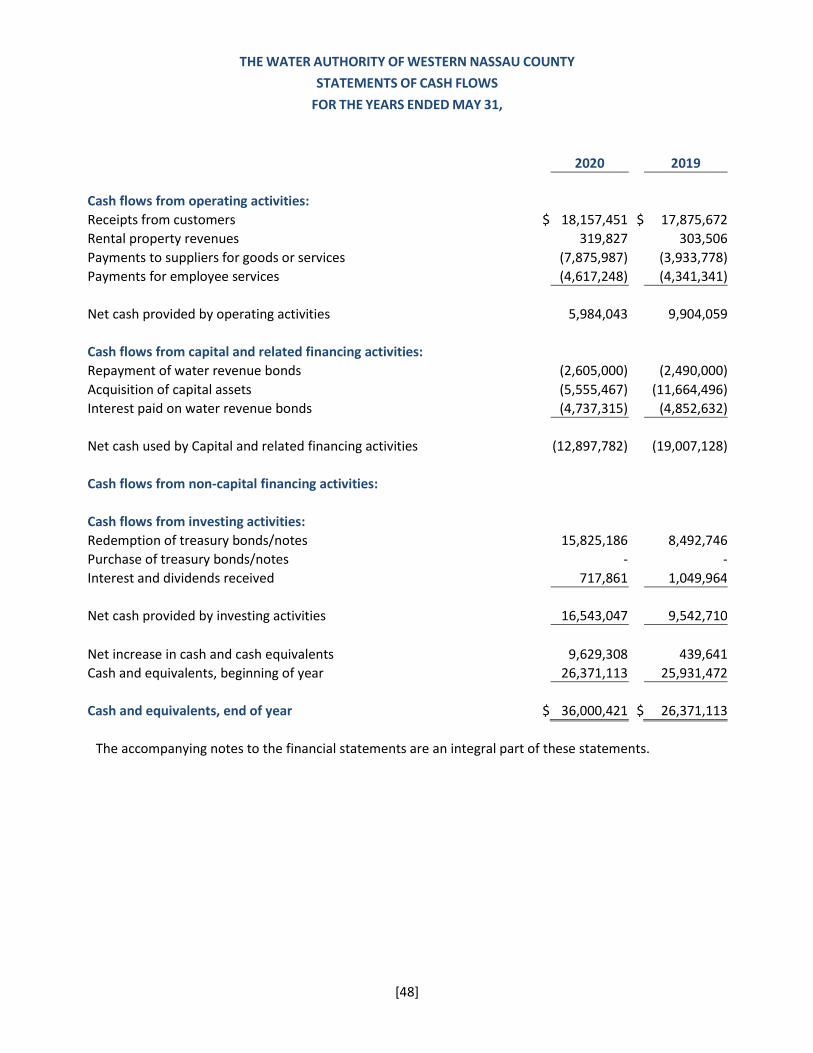
THE WATER AUTHORITY OF WESTERN NASSAU COUNTY
STATEMENTS OF CASH FLOWS
FOR THE YEARS ENDED MAY 31,
[48]
2020 2019
Cash flows from operating activities:
Receipts from customers $ 18,157,451 $ 17,875,672
Rental property revenues 319,827 303,506
Payments to suppliers for goods or services (7,875,987) (3,933,778)
Payments for employee services (4,617,248) (4,341,341)
Net cash provided by operating activities 5,984,043 9,904,059
Cash flows from capital and related financing activities:
Repayment of water revenue bonds (2,605,000) (2,490,000)
Acquisition of capital assets (5,555,467) (11,664,496)
Interest paid on water revenue bonds (4,737,315) (4,852,632)
Net cash used by Capital and related financing activities (12,897,782) (19,007,128)
Cash flows from non-capital financing activities:
Cash flows from investing activities:
Redemption of treasury bonds/notes 15,825,186 8,492,746
Purchase of treasury bonds/notes - -
Interest and dividends received 717,861 1,049,964
Net cash provided by investing activities 16,543,047 9,542,710
Net increase in cash and cash equivalents 9,629,308 439,641
Cash and equivalents, beginning of year 26,371,113 25,931,472
Cash and equivalents, end of year $ 36,000,421 $ 26,371,113
The accompanying notes to the financial statements are an integral part of these statements.
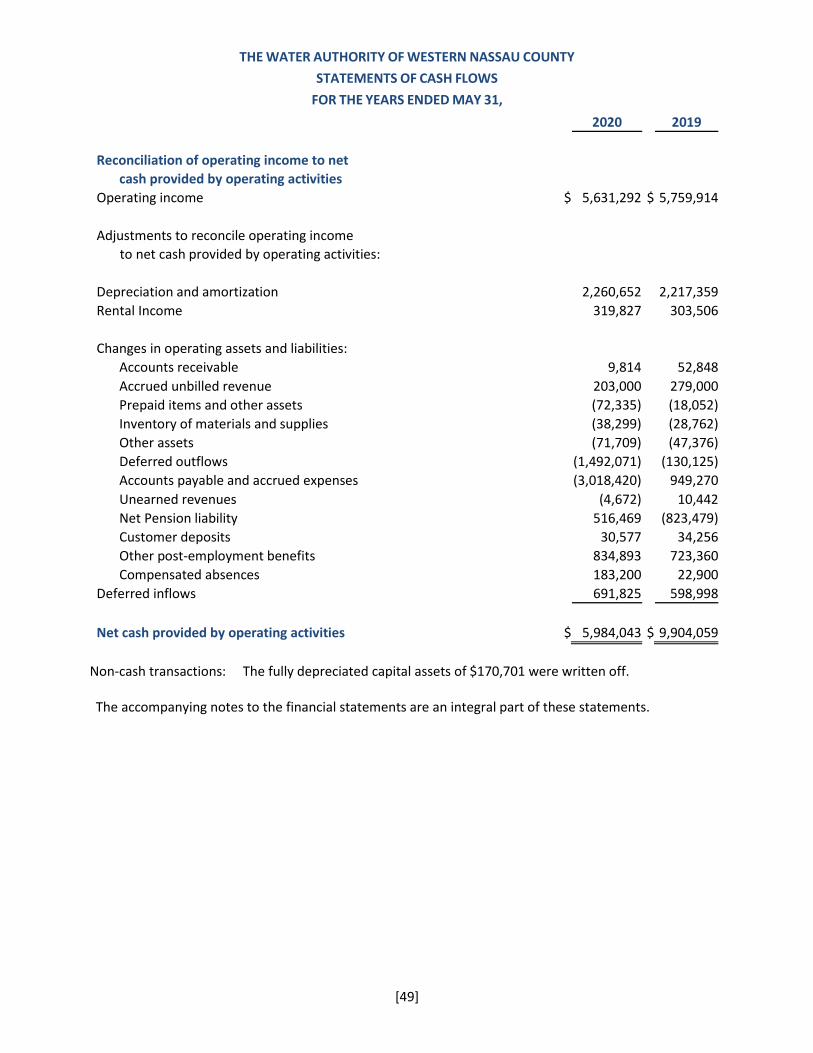
THE WATER AUTHORITY OF WESTERN NASSAU COUNTY
STATEMENTS OF CASH FLOWS
FOR THE YEARS ENDED MAY 31,
[49]
2020 2019
Reconciliation of operating income to net
cash provided by operating activities
Operating income $ 5,631,292 $ 5,759,914
Adjustments to reconcile operating income
to net cash provided by operating activities:
Depreciation and amortization 2,260,652 2,217,359
Rental Income 319,827 303,506
Changes in operating assets and liabilities:
Accounts receivable 9,814 52,848
Accrued unbilled revenue 203,000 279,000
Prepaid items and other assets (72,335) (18,052)
Inventory of materials and supplies (38,299) (28,762)
Other assets (71,709) (47,376)
Deferred outflows (1,492,071) (130,125)
Accounts payable and accrued expenses (3,018,420) 949,270
Unearned revenues (4,672) 10,442
Net Pension liability 516,469 (823,479)
Customer deposits 30,577 34,256
Other post-employment benefits 834,893 723,360
Compensated absences 183,200 22,900
Deferred inflows 691,825 598,998
Net cash provided by operating activities $ 5,984,043 $ 9,904,059
Non-cash transactions: The fully depreciated capital assets of $170,701 were written off. The accompanying notes to the financial statements are an integral part of these statements.
THE WATER AUTHORITY OF WESTERN NASSAU COUNTY
NOTES TO THE FINANCIAL STATEMENTS
FOR THE YEARS ENDED MAY 31, 2020 AND 2019
[50]
NOTE 1 – ORGANIZATION The Water Authority of Western Nassau County (“the Water Authority”) was established on July 25, 1990, pursuant to the “Water Authority of Western Nassau County Act,” of the State of New York, as amended on July 31, 1992 and codified under Title 8-C of Article 5 of the Public Authorities Law. As a governmental agency constituting a public benefit corporation, the Water Authority was created for the purpose of acquiring, constructing, maintaining and operating a water supply and distribution system within the territorial boundaries of the Water Authority of Western Nassau County District (“the District”). On May 28, 1996, the Water Authority, by exercise of the power of eminent domain, acquired the water supply and distribution system situated in the District previously owned by Jamaica Water Supply Company. The District serves a population of approximately 120,000 within the Town of Hempstead and the Town of North Hempstead. The Town of Hempstead component includes the incorporated villages of Bellerose, Floral Park, New Hyde Park, South Floral Park, Stewart Manor and portions of Garden City and Valley Stream. The area within the Town of Hempstead also includes the unincorporated areas of Bellerose Terrace, Elmont and portions of Franklin Square and North Valley Stream. The area within the Town of North Hempstead includes the unincorporated areas of Floral Park, Floral Park Centre and New Hyde Park. The Water Authority is governed by a Board of Directors consisting of nine members. The town board of the Town of Hempstead appoints two members, and the town board of the Town of North Hempstead appoints one member to the Board. The village boards of the Villages of Bellerose, Floral Park, Garden City, New Hyde Park, South Floral Park and Stewart Manor each appoint a single member to the Board. Each member serves for a period of two years. The number of votes of each Board member is proportional to the number of water customers in the town or village that appoints them. Under the Government Accounting Standards Board (“GASB”) Statement No. 14, The Financial Reporting Entity, Statement No. 39, Determining Whether Certain Organizations Are Component Units-an Amendment of GASB Statement No. 14 and Statement No. 61, The Financial Reporting Entity: Omnibus the Water Authority is classified as a primary government agency with no component units. The classification is based on the following criteria: (1) it has a separately appointed governing body; (2) pursuant to its charter, the Water Authority is a legally separate and distinct entity from the State of New York, the County of Nassau and the Towns and Villages that appoint its Board of Directors and (3) neither the State of New York, nor any of its municipal entities, are financially accountable or liable for the indebtedness of the Water Authority. The Water Authority determines its operating plan, sets rates and issues bonded debt without approval by another government entity. NOTE 2 – SUMMARY OF SIGNIFICANT ACCOUNTING POLICIES Measurement Focus, Basis of Accounting and Financial Statement Presentation The financial statements of the Water Authority have been prepared in conformity with generally accepted accounting principles (“GAAP”) as applied to governmental units. GASB is the accepted standard-setting body for establishing governmental accounting and financial reporting principles. The Water Authority applies all applicable pronouncements of GASB.
THE WATER AUTHORITY OF WESTERN NASSAU COUNTY
NOTES TO THE FINANCIAL STATEMENTS
FOR THE YEARS ENDED MAY 31, 2020 AND 2019
[51]
The activities of the Water Authority are accounted for similar to those often found in the private sector using the flow of economic resources measurement focus and the accrual basis of accounting. All assets, liabilities, net position, revenues and expenses are accounted for through a single enterprise fund with revenues recorded when earned and expenses recorded at the time liabilities are incurred. The flow of economic resources refers to the reporting of all the net position available to the Water Authority for the purposes of providing related water services. The accounting objectives of this measurement focus are the determination of operating income, changes in net position (or cost recovery), financial position and cash flows. All assets and liabilities (whether current or noncurrent) and associated activities are reported, and equity is reported as net position. Basis of accounting refers to when revenues, expenses, transfers and the related assets and liabilities are recognized and reported in the financial statements. Specifically, it relates to the timing of the measurements made regardless of the nature of the measurement. The Water Authority uses the accrual basis of accounting, whereby revenues are recognized when earned and expenses are recorded when incurred. Proprietary-type accounting also distinguishes operating revenues and expenses from non-operating items. Operating revenues and expenses generally result from providing water services and producing potable water for the service area in connection with the Water Authority’s principal ongoing operations. The principal operating revenues of the Water Authority are charges to customers to provide potable water service. Other ancillary fees and services related to providing water are also recognized as operating revenues. Operating expenses include the cost of service, administration and depreciation of capital assets. All revenues and expenses not meeting these definitions are reported as non-operating revenues and expenses. The Water Authority has adopted the provisions of Government Accounting Standard Board (GASB) Statement No. 34, Basic Financial Statements—and Management's Discussion and Analysis—for State and Local Governments and GASB statement No. 63, Financial Reporting of Deferred Outflows of Resources, Deferred Inflows of Resources, and Net Position. These statements established reporting standards for all state and local governments, which include Statement of Net Position, Statements of Revenues, Expenses and Changes in Net Position and Statement of Cash Flows and inclusion of Management’s Discussion and Analysis. The Statement of Net Position of the Water Authority reports all assets, deferred outflows of resources, liabilities, deferred inflow of resources, and net position. The Statement of Net Position represents the difference between all other elements in a statement of financial position in three components: net investment in capital assets; restricted (distinguishing between major categories or restrictions) and unrestricted. The Statement of Net Position provides information about the nature and amount of investment in resources (assets) and obligations to the Water Authority’s creditors (liabilities) at year-end. It also provides the basis for computing rate of return, evaluating the capital structure of the Water Authority and assessing the liquidity and financial flexibility of the Water Authority. Over time, increases or decreases in net position serve as a useful indicator of whether the financial position of the Water Authority is improving or deteriorating.
THE WATER AUTHORITY OF WESTERN NASSAU COUNTY
NOTES TO THE FINANCIAL STATEMENTS
FOR THE YEARS ENDED MAY 31, 2020 AND 2019
[52]
The Statement of Net Position requires the classification of net position into three components as follows:
1. Net investment in capital assets– This component of net position consists of capital assets, net of accumulated depreciation and is reduced by the outstanding balances of any bonds, mortgages, notes, or other borrowings that are attributable to the acquisition, construction or improvement of these assets. Deferred outflows of resources and deferred inflow of resources that are attributable to the acquisition, construction, or improvement of those assets or related debt also should be included in this component of net position. If there are significant unspent related debt proceeds or deferred inflows of resources at the end of the period, the portion of the debt or deferred inflow of resources attributable to unspent amount should not be included in the calculation of net investment in capital assets. Instead, that portion of the debt or deferred inflows of resources should be included in the same net position component (restricted or unrestricted) as the unspent amount.
2. Restricted – The restricted component of net position consists of restricted assets reduced by liabilities and deferred inflow of resources related to those assets. Generally, a liability relates to the restricted assets if the asset results from a resource flow that also results in the recognition of a liability or if the liability will be liquidated with the restricted asset reported. This component of net position consists of restrictions placed on net position as a result of external constraints imposed by creditors (such as through debt covenants), grantors, contributors, or laws or regulations of other governments or constraints imposed by law through constitutional provisions or enabling legislation.
3. Unrestricted net position – The unrestricted component of net position is the net amount of the assets, deferred outflows of resources, liabilities, and deferred inflows of resources that are not included in the determination of net investment in capital assets or the restricted component of net position.
Cash and Cash Equivalents For the purpose of the Statement of Cash Flows, the Water Authority considers all highly liquid investments with maturity of three months or less, when purchased, to be cash equivalents. The Statement of Cash Flows presented uses the direct method of reporting cash flows. Under the Bonds Covenants, the Water Authority maintains its cash and cash equivalents in the Water Revenue Fund, General Fund and Operating Fund. The Water Authority pays into the Water Revenue Fund all of the revenues and all other moneys required to be paid into the fund other than the revenues and other amounts expressly required or permitted to be credited to, or deposited in, any other fund account. Cash in the General Fund may be used for any lawful purpose of the Water Authority. All reasonable and necessary operations and maintenance expenses are paid from the Operating Fund. Restricted Cash, Cash Equivalents and Investments held by Trustee Restricted cash, cash equivalents and investments are held in the following funds: Rate Stabilization Fund – This is a fund maintained by the Water Authority. Money deposited into the Rate Stabilization Fund is used in the following order:
THE WATER AUTHORITY OF WESTERN NASSAU COUNTY
NOTES TO THE FINANCIAL STATEMENTS
FOR THE YEARS ENDED MAY 31, 2020 AND 2019
[53]
1. To the extent provided in the current operating plan, money should be credited to or transferred to any other fund or account created under resolution.
2. Transferred to the bond fund trustee for deposit in the Bond Fund to ensure that there are no deficiencies in payments to the Bond Fund.
3. Transferred to the bond fund trustee for deposit in the Secondary Bond Fund to ensure that there are no deficiencies in payments to the Secondary Bond Fund.
4. Transferred to Unrestricted – Operating. The amount of Rate Stabilization Fund cash and cash equivalents were $2,000,000 and $2,000,000 as of May 31, 2020 and May 31, 2019, respectively. Bond Construction Fund – In accordance with the bond resolution, money deposited in the Bond Construction Fund from the proceeds of the Water System Revenue Bonds, Series 2015 and Series 2010 are restricted to the cost of improvements or the replacement of the water system. The Bond Construction Fund is to be maintained in trust and held by the fund trustee. The total amounts in the Bond Construction Funds on May 31, 2020 and May 31, 2019 were $27,120,879 and $31,389,717, respectively. As of May 31, 2020, the balances of Construction Funds are from 2015 Bond Series. Bond Reserve Funds – Under the Series 2015A and 2010 Resolutions, the Water Authority is required to deposit into the Reserve Accounts, the lesser of (i) 10% of the proceeds of the Series 2015A, Series 2010A and Series 2010B Bonds, (ii) the maximum principal and interest payments due on the Series 2015A, 2010A and Series 2010B Bonds in any Fiscal Year, (iii) 125% of the average of the annual installments of Debt Service with respect to all Series 2015A, Series 2010A and Series 2010B Bonds for the current and all future Fiscal Years. The Bond Reserve Funds are to be maintained in trust and held by the fund trustee. Amounts in the Reserve Accounts are available to pay debt service when insufficient funds for that purpose are available in the Bond Fund. As of May 31, 2020, and May 31, 2019, the total amounts of Bond Reserve Funds were $9,069,593 and $8,818,042, respectively. The Water Authority considers the expected changes in treasury yield curve in determining the optimal allocation of its debt reserve funds between cash and cash equivalents and investments. Bond Payment Fund – The Water Authority’s bond resolution authorizing the Water System Revenue Bonds, Series 2015, and Series 2010 bond issues has established the Bond Payment Fund. The Bond Fund is to be maintained in trust and held by the fund trustee. The Bond Fund is comprised of two separate fund accounts including the Bond Principal and Interest Fund. All money deposited in the Bond Fund is used solely for the purpose of paying the principal and interest on the bonds. On May 31, 2020 and May 31, 2019, the amounts in the Bond Fund cash and cash equivalents were $1,401,155 and $1,198,055, respectively. Investment Securities — Investments are reported at fair value in the financial statements. Fair value is the amount in which an investment could be exchanged in a current transaction between willing parties, other than in a forced or liquidation sale. If a quoted market price is available for an investment, the fair value is the total number of trading units of the instrument times the market price per unit. All investment
THE WATER AUTHORITY OF WESTERN NASSAU COUNTY
NOTES TO THE FINANCIAL STATEMENTS
FOR THE YEARS ENDED MAY 31, 2020 AND 2019
[54]
income, including changes in fair value of investments is recognized as non-operating revenue in the operating statement. Accrued Unbilled Revenues Accrued unbilled revenues represent revenue earned in the current year but not yet billed to customers until future days, usually within three months, based on the estimated billings occurring in the three months of the succeeding year. Historical trend is used to estimate accrued unbilled revenues. Accounts Receivable Accounts receivable is net of an allowance for doubtful accounts of $25,000 on May 31, 2020 and May 31, 2019. The allowance is estimated based on trends in historical collection rates and write-offs. Prepaid Items Certain prepayments to vendors reflect costs applicable to future accounting periods and are recorded as prepaid items in the Statement of Net Position. Materials and Supplies Materials and supplies inventory are valued at weighted average cost, which approximates market. Capital Assets Capital assets are defined by the Water Authority as assets with an initial individual cost of more than $500 and an estimated useful life in excess of one year. Capital assets are carried at cost to the Water Authority. Improvements, renewals purchased or contributed property, replacements of retired units of property and significant repairs inclusive of materials, labor and certain overhead that extend the life of the asset are capitalized while minor repairs and maintenance costs are expensed as incurred. Donated capital assets or donated works of art and similar items and capital assets received in a service concession arrangement are reported at acquisition value rather than fair value. Capitalization of Interest during Construction Depreciation is provided on the straight-line basis using the following estimated useful lives for each asset type:
Capital Asset Useful Life Years Distribution system 35 - 105 Wells and standpipes 40 - 60 Pumping and purification 20 - 50 Other property and equipment 5 - 10
When assets are retired or otherwise disposed of, the related assets and accumulated depreciation is written off and any related gains or losses are recorded.
THE WATER AUTHORITY OF WESTERN NASSAU COUNTY
NOTES TO THE FINANCIAL STATEMENTS
FOR THE YEARS ENDED MAY 31, 2020 AND 2019
[55]
In previous fiscal years, the Water Authority capitalized the interest cost during the construction of capital assets according to Financial Accounting Standards Board’s Accounting Standards Codification Paragraph 835-20-30-10 through 835-20-30-12. In June 2019, of the Governmental Accounting Standards Board issued Statement No. 89, Accounting for Interest Cost Incurred before the End of a Construction Period. This Statement requires that interest cost incurred before the end of a construction period be recognized as an expense in the period in which the cost is incurred for financial statements prepared using the economic resources measurement focus. As a result, interest cost incurred before the end of a construction period is not be included in the historical cost of a capital asset reported in a business-type activity or enterprise fund. The requirements of this Statement are effective for reporting periods beginning after December 15, 2020. Earlier application is encouraged. The Water Authority adopted this statement in the year ended May 31, 2019 and has expensed all interest cost incurred during the year. Also, the Water Authority will apply the requirements of this Statement prospectively. Long-term Obligations In the financial statements, long-term debt is reported as a liability in the Statement of Net Position. Long-term debt is reported at face value less any loss on defeasance and plus or minus applicable premium or discount, respectively. Bond premiums and bond discounts are deferred and amortized over the life of the bonds in relation to principal payment over the life of the issue. The costs related to the insurance on long-term debt and the loss on the early retirement of refunded debt is amortized in relation to principal repayment over the life of the issue. The amortizations of bond premiums were $376,708 and $376,709, in years ended May 31, 2020 and May 31, 2019. The amortization of Series 2015 deferred refunding loss was $51,433 and the amortization of Series 2005 refunding gain was $53,035, for both years ended May 31, 2020 and May 31, 2019. Unearned Revenues The Unearned revenues include advance payments by customers and charges for future repairs. The Water Authority recognizes the amounts charged as liabilities and credits them to revenue only when associated costs are incurred. Other Postemployment Benefits In addition to providing pension benefits, the Water Authority provides health insurance coverage for eligible retired employees. Substantially all the Water Authority’s employees may become eligible for these benefits provided the employee has a minimum of ten years of full-time employment with the Water Authority, has obtained 55 years of age and has terminated employment with the Water Authority within five years from the date on which entitled to a retirement allowance from the New York State and Local Employees Retirement System.
THE WATER AUTHORITY OF WESTERN NASSAU COUNTY
NOTES TO THE FINANCIAL STATEMENTS
FOR THE YEARS ENDED MAY 31, 2020 AND 2019
[56]
The Water Authority’s Board of Directors adopted a resolution dated September 17, 2002, as amended November 9, 2009, that provides eligible enrollees with post-retirement medical insurance coverage, limited to the health insurance programs offered by the Water Authority to its then full-time employees, as modified from time to time by the Board of Directors of the Water Authority. In previous fiscal years, the Water Authority recognized the cost of providing benefits by recording its share of insurance premiums as expenditures in the year paid. The liability for these other postemployment benefits was recorded as a long-term liability in the Statement of Net Position and was estimated based on the most recent actuarial valuation in accordance with the parameters of GASB Statement No. 45. In June 2015, Government Accounting Standards Board (GASB) issued the Statement No. 75, Accounting and Financial Reporting for Postemployment Benefits Other Than Pensions. This Statement requires the liability of employers to employees for defined benefit OPEB (net OPEB liability) to be measured as the portion of the present value of projected benefit payments to be provided to current active and inactive employees that is attributed to those employees’ past periods of service (total OPEB liability), less the amount of the OPEB plan’s fiduciary net position. The Statement requires governments to present more extensive note disclosures and required supplementary information (RSI) about their OPEB liabilities. The new RSI includes a schedule showing the causes of increases and decreases in the OPEB liability and a schedule comparing a government’s actual OPEB contributions to its contribution requirements. This Statement is effective for fiscal years beginning after June 15, 2018. The Water Authority adopted and implemented this statement in the fiscal year ended May 31, 2019. The implementation of GASB Statement 75 increased the net other post-employment (OPEB) liability by $2,579,837, from $460,859 (under GASB Statement 45) to $6,040,696 (under GASB Statement 75), as of May 31, 2019. The Statement of Net Position and Statement of Changes in Net Position were restated for May 31, 2018 to reflect implementation as follows:
Net position—May 31, 2018, as previously stated $ 27,729,120 GASB Statement No. 75 implementation (2,579,837)
Net position—May 31, 2018, as restated $ 25,149,283
Accrued Vacation and Sick Leave In the event of termination or upon retirement, employees are entitled to receive accumulated but unused vacation and sick leave at various rates subject to certain maximum limitations pursuant to policies adopted by the Board of Directors. The liability for vested or accumulated vacation or sick leave (compensated absences) is recorded as current and noncurrent obligations on the Statement of Net Position. The current portion of this liability is estimated based on historical trends. In the Statements of Revenues, Expenses and Changes in Net Position only the compensated absence liability payable from available financial resources is incurred.
THE WATER AUTHORITY OF WESTERN NASSAU COUNTY
NOTES TO THE FINANCIAL STATEMENTS
FOR THE YEARS ENDED MAY 31, 2020 AND 2019
[57]
Net Pension Obligation and Deferred Outflows The Water Authority provides retirement benefits for substantially all of its regular, full-time employees through contributions to the New York State and Local Employees’ Retirement System. The system provides various plans and options, and all full-time employees are required to join the plan. The Water Authority recognizes a net pension liability, which represents the Water Authority’s proportional share of excess total pension liability over the pension plan assets, actuarially calculated, of New York Employees Retirement System, a cost-sharing multiple-employer plan, measured as of the pension plan’s fiscal year-end. Changes in the net pension liability during the period are recorded as pension expense, or as deferred inflows of resources or deferred outflows of resources depending on the nature of the change, in the period incurred. Revenue Recognition Revenues from water sales are recognized at the time-of-service delivery based on actual or estimated water meter readings. Billings for water service are generally rendered on a quarterly basis except for one consumer, which is billed monthly due to the requirements of a legal settlement. The Water Authority's Board of Directors has the power to set rates and charges, which are sufficient to meet its obligations, independently and is not subject to the regulation of any department or commission, including the New York State Public Service Commission. Operating and Non-Operating Revenues and Expenses Operating revenues and expenses are related to operating transactions. The operating transactions are those other than capital and related financing activities, noncapital financing activities and investing activities. Operating revenues generally result from sales of water, grants for production and delivery of water, and reimbursement of operating expenses. Operating expenses include depreciation on all fixed assets. Non-operating revenue includes interest earnings on investment assets and miscellaneous income. Non-operating expenditures include interest expense on long-term debt. Taxes As a Public Benefit Corporation, the Water Authority is exempt from federal and state income taxes, as well as state and local property taxes. Deferred Inflows of Resources/Deferred Outflows of Resources Deferred outflows of resources are defined as a consumption of net assets by the government that is applicable to a future reporting period. Deferred inflows of resources are defined as an acquisition of net assets by the government that is applicable to a future reporting period. Deferred outflows of resources increase net position, similar to assets, and deferred inflows of resources decrease net position, similar to liabilities.
THE WATER AUTHORITY OF WESTERN NASSAU COUNTY
NOTES TO THE FINANCIAL STATEMENTS
FOR THE YEARS ENDED MAY 31, 2020 AND 2019
[58]
Use of Estimates The preparation of financial statements in conformity with generally accepted accounting principles requires management to make estimates and assumptions that affect the reported amounts of assets and liabilities, disclosure of contingent assets and liabilities at the date of the financial statements and the reported amounts of revenues and expenses during the reporting period. Actual results could differ from those estimates. Operating and Capital Plans The Water Authority adopts annual operating and capital plans. Plans are adopted on a basis consistent with generally accepted accounting principles. The current operating plan details the Water Authority’s plans to earn and expend funds for charges incurred for operations, maintenance, certain interest and other charges for the fiscal year. The capital plan details the Water Authority’s plan to receive and expend capital contribution fees and revenues for improving and expanding capital facilities. All unexpended or encumbered appropriations in the operating plan remaining at the end of the fiscal year lapse. No appropriations for capital projects in the capital plan lapse until the purpose for which the appropriation was made, has been accomplished or changed. Management submits a proposed plan to the Water Authority’s Board of Directors prior to the commencement of the next fiscal year. A plan is adopted by resolution prior to June 1. During the year, the Board of Directors has to authorize the transfer of planned amounts between line items. Fair Value Measurements In accordance with Governmental Accounting Standards Board (GASB) Statement No. 72, Fair Value Measurement and Application. Fair Value hierarchy prioritizes the inputs to valuation techniques used to measure fair value. It gives the highest priority to unadjusted quoted prices in active markets for identical assets or liabilities (Level 1 measurements) and the lowest priority to unobservable inputs (Level 3 measurements). The three of the fair value hierarchy are described as follows: Level 1: Inputs to the valuation methodology are unadjusted quoted prices for identical assets or liabilities in active markets that the plan has the ability to access. Level 2: Inputs to the valuation methodology include:
• Quoted prices for similar assets or liabilities in active markets. • Quoted prices for identical or similar assets or liabilities in inactive markets. • Inputs other than quoted prices that are observable for the asset or liability. • Inputs that are derived principally from or corroborated by observable market data by correlation
or other means. • If the asset or liability has a specified (contractual) term, the level 2 input must be observable for
substantially the full term of the asset or liability.
THE WATER AUTHORITY OF WESTERN NASSAU COUNTY
NOTES TO THE FINANCIAL STATEMENTS
FOR THE YEARS ENDED MAY 31, 2020 AND 2019
[59]
Level 3: Inputs to the valuation methodology are unobservable and significant to the fair value measurement. The asset or liability's fair value measurement level within the fair value hierarchy is based on the lowest level of any input that is significant to the fair value measurement. Valuation techniques use should maximize the use of observable inputs and minimize the use of unobservable inputs. The following is a description of the valuation methodologies used for investments measured at fair value: Cash and Cash Equivalents - The fair value of cash and cash equivalents, consisting primarily of deposits and government money market funds, is classified as Level 1. Treasury notes and bonds- Valued at the closing price reported on the active market on which the individual securities are listed, valued at Level 1. The preceding methods described may produce a fair value calculation that may not be indicative of net realizable value or reflective of future fair values. Furthermore, although the Water Authority believes its valuation methods are appropriate and consistent with other market participants, the use of different methodologies or assumptions to determine the fair value of certain financial instruments could result in a different fair value measurement at the reporting date. Recent Accounting Pronouncements The following are discussions of the standards requiring implementation in the current year and standards that may impact the Water Authority in future years. In January 2017, GASB issued Statement No. 84, Fiduciary Activities (“GASB 84”). The objective of GASB 84 is to improve guidance regarding the identification of fiduciary activities for accounting and financial reporting purposes and how those activities should be reported. The requirements of GASB 84 are effective for fiscal years beginning after December 15, 2019. The Water Authority adopted this pronouncement in the current year. The adoption of GASB 84 did not have an impact on the Water Authority’s financial statements, as the Water Authority does not enter into fiduciary activities. In June 2017, GASB issued Statement No. 87, Leases (“GASB 87”). The objective of GASB 87 is to improve accounting and financial reporting for leases by governments. This statement increases the usefulness of governments’ financial statements by requiring recognition of certain lease assets and liabilities for leases that previously were classified as operating leases and recognized as inflows of resources or outflows of resources based on the payment provisions of the contract. It establishes a single model for lease accounting based on the foundational principle that leases are a financing of the right to use an underlying asset. Under this statement, a lessee is required to recognize a lease liability and an intangible right-to-use a lease asset, and a lessor is required to recognize a lease receivable and a deferred inflow of resources, thereby enhancing the relevance and consistency of information about governments’ leasing activities. The requirements of GASB 87 are effective for fiscal years beginning after June 15, 2021. The Water Authority has not completed the process of evaluating GASB 87, but it does not expect it to have a significant impact on its financial statements
THE WATER AUTHORITY OF WESTERN NASSAU COUNTY
NOTES TO THE FINANCIAL STATEMENTS
FOR THE YEARS ENDED MAY 31, 2020 AND 2019
[60]
In August 2018, GASB issued Statement No. 90, Majority Equity Interests (“GASB 90”). GASB 90 clarifies the accounting and financial reporting requirements for a state and local government’s majority equity interest in an organization that remains legally separate after acquisition. The requirements of GASB 90 are effective for fiscal years beginning after December 15, 2019. The Water Authority adopted this pronouncement in the current year. The adoption of GASB 90 did not have an impact on the Water Authority’s financial statements, as the Water Authority has not made such acquisitions. In January 2020, GASB issued Statement No. 92, Omnibus 2020 (“GASB 92”). GASB 92 enhances the comparability in accounting and financial reporting as well as improves the consistency of authoritative literature by addressing practice issues that have been identified during implementation and application of certain GASB Statements. The requirements for GASB 92 are effective for reporting periods beginning after June 15, 2021. The Water Authority has not completed the process of evaluating GASB 92, but it does not expect it to have an impact on the Water Authority’s financial statements. In March 2020, GASB issued Statement No. 93, Replacement of Interbank Offered Rates (“GASB 93”). GASB 93 addressed accounting and financial reporting implications that result from the replacement of an interbank offered rate (“IBOR”) – most notably, the London Interbank Offered Rate (“LIBOR”) resulting from global reference rate reform. LIBOR is expected to cease to exist in its current form at the end of 2021, prompting governments to amend or replace financial instruments for the purpose of replacing LIBOR with other reference rates, by either changing the reference rate or adding or changing fallback provisions related to the reference rate. The removal of LIBOR as an appropriate benchmark interest rate is effective for reporting periods ending after December 31, 2021. All other requirements of GASB 93 are effective for reporting periods beginning after June 15, 2021. The Water Authority has not completed the process of evaluating GASB 92, but it does not expect it to have an impact on the Water Authority’s financial statements. In March 2020, GASB issued Statement No. 94, Public-Private and Public-Public Partnerships and Availability Payment Arrangements (“GASB 94”). GASB 94 improves financial reporting by addressing issues related to public-private and public-public partnership arrangements (“PPPs”). The requirements for GASB 94 are effective for fiscal years beginning after June 15, 2022, and all reporting periods thereafter. The Water Authority has not completed the process of evaluating GASB 94, but it does not expect GASB 94 to have an impact on the Water Authority’s financial statements as it does not enter into PPPs. In May 2020, GASB issued Statement No. 95, Postponement of the Effective Dates of Certain Authoritative Guidance (“GASB 95”). GASB 95 provides temporary relief to governments and other stakeholders in light of the COVID-19 pandemic by postponing the effective dates of certain provisions in Statements and Implementation Guides that first became effective or are scheduled to become effective for periods beginning after June 15, 2018, and later. In May 2020, GASB issued Statement No. 96, Subscription-Based Information Technology Arrangements (“GASB 96”). GASB 96 provides guidance on the accounting and financial reporting for subscription-based information technology arrangements (“SBITAs”) for government end users (governments). The requirements GASB 96 are effective for fiscal years beginning after June 15, 2022, and all reporting periods thereafter. The Water Authority has not completed the process of evaluating GASB 96 but does not expect it to have an impact on the Water Authority’s financial statements as it does not enter into SBITAs.
THE WATER AUTHORITY OF WESTERN NASSAU COUNTY
NOTES TO THE FINANCIAL STATEMENTS
FOR THE YEARS ENDED MAY 31, 2020 AND 2019
[61]
In June 2020, GASB issued Statement No. 97, Certain Component Unit Criteria, and Accounting and Financial Reporting for Internal Revenue Code Section 457 Deferred Compensation Plans (“GASB 97”). The objectives of GASB 97 are to (1) increase consistency and comparability related to the reporting of fiduciary component units in circumstances in which a potential component unit does not have a governing board and the primary government performs the duties that a governing board typically would perform; (2) mitigate costs associated with the reporting of certain defined contribution pension plans, defined contribution other postemployment benefit (OPEB) plans, and employee benefit plans other than pension plans or OPEB plans (other employee benefit plans) as fiduciary component units in fiduciary fund financial statements; and (3) enhance the relevance, consistency, and comparability of the accounting and financial reporting for Internal Revenue Code (IRC) Section 457 deferred compensation plans (Section 457 plans) that meet the definition of a pension plan and for benefits provided through those plans. The Water Authority has not completed the process of evaluating GASB 97 but does not expect it to have an impact on the Water Authority’s financial statements. NOTE 3 –CASH, CASH EQUIVALENTS AND INVESTMENTS Cash includes petty cash on hand, demand deposits and deposits in other kinds of accounts that have the general characteristics of demand deposit accounts, in that the Water Authority may deposit additional cash at any time and also effectively may withdraw cash at any time without prior notice or penalty. Cash equivalents include short-term, highly liquid investments that are both
a. Readily convertible to known amounts of cash.
b. So near their maturity that they present insignificant risk of changes in value because of
changes in interest rates. Generally, only investments with original maturities of three
months or less meet this definition.
In accordance with the bond resolutions the Water Authority has deposited cash and made investment in various restricted accounts with the Bond Trustee. Also, the Water Authority holds customer deposits in a restricted bank account. The restricted cash and investment are as follows:
Restricted for bond payment. This cash account is established to meet the debt service requirements on the outstanding water revenue bonds as they become due and payable. Restricted for bond reserve. The restricted cash and investment bond reserve accounts are established to hold sufficient amount of money that remains outstanding through final bond maturity to ensure debt service payments. Restricted for construction. The restricted cash and investment bond construction accounts are committed for capital expenditures. Restricted for rate stabilization. The restricted cash rate stabilization account is established to buffer the impacts of occasional revenue shortfalls. Restricted for customer deposits. This restricted cash account is established to keep deposits received from customers to secure the payment of their water bills.
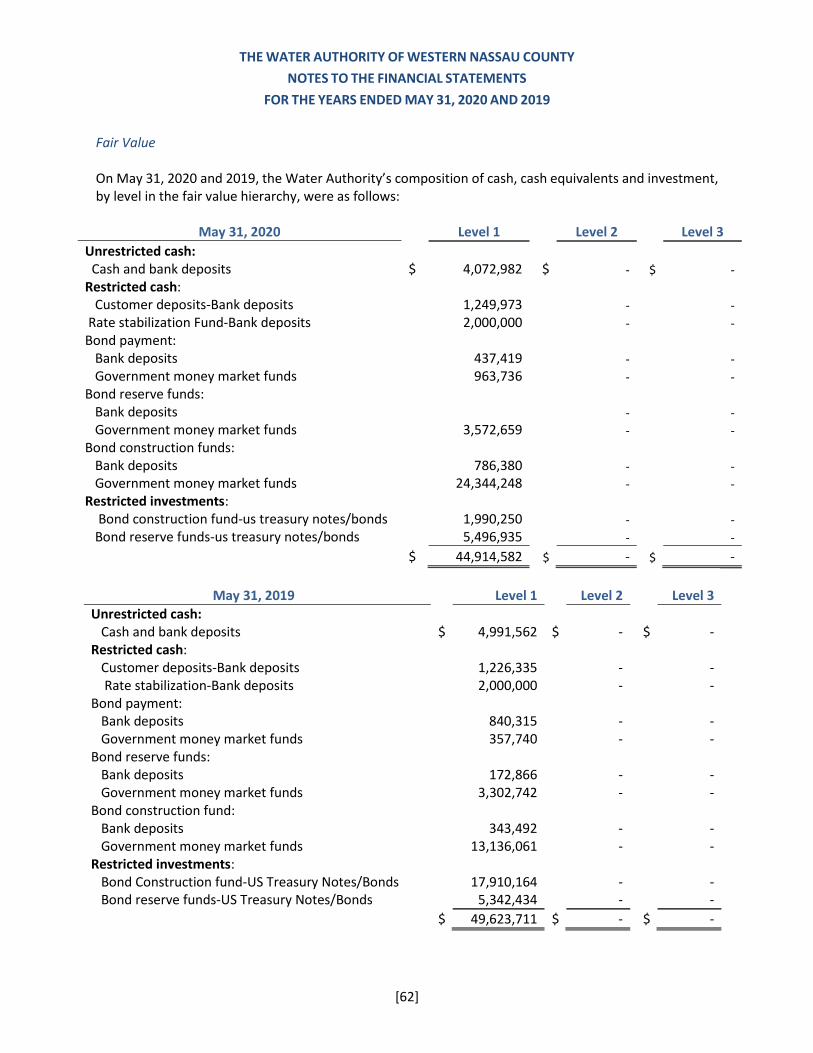
THE WATER AUTHORITY OF WESTERN NASSAU COUNTY
NOTES TO THE FINANCIAL STATEMENTS
FOR THE YEARS ENDED MAY 31, 2020 AND 2019
[62]
Fair Value On May 31, 2020 and 2019, the Water Authority’s composition of cash, cash equivalents and investment, by level in the fair value hierarchy, were as follows:
May 31, 2020 Level 1 Level 2 Level 3
Unrestricted cash: Cash and bank deposits $ 4,072,982 $ - $ -
Restricted cash: Customer deposits-Bank deposits 1,249,973 - -
Rate stabilization Fund-Bank deposits 2,000,000 - -
Bond payment: Bank deposits 437,419 - -
Government money market funds 963,736 - -
Bond reserve funds: Bank deposits - -
Government money market funds 3,572,659 - -
Bond construction funds: Bank deposits 786,380 - -
Government money market funds 24,344,248 - -
Restricted investments: Bond construction fund-us treasury notes/bonds 1,990,250 - -
Bond reserve funds-us treasury notes/bonds 5,496,935 - - $ 44,914,582 $ - $ -
May 31, 2019 Level 1 Level 2 Level 3
Unrestricted cash: Cash and bank deposits $ 4,991,562 $ - $ - Restricted cash: Customer deposits-Bank deposits 1,226,335 - - Rate stabilization-Bank deposits 2,000,000 - - Bond payment: Bank deposits 840,315 - - Government money market funds 357,740 - - Bond reserve funds: Bank deposits 172,866 - - Government money market funds 3,302,742 - - Bond construction fund: Bank deposits 343,492 - - Government money market funds 13,136,061 - - Restricted investments: Bond Construction fund-US Treasury Notes/Bonds 17,910,164 - - Bond reserve funds-US Treasury Notes/Bonds 5,342,434 - -
$ 49,623,711 $ - $ -
THE WATER AUTHORITY OF WESTERN NASSAU COUNTY
NOTES TO THE FINANCIAL STATEMENTS
FOR THE YEARS ENDED MAY 31, 2020 AND 2019
[63]
All cash equivalents and investments classified and included in the Level 1 of the fair value hierarchy, as of May 31, 2020 and 2019, respectively, are valued using quoted prices in active markets. Custodial Credit Risk – All cash deposits of the Water Authority are required to be insured by the Federal Deposit Insurance Corporation (“FDIC”) or to be secured by obligations of, or guaranteed by, the United States of America or of the State of New York of a market value equal at all times to the amount on deposit and all banks and trust companies are authorized to give such security for such deposits. The Water Authority’s cash accounts are secured by the appropriate amount from the FDIC with all remaining amounts covered by fully pledged collateral securities, at over 102% of the amounts on deposit. All pledged collateral is classified in the highest category by being held by the Bank of New York Mellon under a tri-party collateral agreement in the Water Authority’s name. All time and savings deposits and demand deposits of the Water Authority are held in insured depository institution within the State of New York and are separately insured up to $250,000. Investments Investments Authorized by the State of New York and Bond Resolutions. Pursuant to the Bond Resolution, the Water Authority may only invest moneys on deposit in various funds established under the resolution in certain investment securities. In addition, and in accordance with the requirements of the State of New York Public Authorities Law, the Water Authority has adopted comprehensive investment guidelines which govern the investment of all moneys of the Water Authority. These guidelines provide that moneys on deposit with the Water Authority may only be invested in:
1. Direct obligations of, or obligations the principal of and interest on which are unconditionally guaranteed by, the United States of America (“USA”).
2. Bonds, debentures, notes, participation certificates or other evidence of indebtedness issued or guaranteed by any agency or instrumentality of the USA or any other corporation wholly owned by the USA.
3. Public housing bonds or preliminary, temporary or project notes issued by public agencies or municipalities and fully secured as to the payment of both principal and interest by a pledge of annual contributions, under an annual contributions contract, or contracts with the USA or any federal agency.
4. Direct and general obligations of any State or political subdivision of State, as to the payment of the principal of and interest on which the full faith and credit of the issuer is pledged and at the time of their purchase, such obligations of any such state or political subdivision are rated in either of the two highest rating categories by two nationally recognized bond rating agencies.
5. Bank time deposits evidenced by certificates of deposit and bankers' acceptances issued by any bank or trust company, which is a member of the FDIC.
6. Obligations consisting of notes, bonds and debentures which are direct obligations of a solvent corporation existing under the laws of the USA or any state thereof, provided that such investments shall be rated in the two highest rating categories established by at least two nationally recognized bond rating agencies.
7. Certificates or other obligations of the USA or any state, political subdivision, agency or instrumentality of the USA or any state or political subdivision. It is required that such obligations shall be held in trust by a bank or trust company or a national banking association meeting the
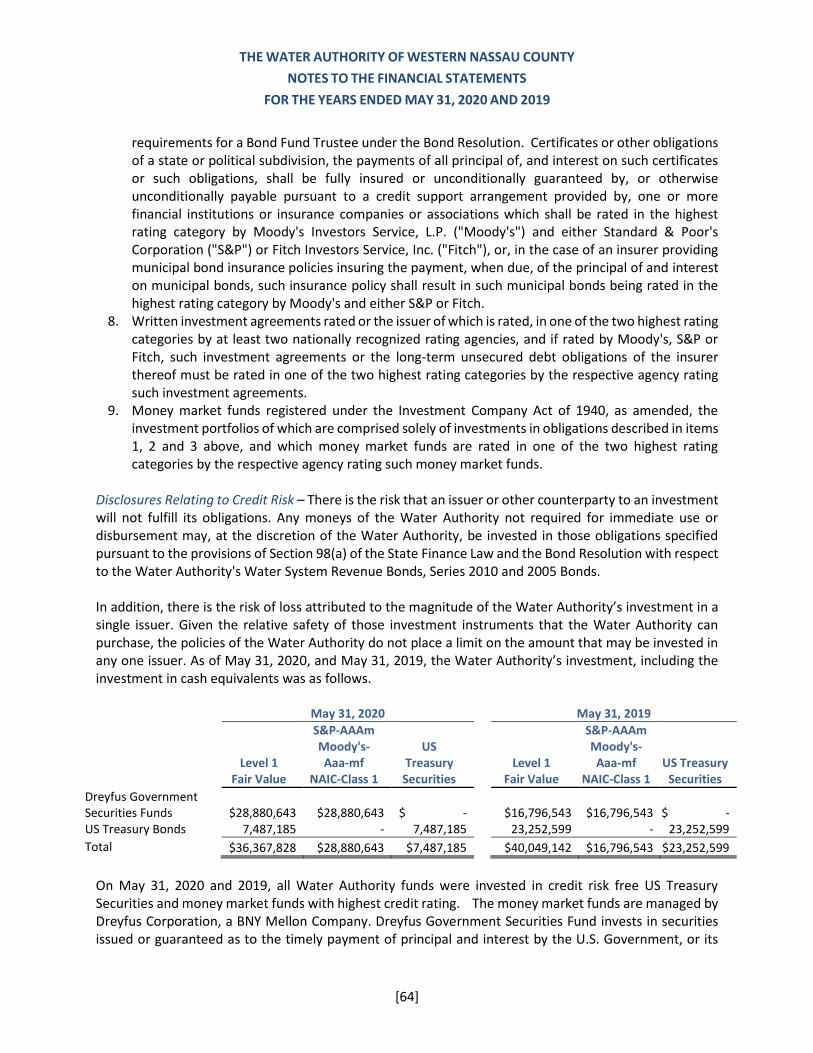
THE WATER AUTHORITY OF WESTERN NASSAU COUNTY
NOTES TO THE FINANCIAL STATEMENTS
FOR THE YEARS ENDED MAY 31, 2020 AND 2019
[64]
requirements for a Bond Fund Trustee under the Bond Resolution. Certificates or other obligations of a state or political subdivision, the payments of all principal of, and interest on such certificates or such obligations, shall be fully insured or unconditionally guaranteed by, or otherwise unconditionally payable pursuant to a credit support arrangement provided by, one or more financial institutions or insurance companies or associations which shall be rated in the highest rating category by Moody's Investors Service, L.P. ("Moody's") and either Standard & Poor's Corporation ("S&P") or Fitch Investors Service, Inc. ("Fitch"), or, in the case of an insurer providing municipal bond insurance policies insuring the payment, when due, of the principal of and interest on municipal bonds, such insurance policy shall result in such municipal bonds being rated in the highest rating category by Moody's and either S&P or Fitch.
8. Written investment agreements rated or the issuer of which is rated, in one of the two highest rating categories by at least two nationally recognized rating agencies, and if rated by Moody's, S&P or Fitch, such investment agreements or the long-term unsecured debt obligations of the insurer thereof must be rated in one of the two highest rating categories by the respective agency rating such investment agreements.
9. Money market funds registered under the Investment Company Act of 1940, as amended, the investment portfolios of which are comprised solely of investments in obligations described in items 1, 2 and 3 above, and which money market funds are rated in one of the two highest rating categories by the respective agency rating such money market funds.
Disclosures Relating to Credit Risk – There is the risk that an issuer or other counterparty to an investment will not fulfill its obligations. Any moneys of the Water Authority not required for immediate use or disbursement may, at the discretion of the Water Authority, be invested in those obligations specified pursuant to the provisions of Section 98(a) of the State Finance Law and the Bond Resolution with respect to the Water Authority's Water System Revenue Bonds, Series 2010 and 2005 Bonds. In addition, there is the risk of loss attributed to the magnitude of the Water Authority’s investment in a single issuer. Given the relative safety of those investment instruments that the Water Authority can purchase, the policies of the Water Authority do not place a limit on the amount that may be invested in any one issuer. As of May 31, 2020, and May 31, 2019, the Water Authority’s investment, including the investment in cash equivalents was as follows.
May 31, 2020 May 31, 2019
S&P-AAAm S&P-AAAm
Level 1 Moody's- Aaa-mf
US Treasury Level 1
Moody's- Aaa-mf US Treasury
Fair Value NAIC-Class 1 Securities Fair Value NAIC-Class 1 Securities
Dreyfus Government Securities Funds $28,880,643 $28,880,643 $ -
$16,796,543 $16,796,543 $ -
US Treasury Bonds 7,487,185 - 7,487,185 23,252,599 - 23,252,599
Total $36,367,828 $28,880,643 $7,487,185 $40,049,142 $16,796,543 $23,252,599
On May 31, 2020 and 2019, all Water Authority funds were invested in credit risk free US Treasury Securities and money market funds with highest credit rating. The money market funds are managed by Dreyfus Corporation, a BNY Mellon Company. Dreyfus Government Securities Fund invests in securities issued or guaranteed as to the timely payment of principal and interest by the U.S. Government, or its
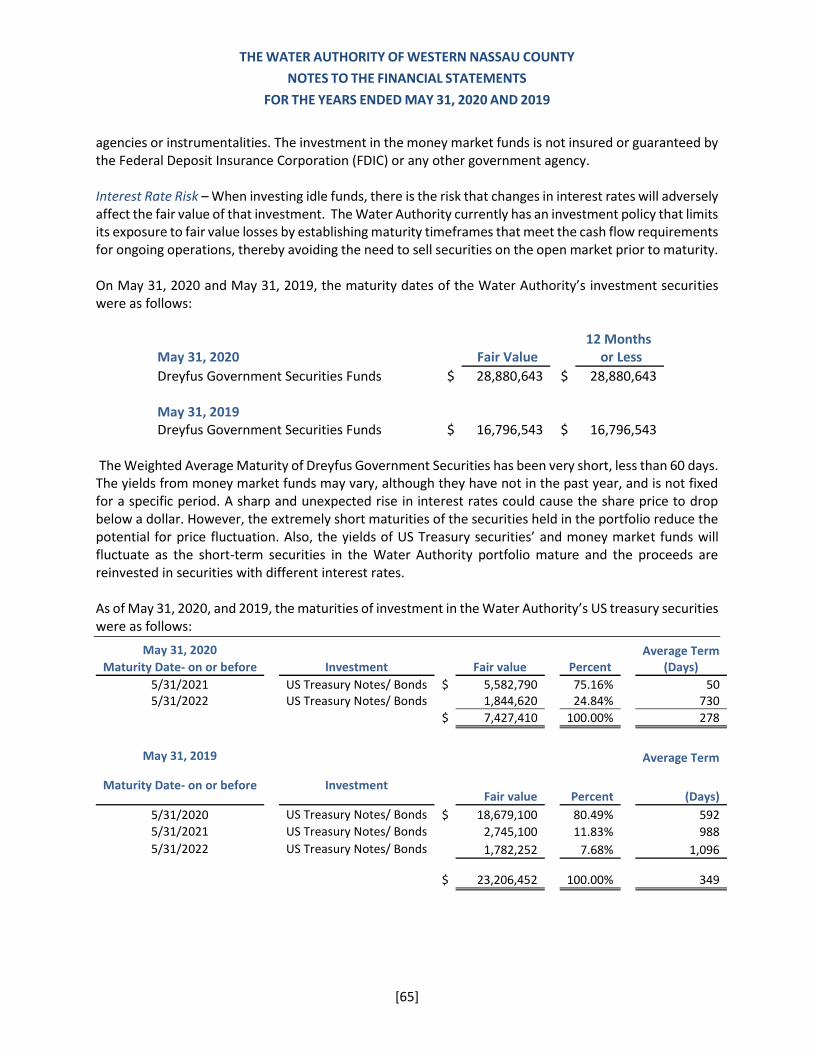
THE WATER AUTHORITY OF WESTERN NASSAU COUNTY
NOTES TO THE FINANCIAL STATEMENTS
FOR THE YEARS ENDED MAY 31, 2020 AND 2019
[65]
agencies or instrumentalities. The investment in the money market funds is not insured or guaranteed by the Federal Deposit Insurance Corporation (FDIC) or any other government agency. Interest Rate Risk – When investing idle funds, there is the risk that changes in interest rates will adversely affect the fair value of that investment. The Water Authority currently has an investment policy that limits its exposure to fair value losses by establishing maturity timeframes that meet the cash flow requirements for ongoing operations, thereby avoiding the need to sell securities on the open market prior to maturity. On May 31, 2020 and May 31, 2019, the maturity dates of the Water Authority’s investment securities were as follows:
12 Months
May 31, 2020 Fair Value or Less
Dreyfus Government Securities Funds $ 28,880,643 $ 28,880,643 May 31, 2019 Dreyfus Government Securities Funds $ 16,796,543 $ 16,796,543
The Weighted Average Maturity of Dreyfus Government Securities has been very short, less than 60 days. The yields from money market funds may vary, although they have not in the past year, and is not fixed for a specific period. A sharp and unexpected rise in interest rates could cause the share price to drop below a dollar. However, the extremely short maturities of the securities held in the portfolio reduce the potential for price fluctuation. Also, the yields of US Treasury securities’ and money market funds will fluctuate as the short-term securities in the Water Authority portfolio mature and the proceeds are reinvested in securities with different interest rates. As of May 31, 2020, and 2019, the maturities of investment in the Water Authority’s US treasury securities were as follows:
May 31, 2020 Average Term
Maturity Date- on or before Investment Fair value Percent (Days)
5/31/2021 US Treasury Notes/ Bonds $ 5,582,790 75.16% 50 5/31/2022 US Treasury Notes/ Bonds 1,844,620 24.84% 730
$ 7,427,410 100.00% 278
May 31, 2019 Average Term
Maturity Date- on or before
Investment Fair value Percent (Days)
5/31/2020 US Treasury Notes/ Bonds $ 18,679,100 80.49% 592
5/31/2021 US Treasury Notes/ Bonds 2,745,100 11.83% 988
5/31/2022 US Treasury Notes/ Bonds 1,782,252 7.68% 1,096
$ 23,206,452 100.00% 349
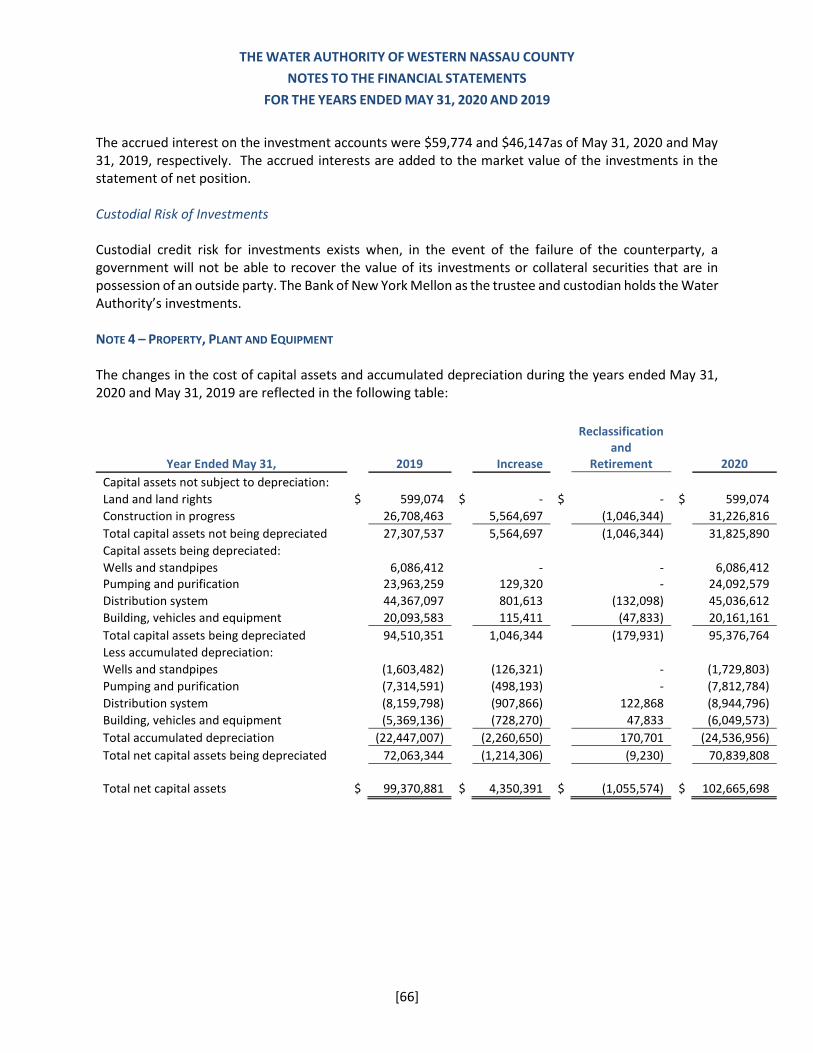
THE WATER AUTHORITY OF WESTERN NASSAU COUNTY
NOTES TO THE FINANCIAL STATEMENTS
FOR THE YEARS ENDED MAY 31, 2020 AND 2019
[66]
The accrued interest on the investment accounts were $59,774 and $46,147as of May 31, 2020 and May 31, 2019, respectively. The accrued interests are added to the market value of the investments in the statement of net position. Custodial Risk of Investments Custodial credit risk for investments exists when, in the event of the failure of the counterparty, a government will not be able to recover the value of its investments or collateral securities that are in possession of an outside party. The Bank of New York Mellon as the trustee and custodian holds the Water Authority’s investments. NOTE 4 – PROPERTY, PLANT AND EQUIPMENT The changes in the cost of capital assets and accumulated depreciation during the years ended May 31, 2020 and May 31, 2019 are reflected in the following table:
Reclassification
Year Ended May 31, 2019
Increase and
Retirement
2020
Capital assets not subject to depreciation: Land and land rights $ 599,074 $ - $ - $ 599,074
Construction in progress 26,708,463 5,564,697 (1,046,344) 31,226,816
Total capital assets not being depreciated 27,307,537 5,564,697 (1,046,344) 31,825,890
Capital assets being depreciated: Wells and standpipes 6,086,412 - - 6,086,412 Pumping and purification 23,963,259 129,320 - 24,092,579
Distribution system 44,367,097 801,613 (132,098) 45,036,612
Building, vehicles and equipment 20,093,583 115,411 (47,833) 20,161,161
Total capital assets being depreciated 94,510,351 1,046,344 (179,931) 95,376,764
Less accumulated depreciation: Wells and standpipes (1,603,482) (126,321) - (1,729,803)
Pumping and purification (7,314,591) (498,193) - (7,812,784)
Distribution system (8,159,798) (907,866) 122,868 (8,944,796)
Building, vehicles and equipment (5,369,136) (728,270) 47,833 (6,049,573)
Total accumulated depreciation (22,447,007) (2,260,650) 170,701 (24,536,956)
Total net capital assets being depreciated 72,063,344 (1,214,306) (9,230) 70,839,808
Total net capital assets $ 99,370,881 $
4,350,391 $ (1,055,574) $ 102,665,698
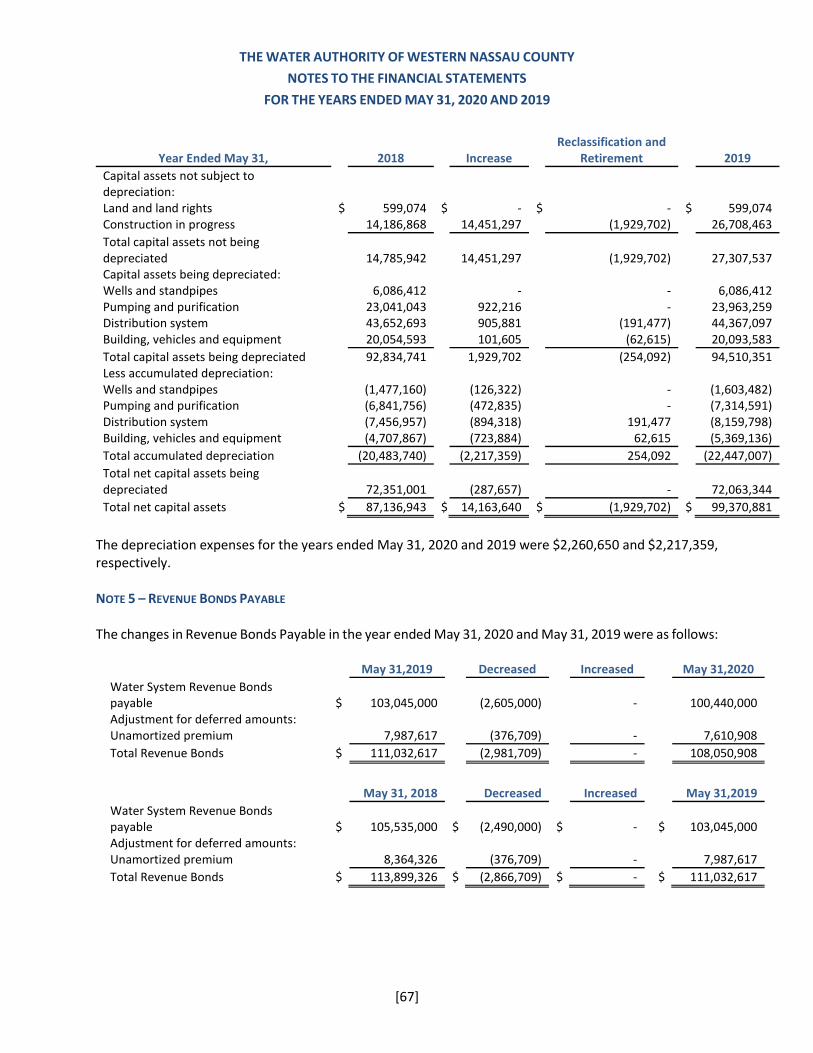
THE WATER AUTHORITY OF WESTERN NASSAU COUNTY
NOTES TO THE FINANCIAL STATEMENTS
FOR THE YEARS ENDED MAY 31, 2020 AND 2019
[67]
Year Ended May 31, 2018 Increase
Reclassification and Retirement 2019
Capital assets not subject to depreciation: Land and land rights $ 599,074 $ - $ - $ 599,074 Construction in progress 14,186,868 14,451,297 (1,929,702) 26,708,463
Total capital assets not being depreciated 14,785,942 14,451,297 (1,929,702) 27,307,537 Capital assets being depreciated: Wells and standpipes 6,086,412 - - 6,086,412 Pumping and purification 23,041,043 922,216 - 23,963,259 Distribution system 43,652,693 905,881 (191,477) 44,367,097 Building, vehicles and equipment 20,054,593 101,605 (62,615) 20,093,583
Total capital assets being depreciated 92,834,741 1,929,702 (254,092) 94,510,351 Less accumulated depreciation: Wells and standpipes (1,477,160) (126,322) - (1,603,482) Pumping and purification (6,841,756) (472,835) - (7,314,591) Distribution system (7,456,957) (894,318) 191,477 (8,159,798) Building, vehicles and equipment (4,707,867) (723,884) 62,615 (5,369,136)
Total accumulated depreciation (20,483,740) (2,217,359) 254,092 (22,447,007)
Total net capital assets being depreciated 72,351,001 (287,657) - 72,063,344
Total net capital assets $ 87,136,943 $ 14,163,640 $ (1,929,702) $ 99,370,881
The depreciation expenses for the years ended May 31, 2020 and 2019 were $2,260,650 and $2,217,359, respectively. NOTE 5 – REVENUE BONDS PAYABLE The changes in Revenue Bonds Payable in the year ended May 31, 2020 and May 31, 2019 were as follows:
May 31,2019 Decreased Increased May 31,2020
Water System Revenue Bonds payable $ 103,045,000 (2,605,000) - 100,440,000 Adjustment for deferred amounts: Unamortized premium 7,987,617 (376,709) - 7,610,908
Total Revenue Bonds $ 111,032,617 (2,981,709) - 108,050,908
May 31, 2018 Decreased Increased May 31,2019
Water System Revenue Bonds payable $ 105,535,000 $ (2,490,000) $ - $ 103,045,000 Adjustment for deferred amounts: Unamortized premium 8,364,326 (376,709) - 7,987,617
Total Revenue Bonds $ 113,899,326 $ (2,866,709) $ - $ 111,032,617
THE WATER AUTHORITY OF WESTERN NASSAU COUNTY
NOTES TO THE FINANCIAL STATEMENTS
FOR THE YEARS ENDED MAY 31, 2020 AND 2019
[68]
SERIES 2005 REVENUE BONDS PAYABLE On August 4, 2005, the Water Authority issued $33,065,000 Water System Revenue Bonds, Series 2005 in part to provide sufficient funds to affect the advanced refunding of 1996 Series bonds, to finance the cost of acquisition and construction of improvements to the Water System and pay certain costs of issuance relating to the Series 2005 Bonds. The interest on the refunding bonds ranged from 2.84% to 5.30% (average interest of 3.7%) and the bonds were issued at a premium of $1,642,140. The $28,155,000 remaining balance of the Water Authority’s outstanding Series 1996A bonds had interest rates ranging from 5.65% to 6.43% (average interest of 5.6%). Simultaneously with the issuance of the Series 2005 Bonds, $28,758,320, the amount of $27,900,000 from the proceeds of the sale of the Series 2005 Bonds together with other available moneys, were used to purchase non-callable direct obligations of the USA. Those securities were deposited in an irrevocable trust with an escrow agent to provide for the May 1, 2006, redemption of the bonds, at a redemption price of 102% plus accrued interest. As a result, $28,225,000 of Series 1996A bonds are considered defeased and the liability for those bonds were removed from the financial statements. The refunding resulted in a difference between the reacquisition price and the net carrying amount of the refunded debt of $2,230,412. The Water Authority completed the refunding to reduce its total debt service payments over the next 30 years to obtain an economic gain (difference between the present values of the old and new debt service payments) of $2,314,315. SERIES 2010 REVENUE BONDS PAYABLE On April 15, 2010, the Water Authority issued its Series 2010 Revenue Bonds. The Series 2010 Revenue Bonds include the Water System Revenue Bonds, Series 2010A (the "Series 2010A Bonds"), with aggregate principal balance of $6,925,000, and Water System Revenue Bonds, Series 2010B (the "Series 2010B Bonds"), federally taxable, Build America Bonds, with aggregate principal balance of $33,965,000. The Bonds were issued pursuant to the water system revenue bonds General Resolution adopted by the Water Authority on May 13, 1996 and the supplemental Series 2010 Resolution adopted on January 25, 2010. The Series 2010 Bonds are the third and fourth Series of Bonds (as that term is defined herein) to be issued under the General Resolution. The Series 2010A Bonds were issued to finance costs of acquisition, improvements and additions to the water system, to fund a deposit to the Reserve Account, and to pay certain costs of issuance relating to the Series 2010A Bonds. The Series 2010B Bonds were issued to finance the cost of acquisition, improvements and additions to the water system, including the construction of the Water Authority’s headquarters, to fund a deposit to the Reserve Account, and to pay certain costs of issuance relating to the Series 2010B Bonds. The Series 2010 Bonds, which are issued as Senior Lien Bonds, are the third and fourth Series of Bonds issued under the General Resolution. The Series 2010 Bonds are payable as to both interest and principal solely from the net revenues on parity with other outstanding Bonds. The Water Authority has elected to treat the Series 2010B Bonds as "Build America Bonds" for purposes of the American Recovery and Reinvestment Act of 2009 (the "Recovery Act") and to receive a cash subsidy from the US Treasury in connection therewith. Pursuant to the Recovery Act, the Water Authority is entitled to receive cash subsidy payments rebating a portion of the interest on the Build America Bonds
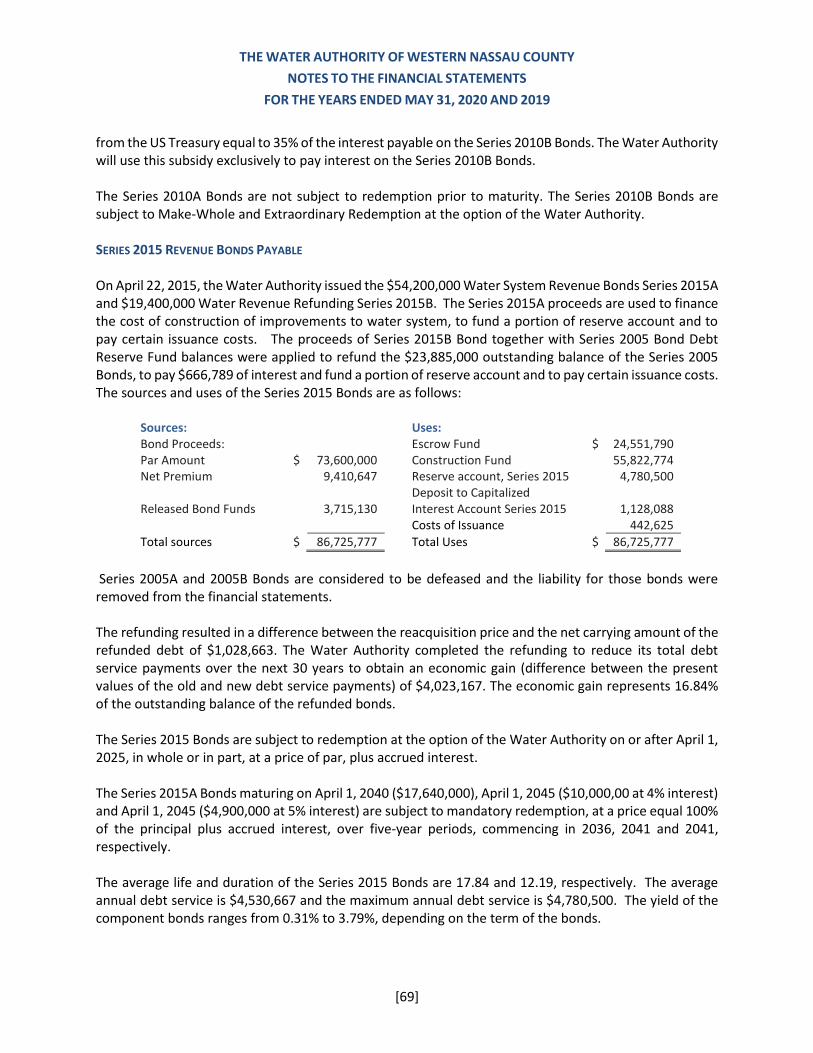
THE WATER AUTHORITY OF WESTERN NASSAU COUNTY
NOTES TO THE FINANCIAL STATEMENTS
FOR THE YEARS ENDED MAY 31, 2020 AND 2019
[69]
from the US Treasury equal to 35% of the interest payable on the Series 2010B Bonds. The Water Authority will use this subsidy exclusively to pay interest on the Series 2010B Bonds. The Series 2010A Bonds are not subject to redemption prior to maturity. The Series 2010B Bonds are subject to Make-Whole and Extraordinary Redemption at the option of the Water Authority. SERIES 2015 REVENUE BONDS PAYABLE On April 22, 2015, the Water Authority issued the $54,200,000 Water System Revenue Bonds Series 2015A and $19,400,000 Water Revenue Refunding Series 2015B. The Series 2015A proceeds are used to finance the cost of construction of improvements to water system, to fund a portion of reserve account and to pay certain issuance costs. The proceeds of Series 2015B Bond together with Series 2005 Bond Debt Reserve Fund balances were applied to refund the $23,885,000 outstanding balance of the Series 2005 Bonds, to pay $666,789 of interest and fund a portion of reserve account and to pay certain issuance costs. The sources and uses of the Series 2015 Bonds are as follows:
Sources: Uses: Bond Proceeds: Escrow Fund $ 24,551,790 Par Amount $ 73,600,000 Construction Fund 55,822,774 Net Premium 9,410,647 Reserve account, Series 2015 4,780,500
Released Bond Funds 3,715,130 Deposit to Capitalized
Interest Account Series 2015 1,128,088
Costs of Issuance 442,625
Total sources $ 86,725,777 Total Uses $ 86,725,777
Series 2005A and 2005B Bonds are considered to be defeased and the liability for those bonds were removed from the financial statements. The refunding resulted in a difference between the reacquisition price and the net carrying amount of the refunded debt of $1,028,663. The Water Authority completed the refunding to reduce its total debt service payments over the next 30 years to obtain an economic gain (difference between the present values of the old and new debt service payments) of $4,023,167. The economic gain represents 16.84% of the outstanding balance of the refunded bonds. The Series 2015 Bonds are subject to redemption at the option of the Water Authority on or after April 1, 2025, in whole or in part, at a price of par, plus accrued interest. The Series 2015A Bonds maturing on April 1, 2040 ($17,640,000), April 1, 2045 ($10,000,00 at 4% interest) and April 1, 2045 ($4,900,000 at 5% interest) are subject to mandatory redemption, at a price equal 100% of the principal plus accrued interest, over five-year periods, commencing in 2036, 2041 and 2041, respectively. The average life and duration of the Series 2015 Bonds are 17.84 and 12.19, respectively. The average annual debt service is $4,530,667 and the maximum annual debt service is $4,780,500. The yield of the component bonds ranges from 0.31% to 3.79%, depending on the term of the bonds.
THE WATER AUTHORITY OF WESTERN NASSAU COUNTY
NOTES TO THE FINANCIAL STATEMENTS
FOR THE YEARS ENDED MAY 31, 2020 AND 2019
[70]
Make-whole Redemption The Series 2010B Bonds are subject to redemption, in whole or in part, prior to their stated maturities, on any date. The redemption price is equal to the greater of:
(i) 100% of the principal amount of such Series 2010B Bonds to be redeemed, plus accrued and unpaid interest, or
(ii) The sum of the present values of the remaining scheduled payments of principal and interest discounted to the date of redemption at the Treasury Rate plus 30 basis points. "Treasury Rate" is the yield to maturity of the Treasury Issue, with equivalent maturity.
Extraordinary Redemption The Series 2010B Bonds are subject to redemption prior to maturity at the option of the Water Authority, in whole or in part, on any date following the occurrence of an “Extraordinary Event”, at redemption price equal to the greater of:
(i) 100% of the principal amount of such Series 2010B Bonds to be redeemed, plus accrued and unpaid interest, or
(ii) The sum of the present values of the remaining scheduled payments of principal and interest on such Series 2010B Bonds to be redeemed discounted to the date of redemption on a semiannual basis at the Treasury Rate plus 100 basis points.
An "Extraordinary Event" occurs if the 35% cash subsidy payment from the US Treasury to the Water Authority is reduced or eliminated as a result of change in provisions of Internal Revenue Code of 1986 pertaining to Build America Bonds or determination by the Internal Revenue Service or the US Treasury that the Bonds do not qualify to receive the subsidy. The Series 2010B Bonds maturing on April 1, 2025, 2030 and 2040 are subject to mandatory redemption prior to their stated maturity in part on each April 1 on and after April 1, 2021, 2026 and 2031, respectively. The Bonds will be redeemed from moneys required to be credited to the Bond Retirement Account in the Bond Fund at a redemption price equal to the principal amount to be redeemed, together with interest accrued on such principal amount to the date fixed for redemption. The General Resolution requires the Water Authority to establish rates and other charges for the water that will be sufficient in each fiscal year to produce revenues (with deposits from Rate Stabilization Fund) that will be at least equal to: (i) the fiscal year's debt service and reserve fund replenishment obligations, operation and maintenance expenses (including amounts to be deposited to the Rate Stabilization Fund), and any other charges or liens; (ii) 1.20 times the debt service for such Fiscal Year.
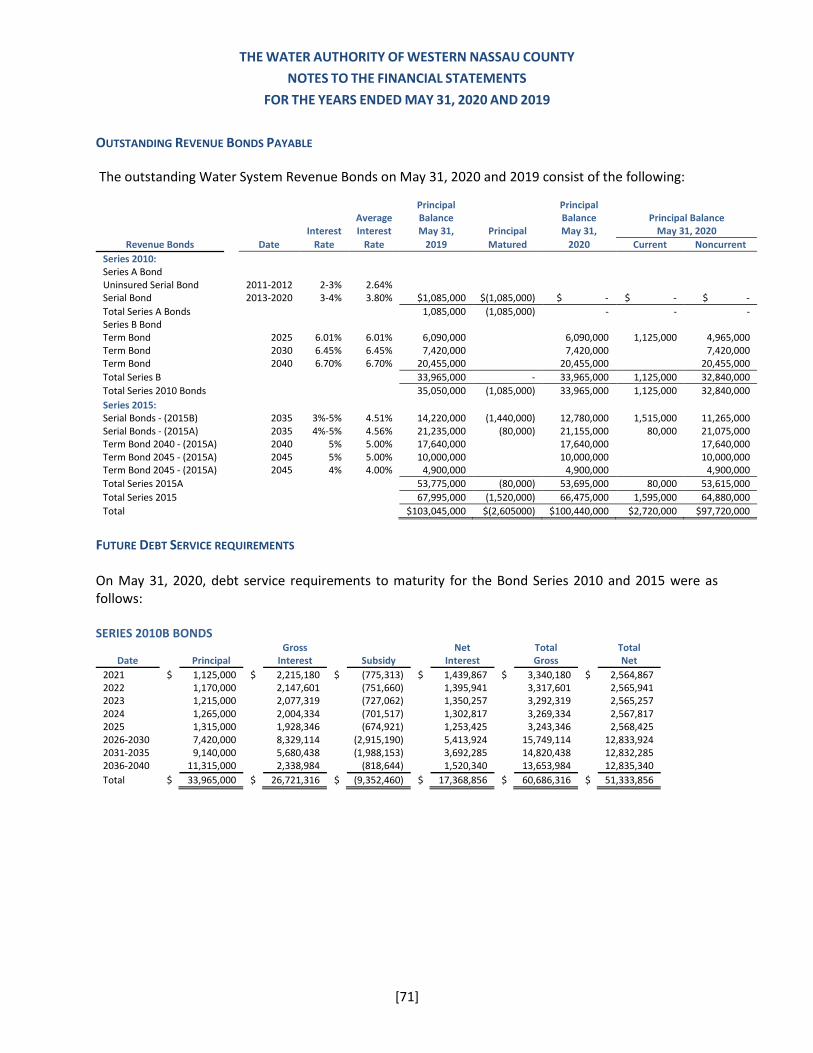
THE WATER AUTHORITY OF WESTERN NASSAU COUNTY
NOTES TO THE FINANCIAL STATEMENTS
FOR THE YEARS ENDED MAY 31, 2020 AND 2019
[71]
OUTSTANDING REVENUE BONDS PAYABLE
The outstanding Water System Revenue Bonds on May 31, 2020 and 2019 consist of the following:
Principal Principal Average Balance Balance Principal Balance
Interest Interest May 31, Principal May 31, May 31, 2020
Revenue Bonds Date Rate Rate 2019 Matured 2020 Current Noncurrent
Series 2010: Series A Bond Uninsured Serial Bond 2011-2012 2-3% 2.64% Serial Bond 2013-2020 3-4% 3.80% $1,085,000 $(1,085,000) $ - $ - $ -
Total Series A Bonds 1,085,000 (1,085,000) - - - Series B Bond Term Bond 2025 6.01% 6.01% 6,090,000 6,090,000 1,125,000 4,965,000 Term Bond 2030 6.45% 6.45% 7,420,000 7,420,000 7,420,000 Term Bond 2040 6.70% 6.70% 20,455,000 20,455,000 20,455,000
Total Series B 33,965,000 - 33,965,000 1,125,000 32,840,000
Total Series 2010 Bonds 35,050,000 (1,085,000) 33,965,000 1,125,000 32,840,000 Series 2015: Serial Bonds - (2015B) 2035 3%-5% 4.51% 14,220,000 (1,440,000) 12,780,000 1,515,000 11,265,000 Serial Bonds - (2015A) 2035 4%-5% 4.56% 21,235,000 (80,000) 21,155,000 80,000 21,075,000 Term Bond 2040 - (2015A) 2040 5% 5.00% 17,640,000 17,640,000 17,640,000 Term Bond 2045 - (2015A) 2045 5% 5.00% 10,000,000 10,000,000 10,000,000 Term Bond 2045 - (2015A) 2045 4% 4.00% 4,900,000 4,900,000 4,900,000
Total Series 2015A 53,775,000 (80,000) 53,695,000 80,000 53,615,000
Total Series 2015 67,995,000 (1,520,000) 66,475,000 1,595,000 64,880,000
Total $103,045,000 $(2,605000) $100,440,000 $2,720,000 $97,720,000
FUTURE DEBT SERVICE REQUIREMENTS On May 31, 2020, debt service requirements to maturity for the Bond Series 2010 and 2015 were as follows: SERIES 2010B BONDS
Gross Net Total Total Date Principal Interest Subsidy Interest Gross Net
2021 $ 1,125,000 $ 2,215,180 $ (775,313) $ 1,439,867 $ 3,340,180 $ 2,564,867 2022 1,170,000 2,147,601 (751,660) 1,395,941 3,317,601 2,565,941 2023 1,215,000 2,077,319 (727,062) 1,350,257 3,292,319 2,565,257 2024 1,265,000 2,004,334 (701,517) 1,302,817 3,269,334 2,567,817 2025 1,315,000 1,928,346 (674,921) 1,253,425 3,243,346 2,568,425 2026-2030 7,420,000 8,329,114 (2,915,190) 5,413,924 15,749,114 12,833,924 2031-2035 9,140,000 5,680,438 (1,988,153) 3,692,285 14,820,438 12,832,285 2036-2040 11,315,000 2,338,984 (818,644) 1,520,340 13,653,984 12,835,340
Total $ 33,965,000 $ 26,721,316 $ (9,352,460) $ 17,368,856 $ 60,686,316 $ 51,333,856
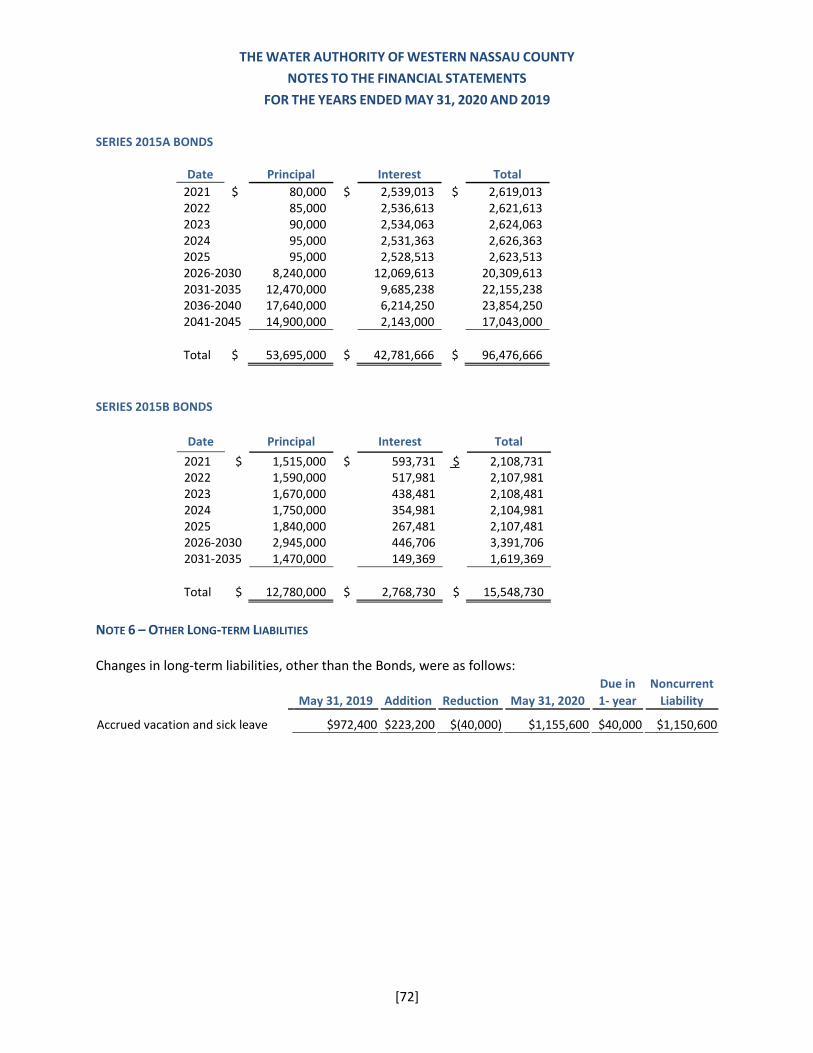
THE WATER AUTHORITY OF WESTERN NASSAU COUNTY
NOTES TO THE FINANCIAL STATEMENTS
FOR THE YEARS ENDED MAY 31, 2020 AND 2019
[72]
SERIES 2015A BONDS
Date Principal Interest Total
2021 $ 80,000 $ 2,539,013 $ 2,619,013 2022 85,000 2,536,613 2,621,613 2023 90,000 2,534,063 2,624,063 2024 95,000 2,531,363 2,626,363 2025 95,000 2,528,513 2,623,513 2026-2030 8,240,000 12,069,613 20,309,613 2031-2035 12,470,000 9,685,238 22,155,238 2036-2040 17,640,000 6,214,250 23,854,250 2041-2045 14,900,000 2,143,000 17,043,000
Total $ 53,695,000 $ 42,781,666 $ 96,476,666
SERIES 2015B BONDS
Date Principal Interest Total
2021 $ 1,515,000 $ 593,731 $ 2,108,731 2022 1,590,000 517,981 2,107,981 2023 1,670,000 438,481 2,108,481 2024 1,750,000 354,981 2,104,981 2025 1,840,000 267,481 2,107,481 2026-2030 2,945,000 446,706 3,391,706 2031-2035 1,470,000 149,369 1,619,369
Total $ 12,780,000 $ 2,768,730 $ 15,548,730
NOTE 6 – OTHER LONG-TERM LIABILITIES Changes in long-term liabilities, other than the Bonds, were as follows:
Due in Noncurrent
May 31, 2019 Addition
Reduction May 31, 2020 1- year Liability
Accrued vacation and sick leave $972,400 $223,200 $(40,000) $1,155,600 $40,000 $1,150,600
THE WATER AUTHORITY OF WESTERN NASSAU COUNTY
NOTES TO THE FINANCIAL STATEMENTS
FOR THE YEARS ENDED MAY 31, 2020 AND 2019
[73]
NOTE 7 – EMPLOYEE BENEFITS Retirement Plan Description The Water Authority participates in the New York State and Local Employees’ Retirement System the System), a cost-sharing multiple-employer defined benefit retirement systems. The system provides retirement benefits as well as death and disability benefits. The net position of the System is held in the New York State Common Retirement Fund (the Fund), which was established to hold all net assets and record changes in fiduciary net position allocated to the System. The Comptroller of the State of New York serves as the trustee of the Fund and is the administrative head of the System. System benefits are established under the provisions of the New York State Retirement and Social Security Law (RSSL). Once a public employer elects to participate in the System, the election is irrevocable. The New York State Constitution provides that pension membership is a contractual relationship and plan benefits cannot be diminished or impaired. Benefits can be changed for future members only by enactment of a State statute. The Water Authority also participates in the Public Employees’ Group Life Insurance Plan (GLIP), which provides death benefits in the form of life insurance. The System issues its own financial statements. The System’s comprehensive annual financial reports, annual financial statements, annual employer allocation and pension amounts, and annual actuarial assumptions reports may be found at:
• https://www.osc.state.ny.us/retirement/resources/financial-statements-and-supplementary-
information
• or obtained by writing to the New York State and Local Retirement System, 110 State Street,
Albany, NY 12244.
Eligibility and Benefits The Water Authority employees are classified into tiers, based on the period of their enrollment time. The employees ‘eligibility, contributions and benefits depend on their respective tier. The employee tiers are as follows: Tiers 1 and 2 Eligibility: Tier 1 members, with the exception of those retiring under special retirement plans, must be at least age 55 to be eligible to collect a retirement benefit. There is no minimum service requirement for Tier 1 members. Tier 2 members, with the exception of those retiring under special retirement plans, must have five years of service and be at least age 55 to be eligible to collect a retirement benefit. The
Tier Enrollment Period
Tier 1 Before July 1, 1973
Tier 2 July 1, 1973 to July 27, 1976
Tier 3 July 27, 1976 to September 1, 1983
Tier 4 September 1, 1983 to January 1, 2010
Tier 5 January 1, 2010 to April 1, 2012
Tier 6 April 1, 2012 and after
THE WATER AUTHORITY OF WESTERN NASSAU COUNTY
NOTES TO THE FINANCIAL STATEMENTS
FOR THE YEARS ENDED MAY 31, 2020 AND 2019
[74]
age at which full benefits may be collected for Tier 1 is 55, and the full benefit age for Tier 2 is 62. Benefit Calculation: Generally, the benefit is 1.67% of final average salary for each year of service if the member retires with less than 20 years. If the member retires with 20 or more years of service, the benefit is 2.0% of final average salary for each year of service. Tier 2 members with five or more years of service can retire as early as age 55 with reduced benefits. Tier 2 members age 55 or older with 30 or more years of service can retire with no reduction in benefits. As a result of Article 19 of the RSSL, Tier 1 and Tier 2 members who worked continuously from April 1, 1999 through October 1, 2000 received an additional month of service credit for each year of credited service they have at retirement, up to a maximum of 24 additional months. Final average salary is the average of the wages earned in the three highest consecutive years. For Tier 1 members who joined on or after June 17, 1971, each year of final average salary is limited to no more than 20% of the previous year. For Tier 2 members, each year of final average salary is limited to no more than 20% of the average of the previous two years. Tiers 3, 4, and 5 Eligibility: Tier 3 and 4 members, with the exception of those retiring under special retirement plans, must have five years of service and be at least age 55 to be eligible to collect a retirement benefit. Tier 5 members, with the exception of those retiring under special retirement plans, must have ten years of service and be at least 55 to be eligible to collect a retirement benefit. The full benefit age for Tiers 3, 4 and 5 is 62. Benefit calculation: Generally, the benefit is 1.67% of final average salary for each year of service if the member retires with less than 20 years. If a member retires with between 20 and 30 years of service, the benefit is 2.0% of final average salary for each year of service. If a member retires with more than 30 years of service, an additional benefit of 1.5% of final average salary is applied for each year of service over 30 years. Tier 3 and 4 members with five or more years of service and Tier 5 members with ten or more years of service can retire as early as age 55 with reduced benefits. Tier 3- and 4-members age 55 or older with 30 or more years of service can retire with no reduction in benefits. Final average salary is the average of the wages earned in the three highest consecutive years. For Tier 3, 4, and 5 members, each year of final average salary is limited to no more than 10% of the average of the previous two years. Tier 6 Eligibility: Tier 6 members, with the exception of those retiring under special retirement plans, must have ten years of service and be at least age 55 to be eligible to collect a retirement benefit. The full benefit age for Tier 6 is 63 for ERS members and 62 for PFRS members. Benefit calculation: Generally, the benefit is 1.67% of final average salary for each year of service if the member retires with less than 20 years. If a member retires with 20 years of service, the benefit is 1.75% of final average salary for each year of service. If a member retires with more than 20 years of service, an additional benefit of 2.0% of final average salary is applied for each year of service over 20 years. Tier 6 members with ten or more years of service can retire as early as age 55 with reduced benefits. Final average salary is the average of the wages earned in the five highest consecutive years. For Tier 6 members, each year of final average salary is limited to no more than 10% of the average of the previous four years.
THE WATER AUTHORITY OF WESTERN NASSAU COUNTY
NOTES TO THE FINANCIAL STATEMENTS
FOR THE YEARS ENDED MAY 31, 2020 AND 2019
[75]
Ordinary Disability Benefits Generally, ordinary disability benefits, usually one-third of salary, are provided to eligible members after ten years of service; in some cases, they are provided after five years of service. Accidental Disability Benefits For all eligible Tier 1 and Tier 2 members, the accidental disability benefit is a pension of 75 percent of final average salary, with an offset for any Workers’ compensation benefits received. The benefit for eligible Tier 3, 4, 5 and 6 members is the ordinary disability benefit with the years-of-service eligibility requirement dropped. Ordinary Death Benefits Death benefits are payable upon the death, before retirement, of a member who meets eligibility requirements as set forth by law. The first $50,000 of an ordinary death benefit is paid in the form of group term life insurance. The benefit is generally three times the member’s annual salary. For most members, there is also a reduced post-retirement ordinary death benefit available. Post-Retirement Benefit Increases A cost-of-living adjustment is provided annually to: (i) all retirees who have attained age 62 and have been retired for five years; (ii) all retirees who have attained age 55 and have been retired for ten years; (iii) all disability retirees, regardless of age, who have been retired for five years; (iv) ERS recipients of an accidental death benefit, regardless of age, who have been receiving such benefit for five years; and (v) the spouse of a deceased retiree receiving a lifetime benefit under an option elected by the retiree at retirement. An eligible spouse is entitled to one-half the cost-of-living adjustment amount that would have been paid to the retiree when the retiree would have met the eligibility criteria. This cost-of-living adjustment is a percentage of the annual retirement benefit of the eligible retiree as computed on a base benefit amount not to exceed $18,000 of the annual retirement benefit. The cost-of-living percentage shall be 50 percent of the annual Consumer Price Index as published by the U.S. Bureau of Labor but cannot be less than 1 percent or exceed 3 percent. Vesting Members who joined the System prior to January 1, 2010 need five years of service to be 100 percent vested. Members who joined on or after January 1, 2010 (ERS) or January 9, 2010 (PFRS) require ten years of service credit to be 100 percent vested. Contributions Member Contributions The System is contributory for employees who joined the New York State and Local Employees’ Retirement System after July 27, 1976. For Tier 1 and Tier 2 employees, who had joined the System before July 27, 1976, the System is noncontributory. Generally, Tier 3, 4, and 5 members must contribute 3 percent of their salary to the System. As a result of Article 19 of the RSSL, eligible Tier 3 and 4 employees, with a membership date on or after July 27, 1976, who have ten or more years of membership or credited service with the System, are not required to contribute. Members cannot be required to begin making contributions or to make increased contributions beyond what was required when membership began. For Tier 6 members, the contribution rate varies from 3 percent to 6 percent depending on salary. Generally, Tier 5 and 6 members are required to contribute for all years of service.
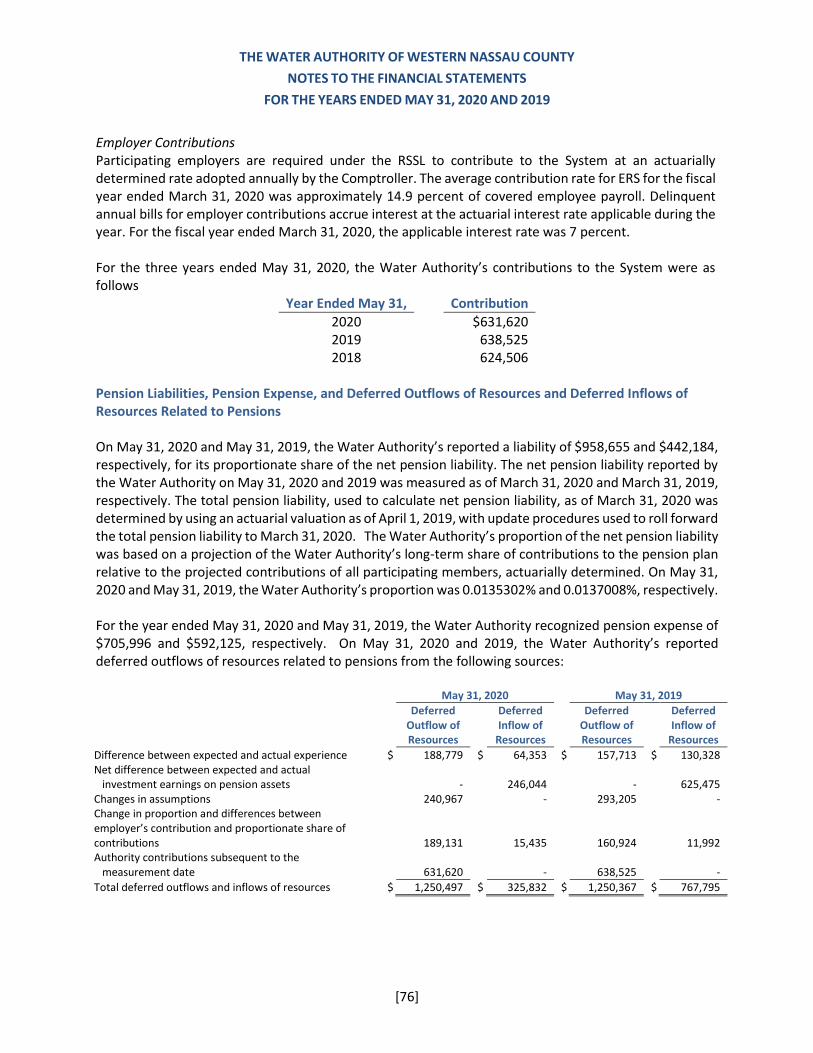
THE WATER AUTHORITY OF WESTERN NASSAU COUNTY
NOTES TO THE FINANCIAL STATEMENTS
FOR THE YEARS ENDED MAY 31, 2020 AND 2019
[76]
Employer Contributions Participating employers are required under the RSSL to contribute to the System at an actuarially determined rate adopted annually by the Comptroller. The average contribution rate for ERS for the fiscal year ended March 31, 2020 was approximately 14.9 percent of covered employee payroll. Delinquent annual bills for employer contributions accrue interest at the actuarial interest rate applicable during the year. For the fiscal year ended March 31, 2020, the applicable interest rate was 7 percent. For the three years ended May 31, 2020, the Water Authority’s contributions to the System were as follows
Year Ended May 31, Contribution
2020 $631,620 2019 638,525 2018 624,506
Pension Liabilities, Pension Expense, and Deferred Outflows of Resources and Deferred Inflows of Resources Related to Pensions On May 31, 2020 and May 31, 2019, the Water Authority’s reported a liability of $958,655 and $442,184, respectively, for its proportionate share of the net pension liability. The net pension liability reported by the Water Authority on May 31, 2020 and 2019 was measured as of March 31, 2020 and March 31, 2019, respectively. The total pension liability, used to calculate net pension liability, as of March 31, 2020 was determined by using an actuarial valuation as of April 1, 2019, with update procedures used to roll forward the total pension liability to March 31, 2020. The Water Authority’s proportion of the net pension liability was based on a projection of the Water Authority’s long-term share of contributions to the pension plan relative to the projected contributions of all participating members, actuarially determined. On May 31, 2020 and May 31, 2019, the Water Authority’s proportion was 0.0135302% and 0.0137008%, respectively. For the year ended May 31, 2020 and May 31, 2019, the Water Authority recognized pension expense of $705,996 and $592,125, respectively. On May 31, 2020 and 2019, the Water Authority’s reported deferred outflows of resources related to pensions from the following sources: May 31, 2020 May 31, 2019
Deferred Outflow of Resources
Deferred Inflow of
Resources
Deferred Outflow of Resources
Deferred Inflow of
Resources
Difference between expected and actual experience $ 188,779 $ 64,353 $ 157,713 $ 130,328 Net difference between expected and actual investment earnings on pension assets - 246,044 - 625,475 Changes in assumptions 240,967 - 293,205 - Change in proportion and differences between employer’s contribution and proportionate share of contributions 189,131 15,435 160,924 11,992 Authority contributions subsequent to the measurement date 631,620 - 638,525 -
Total deferred outflows and inflows of resources $ 1,250,497 $ 325,832 $ 1,250,367 $ 767,795
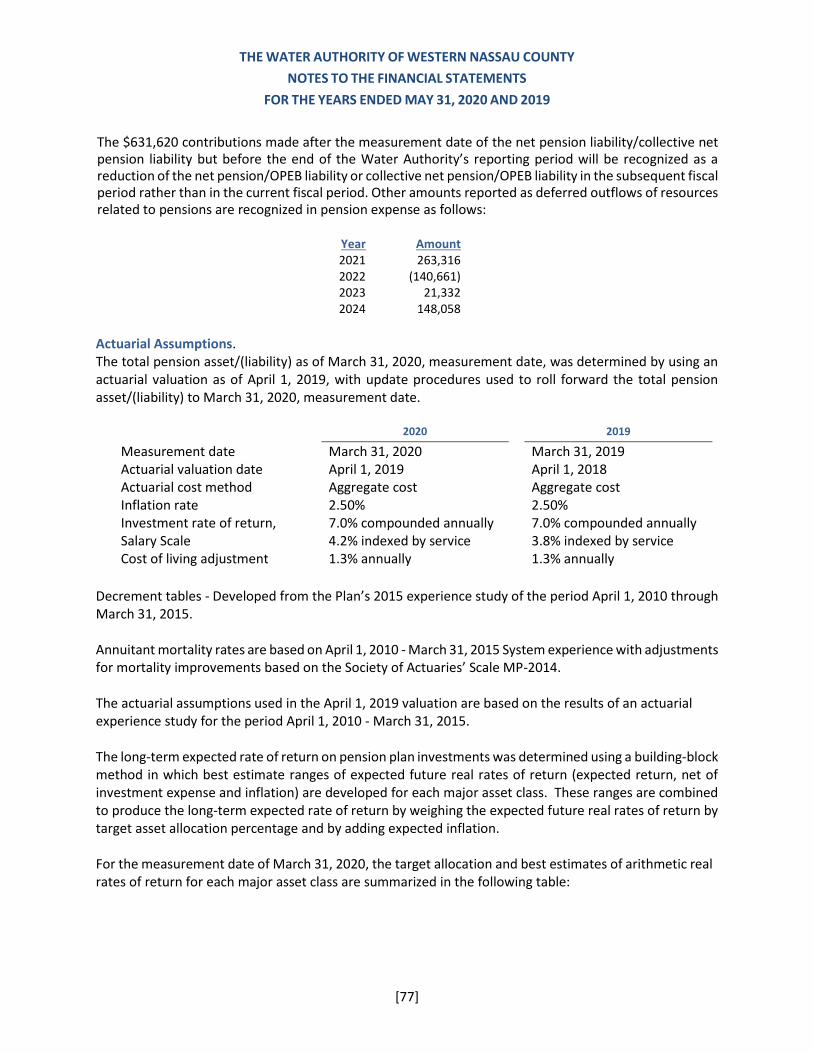
THE WATER AUTHORITY OF WESTERN NASSAU COUNTY
NOTES TO THE FINANCIAL STATEMENTS
FOR THE YEARS ENDED MAY 31, 2020 AND 2019
[77]
The $631,620 contributions made after the measurement date of the net pension liability/collective net pension liability but before the end of the Water Authority’s reporting period will be recognized as a reduction of the net pension/OPEB liability or collective net pension/OPEB liability in the subsequent fiscal period rather than in the current fiscal period. Other amounts reported as deferred outflows of resources related to pensions are recognized in pension expense as follows:
Actuarial Assumptions. The total pension asset/(liability) as of March 31, 2020, measurement date, was determined by using an actuarial valuation as of April 1, 2019, with update procedures used to roll forward the total pension asset/(liability) to March 31, 2020, measurement date.
2020 2019
Measurement date March 31, 2020 March 31, 2019 Actuarial valuation date April 1, 2019 April 1, 2018 Actuarial cost method Aggregate cost Aggregate cost Inflation rate 2.50% 2.50% Investment rate of return, 7.0% compounded annually 7.0% compounded annually Salary Scale 4.2% indexed by service 3.8% indexed by service Cost of living adjustment 1.3% annually 1.3% annually
Decrement tables - Developed from the Plan’s 2015 experience study of the period April 1, 2010 through March 31, 2015. Annuitant mortality rates are based on April 1, 2010 - March 31, 2015 System experience with adjustments for mortality improvements based on the Society of Actuaries’ Scale MP-2014. The actuarial assumptions used in the April 1, 2019 valuation are based on the results of an actuarial experience study for the period April 1, 2010 - March 31, 2015. The long-term expected rate of return on pension plan investments was determined using a building-block method in which best estimate ranges of expected future real rates of return (expected return, net of investment expense and inflation) are developed for each major asset class. These ranges are combined to produce the long-term expected rate of return by weighing the expected future real rates of return by target asset allocation percentage and by adding expected inflation. For the measurement date of March 31, 2020, the target allocation and best estimates of arithmetic real rates of return for each major asset class are summarized in the following table:
Year Amount 2021 263,316 2022 (140,661) 2023 21,332 2024 148,058
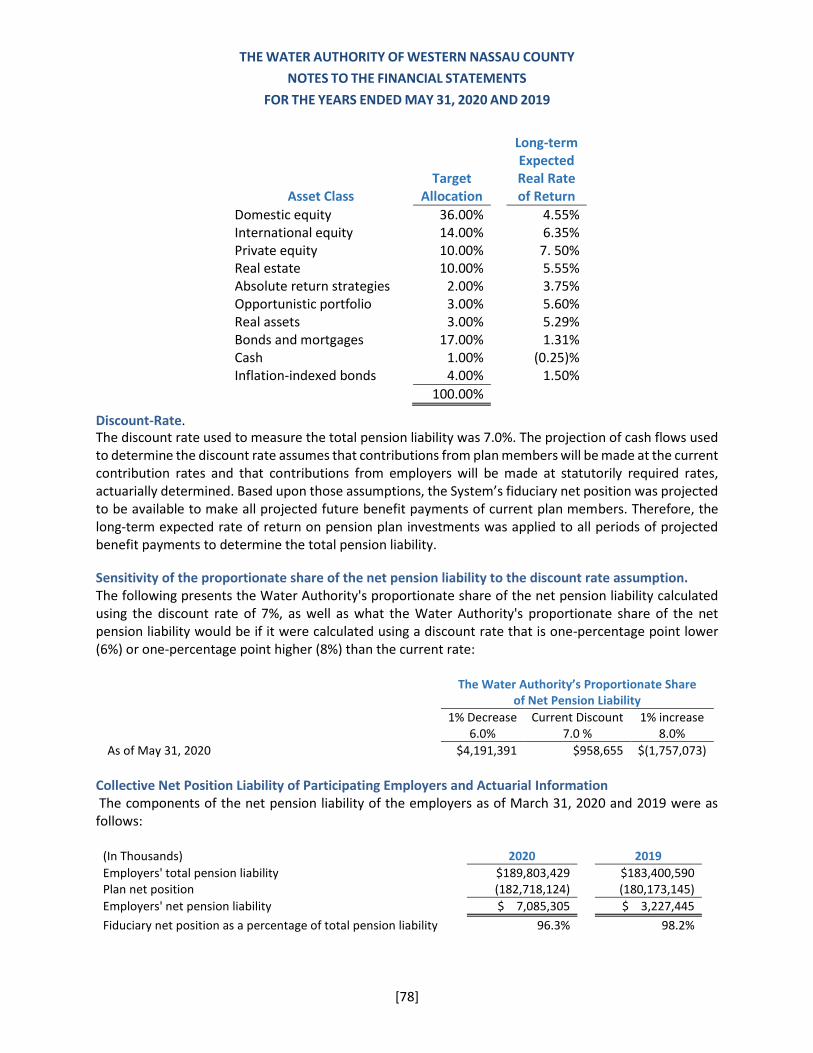
THE WATER AUTHORITY OF WESTERN NASSAU COUNTY
NOTES TO THE FINANCIAL STATEMENTS
FOR THE YEARS ENDED MAY 31, 2020 AND 2019
[78]
Asset Class Target
Allocation
Long-term Expected Real Rate of Return
Domestic equity 36.00% 4.55% International equity 14.00% 6.35% Private equity 10.00% 7. 50% Real estate 10.00% 5.55% Absolute return strategies 2.00% 3.75% Opportunistic portfolio 3.00% 5.60% Real assets 3.00% 5.29% Bonds and mortgages 17.00% 1.31% Cash 1.00% (0.25)% Inflation-indexed bonds 4.00% 1.50%
100.00%
Discount-Rate. The discount rate used to measure the total pension liability was 7.0%. The projection of cash flows used to determine the discount rate assumes that contributions from plan members will be made at the current contribution rates and that contributions from employers will be made at statutorily required rates, actuarially determined. Based upon those assumptions, the System’s fiduciary net position was projected to be available to make all projected future benefit payments of current plan members. Therefore, the long-term expected rate of return on pension plan investments was applied to all periods of projected benefit payments to determine the total pension liability.
Sensitivity of the proportionate share of the net pension liability to the discount rate assumption. The following presents the Water Authority's proportionate share of the net pension liability calculated using the discount rate of 7%, as well as what the Water Authority's proportionate share of the net pension liability would be if it were calculated using a discount rate that is one-percentage point lower (6%) or one-percentage point higher (8%) than the current rate:
The Water Authority’s Proportionate Share of Net Pension Liability
1% Decrease Current Discount 1% increase
6.0% 7.0 % 8.0%
As of May 31, 2020 $4,191,391 $958,655 $(1,757,073)
Collective Net Position Liability of Participating Employers and Actuarial Information The components of the net pension liability of the employers as of March 31, 2020 and 2019 were as follows:
(In Thousands) 2020 2019
Employers' total pension liability $189,803,429 $183,400,590 Plan net position (182,718,124) (180,173,145)
Employers' net pension liability $ 7,085,305 $ 3,227,445
Fiduciary net position as a percentage of total pension liability 96.3% 98.2%
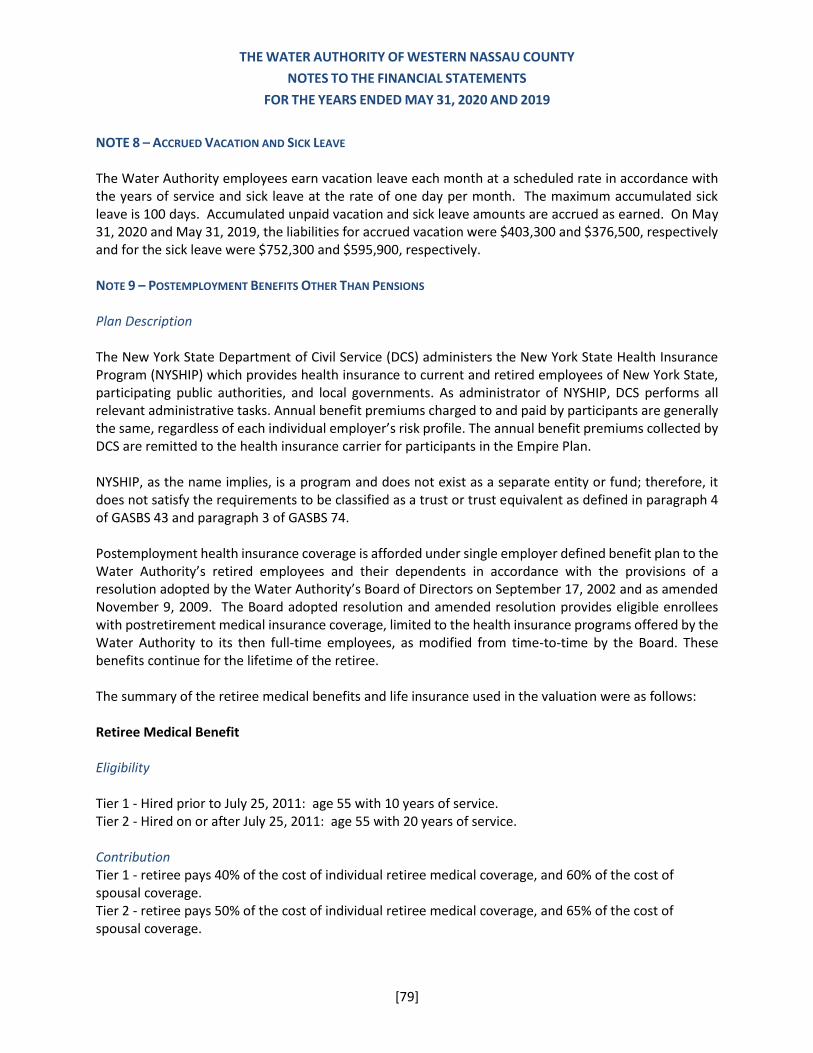
THE WATER AUTHORITY OF WESTERN NASSAU COUNTY
NOTES TO THE FINANCIAL STATEMENTS
FOR THE YEARS ENDED MAY 31, 2020 AND 2019
[79]
NOTE 8 – ACCRUED VACATION AND SICK LEAVE The Water Authority employees earn vacation leave each month at a scheduled rate in accordance with the years of service and sick leave at the rate of one day per month. The maximum accumulated sick leave is 100 days. Accumulated unpaid vacation and sick leave amounts are accrued as earned. On May 31, 2020 and May 31, 2019, the liabilities for accrued vacation were $403,300 and $376,500, respectively and for the sick leave were $752,300 and $595,900, respectively. NOTE 9 – POSTEMPLOYMENT BENEFITS OTHER THAN PENSIONS Plan Description The New York State Department of Civil Service (DCS) administers the New York State Health Insurance Program (NYSHIP) which provides health insurance to current and retired employees of New York State, participating public authorities, and local governments. As administrator of NYSHIP, DCS performs all relevant administrative tasks. Annual benefit premiums charged to and paid by participants are generally the same, regardless of each individual employer’s risk profile. The annual benefit premiums collected by DCS are remitted to the health insurance carrier for participants in the Empire Plan. NYSHIP, as the name implies, is a program and does not exist as a separate entity or fund; therefore, it does not satisfy the requirements to be classified as a trust or trust equivalent as defined in paragraph 4 of GASBS 43 and paragraph 3 of GASBS 74. Postemployment health insurance coverage is afforded under single employer defined benefit plan to the Water Authority’s retired employees and their dependents in accordance with the provisions of a resolution adopted by the Water Authority’s Board of Directors on September 17, 2002 and as amended November 9, 2009. The Board adopted resolution and amended resolution provides eligible enrollees with postretirement medical insurance coverage, limited to the health insurance programs offered by the Water Authority to its then full-time employees, as modified from time-to-time by the Board. These benefits continue for the lifetime of the retiree. The summary of the retiree medical benefits and life insurance used in the valuation were as follows: Retiree Medical Benefit Eligibility Tier 1 - Hired prior to July 25, 2011: age 55 with 10 years of service. Tier 2 - Hired on or after July 25, 2011: age 55 with 20 years of service. Contribution Tier 1 - retiree pays 40% of the cost of individual retiree medical coverage, and 60% of the cost of spousal coverage. Tier 2 - retiree pays 50% of the cost of individual retiree medical coverage, and 65% of the cost of spousal coverage.
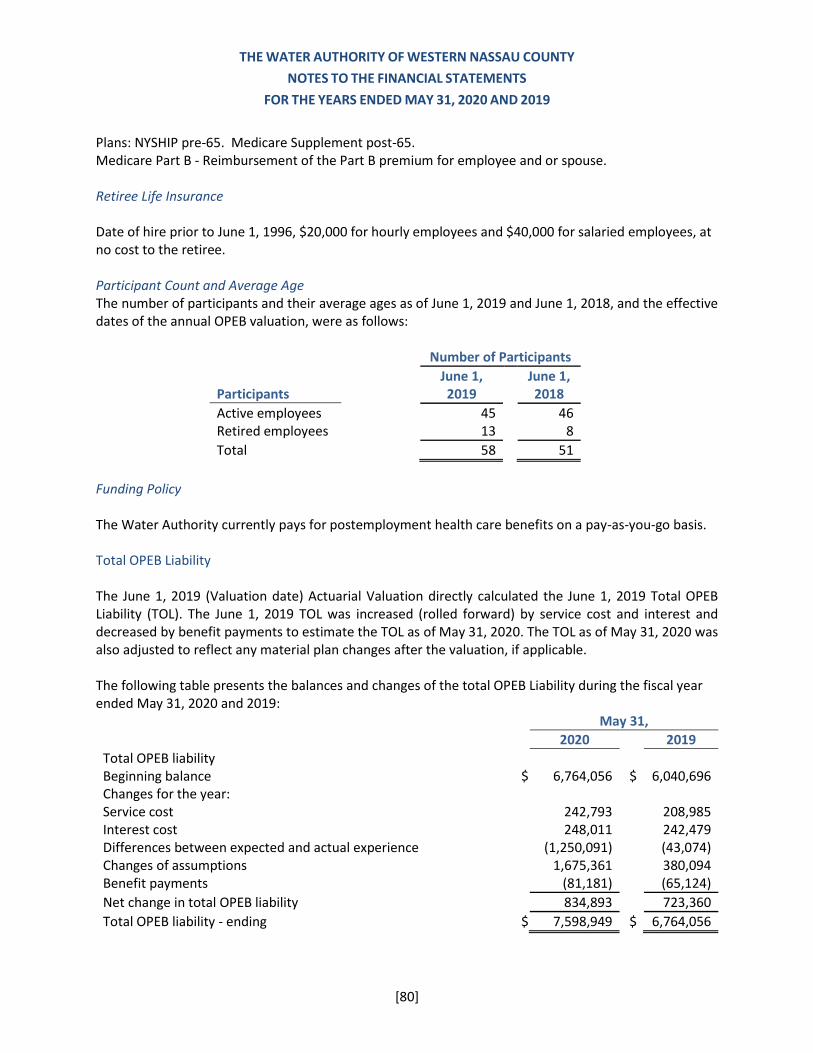
THE WATER AUTHORITY OF WESTERN NASSAU COUNTY
NOTES TO THE FINANCIAL STATEMENTS
FOR THE YEARS ENDED MAY 31, 2020 AND 2019
[80]
Plans: NYSHIP pre-65. Medicare Supplement post-65. Medicare Part B - Reimbursement of the Part B premium for employee and or spouse. Retiree Life Insurance Date of hire prior to June 1, 1996, $20,000 for hourly employees and $40,000 for salaried employees, at no cost to the retiree. Participant Count and Average Age The number of participants and their average ages as of June 1, 2019 and June 1, 2018, and the effective dates of the annual OPEB valuation, were as follows:
Number of Participants
Participants
June 1, 2019
June 1, 2018
Active employees 45 46 Retired employees 13 8
Total 58 51
Funding Policy The Water Authority currently pays for postemployment health care benefits on a pay-as-you-go basis. Total OPEB Liability The June 1, 2019 (Valuation date) Actuarial Valuation directly calculated the June 1, 2019 Total OPEB Liability (TOL). The June 1, 2019 TOL was increased (rolled forward) by service cost and interest and decreased by benefit payments to estimate the TOL as of May 31, 2020. The TOL as of May 31, 2020 was also adjusted to reflect any material plan changes after the valuation, if applicable. The following table presents the balances and changes of the total OPEB Liability during the fiscal year ended May 31, 2020 and 2019:
May 31,
2020 2019
Total OPEB liability Beginning balance $ 6,764,056 $ 6,040,696 Changes for the year: Service cost 242,793 208,985 Interest cost 248,011 242,479 Differences between expected and actual experience (1,250,091) (43,074) Changes of assumptions 1,675,361 380,094 Benefit payments (81,181) (65,124)
Net change in total OPEB liability 834,893 723,360
Total OPEB liability - ending $ 7,598,949 $ 6,764,056
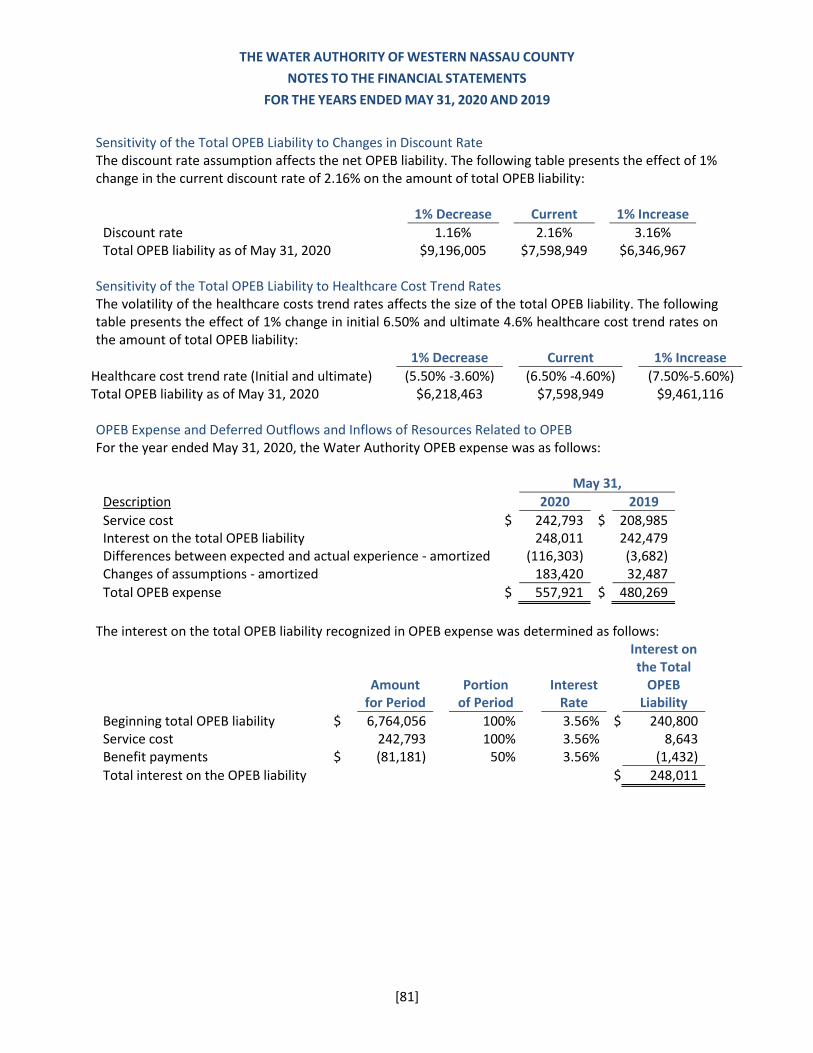
THE WATER AUTHORITY OF WESTERN NASSAU COUNTY
NOTES TO THE FINANCIAL STATEMENTS
FOR THE YEARS ENDED MAY 31, 2020 AND 2019
[81]
Sensitivity of the Total OPEB Liability to Changes in Discount Rate The discount rate assumption affects the net OPEB liability. The following table presents the effect of 1% change in the current discount rate of 2.16% on the amount of total OPEB liability:
1% Decrease Current 1% Increase
Discount rate 1.16% 2.16% 3.16% Total OPEB liability as of May 31, 2020 $9,196,005 $7,598,949 $6,346,967
Sensitivity of the Total OPEB Liability to Healthcare Cost Trend Rates The volatility of the healthcare costs trend rates affects the size of the total OPEB liability. The following table presents the effect of 1% change in initial 6.50% and ultimate 4.6% healthcare cost trend rates on the amount of total OPEB liability:
1% Decrease Current 1% Increase
Healthcare cost trend rate (Initial and ultimate) (5.50% -3.60%) (6.50% -4.60%) (7.50%-5.60%) Total OPEB liability as of May 31, 2020 $ $6,218,463 $7,598,949 $9,461,116 OPEB Expense and Deferred Outflows and Inflows of Resources Related to OPEB For the year ended May 31, 2020, the Water Authority OPEB expense was as follows:
May 31,
Description 2020 2019
Service cost $ 242,793 $ 208,985 Interest on the total OPEB liability 248,011 242,479 Differences between expected and actual experience - amortized (116,303) (3,682) Changes of assumptions - amortized 183,420 32,487
Total OPEB expense $ 557,921 $ 480,269
The interest on the total OPEB liability recognized in OPEB expense was determined as follows:
Amount for Period
Portion of Period
Interest Rate
Interest on the Total
OPEB Liability
Beginning total OPEB liability $ 6,764,056 100% 3.56% $ 240,800 Service cost 242,793 100% 3.56% 8,643 Benefit payments $ (81,181) 50% 3.56% (1,432)
Total interest on the OPEB liability $ 248,011
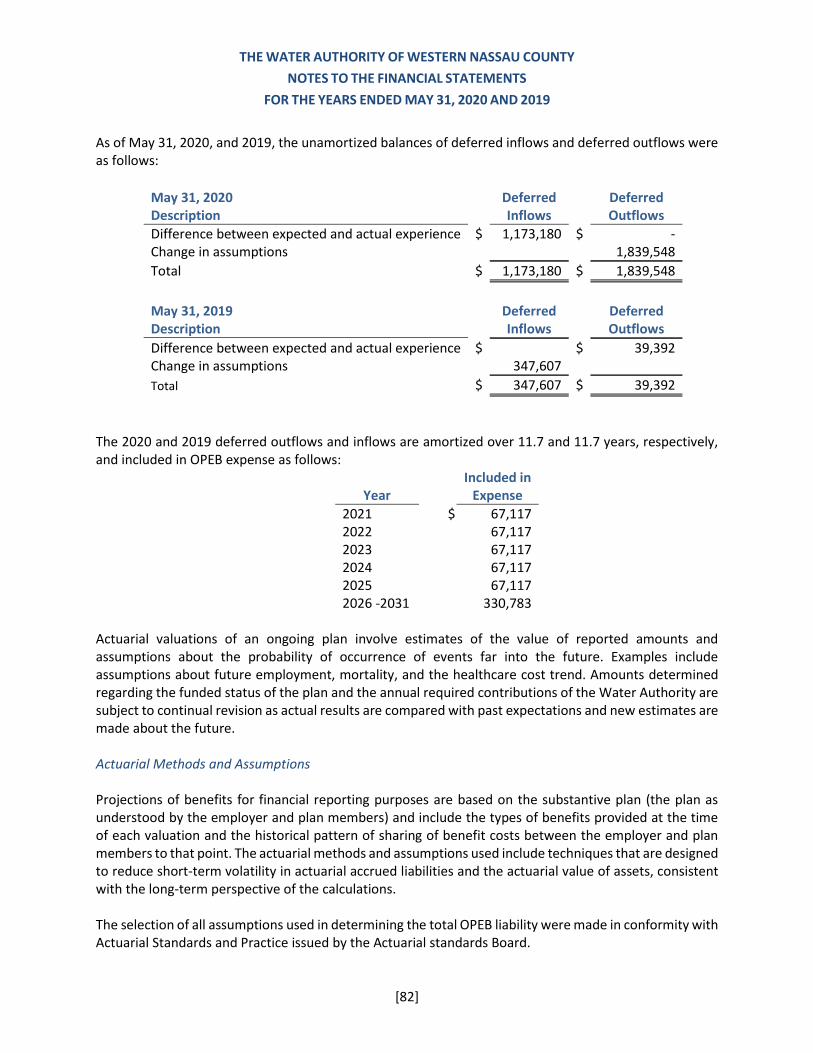
THE WATER AUTHORITY OF WESTERN NASSAU COUNTY
NOTES TO THE FINANCIAL STATEMENTS
FOR THE YEARS ENDED MAY 31, 2020 AND 2019
[82]
As of May 31, 2020, and 2019, the unamortized balances of deferred inflows and deferred outflows were as follows:
May 31, 2020 Description
Deferred Inflows
Deferred Outflows
Difference between expected and actual experience $ 1,173,180 $ - Change in assumptions
1,839,548
Total $ 1,173,180 $ 1,839,548
May 31, 2019 Description
Deferred Inflows
Deferred Outflows
Difference between expected and actual experience $ $ 39,392 Change in assumptions 347,607 Total $ 347,607 $ 39,392
The 2020 and 2019 deferred outflows and inflows are amortized over 11.7 and 11.7 years, respectively, and included in OPEB expense as follows:
Year
Included in Expense
2021 $ 67,117 2022 67,117 2023 67,117 2024 67,117 2025 67,117 2026 -2031 330,783
Actuarial valuations of an ongoing plan involve estimates of the value of reported amounts and assumptions about the probability of occurrence of events far into the future. Examples include assumptions about future employment, mortality, and the healthcare cost trend. Amounts determined regarding the funded status of the plan and the annual required contributions of the Water Authority are subject to continual revision as actual results are compared with past expectations and new estimates are made about the future. Actuarial Methods and Assumptions Projections of benefits for financial reporting purposes are based on the substantive plan (the plan as understood by the employer and plan members) and include the types of benefits provided at the time of each valuation and the historical pattern of sharing of benefit costs between the employer and plan members to that point. The actuarial methods and assumptions used include techniques that are designed to reduce short-term volatility in actuarial accrued liabilities and the actuarial value of assets, consistent with the long-term perspective of the calculations. The selection of all assumptions used in determining the total OPEB liability were made in conformity with Actuarial Standards and Practice issued by the Actuarial standards Board.
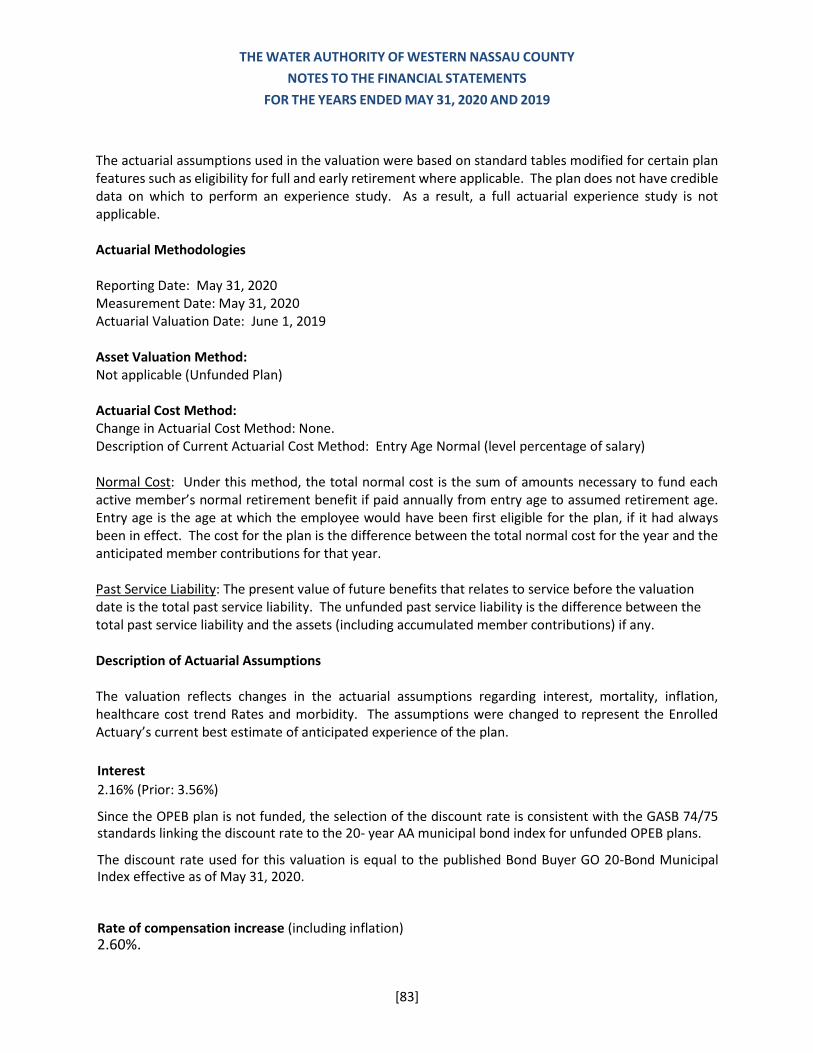
THE WATER AUTHORITY OF WESTERN NASSAU COUNTY
NOTES TO THE FINANCIAL STATEMENTS
FOR THE YEARS ENDED MAY 31, 2020 AND 2019
[83]
The actuarial assumptions used in the valuation were based on standard tables modified for certain plan features such as eligibility for full and early retirement where applicable. The plan does not have credible data on which to perform an experience study. As a result, a full actuarial experience study is not applicable. Actuarial Methodologies Reporting Date: May 31, 2020 Measurement Date: May 31, 2020 Actuarial Valuation Date: June 1, 2019 Asset Valuation Method: Not applicable (Unfunded Plan) Actuarial Cost Method: Change in Actuarial Cost Method: None. Description of Current Actuarial Cost Method: Entry Age Normal (level percentage of salary) Normal Cost: Under this method, the total normal cost is the sum of amounts necessary to fund each active member’s normal retirement benefit if paid annually from entry age to assumed retirement age. Entry age is the age at which the employee would have been first eligible for the plan, if it had always been in effect. The cost for the plan is the difference between the total normal cost for the year and the anticipated member contributions for that year. Past Service Liability: The present value of future benefits that relates to service before the valuation date is the total past service liability. The unfunded past service liability is the difference between the total past service liability and the assets (including accumulated member contributions) if any. Description of Actuarial Assumptions The valuation reflects changes in the actuarial assumptions regarding interest, mortality, inflation, healthcare cost trend Rates and morbidity. The assumptions were changed to represent the Enrolled Actuary’s current best estimate of anticipated experience of the plan.
Interest
2.16% (Prior: 3.56%)
Since the OPEB plan is not funded, the selection of the discount rate is consistent with the GASB 74/75 standards linking the discount rate to the 20- year AA municipal bond index for unfunded OPEB plans.
The discount rate used for this valuation is equal to the published Bond Buyer GO 20-Bond Municipal Index effective as of May 31, 2020. Rate of compensation increase (including inflation) 2.60%.
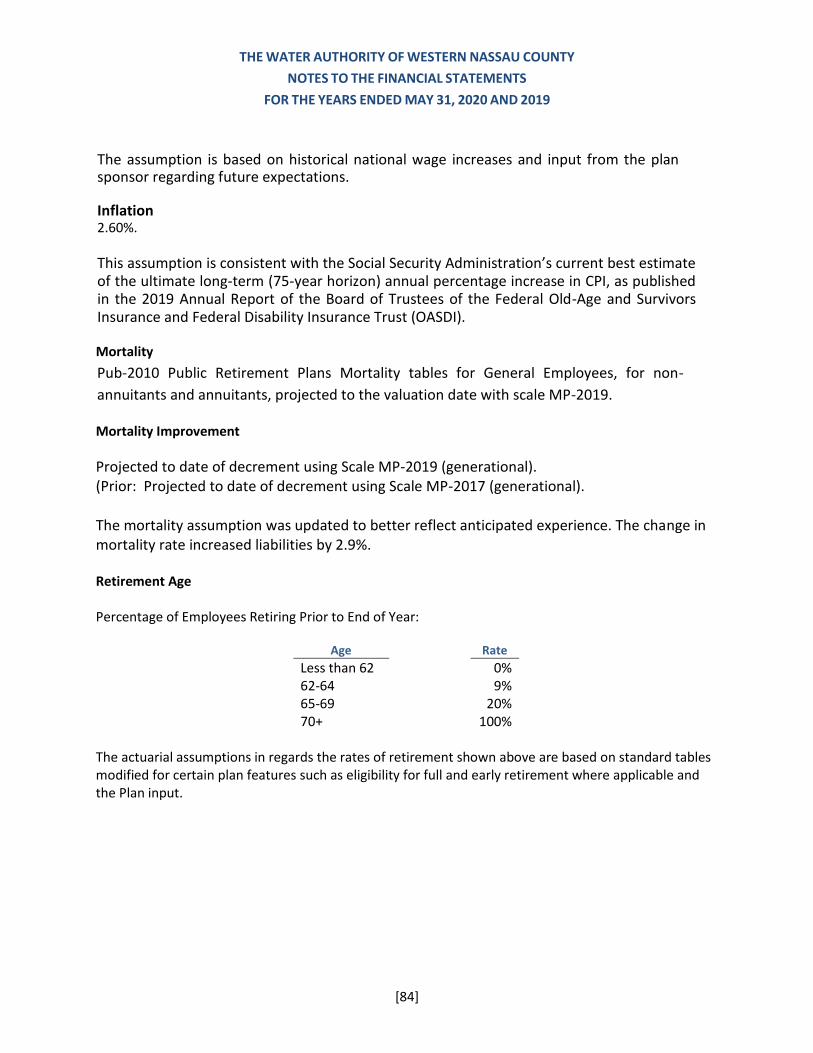
THE WATER AUTHORITY OF WESTERN NASSAU COUNTY
NOTES TO THE FINANCIAL STATEMENTS
FOR THE YEARS ENDED MAY 31, 2020 AND 2019
[84]
The assumption is based on historical national wage increases and input from the plan sponsor regarding future expectations. Inflation 2.60%. This assumption is consistent with the Social Security Administration’s current best estimate of the ultimate long-term (75-year horizon) annual percentage increase in CPI, as published in the 2019 Annual Report of the Board of Trustees of the Federal Old-Age and Survivors Insurance and Federal Disability Insurance Trust (OASDI). Mortality
Pub-2010 Public Retirement Plans Mortality tables for General Employees, for non-
annuitants and annuitants, projected to the valuation date with scale MP-2019. Mortality Improvement Projected to date of decrement using Scale MP-2019 (generational). (Prior: Projected to date of decrement using Scale MP-2017 (generational). The mortality assumption was updated to better reflect anticipated experience. The change in mortality rate increased liabilities by 2.9%. Retirement Age Percentage of Employees Retiring Prior to End of Year:
Age Rate
Less than 62 0% 62-64 9% 65-69 20% 70+ 100%
The actuarial assumptions in regards the rates of retirement shown above are based on standard tables modified for certain plan features such as eligibility for full and early retirement where applicable and the Plan input.
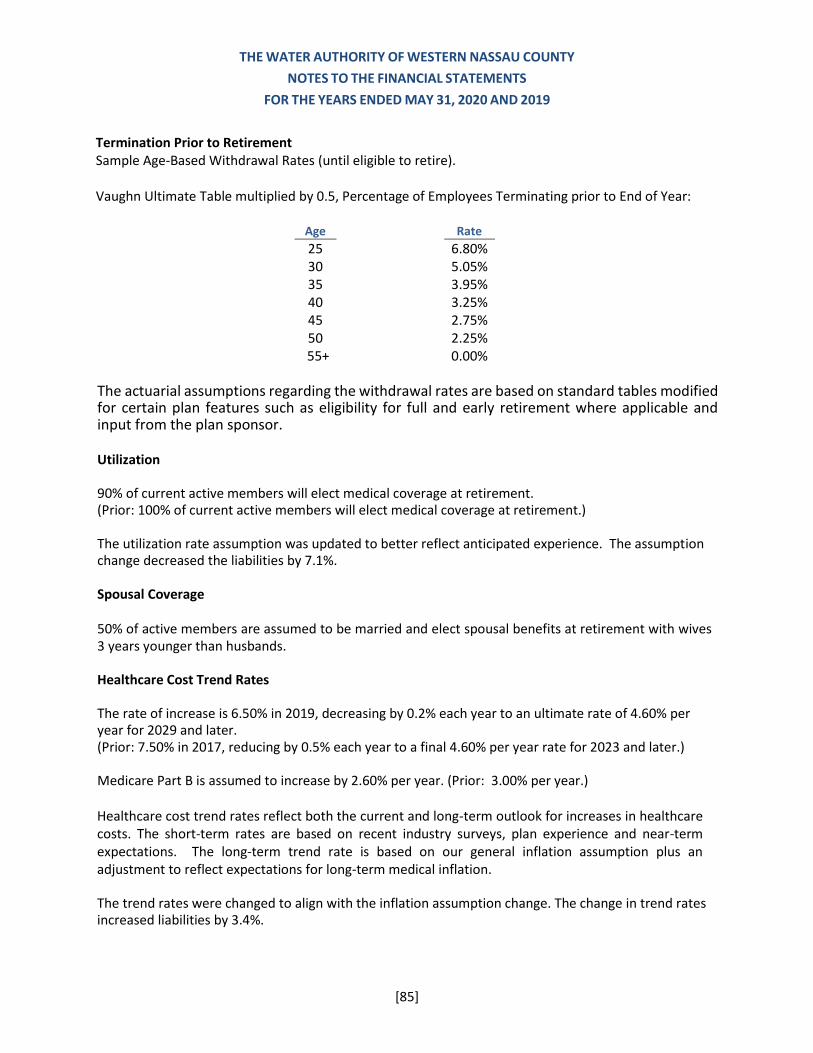
THE WATER AUTHORITY OF WESTERN NASSAU COUNTY
NOTES TO THE FINANCIAL STATEMENTS
FOR THE YEARS ENDED MAY 31, 2020 AND 2019
[85]
Termination Prior to Retirement Sample Age-Based Withdrawal Rates (until eligible to retire). Vaughn Ultimate Table multiplied by 0.5, Percentage of Employees Terminating prior to End of Year:
Age Rate
25 6.80% 30 5.05% 35 3.95% 40 3.25% 45 2.75% 50 2.25%
55+ 0.00% The actuarial assumptions regarding the withdrawal rates are based on standard tables modified for certain plan features such as eligibility for full and early retirement where applicable and input from the plan sponsor. Utilization 90% of current active members will elect medical coverage at retirement. (Prior: 100% of current active members will elect medical coverage at retirement.) The utilization rate assumption was updated to better reflect anticipated experience. The assumption change decreased the liabilities by 7.1%. Spousal Coverage 50% of active members are assumed to be married and elect spousal benefits at retirement with wives 3 years younger than husbands. Healthcare Cost Trend Rates The rate of increase is 6.50% in 2019, decreasing by 0.2% each year to an ultimate rate of 4.60% per year for 2029 and later. (Prior: 7.50% in 2017, reducing by 0.5% each year to a final 4.60% per year rate for 2023 and later.) Medicare Part B is assumed to increase by 2.60% per year. (Prior: 3.00% per year.) Healthcare cost trend rates reflect both the current and long-term outlook for increases in healthcare costs. The short-term rates are based on recent industry surveys, plan experience and near-term expectations. The long-term trend rate is based on our general inflation assumption plus an adjustment to reflect expectations for long-term medical inflation. The trend rates were changed to align with the inflation assumption change. The change in trend rates increased liabilities by 3.4%.
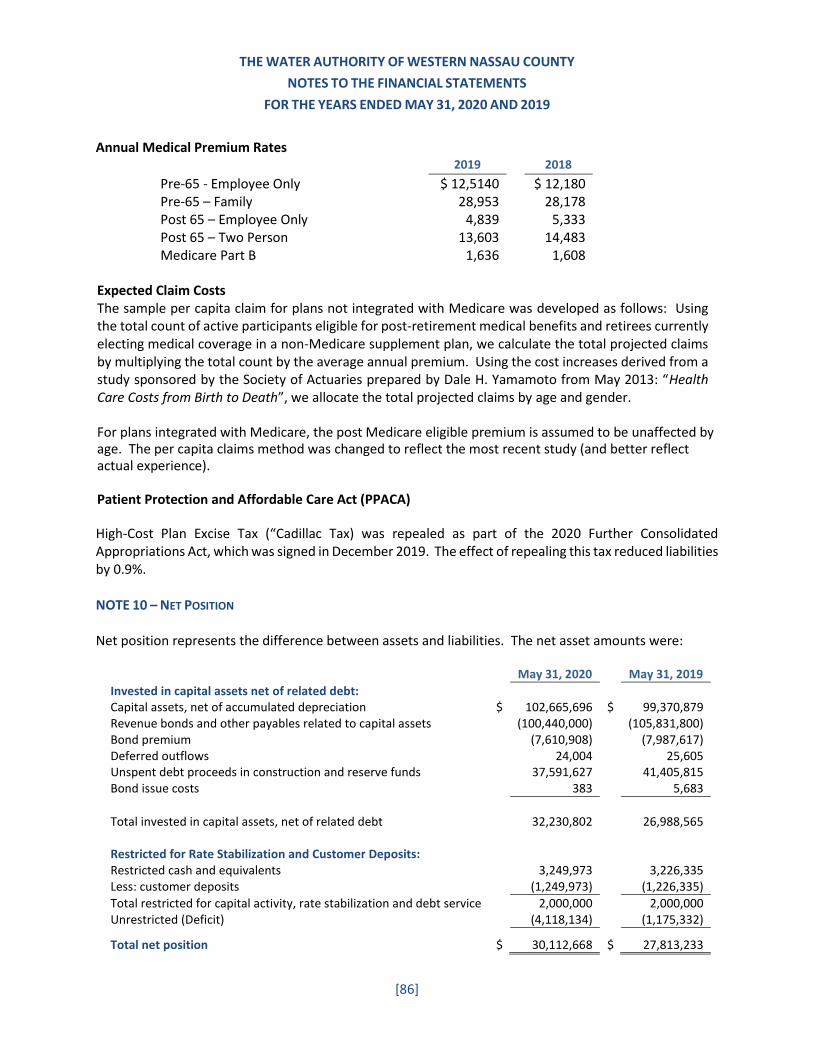
THE WATER AUTHORITY OF WESTERN NASSAU COUNTY
NOTES TO THE FINANCIAL STATEMENTS
FOR THE YEARS ENDED MAY 31, 2020 AND 2019
[86]
Annual Medical Premium Rates 2019 2018
Pre-65 - Employee Only $ 12,5140 $ 12,180 Pre-65 – Family 28,953 28,178 Post 65 – Employee Only 4,839 5,333 Post 65 – Two Person 13,603 14,483 Medicare Part B 1,636 1,608
Expected Claim Costs The sample per capita claim for plans not integrated with Medicare was developed as follows: Using the total count of active participants eligible for post-retirement medical benefits and retirees currently electing medical coverage in a non-Medicare supplement plan, we calculate the total projected claims by multiplying the total count by the average annual premium. Using the cost increases derived from a study sponsored by the Society of Actuaries prepared by Dale H. Yamamoto from May 2013: “Health Care Costs from Birth to Death”, we allocate the total projected claims by age and gender. For plans integrated with Medicare, the post Medicare eligible premium is assumed to be unaffected by age. The per capita claims method was changed to reflect the most recent study (and better reflect actual experience). Patient Protection and Affordable Care Act (PPACA) High-Cost Plan Excise Tax (“Cadillac Tax) was repealed as part of the 2020 Further Consolidated Appropriations Act, which was signed in December 2019. The effect of repealing this tax reduced liabilities by 0.9%. NOTE 10 – NET POSITION Net position represents the difference between assets and liabilities. The net asset amounts were:
May 31, 2020 May 31, 2019
Invested in capital assets net of related debt: Capital assets, net of accumulated depreciation $ 102,665,696 $ 99,370,879 Revenue bonds and other payables related to capital assets (100,440,000) (105,831,800) Bond premium (7,610,908) (7,987,617) Deferred outflows 24,004 25,605 Unspent debt proceeds in construction and reserve funds 37,591,627 41,405,815 Bond issue costs 383 5,683
Total invested in capital assets, net of related debt 32,230,802
26,988,565
Restricted for Rate Stabilization and Customer Deposits: Restricted cash and equivalents 3,249,973 3,226,335 Less: customer deposits (1,249,973) (1,226,335)
Total restricted for capital activity, rate stabilization and debt service 2,000,000 2,000,000 Unrestricted (Deficit) (4,118,134) (1,175,332)
Total net position $ 30,112,668 $ 27,813,233
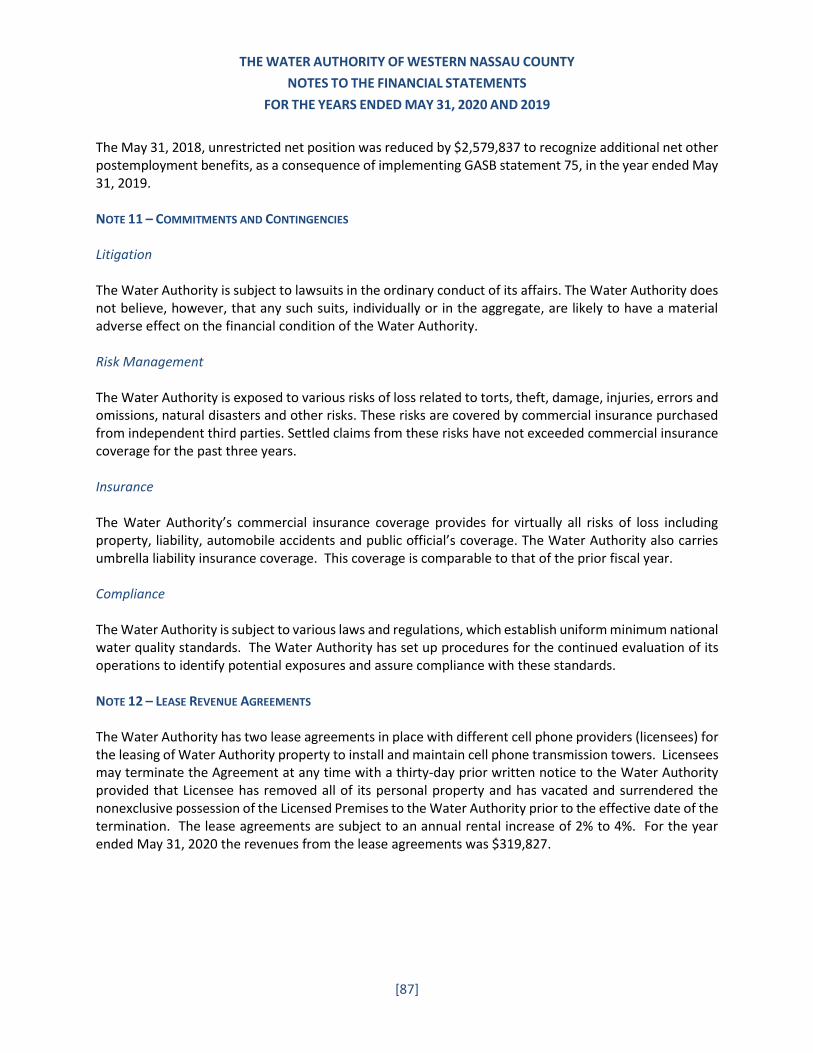
THE WATER AUTHORITY OF WESTERN NASSAU COUNTY
NOTES TO THE FINANCIAL STATEMENTS
FOR THE YEARS ENDED MAY 31, 2020 AND 2019
[87]
The May 31, 2018, unrestricted net position was reduced by $2,579,837 to recognize additional net other postemployment benefits, as a consequence of implementing GASB statement 75, in the year ended May 31, 2019. NOTE 11 – COMMITMENTS AND CONTINGENCIES Litigation The Water Authority is subject to lawsuits in the ordinary conduct of its affairs. The Water Authority does not believe, however, that any such suits, individually or in the aggregate, are likely to have a material adverse effect on the financial condition of the Water Authority. Risk Management The Water Authority is exposed to various risks of loss related to torts, theft, damage, injuries, errors and omissions, natural disasters and other risks. These risks are covered by commercial insurance purchased from independent third parties. Settled claims from these risks have not exceeded commercial insurance coverage for the past three years. Insurance The Water Authority’s commercial insurance coverage provides for virtually all risks of loss including property, liability, automobile accidents and public official’s coverage. The Water Authority also carries umbrella liability insurance coverage. This coverage is comparable to that of the prior fiscal year. Compliance The Water Authority is subject to various laws and regulations, which establish uniform minimum national water quality standards. The Water Authority has set up procedures for the continued evaluation of its operations to identify potential exposures and assure compliance with these standards. NOTE 12 – LEASE REVENUE AGREEMENTS The Water Authority has two lease agreements in place with different cell phone providers (licensees) for the leasing of Water Authority property to install and maintain cell phone transmission towers. Licensees may terminate the Agreement at any time with a thirty-day prior written notice to the Water Authority provided that Licensee has removed all of its personal property and has vacated and surrendered the nonexclusive possession of the Licensed Premises to the Water Authority prior to the effective date of the termination. The lease agreements are subject to an annual rental increase of 2% to 4%. For the year ended May 31, 2020 the revenues from the lease agreements was $319,827.
THE WATER AUTHORITY OF WESTERN NASSAU COUNTY
NOTES TO THE FINANCIAL STATEMENTS
FOR THE YEARS ENDED MAY 31, 2020 AND 2019
[88]
NOTE 13 – RATE CHANGES Under the Water Authority Charter, the Board is empowered to set rates for all its customers. The rates are to be sufficient to pay for operations, maintenance, reserves, debt service, additions, extensions and betterment of the facilities. The Board has approved 10.57% and 3.83% increase in water rates effective on June 1, 2020 and June 1, 2019, respectively. NOTE 14 – SUBSEQUENT EVENTS The Water Authority evaluated subsequent events from May 31, 2020 through October 30, 2020, the date on which the financial statements were available to be issued and determined that there were no material subsequent events.
SECTION C: REQUIRED SUPPLEMENTARY INFORMATION

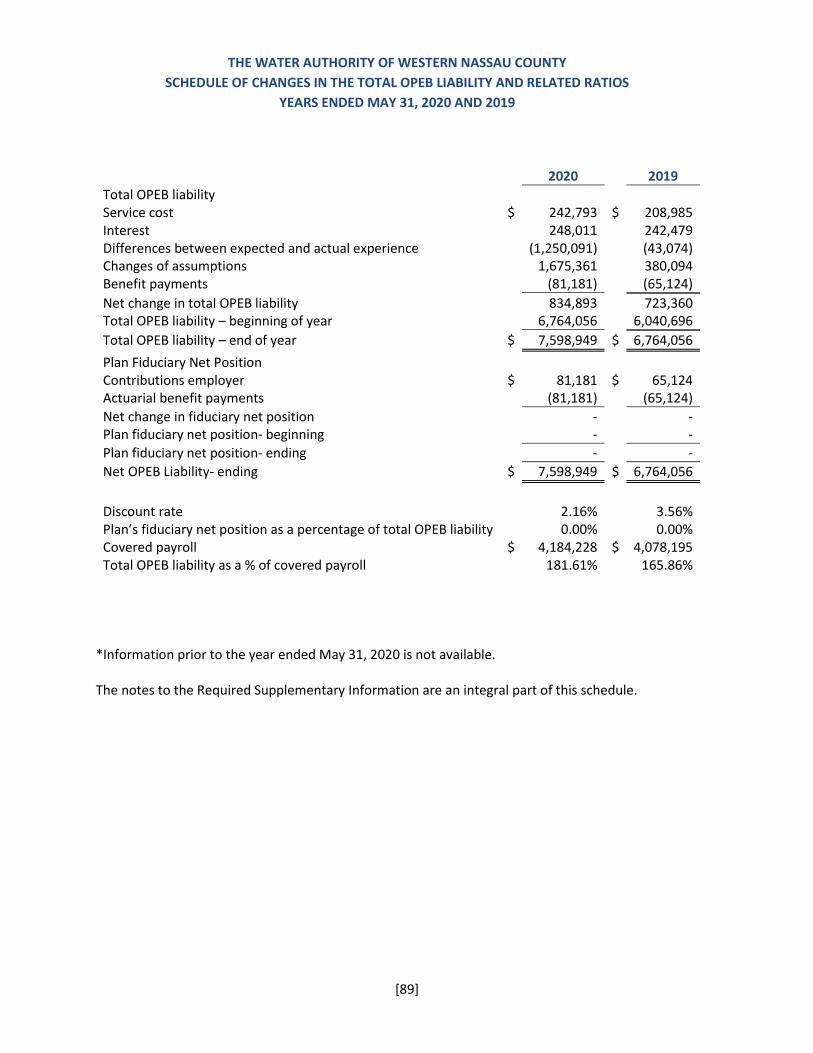
THE WATER AUTHORITY OF WESTERN NASSAU COUNTY
SCHEDULE OF CHANGES IN THE TOTAL OPEB LIABILITY AND RELATED RATIOS
YEARS ENDED MAY 31, 2020 AND 2019
[89]
2020 2019
Total OPEB liability Service cost $ 242,793 $ 208,985 Interest 248,011 242,479 Differences between expected and actual experience (1,250,091) (43,074) Changes of assumptions 1,675,361 380,094 Benefit payments (81,181) (65,124)
Net change in total OPEB liability 834,893 723,360 Total OPEB liability – beginning of year 6,764,056 6,040,696
Total OPEB liability – end of year $ 7,598,949 $ 6,764,056 Plan Fiduciary Net Position Contributions employer $ 81,181 $ 65,124 Actuarial benefit payments (81,181) (65,124)
Net change in fiduciary net position - - Plan fiduciary net position- beginning - -
Plan fiduciary net position- ending - -
Net OPEB Liability- ending $ 7,598,949 $ 6,764,056 Discount rate 2.16% 3.56% Plan’s fiduciary net position as a percentage of total OPEB liability 0.00% 0.00% Covered payroll $ 4,184,228 $ 4,078,195 Total OPEB liability as a % of covered payroll 181.61% 165.86%
*Information prior to the year ended May 31, 2020 is not available. The notes to the Required Supplementary Information are an integral part of this schedule.
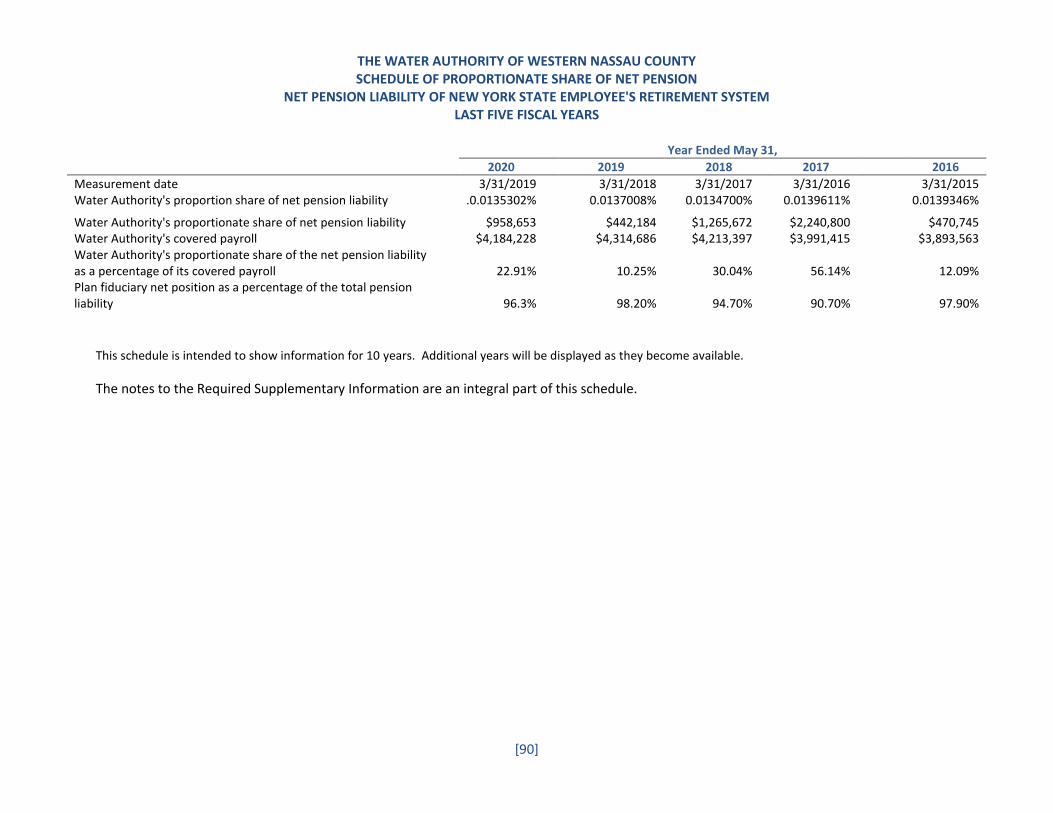
THE WATER AUTHORITY OF WESTERN NASSAU COUNTY
SCHEDULE OF PROPORTIONATE SHARE OF NET PENSION NET PENSION LIABILITY OF NEW YORK STATE EMPLOYEE'S RETIREMENT SYSTEM
LAST FIVE FISCAL YEARS
[90]
Year Ended May 31,
2020 2019 2018 2017 2016
Measurement date 3/31/2019 3/31/2018 3/31/2017 3/31/2016 3/31/2015 Water Authority's proportion share of net pension liability .0.0135302% 0.0137008% 0.0134700% 0.0139611% 0.0139346%
Water Authority's proportionate share of net pension liability $958,653 $442,184 $1,265,672 $2,240,800 $470,745 Water Authority's covered payroll $4,184,228 $4,314,686 $4,213,397 $3,991,415 $3,893,563 Water Authority's proportionate share of the net pension liability as a percentage of its covered payroll 22.91% 10.25% 30.04% 56.14% 12.09% Plan fiduciary net position as a percentage of the total pension liability 96.3% 98.20% 94.70% 90.70% 97.90%
This schedule is intended to show information for 10 years. Additional years will be displayed as they become available.
The notes to the Required Supplementary Information are an integral part of this schedule.
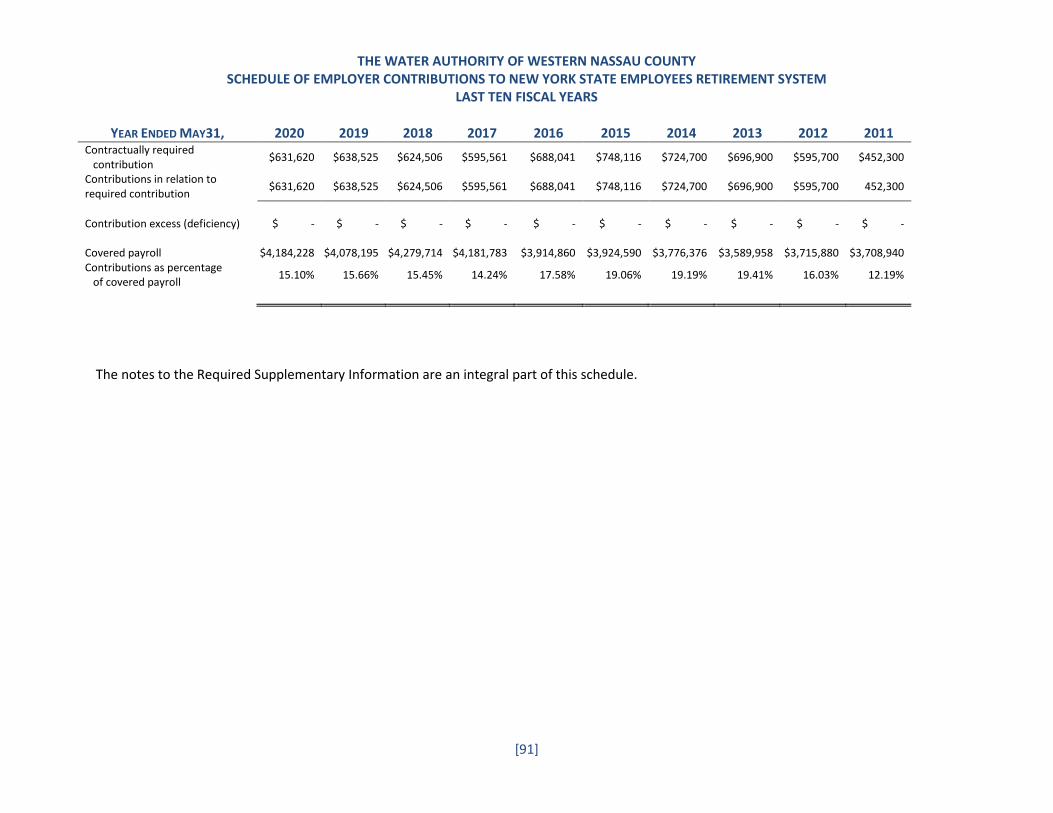
THE WATER AUTHORITY OF WESTERN NASSAU COUNTY
SCHEDULE OF EMPLOYER CONTRIBUTIONS TO NEW YORK STATE EMPLOYEES RETIREMENT SYSTEM
LAST TEN FISCAL YEARS
[91]
YEAR ENDED MAY31, 2020 2019 2018 2017 2016 2015 2014 2013 2012 2011 Contractually required contribution
$631,620 $638,525 $624,506 $595,561 $688,041 $748,116 $724,700 $696,900 $595,700 $452,300
Contributions in relation to required contribution
$631,620 $638,525 $624,506 $595,561 $688,041 $748,116 $724,700 $696,900 $595,700 452,300
Contribution excess (deficiency) $ - $ - $ - $ - $ - $ - $ - $ - $ - $ - Covered payroll $4,184,228 $4,078,195 $4,279,714 $4,181,783 $3,914,860 $3,924,590 $3,776,376 $3,589,958 $3,715,880 $3,708,940 Contributions as percentage of covered payroll
15.10% 15.66% 15.45% 14.24% 17.58% 19.06% 19.19% 19.41% 16.03% 12.19%
The notes to the Required Supplementary Information are an integral part of this schedule.

[92]
THIS PAGE INTENTIONALLY LEFT BLANK
SECTION C: STATISTICAL SECTION

WATER AUTHORITY OF WESTERN NASSAU COUNTY
STATISTICAL SECTION
(UNAUDITED)
This section of the Water Authority of Western Nassau County’s comprehensive annual financial report presents detailed information as a context for understanding what the information in the financial statements, note disclosures, and required supplementary information says about the Water Authority’s overall financial health.
Contents Page
Page
Financial Trends 93
These schedules contain trend information to help the reader understand how the Water Authority’s financial performance has changed over time.
Revenue Capacity 101
These schedules contain information to help the reader assess the Water Authority’s most significant revenue source – water sales.
Debt Capacity 107
These schedules present information to help the reader assess the affordability of the Water Authority’s current levels of outstanding debt and the Water Authority’s ability to issue additional debt in the future
Demographic and Economic Information 113
These schedules offer demographic and economic indicators to help the reader understand the environment within which the Water Authority’s financial activities take place
Operating Information 119
These schedules contain service and infrastructure data to help the reader understand how the information in the Water Authority’s financial report relates to services the Water Authority provides and the activities it performs.

SECTION C: STATISTICAL SECTION
Financial Trends

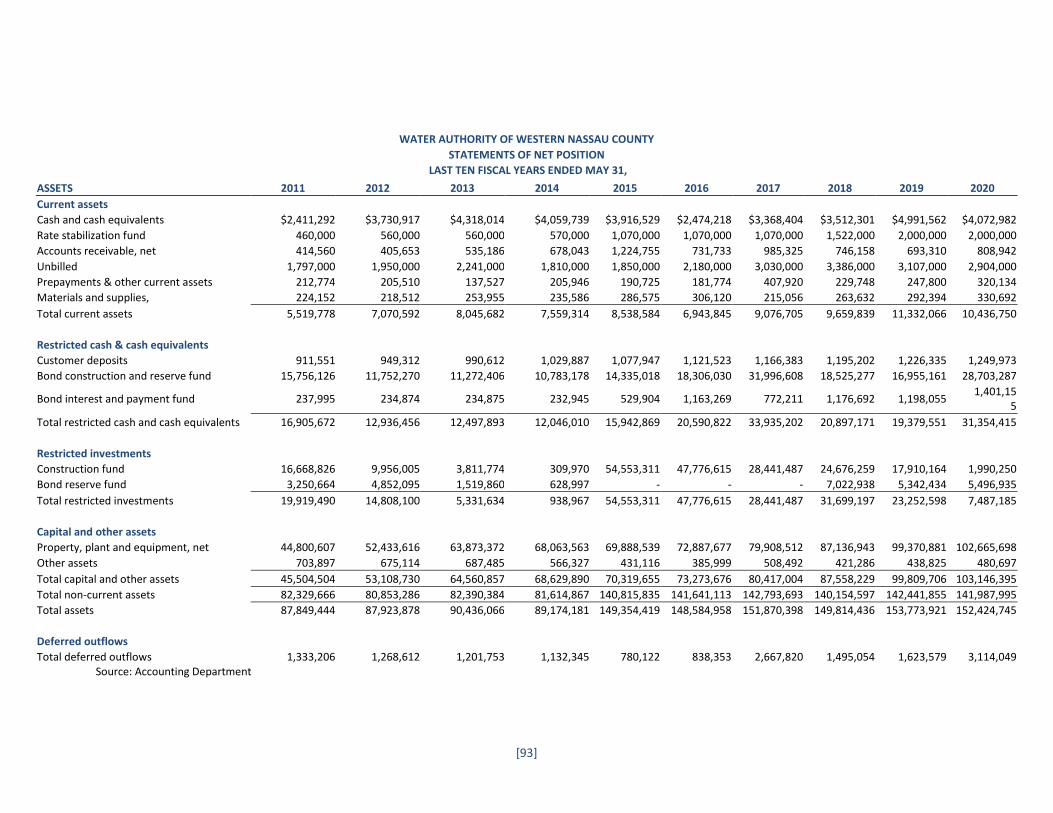
[93]
WATER AUTHORITY OF WESTERN NASSAU COUNTY
STATEMENTS OF NET POSITION
LAST TEN FISCAL YEARS ENDED MAY 31, ASSETS 2011 2012 2013 2014 2015 2016 2017 2018 2019 2020
Current assets
Cash and cash equivalents $2,411,292 $3,730,917 $4,318,014 $4,059,739 $3,916,529 $2,474,218 $3,368,404 $3,512,301 $4,991,562 $4,072,982
Rate stabilization fund 460,000 560,000 560,000 570,000 1,070,000 1,070,000 1,070,000 1,522,000 2,000,000 2,000,000
Accounts receivable, net 414,560 405,653 535,186 678,043 1,224,755 731,733 985,325 746,158 693,310 808,942
Unbilled 1,797,000 1,950,000 2,241,000 1,810,000 1,850,000 2,180,000 3,030,000 3,386,000 3,107,000 2,904,000
Prepayments & other current assets 212,774 205,510 137,527 205,946 190,725 181,774 407,920 229,748 247,800 320,134
Materials and supplies, 224,152 218,512 253,955 235,586 286,575 306,120 215,056 263,632 292,394 330,692
Total current assets 5,519,778 7,070,592 8,045,682 7,559,314 8,538,584 6,943,845 9,076,705 9,659,839 11,332,066 10,436,750
Restricted cash & cash equivalents
Customer deposits 911,551 949,312 990,612 1,029,887 1,077,947 1,121,523 1,166,383 1,195,202 1,226,335 1,249,973
Bond construction and reserve fund 15,756,126 11,752,270 11,272,406 10,783,178 14,335,018 18,306,030 31,996,608 18,525,277 16,955,161 28,703,287
Bond interest and payment fund 237,995 234,874 234,875 232,945 529,904 1,163,269 772,211 1,176,692 1,198,055 1,401,15
5
Total restricted cash and cash equivalents 16,905,672 12,936,456 12,497,893 12,046,010 15,942,869 20,590,822 33,935,202 20,897,171 19,379,551 31,354,415
Restricted investments
Construction fund 16,668,826 9,956,005 3,811,774 309,970 54,553,311 47,776,615 28,441,487 24,676,259 17,910,164 1,990,250
Bond reserve fund 3,250,664 4,852,095 1,519,860 628,997 - - - 7,022,938 5,342,434 5,496,935
Total restricted investments 19,919,490 14,808,100 5,331,634 938,967 54,553,311 47,776,615 28,441,487 31,699,197 23,252,598 7,487,185
Capital and other assets
Property, plant and equipment, net 44,800,607 52,433,616 63,873,372 68,063,563 69,888,539 72,887,677 79,908,512 87,136,943 99,370,881 102,665,698
Other assets 703,897 675,114 687,485 566,327 431,116 385,999 508,492 421,286 438,825 480,697
Total capital and other assets 45,504,504 53,108,730 64,560,857 68,629,890 70,319,655 73,273,676 80,417,004 87,558,229 99,809,706 103,146,395
Total non-current assets 82,329,666 80,853,286 82,390,384 81,614,867 140,815,835 141,641,113 142,793,693 140,154,597 142,441,855 141,987,995
Total assets 87,849,444 87,923,878 90,436,066 89,174,181 149,354,419 148,584,958 151,870,398 149,814,436 153,773,921 152,424,745
Deferred outflows
Total deferred outflows 1,333,206 1,268,612 1,201,753 1,132,345 780,122 838,353 2,667,820 1,495,054 1,623,579 3,114,049 Source: Accounting Department
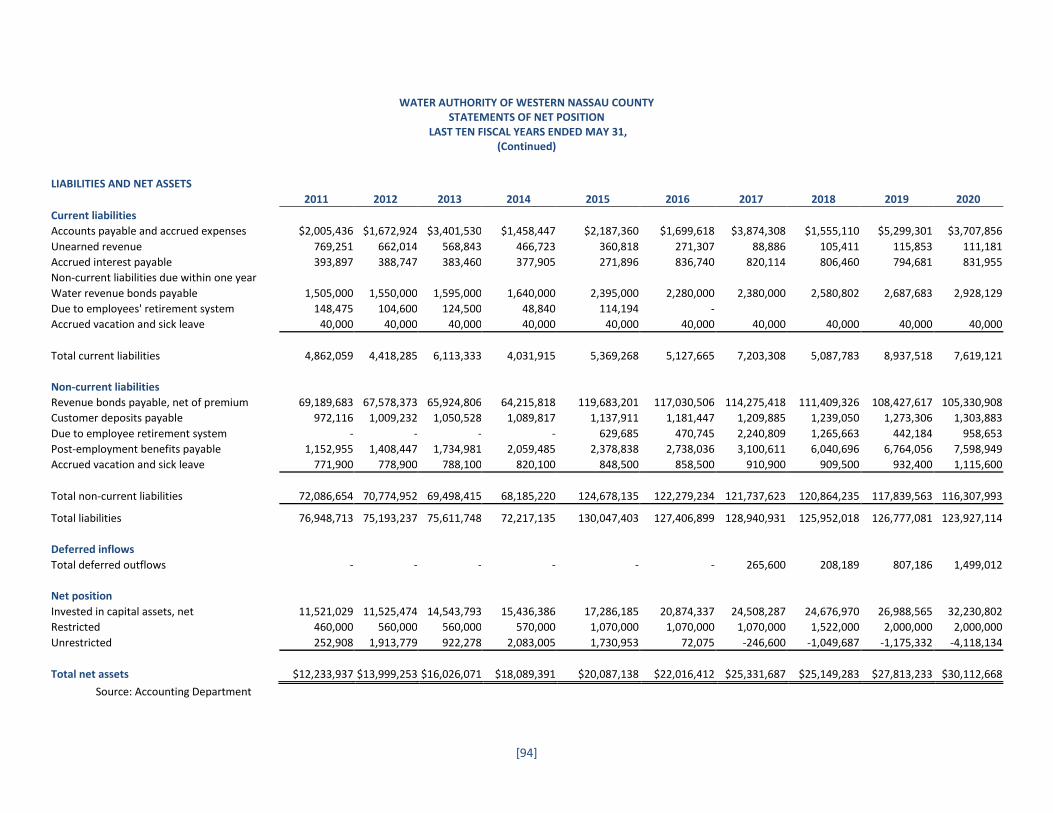
[94]
WATER AUTHORITY OF WESTERN NASSAU COUNTY STATEMENTS OF NET POSITION
LAST TEN FISCAL YEARS ENDED MAY 31, (Continued)
LIABILITIES AND NET ASSETS
2011 2012 2013 2014 2015 2016 2017 2018 2019 2020
Current liabilities
Accounts payable and accrued expenses $2,005,436 $1,672,924 $3,401,530 $1,458,447 $2,187,360 $1,699,618 $3,874,308 $1,555,110 $5,299,301 $3,707,856
Unearned revenue 769,251 662,014 568,843 466,723 360,818 271,307 88,886 105,411 115,853 111,181
Accrued interest payable 393,897 388,747 383,460 377,905 271,896 836,740 820,114 806,460 794,681 831,955
Non-current liabilities due within one year
Water revenue bonds payable 1,505,000 1,550,000 1,595,000 1,640,000 2,395,000 2,280,000 2,380,000 2,580,802 2,687,683 2,928,129
Due to employees' retirement system 148,475 104,600 124,500 48,840 114,194 -
Accrued vacation and sick leave 40,000 40,000 40,000 40,000 40,000 40,000 40,000 40,000 40,000 40,000
Total current liabilities 4,862,059 4,418,285 6,113,333 4,031,915 5,369,268 5,127,665 7,203,308 5,087,783 8,937,518 7,619,121
Non-current liabilities
Revenue bonds payable, net of premium 69,189,683 67,578,373 65,924,806 64,215,818 119,683,201 117,030,506 114,275,418 111,409,326 108,427,617 105,330,908
Customer deposits payable 972,116 1,009,232 1,050,528 1,089,817 1,137,911 1,181,447 1,209,885 1,239,050 1,273,306 1,303,883
Due to employee retirement system - - - - 629,685 470,745 2,240,809 1,265,663 442,184 958,653
Post-employment benefits payable 1,152,955 1,408,447 1,734,981 2,059,485 2,378,838 2,738,036 3,100,611 6,040,696 6,764,056 7,598,949
Accrued vacation and sick leave 771,900 778,900 788,100 820,100 848,500 858,500 910,900 909,500 932,400 1,115,600
Total non-current liabilities 72,086,654 70,774,952 69,498,415 68,185,220 124,678,135 122,279,234 121,737,623 120,864,235 117,839,563 116,307,993
Total liabilities 76,948,713 75,193,237 75,611,748 72,217,135 130,047,403 127,406,899 128,940,931 125,952,018 126,777,081 123,927,114
Deferred inflows
Total deferred outflows - - - - - - 265,600 208,189 807,186 1,499,012
Net position
Invested in capital assets, net 11,521,029 11,525,474 14,543,793 15,436,386 17,286,185 20,874,337 24,508,287 24,676,970 26,988,565 32,230,802
Restricted 460,000 560,000 560,000 570,000 1,070,000 1,070,000 1,070,000 1,522,000 2,000,000 2,000,000
Unrestricted 252,908 1,913,779 922,278 2,083,005 1,730,953 72,075 -246,600 -1,049,687 -1,175,332 -4,118,134
Total net assets $12,233,937 $13,999,253 $16,026,071 $18,089,391 $20,087,138 $22,016,412 $25,331,687 $25,149,283 $27,813,233 $30,112,668
Source: Accounting Department
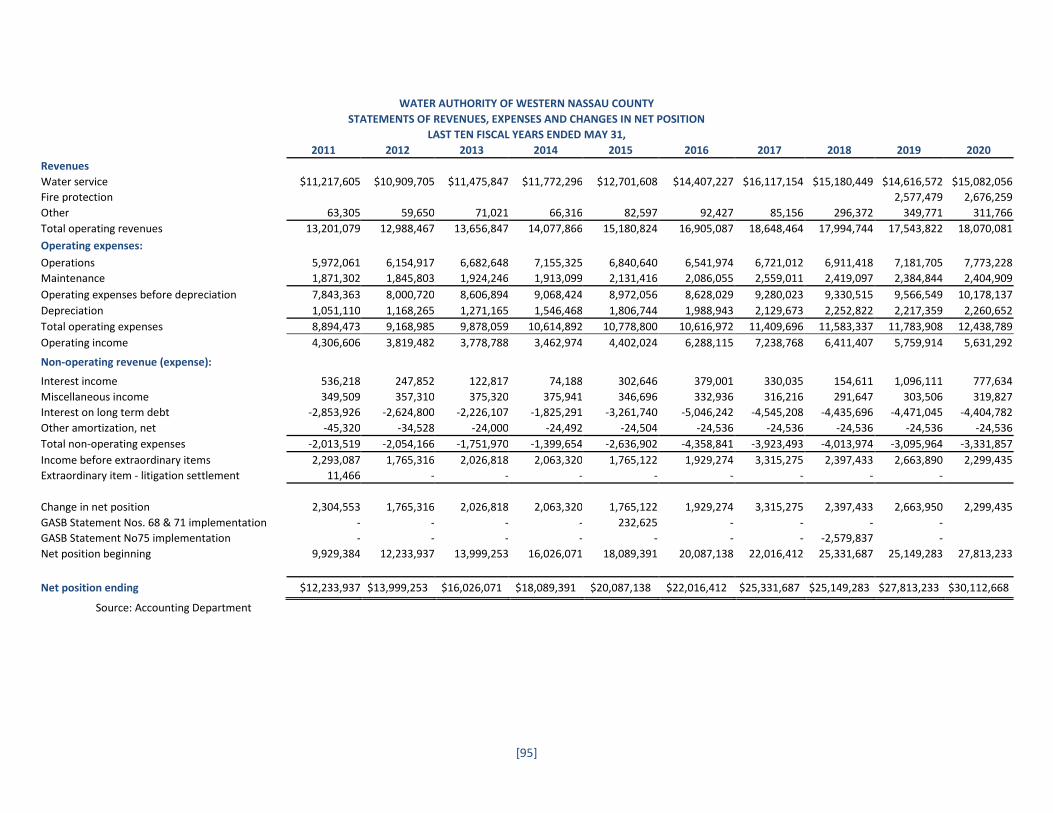
[95]
WATER AUTHORITY OF WESTERN NASSAU COUNTY
STATEMENTS OF REVENUES, EXPENSES AND CHANGES IN NET POSITION
LAST TEN FISCAL YEARS ENDED MAY 31,
2011 2012 2013 2014 2015 2016 2017 2018 2019 2020
Revenues
Water service $11,217,605 $10,909,705 $11,475,847 $11,772,296 $12,701,608 $14,407,227 $16,117,154 $15,180,449 $14,616,572 $15,082,056
Fire protection 2,577,479 2,676,259
Other 63,305 59,650 71,021 66,316 82,597 92,427 85,156 296,372 349,771 311,766
Total operating revenues 13,201,079 12,988,467 13,656,847 14,077,866 15,180,824 16,905,087 18,648,464 17,994,744 17,543,822 18,070,081
Operating expenses:
Operations 5,972,061 6,154,917 6,682,648 7,155,325 6,840,640 6,541,974 6,721,012 6,911,418 7,181,705 7,773,228
Maintenance 1,871,302 1,845,803 1,924,246 1,913,099 2,131,416 2,086,055 2,559,011 2,419,097 2,384,844 2,404,909
Operating expenses before depreciation 7,843,363 8,000,720 8,606,894 9,068,424 8,972,056 8,628,029 9,280,023 9,330,515 9,566,549 10,178,137
Depreciation 1,051,110 1,168,265 1,271,165 1,546,468 1,806,744 1,988,943 2,129,673 2,252,822 2,217,359 2,260,652
Total operating expenses 8,894,473 9,168,985 9,878,059 10,614,892 10,778,800 10,616,972 11,409,696 11,583,337 11,783,908 12,438,789
Operating income 4,306,606 3,819,482 3,778,788 3,462,974 4,402,024 6,288,115 7,238,768 6,411,407 5,759,914 5,631,292
Non-operating revenue (expense):
Interest income 536,218 247,852 122,817 74,188 302,646 379,001 330,035 154,611 1,096,111 777,634
Miscellaneous income 349,509 357,310 375,320 375,941 346,696 332,936 316,216 291,647 303,506 319,827
Interest on long term debt -2,853,926 -2,624,800 -2,226,107 -1,825,291 -3,261,740 -5,046,242 -4,545,208 -4,435,696 -4,471,045 -4,404,782
Other amortization, net -45,320 -34,528 -24,000 -24,492 -24,504 -24,536 -24,536 -24,536 -24,536 -24,536
Total non-operating expenses -2,013,519 -2,054,166 -1,751,970 -1,399,654 -2,636,902 -4,358,841 -3,923,493 -4,013,974 -3,095,964 -3,331,857
Income before extraordinary items 2,293,087 1,765,316 2,026,818 2,063,320 1,765,122 1,929,274 3,315,275 2,397,433 2,663,890 2,299,435
Extraordinary item - litigation settlement 11,466 - - - - - - - -
Change in net position 2,304,553 1,765,316 2,026,818 2,063,320 1,765,122 1,929,274 3,315,275 2,397,433 2,663,950 2,299,435
GASB Statement Nos. 68 & 71 implementation - - - - 232,625 - - - -
GASB Statement No75 implementation - - - - - - - -2,579,837 -
Net position beginning 9,929,384 12,233,937 13,999,253 16,026,071 18,089,391 20,087,138 22,016,412 25,331,687 25,149,283 27,813,233
Net position ending $12,233,937 $13,999,253 $16,026,071 $18,089,391 $20,087,138 $22,016,412 $25,331,687 $25,149,283 $27,813,233 $30,112,668
Source: Accounting Department
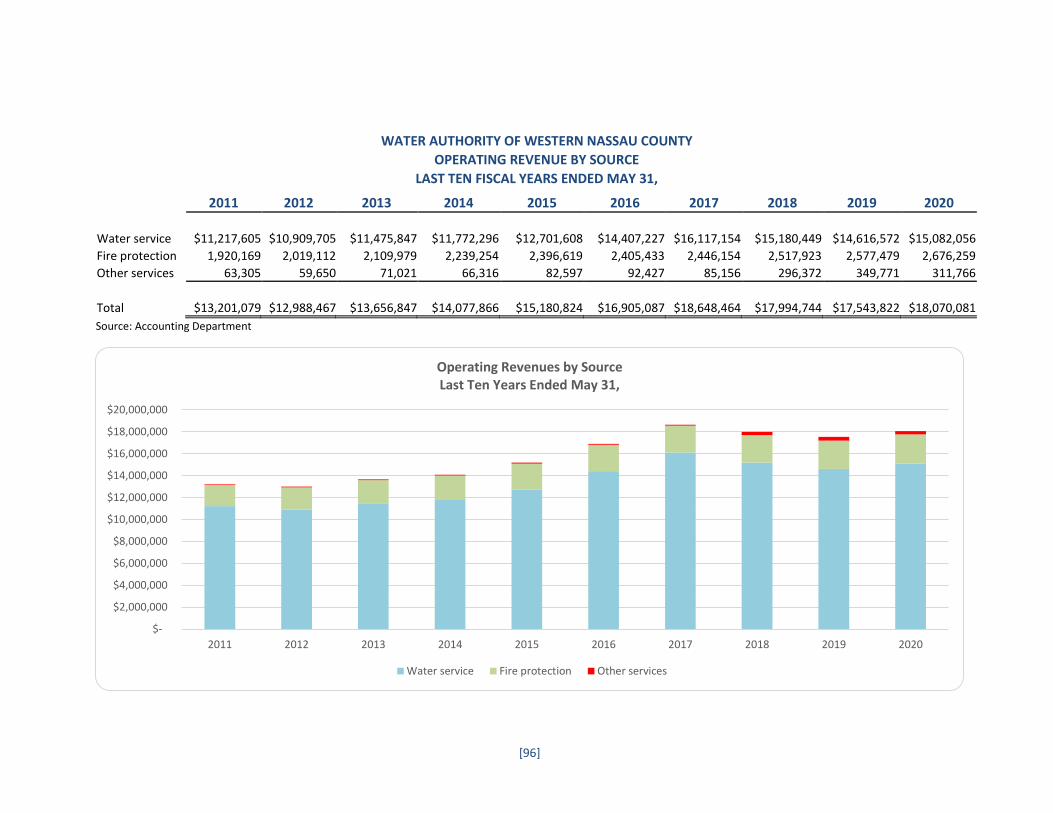
[96]
WATER AUTHORITY OF WESTERN NASSAU COUNTY
OPERATING REVENUE BY SOURCE
LAST TEN FISCAL YEARS ENDED MAY 31,
2011 2012 2013 2014 2015 2016 2017 2018 2019 2020
Water service $11,217,605 $10,909,705 $11,475,847 $11,772,296 $12,701,608 $14,407,227 $16,117,154 $15,180,449 $14,616,572 $15,082,056
Fire protection 1,920,169 2,019,112 2,109,979 2,239,254 2,396,619 2,405,433 2,446,154 2,517,923 2,577,479 2,676,259
Other services 63,305 59,650 71,021 66,316 82,597 92,427 85,156 296,372 349,771 311,766
Total $13,201,079 $12,988,467 $13,656,847 $14,077,866 $15,180,824 $16,905,087 $18,648,464 $17,994,744 $17,543,822 $18,070,081
Source: Accounting Department
$-
$2,000,000
$4,000,000
$6,000,000
$8,000,000
$10,000,000
$12,000,000
$14,000,000
$16,000,000
$18,000,000
$20,000,000
2011 2012 2013 2014 2015 2016 2017 2018 2019 2020
Operating Revenues by SourceLast Ten Years Ended May 31,
Water service Fire protection Other services
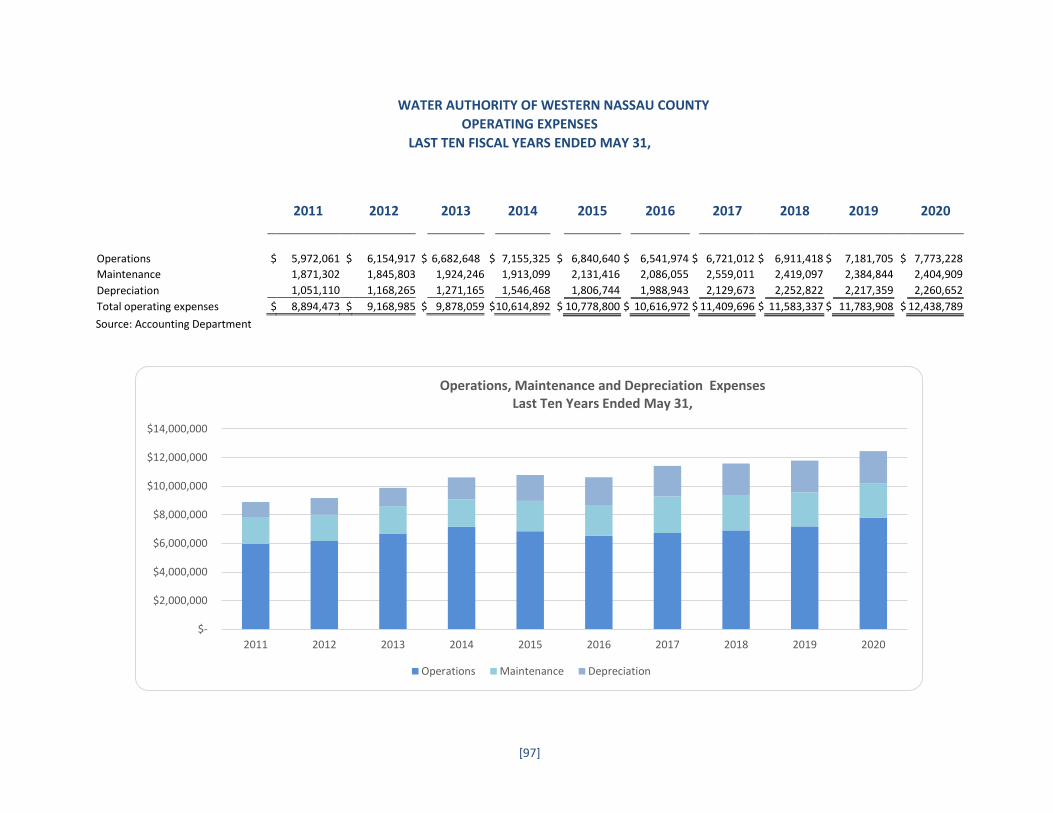
[97]
WATER AUTHORITY OF WESTERN NASSAU COUNTY
OPERATING EXPENSES
LAST TEN FISCAL YEARS ENDED MAY 31,
2011
2012
2013
2014
2015
2016
2017
2018
2019
2020
Operations $ 5,972,061 $ 6,154,917 $ 6,682,648 $ 7,155,325 $ 6,840,640 $ 6,541,974 $ 6,721,012 $ 6,911,418 $ 7,181,705 $ 7,773,228
Maintenance 1,871,302 1,845,803 1,924,246 1,913,099 2,131,416 2,086,055 2,559,011 2,419,097 2,384,844 2,404,909
Depreciation 1,051,110 1,168,265 1,271,165 1,546,468 1,806,744 1,988,943 2,129,673 2,252,822 2,217,359 2,260,652
Total operating expenses $ 8,894,473 $ 9,168,985 $ 9,878,059 $ 10,614,892 $ 10,778,800 $ 10,616,972 $ 11,409,696 $ 11,583,337 $ 11,783,908 $ 12,438,789
Source: Accounting Department
$-
$2,000,000
$4,000,000
$6,000,000
$8,000,000
$10,000,000
$12,000,000
$14,000,000
2011 2012 2013 2014 2015 2016 2017 2018 2019 2020
Operations, Maintenance and Depreciation Expenses Last Ten Years Ended May 31,
Operations Maintenance Depreciation
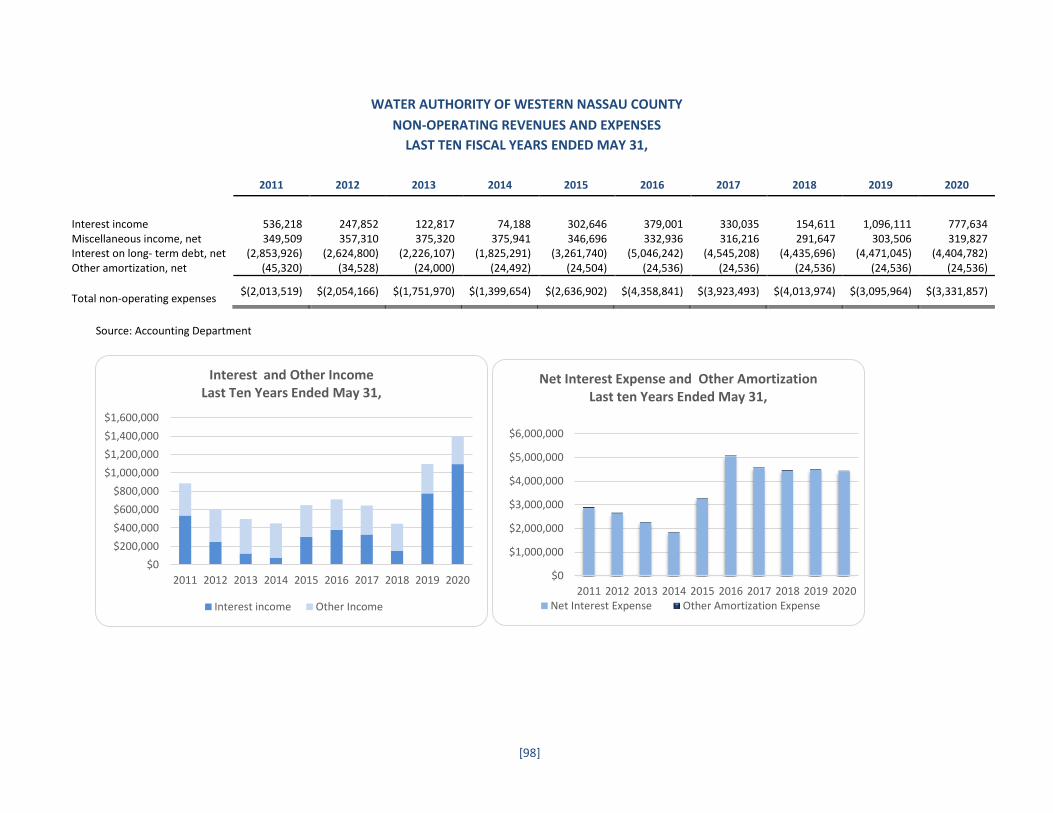
[98]
WATER AUTHORITY OF WESTERN NASSAU COUNTY
NON-OPERATING REVENUES AND EXPENSES
LAST TEN FISCAL YEARS ENDED MAY 31,
2011 2012 2013 2014 2015 2016 2017 2018 2019 2020
Interest income 536,218 247,852 122,817 74,188 302,646 379,001 330,035 154,611 1,096,111 777,634 Miscellaneous income, net 349,509 357,310 375,320 375,941 346,696 332,936 316,216 291,647 303,506 319,827 Interest on long- term debt, net (2,853,926) (2,624,800) (2,226,107) (1,825,291) (3,261,740) (5,046,242) (4,545,208) (4,435,696) (4,471,045) (4,404,782) Other amortization, net (45,320) (34,528) (24,000) (24,492) (24,504) (24,536) (24,536) (24,536) (24,536) (24,536)
Total non-operating expenses
$(2,013,519) $(2,054,166) $(1,751,970) $(1,399,654) $(2,636,902) $(4,358,841) $(3,923,493) $(4,013,974) $(3,095,964) $(3,331,857)
Source: Accounting Department
$0
$200,000
$400,000
$600,000
$800,000
$1,000,000
$1,200,000
$1,400,000
$1,600,000
2011 2012 2013 2014 2015 2016 2017 2018 2019 2020
Interest and Other IncomeLast Ten Years Ended May 31,
Interest income Other Income
$0
$1,000,000
$2,000,000
$3,000,000
$4,000,000
$5,000,000
$6,000,000
2011 2012 2013 2014 2015 2016 2017 2018 2019 2020
Net Interest Expense and Other AmortizationLast ten Years Ended May 31,
Net Interest Expense Other Amortization Expense
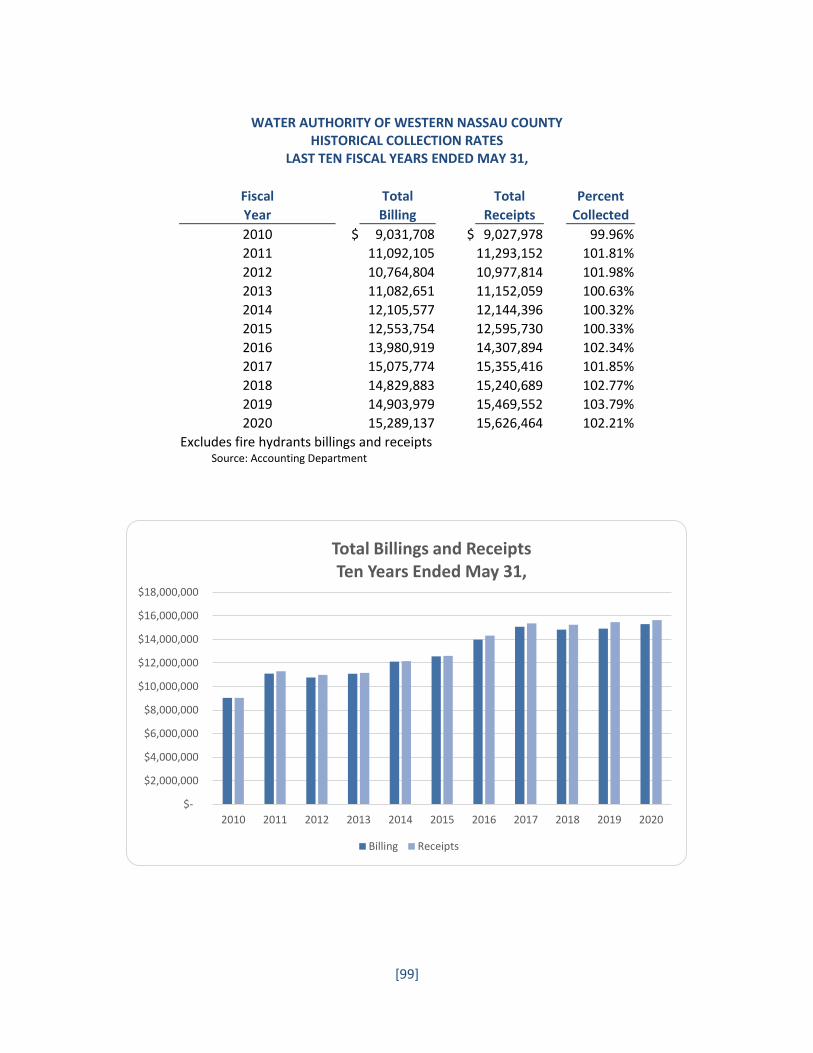
[99]
WATER AUTHORITY OF WESTERN NASSAU COUNTY
HISTORICAL COLLECTION RATES LAST TEN FISCAL YEARS ENDED MAY 31,
Fiscal Total Total Percent
Year Billing Receipts Collected
2010 $ 9,031,708 $ 9,027,978 99.96%
2011 11,092,105 11,293,152 101.81%
2012 10,764,804 10,977,814 101.98%
2013 11,082,651 11,152,059 100.63%
2014 12,105,577 12,144,396 100.32%
2015 12,553,754 12,595,730 100.33%
2016 13,980,919 14,307,894 102.34%
2017 15,075,774 15,355,416 101.85%
2018 14,829,883 15,240,689 102.77%
2019 14,903,979 15,469,552 103.79%
2020 15,289,137 15,626,464 102.21%
Excludes fire hydrants billings and receipts Source: Accounting Department
$-
$2,000,000
$4,000,000
$6,000,000
$8,000,000
$10,000,000
$12,000,000
$14,000,000
$16,000,000
$18,000,000
2010 2011 2012 2013 2014 2015 2016 2017 2018 2019 2020
Total Billings and ReceiptsTen Years Ended May 31,
Billing Receipts

[100]
THIS PAGE INTENTIONALLY LEFT BLANK

SECTION C: STATISTICAL SECTION
Revenue Capacity

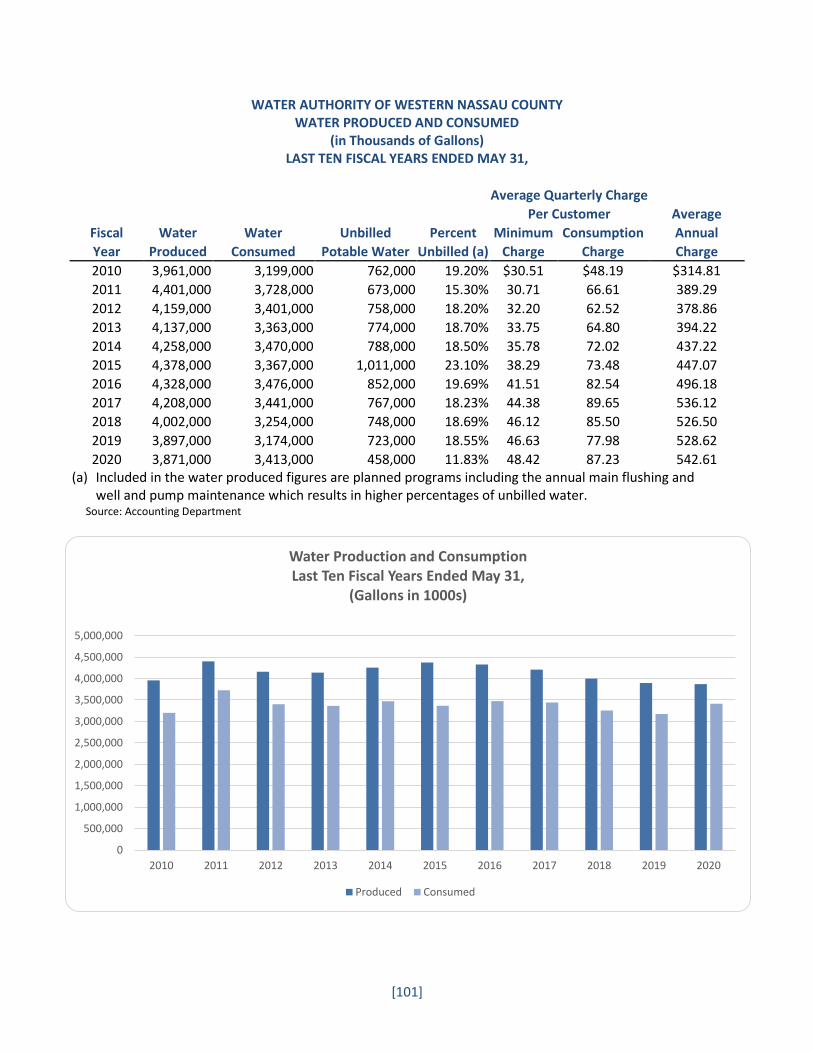
[101]
WATER AUTHORITY OF WESTERN NASSAU COUNTY WATER PRODUCED AND CONSUMED
(in Thousands of Gallons) LAST TEN FISCAL YEARS ENDED MAY 31,
Average Quarterly Charge
Per Customer Average
Fiscal Water Water Unbilled Percent Minimum Consumption Annual
Year Produced Consumed Potable Water Unbilled (a) Charge Charge Charge
2010 3,961,000 3,199,000 762,000 19.20% $30.51 $48.19 $314.81
2011 4,401,000 3,728,000 673,000 15.30% 30.71 66.61 389.29
2012 4,159,000 3,401,000 758,000 18.20% 32.20 62.52 378.86
2013 4,137,000 3,363,000 774,000 18.70% 33.75 64.80 394.22
2014 4,258,000 3,470,000 788,000 18.50% 35.78 72.02 437.22
2015 4,378,000 3,367,000 1,011,000 23.10% 38.29 73.48 447.07
2016 4,328,000 3,476,000 852,000 19.69% 41.51 82.54 496.18
2017 4,208,000 3,441,000 767,000 18.23% 44.38 89.65 536.12
2018 4,002,000 3,254,000 748,000 18.69% 46.12 85.50 526.50
2019 3,897,000 3,174,000 723,000 18.55% 46.63 77.98 528.62
2020 3,871,000 3,413,000 458,000 11.83% 48.42 87.23 542.61 (a) Included in the water produced figures are planned programs including the annual main flushing and
well and pump maintenance which results in higher percentages of unbilled water. Source: Accounting Department
0
500,000
1,000,000
1,500,000
2,000,000
2,500,000
3,000,000
3,500,000
4,000,000
4,500,000
5,000,000
2010 2011 2012 2013 2014 2015 2016 2017 2018 2019 2020
Water Production and ConsumptionLast Ten Fiscal Years Ended May 31,
(Gallons in 1000s)
Produced Consumed
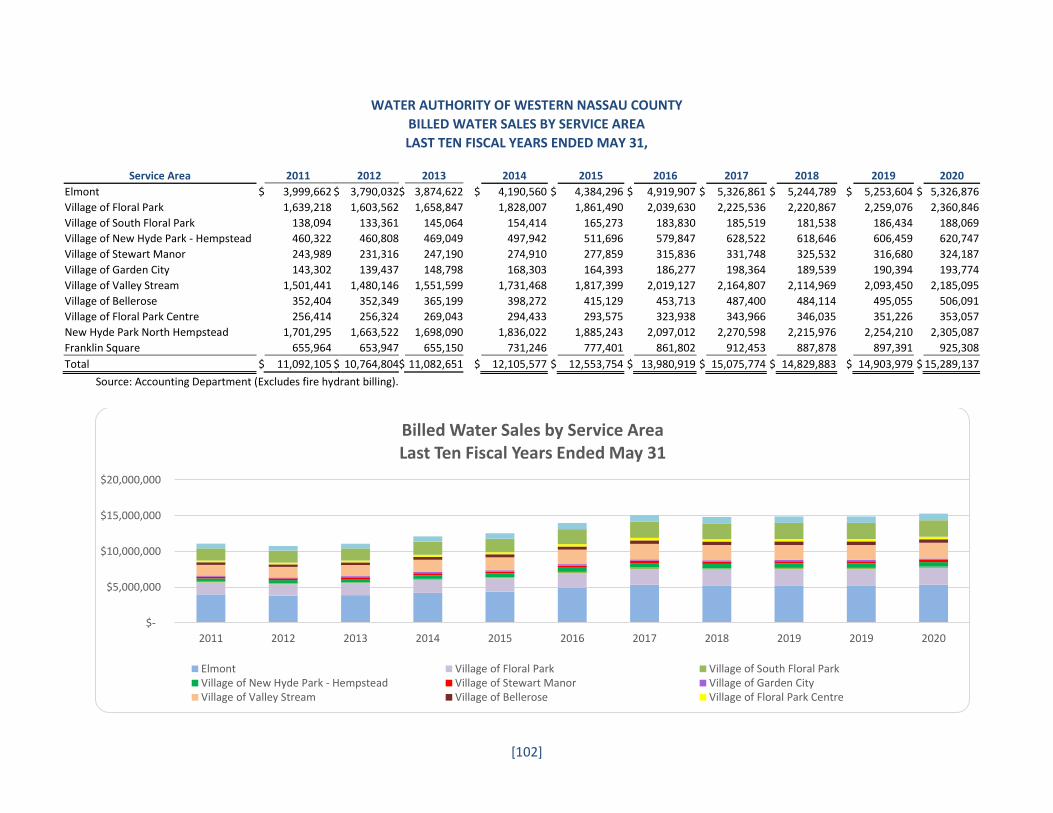
[102]
WATER AUTHORITY OF WESTERN NASSAU COUNTY
BILLED WATER SALES BY SERVICE AREA
LAST TEN FISCAL YEARS ENDED MAY 31,
Service Area 2011 2012 2013 2014 2015 2016 2017 2018 2019 2020 Elmont $ 3,999,662 $ 3,790,032 $ 3,874,622 $ 4,190,560 $ 4,384,296 $ 4,919,907 $ 5,326,861 $ 5,244,789 $ 5,253,604 $ 5,326,876 Village of Floral Park 1,639,218 1,603,562 1,658,847 1,828,007 1,861,490 2,039,630 2,225,536 2,220,867 2,259,076 2,360,846 Village of South Floral Park 138,094 133,361 145,064 154,414 165,273 183,830 185,519 181,538 186,434 188,069 Village of New Hyde Park - Hempstead 460,322 460,808 469,049 497,942 511,696 579,847 628,522 618,646 606,459 620,747 Village of Stewart Manor 243,989 231,316 247,190 274,910 277,859 315,836 331,748 325,532 316,680 324,187 Village of Garden City 143,302 139,437 148,798 168,303 164,393 186,277 198,364 189,539 190,394 193,774 Village of Valley Stream 1,501,441 1,480,146 1,551,599 1,731,468 1,817,399 2,019,127 2,164,807 2,114,969 2,093,450 2,185,095 Village of Bellerose 352,404 352,349 365,199 398,272 415,129 453,713 487,400 484,114 495,055 506,091 Village of Floral Park Centre 256,414 256,324 269,043 294,433 293,575 323,938 343,966 346,035 351,226 353,057 New Hyde Park North Hempstead 1,701,295 1,663,522 1,698,090 1,836,022 1,885,243 2,097,012 2,270,598 2,215,976 2,254,210 2,305,087 Franklin Square 655,964 653,947 655,150 731,246 777,401 861,802 912,453 887,878 897,391 925,308 Total $ 11,092,105 $ 10,764,804 $ 11,082,651 $ 12,105,577 $ 12,553,754 $ 13,980,919 $ 15,075,774 $ 14,829,883 $ 14,903,979 $ 15,289,137
Source: Accounting Department (Excludes fire hydrant billing).
$-
$5,000,000
$10,000,000
$15,000,000
$20,000,000
2011 2012 2013 2014 2015 2016 2017 2018 2019 2019 2020
Billed Water Sales by Service AreaLast Ten Fiscal Years Ended May 31
Elmont Village of Floral Park Village of South Floral ParkVillage of New Hyde Park - Hempstead Village of Stewart Manor Village of Garden CityVillage of Valley Stream Village of Bellerose Village of Floral Park Centre
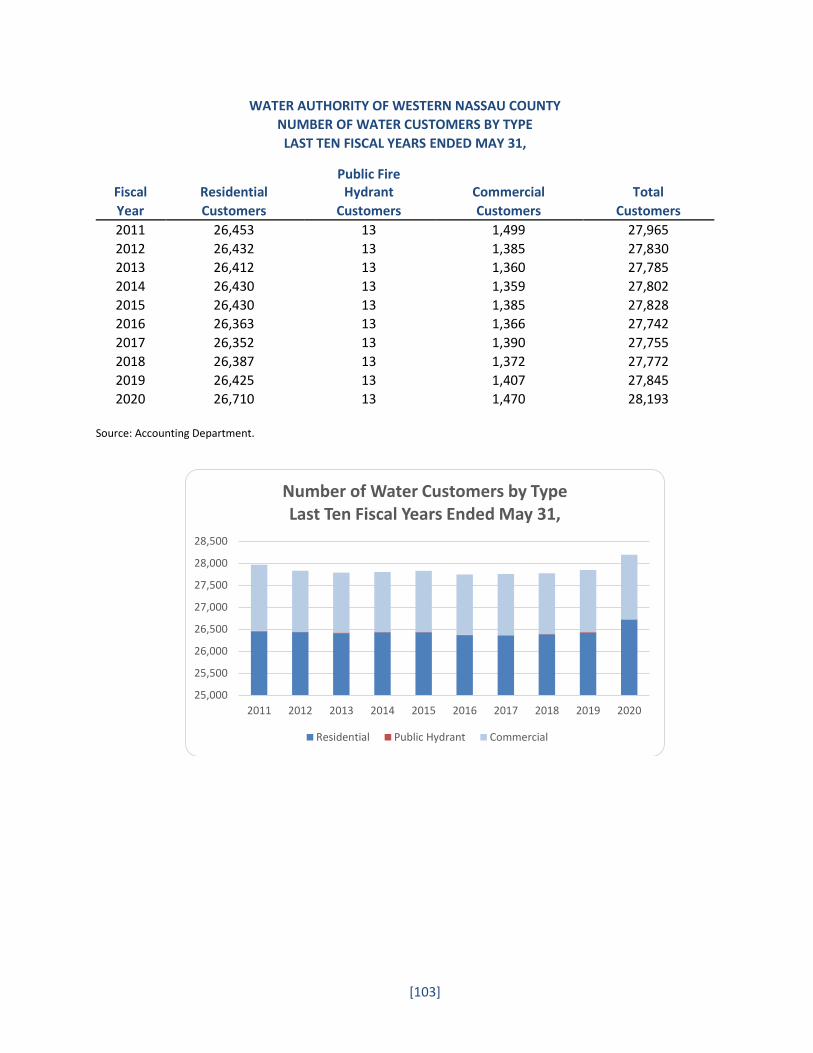
[103]
WATER AUTHORITY OF WESTERN NASSAU COUNTY
NUMBER OF WATER CUSTOMERS BY TYPE
LAST TEN FISCAL YEARS ENDED MAY 31,
Fiscal Residential Public Fire
Hydrant Commercial Total
Year Customers Customers Customers Customers
2011 26,453 13 1,499 27,965
2012 26,432 13 1,385 27,830
2013 26,412 13 1,360 27,785
2014 26,430 13 1,359 27,802
2015 26,430 13 1,385 27,828
2016 26,363 13 1,366 27,742
2017 26,352 13 1,390 27,755
2018 26,387 13 1,372 27,772
2019 26,425 13 1,407 27,845
2020 26,710 13 1,470 28,193 Source: Accounting Department.
25,000
25,500
26,000
26,500
27,000
27,500
28,000
28,500
2011 2012 2013 2014 2015 2016 2017 2018 2019 2020
Number of Water Customers by TypeLast Ten Fiscal Years Ended May 31,
Residential Public Hydrant Commercial
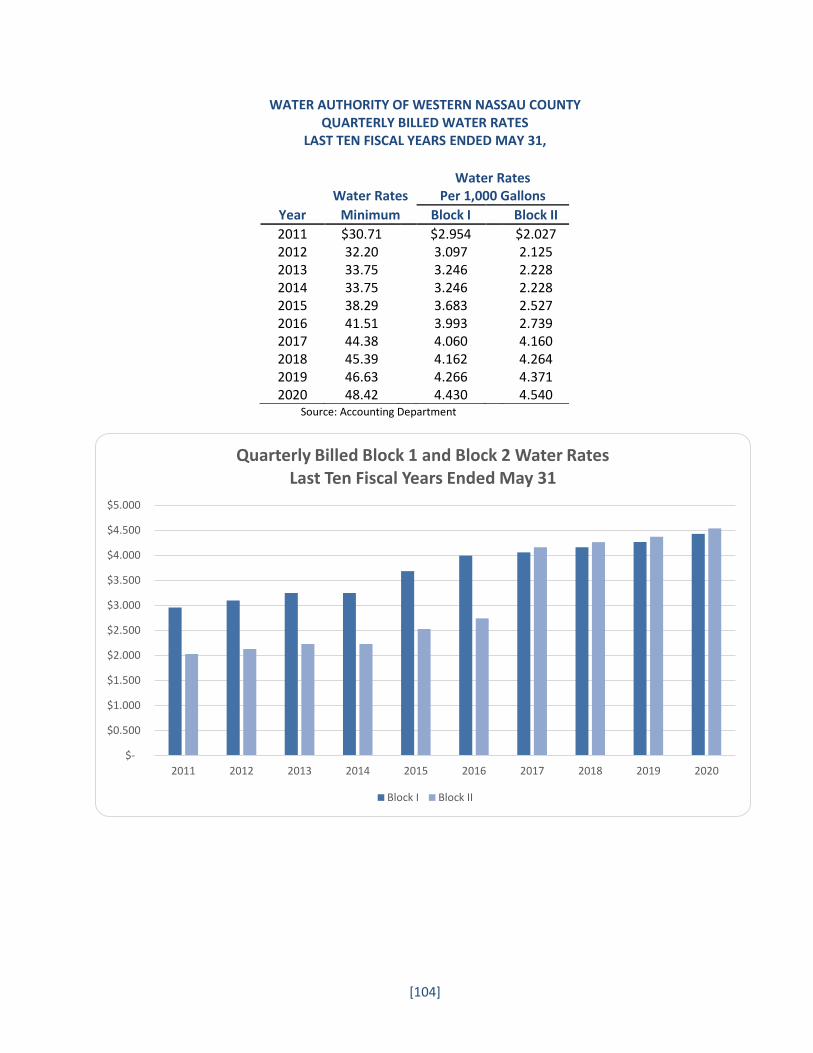
[104]
WATER AUTHORITY OF WESTERN NASSAU COUNTY QUARTERLY BILLED WATER RATES
LAST TEN FISCAL YEARS ENDED MAY 31,
Water Rates Water Rates
Per 1,000 Gallons
Year Minimum Block I Block II
2011 $30.71 $2.954 $2.027 2012 32.20 3.097 2.125 2013 33.75 3.246 2.228 2014 33.75 3.246 2.228 2015 38.29 3.683 2.527 2016 41.51 3.993 2.739 2017 44.38 4.060 4.160 2018 45.39 4.162 4.264 2019 46.63 4.266 4.371 2020 48.42 4.430 4.540
Source: Accounting Department
$-
$0.500
$1.000
$1.500
$2.000
$2.500
$3.000
$3.500
$4.000
$4.500
$5.000
2011 2012 2013 2014 2015 2016 2017 2018 2019 2020
Quarterly Billed Block 1 and Block 2 Water RatesLast Ten Fiscal Years Ended May 31
Block I Block II
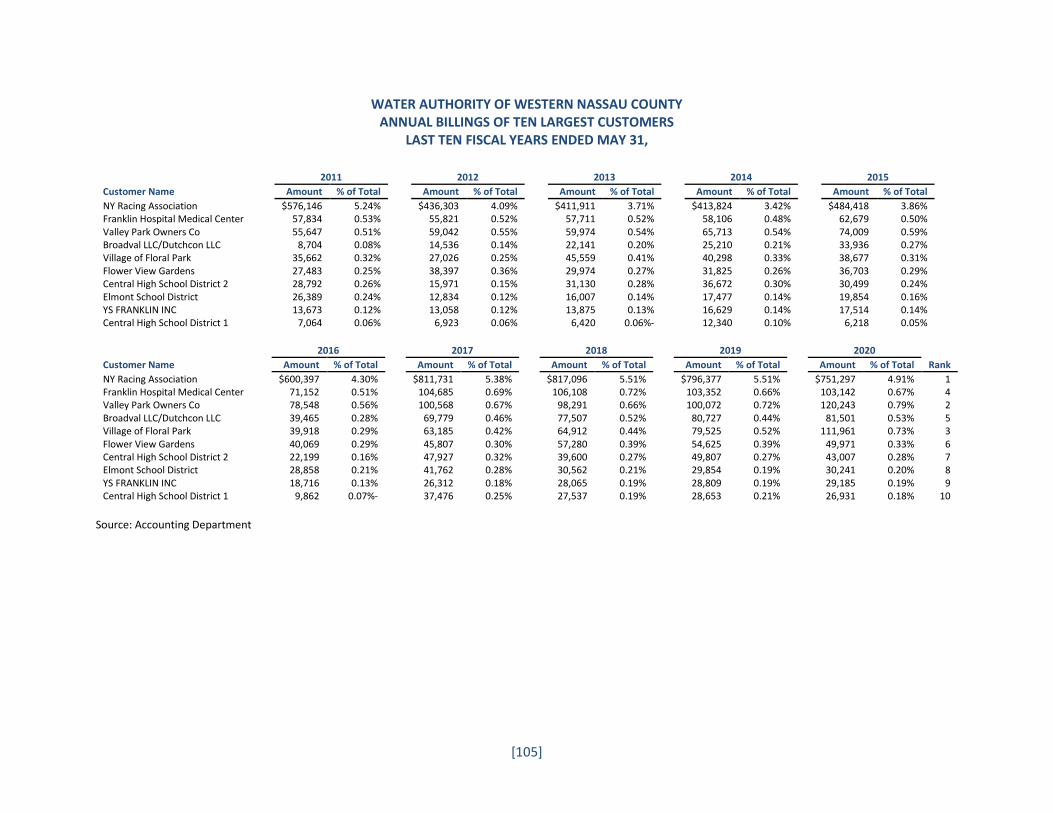
[105]
WATER AUTHORITY OF WESTERN NASSAU COUNTY ANNUAL BILLINGS OF TEN LARGEST CUSTOMERS
LAST TEN FISCAL YEARS ENDED MAY 31,
2011 2012 2013 2014 2015 Customer Name Amount % of Total Amount % of Total Amount % of Total Amount % of Total Amount % of Total NY Racing Association $576,146 5.24% $436,303 4.09% $411,911 3.71% $413,824 3.42% $484,418 3.86% Franklin Hospital Medical Center 57,834 0.53% 55,821 0.52% 57,711 0.52% 58,106 0.48% 62,679 0.50% Valley Park Owners Co 55,647 0.51% 59,042 0.55% 59,974 0.54% 65,713 0.54% 74,009 0.59% Broadval LLC/Dutchcon LLC 8,704 0.08% 14,536 0.14% 22,141 0.20% 25,210 0.21% 33,936 0.27% Village of Floral Park 35,662 0.32% 27,026 0.25% 45,559 0.41% 40,298 0.33% 38,677 0.31% Flower View Gardens 27,483 0.25% 38,397 0.36% 29,974 0.27% 31,825 0.26% 36,703 0.29% Central High School District 2 28,792 0.26% 15,971 0.15% 31,130 0.28% 36,672 0.30% 30,499 0.24% Elmont School District 26,389 0.24% 12,834 0.12% 16,007 0.14% 17,477 0.14% 19,854 0.16% YS FRANKLIN INC 13,673 0.12% 13,058 0.12% 13,875 0.13% 16,629 0.14% 17,514 0.14% Central High School District 1 7,064 0.06% 6,923 0.06% 6,420 0.06%- 12,340 0.10% 6,218 0.05%
2016 2017 2018 2019 2020 Customer Name Amount % of Total Amount % of Total Amount % of Total Amount % of Total Amount % of Total Rank
NY Racing Association $600,397 4.30% $811,731 5.38% $817,096 5.51% $796,377 5.51% $751,297 4.91% 1 Franklin Hospital Medical Center 71,152 0.51% 104,685 0.69% 106,108 0.72% 103,352 0.66% 103,142 0.67% 4 Valley Park Owners Co 78,548 0.56% 100,568 0.67% 98,291 0.66% 100,072 0.72% 120,243 0.79% 2 Broadval LLC/Dutchcon LLC 39,465 0.28% 69,779 0.46% 77,507 0.52% 80,727 0.44% 81,501 0.53% 5 Village of Floral Park 39,918 0.29% 63,185 0.42% 64,912 0.44% 79,525 0.52% 111,961 0.73% 3 Flower View Gardens 40,069 0.29% 45,807 0.30% 57,280 0.39% 54,625 0.39% 49,971 0.33% 6 Central High School District 2 22,199 0.16% 47,927 0.32% 39,600 0.27% 49,807 0.27% 43,007 0.28% 7 Elmont School District 28,858 0.21% 41,762 0.28% 30,562 0.21% 29,854 0.19% 30,241 0.20% 8 YS FRANKLIN INC 18,716 0.13% 26,312 0.18% 28,065 0.19% 28,809 0.19% 29,185 0.19% 9 Central High School District 1 9,862 0.07%- 37,476 0.25% 27,537 0.19% 28,653 0.21% 26,931 0.18% 10
Source: Accounting Department

[106]
THIS PAGE INTENTIONALLY LEFT BLANK

SECTION C: STATISTICAL SECTION
Debt Capacity

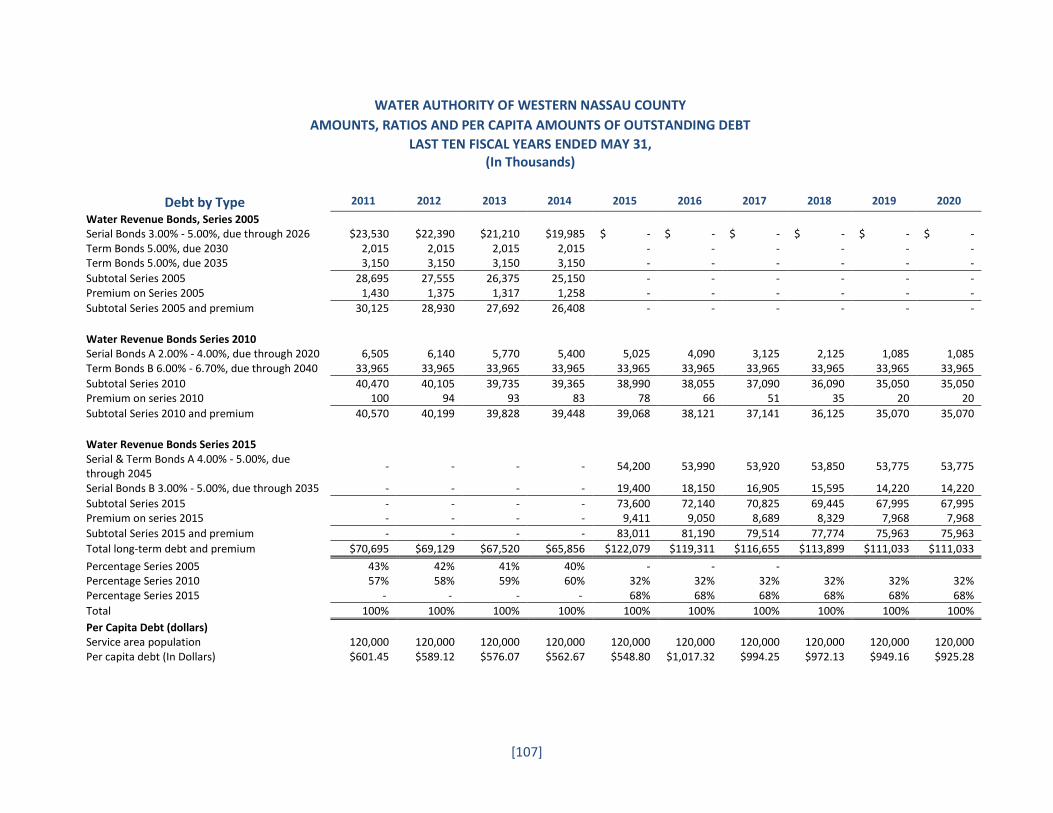
[107]
WATER AUTHORITY OF WESTERN NASSAU COUNTY
AMOUNTS, RATIOS AND PER CAPITA AMOUNTS OF OUTSTANDING DEBT
LAST TEN FISCAL YEARS ENDED MAY 31, (In Thousands)
Debt by Type 2011 2012 2013 2014 2015 2016 2017 2018 2019 2020
Water Revenue Bonds, Series 2005
Serial Bonds 3.00% - 5.00%, due through 2026 $23,530 $22,390 $21,210 $19,985 $ - $ - $ - $ - $ - $ - Term Bonds 5.00%, due 2030 2,015 2,015 2,015 2,015 - - - - - - Term Bonds 5.00%, due 2035 3,150 3,150 3,150 3,150 - - - - - -
Subtotal Series 2005 28,695 27,555 26,375 25,150 - - - - - - Premium on Series 2005 1,430 1,375 1,317 1,258 - - - - - -
Subtotal Series 2005 and premium 30,125 28,930 27,692 26,408 - - - - - -
Water Revenue Bonds Series 2010
Serial Bonds A 2.00% - 4.00%, due through 2020 6,505 6,140 5,770 5,400 5,025 4,090 3,125 2,125 1,085 1,085 Term Bonds B 6.00% - 6.70%, due through 2040 33,965 33,965 33,965 33,965 33,965 33,965 33,965 33,965 33,965 33,965
Subtotal Series 2010 40,470 40,105 39,735 39,365 38,990 38,055 37,090 36,090 35,050 35,050 Premium on series 2010 100 94 93 83 78 66 51 35 20 20
Subtotal Series 2010 and premium 40,570 40,199 39,828 39,448 39,068 38,121 37,141 36,125 35,070 35,070
Water Revenue Bonds Series 2015
Serial & Term Bonds A 4.00% - 5.00%, due through 2045
- - - - 54,200 53,990 53,920 53,850 53,775 53,775
Serial Bonds B 3.00% - 5.00%, due through 2035 - - - - 19,400 18,150 16,905 15,595 14,220 14,220
Subtotal Series 2015 - - - - 73,600 72,140 70,825 69,445 67,995 67,995 Premium on series 2015 - - - - 9,411 9,050 8,689 8,329 7,968 7,968
Subtotal Series 2015 and premium - - - - 83,011 81,190 79,514 77,774 75,963 75,963
Total long-term debt and premium $70,695 $69,129 $67,520 $65,856 $122,079 $119,311 $116,655 $113,899 $111,033 $111,033
Percentage Series 2005 43% 42% 41% 40% - - -
Percentage Series 2010 57% 58% 59% 60% 32% 32% 32% 32% 32% 32% Percentage Series 2015 - - - - 68% 68% 68% 68% 68% 68%
Total 100% 100% 100% 100% 100% 100% 100% 100% 100% 100%
Per Capita Debt (dollars) Service area population 120,000 120,000 120,000 120,000 120,000 120,000 120,000 120,000 120,000 120,000 Per capita debt (In Dollars) $601.45 $589.12 $576.07 $562.67 $548.80 $1,017.32 $994.25 $972.13 $949.16 $925.28
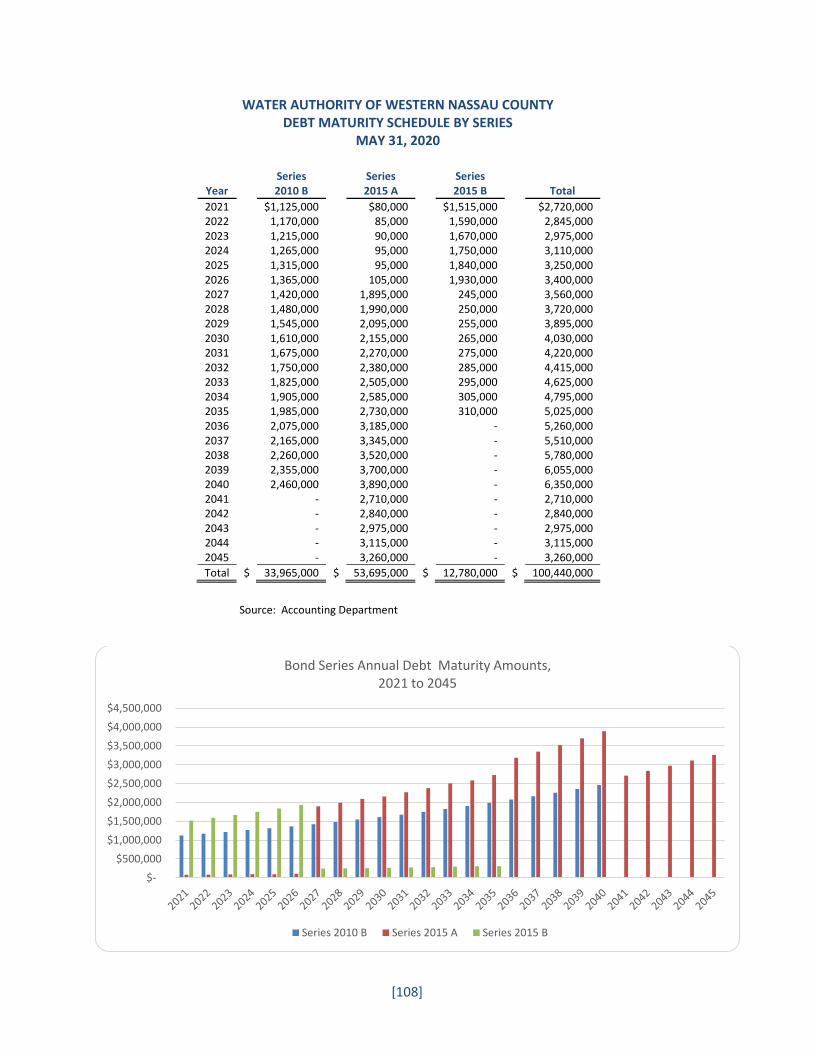
[108]
WATER AUTHORITY OF WESTERN NASSAU COUNTY DEBT MATURITY SCHEDULE BY SERIES
MAY 31, 2020
Year
Series 2010 B
Series 2015 A
Series 2015 B Total
2021 $1,125,000 $80,000 $1,515,000 $2,720,000 2022 1,170,000 85,000 1,590,000 2,845,000 2023 1,215,000 90,000 1,670,000 2,975,000 2024 1,265,000 95,000 1,750,000 3,110,000 2025 1,315,000 95,000 1,840,000 3,250,000 2026 1,365,000 105,000 1,930,000 3,400,000 2027 1,420,000 1,895,000 245,000 3,560,000 2028 1,480,000 1,990,000 250,000 3,720,000 2029 1,545,000 2,095,000 255,000 3,895,000 2030 1,610,000 2,155,000 265,000 4,030,000 2031 1,675,000 2,270,000 275,000 4,220,000 2032 1,750,000 2,380,000 285,000 4,415,000 2033 1,825,000 2,505,000 295,000 4,625,000 2034 1,905,000 2,585,000 305,000 4,795,000 2035 1,985,000 2,730,000 310,000 5,025,000 2036 2,075,000 3,185,000 - 5,260,000 2037 2,165,000 3,345,000 - 5,510,000 2038 2,260,000 3,520,000 - 5,780,000 2039 2,355,000 3,700,000 - 6,055,000 2040 2,460,000 3,890,000 - 6,350,000 2041 - 2,710,000 - 2,710,000 2042 - 2,840,000 - 2,840,000 2043 - 2,975,000 - 2,975,000 2044 - 3,115,000 - 3,115,000 2045 - 3,260,000 - 3,260,000
Total $ 33,965,000 $ 53,695,000 $ 12,780,000 $ 100,440,000
Source: Accounting Department
$-
$500,000
$1,000,000
$1,500,000
$2,000,000
$2,500,000
$3,000,000
$3,500,000
$4,000,000
$4,500,000
Bond Series Annual Debt Maturity Amounts, 2021 to 2045
Series 2010 B Series 2015 A Series 2015 B
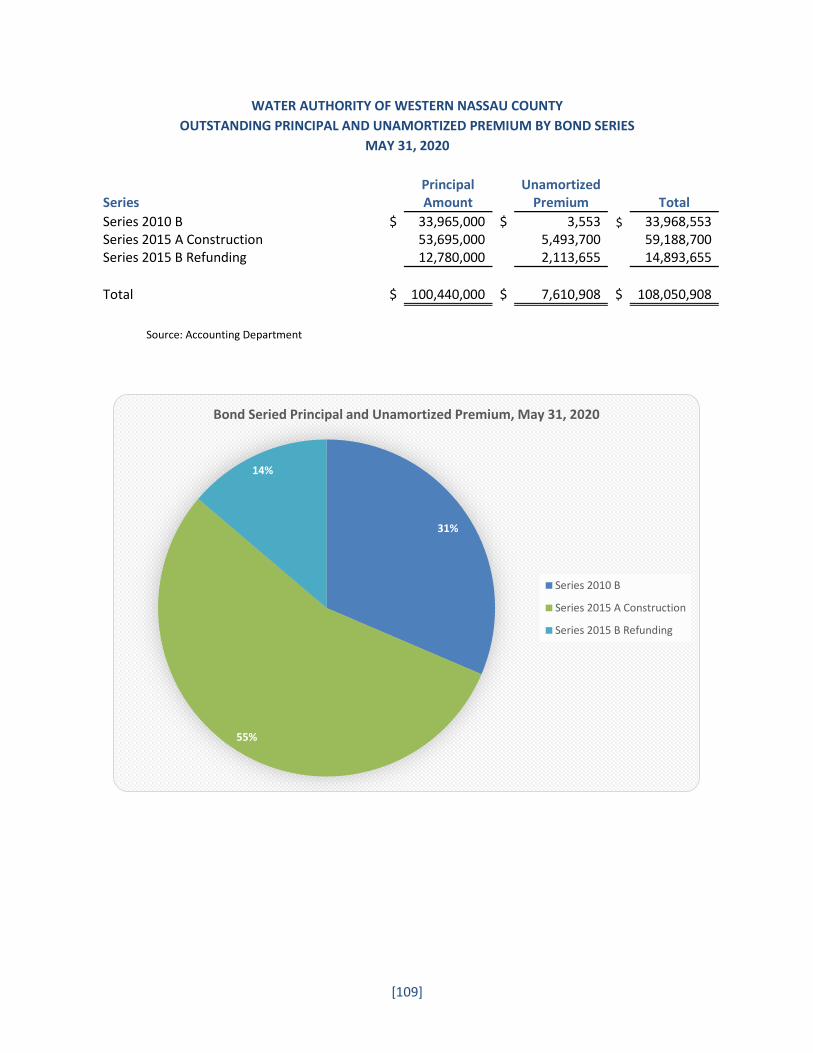
[109]
WATER AUTHORITY OF WESTERN NASSAU COUNTY
OUTSTANDING PRINCIPAL AND UNAMORTIZED PREMIUM BY BOND SERIES
MAY 31, 2020
Principal Unamortized Series Amount Premium Total
Series 2010 B $ 33,965,000 $ 3,553 $ 33,968,553 Series 2015 A Construction 53,695,000 5,493,700 59,188,700 Series 2015 B Refunding 12,780,000 2,113,655 14,893,655
Total $ 100,440,000 $ 7,610,908 $ 108,050,908
Source: Accounting Department
31%
55%
14%
Bond Seried Principal and Unamortized Premium, May 31, 2020
Series 2010 B
Series 2015 A Construction
Series 2015 B Refunding
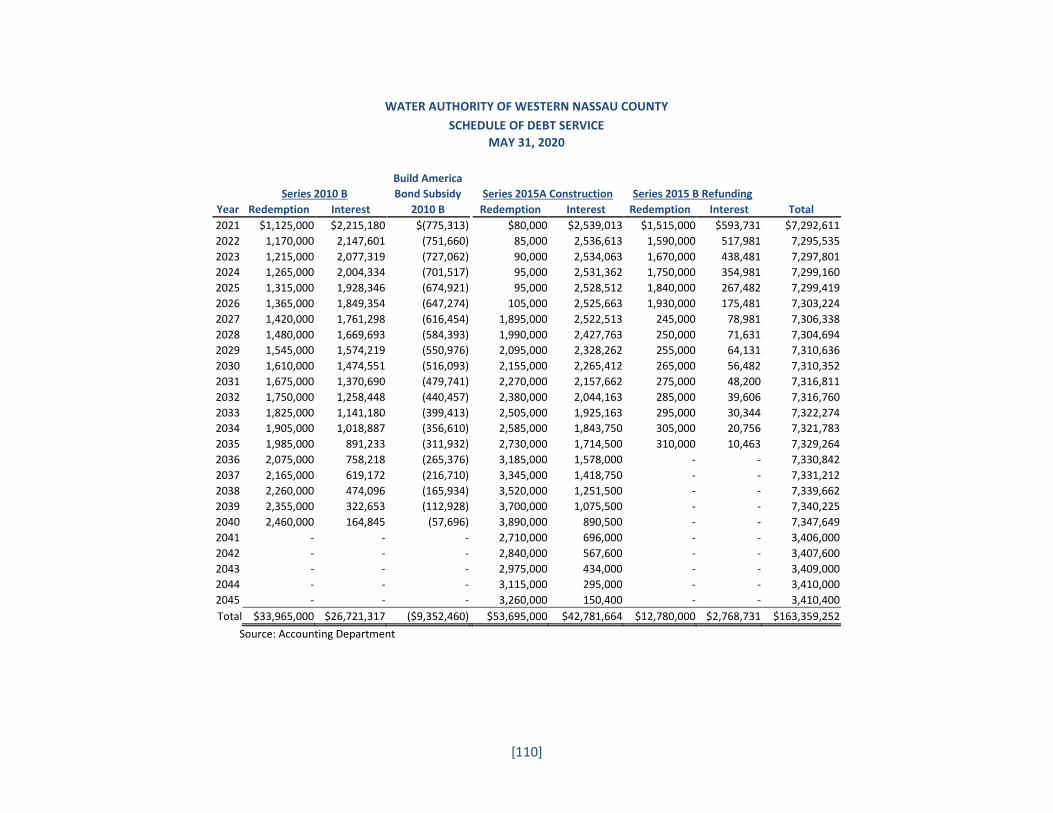
[110]
WATER AUTHORITY OF WESTERN NASSAU COUNTY
SCHEDULE OF DEBT SERVICE
MAY 31, 2020
Build America
Series 2010 B Bond Subsidy Series 2015A Construction Series 2015 B Refunding Year Redemption Interest 2010 B Redemption Interest Redemption Interest Total
2021 $1,125,000 $2,215,180 $(775,313) $80,000 $2,539,013 $1,515,000 $593,731 $7,292,611
2022 1,170,000 2,147,601 (751,660) 85,000 2,536,613 1,590,000 517,981 7,295,535
2023 1,215,000 2,077,319 (727,062) 90,000 2,534,063 1,670,000 438,481 7,297,801
2024 1,265,000 2,004,334 (701,517) 95,000 2,531,362 1,750,000 354,981 7,299,160
2025 1,315,000 1,928,346 (674,921) 95,000 2,528,512 1,840,000 267,482 7,299,419
2026 1,365,000 1,849,354 (647,274) 105,000 2,525,663 1,930,000 175,481 7,303,224
2027 1,420,000 1,761,298 (616,454) 1,895,000 2,522,513 245,000 78,981 7,306,338
2028 1,480,000 1,669,693 (584,393) 1,990,000 2,427,763 250,000 71,631 7,304,694
2029 1,545,000 1,574,219 (550,976) 2,095,000 2,328,262 255,000 64,131 7,310,636
2030 1,610,000 1,474,551 (516,093) 2,155,000 2,265,412 265,000 56,482 7,310,352
2031 1,675,000 1,370,690 (479,741) 2,270,000 2,157,662 275,000 48,200 7,316,811
2032 1,750,000 1,258,448 (440,457) 2,380,000 2,044,163 285,000 39,606 7,316,760
2033 1,825,000 1,141,180 (399,413) 2,505,000 1,925,163 295,000 30,344 7,322,274
2034 1,905,000 1,018,887 (356,610) 2,585,000 1,843,750 305,000 20,756 7,321,783
2035 1,985,000 891,233 (311,932) 2,730,000 1,714,500 310,000 10,463 7,329,264
2036 2,075,000 758,218 (265,376) 3,185,000 1,578,000 - - 7,330,842
2037 2,165,000 619,172 (216,710) 3,345,000 1,418,750 - - 7,331,212
2038 2,260,000 474,096 (165,934) 3,520,000 1,251,500 - - 7,339,662
2039 2,355,000 322,653 (112,928) 3,700,000 1,075,500 - - 7,340,225
2040 2,460,000 164,845 (57,696) 3,890,000 890,500 - - 7,347,649
2041 - - - 2,710,000 696,000 - - 3,406,000
2042 - - - 2,840,000 567,600 - - 3,407,600
2043 - - - 2,975,000 434,000 - - 3,409,000
2044 - - - 3,115,000 295,000 - - 3,410,000
2045 - - - 3,260,000 150,400 - - 3,410,400
Total $33,965,000 $26,721,317 ($9,352,460) $53,695,000 $42,781,664 $12,780,000 $2,768,731 $163,359,252
Source: Accounting Department
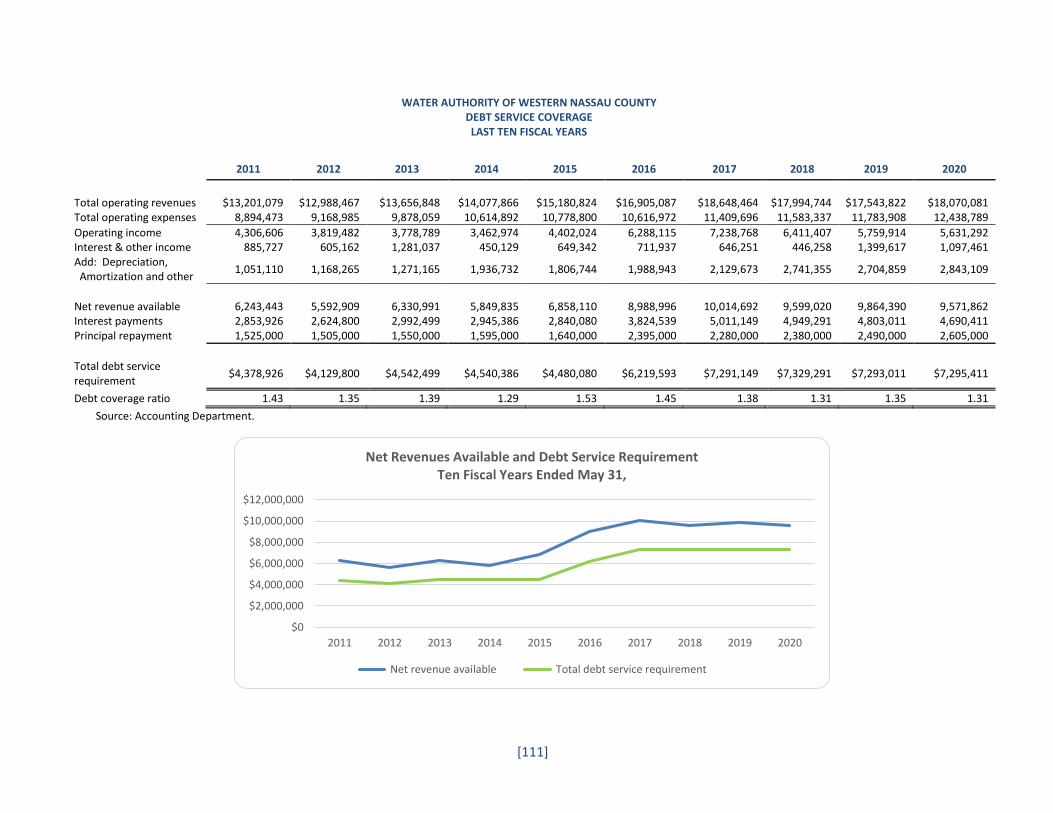
[111]
WATER AUTHORITY OF WESTERN NASSAU COUNTY DEBT SERVICE COVERAGE LAST TEN FISCAL YEARS
2011 2012 2013 2014 2015 2016 2017 2018 2019 2020
Total operating revenues $13,201,079 $12,988,467 $13,656,848 $14,077,866 $15,180,824 $16,905,087 $18,648,464 $17,994,744 $17,543,822 $18,070,081 Total operating expenses 8,894,473 9,168,985 9,878,059 10,614,892 10,778,800 10,616,972 11,409,696 11,583,337 11,783,908 12,438,789
Operating income 4,306,606 3,819,482 3,778,789 3,462,974 4,402,024 6,288,115 7,238,768 6,411,407 5,759,914 5,631,292 Interest & other income 885,727 605,162 1,281,037 450,129 649,342 711,937 646,251 446,258 1,399,617 1,097,461 Add: Depreciation, Amortization and other
1,051,110 1,168,265 1,271,165 1,936,732 1,806,744 1,988,943 2,129,673 2,741,355 2,704,859 2,843,109
Net revenue available 6,243,443 5,592,909 6,330,991 5,849,835 6,858,110 8,988,996 10,014,692 9,599,020 9,864,390 9,571,862 Interest payments 2,853,926 2,624,800 2,992,499 2,945,386 2,840,080 3,824,539 5,011,149 4,949,291 4,803,011 4,690,411 Principal repayment 1,525,000 1,505,000 1,550,000 1,595,000 1,640,000 2,395,000 2,280,000 2,380,000 2,490,000 2,605,000
Total debt service requirement
$4,378,926 $4,129,800 $4,542,499 $4,540,386 $4,480,080 $6,219,593 $7,291,149 $7,329,291 $7,293,011 $7,295,411
Debt coverage ratio 1.43 1.35 1.39 1.29 1.53 1.45 1.38 1.31 1.35 1.31
Source: Accounting Department.
$0
$2,000,000
$4,000,000
$6,000,000
$8,000,000
$10,000,000
$12,000,000
2011 2012 2013 2014 2015 2016 2017 2018 2019 2020
Net Revenues Available and Debt Service RequirementTen Fiscal Years Ended May 31,
Net revenue available Total debt service requirement
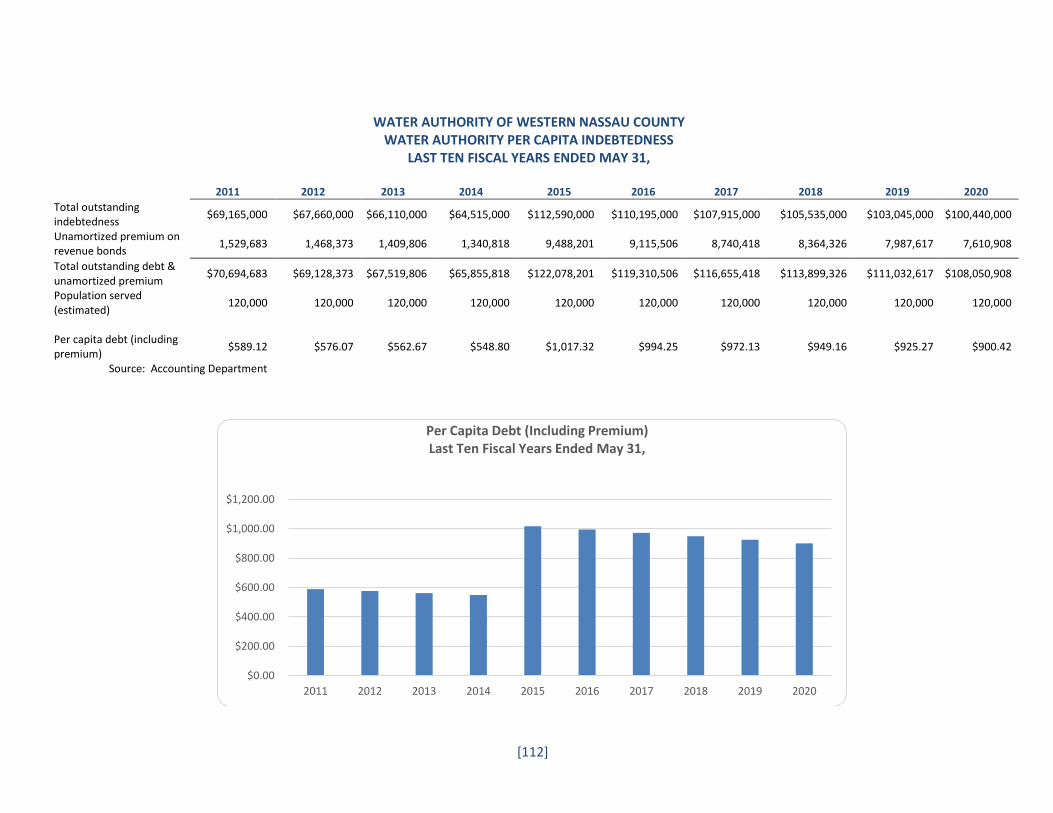
[112]
WATER AUTHORITY OF WESTERN NASSAU COUNTY
WATER AUTHORITY PER CAPITA INDEBTEDNESS LAST TEN FISCAL YEARS ENDED MAY 31,
2011 2012 2013 2014 2015 2016 2017 2018 2019 2020
Total outstanding indebtedness
$69,165,000 $67,660,000 $66,110,000 $64,515,000 $112,590,000 $110,195,000 $107,915,000 $105,535,000 $103,045,000 $100,440,000
Unamortized premium on revenue bonds
1,529,683 1,468,373 1,409,806 1,340,818 9,488,201 9,115,506 8,740,418 8,364,326 7,987,617 7,610,908
Total outstanding debt & unamortized premium
$70,694,683 $69,128,373 $67,519,806 $65,855,818 $122,078,201 $119,310,506 $116,655,418 $113,899,326 $111,032,617 $108,050,908
Population served (estimated)
120,000 120,000 120,000 120,000 120,000 120,000 120,000 120,000 120,000 120,000
Per capita debt (including premium)
$589.12 $576.07 $562.67 $548.80 $1,017.32 $994.25 $972.13 $949.16 $925.27 $900.42
Source: Accounting Department
$0.00
$200.00
$400.00
$600.00
$800.00
$1,000.00
$1,200.00
2011 2012 2013 2014 2015 2016 2017 2018 2019 2020
Per Capita Debt (Including Premium)Last Ten Fiscal Years Ended May 31,

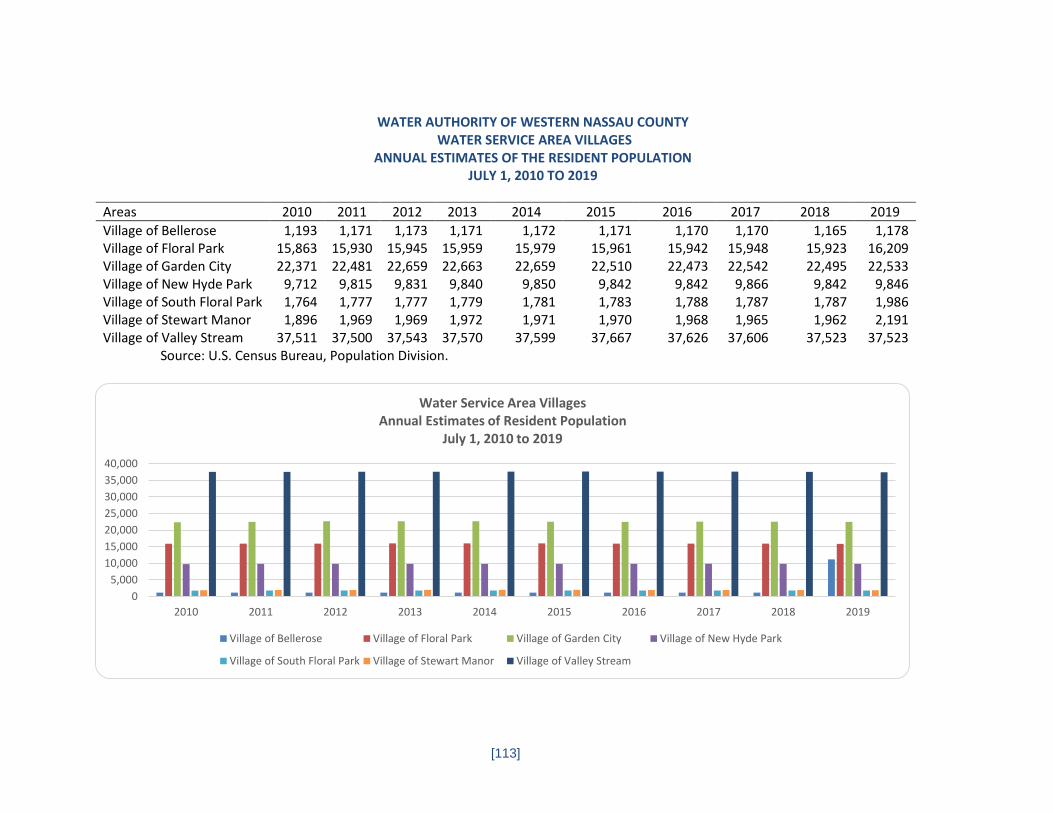
[113]
WATER AUTHORITY OF WESTERN NASSAU COUNTY
WATER SERVICE AREA VILLAGES ANNUAL ESTIMATES OF THE RESIDENT POPULATION
JULY 1, 2010 TO 2019
Areas 2010 2011 2012 2013 2014 2015 2016 2017 2018 2019
Village of Bellerose 1,193 1,171 1,173 1,171 1,172 1,171 1,170 1,170 1,165 1,178 Village of Floral Park 15,863 15,930 15,945 15,959 15,979 15,961 15,942 15,948 15,923 16,209 Village of Garden City 22,371 22,481 22,659 22,663 22,659 22,510 22,473 22,542 22,495 22,533 Village of New Hyde Park 9,712 9,815 9,831 9,840 9,850 9,842 9,842 9,866 9,842 9,846 Village of South Floral Park 1,764 1,777 1,777 1,779 1,781 1,783 1,788 1,787 1,787 1,986 Village of Stewart Manor 1,896 1,969 1,969 1,972 1,971 1,970 1,968 1,965 1,962 2,191 Village of Valley Stream 37,511 37,500 37,543 37,570 37,599 37,667 37,626 37,606 37,523 37,523
Source: U.S. Census Bureau, Population Division.
0
5,000
10,000
15,000
20,000
25,000
30,000
35,000
40,000
2010 2011 2012 2013 2014 2015 2016 2017 2018 2019
Water Service Area VillagesAnnual Estimates of Resident Population
July 1, 2010 to 2019
Village of Bellerose Village of Floral Park Village of Garden City Village of New Hyde Park
Village of South Floral Park Village of Stewart Manor Village of Valley Stream
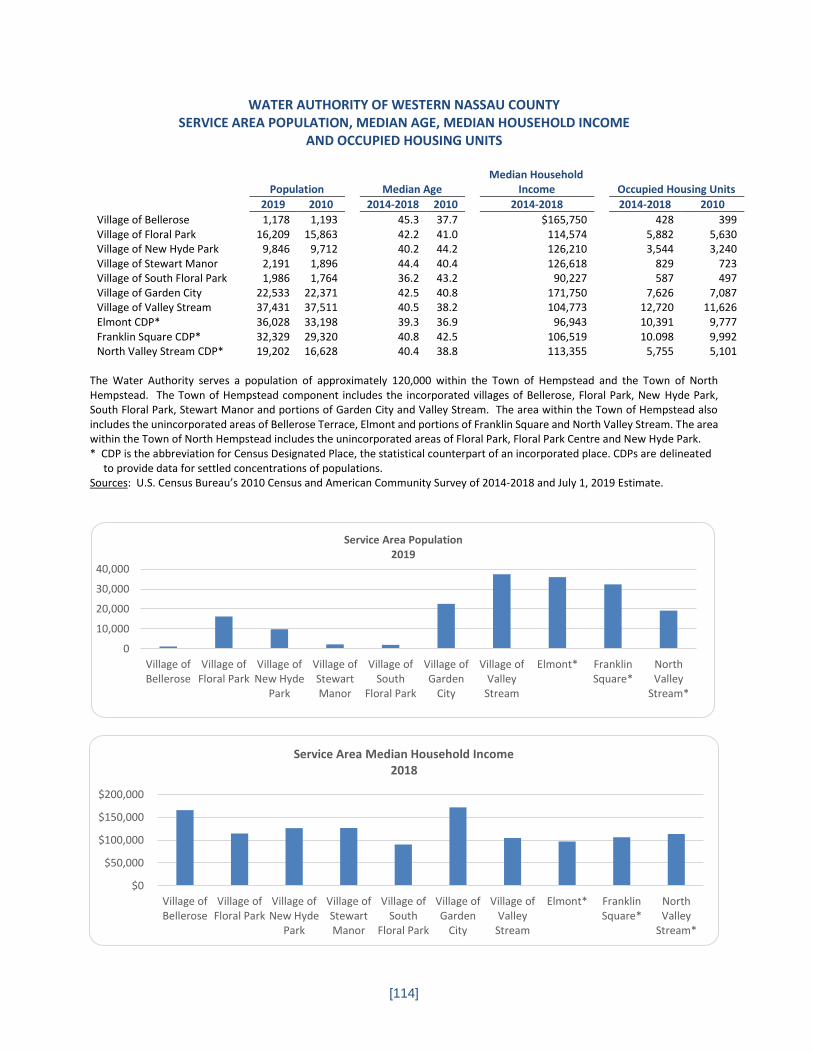
[114]
WATER AUTHORITY OF WESTERN NASSAU COUNTY SERVICE AREA POPULATION, MEDIAN AGE, MEDIAN HOUSEHOLD INCOME
AND OCCUPIED HOUSING UNITS
Population Median Age Median Household
Income Occupied Housing Units
2019 2010 2014-2018 2010 2014-2018 2014-2018 2010
Village of Bellerose 1,178 1,193 45.3 37.7 $165,750 428 399 Village of Floral Park 16,209 15,863 42.2 41.0 114,574 5,882 5,630 Village of New Hyde Park 9,846 9,712 40.2 44.2 126,210 3,544 3,240 Village of Stewart Manor 2,191 1,896 44.4 40.4 126,618 829 723 Village of South Floral Park 1,986 1,764 36.2 43.2 90,227 587 497 Village of Garden City 22,533 22,371 42.5 40.8 171,750 7,626 7,087 Village of Valley Stream 37,431 37,511 40.5 38.2 104,773 12,720 11,626 Elmont CDP* 36,028 33,198 39.3 36.9 96,943 10,391 9,777 Franklin Square CDP* 32,329 29,320 40.8 42.5 106,519 10.098 9,992 North Valley Stream CDP* 19,202 16,628 40.4 38.8 113,355 5,755 5,101
The Water Authority serves a population of approximately 120,000 within the Town of Hempstead and the Town of North Hempstead. The Town of Hempstead component includes the incorporated villages of Bellerose, Floral Park, New Hyde Park, South Floral Park, Stewart Manor and portions of Garden City and Valley Stream. The area within the Town of Hempstead also includes the unincorporated areas of Bellerose Terrace, Elmont and portions of Franklin Square and North Valley Stream. The area within the Town of North Hempstead includes the unincorporated areas of Floral Park, Floral Park Centre and New Hyde Park. * CDP is the abbreviation for Census Designated Place, the statistical counterpart of an incorporated place. CDPs are delineated to provide data for settled concentrations of populations. Sources: U.S. Census Bureau’s 2010 Census and American Community Survey of 2014-2018 and July 1, 2019 Estimate.
0
10,000
20,000
30,000
40,000
Village ofBellerose
Village ofFloral Park
Village ofNew Hyde
Park
Village ofStewartManor
Village ofSouth
Floral Park
Village ofGarden
City
Village ofValley
Stream
Elmont* FranklinSquare*
NorthValley
Stream*
Service Area Population 2019
$0
$50,000
$100,000
$150,000
$200,000
Village ofBellerose
Village ofFloral Park
Village ofNew Hyde
Park
Village ofStewartManor
Village ofSouth
Floral Park
Village ofGarden
City
Village ofValley
Stream
Elmont* FranklinSquare*
NorthValley
Stream*
Service Area Median Household Income2018
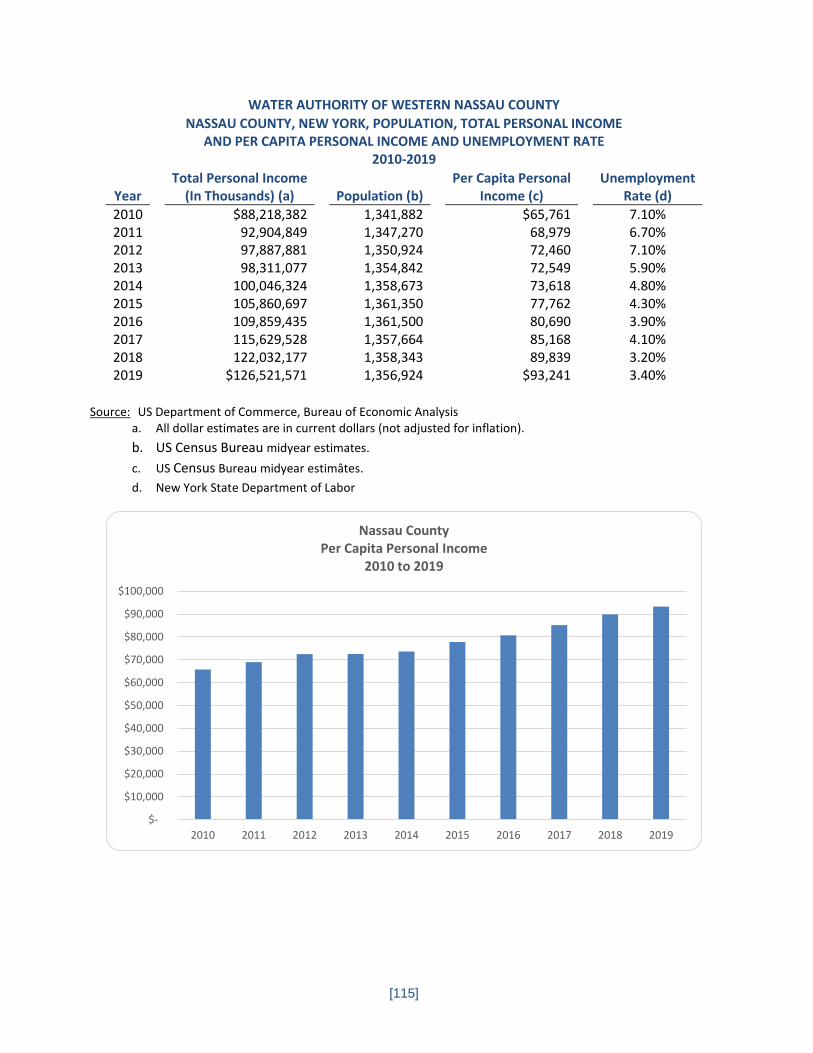
[115]
WATER AUTHORITY OF WESTERN NASSAU COUNTY
NASSAU COUNTY, NEW YORK, POPULATION, TOTAL PERSONAL INCOME AND PER CAPITA PERSONAL INCOME AND UNEMPLOYMENT RATE
2010-2019
Total Personal Income Per Capita Personal Unemployment Year (In Thousands) (a) Population (b) Income (c) Rate (d)
2010 $88,218,382 1,341,882 $65,761 7.10% 2011 92,904,849 1,347,270 68,979 6.70% 2012 97,887,881 1,350,924 72,460 7.10% 2013 98,311,077 1,354,842 72,549 5.90% 2014 100,046,324 1,358,673 73,618 4.80% 2015 105,860,697 1,361,350 77,762 4.30% 2016 109,859,435 1,361,500 80,690 3.90% 2017 115,629,528 1,357,664 85,168 4.10% 2018 122,032,177 1,358,343 89,839 3.20% 2019 $126,521,571 1,356,924 $93,241 3.40%
Source: US Department of Commerce, Bureau of Economic Analysis
a. All dollar estimates are in current dollars (not adjusted for inflation).
b. US Census Bureau midyear estimates.
c. US Census Bureau midyear estimâtes.
d. New York State Department of Labor
$-
$10,000
$20,000
$30,000
$40,000
$50,000
$60,000
$70,000
$80,000
$90,000
$100,000
2010 2011 2012 2013 2014 2015 2016 2017 2018 2019
Nassau County Per Capita Personal Income
2010 to 2019
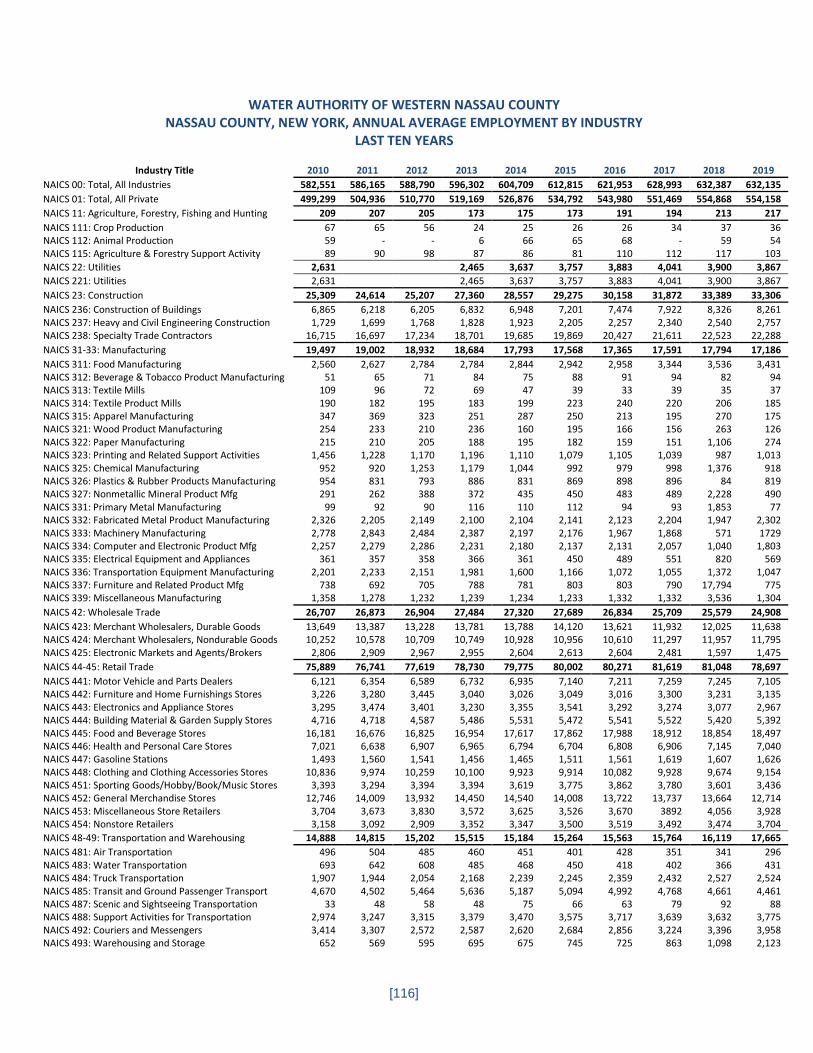
[116]
WATER AUTHORITY OF WESTERN NASSAU COUNTY NASSAU COUNTY, NEW YORK, ANNUAL AVERAGE EMPLOYMENT BY INDUSTRY
LAST TEN YEARS
Industry Title 2010 2011 2012 2013 2014 2015 2016 2017 2018 2019
NAICS 00: Total, All Industries 582,551 586,165 588,790 596,302 604,709 612,815 621,953 628,993 632,387 632,135
NAICS 01: Total, All Private 499,299 504,936 510,770 519,169 526,876 534,792 543,980 551,469 554,868 554,158
NAICS 11: Agriculture, Forestry, Fishing and Hunting 209 207 205 173 175 173 191 194 213 217
NAICS 111: Crop Production 67 65 56 24 25 26 26 34 37 36 NAICS 112: Animal Production 59 - - 6 66 65 68 - 59 54 NAICS 115: Agriculture & Forestry Support Activity 89 90 98 87 86 81 110 112 117 103
NAICS 22: Utilities 2,631 2,465 3,637 3,757 3,883 4,041 3,900 3,867
NAICS 221: Utilities 2,631 2,465 3,637 3,757 3,883 4,041 3,900 3,867
NAICS 23: Construction 25,309 24,614 25,207 27,360 28,557 29,275 30,158 31,872 33,389 33,306
NAICS 236: Construction of Buildings 6,865 6,218 6,205 6,832 6,948 7,201 7,474 7,922 8,326 8,261 NAICS 237: Heavy and Civil Engineering Construction 1,729 1,699 1,768 1,828 1,923 2,205 2,257 2,340 2,540 2,757 NAICS 238: Specialty Trade Contractors 16,715 16,697 17,234 18,701 19,685 19,869 20,427 21,611 22,523 22,288
NAICS 31-33: Manufacturing 19,497 19,002 18,932 18,684 17,793 17,568 17,365 17,591 17,794 17,186
NAICS 311: Food Manufacturing 2,560 2,627 2,784 2,784 2,844 2,942 2,958 3,344 3,536 3,431 NAICS 312: Beverage & Tobacco Product Manufacturing 51 65 71 84 75 88 91 94 82 94 NAICS 313: Textile Mills 109 96 72 69 47 39 33 39 35 37 NAICS 314: Textile Product Mills 190 182 195 183 199 223 240 220 206 185 NAICS 315: Apparel Manufacturing 347 369 323 251 287 250 213 195 270 175 NAICS 321: Wood Product Manufacturing 254 233 210 236 160 195 166 156 263 126 NAICS 322: Paper Manufacturing 215 210 205 188 195 182 159 151 1,106 274 NAICS 323: Printing and Related Support Activities 1,456 1,228 1,170 1,196 1,110 1,079 1,105 1,039 987 1,013 NAICS 325: Chemical Manufacturing 952 920 1,253 1,179 1,044 992 979 998 1,376 918 NAICS 326: Plastics & Rubber Products Manufacturing 954 831 793 886 831 869 898 896 84 819 NAICS 327: Nonmetallic Mineral Product Mfg 291 262 388 372 435 450 483 489 2,228 490 NAICS 331: Primary Metal Manufacturing 99 92 90 116 110 112 94 93 1,853 77 NAICS 332: Fabricated Metal Product Manufacturing 2,326 2,205 2,149 2,100 2,104 2,141 2,123 2,204 1,947 2,302 NAICS 333: Machinery Manufacturing 2,778 2,843 2,484 2,387 2,197 2,176 1,967 1,868 571 1729 NAICS 334: Computer and Electronic Product Mfg 2,257 2,279 2,286 2,231 2,180 2,137 2,131 2,057 1,040 1,803 NAICS 335: Electrical Equipment and Appliances 361 357 358 366 361 450 489 551 820 569 NAICS 336: Transportation Equipment Manufacturing 2,201 2,233 2,151 1,981 1,600 1,166 1,072 1,055 1,372 1,047 NAICS 337: Furniture and Related Product Mfg 738 692 705 788 781 803 803 790 17,794 775 NAICS 339: Miscellaneous Manufacturing 1,358 1,278 1,232 1,239 1,234 1,233 1,332 1,332 3,536 1,304
NAICS 42: Wholesale Trade 26,707 26,873 26,904 27,484 27,320 27,689 26,834 25,709 25,579 24,908
NAICS 423: Merchant Wholesalers, Durable Goods 13,649 13,387 13,228 13,781 13,788 14,120 13,621 11,932 12,025 11,638 NAICS 424: Merchant Wholesalers, Nondurable Goods 10,252 10,578 10,709 10,749 10,928 10,956 10,610 11,297 11,957 11,795 NAICS 425: Electronic Markets and Agents/Brokers 2,806 2,909 2,967 2,955 2,604 2,613 2,604 2,481 1,597 1,475
NAICS 44-45: Retail Trade 75,889 76,741 77,619 78,730 79,775 80,002 80,271 81,619 81,048 78,697
NAICS 441: Motor Vehicle and Parts Dealers 6,121 6,354 6,589 6,732 6,935 7,140 7,211 7,259 7,245 7,105 NAICS 442: Furniture and Home Furnishings Stores 3,226 3,280 3,445 3,040 3,026 3,049 3,016 3,300 3,231 3,135 NAICS 443: Electronics and Appliance Stores 3,295 3,474 3,401 3,230 3,355 3,541 3,292 3,274 3,077 2,967 NAICS 444: Building Material & Garden Supply Stores 4,716 4,718 4,587 5,486 5,531 5,472 5,541 5,522 5,420 5,392 NAICS 445: Food and Beverage Stores 16,181 16,676 16,825 16,954 17,617 17,862 17,988 18,912 18,854 18,497 NAICS 446: Health and Personal Care Stores 7,021 6,638 6,907 6,965 6,794 6,704 6,808 6,906 7,145 7,040 NAICS 447: Gasoline Stations 1,493 1,560 1,541 1,456 1,465 1,511 1,561 1,619 1,607 1,626 NAICS 448: Clothing and Clothing Accessories Stores 10,836 9,974 10,259 10,100 9,923 9,914 10,082 9,928 9,674 9,154 NAICS 451: Sporting Goods/Hobby/Book/Music Stores 3,393 3,294 3,394 3,394 3,619 3,775 3,862 3,780 3,601 3,436 NAICS 452: General Merchandise Stores 12,746 14,009 13,932 14,450 14,540 14,008 13,722 13,737 13,664 12,714 NAICS 453: Miscellaneous Store Retailers 3,704 3,673 3,830 3,572 3,625 3,526 3,670 3892 4,056 3,928 NAICS 454: Nonstore Retailers 3,158 3,092 2,909 3,352 3,347 3,500 3,519 3,492 3,474 3,704
NAICS 48-49: Transportation and Warehousing 14,888 14,815 15,202 15,515 15,184 15,264 15,563 15,764 16,119 17,665
NAICS 481: Air Transportation 496 504 485 460 451 401 428 351 341 296 NAICS 483: Water Transportation 693 642 608 485 468 450 418 402 366 431 NAICS 484: Truck Transportation 1,907 1,944 2,054 2,168 2,239 2,245 2,359 2,432 2,527 2,524 NAICS 485: Transit and Ground Passenger Transport 4,670 4,502 5,464 5,636 5,187 5,094 4,992 4,768 4,661 4,461 NAICS 487: Scenic and Sightseeing Transportation 33 48 58 48 75 66 63 79 92 88 NAICS 488: Support Activities for Transportation 2,974 3,247 3,315 3,379 3,470 3,575 3,717 3,639 3,632 3,775 NAICS 492: Couriers and Messengers 3,414 3,307 2,572 2,587 2,620 2,684 2,856 3,224 3,396 3,958 NAICS 493: Warehousing and Storage 652 569 595 695 675 745 725 863 1,098 2,123
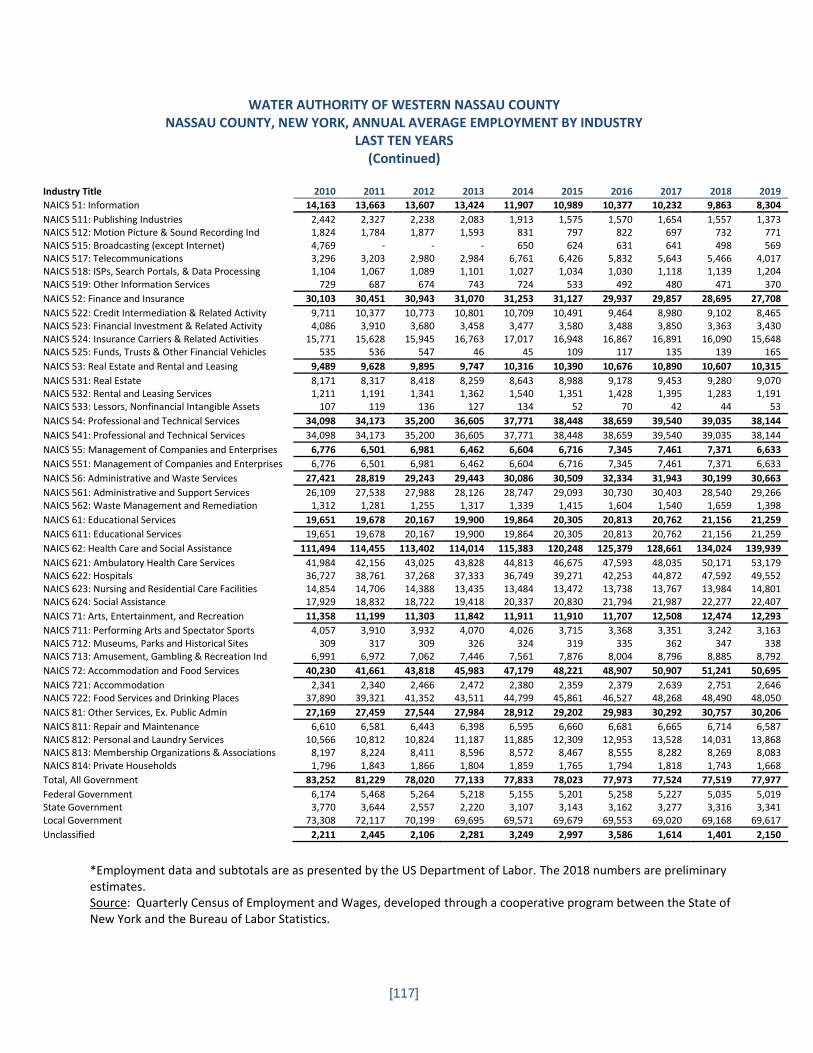
[117]
WATER AUTHORITY OF WESTERN NASSAU COUNTY NASSAU COUNTY, NEW YORK, ANNUAL AVERAGE EMPLOYMENT BY INDUSTRY
LAST TEN YEARS (Continued)
Industry Title 2010 2011 2012 2013 2014 2015 2016 2017 2018 2019
NAICS 51: Information 14,163 13,663 13,607 13,424 11,907 10,989 10,377 10,232 9,863 8,304
NAICS 511: Publishing Industries 2,442 2,327 2,238 2,083 1,913 1,575 1,570 1,654 1,557 1,373 NAICS 512: Motion Picture & Sound Recording Ind 1,824 1,784 1,877 1,593 831 797 822 697 732 771 NAICS 515: Broadcasting (except Internet) 4,769 - - - 650 624 631 641 498 569 NAICS 517: Telecommunications 3,296 3,203 2,980 2,984 6,761 6,426 5,832 5,643 5,466 4,017 NAICS 518: ISPs, Search Portals, & Data Processing 1,104 1,067 1,089 1,101 1,027 1,034 1,030 1,118 1,139 1,204 NAICS 519: Other Information Services 729 687 674 743 724 533 492 480 471 370
NAICS 52: Finance and Insurance 30,103 30,451 30,943 31,070 31,253 31,127 29,937 29,857 28,695 27,708
NAICS 522: Credit Intermediation & Related Activity 9,711 10,377 10,773 10,801 10,709 10,491 9,464 8,980 9,102 8,465 NAICS 523: Financial Investment & Related Activity 4,086 3,910 3,680 3,458 3,477 3,580 3,488 3,850 3,363 3,430 NAICS 524: Insurance Carriers & Related Activities 15,771 15,628 15,945 16,763 17,017 16,948 16,867 16,891 16,090 15,648 NAICS 525: Funds, Trusts & Other Financial Vehicles 535 536 547 46 45 109 117 135 139 165
NAICS 53: Real Estate and Rental and Leasing 9,489 9,628 9,895 9,747 10,316 10,390 10,676 10,890 10,607 10,315
NAICS 531: Real Estate 8,171 8,317 8,418 8,259 8,643 8,988 9,178 9,453 9,280 9,070 NAICS 532: Rental and Leasing Services 1,211 1,191 1,341 1,362 1,540 1,351 1,428 1,395 1,283 1,191 NAICS 533: Lessors, Nonfinancial Intangible Assets 107 119 136 127 134 52 70 42 44 53
NAICS 54: Professional and Technical Services 34,098 34,173 35,200 36,605 37,771 38,448 38,659 39,540 39,035 38,144
NAICS 541: Professional and Technical Services 34,098 34,173 35,200 36,605 37,771 38,448 38,659 39,540 39,035 38,144
NAICS 55: Management of Companies and Enterprises 6,776 6,501 6,981 6,462 6,604 6,716 7,345 7,461 7,371 6,633
NAICS 551: Management of Companies and Enterprises 6,776 6,501 6,981 6,462 6,604 6,716 7,345 7,461 7,371 6,633
NAICS 56: Administrative and Waste Services 27,421 28,819 29,243 29,443 30,086 30,509 32,334 31,943 30,199 30,663
NAICS 561: Administrative and Support Services 26,109 27,538 27,988 28,126 28,747 29,093 30,730 30,403 28,540 29,266 NAICS 562: Waste Management and Remediation 1,312 1,281 1,255 1,317 1,339 1,415 1,604 1,540 1,659 1,398
NAICS 61: Educational Services 19,651 19,678 20,167 19,900 19,864 20,305 20,813 20,762 21,156 21,259
NAICS 611: Educational Services 19,651 19,678 20,167 19,900 19,864 20,305 20,813 20,762 21,156 21,259
NAICS 62: Health Care and Social Assistance 111,494 114,455 113,402 114,014 115,383 120,248 125,379 128,661 134,024 139,939
NAICS 621: Ambulatory Health Care Services 41,984 42,156 43,025 43,828 44,813 46,675 47,593 48,035 50,171 53,179 NAICS 622: Hospitals 36,727 38,761 37,268 37,333 36,749 39,271 42,253 44,872 47,592 49,552 NAICS 623: Nursing and Residential Care Facilities 14,854 14,706 14,388 13,435 13,484 13,472 13,738 13,767 13,984 14,801 NAICS 624: Social Assistance 17,929 18,832 18,722 19,418 20,337 20,830 21,794 21,987 22,277 22,407
NAICS 71: Arts, Entertainment, and Recreation 11,358 11,199 11,303 11,842 11,911 11,910 11,707 12,508 12,474 12,293
NAICS 711: Performing Arts and Spectator Sports 4,057 3,910 3,932 4,070 4,026 3,715 3,368 3,351 3,242 3,163 NAICS 712: Museums, Parks and Historical Sites 309 317 309 326 324 319 335 362 347 338 NAICS 713: Amusement, Gambling & Recreation Ind 6,991 6,972 7,062 7,446 7,561 7,876 8,004 8,796 8,885 8,792
NAICS 72: Accommodation and Food Services 40,230 41,661 43,818 45,983 47,179 48,221 48,907 50,907 51,241 50,695
NAICS 721: Accommodation 2,341 2,340 2,466 2,472 2,380 2,359 2,379 2,639 2,751 2,646 NAICS 722: Food Services and Drinking Places 37,890 39,321 41,352 43,511 44,799 45,861 46,527 48,268 48,490 48,050
NAICS 81: Other Services, Ex. Public Admin 27,169 27,459 27,544 27,984 28,912 29,202 29,983 30,292 30,757 30,206
NAICS 811: Repair and Maintenance 6,610 6,581 6,443 6,398 6,595 6,660 6,681 6,665 6,714 6,587 NAICS 812: Personal and Laundry Services 10,566 10,812 10,824 11,187 11,885 12,309 12,953 13,528 14,031 13,868 NAICS 813: Membership Organizations & Associations 8,197 8,224 8,411 8,596 8,572 8,467 8,555 8,282 8,269 8,083 NAICS 814: Private Households 1,796 1,843 1,866 1,804 1,859 1,765 1,794 1,818 1,743 1,668
Total, All Government 83,252 81,229 78,020 77,133 77,833 78,023 77,973 77,524 77,519 77,977
Federal Government 6,174 5,468 5,264 5,218 5,155 5,201 5,258 5,227 5,035 5,019 State Government 3,770 3,644 2,557 2,220 3,107 3,143 3,162 3,277 3,316 3,341 Local Government 73,308 72,117 70,199 69,695 69,571 69,679 69,553 69,020 69,168 69,617
Unclassified 2,211 2,445 2,106 2,281 3,249 2,997 3,586 1,614 1,401 2,150
*Employment data and subtotals are as presented by the US Department of Labor. The 2018 numbers are preliminary estimates. Source: Quarterly Census of Employment and Wages, developed through a cooperative program between the State of New York and the Bureau of Labor Statistics.
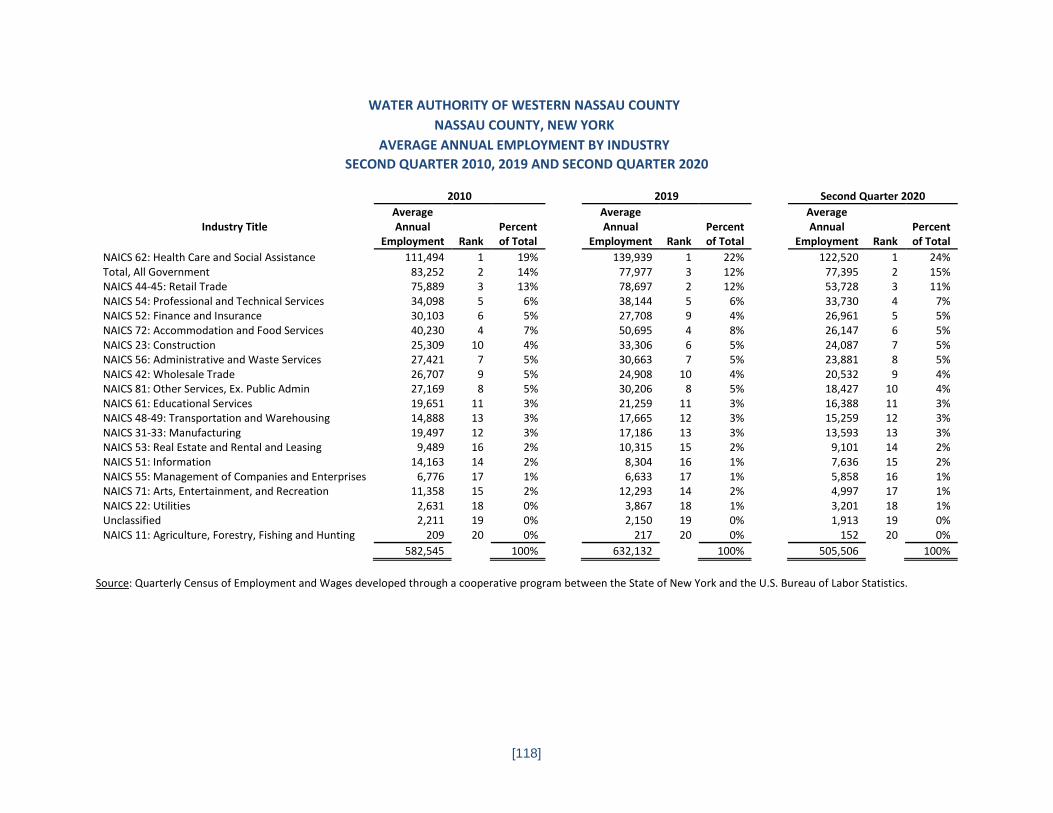
[118]
WATER AUTHORITY OF WESTERN NASSAU COUNTY
NASSAU COUNTY, NEW YORK
AVERAGE ANNUAL EMPLOYMENT BY INDUSTRY
SECOND QUARTER 2010, 2019 AND SECOND QUARTER 2020
2010 2019 Second Quarter 2020
Industry Title Average Annual
Employment Rank Percent of Total
Average Annual
Employment Rank Percent of Total
Average Annual
Employment Rank Percent of Total
NAICS 62: Health Care and Social Assistance 111,494 1 19% 139,939 1 22% 122,520 1 24% Total, All Government 83,252 2 14% 77,977 3 12% 77,395 2 15% NAICS 44-45: Retail Trade 75,889 3 13% 78,697 2 12% 53,728 3 11% NAICS 54: Professional and Technical Services 34,098 5 6% 38,144 5 6% 33,730 4 7% NAICS 52: Finance and Insurance 30,103 6 5% 27,708 9 4% 26,961 5 5% NAICS 72: Accommodation and Food Services 40,230 4 7% 50,695 4 8% 26,147 6 5% NAICS 23: Construction 25,309 10 4% 33,306 6 5% 24,087 7 5% NAICS 56: Administrative and Waste Services 27,421 7 5% 30,663 7 5% 23,881 8 5% NAICS 42: Wholesale Trade 26,707 9 5% 24,908 10 4% 20,532 9 4% NAICS 81: Other Services, Ex. Public Admin 27,169 8 5% 30,206 8 5% 18,427 10 4% NAICS 61: Educational Services 19,651 11 3% 21,259 11 3% 16,388 11 3% NAICS 48-49: Transportation and Warehousing 14,888 13 3% 17,665 12 3% 15,259 12 3% NAICS 31-33: Manufacturing 19,497 12 3% 17,186 13 3% 13,593 13 3% NAICS 53: Real Estate and Rental and Leasing 9,489 16 2% 10,315 15 2% 9,101 14 2% NAICS 51: Information 14,163 14 2% 8,304 16 1% 7,636 15 2% NAICS 55: Management of Companies and Enterprises 6,776 17 1% 6,633 17 1% 5,858 16 1% NAICS 71: Arts, Entertainment, and Recreation 11,358 15 2% 12,293 14 2% 4,997 17 1% NAICS 22: Utilities 2,631 18 0% 3,867 18 1% 3,201 18 1% Unclassified 2,211 19 0% 2,150 19 0% 1,913 19 0% NAICS 11: Agriculture, Forestry, Fishing and Hunting 209 20 0% 217 20 0% 152 20 0%
582,545 100% 632,132 100% 505,506 100%
Source: Quarterly Census of Employment and Wages developed through a cooperative program between the State of New York and the U.S. Bureau of Labor Statistics.
SECTION C: STATISTICAL SECTION
Operating Information

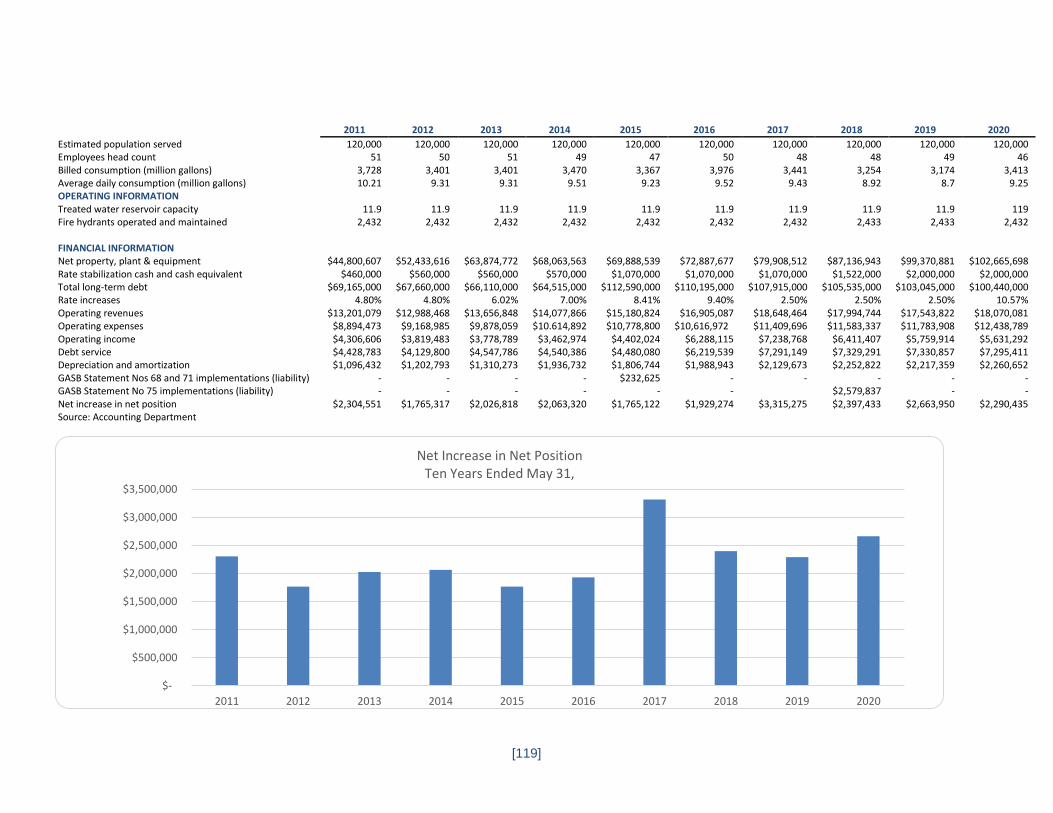
[119]
$-
$500,000
$1,000,000
$1,500,000
$2,000,000
$2,500,000
$3,000,000
$3,500,000
2011 2012 2013 2014 2015 2016 2017 2018 2019 2020
Net Increase in Net Position Ten Years Ended May 31,
2011 2012 2013 2014 2015 2016 2017 2018 2019 2020
Estimated population served 120,000 120,000 120,000 120,000 120,000 120,000 120,000 120,000 120,000 120,000 Employees head count 51 50 51 49 47 50 48 48 49 46 Billed consumption (million gallons) 3,728 3,401 3,401 3,470 3,367 3,976 3,441 3,254 3,174 3,413 Average daily consumption (million gallons) 10.21 9.31 9.31 9.51 9.23 9.52 9.43 8.92 8.7 9.25 OPERATING INFORMATION
Treated water reservoir capacity 11.9 11.9 11.9 11.9 11.9 11.9 11.9 11.9 11.9 119 Fire hydrants operated and maintained 2,432 2,432 2,432 2,432 2,432 2,432 2,432 2,433 2,433 2,432
FINANCIAL INFORMATION
Net property, plant & equipment $44,800,607 $52,433,616 $63,874,772 $68,063,563 $69,888,539 $72,887,677 $79,908,512 $87,136,943 $99,370,881 $102,665,698 Rate stabilization cash and cash equivalent $460,000 $560,000 $560,000 $570,000 $1,070,000 $1,070,000 $1,070,000 $1,522,000 $2,000,000 $2,000,000 Total long-term debt $69,165,000 $67,660,000 $66,110,000 $64,515,000 $112,590,000 $110,195,000 $107,915,000 $105,535,000 $103,045,000 $100,440,000 Rate increases 4.80% 4.80% 6.02% 7.00% 8.41% 9.40% 2.50% 2.50% 2.50% 10.57% Operating revenues $13,201,079 $12,988,468 $13,656,848 $14,077,866 $15,180,824 $16,905,087 $18,648,464 $17,994,744 $17,543,822 $18,070,081 Operating expenses $8,894,473 $9,168,985 $9,878,059 $10.614,892 $10,778,800 $10,616,972 $11,409,696 $11,583,337 $11,783,908 $12,438,789 Operating income $4,306,606 $3,819,483 $3,778,789 $3,462,974 $4,402,024 $6,288,115 $7,238,768 $6,411,407 $5,759,914 $5,631,292 Debt service $4,428,783 $4,129,800 $4,547,786 $4,540,386 $4,480,080 $6,219,539 $7,291,149 $7,329,291 $7,330,857 $7,295,411 Depreciation and amortization $1,096,432 $1,202,793 $1,310,273 $1,936,732 $1,806,744 $1,988,943 $2,129,673 $2,252,822 $2,217,359 $2,260,652 GASB Statement Nos 68 and 71 implementations (liability) - - - - $232,625 - - - - - GASB Statement No 75 implementations (liability) - - - - - - $2,579,837 - - Net increase in net position $2,304,551 $1,765,317 $2,026,818 $2,063,320 $1,765,122 $1,929,274 $3,315,275 $2,397,433 $2,663,950 $2,290,435 Source: Accounting Department
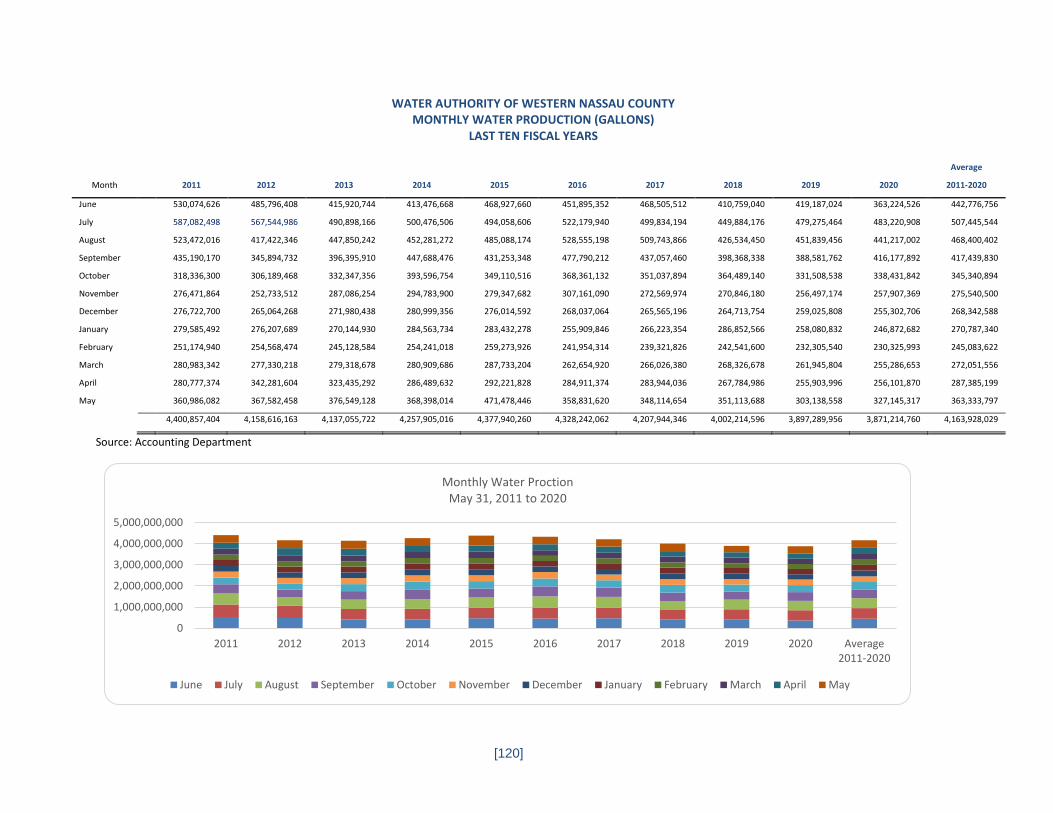
[120]
WATER AUTHORITY OF WESTERN NASSAU COUNTY MONTHLY WATER PRODUCTION (GALLONS) LAST TEN FISCAL YEARS
Average
Month 2011 2012 2013 2014 2015 2016 2017 2018 2019 2020 2011-2020
June 530,074,626 485,796,408 415,920,744 413,476,668 468,927,660 451,895,352 468,505,512 410,759,040 419,187,024 363,224,526 442,776,756
July 587,082,498 567,544,986 490,898,166 500,476,506 494,058,606 522,179,940 499,834,194 449,884,176 479,275,464 483,220,908 507,445,544
August 523,472,016 417,422,346 447,850,242 452,281,272 485,088,174 528,555,198 509,743,866 426,534,450 451,839,456 441,217,002 468,400,402
September 435,190,170 345,894,732 396,395,910 447,688,476 431,253,348 477,790,212 437,057,460 398,368,338 388,581,762 416,177,892 417,439,830
October 318,336,300 306,189,468 332,347,356 393,596,754 349,110,516 368,361,132 351,037,894 364,489,140 331,508,538 338,431,842 345,340,894
November 276,471,864 252,733,512 287,086,254 294,783,900 279,347,682 307,161,090 272,569,974 270,846,180 256,497,174 257,907,369 275,540,500
December 276,722,700 265,064,268 271,980,438 280,999,356 276,014,592 268,037,064 265,565,196 264,713,754 259,025,808 255,302,706 268,342,588
January 279,585,492 276,207,689 270,144,930 284,563,734 283,432,278 255,909,846 266,223,354 286,852,566 258,080,832 246,872,682 270,787,340
February 251,174,940 254,568,474 245,128,584 254,241,018 259,273,926 241,954,314 239,321,826 242,541,600 232,305,540 230,325,993 245,083,622
March 280,983,342 277,330,218 279,318,678 280,909,686 287,733,204 262,654,920 266,026,380 268,326,678 261,945,804 255,286,653 272,051,556
April 280,777,374 342,281,604 323,435,292 286,489,632 292,221,828 284,911,374 283,944,036 267,784,986 255,903,996 256,101,870 287,385,199
May 360,986,082 367,582,458 376,549,128 368,398,014 471,478,446 358,831,620 348,114,654 351,113,688 303,138,558 327,145,317 363,333,797
4,400,857,404 4,158,616,163 4,137,055,722 4,257,905,016 4,377,940,260 4,328,242,062 4,207,944,346 4,002,214,596 3,897,289,956 3,871,214,760 4,163,928,029
Source: Accounting Department
0
1,000,000,000
2,000,000,000
3,000,000,000
4,000,000,000
5,000,000,000
2011 2012 2013 2014 2015 2016 2017 2018 2019 2020 Average2011-2020
Monthly Water ProctionMay 31, 2011 to 2020
June July August September October November December January February March April May
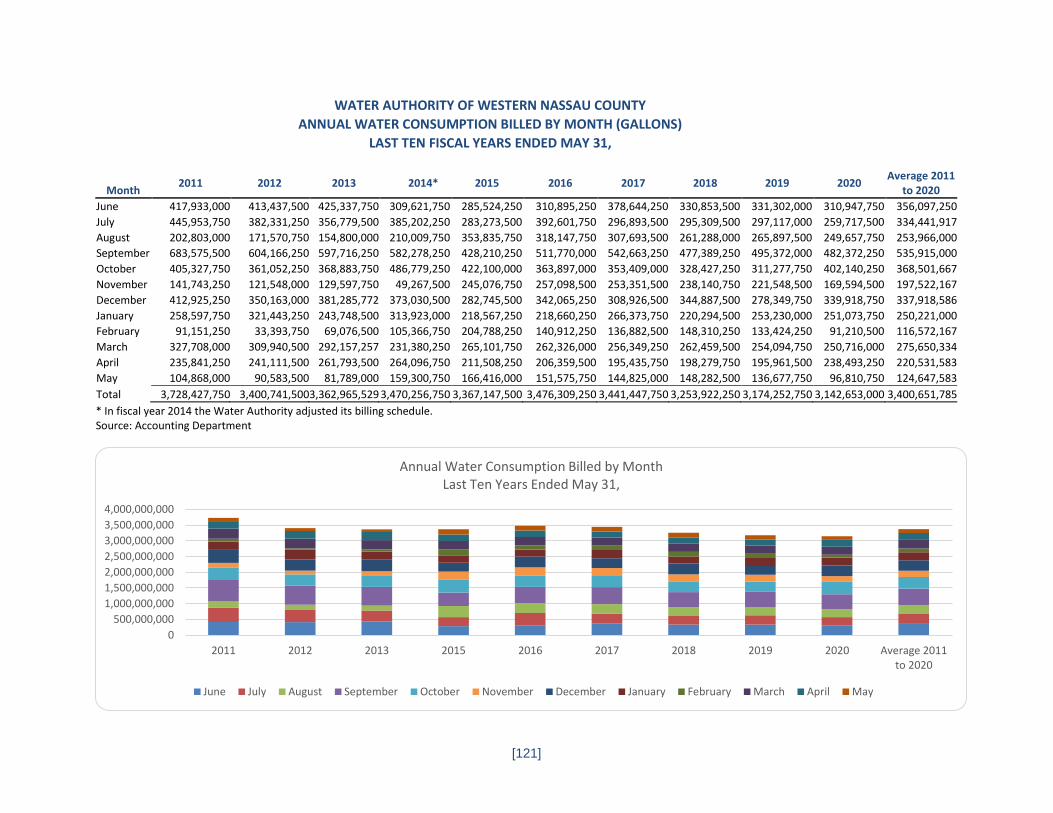
[121]
* In fiscal year 2014 the Water Authority adjusted its billing schedule. Source: Accounting Department
0
500,000,000
1,000,000,000
1,500,000,000
2,000,000,000
2,500,000,000
3,000,000,000
3,500,000,000
4,000,000,000
2011 2012 2013 2015 2016 2017 2018 2019 2020 Average 2011to 2020
Annual Water Consumption Billed by MonthLast Ten Years Ended May 31,
June July August September October November December January February March April May
WATER AUTHORITY OF WESTERN NASSAU COUNTY
ANNUAL WATER CONSUMPTION BILLED BY MONTH (GALLONS)
LAST TEN FISCAL YEARS ENDED MAY 31,
Month 2011 2012 2013 2014* 2015 2016 2017 2018 2019 2020
Average 2011 to 2020
June 417,933,000 413,437,500 425,337,750 309,621,750 285,524,250 310,895,250 378,644,250 330,853,500 331,302,000 310,947,750 356,097,250
July 445,953,750 382,331,250 356,779,500 385,202,250 283,273,500 392,601,750 296,893,500 295,309,500 297,117,000 259,717,500 334,441,917
August 202,803,000 171,570,750 154,800,000 210,009,750 353,835,750 318,147,750 307,693,500 261,288,000 265,897,500 249,657,750 253,966,000
September 683,575,500 604,166,250 597,716,250 582,278,250 428,210,250 511,770,000 542,663,250 477,389,250 495,372,000 482,372,250 535,915,000
October 405,327,750 361,052,250 368,883,750 486,779,250 422,100,000 363,897,000 353,409,000 328,427,250 311,277,750 402,140,250 368,501,667
November 141,743,250 121,548,000 129,597,750 49,267,500 245,076,750 257,098,500 253,351,500 238,140,750 221,548,500 169,594,500 197,522,167
December 412,925,250 350,163,000 381,285,772 373,030,500 282,745,500 342,065,250 308,926,500 344,887,500 278,349,750 339,918,750 337,918,586
January 258,597,750 321,443,250 243,748,500 313,923,000 218,567,250 218,660,250 266,373,750 220,294,500 253,230,000 251,073,750 250,221,000
February 91,151,250 33,393,750 69,076,500 105,366,750 204,788,250 140,912,250 136,882,500 148,310,250 133,424,250 91,210,500 116,572,167
March 327,708,000 309,940,500 292,157,257 231,380,250 265,101,750 262,326,000 256,349,250 262,459,500 254,094,750 250,716,000 275,650,334
April 235,841,250 241,111,500 261,793,500 264,096,750 211,508,250 206,359,500 195,435,750 198,279,750 195,961,500 238,493,250 220,531,583
May 104,868,000 90,583,500 81,789,000 159,300,750 166,416,000 151,575,750 144,825,000 148,282,500 136,677,750 96,810,750 124,647,583
Total 3,728,427,750 3,400,741,500 3,362,965,529 3,470,256,750 3,367,147,500 3,476,309,250 3,441,447,750 3,253,922,250 3,174,252,750 3,142,653,000 3,400,651,785
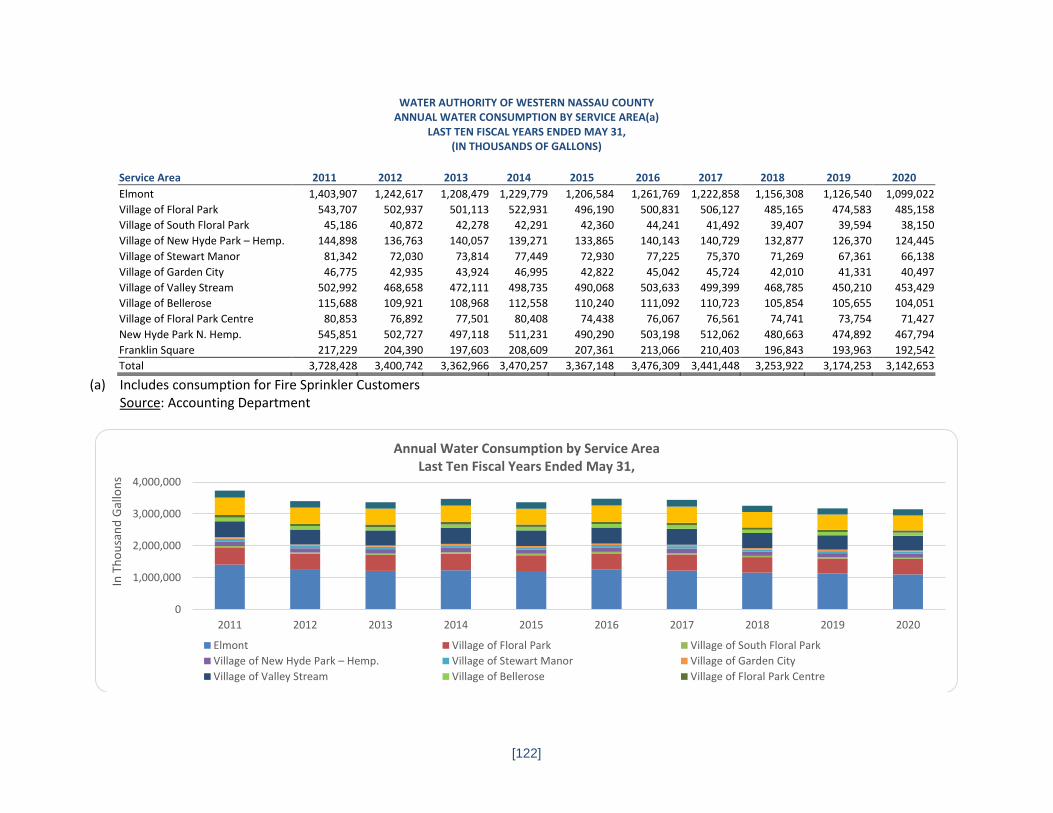
[122]
WATER AUTHORITY OF WESTERN NASSAU COUNTY ANNUAL WATER CONSUMPTION BY SERVICE AREA(a)
LAST TEN FISCAL YEARS ENDED MAY 31, (IN THOUSANDS OF GALLONS)
Service Area 2011 2012 2013 2014 2015 2016 2017 2018 2019 2020
Elmont 1,403,907 1,242,617 1,208,479 1,229,779 1,206,584 1,261,769 1,222,858 1,156,308 1,126,540 1,099,022
Village of Floral Park 543,707 502,937 501,113 522,931 496,190 500,831 506,127 485,165 474,583 485,158
Village of South Floral Park 45,186 40,872 42,278 42,291 42,360 44,241 41,492 39,407 39,594 38,150
Village of New Hyde Park – Hemp. 144,898 136,763 140,057 139,271 133,865 140,143 140,729 132,877 126,370 124,445
Village of Stewart Manor 81,342 72,030 73,814 77,449 72,930 77,225 75,370 71,269 67,361 66,138
Village of Garden City 46,775 42,935 43,924 46,995 42,822 45,042 45,724 42,010 41,331 40,497
Village of Valley Stream 502,992 468,658 472,111 498,735 490,068 503,633 499,399 468,785 450,210 453,429
Village of Bellerose 115,688 109,921 108,968 112,558 110,240 111,092 110,723 105,854 105,655 104,051
Village of Floral Park Centre 80,853 76,892 77,501 80,408 74,438 76,067 76,561 74,741 73,754 71,427
New Hyde Park N. Hemp. 545,851 502,727 497,118 511,231 490,290 503,198 512,062 480,663 474,892 467,794
Franklin Square 217,229 204,390 197,603 208,609 207,361 213,066 210,403 196,843 193,963 192,542
Total 3,728,428 3,400,742 3,362,966 3,470,257 3,367,148 3,476,309 3,441,448 3,253,922 3,174,253 3,142,653
(a) Includes consumption for Fire Sprinkler Customers Source: Accounting Department
0
1,000,000
2,000,000
3,000,000
4,000,000
2011 2012 2013 2014 2015 2016 2017 2018 2019 2020
In T
ho
usa
nd
Gal
lon
s
Annual Water Consumption by Service AreaLast Ten Fiscal Years Ended May 31,
Elmont Village of Floral Park Village of South Floral Park
Village of New Hyde Park – Hemp. Village of Stewart Manor Village of Garden City
Village of Valley Stream Village of Bellerose Village of Floral Park Centre
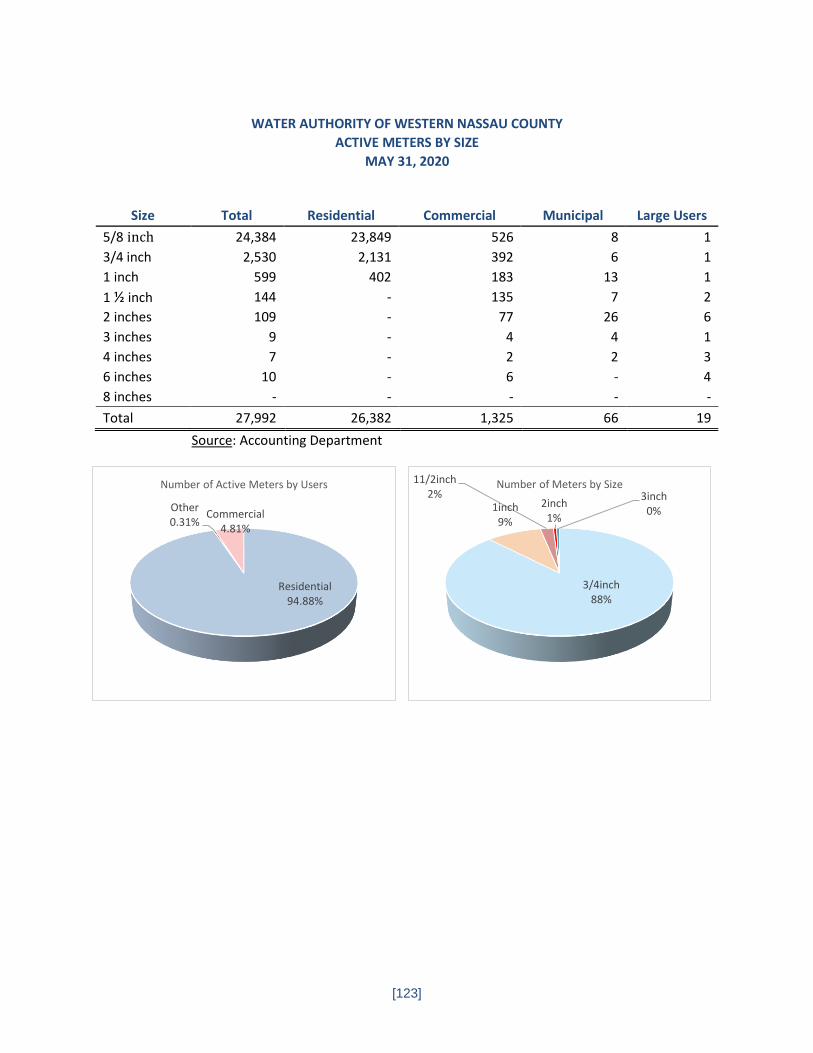
[123]
WATER AUTHORITY OF WESTERN NASSAU COUNTY
ACTIVE METERS BY SIZE
MAY 31, 2020
Size Total Residential Commercial Municipal Large Users
5/8 inch 24,384 23,849 526 8 1
3/4 inch 2,530 2,131 392 6 1
1 inch 599 402 183 13 1
1 ½ inch 144 - 135 7 2
2 inches 109 - 77 26 6
3 inches 9 - 4 4 1
4 inches 7 - 2 2 3
6 inches 10 - 6 - 4
8 inches - - - - -
Total 27,992 26,382 1,325 66 19
Source: Accounting Department
3/4inch88%
1inch9%
11/2inch2%
2inch1%
3inch0%
Number of Meters by Size
Residential94.88%
Other0.31%
Commercial4.81%
Number of Active Meters by Users
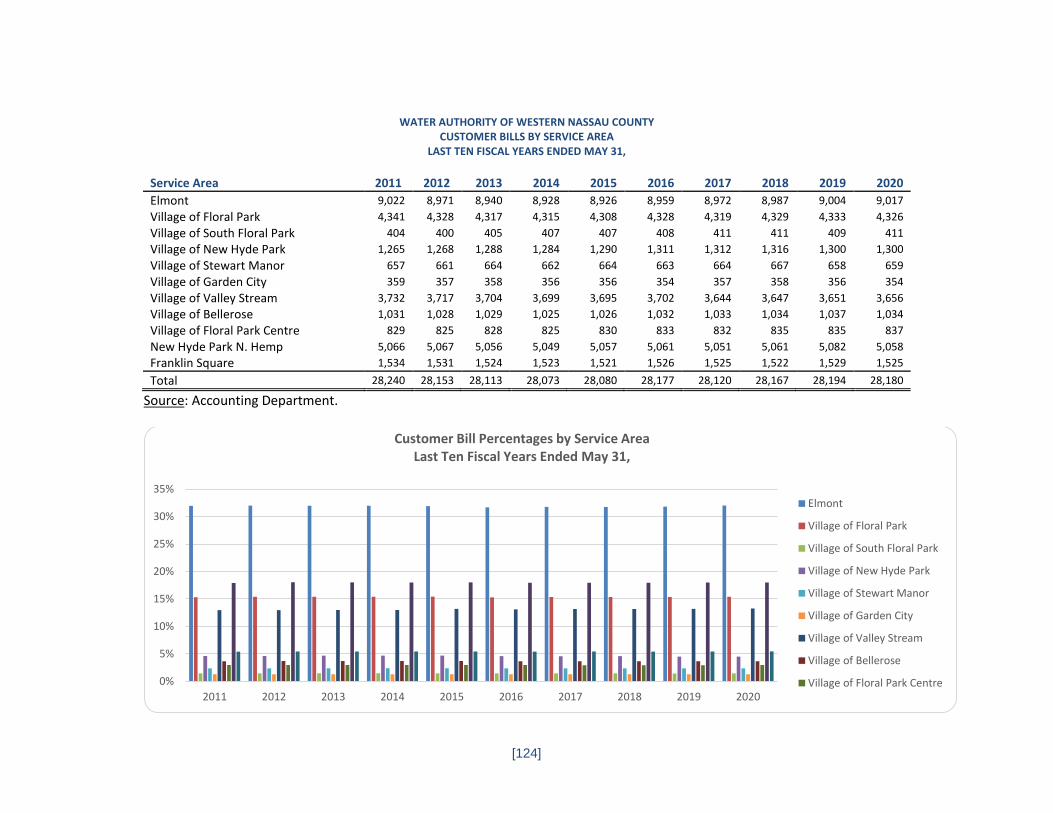
[124]
WATER AUTHORITY OF WESTERN NASSAU COUNTY
CUSTOMER BILLS BY SERVICE AREA LAST TEN FISCAL YEARS ENDED MAY 31,
Service Area 2011 2012 2013 2014 2015 2016 2017 2018 2019 2020
Elmont 9,022 8,971 8,940 8,928 8,926 8,959 8,972 8,987 9,004 9,017
Village of Floral Park 4,341 4,328 4,317 4,315 4,308 4,328 4,319 4,329 4,333 4,326
Village of South Floral Park 404 400 405 407 407 408 411 411 409 411
Village of New Hyde Park 1,265 1,268 1,288 1,284 1,290 1,311 1,312 1,316 1,300 1,300
Village of Stewart Manor 657 661 664 662 664 663 664 667 658 659
Village of Garden City 359 357 358 356 356 354 357 358 356 354
Village of Valley Stream 3,732 3,717 3,704 3,699 3,695 3,702 3,644 3,647 3,651 3,656
Village of Bellerose 1,031 1,028 1,029 1,025 1,026 1,032 1,033 1,034 1,037 1,034
Village of Floral Park Centre 829 825 828 825 830 833 832 835 835 837
New Hyde Park N. Hemp 5,066 5,067 5,056 5,049 5,057 5,061 5,051 5,061 5,082 5,058
Franklin Square 1,534 1,531 1,524 1,523 1,521 1,526 1,525 1,522 1,529 1,525
Total 28,240 28,153 28,113 28,073 28,080 28,177 28,120 28,167 28,194 28,180
Source: Accounting Department.
0%
5%
10%
15%
20%
25%
30%
35%
2011 2012 2013 2014 2015 2016 2017 2018 2019 2020
Customer Bill Percentages by Service AreaLast Ten Fiscal Years Ended May 31,
Elmont
Village of Floral Park
Village of South Floral Park
Village of New Hyde Park
Village of Stewart Manor
Village of Garden City
Village of Valley Stream
Village of Bellerose
Village of Floral Park Centre
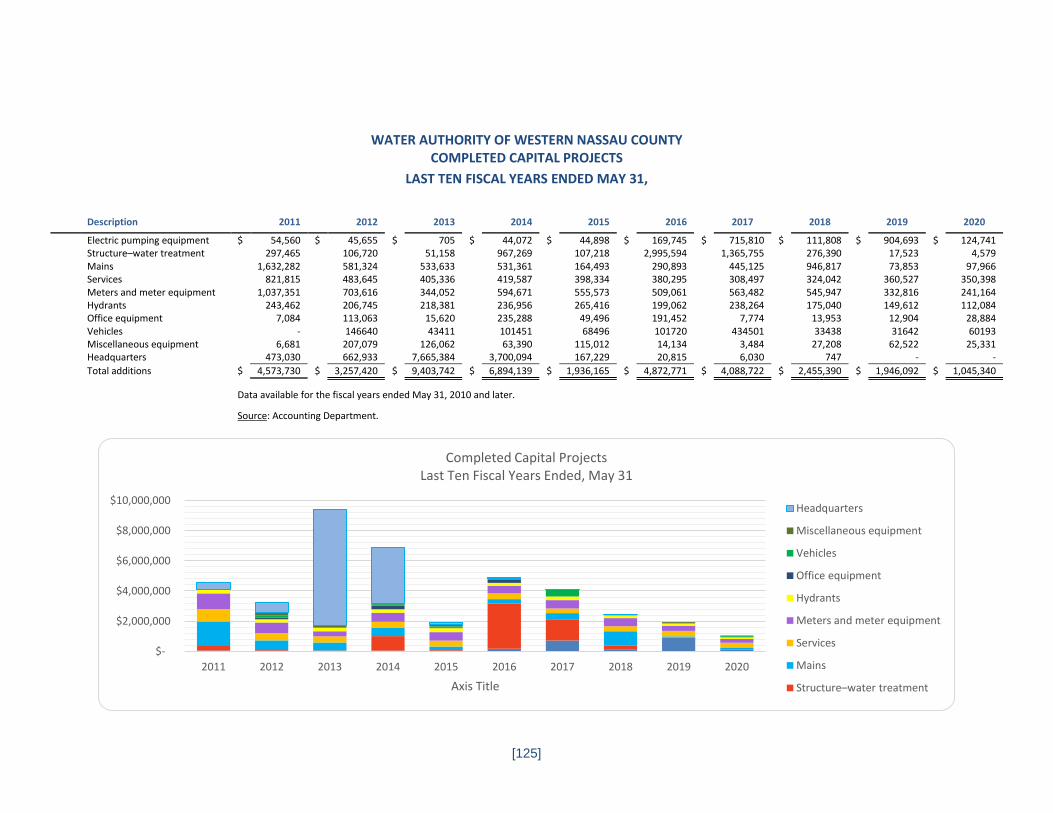
[125]
WATER AUTHORITY OF WESTERN NASSAU COUNTY
COMPLETED CAPITAL PROJECTS
LAST TEN FISCAL YEARS ENDED MAY 31,
Description 2011 2012 2013 2014 2015 2016 2017 2018 2019 2020
Electric pumping equipment $ 54,560 $ 45,655 $ 705 $ 44,072 $ 44,898 $ 169,745 $ 715,810 $ 111,808 $ 904,693 $ 124,741 Structure–water treatment 297,465 106,720 51,158 967,269 107,218 2,995,594 1,365,755 276,390 17,523 4,579 Mains 1,632,282 581,324 533,633 531,361 164,493 290,893 445,125 946,817 73,853 97,966 Services 821,815 483,645 405,336 419,587 398,334 380,295 308,497 324,042 360,527 350,398 Meters and meter equipment 1,037,351 703,616 344,052 594,671 555,573 509,061 563,482 545,947 332,816 241,164 Hydrants 243,462 206,745 218,381 236,956 265,416 199,062 238,264 175,040 149,612 112,084 Office equipment 7,084 113,063 15,620 235,288 49,496 191,452 7,774 13,953 12,904 28,884 Vehicles - 146640 43411 101451 68496 101720 434501 33438 31642 60193 Miscellaneous equipment 6,681 207,079 126,062 63,390 115,012 14,134 3,484 27,208 62,522 25,331 Headquarters 473,030 662,933 7,665,384 3,700,094 167,229 20,815 6,030 747 - -
Total additions $ 4,573,730 $ 3,257,420 $ 9,403,742 $ 6,894,139 $ 1,936,165 $ 4,872,771 $ 4,088,722 $ 2,455,390 $ 1,946,092 $ 1,045,340
Data available for the fiscal years ended May 31, 2010 and later.
Source: Accounting Department.
$-
$2,000,000
$4,000,000
$6,000,000
$8,000,000
$10,000,000
2011 2012 2013 2014 2015 2016 2017 2018 2019 2020
Axis Title
Completed Capital ProjectsLast Ten Fiscal Years Ended, May 31
Headquarters
Miscellaneous equipment
Vehicles
Office equipment
Hydrants
Meters and meter equipment
Services
Mains
Structure–water treatment
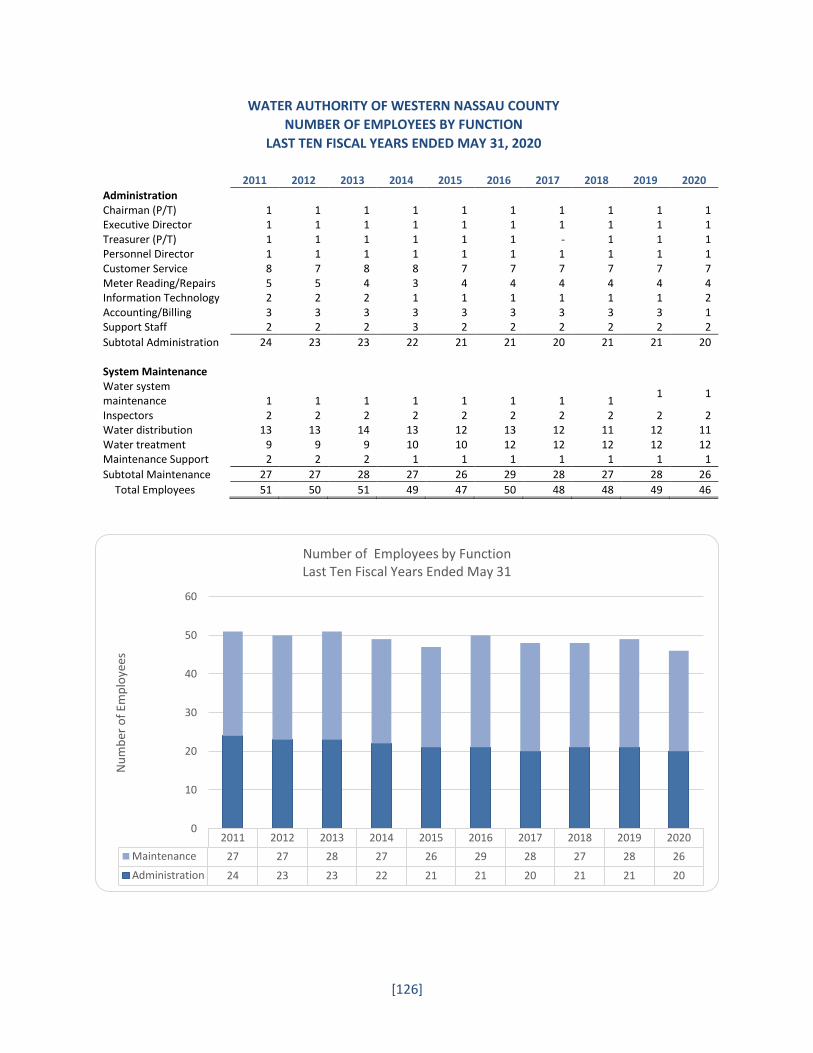
[126]
WATER AUTHORITY OF WESTERN NASSAU COUNTY
NUMBER OF EMPLOYEES BY FUNCTION
LAST TEN FISCAL YEARS ENDED MAY 31, 2020
2011 2012 2013 2014 2015 2016 2017 2018 2019 2020
Administration Chairman (P/T) 1 1 1 1 1 1 1 1 1 1 Executive Director 1 1 1 1 1 1 1 1 1 1 Treasurer (P/T) 1 1 1 1 1 1 - 1 1 1 Personnel Director 1 1 1 1 1 1 1 1 1 1 Customer Service 8 7 8 8 7 7 7 7 7 7 Meter Reading/Repairs 5 5 4 3 4 4 4 4 4 4 Information Technology 2 2 2 1 1 1 1 1 1 2 Accounting/Billing 3 3 3 3 3 3 3 3 3 1 Support Staff 2 2 2 3 2 2 2 2 2 2
Subtotal Administration 24 23 23 22 21 21 20 21 21 20
System Maintenance Water system maintenance 1 1 1 1 1 1 1 1
1 1
Inspectors 2 2 2 2 2 2 2 2 2 2 Water distribution 13 13 14 13 12 13 12 11 12 11 Water treatment 9 9 9 10 10 12 12 12 12 12 Maintenance Support 2 2 2 1 1 1 1 1 1 1
Subtotal Maintenance 27 27 28 27 26 29 28 27 28 26
Total Employees 51 50 51 49 47 50 48 48 49 46
2011 2012 2013 2014 2015 2016 2017 2018 2019 2020
Maintenance 27 27 28 27 26 29 28 27 28 26
Administration 24 23 23 22 21 21 20 21 21 20
0
10
20
30
40
50
60
Nu
mb
er o
f Em
plo
yees
Number of Employees by FunctionLast Ten Fiscal Years Ended May 31
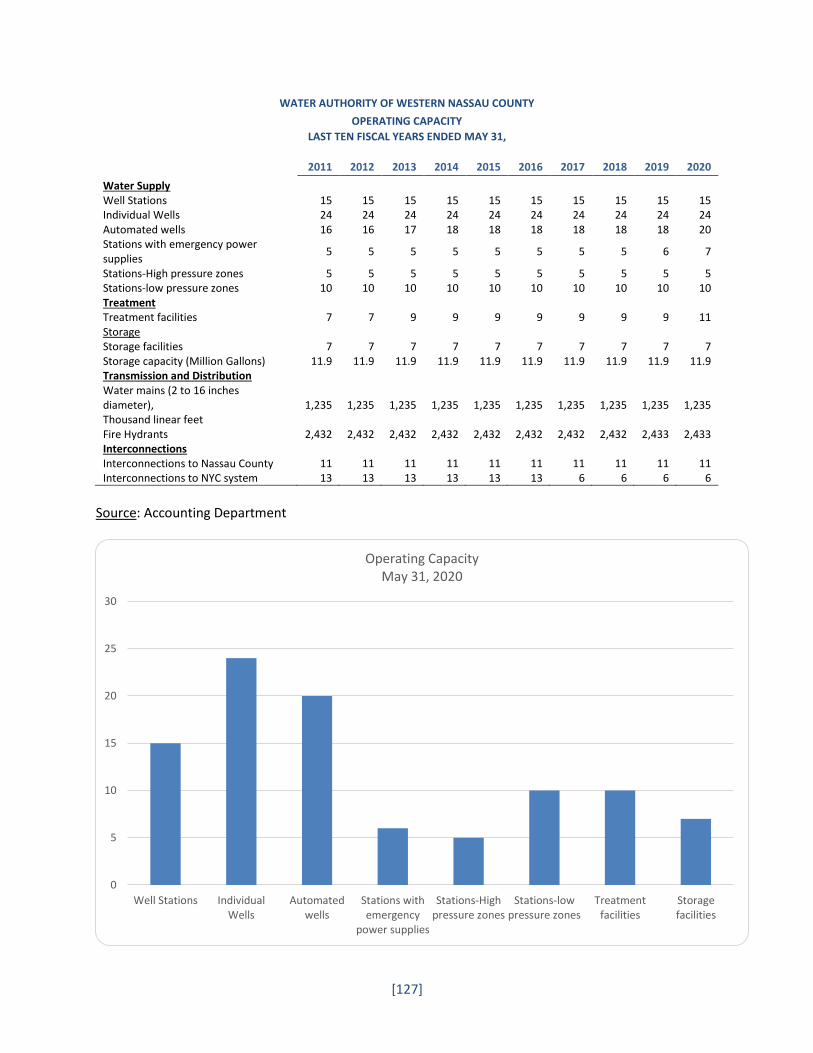
[127]
WATER AUTHORITY OF WESTERN NASSAU COUNTY
OPERATING CAPACITY
LAST TEN FISCAL YEARS ENDED MAY 31,
2011 2012 2013 2014 2015 2016 2017 2018 2019 2020
Water Supply
Well Stations 15 15 15 15 15 15 15 15 15 15 Individual Wells 24 24 24 24 24 24 24 24 24 24 Automated wells 16 16 17 18 18 18 18 18 18 20 Stations with emergency power supplies
5 5 5 5 5 5 5 5 6 7
Stations-High pressure zones 5 5 5 5 5 5 5 5 5 5 Stations-low pressure zones 10 10 10 10 10 10 10 10 10 10 Treatment
Treatment facilities 7 7 9 9 9 9 9 9 9 11 Storage
Storage facilities 7 7 7 7 7 7 7 7 7 7 Storage capacity (Million Gallons) 11.9 11.9 11.9 11.9 11.9 11.9 11.9 11.9 11.9 11.9 Transmission and Distribution
Water mains (2 to 16 inches diameter), Thousand linear feet
1,235 1,235 1,235 1,235 1,235 1,235 1,235 1,235 1,235 1,235
Fire Hydrants 2,432 2,432 2,432 2,432 2,432 2,432 2,432 2,432 2,433 2,433 Interconnections
Interconnections to Nassau County 11 11 11 11 11 11 11 11 11 11 Interconnections to NYC system 13 13 13 13 13 13 6 6 6 6
Source: Accounting Department
0
5
10
15
20
25
30
Well Stations IndividualWells
Automatedwells
Stations withemergency
power supplies
Stations-Highpressure zones
Stations-lowpressure zones
Treatmentfacilities
Storagefacilities
Operating CapacityMay 31, 2020
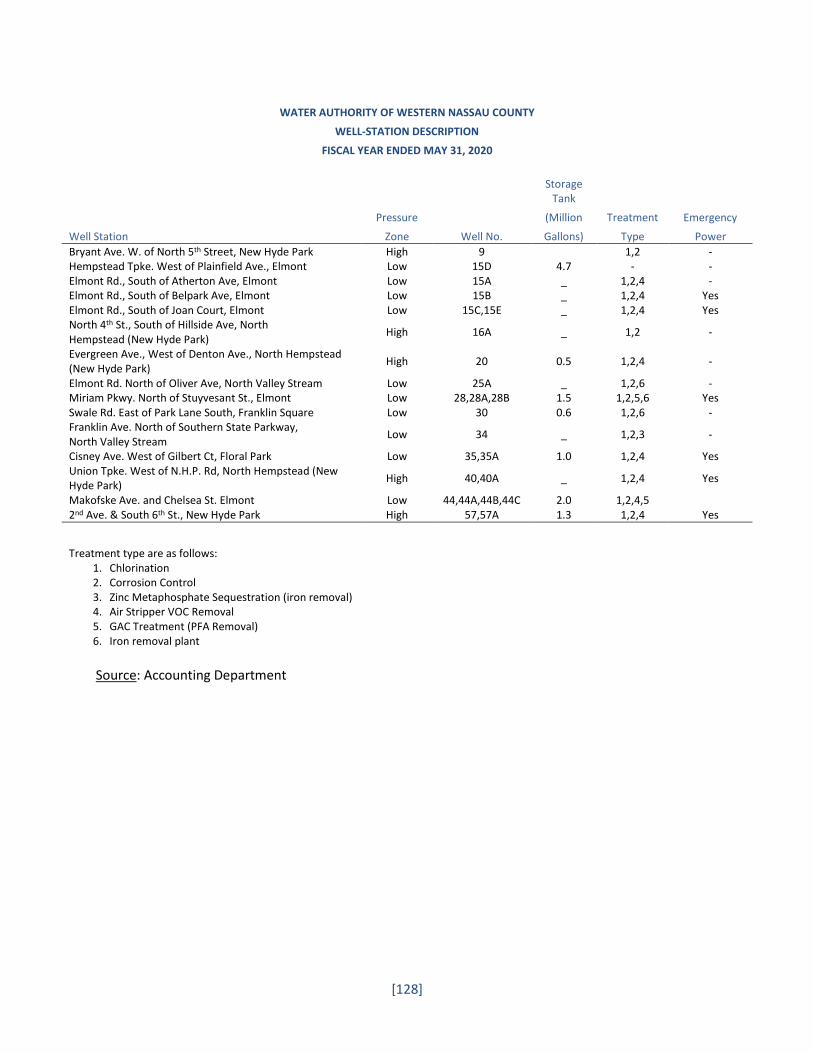
[128]
WATER AUTHORITY OF WESTERN NASSAU COUNTY
WELL-STATION DESCRIPTION
FISCAL YEAR ENDED MAY 31, 2020
Storage
Tank
Pressure (Million Treatment Emergency
Well Station Zone Well No. Gallons) Type Power
Bryant Ave. W. of North 5th Street, New Hyde Park High 9 1,2 - Hempstead Tpke. West of Plainfield Ave., Elmont Low 15D 4.7 - - Elmont Rd., South of Atherton Ave, Elmont Low 15A _ 1,2,4 - Elmont Rd., South of Belpark Ave, Elmont Low 15B _ 1,2,4 Yes Elmont Rd., South of Joan Court, Elmont Low 15C,15E _ 1,2,4 Yes North 4th St., South of Hillside Ave, North Hempstead (New Hyde Park)
High 16A _ 1,2 -
Evergreen Ave., West of Denton Ave., North Hempstead (New Hyde Park)
High 20 0.5 1,2,4 -
Elmont Rd. North of Oliver Ave, North Valley Stream Low 25A _ 1,2,6 - Miriam Pkwy. North of Stuyvesant St., Elmont Low 28,28A,28B 1.5 1,2,5,6 Yes Swale Rd. East of Park Lane South, Franklin Square Low 30 0.6 1,2,6 - Franklin Ave. North of Southern State Parkway, North Valley Stream
Low 34 _ 1,2,3 -
Cisney Ave. West of Gilbert Ct, Floral Park Low 35,35A 1.0 1,2,4 Yes Union Tpke. West of N.H.P. Rd, North Hempstead (New Hyde Park)
High 40,40A _ 1,2,4 Yes
Makofske Ave. and Chelsea St. Elmont Low 44,44A,44B,44C 2.0 1,2,4,5 2nd Ave. & South 6th St., New Hyde Park High 57,57A 1.3 1,2,4 Yes
Treatment type are as follows: 1. Chlorination 2. Corrosion Control 3. Zinc Metaphosphate Sequestration (iron removal) 4. Air Stripper VOC Removal 5. GAC Treatment (PFA Removal) 6. Iron removal plant Source: Accounting Department
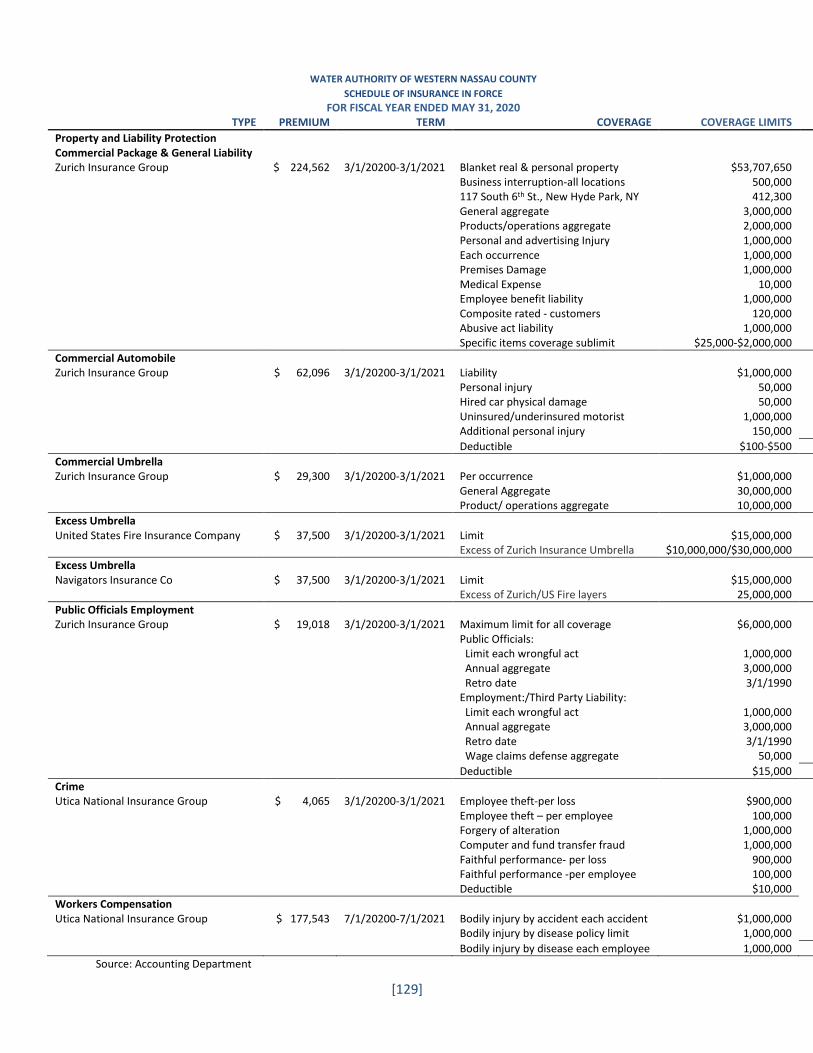
[129]
WATER AUTHORITY OF WESTERN NASSAU COUNTY SCHEDULE OF INSURANCE IN FORCE
FOR FISCAL YEAR ENDED MAY 31, 2020 TYPE PREMIUM TERM COVERAGE COVERAGE LIMITS
Property and Liability Protection Commercial Package & General Liability Zurich Insurance Group $ 224,562 3/1/20200-3/1/2021 Blanket real & personal property $53,707,650
Business interruption-all locations 500,000 117 South 6th St., New Hyde Park, NY 412,300
General aggregate 3,000,000
Products/operations aggregate 2,000,000
Personal and advertising Injury 1,000,000
Each occurrence 1,000,000
Premises Damage 1,000,000
Medical Expense 10,000
Employee benefit liability 1,000,000
Composite rated - customers 120,000
Abusive act liability 1,000,000 Specific items coverage sublimit $25,000-$2,000,000
Commercial Automobile Zurich Insurance Group $ 62,096 3/1/20200-3/1/2021 Liability $1,000,000 Personal injury 50,000 Hired car physical damage 50,000 Uninsured/underinsured motorist 1,000,000 Additional personal injury 150,000
Deductible $100-$500
Commercial Umbrella Zurich Insurance Group $ 29,300 3/1/20200-3/1/2021 Per occurrence $1,000,000
General Aggregate 30,000,000
Product/ operations aggregate 10,000,000
Excess Umbrella United States Fire Insurance Company $ 37,500 3/1/20200-3/1/2021 Limit $15,000,000
Excess of Zurich Insurance Umbrella $10,000,000/$30,000,000
Excess Umbrella Navigators Insurance Co $ 37,500 3/1/20200-3/1/2021 Limit $15,000,000
Excess of Zurich/US Fire layers 25,000,000
Public Officials Employment Zurich Insurance Group $ 19,018 3/1/20200-3/1/2021 Maximum limit for all coverage $6,000,000
Public Officials:
Limit each wrongful act 1,000,000
Annual aggregate 3,000,000
Retro date 3/1/1990
Employment:/Third Party Liability:
Limit each wrongful act 1,000,000
Annual aggregate 3,000,000
Retro date 3/1/1990
Wage claims defense aggregate 50,000
Deductible $15,000
Crime Utica National Insurance Group $ 4,065 3/1/20200-3/1/2021 Employee theft-per loss $900,000
Employee theft – per employee 100,000
Forgery of alteration 1,000,000 Computer and fund transfer fraud 1,000,000 Faithful performance- per loss 900,000 Faithful performance -per employee 100,000 Deductible $10,000
Workers Compensation Utica National Insurance Group $ 177,543 7/1/20200-7/1/2021 Bodily injury by accident each accident $1,000,000 Bodily injury by disease policy limit 1,000,000
Bodily injury by disease each employee 1,000,000
Source: Accounting Department

[130]
THIS PAGE INTENTIONALLY LEFT BLANK
SECTION D: COMPLIANCE SECTION

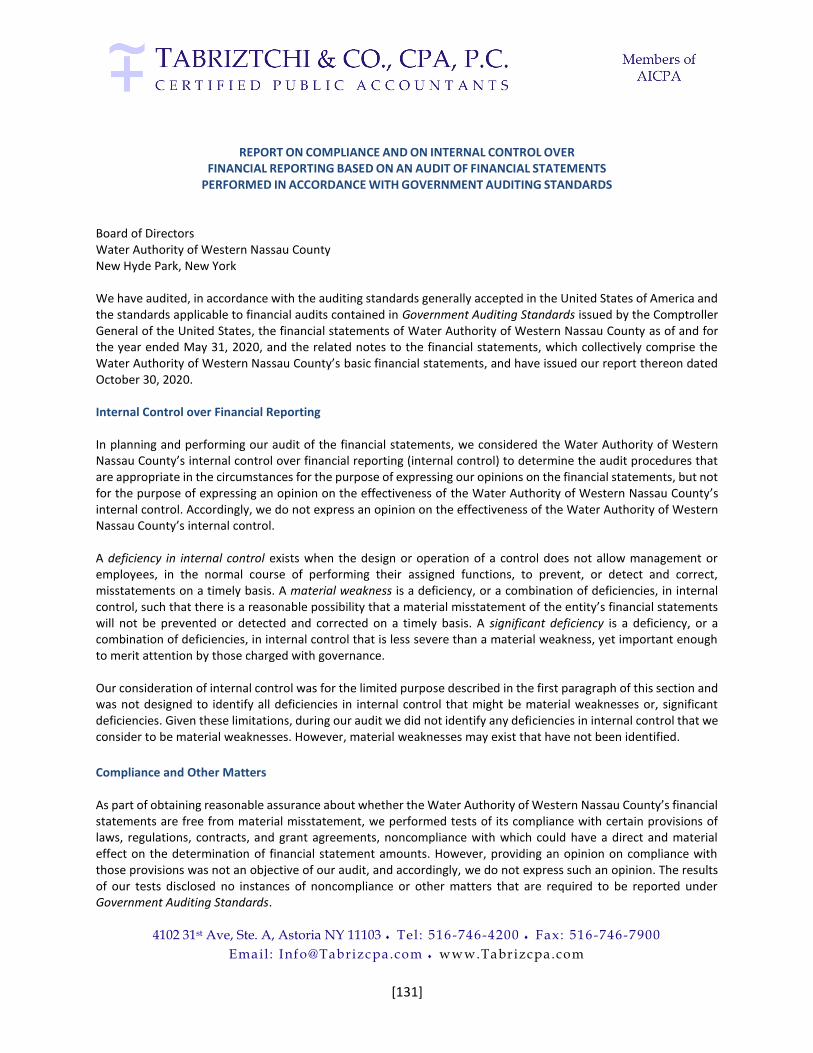
4102 31st Ave, Ste. A, Astoria NY 11103 Tel : 516-746-4200 Fax: 516-746-7900
Email : [email protected] www.Tabrizcpa.com
[131]
REPORT ON COMPLIANCE AND ON INTERNAL CONTROL OVER
FINANCIAL REPORTING BASED ON AN AUDIT OF FINANCIAL STATEMENTS PERFORMED IN ACCORDANCE WITH GOVERNMENT AUDITING STANDARDS
Board of Directors Water Authority of Western Nassau County New Hyde Park, New York We have audited, in accordance with the auditing standards generally accepted in the United States of America and the standards applicable to financial audits contained in Government Auditing Standards issued by the Comptroller General of the United States, the financial statements of Water Authority of Western Nassau County as of and for the year ended May 31, 2020, and the related notes to the financial statements, which collectively comprise the Water Authority of Western Nassau County’s basic financial statements, and have issued our report thereon dated October 30, 2020. Internal Control over Financial Reporting In planning and performing our audit of the financial statements, we considered the Water Authority of Western Nassau County’s internal control over financial reporting (internal control) to determine the audit procedures that are appropriate in the circumstances for the purpose of expressing our opinions on the financial statements, but not for the purpose of expressing an opinion on the effectiveness of the Water Authority of Western Nassau County’s internal control. Accordingly, we do not express an opinion on the effectiveness of the Water Authority of Western Nassau County’s internal control. A deficiency in internal control exists when the design or operation of a control does not allow management or employees, in the normal course of performing their assigned functions, to prevent, or detect and correct, misstatements on a timely basis. A material weakness is a deficiency, or a combination of deficiencies, in internal control, such that there is a reasonable possibility that a material misstatement of the entity’s financial statements will not be prevented or detected and corrected on a timely basis. A significant deficiency is a deficiency, or a combination of deficiencies, in internal control that is less severe than a material weakness, yet important enough to merit attention by those charged with governance. Our consideration of internal control was for the limited purpose described in the first paragraph of this section and was not designed to identify all deficiencies in internal control that might be material weaknesses or, significant deficiencies. Given these limitations, during our audit we did not identify any deficiencies in internal control that we consider to be material weaknesses. However, material weaknesses may exist that have not been identified.
Compliance and Other Matters As part of obtaining reasonable assurance about whether the Water Authority of Western Nassau County’s financial statements are free from material misstatement, we performed tests of its compliance with certain provisions of laws, regulations, contracts, and grant agreements, noncompliance with which could have a direct and material effect on the determination of financial statement amounts. However, providing an opinion on compliance with those provisions was not an objective of our audit, and accordingly, we do not express such an opinion. The results of our tests disclosed no instances of noncompliance or other matters that are required to be reported under Government Auditing Standards.
[132]
Purpose of this Report The purpose of this report is solely to describe the scope of our testing of internal control and compliance and the results of that testing, and not to provide an opinion on the effectiveness of the entity’s internal control or on compliance. This report is an integral part of an audit performed in accordance with Government Auditing Standards in considering the entity’s internal control and compliance. Accordingly, this communication is not suitable for any other purpose.
Astoria, NY October 30, 2020