Fiscal Dimensions of Armed Conflict in Low and Middle-Income Countries
21
International Monetary Fund Fiscal Affairs Department Fiscal Dimensions of Armed Conflict in Low- and Middle-Income Countries* Prepared by Sanjeev Gupta, Benedict Clements, Rina Bhattacharya, and Shamit Chakravarti** _________________________ * Paper prepared for the Workshop on “The Economic Consequences of Global Terrorism,” June 14–15, 2002. ** The authors would like to thank Hamid Davoodi for useful comments and suggestions. The views expressed in this paper are those of the authors and do not necessarily represent those of the IMF or IMF policy.
-
Upload
independent -
Category
Documents
-
view
2 -
download
0
Transcript of Fiscal Dimensions of Armed Conflict in Low and Middle-Income Countries
International Monetary Fund
Fiscal Affairs Department
Fiscal Dimensions of Armed Conflict in Low- and Middle-Income Countries*
Prepared by Sanjeev Gupta, Benedict Clements, Rina Bhattacharya, andShamit Chakravarti**
_________________________* Paper prepared for the Workshop on “The Economic Consequences of Global Terrorism,” June 14–15, 2002.
** The authors would like to thank Hamid Davoodi for useful comments and suggestions. The views expressedin this paper are those of the authors and do not necessarily represent those of the IMF or IMF policy.
- 2 -
I. INTRODUCTION
Armed conflict can have important consequences for both government revenues andexpenditures of a country. These fiscal consequences, in turn, can have repercussions oneconomic growth, both in the short run and over the medium and long term. For example,armed conflict may encourage higher defense expenditures at the expense of lower publicspending in socially and economically productive sectors, such as basic health and educationservices and infrastructure. Moreover, the potential channels through which armed conflictcan affect economic activity are many, varied and usually interlinked: they includeinvestment, the nation’s infrastructure, trade volumes, and (as mentioned above) the fiscalaccounts. This paper analyses the fiscal repercussions of armed conflict and, in turn,examines how these fiscal effects can indirectly affect economic growth for a sample of lowand middle-income economies.
A number of empirical studies have assessed the impact of socio-political instability in acountry on investment and on growth, both in developing and in advanced countries, mostlyusing cross-section analysis of country-level data (see for example Veneiris and Gupta(1986), Barro (1991), Alesina and Perotti (1996), Alesina et al. (1996), and Rodrik (1999)).However, there are relatively few studies that examine the economic effects of an armedconflict per se on a country. Moreover, as Abadie and Gardeazabal (2001) point out, anotherpotential shortcoming of studies based on country-level data is that conflicts in differentcountries may be radically different in nature; such heterogeneity may create problems whencomparing the experiences of different countries and interpreting the results.
Some studies have empirically assessed the impact of terrorism on tourism, both domesticand regional, and have found the expected negative effect (Drakos and Kutan (2001), Endersand Sandler (1991), and Enders, Sandler and Parise (1992)). For example, in a study coveringGreece, Israel and Turkey, and using Italy as a ‘control variable’, Drakos and Kutan (2001)find that the intensity of casualties from terrorist incidents has significant own and cross-country effects on the market shares of the affected countries, and that there are significantcontagion effects from terrorism in the region. However, these studies limit their focus to onesector of the economy and do not consider the impact of terrorism on the economy as awhole.
Ndikumana (2001) seeks to remedy this. He studies fiscal policy and armed conflict in twoAfrican countries in the 1990s and the interactions between fiscal and other economicaggregates. However, the study limits its analysis to the two countries, and does not directlyquantify the impact of armed conflict on growth or on the public finances. Addison andMurshed (2001) do a similar type of analysis but for a larger number of countries, mostly inAfrica, and discuss also the important role of fiscal institutions, and possibly fiscal reform, inensuring a broad-based and sustainable economic reconstruction following the end of aperiod of armed conflict.
- 3 -
One study that does assess the effect of armed conflict or terrorism on the economy as awhole is Abadie and Gardeazabal (2001). This study uses a combination of regions in Spainto construct a ‘synthetic’ region, which resembles many relevant economic characteristics ofthe Basque area before the outset of terrorism in the 1970s. The subsequent economicevolution of this ‘counterfactual’ region without terrorism is compared to the actualexperience of the Basque region. They find that, after the outbreak of terrorism, per capitaGDP in the Basque region declined by about 10 percentage points relative to the syntheticregion, and that this gap seemed to widen in response to spikes in terrorist activity.Arunatilake, Jayasuriya and Kelegama (2000) provide another case study of the economiccosts of armed conflict in Sri Lanka, and find that the cost since 1983 may be at leastequivalent to twice the country’s 1996 GDP.
This study aims to add to the literature by providing a cross-country examination of the fiscaleffects of armed conflict. The following section lays out the channels through which armedconflict can have an impact on the fiscal accounts, both directly and indirectly, and at thelinks between armed conflict and economic variables. Section III discusses methodologicalissues related to the empirical analysis presented in the paper. Section IV presents anassessment of 22 episodes of armed conflicts in a number of lower- and middle-incomecountries. This involves an examination of various macroeconomic and fiscal variables andsocio-economic indicators during conflict periods and in the years immediately precedingand following these conflicts. Section V presents and estimates an integrated system ofequations for real per capita income growth, government revenue and government spending,and uses the results to examine the main channels through which armed conflict affects thefiscal accounts. Section VI concludes.
II. FISCAL EFFECTS OF ARMED CONFLICT: POTENTIAL CHANNELS
Armed conflict can affect the fiscal accounts through its impact on both revenues and publicexpenditures. One way in which conflict adversely affects government receipts is through itsimpact on real economic activity. In most countries, tax receipts vary with the health of theeconomy, with economic downturns implying a decline in real tax revenues. The directimpact of conflict on the level of economic activity can occur through loss of physicalinfrastructure and of human capital (either through loss of human life, reduced productivityof the existing labor force as a result of disabilities or injuries suffered, or throughemigration). In general, the most important indirect effects are the impact on trade volumes(in part through possible destruction of essential transport infrastructure), on investment as aresult of greater macroeconomic and political uncertainty, and discouragement of tourism.
Addison and Murshed (2001) and Ndikumana (2001) note that there might also be importantfiscal dimensions to the causes of armed conflict. In particular, perceived inequities (byregion or ethnic group) in the distribution of the tax burden and/or discrimination relating tothe allocation of the benefits of public spending can inflame grievances and play a role inconflict generation. Conversely, social stability is often associated with the existence of anefficient and effective redistributive mechanism through the fiscal system.
- 4 -
Beyond the effect of armed conflict on real activity, armed conflict (particular if prolonged)can destroy part of the tax base (through the destruction of business firms, for example) andalso weaken the efficiency of tax administration. For example, Ndikumana (2001) notes that,following the outbreak of armed conflict in two countries in Africa, not only did the tax basecollapse but tax administration capacity was also eroded. With the return of peace and theresumption of normal production in one of the two countries tax revenues recoveredprogressively, and by 1998 exceeded the pre-conflict level.
Armed conflict also affects the composition of government spending. Military expenditurestypically increase during conflict and tend to remain high even after conflict is apparentlyresolved. At the same time, as noted above, the revenue base is eroded during the conflict,and in the period immediately following it. The consequence is that higher defenseexpenditures are afforded at the expense of lower outlays in socially and economicallyproductive sectors and higher budget deficits, with adverse effects for long-term growth. Thisalso suggests that ending conflicts can result in a “peace dividend” that can help release fiscalresources for either deficit reduction, lower taxes, or growth-enhancing spending in the socialsectors.1
Previous research extending beyond conflict-afflicted countries also suggests that cuttingmilitary spending can help foster economic growth (Arora and Bayoumi, 1993; Bayoumi,Hewitt, and Schiff, 1993; and Knight, Loayza and Villanueva, 1996). While some earlierstudies argued that military spending could boost growth (e.g., Benoit, 1978), these papersargue that lower military spending can encourage growth by increasing capital formation andimproving the efficiency with which resources are utilized in the economy.
III. EMPIRICAL METHODOLOGY
The empirical analysis in this paper follows two different approaches. In the first, we look at22 episodes of armed conflict in lower- and middle-income countries, and at the evolution ofvarious macroeconomic and fiscal variables and socio-economic indicators during theconflict period and in the years immediately preceding and following the conflict. Oursample includes those episodes of armed conflict that either began, or were ongoing, in 1985or after, and which ended in 1999 or earlier, and for which the relevant data for analysis areavailable. In this section we follow the Stockholm International Peace Research Institute(SIPRI) in defining conflict as “prolonged combat between the military forces of two or moregovernments, or of one government and at least one organized armed group, incurring thebattle-related deaths of at least 1,000 people during the entire conflict, and in which the
1 For an examination of how countries across the world (both conflict and nonconflicted afflicted) have utilizedthe peace dividend arising from the decline in worldwide military spending from 1990–95, see Schiff, Gupta,and Clements (1998).
- 5 -
incompatibility concerns government and/or territory” (see Appendix 1 for more details onour sample selection of countries).
One shortcoming of the SIPRI index is that it applies an absolute criteria for the number ofbattle-related deaths. Thus, a country with a large population will be classified as being inconflict, even though the number of deaths (1,000) may be small relative to its population.Moreover, the number of battle-related deaths may not adequately capture the economicimpact of armed conflict; it is possible that a number of sporadic low-intensity incidentsaffecting mainly the local population will have different economic effects, in terms of theirimpact on business and consumer confidence and international perception of the riskiness ofthe affected country, than a single dramatic event affecting mainly the tourist sector or keysectors linked to foreign trade.. Nevertheless, the SIPRI index is broadly consistent with theconflict index produced by the Heidelberg Institute for International Conflict Research(HIIK). Furthermore, where country ratings on internal conflict by the International CountryRisk Guide (ICRG) are also available for the corresponding episode periods (for 14 of the 21countries), we find a broad match between low ICRG ratings (of 8 or less) and countries thathave been classified as conflict-afflicted by SIPRI and HIIK. The SIPRI index has been usedin other empirical studies, such as Davoodi, Clements, Schiff and Debaere (2001).
Our first approach focuses on the impact of armed conflict within conflict-affected countries.In our second approach, which is designed to compare the effects of armed conflict acrosscountries, we estimate econometrically an integrated system of equations for real per capitaincome growth, government revenue and government spending, and use the results toexamine the main channels through which armed conflict affects the fiscal accounts.
For the purpose of the econometric analysis we use both the SIPRI index and the ICRGratings on internal conflict. The ICRG’s internal conflict rating is an assessment of politicalviolence in the country and its actual or potential impact on governance. The highest rating isgiven to those countries “...where there is no armed opposition to the government and thegovernment does not indulge in arbitrary violence, direct or indirect, against its ownpeople.”2 The lowest rating is given to a country embroiled in an ongoing civil war. The riskrating assigned is the sum of three subcomponents, each with a maximum score of fourpoints and a minimum score of zero points. A score of four points equates to very low riskand a score of zero to very high risk. The subcomponents are: civil war, terrorism/politicalviolence, and civil disorder. The ICRG series covers a wide range of countries, includingcountries not affected by conflict as defined by SIPRI and HIIK.
2 See the website address of the Political Risk Services Group at http://www.prsgroup.com/index.html
- 6 -
IV. MACROECONOMIC AND FISCAL VARIABLES AND SOCIO-ECONOMIC INDICATORS:PRE-CONFLICT, CONFLICT, AND POST-CONFLICT
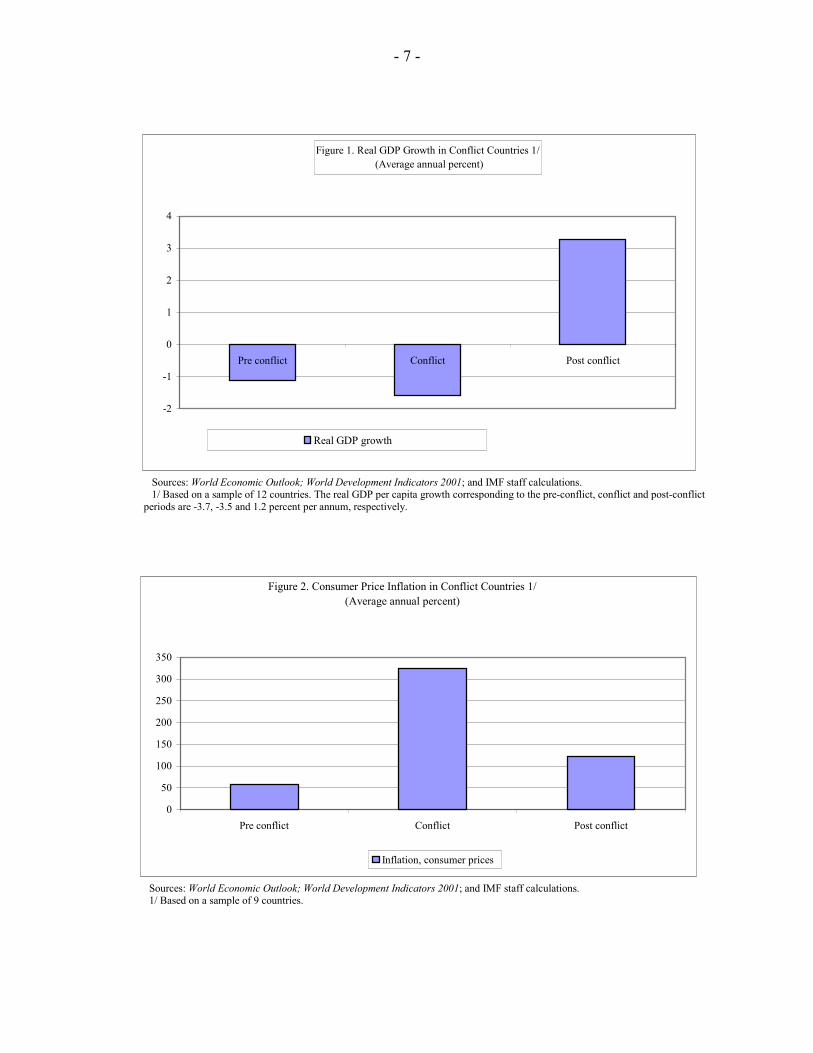
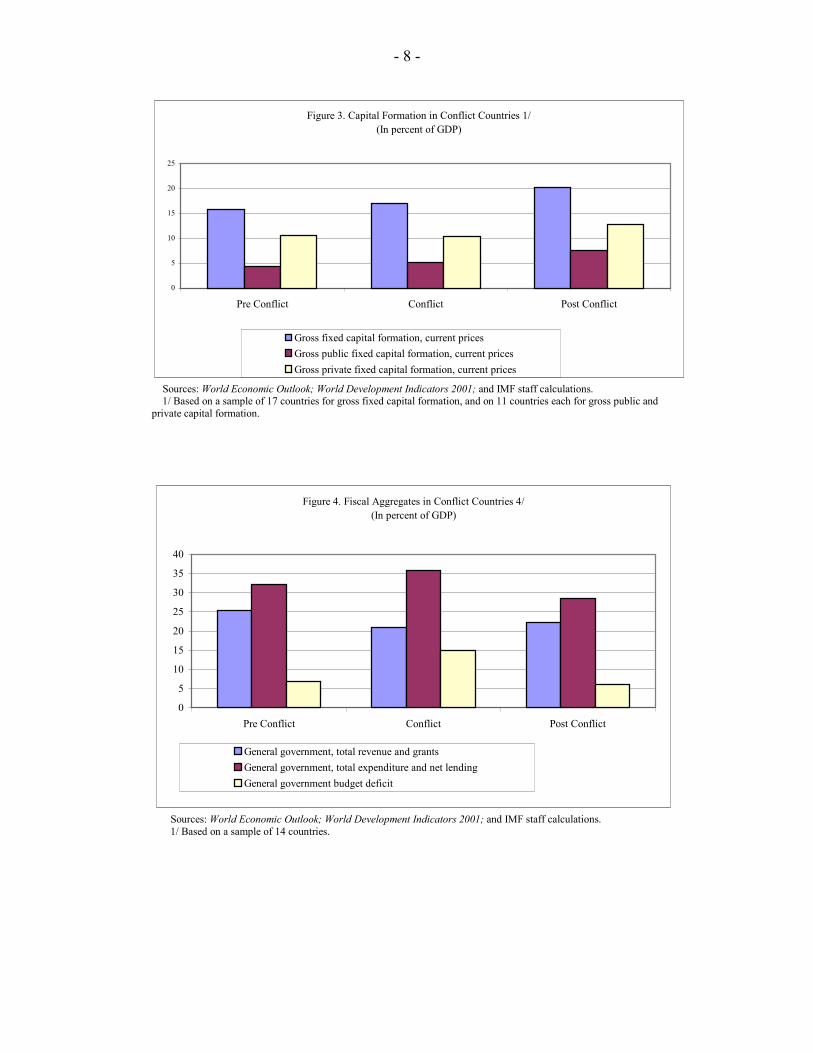
The results from 22 episodes of armed conflicts in lower- and middle-income countries arepresented in Figures 1–5 and Table 1. The data on real GDP are consistent with thehypothesis of a significant pickup in growth in the immediate post-conflict years, while oninflation there is a dramatic pickup in inflation during the conflict period, followed by asignificant decline in the immediate post-conflict period (see Figures 1 and 2). With regard togross fixed capital formation, the data show a notable increase in its share to GDP in theimmediate post-conflict years, particularly with regard to private sector investment (seeFigure 3).
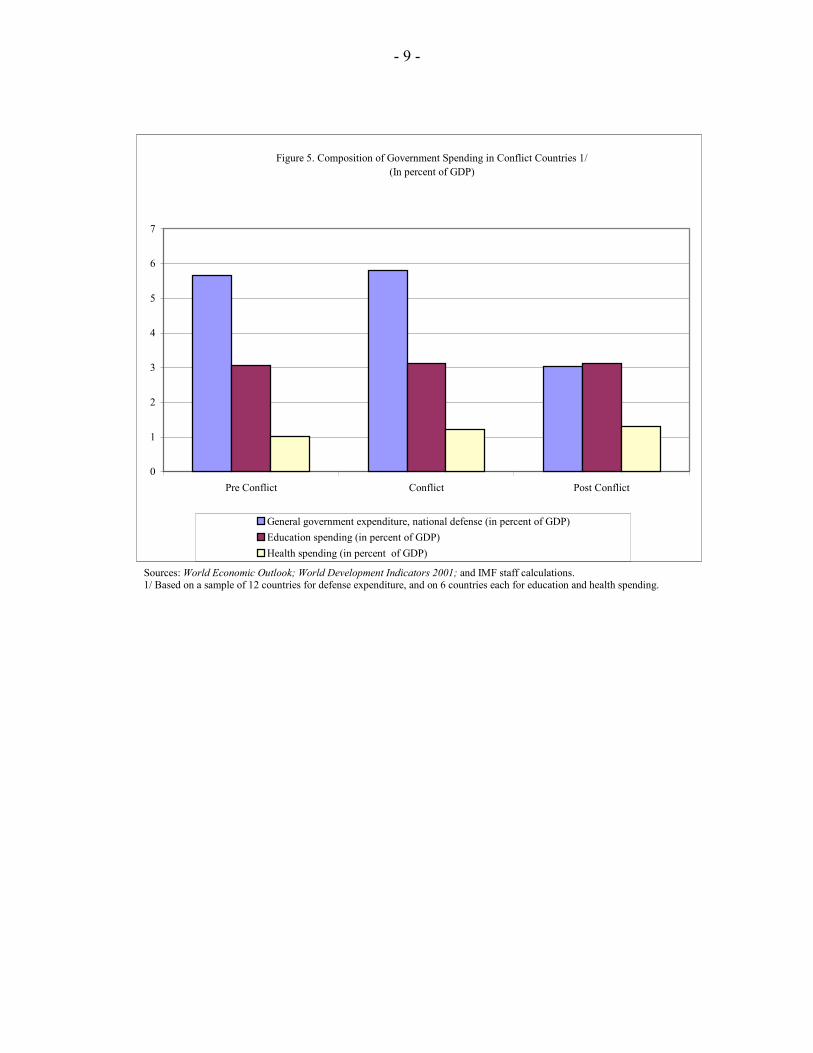
Figures 4–5 show the evolution of fiscal variables over the pre-conflict, conflict andpost-conflict periods. The available data for our sample of countries show that the share ofgovernment revenue and grants in GDP tends to fall during the conflict period, and to pickupsomewhat in the immediate post-conflict period. On the expenditure side, there appears to bea significant increase in government expenditure and net lending as a percent of GDP duringthe conflict period compared with the pre-conflict period, followed by a notable decline inthe immediate post-conflict period. In particular the available data suggest high governmentspending on defense during the conflict period and in the period immediately preceding it,followed by a significant fall in the immediate post-conflict period. However, high defensespending during the conflict period and in the years immediately preceding it tends to be atthe expense of macroeconomic stability (as reflected for example in significantly higherbudget deficits and a dramatic pickup in inflation) rather than at the cost of lower spendingon education and health as a share of GDP; however, since conflict is associated with lowerreal GDP growth, the implication is lower growth in real per capita government spending oneducation and health during conflict periods. Bevan (2000) and Addison and Murshed (2001)note, however, that the economic benefits from lower defense spending and the peacedividend may not accrue immediately following the end of a period of armed conflict, butover a period of time as the political situation returns to normal.
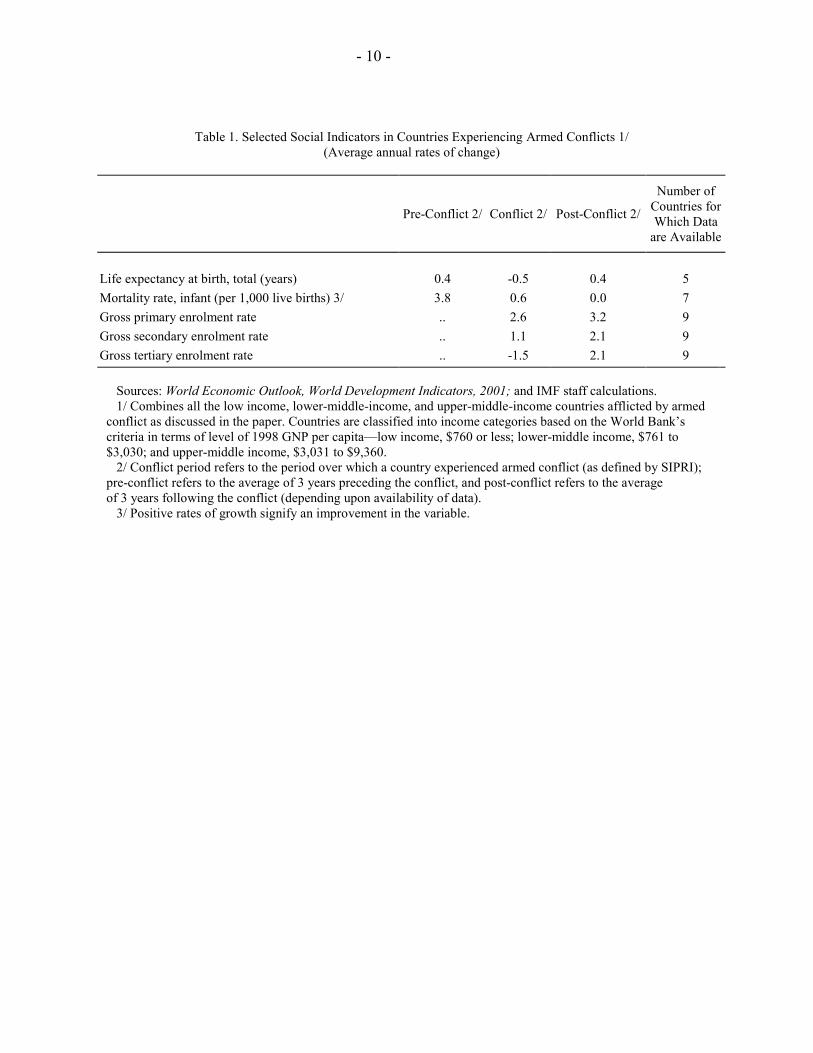
Turning now to the socio-economic indicators, Table 1 shows a significant decline in the rateof improvement of life expectancy at birth during the conflict period, but the trendimprovement in life expectancy picks up again in the immediate post-conflict period. Thereis also a significant deterioration in the rate of improvement of infant mortality duringconflict years, but the deterioration continues into the immediate post-conflict period. Theavailable data also show a marked improvement in gross school enrollment rates (at all threelevels—primary, secondary, and tertiary) following the end of armed conflict.
While a useful exercise, the conclusions that are drawn from this type of before-during-afteranalysis have to be interpreted with caution, in particular because this type of analysis doesnot control for other factors (variables) that might have changed during the periods andaffected not only the outcomes, but also the interactions among the variables of interest. For
- 7 -
Figure 1. Real GDP Growth in Conflict Countries 1/ (Average annual percent)
-2
-1
0
1
2
3
4
Pre conflict Conflict Post conflict
Real GDP growth
Sources: World Economic Outlook; World Development Indicators 2001; and IMF staff calculations. 1/ Based on a sample of 12 countries. The real GDP per capita growth corresponding to the pre-conflict, conflict and post-conflictperiods are -3.7, -3.5 and 1.2 percent per annum, respectively.
Figure 2. Consumer Price Inflation in Conflict Countries 1/(Average annual percent)
0
50
100
150
200
250
300
350
Pre conflict Conflict Post conflict
Inflation, consumer prices
Sources: World Economic Outlook; World Development Indicators 2001; and IMF staff calculations. 1/ Based on a sample of 9 countries.
- 8 -
Figure 3. Capital Formation in Conflict Countries 1/(In percent of GDP)
0
5
10
15
20
25
Pre Conflict Conflict Post Conflict
Gross fixed capital formation, current prices Gross public fixed capital formation, current prices Gross private fixed capital formation, current prices
Sources: World Economic Outlook; World Development Indicators 2001; and IMF staff calculations. 1/ Based on a sample of 17 countries for gross fixed capital formation, and on 11 countries each for gross public andprivate capital formation.
Figure 4. Fiscal Aggregates in Conflict Countries 4/(In percent of GDP)
0
5
10
15
20
25
30
35
40
Pre Conflict Conflict Post Conflict
General government, total revenue and grants General government, total expenditure and net lending General government budget deficit
Sources: World Economic Outlook; World Development Indicators 2001; and IMF staff calculations. 1/ Based on a sample of 14 countries.
- 9 -
Figure 5. Composition of Government Spending in Conflict Countries 1/ (In percent of GDP)
0
1
2
3
4
5
6
7
Pre Conflict Conflict Post Conflict
General government expenditure, national defense (in percent of GDP)Education spending (in percent of GDP)Health spending (in percent of GDP)
Sources: World Economic Outlook; World Development Indicators 2001; and IMF staff calculations. 1/ Based on a sample of 12 countries for defense expenditure, and on 6 countries each for education and health spending.
- 10 -
Table 1. Selected Social Indicators in Countries Experiencing Armed Conflicts 1/(Average annual rates of change)
Pre-Conflict 2/ Conflict 2/ Post-Conflict 2/
Number ofCountries forWhich Data
are Available
Life expectancy at birth, total (years) 0.4 -0.5 0.4 5Mortality rate, infant (per 1,000 live births) 3/ 3.8 0.6 0.0 7Gross primary enrolment rate .. 2.6 3.2 9Gross secondary enrolment rate .. 1.1 2.1 9Gross tertiary enrolment rate .. -1.5 2.1 9
Sources: World Economic Outlook, World Development Indicators, 2001; and IMF staff calculations. 1/ Combines all the low income, lower-middle-income, and upper-middle-income countries afflicted by armedconflict as discussed in the paper. Countries are classified into income categories based on the World Bank’scriteria in terms of level of 1998 GNP per capita—low income, $760 or less; lower-middle income, $761 to$3,030; and upper-middle income, $3,031 to $9,360. 2/ Conflict period refers to the period over which a country experienced armed conflict (as defined by SIPRI);pre-conflict refers to the average of 3 years preceding the conflict, and post-conflict refers to the averageof 3 years following the conflict (depending upon availability of data). 3/ Positive rates of growth signify an improvement in the variable.

- 11 -
this reason the next section of the paper presents an econometric estimation of a system ofinterlinked equations covering a wider range of countries, including countries not affected byconflict as defined by SIPRI and HIIK.
V. ECONOMETRIC ESTIMATES
As mentioned earlier, there are three main ways in which armed conflict can affect the fiscalaccounts: through its impact on real economic activity (GDP), and therefore on governmentrevenues; by adversely affecting both the tax base and the efficiency of the taxadministration; and by changing the composition of government spending. These fiscalconsequences, in turn, can have important repercussions on economic growth, which furtheraffect the public finances. To capture all these we specify a structural model with threeequations: one for economic growth, one for the government revenue to GDP ratio, and onefor the composition of government spending, measured by the share of defense spending intotal government expenditure.
In the structural model the equations for per capita income growth (Equation (1)),government revenue to GDP (Equation (2)), and defense expenditure as a share of totalgovernment spending (Equation (3)) are specified as follows:
GRPCYit = αr + α1PCYINIit + α2GSECINIit + α3DEFEXPDit +α4AGEDEPit + α5CONFit + µ1it (1)
GREVGDPit = βr + β1PCYit + β2NONAGRXit + β3CONFit + µ2it (2)
DEFEXPDit = λr + λ1DEFGDPNit + λ2CONFit + µ3it (3)
where
GRPCY = growth of real per capita income (GDP).
PCYINI = real per capita income (GDP, in $U.S.) in the initial year of the sampleperiod.
GSECINI = gross secondary school enrollment rate in the initial year of the sampleperiod.
DEFEXPD = share of defense expenditure in total government spending.
AGEDEP = age-dependency ratio.
CONF = a conflict variable (discussed below).
GREVGDP = government revenue as a ratio of GDP.
PCY = real per capita income (in $US).
- 12 -
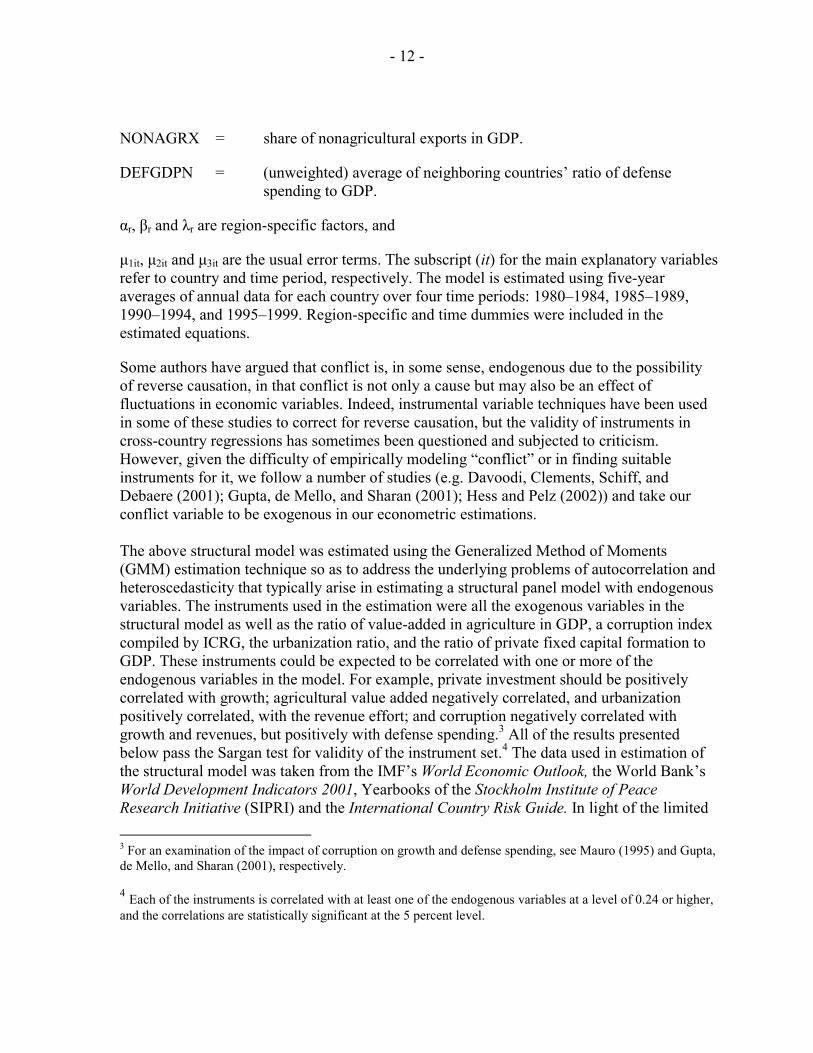
NONAGRX = share of nonagricultural exports in GDP.
DEFGDPN = (unweighted) average of neighboring countries’ ratio of defensespending to GDP.
αr, βr and λr are region-specific factors, and
µ1it, µ2it and µ3it are the usual error terms. The subscript (it) for the main explanatory variablesrefer to country and time period, respectively. The model is estimated using five-yearaverages of annual data for each country over four time periods: 1980–1984, 1985–1989,1990–1994, and 1995–1999. Region-specific and time dummies were included in theestimated equations.
Some authors have argued that conflict is, in some sense, endogenous due to the possibilityof reverse causation, in that conflict is not only a cause but may also be an effect offluctuations in economic variables. Indeed, instrumental variable techniques have been usedin some of these studies to correct for reverse causation, but the validity of instruments incross-country regressions has sometimes been questioned and subjected to criticism.However, given the difficulty of empirically modeling “conflict” or in finding suitableinstruments for it, we follow a number of studies (e.g. Davoodi, Clements, Schiff, andDebaere (2001); Gupta, de Mello, and Sharan (2001); Hess and Pelz (2002)) and take ourconflict variable to be exogenous in our econometric estimations.
The above structural model was estimated using the Generalized Method of Moments(GMM) estimation technique so as to address the underlying problems of autocorrelation andheteroscedasticity that typically arise in estimating a structural panel model with endogenousvariables. The instruments used in the estimation were all the exogenous variables in thestructural model as well as the ratio of value-added in agriculture in GDP, a corruption indexcompiled by ICRG, the urbanization ratio, and the ratio of private fixed capital formation toGDP. These instruments could be expected to be correlated with one or more of theendogenous variables in the model. For example, private investment should be positivelycorrelated with growth; agricultural value added negatively correlated, and urbanizationpositively correlated, with the revenue effort; and corruption negatively correlated withgrowth and revenues, but positively with defense spending.3 All of the results presentedbelow pass the Sargan test for validity of the instrument set.4 The data used in estimation ofthe structural model was taken from the IMF’s World Economic Outlook, the World Bank’sWorld Development Indicators 2001, Yearbooks of the Stockholm Institute of PeaceResearch Initiative (SIPRI) and the International Country Risk Guide. In light of the limited 3 For an examination of the impact of corruption on growth and defense spending, see Mauro (1995) and Gupta,de Mello, and Sharan (2001), respectively.
4 Each of the instruments is correlated with at least one of the endogenous variables at a level of 0.24 or higher,and the correlations are statistically significant at the 5 percent level.
- 13 -
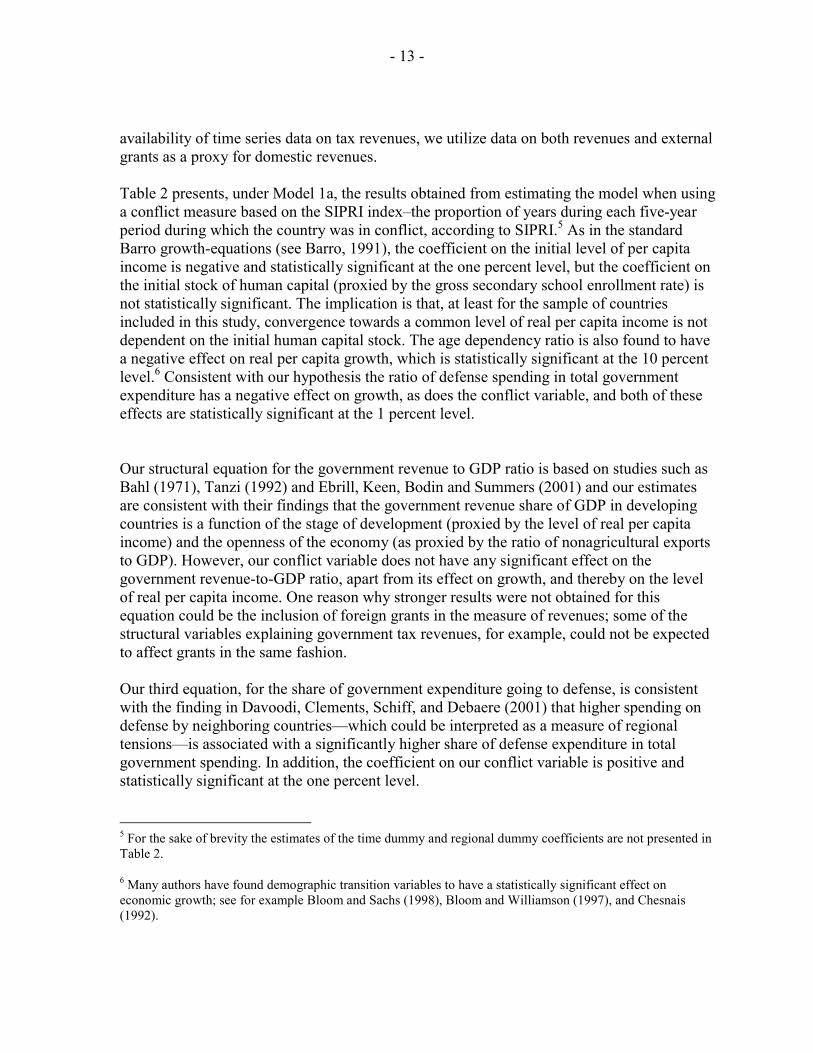
availability of time series data on tax revenues, we utilize data on both revenues and externalgrants as a proxy for domestic revenues.
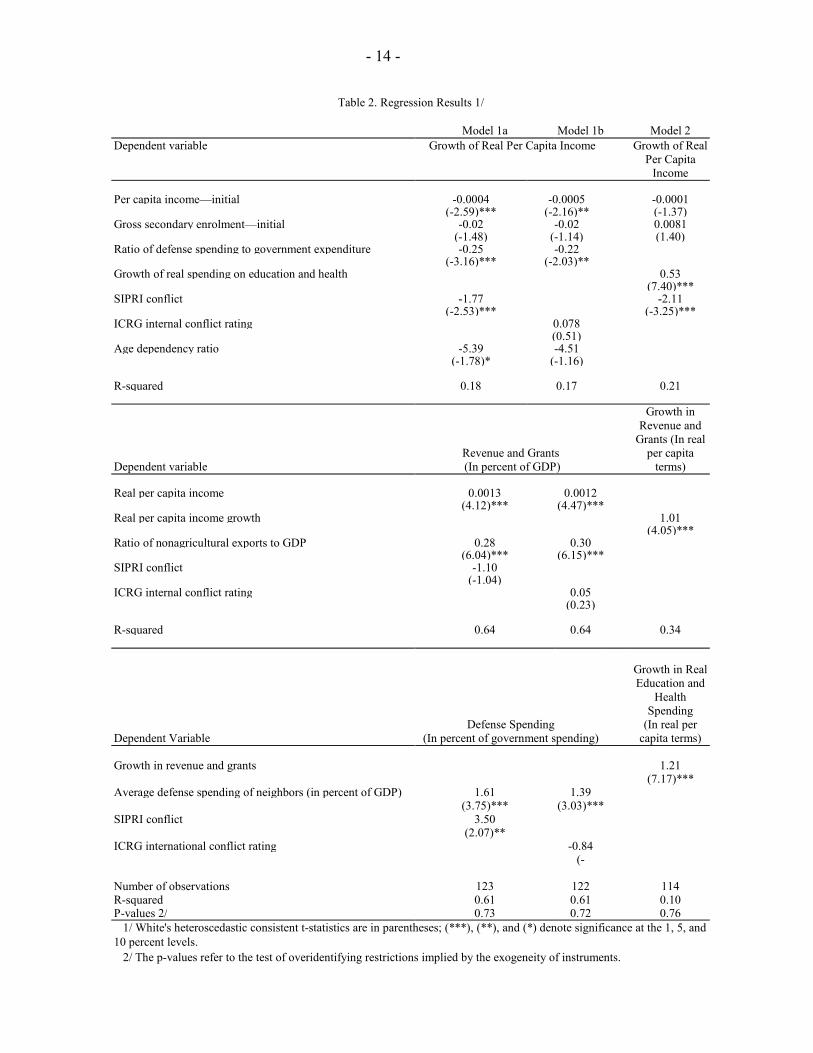
Table 2 presents, under Model 1a, the results obtained from estimating the model when usinga conflict measure based on the SIPRI index–the proportion of years during each five-yearperiod during which the country was in conflict, according to SIPRI.5 As in the standardBarro growth-equations (see Barro, 1991), the coefficient on the initial level of per capitaincome is negative and statistically significant at the one percent level, but the coefficient onthe initial stock of human capital (proxied by the gross secondary school enrollment rate) isnot statistically significant. The implication is that, at least for the sample of countriesincluded in this study, convergence towards a common level of real per capita income is notdependent on the initial human capital stock. The age dependency ratio is also found to havea negative effect on real per capita growth, which is statistically significant at the 10 percentlevel.6 Consistent with our hypothesis the ratio of defense spending in total governmentexpenditure has a negative effect on growth, as does the conflict variable, and both of theseeffects are statistically significant at the 1 percent level.
Our structural equation for the government revenue to GDP ratio is based on studies such asBahl (1971), Tanzi (1992) and Ebrill, Keen, Bodin and Summers (2001) and our estimatesare consistent with their findings that the government revenue share of GDP in developingcountries is a function of the stage of development (proxied by the level of real per capitaincome) and the openness of the economy (as proxied by the ratio of nonagricultural exportsto GDP). However, our conflict variable does not have any significant effect on thegovernment revenue-to-GDP ratio, apart from its effect on growth, and thereby on the levelof real per capita income. One reason why stronger results were not obtained for thisequation could be the inclusion of foreign grants in the measure of revenues; some of thestructural variables explaining government tax revenues, for example, could not be expectedto affect grants in the same fashion.
Our third equation, for the share of government expenditure going to defense, is consistentwith the finding in Davoodi, Clements, Schiff, and Debaere (2001) that higher spending ondefense by neighboring countries—which could be interpreted as a measure of regionaltensions—is associated with a significantly higher share of defense expenditure in totalgovernment spending. In addition, the coefficient on our conflict variable is positive andstatistically significant at the one percent level.
5 For the sake of brevity the estimates of the time dummy and regional dummy coefficients are not presented inTable 2.
6 Many authors have found demographic transition variables to have a statistically significant effect oneconomic growth; see for example Bloom and Sachs (1998), Bloom and Williamson (1997), and Chesnais(1992).
- 14 -
Table 2. Regression Results 1/
Model 1a Model 1b Model 2Dependent variable Growth of Real Per Capita Income Growth of Real
Per CapitaIncome
Per capita income—initial -0.0004 -0.0005 -0.0001(-2.59)*** (-2.16)** (-1.37)
Gross secondary enrolment—initial -0.02 -0.02 0.0081(-1.48) (-1.14) (1.40)
Ratio of defense spending to government expenditure -0.25 -0.22(-3.16)*** (-2.03)**
Growth of real spending on education and health 0.53(7.40)***
SIPRI conflict -1.77 -2.11(-2.53)*** (-3.25)***
ICRG internal conflict rating 0.078(0.51)
Age dependency ratio -5.39 -4.51(-1.78)* (-1.16)
R-squared 0.18 0.17 0.21
Dependent variableRevenue and Grants (In percent of GDP)
Growth inRevenue and
Grants (In realper capita
terms)
Real per capita income 0.0013 0.0012(4.12)*** (4.47)***
Real per capita income growth 1.01(4.05)***
Ratio of nonagricultural exports to GDP 0.28 0.30(6.04)*** (6.15)***
SIPRI conflict -1.10(-1.04)
ICRG internal conflict rating 0.05(0.23)
R-squared 0.64 0.64 0.34
Dependent VariableDefense Spending
(In percent of government spending)
Growth in RealEducation and
HealthSpending
(In real percapita terms)
Growth in revenue and grants 1.21(7.17)***
Average defense spending of neighbors (in percent of GDP) 1.61 1.39(3.75)*** (3.03)***
SIPRI conflict 3.50(2.07)**
ICRG international conflict rating -0.84(-
Number of observations 123 122 114R-squared 0.61 0.61 0.10P-values 2/ 0.73 0.72 0.76 1/ White's heteroscedastic consistent t-statistics are in parentheses; (***), (**), and (*) denote significance at the 1, 5, and10 percent levels. 2/ The p-values refer to the test of overidentifying restrictions implied by the exogeneity of instruments.
- 15 -
In summary, our empirical results suggest that armed conflict leads to a higher share ofdefense spending in total government expenditure, which in turn has a negative effect ongrowth by diverting resources away from spending on socially and economically productivesectors that promote economic growth over the long term. Armed conflict is also found tohave an additional negative impact on growth, separate from its impact on the composition ofgovernment spending. However, conflict does not seem to have any impact on governmentrevenue, independent of its effect on growth and therefore on the level of real per capitaincome.
To assess the robustness of the results, we also estimated the model using a different measureof conflict. The middle column in Table 2 presents the results from reestimating Model 1ausing the ICRG internal conflict rating, instead of the SIPRI-based conflict measure; theresults are presented under Model 1b. Note that, in contrast with our previous conflictmeasure, a higher value of the ICRG conflict rating means a lower risk of internal conflict.The results are very similar to those presented and discussed under Model 1a, except that theage dependency ratio becomes statistically insignificant and our conflict measure no longerhas a statistically significant effect on growth separate from its impact on the composition ofgovernment spending. One possible reason why the results using the ICRG conflict measureare weaker involves the nature of the ICRG index. Since the index is continuous, countrieswith both low and “medium” levels of conflict have different ICRG ratings. If the economyis only affected by severe conflicts, and not a “medium” level of conflict, then the ICRGranking may not necessarily be strongly correlated with economic variables. Since theSIPRI-based index is discrete for any given year (either 0 or 1), it may do a better job ofidentifying conflicts with economic consequences.
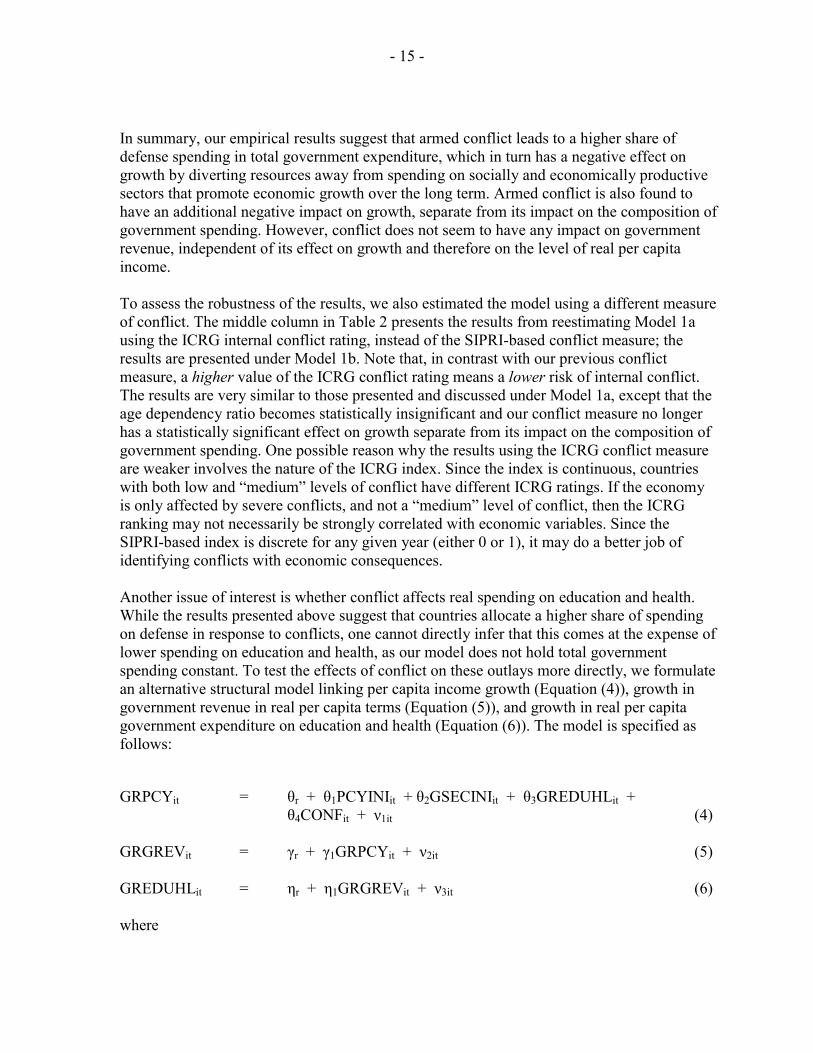
Another issue of interest is whether conflict affects real spending on education and health.While the results presented above suggest that countries allocate a higher share of spendingon defense in response to conflicts, one cannot directly infer that this comes at the expense oflower spending on education and health, as our model does not hold total governmentspending constant. To test the effects of conflict on these outlays more directly, we formulatean alternative structural model linking per capita income growth (Equation (4)), growth ingovernment revenue in real per capita terms (Equation (5)), and growth in real per capitagovernment expenditure on education and health (Equation (6)). The model is specified asfollows:
GRPCYit = θr + θ1PCYINIit + θ2GSECINIit + θ3GREDUHLit +θ4CONFit + ν1it (4)
GRGREVit = γr + γ1GRPCYit + ν2it (5)
GREDUHLit = ηr + η1GRGREVit + ν3it (6)
where
- 16 -
GRPCY, PCYINI, GSECINI and CONF are as defined earlier.
GREDUHL = growth in real per capita government spending on education andhealth.
GRGREV = growth in government revenue and grants, in real per capita terms.
θr, γr and ηr are region-specific factors, and
ν1it, ν2it and ν3it are the usual error terms.
The results from this model are presented in Table 2 under Model 2. The conflict variableused in the estimation is the SIPRI-based conflict measure. The instrument set was broadlythe same as that used in Model 1a, and for each of the endogenous variables there is at leastone instrument that is significantly correlated with it at the 5 percent level. The empiricalresults indicate that armed conflict has a significant negative impact on per capita incomegrowth, which leads to a proportionate reduction in growth of real per capita governmentrevenue, and this in turn results in lower real per capita spending by the government oneducation and health. The latter has a further significant and negative impact on growth.These findings are consistent with those discussed earlier from the estimation of Model 1.
VI. CONCLUSIONS
This study has aimed to provide a cross-country examination of the fiscal effects of armedconflict. Two different approaches have been taken to examine this issue. In the first, welooked at 22 episodes of armed conflicts in lower- and middle-income countries, and at theevolution of various macroeconomic and fiscal variables and socio-economic indicatorsduring the conflict period and in the years immediately preceding and following the conflict.This was followed by econometric estimation of an integrated system of equations for realper capita income growth, government revenue, and government spending to examine themain channels through which armed conflict affects the fiscal accounts.
Our findings are consistent with the hypothesis that armed conflict leads to a higher share ofdefense spending in total government expenditure, which has a negative effect on growth bydiverting resources away from spending on socially and economically productive sectors thatpromote economic growth. In particular there is evidence that armed conflict, by negativelyaffecting growth of real per capita income and thereby growth in government revenue in realper capita terms, leads to lower growth of real per capita government spending on educationand health, which in turn adversely affects economic growth. The results also suggest thatconflict has had an additional and significant negative impact on growth, independent of itseffect on the composition of government spending. On the revenue side, conflict onlyappears to affect the fiscal accounts through its effects on real economic activity, and doesnot have an independent effect per se on revenues. The inclusion of foreign grants in ourmeasures of revenues may have contributed to this result.
- 17 -
These findings from the econometric estimation are generally consistent with the conclusionsof the before-during-after conflict analysis on growth. The share of government revenue inpercent of GDP tends to fall during the conflict period, and to pickup somewhat in theimmediate post-conflict period. This finding is not reflected in our econometric estimates,perhaps because the before-during-after conflict analysis is based on a much smaller sampleof countries. The before-during-after conflict analysis also suggests that armed conflict leadsto higher government spending on defense, but this tends to be at the expense ofmacroeconomic stability (reflected for example in significantly higher budget deficits and adramatic pickup in inflation) rather than at the cost of lower spending on education andhealth—at least when measured as a percent of GDP; however, since conflict is associatedwith lower real GDP growth, the implication is lower growth in real per capita governmentspending on education and health during conflict periods. Not surprisingly, the data isconsistent with an increase in the share of investment in GDP in the immediate post-conflictperiod, and in particular in the share of private sector investment. The available data alsoshow a dramatic pickup in inflation during the conflict period, followed by a significantdecline in the immediate post-conflict period.
The results suggest sizeable economic gains for countries that end conflicts in terms ofeconomic growth, macroeconomic stability, and the generation of tax revenues to supportpoverty-reducing spending. Ending conflicts can be expected to reduce the share of thebudget allocated to military spending. These results confirm those found in earlier studies,which underscore the potential for this “peace dividend” to contribute to economicdevelopment. For example, a recent study by Hess and Pelz (2002) find that the pureeconomic welfare losses from conflict are quite large. The authors estimate that these lossesare typically four times larger than the welfare costs of business cycles as calculated byLucas (1987), and that on average individuals would give up over 6 percent of their currentannual level of consumption as a one-time payment in order to live in a world of perpetualpeace.
The IMF is often heavily involved in lending for reconstruction to post-conflict countries. Inparticular, the IMF provides assistance under its emergency assistance facility to helpmembers emerging from conflicts rebuild capacity and recover economic stability in post-conflict periods; over the period 1995-2000, the IMF provided such assistance (amounting toover $ 300 million) to seven countries. Our analysis has implications for the design ofmacroeconomic and fiscal policies for these countries emerging from conflicts. In particular,our results suggest that these countries are likely to experience a pickup in government taxrevenues and a reduction in military spending (albeit perhaps with a lag) in the post-conflictperiod. As such, the resolution of conflicts should help contribute to restoringmacroeconomic stability above and beyond other reform measures implemented in the post-conflict era.
- 18 - APPENDIX
Sample Selection
The information on armed conflicts provided by the Stockholm International Peace ResearchInstitute (SIPRI) provides the starting point for selecting the sample for this study.7 Thisinformation is in broad agreement with that provided by the Heidelberg Institute forInternational Conflict Research (HIIK), which defines conflict more broadly than SIPRI.8Another measure of conflict is provided by the International Country Risk Guide’s (ICRG)ratings on internal conflict (available from 1984 onwards). Using the information providedby SIPRI, we find 20 countries (22 episodes) where conflict began or was ongoing after1985, but ended before 2000 (Table 1). The sample includes 15 low-income countries(Armenia, Azerbaijan, Bangladesh, Cambodia, Chad, Congo, republic of, Georgia,Guinea-Bissau, Laos, Mozambique, Nicaragua, Senegal, Tajikistan, Uganda, and Yemen),3 low middle-income countries (Albania, El Salvador, and Guatemala) and 2 uppermiddle-income countries (Croatia and Lebanon).
Where ICRG country ratings on internal conflict are also available for the correspondingepisode periods (for 14 of the 21 countries), we find a broad match between low ICRGratings (of 8 or less) and countries that have been classified as conflict-afflicted by SIPRI andHIIK.9 The average ICRG internal conflict score (where available) for these 20 countries is3.7 between 1984–89, 6.4 between 1990–94, and 8.2 between 1995–99. This is a reflection ofthe fact that in most of these 20 countries, the main conflict took place during the 1980s (orbefore) and during the first half of the 1990s. It should also be noted that the ICRG rating forexternal conflict for these same countries was 5.7, 8 and 9 over the periods 1984–89,1990–94 and 1995–99 respectively.
7 The Stockholm International Peace Research Institute (SIPRI) provides a quantitative definition of conflict,“the prolonged combat between the military forces of two or more governments, or of one government and atleast one organized armed group, incurring the battle related deaths of at least 1,000 people during the entireconflict, and in which the incompatibility concerns government and/or territory.”
8 Unlike SIPRI, the Heidelberg Institute does not consider a cut-off level of 1,000 conflict-related deaths toclassify a country as being afflicted by conflict. It defines conflict broadly as “the clashing of overlappinginterests (positional differences) around national values and issues (independence, self-determination, bordersand territory, access to or distribution of domestic or international power); the conflict has to be of someduration and magnitude of at least two parties (states, groups of states, organizations or organized groups) thatare determined to pursue their interests and win their case.”
9 On the 0–12 ICRG scale, 0 denotes Very High Risk of Conflict and 12 denotes Very Low Risk. For example, Liberia hadan average ICRG (Internal Conflict) rating of 2.1 between 1990–94.
- 19 -
References
Abadie, Alberto, and Javier Gardeazabal, 2001, “The Economic Costs of Conflict: A CaseControl Study for the Basque Country,” NBER Working Paper No. 8478 (Cambridge,Massachusetts: National Bureau of Economic Research).
Addison, Tony, and S. Mansoob Murshed, 2001, “The Fiscal Dimensions of Conflict andReconstruction”, WIDER Discussion Paper No. 2001/49, World Institute forDevelopment Economics Research, United Nations University, Helsinki, Finland.
Alesina, Alberto, Sule Özler, Nouriel Roubini, and Phillip Swagel, 1996, “PoliticalInstability and Economic Growth,” Journal of Economic Growth, Vol. 1, pp.189–211.
Alesina, Alberto, and R. Perotti, 1996, “Income Distribution, Political Instability andInvestment,” European Economic Review, Vol. 40, No.6, pp. 1203–28.
Arora, Vivek, and Tamim Bayoumi, 1993, “Economic Benefits of Reducing MilitaryExpenditure,” World Economic Outlook, October 1993 (Washington: InternationalMonetary Fund).
Arunatilake, Nisha, Sisira Jayasuriya, and Saman Kelegama, 2000, “The economic costs ofthe war in Sri Lanka”, Research Studies: Macroeconomic and Planning SeriesNo. 13, Colombo: Institute of Policy Studies.
Bahl, Roy W., 1971, “A Regression Approach to Tax Effort and Tax Ratio Analysis,” StaffPapers, International Monetary Fund, Vol. 18, No. 3.
Barro, Robert J., 1991, “Economic Growth in a Cross Section of Countries,” QuarterlyJournal of Economics, Vol. 106, No. 2, pp. 407–43.
Bayoumi, Tamim, Daniel Hewitt, and Jerald Schiff, 1993, “Economic Consequences ofLower Military Spending: Some Simulation Results,” IMF Working Paper 93/17(Washington: International Monetary Fund).
Benoit, Emile, 1978, “Growth and Defense in Developing Countries,” EconomicDevelopment and Cultural Change, Vol. 26, No. 2.
Bevan, D., 2000, “The fiscal dimensions of Ethiopia’s transition and reconstruction ,” inT. Addison (ed.)., “From Conflict to Reconstruction in Africa,” World Institute forDevelopment Economics Research, United Nations University, Helsinki, Finland.
Bloom, David E., and Jeffrey D. Sachs, 1998, “Geography, Demography and EconomicGrowth in Africa,” Brookings Papers on Economic Activity: 2, Brookings Institution.
- 20 -
Bloom, David E., and Jeffrey G. Williamson, 1997, “Demographic Transition and EconomicMiracles in Emerging Asia,” in Emerging Asia: Changes and Challenges (Manila:Asian Development Bank).
Chesnais, Jean-Claude, 1992, The Demographic Transition: Stages, Patterns and EconomicImplications: A Longitudinal Study of Sixty-Seven Countries Covering the Period1720–1984 (Oxford, Oxfordshire: Clarendon Press).
Cukierman, Alex, Sebastian Edwards, and Guido Tabellini, 1992, “Seignorage and PoliticalInstability,” American Economic Review, Vol. 82, No. 3, pp. 537–55.
Davoodi, Hamid, Benedict Clements, Jerald Schiff, and Peter Debaere, 2001, “MilitarySpending, the Peace Dividend, and Fiscal Adjustment,” Staff Papers, InternationalMonetary Fund, Vol. 48, No. 2.
Drakos, Konstantinos, and Ali M. Kutan, 2001, “Regional Effects of Terrorism on Tourism:Evidence from Three Mediterranean Countries,” Center for European IntegrationStudies Working Paper No. 26 (Bonn: Universität Bonn).
Ebrill, Liam, Michael Keen, Jean-Paul Bodin and Victoria Summers, 2001, “The ModernVAT (Washington: International Monetary Fund).
Enders, Walter, and Todd Sandler, 1991, “Causality Between Transnational Terrorism andTourism: The Case of Spain,” Terrorism, Vol. 14, pp. 49–58.
———, and Gerald F. Parise, 1992, “An Econometric Analysis of the Impact of Terrorismon Tourism,” Kyklos, Vol. 45, No. 4, pp. 531–54.
Gupta, Sanjeev, Luiz de Mello, and Raju Sharan, 2001, “Corruption and Military Spending,”European Journal of Political Economy, Vol. 17, No. 4, pp. 749–77.
Hess, Gregory D., and Eduard Pelz, 2002, “An Empirical Assessment of the EconomicWelfare Cost of Conflict” (unpublished).
Knight, Malcolm, Norman Loayza, and Delano Villanueva, 1996, “The Peace Dividend:Military Spending Cuts and Economic Growth,” IMF Staff Papers, InternationalMonetary Fund, Vol. 43, No. 1.
Lucas, Robert E., Jr., 1987, Models of Business Cycles, (Oxford, Oxfordshire; New York:B. Blackwell).
Mauro, Paolo, 1995, “Corruption and Growth,” Quarterly Journal of Economics, Vol. 110,pp. 681–712.
- 21 -
Ndikumana, Léonce, 2001, “Fiscal Policy, Conflict, and Reconstruction in Burundi andRwanda,” Wider Institute for Development Economics Research Discussion PaperNo. 2001/62.
Özler, Sule, and Guido Tabellini, 1991, “External Debt and Political Instability,” NBERWorking Paper No. 3772 (Cambridge, Massachusetts: National Bureau of EconomicResearch).
Rodrik, Dani, 1991, “Where Did All the Growth Go? External Shocks, Social Conflict, andGrowth Collapses,” Journal of Economic Growth, Vol. 4, No. 4, pp.385–412.
Roubini, Nouriel, 1991, “Economic and Political Determinants of Budget Deficits inDeveloping Countries,” Journal of International Money and Finance, Vol. 10,Supplement, pp. S49–S72.
Roubini, Nouriel, and Jeffrey D. Sachs, 1989, “Political and Economic Determinants ofBudget Deficits in the Industrial Democracies,” European Economic Review, Vol. 33,No. 5, pp. 903–38.
Schiff, Gerald, Sanjeev Gupta, and Benedict Clements, 1998, “Worldwide MilitarySpending, 1990–95,” Defense and Peace Economics, Vol. 9, pp. 237–81.
Tanzi, Vito, 1992, “Structural Factors and Tax Revenue in Developing Countries: A Decadeof Evidence,” in Ian Goldin and L. Alan Winters (eds.), “Open Economies: StructuralAdjustment and Agriculture,” New York, Cambridge University Press.
Venieris, Yiannis P., and Dipak K. Gupta, 1986, “Income Distribution and SociopoliticalInstability as Determinants of Savings: A Cross-sectional Model,” Journal ofPolitical Economy, Vol. 94, No. 4, pp. 873–83.