FIRE & POLICE - City of Pasadena
424
PASADENA PASADENA FIRE & POLICE RETIREMENT SYSTEM FIRE & POLICE RETIREMENT BOARD - REGULAR MEETING Wedn es day, February 21, 2018 RETIREMENT SYSTEM City Council Chamb e rs , 100 N. Garfield Ave., #5249 10:15 a.m. AGENDA 1. Call to Order 2. Public Comment 3. Minutes: November 15, 2017 (Regular Meeting) CONSENT CALENDAR 4. Approve the monthly retirement allowance roll of $1,073,865.44 for November 2017, $ 1, 071,271.25 for December 2017, and $1 ,069,560.74 for January 2018. 5. Approve additions/removals of the following members/beneficiaries to/from the manthl II II 1y a owance ro : Effective Add/ Pension Pension Name Date Remove Continuance Amount a. G. Kenney 10/26/17 remove No $1,936.31 6. Receive and file the 4th Quarter 2017 Asset Manager Performance Reports from the fo ll owing asset managers: a. Atlanta Capital Investment Managers b. Capital Group, American Funds EuroPacific Growth Fund c. Dodge & Cox International Stock Fund d. Dodge & Cox Stock Fund e. Invesco Core Real Estate, USA - LP f. PIMCO All Asset Fund g. T CW MetWest Fi xed In come Review h. Vanguard Inflation-Protected Securities Fund i. Vanguard Growth Index Fund j. Vanguard Short-Term Investment-Grade Fund k. Voya Senior Loan Trust Fund Review 7. Schedule the CalPERS Service Pending Industrial Disability Retirement hearing application for Salvador Vidales, Police Officer, for the March 21, 2018 regular meeting of the FPRS Board. 8. Adopt Resolution No. 326 setting the cost of living adjustment at an increase of 3% for all eligible retires and beneficiaries per Charter Section 1509.8 to become effective July 1, 2018, as determined by Bartel Associates, System actuary. Page 1 of 3
-
Upload
khangminh22 -
Category
Documents
-
view
32 -
download
0
Transcript of FIRE & POLICE - City of Pasadena

PASADENA PASADENA FIRE & POLICE RETIREMENT SYSTEM FIRE & POLICE
RETIREMENT BOARD - REGULAR MEETING
Wednesday, February 21, 2018 RETIREMENT SYSTEM City Council Chambers, 100 N. Garfield Ave. , #5249
10:15 a.m.
AGENDA
1. Call to Order 2. Public Comment 3. Minutes: November 15, 2017 (Regular Meeting)
CONSENT CALENDAR 4. Approve the monthly retirement allowance roll of $1,073,865.44 for November
2017, $1,071,271.25 for December 2017, and $1 ,069,560.74 for January 2018. 5. Approve additions/removals of the following members/beneficiaries to/from the
man thl II II 1y a owance ro : Effective Add/ Pension Pension
Name Date Remove Continuance Amount a. G. Kenney 10/26/17 remove No $1,936.31
6. Receive and file the 4th Quarter 2017 Asset Manager Performance Reports from the fo llowing asset managers: a. Atlanta Capital Investment Managers b. Capital Group, American Funds EuroPacific Growth Fund c. Dodge & Cox International Stock Fund d. Dodge & Cox Stock Fund e. Invesco Core Real Estate, USA - LP f. PIMCO All Asset Fund g. TCW MetWest Fixed Income Review h. Vanguard Inflation-Protected Securities Fund i. Vanguard Growth Index Fund j. Vanguard Short-Term Investment-Grade Fund k. Voya Senior Loan Trust Fund Review
7. Schedule the CalPERS Service Pending Industrial Disability Retirement hearing application fo r Salvador Vidales, Police Officer, for the March 21, 2018 regular meeting of the FPRS Board.
8. Adopt Resolution No. 326 setting the cost of living adjustment at an increase of 3% for al l eligible retires and beneficiaries per Charter Section 1509.8 to become effective July 1, 2018, as determined by Bartel Associates, System actuary.
Page 1 of 3

CLOSED SESSION
A. CONFERENCE ON PUBLIC EMPLOYMENT (Government Code Section 54957) Title: Retirement Administrator/Secretary (Management Analyst IV) System Representative: Keith Jones
B. CONFERENCE ON PUBLIC EMPLOYMENT (Government Code Section 54957) Title: City Temporary Worker System Representative: Keith Jones
ACTION ITEMS - The Board may discuss and take action on the following items: 9. Receive, discuss, and possibly take action on the presentations by prospective
auditing financial services firms: a. Brown Armstrong b. Moss Adams, LLP c. Macias Gini & O'Connell , LLP
10. Discuss and take action on Amendment to Agreement No. 20,823, assignment of beneficial interest in 275 East Cordova Street.
11. Discuss and possibly take action on the following investment reports submitted by Verus Investments: a. Receive and file, Active Management Environment Summary b. Discuss, and possibly take action, US Large Cap Equity Passive vs.
Active Analysis c. Receive and file, November 2017 -January 2018 Withdrawal and
Rebalance Transaction Summary d. Receive and file, 4th Quarter 2017 Investment Performance Review e. Receive and file, January 2018 Performance Update f. Review and approve, February-April 2018 Rebalance and Withdrawal g. Review and approve, Invesco Core Real Estate - U.S.A., L.P. Ratification
of Advisory Committee Members
INFORMATION ITEMS 12. Staff Report
a. January 2018 Budget/Expense Report 13. Counsel Report 14. Articles/Newsletters/Conferences
COMMENTS FROM BOARD MEMBERS
ADJOURN
Page 2 of 2

POSTING STATEMENT: I HEREBY CERTIFY that this Agenda was posted in its entirety at the City Kiosk and on the City Council Chamber bulletin board, Room S249, on February 15, 2018 at 5:00 p.m., and a copy was sent to the Central Library for posting.
Jill ;b.Jt~ Administrator/Secretary to the Board
In compliance with the Americans with Disabilities Act of 1990, listening assistive devices are avai/able.fi-om the City Clerk's Office with a 24-hour advance notice. Please call (626) 744-4320 to request use of a listening device.
Any documents distributed to a majority of the Pasadena Fire & Police Retirement Board regarding any item on this agenda will be made available at the office of the Fire & Police Retirement System, located at 100 N. Garfield Avenue, #N204, Pasadena, CA 91101. To make arrangements to view items, during normal business hours, please contact the Retirement office at (626)744-4320.
DISTRIBUTION Board Members Bartel Associates A. Taylor, Verus I. Safie, City Atty
Police Dept (Admin Srv) Fire Chief Director of Finance City Treasurer
P. Fuleihan S. Lebovitz A. Snitzer
Page 3 of 3
T. Phillips, CPA D. Barba, AdminSure D. Sullivan, AdminSure R. Lennon, AdminSure
L. Derderian, Interim PIO Library, NIS City Controller

PASADENA FIRE & POLICE RETIREMENT SYSTEM RETIREMENT BOARD - REGULAR MEETING
Wednesday, November 15, 2017 City Council Chambers S249
Pasadena City Hall, 100 N. Garfield Avenue 10:15 a.m.
MINUTES
1. Call to Order
The regular meeting of the Pasadena Fire & Police Retirement Board was called to order by the Chair, Mr. Keith Jones, on Wednesday, November 15, 2017 at 10:16 a.m. in the City Council Chambers at City Hall.
Members - Present K. Jones, Chair P. Boyle, Vice Chair (departed 11:15) J. Brinsley J. Milligan T. Tomek
Staff - Present
J. Fosselman, Administrator/Secretary E. Wong, Sr. Office Assistant I. Safie, City Attorney Representative
Others Present A. Taylor, J. Godsey, A. Chiang, R. Ridley
2. Public Comment
None noted.
Not Present
Not Present
3. Minutes: Approve the minutes for the regular meeting of September 20 and the special meeting of October 9, 2017.
MOTION by Mr. Milligan, seconded by Mr. Brinsley, to approve the Minutes for the regular meeting of September 20 and the special meeting of October 9, 2017. (Motion unanimously carried)
Page 1of6

CONSENT CALENDAR
4. Approve the monthly retirement allowance roll of $1,073, 179.24 for September 2017, and $1,067,418.15 for October 2017.
5. Approve additions/removals of the following members/beneficiaries to/from the man thl II II 1y a owance ro :
Effective Add/ Pension Pension Name Date Remove Continuance Amount
a. J. Galligan 10/13/17 remove Yes, 100% $4,075.40
b. F. Galligan 10/14/17 remove No $4,075.40
6. Receive and file the 3rd Quarter 2017 Asset Manager Performance Reports from the following asset managers: a. Atlanta Capital Investment Managers b. Capital Group, American Funds EuroPacific Growth Fund c. Dodge & Cox International Stock Fund d. Dodge & .Cox Stock Fund e. Invesco Core Real Estate, USA- LP f. PIMCO All Asset Fund g. TCW MetWest Fixed Income Review h. Voya Senior Loan Trust Fund Review
MOTION by Mr. Boyle, seconded by Mr. Milligan, to approve items 4-6 on the Consent Calendar. (Motion unanimously carried)
CalPERS HEARINGS 7. CalPERS scheduled hearing on the Service Pending Industrial Disability
Retirement application for Salvador Vidales, Police Officer. (Remove from calendar)
The Chair announced it was the time for the hearing on the CalPERS Service Pending Industrial Disability Retirement application, filed by Salvador Vidales, Police Officer. However, the Board received notification from the City on November 2, 2017 that the applicant filed an additional claim. Thus, the City requested (with concurrence from the applicant) to remove the scheduled hearing from the Board's calendar.
ACTION ITEMS - The Board may discuss and take action on the following items:
8. Review, discuss and approve the June 30, 2017 Annual Report and Audited Financial Statements, as prepared by System Auditor Macias Gini & O'Connell.
Engagement Partner James Godsey of Macias Gini & O'Connell ("MGO") reviewed the reports and significant information in the financial statements and notes. He reported that there were no findings, and that MGO had issued an unmodified opinion on the financial statements. Although MGO was not engaged
Page 2 of 6

to provide an opinion on internal controls, if they had discovered any, they would have disclosed them to the Board. No such deficiencies in internal control were found, and MGO believes that adequate checks and balances are in place to maintain control.
MOTION by Mr. Boyle, seconded by Mr. Tomek, to approve the June 30, 2017 Annual Report and Audited Financial Statements. (Motion unanimously carried)
Following action on this item, Chair Jones moved to Item 10 on the Agenda.
10. Receive presentation, discuss and possibly take action on the City's assignment of beneficial interest to the System in 275 East Cordova Street (The Concord).
Jill Fosselman provided a verbal update on the staff efforts to develop mutually agreed memorialization of the System's beneficial interest. She briefly iterated the key tenants of the System's beneficial interest: 100% of the rent, past-due rent, and interest on the past due rent until 2031 or until the City sells the property; 93% interest in the original "Concord" land parcel, including 93% of any proceeds realized from the sale or leasing of any part of the property, until the City is no longer fee title owner to the land, and; the City maintains all control over all decisions to be made regarding the sale, lease, or use of the property.
The Board generally discussed a tentative review and approval process for the beneficial interest, and further expressed their preference to develop a separate agreement to memorialize the beneficial agreement rather than amend the current contribution agreement between the City and System.
MOTION by Mr. Brinsely, seconded by Mr. Milligan, to approve in concept, the key tenants of the beneficial interest presented verbally, and directed counsel to draft the framework for a memorandum of understanding memorializing the System's beneficial interest in the Concord. (Motion unanimously carried)
Following action on this item, Chair Jones returned to Item 9 on the Agenda.
9. Discuss and possibly take action on the following investment reports submitted by Verus Investments: a. Receive and file, 3rct Quarter 2017 Investment Performance Review
Annie Taylor reviewed the research report. In view of the broader economy, Verus believes the moderate overweight to risk is warranted as interest rates are expected to increase in December. The net change in the portfolio for the quarter was -$785,798, bringing the value to $123,370,489 on September 30, 2017. The fund returned 3.0% net of fees (v. the benchmark of 2.6%) for the quarter). Over each of the earnings periods in the report (3 month, Fiscal YTD, YTD, and 1/3/5 Years), the fund outperformed its policy index. The fund's overall overperformance relative to the benchmark for the quarter was largely driven by earnings in international equities. Including pooled cash with the City,
Page 3 of 6

total market value at the end of the quarter was $125.8 million. The fund's cumulative performance for the quarter ranked in the 59th percentile relative to its peer universe (lnvestorForce Public DB $50mm-$250mm Gross).
MOTION by Mr. Brinsley, seconded by Mr. Milligan, to receive and file the 3rd Quarter 2017 Investment Performance Review, as recommended by Verus Investments. (Motion unanimously carried)
b. Receive and file, October 2017 Performance Update
Ms. Taylor reviewed the performance update reflecting performance without pooled cash. The total fund returned 0.8% net of fees for October (compared to the index of 0.7%), bringing the fiscal year-to-date return to 3.8% net of fees (vs. the index of 3.4%). Domestic Equities provided the strongest returns for the month with cumulative earnings of 1.8%, next followed by International Equities with cumulative earnings of 1.4% for these asset categories. Total market value at the end of October was $125.6 million, including pooled cash with the City.
Vice Chair Boyle departed the meeting at 11:15 a.m.
All asset classes were within the policy ranges specified in the Investment Performance Statement. However, given Verus' recommendation that the portfolio's moderate overweight to risk continues to be warranted, Ms. Taylor suggested a rebalance over time from Private Real Estate (current percentage is 11.1 %, and the target allocation is 10.0%). Ms. Taylor further recommended the Board request to redeem $1,000,000 from Invesco (to be reinvested or withdrawn for benefit payments).
MOTION by Mr. Tomek, seconded by Mr. Milligan, to approve the recommended withdrawal of $1,000,000 from Private Real Estate asset manager Invesco and rebalance as practicable, as recommended by Verus Investments. (Motion unanimously carried, 4-0, Boyle absent)
c. Receive and file, Liquidity Analysis
Ms. Taylor reviewed the liquidity analysis of the fund's portfolio, focusing on the individual assets and categories of assets held by liquidity. The System's portfolio is predominantly highly liquid: 80% of the assets have daily or weekly liquidity. Such liquidity is sufficient to meet the quarterly withdrawal needs for payment of benefits and administration, and no changes in asset managers or asset classes were recommended.
MOTION by Mr. Milligan, seconded by Mr. Brinsley, to receive and file the Liquidity Analysis, as recommended by Verus Investments. (Motion unanimously carried, 4-0)
Page 4 of6

d. Receive and file, September - October 2017 Withdrawal and Rebalance Transaction Summary
Ms. Taylor briefly reviewed the transaction summary for the rebalance and withdrawal for September-October pension benefits and administration of $2,200,000. The majority of the withdrawal was taken from international equities, followed next by domestic equities.
MOTION by Mr. Brinsley, seconded by Mr. Milligan, to receive and file the Transaction Summary, as recommended by Verus Investments. (Motion unanimously carried, 4-0)
e. Review and approve, November 2017 - January 2018 Withdrawal and Rebalance
Ms. Taylor reviewed the proposed preliminary withdrawal and rebalance of $3.4 million for benefits and administration for the months of November, December and January. Funds will be predominantly withdrawn from earnings in the Fund's equity assets, followed next by the fixed income asset manager, and a smaller amount from liquid alternatives.
MOTION by Mr. Brinsley, seconded by Mr. Milligan, to approve the preliminary rebalance and withdrawal of $3,400,000, as recommended by Verus Investments. (Motion unanimously carried, 4-0)
INFORMATION ITEMS
11. Staff Report - Ms. Fosselman provided a brief update on the US Bank payroll system (new 2018 medical rates), auditing financial services RFP, and noted the Board meeting break over the holidays until February. a. October 2017 Budget/Expense Report- noted. b. 2018 Board Meeting Schedule - noted.
12. Counsel Report- none noted. 13. Articles/Newsletters/Conferences - none noted.
COMMENTS FROM BOARD MEMBERS
None noted.
ADJOURNMENT
MOTION by Mr. Tomek, seconded by Mr. Milligan, to adjourn the meeting at 11 :38 a.m. (Motion unanimously carried, 4-0)
Page 5 of 6

Respectfully submitted,
Ji~~ifiYJL Keith Jones Secretary to the Board/Administrator Chair, Retirement Board
Details of this meeting are contained on a DVD recording of the meeting and will be kept in the archives for two years, per Board policy.
DISTRIBUTION: Board Members City Attorney Director of Finance
Fire & Police Retirees Assn. Police Chief Fire Chief
P. Fuleihan S. Lebovitz
Page 6 of 6
A. Snitzer D. Barba

DATE V2 1//€3 ITEM# t
PASADENA FIRE AND POLICE RETIREMENT SYSTEM
MONTHLY ALLOWANCE ROLL-TOTALS
MONTH 2016-2017 2017-2018 Notes
JULY 1, 113,678.65 1,080,895.48 a. AUGUST 1,114,712.51 1,072,450.04 d., e. SEPTEMBER 1,11 0,857.14 1,073, 179.24 d. , OCTOBER 1,110,857.14 1,067,418.15 q. NOVEMBER 1,110,857.14 1,073,865.44 q. DECEMBER 1,105,747.36 1,071,271.25 q., h. JANUARY 1,089, 152.42 1,069,560.74 FEBRUARY 1,076,066.67 MARCH 1,086,444.43 APRIL 1,072, 755.90 MAY 1,066,511.65 JUNE 1,062,779.72 Refund Checks -2,697.45 Prior Year Accruals Paid -2,859.76 b., c., f. FY TOTALS 13, 117,723.28 7,505, 780.58
COL BENEFITS INCLUDED ABOVE 6,930 , 154.22 3,971 ,080.46
COL- % Of Total 53% 53%
a. 2% COLA applied to all members and beneficiaries. b. T. Smith passed 6/4/2017. Final amount of $606.75 (accrued in June '17 - FY17) paid 7/31/17. c. A.J. Bergeson passed 6/12/2017. Final amount $1,878.40 (accrued in June '1 7 - FY17) paid
7/31/2017. d. B. Mcintyre passed 8/8/2017. Final amount $1,307.58 paid 9/30/17. No Survivor. e. R. McCray passed 8/16/2017. Surviving Spouse continuance 60%. Final amount $2,382.47
paid 8/31/17. Surviving Spouse normal amount $2 ,769 .62. Surviving Spouse initial August payment $1,340. 14 paid 8/31/2017. be paid when paperwork is complete. Surviving Spouse initial payment will be paid with her November payment.
f. H. Quinan passed 4/16/2017. Final amount $374.61 (accrued in June '17 - FY 17) paid 9/30/17. g. J. Galligan passed 10/13/17. Surviving Spouse continuance 100%. Final amount $1, 710.51
paid 12/31/2017. Surviving Spouse initial payment was paid with her November payment. h. G. Kenney passed 10/26/17. No continuance. Overpaid 5 days October and all of November.
Received refund check 2/5/2018 (after January payroll).

January 10, 2018
Bill Hackney, CFA(404) 876-9411
www.atlcap.com
OPINION AND ANALYSIS OF KEY ECONOMIC AND INVESTMENT ISSUES Page One
What’s up with tax reform? The stock market seems to like it. Most Republicans seem to like it. But public opinion polls show that over half of the American populati on doesn’t like it.
Economist Larry Summers predicts that 10,000 people per year will die due to tax reform. New York governor Andrew Cuomo calls it “a dagger at the economic heart of New York.” A study by the University of Chicago found that only one of 42 economists surveyed said the tax bill would increase economic growth substanti ally.
Of course Republicans and their favorite economists—apparently few of whom were interviewed by the University of Chicago—have a diff erent take on tax reform. They claim that the Tax Cuts and Jobs Act will result in more jobs, higher wages, greater business investment, faster economic growth and a fl ood of money fl owing back to the US from American companies’ $2 trillion overseas cash hoard.
“Finding Waldo” in this forest of economic hyperbole and jabbering punditry is diffi cult. But, as one might expect, the kernels of truth are probably found somewhere in between the prognosti cati ons of the opti mists and the naysayers.
What follows is my take on the tax bill, with parti cular focus on what’s important for investors to know in 2018.
First, some general observati ons. This legislati on is more a straightf orward tax cut than tax reform. Tax reform is usually viewed as revenue neutral, with the loss of tax revenues from the rate cuts being off set by the gain in revenues from the eliminati on of tax deducti ons and loopholes and from base broadening. This bill should cut taxes by about $1.5 trillion over the next ten years, with the cut about evenly distributed between individuals and corporati ons. Some of the lost tax revenues will likely be off set by gains generated from additi onal economic acti vity. Just how much growth will off set the revenue loss is, of course, the great debate between Democrats and Republicans.
An important feature of this legislati on is that the tax cuts for corporati ons are permanent, but most of the personal tax cuts expire in 2026. Beginning in 2018, the US federal corporate tax rate will be cut from 35% to 21%, the largest corporate tax cut in history and the fi rst cut since 1986.
For individuals, the top personal tax rate goes from 39.5% to 37%. All other personal tax rates are cut as well, with lower income earners benefi ti ng from a near doubling in the standard deducti on and a hike in the child tax credit. Between now and 2025, about 80% of Americans will get a tax cut, about 15% will see litt le or no change, and 5% will experience a tax increase (mostly the higher earners in high tax states like New York, New Jersey and California).
What You Wish For!Be Careful

OPINION AND ANALYSIS OF KEY ECONOMIC AND INVESTMENT ISSUES Page Two
Are the personal tax cuts distributed fairly across the income spectrum? Alas, “fairness” like “beauty” is in the eye of the beholder. Many opponents of the bill say that the majority of the benefi ts will accrue to the highest earners. This is true: mostly because top earners in America pay the lion’s share of the income taxes, so it’s diffi cult to implement a tax cut without benefi ti ng top earners. For example, the top one percent pay about 40% of total federal income taxes, despite generati ng only 20% of the taxable income. The top 50% of earners pay 97% of the total income taxes. As Congress fi ddled with income taxes over the past four decades, they have steadily eliminated lower income earners from the tax rolls.
From an investor point of view, there are six key conclusions that can be gleaned from these tax cuts.
1. US economic growth will be signifi cantly enhanced in 2018 and 2019. I don’t buy the argument that this legislati on is likely to have a negligible eff ect on US economic growth. It consti tutes a signifi cant dose of fi scal sti mulus. Not only does it cut tax rates for both corporati ons and individuals, it also provides a fi ve-year window for companies to fully expense their investments in capital equipment. A boost, if not a boom, in capital investment spending is likely to follow. What’s more, many companies have recently announced $1000 bonuses for their employees. Soon, most employees will see a bump in take home pay due to lower withholding. I think 3% plus economic growth can conti nue at least through 2018. The tax cuts will increase the defi cit and thereby push up interest rates, which will eventually slow the economy. But that likely won’t become a problem in the next year or so.
2. The internati onal competi ti veness of American manufacturers will improve. Prior to this legislati on, the US had the highest corporate tax rate among major developed world economies. High US corporate taxes have been a major impediment to manufacturers located in the US. Currently, the world average corporate rate is about 29%. Adding in 4% for state and local taxes, the new US corporate tax rate will be about 25%. This lower tax rate will reduce, but not eliminate, corporate desires to take advantage of tax havens such as Ireland, Bermuda and the Cayman Islands. Most importantly, it will substanti ally improve the US manufacturers’ competi ti ve positi on in world markets. (At least unti l foreign countries begin to match our tax cuts.)
3. Corporate earnings will jump in 2018. Earnings will be about 10% higher in 2018 just because of the tax bill. However, as corporati ons adjust to the new legislati on, there will be “noise” in 4th quarter 2017 and 1st quarter 2018 earnings when some companies take write-downs to adjust to the new tax code. Using the S&P 500® index as a benchmark, 2017 earnings are esti mated to be about $130. Prior to the tax cut, 2018 earnings were expected to advance about 5 to 7%. Since the bill’s passage, analysts have been scrambling to raise their 2018 esti mates to about $155, a gain of about 19% over 2017. Using the S&P 500 close of $2674 at year-end, the stock market sells at 20.5 ti mes 2017 earnings, but for 2018 earnings it sells at a more reasonable 17.2 ti mes.
4. The tax bill’s corporate benefi ts will vary. The tax bill will benefi t companies and economic sectors with a large US base of business. As such, smaller capitalizati on companies will benefi t more than the larger multi nati onals, which usually have higher foreign sales. Among economic sectors, Consumer
~ The Huffi ngton PostDecember 18, 2017
The average household would pay $1600 less in taxes next year,
increasing after-tax incomes 2.2 percent according to the
nonpartisan Tax Policy Center . . . In 2025, the last year before the individual tax cuts expire, 76 percent of households would pay about $2500 less in taxes. But by 2027, only a quarter of taxpayers
would see a cut.
The Republican tax-overhaul plan will send about 10% of a
net $1.5 trillion tax cut directly to middle-income households . . . Households that earn $20,000 to $100,000 a year in wages, dividends and benefi ts will get
$144 billion in tax cuts in all over a decade, with most of those cuts coming in the early years of the decade and then petering out or reversing as tax cuts expire . . .
~Wall Street JournalSeptember 19, 2017

OPINION AND ANALYSIS OF KEY ECONOMIC AND INVESTMENT ISSUES Page Three
Discreti onary (retailers), Telecom Services, Industrials and Regional Banks are expected to be major benefi ciaries. The sectors benefi ti ng the least should be Energy, Technology and Materials, because of their relati vely high foreign sales content. Despite their domesti c orientati on, most Uti liti es are also unlikely to benefi t because their earnings power is heavily regulated.
5. Repatriati on of corporate cash held overseas won’t meet investor expectati ons. Many analysts predict a fl ood of cash being repatriated from the $2 trillion corporate cash hoard held overseas. This presumed fl ood will enable corporati ons to pay increased dividends, buyback stock, reti re debt and fund additi onal capital investment. It might even increase the value of the US dollar. The opti mists oft en base their predicti on on what happened in 2004, when legislati on opened up a window of opportunity to bring overseas cash back at a low 5.5% rate. The new tax bill should cause overseas corporate cash to fl ow back to the US, but it won’t be a fl ood—more likely a steady trickle. The new tax bill treats cash repatriati on diff erently than the 2004 legislati on. It taxes all unrepatriated foreign earnings at 15.5% over a period of eight years, whether the company brings cash back to the US or not. There is no window of opportunity to spur companies to take immediate acti on.
6. Debt-laden companies are likely to suff er, with negati ve implicati ons for the junk bond market. Historically, companies have been able to deduct from their taxes all interest payments on debt. In 2021, the amount of interest expense companies can deduct will be limited to 30% of EBITDA—earnings before interest, taxes, depreciati on and amorti zati on. This rule stays in eff ect unti l 2025, then the interest deducti on becomes even more onerous. As a result, the new rule will restrain credit availability to lower quality companies as well as make them more vulnerable to any rise in interest rates.
There is a lot to like in the new tax bill. But, with all major legislati on, there will be unintended consequences. The one I worry about is infl ati on. The Tax Cut and Jobs Act of 2017 applies a powerful dose of fi scal sti mulus to our economy which is already doing well. The US unemployment rate is a low 4.1%, with an increasing number of businesses citi ng shortages of skilled labor.
~ NFIB Jobs ReportNational Federation of Independent Business
January 4, 2018
The shortage of qualifi ed workers reached a record high
in December, and the number of small business owners who made plans to raise compensation was the second highest in history. . .
“Finding qualifi ed workers is now the second biggest concern
for small business owners,” said NFIB Chief Economist Bill
Dunkelberg. “Taxes occupied the top spot all of last year, but that
may drop as the recently enacted tax reform law takes effect. The worker shortage could very well become the number-one problem
for small businesses.”
0.0
1.0
2.0
3.0
4.0
5.0
6.0
1998
1999
2000
2001
2002
2003
2004
2005
2006
2007
2008
2009
2010
2011
2012
2013
2014
2015
2016
2017
2018
Perc
enta
ge (%
)
Atlanta Fed’s Wage Growth Tracker
Recessions
Source: Federal Reserve Bank of Atlanta
My #1 Economic Indicator for 2018: Wage Growth
Source: Federal Reserve Bank of Atlanta
OPINION AND ANALYSIS OF KEY ECONOMIC AND INVESTMENT ISSUES Page Four
Atlanta Capital Management Co., LLC1075 Peachtree Street NESuite 2100Atlanta, GA 30309
This material is presented for informati onal and illustrati ve purposes only and should not be construed as investment advice, a recommendati on to purchase or sell specifi c securiti es, or to adopt any parti cular investment strategy. The opinions expressed herein are those of the author and do not necessarily refl ect the views of other employees at Atlanta Capital Management. Any current investment views and opinions/analyses expressed consti tute judgments as of the date of this material and are subject to change at any ti me without noti ce. Index and commodity changes are based on price-only percentage change. This material has been prepared on the basis of publicly available informati on, internally developed data, and other third party sources believed to be reliable. However, no assurances are provided regarding the reliability of such informati on and Atlanta Capital has not sought to independently verify informati on taken from public and third party sources. This material may contain statements that are not historical facts, referred to as forward-looking statements. Future results may diff er signifi cantly from those stated in forward-looking statements, depending on factors such as changes in securiti es or fi nancial markets or general economic conditi ons. Investi ng entails risks and there can be no assurance that any forecasts or opinions expressed in this material will be realized. It is not possible to directly invest in an index. Past performance does not predict future results.
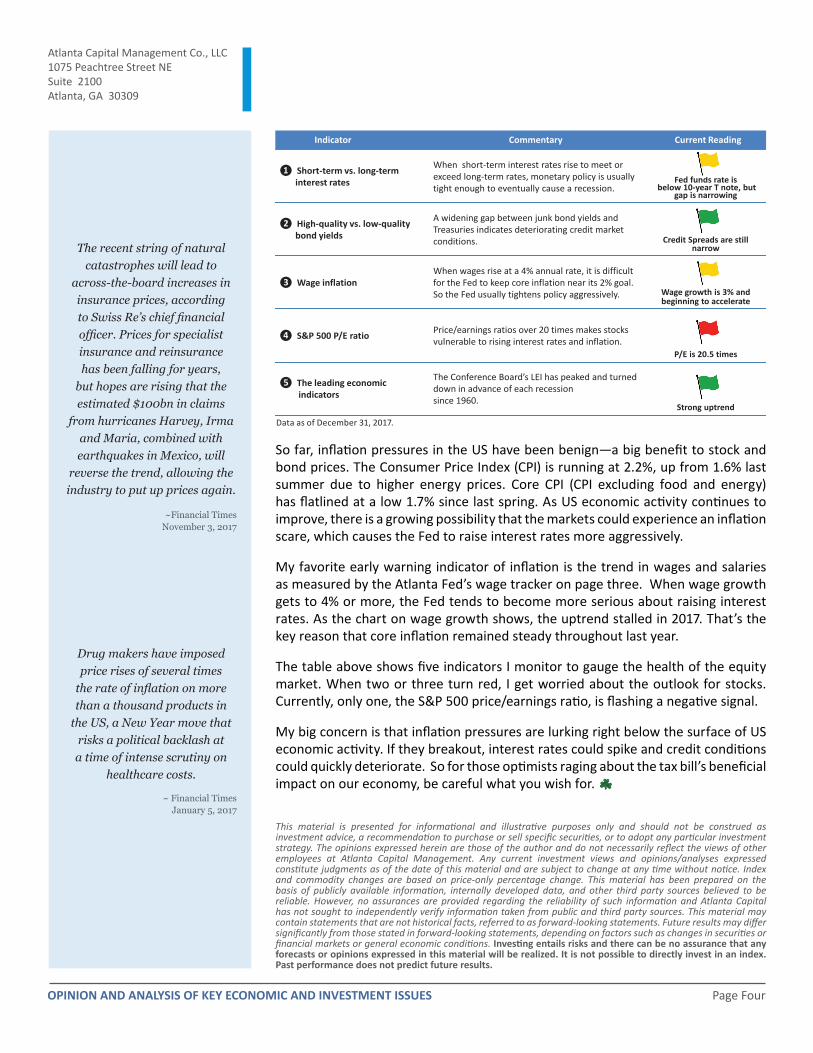
So far, infl ati on pressures in the US have been benign—a big benefi t to stock and bond prices. The Consumer Price Index (CPI) is running at 2.2%, up from 1.6% last summer due to higher energy prices. Core CPI (CPI excluding food and energy) has fl atlined at a low 1.7% since last spring. As US economic acti vity conti nues to improve, there is a growing possibility that the markets could experience an infl ati on scare, which causes the Fed to raise interest rates more aggressively.
My favorite early warning indicator of infl ati on is the trend in wages and salaries as measured by the Atlanta Fed’s wage tracker on page three. When wage growth gets to 4% or more, the Fed tends to become more serious about raising interest rates. As the chart on wage growth shows, the uptrend stalled in 2017. That’s the key reason that core infl ati on remained steady throughout last year.
The table above shows fi ve indicators I monitor to gauge the health of the equity market. When two or three turn red, I get worried about the outlook for stocks. Currently, only one, the S&P 500 price/earnings rati o, is fl ashing a negati ve signal.
My big concern is that infl ati on pressures are lurking right below the surface of US economic acti vity. If they breakout, interest rates could spike and credit conditi ons could quickly deteriorate. So for those opti mists raging about the tax bill’s benefi cial impact on our economy, be careful what you wish for.
Indicator Commentary Current Reading
❶ Short-term vs. long-terminterest rates
When short-term interest rates rise to meet or exceed long-term rates, monetary policy is usually tight enough to eventually cause a recession.
Fed funds rate isbelow 10-year T note, but
gap is narrowing
❷ High-quality vs. low-qualitybond yields
A widening gap between junk bond yields and Treasuries indicates deteriorating credit market conditions. Credit Spreads are still
narrow
❸ Wage inflationWhen wages rise at a 4% annual rate, it is difficult for the Fed to keep core inflation near its 2% goal. So the Fed usually tightens policy aggressively. Wage growth is 3% and
beginning to accelerate
❹ S&P 500 P/E ratio Price/earnings ratios over 20 times makes stocks vulnerable to rising interest rates and inflation.
P/E is 20.5 times
❺ The leading economic indicators
The Conference Board’s LEI has peaked and turned down in advance of each recession since 1960.
Strong uptrend
~ Financial TimesJanuary 5, 2017
Drug makers have imposed price rises of several times
the rate of infl ation on more than a thousand products in
the US, a New Year move that risks a political backlash at a time of intense scrutiny on
healthcare costs.
The recent string of natural catastrophes will lead to
across-the-board increases in insurance prices, according to Swiss Re’s chief fi nancial offi cer. Prices for specialist insurance and reinsurance has been falling for years,
but hopes are rising that the estimated $100bn in claims
from hurricanes Harvey, Irma and Maria, combined with earthquakes in Mexico, will
reverse the trend, allowing the industry to put up prices again.
~Financial TimesNovember 3, 2017
Data as of December 31, 2017.

Your Atlanta Capital Team
Michael Jaje, CFA Investment Specialist & Principal (404) 682-2498 [email protected]
Cheryl lnnerarity Portfolio Administrator (404) 682-2552 cheryl. [email protected]
ATLANTA CAPITAL INVESTMENT MANAGERS
1075 Peachtree Street NE I Suite 2100 I Atlanta I GA I 30309

Atlanta Capital Management Co., LLC As of December 31, 2017
• Founded in 1969 in Atlanta, Georgia
• Singular focus on High Quality stocks and bonds
• Owned by employees & Eaton Vance Corporation
• Employ 41 professionals (17 are equity partners)
Investment Franchises ($20.6 Billion)
Core Equity Management ($16.1 Billion)
Fixed Income SMID Cap
s13.2 bn I 2004
Core Equity
Growth Equity llllim Small Cap $2.1 bn I 1992 Select Equity
$818 mm I 2006
Assets under management I inception data of strategy.
ATLANTA CAPITAL INVESTMENT MANAGERS

Seasoned & Stable Investment Team
A focused team that combines the benefit of conducting independent fundamental research with the ability to make timely investment decisions.
11
Portfolio Managers
Matt Hereford, CFA 22 Yrs I 2002
Investment Specialist
• Portfolio managers are generalists and serve as both research analyst and portfolio manager • Our team does not rely on a research staff to generate ideas or perform fundamental research • Each portfolio manager conducts his own research while decisions are made on a consensus basis
Years industiy experience as of 12131/17 I year joined Atlanta Capital.
2
ATLANTA CAPITAL INVESTMENT MANACiERS

Consistent Growth & Stability in Earnings Key Tenet of Our Investment Philosophy
15%
12%
9%
6%
3%
Five-Year Rolling CAGR of As Reported Earnings Russell 2000® Index by Earnings Stability
0% ...... J L L l •r• "L LJQC! ' L J l J J L L .,...., Z:t " ~Y"Y J J L L l rnT y: ~~ J L J J J ~
(3%)
• •
88 89 90 91 92 93 94 95 96 97 98 99 00 01 02 03 04 05 06 07 08 09 10 11 12 13 14 15 16 17
Earnings Stability Above-Average Below-Average
Avg. 5-Year CAGR 6.9% 3.9%
Earnings Variability 1.7% 3.4%
# Positive Periods 120or100% 105 or88%
# Negative Periods Oor0%
15or12%
*Time period: January 1, 1988 - December 31, 2017. The Earnings Stability portfolios are modal portfolios formed and rebalanced monthly by Atlanta Capital based on Iha stocks in Iha Russell 2000® Index sorted by quality rankings. The Above-Average Earnings Stability and Below-Average Earnings Stability portfolios are provided to compare the aggregate of all companies in the index with High Quality S&P Rankings (B+ or Better) to those with Low Quality S&P Rankings (B or Below). The universe includes all Russell 2000® Index constituents with S&P Quality Rankings and prices greater than $1. Five-year historical earnings growth rates are calculated using a market capitalization-weighted methodology. The Russell 2000® Index is a widely-accepted measure of the U.S. small cap stock market. Indexes are unmanaged and it is not possible to directly invest in an index. The Above-Average Earnings Stability and Below-Average Earnings Stability portfolios were derived in part from the Russell Index Data and Frank Russell Company remains the source and owner of the Russell Index Data contained or reflected and all trademarks and copyrights. Sources: Russell, Standard & Poor's, Wilshire Atlas, Atlanta Capital. The material is based upon information that Russell, S&P, Wilshire and Atlanta Capital considers to be reliable, but neither Russell, S&P, Wilshire nor Atlanta Capital warrants its completeness, accuracy or adequacy and it should not be relied upon as such. This information is provided for illustrative purposes only and does not reflect historical results or predict future results for any particular Atlanta Capital investment strategy. The chart demonstrates the long-term trend; individual client results may vary. The material should not be considered investment advice or a recommendation to invest in a particular strategy. Reproduction or redistribution of this page in any form without express permission from Atlanta Capital is prohibited. Above-average earnings stability does not guarantee outperformance. Past performance does not predict future results.
ATLANTA CAPITAL INVESTMENT MANAGERS
3

Investment Objective April 1, 1992 - December 31, 2017
40%
30%
20%
10%
0%
Our objective is to participate in rising markets, protect capital during declining markets, and outperform over the long term ...
RISING MARKETS DECLINING MARKETS SINCE INCEPTION* (70 Positive Quarters)
Net of Fees (33 Negative Quarters)
Net of Fees (103 Total Quarters)
Net of Fees
Upside Reward + Downside Protection = Long-Term Results
0%
·10%
·20%
-30%
-40%
Beta • HQ Small I R2000® •
0.71 11.00
13%
11%
9%
7%
5%
Standard Deviation • HQ Small I R2000® •
14.9% 119.3%
... without the volatility typically associated with small cap investing. 'Inception data of the High Quality Small Capitalization Composite is April 1, 1992. For illustrative purposes only. The charts above illustrate the average (annualized) return of the High Quality Small Capitalization Composite during both rising and declining markets since inception. Results for other time periods may differ from the long-term trend shown above. Rising markets are defined as quarters where the return of the Russell 2000® index was positive. Declining markets are defined as quarters where the return of the Russell 2000® index was negative. These positive and negative quarters are separated out from the intervening quarters, cumulated across the period, and annualized. Long-term investment returns include both rising and declining periods. Composite performance is shown in US dollars and reflects reinvestment of all income and capital gains. Composite performance is shown net of investment advisory fees using a maximum annual investment management fee of 0.80% applied monthly; client results will be reduced by custody fees and other client expanses. Performance during certain periods reflects strong stock market performance that is not typical and may not be repeated. Individual client returns will vary due to fees, client-imposed investment constraints and client inception date. Beta measures the historical sensitivity of portfolio excess returns to movements in the excess return of the market index. Standard Deviation is a measure of absolute volatility of returns. The Russell 2000® index is unmanaged and does not incur management fees or other expanses associated with managed accounts. It is not possible to directly invest in an index. This material is supplemental to the GIPS® presentation included at the and of this presentation. Please sea the GIPS® composite presentation for important additional information and disclosure. Past performance does not predict or guarantee future results. Source: aVestment and Atlanta Capital. ATLANTA CAPITAL
INVESTMENT MANAGERS
4

Disciplined Investment Process High Quality Small Cap Equity
Step 1. Create a 'Focus List' of High Quality Companies
Exclude companies with:
• Volatile earnings streams
• Short operating histories
• High levels of debt
• Weak cash flow generation
.... +~ ...
Step 3. Construct a Focused Yet Well-Diversified Portfolio
* 3-year average turnover based on a single representative client portfolio and subject to change; individual client results may vary.
• Low returns on capital
Step 2. Conduct 'Onsite' Fundamental Research
5
Step 4. Monitor Holdings & Review Focus List
ATLANTA CAPITAL INVESTMENT MANAGERS

Summary of Guidelines City of Pasadena Fire & Police Retirement System
Objective • Over rolling three-year periods, the account will be expected to achieve the following:
Outperform the return of the Russell 2000® Index.
Provide a rate of return which ranks in the top half of the Mercer US Small Mid Cap Core Equity Universe.
Generate a standard deviation of quarterly returns which does not exceed that of the Russell 2000® Index by more than 50% without a proportionate percentage increase in return achieved.
Guidelines • No more than 7% of the portfolio's total market value shall be invested in cash.
• The market cap of securities held will generally be within the range of stocks comprising the Russell 2000® Index. Atlanta Capital defines a small cap company as one with a market capitalization greater than the market capitalization of the smallest company in the Russell 2000® Index and less than three times the weighted average market capitalization of companies in that Index. The portfolio management team will generally not initiate a position in a company unless it has a market capitalization between $200 million and $3.0 billion.
• The account's exposure to the securities of any one issuer is limited to the greater of 7.5% of the total account at market value or the benchmark weight of the security plus 2%.
• Portfolio sector allocations is limited to a maximum of 200% of the weight of the sector in the benchmark index or 30%, whichever is greater, with the exception of sectors whose benchmark allocation is less than 5%, where the maximum allocation shall be 15%.
• The account may hold non-U.S. companies up to a maximum of 10% of the total account at market value. All issues must be denominated in US dollars.
Trading • Investment Managers shall effect all purchases and sales of securities for the account in a manner consistent with the
principals of best execution, taking into account net price (including commissions), execution capability and other services which the broker or dealer may provide.
ATLANTA CAPITAL INVESTMENT MANAGERS
6

Summary of Guidelines City of Pasadena Fire & Police Retirement System
Proxy Voting • All proxies shall be voted at the Investment Managers' discretion in the best interests of the participants of the system's
constituent base.
Investment Policy Date: July 2011. Amended February 2015
ATLANTA CAPITAL INVESTMENT MANAGERS
7

Annualized Performance As of December 31, 2017
City of Pasadena Fire and Police Retirement System
QTD (%)
YTD (%)
1 Yr (%)
3 Yrs*
(%) 5 Yrs*
(%)
7 Yrs*
(%)
10 Yrs*
(%)
Since Inception*
(%)
High Quality Small Cap 5.40 15.15 15.15 13.37 16.45 14.83 - 17.83
Russell 2500 - 2000 (03/01/15) Periods < 03/01/15 represent SMID
3.34 14.65 14.65 10.40
Account Summary
Performance Inception Date:
Net Investment Contributions:
Investment Dollars Earned:
Market Value (12/31/17):
"Time periods greater than one year are annualized. Performance reflects reinvestment of all income and capital gains (realized and unrealized). Results are based on the accrual method of accounting as well as trade dale valuation. Returns are gross of fees unless otherwise noted.
14.54
June 30, 2009
($5,565,985)
$10,524,021
$4,958,036
Gross of fee returns do not reflect the deduction of management and custodial fees. Net of fee returns reflect the deduction of the management fee accrued on a monthly basis. Returns are based on the total assets of the client's account, calculated on a daily basis, and geometrically linked to calculate returns for longer periods of time. The unmanaged indexes shown for comparative purposes do not reflect the subtraction of any fees or transaction costs. II is not possible to directly invest in an index. Past performance does not guarantee or predict future results.
8
12.39 16.34
ATLANTA CAPITAL INVESTMENT MANAGERS

Performance Drivers & Detractors As of December 31, 2017 City of Pasadena Fire and Police Retirement System
Total Portfolio
vs. Russell 2000® Index
Sector Allocation
Stock Selection
Excess Return
Last3-Mos. Attribution
(%)
I o.6
" 1.5
- 2.1
+ Positive stock selection in Technology, Financials, Health Care, and Consumer Discretionary
+ Overweight in Consumer Staples, Consumer Discretionary, Industrials
+ Underweight Real Estate, Utilities, Telecom, and Health Care
- Negative stock selection in Industrials and Materials
- Overweight Technology
Underweight Energy
Sector Allocation
Stock Selection
Excess Return
Last 12-Mos. Attribution
(%)
I 0.1
I 0.3
I 0.4
+ Positive stock selection in Industrials, Consumer Staples, Real Estate, and Energy
+ Underweight in Energy, Real Estate, Financials, and Telecom
+ Overweight Industrials
- Negative stock selection in Consumer Discretionary, Materials, Technology, and Health Care
Underweight in Health Care
- Overweight in Consumer Staples and Technology
Stock Selection + Sector Allocation = Excess Return Source: Factset The above attribution results are based on each day's ending holdings, and linked to generate attribution over longer periods. Cash in the portfolio is included in the analysis. Portfolio returns do not reflect applicable expenses and trading costs, or variations in transaction prices from end of day values.
9
ATLANTA CAPITAL INVESTMENT MANAGER$
Portfolio Transactions Last 3-Months Ending December 31, 2017 City of Pasadena Fire and Police Retirement System High Quality Small Cap
New Purchases none this quarter
10
ATLANTA CAPITAL INVESTMENT MANAGERS

Portfolio Transactions Last 3-Months Ending December 31, 2017 City of Pasadena Fire and Police Retirement System High Quality Small Cap
Complete Sales Health Care
Advisory Board Co.
Bio-Rad Labs
Industrials
Provides best practice consulting for Health Care and Educational clients. The company's previously announced acquisition was completed during the quarter.
Produces reagents, apparatus, and instruments used in life sciences and Clinical Laboratories. We sold as the company's market capitalization has appreciated to the high end of our threshold.
Graco Produces equipment used to pump, meter, mix and dispense a wide variety of fluids. We sold the position as the company's market capitalization has appreciated to the high end of our threshold.
HEICO Corp. A Designs and manufactures parts and performs repairs for aerospace and aviation end markets. We sold as the company's market capitalization has appreciated to the high end of our threshold.
Knight-Swift Transportation Inc Offers trucking and logistical solutions. We sold the position after the completed merger between Knight and Swift drove the market cap to the high end of our threshold.
ATLANTA CAPITAL INVESTMENT MANAGERS
11

Portfolio Characteristics As of December 31, 2017 City of Pasadena Fire and Police Retirement System High Quality Small Cap
Top Ten Holdings o/o Portfolio Metrics
Manhattan Associates 4.2 WEX 3.7 Metrics Corelogic 3.3
#of Holdings AptarGroup 2.9 Black baud 2.9 Wtd. A\g. Mkt. Cap (billions)
Choice Hotels lnt'I 2.9 Historical Earnings Growth
Morningstar 2.8 Forecasted Earnings Growth Exponent 2.7 Return on Equity Fair Isaac Corp. 2.7 Price/Earnings (NTM) Columbia Sportswear 2.6 Dividend Yield
Sector Exposure
Russe II 2000® Index
1,983 $2.4 9% 13% 6%
18.7x 1.2%
45
40
35
30
• Total Portfolio • Russell 2000® Index
25 23.2
Total Portfolio
56 $3.4 6% 11% 17%
22.4x 0.9%
20 1 16.6 17.9 17.717.8 16.1 15.4 15.3 15 12~
10 7.3 6.2 5 7 6.7 : 111 1111 ·~ .I m; ~· ~: ·~ ... . .. : : ... Information Industrials Financials Consumer Consumer Health Care Materials Real Estate Energy Technology Discretionary Staples
Source: FactSet. Sector weight percentages shown are percentages of total equities.
12
Tele comm Services
Utilities Cash
ATLANTA CAPITAL INVESTMENT MANAGERS

Current Portfolio Holdings As of December 31, 2017
City of Pasadena Fire and Police Retirement System High Quality Small Cap
Sector
Consumer Discretionary
Bright Horizons (BFAM)
Oloice Hotels lnt'I (CHH)
Colurrt>ia Sportswear (COLM)
Domen A"oducts (DORM)
IVbnro (~RO)
Pool Corp. (POOL)
Sally Beauty Hldgs. (SBH)
Sonic Corp. (SONG)
Wolverine World Vllide (WWW)
Consumer Staples
Casey's General Stores (CASY)
.,ter Parfums (IPAR)
J&J Snack Foods Corp. (JJSF)
Lancaster Colony Corp. (LANG)
Dril-Quip (DRQ)
Financials
Artisan Partners (APAM)
BERlb.BANK Corp. (IBKC)
IVbrningstar (II/ORN)
Navigators Group (NAVG)
Pinnacle Fin'I Partners (PNFF?
A"osperily Bancshares (PB)
RU Corp. (RLO
Ending Weight
lmlml 1.3%
2.9%
2.6%
1.8%
1.4%
2.1%
1.7%
1.1%
1.1% ~~ ~ llllllYi&I
2.3%
2.0%
1.8%
1.3%
m'IEI 0.9% ~ mft'!'!!'ll ~~
1.5%
1.5%
2.8%
1.6%
1.5%
1.8%
1.2%
South State Corp. (SSB) 1.2%
State Bank Financial (SlBZ) 1.7%
Urrpqua Holdings Corp. (l.M'Q) 1.2%
Westarrerica Bancorp. (WABC) 1.5%
Source: FactSet.
Health Care
Bio-Techne (TECH)
ICU Medical (ICUO
.,tegra LifeSciences (IARl)
Patterson Corrpanies (PDCO)
Industrials
AAON(AAON)
Beacon Roofing Supply (BECN)
Exponent (EXPO)
Forward Air (FWRD)
Huron Consulting Group (HURN)
Kirby Corp. (KEX)
Landstar System (LSTR)
IVbog (11/0G.A)
Raven Industries (RAVN)
UniFirst Corp. (UNF)
US Ecobgy (ECOL)
13
IBl•fJi'4! 2.1%
1.2%
1.7%
1.1%
ID!l•fJ!f4! 1.0%
1.6%
2.7%
1.8%
1.0%
2.2%
1.8%
2.1%
0.9%
1.8%
1.0%
• High Quality Small Cap
• Russell 2000® Index
Information Technology
Blackbaud (BLKB)
Cass lnforrretion Sys (CASS)
CoreLogic (CLGX)
Envestnet (ENV)
ePius (PLUS)
Fair Isaac Corp. (Fro)
Manhattan Associates (MANH)
National .,strurrents (NA TO
Pow er lnteg rations ( POV'v1)
ScanSource (SCSC)
WCX(WCX)
Materials
AptarGroup (A TR)
Balchem Corp. (BCPC)
Sensient Technologies Corp. (SXT)
Stepan Co. (SCL)
Real Estate
Universal Health Realty (UHT)
Telecommunication Services
Utilities
Cash
aunm 2.9%
0.9%
3.3%
1.3%
1.0%
2.7%
4.2%
1.4%
1.1%
0.9%
3.7%
•t•mm 2.9%
1.0%
1.0%
0.8% ., .... 1.0%
•·n•m::.11 •M•llm •is·•mi!ll
ATLANTA CAPITAL INVESTMENT MANAGERS

Investment Outlook & Strategy As of December 31, 2017
High Quality Small Cap
Outlook
• U.S. equity investors had a lot to cheer about as 2017 drew to a close. Economic growth has been accelerating both here and abroad, inflation and interest rates remain low, and recently passed U.S. tax law should provide a meaningful one-time boost to corporate earnings in 2018.
• Small cap U.S. markets (represented by the Russell 2000® Index) gained 3.3% during the quarter, reaching new all-time highs.
• As small cap markets continue to move higher, valuations continue to be a major challenge. While positive economic growth and low interest rates continue to drive markets higher, they also increase the risk of inflationary surprises that could cause the Fed to become more aggressive.
Portfolio Positioning
• During the quarter, we sold five positions entirely from the portfolio. Four of the sales were due to the stocks reaching the high end of our market cap threshold, and the fifth stock was acquired.
• At quarter end, the portfolio held 56 stocks representing nine of the eleven economic sectors in the Russell 2000®.
• Relative to the benchmark, the portfolio was overweight Technology, Consumer Staples, Consumer Discretionary, Industrials, and Materials.
• The portfolio was underweight Health Care, Real Estate, Energy, and Financials. There are no positions in Utilities or Telecom Services.
ATLANTA CAPITAL INVESTMENT MANAGERS
14

GIPS® Performance Information and Disclosure High Quality Small Capitalization Composite (E7)
January 1, 2007 through December 31, 2017
Period Composite Composite Russell 2000® Composite Russell 2000®
Gross Return(%) Nat Return (%) Return(%) 3-yr Std. Dav. (%) 3-yr Std. Dav. (%)
2017(1) 14.77 13.87 14.65 10.95 13.91
2016 19.00 18.07 21.31 12.69 15.76
2015 5.12 4.29 -4.41 12.68 13.96
2014 3.60 2.78 4.89 10.52 13.12
2013 42.34 41.24 38.82 12.80 16.45
2012 12.24 11.36 16.35 16.63 20.20
2011 10.31 9.44 -4.18 21.88 24.99
2010 25.98 24.99 26.86 24.41 27.69
2009 27.17 26.18 27.17 21.69 24.83
2008 -19.41 -20.06 -33.79 16.62 19.85
2007 6.77 5.92 -1.57 10.66 13.17
(1) Period- 01/01/2017 through 12131/2017. Past performance does not predict or guarantee future results.
Number of Internal Composite Firm Portfolios Dispersion (%) Assets ($mil) Assets ($mil)
49 0.21 1,551 20,606
53 0.19 1,544 17,646
54 0.16 1,259 16,054
56 0.24 1,235 16,707
57 0.51 1,294 18,082
60 0.22 996 14,235
60 0.25 1,023 11,964
49 0.19 737 9,845
36 0.34 639 7,748
38 0.34 494 6,199
37 0.25 551 8,828
Atlanta Capital Management Company, LLC claims compliance with the Global Investment Performance Standards (GIPS") and has prepared and presented this report in compliance with the GIPS Standards. Atlanta Capital Management has bean independently verified for the periods January 1, 1999 through December 31, 2016.
Verification assesses whether (1) the firm has complied with all the composite construction requirements of the GIPS standards on a firm-wide basis and (2) the firm's policies and procedures are designed to calculate and present performance in compliance with the GIPS standards. The High Quality Small Capitalization Composite has bean examined for the periods January 1,1999 through December 31, 2016. The verification and performance examination reports are available upon request.
Composite Description: The investment objective of this style is to seek long-term capital growth. Accounts in this composite invest in common stocks of companies having market capitalizations within the range of companies comprising the Russell 2000®. Management seeks to invest in quality companies in strong financial condition whose equities are priced below their estimate of fair value. Characteristics of high quality companies include a history of sustained growth in earnings and operating cash flow, high returns on capital, attractive profit margins and leading industry positions. Investments are determined based primarily on fundamental analysis of a company's financial trends, products and services, and other factors. Financial quality rankings provided by nationally-recognized rating services may be utilized as part of the investment analysis but are not solely relied upon. The portfolios are broadly diversified. All fully discretionary accounts that are managed in this style and do not pay a bundled or SMA wrap fee are eligible for inclusion in the composite. Benchmark: The Russell 2000® Index includes the smallest 2000 companies in the Russell 3000® and is a widely accepted measure of the small-cap segment of the U.S. equity universe. The index is the benchmark used to evaluate the strategy's performance and characteristics within the small-<:ap U.S. equity universe. Strategy investments differ from the benchmark due to active management, exclusion/inclusion of securities held/not held in the index, over/underweighting specific sectors or securities, limitations in market cap, and/or client constraints. Prior to July 1, 2005, the composite was also compared to the Russell 2000® Value Index as the portfolio construction process produced both core and value characteristics. Our high quality investment philosophy tends to be defensive in nature and does consider valuation metrics, but ii is more consistent with the philosophy and process of a core manager than a value manager. As of July 1, 2015, to clarify our process for potential clients, we determined that it was most appropriate to benchmark our performance results against the Russell 2000® Index only. Indexes include the reinvestment of dividends and earnings, are unmanaged, and do not incur management fees, transaction costs or other expenses associated with separately managed accounts. It is not possible to directly invest in an index. Gross and Nat Returns: Performance reflects reinvestment of all income and capital gains. Composite returns and market values are reported in U.S. dollars. Gross-<Jf-fees performance returns are presented before management and custodial fees but after all trading expenses. Returns ara presented net of withholding taxes. Net-of-fees performance returns are calculated by deducting the highest management fee of 0.80% from the monthly gross-of-fees returns. Other expenses will reduce a client's returns. The annual fee schedule for this composite is as follows: 0.80% on the first $50 million in assets; 0. 70% on the next $50 million in assets; 0.60% on the next $150 million. Actual management fees incurred by clients may vary. Dispersion: The annual internal composite dispersion is calculated using the asset-weighted standard deviation of annual gross returns of those portfolios that were included in the composite for the entire year. The three-year annualized standard deviation measures the variability of the composite and the benchmark returns over the preceding 36-month period. Notes: The creation date of this composite is July 1992. Effective July 1, 2010, the composite was redefined to include both taxable and tax-exempt institutional accounts. The composite up to that time included only tax-exempt institutional accounts. The change provides increased transparency to prospective clients by reducing the number of separate composites maintained for this strategy. There has been no change in investment objective or management style. Clients or prospective clients should not assume that they will have an investment experience similar to that indicated by past performance results, as shown on the Schedule. Returns may vary based upon differences in account size, timing of transactions and market conditions at the lime of investment. Performance during certain lime periods reflects the strong stock market performance and/or the strong performance of stocks held during those periods. This performance is not typical and may not be repeated. Firm Definition: Atlanta Capital Management Company, LLC (Atlanta Capital or the Firm) is an SEC-registered investment adviser located in Atlanta, Georgia. The Firm became a majority-owned subsidiary of Eaton Vance Corp. in 2001. Atlanta Capital operates as an independent subsidiary of Eaton Vance and provides professional investment advisory services to a broad range of institutional and individual clients, and sub-advisory investment management to mutual funds and separately managed sub-advisory account programs. Atlanta Capital includes all discretionary accounts under management in its composites; firm assets include nondiscretionary accounts as well. The Firm's list of composite descriptions and policies for valuing portfolios, calculating performance and preparing compliant presentations ara available upon request. To request any additional information, please contact the Atlanta Capital Management Performance Department at 404-876-9411 or write to Atlanta Capital Management Company, LLC, 1075 Peachtree Street NE, Suite 2100, Atlanta, Georgia 30309, Attention Performance Department.
Atlanta Capital High Quality Small Capitalization Composite
Composite Gross of Faas
Composite Nat of Faas
Russell 2000® Index
"Inception date is April 1, 1992. 01.10.18
1 Year 3Years
14.77 12.81
13.87 11.93
14.65 9.96
Annualiud Returns (%) for Periods Ending December 31, 2017 Cumulative (%)
5Years 7Yaars 10 Years Since Inception• Since Inception•
16.19 14.76 12.97 12.96 2204.57
15.27 13.86 12.08 12.06 1777.32
14.12 11.62 8.71 9.67 975.98
ATLANTA CAPITAL INVESTMENT MANAGERS
15

co .....
CITY OF PASADENA FIRE AND POLICE RETIREMENT SYSTEM
EQUITIES
CONSUMER DISCRETIONARY CONSUMER STAPLES ENERGY FINANCIALS HEALTH CARE INDUSTRIALS INFORMATION TECHNOLOGY MATERIALS REAL ESTATE
SUBTOTAL EQUITIES
INVESTABLE CASH
EQUITY CASH
TOTAL
ACCRUED DIVIDENDS
TOTAL PORTFOLIO
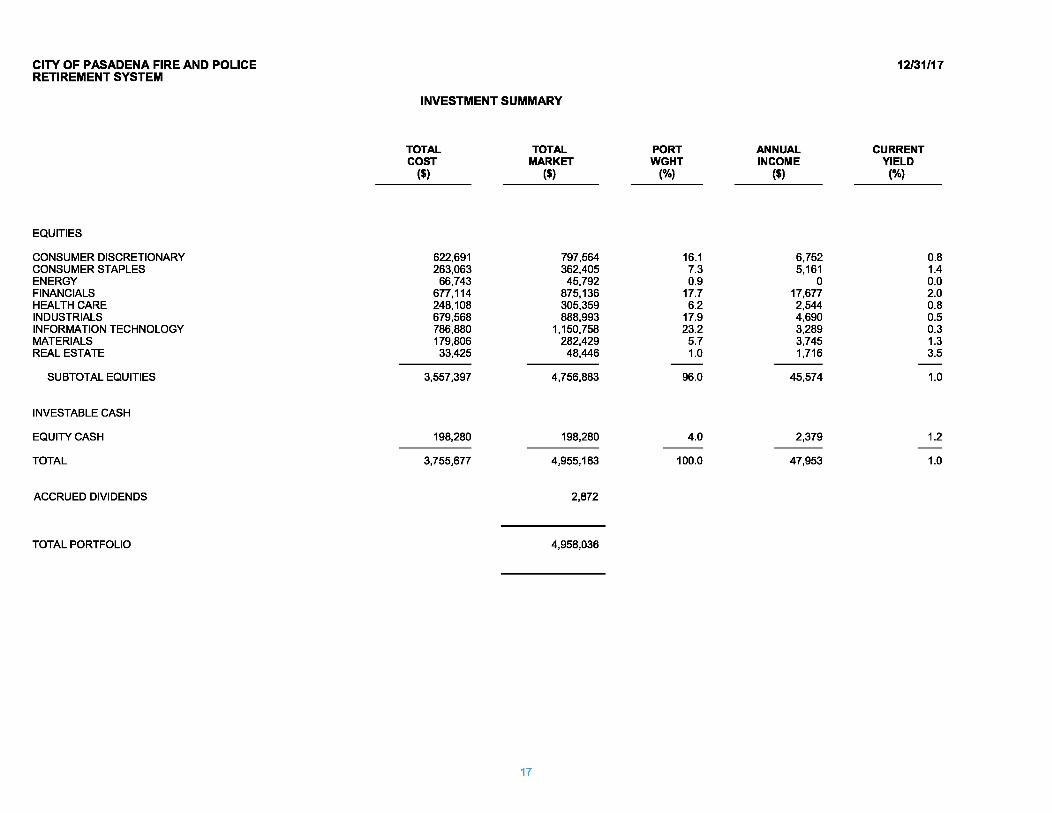
INVESTMENT SUMMARY
TOTAL COST
($)
622,691 263,063
66,743 677,114 248,108 679,568 786,880 179,806 33,425
3,557,397
198,280
3,755,677
TOTAL MARKET
($)
797,564 362,405
45,792 875,136 305,359 888,993
1, 150,758 282,429
48,446
4,756,883
198,280
4,955,163
2,872
4,958,036
17
PORT WGHT
(%)
16.1 7.3 0.9
17.7 6.2
17.9 23.2
5.7 1.0
--96.0
4.0 ---
100.0
ANNUAL INCOME
($)
6,752 5,161
0 17,677 2,544 4,690 3,289 3,745 1,716
45,574
2,379
47,953
12/31/17
CURRENT YIELD
(%)
0.8 1.4 0.0 2.0 0.8 0.5 0.3 1.3 3.5
--1.0
1.2 --
1.0

CITY OF PASADENA FIRE AND POLICE 12/31/17 RETIREMENT SYSTEM
ASSET STATEMENT
SECURITY COST/ MARKET/ TOTAL TOTAL PORT ANNUAL CURRENT DESCRIPTION SHARE SHARE COST MARKET WHTG INCOME YIELD
SHARES ($) ($) ($) ($) (%) ($) (%) --
EQUITIES
CONSUMER DISCRETIONARY
BRIGHT HORIZONS FAMILY SOL 687 64.94 94.00 44,614 64,578 1.3 0 0.0 CHOICE HOTELS INT'L INC 1,880 60.26 77.60 113,285 145,888 2.9 1,617 1.1 COLUMBIA SPORTSWEAR CO 1,775 38.87 71.88 68,985 127,587 2.6 1,349 1.1 DORMAN PRODUCTS INC 1,469 47.49 61.14 69,766 89,815 1.8 0 0.0 MONRO INC 1,250 63.19 56.95 78,992 71, 188 1.4 900 1.3 POOL CORP 797 69.18 129.65 55,138 103,331 2.1 1,180 1.1 SALLY BEAUTY HOLDINGS INC 4,602 19.92 18.76 91,657 86,334 1.7 0 0.0 SONIC CORP 2,049 24.90 27.48 51,025 56,307 1.1 1,311 2.3 WOLVERINE WORLD WIDE INC 1,648 29.87 31.88 49,228 52,538 1.1 396 0.8
-- --- --622,691 797,564 16.1 6,752 0.8
CONSUMER STAPLES
CASEY'S GEN'L STORES INC 1,017 91.46 111.94 93,017 113,843 2.3 1,058 0.9 INTER PARFUMS INC 2,277 28.87 43.45 65,732 98,936 2.0 1,913 1.9 J&J SNACK FOODS CORP 577 101.45 151.83 58,535 87,606 1.8 1,039 1.2 LANCASTER COLONY CORP 480 95.37 129.21 45,780 62,021 1.3 1,152 1.9
-- -- --- -263,063 362,405 7.3 5, 161 1.4
ENERGY
DRIL-QUIP INC 960 69.52 47.70 66,743 45,792 0.9 0 0.0
FINANCIALS
ARTISAN PARTNERS ASSET MGMT INC 1,869 46.40 39.50 86,720 73,826 1.5 4,486 6.1 IBERIABANK CORP 987 63.28 77.50 62,460 76,493 1.5 1,461 1.9 MORNINGSTAR INC 1,450 50.67 96.97 73,470 140,607 2.8 1,450 1.0 NAVIGATORS GROUP INC 1,661 45.43 48.70 75,467 80,891 1.6 399 0.5 PINNACLE FINANCIAL PARTNERS 1, 110 43.56 66.30 48,355 73,593 1.5 622 0.8 PROSPERITY BANCSHARES INC 1,293 54.57 70.07 70,558 90,601 1.8 1,862 2.1 RU CORP 1,003 49.72 60.66 49,866 60,842 1.2 843 1.4 SOUTH STATE CORP 681 90.06 87.15 61,328 59,349 1.2 899 1.5 STATE BANK FINANCIAL CORP 2,877 20.14 29.84 57,942 85,850 1.7 1,611 1.9 UMPQUA HOLDINGS CORP 2,917 13.00 20.80 37,924 60,674 1.2 2,100 3.5
18

CITY OF PASADENA FIRE AND POLICE 12/31/17 RETIREMENT SYSTEM
ASSET STATEMENT
SECURITY COST/ MARKET/ TOTAL TOTAL PORT ANNUAL CURRENT DESCRIPTION SHARE SHARE COST MARKET WHTG INCOME YIELD
SHARES ($) ($) ($) ($) (%) ($) (%) --
EQUITIES -cont.
FINANCIALS - cont.
WESTAMERICA BANCORPORATION 1,216 43.60 59.55 53,023 72,413 1.5 1,946 2.7 -- --
677,114 875,136 17.7 17,677 2.0
HEALTH CARE
BIO-TECHNE CORP 823 98.30 129.55 80,903 106,620 2.2 1,053 1.0 ICU MEDICAL INC 284 126.11 216.00 35,815 61,344 1.2 0 0.0 INTEGRA LIFESCIENCES HOLDINGS 1,789 42.62 47.86 76,253 85,622 1.7 0 0.0 PATTERSON COMPANIES INC 1,433 38.48 36.13 55,137 51,774 1.0 1,490 2.9
-- --- --248,108 305,359 6.2 2,544 0.8
INDUSTRIALS
AAON INC 1,405 23.90 36.70 33,580 51,564 1.0 365 0.7 BEACON ROOFING SUPPLY INC 1,210 31.07 63.76 37,590 77,150 1.6 0 0.0 EXPONENT INC 1,876 45.00 71.10 84,419 133,384 2.7 1,576 1.2 FORWARD AIR CORP 1,537 52.98 57.44 81,438 88,285 1.8 922 1.0 HURON CONSUL TING GROUP INC 1,230 58.00 40.45 71,338 49,754 1.0 0 0.0 KIRBY CORP 1,632 54.58 66.80 89,069 109,018 2.2 0 0.0 LANDSTAR SYSTEM INC 862 57.62 104.10 49,670 89,734 1.8 345 0.4 MOOG INC CL A 1,203 76.00 86.85 91,428 104,481 2.1 0 0.0 RAVEN INDUSTRIES INC 1,327 20.35 34.35 27,000 45,582 0.9 690 1.5 UNIFIRST CORP 544 123.67 164.90 67,276 89,706 1.8 82 0.1 US ECOLOGY INC 987 47.38 51.00 46,760 50,337 1.0 711 1.4
- -- --679,568 888,993 17.9 4,690 0.5
INFORMATION TECHNOLOGY
BLACKBAUD INC 1,535 23.40 94.49 35,921 145,042 2.9 737 0.5 CASS INFORMATION SYSTEMS INC 793 46.19 58.21 36,627 46,161 0.9 692 1.5 CORELOGIC INC 3,510 36.60 46.21 128,461 162, 197 3.3 0 0.0 ENVESTNET INC 1,254 48.18 49.85 60,424 62,512 1.3 0 0.0 EPLUS INC 652 90.40 75.20 58,943 49,030 1.0 0 0.0 FAIR ISAAC CORP 863 15.59 153.20 13,454 132,212 2.7 69 0.1
19

CITY OF PASADENA FIRE AND POLICE 12/31/17 RETIREMENT SYSTEM
ASSET STATEMENT
SECURITY COST/ MARKET/ TOTAL TOTAL PORT ANNUAL CURRENT DESCRIPTION SHARE SHARE COST MARKET WHTG INCOME YIELD
SHARES ($) ($) ($) ($) (%) ($) (%) --
EQUITIES -cont.
INFORMATION TECHNOLOGY -cont.
MANHATTAN ASSOCIATES INC 4,186 48.20 49.54 201,778 207,374 4.2 0 0.0 NATIONAL INSTRUMENTS CORP 1,636 30.72 41.63 50,261 68,107 1.4 1,374 2.0 POWER INTEGRATIONS INC 744 59.40 73.55 44,192 54,721 1.1 417 0.8 SCANSOURCE INC 1, 171 37.27 35.80 43,640 41,922 0.8 0 0.0 WEXINC 1,285 88.08 141.23 113,179 181,481 3.7 0 0.0
-- --- --786,880 1,150,758 23.2 3,289 0.3
MATERIALS
APTARGROUP INC 1,691 44.40 86.28 75,078 145,899 2.9 2,164 1.5 BALCHEM CORP 608 58.49 80.60 35,564 49,005 1.0 255 0.5 SENSIENT TECHNOLOGIES CORP 674 73.34 73.15 49,430 49,303 1.0 890 1.8 STEPAN CO 484 40.77 78.97 19,735 38,221 0.8 436 1.1
-- -- --- --179,806 282,429 5.7 3,745 1.3
REAL ESTATE
UNIVERSAL HEAL TH RL TY INCOME TR 645 51.82 75.11 33,425 48,446 1.0 1,716 3.5 -- --
3,557,397 4,756,883 96.0 45,574 1.0
INVESTABLE CASH
20

CITY OF PASADENA FIRE AND POLICE RETIREMENT SYSTEM
SECURITY DESCRIPTION
EQUITY CASH
TOTAL
ACCRUED DIVIDENDS
TOTAL PORTFOLIO
COST/ SHARE
SHARES ($) -
198 0.00
ASSET STATEMENT
MARKET/ TOTAL SHARE COST
($) ($)
1000.00 198,280
3,755,677
21
12/31/17
TOTAL PORT ANNUAL CURRENT MARKET WHTG INCOME YIELD
($) (%) ($) (%)
198,280 4.0 2,379 1.2 --- --
4,955,163 100.0 47,953 1.0
2,872
--4,958,036

CITY OF PASADENA FIRE AND POLICE RETIREMENT SYSTEM
SECURITY
EQUITIES
SONIC CORP SONIC CORP SOUTH STATE CORP SOUTH STATE CORP EPLUS INC PATTERSON COMPANIES INC PATTERSON COMPANIES INC PATTERSON COMPANIES INC SONIC CORP SONIC CORP SONIC CORP SOUTH STATE CORP EPLUS INC SONIC CORP SOUTH STATE CORP EPLUS INC SOUTH STATE CORP EPLUS INC SOUTH STATE CORP DORMAN PRODUCTS INC DORMAN PRODUCTS INC DORMAN PRODUCTS INC DORMAN PRODUCTS INC DORMAN PRODUCTS INC EPLUS INC EPLUS INC PATTERSON COMPANIES INC SONIC CORP SOUTH STATE CORP SONIC CORP SONIC CORP SOUTH STATE CORP SOUTH STATE CORP
TRANSACTION SCHEDULE - PURCHASES
PAR/ SHARES
73 166 46 50
9 1
44 336
62 88
317 34 18
121 15 18 26 82 55
3 13 10 17 14 61 88
264 190
51 75
168 27 61
FROM: 10/01/17 TO: 12/31/17
TRADE DATE
10/02/17 10/02/17 10/02/17 10/03/17 10/09/17 10/09/17 10/09/17 10/09/17 10/09/17 10/09/17 10/09/17 10/09/17 10/10/17 10/10/17 10/10/17 10/11/17 10/11/17 10/12/17 10/12/17 10/17/17 10/17/17 10/18/17 10/18/17 10/19/17 10/26/17 10/26/17 10/26/17 10/26/17 10/26/17 10/27/17 10/27/17 10/27/17 10/30/17
COST/ SHARE
($)
-24.92 -25.25 -90.55 -91.40 -94.09 -37.80 -37.58 -37.76 -24.09 -24.09 -24.00 -91.85 -95.59 -23.93 -92.23 -96.62 -92.44 -97.05 -92.22 -70.02 -71.16 -72.34 -72.33 -72.11 -92.49 -92.41 -40.23 -25.69 -93.54 -25.68 -25.73 -91.99 -90.49
22
TOTAL COST
($)
-1,819.08 -4, 192.15 -4, 165.22 -4,570.17
-846.82 -37.80
-1,653.72 -12,686.39
-1,493.68 -2, 120.18 -7,609.33 -3, 122.76 -1,720.58 -2,895.23 -1,383.49 -1,739.17 -2,403.31 -7,958.05 -5,071.93
-210.06 -925.03 -723.39
-1,229.59 -1,009.56 -5,641.90 -8, 131.69
-10,621.86 -4,881.86 -4,770.41 -1,925.63 -4,322.22 -2,483.60 -5,520.04
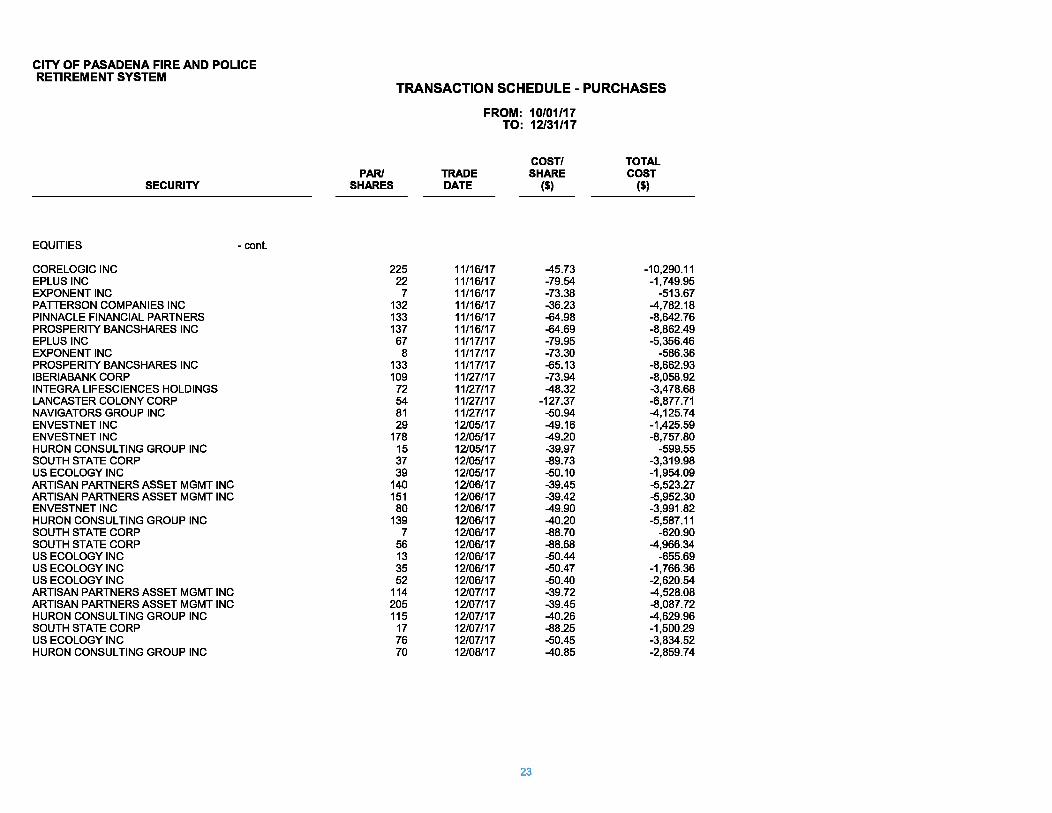
CITY OF PASADENA FIRE AND POLICE RETIREMENT SYSTEM
SECURITY
EQUITIES - cont.
CORELOGIC INC EPLUS INC EXPONENT INC PATTERSON COMPANIES INC PINNACLE FINANCIAL PARTNERS PROSPERITY BANCSHARES INC EPLUS INC EXPONENT INC PROSPERITY BANCSHARES INC IBERIABANK CORP INTEGRA LIFESCIENCES HOLDINGS LANCASTER COLONY CORP NAVIGATORS GROUP INC ENVESTNET INC ENVESTNET INC HURON CONSUL TING GROUP INC SOUTH STATE CORP US ECOLOGY INC ARTISAN PARTNERS ASSET MGMT INC ARTISAN PARTNERS ASSET MGMT INC ENVESTNET INC HURON CONSUL TING GROUP INC SOUTH STATE CORP SOUTH STATE CORP US ECOLOGY INC US ECOLOGY INC US ECOLOGY INC ARTISAN PARTNERS ASSET MGMT INC ARTISAN PARTNERS ASSET MGMT INC HURON CONSUL TING GROUP INC SOUTH STATE CORP US ECOLOGY INC HURON CONSUL TING GROUP INC
TRANSACTION SCHEDULE - PURCHASES
PAR/ SHARES
225 22
7 132 133 137
67 8
133 109
72 54 81 29
178 15 37 39
140 151 80
139 7
56 13 35 52
114 205 115
17 76 70
FROM: 10/01/17 TO: 12/31/17
TRADE DATE
11/16/17 11/16/17 11/16/17 11/16/17 11/16/17 11/16/17 11/17/17 11/17117 11/17117 11/27/17 11/27/17 11/27/17 11/27/17 12/05/17 12/05/17 12/05/17 12/05/17 12/05/17 12/06/17 12/06/17 12/06/17 12/06/17 12/06/17 12/06/17 12/06/17 12/06/17 12/06/17 12/07/17 12/07/17 12/07/17 12/07/17 12/07/17 12/08/17
COST/ SHARE
($)
-45.73 -79.54 -73.38 -36.23 -64.98 -64.69 -79.95 -73.30 -65.13 -73.94 -48.32
-127.37 -50.94 -49.16 -49.20 -39.97 -89.73 -50.10 -39.45 -39.42 -49.90 -40.20 -88.70 -88.68 -50.44 -50.47 -50.40 -39.72 -39.45 -40.26 -88.25 -50.45 -40.85
23
TOTAL COST
($)
-10,290.11 -1,749.95
-513.67 -4,782.18 -8,642.76 -8,862.49 -5,356.46
-586.36 -8,662.93 -8,058.92 -3,478.68 -6,877.71 -4,125.74 -1,425.59 -8,757.80
-599.55 -3,319.98 -1,954.09 -5,523.27 -5,952.30 -3,991.82 -5,587.11
-620.90 -4,966.34
-655.69 -1,766.36 -2,620.54 -4,528.08 -8,087.72 -4,629.96 -1,500.29 -3,834.52 -2,859.74

CITY OF PASADENA FIRE AND POLICE RETIREMENT SYSTEM
EQUITIES
US ECOLOGY INC US ECOLOGY INC EXPONENT INC EXPONENT INC
SECURITY
STATE BANK FINANCIAL CORP
- cont.
PAR/ SHARES
TRANSACTION SCHEDULE - PURCHASES
26 37 70
2 18
FROM: 10/01/17 TO: 12/31/17
TRADE DATE
12/11/17 12/12/17 12/13/17 12/14/17 12/27/17
COST/ SHARE
($)
-50.01 -50.38 -70.54 -71.42 -30.11
24
TOTAL COST
($)
-1,300.21 -1,864.05 -4,937.45
-142.83 -541.98
-273,842.03
CITY OF PASADENA FIRE AND POLICE RETIREMENT SYSTEM
EQUITIES
HEICO CORP CL A HEICO CORP CL A
SECURITY DESCRIPTION
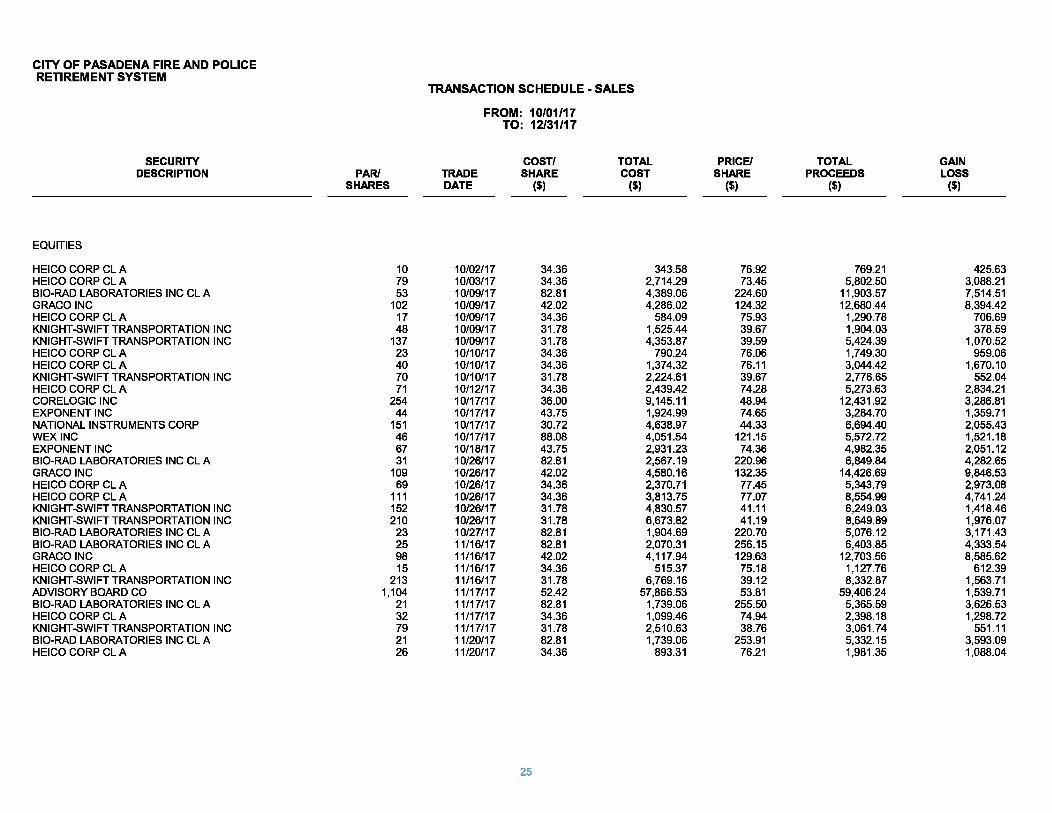
BIO-RAD LABORATORIES INC CL A GRACO INC HEICO CORP CL A KNIGHT-SWIFT TRANSPORTATION INC KNIGHT-SWIFT TRANSPORTATION INC HEICO CORP CL A HEICO CORP CL A KNIGHT-SWIFT TRANSPORTATION INC HEICO CORP CL A CORELOGIC INC EXPONENT INC NATIONAL INSTRUMENTS CORP WEXINC EXPONENT INC BIO-RAD LABORATORIES INC CL A GRACO INC HEICO CORP CL A HEICO CORP CL A KNIGHT-SWIFT TRANSPORTATION INC KNIGHT-SWIFT TRANSPORTATION INC BIO-RAD LABORATORIES INC CL A BIO-RAD LABORATORIES INC CL A GRACO INC HEICO CORP CL A KNIGHT-SWIFT TRANSPORTATION INC ADVISORY BOARD CO BIO-RAD LABORATORIES INC CL A HEICO CORP CL A KNIGHT-SWIFT TRANSPORTATION INC BIO-RAD LABORATORIES INC CL A HEICO CORP CL A
PAR/ SHARES
10 79 53
102 17 48
137 23 40 70 71
254 44
151 46 67 31
109 69
111 152 210
23 25 98 15
213 1,104
21 32 79 21 26
TRANSACTION SCHEDULE - SALES
FROM: 10/01/17
TRADE DATE
10/02/17 10/03/17 10/09/17 10/09/17 10/09/17 10/09/17 10/09/17 10/10/17 10/10/17 10/10/17 10/12/17 10/17/17 10/17/17 10/17/17 10/17/17 10/18/17 10/26/17 10/26/17 10/26/17 10/26/17 10/26/17 10/26/17 10/27/17 11/16/17 11/16/17 11/16/17 11/16/17 11/17/17 11/17/17 11/17/17 11/17/17 11/20/17 11/20/17
TO: 12/31/17
COST/ SHARE
($)
34.36 34.36 82.81 42.02 34.36 31.78 31.78 34.36 34.36 31.78 34.36 36.00 43.75 30.72 88.08 43.75 82.81 42.02 34.36 34.36 31.78 31.78 82.81 82.81 42.02 34.36 31.78 52.42 82.81 34.36 31.78 82.81 34.36
25
TOTAL COST
($)
343.58 2,714.29 4,389.06 4,286.02
584.09 1,525.44 4,353.87
790.24 1,374.32 2,224.61 2,439.42 9, 145.11 1,924.99 4,638.97 4,051.54 2,931.23 2,567.19 4,580.16 2,370.71 3,813.75 4,830.57 6,673.82 1,904.69 2,070.31 4,117.94
515.37 6,769.16
57,866.53 1,739.06 1,099.46 2,510.63 1,739.06
893.31
PRICE/ SHARE
($)
76.92 73.45
224.60 124.32
75.93 39.67 39.59 76.06 76.11 39.67 74.28 48.94 74.65 44.33
121.15 74.36
220.96 132.35
77.45 77.07 41.11 41.19
220.70 256.15 129.63
75.18 39.12 53.81
255.50 74.94 38.76
253.91 76.21
TOTAL PROCEEDS
($)
769.21 5,802.50
11,903.57 12,680.44
1,290.78 1,904.03 5,424.39 1,749.30 3,044.42 2,776.65 5,273.63
12,431.92 3,284.70 6,694.40 5,572.72 4,982.35 6,849.84
14,426.69 5,343.79 8,554.99 6,249.03 8,649.89 5,076.12 6,403.85
12,703.56 1,127.76 8,332.87
59,406.24 5,365.59 2,398.18 3,061.74 5,332.15 1,981.35
GAIN LOSS
($)
425.63 3,088.21 7,514.51 8,394.42
706.69 378.59
1,070.52 959.06
1,670.10 552.04
2,834.21 3,286.81 1,359.71 2,055.43 1,521.18 2,051.12 4,282.65 9,846.53 2,973.08 4,741.24 1,418.46 1,976.07 3,171.43 4,333.54 8,585.62
612.39 1,563.71 1,539.71 3,626.53 1,298.72
551.11 3,593.09 1,088.04

CITY OF PASADENA FIRE AND POLICE RETIREMENT SYSTEM
EQUITIES
HEICO CORP CL A HEICO CORP CL A APTARGROUP INC
SECURITY DESCRIPTION
ARTISAN PARTNERS ASSET MGMT INC BEACON ROOFING SUPPLY INC BIO-TECHNE CORP BLACKBAUD INC BRIGHT HORIZONS FAMILY SOL CASEY'S GEN'L STORES INC CHOICE HOTELS INT'L INC COLUMBIA SPORTSWEAR CO CORELOGIC INC ENVESTNET INC EXPONENT INC FAIR ISAAC CORP FORWARD AIR CORP HEICO CORP CL A HURON CONSUL TING GROUP INC ICU MEDICAL INC INTER PARFUMS INC J&J SNACK FOODS CORP LANDSTAR SYSTEM INC MOOG INC CLA MORNINGSTAR INC NATIONAL INSTRUMENTS CORP PINNACLE FINANCIAL PARTNERS POWER INTEGRATIONS INC PROSPERITY BANCSHARES INC RAVEN INDUSTRIES INC SALLY BEAUTY HOLDINGS INC STATE BANK FINANCIAL CORP UMPQUA HOLDINGS CORP UNIFIRST CORP
- cont.
PAR/ SHARES
46 15
150 465 318 172 272 172 176 249 365 174 113 128 107 168 27
328 72
521 92
175 137 143 120
79 177 101 293 325 188 361
66
TRANSACTION SCHEDULE - SALES
FROM: 10/01/17
TRADE DATE
11/21/17 11/22/17 11/27/17 11/27/17 11/27/17 11/27/17 11/27/17 11/27/17 11/27/17 11/27/17 11/27/17 11/27/17 11/27/17 11/27/17 11/27/17 11/27/17 11/27/17 11/27/17 11/27/17 11/27/17 11/27/17 11/27/17 11/27/17 11/27/17 11/27/17 11/27/17 11/27/17 11/27/17 11/27/17 11/27/17 11/27/17 11/27/17 11/27/17
TO: 12/31/17
COST/ SHARE
($)
34.36 34.36 44.40 49.74 31.07 98.30 23.40 64.94 91.46 60.26 38.87 36.60 47.83 43.98 15.59 52.98 34.36 64.72
126.11 28.87
101.45 57.62 76.00 50.67 30.72 43.56 59.40 54.57 20.35 19.92 20.08 13.00
123.67
26
TOTAL COST
($)
1,580.47 515.37
6,659.79 23,131.20
9,879.05 16,908.10
6,365.09 11, 169.85 16,097.31 15,004.20 14,185.74
6,368.15 5,404.46 5,629.36 1,668.17 8,901.45
927.67 21,226.86
9,079.78 15,040.05
9,333.11 10,083.80 10,412.02
7,245.67 3,686.60 3,441.50
10,513.47 5,511.50 5,961.57 6,472.92 3,774.49 4,693.39 8,162.16
PRICE/ SHARE
($)
77.07 77.32 86.85 37.91 60.64
132.72 102.56 87.22
118.20 77.36 68.42 44.70 49.66 74.51
155.38 54.93 77.01 40.65
216.13 42.75
146.44 98.43 81.34 91.55 44.15 65.30 80.33 65.39 36.37 15.93 29.56 20.61
158.45
TOTAL PROCEEDS
($)
3,545.07 1,159.73
13,027.94 17,630.06 19,282.47 22,828.39 27,895.59 15,002.35 20,803.59 19,263.43 24,973.23
7,778.49 5,612.01 9,537.69
16,625.73 9,227.68 2,079.16
13,334.53 15,561.70 22,274.83 13,472.62 17,225.48 11, 144.00 13,091.56
5,298.47 5,158.97
14,218.64 6,604.73
10,656.77 5,177.00 5,557.09 7,440.03
10,457.78
GAIN LOSS
($)
1,964.60 644.36
6,368.15 -5,501.14 9,403.42 5,920.29
21,530.50 3,832.50 4,706.28 4,259.23
10,787.49 1,410.34
207.55 3,908.33
14,957.56 326.23
1, 151.49 -7,892.33 6,481.92 7,234.78 4, 139.51 7,141.68
731.98 5,845.89 1,611.87 1,717.47 3,705.17 1,093.23 4,695.20
-1,295.92 1,782.60 2,746.64 2,295.62

CITY OF PASADENA FIRE AND POLICE RETIREMENT SYSTEM
EQUITIES
SECURITY DESCRIPTION
UNIVERSAL HEAL TH RL TY INCOME TR WEXINC BIO-RAD LABORATORIES INC CL A HEICO CORP CL A KNIGHT-SWIFT TRANSPORTATION INC HEICO CORP CL A KNIGHT-SWIFT TRANSPORTATION INC HEICO CORP CL A HEICO CORP CL A CASS INFORMATION SYSTEMS INC
- cont.
PAR/ SHARES
103 104
50 44
518 72
143 87
138 0
TRANSACTION SCHEDULE - SALES
FROM: 10/01/17
TRADE DATE
11/27/17 11/27/17 12/04/17 12/05/17 12/05/17 12/06/17 12/06/17 12/07/17 12/07/17 12/28/17
TO: 12/31/17
COST/ SHARE
($)
51.82 88.08 82.81 34.36 31.78 34.36 31.78 34.36 34.36 46.19
27
TOTAL COST
($)
5,337.65 9,160.01 4,140.63 1,511.76
16,462.09 2,473.78 4,544.55 2,989.15 4,741.41
4.62
490,178.45 --
490,178.45
PRICE/ SHARE
($)
74.44 123.41 260.65
74.03 42.58 73.82 42.60 74.32 74.31 59.50
TOTAL PROCEEDS
($)
7,667.74 12,834.66 13,032.63 3,257.37
22,054.69 5,314.85 6,091.34 6,465.51
10,254.15 5.95
746,774.35
746,774.35
GAIN LOSS
($)
2,330.09 3,674.65 8,892.00 1,745.61 5,592.60 2,841.07 1,546.79 3,476.36 5,512.74
1.33
256,595.90
256,595.90

co N

City of Pasadena Fire and Police Retirement System Reporting Period: 10/01/2017 to 12/31/2017
Bio-Techne Corporation Meeting Date: 10/26/2017 Record Date: 09/01/2017 Shares Voted: 995
ProPOSal Number
2a
2b
2c
2d
2e
2f
2g
2h
2i
2j
3
4
5
6
Issue
Fix Number of Directors at Ten
Elect Director Robert V. Baumgartner
Elect Director Charles A. Dinarello
Elect Director John L. Higgins
Elect Director Karen A. Holbrook
Elect Director Joseph D. Keegan
Elect Director Charles R. Kummeth
Elect Director Roeland Nusse
Elect Director Alpna Seth
Elect Director Randolph C. Steer
Elect Director Harold J. Wiens
Advisory Vote to Ratify Named Executive Officers' Compensation
Advisory Vote on Say on Pay Frequency
Amend Omnibus Stock Plan
Ratify KPMG LLP as Auditors
Lancaster Colony Corporation
Vote
For
For
Against
For
For
For
For
For
For
For
For
Against
One Year
For
For
Meeting Date: 11/15/2017 Record Date: 09/18/2017 Shares Voted: 426
ProPOSal Number Issue
1.1 Elect Director Robert L. Fox
1.2 Elect Director John B. Gerlach, Jr.
1.3 Elect Director Robert P. Ostryniec
2
3
4
Advisory Vote to Ratify Named Executive Officers' Compensation
Advisory Vote on Say on Pay Frequency
Ratify Deloitte & Touche LLP as Auditors
The Advisory Board Company
Vote
For
For
For
For
One Year
For
Meeting Date: 11/15/2017 Record Date: 10/05/2017 Shares Voted: 1,104
ProPOSal Number Issue
2
Approve Merger Agreement
Adjourn Meeting
Vote
For
For
29
3
ScanSource, Inc. Meeting Date: 12/07/2017
Proposal Number
1.1
1.2
1.3
1.4
1.5
1.6
1.7
2
3
4
Advisory Vote on Golden Parachutes Against
Record Date: 10/11/2017 Shares Voted: 1,171
Issue Vote
Elect Director Steven R. Fischer For
Elect Director Michael L. Baur For
Elect Director Peter C. Browning For
Elect Director Michael J. Grainger For
Elect Director John P. Reilly For
Elect Director Elizabeth 0. Temple For
Elect Director Charles R. Whitchurch For
Advisory Vote to Ratify Named Executive Officers' For Compensation
Advisory Vote on Say on Pay Frequency One Year
Ratify Grant Thornton LLP as Auditors For

EuroPacific Growth Fund®
As of December 31, 2017
Consider for a Core International allocation and has the flexibility to invest in emerging markets.
Quarterly review
Brief market overview
Implementation guidance:
• Non-U.S. companies advanced through the quarter, helped by signs of an improvingglobal economy and strong corporate earnings growth. Currency movements helped liftresults in many markets as the U.S. dollar tended to weaken through the quarter.
• Japanese companies rallied the most, boosted by Prime Minister Shinzo Abe's victory inOctober's snap election, where his party won more than two-thirds of available seats.Japan's third-quarter GDP expanded by 2.5% on an annualized basis, with strong exportscompensating for subdued domestic demand. This is Japan's seventh consecutivequarter of growth, its longest unbroken streak in nearly two decades. Elsewhere in Asia-Pacific, Singapore delivered strong returns, while Australian and Hong Kong shares alsorose.
• European companies delivered slight gains in U.S. dollar terms. While the euro-zoneeconomy accelerated and the European Central Bank said it would continue its stimulusmeasures until at least September 2018, political risks were a drag on returns. In Spain,the region of Catalonia voted for independence in a referendum declared illegal by thegovernment in Madrid. German politics also caused concern as Angela Merkel failed toform a coalition government, potentially paving the way for another election.
• U.K.-listed companies produced solid returns, outpacing those in continental Europe.Prime Minister Theresa May finally achieved the breakthrough needed to move the Brexitnegotiations onto the next phase -- transition arrangements and trade -- but U.K.economic activity remained sluggish. As widely expected, the Bank of England raisedrates by 25 basis points to tackle rising inflation, which touched a five-year high of 3.1%in November.
The fund's investment objective is to provide long-term growth of capital.
• The fund aims to provide long-term growth of capital by investing in the equity of non-U.S. issuers based chiefly in Europe and the Pacific Basin.
• The portfolio managers have the flexibility to invest in both developed and emergingmarket securities, offering the broadest potential to access the most attractiveinvestments.
• They leverage Capital Group's global research capability to gain a deep knowledge ofcompanies worldwide.
• Companies domiciled in developing economies delivered strong gains through thequarter, partly helped by robust returns from select technology stocks. In China, stocksovercame fears of a slowdown to end with strong gains. Indian companies generateddouble-digit returns as the government unveiled plans aimed at boosting a slowingeconomy. Russian stocks also rose, boosted by higher oil prices and an improvingeconomy. However, Latin American markets didn't fare as well. Mexican stocksretreated on concerns that the North American Free Trade Agreement would collapse,while Brazilian companies were affected by fears that the government had abandonedcrucial pension reforms.
Long-term perspective
Brief market overview
Objective:
Invests in companies in Europe and the Pacific Basin, ranging from small firms to large corporations.Distinguishing characteristics:
Page 1 of 10Investments are not FDIC-insured, nor are they deposits of or guaranteed by a bank or any other entity, so they may lose value.

EuroPacific Growth Fund®
As of December 31, 2017
Figures shown are past results for Class F-1, F-2, F-3 and R-6 shares and are not predictive of results in future periods. Current and future results may be lower or higher than those shown. Share prices and returns will vary, so investors may lose money. Investing for short periods makes losses more likely. For current information and month-end results, visit americanfunds.com or americanfundsretirement.com.
Returns Total returns Average annual total returns Expense
For periods ended December 31, 2017 (%) 3 mo YTD 1 year 3 years 5 years 10 years Lifetime ratio
EuroPacific Growth Fund F-1 4.14 30.68 30.68 9.25 8.81 3.57 10.96 0.87
EuroPacific Growth Fund F-2 4.20 31.02 31.02 9.55 9.09 3.85 11.24 0.60
EuroPacific Growth Fund F-3 4.23 31.14 31.14 9.65 9.20 3.95 11.40 0.51
EuroPacific Growth Fund R-6 4.23 31.18 31.18 9.66 9.21 3.94 11.35 0.50
Historical Benchmarks Index* 5.00 27.19 27.19 7.83 6.80 1.84 8.67 ---MSCI All Country World ex USA Index** 5.00 27.19 27.19 7.83 6.80 1.84 --- ---Lipper International Funds Average 4.05 26.79 26.79 7.90 7.42 2.01 9.04 ---
Fund inception: April 16, 1984
*Returns reflect results of the fund's current and former benchmark indexes: MSCI All Country World ex USA Index, April 2007-present; MSCI EAFE Index, fund inception-March 2007.Results reflect net dividends.**Results reflect gross dividends through December 31, 2000 and net dividends thereafter.Market indexes are unmanaged and, therefore, have no expenses. Investors cannot invest directly in an index. Lipper averages reflect the current composition of all eligible mutualfunds (all share classes) within a given category. Lipper categories are dynamic and averages may have few funds, especially over longer periods. To see the number of fundsincluded in the Lipper category for each fund's lifetime, please see the Quarterly Statistical Update, available on our website. There have been periods when the fund has lagged theindexes.
We offer a range of share classes designed to meet the needs of retirement plan sponsors and participants. The different share classes incorporate varying levels of advisorcompensation and service provider payments. Because Class R-6 shares do not include any recordkeeping payments, expenses are lower and results are higher. Other share classesthat include recordkeeping costs have higher expenses and lower results than Class R-6.
Investment results assume all distributions are reinvested and reflect applicable fees and expenses. When applicable, investment results reflect fee waivers and/or expensereimbursements, without which results would have been lower. Please see americanfunds.com for more information. Certain share classes were offered after the inception dates ofsome funds. Results for these share classes prior to the dates of first sale are hypothetical based on Class A share results without a sales charge, adjusted for estimated annualexpenses. (Inception date: Class F-1, March 15, 2001; Class F-2, August 1, 2008; Class F-3, January 27, 2017; Class R-6, May 1, 2009.) Results for certain funds with an inception dateafter the share class inception also include hypothetical returns because those funds' shares sold after the date of first offering. Please see americanfunds.com for more information onspecific expense adjustments and the actual dates of first sale. Expense ratios are as of the fund's prospectus available at the time of publication. The expense ratios for Class F-3 sharesare estimated.
Page 2 of 10
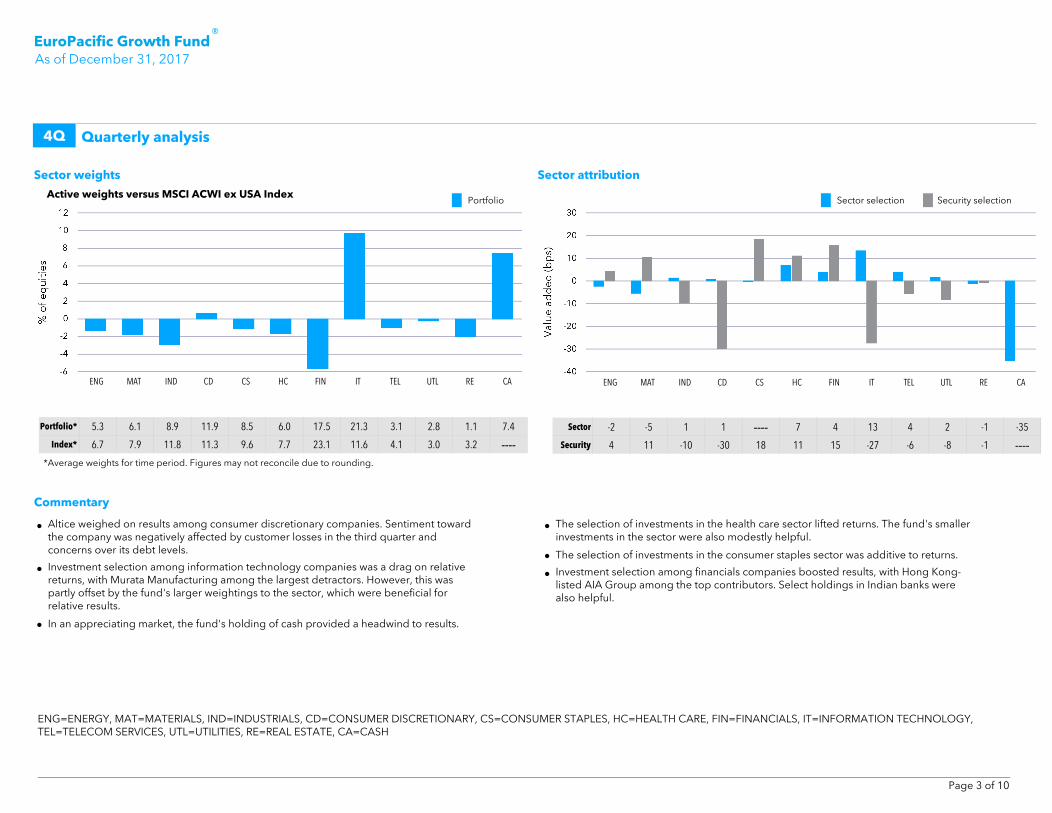
EuroPacific Growth Fund®
As of December 31, 2017
4Q Quarterly analysis
Portfolio* 5.3 6.1 8.9 11.9 8.5 6.0 17.5 21.3 3.1 2.8 1.1 7.4
Index* 6.7 7.9 11.8 11.3 9.6 7.7 23.1 11.6 4.1 3.0 3.2 ---- *Average weights for time period. Figures may not reconcile due to rounding.
Sector weights Sector attribution
Commentary
Sector -2 -5 1 1 ---- 7 4 13 4 2 -1 -35
Security 4 11 -10 -30 18 11 15 -27 -6 -8 -1 ----
Active weights versus MSCI ACWI ex USA Index Portfolio
ENG MAT IND CD CS HC FIN IT TEL UTL RE CA
• Altice weighed on results among consumer discretionary companies. Sentiment towardthe company was negatively affected by customer losses in the third quarter andconcerns over its debt levels.
• Investment selection among information technology companies was a drag on relativereturns, with Murata Manufacturing among the largest detractors. However, this waspartly offset by the fund's larger weightings to the sector, which were beneficial forrelative results.
• In an appreciating market, the fund's holding of cash provided a headwind to results.
• The selection of investments in the health care sector lifted returns. The fund's smallerinvestments in the sector were also modestly helpful.
• The selection of investments in the consumer staples sector was additive to returns.
• Investment selection among financials companies boosted results, with Hong Kong-listed AIA Group among the top contributors. Select holdings in Indian banks werealso helpful.
Sector selection Security selection
ENG MAT IND CD CS HC FIN IT TEL UTL RE CA
Page 3 of 10
Important note: All of the American Funds are managed using The Capital System. Each individual portfolio manager manages their portfolio independently through a bottom-up, research-driven process.
SM
ENG=ENERGY, MAT=MATERIALS, IND=INDUSTRIALS, CD=CONSUMER DISCRETIONARY, CS=CONSUMER STAPLES, HC=HEALTH CARE, FIN=FINANCIALS, IT=INFORMATION TECHNOLOGY,TEL=TELECOM SERVICES, UTL=UTILITIES, RE=REAL ESTATE, CA=CASH

EuroPacific Growth Fund®
As of December 31, 2017
4Q Quarterly analysis
*Average weights for time period. Figures may not reconcile due to rounding.
Regional weights Regional attribution
Commentary
Active weights versus MSCI ACWI ex USA Index
Canada Eurozone Japan EmergingMarkets
OtherEurope
Pacificex Japan
UK USA
Portfolio* 3.6 19.7 13.7 31.8 5.4 6.2 11.3 0.9
Index* 6.6 22.7 16.5 24.6 9.5 8.1 12.1 ----
Canada Eurozone Japan EmergingMarkets
OtherEurope
Pacificex Japan
UK USA
Region 3 10 -7 38 20 -4 2 -1
Security ---- -42 -41 -20 10 25 5 3
• Murata Manufacturing and SoftBank were a drag on returns among Japanesecompanies. The fund's smaller weightings further dampened relative results asJapanese companies were among those with the strongest returns through the quarter.
• Investment selection among euro-zone companies weighed on results, with Altice andUniCredit among the largest detractors.
• Minor holdings in Switzerland and Sweden lifted results among companies domiciledin non-euro-zone countries in Europe.
• Holdings of companies domiciled in developing economies boosted returns, withIndia's Reliance Industries, China's Tencent and South Africa's Naspers among the topcontributors.
Portfolio Region selection Security selection
Page 4 of 10
Important note: All of the American Funds are managed using The Capital System. Each individual portfolio manager manages their portfolio independently through a bottom-up, research-driven process.
SM

EuroPacific Growth Fund®
As of December 31, 2017
Company Portfolio* % Index* %Relative
contribution
Reliance Industries Limited 1.97 0.17 0.24
AIA Group Limited 2.43 0.45 0.20
Sony Corporation 1.53 0.25 0.18
Tencent Holdings Ltd. 1.96 1.30 0.11
Naspers Limited Class N 0.99 0.52 0.10
Company Portfolio* % Index* %Relative
contribution
ISR: Altice N.V. Class A 0.79 0.04 -0.57
UniCredit S.p.A. 1.25 0.19 -0.20
Associated British Foods plc 1.09 0.07 -0.17
Murata Manufacturing Co., Ltd. 1.03 0.13 -0.13
SoftBank Group Corp. 1.94 0.33 -0.11
4Q Quarterly analysis
* Average position for quarter; portfolio holdings change. * Average position for quarter; portfolio holdings change.
Commentary Commentary
Reliance Industries Limited
Reliance Industries is an India-based conglomerate, with businesses across the energy,petrochemicals, textiles, natural resources, retail and telecommunications sectors. Shareswere boosted by strong financial results from its wholly owned mobile network operatorsubsidiary Jio, which reported a 15.3-million increase in subscriber numbers in the quarterended September, causing it to claim to be the world's fastest growing digital servicesplatform. There was also speculation that Reliance Industries could launch an IPO for Jio in2018 or 2019. Reliance Industries' shares were additionally boosted by news that it hadsold U.S. shale assets for $126 million.
Sony Corporation
Sony is engaged in the development, design, manufacture and sale of various kinds ofelectronic equipment, instruments and devices for consumer, professional and industrialmarkets, as well as game consoles and software. Shares surged after the companyexceeded second-quarter fiscal 2017 earnings forecasts. Operating income jumped 346%as revenues rose by 18%, boosted by higher sales of gaming consoles, televisions andimage sensors, with strong performance from its PlayStation gaming business andsemiconductor unit. Revenue from Sony's Game & Network Services, Home Entertainment& Sound, and Semiconductors segments rose 35.4%, 28.1% and 17.9%, respectively. Thecompany also forecast record operating income for the full year.
Top five security contributors versus MSCI ACWI ex USA Index Bottom five security contributors versus MSCI ACWI ex USA Index
Altice
Altice is a multinational telecommunications company, providing cable-based and mobileservices to residential and corporate customers. Shares plunged after the companywarned full-year earnings would be at the low end of its guidance range with third-quarterrevenue missing estimates. Concerns were centered on performance in France, its mainmarket, where Altice lost around 75,000 broadband customers in the quarter. There werealso worries over its debt levels. The company announced the departure of its chiefexecutive Michel Combes soon after the results were unveiled.
Murata Manufacturing
Murata Manufacturing is the largest passive electronic component maker in the world.Shares slid after the company lowered its full-year earnings forecasts citing a substantialincrease in production costs amid delays as well as technical and market challenges.Murata highlighted its efforts to reinforce the production capacity for new products.Despite the reduction in earnings guidance, Murata simultaneously raised its full-yearsales forecast amid rising demand for the components it produces for smartphones andelectric vehicles
The mnemonic 'ISR:' indicates that two or more issues of the same issuer have been rolled up and thus what is presented in the report is the Issuer Level data.
Page 5 of 10
Important note: All of the American Funds are managed using The Capital System. Each individual portfolio manager manages their portfolio independently through a bottom-up, research-driven process.
SM

EuroPacific Growth Fund®
As of December 31, 2017
YTD Year-to-date analysis
Portfolio* 5.5 6.2 9.2 12.5 8.6 6.4 17.3 18.7 3.5 2.9 1.4 8.0
Index* 6.6 7.9 11.8 11.3 9.8 7.9 23.3 10.6 4.4 3.1 3.2 ---- *Average weights for time period. Figures may not reconcile due to rounding.
Sector weights Sector attribution
Commentary
Sector 10 -9 -4 -1 7 19 10 168 14 2 1 -233
Security 11 12 81 12 -3 -22 180 165 8 75 25 ----
Active weights versus MSCI ACWI ex USA Index Portfolio
• Almost all the sectors in which the fund was invested made a positive contribution torelative results, with health care the only slight detractor on a relative basis.
• The fund's larger holdings in information technology companies were helpful as theywere among those with the strongest returns through the year. Investment selectionfurther boosted results, with Alibaba, Nintendo and Tencent among the topcontributors.
• Strong returns from Indian lenders, including HDFC Bank, lifted results amongfinancials companies. The company continues to grow its market share across Indiaand benefited from regulatory tightening from the Reserve Bank of India.
• Investment selection among industrials and utilities companies was additive to results.
• In a strong upmarket, the fund's holding of cash was the only meaningful detractor ona relative basis.
Sector selection Security selection
ENG MAT IND CD CS HC FIN IT TEL UTL RE CA ENG MAT IND CD CS HC FIN IT TEL UTL RE CA
Page 6 of 10
Important note: All of the American Funds are managed using The Capital System. Each individual portfolio manager manages their portfolio independently through a bottom-up, research-driven process.
SM
ENG=ENERGY, MAT=MATERIALS, IND=INDUSTRIALS, CD=CONSUMER DISCRETIONARY, CS=CONSUMER STAPLES, HC=HEALTH CARE, FIN=FINANCIALS, IT=INFORMATION TECHNOLOGY,TEL=TELECOM SERVICES, UTL=UTILITIES, RE=REAL ESTATE, CA=CASH

EuroPacific Growth Fund®
As of December 31, 2017
YTD Year-to-date analysis
*Average weights for time period. Figures may not reconcile due to rounding.
Regional weights Regional attribution
Commentary
Active weights versus MSCI ACWI ex USA Index
Canada Eurozone Japan EmergingMarkets
Other Europe Pacificex Japan
UK USA
Portfolio* 3.8 20.1 14.1 29.2 5.9 6.4 11.6 0.8
Index* 6.7 22.3 16.4 23.9 9.9 8.4 12.3 ----
Canada Eurozone Japan EmergingMarkets
Other Europe Pacificex Japan
UK USA
Region 26 -26 7 59 20 -37 6 -8
Security -62 24 131 476 4 160 -2 -20
• Investment selection among companies domiciled in developing economies was theprimary driver of the fund's strong relative results. Select holdings in companiesdomiciled in India and China rallied strongly, most notably India's HDFC Bank andReliance Industries, as well as Chinese information technology companies Alibaba andTencent.
• Strong returns from Nintendo boosted returns among Japanese companies.
• Select investments in Hong Kong lifted returns in the Pacific ex Japan. Having nopositions in the larger Australian banks was also helpful for relative returns.
• Holdings of energy-related companies were a drag on returns among Canadiancompanies.
• In a strong upmarket, the fund's holding of cash provided a headwind to results.
Region selection Security selectionPortfolio
Page 7 of 10
Important note: All of the American Funds are managed using The Capital System. Each individual portfolio manager manages their portfolio independently through a bottom-up, research-driven process.
SM

EuroPacific Growth Fund®
As of December 31, 2017
Company Portfolio* % Index* %Relative
contribution
Alibaba Group Holding Ltd. Sponsored ADR 2.39 0.80 0.97
ISR: HDFC Bank Limited 2.37 0.00 0.82
Reliance Industries Limited 1.65 0.15 0.67
Tencent Holdings Ltd. 1.96 1.06 0.63
Nintendo Co., Ltd. 1.63 0.17 0.59
Company Portfolio* % Index* %Relative
contribution
ISR: Altice N.V. Class A 1.28 0.05 -1.13
Barclays PLC 1.36 0.23 -0.38
Teva Pharmaceutical Industries Limited 0.35 0.12 -0.28
Murata Manufacturing Co., Ltd. 1.15 0.14 -0.28
Schlumberger NV 0.42 0.00 -0.27
YTD Year-to-date analysis
* Average position for time period; portfolio holdings change. * Average position for time period; portfolio holdings change.
Commentary Commentary
Alibaba
Alibaba is one of the world's largest e-commerce companies. It provides shareholderswith exposure to transformational growth in China. Strong online sales drove a 56%increase in first-quarter fiscal 2018 revenues, while Alibaba also reported exceptionalgrowth from its smaller cloud and entertainment segments. Similarly, second-quarter fiscal2018 revenue rose 61% year-over-year. While Alibaba has continued to benefit from thetrend of rising online shopping by Chinese consumers, it also unveiled plans to growrevenues outside China.
HDFC Bank
HDFC Bank is an Indian banking and financial services company headquartered inMumbai, with a rapidly growing customer base. Shares rose after the bank beat third- andfourth-quarter fiscal earnings forecasts, while continuing to grow its market share andfootprint across India. HDFC shares were also boosted by regulatory tightening from theReserve Bank of India as lower quality/higher risk Indian banking entities came underpressure to strengthen their balance sheets. As the period progressed, the sharescontinued to be buoyed by strong results and broker upgrades, with earnings for the firstquarter fiscal rising by over 20%. Profits grew 15% year-over-year in the quarter endedSeptember.
Top five security contributors versus MSCI ACWI ex USA Index Bottom five security contributors versus MSCI ACWI ex USA Index
Barclays
Barclays is a global financial services provider engaged in retail, wholesale and investmentbanking, credit cards and investment management services. Shares slid after the companyreported disappointing first-quarter results, with an unexpected decline in revenue fromtrading. Similarly, shares were again hit in October after the company reporteddisappointing third-quarter results as low volatility and trading volumes hurt theinvestment banking business. To a lesser extent, shares were also adversely impacted bynews that the U.K. authorities were prosecuting Barclays, along with four formerexecutives, over dealings with the sovereign fund of Qatar in 2008.
Schlumberger
Schlumberger is a leading supplier of oil services to the energy industry. Shares fell afterthe company reported disappointing first-quarter revenues, as drilling proceeds declinedmodestly due to overseas pricing pressures. Shares were further pressured aftermanagement reduced the earnings outlook for 2017. There were also concerns aboutSchlumberger's strategy as it completed a deal to acquire $1 billion in oil and gas assetsfrom Cenovus Energy, giving it more direct exposure to refining and drilling.
The mnemonic 'ISR:' indicates that two or more issues of the same issuer have been rolled up and thus what is presented in the report is the Issuer Level data.
Page 8 of 10
Important note: All of the American Funds are managed using The Capital System. Each individual portfolio manager manages their portfolio independently through a bottom-up, research-driven process.
SM

EuroPacific Growth Fund®
As of December 31, 2017
Portfolio manager viewpoint Portfolio manager years of experience
Carl M. Kawaja
Portfolio managers Years with Capital Group Years in profession
Mark E. Denning 35 35
Nicholas J. Grace 24 27
Carl M. Kawaja 26 30
Jonathan Knowles 25 25
Lawrence Kymisis 14 22
Sung Lee 23 23
Jesper Lyckeus 21 22
Andrew B. Suzman 24 24
Christopher Thomsen 20 20Statements attributed to an individual represent the opinions of that individual as of the date published and donot necessarily reflect the opinions of Capital Group or its affiliates. This information is intended to highlightissues and not be comprehensive or to provide advice.
I've been involved with EuroPacific Growth Fund for more than 20 yearsand I will say one of our advantages is - although it is called growth fund -it's actually a very flexible fund. We focus on growth of capital, notnecessarily growth companies. So that means we can buy companies withlow valuations if we think they are going to be re-rated and the shareprice is going to rise. Our portfolio managers have the flexibility to takedifferent approaches, depending on each specific opportunity. Ourprimary goal is to do well for our shareholders on a long-term basis andto avoid terrible down periods to the greatest extent that we can. For me,that has led to an approach that says: be flexible.
— Carl M. Kawaja (December 2017)
Page 9 of 10
Although the American Funds are compared to their benchmarks, portfolio managers manage the funds consistent with each fund’s investment objectives.

EuroPacific Growth Fund®
As of December 31, 2017
Attribution methodology disclosureEquity attribution data was produced using FactSet, a third-party software system, basedon daily portfolios. Securities in their initial period of acquisition may not be included inthis analysis. The analysis includes equity investments only and excludes forward contractsand fixed-income investments, if applicable. It does not account for buy and selltransactions that might have occurred intraday. As a result, average portfolio weightpercentages are approximate and the actual average portfolio weight percentages mightbe higher or lower. Data elements such as pricing, income, market cap, etc., wereprovided by FactSet. The index provided for attribution is based on FactSet’smethodology. The index is a broad-based market benchmark and may not be used byCapital Group as the sole comparative index for this fund. Capital believes the softwareand information from FactSet to be reliable. However, Capital cannot be responsible forinaccuracies, incomplete information or updating of information by FactSet. Past resultsare not predictive of results in future periods.
Index definitions
EuroPacific Growth Fund Historical Benchmarks Index returns reflect the results of theMSCI EAFE® Index through 3/31/2007 and the MSCI All Country World ex USA Index, thefund’s current primary benchmark, thereafter. MSCI EAFE® (Europe, Australasia, Far East)Index is a free float-adjusted market capitalization weighted index that is designed tomeasure developed equity market results, excluding the United States and Canada. MSCIAll Country World ex USA Index is a free float-adjusted market capitalization weightedindex that is designed to measure equity market results in the global developed andemerging markets, excluding the United States. The index consists of more than 40developed and emerging market country indexes. Results reflect dividends net ofwithholding taxes. These indexes are unmanaged and, therefore, have no expenses, andtheir results include reinvested dividends and/or distributions.
MSCI All Country World ex USA Index is a free float-adjusted market capitalizationweighted index that is designed to measure equity market results in the globaldeveloped and emerging markets, excluding the United States. The index consists ofmore than 40 developed and emerging market country indexes. Results reflect dividendsgross of withholding taxes through December 31, 2000, and dividends net ofwithholding taxes thereafter. This index is unmanaged, and its results include reinvesteddividends and/or distributions but do not reflect the effect of sales charges, commissions,account fees, expenses or taxes. This index was not in existence as of the date the fundbegan investment operations; therefore, lifetime results are not available.
Lipper International Funds Average is composed of funds that invest assets in securitieswith primary trading markets outside the United States. The results of the underlyingfunds in the average include the reinvestment of dividends and capital gain distributions,as well as brokerage commissions paid by the funds for portfolio transactions and otherfund expenses, but do not reflect the effect of sales charges, account fees or taxes.
MSCI has not approved, reviewed or produced this report, makes no express or impliedwarranties or representations and is not liable whatsoever for any data in the report. Youmay not redistribute the MSCI data or use it as a basis for other indices or investmentproducts.
Source: Thomson Reuters Lipper
Content contained herein is not intended to serve as impartial investment or fiduciary advice. The content has been developed by the distributor of the American Funds mutual funds,which receives fees for distributing and servicing the funds.
Page 10 of 10
Investors should carefully consider investment objectives, risks, charges and expenses. This and other important information is contained in the fund prospectus and summary prospectus, which can be obtained from a financial professional and should be read carefully before investing. Investing outside the United States involves risks such as currency fluctuations, periods of illiquidity and price volatility, as more fully described in the prospectus. These risks may be heightened in connection with investments in developing countries.
Lit No. ITGEQSX-016-0118O CGD/10219-S59692 © 2018 American Funds Distributors, Inc.

International Stock Fund
1 of 5
T O O U R S H A R E H O L D E R S
The Dodge & Cox International Stock Fund had a total return of 23.9% for the year ended December 31, 2017, compared to a return of 25.0% for the MSCI EAFE (Europe, Australasia, Far East) Index.
M A R K E T C O M M E N TA RY
Global equity markets delivered exceptionally strong performance in 2017. Every sector of the MSCI EAFE posted double-digit positive returns. Information Technology (up 39%) and Materials (up 34%) were the best-performing sectors of the MSCI EAFE, while the worst performers—Telecommunication Services (up 13%) and Health Care (up 17%)—still registered substantial gains. Over the past decade, U.S. equity markets largely outperformed international markets because of higher U.S. corporate earnings growth, valuation expansion, and U.S. dollar appreciation that diminished international returns as measured in U.S. dollars. However, this trend reversed in 2017, as international equities outperformed U.S. markets: the MSCI Emerging Markets Index was up 37% and the MSCI EAFE increased 25%, while the S&P 500 Index rose nearly 22%. International equities benefited recently from increased earnings growth and a weaker U.S. dollar. The valuation differential between U.S. equities and international markets continues to be wide. At year end, the MSCI EAFE traded at 15 times forward estimated earnings and the MSCI Emerging Markets traded at 13 times, compared to 20 times for the S&P 500.a
I N V E S T M E N T S T R AT E G Y: F I N D I N G O P P O RT U N I T I E S I N H E A LT H C A R E A N D E N E R G Y
Dodge & Cox employs a long-term, valuation-oriented investment approach. We analyze each company using a three- to five-year time horizon. We concentrate our research on how a company’s fundamentals—the strength of the business franchise, its growth prospects, competitive positioning, and earnings power—could evolve over time. We then compare those fundamentals to the current valuation to identify potential price disparities. Experience has taught us that share prices fluctuate more in the short term than underlying fundamentals. Those fluctuations provide us the opportunity to buy, sell, and adjust individual portfolio holdings. During 2017, we shifted away from areas of the market that performed very well and where valuations expanded, trimming selected holdings in the Financials and Information Technology sectors, as well as in Japan. We also reduced the Fund’s weighting in Chinese internet holdings, which were highlighted in our last letter for their excellent growth prospects. Our view of their fundamentals has not changed, but rising valuations led us to trim Tencent (through Naspers), JD.com, and Baidu; in addition, we sold 58.com.b
We reinvested most of the proceeds into the Health Care and Energy sectors, where valuations are more appealing.
Health CarePharmaceutical companies, which comprise the majority of the investable Health Care sector, are an attractive area of the international market at 16 times forward earnings. Many of these companies are stable businesses with strong balance sheets and have growth potential from both new discoveries and expansion into emerging markets. In comparison, Consumer Staples, a large underweight for the Fund, has some similar characteristics yet trades at 20 times forward earnings. The Pharmaceuticals industry does face some challenges. For many companies, the United States is the largest market by revenue and earnings. As a result of industry consolidation and higher market shares, U.S. pharmacy benefit managers continue to exert increased pricing pressure on drug manufacturers. We have incorporated these risks into our analysis, but we believe current valuations help mitigate the downside potential of these investments. During 2017, we added to all of the Fund’s Health Care holdings. At year end, Health Care represented 15.5% of the Fund, compared to 10.1% for the MSCI EAFE.
GlaxoSmithKlineThe Fund recently re-established a position in GlaxoSmithKline, after selling it in 2015. Based in the United Kingdom, the company has leading therapeutic franchises in respiratory care and HIV. In addition to its traditional pharmaceuticals business, the company is diversified through strong and growing businesses in vaccines and over-the-counter consumer health.
a Unless otherwise specified, all weightings and characteristics are as of December 31, 2017.b The use of specific examples does not imply that they are more or less attractive investments than the Fund’s other holdings.

2 of 5
In 2015, we sold GlaxoSmithKline based on market headwinds and a higher valuation. The company’s pharmaceuticals business was suffering from pricing pressure on a key respiratory drug, Advair, and the pipeline of new drug launches was weak. The valuation, at 20 times forward earnings, was relatively expensive and did not sufficiently compensate for the risks. Some of those risks, including continued weakness in Advair sales, materialized, and the valuation declined after we sold the position. In the second half of 2017, however, we built a position in GlaxoSmithKline again based on a more favorable fundamental long-term outlook and a lower valuation (12 times forward earnings). In the respiratory care division, declines in Advair sales should be offset by new drugs, aided by a new inhaler. The HIV segment is growing at healthy rates due to increased adoption of Dolutegravir, a drug that blocks an enzyme needed for HIV to replicate. Combined with continued growth in vaccines and consumer health, the company should achieve modest earnings growth. Meanwhile, the management team has also been revamped. The new CEO is focusing on renewing the pharmaceutical pipeline and has brought in a well-regarded head of research and development to lead that effort. Improvements in the drug pipeline will take time to manifest, but in the meantime, the company continues to generate stable cash flow and has an attractive 6% dividend yield. On December 31, GlaxoSmithKline was a 1.9% position in the Fund.
EnergyWe discussed Energy in our last letter, noting that it was the worst-performing sector in the first half of 2017. Oil prices declined 16% in the first half but rebounded 40% in the second half. Unfortunately, the Fund’s holdings underperformed those in the MSCI EAFE Energy sector for the year. Specifically, our overweight in the Energy Equipment & Services (Oil Services) industry (2.7% compared to 0.1% for the MSCI EAFE) hurt performance, as Oil Services was down 23% compared to the overall Energy sector up 22%. The Fund’s largest investment in Oil Services is Schlumberger (a 2.1% position), which is the industry’s leading global player. As highlighted in our last letter, the stock price declined 22% in the first half, and we added to the position during the second quarter. The shares have remained weak—up only 4% in the second half—because a recovery in its international markets has not yet materialized. Since the current industry downturn started in 2014, the management team has done a remarkable job strengthening its business franchise through organic investments and selected acquisitions. We believe Schlumberger should benefit directly as higher oil prices spur producers to ramp up their investment in exploration and production. We maintain our long-term view that Energy is an attractive area of the market. Demand growth continues to be substantial, and the dearth of investment in new supply over the past few years generates conditions that are supportive of higher oil prices in the longer term. We conduct ongoing research to test this thesis and recently met with industry executives and experts in Houston and the Middle East. One topic we focused on was U.S. shale oil, whose growth has surprised and disrupted the oil markets. Production of shale oil in the United States has increased to six million barrels a day from virtually nothing a decade ago, out of a global total of 98 million barrels a day. The key growth driver is the prodigious Permian Basin in Texas and New Mexico, which has altered the global cost curve because it can be economically viable at low oil prices. Our recent meetings reaffirmed that development costs are rising with more activity in the basin and that other global sources of new supply are likely needed to satisfy demand. Our research also reinforced the importance of investing in oil producers, such as Suncor Energy, whose assets are on the low end of the cost curve and whose management teams are investing counter-cyclically.
Suncor EnergySuncor, a 1.9% position, is an integrated Canadian oil producer with most of its production coming from mining oil sands. We initially purchased the stock in the summer of 2016, as we viewed the valuation to be attractive relative to the business prospects. Oil sands require large upfront capital expenditures but can produce for decades at relatively low ongoing costs. Suncor’s assets generate free cash flow across a wide range of oil prices. These characteristics, along with Suncor’s strong balance sheet, provide the company staying power through the oil cycle. In addition, Suncor’s management has a track record of counter-cyclical capital allocation. When oil prices were high, management was disciplined and returned capital to shareholders through dividends and share buybacks. When oil prices declined, management opportunistically increased its ownership stake in a major oil sands asset called Syncrude. We added to our position in 2017 and view the company as offering a compelling combination of growth, resilience, and return of capital to shareholders.
AlticeInvesting too early is a risk in implementing our value-oriented investment strategy. We may be attracted to a company because of its low valuation and the prospect of improving fundamentals, but we may inaccurately gauge the path and time needed to bring about that change in fundamentals. A case in point is Altice, which significantly detracted from performance in 2017. Altice is a cable and telecommunications operator with major assets in Western Europe and the United States. Through a series of levered acquisitions, the company owns the second largest telecom company in France (SFR), U.S. cable operators

Cablevision and Suddenlink, and the incumbent telecom company in Portugal (Portugal Telecom). Altice is led by founder Patrick Drahi, who established a reputation for successfully consolidating the French cable market and improving profitability by re-engineering the cost structure of those businesses. We first bought Altice in early 2016. The valuation had declined due to skepticism about its recently announced Cablevision acquisition and high customer churn at SFR. We thought that was a good entry point given the significant opportunity to cut costs and improve operations at the recently acquired businesses. Through the second quarter of 2017, the stock had appreciated 80% since our initial purchase. However, the company then reported disappointing third quarter results, with deteriorating revenue trends in France, Portugal, and U.S.-based Suddenlink. Because the company has high financial leverage, the impact on the stock was substantial—it was down 44% between the release of third quarter results and year end. In these situations, we are careful not to be knee-jerk sellers or buyers. We concentrate our efforts on retesting the assumptions underlying our thesis. For Altice, management’s ability to improve revenue trends and cut costs is critical. Mr. Drahi responded by replacing the CEO at SFR with an executive who has an accomplished record of operational turnarounds and has been at Altice since its founding. While the competitive environment is intense, we believe the issues facing Altice can be fixed by the new management team. We also re-examined the company’s financial leverage with the help of our fixed income team and remain comfortable with the debt structure and maturity schedule. At the now lower valuation, we think Altice is very attractive. The U.S. cable operations are performing well, and we can attribute most of the company’s valuation to the stake in Altice USA, meaning we are paying little for the rest of the company. Based on these factors, we decided to add to the Fund’s position in Altice (0.8% on December 31).
I N C L O S I N G
Overall, we remain optimistic about the long-term outlook for the portfolio. International valuations are reasonable, and we see attractive earnings prospects for companies in the Fund. We believe a single quarter or year’s performance is too short of an interval to evaluate our strategy. Our active, bottom-up, value-oriented investment approach requires conviction and patience. Accordingly, maintaining a long-term investment horizon and staying the course are essential. We thank our fellow shareholders for your continued confidence in Dodge & Cox. As always, we welcome your comments and questions.
For the Board of Trustees,
Charles F. Pohl, Dana M. Emery,Chairman President
January 30, 2018
3 of 5

Objectives The Fund seeks long-term growth of principal and income.
Strategy The Fund invests primarily in a diversified portfolio of equity securities issued by non-U.S. companies from at least three different countries, including emerging market countries. The Fund is not required to allocate its investments in set percentages in particular countries. The Fund typically invests in medium-to-large well established companies based on standards of the applicable market.
Risks The Fund is subject to market risk, meaning holdings in the Fund may decline in value for extended periods due to the financial prospects of individual companies or due to general market and economic conditions. Investing in non-U.S. securities may entail risk due to foreign economic and political developments; this risk may be higher when investing in emerging markets. Please read the prospectus for specific details regarding the Fund’s risk profile.
A S S E T A L L O C AT I O N
EquitySecurities: 99.2%
Net Cash & Other:(d) 0.8%
(a) SEC Yield is an annualization of the Fund’s net investment income for the trailing 30-day period. Dividends paid by the Fund may be higher or lower than implied by the SEC Yield.
(b) Price-to-earnings (P/E) ratios are calculated using 12-month forward earnings estimates from third-party sources.(c) The Fund’s portfolio holdings are subject to change without notice. The mention of specific securities is not a recommendation to buy, sell, or hold any particular security and
is not indicative of Dodge & Cox’s current or future trading activity.(d) Net Cash & Other includes cash, short-term investments, derivatives, receivables, and payables.(e) The Fund may classify a company in a different category than the MSCI EAFE. The Fund generally classifies a company based on its country of incorporation, but may designate
a different country in certain circumstances.
G E N E R A L I N F O R M AT I O NNet Asset Value Per Share $46.32Total Net Assets (billions) $65.72016 Expense Ratio (per 5/1/17 Prospectus) 0.64%2017 Expense Ratio 0.63%Portfolio Turnover Rate 17%30-Day SEC Yield(a) 1.63%Number of Companies 69Fund Inception 2001No sales charges or distribution fees
Investment Manager: Dodge & Cox, San Francisco. Managed by the International Equity Investment Committee, whose eight members’ average tenure at Dodge & Cox is 23 years.
MSCI P O RT F O L I O C H A R A C T E R I S T I C S Fund EAFEMedian Market Capitalization (billions) $36 $11Weighted Average Market Capitalization (billions) $72 $60Price-to-Earnings Ratio(b) 14.2x 14.9xCountries Represented 25 21Emerging Markets (Brazil, China, India, Mexico, Russia, South Africa, South Korea, Thailand, Turkey, United Arab Emirates) 26.1% 0.0%
T E N L A R G E S T H O L D I N G S ( % ) ( c ) Fund Naspers, Ltd. (South Africa) 4.1Samsung Electronics Co., Ltd. (South Korea) 3.9Sanofi (France) 3.3Novartis AG (Switzerland) 3.1ICICI Bank, Ltd. (India) 2.9Liberty Global PLC (United Kingdom) 2.6Itau Unibanco Holding SA (Brazil) 2.5BNP Paribas SA (France) 2.3Barclays PLC (United Kingdom) 2.3Honda Motor Co., Ltd. (Japan) 2.2
MSCI R E G I O N D I V E R S I F I C AT I O N ( % ) ( e ) Fund EAFE Europe (excluding United Kingdom) 41.6 45.7United Kingdom 15.1 17.8Pacific (excluding Japan) 12.5 12.0Japan 10.4 24.0Latin America 7.0 0.0Africa 5.8 0.0United States 3.6 0.0Canada 2.9 0.0Middle East 0.3 0.5
MSCI S E C T O R D I V E R S I F I C AT I O N ( % ) Fund EAFE Financials 28.1 21.2Consumer Discretionary 15.9 12.3Health Care 15.5 10.1Information Technology 12.3 6.4Energy 7.7 5.3Industrials 7.3 14.6Materials 6.1 8.2Telecommunication Services 3.3 3.9Utilities 1.3 3.2Consumer Staples 1.1 11.2Real Estate 0.6 3.6
International Stock Fund
December 31, 2017
Ticker Symbol
D O D F X
4 of 5

Average Annual Total Return1
For periods ended December 31, 2017 1 Year 3 Years 5 Years 10 Years
Dodge & Cox International Stock Fund 23.94% 5.96% 8.50% 3.17%
MSCI EAFE Index 25.03 7.80 7.90 1.94
Returns represent past performance and do not guarantee future results. Investment return and share price will fluctuate with market conditions, and investors may have a gain or loss when shares are sold. Fund performance changes over time and currently may be significantly lower than stated above. Performance is updated and published monthly. Visit the Fund’s website at dodgeandcox.com or call 800-621-3979 for current month-end performance figures.
The Dodge & Cox International Stock Fund had a total return of 1.2% for the fourth quarter of 2017, compared to 4.2% for the MSCI EAFE (Europe, Australasia, Far East) Index. For 2017, the Fund had a total return of 23.9%, compared to 25.0% for the MSCI EAFE.
I N V E S T M E N T C O M M E N TA RYGlobal equity markets continued to rise during the fourth quarter and had exceptionally strong performance in 2017. Every sector of the MSCI EAFE posted double-digit positive returns for the year. Information Technology (up 39%) and Materials (up 34%) were the best-performing sectors of the MSCI EAFE, while the worst performers—Telecommunication Services (up 13%) and Health Care (up 17%)—still registered substantial gains. Over the past decade, U.S. equity markets largely outperformed international markets because of higher U.S. corporate earnings growth and valuation expansion. In addition, headwinds from a strong U.S. dollar trimmed international returns in U.S. dollars. However, this trend reversed during 2017 as international equities outperformed U.S. markets: the MSCI Emerging Markets Index was up 37% and the MSCI EAFE increased 25%, while the S&P 500 Index rose 22%. International equities benefited recently from increased earnings growth and a weaker U.S. dollar. The valuation differential between U.S. equities and international markets continues to be wide. At year end, the MSCI EAFE traded at 15 times forward estimated earnings and the MSCI Emerging Markets traded at 13 times, compared to 20 times for the S&P 500. At Dodge & Cox, we employ a bottom-up approach and weigh each current and prospective investment’s fundamentals against its current valuation. During 2017, we trimmed selected holdings that had outperformed significantly at higher valuations. These included holdings in several sectors, such as Information Technology—especially the Chinese Internet-related companies—and Financials, as well as in Japan. Meanwhile, we continue to find investment opportunities across the globe and reinvested the proceeds from these trims into the Health Care and Energy sectors, where valuations are especially appealing. For example, after selling in 2015, we recently re-established a position in GlaxoSmithKline, a global pharmaceutical company, and also added to existing pharmaceutical holdings, including AstraZeneca, Bayer, and Sanofi. Energy is another attractive area of the market. Our ongoing due diligence, including recent meetings in the Middle East and Houston, reaffirmed our view that oil prices could rise over the long term. Abundant growth in U.S. shale oil has disrupted the industry, but its cost of production is rising and supply from other sources will be needed to satisfy global demand. In 2017, we added significantly to two of the Fund’s Integrated Oils holdings, Statoil and Suncor Energy. Both companies are opportunistically investing to lower development costs, which should improve their profitability in the coming years. Overall, we remain optimistic about the long-term outlook for the portfolio. Performance results over the past few years reaffirm that a single quarter or year is too short an interval over which to evaluate our strategy. Our active, bottom-up, value-oriented investment approach requires conviction and patience. Accordingly, maintaining a long-term investment horizon and staying the course are essential. We thank our fellow shareholders for your continued confidence in Dodge & Cox.
F O U RT H QU A RT E R P E R F O R M A N C E R E V I E W The Fund underperformed the MSCI EAFE by 3.0 percentage points during the quarter.
K E Y D E T R A C T O R S F R O M R E L AT I V E R E S U LT S The Fund’s overweight position and holdings in the Health Care sector (down 6% compared to flat for the MSCI EAFE sector) significantly detracted from results. Sanofi (down 13%) and Bayer (down 8%) performed poorly.
Before investing in any Dodge & Cox Fund, you should carefully consider the Fund’s investment objectives, risks, and charges and expenses. To obtain a Fund’s prospectus and summary prospectus, which contain this and other important information, visit dodgeandcox.com or call 800-621-3979. Please read the prospectus and summary prospectus carefully before investing.
Japan was one of the best-performing developed market countries (up 9%), so the Fund’s average underweight position (11% versus 24% for the MSCI EAFE region) hurt its relative results.
Within the Materials sector, the Fund underperformed (up 2% compared to up 9% for the MSCI EAFE sector) because of Cemex (down 17%) and its lack of holdings in the Metals & Mining industry, a strong industry of the market (up 13%).
Weak relative returns from the Fund’s holdings in the Energy sector (up 2% compared to up 10% for the MSCI EAFE sector) hindered performance.
Additional detractors included Altice (down 48%), Magnit (down 37%), Grupo Televisa (down 24%), and UniCredit (down 12%).
K E Y C O N T R I B U T O R S T O R E L AT I V E R E S U LT S The Fund’s emerging market holdings performed well (up 6%), especially Naspers (up 29%), MTN Group (up 20%), ICICI Bank (up 16%), Kasikornbank (up 14%), and Samsung Electronics (up 7%).
The Fund’s underweight position in the Utilities sector, the worst-performing sector of the market, and holding of Engie (up 3% compared to down 1% for the MSCI EAFE sector), helped performance.
Additional contributors included Honda Motor (up 16%), TE Connectivity (up 15%), and Linde (up 12%).
2 0 1 7 P E R F O R M A N C E R E V I E W The Fund underperformed the MSCI EAFE by 1.1 percentage points in 2017.
K E Y D E T R A C T O R S F R O M R E L AT I V E R E S U LT S Weak returns from the Fund’s holdings in the Energy sector (up 1% compared to up 22% for the MSCI EAFE sector) hurt performance results, especially Schlumberger (down 17%).
The Fund’s underweight position in Industrials, one of the strongest sectors of the market, and selection of holdings (up 22% compared to up 30% for the MSCI EAFE sector) hindered results. Johnson Controls International (down 6%) performed poorly.
Additional detractors included Altice (down 47%), Magnit (down 38%), Grupo Televisa (down 10%), and Barclays (up 1%).
K E Y C O N T R I B U T O R S T O R E L AT I V E R E S U LT S Strong returns from the Fund’s holdings in emerging markets (up 42%) contributed significantly, especially in the Information Technology, Consumer Discretionary, and Financials sectors. Samsung Electronics (up 61%), Kasikornbank (up 51%), ICICI Bank (up 45%), and the Fund’s Chinese internet-related holdings—Naspers (up 90%), JD.com (up 63%), and Baidu (up 42%)—were particularly notable.
The Fund’s holdings in Japan (up 37% compared to up 24% for the MSCI EAFE region) helped results. Nintendo (up 77%) performed strongly.
Within the Telecommunication Services sector, the Fund’s holdings outperformed (up 43% compared to up 13% for the MSCI EAFE sector). Millicom International Cellular (up 64%) performed exceptionally well.
1 The Fund’s total returns include the reinvestment of dividend and capital gain distributions, but have not been adjusted for any income taxes payable by shareholders on these distributions or on Fund share redemptions. Index returns include dividends but, unlike Fund returns, do not reflect fees or expenses. The MSCI EAFE (Europe, Australasia, Far East) Index is a broad-based, unmanaged equity market index aggregated from 21 developed market country indices, excluding the United States and Canada. MSCI makes no express or implied warranties or representations and shall have no liability whatsoever with respect to any MSCI data contained herein. The MSCI data may not be further redistributed or used as a basis for other indices or any securities or financial products. This report is not approved, reviewed, or produced by MSCI. All returns are stated in U.S. dollars, unless otherwise noted.
MSCI EAFE is a service mark of MSCI Barra. S&P 500® is a trademark of S&P Global Inc.
dodgeandcox.com
5 of 5

Stock Fund
1 of 5
T O O U R S H A R E H O L D E R S
The Dodge & Cox Stock Fund had a total return of 18.3% for the year ended December 31, 2017, compared to a return of 21.8% for the S&P 500 Index.
M A R K E T C O M M E N TA RY
U.S. equity markets continued to climb steadily during the fourth quarter, capping off a year of strong performance and low volatility. The S&P 500 reached an all-time high in mid-December and ended the year up nearly 22%. The period of sustained performance in U.S. equities since March 2009 is the second longest in U.S. history. During 2017, U.S. growth stocks (the higher valuation portion of the equity market) outperformed value stocks (the lower valuation portion) by 17 percentage points overall.a Companies in sectors and industries associated with technology (e.g., Information Technology, Internet Retail, Media) led the market. The “FAANG” growth stocks—Facebook, Amazon, Apple, Netflix, and Google—were particularly strong, accounting for 20% of the S&P 500’s total return. Within the traditional value sectors, Energy was a laggard despite an 18% increase in oil prices during the year. Dodge & Cox’s approach is value oriented, and the Fund outperformed the U.S. value investment universe by five percentage points.b However, the outperformance of growth stocks had a negative impact on the Fund’s relative results versus the broad-based S&P 500. Robust corporate earnings growth, sustained economic expansion, and rising interest rates were major factors influencing equity market returns. Anticipation of the new U.S. tax bill signed in December, which significantly reduces statutory corporate tax rates, also contributed. Economic data released during the fourth quarter was solid (e.g., the unemployment rate hit a 17-year low), suggesting the U.S. economy remains on a steady path.
I N V E S T M E N T S T R AT E G Y: F I N D I N G O P P O RT U N I T I E S I N H E A LT H C A R E A N D E N E R G Y
At Dodge & Cox, our strong price discipline is an essential component of our investment strategy. Investment returns hinge on the purchase price: a good company is not always a good investment if the starting valuation is too high. We seek to invest in companies with valuations that do not fully reflect prospects for the company and where our analysis suggests the possibility of more positive developments. We constantly weigh valuation against company fundamentals and re-evaluate our thinking as prices change. In response to diverging valuations, we made a number of gradual portfolio adjustments during 2017. We trimmed selected Information Technology, Media, and Financials holdings that had performed strongly. The Fund’s largest sale was DXC Technology, the company formed through the merger of Hewlett Packard Enterprise’s services division and Computer Sciences Corporation. As a result of the Fund’s investment in Hewlett Packard Enterprise, the Fund received DXC shares in April 2017, and the stock performed strongly. While the CEO has an impressive track record of shareholder value creation, management’s three-year plan embedded high expectations for margin expansion and earnings growth. We questioned whether these targets, even if achieved, would be sustainable over the long term. These concerns, combined with DXC’s higher valuation, led us to sell the stock (up 36% over the holding period). We redeployed these proceeds, and others, into more attractively valued companies in the Health Care and Energy sectors, where our long-term outlook is more positive than that of many other investors.
Health CareIn the Pharmaceuticals industry, we believe valuations are compelling, reflecting regulatory and pricing concerns. As a result of industry consolidation and higher market shares, pharmacy benefit managers have been able to exert increased pricing pressure on drug manufacturers. This trend could impact long-term profitability for pharmaceutical companies. Despite these challenges, the FDA has recently increased the pace of new drug approvals. Most of the Fund’s pharmaceutical company holdings feature durable franchises with significant barriers to entry and growth potential from new discoveries and expansion into emerging markets. Based on our evaluation of the risks and opportunities, the portfolio has significant exposure to the Pharmaceuticals and Biotechnology industries (15.0% compared to 7.4% for the S&P 500c). In 2017, we added tactically to several holdings (including Bristol Myers Squibb) as valuations became more attractive and initiated three new positions: Eli Lilly and GlaxoSmithKline, which are highlighted below, and Gilead Sciences (a biopharmaceutical company focused on treatments and research for HIV/AIDS and hepatitis).d a The Russell 1000 Growth Index had a total return of 30.2% compared to 13.7% for the Russell 1000 Value Index during 2017.b The Dodge & Cox Stock Fund had a total return of 18.3% compared to 13.7% for the Russell 1000 Value Index during 2017.c Unless otherwise specified, all weightings and characteristics are as of December 31, 2017.d The use of specific examples does not imply that they are more or less attractive investments than the Fund’s other holdings.

2 of 5
Eli LillyDuring the second quarter of 2017, we initiated a position in Eli Lilly, a leading drug company focused on branded pharmaceuticals and animal health products. As the only pharmaceutical company with a presence across all major drug classes in the diabetes field, it has an advantage in contracting and marketing products. Until recently, Eli Lilly was losing market share to Novo Nordisk and Sanofi in the key area of diabetes classes, given its smaller emerging markets footprint and lack of a basal insulin therapy. This trend reversed as Eli Lilly launched several new products during the last few years, and the company is now gaining share in most therapeutic areas within diabetes. Eli Lilly’s partnership with Boehringer Ingelheim, where costs and profits are shared 50/50, has been important in rejuvenating its diabetes portfolio. After weathering two recent patent expirations, Eli Lilly is entering what could be an extended period of growth. The company’s four new drugs should each generate over $1 billion in annual sales. All of these recent product approvals have found commercial success and are driving future sales growth. If revenue grows as we expect, margins should improve significantly and boost earnings growth. The company has consistently had one of the better research and development (R&D) groups in the Pharmaceuticals industry due to its stable organization, thoughtful leadership, and high funding. Most importantly, the company’s newly appointed CEO leads a competent management team that appears to be well aligned with the interests of long-term shareholders and capable of navigating competitive and regulatory risks. Eli Lilly was a 1.4% position in the portfolio on December 31.
GlaxoSmithKlineThe Fund recently re-established a position in GlaxoSmithKline, after selling it in 2015. Based in the United Kingdom, the company has leading therapeutic franchises in respiratory care and HIV. In addition to its traditional pharmaceuticals business, the company is diversified through strong and growing businesses in vaccines and over-the-counter consumer health. In 2015, we sold GlaxoSmithKline based on market headwinds and a higher valuation. The company’s pharmaceuticals business was suffering from pricing pressure on a key respiratory drug, Advair, and the pipeline of new drug launches was weak. The valuation, at 20 times forward earnings, was relatively expensive and did not sufficiently compensate for the risks. Some of those risks, including continued weakness in Advair sales, materialized, and the valuation declined after we sold the position. In the second half of 2017, however, we built a position in GlaxoSmithKline again based on a more favorable fundamental long-term outlook and a lower valuation (12 times forward earnings). In the respiratory care division, declines in Advair sales should be offset by new drugs, aided by a new inhaler. The HIV segment is growing at healthy rates due to increased adoption of Dolutegravir, a drug that blocks an enzyme needed for HIV to replicate. Combined with continued growth in vaccines and consumer health, the company should achieve modest earnings growth. Meanwhile, the management team has also been revamped. The new CEO is focusing on renewing the pharmaceutical pipeline and has brought in a well-regarded head of R&D to lead that effort. Improvements in the drug pipeline will take time to manifest, but in the meantime, the company continues to generate stable cash flow and has an attractive 6% dividend yield. On December 31, GlaxoSmithKline was a 1.4% position in the Fund.
EnergyWhile Energy was the second-worst performing sector (down 1%) of the S&P 500 during 2017, we continue to believe Energy is an attractive area of the market. Global supply and demand fundamentals are supportive of higher oil prices. Demand growth in the developing world continues to be healthy, and the dearth of investment in new supply over the past few years should lead to a tighter balance. We conduct ongoing research to test our investment thesis and recently met with industry executives and experts in Houston and the Middle East. Our trips reaffirmed that development costs in U.S. shale oil are rising with more activity and that other global sources of new supply are likely needed to satisfy demand. Our research also reinforced the importance of investing in oil producers with assets on the low end of the cost curve and management teams that are investing counter-cyclically. The Fund remains modestly overweight the Energy sector (7.8% compared to 6.1% for the S&P 500), primarily due to investments in the Energy Equipment & Services (Oil Services) industry and growing exposure to exploration and production (E&P) companies. Oil services companies are particularly appealing due to their strong franchises and ability to expand earnings as producers reinvest in projects to meet growing global demand. Given attractive valuations, we recently added to selected holdings, including Anadarko Petroleum (a leading global E&P company with strong operational capabilities) and Baker Hughes.
Baker Hughes, a GE CompanyWe have held Baker Hughes in the Fund since 1998, actively adding to and trimming from the position given relative valuation opportunities and changing fundamentals over the years. In July 2017, GE Oil & Gas completed its acquisition of Baker Hughes, forming Baker Hughes GE (BHGE), now the second largest oilfield services company in the world after Schlumberger (also held in the Fund, 1.6% at year end). By combining oilfield services (Baker Hughes) and oilfield equipment (GE Oil & Gas) businesses, BHGE is the only company that serves the upstream, midstream, and downstream segments of the Oil, Gas, and Consumable Fuels industry.

Adjusting for the $17.50 per share cash dividend the Fund received in July, the stock was weak in 2017. While oil service activity levels have started to rebound in North America due to the resurgence of U.S. shale oil, hopes for an international recovery have been delayed. During the second half of 2017, we added to BHGE given its lower valuation, earnings growth potential, diversified business model, and financial strength. Management is targeting a $1.6 billion improvement in EBITDA, driven by 75% cost savings and 25% revenue synergies. BHGE has a long-term opportunity to increase its market share with its improved scale. BHGE’s leadership position in compressors and turbines generates long-term service contracts with attractive recurring revenue, which should reduce downside volatility. In addition, the company has a healthy balance sheet and recently announced a $3 billion share buyback. We believe BHGE provides attractive risk-reward diversification to the Fund’s Energy portfolio. The company was a 1.0% position on December 31.
IN CLOSING U.S. equity valuations are now at the high end of the historical range. While we have a tempered return outlook for the overall U.S. market, we are optimistic about the long-term prospects for the Fund’s portfolio, which continues to trade at a significant discount to the market. On December 31, the Fund’s portfolio of 66 companies traded at 16 times forward estimated earnings, compared to 20 times for the S&P 500. As an active, value-oriented manager, we believe the valuation disparities that characterize the current market offer significant opportunities. Our fundamental, bottom-up, price-disciplined investment approach requires conviction and patience. Accordingly, maintaining a long-term investment horizon and staying the course are essential. We thank our fellow shareholders for your continued confidence in Dodge & Cox. As always, we welcome your comments and questions.
For the Board of Trustees,
Charles F. Pohl, Dana M. Emery,Chairman President
January 30, 2018
3 of 5

Objectives The Fund seeks long-term growth of principal and income. A secondary objective is to achieve a reasonable current income.
Strategy The Fund invests primarily in a diversified portfolio of equity securities. In selecting investments, the Fund typically invests in companies that, in Dodge & Cox’s opinion, appear to be temporarily undervalued by the stock market but have a favorable outlook for long-term growth. The Fund focuses on the underlying financial condition and prospects of individual companies, including future earnings, cash flow, and dividends. Various other factors, including financial strength, economic condition, competitive advantage, quality of the business franchise, and the reputation, experience, and competence of a company’s management are weighed against valuation in selecting individual securities.
Risks The Fund is subject to market risk, meaning holdings in the Fund may decline in value for extended periods due to the financial prospects of individual companies or due to general market and economic conditions. Please read the prospectus for specific details regarding the Fund’s risk profile.
A S S E T A L L O C AT I O N
EquitySecurities: 98.6%
Net Cash & Other:(e) 1.4%
(a) SEC Yield is an annualization of the Fund’s net investment income for the trailing 30-day period. Dividends paid by the Fund may be higher or lower than implied by the SEC Yield.
(b) Price-to-earnings (P/E) ratios are calculated using 12-month forward earnings estimates from third-party sources.(c) Foreign securities are U.S. dollar denominated.(d) The Fund’s portfolio holdings are subject to change without notice. The mention of specific securities is not a recommendation to buy, sell, or hold any particular security and
is not indicative of Dodge & Cox’s current or future trading activity.(e) Net Cash & Other includes cash, short-term investments, derivatives, receivables, and payables.
G E N E R A L I N F O R M AT I O NNet Asset Value Per Share $203.61Total Net Assets (billions) $70.9Expense Ratio 0.52%Portfolio Turnover Rate 13%30-Day SEC Yield(a) 1.18%Number of Companies 66Fund Inception 1965No sales charges or distribution fees
Investment Manager: Dodge & Cox, San Francisco. Managed by the U.S. Equity Investment Committee, whose eight members’ average tenure at Dodge & Cox is 24 years.
P O RT F O L I O C H A R A C T E R I S T I C S Fund S&P 500Median Market Capitalization (billions) $52 $22Weighted Average Market Capitalization (billions) $140 $197Price-to-Earnings Ratio(b) 16.1x 20.0xForeign Securities not in the S&P 500(c) 11.2% 0.0%
T E N L A R G E S T H O L D I N G S ( % ) ( d ) FundCharles Schwab Corp. 3.9Capital One Financial Corp. 3.8Wells Fargo & Co. 3.7Bank of America Corp. 3.7Comcast Corp. 3.2Alphabet, Inc. 3.0Microsoft Corp. 2.9Charter Communications, Inc. 2.7Novartis AG (Switzerland) 2.6Goldman Sachs Group, Inc. 2.5
S E C T O R D I V E R S I F I C AT I O N ( % ) Fund S&P 500 Financials 28.1 14.8Health Care 22.4 13.8Information Technology 17.6 23.8Consumer Discretionary 14.5 12.2Energy 7.8 6.1Industrials 5.1 10.2Telecommunication Services 1.6 2.1Materials 1.0 3.0Consumer Staples 0.5 8.2Utilities 0.0 2.9Real Estate 0.0 2.9
Stock Fund
December 31, 2017
Ticker Symbol
D O D G X
4 of 5

Average Annual Total Return1
For periods ended December 31, 2017 1 Year 3 Years 5 Years 10 Years 20 Years
Dodge & Cox Stock Fund 18.32% 11.09% 16.30% 7.71% 9.55%S&P 500 Index 21.83 11.41 15.79 8.50 7.20
Returns represent past performance and do not guarantee future results. Investment return and share price will fluctuate with market conditions, and investors may have a gain or loss when shares are sold. Fund performance changes over time and currently may be significantly lower than stated above. Performance is updated and published monthly. Visit the Fund’s website at dodgeandcox.com or call 800-621-3979 for current month-end performance figures.
The Dodge & Cox Stock Fund had a total return of 5.7% for the fourth quarter of 2017, compared to 6.6% for the S&P 500 Index. For 2017, the Fund had a total return of 18.3%, compared to 21.8% for the S&P 500.
I N V E S T M E N T C O M M E N TA RYU.S. equity markets continued to climb steadily during the fourth quarter, capping off a year of strong performance and low volatility. The S&P 500 reached an all-time high in mid-December and ended the year up nearly 22%. The extraordinary rally in U.S. equities since March 2009 is the second-longest bull run in U.S. history. During 2017, U.S. growth stocks (the higher valuation portion of the equity market) outperformed value stocks (the lower valuation portion) by 17 percentage points overall.2 Companies in sectors associated with technology (e.g., Information Technology, Internet Retail, Media) led the market. The “FAANG” growth stocks—Facebook, Amazon, Apple, Netflix, and Google—were particularly strong, accounting for 20% of the S&P 500’s total return. Within the value camp, Energy was a laggard despite an 18% increase in oil prices during the year. Dodge & Cox’s approach is value oriented, and the Fund outperformed the U.S. value investment universe by five percentage points.3 However, the outperformance of growth stocks had a negative impact on the Fund’s relative results versus the broad-based S&P 500. Robust corporate earnings growth, sustained economic growth, and rising interest rates were the major factors boosting equity market returns. Economic data released during the fourth quarter was solid (e.g., the unemployment rate hit a 17-year low), indicating that the U.S. economy remains on a steady path. In addition, the new U.S. tax bill signed in December, which significantly reduces statutory corporate tax rates, could further stimulate growth. U.S. equity valuations are now at the high end of the historical range. While we have a tempered return outlook for the overall U.S. market, we are optimistic about the long-term prospects for the Fund’s portfolio, which continues to trade at a significant discount to the market. On December 31, the Fund’s portfolio of 66 companies traded at 16 times forward estimated earnings, compared to 20 times for the S&P 500. In response to changing valuations, we made gradual adjustments to the portfolio during 2017. For example, we trimmed selected Information Technology, Media, and Financials holdings that had performed strongly. We redeployed these proceeds into the Health Care and Energy sectors, where we are finding various long-term investment opportunities. Within Health Care, we initiated new positions—Eli Lilly, Gilead Sciences, and GlaxoSmithKline—and also recently increased the Fund’s position in Medtronic. Our ongoing due diligence in the Energy sector, including recent meetings in the Middle East and Houston, reaffirmed our view that oil prices could rise over the long term. On a bottom-up basis, we recently added to Baker Hughes (a GE Company) as well as other holdings. Overall, we remain optimistic about the long-term outlook for the portfolio. Our fundamental, active, value-oriented investment approach requires conviction and patience. Accordingly, maintaining a long-term investment horizon and staying the course are essential. We thank our fellow shareholders for your continued confidence in Dodge & Cox.
F O U RT H QU A RT E R P E R F O R M A N C E R E V I E WThe Fund underperformed the S&P 500 by 0.9 percentage points during the quarter.
Before investing in any Dodge & Cox Fund, you should carefully consider the Fund’s investment objectives, risks, and charges and expenses. To obtain a Fund’s prospectus and summary prospectus, which contain this and other important information, visit dodgeandcox.com or call 800-621-3979. Please read the prospectus and summary prospectus carefully before investing.
K E Y D E T R A C T O R S F R O M R E L AT I V E R E S U LT S Returns from holdings in the Consumer Discretionary sector (up 3% compared to up 10% for the S&P 500 sector) negatively impacted relative results. Time Warner (down 10%) and Charter Communications (down 8%) lagged.
The Fund’s higher average weighting in the Health Care sector (23% versus 14%) detracted; holdings in the Pharmaceuticals industry were weak (down 5% compared to up 1% for the S&P 500 industry), mainly Sanofi (down 14%), GlaxoSmithKline (down 11%), and Novartis (down 2%).
Sprint (down 24%) also detracted.
K E Y C O N T R I B U T O R S T O R E L AT I V E R E S U LT S The Fund’s Financials holdings (up 11% compared to up 9% for the S&P 500 sector) and higher average weighting in the sector (28% versus 15%) helped results. Capital One Financial (up 18%), Charles Schwab (up 18%), and Bank of America (up 17%) were particularly strong.
Additional contributors included Twenty-First Century Fox (up 31%), Wal-Mart (up 27%), and Express Scripts (up 18%).
2 0 1 7 P E R F O R M A N C E R E V I E WThe Fund underperformed the S&P 500 by 3.5 percentage points in 2017.
K E Y D E T R A C T O R S F R O M R E L AT I V E R E S U LT S Returns from holdings in the Energy sector (down 16% compared to down 1% for the S&P 500 sector), combined with a higher average weighting (8% versus 6%), detracted from results. Apache (down 32%), Baker Hughes (down 27%), and Anadarko Petroleum (down 23%) were weak.
Relative results were hindered by the strong performance of several large internet and technology stocks not held by the Fund (e.g., Apple, Amazon, Facebook). The impact was significant in the Consumer Discretionary sector, where the Fund’s holdings lagged meaningfully (up 13% compared to up 23% for the S&P 500 sector). In Information Technology, the Fund’s underweight position and modest underperformance (up 36% compared to up 39% for the S&P 500 sector) hurt.
Sprint (down 30%) also detracted.
K E Y C O N T R I B U T O R S T O R E L AT I V E R E S U LT S The return for Wal-Mart (up 47%), the Fund’s only holding in Consumer Staples, considerably outpaced the S&P 500 sector (up 13%).
The Fund’s lack of holdings in the Real Estate and Utilities sectors (up 11% and up 12%, respectively) aided relative results as these areas lagged the broader index.
A number of individual holdings also contributed, including Alnylam Pharmaceuticals (up 239%), Cigna (up 52%), HP Inc. (up 46%), and several financial services companies, including American Express (up 36%), Bank of America (up 36%), and Charles Schwab (up 31%).
1 The Fund’s total returns include the reinvestment of dividend and capital gain distributions, but have not been adjusted for any income taxes payable by shareholders on these distributions or on Fund share redemptions. Index returns include dividends but, unlike Fund returns, do not reflect fees or expenses. The S&P 500 Index is a market capitalization-weighted index of 500 large capitalization stocks commonly used to represent the U.S. equity market.
2 The Russell 1000 Growth Index had a total return of 30.2% compared to 13.7% for the Russell 1000 Value Index during 2017.
3 The Dodge & Cox Stock Fund had a total return of 18.3% compared to 13.7% for the Russell 1000 Value Index during 2017.
S&P 500® is a trademark of S&P Global Inc.
dodgeandcox.com
5 of 5

Looking Forward ICRE continues to deliver long-term outperformance as a result of its asset and location quality and the durability and growth profile
of the existing income stream. In addition, the Fund will generate significant additional NOI in the near- and medium-term from boththe assets in the Core Portfolio and maturing assets in the Manage-to-Core Portfolio.
Looking ahead, the Fund is projecting to generate cumulative NOI growth of approximately $150 million over the next 36 months – a36% increase in NOI over the trailing 12 months. The projected NOI growth in the Core commercial portfolio is largely contractual andwill be supplemented by the phase-in of income from the Manage-to-Core portfolio beginning this year; during the fourth quarter, theManage-to-Core Portfolio represented approximately 10 bps of income dilution.
ICRE also continues to maintain a strong, flexible balance sheet with long duration (8.6 years on fixed rate debt, nearly 2x ODCE) andprimarily fixed rate debt that will provide the financial flexibility to take advantage of opportunities across cycles.
Fund Highlights For the fourth quarter 2017, the Fund generated a total gross return of 2.26%, comprised of 0.87% income and 1.39% appreciation. The Fund produced gross unlevered appreciation of 122 bps on the total portfolio for the quarter. Appreciation in the Core Portfolio
was broad based throughout the commercial sector, while the Manage-to-Core Portfolio generated approximately $53 million of grossappreciation.
Assets that started the year in the Manage-to-Core Portfolio have contributed $97.1 million of appreciation for the Fund during 2017. We expect continued, meaningful, value creation from these Manage-to-Core assets as they mature over the near- and medium-term. The Fund ended the quarter at a strong 93.5% leased, which is down 100 bps from the prior quarter due to specific manage-to-core
assets and up 40 bps over the prior year. The Core Portfolio percentage leased decreased 20 bps from the prior quarter and 30 bpsfrom the prior year to 94.8%.
Investment Activity During the quarter, the Fund closed on a joint venture land acquisition for a future self-storage development property located in the
Los Angeles Area for a gross purchase price of $6.8 million (total capitalization $23.1 million - ICRE share). In addition, the Fund closed on two dispositions during the quarter for total a gross sales price of $85.8 million: Matthews Township, a
retail property in Matthews, NC (Charlotte MSA; $27.5 million) and The Pointe at Westchester, an apartment property located in WestChester, PA (Philadelphia MSA; $58.3 million).
Investor Activity
The Fund called $240.8 million of capital from four new and eight existing investors and redemptions of $106.7 million were paid. Subsequent to quarter end, $218.1 million of capital was called and outstanding redemptions were paid for a total of $38.4 million.
Quarterly
Top Ten MSAs ($ in billions) Based on Proforma Gross Market Value
Quarterly Flash Report
Invesco Core Real Estate–U.S.A.
Fourth Quarter 2017
Key Statistics 1 Investment Performance Gross Income
GrossAppreciation
Total Gross
Gross Asset Value $12.33B Number of Investors 4 127 Current Quarter 0.87% 1.39% 2.26%
Net Asset Value $8.98B Contributions for the Quarter 5 $272.1M One Year Rolling 3.66% 4.60% 8.38%
Number of Investments 91 Withdrawals for the Quarter $106.7M Three Year Rolling 3.92% 6.63% 10.74%
Debt to Total Assets 2 25.2% Dividend Declared $70.0M Five Year Rolling 4.23% 7.30% 11.76%
Manage-to-Core Portfolio 3 7.7% Trailing 4 Qtr Gross Distribution Yield 3.3% Seven Year Rolling 4.47% 7.32% 12.03%
Total Portfolio Leased 93.5% Cash as % of NAV 2.8% Ten Year Rolling 4.79% 0.45% 5.27%
Core Portfolio Leased 94.8% Annualized Since Inception (4Q04-4Q17) 5.20% 3.00% 8.31%1
See Notes to Performance; 2
Short-term line of credit balance was $0M; 3
Represents the Manage-to-Core Portfolio on a fully funded basis plus appreciation to date; At current carry values, the Manage-to-Core Portfolio is 6.8%;
4 Invested as of 12/31/17;
5Includes reinvested dividends.
Diversification Property Type (%) Based on Proforma Gross Market Value1
1
Legacy West Plano, TX
0.0
0.5
1.0
1.5
2.0
2.5
SF B
ay A
rea
Los
Ang
eles
Are
a
New
Yor
k
Was
hing
ton
DC
Den
ver
Dal
las
Hou
ston
Bos
ton
Ora
nge
Coun
ty
Chi
cago
( in
bill
ions
)
Apartment Industrial Office Retail Other
18%
14%
10% 9%8%
1
7% 6% 6%4%
3%13%
35%
21%
31%
0%
0%
10%
20%
30%
40%
50%
Industrial Apartment Retail Office Other
ICRE Projected Portfolio Tactical Target ODCE Weights
1 Proforma Gross Market Value includes the Manage-to-Core Portfolio on a fully funded basis plus appreciation to date.2 Target diversification may change based on changing market conditions.3 Represents San Francisco, SF East Bay and San Jose. 4 Represents Los Angeles and the Inland Empire Region.
■Strategic Range2 (9/30/17)
confidential
confidential

Notes to Performance
Invesco Core Real Estate – U.S.A.Fourth Quarter 2017
1. The Invesco Core Real Estate U.S.A., L.P. is a core style, open-end real estate fund with a September 30, 2004inception date. The Fund can also invest up to 15% of gross assets in value added strategies.
2. Information is presented on a preliminary basis and is subject to change.3. Performance is calculated in U.S. dollars. Performance returns are leveraged and calculated on an investment level
following the Modified Dietz methodology.4. Returns include Fund Level operating expenses. The impact of cash balances and any interest earnings are also
reflected in the Fund’s returns.5. Returns are shown gross of fees. An investor’s return would be reduced by the amount of the fees which could differ
based on the size of their investment. The highest fee would be 1.1% of NAV assuming a minimum investment of $10million.
6. Operating results of the Fund are presented on a fair value basis of accounting in conformity with U.S. GAAP and areaudited annually.
7. Real estate investments and debt obligations are valued on a quarterly basis by independent third party valuers.8. In an effort to most accurately reflect the Fund’s geographic and property type exposure and provide information on
leverage and other investment parameters, all Joint Venture investments are reported at the Fund’s ownershippercentage.
9. Investors in the Fund have the option of reinvesting all or a portion of the quarterly cash distributions made by theFund.
10. UBIT/Transactions: To date, no investments have been made outside of ICRE REIT Holdings. If ICRE REIT Holdings isdetermined to be a "pension-held REIT", the Manager does not anticipate that tax-exempt Members will be subject tounrelated business income tax except to the extent they own more than 10% of the Fund's Units or they have borrowedto make their investment in the Fund. As of the date of this report ICRE REIT Holdings is not a “pension-held REIT”.
11. As with all investments there are associated inherent risks. Please obtain and review all financial materials carefullybefore investing.
12. Certain information contained in this report constitutes forward-looking statements, which can be identified by the useof forward-looking terminology such as “may,” “seek,” “should,” “expect,” “anticipate,” “project,” “estimate,” “intend,”“continue,” or “believe” or the negatives thereof or other variations thereon or comparable terminology. While webelieve that such statements and information are based upon reasonable estimates and assumptions, due to variousrisks and uncertainties, actual events or results or the actual performance may differ materially from those reflected orcontemplated in such forward-looking statements.
All material presented is compiled from sources believed to be reliable and current but accuracy cannot be guaranteed. This is not to beconstrued as an offer to buy or sell any financial instrument. It is not our intention to state, indicate or imply in any manner that current orpast results are indicative of future profitability or expectations. As with all investments there are associated inherent risks. Please obtainand review all financial material carefully before investing. This report may contain confidential and proprietary information for the Fund andInvesco Ltd. Circulation, disclosure or dissemination of all or any part of this material to any unauthorized persons is prohibited. This reportis intended for Fund investors only.
2
Empire Gateway Industrial Chino, CA
Investment Policy & Performance Investor Relations
William C. Grubbs Jr.Managing Director,Head of Funds ManagementInvesco Real Estate101 California Street, Suite 1800San Francisco, CA [email protected]
Michelle FossSenior Director,Portfolio ManagerInvesco Real Estate101 California Street, Suite 1800San Francisco, CA [email protected]
Chad ProvostDirector,Associate Portfolio ManagerInvesco Real Estate101 California Street; Suite 1800San Francisco, CA [email protected]
Melissa NeckarAssociate Director,Investor Relations SpecialistInvesco Real Estate2001 Ross Avenue, Suite 3400Dallas, TX [email protected]
Beth WorthyDirector,Fund OperationsInvesco Real Estate2001 Ross Avenue,Suite 3400Dallas, TX [email protected]
Thomas ThreadgillSenior Associate,Fund OperationsInvesco Real Estate2001 Ross Avenue,Suite 3400Dallas, TX [email protected]
Trent HeinerAssociate,Fund OperationsInvesco Real Estate2001 Ross Avenue,Suite 3400Dallas, TX [email protected]
confidential
confidential
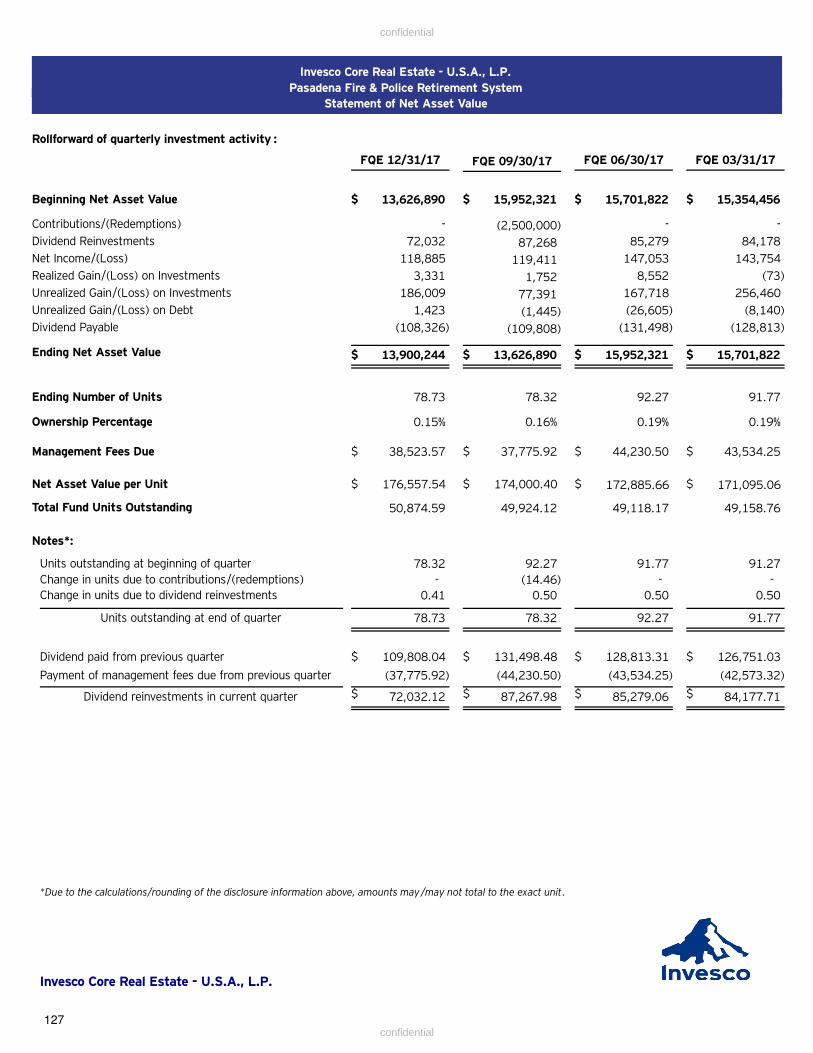
Invesco Core Real Estate - U.S.A., L.P.
Pasadena Fire & Police Retirement System
Statement of Net Asset Value
Rollforward of quarterly investment activity :
FQE 12/31/17 FQE 03/31/17FQE 06/30/17FQE 09/30/17
Beginning Net Asset Value 13,626,890 15,952,321 15,701,822 15,354,456$ $ $ $
Contributions/(Redemptions) - (2,500,000) - -
Dividend Reinvestments 85,279 84,17887,26872,032
Net Income/(Loss) 118,885 119,411 147,053 143,754
Realized Gain/(Loss) on Investments 1,752 8,552 (73)3,331
Unrealized Gain/(Loss) on Investments 186,009 77,391 167,718 256,460
Unrealized Gain/(Loss) on Debt 1,423 (1,445) (26,605) (8,140)
Dividend Payable (109,808) (131,498) (128,813)(108,326)
Ending Net Asset Value 13,900,244 13,626,890 15,952,321 15,701,822$ $ $ $
Ending Number of Units 78.73 78.32 92.27 91.77
Ownership Percentage 0.15% 0.16% 0.19% 0.19%
Management Fees Due 38,523.57 37,775.92 44,230.50 43,534.25$ $ $ $
Net Asset Value per Unit 176,557.54 174,000.40 172,885.66 171,095.06$ $ $ $
Total Fund Units Outstanding 49,158.7649,118.1749,924.1250,874.59
Notes*:
Units outstanding at beginning of quarter 78.32 92.27 91.77 91.27
Change in units due to contributions/(redemptions) - (14.46) - -
Change in units due to dividend reinvestments 0.41 0.50 0.50 0.50
Units outstanding at end of quarter 78.73 78.32 92.27 91.77
Dividend paid from previous quarter 109,808.04$ $ $ $131,498.48 128,813.31 126,751.03
Payment of management fees due from previous quarter (37,775.92) (44,230.50) (43,534.25) (42,573.32)
72,032.12 85,279.06 84,177.7187,267.98$ $ $ $Dividend reinvestments in current quarter
Pasadena Fire & Police Ret
*Due to the calculations/rounding of the disclosure information above, amounts may /may not total to the exact unit.
Invesco Core Real Estate - U.S.A., L.P.
127
confidential
confidential

PIMC 0
Quarterly Investment Report I 4Q 17
PIM CO All Asset Fund
A company af Alllanz(D

1
Performance periods ended 31 Dec '17 3 mos. 6 mos. 1 yr. 3 yrs. 5 yrs. 10 yrs. SI
Fund after fees 3.13 6.49 13.98 5.65 3.67 5.29 7.30
Benchmark* 0.53 1.24 1.90 1.78 0.09 2.83 4.05
Secondary Benchmark** 1.85 4.14 7.12 6.62 6.41 6.61 7.10
As of 31 December 2017
Performance quoted represents past performance. Past performance is not a guarantee or a reliable indicator of future results. Investment
return and the principal value of an investment will fluctuate. Shares may be worth more or less than original cost when redeemed. Current
performance may be lower or higher than performance shown. For performance current to the most recent month end, visit pimco.com or
call 888.87.PIMCO.
*Bloomberg Barclays U.S. TIPS: 1-10 Year Index; **Consumer Price Index + 500 Basis Points
Class:
Inception date:
Fund assets (in millions):
Annual operating expense:
Net operating expense: 0.925%
INST
31 Jul '02
$19,771.39
1.065%
Asset allocation
70.8%
17.8%
10.7%
20.1%
12.4%
0.0%
3.8%
6.1%
19.9%
7.2%
8.7%
4.0%
9.3%
0.3%
9.0%Developed ex-U.S. Equities
First Pillar
Second Pillar
U.S. Core Bonds
U.S. Long Maturity Bonds
Short-Term Bonds
U.S. Equities
Emerging Markets Bond
Credit
Global Bonds
Inflation-Linked Bonds
Alternative Strategies
Market value
Emerging Markets Equities
Third Pillar
Commodities and REITs
Portfolio performance
DETRACTORS CONTRIBUTORS
The All Asset Fund aims to serve as a differentiated asset allocation strategy. It focuses on “third pillar” assets in seeking three key outcomes: 1) long-term real return consistent with its secondary benchmark of CPI+5%; 2) return diversification away from traditional stock/bond approaches; and 3) greater inflation protection than may be provided by traditional stocks and bonds.
Portfolio strategy
• No material detractors • Positions in emerging markets equities
• Exposure to commodities and REITs
• Positions in developed ex-U.S. equities
• Current positioning is further intended to benefit from a continuation of three key recent trends: 1) stable to rising inflation expectations; 2) stabilization/recovery of emerging markets; and 3) value outperforming momentum, across asset classes and within global equities.
• Tactically allocate across “third pillar” assets, using a value-oriented, contrarian approach, in seeking maximum real return that also provides diversification away from fully valued U.S. equities and high correlation to changes in inflation expectations.

2
Strong third pillar returns YTD 2017, continuing 2016’s rebound
As of 31 December 2017
Source: Barclays, BofA, JPMorgan, Bloomberg. U.S. equities represented by the S&P 500 Index; Small cap equities represented by the Russell 2000 index; Developed ex. U.S. equities
represented by the MSCI EAFE Net Dividend Index (USD Unhedged); U.S. core fixed income represented by the Bloomberg Barclays U.S. Aggregate Index; Long U.S. Treasuries
represented by the Bloomberg Barclays Long-Term Treasury Index; U.S. investment grade credit represented by the Bloomberg Barclays U.S. Credit Index; U.S. high yield represented
by the BofA Merrill Lynch U.S. High Yield, BB-B Rated, Constrained Index; EM local bonds represented by the JPMorgan Government Bond Index- Emerging Markets Global
Diversified Index (Unhedged); EM equities represented by the MSCI EM Index; Long U.S. TIPS represented by the Bloomberg Barclays U.S. Treasury Inflation Notes: 10+ Year Index;
REITS represented by the Dow Jones U.S. Select REIT Total Return Index.; Diversified commodities represented by the Dow Jones-UBS Commodity Index Total Return.
21.8%
14.6%
25.0%
3.5%
8.5%
6.2% 7.0%
15.2%
37.3%
7.5%
3.8%1.7%
12.0%
21.3%
1.0%2.6%
1.3%
5.6%
14.7%
9.9%11.2%
7.3% 6.7%
11.8%
0%
5%
10%
15%
20%
25%
30%
35%
40%
U.S.
equities
Small cap
equities
Developed
ex. U.S.
equities
U.S. core
fixed
income
Long U.S.
Treasuries
U.S.
investment
grade credit
U.S. high
yield
EM local
bonds
EM
equities
Long U.S.
TIPS
REITs Diversified
commodities
Asset class returns YTD 2017 2016
First Pillar Second Pillar Third Pillar

3 As of 31 December 2017
11364
29 12 0 6 18 3 27
0
240
479
89
273
117
0 1448 42
86
6 5
239
-200
-100
0
100
200
300
400
500
600
Emerging
Markets
Equities
Commodities
and REITs
Emerging
Markets Bonds
Credit Global Bonds Inflation-Linked
Bonds
Alternative
Strategies
US Core Bonds US Long
Maturity Bonds
Short-Term
Bonds
US Equities Developed ex-
US Equities
All Asset Attribution Q4 2017 YTD 2017
All Asset posted strong performance YTD, continuing the 2016 rebound Strong performance in 2016-2017 was fueled by three factors, which represented a reversal of headwinds from 2013-2015: First, rising inflation expectations amid
a recovery in oil prices and reduced fears of a China slowdown. Second, EM stabilization given attractive valuations and strengthening EM currencies. Third, value
outperforming momentum as fundamentals improved.
Global Equities
For Q4, an emphasis on EM stocks meaningfully contributed as the region outpaced developed peers, returning 7.4%. The Fund also benefited from its sizeable position in dev. ex-US equities, as the sector rose 4.2%. While US stocks rose 6.6% as Congress passed the Tax Cuts and Jobs Act, this had little contribution for the Fund, which held a minimal allocation due to full valuations.
U.S. Core and Long Maturity Bonds
The US Treasury yield curve flattened in the quarter; although the Fed hiked its policy rate for the 3rd time in 2017, 30 year rates dropped 12 bps. In addition, demand for MBS remained amid continued strength in the US housing market. These resulted in positive total returns for the quarter, which benefited All Asset’s performance given increased allocations to long maturity bonds.
Emerging Market Bonds and Currencies
All Asset's emphasis on EM currencies and local bonds contributed as solid growth and muted inflationary pressures led to positive returns in Q4. EM local bonds also added to performance, as gains from carry outweighed higher local currency yields. EM currencies benefited as the asset class generally strengthened on the back of improving fundamentals and buoyant risk sentiment.
Performance quoted represents past performance. Past performance is not a guarantee or a reliable indicator of future results. Investment return and the principal value of an
investment will fluctuate. Shares may be worth more or less than original cost when redeemed. Current performance may be lower or higher than performance shown. For
performance current to the most recent month-end, visit www.pimco.com or call (888) 87-PIMCO.

4 As of 31 December 2017
Change relative to
2017 data
U.S.
MEXICO
U.K.
RUSSIA
JAPAN
BRAZIL
EUROZONE
INDIA
GDP: 7.00% - 8.00%
CPI: 4.00% - 5.00%
CHINA
% of world GDP
--
GDP: 2.25% – 2.75 %
CPI: 1.75% – 2.25% --
GDP: 2.00% - 3.00%
CPI: 3.25% - 4.25%
GDP: 2.00% - 3.00%
CPI: 3.75% - 4.75%
GDP: 1.25% - 1.75%
CPI: 2.25% - 2.75%
GDP: 2.00% - 2.50%
HICP: 1.00% - 1.50%
GDP: 5.75% - 6.75%
CPI: 2.00% - 3.00%
GDP: 1.00% - 1.50%
CPI: 0.75% - 1.25%
GDP: 1.50% - 2.50%
CPI: 3.25% - 4.25%
Forecasts GDP Inflation
2017 2018 2017 2018
Developed Markets 2.10 1.75 - 2.25 1.70 1.50 - 2.00
Emerging Markets 5.40 5.25 - 5.75 2.40 2.75 - 3.25
World 3.20 3.00 - 3.50 1.90 2.00 - 2.50PIMCO forecast ranges as of December 2017.
Real GDP and inflation projections reflect the midpoints of PIMCO’s forecast ranges for 2018.

5
Strategic Positioning The Fund currently emphasizes select Third Pillar asset classes that diversify fully-valued U.S. stocks and bonds, provide responsiveness to changes in inflation
levels, and offer compelling risk and return potential relative to traditional 60/40 balanced portfolios.
As of 31 December 2017
0.3%
9.0%
17.1%
0.3%
9.0%
17.8%
0%5%
10%15%20%25%
U.S. Equities Developed ex-U.S. Equities EM Equities
(%)
Net
ass
ets
3Q17 4Q17
20.2%17.1%
20.1% 17.8%
0%
10%
20%
30%
EM Bonds EM Equities
(%)
Net
ass
ets
3Q17 4Q17
8.4% 8.6%7.2% 8.7%
0%
5%
10%
15%
20%
US Core Bonds US Long Maturity Bonds
(%)
Net
ass
ets
3Q17 4Q17
5.8% 6.1%
0%
5%
10%
15%
Alternative Strategies
(%)
Net
ass
ets
3Q17 4Q17
Key strategies Position
Equities
Our U.S. equity allocation remains low as a mature U.S. bull market has led to full valuations and reduced return expectations. Instead we are focusing on EM and developed ex-US equities given higher dividend yields and substantially more attractive valuations.
Emerging Markets
EM assets (equities and local debt) are attractive given depressed prices, elevated yields and inflation hedging properties. We find EM currency exposure attractive due to its potential for higher expected returns via exchange rate appreciation and yield premium.
U.S. Core and Long Maturity Bonds
We maintained long maturity bond exposure following the post-election rise in yields and given their risk diversification potential versus risk assets. We similarly maintained positions in core bonds, preserving "dry powder" that may be deployed should market volatility increase.
Alternative Strategies
Allocations to alternatives were reduced over the last year as bond yields rose, presenting a more traditional "dry powder" allocation. However, they remain at levels that help diversify the Fund’s long-only holdings and also act as dry powder in the event of future dislocations.

6
1 2 1 0 0
4
116 8
11 9
5 2
54
5
4 6
57
3
4 2 3
59
6
1317 15
96
5
1
8
34 4
4
1
1
0 0 0
33 28
15
1817
12
16 20 21
1820
20
12 86
6
511
912
14
2219 18
0
10
20
30
40
50
60
70
80
90
100
Dec '11 Dec '13 Dec '15 Jun '16 Dec '16 Dec '17
Perc
en
t o
f n
et
ass
ets
(%
)Current allocation mix
Emerging markets equities
Commodities and REITs
Inflation-linked bonds
Emerging markets bonds
Global bonds
Credit
Alternative strategies
U.S. Long maturity bonds
U.S. Core bonds
Short-term bonds
Developed ex-U.S. equities
U.S. equities
As of 31 December 2017

7 As of 31 December 2017
PIMCO All Asset Fund (net of fees performance)
Performance periods ended: 31 Dec '17
Annual
operating
expense
Net
expense
ratio
NAV
currency
Class
Inception
date 3 mos. 6 mos. 1 yr. 3 yrs. 5 yrs. 10 yrs. SI
Class A (at NAV) 1.515 1.375 USD 30 Apr '03 3.00 6.31 13.50 5.14 3.17 4.75 6.70
Class A (at MOP) 1.515 1.375 USD 30 Apr '03 -0.86 2.32 9.24 3.81 2.39 4.35 6.44
Class ADMIN 1.315 1.175 USD 31 Dec '02 3.06 6.42 13.68 5.40 3.42 5.03 7.04
Class C (at NAV) 2.265 2.125 USD 30 Apr '03 2.81 5.91 12.66 4.36 2.40 3.96 5.90
Class C (at MOP) 2.265 2.125 USD 30 Apr '03 1.81 4.91 11.66 4.36 2.40 3.96 5.90
Class D 1.515 1.375 USD 30 Apr '03 2.92 6.25 13.45 5.20 3.25 4.85 6.77
Class INST 1.065 0.925 USD 31 Jul '02 3.13 6.49 13.98 5.65 3.67 5.29 7.30
Class P 1.165 1.025 USD 30 Apr '08 3.10 6.50 13.85 5.56 3.57 5.20 7.20
Class R 1.765 1.625 USD 31 Jan '06 2.87 6.12 13.12 4.87 2.91 4.46 6.41
Bloomberg Barclays U.S. TIPS: 1-10 Year Index 0.53 1.24 1.90 1.78 0.09 2.83 4.05
Consumer Price Index + 500 Basis Points 1.85 4.14 7.12 6.62 6.41 6.61 7.10
Certain classes may have an inception date which is different than the inception date of the fund. For the periods prior to the inception date of the oldest class shares, performance
information is based on the performance of the oldest class shares, adjusted to reflect the actual distribution and/or service (12b-1) fees and other expenses paid by the other class
shares. The net expense ratio reflects a contractual expense reduction agreement through 31 July 2018.
Performance quoted represents past performance. Past performance is not a guarantee or a reliable indicator of future results. Investment return and the principal value of an
investment will fluctuate. Shares may be worth more or less than original cost when redeemed. Current performance may be lower or higher than performance shown. For
performance current to the most recent month end, visit pimco.com or call 888.87.PIMCO. The maximum offering price (MOP) returns take into account the Class A maximum initial
sales charge of 3.75%. The maximum offering price (MOP) returns take into account the contingent deferred sales charge (CDSC) for Class C shares, which for this fund is 1.00%.
Interest expense results from the Fund's use of certain investments such as tender option bond floating rate certificates. Such expense is required to be treated as a Fund expense for
accounting purposes and is not payable to Pacific Investment Management Company LLC ("PIMCO"). Any interest expense amount will vary based on the Fund's use of those
investments as an investment strategy best suited to seek the objective of the Fund. Total Annual Fund Operating Expenses After Fee Waiver and/or Expense Reimbursement
excluding interest expense are 1.315%, 1.115%, 2.065%, 1.315%, 0.865%, 0.965%, and 1.565% for the A Class, ADMIN Class, C Class, D Class, INST Class, P Class, and R Class,
respectively.

8
This material is authorized for use only when preceded or accompanied by the current PIMCO funds prospectus or summary prospectus, if available.
Past performance is not a guarantee or a reliable indicator of future results. The performance figures presented reflect the total return performance, after fees, and reflect changes in share price and
reinvestment of dividend and capital gain distributions. All periods longer than one year are annualized. The minimum initial investment for institutional, administrative, and P class shares is $1 million;
however, it may be modified for certain financial intermediaries who submit trades on behalf of eligible investors.
There is no assurance that any fund, including any fund that has experienced high or unusual performance for one or more periods, will experience similar levels of performance in the future. High
performance is defined as a significant increase in either 1) a fund’s total return in excess of that of the fund’s benchmark between reporting periods or 2) a fund’s total return in excess of the fund’s
historical returns between reporting periods. Unusual performance is defined as a significant change in a fund’s performance as compared to one or more previous reporting periods.
Investments made by a Fund and the results achieved by a Fund are not expected to be the same as those made by any other PIMCO-advised Fund, including those with a similar name, investment
objective or policies. A new or smaller Fund’s performance may not represent how the Fund is expected to or may perform in the long-term. New Funds have limited operating histories for investors to
evaluate and new and smaller Funds may not attract sufficient assets to achieve investment and trading efficiencies. A Fund may be forced to sell a comparatively large portion of its portfolio to meet
significant shareholder redemptions for cash, or hold a comparatively large portion of its portfolio in cash due to significant share purchases for cash, in each case when the Fund otherwise would not
seek to do so, which may adversely affect performance.
Differences in the Fund’s performance versus the index and related attribution information with respect to particular categories of securities or individual positions may be attributable, in part, to
differences in the pricing methodologies used by the Fund and the index.
Portfolio allocations and other information in the charts in this Quarterly Investment Report are based on the fund's net assets. These percentages may differ from those used for the fund's compliance
calculations, including the fund's prospectus, regulatory, and other investment limitations and policies, which may be based on total assets of the fund or other measurements, may include or exclude
various categories of investments from those covered in the portfolio allocation categories shown in this report, and may be based on different classifications and measurements of the fund's investments
and other criteria. All funds are separately monitored for compliance with prospectus and regulatory requirements.
A word about risk: The fund invests in other PIMCO funds and performance is subject to underlying investment weightings which will vary. Investing in the bond market is subject to risks, including
market, interest rate, issuer, credit, inflation risk, and liquidity risk. The value of most bonds and bond strategies are impacted by changes in interest rates. Bonds and bond strategies with longer
durations tend to be more sensitive and volatile than those with shorter durations; bond prices generally fall as interest rates rise, and the current low interest rate environment increases this risk. Current
reductions in bond counterparty capacity may contribute to decreased market liquidity and increased price volatility. Bond investments may be worth more or less than the original cost when redeemed.
Investing in foreign denominated and/or domiciled securities may involve heightened risk due to currency fluctuations, and economic and political risks, which may be enhanced in emerging markets.
Commodities contain heightened risk including market, political, regulatory, and natural conditions, and may not be suitable for all investors. Mortgage and asset-backed securities may be sensitive to
changes in interest rates, subject to early repayment risk, and their value may fluctuate in response to the market’s perception of issuer creditworthiness; while generally supported by some form of
government or private guarantee there is no assurance that private guarantors will meet their obligations. High-yield, lower-rated, securities involve greater risk than higher-rated securities; portfolios that
invest in them may be subject to greater levels of credit and liquidity risk than portfolios that do not. Investing in securities of smaller companies tends to be more volatile and less liquid than securities of
larger companies. Inflation-linked bonds (ILBs) issued by a government are fixed-income securities whose principal value is periodically adjusted according to the rate of inflation; ILBs decline in value
when real interest rates rise. Equities may decline in value due to both real and perceived general market, economic, and industry conditions. Derivatives and commodity-linked derivatives may involve
certain costs and risks such as liquidity, interest rate, market, credit, management and the risk that a position could not be closed when most advantageous. Commodity-linked derivative instruments may
involve additional costs and risks such as changes in commodity index volatility or factors affecting a particular industry or commodity, such as drought, floods, weather, livestock disease, embargoes,
tariffs and international economic, political and regulatory developments. Investing in derivatives could lose more than the amount invested. The cost of investing in the Fund will generally be higher than
the cost of investing in a fund that invests directly in individual stocks and bonds. Diversification does not ensure against loss.
The Bloomberg Barclays U.S. TIPS: 1-10 Year Index is an unmanaged market index comprised of U.S. Treasury Inflation-Protected Securities having a maturity of at least 1 year and less than 10 years. It is
not possible to invest directly in an unmanaged index. The CPI + 500 Basis Points benchmark is created by adding 5% to the annual percentage change in the Consumer Price Index (“CPI”). This index
reflects seasonally adjusted returns. The Consumer Price Index is an unmanaged index representing the rate of inflation of the U.S. consumer prices as determined by the U.S. Bureau of Labor Statistics.
There can be no guarantee that the CPI or other indexes will reflect the exact level of inflation at any given time. It is not possible to invest directly in an unmanaged index.
As of 31 December 2017
9
The following defined terms are used throughout the report. Emerging market short duration instruments includes an emerging market security or other instrument economically tied to an emerging
market country by country of risk with an effective duration less than one year and rated investment grade or higher or if unrated, determined to be similar quality by PIMCO. Net other short duration
instruments includes securities and other instruments (except instruments tied to emerging markets by country of risk) with an effective duration less than one year and rated investment grade or higher
or, if unrated, determined by PIMCO to be of comparable quality, commingled liquidity funds, uninvested cash, interest receivables, net unsettled trades, broker money and derivatives offset. With respect
to certain categories of short duration securities, the Adviser reserves the discretion to require a minimum credit rating higher than investment grade for inclusion in this category. Short duration
derivatives and derivatives offsets include: 1) derivatives with an effective duration less than one year and where the country of risk is not an emerging market country (for example, Eurodollar futures) and
2) offsets associated with investments in futures, swaps and other derivatives. Such offsets may be taken at the notional value of the derivative position which in certain instances may exceed the actual
amount owed on such positions. Municipals/Other may include convertibles, preferred and yankee bonds.
The SEC yield is an annualized yield based on the most recent 30 day period. The average distribution yield is the average of the last four quarterly distribution yields. The quarterly distribution yield is
calculated by annualizing the quarter's distribution and dividing by the NAV on the last business day of the period. It does not include long- or short-term capital gains distributions. Average coupon is
the average of the coupon payments of the underlying bonds within the portfolio. Average effective maturity is a weighted average of all the maturities of the bonds in a portfolio, computed by
weighting each bond’s effective maturity by the market value of the security. Duration is the measure of a bond's price sensitivity to interest rates and is expressed in years. Effective duration is the
duration for a bond with an embedded option when the value is calculated to include the expected change in cash flow caused by the option as interest rates change. Information ratio is a ratio of
portfolio returns above the returns of a benchmark to the volatility of those returns. Tracking error measures the dispersion or volatility of excess returns relative to a benchmark. Tracking error measures
the dispersion or volatility of excess returns relative to a benchmark.
Statements concerning financial market trends or portfolio strategies are based on current market conditions, which will fluctuate. There is no guarantee that these investment strategies will work under
all market conditions or are suitable for all investors and each investor should evaluate their ability to invest for the long term, especially during periods of downturn in the market. Outlook and strategies
are subject to change without notice.
The performance figures presented reflect the performance for the institutional class unless otherwise noted.
A note about Sector exposure: Other indicates swaps and securities issued in euros.
A note about Emerging markets exposure by country of risk: country of risk reflects the country of incorporation of the ultimate parent company.
PIMCO uses an internal model for calculating effective duration, which may result in a different value for the duration of an index compared to the duration calculated by the index provider or another
third party.
This material contains the current opinions of the manager and such opinions are subject to change without notice. This material has been distributed for informational purposes only and should not be
considered as investment advice or a recommendation of any particular security, strategy or investment product. Information contained herein has been obtained from sources believed to be reliable, but
not guaranteed. No part of this material may be reproduced in any form, or referred to in any other publication, without express written permission. PIMCO is a trademark of Allianz Asset Management of
America L.P. in the United States and throughout the world. PIMCO Investments LLC, distributor, 1633 Broadway, New York, NY, 10019 is a company of PIMCO ©2018 PIMCO.
As of 31 December 2017
736_QIR-4Q17

Client Statement
865 S. Figueroa Street
Los Angeles CA 90017
TCW provides investment advisory services through the following investment advisors: TCW Asset Management Company, TCW Investment Management Company,Metropolitan West Asset Management LLC and Sepulveda Management LLC. Your specific investment advisor(s) will depend on the investment(s) in which you participate.
You should compare this statement with any statements that you receive from the custodians for your investments.
Pasadena Fire and Police Retirement System (SMS650)
Client Services (FI) Central Delivery
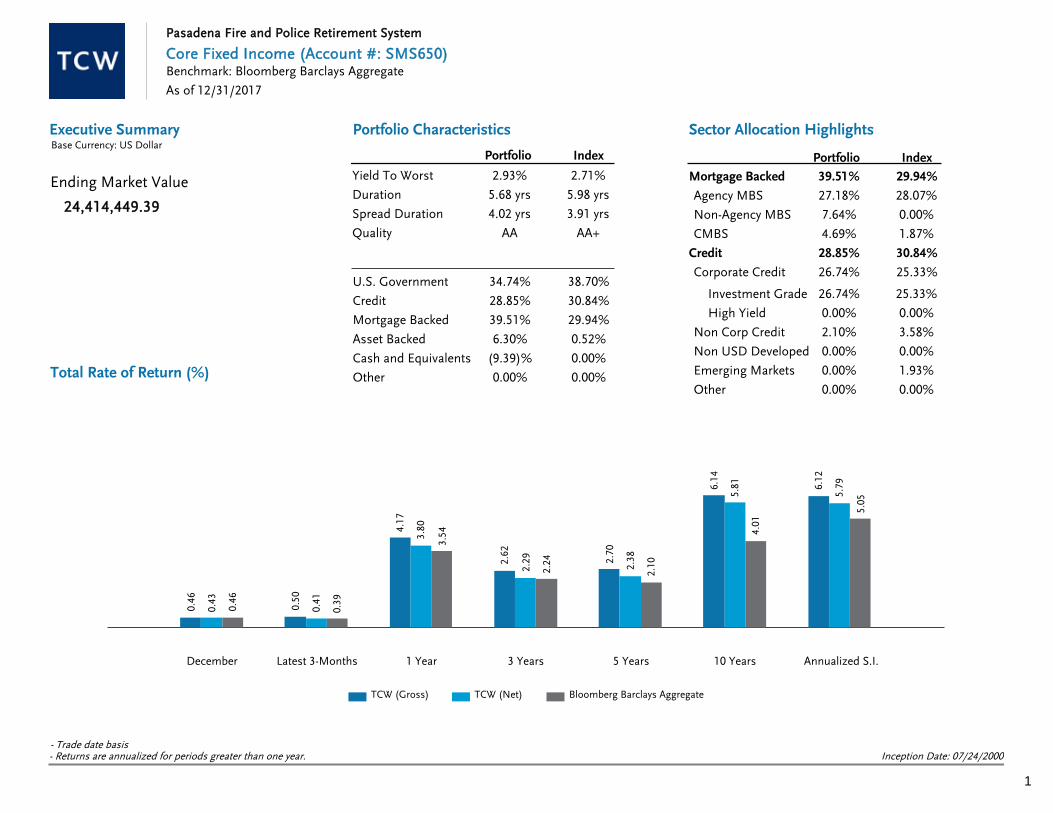
Executive SummaryBase Currency: US Dollar
Portfolio Characteristics
Total Rate of Return (%)
Sector Allocation Highlights
0.4
6
0.5
0
4.1
7
2.6
2
2.7
0
6.1
4
6.1
2
0.4
3
0.4
1
3.8
0
2.2
9
2.3
8
5.8
1
5.7
9
0.4
6
0.3
9
3.5
4
2.2
4
2.1
0
4.0
1
5.0
5
December Latest 3-Months 1 Year 3 Years 5 Years 10 Years Annualized S.I.
TCW (Gross) TCW (Net) Bloomberg Barclays Aggregate
IndexPortfolio
Yield To Worst 2.93% 2.71%
Duration 5.68 yrs 5.98 yrs
Spread Duration 4.02 yrs 3.91 yrs
Quality AA AA+
Portfolio Index
Mortgage Backed 39.51% 29.94%
Agency MBS 27.18% 28.07%
Non-Agency MBS 7.64% 0.00%
CMBS 4.69% 1.87%
Credit 28.85% 30.84%
26.74% 25.33%Corporate Credit
Investment Grade 26.74% 25.33%
High Yield 0.00% 0.00%
Non Corp Credit 2.10% 3.58%
Non USD Developed 0.00% 0.00%
Emerging Markets 0.00% 1.93%
Other 0.00% 0.00%
24,414,449.39
Ending Market Value
34.74%U.S. Government 38.70%
28.85%Credit 30.84%
39.51%Mortgage Backed 29.94%
6.30%Asset Backed 0.52%
(9.39)%Cash and Equivalents 0.00%
0.00%Other 0.00%
Pasadena Fire and Police Retirement System
As of 12/31/2017
Core Fixed Income (Account #: SMS650)Benchmark: Bloomberg Barclays Aggregate
Inception Date: 07/24/2000- Trade date basis- Returns are annualized for periods greater than one year.
1

Duration BreakdownQuality Breakdown
Maturity BreakdownBase Currency: US Dollar
Characteristics Summary
Index
Market Value %
PortfolioMarket Value Portfolio Index
Duration %
-491,2400 - 1 Yrs -2.01% 0.06% 0.40% 0.01%
4,284,1311 - 3 Yrs 17.55% 20.79% 4.67% 6.70%
6,872,5083 - 5 Yrs 28.15% 18.93% 20.08% 11.85%
10,266,8445 - 10 Yrs 42.05% 44.24% 34.53% 40.06%
1,060,45710 - 20 Yrs 4.34% 3.61% 6.74% 6.63%
2,421,75020+ Yrs 9.92% 12.36% 33.58% 34.75%
TOTAL 24,414,449 100%100% 100% 100%
IndexPortfolio
Yield to Worst 2.93% 2.71%
Spread Duration 4.02 yrs 3.91 yrs
Effective Duration 5.68 yrs 5.98 yrs
Duration Difference -0.30 yrs
Average Maturity 8.25 yrs 8.21 yrs
Average Credit Quality AA AA+
Average Coupon 3.66% 3.06%
Current Yield 3.59% 2.97%
Average Convexity -0.01 yrs 0.14 yrs
Index
Market Value %
PortfolioMarket Value Portfolio Index
Duration %
15,534,630AAA 63.63% 71.17% 72.17% 64.19%
1,440,494AA 5.90% 3.85% 4.84% 3.87%
3,652,560A 14.96% 11.49% 8.00% 14.53%
2,985,706BBB 12.23% 13.50% 14.40% 17.41%
318,731BB 1.31% 0.00% 0.52% 0.00%
288,862B 1.18% 0.00% 0.04% 0.00%
193,467CCC & Below 0.79% 0.00% 0.03% 0.00%
0Not Rated 0.00% 0.00% 0.00% 0.00%
TOTAL 24,414,449 100%100% 100% 100%
Index
Market Value %
PortfolioMarket Value Portfolio Index
Duration %
252< 0 Yrs 0.00% 0.00% 0.00% 0.00%
2,511,8870 - 1 Yrs 10.29% 0.11% 0.78% 0.02%
3,175,1151 - 2 Yrs 13.01% 11.34% 3.85% 2.84%
1,618,6202 - 3 Yrs 6.63% 11.48% 2.94% 4.84%
8,966,7963 - 5 Yrs 36.73% 36.51% 27.85% 24.81%
2,508,5435 - 7 Yrs 10.27% 17.86% 10.30% 17.34%
2,372,7517 - 9 Yrs 9.72% 7.45% 14.08% 9.81%
3,260,4869+ Yrs 13.35% 15.24% 40.20% 40.35%
TOTAL 24,414,449 100%100% 100% 100%
Pasadena Fire and Police Retirement System
Core Fixed Income (Account #: SMS650)
As of 12/31/2017
Benchmark: Bloomberg Barclays Aggregate
All market values include accrued interestAll securities unrated by NRSROs will defer to the manager determined rating where applicable and permitted 2

Base Currency: US Dollar
Sector Allocations
Market Value Portfolio Index
% Market Value
Portfolio Index Portfolio Index
Duration % Duration
Mortgage Backed 39.51%9,646,285 26.62% 22.49%29.94% 3.83 4.49
Agency MBS 6,635,736 27.18% 28.07% 4.27 20.79%4.43 20.41%
0.00ARM 0.05% 0.00%11,469 0.00%0.00% 0.45
4.43Pass Through 26.30% 19.50%6,421,573 20.79%28.07% 4.21
0.00CMO 0.83% 0.91%202,695 0.00%0.00% 6.22
0.00Other 0.00% 0.00%0 0.00%0.00% 0.00
Non Agency MBS 1,866,274 7.64% 0.00% 0.79 0.00%0.00 1.07%
0.00Prime 1.14% 0.04%278,810 0.00%0.00% 0.20
0.00Alt-A 1.51% 0.57%368,740 0.00%0.00% 2.13
0.00Subprime 1.91% 0.07%466,499 0.00%0.00% 0.20
0.00Option ARM 2.60% 0.09%634,468 0.00%0.00% 0.20
0.00Other 0.48% 0.30%117,756 0.00%0.00% 3.58
CMBS 1,144,274 4.69% 1.87% 6.23 1.70%5.44 5.14%
5.12Agency CMBS 3.63% 4.16%886,088 0.62%0.73% 6.51
5.64Non Agency CMBS 1.06% 0.98%258,186 1.07%1.14% 5.27
Other 0 0.00% 0.00% 0.00 0.00%0.00 0.00%
Asset Backed 6.30%1,537,328 0.94% 0.19%0.52% 0.85 2.15
0.00Student Loan 4.82% 0.08%1,175,710 0.00%0.00% 0.09
0.00CLO 0.70% 0.02%171,581 0.00%0.00% 0.15
1.88Automobile 0.00% 0.00%0 0.07%0.22% 0.00
2.32Credit Card 0.00% 0.00%0 0.11%0.29% 0.00
2.89Other 0.78% 0.84%190,037 0.01%0.01% 6.16
Other 0.00%0 0.00% 0.00%0.00% 0.00 0.00
0.00Futures 0.00% 0.00%0 0.00%0.00% 0.00
0.00Swaps and Options 0.00% 0.00%0 0.00%0.00% 0.00
0.00Other 0.00% 0.00%0 0.00%0.00% 0.00
TOTAL ACCOUNT 5.6824,414,449 5.98100% 100% 100% 100%
Market Value Portfolio Index
% Market Value
Portfolio Index Portfolio Index
Duration % Duration
Cash and Equivalents (9.39)%(2,292,950) 0.00% 0.00%0.00% 0.10 0.00
0.00Cash (10.47)% (0.02)%(2,556,582) 0.00%0.00% 0.00
0.00T-Bill 1.08% 0.02%263,632 0.00%0.00% 0.10
0.00Agency Discount Note 0.00% 0.00%0 0.00%0.00% 0.00
0.00UST Cash Equivalent 0.00% 0.00%0 0.00%0.00% 0.00
0.00TIPS Cash Equivalent 0.00% 0.00%0 0.00%0.00% 0.00
0.00Agency Cash Equiv 0.00% 0.00%0 0.00%0.00% 0.00
0.00Other Cash Equiv 0.00% 0.00%0 0.00%0.00% 0.00
U.S. Government 34.74%8,481,413 45.04% 39.63%38.70% 7.37 6.13
6.23US Treasury 31.84% 37.88%7,774,683 38.48%36.95% 6.76
0.00TIPs 2.89% 7.15%706,730 0.00%0.00% 14.05
3.96Agency 0.00% 0.00%0 1.16%1.75% 0.00
Credit 28.85%7,042,373 27.41% 37.69%30.84% 5.40 7.31
26.74% 25.33%6,529,339Corporate Credit 32.02%24.53%5.21 7.56
8.13Industrial 9.49% 14.71%2,317,467 20.91%15.39% 8.81
10.06Utility 3.37% 3.68%822,146 3.00%1.78% 6.21
5.94Financial 13.88% 6.14%3,389,726 8.11%8.16% 2.51
2.10% 3.58%513,034Non Corporate Credit 3.06%2.87%7.76 5.12
5.10Sovereign 0.00% 0.00%0 0.05%0.06% 0.00
3.80Foreign Agency 0.00% 0.00%0 0.63%0.99% 0.00
3.43Supranational 0.00% 0.00%0 0.89%1.55% 0.00
9.14Municipal 2.10% 2.87%513,034 1.49%0.98% 7.76
0.00% 0.00%0Bank Loan 0.00%0.00%0.00 0.00
0.00% 1.93%0Emerging Markets 2.60%0.00%0.00 8.07
0.00% 0.00%0Developed Markets 0.00%0.00%0.00 0.00
0.00% 0.00%0Other 0.00%0.00%0.00 0.00
Pasadena Fire and Police Retirement System
Core Fixed Income (Account #: SMS650)
As of 12/31/2017
Benchmark: Bloomberg Barclays Aggregate
All market values include accrued interest3

Cusip Security Name Coupon Maturity PriceParOriginal
CostCostPrice Principal Accrued
% ofPortfolio Dur S&PMoodys Fitch
CreditQuality
CASH AND EQUIVALENTS
CASH
USD US DOLLAR (2,556,581.69)1.000 (2,556,581.69) 0.00 (10.47)% 0.01 AAA
TOTAL CASH (2,556,581.69) (2,556,581.69) 0.00 (10.47)% 0.00
T-BILL
912796NR6 US TREASURY BILL2/8/2018
0.000 02/08/18 99.861264,000.00 263,015.5799.627 263,631.98 0.00 1.08% 0.10 AAA Aaa AA+ AAA
TOTAL T-BILL 263,015.57 263,631.98 0.00 1.08% 0.10
(2,293,566.12) (2,292,949.71) 0.00 (9.39)%TOTAL CASH AND EQUIVALENTS 0.10
U.S. GOVERNMENT
US TREASURY
912810RZ3 US TREASURY N/B 2.750 11/15/47 100.1801,210,000.00 1,188,323.1498.209 1,212,174.19 4,320.23 4.98% 20.62 AAA Aaa AA+ AAA
9128282X7 US TREASURY N/B 1.375 09/30/19 99.134590,000.00 589,037.5099.837 584,887.54 2,072.70 2.40% 1.71 AAA Aaa AA+ AAA
9128283C2 US TREASURY N/B 2.000 10/31/22 99.152800,000.00 798,985.1699.873 793,215.70 2,740.33 3.26% 4.58 AAA Aaa AA+ AAA
9128283F5 US TREASURY N/B 2.250 11/15/27 98.615660,000.00 652,144.5498.810 650,861.78 1,936.12 2.67% 8.82 AAA Aaa AA+ AAA
9128283H1 US TREASURY N/B 1.750 11/30/19 99.754235,000.00 235,000.00100.000 234,421.68 361.54 0.96% 1.88 AAA Aaa AA+ AAA
9128283N8 US TREASURY N/B 1.875 12/31/19 99.979135,000.00 134,936.7299.953 134,971.00 13.98 0.55% 1.95 AAA Aaa AA+ AAA
912828F62 US TREASURY N/B 1.500 10/31/19 99.3241,085,000.00 1,083,050.2799.820 1,077,667.78 2,787.43 4.43% 1.79 AAA Aaa AA+ AAA
912828M80 US TREASURY N/B 2.000 11/30/22 99.1051,730,000.00 1,723,925.5999.649 1,714,521.14 3,041.76 7.04% 4.66 AAA Aaa AA+ AAA
912828N30 US TREASURY N/B 2.125 12/31/22 99.5981,360,000.00 1,352,746.4299.467 1,354,528.12 159.68 5.55% 4.74 AAA Aaa AA+ AAA
TOTAL US TREASURY 7,758,149.34 7,757,248.92 17,433.78 31.84% 6.76
TIPS
912828S50 TSY INFL IX N/B 0.125 07/15/26 97.740190,376.10 184,155.3098.164 186,072.57 109.93 0.76% 8.47 AAA Aaa AA+ AAA
912828X39 TSY INFL IX N/B 0.125 04/15/22 99.308147,070.60 146,172.6799.888 146,052.14 39.39 0.60% 4.27 AAA Aaa AA+ AAA
9128282L3 TSY INFL IX N/B 0.375 07/15/27 99.508115,963.70 115,667.67100.444 115,392.75 200.89 0.47% 9.34 AAA Aaa AA+ AAA
Pasadena Fire and Police Retirement System
Core Fixed Income (Account #: SMS650)
As of 12/31/2017
Base Currency: US Dollar
Account Holdings Detail
Benchmark: Bloomberg Barclays Aggregate
4

Pasadena Fire and Police Retirement System
Core Fixed Income (Account #: SMS650)
As of 12/31/2017
Base Currency: US Dollar
Account Holdings Detail (continued)
Benchmark: Bloomberg Barclays Aggregate
Cusip Security Name Coupon Maturity PriceParOriginal
CostCostPrice Principal Accrued
% ofPortfolio Dur S&PMoodys Fitch
CreditQuality
TIPS
912810RW0 TSY INFL IX N/B 0.875 02/15/47 103.919248,309.55 243,518.8199.488 258,041.83 820.67 1.06% 25.68 AAA Aaa AA+ AAA
TOTAL TIPS 689,514.45 705,559.29 1,170.88 2.89% 14.05
8,447,663.79 8,462,808.21 18,604.66 34.74%TOTAL U.S. GOVERNMENT 7.37
CREDIT
CORPORATE CREDIT
INDUSTRIAL
002824BF6 ABBOTT LABORATORIES 3.750 11/30/26 102.934105,000.00 104,218.8099.256 108,080.28 339.06 0.44% 7.51 BBB Baa3 BBB
00287YAS8 ABBVIE INC 4.700 05/14/45 112.71440,000.00 38,639.6096.599 45,085.44 245.44 0.19% 16.18 A- Baa2 A-
00507UAH4 ACTAVIS FUNDING SCS 4.850 06/15/44 107.44725,000.00 26,638.25106.553 26,861.77 53.89 0.11% 15.46 BBB- Baa3 BBB BBB-
02209SAD5 ALTRIA GROUP INC 9.700 11/10/18 106.39795,000.00 106,677.40112.292 101,077.48 1,305.46 0.42% 0.84 A- A3 A- A-
03027XAQ3 AMERICAN TOWER CORP 3.000 06/15/23 99.86325,000.00 24,935.5099.742 24,965.67 47.92 0.10% 5.03 BBB- Baa3 BBB- BBB
032511BK2 ANADARKO PETROLEUMCORP
4.500 07/15/44 100.03630,000.00 28,279.5094.265 30,010.65 622.50 0.13% 15.34 BBB Ba1 BBB BBB
035242AN6 ANHEUSER-BUSCH INBEVFIN
4.900 02/01/46 116.29872,000.00 71,830.8099.765 83,734.38 1,470.00 0.35% 16.08 A- A3 A- BBB
037833BX7 APPLE INC 4.650 02/23/46 117.36425,000.00 24,855.7599.423 29,341.00 413.33 0.12% 16.56 AA+ Aa1 AA+
00206RCG5 AT&T INC 4.800 06/15/44 98.28620,000.00 19,071.2095.356 19,657.15 42.67 0.08% 15.01 BBB+ Baa1 BBB+ A-
00206RCT7 AT&T INC 4.125 02/17/26 102.45770,000.00 69,953.8099.934 71,719.77 1,074.79 0.30% 6.77 BBB+ Baa1 BBB+ A-
00206RDR0 AT&T INC 5.250 03/01/37 105.88680,000.00 79,623.2099.529 84,708.92 1,400.00 0.35% 12.17 BBB+ Baa1 BBB+ A-
124857AV5 CBS CORP 3.700 06/01/28 98.75435,000.00 34,405.0098.300 34,563.83 161.88 0.14% 8.55 BBB Baa2 BBB BBB
14987BAE3 CC HOLDINGS GS VLLC/CRO
3.849 04/15/23 103.34335,000.00 36,678.60104.796 36,170.00 284.40 0.15% 4.78 BBB Baa2 BBB- BBB
151020AU8 CELGENE CORP 5.000 08/15/45 113.61175,000.00 74,948.2599.931 85,208.03 1,416.67 0.35% 15.67 BBB+ Baa2 BBB+
161175AY0 CHARTER COMM OPTLLC/CAP
4.908 07/23/25 105.966115,000.00 115,000.00100.000 121,860.82 2,477.18 0.51% 6.16 BBB- Ba1 BBB- BBB-
210805CQ8 CONTINENTAL AIRLINES99-1 A
6.545 02/02/19 102.50079,873.76 87,262.08109.250 81,870.60 2,163.70 0.34% 0.60 A- Baa2 A-
210805BU0 CONTL AIRLINES 1997-4 6.900 01/02/18 100.0636,674.91 6,758.35101.250 6,679.08 229.01 0.03% 0.00 A+ A3 A+
5
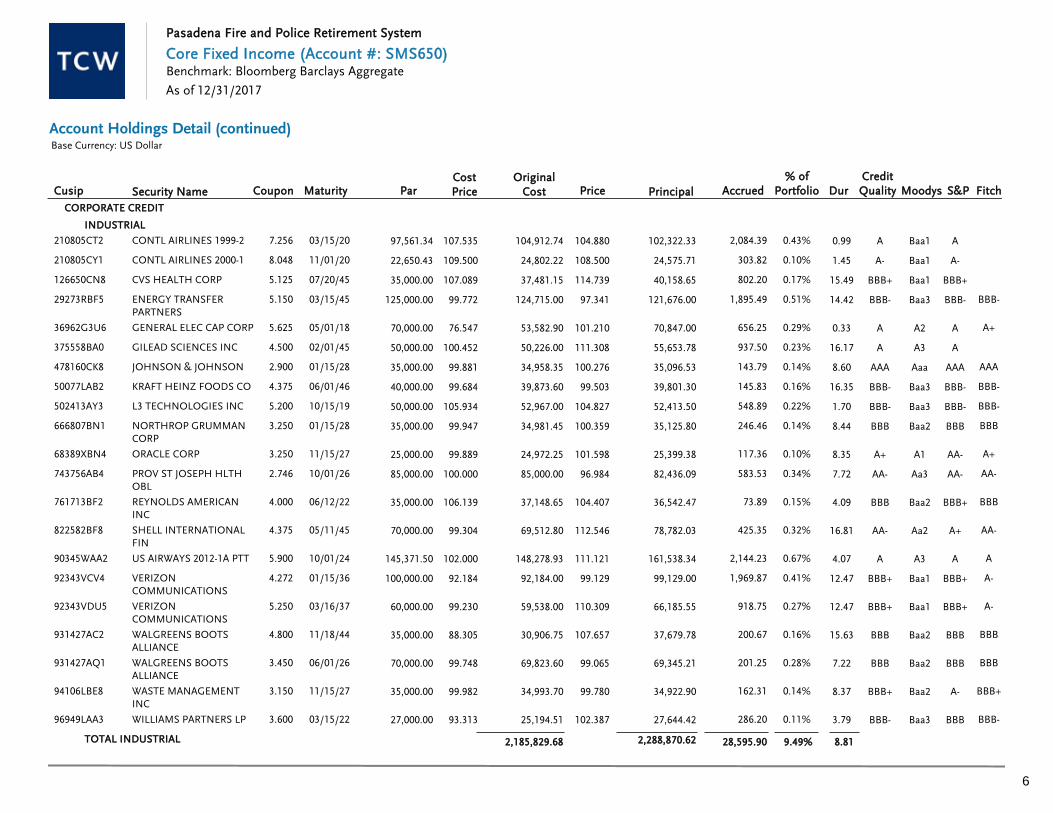
Pasadena Fire and Police Retirement System
Core Fixed Income (Account #: SMS650)
As of 12/31/2017
Base Currency: US Dollar
Account Holdings Detail (continued)(continued)
Benchmark: Bloomberg Barclays Aggregate
Cusip Security Name Coupon Maturity PriceParOriginal
CostCostPrice Principal Accrued
% ofPortfolio Dur S&PMoodys Fitch
CreditQuality
CORPORATE CREDIT
INDUSTRIAL
210805CT2 CONTL AIRLINES 1999-2 7.256 03/15/20 104.88097,561.34 104,912.74107.535 102,322.33 2,084.39 0.43% 0.99 A Baa1 A
210805CY1 CONTL AIRLINES 2000-1 8.048 11/01/20 108.50022,650.43 24,802.22109.500 24,575.71 303.82 0.10% 1.45 A- Baa1 A-
126650CN8 CVS HEALTH CORP 5.125 07/20/45 114.73935,000.00 37,481.15107.089 40,158.65 802.20 0.17% 15.49 BBB+ Baa1 BBB+
29273RBF5 ENERGY TRANSFERPARTNERS
5.150 03/15/45 97.341125,000.00 124,715.0099.772 121,676.00 1,895.49 0.51% 14.42 BBB- Baa3 BBB- BBB-
36962G3U6 GENERAL ELEC CAP CORP 5.625 05/01/18 101.21070,000.00 53,582.9076.547 70,847.00 656.25 0.29% 0.33 A A2 A A+
375558BA0 GILEAD SCIENCES INC 4.500 02/01/45 111.30850,000.00 50,226.00100.452 55,653.78 937.50 0.23% 16.17 A A3 A
478160CK8 JOHNSON & JOHNSON 2.900 01/15/28 100.27635,000.00 34,958.3599.881 35,096.53 143.79 0.14% 8.60 AAA Aaa AAA AAA
50077LAB2 KRAFT HEINZ FOODS CO 4.375 06/01/46 99.50340,000.00 39,873.6099.684 39,801.30 145.83 0.16% 16.35 BBB- Baa3 BBB- BBB-
502413AY3 L3 TECHNOLOGIES INC 5.200 10/15/19 104.82750,000.00 52,967.00105.934 52,413.50 548.89 0.22% 1.70 BBB- Baa3 BBB- BBB-
666807BN1 NORTHROP GRUMMANCORP
3.250 01/15/28 100.35935,000.00 34,981.4599.947 35,125.80 246.46 0.14% 8.44 BBB Baa2 BBB BBB
68389XBN4 ORACLE CORP 3.250 11/15/27 101.59825,000.00 24,972.2599.889 25,399.38 117.36 0.10% 8.35 A+ A1 AA- A+
743756AB4 PROV ST JOSEPH HLTHOBL
2.746 10/01/26 96.98485,000.00 85,000.00100.000 82,436.09 583.53 0.34% 7.72 AA- Aa3 AA- AA-
761713BF2 REYNOLDS AMERICANINC
4.000 06/12/22 104.40735,000.00 37,148.65106.139 36,542.47 73.89 0.15% 4.09 BBB Baa2 BBB+ BBB
822582BF8 SHELL INTERNATIONALFIN
4.375 05/11/45 112.54670,000.00 69,512.8099.304 78,782.03 425.35 0.32% 16.81 AA- Aa2 A+ AA-
90345WAA2 US AIRWAYS 2012-1A PTT 5.900 10/01/24 111.121145,371.50 148,278.93102.000 161,538.34 2,144.23 0.67% 4.07 A A3 A A
92343VCV4 VERIZONCOMMUNICATIONS
4.272 01/15/36 99.129100,000.00 92,184.0092.184 99,129.00 1,969.87 0.41% 12.47 BBB+ Baa1 BBB+ A-
92343VDU5 VERIZONCOMMUNICATIONS
5.250 03/16/37 110.30960,000.00 59,538.0099.230 66,185.55 918.75 0.27% 12.47 BBB+ Baa1 BBB+ A-
931427AC2 WALGREENS BOOTSALLIANCE
4.800 11/18/44 107.65735,000.00 30,906.7588.305 37,679.78 200.67 0.16% 15.63 BBB Baa2 BBB BBB
931427AQ1 WALGREENS BOOTSALLIANCE
3.450 06/01/26 99.06570,000.00 69,823.6099.748 69,345.21 201.25 0.28% 7.22 BBB Baa2 BBB BBB
94106LBE8 WASTE MANAGEMENTINC
3.150 11/15/27 99.78035,000.00 34,993.7099.982 34,922.90 162.31 0.14% 8.37 BBB+ Baa2 A- BBB+
96949LAA3 WILLIAMS PARTNERS LP 3.600 03/15/22 102.38727,000.00 25,194.5193.313 27,644.42 286.20 0.11% 3.79 BBB- Baa3 BBB BBB-
TOTAL INDUSTRIAL 2,185,829.68 2,288,870.62 28,595.90 9.49% 8.81
6

Pasadena Fire and Police Retirement System
Core Fixed Income (Account #: SMS650)
As of 12/31/2017
Base Currency: US Dollar
Account Holdings Detail (continued)(continued) (continued)
Benchmark: Bloomberg Barclays Aggregate
Cusip Security Name Coupon Maturity PriceParOriginal
CostCostPrice Principal Accrued
% ofPortfolio Dur S&PMoodys Fitch
CreditQuality
UTILITY
030288AB0 AMERICANTRANSMISSION SY
5.000 09/01/44 116.35875,000.00 74,255.2599.007 87,268.35 1,250.00 0.36% 15.54 BBB+ Baa1 BBB- BBB+
26442CAM6 DUKE ENERGY CAROLINAS 4.250 12/15/41 110.31550,000.00 49,936.5099.873 55,157.71 94.44 0.23% 15.58 AA Aa2 A
65473QBH5 NISOURCE FINANCE CORP 2.650 11/17/22 99.47325,000.00 24,968.5099.874 24,868.28 80.97 0.10% 4.54 BBB Baa2 BBB+ BBB
68233JAH7 ONCOR ELECTRICDELIVERY
5.250 09/30/40 127.06650,000.00 50,463.50100.927 63,533.18 663.54 0.26% 14.47 A- A3 A BBB+
744499AP9 PUBLIC SVC NEW MEXICO 7.950 05/15/18 102.062226,000.00 273,742.50121.125 230,660.91 2,295.78 0.95% 0.36 BBB+ Baa2 BBB+
8426EPAA6 SOUTHERN CO GASCAPITAL
2.450 10/01/23 97.083130,000.00 129,898.6099.922 126,207.45 796.25 0.52% 5.28 BBB+ Baa1 A- BBB+
898813AL4 TUCSON ELECTRIC POWERCO
3.850 03/15/23 100.764225,000.00 224,268.7599.675 226,718.66 2,550.63 0.94% 4.68 A- A3 A-
TOTAL UTILITY 827,533.60 814,414.52 7,731.62 3.37% 6.21
FINANCIAL
015271AF6 ALEXANDRIA REAL ESTATEE
2.750 01/15/20 100.46960,000.00 60,196.20100.327 60,281.21 760.83 0.25% 1.91 BBB Baa2 BBB
024836AD0 AMERICAN CAMPUSCOMMUNIT
3.625 11/15/27 99.01635,000.00 34,969.2099.912 34,655.75 285.47 0.14% 8.17 BBB Baa2 BBB
06051GFF1 BANK OF AMERICA CORP 4.000 04/01/24 105.80055,000.00 55,749.10101.362 58,190.16 550.00 0.24% 6.94 A- A3 A- A
06051GGT0 BANK OF AMERICA CORP 3.093 10/01/25 99.86150,000.00 50,000.00100.000 49,930.60 442.47 0.21% 6.05 A- A3 A- A
06051GGV5 BANK OF AMERICA CORP 3.004 12/20/23 100.326107,000.00 107,056.92100.053 107,348.47 98.21 0.44% 4.62 A- A3 A- A
06051GGW3 BANK OF AMERICA CORP 3.419 12/20/28 100.14747,000.00 46,739.9099.447 47,069.27 49.10 0.19% 8.47 A- A3 A- A
06051GDX4 BANK OF AMERICA NA 5.650 05/01/18 101.232215,000.00 224,416.25104.380 217,647.98 2,024.58 0.90% 0.33 A- A3 A- A
06406RAC1 BANK OF NY MELLONCORP
2.661 05/16/23 99.63250,000.00 50,182.00100.364 49,815.85 166.31 0.20% 4.12 A+ A1 A AA-
073902RU4 BEAR STEARNS CO INC 7.250 02/01/18 100.401135,000.00 128,305.6095.041 135,541.40 4,078.13 0.57% 0.08 A- A3 A- A+
10112RAY0 BOSTON PROPERTIES LP 2.750 10/01/26 94.517100,000.00 91,666.0091.666 94,517.12 687.50 0.39% 7.64 BBB+ Baa2 A- BBB+
125509BV0 CIGNA CORP 3.050 10/15/27 97.29935,000.00 34,932.8099.808 34,054.63 317.28 0.14% 8.31 BBB+ Baa1 A BBB+
172967EV9 CITIGROUP INC 8.500 05/22/19 108.369200,000.00 218,080.00109.040 216,738.41 1,841.67 0.90% 1.32 BBB+ Baa1 BBB+ A
30958PAA1 FARMERS EXCHANGE CAPII
6.151 11/01/53 115.02680,000.00 80,000.00100.000 92,020.64 820.13 0.38% 10.59 BBB+ Baa2 BBB+
38141EA25 GOLDMAN SACHS GROUPINC
7.500 02/15/19 105.712217,000.00 225,185.26103.772 229,395.31 6,148.33 0.96% 1.06 A- A3 BBB+ A
7

Pasadena Fire and Police Retirement System
Core Fixed Income (Account #: SMS650)
As of 12/31/2017
Base Currency: US Dollar
Account Holdings Detail (continued)(continued) (continued) (continued)
Benchmark: Bloomberg Barclays Aggregate
Cusip Security Name Coupon Maturity PriceParOriginal
CostCostPrice Principal Accrued
% ofPortfolio Dur S&PMoodys Fitch
CreditQuality
CORPORATE CREDIT
FINANCIAL
38141GFM1 GOLDMAN SACHS GROUPINC
6.150 04/01/18 101.059335,000.00 350,476.95104.620 338,546.61 5,150.63 1.41% 0.25 A- A3 BBB+ A
4041A2AH7 HBOS PLC 6.750 05/21/18 101.624125,000.00 107,746.2586.197 127,029.75 937.50 0.52% 0.38 BBB+ Baa1 BBB- A-
40414LAK5 HCP INC 4.200 03/01/24 104.89065,000.00 67,671.50104.110 68,178.70 910.00 0.28% 5.29 BBB Baa2 BBB BBB
42217KBF2 HEALTH CARE REIT INC 4.000 06/01/25 103.56550,000.00 52,652.50105.305 51,782.57 166.67 0.21% 6.35 BBB+ Baa1 BBB+ BBB+
46623EKD0 JPMORGAN CHASE & CO 1.700 03/01/18 99.971100,000.00 100,160.00100.160 99,971.19 566.67 0.41% 0.15 A- A3 A- A+
46625HRY8 JPMORGAN CHASE & CO 3.782 02/01/28 103.70650,000.00 52,064.50104.129 51,853.08 787.92 0.22% 7.64 A- A3 A- A+
6174467P8 MORGAN STANLEY 5.500 07/24/20 107.28250,000.00 49,506.0099.012 53,641.16 1,199.31 0.22% 2.36 A- A3 BBB+ A
61746BEH5 MORGAN STANLEY 2.213 02/14/20 100.415125,000.00 125,000.00100.000 125,518.92 368.82 0.52% 0.05 A- A3 BBB+ A
61747YCG8 MORGAN STANLEY 7.300 05/13/19 106.646100,000.00 114,780.00114.780 106,645.91 973.33 0.44% 1.30 A- A3 BBB+ A
638671AJ6 NATIONWIDE MUTUALINSURA
3.879 12/15/24 100.000105,000.00 105,000.00100.000 105,000.00 192.31 0.43% 0.23 A- A-
69353REJ3 PNC BANK NA 1.500 02/23/18 99.962250,000.00 249,972.5099.989 249,905.38 1,333.33 1.03% 0.14 A A2 A A+
91324PDF6 UNITEDHEALTH GROUPINC
3.750 10/15/47 102.46735,000.00 34,676.6099.076 35,863.29 240.63 0.15% 18.17 A- A3 A+ A-
92276MBB0 VENTAS REALTY LP/CAPCRP
2.700 04/01/20 100.492125,000.00 124,598.7599.679 125,614.72 843.75 0.52% 2.03 BBB+ Baa1 BBB+ BBB+
949746RW3 WELLS FARGO &COMPANY
3.000 04/22/26 98.36435,000.00 34,191.8597.691 34,427.31 201.25 0.14% 7.32 A A2 A A+
94974BGP9 WELLS FARGO &COMPANY
3.550 09/29/25 102.48845,000.00 45,505.80101.124 46,119.43 408.25 0.19% 6.75 A A2 A A+
94988J5G8 WELLS FARGO BANK NA 2.150 12/06/19 99.896250,000.00 249,655.0099.862 249,738.74 373.26 1.02% 1.88 AA- Aa2 AA- AA-
42217KAU0 WELLTOWER INC 4.950 01/15/21 106.37155,000.00 56,233.30102.242 58,503.86 1,255.38 0.24% 2.57 BBB+ Baa1 BBB+ BBB+
TOTAL FINANCIAL 3,327,370.73 3,355,547.37 34,179.01 13.88% 2.51
TOTAL CORPORATE CREDIT 6,340,734.01 6,458,832.52 70,506.53 26.74% 5.21
NON CORPORATE CREDIT
MUNICIPAL
01026CAC5 ALABAMA ECONSETTLEME
3.163 09/15/25 101.196105,000.00 105,000.00100.000 106,255.80 977.89 0.44% 4.03 A+ A1 A-
8

Pasadena Fire and Police Retirement System
Core Fixed Income (Account #: SMS650)
As of 12/31/2017
Base Currency: US Dollar
Account Holdings Detail (continued)(continued) (continued) (continued)
Benchmark: Bloomberg Barclays Aggregate
Cusip Security Name Coupon Maturity PriceParOriginal
CostCostPrice Principal Accrued
% ofPortfolio Dur S&PMoodys Fitch
CreditQuality
NON CORPORATE CREDIT
MUNICIPAL
13063BFS6 CA ST-TXBL 6.650 03/01/22 113.59150,000.00 63,108.00126.216 56,795.50 1,108.33 0.24% 3.25 AA- Aa3 AA- AA-
544525NZ7 LA DWP 6.008 07/01/39 130.482100,000.00 124,307.00124.307 130,482.00 3,004.00 0.55% 10.61 AA Aa2 AA+ AA
64971M4P4 NYC FIN AUTH 5.508 08/01/37 127.52250,000.00 63,200.50126.401 63,761.00 1,147.50 0.27% 11.58 AAA Aa1 AAA AAA
649902T29 NYS DORM AUTH-BABS 5.500 03/15/30 117.99250,000.00 59,215.00118.430 58,996.00 809.72 0.25% 7.41 AA+ Aa1 AAA AA+
93974CRD4 WASHINGTON ST-F-BABS 5.040 08/01/31 117.49575,000.00 86,037.00114.716 88,121.25 1,575.00 0.37% 8.39 AA+ Aa1 AA+ AA+
TOTAL MUNICIPAL 500,867.50 504,411.55 8,622.45 2.10% 7.76
TOTAL NON CORPORATE CREDIT 500,867.50 504,411.55 8,622.45 2.10% 7.76
6,841,601.51 6,963,244.07 79,128.98 28.85%TOTAL CREDIT 5.40
MORTGAGE BACKED
AGENCY MBS
ARM
31407ULL9 FN 841031 3.585 11/01/35 104.966827.25 828.03100.094 868.34 2.47 0.00% 0.81 AAA Aaa AAA AAA
31411YL27 FN 918445 3.474 05/01/37 104.74310,090.15 10,152.82100.621 10,568.73 29.21 0.04% 0.42 AAA Aaa AAA AAA
TOTAL ARM 10,980.85 11,437.06 31.68 0.05% 0.45
PASS THROUGH
3128KRVU5 FG A61527 5.000 07/01/36 109.51540,795.51 41,662.41102.125 44,677.07 169.98 0.18% 4.12 AAA Aaa AAA AAA
3128M8MJ0 FG G06361 4.000 03/01/41 106.60989,902.46 88,483.6998.422 95,843.63 299.67 0.39% 4.98 AAA Aaa AAA AAA
3128MJXF2 FG G08677 4.000 11/01/45 104.696137,528.52 145,409.55105.731 143,987.47 458.43 0.59% 3.97 AAA Aaa AAA AAA
3128MJXK1 FG G08681 3.500 12/01/45 102.778167,613.42 172,589.44102.969 172,269.32 488.87 0.71% 4.38 AAA Aaa AAA AAA
3128MJX47 FG G08698 3.500 03/01/46 102.74715,426.92 16,166.93104.797 15,850.75 45.00 0.07% 4.40 AAA Aaa AAA AAA
3128MJX54 FG G08699 4.000 03/01/46 104.675111,528.77 118,965.47106.668 116,742.95 371.76 0.48% 4.01 AAA Aaa AAA AAA
3128MJYH7 FG G08711 3.500 06/01/46 102.757171,114.27 179,930.67105.152 175,831.65 499.08 0.72% 4.65 AAA Aaa AAA AAA
3128MJYM6 FG G08715 3.000 08/01/46 100.059329,592.14 342,724.60103.985 329,784.95 823.98 1.35% 5.67 AAA Aaa AAA AAA
3128MJYT1 FG G08721 3.000 09/01/46 100.059145,787.91 151,220.79103.727 145,873.20 364.47 0.60% 5.72 AAA Aaa AAA AAA
9
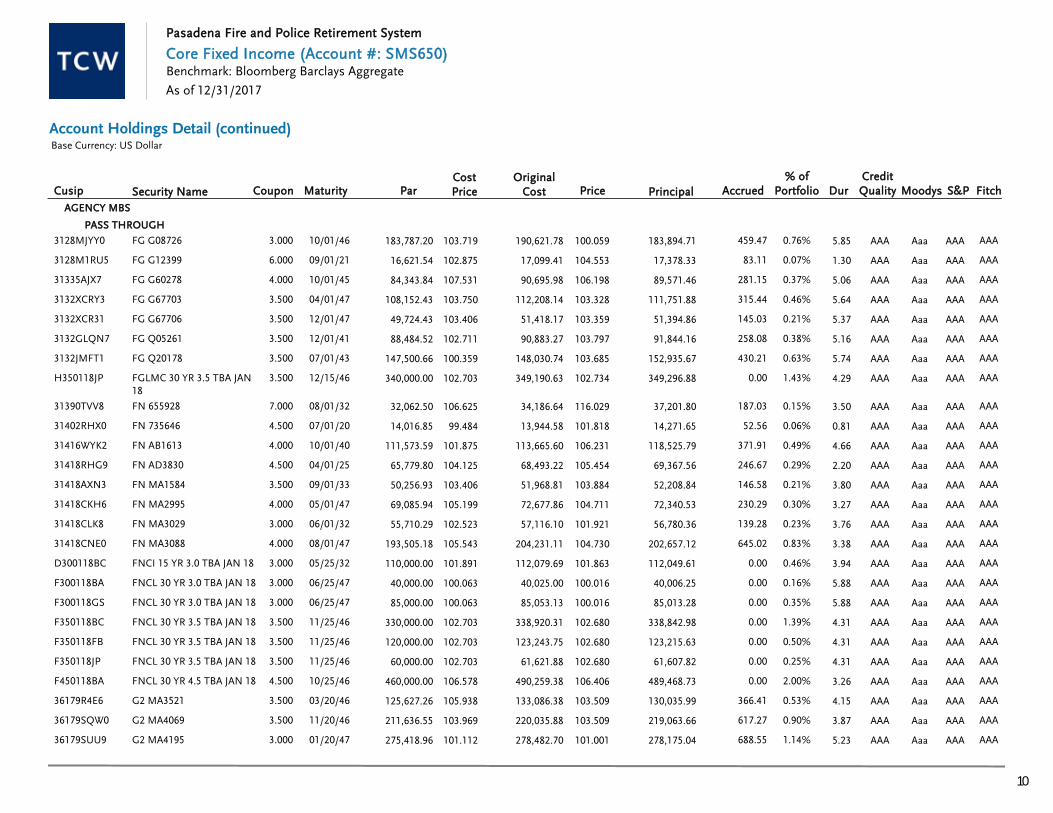
Pasadena Fire and Police Retirement System
Core Fixed Income (Account #: SMS650)
As of 12/31/2017
Base Currency: US Dollar
Account Holdings Detail (continued)(continued) (continued) (continued)
Benchmark: Bloomberg Barclays Aggregate
Cusip Security Name Coupon Maturity PriceParOriginal
CostCostPrice Principal Accrued
% ofPortfolio Dur S&PMoodys Fitch
CreditQuality
AGENCY MBS
PASS THROUGH
3128MJYY0 FG G08726 3.000 10/01/46 100.059183,787.20 190,621.78103.719 183,894.71 459.47 0.76% 5.85 AAA Aaa AAA AAA
3128M1RU5 FG G12399 6.000 09/01/21 104.55316,621.54 17,099.41102.875 17,378.33 83.11 0.07% 1.30 AAA Aaa AAA AAA
31335AJX7 FG G60278 4.000 10/01/45 106.19884,343.84 90,695.98107.531 89,571.46 281.15 0.37% 5.06 AAA Aaa AAA AAA
3132XCRY3 FG G67703 3.500 04/01/47 103.328108,152.43 112,208.14103.750 111,751.88 315.44 0.46% 5.64 AAA Aaa AAA AAA
3132XCR31 FG G67706 3.500 12/01/47 103.35949,724.43 51,418.17103.406 51,394.86 145.03 0.21% 5.37 AAA Aaa AAA AAA
3132GLQN7 FG Q05261 3.500 12/01/41 103.79788,484.52 90,883.27102.711 91,844.16 258.08 0.38% 5.16 AAA Aaa AAA AAA
3132JMFT1 FG Q20178 3.500 07/01/43 103.685147,500.66 148,030.74100.359 152,935.67 430.21 0.63% 5.74 AAA Aaa AAA AAA
H350118JP FGLMC 30 YR 3.5 TBA JAN18
3.500 12/15/46 102.734340,000.00 349,190.63102.703 349,296.88 0.00 1.43% 4.29 AAA Aaa AAA AAA
31390TVV8 FN 655928 7.000 08/01/32 116.02932,062.50 34,186.64106.625 37,201.80 187.03 0.15% 3.50 AAA Aaa AAA AAA
31402RHX0 FN 735646 4.500 07/01/20 101.81814,016.85 13,944.5899.484 14,271.65 52.56 0.06% 0.81 AAA Aaa AAA AAA
31416WYK2 FN AB1613 4.000 10/01/40 106.231111,573.59 113,665.60101.875 118,525.79 371.91 0.49% 4.66 AAA Aaa AAA AAA
31418RHG9 FN AD3830 4.500 04/01/25 105.45465,779.80 68,493.22104.125 69,367.56 246.67 0.29% 2.20 AAA Aaa AAA AAA
31418AXN3 FN MA1584 3.500 09/01/33 103.88450,256.93 51,968.81103.406 52,208.84 146.58 0.21% 3.80 AAA Aaa AAA AAA
31418CKH6 FN MA2995 4.000 05/01/47 104.71169,085.94 72,677.86105.199 72,340.53 230.29 0.30% 3.27 AAA Aaa AAA AAA
31418CLK8 FN MA3029 3.000 06/01/32 101.92155,710.29 57,116.10102.523 56,780.36 139.28 0.23% 3.76 AAA Aaa AAA AAA
31418CNE0 FN MA3088 4.000 08/01/47 104.730193,505.18 204,231.11105.543 202,657.12 645.02 0.83% 3.38 AAA Aaa AAA AAA
D300118BC FNCI 15 YR 3.0 TBA JAN 18 3.000 05/25/32 101.863110,000.00 112,079.69101.891 112,049.61 0.00 0.46% 3.94 AAA Aaa AAA AAA
F300118BA FNCL 30 YR 3.0 TBA JAN 18 3.000 06/25/47 100.01640,000.00 40,025.00100.063 40,006.25 0.00 0.16% 5.88 AAA Aaa AAA AAA
F300118GS FNCL 30 YR 3.0 TBA JAN 18 3.000 06/25/47 100.01685,000.00 85,053.13100.063 85,013.28 0.00 0.35% 5.88 AAA Aaa AAA AAA
F350118BC FNCL 30 YR 3.5 TBA JAN 18 3.500 11/25/46 102.680330,000.00 338,920.31102.703 338,842.98 0.00 1.39% 4.31 AAA Aaa AAA AAA
F350118FB FNCL 30 YR 3.5 TBA JAN 18 3.500 11/25/46 102.680120,000.00 123,243.75102.703 123,215.63 0.00 0.50% 4.31 AAA Aaa AAA AAA
F350118JP FNCL 30 YR 3.5 TBA JAN 18 3.500 11/25/46 102.68060,000.00 61,621.88102.703 61,607.82 0.00 0.25% 4.31 AAA Aaa AAA AAA
F450118BA FNCL 30 YR 4.5 TBA JAN 18 4.500 10/25/46 106.406460,000.00 490,259.38106.578 489,468.73 0.00 2.00% 3.26 AAA Aaa AAA AAA
36179R4E6 G2 MA3521 3.500 03/20/46 103.509125,627.26 133,086.38105.938 130,035.99 366.41 0.53% 4.15 AAA Aaa AAA AAA
36179SQW0 G2 MA4069 3.500 11/20/46 103.509211,636.55 220,035.88103.969 219,063.66 617.27 0.90% 3.87 AAA Aaa AAA AAA
36179SUU9 G2 MA4195 3.000 01/20/47 101.001275,418.96 278,482.70101.112 278,175.04 688.55 1.14% 5.23 AAA Aaa AAA AAA
10

Pasadena Fire and Police Retirement System
Core Fixed Income (Account #: SMS650)
As of 12/31/2017
Base Currency: US Dollar
Account Holdings Detail (continued)(continued) (continued) (continued)
Benchmark: Bloomberg Barclays Aggregate
Cusip Security Name Coupon Maturity PriceParOriginal
CostCostPrice Principal Accrued
% ofPortfolio Dur S&PMoodys Fitch
CreditQuality
AGENCY MBS
PASS THROUGH
36179S2P1 G2 MA4382 3.500 04/20/47 103.52283,848.02 87,378.80104.211 86,801.25 244.56 0.36% 3.54 AAA Aaa AAA AAA
36179TAK1 G2 MA4510 3.500 06/20/47 103.52224,311.44 25,304.79104.086 25,167.72 70.91 0.10% 3.49 AAA Aaa AAA AAA
36179TC29 G2 MA4589 5.000 07/20/47 107.16861,762.43 66,356.01107.438 66,189.55 257.34 0.27% 2.95 AAA Aaa AAA AAA
36179TG41 G2 MA4719 3.500 09/20/47 103.51024,792.22 25,623.14103.352 25,662.48 50.62 0.11% 3.49 AAA Aaa AAA AAA
36179TLT0 G2 MA4838 4.000 11/20/47 104.40364,855.17 68,105.53105.012 67,710.56 216.18 0.28% 2.76 AAA Aaa AAA AAA
T300118BA G2SF 30 YR 3.0 TBA JAN 18 3.000 07/20/47 100.914200,000.00 201,781.25100.891 201,828.13 0.00 0.83% 5.28 AAA Aaa AAA AAA
T350118GS G2SF 30 YR 3.5 TBA JAN 18 3.500 05/20/47 103.383215,000.00 222,365.43103.426 222,273.05 0.00 0.91% 3.65 AAA Aaa AAA AAA
T400118RC G2SF 30 YR 4.0 TBA JAN 18 4.000 10/20/46 104.25055,000.00 57,397.66104.359 57,337.50 0.00 0.23% 2.89 AAA Aaa AAA AAA
T450118JP G2SF 30 YR 4.5 TBA JAN 18 4.500 02/20/46 104.906555,000.00 584,137.50105.250 582,229.66 0.00 2.38% 2.61 AAA Aaa AAA AAA
T500118MZ G2SF 30 YR 5.0 TBA JAN 18 5.000 04/20/41 106.619110,000.00 117,691.41106.992 117,281.06 0.00 0.48% 3.11 AAA Aaa AAA AAA
36204QFC9 GN 376463 6.500 04/15/24 110.9931,681.09 1,605.4495.500 1,865.90 9.11 0.01% 2.15 AAA Aaa AAA AAA
36225ABC3 GN 780035 6.500 07/15/24 111.0031,391.18 1,328.5895.501 1,544.25 7.54 0.01% 1.91 AAA Aaa AAA AAA
36241LDX1 GN 782818 4.500 11/15/39 107.427153,872.63 157,731.46102.508 165,301.31 577.02 0.68% 4.88 AAA Aaa AAA AAA
TOTAL PASS THROUGH 6,423,200.69 6,410,953.98 10,618.59 26.30% 4.21
CMO
31339GNQ0 FHR 2368 AS 17.090 10/15/31 134.16513,051.06 11,403.3687.375 17,509.88 99.13 0.07% 8.87 AAA Aaa AAA AAA
3133TVPR1 FHR 2433 SA 17.090 02/15/32 131.22418,386.80 19,383.71105.422 24,127.80 139.66 0.10% 9.06 AAA Aaa AAA AAA
31393VW64 FHR 2642 BW 5.000 06/15/23 3.9175,822.44 1,062.6018.250 228.04 24.26 0.00% (2.59) AAA Aaa AAA AAA
31394L5S7 FHR 2684 ZN 4.000 10/15/33 103.70151,680.85 35,433.6868.563 53,593.59 172.27 0.22% 3.89 AAA Aaa AAA AAA
313921MN5 FNR 2001-52 YZ 6.500 10/25/31 113.43353,627.79 55,169.59102.875 60,831.67 290.48 0.25% 3.44 AAA Aaa AAA AAA
38373RBR9 GNR 2001-22 SO 16.622 05/20/31 135.17915,392.53 16,109.25104.656 20,807.48 78.18 0.09% 8.21 AAA Aaa AAA AAA
38376FLM2 GNR 2009-66 XS 5.309 07/16/39 11.887104,488.88 13,991.7113.391 12,420.35 231.15 0.05% 11.44 AAA Aaa AAA AAA
38374TDP6 GNR 2009-8 PS 4.809 08/16/38 9.790121,527.57 13,937.6911.469 11,897.71 243.52 0.05% 12.35 AAA Aaa AAA AAA
TOTAL CMO 166,491.59 201,416.52 1,278.65 0.83% 6.22
TOTAL AGENCY MBS 6,600,673.13 6,623,807.56 11,928.92 27.18% 4.27
11
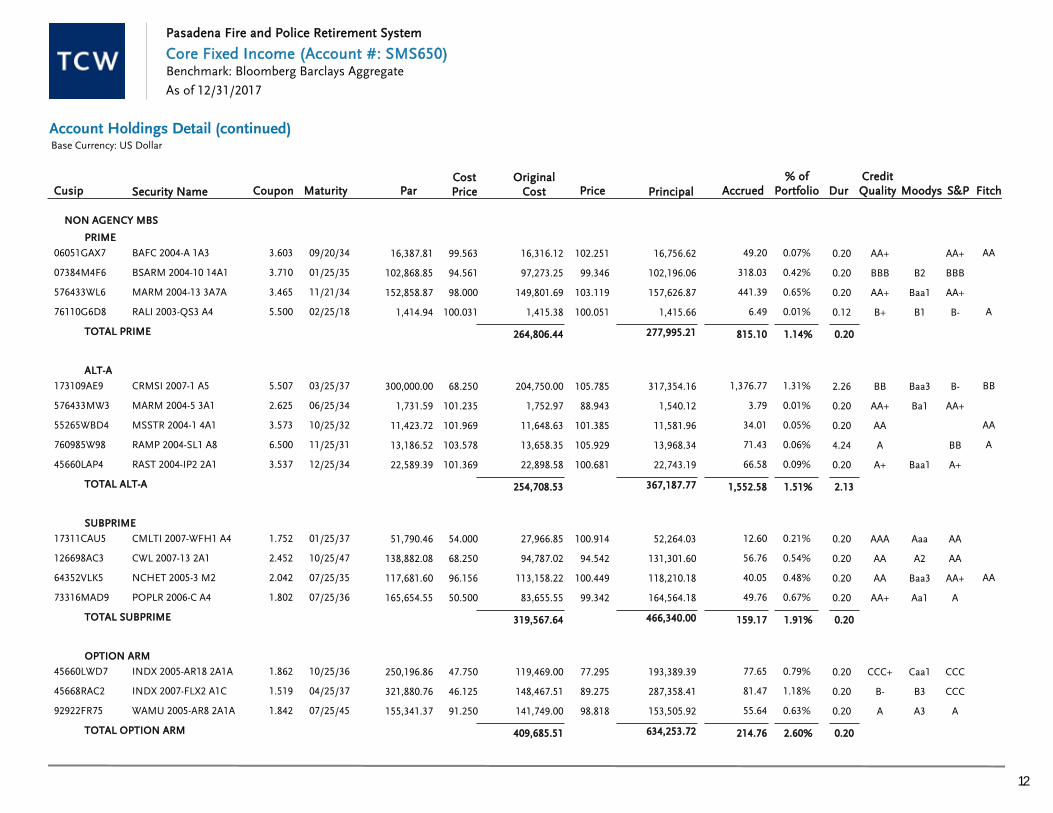
Pasadena Fire and Police Retirement System
Core Fixed Income (Account #: SMS650)
As of 12/31/2017
Base Currency: US Dollar
Account Holdings Detail (continued)(continued) (continued) (continued)
Benchmark: Bloomberg Barclays Aggregate
Cusip Security Name Coupon Maturity PriceParOriginal
CostCostPrice Principal Accrued
% ofPortfolio Dur S&PMoodys Fitch
CreditQuality
NON AGENCY MBS
PRIME
06051GAX7 BAFC 2004-A 1A3 3.603 09/20/34 102.25116,387.81 16,316.1299.563 16,756.62 49.20 0.07% 0.20 AA+ AA+ AA
07384M4F6 BSARM 2004-10 14A1 3.710 01/25/35 99.346102,868.85 97,273.2594.561 102,196.06 318.03 0.42% 0.20 BBB B2 BBB
576433WL6 MARM 2004-13 3A7A 3.465 11/21/34 103.119152,858.87 149,801.6998.000 157,626.87 441.39 0.65% 0.20 AA+ Baa1 AA+
76110G6D8 RALI 2003-QS3 A4 5.500 02/25/18 100.0511,414.94 1,415.38100.031 1,415.66 6.49 0.01% 0.12 B+ B1 B- A
TOTAL PRIME 264,806.44 277,995.21 815.10 1.14% 0.20
ALT-A
173109AE9 CRMSI 2007-1 A5 5.507 03/25/37 105.785300,000.00 204,750.0068.250 317,354.16 1,376.77 1.31% 2.26 BB Baa3 B- BB
576433MW3 MARM 2004-5 3A1 2.625 06/25/34 88.9431,731.59 1,752.97101.235 1,540.12 3.79 0.01% 0.20 AA+ Ba1 AA+
55265WBD4 MSSTR 2004-1 4A1 3.573 10/25/32 101.38511,423.72 11,648.63101.969 11,581.96 34.01 0.05% 0.20 AA AA
760985W98 RAMP 2004-SL1 A8 6.500 11/25/31 105.92913,186.52 13,658.35103.578 13,968.34 71.43 0.06% 4.24 A BB A
45660LAP4 RAST 2004-IP2 2A1 3.537 12/25/34 100.68122,589.39 22,898.58101.369 22,743.19 66.58 0.09% 0.20 A+ Baa1 A+
TOTAL ALT-A 254,708.53 367,187.77 1,552.58 1.51% 2.13
SUBPRIME
17311CAU5 CMLTI 2007-WFH1 A4 1.752 01/25/37 100.91451,790.46 27,966.8554.000 52,264.03 12.60 0.21% 0.20 AAA Aaa AA
126698AC3 CWL 2007-13 2A1 2.452 10/25/47 94.542138,882.08 94,787.0268.250 131,301.60 56.76 0.54% 0.20 AA A2 AA
64352VLK5 NCHET 2005-3 M2 2.042 07/25/35 100.449117,681.60 113,158.2296.156 118,210.18 40.05 0.48% 0.20 AA Baa3 AA+ AA
73316MAD9 POPLR 2006-C A4 1.802 07/25/36 99.342165,654.55 83,655.5550.500 164,564.18 49.76 0.67% 0.20 AA+ Aa1 A
TOTAL SUBPRIME 319,567.64 466,340.00 159.17 1.91% 0.20
OPTION ARM
45660LWD7 INDX 2005-AR18 2A1A 1.862 10/25/36 77.295250,196.86 119,469.0047.750 193,389.39 77.65 0.79% 0.20 CCC+ Caa1 CCC
45668RAC2 INDX 2007-FLX2 A1C 1.519 04/25/37 89.275321,880.76 148,467.5146.125 287,358.41 81.47 1.18% 0.20 B- B3 CCC
92922FR75 WAMU 2005-AR8 2A1A 1.842 07/25/45 98.818155,341.37 141,749.0091.250 153,505.92 55.64 0.63% 0.20 A A3 A
TOTAL OPTION ARM 409,685.51 634,253.72 214.76 2.60% 0.20
12

Pasadena Fire and Police Retirement System
Core Fixed Income (Account #: SMS650)
As of 12/31/2017
Base Currency: US Dollar
Account Holdings Detail (continued)(continued) (continued) (continued)
Benchmark: Bloomberg Barclays Aggregate
Cusip Security Name Coupon Maturity PriceParOriginal
CostCostPrice Principal Accrued
% ofPortfolio Dur S&PMoodys Fitch
CreditQuality
NON AGENCY MBS
OTHER
59560UAD3 MDST 2004-1 B 8.900 08/15/37 113.712102,885.65 109,332.08106.266 116,993.11 763.07 0.48% 3.58 BBB Baa2 BBB
TOTAL OTHER 109,332.08 116,993.11 763.07 0.48% 3.58
TOTAL NON AGENCY MBS 1,358,100.20 1,862,769.80 3,504.68 7.64% 0.79
CMBS
AGENCY CMBS
31419AEG8 FN AE0134 4.400 02/01/20 103.903121,000.00 130,245.16107.641 125,722.00 458.46 0.52% 1.58 AAA Aaa AAA AAA
3138EHAF9 FN AL0905 3.948 09/01/21 104.897111,574.80 121,076.09108.516 117,039.03 379.32 0.48% 2.92 AAA Aaa AAA AAA
3138L7QP4 FN AM6761 3.570 10/01/29 104.78075,876.46 81,092.97106.875 79,503.47 233.26 0.33% 8.19 AAA Aaa AAA AAA
3138L9C26 FN AM8188 2.640 03/01/27 98.84675,905.29 76,249.24100.453 75,028.97 172.56 0.31% 6.94 AAA Aaa AAA AAA
3138LAFP9 FN AM9173 3.110 06/01/27 102.15476,813.09 79,549.56103.563 78,467.26 205.71 0.32% 7.08 AAA Aaa AAA AAA
3138LAS26 FN AM9536 3.340 08/01/30 103.32977,108.56 80,566.40104.484 79,675.38 221.77 0.33% 8.74 AAA Aaa AAA AAA
3138LCLR4 FN AN0335 3.390 01/01/31 103.28280,000.00 86,675.00108.344 82,625.82 233.53 0.34% 9.00 AAA Aaa AAA AAA
3138LDJF1 FN AN1161 3.050 04/01/28 101.41985,000.00 86,072.46101.262 86,205.80 223.24 0.35% 7.97 AAA Aaa AAA AAA
3138LEBD2 FN AN1835 2.535 07/01/28 96.97785,000.00 85,318.75100.375 82,430.23 185.55 0.34% 8.49 AAA Aaa AAA AAA
3138LFEN4 FN AN2840 2.490 09/01/28 96.13180,000.00 76,193.7595.242 76,904.92 171.53 0.32% 8.54 AAA Aaa AAA AAA
TOTAL AGENCY CMBS 903,039.38 883,602.87 2,484.93 3.63% 6.51
NON AGENCY CMBS
05524UAA7 BAMLL 2012-PARK A 2.959 12/10/30 101.23540,000.00 41,925.00104.813 40,493.83 98.63 0.17% 4.33 AAA AAA
05529SAC3 BBCMS 2013-TYSN A2 3.756 09/05/32 103.33640,000.00 42,137.50105.344 41,334.51 125.21 0.17% 2.30 AAA Aaa
12592FAA3 COMM 2014-277P A 3.611 08/10/49 103.88140,000.00 41,657.81104.145 41,552.20 120.38 0.17% 5.54 AAA AAA
67087MAA4 OBP 2010-OBP A 4.646 07/15/45 104.60940,000.00 43,912.50109.781 41,843.69 154.87 0.17% 1.93 AAA AAA AAA
74932QAA8 RBSCF 2013-GSP A 3.834 01/13/32 103.65245,000.00 47,696.48105.992 46,643.27 143.76 0.19% 4.92 AAA AAA AAA
78413MAA6 SFAVE 2015-5AVE A1 3.872 01/05/43 101.18045,000.00 43,468.9596.598 45,530.80 145.20 0.19% 12.00 AAA AAA
TOTAL NON AGENCY CMBS 260,798.24 257,398.30 788.05 1.06% 5.27
13
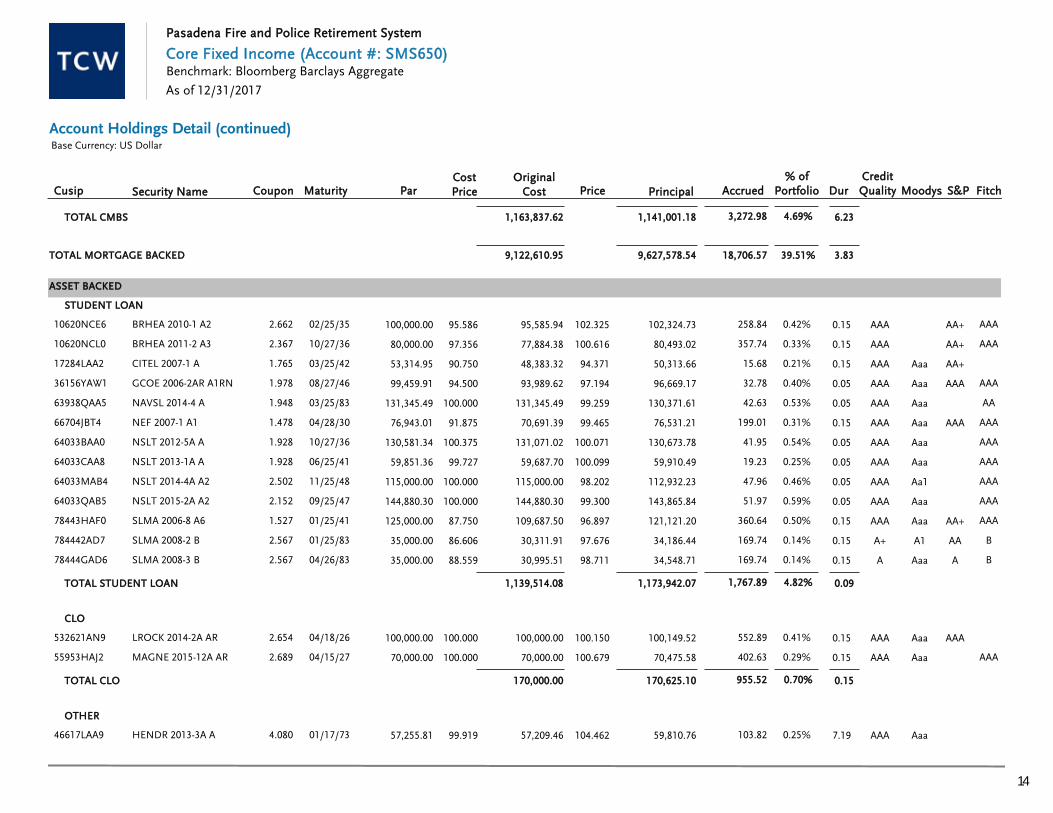
Pasadena Fire and Police Retirement System
Core Fixed Income (Account #: SMS650)
As of 12/31/2017
Base Currency: US Dollar
Account Holdings Detail (continued)(continued) (continued) (continued)
Benchmark: Bloomberg Barclays Aggregate
Cusip Security Name Coupon Maturity PriceParOriginal
CostCostPrice Principal Accrued
% ofPortfolio Dur S&PMoodys Fitch
CreditQuality
TOTAL CMBS 1,163,837.62 1,141,001.18 3,272.98 4.69% 6.23
9,122,610.95 9,627,578.54 18,706.57 39.51%TOTAL MORTGAGE BACKED 3.83
ASSET BACKED
STUDENT LOAN
10620NCE6 BRHEA 2010-1 A2 2.662 02/25/35 102.325100,000.00 95,585.9495.586 102,324.73 258.84 0.42% 0.15 AAA AA+ AAA
10620NCL0 BRHEA 2011-2 A3 2.367 10/27/36 100.61680,000.00 77,884.3897.356 80,493.02 357.74 0.33% 0.15 AAA AA+ AAA
17284LAA2 CITEL 2007-1 A 1.765 03/25/42 94.37153,314.95 48,383.3290.750 50,313.66 15.68 0.21% 0.15 AAA Aaa AA+
36156YAW1 GCOE 2006-2AR A1RN 1.978 08/27/46 97.19499,459.91 93,989.6294.500 96,669.17 32.78 0.40% 0.05 AAA Aaa AAA AAA
63938QAA5 NAVSL 2014-4 A 1.948 03/25/83 99.259131,345.49 131,345.49100.000 130,371.61 42.63 0.53% 0.05 AAA Aaa AA
66704JBT4 NEF 2007-1 A1 1.478 04/28/30 99.46576,943.01 70,691.3991.875 76,531.21 199.01 0.31% 0.15 AAA Aaa AAA AAA
64033BAA0 NSLT 2012-5A A 1.928 10/27/36 100.071130,581.34 131,071.02100.375 130,673.78 41.95 0.54% 0.05 AAA Aaa AAA
64033CAA8 NSLT 2013-1A A 1.928 06/25/41 100.09959,851.36 59,687.7099.727 59,910.49 19.23 0.25% 0.05 AAA Aaa AAA
64033MAB4 NSLT 2014-4A A2 2.502 11/25/48 98.202115,000.00 115,000.00100.000 112,932.23 47.96 0.46% 0.05 AAA Aa1 AAA
64033QAB5 NSLT 2015-2A A2 2.152 09/25/47 99.300144,880.30 144,880.30100.000 143,865.84 51.97 0.59% 0.05 AAA Aaa AAA
78443HAF0 SLMA 2006-8 A6 1.527 01/25/41 96.897125,000.00 109,687.5087.750 121,121.20 360.64 0.50% 0.15 AAA Aaa AA+ AAA
784442AD7 SLMA 2008-2 B 2.567 01/25/83 97.67635,000.00 30,311.9186.606 34,186.44 169.74 0.14% 0.15 A+ A1 AA B
78444GAD6 SLMA 2008-3 B 2.567 04/26/83 98.71135,000.00 30,995.5188.559 34,548.71 169.74 0.14% 0.15 A Aaa A B
TOTAL STUDENT LOAN 1,139,514.08 1,173,942.07 1,767.89 4.82% 0.09
CLO
532621AN9 LROCK 2014-2A AR 2.654 04/18/26 100.150100,000.00 100,000.00100.000 100,149.52 552.89 0.41% 0.15 AAA Aaa AAA
55953HAJ2 MAGNE 2015-12A AR 2.689 04/15/27 100.67970,000.00 70,000.00100.000 70,475.58 402.63 0.29% 0.15 AAA Aaa AAA
TOTAL CLO 170,000.00 170,625.10 955.52 0.70% 0.15
OTHER
46617LAA9 HENDR 2013-3A A 4.080 01/17/73 104.46257,255.81 57,209.4699.919 59,810.76 103.82 0.25% 7.19 AAA Aaa
14

Pasadena Fire and Police Retirement System
Core Fixed Income (Account #: SMS650)
As of 12/31/2017
Base Currency: US Dollar
Account Holdings Detail (continued)(continued) (continued) (continued)
Benchmark: Bloomberg Barclays Aggregate
Cusip Security Name Coupon Maturity PriceParOriginal
CostCostPrice Principal Accrued
% ofPortfolio Dur S&PMoodys Fitch
CreditQuality
OTHER
46618AAA2 HENDR 2014-2A A 3.610 01/17/73 101.87374,093.45 74,045.4399.935 75,481.04 118.88 0.31% 7.62 AAA Aaa
37952UAE3 SEACO 2014-1A A2 3.090 07/17/29 97.31555,958.33 55,943.3099.973 54,455.74 67.24 0.22% 2.99 A- A-
TOTAL OTHER 187,198.19 189,747.54 289.95 0.78% 6.16
1,496,712.27 1,534,314.71 3,013.36 6.30%TOTAL ASSET BACKED 0.85
24,294,995.82
119,453.57
24,414,449.39
Principal Market Value
Accrued Income
Total Portfolio Market Value
Account Holdings Summary MarketValue
15

DescriptionTrade DateCurrent
FaceRealized
Gains/LossesCUSIP/SEDOL
NetAmount
OriginalFacePrice
Currency: US Dollar
Settle DateMaturity
Date
PURCHASES
12/01/2017 US TREASURY N/B 99.623912828M80 -443,322.66445,000.00 0.0012/04/2017 11/30/2022 445,000.00
12/04/2017 G2SF 30 YR 4.5 TBA JAN 18 105.250T450118JP -584,137.50555,000.00 0.0001/22/2018 02/20/2046 555,000.00
12/05/2017 AMERICAN TOWER CORP 99.74203027XAQ3 -24,935.5025,000.00 0.0012/08/2017 06/15/2023 25,000.00
12/05/2017 FNCL 30 YR 3.5 TBA DEC 17 102.703F351217BC -112,973.44110,000.00 0.0012/13/2017 11/25/2046 110,000.00
12/05/2017 US TREASURY N/B 99.262912828M80 -24,815.4325,000.00 0.0012/06/2017 11/30/2022 25,000.00
12/06/2017 FNCL 30 YR 4.5 TBA JAN 18 106.578F450118BA -490,259.38460,000.00 0.0001/11/2018 10/25/2046 460,000.00
12/06/2017 US TREASURY N/B 99.750912828M80 -209,475.00210,000.00 0.0012/07/2017 11/30/2022 210,000.00
12/06/2017 US TREASURY N/B 99.438912828M80 -159,100.00160,000.00 0.0012/07/2017 11/30/2022 160,000.00
12/06/2017 US TREASURY N/B 99.750912828M80 -124,687.50125,000.00 0.0012/07/2017 11/30/2022 125,000.00
12/07/2017 FNCL 30 YR 3.0 TBA JAN 18 100.063F300118BA -40,025.0040,000.00 0.0001/11/2018 06/25/2047 40,000.00
12/07/2017 FNCL 30 YR 3.0 TBA JAN 18 100.063F300118GS -85,053.1385,000.00 0.0001/11/2018 06/25/2047 85,000.00
12/07/2017 US TREASURY N/B 99.750912828M80 -199,500.00200,000.00 0.0012/08/2017 11/30/2022 200,000.00
12/08/2017 FG G67706 103.4063132XCR31 -51,418.1749,724.43 0.0012/13/2017 12/01/2047 50,000.00
12/08/2017 US TREASURY N/B 99.750912828M80 -99,750.00100,000.00 0.0012/11/2017 11/30/2022 100,000.00
12/11/2017 FGLMC 30 YR 3.5 TBA JAN 18 102.703H350118JP -349,190.63340,000.00 0.0001/11/2018 12/15/2046 340,000.00
12/11/2017 FNCL 30 YR 3.5 TBA JAN 18 102.703F350118JP -61,621.8860,000.00 0.0001/11/2018 11/25/2046 60,000.00
12/11/2017 FNCL 30 YR 3.5 TBA JAN 18 102.703F350118FB -123,243.75120,000.00 0.0001/11/2018 11/25/2046 120,000.00
12/11/2017 FNCL 30 YR 3.5 TBA JAN 18 102.703F350118BC -338,920.31330,000.00 0.0001/11/2018 11/25/2046 330,000.00
12/12/2017 G2SF 30 YR 5.0 TBA JAN 18 106.992T500118MZ -117,691.41110,000.00 0.0001/22/2018 04/20/2041 110,000.00
12/12/2017 US TREASURY N/B 99.2509128283F5 -208,425.00210,000.00 0.0012/13/2017 11/15/2027 210,000.00
12/12/2017 US TREASURY N/B 99.750912828M80 -99,750.00100,000.00 0.0012/13/2017 11/30/2022 100,000.00
12/13/2017 FNCI 15 YR 3.0 TBA JAN 18 101.891D300118BC -112,079.69110,000.00 0.0001/17/2018 05/25/2032 110,000.00
12/13/2017 G2 MA4838 105.01236179TLT0 -68,105.5364,855.17 0.0012/20/2017 11/20/2047 65,000.00
12/15/2017 G2SF 30 YR 3.0 TBA JAN 18 100.891T300118BA -201,781.25200,000.00 0.0001/22/2018 07/20/2047 200,000.00
12/15/2017 G2SF 30 YR 3.5 TBA JAN 18 103.426T350118GS -248,221.88240,000.00 0.0001/22/2018 05/20/2047 240,000.00
12/15/2017 G2SF 30 YR 4.0 TBA JAN 18 104.359T400118RC -57,397.6655,000.00 0.0001/22/2018 10/20/2046 55,000.00
12/15/2017 US TREASURY N/B 99.750912828M80 -49,875.0050,000.00 0.0012/18/2017 11/30/2022 50,000.00
Pasadena Fire and Police Retirement System
Core Fixed Income (Account #: SMS650)
Account Transaction Activity
As of 12/31/2017
Benchmark: Bloomberg Barclays Aggregate
16

Pasadena Fire and Police Retirement System
Core Fixed Income (Account #: SMS650)
Account Transaction Activity (continued)
As of 12/31/2017
Benchmark: Bloomberg Barclays Aggregate
DescriptionTrade DateCurrent
FaceRealized
Gains/LossesCUSIP/SEDOL
NetAmount
OriginalFacePrice
Currency: US Dollar
Settle DateMaturity
Date
PURCHASES
12/19/2017 WELLS FARGO & COMPANY 97.691949746RW3 -34,191.8535,000.00 0.0012/21/2017 04/22/2026 35,000.00
12/20/2017 US TREASURY N/B 97.9229128283F5 -68,545.3170,000.00 0.0012/21/2017 11/15/2027 70,000.00
12/20/2017 US TREASURY N/B 99.000912828M80 -74,250.0075,000.00 0.0012/21/2017 11/30/2022 75,000.00
12/21/2017 US TREASURY N/B 99.382912828N30 -168,949.69170,000.00 0.0001/02/2018 12/31/2022 170,000.00
12/27/2017 G2 MA4719 103.35236179TG41 -25,623.1424,792.22 0.0001/22/2018 09/20/2047 25,000.00
12/27/2017 US TREASURY N/B 99.469912828N30 -358,089.48360,000.00 0.0001/02/2018 12/31/2022 360,000.00
12/27/2017 US TREASURY N/B 99.469912828N30 -273,540.58275,000.00 0.0001/02/2018 12/31/2022 275,000.00
12/27/2017 US TREASURY N/B 99.469912828N30 -188,991.67190,000.00 0.0001/02/2018 12/31/2022 190,000.00
12/28/2017 US TREASURY N/B 99.500912828N30 -184,075.00185,000.00 0.0001/02/2018 12/31/2022 185,000.00
12/28/2017 US TREASURY N/B 99.500912828N30 -179,100.00180,000.00 0.0001/02/2018 12/31/2022 180,000.00
12/28/2017 US TREASURY N/B 99.9539128283N8 -134,936.72135,000.00 0.0001/02/2018 12/31/2019 135,000.00
12/29/2017 US TREASURY N/B 98.4619128283F5 -127,999.22130,000.00 0.0001/02/2018 11/15/2027 130,000.00
0.00-6,504,049.36TOTAL PURCHASES
SALES
12/01/2017 US TREASURY N/B 99.6729128283C2 448,523.44450,000.00 -1,204.9412/04/2017 10/31/2022 450,000.00
12/04/2017 G2SF 30 YR 4.5 TBA DEC 17 105.277T451217FB 584,289.26555,000.00 -2,623.2412/20/2017 01/20/2046 555,000.00
12/05/2017 FNCL 30 YR 3.5 TBA DEC 17 102.719F351217FB 25,679.6925,000.00 -50.7812/13/2017 11/25/2046 25,000.00
12/05/2017 FNCL 30 YR 4.0 TBA DEC 17 104.563F401217GS 146,387.50140,000.00 -628.9112/13/2017 12/25/2046 140,000.00
12/05/2017 US TREASURY N/B 99.3249128283C2 29,797.2730,000.00 -184.6212/07/2017 10/31/2022 30,000.00
12/06/2017 FNCL 30 YR 4.5 TBA DEC 17 106.703F451217BA 490,834.38460,000.00 -790.6212/13/2017 02/25/2046 460,000.00
12/06/2017 US TREASURY N/B 99.2039128282W9 128,964.06130,000.00 -1,019.1812/07/2017 09/30/2022 130,000.00
12/06/2017 US TREASURY N/B 99.2039128282W9 213,286.72215,000.00 -1,838.3712/07/2017 09/30/2022 215,000.00
12/06/2017 US TREASURY N/B 98.9019128282W9 163,187.47165,000.00 -2,027.8312/07/2017 09/30/2022 165,000.00
12/07/2017 FNCL 30 YR 3.0 TBA DEC 17 100.178F301217BA 40,071.0940,000.00 -3.9112/13/2017 06/25/2047 40,000.00
12/07/2017 FNCL 30 YR 3.0 TBA DEC 17 100.178F301217GS 85,151.0785,000.00 -14.9512/13/2017 06/25/2047 85,000.00
12/07/2017 US TREASURY N/B 99.2039128282W9 203,366.41205,000.00 -1,275.4912/08/2017 09/30/2022 205,000.00
12/08/2017 FNCL 30 YR 3.5 TBA DEC 17 102.828F351217FB 51,414.0650,000.00 -46.8812/13/2017 11/25/2046 50,000.00
17
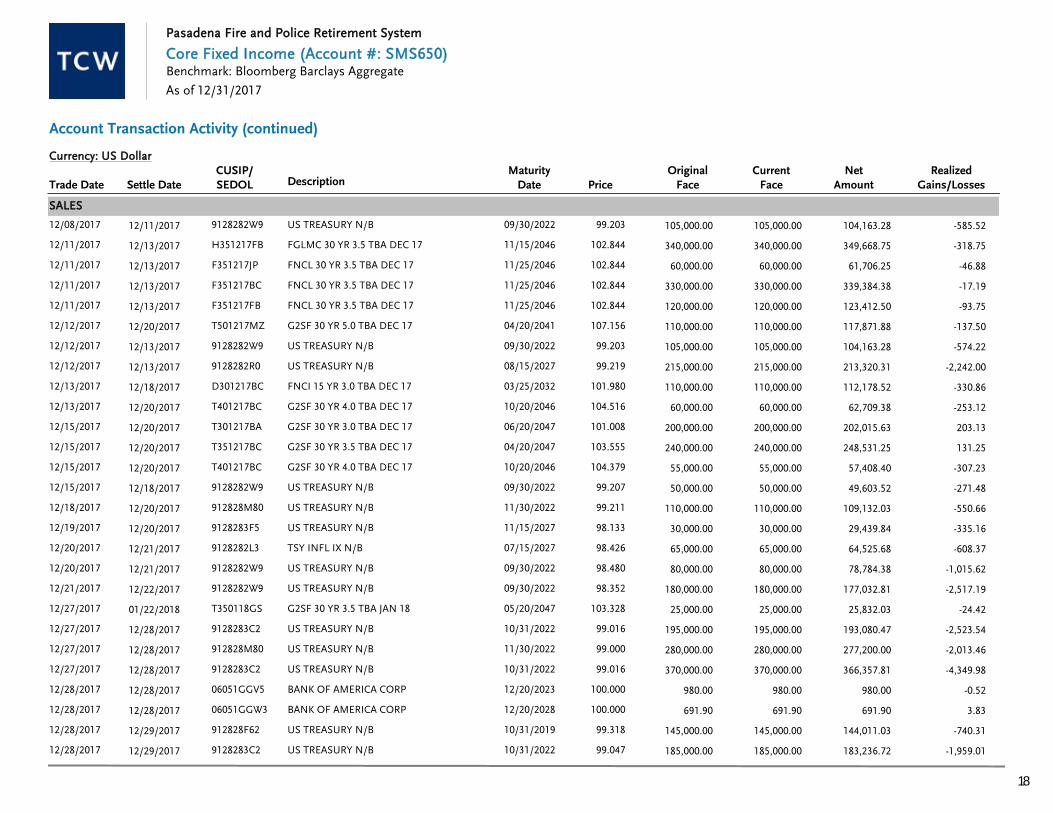
Pasadena Fire and Police Retirement System
Core Fixed Income (Account #: SMS650)
Account Transaction Activity (continued)(continued)
As of 12/31/2017
Benchmark: Bloomberg Barclays Aggregate
DescriptionTrade DateCurrent
FaceRealized
Gains/LossesCUSIP/SEDOL
NetAmount
OriginalFacePrice
Currency: US Dollar
Settle DateMaturity
Date
SALES
12/08/2017 US TREASURY N/B 99.2039128282W9 104,163.28105,000.00 -585.5212/11/2017 09/30/2022 105,000.00
12/11/2017 FGLMC 30 YR 3.5 TBA DEC 17 102.844H351217FB 349,668.75340,000.00 -318.7512/13/2017 11/15/2046 340,000.00
12/11/2017 FNCL 30 YR 3.5 TBA DEC 17 102.844F351217JP 61,706.2560,000.00 -46.8812/13/2017 11/25/2046 60,000.00
12/11/2017 FNCL 30 YR 3.5 TBA DEC 17 102.844F351217BC 339,384.38330,000.00 -17.1912/13/2017 11/25/2046 330,000.00
12/11/2017 FNCL 30 YR 3.5 TBA DEC 17 102.844F351217FB 123,412.50120,000.00 -93.7512/13/2017 11/25/2046 120,000.00
12/12/2017 G2SF 30 YR 5.0 TBA DEC 17 107.156T501217MZ 117,871.88110,000.00 -137.5012/20/2017 04/20/2041 110,000.00
12/12/2017 US TREASURY N/B 99.2039128282W9 104,163.28105,000.00 -574.2212/13/2017 09/30/2022 105,000.00
12/12/2017 US TREASURY N/B 99.2199128282R0 213,320.31215,000.00 -2,242.0012/13/2017 08/15/2027 215,000.00
12/13/2017 FNCI 15 YR 3.0 TBA DEC 17 101.980D301217BC 112,178.52110,000.00 -330.8612/18/2017 03/25/2032 110,000.00
12/13/2017 G2SF 30 YR 4.0 TBA DEC 17 104.516T401217BC 62,709.3860,000.00 -253.1212/20/2017 10/20/2046 60,000.00
12/15/2017 G2SF 30 YR 3.0 TBA DEC 17 101.008T301217BA 202,015.63200,000.00 203.1312/20/2017 06/20/2047 200,000.00
12/15/2017 G2SF 30 YR 3.5 TBA DEC 17 103.555T351217BC 248,531.25240,000.00 131.2512/20/2017 04/20/2047 240,000.00
12/15/2017 G2SF 30 YR 4.0 TBA DEC 17 104.379T401217BC 57,408.4055,000.00 -307.2312/20/2017 10/20/2046 55,000.00
12/15/2017 US TREASURY N/B 99.2079128282W9 49,603.5250,000.00 -271.4812/18/2017 09/30/2022 50,000.00
12/18/2017 US TREASURY N/B 99.211912828M80 109,132.03110,000.00 -550.6612/20/2017 11/30/2022 110,000.00
12/19/2017 US TREASURY N/B 98.1339128283F5 29,439.8430,000.00 -335.1612/20/2017 11/15/2027 30,000.00
12/20/2017 TSY INFL IX N/B 98.4269128282L3 64,525.6865,000.00 -608.3712/21/2017 07/15/2027 65,000.00
12/20/2017 US TREASURY N/B 98.4809128282W9 78,784.3880,000.00 -1,015.6212/21/2017 09/30/2022 80,000.00
12/21/2017 US TREASURY N/B 98.3529128282W9 177,032.81180,000.00 -2,517.1912/22/2017 09/30/2022 180,000.00
12/27/2017 G2SF 30 YR 3.5 TBA JAN 18 103.328T350118GS 25,832.0325,000.00 -24.4201/22/2018 05/20/2047 25,000.00
12/27/2017 US TREASURY N/B 99.0169128283C2 193,080.47195,000.00 -2,523.5412/28/2017 10/31/2022 195,000.00
12/27/2017 US TREASURY N/B 99.000912828M80 277,200.00280,000.00 -2,013.4612/28/2017 11/30/2022 280,000.00
12/27/2017 US TREASURY N/B 99.0169128283C2 366,357.81370,000.00 -4,349.9812/28/2017 10/31/2022 370,000.00
12/28/2017 BANK OF AMERICA CORP 100.00006051GGV5 980.00980.00 -0.5212/28/2017 12/20/2023 980.00
12/28/2017 BANK OF AMERICA CORP 100.00006051GGW3 691.90691.90 3.8312/28/2017 12/20/2028 691.90
12/28/2017 US TREASURY N/B 99.318912828F62 144,011.03145,000.00 -740.3112/29/2017 10/31/2019 145,000.00
12/28/2017 US TREASURY N/B 99.0479128283C2 183,236.72185,000.00 -1,959.0112/29/2017 10/31/2022 185,000.00
18

Pasadena Fire and Police Retirement System
Core Fixed Income (Account #: SMS650)
Account Transaction Activity (continued)(continued) (continued)
As of 12/31/2017
Benchmark: Bloomberg Barclays Aggregate
DescriptionTrade DateCurrent
FaceRealized
Gains/LossesCUSIP/SEDOL
NetAmount
OriginalFacePrice
Currency: US Dollar
Settle DateMaturity
Date
SALES
12/28/2017 US TREASURY N/B 99.0479128283C2 188,189.06190,000.00 -1,521.8812/29/2017 10/31/2022 190,000.00
-34,710.136,595,583.51TOTAL SALES
PAYDOWNS
12/15/2017 FG A615273128KRVU5 2,189.40-2,189.40 -46.5212/15/2017 07/01/2036 520,000.00
12/15/2017 FG G063613128M8MJ0 900.46-900.46 14.2112/15/2017 03/01/2041 210,000.00
12/15/2017 FG G086773128MJXF2 2,745.55-2,745.55 -157.3312/15/2017 11/01/2045 210,000.00
12/15/2017 FG G086813128MJXK1 2,220.88-2,220.88 -65.9312/15/2017 12/01/2045 225,000.00
12/15/2017 FG G086983128MJX47 192.22-192.22 -9.2212/15/2017 03/01/2046 20,000.00
12/15/2017 FG G086993128MJX54 1,765.34-1,765.34 -117.7112/15/2017 03/01/2046 155,000.00
12/15/2017 FG G087113128MJYH7 2,269.38-2,269.38 -116.9312/15/2017 06/01/2046 205,000.00
12/15/2017 FG G087153128MJYM6 2,471.06-2,471.06 -98.4612/15/2017 08/01/2046 365,000.00
12/15/2017 FG G087213128MJYT1 1,178.34-1,178.34 -43.9112/15/2017 09/01/2046 160,000.00
12/15/2017 FG G087263128MJYY0 1,387.77-1,387.77 -51.6112/15/2017 10/01/2046 200,000.00
12/15/2017 FG G123993128M1RU5 567.08-567.08 -16.3012/15/2017 09/01/2021 795,000.00
12/15/2017 FG G6027831335AJX7 988.51-988.51 -74.4512/15/2017 10/01/2045 110,000.00
12/15/2017 FG G677033132XCRY3 837.17-837.17 -31.3912/15/2017 04/01/2047 115,000.00
12/15/2017 FG Q052613132GLQN7 545.86-545.86 -14.8012/15/2017 12/01/2041 165,000.00
12/15/2017 FG Q201783132JMFT1 1,703.81-1,703.81 -6.1212/15/2017 07/01/2043 220,000.00
12/15/2017 FHR 2368 AS31339GNQ0 64.26-64.26 8.1112/15/2017 10/15/2031 500,000.00
12/15/2017 FHR 2433 SA3133TVPR1 452.42-452.42 -24.5312/15/2017 02/15/2032 275,000.00
12/15/2017 FHR 2684 ZN31394L5S7 994.44-994.44 312.6312/15/2017 10/15/2033 190,000.00
12/15/2017 GN 37646336204QFC9 20.40-20.40 0.9212/15/2017 04/15/2024 341,247.00
12/15/2017 GN 78003536225ABC3 24.69-24.69 1.1112/15/2017 07/15/2024 199,051.00
12/15/2017 GN 78281836241LDX1 2,259.97-2,259.97 -56.6812/15/2017 11/15/2039 430,000.00
12/15/2017 HENDR 2013-3A A46617LAA9 485.83-485.83 0.3912/15/2017 01/17/2073 75,000.00
12/15/2017 HENDR 2014-2A A46618AAA2 613.28-613.28 0.4012/15/2017 01/17/2073 90,000.00
12/17/2017 SEACO 2014-1A A237952UAE3 708.33-708.33 0.1912/18/2017 07/17/2029 85,000.00
19

Pasadena Fire and Police Retirement System
Core Fixed Income (Account #: SMS650)
Account Transaction Activity (continued)(continued) (continued) (continued)
As of 12/31/2017
Benchmark: Bloomberg Barclays Aggregate
DescriptionTrade DateCurrent
FaceRealized
Gains/LossesCUSIP/SEDOL
NetAmount
OriginalFacePrice
Currency: US Dollar
Settle DateMaturity
Date
PAYDOWNS
12/18/2017 MDST 2004-1 B59560UAD3 1,134.35-1,134.35 -71.0712/15/2017 08/15/2037 400,000.00
12/20/2017 BAFC 2004-A 1A306051GAX7 1,252.42-1,252.42 5.4812/20/2017 09/20/2034 660,000.00
12/20/2017 G2 MA352136179R4E6 2,119.91-2,119.91 -125.8712/20/2017 03/20/2046 180,000.00
12/20/2017 G2 MA406936179SQW0 3,406.97-3,406.97 -135.2112/20/2017 11/20/2046 245,000.00
12/20/2017 G2 MA419536179SUU9 2,501.64-2,501.64 -27.8312/20/2017 01/20/2047 295,000.00
12/20/2017 G2 MA438236179S2P1 1,938.20-1,938.20 -81.6212/20/2017 04/20/2047 90,000.00
12/20/2017 G2 MA451036179TAK1 190.94-190.94 -7.8012/20/2017 06/20/2047 25,000.00
12/20/2017 G2 MA458936179TC29 1,220.47-1,220.47 -90.7712/20/2017 07/20/2047 65,000.00
12/20/2017 GNR 2001-22 SO38373RBR9 251.17-251.17 -11.7012/20/2017 05/20/2031 1,707,394.00
12/21/2017 MARM 2004-13 3A7A576433WL6 5,797.91-5,797.91 115.9612/21/2017 11/21/2034 555,000.00
12/25/2017 BSARM 2004-10 14A107384M4F6 311.22-311.22 16.9312/26/2017 01/25/2035 1,530,000.00
12/25/2017 FN 65592831390TVV8 197.72-197.72 -13.1012/26/2017 08/01/2032 765,000.00
12/25/2017 FN 73564631402RHX0 912.69-912.69 4.7112/26/2017 07/01/2020 900,000.00
12/25/2017 FN 84103131407ULL9 2.63-2.63 0.0012/26/2017 11/01/2035 380,000.00
12/25/2017 FN 91844531411YL27 28.54-28.54 -0.1812/26/2017 05/01/2037 705,000.00
12/25/2017 FN AB161331416WYK2 1,093.24-1,093.24 -20.5012/26/2017 10/01/2040 305,000.00
12/25/2017 FN AD383031418RHG9 1,773.21-1,773.21 -73.1412/26/2017 04/01/2025 390,000.00
12/25/2017 FN AL09053138EHAF9 198.22-198.22 -16.8812/26/2017 09/01/2021 210,000.00
12/25/2017 FN AM67613138L7QP4 120.52-120.52 -8.2912/26/2017 10/01/2029 80,000.00
12/25/2017 FN AM81883138L9C26 134.13-134.13 -0.6112/26/2017 03/01/2027 80,000.00
12/25/2017 FN AM91733138LAFP9 116.70-116.70 -4.1612/26/2017 06/01/2027 80,000.00
12/25/2017 FN AM95363138LAS26 113.44-113.44 -5.0912/26/2017 08/01/2030 80,000.00
12/25/2017 FN MA158431418AXN3 801.85-801.85 -27.3112/26/2017 09/01/2033 100,000.00
12/25/2017 FN MA299531418CKH6 1,035.41-1,035.41 -53.8312/26/2017 05/01/2047 75,000.00
12/25/2017 FN MA302931418CLK8 686.20-686.20 -17.3212/26/2017 06/01/2032 60,000.00
12/25/2017 FN MA308831418CNE0 1,837.08-1,837.08 -101.8312/26/2017 08/01/2047 200,000.00
12/25/2017 FNR 2001-52 YZ313921MN5 1,195.53-1,195.53 -34.3712/26/2017 10/25/2031 575,000.00
20

Pasadena Fire and Police Retirement System
Core Fixed Income (Account #: SMS650)
Account Transaction Activity (continued)(continued) (continued) (continued)
As of 12/31/2017
Benchmark: Bloomberg Barclays Aggregate
DescriptionTrade DateCurrent
FaceRealized
Gains/LossesCUSIP/SEDOL
NetAmount
OriginalFacePrice
Currency: US Dollar
Settle DateMaturity
Date
PAYDOWNS
12/25/2017 MARM 2004-5 3A1576433MW3 2.35-2.35 -0.0312/26/2017 06/25/2034 505,000.00
12/25/2017 MSSTR 2004-1 4A155265WBD4 66.14-66.14 -1.3012/26/2017 10/25/2032 550,000.00
12/25/2017 RALI 2003-QS3 A476110G6D8 841.39-841.39 -0.2612/26/2017 02/25/2018 1,100,000.00
12/25/2017 RAMP 2004-SL1 A8760985W98 68.94-68.94 -2.4712/26/2017 11/25/2031 675,000.00
12/25/2017 RAST 2004-IP2 2A145660LAP4 68.45-68.45 -0.9412/26/2017 12/25/2034 535,000.00
12/25/2017 WAMU 2005-AR8 2A1A92922FR75 2,108.90-2,108.90 184.5312/26/2017 07/25/2045 2,000,000.00
12/26/2017 CITEL 2007-1 A17284LAA2 1,441.87-1,441.87 133.3712/26/2017 03/25/2042 150,000.00
12/26/2017 INDX 2005-AR18 2A1A45660LWD7 3,555.38-3,555.38 1,857.6912/26/2017 10/25/2036 1,300,000.00
12/26/2017 NAVSL 2014-4 A63938QAA5 1,560.97-1,560.97 0.0012/26/2017 03/25/2083 185,000.00
12/26/2017 NCHET 2005-3 M264352VLK5 10,355.45-10,355.45 398.0412/26/2017 07/25/2035 250,000.00
12/26/2017 NSLT 2012-5A A64033BAA0 1,395.34-1,395.34 -5.2312/26/2017 10/27/2036 270,000.00
12/26/2017 NSLT 2013-1A A64033CAA8 590.14-590.14 1.6112/26/2017 06/25/2041 120,000.00
12/26/2017 NSLT 2015-2A A264033QAB5 2,240.62-2,240.62 0.0012/26/2017 09/25/2047 200,000.00
12/26/2017 POPLR 2006-C A473316MAD9 4,441.11-4,441.11 2,198.3512/26/2017 07/25/2036 243,000.00
12/27/2017 CMLTI 2007-WFH1 A417311CAU5 2,887.80-2,887.80 1,328.3912/27/2017 01/25/2037 100,000.00
4,712.4289,583.61TOTAL PAYDOWNS
IO FACTOR ADJUSTMENT
12/15/2017 FHR 2642 BW31393VW64 0.005,822.44 -33.8412/15/2017 06/15/2023 520,000.00
12/16/2017 GNR 2009-66 XS38376FLM2 0.00104,488.88 -272.5512/18/2017 07/16/2039 1,350,000.00
12/16/2017 GNR 2009-8 PS38374TDP6 0.00121,527.57 -237.5912/18/2017 08/16/2038 995,000.00
-543.980.00TOTAL IO FACTOR ADJUSTMENT
INTEREST - BUY & SELL
12/01/2017 US TREASURY N/B912828M80 -97.800.00 0.0012/04/2017 11/30/2022 445,000.00
12/01/2017 US TREASURY N/B9128283C2 845.300.00 0.0012/04/2017 10/31/2022 450,000.00
12/05/2017 US TREASURY N/B9128283C2 61.330.00 0.0012/07/2017 10/31/2022 30,000.00
12/05/2017 US TREASURY N/B912828M80 -8.240.00 0.0012/06/2017 11/30/2022 25,000.00
12/06/2017 US TREASURY N/B912828M80 -61.540.00 0.0012/07/2017 11/30/2022 160,000.00
21

Pasadena Fire and Police Retirement System
Core Fixed Income (Account #: SMS650)
Account Transaction Activity (continued)(continued) (continued) (continued)
As of 12/31/2017
Benchmark: Bloomberg Barclays Aggregate
DescriptionTrade DateCurrent
FaceRealized
Gains/LossesCUSIP/SEDOL
NetAmount
OriginalFacePrice
Currency: US Dollar
Settle DateMaturity
Date
INTEREST - BUY & SELL
12/06/2017 US TREASURY N/B9128282W9 577.950.00 0.0012/07/2017 09/30/2022 165,000.00
12/06/2017 US TREASURY N/B912828M80 -128.850.00 0.0012/07/2017 11/30/2022 335,000.00
12/06/2017 US TREASURY N/B9128282W9 1,208.450.00 0.0012/07/2017 09/30/2022 345,000.00
12/07/2017 US TREASURY N/B9128282W9 728.620.00 0.0012/08/2017 09/30/2022 205,000.00
12/07/2017 US TREASURY N/B912828M80 -87.910.00 0.0012/08/2017 11/30/2022 200,000.00
12/08/2017 FG G677063132XCR31 -58.010.00 0.0012/13/2017 12/01/2047 50,000.00
12/08/2017 US TREASURY N/B912828M80 -60.440.00 0.0012/11/2017 11/30/2022 100,000.00
12/08/2017 US TREASURY N/B9128282W9 389.420.00 0.0012/11/2017 09/30/2022 105,000.00
12/12/2017 US TREASURY N/B9128283F5 -365.470.00 0.0012/13/2017 11/15/2027 210,000.00
12/12/2017 US TREASURY N/B9128282W9 400.240.00 0.0012/13/2017 09/30/2022 105,000.00
12/12/2017 US TREASURY N/B912828M80 -71.430.00 0.0012/13/2017 11/30/2022 100,000.00
12/12/2017 US TREASURY N/B9128282R0 1,577.450.00 0.0012/13/2017 08/15/2027 215,000.00
12/13/2017 G2 MA483836179TLT0 -136.920.00 0.0012/20/2017 11/20/2047 65,000.00
12/15/2017 US TREASURY N/B912828M80 -49.450.00 0.0012/18/2017 11/30/2022 50,000.00
12/15/2017 US TREASURY N/B9128282W9 203.470.00 0.0012/18/2017 09/30/2022 50,000.00
12/18/2017 US TREASURY N/B912828M80 120.880.00 0.0012/20/2017 11/30/2022 110,000.00
12/19/2017 US TREASURY N/B9128283F5 65.260.00 0.0012/20/2017 11/15/2027 30,000.00
12/19/2017 WELLS FARGO & COMPANY949746RW3 -172.080.00 0.0012/21/2017 04/22/2026 35,000.00
12/20/2017 TSY INFL IX N/B9128282L3 106.220.00 0.0012/21/2017 07/15/2027 65,000.00
12/20/2017 US TREASURY N/B9128282W9 337.910.00 0.0012/21/2017 09/30/2022 80,000.00
12/20/2017 US TREASURY N/B9128283F5 -156.630.00 0.0012/21/2017 11/15/2027 70,000.00
12/20/2017 US TREASURY N/B912828M80 -86.540.00 0.0012/21/2017 11/30/2022 75,000.00
12/21/2017 US TREASURY N/B912828N30 -19.960.00 0.0001/02/2018 12/31/2022 170,000.00
12/21/2017 US TREASURY N/B9128282W9 769.570.00 0.0012/22/2017 09/30/2022 180,000.00
12/27/2017 G2 MA471936179TG41 -50.620.00 0.0001/22/2018 09/20/2047 25,000.00
12/27/2017 US TREASURY N/B912828N30 -32.290.00 0.0001/02/2018 12/31/2022 275,000.00
12/27/2017 US TREASURY N/B912828N30 -64.580.00 0.0001/02/2018 12/31/2022 550,000.00
22

Pasadena Fire and Police Retirement System
Core Fixed Income (Account #: SMS650)
Account Transaction Activity (continued)(continued) (continued) (continued)
As of 12/31/2017
Benchmark: Bloomberg Barclays Aggregate
DescriptionTrade DateCurrent
FaceRealized
Gains/LossesCUSIP/SEDOL
NetAmount
OriginalFacePrice
Currency: US Dollar
Settle DateMaturity
Date
INTEREST - BUY & SELL
12/27/2017 US TREASURY N/B912828M80 430.770.00 0.0012/28/2017 11/30/2022 280,000.00
12/27/2017 US TREASURY N/B9128283C2 1,810.500.00 0.0012/28/2017 10/31/2022 565,000.00
12/28/2017 US TREASURY N/B9128283C2 1,222.380.00 0.0012/29/2017 10/31/2022 375,000.00
12/28/2017 US TREASURY N/B912828N30 -42.850.00 0.0001/02/2018 12/31/2022 365,000.00
12/28/2017 US TREASURY N/B9128283N8 -13.980.00 0.0001/02/2018 12/31/2019 135,000.00
12/28/2017 US TREASURY N/B912828F62 354.490.00 0.0012/29/2017 10/31/2019 145,000.00
12/29/2017 US TREASURY N/B9128283F5 -387.850.00 0.0001/02/2018 11/15/2027 130,000.00
0.009,056.77TOTAL INTEREST - BUY & SELL
INTEREST - MORTGAGE COUPON
12/05/2017 BBCMS 2013-TYSN A205529SAC3 125.2140,000.00 0.0012/05/2017 09/05/2032 40,000.00
12/05/2017 SFAVE 2015-5AVE A178413MAA6 145.2045,000.00 0.0012/05/2017 01/05/2043 45,000.00
12/10/2017 BAMLL 2012-PARK A05524UAA7 98.6340,000.00 0.0012/11/2017 12/10/2030 40,000.00
12/10/2017 COMM 2014-277P A12592FAA3 120.3840,000.00 0.0012/11/2017 08/10/2049 40,000.00
12/13/2017 RBSCF 2013-GSP A74932QAA8 143.7645,000.00 0.0012/13/2017 01/13/2032 45,000.00
12/15/2017 FG A615273128KRVU5 179.1042,984.91 0.0012/15/2017 07/01/2036 520,000.00
12/15/2017 FG G063613128M8MJ0 302.6890,802.92 0.0012/15/2017 03/01/2041 210,000.00
12/15/2017 FG G086773128MJXF2 467.58140,274.07 0.0012/15/2017 11/01/2045 210,000.00
12/15/2017 FG G086813128MJXK1 495.35169,834.30 0.0012/15/2017 12/01/2045 225,000.00
12/15/2017 FG G086983128MJX47 45.5615,619.13 0.0012/15/2017 03/01/2046 20,000.00
12/15/2017 FG G086993128MJX54 377.65113,294.11 0.0012/15/2017 03/01/2046 155,000.00
12/15/2017 FG G087113128MJYH7 505.70173,383.65 0.0012/15/2017 06/01/2046 205,000.00
12/15/2017 FG G087153128MJYM6 830.15332,063.21 0.0012/15/2017 08/01/2046 365,000.00
12/15/2017 FG G087213128MJYT1 367.42146,966.25 0.0012/15/2017 09/01/2046 160,000.00
12/15/2017 FG G087263128MJYY0 462.94185,174.97 0.0012/15/2017 10/01/2046 200,000.00
12/15/2017 FG G123993128M1RU5 85.9417,188.62 0.0012/15/2017 09/01/2021 795,000.00
12/15/2017 FG G6027831335AJX7 284.4485,332.36 0.0012/15/2017 10/01/2045 110,000.00
12/15/2017 FG G677033132XCRY3 317.89108,989.60 0.0012/15/2017 04/01/2047 115,000.00
23

Pasadena Fire and Police Retirement System
Core Fixed Income (Account #: SMS650)
Account Transaction Activity (continued)(continued) (continued) (continued)
As of 12/31/2017
Benchmark: Bloomberg Barclays Aggregate
DescriptionTrade DateCurrent
FaceRealized
Gains/LossesCUSIP/SEDOL
NetAmount
OriginalFacePrice
Currency: US Dollar
Settle DateMaturity
Date
INTEREST - MORTGAGE COUPON
12/15/2017 FG Q052613132GLQN7 259.6789,030.37 0.0012/15/2017 12/01/2041 165,000.00
12/15/2017 FG Q201783132JMFT1 435.18149,204.47 0.0012/15/2017 07/01/2043 220,000.00
12/15/2017 FHR 2368 AS31339GNQ0 193.2213,115.32 0.0012/15/2017 10/15/2031 500,000.00
12/15/2017 FHR 2433 SA3133TVPR1 277.5518,839.22 0.0012/15/2017 02/15/2032 275,000.00
12/15/2017 FHR 2642 BW31393VW64 25.036,007.88 0.0012/15/2017 06/15/2023 520,000.00
12/15/2017 FHR 2684 ZN31394L5S7 175.5852,675.30 0.0012/15/2017 10/15/2033 190,000.00
12/15/2017 GN 37646336204QFC9 9.221,701.48 0.0012/15/2017 04/15/2024 341,247.00
12/15/2017 GN 78003536225ABC3 7.671,415.86 0.0012/15/2017 07/15/2024 199,051.00
12/15/2017 GN 78281836241LDX1 585.50156,132.60 0.0012/15/2017 11/15/2039 430,000.00
12/15/2017 HENDR 2013-3A A46617LAA9 196.3257,741.64 0.0012/15/2017 01/17/2073 75,000.00
12/15/2017 HENDR 2014-2A A46618AAA2 224.7474,706.73 0.0012/15/2017 01/17/2073 90,000.00
12/15/2017 MDST 2004-1 B59560UAD3 771.48104,020.01 0.0012/15/2017 08/15/2037 400,000.00
12/15/2017 OBP 2010-OBP A67087MAA4 154.8740,000.00 0.0012/15/2017 07/15/2045 40,000.00
12/16/2017 GNR 2009-66 XS38376FLM2 491.48106,524.29 0.0012/18/2017 07/16/2039 1,350,000.00
12/16/2017 GNR 2009-8 PS38374TDP6 518.76123,599.18 0.0012/18/2017 08/16/2038 995,000.00
12/17/2017 SEACO 2014-1A A237952UAE3 145.9256,666.67 0.0012/18/2017 07/17/2029 85,000.00
12/20/2017 BAFC 2004-A 1A306051GAX7 52.9617,640.23 0.0012/20/2017 09/20/2034 660,000.00
12/20/2017 G2 MA352136179R4E6 372.60127,747.17 0.0012/20/2017 03/20/2046 180,000.00
12/20/2017 G2 MA406936179SQW0 627.21215,043.52 0.0012/20/2017 11/20/2046 245,000.00
12/20/2017 G2 MA419536179SUU9 694.81277,920.61 0.0012/20/2017 01/20/2047 295,000.00
12/20/2017 G2 MA438236179S2P1 250.2185,786.22 0.0012/20/2017 04/20/2047 90,000.00
12/20/2017 G2 MA451036179TAK1 71.4724,502.38 0.0012/20/2017 06/20/2047 25,000.00
12/20/2017 G2 MA458936179TC29 262.4362,982.90 0.0012/20/2017 07/20/2047 65,000.00
12/20/2017 GNR 2001-22 SO38373RBR9 223.8115,643.71 0.0012/20/2017 05/20/2031 1,707,394.00
12/21/2017 MARM 2004-13 3A7A576433WL6 458.13158,656.78 0.0012/21/2017 11/21/2034 555,000.00
12/25/2017 BSARM 2004-10 14A107384M4F6 318.99103,180.07 0.0012/26/2017 01/25/2035 1,530,000.00
12/25/2017 CRMSI 2007-1 A5173109AE9 1,376.77300,000.00 0.0012/26/2017 03/25/2037 300,000.00
24

Pasadena Fire and Police Retirement System
Core Fixed Income (Account #: SMS650)
Account Transaction Activity (continued)(continued) (continued) (continued)
As of 12/31/2017
Benchmark: Bloomberg Barclays Aggregate
DescriptionTrade DateCurrent
FaceRealized
Gains/LossesCUSIP/SEDOL
NetAmount
OriginalFacePrice
Currency: US Dollar
Settle DateMaturity
Date
INTEREST - MORTGAGE COUPON
12/25/2017 FN 65592831390TVV8 188.1832,260.22 0.0012/26/2017 08/01/2032 765,000.00
12/25/2017 FN 73564631402RHX0 55.9914,929.54 0.0012/26/2017 07/01/2020 900,000.00
12/25/2017 FN 84103131407ULL9 2.48829.88 0.0012/26/2017 11/01/2035 380,000.00
12/25/2017 FN 91844531411YL27 29.2910,118.69 0.0012/26/2017 05/01/2037 705,000.00
12/25/2017 FN AB161331416WYK2 375.56112,666.83 0.0012/26/2017 10/01/2040 305,000.00
12/25/2017 FN AD383031418RHG9 253.3267,553.01 0.0012/26/2017 04/01/2025 390,000.00
12/25/2017 FN AE013431419AEG8 443.67121,000.00 0.0012/26/2017 02/01/2020 121,000.00
12/25/2017 FN AL09053138EHAF9 367.73111,773.02 0.0012/26/2017 09/01/2021 210,000.00
12/25/2017 FN AM67613138L7QP4 226.0975,996.98 0.0012/26/2017 10/01/2029 80,000.00
12/25/2017 FN AM81883138L9C26 167.2976,039.43 0.0012/26/2017 03/01/2027 80,000.00
12/25/2017 FN AM91733138LAFP9 199.3876,929.79 0.0012/26/2017 06/01/2027 80,000.00
12/25/2017 FN AM95363138LAS26 214.9377,222.00 0.0012/26/2017 08/01/2030 80,000.00
12/25/2017 FN AN03353138LCLR4 226.0080,000.00 0.0012/26/2017 01/01/2031 80,000.00
12/25/2017 FN AN11613138LDJF1 216.0485,000.00 0.0012/26/2017 04/01/2028 85,000.00
12/25/2017 FN AN18353138LEBD2 179.5685,000.00 0.0012/26/2017 07/01/2028 85,000.00
12/25/2017 FN AN28403138LFEN4 166.0080,000.00 0.0012/26/2017 09/01/2028 80,000.00
12/25/2017 FN MA158431418AXN3 148.9251,058.78 0.0012/26/2017 09/01/2033 100,000.00
12/25/2017 FN MA299531418CKH6 233.7470,121.35 0.0012/26/2017 05/01/2047 75,000.00
12/25/2017 FN MA302931418CLK8 140.9956,396.48 0.0012/26/2017 06/01/2032 60,000.00
12/25/2017 FN MA308831418CNE0 651.14195,342.26 0.0012/26/2017 08/01/2047 200,000.00
12/25/2017 FNR 2001-52 YZ313921MN5 296.9654,823.32 0.0012/26/2017 10/25/2031 575,000.00
12/25/2017 MARM 2004-5 3A1576433MW3 3.791,733.94 0.0012/26/2017 06/25/2034 505,000.00
12/25/2017 MSSTR 2004-1 4A155265WBD4 34.2111,489.86 0.0012/26/2017 10/25/2032 550,000.00
12/25/2017 RALI 2003-QS3 A476110G6D8 10.342,256.33 0.0012/26/2017 02/25/2018 1,100,000.00
12/25/2017 RAMP 2004-SL1 A8760985W98 71.8013,255.47 0.0012/26/2017 11/25/2031 675,000.00
12/25/2017 RAST 2004-IP2 2A145660LAP4 66.7922,657.84 0.0012/26/2017 12/25/2034 535,000.00
12/25/2017 WAMU 2005-AR8 2A1A92922FR75 250.28157,450.27 0.0012/26/2017 07/25/2045 2,000,000.00
25

Pasadena Fire and Police Retirement System
Core Fixed Income (Account #: SMS650)
Account Transaction Activity (continued)(continued) (continued) (continued)
As of 12/31/2017
Benchmark: Bloomberg Barclays Aggregate
DescriptionTrade DateCurrent
FaceRealized
Gains/LossesCUSIP/SEDOL
NetAmount
OriginalFacePrice
Currency: US Dollar
Settle DateMaturity
Date
INTEREST - MORTGAGE COUPON
12/26/2017 CITEL 2007-1 A17284LAA2 198.4754,756.82 0.0012/26/2017 03/25/2042 150,000.00
12/26/2017 CWL 2007-13 2A1126698AC3 249.21138,882.08 0.0012/26/2017 10/25/2047 400,000.00
12/26/2017 GCOE 2006-2AR A1RN36156YAW1 158.4499,459.91 0.0012/26/2017 08/27/2046 130,000.00
12/26/2017 INDX 2005-AR18 2A1A45660LWD7 334.95253,752.24 0.0012/26/2017 10/25/2036 1,300,000.00
12/26/2017 INDX 2007-FLX2 A1C45668RAC2 393.77321,880.76 0.0012/26/2017 04/25/2037 320,000.00
12/26/2017 NAVSL 2014-4 A63938QAA5 208.51132,906.46 0.0012/26/2017 03/25/2083 185,000.00
12/26/2017 NCHET 2005-3 M264352VLK5 212.73128,037.05 0.0012/26/2017 07/25/2035 250,000.00
12/26/2017 NSLT 2012-5A A64033BAA0 204.92131,976.68 0.0012/26/2017 10/27/2036 270,000.00
12/26/2017 NSLT 2013-1A A64033CAA8 93.8560,441.50 0.0012/26/2017 06/25/2041 120,000.00
12/26/2017 NSLT 2014-4A A264033MAB4 210.98115,000.00 0.0012/26/2017 11/25/2048 115,000.00
12/26/2017 NSLT 2015-2A A264033QAB5 228.44147,120.91 0.0012/26/2017 09/25/2047 200,000.00
12/26/2017 POPLR 2006-C A473316MAD9 216.31170,095.66 0.0012/26/2017 07/25/2036 243,000.00
12/27/2017 CMLTI 2007-WFH1 A417311CAU5 67.2854,678.27 0.0012/27/2017 01/25/2037 100,000.00
0.0022,535.49TOTAL INTEREST - MORTGAGE COUPON
INTEREST - NON MORTGAGE COUPON
12/01/2017 BANK OF AMERICA CORP06051GDZ9 3,812.50100,000.00 0.0012/01/2017 06/01/2019 100,000.00
12/01/2017 HEALTH CARE REIT INC42217KBF2 1,000.0050,000.00 0.0012/01/2017 06/01/2025 50,000.00
12/01/2017 KRAFT HEINZ FOODS CO50077LAB2 875.0040,000.00 0.0012/01/2017 06/01/2046 40,000.00
12/01/2017 WALGREENS BOOTS ALLIANCE931427AQ1 1,207.5070,000.00 0.0012/01/2017 06/01/2026 70,000.00
12/06/2017 WELLS FARGO BANK NA94988J5G8 2,687.50250,000.00 0.0012/06/2017 12/06/2019 250,000.00
12/12/2017 REYNOLDS AMERICAN INC761713BF2 700.0035,000.00 0.0012/12/2017 06/12/2022 35,000.00
12/15/2017 ACTAVIS FUNDING SCS00507UAH4 606.2525,000.00 0.0012/15/2017 06/15/2044 25,000.00
12/15/2017 AT&T INC00206RCG5 480.0020,000.00 0.0012/15/2017 06/15/2044 20,000.00
12/15/2017 DUKE ENERGY CAROLINAS26442CAM6 1,062.5050,000.00 0.0012/15/2017 12/15/2041 50,000.00
12/15/2017 NATIONWIDE MUTUAL INSURA638671AJ6 958.15105,000.00 0.0012/15/2017 12/15/2024 105,000.00
12/18/2017 CONTL AIRLINES 1997-4210805BU0 21.216,674.91 0.0012/18/2017 01/02/2018 300,000.00
12/20/2017 BANK OF AMERICA CORP06051GFF1 395.0045,000.00 0.0012/20/2017 04/01/2024 45,000.00
26

Pasadena Fire and Police Retirement System
Core Fixed Income (Account #: SMS650)
Account Transaction Activity (continued)(continued) (continued) (continued)
As of 12/31/2017
Benchmark: Bloomberg Barclays Aggregate
DescriptionTrade DateCurrent
FaceRealized
Gains/LossesCUSIP/SEDOL
NetAmount
OriginalFacePrice
Currency: US Dollar
Settle DateMaturity
Date
INTEREST - NON MORTGAGE COUPON
12/20/2017 BANK OF AMERICA CORP06051GDZ9 402.43100,000.00 0.0012/20/2017 06/01/2019 100,000.00
0.0014,208.04TOTAL INTEREST - NON MORTGAGE COUPON
INTEREST - STIF
12/04/2017 STIF INTERESTN/A 408.960.00 0.0012/04/2017 0.00
0.00408.96TOTAL INTEREST - STIF
CORPORATE ACTIONS
12/20/2017 BANK OF AMERICA CORP06051GFF1 -47,427.9745,000.00 1,815.0712/20/2017 04/01/2024 45,000.00
12/20/2017 BANK OF AMERICA CORP06051GDZ9 -108,037.45100,000.00 -4,076.5512/20/2017 06/01/2019 100,000.00
12/20/2017 BANK OF AMERICA CORP06051GGV5 108,037.45107,980.00 0.0012/20/2017 12/20/2023 107,980.00
12/20/2017 BANK OF AMERICA CORP06051GGW3 47,427.9747,691.90 0.0012/20/2017 12/20/2028 47,691.90
-2,261.480.00TOTAL CORPORATE ACTIONS
MISCELLANEOUS
12/22/2017 WAMU TIA CLASS ACTION SETTLEMENTN/A 64.650.00 0.0012/22/2017 0.00
0.0064.65TOTAL MISCELLANEOUS
-32,803.17TOTALS 227,391.67
27

Metropolitan West Asset Management, LLC, TCW Asset Management Company LLC, and TCW Investment Management Company LLC are wholly owned subsidiaries of TheTCW Group Inc. (“TCW”).
This statement was prepared as a private communication to clients regarding an account with TCW, and is not intended for public circulation. Clients may authorize TCW inwriting to distribute this statement to their consultants or other agents. TCW manages a number of separate strategies, and the holdings in each separate strategy may differdepending on the portfolio manager’s views or analysis with respect to a particular company, security or the economy.
As part of the respective investment process, some TCW equity strategies have a defined range or maximum number of securities for the portfolio. The number of securitiesreflected in this statement may be over or under the range or maximum number due to open orders.
Nothing in this statement constitutes investment, legal, accounting, or tax advice, or a representation that any investment strategy is suitable or appropriate to therecipient’s individual circumstances. This statement is not to be relied upon for investment decisions by the client, or as a substitute for the exercise of independentjudgment by its recipient.
This statement is provided to its recipient as an indication of the holdings of the client’s account as of the date the statement was generated. This statement should not berelied upon to make investment decisions with respect to holdings of the portfolio. TCW may in fact be currently recommending the purchase of a security or the sale of asecurity regardless of any statement made in this document about that security and whether it is held in the client portfolio.
Important Information Regarding Risk FactorsInvestment strategies may not achieve the desired results due to implementation lag, other timing factors, portfolio management decision-making, economic or marketconditions or other unanticipated factors. The price and value of any of the securities or financial instruments mentioned in this statement are subject to variability and canfall as well as rise. Past performance is no guarantee of future results.
Important Information Regarding Client ResponsibilitiesClients are requested to carefully review all portfolio holdings and strategies and to promptly inform TCW of any potential or perceived policy or guideline inconsistencies. Inparticular, TCW understands that guideline enabling language is subject to a measure of interpretation and TCW strongly encourages clients to express any contrastinginterpretation as soon as practical. Due to changing industry standards and the wide variety of interpretations to which a client guideline may be subjected, there can be noassurance that TCW’s interpretation will conform to that of clients or their consultants. TCW Client Services can be reached by calling (213) 244-0810, or [email protected].
Clients are also requested to notify TCW of any updates to Client’s organization, such as (but not limited to) adding affiliates (including broker dealer affiliates), issuingadditional securities, name changes, mergers or other alterations to Client’s legal structure.
Important Information Regarding This Report
The manager has the discretion to assign a security to a country other than its Bloomberg Country of Risk in the event that (i) the relevant index has assigned the security tothat country and/or (ii) the largest share of its income and/or assets is generated or located in that country.
Benchmark: Bloomberg Barclays Aggregate
Pasadena Fire and Police Retirement System
Core Fixed Income (Account #: SMS650)
As of 12/31/2017
© 2016 The TCW Group Inc. 28

Fixed Income ReviewTCW Core and Core Plus Fixed Income StrategiesFOURTH QUARTER 2017
FOR INVESTMENT PROFESSIONAL USE ONLY

FOR INVESTMENT PROFESSIONAL USE ONLY
DFIqr878CCP 2/1/18
Table of Contents
Organization Update . . . . . . . . . . . . . . . . . . . . . . . . . . . . . . . . . . . . . . . . . . . . . . . . . . . . . . . . . . . . . . . . . . . . . . . . . . (pp 1-2)
4Q 2017 Market Returns . . . . . . . . . . . . . . . . . . . . . . . . . . . . . . . . . . . . . . . . . . . . . . . . . . . . . . . . . . . . . . . . . . . . . . . . . . (p 3)
4Q 2017 Core and Core Plus Fixed Income Performance Attribution . . . . . . . . . . . . . . . . . . . . . . . . . . . . . . . . . . . . . . . (p 4)
2017 Core and Core Plus Fixed Income Performance Attribution . . . . . . . . . . . . . . . . . . . . . . . . . . . . . . . . . . . . . . . . . . (p 5)
4Q 2017 Economic Review: Improving Growth but Cracks Are Appearing . . . . . . . . . . . . . . . . . . . . . . . . . . . . . . . . . . . (p 6)
4Q 2017 Market Review: Strong Returns but Low Volatility is a Concern . . . . . . . . . . . . . . . . . . . . . . . . . . . . . . . . . . . (p 7)
4Q 2017 Fed Review: Coming Changes and Curve Flattening . . . . . . . . . . . . . . . . . . . . . . . . . . . . . . . . . . . . . . . . . . . . . (p 8)
4Q 2017 Tax Reform: Marginal Positive but Not a Change in Trajectory . . . . . . . . . . . . . . . . . . . . . . . . . . . . . . . . . . . . (p 9)
4Q 2017 Global/EM Review and Outlook: Better Growth Prospects with Growing Risks . . . . . . . . . . . . . . . . . . . . . . (p 10)
4Q 2017 Investment Grade Credit Review and Outlook: High Leverage and Tight Spreads . . . . . . . . . . . . . . . . . . . . (p 11)
4Q 2017 High Yield/Bank Loan Review and Outlook: Underwriting is Increasingly Aggressive . . . . . . . . . . . . . . . . . (p 12)
4Q 2017 Non-Agency MBS Review and Outlook: One of the Only Sectors to Offer Deleveraging Assets . . . . . . . . . (p 13)
4Q 2017 CMBS Review and Outlook: Poor Underwriting Finds Way to Structured Products . . . . . . . . . . . . . . . . . . . (p 14)
4Q 2017 Agency MBS Review and Outlook: Some Good and Some Bad . . . . . . . . . . . . . . . . . . . . . . . . . . . . . . . . . . . (p 15)
4Q 2017 ABS Review and Outlook: A Large Market and Diverse Market . . . . . . . . . . . . . . . . . . . . . . . . . . . . . . . . . . . (p 16)
4Q 2017 Core and Core Plus Fixed Income Positioning Summary . . . . . . . . . . . . . . . . . . . . . . . . . . . . . . . . . . . . . . . . (p 17)
4Q 2017 Sector Highlight: Non-Agency MBS Issuance . . . . . . . . . . . . . . . . . . . . . . . . . . . . . . . . . . . . . . . . . . . . . . . . . (p 18)

DFIqr878CCP 2/1/18 1
FOR INVESTMENT PROFESSIONAL USE ONLY
On December 27th, Nippon Life Insurance Company, Japan’s largest private life insurance company, completed its previously announced acquisition of a 24.75% minority stake in TCW from The Carlyle Group. As a result of the transaction, ownership in TCW by TCW management and employees increases to 44.07%, and Carlyle maintains a 31.18% interest in the firm through its long duration private equity fund, Carlyle Global Partners.
We are excited by this new phase in TCW’s evolution as we solidify long-term ownership of the Firm with partners who strongly share TCW’s commitment to value creation for the benefit of you, our clients. We expect nothing to change from your perspective. There have been no changes to the team and day-to-day oversight of TCW will continue under the same key staff. Most importantly, our disciplined investment philosophy, process, and approach remains the same and continues to be independent as we strive to meet your investment objectives.
Core/Core Plus Fixed Income* ($125)
Securitized Products ($19)
Emerging Markets ($11)
Unconstrained/Strategic/Absolute ($10)
Long Duration ($9)
Low Duration** ($4)High Yield/Bank Loans ($3)
Investment Grade Credit ($2)Other Fixed Income*** ($1)
TCW Assets Under ManagementAS OF DECEMBER 31, 2017
Firm AUM1: $205 Billion
Fixed Income
Equities
AlternativeInvestments
$7
$15
$183
Total Fixed Income Assets2: $183 Billionby Strategy
Source: TCWComprises the assets under management, or committed to management, of The TCW Group, Inc. and its subsidiaries.1 Includes respective allocations for multi-asset products. 2 AUM totals may not reconcile due to cross-held assets.* Includes Core, Core Plus, Intermediate, and Opportunistic Core Plus Fixed Income. ** Includes Low Duration and Ultra Short/Cash Management. *** Includes U.S. Government, Government/Credit, Global, and Other Fixed Income.

DFIqr878CCP 2/1/18 2
FOR INVESTMENT PROFESSIONAL USE ONLY
Fixed Income ExpertiseAS OF FEBRUARY 2018
Portfolio Investment Team
Bret BarkerLawrence Rhee
Analysts/TradersJeannie Fong
Marcela Meirelles, PhD, CFAMichael Pak, CFATim Torline, CFA
Tyler Tucci
Marcos GutierrezAndrew Xu
Vince MessinaChait ErrandeMelicia Shen
Mhair Orchanian, PhDAnish Patel, FRM
Ricardo Horowicz, PhDMateo Martinez
Patrick MooreDavid Vick, CFAGino Nucci, CFA
Jeffrey KatzTimothy BitsbergerMark McNeill, CFA
Jamie FrancoJulie StevensonVictoria VogelTracy GibsonIrene Mapua
Government/RatesSecuritized Products CreditInvestment
Risk Management Product Specialists
Credit TradingJerry Cudzil
Mike Carrion, CFATammy Karp
Drew SweeneyBrian Gelfand
Credit ResearchJamie FarnhamPatrick Barrett
Nick Bender, CFAAlex Bibi, CFA
Marie ChoiNikhil Chopra
Anthony GarciaGriffi th Lee
Chet MalhotraMelinda Newman
Ronnie NgNick Nilarp, CFA
Steven PurdyJoel Shpall
Kenneth Toshima
GENERALIST PORTFOLIO MANAGERS
Tad Rivelle, CIO-Fixed Income Laird Landmann Stephen Kane, CFA Bryan Whalen, CFA
Analysts
Ruben Hovhannisyan, CFADaniel Pace
Portfolio Investment TeamPenny Foley
David RobbinsAlex Stanojevic
Portfolio SpecialistAnisha Goodly
Sovereign ResearchBlaise Antin
David LoevingerMauro Roca, PhD
Brett RowleySpencer Rodriguez
Corporate Credit ResearchJavier Segovia, CFAStephen Keck, CFAJeffrey Nuruki, CFA
Shant Thomasian, CFA
StrategyLocal Markets – Jae H. LeeCorporates – Chris Hays
TradingJason ShamalyJustin Becker
Emerging Markets Debt
AgencyMitch Flack
Eric Arentsen Pat Ahn
Nanlan Ye Stephen Leech
Jae LimLauren Morrison
CreditScott Austin, CFA
Harrison Choi
ABS/CMBSPhilip Choi
Elizabeth CrawfordDavid Doan
Tony Lee, CFASagar Parikh, CFA Palak Pathak, CFA
Kyle Phillips Zhao Zhao
Non-Agency RMBSPhillip Dominguez, CFA
Michael Hsu Brian Choi, CFA
Brian Rosenlund, CFAJonathan Marcus

DFIqr878CCP 2/1/18 3
FOR INVESTMENT PROFESSIONAL USE ONLY
4Q 2017 Market Returns
4Q 2017 4Q 2017 12 Month 12 MonthFixed Income Total Return Excess Return* Total Return Excess Return* Yield-to-Maturity OAS (bps)
Treasury 0.1% 0.0% 2.3% 0.0% 2.2% -
3 mo T-Bills 0.3% 0.0% 0.9% 0.0% 1.4% -
1-3 Year -0.3% 0.0% 0.4% 0.0% 1.9% -
TIPS 1.3% 0.0% 3.0% 0.0% 2.3% -
Corporate 1.2% 1.0% 6.4% 3.5% 3.3% 93
AA-Rated 0.7% 0.6% 4.6% 2.1% 2.7% 49
BBB-Rated 1.2% 1.1% 7.1% 4.2% 3.6% 121
High Yield 0.5% 0.7% 7.5% 6.1% 6.2% 343
Agency MBS 0.2% 0.2% 2.5% 0.5% 2.9% 25
Commercial MBS 0.4% 0.8% 3.4% 1.6% 2.9% 62
Asset Backed 0.0% 0.2% 1.6% 0.9% 2.3% 36
Non U.S. Sovereign 1.5% 1.2% 9.3% 6.1% 0.7% 19
Emerging Markets 0.5% 0.5% 9.1% 6.4% 4.9% 258
Source: Bloomberg Barclays *Excess returns are calculated by Bloomberg Barclays and represent the return of a sector excluding the impact of interest rate changes.
4Q 2017 12 Month Equity Total Return Total Return Yield-to-Maturity OAS (bps)
S&P 500 Index 6.64% 21.82% - -
DJIA Index 10.96% 28.11% - -
NASDAQ Index 6.57% 29.73% - -
Source: Bloomberg For period ending 12/31/17

DFIqr878CCP 2/1/18 4
FOR INVESTMENT PROFESSIONAL USE ONLY
4Q 2017 Core and Core Plus Fixed Income Performance Attribution
• Commodity-related industrial sectors led among corporate credit, though many other sectors fared well, including consumer cyclicals, transportation, media entertainment, natural gas, insurance, and REITs
• Commodity prices were strong, benefitting metals and energy sectors and emerging market debt
• Returns were positive across both agency and non-agency CMBS, though higher quality areas of the market significantly underperformed
• Non-agency MBS performance remained strong into year-end, supported by solid investor demand given attractive loss-adjusted yields and a profile characterized by low volatility, short duration, and improving fundamentals
• Position remained attractive with a significant yield premium over U.S. T-bills
• Corporate positioning favors large U.S. banks, insurance companies, and REITs, within financials, and select defensive industrials like pharmaceuticals, communications, and non-profit hospitals
• Avoid issues with non-U.S. risks and exposure to the volatile energy and metals sectors
• CMBS holdings remain focused on agency issues and seasoned non-agency bonds where underwriting remains solid
• Maintain position in current pay, senior, non-agency MBS backed by subprime and alt-A loans
• Continued to hold 3-month JGB T-bills, where allowed, hedging Yen exposure with a dollar-yen cross-currency swap
Issue Selection
SmallNegative
• Non-government sectors outperformed during the quarter, with the broad fixed income market ahead of Treasuries by 36 bps on a duration-adjusted basis
• Investment grade credit outpaced Treasuries by 90 bps, with corporates leading non-corporate credit, while high yield corporates bested Treasuries by just over 70 bps
• Structured products generally outpaced Treasuries on a duration adjusted basis but trailed credit sectors
• Underweight governments
• Underweight exposure to investment grade credit, with a small allocation to high yield where allowed
• Overweight most structured products, including non-agency MBS, CMBS, and ABS
Sector Neutral
The yield curve continued to flatten, with the spread between 5- and 30-Year rates falling to 53 bps from over 100 bps a year ago
Underweight across the curve with a slight preference for 5-Year maturities
Yield Curve
Neutral
While short rates rose by 30-40 bps during the quarter, and the 10-Year yield increased by 7 bps, the 30-Year continued to edge lower, falling 12 bps to 2.74%
Duration remained 0.3 years shorter than the Index throughout the quarterDuration Small
Positive
Market ActionPositioning Result
Portfolio characteristics and holdings are subject to change at any time. Past performance is no guarantee of future results.

DFIqr878CCP 2/1/18 5
FOR INVESTMENT PROFESSIONAL USE ONLY
2017 Core and Core Plus Fixed Income Performance Attribution
• Issue selection among insurance and REIT credits contributed, though banking credits underperformed those held in the Aggregate Index, while the lack of exposure to technology and building materials further detracted
• Commodity prices improved over the year, benefitting metals and energy sectors and emerging market debt
• Non-agency MBS gained approximately 10% in 2017, holding up well against rising rates and benefitting from solid investor demand given attractive loss-adjusted yields and a profile characterized by low volatility, short duration, and improving fundamentals
• Government guaranteed student loans, largely floating rate, performed well as rates rose and investor uncertainty about rating downgrades dissipated as rating agencies concluded their broad review early in the year
• Position remained attractive during 2017 with a significant yield premium over U.S. T-bills
• Corporate positioning favors large U.S. banks, insurance companies, and REITs, within financials, and select defensive industrials like pharmaceuticals, communications, and non-profit hospitals
• Avoid issues with non-U.S. risks and exposure to the volatile energy and metals sectors
• Maintain position in current pay, senior, non-agency MBS backed by subprime and alt-A loans
• Emphasis on non-traditional ABS sectors like government guaranteed student loan receivables
• Continued to hold 3-month JGB T-bills, where allowed, hedging Yen exposure with a dollar-yen cross-currency swap
Issue Selection
SmallPositive
• Non-government sectors outperformed, with the broad fixed income market ahead of Treasuries by 120 bps on a duration-adjusted basis
• Investment grade credit outpaced Treasuries by 335 bps, with corporates leading non-corporate credit, while high yield corporates bested Treasuries by 610 bps
• Structured products generally outpaced Treasuries on a duration adjusted basis but trailed credit sectors
• Underweight governments
• Underweight exposure to investment grade credit, with a small allocation to high yield where allowed
• Overweight most structured products, including non-agency MBS, CMBS, and ABS, but slightly reduced the overweight to non-agency CMBS
Sector SmallNegative
Front-end yields moved higher with the Fed Funds rate while the long-end edged lower, resulting in a significantly flatter curve with the spread between the 5- and 30-Year falling to 53 bps from over 100 bps at the start of the year
Underweight across the curve with a slight preference for 5-Year maturities
Yield Curve
Neutral
Notwithstanding a 90 bps rise in the front-end of the yield curve, long U.S. Treasury rates fell with the 30-Year down 33 bps to 2.74%, while the 10-Year traded between 2.1% and 2.4%, ultimately ending the year at 2.4%, a modest 4 bps lower than where it started
Duration remained approximately 0.3 years shorter than the Index throughout the yearDuration Small
Positive
Market ActionPositioning Result
Portfolio characteristics and holdings are subject to change at any time. Past performance is no guarantee of future results.

DFIqr878CCP 2/1/18 6
FOR INVESTMENT PROFESSIONAL USE ONLY
4Q 2017 Economic Review: Improving Growth but Cracks Are Appearing
Our View: The U.S. economy performed well in 2017, but there are signs of stress under the surface, and broad economic statistics like GDP are a lagging indicator, typically not showing weakness until a market correction is already underway. Therefore, investors should be looking at the credit markets and forward-looking indicators such as leverage, debt service coverage levels, and underwriting standards to assess the level of risk, rather than justifying aggressive risk taking due to solid economic data.
GDP Moved Higher While Inflation Remained Subdued Consumers Revisit 2007 Deficit Spending Habits
Source: Bloomberg Barclays Source: Bloomberg Barclays
• The U.S. economy continued to build momentum through 2017 with the quarterly GDP print rising to 3.2% in the third quarter, bringing the year over year growth rate to 2.3%, up from 1.8% at the end of 2016. Employment growth was also solid with an average of almost 175k new jobs added every month and an unemployment rate of 4.1%, down from 4.7% to start the year.
• Despite the increase in economic activity, inflation remained tame, with most measures starting the year strong, then dipping over the summer with a modest recovery into year-end. At 1.7% and 1.5% respectively, both core CPI and core PCE remained well below the Fed’s nominal 2% inflation target. At the same time, market measures of future inflation were also contained.
• A strong holiday shopping season helped to offset a rough year for retailers, but it highlighted one of the challenges faced by the U.S. economy – namely that consumption is being enabled not by increases in wages but by less saving, as evidenced by savings rate numbers that are below 3% and back to levels last seen in 2007.
• Similarly, personal interest expense has moved steadily higher over the last few years, reaching levels near the 2007 peak, indicating the growing burden on consumer discretionary income. The challenges of higher interest expense are compounded by the cumulative impact of non-debt payment obligations like cell phone and cable bills, monthly subscription services, and entertainment accounts.
2006 2007 2008 2009 2010 2011 2012 2013 2014 2015 2016 2017-6%
-4%
-2%
0%
2%
4%
6%
-6%
-4%
-2%
0%
2%
4%
6%
Ann
ualiz
ed G
row
th
GDP Growth (YoY)
Core CPI (YoY)
2004 2005 2006 2007 2008 2009 2010 2011 2012 2013 2014 2015 2016 2017$200
$220
$240
$260
$280
$300
$320
0%
2%
4%
6%
8%
10%
12%
Bill
ions
Personal Interest Payments (L)
Personal Savings Rate (R)
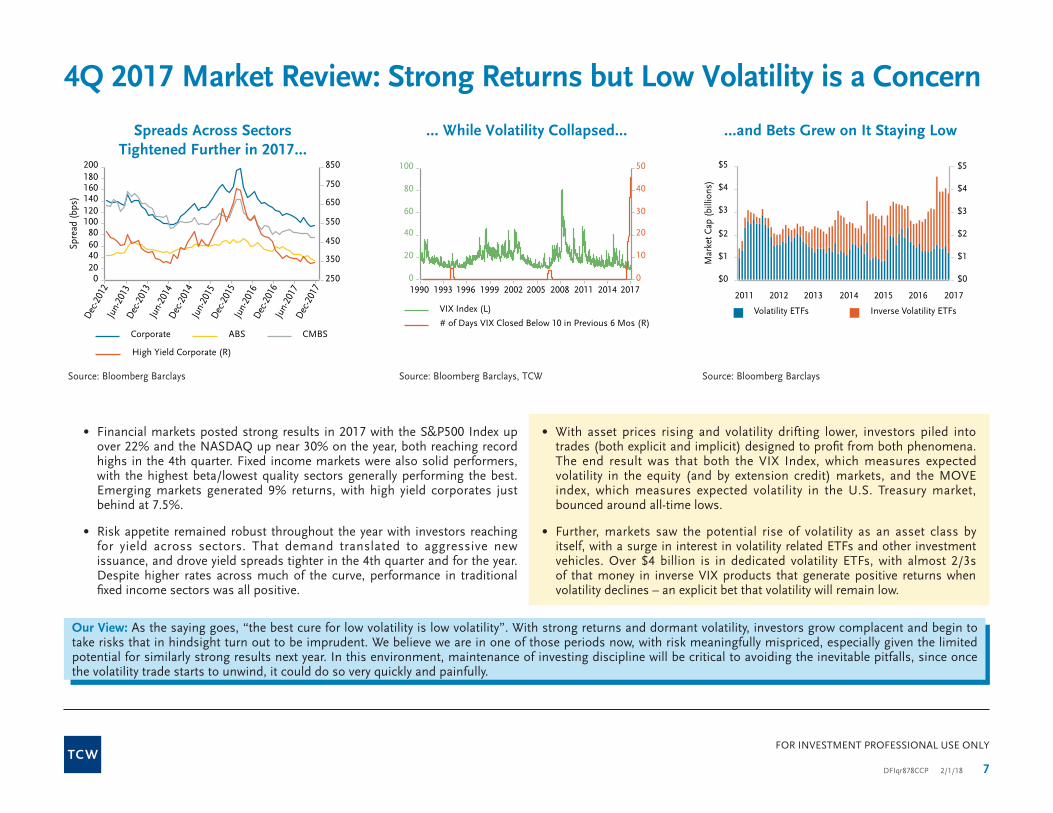
DFIqr878CCP 2/1/18 7
FOR INVESTMENT PROFESSIONAL USE ONLY
4Q 2017 Market Review: Strong Returns but Low Volatility is a Concern
Our View: As the saying goes, “the best cure for low volatility is low volatility”. With strong returns and dormant volatility, investors grow complacent and begin to take risks that in hindsight turn out to be imprudent. We believe we are in one of those periods now, with risk meaningfully mispriced, especially given the limited potential for similarly strong results next year. In this environment, maintenance of investing discipline will be critical to avoiding the inevitable pitfalls, since once the volatility trade starts to unwind, it could do so very quickly and painfully.
• Financial markets posted strong results in 2017 with the S&P500 Index up over 22% and the NASDAQ up near 30% on the year, both reaching record highs in the 4th quarter. Fixed income markets were also solid performers, with the highest beta/lowest quality sectors generally performing the best. Emerging markets generated 9% returns, with high yield corporates just behind at 7.5%.
• Risk appetite remained robust throughout the year with investors reaching for yield across sectors. That demand translated to aggressive new issuance, and drove yield spreads tighter in the 4th quarter and for the year. Despite higher rates across much of the curve, performance in traditional fixed income sectors was all positive.
• With asset prices rising and volatility drifting lower, investors piled into trades (both explicit and implicit) designed to profit from both phenomena. The end result was that both the VIX Index, which measures expected volatility in the equity (and by extension credit) markets, and the MOVE index, which measures expected volatility in the U.S. Treasury market, bounced around all-time lows.
• Further, markets saw the potential rise of volatility as an asset class by itself, with a surge in interest in volatility related ETFs and other investment vehicles. Over $4 billion is in dedicated volatility ETFs, with almost 2/3s of that money in inverse VIX products that generate positive returns when volatility declines – an explicit bet that volatility will remain low.
Source: Bloomberg Barclays Source: Bloomberg Barclays, TCW Source: Bloomberg Barclays
Spreads Across Sectors Tightened Further in 2017...
... While Volatility Collapsed... ...and Bets Grew on It Staying Low
Dec
-201
2Ju
n-20
13D
ec-2
013
Jun-
2014
Dec
-201
4Ju
n-20
15D
ec-2
015
Jun-
2016
Dec
-201
6Ju
n-20
17D
ec-2
017
020406080
100120140160180200
250
350
450
550
650
750
850
Spre
ad (
bps)
Corporate ABS CMBS
High Yield Corporate (R)
1990 1993 1996 1999 2002 2005 2008 2011 2014 20170
20
40
60
80
100
0
10
20
30
40
50
VIX Index (L)
# of Days VIX Closed Below 10 in Previous 6 Mos (R)
2011 2012 2013 2014 2015 2016 2017
$0
$1
$2
$3
$4
$5
$0
$1
$2
$3
$4
$5
Mar
ket C
ap (
billi
ons)
Volatility ETFs Inverse Volatility ETFs

DFIqr878CCP 2/1/18 8
FOR INVESTMENT PROFESSIONAL USE ONLY
4Q 2017 Fed Review: Coming Changes and Curve Flattening
Our View: The Fed has committed to making the normalization process as smooth and transparent as possible, and to date, it has been successful. However, monetary policy works with lags that can be long and variable. As a result, though we aren’t overly concerned about any one particular hike or reduction in asset purchases, the cumulative effect of those actions is a concern. As we have seen in cycles past, the economy and markets can appear to be unaffected by Fed tightening for a period of time, but ultimately both succumb to the impact of tighter and more expensive cost of credit.
• The FOMC hiked rates three times in 2017, including at the last meeting of the year in December to bring the target for the Federal Funds rate to between 1.25% and 1.5%. Fed projections suggest three further hikes in 2018, though markets are pricing in only two hikes for the year.
• As the front-end of the yield curve has moved higher with the Fed Funds rate, the long-end of the curve has actually moved somewhat lower, resulting in a significantly flatter yield curve over the course of the year. Though the Fed has suggested the flattening curve is nothing to worry about, historically a flat curve suggests that markets are skeptical of the durability of economic growth and future Fed tightenings risk tipping the economy from expansion to recession.
• Complicating estimates of the future course of rate hikes is the uncertain composition of the FOMC. Though incoming chairman Powell is expected to offer a fair amount of continuity with Yellen’s policies, there are four vacant seats that President Trump will need to fill. Given Trump’s campaign rhetoric, it is certainly possible that his appointees tend to be more hawkish than recent boards, potentially leading to a faster overall normalization of policy.
• Although Fed tightening efforts and balance sheet reduction have been modest so far, the effect will be to reduce the amount of dollars available to investors. The lower levels of liquidity will be felt in a variety of markets over time, but it has already shown up in greater bank funding pressure over year-end. While high year-end financing costs have been a feature of markets for some time, the JPY/USD and EUR/USD cross currency swap at over 4% heading into year-end represented abnormally elevated levels.
Source: Bloomberg Barclays
Source: Bloomberg Barclays
Fed Hikes, U.S. Treasury Curve Flattens USD Funding Pressure Over Year End was Acute 6
Mos
2 Yr
s
5 Yr
s
7 Yr
s
10 Y
rs
30 Y
rs
0.0%
0.5%
1.0%
1.5%
2.0%
2.5%
3.0%
3.5%
0.0%
0.5%
1.0%
1.5%
2.0%
2.5%
3.0%
3.5%
12/30/16
12/27/17
3-Nov-2017 17-Nov-2017 1-Dec-2017 15-Dec-2017 29-Dec-20171.0%
1.5%
2.0%
2.5%
3.0%
3.5%
4.0%
4.5%
5.0%
1.0%
1.5%
2.0%
2.5%
3.0%
3.5%
4.0%
4.5%
5.0%
Swap
Rat
e
JPY 1M Swap Rate (annualized)
EUR 1M Swap Rate (annualized)

DFIqr878CCP 2/1/18 9
FOR INVESTMENT PROFESSIONAL USE ONLY
4Q 2017 Tax Reform: Marginal Positive but Not a Change in Trajectory
Our View: We agree that the impact of the tax code changes overall will likely provide a small boost to economic growth in the U.S., but not enough to change the fundamental backdrop. Further, gains in income realized by corporations are more likely to go to shareholders in the form of buybacks, dividends, and M&A, and are unlikely to go to employees given the low levels of productivity growth, limiting the size of the bump. Further, if growth surprises to the upside, the Fed may be forced to respond with higher rates, limiting the potential improvements.
Some Sectors Fare Better Than Others Under the New Tax Changes, But On Average, Companies Are Better Off
• The House and Senate finally agreed on a comprehensive tax reform bill that was signed into law in December. The bill includes a substantial cut in the corporate tax rate as well as lower personal income tax rates, at the expense of full deductibility of state, local, and property taxes for individuals, and a cap on interest deductibility for corporations.
• Markets have generally viewed the entire package as mildly stimulative to GDP, with analysts predicting a bump to GDP of between 0.2% and 0.5% over the first couple years. Credit analysts are also predicting a mostly positive impact for investment grade and high yield corporations, though the effect on any particular name will depend heavily on the specific credit details and capital structure of the issuer.
• In particular, sectors that will not benefit from the tax changes include those that are less profitable, have high leverage, low existing tax rates, significant overseas earnings, and/or low capital expenditure requirements. Within high yield, only the lowest (CCC) rated companies are expected to bump up against the interest deductibility caps, increasing the risk in that part of the market, while higher rated bonds are expected to benefit.
• On the individual side, the caps on mortgage interest deductibility and state, local, and property taxes will hit high income earners in high tax states (NY, NJ, CA, IL, CT, MA) disproportionately, but are expected to boost after tax incomes in the middle of the country. These changes could reduce demand for housing in high tax areas, helping to keep a lid on nationwide home prices, though those declines could be offset by rising prices in other areas.
Source: TCW; JPMorgan; Capital IQ
Tele
com
m
Ener
gy
Reta
ilG
amin
g/Lo
dgin
gH
ealth
care
Cabl
e/Sa
telli
teD
iver
sifie
d M
edia
Hig
h-Yi
eld
Met
als/
Min
ing
Food
/Bev
erag
esBr
oadc
astin
gSe
rvic
esCh
emic
als
Indu
stria
lsTr
ansp
orta
tion
Cons
umer
Pro
d.Au
tom
otiv
ePa
per/
Pack
agin
gTe
chno
logy
Hou
sing
0%10%20%30%40%50%60%
70%80%90%
100%
0%10%20%
30%40%50%60%70%80%90%100%
% o
f HY
Issu
ers
Bett
er O
ff

DFIqr878CCP 2/1/18 10
FOR INVESTMENT PROFESSIONAL USE ONLY
4Q 2017 Global/Emerging Market Review and Outlook: Better Growth Prospects but Growing Risks
Our View: While better growth around the world would be welcome, such prospects are built on fragile fundamentals. Chinese growth is dependent upon a huge and growing mountain of debt while European growth may be hampered by weakness in their banking system, which never really delevered in the wake of the financial crisis. Similarly, monetary accommodation appears to have run its course in Japan with little to show for it, while the emerging markets remain vulnerable to a rapid unwind of the short volatility trade and a collapse in available liquidity.
Source: Bloomberg Barclays Source: National Central Banks and Citi Research
• Global growth picked up in 2017 with Chinese data stronger than expected, Europe gradually improving, the UK hiking rates, and Japan showing signs of budding inflation. The improving prospects led central banks to begin to discuss increasing rates and reducing asset purchases, potentially removing one of the long-time supports to global fixed income markets.
• The extent of that support is substantial but potentially waning, with expectations that by the end of 2018, there will be roughly zero net asset purchases, versus the current ~$110bn in monthly purchases. If those expectations are realized in 2018, there will be a total of $1.2 trillion in bonds currently being purchased by central banks that will have to be absorbed by the private market.
• However, for now, negative rates and massive government bond buying programs have spurred valuations to extreme levels. Emerging market spreads are tight and parts of the European high yield market trade at lower yield levels than a 10-Year U.S. Treasury.
• With the European Central Bank, Bank of Japan, and Bank of England just beginning to embark on their policy normalization programs, we believe they are behind the U.S. in that regard. This suggests that the scope of potential rate increases in those countries is greater than it is in the U.S., which, when coupled with the absolute low levels of yield in those markets makes for challenging valuations.
European High Yield Bonds Now Yield Less Than the 10-Year U.S. Treasury
Central Banks Purchases Expected to Shrink Dramatically in 2018
2011 2012 2013 2014 2015 2016 20170%
2%
4%
6%
8%
10%
12%
0%
2%
4%
6%
8%
10%
12%
Yiel
d
10-Year UST European Corporate European HY Corporate
2008 2009 2010 2011 2012 2013 2014 2015 2016 2017 2018 2019
-$100
-$50
$0
$50
$100
$150
$200
$250
-$100
-$50
$0
$50
$100
$150
$200
$250
3mo
Mov
ing
Aver
age
(bill
ions
)
FedBOEBOJECB Total
Forecast

DFIqr878CCP 2/1/18 11
FOR INVESTMENT PROFESSIONAL USE ONLY
4Q 2017 Investment Grade Credit Review and Outlook: High Leverage and Tight Spreads
Our View: Investors have grown too complacent to the risks involved in investment grade corporate bonds. Though the risk of default is low, the risks of downgrades and spread widening exist and yield compensation for those risks is very low. As a result, we continue to look for sectors such as REITS, large money center banks, utilities, food and beverage, and not for profit hospitals that are more defensive, as well as sectors that generally aren’t able to increase leverage and that are more likely to withstand any potential volatility.
• Investment grade corporate bonds posted strong returns in 2017, outperforming comparable duration Treasuries by almost 350 bps. Within corporates, lower quality issuers performed the best, with BBB issues outperforming by over 400 bps, while AA issues generated a more modest 200 bps of excess return. On the sector front, all did well, with high beta sectors like basic industries, building materials, and oil refining pacing the field.
• With the absolute level of rates still low and investors clamoring for yield, issuers were active with supply reaching a record of over $1.4 trillion on a gross basis. Issuance was primarily focused in industrial sectors for the 4th quarter and the year, and with increasingly lax underwriting and passes from the rating agencies, leverage has remained elevated.
• Yield spreads ended the year at 93 bps, near the tightest they have been this cycle and close to the lowest levels historically. It’s important to note that the current numbers are being compared to the spreads of the index from 10 years ago, when the overall index quality was much higher.
• Looking forward, there is some potential for lower issuance, especially from larger technology companies, who may have less of a need to issue debt in the U.S. if they are able to more easily repatriate cash held overseas. However, as long as markets remain open, rates stay low, demand is robust, and the penalty for adding leverage is minimal, issuance is likely to be high.
Source: BofA Merrill Lynch Global Research*U.S. IG Corporate Non-Financial Issuers
Source: Bloomberg Barclays
Leverage of U.S. Corporations* at Record Highs Corporate Spreads Have Declined Despite Lower Quality Index
1997 1999 2001 2003 2005 2007 2009 2011 2013 2015 20171.5
1.7
1.9
2.1
2.3
2.5
2.7
2.9
3.1
1.5
1.7
1.9
2.1
2.3
2.5
2.7
2.9
3.1
Deb
t/EB
ITD
A
Gross leverage
Net leverage
1993 1995 1997 1999 2001 2003 2005 2007 2009 2011 2013 2015 201725%
30%
35%
40%
45%
50%
55%
60%
0
100
200
300
400
500
600
700
% o
f Cor
p In
dex
Spre
ad (
bps)
BBB Weighting (L)
U.S. Corporate OAS (R)

DFIqr878CCP 2/1/18 12
FOR INVESTMENT PROFESSIONAL USE ONLY
4Q 2017 High Yield/Bank Loan Review and Outlook: Increasingly Aggressive Underwriting with Less Yield to Compensate
Our View: Despite the apparent tranquility in markets, risks are abundant across the below investment grade universe. Weak underwriting means fundamental risks are growing while tight spreads provide limited compensation for taking those risks. In the current environment, where the amount of spread investors receive per unit of leverage is at historic lows, the allocation to high yield should be similarly low.
Current Underwriting Standards Worse than 2007
Bank Loan Margins Fell Precipitously in 2017
High Yield Spreads Tightened Further to Post-Crisis Tights
• High yield bonds were up by 7.5% in 2017 as the search for yield caused spreads to ratchet tighter consistent with the investment grade market. Loans also posted strong performance, generating returns for the year of around 4.2%, with the benefit of rising LIBOR rates offset by consistent tightening of spreads and coupons.
• The trading range for high yield bonds in 2017 was around 70 bps, the lowest since the late 90s, while the implied volatility on high yield index credit default swaps reached record lows during the year. Both of those suggest that risks in the market are relatively low, but increasingly aggressive underwriting standards show the opposite.
• Although volatility on the surface has been muted, there has been a meaningful amount across specific sectors and issuers. In particular, stress in wirelines, healthcare, cable, retailers, and select food and beverage names was felt, while sectors like energy and basic industries performed well. This divergence due to idiosyncratic factors has often been a precursor to broader market downturns in cycles past.
• On the loan side, refinancings were abundant, with issuers and underwriters actively reducing coupons on issues that traded above par. As a result of this consistent activity, the average quoted spread of the loan index declined 40 bps since the end of 2016, to end around L+345, the lowest level since 2010. Along those same lines, the percentage of the loan index with a coupon spreads of 250 bps or less has risen to 24% from 9%.
Overall Score
FinancialCovenants
Subordination:Liens and Structural
RPs
Debt Incurrence
Investments
Asset Sales &Mandatory Prepays
Voting,Assignments, etc.
0.0 0.5 1.0 1.5 2.0 2.5 3.0 3.5 4.0 4.5 5.0
20072017 YTD
4.43.52.5
Weakest-Level Protection
Moderate-Level Protection
Weak-Level Protection Jan-
2017
Feb-
2017
Mar
-201
7Ap
r-201
7M
ay-2
017
Jun-
2017
Jul-2
017
Aug-
2017
Sep-
2017
Oct
-201
7N
ov-2
017
Dec
-201
7
340
350
360
370
380
390
400
340
350
360
370
380
390
400
Bank
Loa
n Av
erag
e Co
upon
(bp
s) L+
L+
L+
L+
L+
L+
L+
L+
L+
L+
L+
L+
L+
L+2009 2010 2011 2012 2013 2014 2015 2016 2017
0
400
800
1,200
1,600
2,000
0
400
800
1,200
1,600
2,000
Spre
ad (
bps)
BB B <=CCC
Source: Moody’s Source: S&P, LCD Comps Source: Bank of America Merrill Lynch

DFIqr878CCP 2/1/18 13
FOR INVESTMENT PROFESSIONAL USE ONLY
4Q 2017 Non-Agency MBS Review and Outlook: One of the Only Sectors to Offer Deleveraging Assets
Our View: Legacy non-agency MBS remains one of the most attractive sectors in fixed income given the improving fundamentals – it is one of the few places where investors can find assets that are deleveraging rather than releveraging. Some of the new issue market is attractive, though fundamentally different from the legacy market, while the credit risk transfer notes offer relatively low yield with structures that provide little margin for error.
• Non-agency MBS was one of the best performing asset classes in 2017, with returns for the broad market nearing 10%, well above the annual return for the sector in the previous couple of years. The sector benefited from faster prepayment rates as more and more borrowers became eligible to refinance to lower cost mortgages.
• The sector also got a boost from various legal settlements with banks and underwriters that paid out in 2017 or are expected to pay out in 2018. Between the JP Morgan and Lehman Brothers settlements, markets expect roughly $7bn in settlements to be sent to investors in 2018 on top of the over $9bn paid out to date. These payments, combined with regular paydowns and prepayments continue to reduce leverage in the asset class and demonstrate further fundamental improvement.
• Despite the ongoing paydowns in the market, trading volumes remained healthy with daily trading volume on TRACE averaging about $700mm. In addition, markets saw consistent bid list activity during the year with $14-$18bn of lists every quarter. The list of investors has been stable as well, with sophisticated, unlevered investors like money managers and insurance companies making up the bulk of the demand.
• As the demand for higher yielding investments grows, non-GSE mortgage issuers have begun to respond with new issuance in the sector. There have been a small number of deals based on resecuritizations, non-prime, and non-qualified mortgages, but the largest non-agency issuance has come in credit risk transfer notes from FNMA and FHLMC, a market that is roughly $40bn in size and expected to grow $7-$8bn in 2018.
Non-Agency MBS Posted Strong Returns
Non-Agency MBS Trading Volumes Remain Robust
Credit Risk Transfer Notes Offer Little Spread Compensation
Source: Citigroup Source: Bloomberg Barclays, TCW Source: Citigroup
Jan Feb Mar Apr May Jun Jul Aug Sep Oct Nov Dec-2%
0%
2%
4%
6%
8%
10%
-2%
0%
2%
4%
6%
8%
10%
Cum
ulat
ive
Tota
l Ret
urn
2015 2016 2017
Mar
-16
Jun-
16
Sep-
16
Dec
-16
Mar
-17
Jun-
17
Sep-
17
Dec
-17
$0
$500
$1,000
$1,500
$2,000
$2,500
$3,000
$0
$500
$1,000
$1,500
$2,000
$2,500
$3,000
Mill
ions
Prime Alt-A Option Arm Subprime
2013 2014 2015 2016 20170
100
200
300
400
500
600
700
0
100
200
300
400
500
600
700
Spre
ad (
bps)
Senior Subordinate

DFIqr878CCP 2/1/18 14
FOR INVESTMENT PROFESSIONAL USE ONLY
4Q 2017 CMBS Review and Outlook: Weaker Underwriting Finds Way to Structured Products
Our View: As one of the areas of the structured products market that is experiencing the deterioration in underwriting standards also experienced in credit markets, and with little yield compensation to offset those risks, current vintage CMBS is relatively unattractive. However, parts of the market that do not have those same challenges, including agency CMBS, seasoned issues, or single asset single borrower deals where pari passu loans aren’t included all offer reasonable value.
• Pari passu loans are used in two ways:– High quality loans are put in deals to improve the average metrics, allowing
lower quality loans to be included without causing obvious degradation in overall reported average deal quality
– Small pieces of low quality loans are spread across a wide number of deals to keep them out of the list of top 20 loans, for which additional disclosures are typically required and on which investors do additional due diligence obscuring the actual risk in the lower parts of the capital structure
• As a government guaranteed sector, agency CMBS avoids the credit problems with pari passu loans and poor underwriting, but offers lower spreads and lower return potential. With a focus on multi-family properties consistent with the statutory goals of the agencies, it also avoids the risks associated with the weak retail sector which makes up an average of 10% of traditional CMBS deals.
• Both agency and non-agency CMBS generated modest positive returns in 2017, and consistent with other sectors, the lowest quality parts of the market were the standout performers. While AAA non-agency CMBS returned 3.5% for the year, BBB rated non-agency CMBS posted just over 14% as spreads tightened over 100 bps, though they remain elevated on continued risk assessments of the retail influence on conduit deals.
• Fundamentally, the CMBS market has seen underwriters get increasingly aggressive with structures, using pieces of pari passu loans across a variety of deals to disguise the actual risk in those deals. Pari passu loans are simply larger loans that are divided up into smaller pari passu chunks and placed in a number of different deals, and their allocation in CMBS deals has risen from zero in 2010 to over 40% today.
Source: Bloomberg Barclays
CMBS Spreads Have Tightened Despite Poor UnderwritingUse of Pari Passu Loans Has Risen Substantially
2011 2012 2013 2014 2015 2016 2017
0%
5%
10%
15%
20%
25%
30%
35%
40%
45%
0%
5%
10%
15%
20%
25%
30%
35%
40%
45%
% o
f Par
i Pas
su L
oans
In C
ondu
it D
eals
2010 2011 2012 2013 2014 2015 2016 20170
100
200
300
400
500
600
700
800
0
100
200
300
400
500
600
700
800
Spre
ad (
bps)
AAA A BBB
Source: MS Research, Trepp

DFIqr878CCP 2/1/18 15
FOR INVESTMENT PROFESSIONAL USE ONLY
• Agency MBS ended the year up slightly, outperforming comparable duration Treasuries by about 50 bps. The sector was soft in the middle of the year, as concerns about the pace of the Fed balance sheet reduction caused spreads to widen, but it recovered later in the year as the gradual reduction plan was digested and investors sought the additional carry available.
• Going forward, prepayments are expected to be slower overall as the refinance incentive is significantly lower than it has been in the past. Currently, only about 30% of FHLMC mortgages have rates above the current mortgage rate +50 bps, whereas in June 2003, a full 95% of mortgages had such rates. This makes the likelihood of a rapid increase in prepayments lower and provides greater stability to agency MBS cash flows.
4Q 2017 Agency MBS Review and Outlook: Some Good and Some Bad
Our View: At current levels, agency MBS offers fair value with the positive aspects of the market roughly balancing the potential negative factors. There are parts of the market, such as long CMOs, which look relatively cheap, while TBAs can be attractive especially considering their high levels of liquidity. Other parts of the market, such as GNMAs and 10-15 years pass throughs are relatively unattractive given the potential for greater issuance and tight spread levels respectively.
Positive
• High credit quality
• Very liquid asset class
• Yield premium relative to U.S. Treasuries
• Flatter yield curve benefits “wide window” bonds
• Tax reform is a headwind for housing price appreciation (HPA), tempering net supply
• Unexpectedly higher U.S. deficits could favor the basis with spread narrowing
Negative
• Tight nominal spreads (though fair option adjusted spreads)
• Fed balance sheet runoff
• Potential for higher volatility
• Continued HPA tailwind suggests higher net supply
• Falling U.S. dollar may weigh on overseas demand for MBS
Prepayments Less Sensitive to Interest Rate Changes
Source: eMBS, FTN Financial, TCW
0
10
20
30
40
50
60
70
0
10
20
30
40
50
60
70
-150 -100 -50 0 50 100 150 200
Prep
aym
ent R
ates
Average Refinance Incentive (bps)
July 2003
October 2012
2017
1999-2007
2010-2016
2017
• There are a number of other conflicting forces acting on the agency MBS market currently:

DFIqr878CCP 2/1/18 16
FOR INVESTMENT PROFESSIONAL USE ONLY
4Q 2017 ABS Review and Outlook: A Large Market and Diverse Market
Our View: The ABS sector offers a wide variety of collateral types with varying risk profiles and opportunities. Consistent with our defensive positioning, we favor those sectors that offer strong structures and solid collateral such as federally guaranteed student loans and top of the capital structure CLOs. Moving down the capital structure or into more cyclically sensitive areas isn’t justified by current spreads given the potential for increasing volatility.
• Like other non-government sectors, asset-backed securities also posted positive returns on both an absolute and relative basis, with all subsectors outperforming comparable Treasuries. The best performing sector was student loans, which saw spreads tighten throughout the year as markets gradually grew more comfortable with the impact of rating agency downgrades, which largely concluded early in 2017.
• Although ABS remains a high quality asset class, there are signs of building stress. On a macro level, household debt levels have moved consistently higher, focused on student and auto loans, but credit cards and other forms of debt have also drifted higher.
• Within specific sectors such as subprime auto lending, delinquencies have moved higher with 90+ delinquency rates rising to almost 10%, levels last seen in 2009. At the same time, recoveries have moved lower, with average recovery rates around 40%, about 5% lower than the average level over the preceding few years.
Source: New York Fed Consumer Credit Panel/Equifax Source: New York Fed Consumer Credit Panel/Equifax
Consumer Debt Levels Rising Seriously Delinquent Subprime Auto Borrowers Nearing 2007 Levels
Collateral Type Size ($bn)
Corporate Related 465 CLO 426 Cell Tower 6 Whole Business 14 Rental Car/Fleet Lease 19
Traditional Consumer 199 Credit Card 87 Prime Auto 71 Equipment 41
Student Loans 194 FFELP 157 Private Label 37
Non-Traditional Consumer 96 Subprime Auto 41 Tobacco Bonds 27 Consumer Loans 18 Legal Settlements 4 Timeshare 6
Real Estate Related 46 Military Housing 20 Small Balance Commercial 10 Single Family Buy-to-Rent 16
Global Logistics 23 Railcars 5 Shipping Containers 6 Aircraft 12
Environmental 26 Catastrophe 26
Other 37
Total 1,086
2006
2007
2008
2009
2010
2011
2012
2013
2014
2015
2016
2017
$0.0
$0.2
$0.4
$0.6
$0.8$1.0
$1.2
$1.4
$1.6
$0.0
$0.2
$0.4
$0.6
$0.8$1.0
$1.2
$1.4
$1.6
Auto Loan Student Loan Credit Card Other
2001
2003
2005
2007
2009
2011
2013
2015
2017
2%
4%
6%
8%
10%
12%
2%
4%
6%
8%
10%
12%
Del
inqu
ency
Rat
es
<620 Auto Finance <620 Banks & Credit Unions

DFIqr878CCP 2/1/18 17
FOR INVESTMENT PROFESSIONAL USE ONLY
4Q 2017 Core and Core Plus Fixed Income Positioning Summary
Portfolio characteristics and holdings are subject to change at any time. The views and forecasts expressed in this quarterly review are as of January 2018, are subject to change without notice and may not come to pass. TCW reserves the right to change its investment perspective and outlook without notice as market conditions dictate. Source: Bloomberg, TCW
Approximately 0.3 years shorter than the Index, with a bias to extend as rates rise
Duration• Remain short duration as long as rates remain below long-term fair value• Look to extend duration as rates rise, with a slight preference for adding in the 5-Year
part of the curve
Slightly favor 5-Year maturitiesCurve All parts of the curve bear some risk of rising rates, though 10- and 30-Year maturities are more vulnerable given the current flatness of the yield curve
Underweight with an emphasis on on-the-run securitiesGovernments• On-the-run securities provide greater liquidity for a small give up in yield• Look to add TIPS if breakeven inflation levels tighten further
• Agency MBS – neutral overall with modest adjustments near ends of the trading range
• Non-Agency MBS – maintain allocation
MBS
• Tactically utilize specified pools and TBAs contingent on the pay-up requirements and carry advantage available
• Favor relatively long accrual tranches of CMO bonds given more stable prepayment profiles
• Maintain emphasis on higher quality, shorter duration, currently amortizing non-agency MBS bonds
Overweight, emphasis on non-traditional sectorsABS• Favor government guaranteed student loans with a bias to sell as spreads continue to tighten• Hold senior CLOs given robust structures and reasonable valuations
Overweight, preference for agency CMBSCMBS
• Maintain allocation to agency CMBS which offers high quality cash flows and a yield advantage to Treasuries
• In non-agency, favor single asset single borrower deals and select IO issues where there is attractive upside potential
Underweight, bias to add on weaknessCredit
• Emphasize financials with a preference for large U.S. banks which have strong balance sheets and more diversified exposures than smaller, regional banks
• Underweight industrials with emphasis on defensive sectors like utilities, pharmaceuticals, communications, and non-profit hospitals
• Underweight high beta credit sectors and non-corporate credit, particularly non-U.S. issues, though will look to add high quality energy names if spreads widen
Small allocationHigh Yield Prefer defensive, relatively high quality credits away from volatile sectors like energy, metals, and
transportation
Minimal allocationInternational
• Minimal exposure to emerging markets given vulnerability to credit markets in the U.S.• Look to take advantage of market return to equilibrium levels in U.S. vs German 5-year
government bonds• Hold fully currency-hedged Japanese T-bills as a higher yielding cash substitute
PositioningCharacteristic Comments
We remain concerned about the potential for a significant and painful deleveraging in credit markets if volatility increases and record leverage is unwound in a disorderly fashion. However, deleveraging may take some time to unfold, so we continue to look for opportunities to add yield to the portfolio while avoiding credit risk, which has led us to various parts of the structured products market.

DFIqr878CCP 2/1/18 18
FOR INVESTMENT PROFESSIONAL USE ONLY
4Q 2017 Sector Highlight: Non-Agency MBS IssuanceSince the financial crisis, issuance of non-agency MBS has been anemic and due to the self-amortizing nature of the collateral, the asset class continues to shrink. However, since 2013, non-agency MBS issuance has started to increase, albeit at a very small pace, as detailed below.
Growth of Non-QM Securitization Market• 2017 experienced meaningful growth in non-QM securitization as total issuance in
2017 was approximately $3 billion, exceeding 2016 issuance of approximately $1 billion. New issuance for 2018 is projected to be $5 billion.
• Issuance is concentrated in a few non-bank originators, like private equity funds and asset management firms (Caliber, Angel Oak).
Non-QM vs. Legacy Alt-A• Newly issued non-QM collateral is most similar to pre-2004 Alt-A loans made before
the collapse in underwriting standards prior to the financial crisis.
• Non-QM collateral is not necessarily high risk as a loan may miss QM classification because a borrower does not meet some specific criteria, even though the borrower has a strong credit profile. For example, a self-employed borrower may not have stable enough income to satisfy the required debt-to-income ratio.
2013 2014 2015 2016 2017 2018 Projected
0
10
20
30
40
50
60
70
0
10
20
30
40
50
60
70
$ Bi
llion
s
Re-securitizations
CRT
Prime 2.0
Single Family Housing
Non-Qualified Mortgages
Non-Agency MBS Issuance
Source: Intex Solutions, DBRS, KBRA, S&P, Fitch, Bloomberg LP, Wells Fargo Securities
Our View: The non-agency mortgage market is finally starting to see new types of issuance, though that issuance is fundamentally different than outstanding non-agency securities. Nevertheless, we have been active participants in the new issue market. Even though the size of the market is still small and spreads are tight relative to crisis era non-agency securities, certain parts of the market look attractive given the quality of the collateral and the solidity of the structures.
Non-QM Bond Characteristics vs. 2007 Alt-A Bond CharacteristicsNon-Qualified Mortgage Market (Non-QM)• In 2014 the Consumer Finance Protection Bureau (CFPB) introduced the classification of
Qualified Mortgage, which is a loan that meets certain safe underwriting requirements like maximum debt-to-income ratios, no interest only or negative amortization features, and provides the lender certain legal protections.
• Mortgage loans that do not meet these requirements are deemed non-qualified mortgages, and while they can be made, they open the lender up to potential liability if there are errors in the underwriting.
Non-Qualified Mortgages Mortgage loans that do not meet CFPB classification of Qualified Mortgage
Single Family Housing Securitized lease payments from private equity portfolios
Prime 2.0 Prime borrowers with non-conforming, jumbo loans
CRT Credit Risk Transfer bonds issued by Fannie Mae and Freddie Mac
Re-securitizations Existing mortgages that are re-securitized
Source: Wells Fargo, Federal Reserve Bank of St. Louis and TCW
Non-QM Collateral vs. 2007 Alt-A Collateral Non-QM Loans 2007 Alt-A Loans (at issuance)
FICO Scores~ 67% have FICO between 660 and 740
Similar
Documentation~ 70% of loans originated have full documentation
Less than 30% of loans in 2004 to 2007 vintages had full documentation
Loan to Value 0% of loans have LTV > 90%~30% of loans had LTV > 90% (based on home values at that time)
Non-QM Bonds 2007 Alt-A Bonds (current)Senior Bond Credit Rating AAA CCCCredit Enhancement 38% 0%Weighted Average Life (WAL) 2-3 years 5-7 yearsSpread 60 130Issuers 6 100+

DFIqr878CCP 2/1/18 19
FOR INVESTMENT PROFESSIONAL USE ONLY
This material is for general information purposes only and does not constitute an offer to sell, or a solicitation of an offer to buy, any security. Any issuers or securities noted in this document are provided as illustrations or examples only, for the limited purpose of analyzing general market or economic conditions and may not form the basis for an investment decision, nor are they intended to serve as investment advice. Any such issuers or securities are under periodic review by the portfolio management group and are subject to change without notice. TCW makes no representation as to whether any security or issuer mentioned in this document is now in any TCW portfolio. TCW, its officers, directors, employees or clients may have positions in securities or investments mentioned in this publication, which are subject to change without notice. Any information and statistical data contained herein derived from third party sources are believed to be reliable, but TCW does not represent that they are accurate, and they should not be relied on as such or be the basis for an investment decision.
An investment in the strategy described herein has risks, including the risk of losing some or all of the invested capital. An investor should carefully consider the risks and suitability of an investment strategy based on their own investment objectives and financial position. There is no assurance that the investment objectives and/or trends will come to pass or be maintained. The information contained herein may include preliminary information and/or “forward-looking statements.” Due to numerous factors, actual events may differ substantially from those presented herein. TCW assumes no duty to update any forward-looking statements or opinions in this document. This material comprises the assets under management of The TCW Group, Inc. and its subsidiaries, including TCW Investment Management Company LLC, TCW Asset Management Company LLC, and Metropolitan West Asset Management, LLC. Any opinions expressed herein are current only as of the time made and are subject to change without notice. The investment processes described herein are illustrative only and are subject to change. Past performance is no guarantee of future results. © 2018 TCW

Investment objective
Vanguard Inflation-Protected Securities Fundseeks to provide investors inflation protection andincome consistent with investment ininflation-indexed securities.
Investment strategy
The fund invests at least 80% of its assets ininflation-indexed bonds issued by the U.S.government, its agencies and instrumentalities,and corporations. The fund may invest in bonds ofany maturity; however, its dollar-weightedaverage maturity is expected to be in a range of 7to 20 years. At a minimum, all bonds purchasedby the fund will be rated “investment grade” or, ifunrated, will be considered by the advisor to beinvestment grade.
Fact Sheet | December 31, 2017
Vanguard Inflation-Protected Securities FundBond fund | Institutional Shares
$13,461 Fund as of 12/31/17
$13,605 Benchmark as of 12/31/17
2008 2009 2010 2011 2012 2013 2014 2015 2016 2017
2008 2009 2010 2011 2012 2013 2014 2015 2016 2017
Fund -2.81 11.03 6.33 13.39 6.87 -8.83 4.07 -1.67 4.63 2.97
Benchmark -2.35 11.41 6.31 13.56 6.98 -8.61 3.64 -1.44 4.68 3.01
F1190 122017
BloomBarc US Trsy Inflat Prtcd Idx: Includes the inflation-indexed securities within the Bloomberg Barclays U.S.Treasury Bond Index, which represents U.S. Treasury obligations with maturities of more than 1 year. The fund held asubscription period from June 5, 2000 (the effective date of the fund) to June 29, 2000, during which time all assetswere held directly or indirectly in money market instruments. Performance measurement began June 29, 2000.
Benchmark
BloomBarc US Trsy Inflat Prtcd Idx
For the most up-to-date fund data,please scan the QR code below.
Risk levelLow High
Total netassets
Expense ratio as of 04/26/17
Tickersymbol
TurnoverRate
Inceptiondate
Fundnumber
1 2 3 4 5 $9,508 MM 0.07% VIPIX 27.0% 12/12/03 1190
Growth of a $10,000 investment : January 31, 2008—December 31, 2017
Annual returns
Periods Ended December 31, 2017
Quarter Year to Date One Year Three Years Five Years Ten Years
Fund 1.22% 2.97% 2.97% 1.94% 0.10% 3.40%
Benchmark 1.26% 3.01% 3.01% 2.05% 0.13% 3.53%
The performance data shown represent past performance, which is not a guarantee of futureresults. Investment returns and principal value will fluctuate, so investors’ shares, when sold, maybe worth more or less than their original cost. Current performance may be lower or higher thanthe performance data cited. For performance data current to the most recent month-end, visit ourwebsite at vanguard.com/performance.Figures for periods of less than one year are cumulative returns. All other figures represent average annualreturns. Performance figures include the reinvestment of all dividends and any capital gains distributions.All returns are net of expenses.
Total returns
Distribution by issuer–Bonds
Treasury/Agency 100.0%Asset-Backed 0.0Commercial Mortgage-Backed 0.0Finance 0.0
Foreign 0.0Government Mortgage-Backed 0.0Industrial 0.0Utilities 0.0

Fact Sheet | December 31, 2017
Vanguard Inflation-Protected Securities Fund
Bond fund | Institutional Shares
© 2018 The Vanguard Group, Inc. All rights reserved. Vanguard Marketing Corporation, Distributor. F1190 122017
Investment Products: Not FDIC Insured • No Bank Guarantee • May Lose Value
Connect with Vanguard ® > vanguard.comPlain talk about riskAn investment in the fund could lose money over short or even long periods. You should expect the fund’s share price and total return to fluctuate within a widerange, like the fluctuations of the overall bond market. The fund’s performance could be hurt by:Income fluctuations: The fund’s quarterly income distributions are likely to fluctuate considerably more than the income distributions of a typical bond fund.Income fluctuations associated with changes in interest rates are expected to be low; however, income fluctuations associated with changes in inflation areexpected to be high. Overall, investors can expect income fluctuations to be high for the fund.Interest rate risk: The chance that bond prices will decline because of rising interest rates. Although inflation-indexed bonds seek to provide inflation protection,their prices may decline when interest rates rise and vice versa. Because the fund’s dollar-weighted average maturity is expected to be in the range of 7 to 20years, interest rate risk is expected to be moderate to high for the fund.Manager risk: The chance that poor security selection will cause the fund to underperform relevant benchmarks or other funds with a similar investmentobjective.Derivatives risk: The chance that investments in derivatives may involve risks different from, and possibly greater than, those of investments in the underlyingsecurities, assets, or market indexes.
Note on frequent trading restrictionsFrequent trading policies may apply to those funds offered as investment options within your plan. Please log on to Vanguard.com for your employer plans orcontact Participant Services at 800-523-1188 for additional information.
While U.S. Treasury or government agency securities provide substantial protection against credit risk, they do not protect investors against price changes due tochanging interest rates. Unlike stocks and bonds, U.S. Treasury bills are guaranteed as to the timely payment of principal and interest.
BLOOMBERG® is a trademark and service mark of Bloomberg Finance L.P. BARCLAYS® is a trademark and service mark of Barclays Bank Plc, used under license. Bloomberg Finance L.P. and itsaffiliates, including Bloomberg Index Services Limited (”BISL”) (collectively, ”Bloomberg”), or Bloomberg’s licensors own all proprietary rights in the Bloomberg Barclays Indices. The products are notsponsored, endorsed, issued, sold or promoted by “Bloomberg or Barclays”. Bloomberg and Barclays make no representation or warranty, express or implied, to the owners or purchasers of theproducts or any member of the public regarding the advisability of investing in securities generally or in the products particularly or the ability of the Bloomberg Barclays Indices to track general bondmarket performance. Neither Bloomberg nor Barclays has passed on the legality or suitability of the products with respect to any person or entity. Bloomberg’s only relationship to Vanguard and theproducts are the licensing of the Bloomberg Barclays Indices which are determined, composed and calculated by BISL without regard to Vanguard or the products or any owners or purchasers of theproducts Bloomberg has no obligation to take the needs of the products or the owners of the products into consideration in determining, composing or calculating the Bloomberg Barclays Indices.Neither Bloomberg nor Barclays is responsible for and has not participated in the determination of the timing of, prices at, or quantities of the products to be issued. Neither Bloomberg nor Barclays hasany obligation or liability in connection with the administration, marketing or trading of the products.
For more information about Vanguard funds or to obtain a prospectus, see below for which situation is right for you.If you receive your retirement plan statement from Vanguard or log on to Vanguard’s website to view your plan, visit vanguard.com or call 800-523-1188.If you receive your retirement plan statement from a service provider other than Vanguard or log on to a record keeper’s website that is not Vanguard to view yourplan, please call 855-402-2646. Visit vanguard.com to obtain a prospectus or, if available, a summary prospectus. Investment objectives, risks, charges, expenses, and other importantinformation about a fund are contained in the prospectus; read and consider it carefully before investing.
Financial advisor clients: For more information about Vanguard funds, contact your financial advisor to obtain a prospectus.

Investment objective
Vanguard Growth Index Fund seeks to track theperformance of a benchmark index that measuresthe investment return of large-capitalizationgrowth stocks.
Investment strategy
The fund employs an indexing investmentapproach designed to track the performance ofthe CRSP US Large Cap Growth Index, a broadlydiversified index predominantly made up ofgrowth stocks of large U.S. companies. The fundattempts to replicate the target index by investingall, or substantially all, of its assets in the stocksthat make up the index, holding each stock inapproximately the same proportion as itsweighting in the index.
Fact Sheet | December 31, 2017
Vanguard Growth Index FundDomestic stock fund | Institutional Shares
$26,996 Fund as of 12/31/17
$27,096 Benchmark as of 12/31/17
2008 2009 2010 2011 2012 2013 2014 2015 2016 2017
2008 2009 2010 2011 2012 2013 2014 2015 2016 2017
Fund -38.19 36.50 17.17 1.89 17.04 32.41 13.62 3.33 6.13 27.81
Benchmark -38.22 36.50 17.23 1.96 17.14 32.47 13.69 3.38 6.16 27.86
F0868 122017Spliced Growth Index: S&P 500 Growth Index (formerly known as the S&P 500/Barra Growth Index) through May 16,2003; MSCI US Prime Market Growth Index through April 16, 2013; CRSP US Large Cap Growth Index thereafter.
Benchmark
Spliced Growth Index
For the most up-to-date fund data,please scan the QR code below.
Risk levelLow High
Total netassets
Expense ratio as of 04/27/17
Tickersymbol
TurnoverRate
Inceptiondate
Fundnumber
1 2 3 4 5 $12,495 MM 0.05% VIGIX 10.7% 05/14/98 0868
Growth of a $10,000 investment : January 31, 2008—December 31, 2017
Annual returns
Periods Ended December 31, 2017
Quarter Year to Date One Year Three Years Five Years Ten Years
Fund 6.23% 27.81% 27.81% 11.91% 16.09% 9.53%
Benchmark 6.22% 27.86% 27.86% 11.95% 16.14% 9.58%
The performance data shown represent past performance, which is not a guarantee of futureresults. Investment returns and principal value will fluctuate, so investors’ shares, when sold, maybe worth more or less than their original cost. Current performance may be lower or higher thanthe performance data cited. For performance data current to the most recent month-end, visit ourwebsite at vanguard.com/performance.Figures for periods of less than one year are cumulative returns. All other figures represent average annualreturns. Performance figures include the reinvestment of all dividends and any capital gains distributions.All returns are net of expenses.
Total returns
Top sector holdings–Stocks
Technology 26.9%Consumer Services 20.2Financials 13.2Industrials 12.7Health Care 11.7
Consumer Goods 10.1Oil & Gas 3.7Basic Materials 1.3Telecommunications 0.2Other 0.0
Sector categories are based on the Industry Classification Benchmark (“ICB”), except forthe “Other” category (if applicable), which includes securities that have not been providedan ICB classification as of the effective reporting period.

Fact Sheet | December 31, 2017
Vanguard Growth Index Fund
Domestic stock fund | Institutional Shares
© 2018 The Vanguard Group, Inc. All rights reserved. Vanguard Marketing Corporation, Distributor. F0868 122017
Investment Products: Not FDIC Insured • No Bank Guarantee • May Lose Value
Connect with Vanguard ® > vanguard.comPlain talk about riskAn investment in the fund could lose money over short or even long periods. You should expect the fund’s share price and total return to fluctuate within a widerange, like the fluctuations of the overall stock market. In addition, the fund’s performance could be hurt disproportionately by a decline in the prices of just a fewstocks. This is because, compared with other mutual funds, the fund invests a greater percentage of assets in the stocks of fewer companies. The fund’sperformance could also be hurt by: Stock market risk: The chance that stock prices overall will decline. Stock markets tend to move in cycles, with periods of rising stock prices and periods offalling stock prices. The fund’s target index may, at times, become focused in stocks of a particular sector, category, or group of companies. Because the fundseeks to track its target index, the fund may underperform the overall stock market.Investment style risk: The chance that returns from large-capitalization growth stocks will trail returns from the overall stock market. Large-cap stocks tend to gothrough cycles of doing better—or worse—than other segments of the stock market or the stock market in general. These periods have, in the past, lasted for aslong as several years.
Note on frequent trading restrictionsFrequent trading policies may apply to those funds offered as investment options within your plan. Please log on to Vanguard.com for your employer plans orcontact Participant Services at 800-523-1188 for additional information.
For more information about Vanguard funds or to obtain a prospectus, see below for which situation is right for you.If you receive your retirement plan statement from Vanguard or log on to Vanguard’s website to view your plan, visit vanguard.com or call 800-523-1188.If you receive your retirement plan statement from a service provider other than Vanguard or log on to a record keeper’s website that is not Vanguard to view yourplan, please call 855-402-2646. Visit vanguard.com to obtain a prospectus or, if available, a summary prospectus. Investment objectives, risks, charges, expenses, and other importantinformation about a fund are contained in the prospectus; read and consider it carefully before investing.
Financial advisor clients: For more information about Vanguard funds, contact your financial advisor to obtain a prospectus.
Ten largest holdings*
1 Apple Inc.
2 Alphabet Inc.
3 Amazon.com Inc.
4 Facebook Inc.
5 Home Depot Inc.
6 Visa Inc.
7 Comcast Corp.
8 Coca-Cola Co.
9 Philip Morris International Inc.
10 AbbVie Inc.
Top 10 as % of Total Net Assets 31.4%
* The holdings listed exclude any temporary cashinvestments and equity index products.

Investment objective
Vanguard Short-Term Investment-Grade Fundseeks to provide current income whilemaintaining limited price volatility.
Investment strategy
The fund invests in a variety of high-quality and,to a lesser extent, medium-quality fixed incomesecurities, at least 80% of which will be short-and intermediate-term investment-gradesecurities. High-quality fixed income securitiesare those rated the equivalent of A3 or better byMoody’s Investors Service, Inc., or anotherindependent rating agency; medium-quality fixedincome securities are those rated the equivalentof Baa1, Baa2, or Baa3 by Moody’s or anotherindependent rating agency. (Investment-gradefixed income securities are those rated theequivalent of Baa3 and above by Moody’s.) Thefund is expected to maintain a dollar-weightedaverage maturity of 1 to 4 years.
Fact Sheet | December 31, 2017
Vanguard Short-Term Investment-Grade FundBond fund | Admiral™ Shares
$13,189 Fund as of 12/31/17
$13,830 Benchmark as of 12/31/17
2008 2009 2010 2011 2012 2013 2014 2015 2016 2017
2008 2009 2010 2011 2012 2013 2014 2015 2016 2017
Fund -4.65 14.17 5.33 2.02 4.63 1.07 1.86 1.13 2.82 2.12
Benchmark -1.13 13.52 5.44 3.04 5.51 1.24 1.95 1.06 2.58 2.32
F0539 122017BloomBarc US 1-5 Year Credit Index: Includes investment-grade (rated Baa3 or above by Moody’s) corporate andinternational dollar-denominated bonds with maturities of 1 to 5 years.
Benchmark
BloomBarc US 1-5 Year Credit Index
For the most up-to-date fund data,please scan the QR code below.
Risk levelLow High
Total netassets
Expense ratio as of 05/26/17
Tickersymbol
TurnoverRate
Inceptiondate
Fundnumber
1 2 3 4 5 $42,332 MM 0.10% VFSUX 68.4% 02/12/01 0539
Growth of a $10,000 investment : January 31, 2008—December 31, 2017
Annual returns
Periods Ended December 31, 2017
Quarter Year to Date One Year Three Years Five Years Ten Years
Fund -0.05% 2.12% 2.12% 2.02% 1.80% 2.96%
Benchmark -0.13% 2.32% 2.32% 1.99% 1.83% 3.49%
The performance data shown represent past performance, which is not a guarantee of futureresults. Investment returns and principal value will fluctuate, so investors’ shares, when sold, maybe worth more or less than their original cost. Current performance may be lower or higher thanthe performance data cited. For performance data current to the most recent month-end, visit ourwebsite at vanguard.com/performance.Figures for periods of less than one year are cumulative returns. All other figures represent average annualreturns. Performance figures include the reinvestment of all dividends and any capital gains distributions.All returns are net of expenses.
Total returns
Distribution by issuer–Bonds
Finance 28.4%Industrial 25.2Treasury/Agency 15.0Commercial Mortgage-Backed 9.5Asset-Backed 9.2
Foreign 7.6Utilities 4.1Other 0.4Government Mortgage-Backed 0.3Short-Term Reserves 0.3

Fact Sheet | December 31, 2017
Vanguard Short-Term Investment-Grade Fund
Bond fund | Admiral™ Shares
© 2018 The Vanguard Group, Inc. All rights reserved. Vanguard Marketing Corporation, Distributor. F0539 122017
Investment Products: Not FDIC Insured • No Bank Guarantee • May Lose Value
Connect with Vanguard ® > vanguard.comPlain talk about riskThe fund is designed for investors with a low tolerance for risk; however, the fund’s performance could be hurt by: Income risk: The chance that the fund’s income will decline because of falling interest rates.Interest rate risk: The chance that bond prices will decline because of rising interest rates. Interest rate risk should be low for the fund because it investsprimarily in short-term bonds, whose prices are much less sensitive to interest rate changes than are the prices of long-term bonds.Credit risk: The chance that a bond issuer will fail to pay interest or principal in a timely manner or that negative perceptions of the issuer’s ability to make suchpayments will cause the price of that bond to decline. Credit risk should be relatively low for the fund because it invests primarily in bonds that are considered tobe of high quality.Call risk: The chance that during periods of falling interest rates, issuers of callable bonds may call (redeem) securities with higher coupon rates or interest ratesbefore their maturity dates. The fund would then lose any price appreciation above the bond’s call price and would be forced to reinvest the unanticipated proceedsat lower interest rates, resulting in a decline in the fund’s income.Extension risk: The chance that during periods of rising interest rates, certain debt obligations will be paid off substantially more slowly than originally anticipated,and the value of those securities may fall. Extension risk is generally low for short-term bond funds.Liquidity risk: The chance that the fund may not be able to sell a security in a timely manner at a desired price. Liquidity risk is generally low for short-term bondfunds.Manager risk: The chance that poor security selection will cause the fund to underperform relevant benchmarks or other funds with a similar investmentobjective.BLOOMBERG® is a trademark and service mark of Bloomberg Finance L.P. BARCLAYS® is a trademark and service mark of Barclays Bank Plc, used under license. Bloomberg Finance L.P. and itsaffiliates, including Bloomberg Index Services Limited (”BISL”) (collectively, ”Bloomberg”), or Bloomberg’s licensors own all proprietary rights in the Bloomberg Barclays Indices. The products are notsponsored, endorsed, issued, sold or promoted by “Bloomberg or Barclays”. Bloomberg and Barclays make no representation or warranty, express or implied, to the owners or purchasers of theproducts or any member of the public regarding the advisability of investing in securities generally or in the products particularly or the ability of the Bloomberg Barclays Indices to track general bondmarket performance. Neither Bloomberg nor Barclays has passed on the legality or suitability of the products with respect to any person or entity. Bloomberg’s only relationship to Vanguard and theproducts are the licensing of the Bloomberg Barclays Indices which are determined, composed and calculated by BISL without regard to Vanguard or the products or any owners or purchasers of theproducts Bloomberg has no obligation to take the needs of the products or the owners of the products into consideration in determining, composing or calculating the Bloomberg Barclays Indices.Neither Bloomberg nor Barclays is responsible for and has not participated in the determination of the timing of, prices at, or quantities of the products to be issued. Neither Bloomberg nor Barclays hasany obligation or liability in connection with the administration, marketing or trading of the products.
For more information about Vanguard funds or to obtain a prospectus, see below for which situation is right for you.If you receive your retirement plan statement from Vanguard or log on to Vanguard’s website to view your plan, visit vanguard.com or call 800-523-1188.If you receive your retirement plan statement from a service provider other than Vanguard or log on to a record keeper’s website that is not Vanguard to view yourplan, please call 855-402-2646. Visit vanguard.com to obtain a prospectus or, if available, a summary prospectus. Investment objectives, risks, charges, expenses, and other importantinformation about a fund are contained in the prospectus; read and consider it carefully before investing.
Financial advisor clients: For more information about Vanguard funds, contact your financial advisor to obtain a prospectus.

voyainvestments.com
For financial professional or qualified institutional investor use only. Not for inspection by, distribution or quotation to, the general public.
Pasadena Fire and Police Ret. System
Quarter Ending December 31, 2017
Prepared for
Portfolio Review
Voya TeamTable of Contents
For financial professional or qualified institutional investor use only. Not for inspection by, distribution or quotation to, the general public.
Pasadena Fire and Police Ret. System
Dan Norman
Group Head and Managing Director, Senior Loans
Sandy Sinor
Senior Vice President, Institutional Client Advisor
Rosa Martone
Institutional Client Service
Client Service Manager
Phone: 860-275-4607
Email: [email protected]
Web Access:
https://www.investments.voya.com/ClientAccess
.................................................................................. 3Market Review5..................................................................................Investment Policy6..................................................................................Performance Analysis9..................................................................................Performance Summary
10..................................................................................Portfolio Characteristics12..................................................................................Asset Allocation
.................................................................................. 13Business Highlights
.................................................................................. 14Appendix
2

Market Review - Quarter Ending Dec 31, 2017
For financial professional or qualified institutional investor use only. Not for inspection by, distribution or quotation to, the general public.
Pasadena Fire and Police Ret. System
Market Review
The U.S. equity market proved to be quite resilient throughout 2017, and the fourth quarter was no exception. U.S. equities, as measured by the
S&P 500 index, had lagged their internationally developed market peers but made progress to close the gap in 4Q. Positive seasonal effects,
passage of the U.S. tax legislation and strong economic data propelled U.S. stocks to a perfect pitch year — not a single month posted negative
returns. Stocks haven’t had such a consistently strong year since 1995.
Bond yields, which had been locked in a range since early October, made a move higher in December. The move was not driven by rising inflation
but by the increasing likelihood, with each passing day, of tax reform becoming law. The prospects of bigger budget deficits seem to have been the
culprit pushing bond yields closer to 2.5%. High yield and corporate bond indexes were able to shrug off the Treasury market weakness with
tighter spreads.
The broad, trade-weighted U.S. dollar looked to be able to break its losing streak in a modest counter-trend rally that faded at the end of
December. The positive developments on tax reform gave the currency the lift. Longer term, the U.S. dollar is likely to depreciate, as it has been
through a seven-year bull market and bigger budget deficits are a headwind.
The bond market seems to regard the upcoming tax plan as equivalent to giving a healthy person a shot of adrenalin: 10-year yields jumped 15
basis points over the course of a week with the passage of the bill. Ten-year U.S. Treasurys ended just about where they started the year, but with
a lot of ups and downs touching the bottom of the trading range close to 2.0% and the top 2.6%. With some modicum of near-term faster growth,
we expect bond yields to stay near the top end of that range.
A lot of chatter in the markets is focusing on the low levels of volatility that prevailed in 2017 and whether 2018 will be the year that it returns. As
usual, there are any number of geopolitical or other risks that could cause a temporary sell-off, but we are heartened by the reality of macro
fundamentals, which include strong and synchronous global growth. This would put a cap on any weakness in risk assets or rises in volatility.
3

Market Review - Quarter Ending Dec 31, 2017
For financial professional or qualified institutional investor use only. Not for inspection by, distribution or quotation to, the general public.
Pasadena Fire and Police Ret. System
Equities had a strong run in 2017, driven equally by multiple expansion and earnings growth. We expect that earnings will have to do most of the
heavy lifting in 2018, however, as equities have become more expensive at 19x forward earnings. While tax cuts can add more fuel to the earnings
fire, they are largely incorporated into equity prices already.
The emerging markets were the darlings of last year, gaining over 30%. Even with a modest setback, lagging behind the U.S. in 4Q17, they are the
ultimate beneficiaries of stronger than expected global growth, and at good valuations.
In the United States, tax reform legislation has cleared the legislative hurdles to become law. We estimate the new policy will boost U.S. GDP
growth by 0.3% in 2018 and 2019. The financial markets will have to digest some short- and longer-term consequences. Federal spending will
grow more quickly in 2018 than it has for the last three years. With more fiscal stimulus comes larger deficits. Consensus expectations are for the
U.S. budget deficit to reach 3.7% in 2018 and 5.0% in 2019. We also expect the Federal Reserve to respond to faster growth to maintain its
mandate for a stable labor market.
Therefore, we think the Fed will continue to raise interest rates in 2018. Raising short-term rates will continue to flatten the yield curve (the
difference between the yields on two-year and ten-year Treasurys) but the flattening is unlikely to match the speed that it had in 2017. The back
end of the curve is unlikely to be as firmly anchored as it was in 2017 as one-off effects of softer inflation and an increase in the global supply of
bonds impact the market.
4

Investment Policy
For financial professional or qualified institutional investor use only. Not for inspection by, distribution or quotation to, the general public.
Pasadena Fire and Police Ret. System Senior Loan
Mandate Senior Loan
S&P/LSTA Leveraged Loan Index
The investment management agreement between Voya Investment Management and Pasadena Fire and Police Ret.System was effective June 27, 2014.
Inception
Actively managed, ultra-short duration floating-rate income strategy that invests primarily in privately syndicated, belowinvestment grade senior secured corporate loans
Strategy Summary
Our investment process focuses on fundamental credit analysis, relative value assessment and high levels of diversification. Weinvest primarily in non-investment grade senior loans because they generally offer attractive yields, are typically secured byborrower assets, and are not subject to traditional interest rate risk. We target non-investment grade senior loans with theobjective of achieving superior long-term risk adjusted returns, rather than investing for the absolute highest returns at theexpense of significantly increased credit risk. Our investment process utilizes top-down analysis to target industries with strongoperating momentum or improving credit conditions, while avoiding those sectors prone to the clustering of defaults. The othermajor component of our process, specific borrower selection, is based on fundamental bottom-up credit analysis that includesindependent credit research, in depth collateral review and relative value analysis.
Process
Benchmark
$12,302,068.67 as of December 31, 2017Account Balance
5

Performance Analysis - Quarter Ending Dec 31, 2017
For financial professional or qualified institutional investor use only. Not for inspection by, distribution or quotation to, the general public.
Pasadena Fire and Police Ret. System Senior Loan
Key Takeaways
For the quarter, the Trust outperformed its benchmark, the S&P/LSTA Leveraged Loan Index, due largely to selection in the building &
development and surface transport sectors.
Relative detractors include selection in the food/drug retailers sector.
Portfolio Review
With institutional issuance climbing to record amount and market demand remaining robust, the S&P/LSTA Leveraged Loan Index (“Index”) posted
a quarterly return of 1.11%, bringing the 2017 full year figure to 4.12%. The weighted average bid ended the quarter at 98.05 (slightly up from last
quarter), while remaining on a relatively flattish course during the year.
Institutional issuance experienced a gradual decline in the fourth quarter, as the total volume of $97 billion was the lowest quarterly reading of the
year. Despite the slowdown, 2017 marked a record year in institutional volume. The $503 billion of issuance reported by Standard & Poor’s
Leveraged Commentary & Data easily eclipsed the previous high-water mark of $456 billion from 2013. Merger and acquisition (M&A)-related
activity was down significantly compared to the first nine months of the year, as opportunistic financing re-emerged at an exceptionally active rate.
Fourth quarter’s repricing total of $138 billion was the second-highest on record and accounted for 65% of all institutional activity.
On the other side of the ledger, collateralized loan obligation (CLO) issuance remained strong, with October and November representing the
second and third busiest month of CLO issuance in 2017, each totaling approximately $12.8 billion. December volume was a respectable $9.9
billion, which brought the fourth quarter total to $35 billion, the highest quarterly reading of the year. U.S. loan funds, on the other hand, drifted in
the opposite direction. November and December periods experienced outflows, while October’s influx wasn’t enough to offset the three-month
outflow total of approximately $5 billion.
6

Performance Analysis - Quarter Ending Dec 31, 2017
For financial professional or qualified institutional investor use only. Not for inspection by, distribution or quotation to, the general public.
Pasadena Fire and Police Ret. System Senior Loan
With the exception of defaulted loans, which returned -6.75% for the quarter, returns were positive across below-investment grade ratings cohorts.
CCCs were ahead of the pack with a 2.85% gain as average bids for the cohort moved over 85 (above Moody’s calculation of the long-term
recovery level for the asset-class of 80), while BBs and Bs both returned 1.09%, respectively. Default activity picked up in the fourth quarter after
six issuers filed for bankruptcy. Consequently, the trailing 12-month rate for the asset class, as measured by principal amount, increased to 2.05%
(still well below the long term historical average of 3.01%).
The Trust in the third quarter returned 1.22% on a gross basis, 11 basis points ahead of the Index.
Contributors were distributed across multiple sectors, and included selection in the building & development and surface transport
sectors. Specifically, an overweight to Forterra Finance, LLC (building & development) which saw results improve on the back of stronger
demand, better pricing and successful cost cuts, and the avoidance of American Commercial Lines Inc. (surface transport), which is a distressed
credit operating barges on the Mississippi River, were contributors to the portfolio’s performance. Although selection in the food/drug retailers
sector was the largest detractor to returns, sector allocation and issuer selection detractors for the portfolio were also relatively disbursed, with no
material single drivers over the period. Specifically, in the food/drug retailers sector, an overweight to General Nutrition Centers, Inc. was a
detractor as the company pulled a refinance transaction at the end of the year which would have extended debt maturities.
There was one default in the Trust during the quarter, as compared to six defaults for the Index. The Trust held Cumulus Media, which filed for
bankruptcy after the company and senior lenders negotiated a restructuring proposal that would reduce the debt levels substantially and give a
majority of the equity to lenders. The lagging 12-month default rate by principal amount for the Index stood at 2.05% as of December 31. By
comparison, the Trust’s lagging 12-month default rate stands at 0.45%. Over the period of September 2008 through December 2017, the Trust
has avoided approximately 92% of the defaults within the Index.
Current Strategy and Outlook
7

Performance Analysis - Quarter Ending Dec 31, 2017
For financial professional or qualified institutional investor use only. Not for inspection by, distribution or quotation to, the general public.
Pasadena Fire and Police Ret. System Senior Loan
Our loan market outlook for 2018 calls for a base-case total return in the 4.5-5.5% range. Barring any exogenous event, the loan market should
deliver a coupon with mostly modest contributions or detractions coming from market value changes. The Index’s current interest carry is 4.82%
(annualized rate, based on the month of December 2017), which is about level with the annualized rate from December 2016 (4.86%), as rising
short-term rates have mostly offset spread compression. For 2018, we see rising short-term rates at least offsetting spread compression, as we
expect repricing activity to further moderate and the Federal Reserve (Fed) to stay the course. The Fed has just followed through on a 25 basis
points interest rate hike in December, while confirming their projection for three hikes in 2018, which would clearly benefit the floating-rate loan
market while creating headwinds for the bond market.
8

Performance Summary
For financial professional or qualified institutional investor use only. Not for inspection by, distribution or quotation to, the general public.
Pasadena Fire and Police Ret. System Senior Loan
1.22
3.67
4.48
3.91
1.11
4.12
4.44
3.50
0
1
2
3
4
5
Ra
tes
of
Re
turn
(%
)
Quarter 1 Year 3 Year Since Incept*
Portfolio Gross Benchmark
Quarter 1 Year 3 Year Since Inception*Portfolio Gross (%) 1.22 3.67 4.48 3.91
Portfolio Net (%) 1.09 3.16 3.97 3.41
Benchmark (%) 1.11 4.12 4.44 3.50
Relative to Gross (%) 0.11 (0.45) 0.05 0.42
Calendar Year Returns 2017 2016 2015
Portfolio Gross (%) 3.67 8.52 1.39
Portfolio Net (%) 3.16 7.98 0.88
Benchmark (%) 4.12 10.16 (0.69)
*Performance inception date is 7/01/2014. Benchmark: S&P/LSTA Leveraged Loan Index
Performance returns for time periods greater than 1 year are annualized. Past performance does not guarantee future results.
See Explanatory Notes Section for footnotes and disclosures.
Quarter Ending December 31, 2017
9

Portfolio Characteristics
Quarter Ending December 31, 2017
For financial professional or qualified institutional investor use only. Not for inspection by, distribution or quotation to, the general public.
Pasadena Fire and Police Ret. System Senior Loan
6.4
20.6
33.7
26.3
5.2
7.6
17.7
20.5
34.6
5.3
0
10
20
30
40
BB BB- B+ B B-BB BB- B+ B B-
Moody's S&P
Ratings Distribution (Senior Secured Ratings)
1.6
5.6
21
47.8
16.3
6.1
1.6
0
10
20
30
40
50
L+0 -L+200
L+201 -L+249
L+250 -L+299
L+300 -L+399
L+400 -L+499
L+500 orMore
PrimeSpread
Moody's
Spread Distribution (LIBOR + bps)
See Explanatory Notes Section for footnotes and disclosures.
10

Portfolio Characteristics
Quarter Ending December 31, 2017
For financial professional or qualified institutional investor use only. Not for inspection by, distribution or quotation to, the general public.
Pasadena Fire and Police Ret. System Senior Loan
Characteristics Portfolio
Number of Industries 36
Average per Industry $50,576,717
Average per Industry as a % of AUM 2.78%
Number of Issuers 358
Average per Issuer $5,085,926
Average per Issuer as a % of AUM 0.28%
Weighted Average Spread 3.48%
Weighted Average Maturity Years 5.55
Weighted Average Market Price 99.20%
Leverage for Investment Purposes Percent 0.00%
See Explanatory Notes Section for footnotes and disclosures.
Returns-BasedStatistics (5 years ) Portfolio Benchmark
Standard Deviation (%) 1.88 2.38
Tracking Error (%) 0.72 N/A
Information Ratio 0.69 N/A
Alpha (annualized %) 1.38 N/A
Beta 0.77 1.00
R-Squared 0.94 1.00
Sharpe Ratio 2.28 1.59
11

Asset Allocation
Quarter Ending December 31, 2017
For financial professional or qualified institutional investor use only. Not for inspection by, distribution or quotation to, the general public.
Pasadena Fire and Police Ret. System Senior Loan
Electronics/Electrical, 13%
Health Care, 11%
Business Equipment & Services, 10%
Telecommunications, 8%
Diversified Insurance, 5%
Chemicals & Plastics, 5%
Retailers (Except Food & Drug), 4%
Lodging & Casinos, 4%
Automotive, 4%
Containers & Glass Products, 4%
Radio & Television, 3%
Cable & Satellite Television, 3%
Leisure Goods/Activities/Movies, 3%
Oil & Gas, 2%
Building & Development, 2%
Other, 19%
Top Issuers ($ millions) Market Value % of AUM
Asurion, LLC $25.8 1.42%
Univision Communications, Inc. $16.2 0.89%
Sedgwick Holdings, Inc. $14.6 0.80%
Albertsons LLC $14.4 0.79%
Misys (Finastra) $14.4 0.79%
BMC Software, Inc. $13.5 0.74%
Altice International S.A. $13.3 0.73%
Scientific Games International, Inc. $13.2 0.72%
Golden Nugget Inc. (fka Landry's) $12.6 0.69%
Neustar, Inc. $11.9 0.65%
Top Ten Industries* Market Value % of AUM
Electronics/Electrical $229.2 12.59%
Health Care $196.7 10.80%
Business Equipment & Services $179.2 9.84%
Telecommunications $140.1 7.70%
Diversified Insurance $97.4 5.35%
Chemicals & Plastics $82.1 4.51%
Retailers (Except Food & Drug) $81.8 4.49%
Lodging & Casinos $80.8 4.44%
Automotive $74.0 4.07%
Containers & Glass Products $73.4 4.03%
See Explanatory Notes Section for footnotes and disclosures.
Allocations may not add to 100% due to rounding.
*Industry allocation is tracked using S&P Industries.
12

For financial professional or qualified institutional investor use only. Not for inspection by, distribution or quotation to, the general public.
Pasadena Fire and Police Ret. System
Voya In The News
Thought Leadership
Voya Financial to Sell Closed Block Variable Annuity and Fixed and Fixed Indexed Annuities Businesses
Voya Financial, Inc. (NYSE: VOYA), announced on December 21, 2017, that it will divest substantially all of its Closed Block Variable Annuity (CBVA) segment andits individual fixed and fixed indexed annuity business through an agreement with a consortium of investors led by affiliates of Apollo Global Management, LLC(together with its consolidated subsidiaries, “Apollo”) (NYSE: APO), Crestview Partners (“Crestview”) and Reverence Capital Partners (“Reverence”). In addition tosignificantly reducing market and insurance risk, the agreement will enable Voya to focus on its higher-growth, higher-return, capital-light Retirement, InvestmentManagement and Employee Benefits businesses. Read more at: http://corporate.voya.com/newsroom/news-releases
Three-peat! Voya Investment Management Named to Pensions & Investments Magazine’s “Best Places to Work in Money Management” Listfor the Third Consecutive Year
NEW YORK, Dec. 11, 2017 /Business Wire/ -- Voya Investment Management, the asset management business of Voya Financial, Inc. (NYSE:VOYA), announcedtoday it has been named to Pensions & Investmentsmagazine’s 2017 “Best Places to Work in Money Management” list. Voya ranked third in the category of firm’sthat have between 500 and 999 employees. This is the third consecutive year that Voya has been named to the list. http://corporate.voya.com/newsroom/news-releases
2018 outlook pieces from our MASS and Fixed Income Investment teams:
MASS Capital Market Assumptions for 2018
2018 Fixed Income Outlook: It's Quiet...Is It Too Quiet?https://investments.voya.com/Institutional/Research-Insights/index.htm
Voya IM Blog provides regular access to our most compelling insights across
fixed income, senior loans, equity and multi-asset strategies and solutionshttps://investments.voya.com/Institutional/Research-Insights/Blog
► Two Reasons Why Investors Should Stop Worrying about Credit Spread
Narrowing and Love the Curve Flattening (For Now)
► High Yield Volatility: Opportunity to Buy or a Symptom of Broader Risk?
► Tax Reform on the Horizon? How Current Proposals Could Impact CreditMarkets
If you would like to receive any of our thought leadership, please contact yourclient service representative or visit our website: www.voyainvestments.com
Personnel Update
Additions
► Christina Giannini: VP, Portfolio Analyst – Small Cap
► Donald Schatz: VP, Fixed Income Client Portfolio Manager
Departures
► Kevin Kuhner: SVP, Institutional Client Advisor
► Thomas Schreier: MD, Chief Technology Officer
Business Highlights - Quarter Ending Dec 31, 2017
13
Appendix
For financial professional or qualified institutional investor use only. Not for inspection by, distribution or quotation to, the general public.
Pasadena Fire and Police Ret. System
.............................................................................................. 15Portfolio: Voya Senior Loan Trust
........................................................................................Holdings 15
.............................................................................................. 35Explanatory Notes
14

Holdings Report
Quarter Ending December 31, 2017
For financial professional or qualified institutional investor use only. Not for inspection by, distribution or quotation to, the general public.
Pasadena Fire and Police Ret. System Senior Loan
Borrower LoanX ID Tranche Market Value % Portfolio Maturity Spread %
S&P
Rating PriceIndustry (S&P)
Aerospace & Defense
Maxar Technologies Ltd. (f/k/a MacDonald, Dettwiler and Associates Ltd. a/k/a LX166203 Term Loan B $8,011,613 0.44% 10/05/2024 2.75 BB 100.65Aerospace & Defense
Avolon Holdings Limited LX158981 TL B-2 $5,564,427 0.30% 4/03/2022 2.25 BBB- 99.39Aerospace & Defense
Transdigm, Inc. LX169653 Incremental Term Loan F $4,441,767 0.24% 6/09/2023 2.75 B+ 100.29Aerospace & Defense
Transdigm, Inc. LX168124 Term Loan G $4,253,869 0.23% 8/15/2024 3.00 B+ 100.59Aerospace & Defense
GEO LX160943 Term Loan B $970,989 0.05% 3/21/2024 2.25 BB+ 100.34Aerospace & Defense
$23,242,665 1.26%
Automotive
Gates Global LLC LX169689 USD TL $8,827,710 0.48% 3/30/2024 3.00 B+ 100.63Automotive
Dynacast International LLC LX144577 2017 First Lien Term Loan $5,918,726 0.32% 1/28/2022 3.25 B 100.69Automotive
Caliber Collision LX159380 First Lien Term Loan $5,902,504 0.32% 1/31/2024 3.00 B+ 100.75Automotive
Federal-Mogul Corporation LX136189 Term Loan C $5,717,346 0.31% 4/15/2021 3.75 B- 100.86Automotive
Lumileds LX161397 Term Loan B $5,514,569 0.30% 6/30/2024 4.50 B+ 100.79Automotive
Truck Hero, Inc. LX163494 Upsized First Lien Term Loan $4,882,813 0.27% 4/21/2024 4.00 B 100.15Automotive
Superior Industries International, Inc. LX164512 Term Loan B $4,555,674 0.25% 5/22/2024 4.50 B 100.94Automotive
Key Safety Systems, Inc. LX138594 Upsized First Lien Term Loan $4,242,720 0.23% 8/29/2021 4.50 B+ 100.38Automotive
Dealer Tire, LLC LX170076 Term Loan B $3,967,170 0.22% 12/22/2021 3.25 B 101.06Automotive
TI Group Automotive Systems, L.L.C. LX145315 Upsized USD Term loan B $3,941,557 0.21% 6/30/2022 2.75 BB- 100.72Automotive
KAR Auction Services, Inc. LX164715 Term Loan B-5 $3,857,211 0.21% 3/09/2023 2.50 BB- 100.69Automotive
Service King LX148738 2017 Term Loan B $3,465,971 0.19% 8/18/2021 2.75 B 100.06Automotive
American Axle & Manufacturing, Inc. LX161296 Term Loan B $3,026,964 0.16% 4/06/2024 2.25 BB 100.35Automotive
Belron S.A. LX169049 TL B USD $2,785,134 0.15% 10/27/2024 2.50 BB 101.09Automotive
NN, Inc. LX155280 Upsized Term Loan B $2,319,905 0.13% 10/19/2022 3.75 B+ 100.66Automotive
BBB Industries US Holdings, Inc. LX141345 First Lien Term Loan $1,890,186 0.10% 11/03/2021 4.50 B 101.31Automotive
NN, Inc. LX162054 IncrementalTerm Loan $1,837,111 0.10% 4/01/2021 3.25 B+ 100.72Automotive
15

Holdings Report
Quarter Ending December 31, 2017
For financial professional or qualified institutional investor use only. Not for inspection by, distribution or quotation to, the general public.
Pasadena Fire and Police Ret. System Senior Loan
Borrower LoanX ID Tranche Market Value % Portfolio Maturity Spread %
S&P
Rating PriceIndustry (S&P)
Automotive
Truck Hero, Inc. LX163496 Second Lien Term Loan $1,395,388 0.08% 4/21/2025 8.25 CCC+ 100.75Automotive
$74,048,657 4.02%
Beverage & Tobacco
Jacobs Douwe Egberts LX163471 Term B-4 USD Loans $2,443,478 0.13% 7/02/2022 2.25 BB 100.47Beverage & Tobacco
Refresco Group N.V. LX167716 TL B USD $1,307,313 0.07% 9/29/2024 2.75 BB- 100.56Beverage & Tobacco
Refresco Group N.V. LX170104 TL B USD $1,300,780 0.07% 2/15/2025 3.25 BB- 100.06Beverage & Tobacco
$5,051,571 0.27%
Building & Development
HD Supply Waterworks, Ltd. LX167192 Term Loan B $7,022,275 0.38% 7/31/2024 3.00 BBB- 100.75Building & Development
Forterra Finance, LLC LX162521 First Lien Term Loan $7,001,201 0.38% 10/31/2023 3.00 B- 93.88Building & Development
Wilsonart LLC LX167947 Term Loan B $6,926,234 0.38% 12/19/2023 3.25 B+ 100.70Building & Development
American Builders & Contractors Supply Co., Inc. LX162385 Term Loan B $3,788,625 0.21% 10/31/2023 2.50 BB+ 100.57Building & Development
Quikrete Holdings LX155959 Term Loan B $3,472,764 0.19% 11/15/2023 2.75 BB- 100.33Building & Development
WernerCo LX165605 Incremental Term Loan B $3,356,700 0.18% 7/24/2024 4.00 B 100.50Building & Development
Ply Gem Industries, Inc. LX135000 Term Loan $3,333,517 0.18% 2/01/2021 3.00 BB 100.97Building & Development
Doosan Bobcat, Inc. LX164094 Term Loan B $2,936,270 0.16% 5/10/2024 2.50 BB- 100.65Building & Development
Zekelman Industries, Inc. (fka JMC Steel) LX152890 Term Loan B $2,182,822 0.12% 6/14/2021 2.75 BB- 100.73Building & Development
Henry Company LLC LX154802 Term Loan B $1,900,594 0.10% 10/05/2023 4.50 B 101.04Building & Development
$41,921,002 2.28%
Business Equipment & Services
Misys (Finastra) LX163228 TL B USD $12,718,429 0.69% 6/13/2024 3.50 B 100.40Business Equipment & Services
Neustar, Inc. LX160398 Term Loan B-2 $11,075,465 0.60% 8/08/2024 3.75 BB 101.15Business Equipment & Services
AlixPartners, LLP LX161956 Term Loan B $10,490,728 0.57% 4/04/2024 2.75 B+ 100.67Business Equipment & Services
West Corp LX168759 Term Loan $9,039,354 0.49% 10/15/2024 4.00 B 100.49Business Equipment & Services
16

Holdings Report
Quarter Ending December 31, 2017
For financial professional or qualified institutional investor use only. Not for inspection by, distribution or quotation to, the general public.
Pasadena Fire and Police Ret. System Senior Loan
Borrower LoanX ID Tranche Market Value % Portfolio Maturity Spread %
S&P
Rating PriceIndustry (S&P)
Business Equipment & Services
KinderCare Education, LLC (fka Knowledge Universe Education, LLC) LX163029 Upsized First Lien Term Loan $8,985,599 0.49% 8/13/2022 3.75 B- 100.50Business Equipment & Services
Red Ventures LX168835 1st Lien $8,428,371 0.46% 11/08/2024 4.00 B+ 100.11Business Equipment & Services
Cision LX167639 US Term Loan $6,666,948 0.36% 6/16/2023 4.25 B 101.34Business Equipment & Services
First Data Corporation LX169513 Term Loan 2024 $6,251,724 0.34% 4/26/2024 2.25 BB 100.18Business Equipment & Services
Coinmach Service Corp. LX165477 First Lien Term Loan $6,230,487 0.34% 11/14/2022 3.75 B 100.83Business Equipment & Services
Cyxtera Technologies, Inc. LX161399 First Lien Term Loan $6,166,674 0.34% 5/01/2024 3.00 B+ 100.78Business Equipment & Services
Staples, Inc. LX166934 TL-B $5,497,737 0.30% 9/12/2024 4.00 B+ 98.04Business Equipment & Services
Peak 10, Inc. LX167187 1st Lien $5,309,533 0.29% 8/01/2024 3.50 B 100.34Business Equipment & Services
Endurance International LX164875 Term Loan B $5,081,229 0.28% 2/09/2023 4.00 B+ 100.80Business Equipment & Services
GreenSky LX168222 Term Loan B $5,023,691 0.27% 8/15/2024 4.00 B+ 100.63Business Equipment & Services
Duravant LLC LX166937 First Lien Term Loan $4,632,564 0.25% 7/31/2024 3.25 B 100.19Business Equipment & Services
iQor LX135318 1st Lien Term Loan $4,445,903 0.24% 4/01/2021 5.00 B 99.75Business Equipment & Services
Ascend Learning LLC LX166009 Term Loan B $4,325,371 0.23% 7/12/2024 3.00 B+ 100.73Business Equipment & Services
Solera Management LX151194 USD Incremental B Term Loan $3,684,955 0.20% 3/03/2023 3.25 B 100.75Business Equipment & Services
EVO Payments LX156806 1L $3,598,308 0.20% 12/22/2023 5.00 B 100.71Business Equipment & Services
Procera Networks, Inc. LX167941 Term Loan B $3,547,347 0.19% 9/21/2022 5.75 B- 96.38Business Equipment & Services
SurveyMonkey.com, LLC LX162494 Term Loan $3,458,496 0.19% 4/12/2024 4.50 B- 100.75Business Equipment & Services
Advantage Sales & Marketing, Inc. LX138509 Second Lien Term Loan $3,029,375 0.16% 7/25/2022 6.50 CCC+ 92.50Business Equipment & Services
Clarivate (f/k/a Thomson Reuters Intellectual Property & Science) LX169575 1st Lien Term Loan $2,993,011 0.16% 10/03/2023 3.25 BB- 100.69Business Equipment & Services
Garda World Security Corp. LX162709 US Term Facility $2,938,152 0.16% 5/24/2024 3.50 NR 100.63Business Equipment & Services
Paysafe LX169667 TL B USD $2,834,115 0.15% 12/15/2024 3.50 B 99.97Business Equipment & Services
Peak 10, Inc. LX167188 2nd lien $2,777,500 0.15% 8/01/2025 7.25 CCC+ 101.00Business Equipment & Services
Big Ass Fans, LLC LX169247 First Lien Term Loan $2,771,501 0.15% 5/15/2024 4.25 B 100.42Business Equipment & Services
Legal Shield LX129960 1L Additional Add On $2,595,280 0.14% 7/01/2019 5.25 BB- 100.25Business Equipment & Services
Research Now LX169473 First Lien Term Loan $2,569,115 0.14% 12/11/2024 5.50 B+ 96.04Business Equipment & Services
iQor LX135320 2nd Lien Term Loan $2,476,843 0.13% 4/01/2022 8.75 CCC+ 97.00Business Equipment & Services
17

Holdings Report
Quarter Ending December 31, 2017
For financial professional or qualified institutional investor use only. Not for inspection by, distribution or quotation to, the general public.
Pasadena Fire and Police Ret. System Senior Loan
Borrower LoanX ID Tranche Market Value % Portfolio Maturity Spread %
S&P
Rating PriceIndustry (S&P)
Business Equipment & Services
MCS AMS Sub-Holdings LLC LX164054 1L Term Loan $2,385,701 0.13% 5/30/2024 4.75 B+ 101.00Business Equipment & Services
Learning Care Group LX136648 Term loan $2,163,734 0.12% 5/05/2021 4.00 B+ 100.50Business Equipment & Services
Document Technologies, Inc. LX154767 Term Loan B $1,966,770 0.11% 10/01/2023 5.25 B 99.58Business Equipment & Services
Element Materials Technology LX164896 USD TL $1,854,281 0.10% 6/28/2024 3.50 B 100.67Business Equipment & Services
LegalZoom LX169527 1l Term Loan $1,830,413 0.10% 11/16/2024 4.50 B 99.75Business Equipment & Services
Misys (Finastra) LX163231 TL 2nd lien USD $1,659,281 0.09% 6/13/2025 7.25 CCC+ 100.56Business Equipment & Services
Red Ventures LX168836 2nd Lien $1,358,292 0.07% 11/10/2025 8.00 B- 100.19Business Equipment & Services
TriMark USA LX168447 First Lien Term Loan $1,011,388 0.05% 9/15/2024 3.50 B 100.88Business Equipment & Services
Legal Shield LX129961 Second Lien Term Loan $1,000,000 0.05% 7/01/2020 9.00 B- 100.00Business Equipment & Services
Neustar, Inc. LX160399 2nd Lien Term Loan $837,031 0.05% 8/08/2025 8.00 B- 101.46Business Equipment & Services
Wash Multi-Family Services LX144232 Upsized USD First Lien Term Loan $768,666 0.04% 5/14/2022 3.25 B 100.16Business Equipment & Services
United Site Services LX168054 First Lien Term Loan $704,172 0.04% 8/25/2024 3.75 B+ 100.79Business Equipment & Services
Vistra Group Ltd LX146617 USD First Lien $638,155 0.03% 10/26/2022 3.25 B 100.44Business Equipment & Services
Duravant LLC LX167183 DD First Lien $602,233 0.03% 7/31/2024 3.25 B 100.19Business Equipment & Services
Duravant LLC LX166939 Second Lien Term Loan $490,065 0.03% 7/31/2025 7.25 CCC+ 100.63Business Equipment & Services
Wash Multi-Family Services LX144736 CAD First Lien Term Loan $134,616 0.01% 5/26/2022 3.25 B 100.16Business Equipment & Services
Duravant LLC LX167184 DD Second Lien $58,341 0.00% 7/31/2025 7.25 CCC+ 100.63Business Equipment & Services
TriMark USA LX168448 Delayed Draw First Lien Term Loan $45,264 0.00% 9/15/2024 3.50 B 100.88Business Equipment & Services
$179,152,209 9.73%
Cable & Satellite Television
RCN Grande Cable LX157714 TLB $10,965,292 0.60% 2/01/2024 3.00 B 99.38Cable & Satellite Television
Wideopenwest Finance, LLC LX165396 2016 TLB $9,800,552 0.53% 8/18/2023 3.25 B 98.97Cable & Satellite Television
Suddenlink Communications (aka Cequel Communications, LLC) LX162756 New Term Loan B $7,678,450 0.42% 7/25/2025 2.25 BB 99.80Cable & Satellite Television
Virgin Media Investment Holdings Limited LX169525 TL K USD $7,354,181 0.40% 1/30/2026 2.50 BB- 100.13Cable & Satellite Television
UPC Financing Partnership LX169045 USD TLB AR $5,503,955 0.30% 1/19/2026 2.50 BB 100.07Cable & Satellite Television
18

Holdings Report
Quarter Ending December 31, 2017
For financial professional or qualified institutional investor use only. Not for inspection by, distribution or quotation to, the general public.
Pasadena Fire and Police Ret. System Senior Loan
Borrower LoanX ID Tranche Market Value % Portfolio Maturity Spread %
S&P
Rating PriceIndustry (S&P)
Cable & Satellite Television
Charter Communications Operating, LLC LX158178 TLI $2,138,916 0.12% 1/15/2024 2.25 BBB- 100.21Cable & Satellite Television
Telesat Canada LX159275 Term Loan B $2,087,087 0.11% 11/17/2023 3.00 BB- 100.64Cable & Satellite Television
WaveDivision Holdings LLC LX125117 TLB 2/17 $1,653,410 0.09% 10/15/2019 2.75 BB- 100.19Cable & Satellite Television
Charter Communications Operating, LLC LX170173 TLB $1,467,747 0.08% 4/01/2025 2.00 BBB- 100.19Cable & Satellite Television
$48,649,589 2.64%
Chemicals & Plastics
Avantor Inc LX168603 Dollar Term Loan $10,274,288 0.56% 11/21/2024 4.00 B 100.58Chemicals & Plastics
PQ Corporation LX167800 B1 USD Term Loan $9,055,917 0.49% 11/04/2022 3.25 BB- 100.95Chemicals & Plastics
Ineos US Finance LLC LX169195 TLB USD '24 $6,215,928 0.34% 3/31/2024 2.00 BB+ 100.26Chemicals & Plastics
Diversey (a.k.a Diamond (BC) B.V) LX167193 USD Term Loan $5,562,576 0.30% 9/06/2024 3.00 B 100.41Chemicals & Plastics
Allnex S.a.r.l. (Monarch) LX152754 Term B-2 new $4,430,354 0.24% 9/13/2023 3.25 B 100.81Chemicals & Plastics
H.B. Fuller Company LX168918 Term Loan $4,194,250 0.23% 10/20/2024 2.25 BB+ 100.47Chemicals & Plastics
Orion Engineered Carbons LX169231 Term loan B USD $4,037,894 0.22% 7/25/2024 2.50 BB 100.44Chemicals & Plastics
Atotech LX159041 TL B-1 USD $3,987,411 0.22% 1/31/2024 3.00 B+ 100.77Chemicals & Plastics
Solenis International, L.P. LX138119 USD First Lien Term Loan $3,627,198 0.20% 7/31/2021 3.25 B- 100.55Chemicals & Plastics
Kleopatra Holdings 2 S.C.A (Kloeckner) LX165635 USD TL $3,533,253 0.19% 6/30/2022 4.25 B 101.20Chemicals & Plastics
Allnex S.a.r.l. (Monarch) LX152923 Term B-3 new $3,337,786 0.18% 9/13/2023 3.25 B 100.81Chemicals & Plastics
Tronox Finance LLC LX168581 B1 Term Loan $3,243,339 0.18% 9/22/2024 3.00 BB- 100.73Chemicals & Plastics
Emerald Performance Materials LLC LX139053 First Lien Term Loan $3,021,251 0.16% 8/01/2021 3.50 B 100.90Chemicals & Plastics
Univar Inc. LX169609 Term B3 Loan $2,984,935 0.16% 7/01/2024 2.50 BB 100.50Chemicals & Plastics
MacDermid, Inc. (a.k.a Platform Specialty Products Corp) LX162202 USD TL B6 $2,945,464 0.16% 6/07/2023 3.00 BB- 100.68Chemicals & Plastics
KMG Chemicals, Inc LX163508 Term Loan $2,756,226 0.15% 6/15/2024 4.25 BB 100.50Chemicals & Plastics
Kraton Polymers LLC LX167831 USD Term Loan $2,687,376 0.15% 1/06/2022 3.00 BB- 101.16Chemicals & Plastics
Venator Materials LX166126 Term Loan $2,134,924 0.12% 8/08/2024 3.00 BB 100.72Chemicals & Plastics
Tronox Finance LLC LX168798 B2 Term Loan $1,405,447 0.08% 9/22/2024 3.00 BB- 100.73Chemicals & Plastics
19

Holdings Report
Quarter Ending December 31, 2017
For financial professional or qualified institutional investor use only. Not for inspection by, distribution or quotation to, the general public.
Pasadena Fire and Police Ret. System Senior Loan
Borrower LoanX ID Tranche Market Value % Portfolio Maturity Spread %
S&P
Rating PriceIndustry (S&P)
Chemicals & Plastics
Cypress Performance Group LX169170 First Lien Term Loan $1,095,905 0.06% 10/25/2024 3.25 B 100.54Chemicals & Plastics
Trinseo Materials Operating S.C.A LX167948 Term Loan B $800,819 0.04% 9/06/2024 2.50 BB+ 100.98Chemicals & Plastics
Flint Group Holdings S.A.R.L. LX137290 2nd Lien USD $453,636 0.02% 9/05/2022 7.25 CCC+ 77.00Chemicals & Plastics
Emerald Performance Materials LLC LX139054 Second Lien Term Loan $275,179 0.01% 8/01/2022 7.75 B- 100.04Chemicals & Plastics
Styrolution Group GmbH LX169499 New USD facility $0 0.00% 3/30/2024 2.00 BB+ 100.26Chemicals & Plastics
$82,061,355 4.46%
Clothing/Textiles
Varsity Brands (fka Herff Jones, Inc.) LX169970 Senior Secured First Lien $5,985,129 0.33% 12/11/2024 3.50 B 100.68Clothing/Textiles
Vince, LLC LX133419 Term Loan $341,216 0.02% 11/27/2019 7.00 B 87.50Clothing/Textiles
$6,326,345 0.34%
Conglomerates
ServiceMaster Company LX156211 Term Loan B $3,229,936 0.18% 11/08/2023 2.50 BB+ 100.54Conglomerates
$3,229,936 0.18%
Containers & Glass Products
Reynolds Group Holdings Inc LX159202 USD Term Loan $9,984,445 0.54% 2/04/2023 2.75 B+ 100.60Containers & Glass Products
Milacron LLC LX159514 Term Loan $7,694,344 0.42% 9/28/2023 2.75 B 100.19Containers & Glass Products
Novolex (aka Flex Acquisition Company, Inc) LX157924 First Lien Term Loan $7,253,831 0.39% 12/29/2023 3.00 B 100.67Containers & Glass Products
Berlin Packaging, LLC LX164599 1L TL $6,178,158 0.34% 10/01/2021 3.25 B 100.74Containers & Glass Products
SIG Combibloc Group AG LX143112 USD TL $5,844,337 0.32% 3/10/2022 3.00 B+ 100.59Containers & Glass Products
ProAmpac PG Borrower LLC LX156414 Incremental 1L TL $5,544,034 0.30% 11/18/2023 3.50 B 100.97Containers & Glass Products
Consolidated Container Company LLC LX163510 Term Loan $5,300,813 0.29% 5/22/2024 3.50 B+ 100.65Containers & Glass Products
Ring Container Technologies, LLC LX168799 First Lien Term Loan $4,509,047 0.24% 10/31/2024 2.75 B 100.31Containers & Glass Products
Albea S.A LX162334 USD TLB $4,315,937 0.23% 4/22/2024 3.75 B 100.88Containers & Glass Products
Berry Plastics Corporation LX165834 Term M Loan $4,213,817 0.23% 10/01/2022 2.25 BBB- 100.50Containers & Glass Products
20
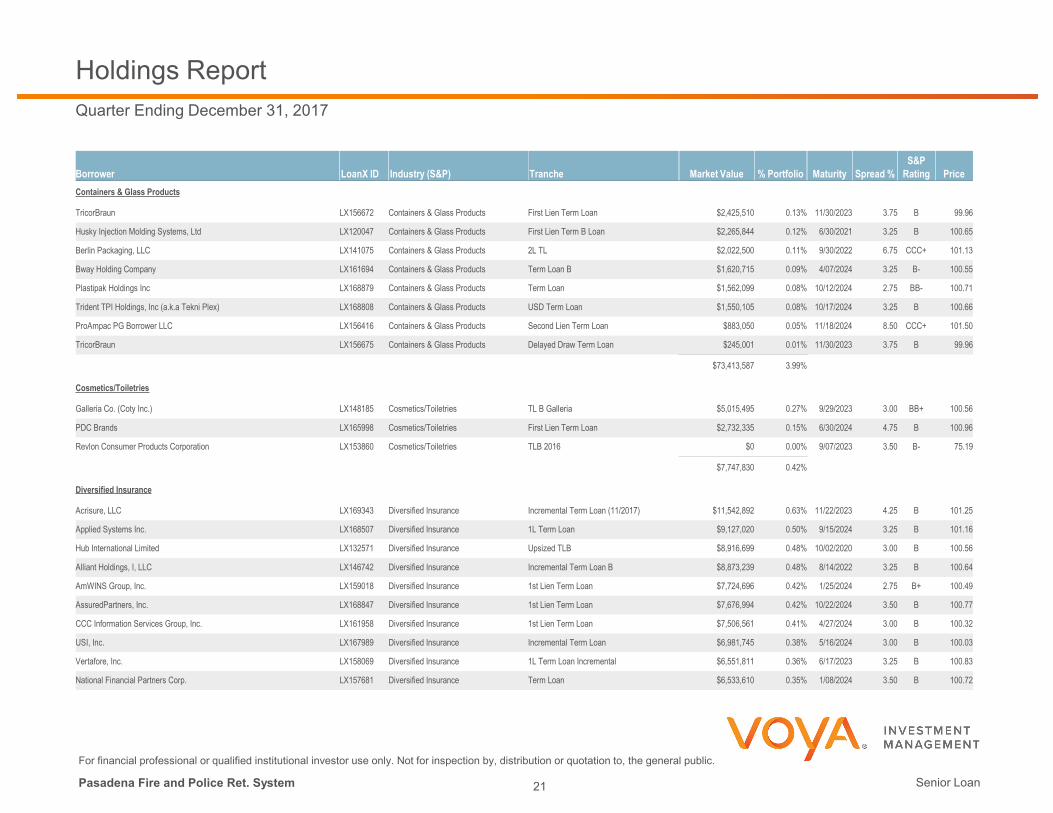
Holdings Report
Quarter Ending December 31, 2017
For financial professional or qualified institutional investor use only. Not for inspection by, distribution or quotation to, the general public.
Pasadena Fire and Police Ret. System Senior Loan
Borrower LoanX ID Tranche Market Value % Portfolio Maturity Spread %
S&P
Rating PriceIndustry (S&P)
Containers & Glass Products
TricorBraun LX156672 First Lien Term Loan $2,425,510 0.13% 11/30/2023 3.75 B 99.96Containers & Glass Products
Husky Injection Molding Systems, Ltd LX120047 First Lien Term B Loan $2,265,844 0.12% 6/30/2021 3.25 B 100.65Containers & Glass Products
Berlin Packaging, LLC LX141075 2L TL $2,022,500 0.11% 9/30/2022 6.75 CCC+ 101.13Containers & Glass Products
Bway Holding Company LX161694 Term Loan B $1,620,715 0.09% 4/07/2024 3.25 B- 100.55Containers & Glass Products
Plastipak Holdings Inc LX168879 Term Loan $1,562,099 0.08% 10/12/2024 2.75 BB- 100.71Containers & Glass Products
Trident TPI Holdings, Inc (a.k.a Tekni Plex) LX168808 USD Term Loan $1,550,105 0.08% 10/17/2024 3.25 B 100.66Containers & Glass Products
ProAmpac PG Borrower LLC LX156416 Second Lien Term Loan $883,050 0.05% 11/18/2024 8.50 CCC+ 101.50Containers & Glass Products
TricorBraun LX156675 Delayed Draw Term Loan $245,001 0.01% 11/30/2023 3.75 B 99.96Containers & Glass Products
$73,413,587 3.99%
Cosmetics/Toiletries
Galleria Co. (Coty Inc.) LX148185 TL B Galleria $5,015,495 0.27% 9/29/2023 3.00 BB+ 100.56Cosmetics/Toiletries
PDC Brands LX165998 First Lien Term Loan $2,732,335 0.15% 6/30/2024 4.75 B 100.96Cosmetics/Toiletries
Revlon Consumer Products Corporation LX153860 TLB 2016 $0 0.00% 9/07/2023 3.50 B- 75.19Cosmetics/Toiletries
$7,747,830 0.42%
Diversified Insurance
Acrisure, LLC LX169343 Incremental Term Loan (11/2017) $11,542,892 0.63% 11/22/2023 4.25 B 101.25Diversified Insurance
Applied Systems Inc. LX168507 1L Term Loan $9,127,020 0.50% 9/15/2024 3.25 B 101.16Diversified Insurance
Hub International Limited LX132571 Upsized TLB $8,916,699 0.48% 10/02/2020 3.00 B 100.56Diversified Insurance
Alliant Holdings, I, LLC LX146742 Incremental Term Loan B $8,873,239 0.48% 8/14/2022 3.25 B 100.64Diversified Insurance
AmWINS Group, Inc. LX159018 1st Lien Term Loan $7,724,696 0.42% 1/25/2024 2.75 B+ 100.49Diversified Insurance
AssuredPartners, Inc. LX168847 1st Lien Term Loan $7,676,994 0.42% 10/22/2024 3.50 B 100.77Diversified Insurance
CCC Information Services Group, Inc. LX161958 1st Lien Term Loan $7,506,561 0.41% 4/27/2024 3.00 B 100.32Diversified Insurance
USI, Inc. LX167989 Incremental Term Loan $6,981,745 0.38% 5/16/2024 3.00 B 100.03Diversified Insurance
Vertafore, Inc. LX158069 1L Term Loan Incremental $6,551,811 0.36% 6/17/2023 3.25 B 100.83Diversified Insurance
National Financial Partners Corp. LX157681 Term Loan $6,533,610 0.35% 1/08/2024 3.50 B 100.72Diversified Insurance
21

Holdings Report
Quarter Ending December 31, 2017
For financial professional or qualified institutional investor use only. Not for inspection by, distribution or quotation to, the general public.
Pasadena Fire and Police Ret. System Senior Loan
Borrower LoanX ID Tranche Market Value % Portfolio Maturity Spread %
S&P
Rating PriceIndustry (S&P)
Diversified Insurance
Sedgwick Holdings, Inc. LX170338 Incremental 1st Lien TL (Dec '17) $6,509,750 0.35% 2/28/2021 2.75 B 100.15Diversified Insurance
Sedgwick Holdings, Inc. LX135266 1st Lien Term Loan $4,645,804 0.25% 2/28/2021 2.75 B 100.04Diversified Insurance
Sedgwick Holdings, Inc. LX135270 2nd Lien Term Loan $2,716,875 0.15% 2/28/2022 5.75 CCC+ 100.63Diversified Insurance
Applied Systems Inc. LX168509 2L Term Loan $1,037,188 0.06% 9/15/2025 7.00 CCC 103.72Diversified Insurance
Sedgwick Holdings, Inc. LX141423 Incremental 2nd Lien TL $503,594 0.03% 2/28/2022 5.75 CCC+ 100.72Diversified Insurance
CCC Information Services Group, Inc. LX161960 2nd Lien Term Loan $307,375 0.02% 4/27/2025 6.75 CCC 102.46Diversified Insurance
Sedgwick Holdings, Inc. LX170339 Incremental 2nd Lien TL (Dec '17) $201,438 0.01% 2/28/2022 5.75 CCC+ 100.72Diversified Insurance
$97,357,289 5.29%
Drugs
Endo LLC LX163026 Term B $10,627,041 0.58% 4/24/2024 4.25 BB- 100.76Drugs
Amneal Pharmaceuticals LLC LX133102 Term B $10,202,483 0.55% 11/01/2019 3.50 BB- 100.60Drugs
Horizon Pharma, Inc. LX169086 Term B $6,448,069 0.35% 3/29/2024 3.25 BB- 100.54Drugs
Prestige Brands LX159002 B-4 $5,564,963 0.30% 1/26/2024 2.75 BB- 100.76Drugs
Alvogen Pharma U.S. LX143747 Upsized Term B $4,305,124 0.23% 4/02/2022 5.00 B 99.38Drugs
$37,147,680 2.02%
Ecological Services & Equipment
Advanced Disposal Services, Inc. (fka ADS Waste Holdings, Inc.) LX155961 Term Loan B $9,475,167 0.51% 11/10/2023 2.25 BB+ 100.41Ecological Services & Equipment
Waste Industries USA, Inc. LX168461 Term Loan B $5,688,348 0.31% 9/20/2024 3.00 B 100.77Ecological Services & Equipment
$15,163,515 0.82%
Electronics/Electrical
BMC Software, Inc. LX169961 U.S. Term Loan $13,492,309 0.73% 9/10/2022 3.25 NR 100.18Electronics/Electrical
Compuware Corporation LX159760 Incremental Term Loan $10,664,156 0.58% 12/15/2021 4.25 B 101.28Electronics/Electrical
Kronos Incorporated LX163804 First Lien Term Loan $10,468,657 0.57% 11/01/2023 3.50 B 100.78Electronics/Electrical
Dell International LLC LX169099 Term Loan B $10,231,547 0.56% 9/07/2023 2.00 BBB- 100.06Electronics/Electrical
22

Holdings Report
Quarter Ending December 31, 2017
For financial professional or qualified institutional investor use only. Not for inspection by, distribution or quotation to, the general public.
Pasadena Fire and Police Ret. System Senior Loan
Borrower LoanX ID Tranche Market Value % Portfolio Maturity Spread %
S&P
Rating PriceIndustry (S&P)
Electronics/Electrical
Hyland Software, Inc. LX159763 Incremental 1st Lien Term Loan $10,173,279 0.55% 7/01/2022 3.25 B 100.78Electronics/Electrical
SolarWinds Holdings, Inc. LX159694 Term Loan $9,616,494 0.52% 2/05/2023 3.50 B+ 100.49Electronics/Electrical
Internet Brands, Inc. LX168014 Term Loan $8,866,772 0.48% 9/13/2024 3.75 B 100.38Electronics/Electrical
McAfee, LLC LX168582 USD 1st Len Term Loan $8,615,121 0.47% 9/27/2024 4.50 B 99.81Electronics/Electrical
Rackspace Hosting LX169594 Upsized Term Loan B $8,599,752 0.47% 11/03/2023 3.00 BB- 100.11Electronics/Electrical
Veritas Technologies Corporation LX165578 USD Term Loan B-1 $8,555,096 0.46% 1/27/2023 4.50 B+ 100.41Electronics/Electrical
Epicor Software Corporation LX144606 08/17 Incremental Term Loan B $8,499,052 0.46% 6/01/2022 3.75 B- 100.30Electronics/Electrical
Micro Focus LX163339 Seattle Term Loan $8,354,722 0.45% 6/21/2024 2.75 BB- 100.39Electronics/Electrical
Informatica Corporation LX144702 Term Loan B $8,131,167 0.44% 8/05/2022 3.50 B 100.40Electronics/Electrical
Western Digital LX169412 USD Term Loan B-3 $7,686,063 0.42% 4/29/2023 2.00 BBB- 100.52Electronics/Electrical
Go Daddy Operating Company, LLC LX169639 Term Loan $7,484,475 0.41% 2/15/2024 2.25 NR 100.40Electronics/Electrical
Dell Software Group LX169547 Term Loan B $7,466,517 0.41% 10/31/2022 5.50 B 101.74Electronics/Electrical
JDA Software (f.k.a RedPrairie Corporation) LX155106 Term Loan B $7,009,117 0.38% 10/12/2023 3.00 B 100.53Electronics/Electrical
Avast Software B.V. LX169502 Term Loan USD $6,718,812 0.37% 9/30/2023 2.75 BB- 100.80Electronics/Electrical
Optiv Security, Inc. (f.k.a. Accuvant Inc.) LX158907 1st Lien Term Loan $5,625,506 0.31% 2/01/2024 3.25 B- 94.08Electronics/Electrical
Aptean Holdings, Inc. LX166079 1st Lien Term Loan $5,259,439 0.29% 12/22/2022 4.25 B 100.92Electronics/Electrical
Greeneden U.S. Holdings II, L.L.C. LX166221 USD Term Loan $5,183,982 0.28% 12/01/2023 3.75 B- 100.70Electronics/Electrical
M/A-COM Technology Solutions Holdings, Inc. LX163919 Term Loan B $4,903,277 0.27% 5/15/2024 2.25 B+ 99.98Electronics/Electrical
Riverbed Technology, Inc. LX152765 1st Lien Term Loan $4,403,320 0.24% 4/24/2022 3.25 B+ 98.52Electronics/Electrical
Infor (US), Inc. LX159959 USD Term Loan B $3,802,527 0.21% 2/01/2022 2.75 B 100.38Electronics/Electrical
ON Semiconductor Corporation LX169532 Term Loan B $3,666,471 0.20% 3/31/2023 2.00 BB 100.59Electronics/Electrical
ASG Technologies Group, Inc. LX167158 Term Loan $3,619,143 0.20% 7/31/2024 4.75 B 100.88Electronics/Electrical
TTM Technologies LX168563 Term Loan B $3,217,988 0.17% 9/28/2024 2.50 BBB- 100.34Electronics/Electrical
Eze Castle Software, Inc. LX160375 1st Lien Term Loan $3,095,761 0.17% 4/04/2020 3.00 B 100.58Electronics/Electrical
Linxens LX160243 TL B-3 USD $3,095,586 0.17% 10/14/2022 3.50 B 100.50Electronics/Electrical
Skillsoft Corp. LX136501 First Lien Term Loan $2,842,599 0.15% 4/28/2021 4.75 B- 96.48Electronics/Electrical
23

Holdings Report
Quarter Ending December 31, 2017
For financial professional or qualified institutional investor use only. Not for inspection by, distribution or quotation to, the general public.
Pasadena Fire and Police Ret. System Senior Loan
Borrower LoanX ID Tranche Market Value % Portfolio Maturity Spread %
S&P
Rating PriceIndustry (S&P)
Electronics/Electrical
Xperi Corporation (f/k/a Tessera Technologies) LX155535 Term Loan B $2,472,711 0.13% 12/01/2023 3.25 BB- 100.92Electronics/Electrical
MaxLinear LX162735 Term Loan B $2,458,506 0.13% 5/12/2024 2.50 BB- 100.63Electronics/Electrical
Navico Inc. LX161442 First Lien Term Loan $2,400,352 0.13% 3/31/2023 5.75 B 100.88Electronics/Electrical
ECi Software Solutions LX168646 1st Lien Term Loan $2,370,683 0.13% 9/29/2024 4.25 B 101.06Electronics/Electrical
Internet Brands, Inc. LX168015 2nd Lien Term Loan $2,270,503 0.12% 9/15/2025 7.50 CCC+ 100.69Electronics/Electrical
Rovi Solutions Corporation LX137932 Term Loan B $1,963,767 0.11% 7/02/2021 2.50 BB+ 100.75Electronics/Electrical
Sabre Inc. LX168045 Term B Facility $1,550,276 0.08% 2/22/2024 2.25 BB- 100.60Electronics/Electrical
ABC Financial Inc. LX170018 1st Lien Term Loan $1,373,425 0.07% 12/20/2024 4.25 B 100.25Electronics/Electrical
McAfee, LLC LX168583 2nd Lien Term Loan $1,311,525 0.07% 9/27/2025 8.50 B- 100.50Electronics/Electrical
Micro Focus LX162911 MA Finance Co USD Term Loan $1,237,316 0.07% 6/21/2024 2.75 BB- 100.40Electronics/Electrical
Eze Castle Software, Inc. LX136217 2nd Lien Term Loan $451,125 0.02% 4/05/2021 6.50 CCC+ 100.25Electronics/Electrical
$229,208,896 12.45%
Equipment Leasing
Brand Energy & Infrastructure Services, Inc. LX165183 Term Loan $2,110,080 0.11% 6/14/2024 4.25 B 100.51Equipment Leasing
Rent-A-Center, Inc. LX135487 Term Loan B $344,939 0.02% 3/19/2021 3.00 B+ 99.56Equipment Leasing
$2,455,018 0.13%
Equity REITs and REOCs
Capital Automotive L.P. LX161335 1L Term Loan $8,167,884 0.44% 3/25/2024 2.50 B 100.44Equity REITs and REOCs
Capital Automotive L.P. LX161337 2L Term Loan $3,061,999 0.17% 3/24/2025 6.00 CCC+ 102.00Equity REITs and REOCs
ESH Hospitality, Inc. LX159960 TLB $2,786,270 0.15% 8/30/2023 2.25 BB+ 100.41Equity REITs and REOCs
$14,016,152 0.76%
Financial Intermediaries
Duff & Phelps LX169993 1L Term Loan $7,307,862 0.40% 12/05/2024 3.25 B 100.52Financial Intermediaries
First Eagle Investment Management, Inc. LX169078 Term Loan B $7,307,435 0.40% 12/01/2022 3.00 BB+ 101.00Financial Intermediaries
24

Holdings Report
Quarter Ending December 31, 2017
For financial professional or qualified institutional investor use only. Not for inspection by, distribution or quotation to, the general public.
Pasadena Fire and Police Ret. System Senior Loan
Borrower LoanX ID Tranche Market Value % Portfolio Maturity Spread %
S&P
Rating PriceIndustry (S&P)
Financial Intermediaries
LPL Holdings, Inc. LX168615 Term Loan $7,099,922 0.39% 9/23/2024 2.25 BB- 100.38Financial Intermediaries
TaxAct / HD Vest LX169647 Ter Loan B $4,232,676 0.23% 5/22/2024 3.00 BB- 100.56Financial Intermediaries
Duff & Phelps LX168888 1L Term Loan $3,741,625 0.20% 10/05/2024 3.25 B 101.13Financial Intermediaries
Fortress Investment Group LX164476 1L Term Loan $3,012,021 0.16% 7/14/2022 2.75 BB- 101.31Financial Intermediaries
Focus Financial Partners LX164224 1L Term Loan $2,637,951 0.14% 7/03/2024 3.25 B+ 100.94Financial Intermediaries
Edelman Financial Services LX169276 1L Term Loan $1,489,750 0.08% 11/09/2024 4.25 B 101.00Financial Intermediaries
$36,829,241 2.00%
Food Products
NPC International LX161940 First Lien Term Loan $5,979,729 0.32% 4/19/2024 3.50 B 101.00Food Products
Atrium Innovations, Inc. LX135021 New USD 1st Lien TL $5,585,522 0.30% 2/15/2021 3.25 B 100.40Food Products
Hostess LX169576 1L Term Loan $4,714,424 0.26% 8/03/2022 2.25 BB- 100.23Food Products
American Seafoods Group LLC LX167293 Term Loan $4,530,938 0.25% 8/31/2023 3.25 BB- 101.25Food Products
JBS USA, Inc. (FKA Swift) LX159478 Term Loan B $3,729,056 0.20% 10/30/2022 2.50 BB- 98.33Food Products
Atkins Nutritionals Holdings II, Inc. LX162989 1st Lien Term Loan $3,625,205 0.20% 7/08/2024 4.00 BB- 100.81Food Products
Del Monte Foods Consumer Products, Inc. LX133785 1st Lien $2,091,994 0.11% 2/18/2021 3.25 CCC+ 80.50Food Products
Dole Food Company, Inc. LX161900 Term Loan B $2,061,542 0.11% 4/04/2024 2.75 B- 100.37Food Products
CSM Bakery Supplies LX129905 First Lien TL $1,245,037 0.07% 7/03/2020 4.00 B- 98.88Food Products
Del Monte Foods Consumer Products, Inc. LX133786 2nd Lien $940,875 0.05% 8/18/2021 7.25 CCC- 48.25Food Products
NPC International LX161941 Second Lien Term Loan $896,875 0.05% 4/20/2025 7.50 CCC 102.50Food Products
$35,401,195 1.92%
Food Service
Golden Nugget Inc. (fka Landry's) LX168592 Upsized Term Loan $12,598,835 0.68% 10/04/2023 3.25 B+ 100.87Food Service
US Foods, Inc. LX153134 1L Term Loan $5,976,123 0.32% 6/27/2023 2.50 BBB- 100.78Food Service
CEC Entertainment, Inc., LX135145 First Lien TL $3,908,604 0.21% 2/14/2021 3.25 B- 94.55Food Service
25

Holdings Report
Quarter Ending December 31, 2017
For financial professional or qualified institutional investor use only. Not for inspection by, distribution or quotation to, the general public.
Pasadena Fire and Police Ret. System Senior Loan
Borrower LoanX ID Tranche Market Value % Portfolio Maturity Spread %
S&P
Rating PriceIndustry (S&P)
Food Service
Manitowoc Foodservice, Inc. (a.k.a Welbilt Inc) LX150914 Term Loan B $2,114,559 0.11% 3/03/2023 2.75 B+ 101.19Food Service
$24,598,120 1.34%
Food/Drug Retailers
Albertsons LLC LX164596 TL-B4 $8,073,715 0.44% 8/25/2021 2.75 BB 98.16Food/Drug Retailers
Albertsons LLC LX164598 TL-B6 $6,367,409 0.35% 6/23/2023 3.00 BB 98.11Food/Drug Retailers
The Nature's Bounty (fka NBTY, Inc.) LX167866 First Lien Term Loan $5,815,562 0.32% 9/15/2024 3.50 B 97.25Food/Drug Retailers
Save-A-Lot LX157028 TL-B $4,946,228 0.27% 12/05/2023 6.00 B- 81.00Food/Drug Retailers
Supervalu LX164594 TL-B $3,145,908 0.17% 6/15/2024 3.50 BB- 97.23Food/Drug Retailers
Portillo Restaurant Group (The) LX139631 Upsized 1st Lien Term Loan $1,942,256 0.11% 8/04/2021 4.50 B- 100.38Food/Drug Retailers
Supervalu LX164595 TL-B (DD) $1,887,545 0.10% 6/15/2024 3.50 BB- 97.23Food/Drug Retailers
The Nature's Bounty (fka NBTY, Inc.) LX167868 Second Lien Term Loan $1,618,200 0.09% 9/15/2025 7.75 CCC+ 93.00Food/Drug Retailers
Smart & Final Stores LX126664 Extended TL-B $1,106,137 0.06% 11/15/2022 3.50 B 98.13Food/Drug Retailers
$34,902,960 1.90%
Forest Products
Blount International, Inc. LX168951 Term Loan B $3,025,506 0.16% 4/12/2023 4.25 B 101.19Forest Products
$3,025,506 0.16%
Health Care
Change Healthcare, Inc. LX159695 Term B $9,952,135 0.54% 2/28/2024 2.75 B+ 100.27Health Care
Sotera Health (f.k.a. Sterigenics International LLC) LX162147 Upsized Incremental TLB $8,812,036 0.48% 3/15/2022 3.00 B 100.15Health Care
Pharmaceutical Product Development, Inc. LX164648 Term B $8,681,041 0.47% 8/18/2022 2.75 B 100.31Health Care
Envision Healthcare Corporation LX156475 Upsized Tranche C $8,460,249 0.46% 12/01/2023 3.00 BB- 100.38Health Care
Grifols S.A LX158207 TL B $8,231,591 0.45% 1/31/2025 2.25 BB 100.35Health Care
NVA Holdings, Inc. LX160854 Upsized B-2 $8,129,081 0.44% 8/14/2021 3.50 B 100.92Health Care
Air Medical Group Holdings, Inc. LX168639 Term Loan B-2 $8,119,652 0.44% 9/26/2024 4.25 B 100.43Health Care
26

Holdings Report
Quarter Ending December 31, 2017
For financial professional or qualified institutional investor use only. Not for inspection by, distribution or quotation to, the general public.
Pasadena Fire and Police Ret. System Senior Loan
Borrower LoanX ID Tranche Market Value % Portfolio Maturity Spread %
S&P
Rating PriceIndustry (S&P)
Health Care
ATI Physical Therapy LX152458 Upsized First Lien Term Loan $7,209,721 0.39% 5/10/2023 3.50 B 101.00Health Care
PAREXEL International Corporation LX167279 Term B $6,982,093 0.38% 9/29/2024 3.00 B 100.58Health Care
U.S. Renal Care, Inc. LX148925 First Lien Term Loan $6,524,569 0.35% 12/30/2022 4.25 B 98.78Health Care
Select Medical Corporation LX159955 Term B $6,344,900 0.34% 3/01/2021 3.50 BB- 101.22Health Care
Tecomet LX169359 1st lien term loan $6,331,474 0.34% 5/01/2024 3.75 B 101.13Health Care
CHG Medical Staffing, Inc. LX170133 Upsized Term Loan B $6,313,423 0.34% 6/07/2023 3.00 B 100.78Health Care
Multiplan, Inc LX152711 First lien term loan $5,583,304 0.30% 6/07/2023 3.00 B+ 100.32Health Care
Albany Molecular Research, Inc. LX167440 First lien term loan $5,347,448 0.29% 8/30/2024 3.25 B 99.00Health Care
Valeant Pharmaceuticals International, Inc. LX143679 Tranche B $5,236,260 0.28% 4/01/2022 3.50 BB- 101.61Health Care
Air Methods LX162655 Term Loan B $5,198,616 0.28% 4/17/2024 3.50 B+ 100.05Health Care
Kinetic Concepts, Inc. LX159619 USD Term B $4,608,450 0.25% 2/03/2024 3.25 B 99.71Health Care
Davis Vision + Superior Vision LX169184 First Lien Term Loan $4,570,250 0.25% 11/08/2024 3.00 B 101.00Health Care
ExamWorks Group, Inc. LX159615 Term B $4,484,959 0.24% 7/27/2023 3.25 B 100.81Health Care
Cotiviti (f/k/a Connolly / iHealth Technologies) LX155103 New 1st Lien TLB $4,438,723 0.24% 9/28/2023 2.50 BB 100.31Health Care
DJO Finance LLC LX144227 First Lien Term Loan $4,387,518 0.24% 6/08/2020 3.25 B+ 98.85Health Care
Team Health, Inc. LX156377 Term B $4,362,976 0.24% 2/06/2024 2.75 B 97.63Health Care
Sivantos (Siemens Audiology) LX160223 TL B USD $4,322,764 0.23% 1/17/2022 3.00 B+ 101.00Health Care
Aspen Dental Management, Inc. LX144074 Incremental Term Loan B $4,275,852 0.23% 4/30/2022 3.75 B 101.06Health Care
Surgery Center Holdings, Inc. LX165294 Term B $4,020,920 0.22% 9/03/2024 3.25 B 99.04Health Care
Vizient, Inc. LX163354 B-3 $3,845,542 0.21% 2/13/2023 3.50 BB- 100.51Health Care
Prospect Medical Holdings, Inc. LX152960 Term Loan B $3,765,615 0.20% 6/30/2022 6.00 B 101.69Health Care
nThrive, Inc LX152078 First lien term loan $3,644,962 0.20% 10/20/2022 4.50 B 100.40Health Care
Schumacher Group LX147695 Upsized 1L Term Loan $3,201,636 0.17% 7/31/2022 4.00 B 98.38Health Care
PharMerica Corporation LX167956 First lien term loan $2,988,191 0.16% 9/26/2024 3.50 B 100.61Health Care
US Anesthesia Partners LX165390 First Lien Term Loan $2,956,245 0.16% 6/16/2024 3.25 B 100.38Health Care
Acadia LX150425 TLB-2 $2,555,122 0.14% 2/16/2023 2.75 BB- 100.67Health Care
27

Holdings Report
Quarter Ending December 31, 2017
For financial professional or qualified institutional investor use only. Not for inspection by, distribution or quotation to, the general public.
Pasadena Fire and Police Ret. System Senior Loan
Borrower LoanX ID Tranche Market Value % Portfolio Maturity Spread %
S&P
Rating PriceIndustry (S&P)
Health Care
CHS/Community Health Systems, Inc. LX144540 TERM LOAN H $2,517,795 0.14% 1/27/2021 3.00 B+ 95.52Health Care
Carestream Dental Digital LX167679 First Lien Term Loan $2,302,642 0.13% 9/01/2024 3.25 B 100.09Health Care
Concentra Inc LX144279 Upsized term loan B $1,654,465 0.09% 6/01/2022 3.00 B+ 101.00Health Care
Diplomat Pharmacy LX169734 Term B $1,485,619 0.08% 12/15/2024 4.50 B+ 101.06Health Care
GHX LX165440 First Lien Term Loan $1,377,855 0.07% 6/28/2024 3.25 B 100.44Health Care
Press Ganey LX169084 First Lien Term Loan $1,353,974 0.07% 10/23/2023 3.00 B 100.56Health Care
Healogics, Inc. LX137952 Second Lien Term Loan $960,000 0.05% 7/01/2022 8.00 CCC 64.00Health Care
Davis Vision + Superior Vision LX169185 Second Lien Term Loan $916,313 0.05% 11/08/2025 6.75 CCC+ 101.25Health Care
Greenway Health LLC LX159734 Term B $251,238 0.01% 2/17/2024 4.25 B 101.00Health Care
$196,707,219 10.69%
Home Furnishings
ADT fka Protection One, Inc. LX157682 Upsized Term Loan B $10,642,966 0.58% 5/02/2022 2.75 BB- 100.83Home Furnishings
Hillman Group (The), Inc. LX137733 Term Loan B $4,835,841 0.26% 6/30/2021 3.50 B+ 100.85Home Furnishings
SharkNinja LX168781 Term loan B $2,315,465 0.13% 10/03/2024 4.00 BB- 101.81Home Furnishings
Serta Simmons Bedding, LLC LX155523 First Lien Term Loan $1,794,046 0.10% 11/08/2023 3.50 B 92.00Home Furnishings
$19,588,318 1.06%
Industrial Equipment
Vertiv Group Corporation LX161714 Term Loan B $7,494,529 0.41% 11/30/2023 4.00 B+ 100.16Industrial Equipment
Accudyne Industries LLC LX167634 First Lien Term Loan $5,359,248 0.29% 8/15/2024 3.75 B 100.73Industrial Equipment
Columbus McKinnon Corporation LX158071 1st Lien Term Loan $3,033,586 0.16% 1/31/2024 3.00 B+ 100.94Industrial Equipment
Kenan Advantage Group, Inc. LX146807 Upsized USD Term loan B $2,740,192 0.15% 7/31/2022 3.00 B+ 100.34Industrial Equipment
Robertshaw Controls Company LX167594 1st Lien Term Loan $2,500,477 0.14% 8/15/2024 4.50 B 100.88Industrial Equipment
Gardner Denver, Inc. LX168067 TLB1 Dollar Term Loan $2,438,539 0.13% 7/30/2024 2.75 B+ 100.41Industrial Equipment
Rexnord Corporation / RBS Global, Inc. LX169998 First Lien Term Loan $2,327,822 0.13% 8/21/2024 2.25 BB+ 100.47Industrial Equipment
ExGen Renewables IV, LLC LX169539 TL-B $1,771,875 0.10% 11/15/2024 3.00 BB+ 101.25Industrial Equipment
28

Holdings Report
Quarter Ending December 31, 2017
For financial professional or qualified institutional investor use only. Not for inspection by, distribution or quotation to, the general public.
Pasadena Fire and Police Ret. System Senior Loan
Borrower LoanX ID Tranche Market Value % Portfolio Maturity Spread %
S&P
Rating PriceIndustry (S&P)
Industrial Equipment
Global Brass and Copper, Inc. LX153274 Term Loan B $1,399,860 0.08% 7/18/2023 3.25 BB- 101.00Industrial Equipment
Robertshaw Controls Company LX167620 2nd Lien Term Loan $937,650 0.05% 2/04/2025 9.00 CCC+ 99.75Industrial Equipment
CeramTec GmbH LX131517 Dollar Term B-1 Loan $853,795 0.05% 8/30/2020 2.75 B 100.09Industrial Equipment
Kenan Advantage Group, Inc. LX146975 Term Loan Canada Borrower $831,031 0.05% 7/31/2022 3.00 B+ 100.34Industrial Equipment
CeramTec GmbH LX132570 Dollar Term B-3 Loan $261,451 0.01% 8/30/2020 2.75 B 100.09Industrial Equipment
CeramTec GmbH LX132449 Dollar Term B-2 Loan $109,616 0.01% 8/30/2020 2.75 B 100.09Industrial Equipment
$32,059,672 1.74%
Leisure Goods/Activities/Movies
Equinox Holdings, Inc. LX169635 First Lien TL-B $8,044,575 0.44% 3/10/2024 3.00 B+ 101.06Leisure Goods/Activities/Movies
Life Time Fitness LX159083 Term Loan B $6,927,803 0.38% 6/10/2022 2.75 BB- 100.44Leisure Goods/Activities/Movies
24 Hour Fitness Worldwide, Inc LX137112 Term Loan B $6,768,482 0.37% 5/28/2021 3.75 B+ 100.15Leisure Goods/Activities/Movies
Fitness International, LLC. LX138000 Term Loan B $5,989,380 0.33% 7/01/2020 3.50 BB- 101.46Leisure Goods/Activities/Movies
Delta2 Sarl Luxembourg (Formula One World Championship) LX139582 TL B3 New $5,179,191 0.28% 2/01/2024 3.00 B+ 100.70Leisure Goods/Activities/Movies
SRAM, LLC LX168720 First Lien Term Loan $4,103,810 0.22% 3/13/2024 3.25 B 100.88Leisure Goods/Activities/Movies
Planet Fitness Holdings, LLC LX156908 Term Loan B $2,984,718 0.16% 3/31/2021 3.00 BB- 100.56Leisure Goods/Activities/Movies
Winnebago LX170097 Term Loan B $2,622,750 0.14% 11/08/2023 3.50 BB 100.88Leisure Goods/Activities/Movies
ClubCorp Club Operations, Inc LX167985 Senior Secured Term Loan B $2,520,356 0.14% 9/18/2024 3.25 B+ 100.54Leisure Goods/Activities/Movies
AMF Bowling Centers, Inc. LX166123 First Lien Term Loan $1,061,508 0.06% 6/29/2024 4.25 B+ 101.12Leisure Goods/Activities/Movies
Equinox Holdings, Inc. LX160948 Second Lien TL-B $589,475 0.03% 9/06/2024 7.00 CCC+ 103.42Leisure Goods/Activities/Movies
$46,792,049 2.54%
Lodging & Casinos
Scientific Games International, Inc. LX167677 Term Loan B-4 $13,166,966 0.72% 8/14/2024 3.25 B+ 101.00Lodging & Casinos
The Stars Group (fka Amaya) LX160896 USD Term Loan $10,395,334 0.56% 8/01/2021 3.50 BB- 100.68Lodging & Casinos
Station Casinos LLC LX152816 Add-on TLB $9,776,485 0.53% 6/08/2023 2.50 BB- 100.32Lodging & Casinos
Caesars Resort Collection LX168784 TLB $9,138,859 0.50% 10/02/2024 2.75 BB 100.54Lodging & Casinos
29

Holdings Report
Quarter Ending December 31, 2017
For financial professional or qualified institutional investor use only. Not for inspection by, distribution or quotation to, the general public.
Pasadena Fire and Police Ret. System Senior Loan
Borrower LoanX ID Tranche Market Value % Portfolio Maturity Spread %
S&P
Rating PriceIndustry (S&P)
Lodging & Casinos
La Quinta LX135546 First Lien Term Loan $7,983,500 0.43% 4/14/2021 2.75 BB 100.63Lodging & Casinos
Everi Holdings Inc (fka Global Cash Access) LX163694 Term Loan B $7,084,823 0.38% 4/28/2024 4.50 B+ 100.50Lodging & Casinos
Golden Entertainment LX165659 1st Lien $5,433,550 0.30% 10/21/2024 3.00 B+ 100.25Lodging & Casinos
Twin River Management Group, Inc. LX136336 Term Loan B $4,948,415 0.27% 7/10/2020 3.50 BB 101.22Lodging & Casinos
CityCenter Holdings, LLC LX162717 TLB $4,703,535 0.26% 4/10/2024 2.50 BB- 100.58Lodging & Casinos
Horseshoe Baltimore LX165522 TLB $3,529,263 0.19% 6/27/2024 4.00 B 101.13Lodging & Casinos
Eldorado Resorts, Inc. LX155237 TLB $2,083,005 0.11% 4/17/2024 2.25 BB 100.22Lodging & Casinos
Golden Entertainment LX165662 2nd Lien $1,805,625 0.10% 10/21/2025 7.00 CCC+ 100.31Lodging & Casinos
Belmond Interfin LX165656 TL USD $787,770 0.04% 6/30/2024 2.75 BB 100.22Lodging & Casinos
$80,837,127 4.39%
Nonferrous Metals/Minerals
Fairmount Santrol Inc (f.k.a Fairmount Minerals Ltd) LX169058 Term Loan $3,089,266 0.17% 10/30/2022 6.00 B- 100.79Nonferrous Metals/Minerals
$3,089,266 0.17%
Oil & Gas
FTS International, Inc. (fka FracTech) LX136541 Term Loan $8,897,984 0.48% 4/16/2021 4.75 CCC+ 97.95Oil & Gas
MEG Energy Corp. LX159204 Term Loan $5,624,987 0.31% 12/31/2023 3.50 BB+ 100.26Oil & Gas
Medallion Midland Acquisition, LLC LX169242 Term Loan $5,458,613 0.30% 10/30/2024 3.25 BB- 100.25Oil & Gas
BCP Renaissance Parent LLC (i.e. Rover) LX168609 Term Loan $5,300,825 0.29% 10/31/2024 4.00 B+ 101.35Oil & Gas
Traverse Midstream Partners LLC LX168620 Term Loan $3,880,941 0.21% 9/30/2024 4.00 B+ 101.46Oil & Gas
Crestwood Holdings LLC LX129978 Term Loan $3,036,315 0.16% 6/19/2019 8.00 B- 100.50Oil & Gas
Glass Mountain Pipeline, LLC LX170112 Term Loan $2,235,000 0.12% 12/15/2024 4.50 B 100.00Oil & Gas
Navitas Midstream Midland Basin, LLC LX170023 Term Loan $2,025,050 0.11% 12/14/2024 4.50 B+ 100.25Oil & Gas
Southcross Energy Partners, L.P. LX139218 Term Loan $1,760,581 0.10% 8/04/2021 4.25 CCC+ 97.75Oil & Gas
Harvey Gulf International Marine, LLC LX130275 Upsized Term Loan B $1,324,729 0.07% 6/18/2020 4.50 CCC- 40.25Oil & Gas
Harvey Gulf International Marine, LLC LX130741 Upsized Term Loan A $1,037,600 0.06% 6/18/2018 4.25 CCC- 38.75Oil & Gas
30

Holdings Report
Quarter Ending December 31, 2017
For financial professional or qualified institutional investor use only. Not for inspection by, distribution or quotation to, the general public.
Pasadena Fire and Police Ret. System Senior Loan
Borrower LoanX ID Tranche Market Value % Portfolio Maturity Spread %
S&P
Rating PriceIndustry (S&P)
Oil & Gas
Limetree Bay Terminals LX159842 Term Loan $887,296 0.05% 2/15/2024 4.00 BB- 99.75Oil & Gas
Summit Midstream Partners LX161196 Term Loan $875,253 0.05% 5/15/2022 6.00 B- 101.75Oil & Gas
$42,345,173 2.30%
Property & Casualty Insurance
BroadStreet Partners, Inc. LX169565 Upsized TLB $5,643,125 0.31% 11/08/2023 3.75 B 101.13Property & Casualty Insurance
$5,643,125 0.31%
Publishing
Merrill Communications, LLC LX144578 New First Lien Term Loan $3,067,204 0.17% 6/01/2022 5.25 BB- 100.88Publishing
Tribune Company LX159214 Term Loan C $1,898,522 0.10% 1/27/2024 3.00 BB+ 100.33Publishing
Tribune Company LX145376 Term Loan B $152,197 0.01% 12/27/2020 3.00 BB+ 100.25Publishing
McGraw Hill Global Education LX152400 Term Loan B $0 0.00% 5/04/2022 4.00 B+ 99.94Publishing
$5,117,924 0.28%
Radio & Television
Univision Communications, Inc. LX161197 TL-C5 $16,161,511 0.88% 3/15/2024 2.75 BB- 99.82Radio & Television
Sinclair Television Group, Inc LX169992 New Term Loan B $9,082,778 0.49% 3/31/2025 2.50 BB+ 100.03Radio & Television
Cumulus Media Holdings Inc. LX134252 Term Loan $5,773,534 0.31% 12/23/2020 3.25 D 86.38Radio & Television
Nexstar Broadcasting, Inc. LX166223 New Term Loan B - Nexstar $5,074,254 0.28% 1/17/2024 2.50 BB+ 100.44Radio & Television
CBS Radio, Inc. LX160915 Incremental Term Loan B-1 $4,983,081 0.27% 11/17/2024 2.75 BB- 100.69Radio & Television
Lions Gate Entertainment Corp LX169637 Term Loan B $4,628,467 0.25% 12/08/2023 2.25 BB- 100.38Radio & Television
Raycom TV Broadcasting, LLC LX167750 Term Loan B $3,636,985 0.20% 8/16/2024 2.75 NR 101.00Radio & Television
Learfield Communications, Inc LX170340 Delayed Draw 1st Lien Term oan $2,407,853 0.13% 12/01/2023 3.25 B+ 100.88Radio & Television
Learfield Communications, Inc LX156663 Upsized 1st Lien Term Loan $2,199,623 0.12% 12/01/2023 3.25 B+ 100.88Radio & Television
Nexstar Broadcasting, Inc. LX166614 New Term Loan B - Mission $640,578 0.03% 1/17/2024 2.50 BB+ 100.44Radio & Television
$54,588,664 2.97%
31

Holdings Report
Quarter Ending December 31, 2017
For financial professional or qualified institutional investor use only. Not for inspection by, distribution or quotation to, the general public.
Pasadena Fire and Police Ret. System Senior Loan
Borrower LoanX ID Tranche Market Value % Portfolio Maturity Spread %
S&P
Rating PriceIndustry (S&P)
Retailers (Except Food & Drug)
PetSmart, Inc. LX155570 TL-B $9,971,100 0.54% 3/11/2022 3.00 CCC+ 80.59Retailers (Except Food & Drug)
Harbor Freight Tools USA, Inc. LX154324 TL-B $7,679,669 0.42% 8/15/2023 3.25 BB- 100.79Retailers (Except Food & Drug)
Leslies Poolmart, Inc. LX154098 TL-B $7,241,896 0.39% 8/16/2023 3.75 B 99.91Retailers (Except Food & Drug)
Jo-Ann Stores, Inc. LX155217 TL-B (UPSIZED) $6,387,965 0.35% 10/21/2023 5.00 B 96.59Retailers (Except Food & Drug)
BJs Wholesale Club LX159354 1L TL-B $6,372,324 0.35% 2/03/2024 3.50 B- 98.53Retailers (Except Food & Drug)
General Nutrition Centers, Inc. LX126268 Term Loan B $6,234,198 0.34% 3/04/2019 2.50 CC 85.19Retailers (Except Food & Drug)
Neiman Marcus Group, Inc LX135908 Term Loan $6,095,553 0.33% 10/25/2020 3.25 CCC 81.90Retailers (Except Food & Drug)
Men's Wearhouse LX136368 Term Loan $5,017,584 0.27% 6/18/2021 3.50 B+ 99.94Retailers (Except Food & Drug)
Party City Holdings Inc LX155718 TL-B $4,836,412 0.26% 8/19/2022 3.00 B+ 100.49Retailers (Except Food & Drug)
Petco Animal Supplies, Inc. LX158994 TLB-1 $4,455,894 0.24% 1/26/2023 3.00 B 76.13Retailers (Except Food & Drug)
National Vision, Inc. LX169606 TL-B $4,244,214 0.23% 11/15/2024 2.75 B+ 100.31Retailers (Except Food & Drug)
Belk LX148858 1st Lien Term Loan $3,627,560 0.20% 12/12/2022 4.75 B- 82.10Retailers (Except Food & Drug)
Academy Ltd. LX144914 Term Loan $2,875,635 0.16% 7/01/2022 4.00 CCC+ 79.00Retailers (Except Food & Drug)
Ascena Retail Group, Inc. LX146680 TLB $2,582,197 0.14% 8/21/2022 4.50 BB- 83.38Retailers (Except Food & Drug)
BJs Wholesale Club LX159355 2L TL-B $1,492,277 0.08% 2/03/2025 7.50 CCC 97.85Retailers (Except Food & Drug)
Hudson's Bay Company LX147151 TL-B $1,466,250 0.08% 9/30/2022 3.25 BB- 97.75Retailers (Except Food & Drug)
Abercrombie & Fitch Management Co. LX139440 Term Loan B $1,195,320 0.06% 8/09/2021 3.75 BB 99.63Retailers (Except Food & Drug)
$81,776,048 4.44%
Surface Transport
Navistar Inc. LX169275 Term Loan B $9,048,412 0.49% 11/01/2024 3.50 B+ 100.59Surface Transport
OSG Bulk Ships, Inc. LX136855 First Lien Term Loan $6,261,555 0.34% 8/05/2019 4.25 B+ 97.00Surface Transport
XPO Logistics LX161342 Term Loan B $3,552,236 0.19% 11/01/2021 2.25 BB+ 100.73Surface Transport
PODS LX169610 1st Lien Term Loan $1,042,331 0.06% 11/27/2024 3.00 B+ 100.71Surface Transport
V.Group LX159618 TL B $891,855 0.05% 3/11/2024 3.00 B 99.84Surface Transport
$20,796,389 1.13%
32

Holdings Report
Quarter Ending December 31, 2017
For financial professional or qualified institutional investor use only. Not for inspection by, distribution or quotation to, the general public.
Pasadena Fire and Police Ret. System Senior Loan
Borrower LoanX ID Tranche Market Value % Portfolio Maturity Spread %
S&P
Rating PriceIndustry (S&P)
Telecommunications
Asurion, LLC LX163239 Replacement B-5 Term Loan $19,912,062 1.08% 11/03/2023 3.00 B+ 100.58Telecommunications
SFR Group SA (Numericable) LX162009 USD TL B11 $10,875,101 0.59% 7/30/2025 2.75 B+ 95.88Telecommunications
Consolidated Communications, Inc. LX154992 Incremental Term Loan $10,119,759 0.55% 10/05/2023 3.00 BB- 98.66Telecommunications
CenturyLink LX161598 TLB $9,859,391 0.54% 1/31/2025 2.75 BBB- 96.66Telecommunications
Avaya Inc. LX169485 First Lien Term Loan $9,078,692 0.49% 11/08/2024 4.75 B 98.52Telecommunications
Ziggo N.V. LX159375 USD TLE $8,375,053 0.46% 4/15/2025 2.50 BB- 99.35Telecommunications
Altice International S.A. LX168956 New USD TL B $6,994,088 0.38% 2/02/2026 2.75 BB- 98.09Telecommunications
Altice International S.A. LX162006 USD TLB $6,338,150 0.34% 7/15/2025 2.75 BB 98.00Telecommunications
Sprint Communications LX159257 Term Loan B $6,232,478 0.34% 2/03/2024 2.50 BB- 100.07Telecommunications
Level 3 Financing, Inc LX160334 Term Loan B $6,007,500 0.33% 2/17/2024 2.25 BBB- 100.13Telecommunications
Uniti Group Inc. (fka Communications Sales & Leasing) LX159837 Term Loan B $5,934,269 0.32% 10/24/2022 3.00 B+ 96.61Telecommunications
U.S. Telepacific Corp LX162974 Term Loan B $5,568,868 0.30% 4/17/2023 5.00 B 96.08Telecommunications
Aricent Group LX136313 Aug 2015 Upsized First Lien Term Loan $5,264,654 0.29% 4/14/2021 4.50 B- 100.50Telecommunications
Asurion, LLC LX167792 Replacement B-4 Term Loan $4,849,276 0.26% 8/04/2022 2.75 B+ 100.63Telecommunications
Windstream Corporation LX155086 Upsized Term Loan B-6 $4,476,220 0.24% 3/29/2021 4.00 BB- 94.19Telecommunications
Telenet Group Holding NV LX169996 USD TL AL $4,223,397 0.23% 3/30/2026 2.50 BB- 100.44Telecommunications
Securus Technologies, Inc. LX164887 First Lien Term Loan $3,611,494 0.20% 11/01/2024 4.50 B 101.02Telecommunications
Global Tel*Link Corporation LX129695 Upsized First Lien Term Loan $3,600,850 0.20% 5/23/2020 4.00 B 100.53Telecommunications
Syniverse Holdings, Inc. LX123795 Initial Term Loan $3,147,700 0.17% 4/23/2019 3.00 B 98.46Telecommunications
Encompass Digital Media, Inc. LX137376 First Lien $1,847,059 0.10% 6/05/2021 4.50 B 95.50Telecommunications
Zayo Group, LLC LX166414 Term Loan B-2 $1,479,425 0.08% 1/19/2024 2.25 BB 100.45Telecommunications
Asurion, LLC LX167087 Second Lien Term Loan $1,050,175 0.06% 8/04/2025 6.00 B- 102.96Telecommunications
Global Tel*Link Corporation LX129696 Second Lien Term Loan $851,063 0.05% 11/23/2020 7.75 CCC+ 100.13Telecommunications
Encompass Digital Media, Inc. LX137379 Second Lien $451,500 0.02% 6/05/2022 7.75 CCC+ 86.00Telecommunications
$140,148,226 7.61%
33

Holdings Report
Quarter Ending December 31, 2017
For financial professional or qualified institutional investor use only. Not for inspection by, distribution or quotation to, the general public.
Pasadena Fire and Police Ret. System Senior Loan
Borrower LoanX ID Tranche Market Value % Portfolio Maturity Spread %
S&P
Rating PriceIndustry (S&P)
Utilities
Dynegy Inc. LX170220 Term Loan C $4,565,277 0.25% 2/07/2024 2.75 BB 100.60Utilities
Vistra Operations Company LLC (fka TCEH) LX155779 Term Loan B $4,528,329 0.25% 8/04/2023 2.50 BB+ 100.56Utilities
Helix Gen LLC LX160979 Term Loan $4,155,131 0.23% 6/02/2024 3.75 BB 100.41Utilities
Southeast PowerGen, LLC LX141908 Term Loan B $3,687,528 0.20% 12/02/2021 3.50 B 96.25Utilities
Nautilus Power, LLC LX163284 Term Loan $3,606,098 0.20% 5/16/2024 4.25 B+ 100.63Utilities
RISEC LX149086 Term Loan $3,327,483 0.18% 12/19/2022 4.75 B+ 100.50Utilities
Dayton Power and Light Company LX154380 Term Loan $3,110,196 0.17% 8/30/2022 3.25 BBB 100.53Utilities
MRP Generation Holdings, LLC (fka TPF Generation Holdings, LLC) LX154155 Term Loan $2,553,058 0.14% 9/30/2022 7.00 B+ 92.50Utilities
Aclara Technologies LLC LX154197 Term Loan (Incremental) $1,821,645 0.10% 8/09/2023 5.75 B 100.50Utilities
Longview Power, LLC LX143826 Term Loan $1,602,900 0.09% 4/13/2021 6.00 CCC 68.50Utilities
Calpine Corp LX170204 CCFC Term Loan $1,601,000 0.09% 1/15/2025 2.50 BB 100.06Utilities
Vistra Operations Company LLC (fka TCEH) LX155780 Term Loan C $804,500 0.04% 8/04/2023 2.50 BB+ 100.56Utilities
Vistra Operations Company LLC (fka TCEH) LX155779 Term Loan B $786,499 0.04% 8/04/2023 2.50 BB+ 100.56Utilities
$36,149,646 1.96%
$1,840,589,165 100.00%Total Loans
Cash & Cash Equivalents
Total Market Value
-22,124,543
$1,818,464,622
Coupon reflects a calculation of the loan spread plus 3-month LIBOR, and does not necessarily reflect the actual changing underlying LIBOR contracts for theloan.
The holdings displayed represent the holdings of the entire commingled fund and do not represent individual client ownership.
34

Explanatory Notes
The information contained in this document has been prepared solely for informational purposes and is not an offer or invitation to buy or sell any security or to participatein any trading activity. This document is intended only for professional investors and describes a strategy only. Some material shown is compiled from third party sourcesthought to be reliable, but accuracy and completeness cannot be guaranteed. Any opinions expressed herein reflect our judgment at this date and are subject to changewithout notice. Neither Voya Investment Management nor any other company or unit belonging to Voya Financial, nor any of its officers, directors, or employees accept anyliability or responsibility in respect to the information or any recommendations expressed herein. No liability is accepted for any losses sustained by readers as a result ofusing this publication or basing decisions on it. The value of your investments may rise or fall. Past performance is not indicative of future results. Investments involve risk.General Risks are listed below:
Equity: Exposure to financial and market risks that accompany investments in equities. Markets are volatile and can decline significantly in response to adverse issuer,political, regulatory, market or economic developments. Small cap stocks may be more volatile and less liquid than stocks of larger more established companies.
Fixed Income: Exposure to financial, market, prepayment, credit and interest rate risks. The value of an investment is not guaranteed and will fluctuate. Higher yieldingbonds are subject to greater volatility and credit risks. A strategy may invest in securities guaranteed by the U.S. Government as to timely payments of interest andprincipal, but the strategy itself is not insured or guaranteed. Bonds have fixed principal and return if held to maturity, but may fluctuate in the interim. Generally, wheninterest rates rise, bond prices fall. Bonds with longer maturities tend to be more sensitive to changes in interest rates.
International: In addition to the general risks of investing in equities and fixed income securities, investing in foreign securities poses special risks, including currencyfluctuation, economic and political risks not found in investments that are solely domestic. Risks of foreign investing are generally intensified for investments in emergingmarkets.
The account information presented in this report is based on the records and information provided by Voya Investment Management. The results may be preliminary andunreconciled and are subject to change. Voya Investment Management does not guarantee the accuracy of the information contained in this portfolio accounting report.The report is for informational purposes only and should not be relied upon or construed to be final. Clients are advised to refer to their custodial statements andconfirmations for trade and holdings information.
Footnotes
Market Value
The ending balance shown on the Portfolio Accounting page may differ from the total market value on the Portfolio Holdings Report due to cash flow posted at close ofbusiness on the last day of the quarter.
For financial professional or qualified institutional investor use only. Not for inspection by, distribution or quotation to, the general public.
Pasadena Fire and Police Ret. System 35

Explanatory Notes
Portfolio Characteristics
The portfolio specific characteristics (such as Average Duration, Average Yield, etc.) are based on the total portfolio market value including cash and derivatives, asprovided by our valuation provider (BNY Mellon) and security characteristics provided by BlackRock Solutions which utilizes a different pricing hierarchy (Barclays). BNYMellon prices combined with Barclays analytics will result in different portfolio averages than are reported. Portfolio and Benchmark averages (Duration, Yield to Maturity,Convexity and Average Life) are reported directly from BlackRock Solutions using Blackrock models and assumptions. As such, the Benchmark Analytics provided abovemay be different from Barclays. Top ten credit exposures include cash.
All holdings-based characteristics presented are based on end-of-month positions of the total portfolio value. Holdings and their weights will change over time and maydiffer across accounts.
Ratings
The portfolios average quality rating is calculated as a market value-weighted average of the rating assigned to all positions, including derivative securities, but excludingnon-rated securities held within the portfolio measured and reported as of the date of this report. The "Effective Rating" is determined as follows: Voya IM Rseeksindividual security ratings from three credit rating agencies that are registered with the SEC as nationally recognized statistical rating organizations -- typically Moody's,S&P and Fitch. If ratings are available from all three agencies, the security will be assigned the median rating. If ratings are available from only two of theagencies, the lower of the ratings will be used. If a rating is available from only one agency, then that rating will be used. If ratings are not available from any of the threeagencies, then we may either assign the security an internal rating or mark it as "N/R" (not rated). AAA is the highest (best) Effective Rating, and D is the lowest (worst)Effective Rating. When an Effective Rating is reported for a group of securities (such as for an asset class or the overall portfolio), it is calculated as a marketvalue-weighted average of the Effective Rating assigned to each component security (excluding securities without an Effective Rating). Please note that Voya does notendorse or affirm the Effective Ratings or any agency ratings.
Furthermore, credit rating agencies disclaim all warranties and liability for their ratings, which (a) should be viewed as their opinions and not as statements of fact orrecommendations as to suitability or to purchase, hold, or sell a security and (b) are not guaranteed as being accurate, timely or available. For derivative securities, swapcontracts are rated on the basis of the underlying security, however, futures contracts are treated as a combination of Treasury securities and cash positions, they have nonet impact to the average quality rating in the portfolio. Measures pertaining to average credit quality may change over time and illustrations presented in the client reportare for informational purposes only. Individual client investment guidelines may have different rules and the foregoing presentation is not meant to represent a compliancecertification of the portfolios overall credit quality.
This report may contain information obtained from third parties, including ratings from credit ratings agencies. Reproduction and distribution of third party content in anyform is prohibited except with the prior written permission of the related third party. Third party content providers do not guarantee the accuracy, completeness, timelinessor availability of any information, including ratings, and are not responsible for any errors or omissions (negligent or otherwise), regardless of the cause, or for the resultobtained from the use of such content. THIRD PARTY CONTENT PROVIDERS GIVE NO EXPRESS OR IMPLIED WARRANTIES, INCLUDING, BUT NOT LIMITED TO,ANY WARRANTIES OF MERCHANTABILITY OR FITNESS FOR A PARTICULAR PURPOSE OR USE. THIRD PARTY CONTENT PROVIDERS SHALL NOT BE LIABLEFOR ANY DIRECT, INDIRECT, INCIDENTAL, EXEMPLARY, COMPENSATORY, PUNITIVE, SPECIAL OR CONSEQUENTIAL DAMAGES, COSTS, EXPENSES, LEGALFREES, OR LOSSES (INCLUDING LOST INCOME OR PROFITS AND OPPORTUNITY COSTS OR LOSSES CAUSED BY NEGLIGENCE) IN CONNECTION WITH ANYUSE OF THEIR CONTENT, INCLUDING RATINGS. Credit agency ratings are statement of opinions and are not statements of fact or recommendations to purchase, holdor sell securities. They do not address the suitability of securities or the suitability of securities for investment purposes, and should not be relied on as investment advice.
For financial professional or qualified institutional investor use only. Not for inspection by, distribution or quotation to, the general public.
Pasadena Fire and Police Ret. System 36

Explanatory Notes
Equity Sector Weightings
Sector weights are based on total portfolio market value, but excludes futures, index level ETFs & cash.
Bond Sector Comparisons
Sector weights are based on total portfolio market value, which includes security market values (including accrued income), plus cash, cash equivalents and derivatives(variation margin for Futures, and Market Value of Swaps).
With the exception of the Treasury, ABS, and CMBS Sectors, the following sector groupings apply:
Treasury and Cash includes Cash/Cash equivalents which includes trade receivables/payables (which may be net positive or negative), TBA liabilities,accrued income on securities that have been sold pending settlement (accrued income is otherwise reflected in the other sectors), and in Sector Weights,also includes variation margin for futures (which may be positive or negative).
Government Related sector is comprised of Agency, Local Government, Sovereign and Supranational securities.Corporate sector is comprised of Financial Institutions, Industrial and Utility securities.Agency Mortgages sector contains Fannie Mae (FNMA), Freddie Mac (FHLMC), and Government National Mortgage Association (GNMA).Securitized sector is comprised of ABS, CMBS, and Agency and Non-Agency Mortgage Backed Securities.Other sector is comprised of Convertibles, Common and Preferred Stocks and Municipal Bonds."Derivatives" (if applicable) includes forwards, options and swaps (see Appendix - Portfolio Holdings Derivatives for details) and futures.
Performance Disclosures
Performance is calculated on a time-weighted total return basis. Performance quoted is past performance, is no guarantee of future results and assumes that dividends anddistributions are reinvested. Current performance may be lower or higher. Investment value will fluctuate, and shares, when redeemed, may be worth more or less thanoriginal cost.
Net returns (if applicable) are reflective of trading costs, management fees, and other administrative fees. Gross returns are net of trading costs, but do not reflect thededuction of management, operating and admin fees. The returns for the Benchmark Index are time-weighted total return performance results.
Attribution results for sub-portfolio components, as provided by Blackrock Solutions Systems, are calculated on a daily basis. These daily results are then geometricallycompounded using a smoothing algorithm (Frongello Linking Algorithm) to produce results for "Month to Date" , "Quarter To Date" and "Year To Date" time periods.However, the use of this smoothing process, as well as rounding effects, may create immaterial differences to total portfolio returns reported to the client for "Month ToDate", "Quarter To Date" and "Year To Date" time periods. Additional details of these calculations are available upon request. Total attribution may not add or matchportfolio returns due to rounding. Total attribution may not add or match portfolio returns due to rounding.
For financial professional or qualified institutional investor use only. Not for inspection by, distribution or quotation to, the general public.
Pasadena Fire and Police Ret. System 37

Explanatory Notes
Holdings
Cash and Cash Equivalents include trade receivables/payables (which may be net positive or negative), accrued income, cash collateral, variation margin (which may bepositive or negative), and TBA liabilities. The current market value of foreign currency as well as derivative holdings is (a) included in the net cash/cash equivalent line atthe end of the Portfolio Holdings Report and (b) reflected in the "other" sector in the Bond Sector Comparisons page.All derivative holdings (including notional amounts) are listed, as applicable. The market value of all derivatives other than futures (and only the variation margin for futures)is (a) included in the net cash/cash equivalent line at the end of the Portfolio Holdings Report and (b) reflected in the other sector in the Bond Sector Comparisons page.
The individual holdings and their respective valuations, (pricing and accruals) illustrated in this report are provided by IMs operations servicer, Bank of New York Mellon.Individual Security and Portfolio Level attributes illustrations are provided by BlackRock Solutions which utilizes a different pricing hierarchy (Barclays) in the deriving ofanalytics such as; Duration, Yield to Maturity, Convexity, and Average Life. Please refer to the Explanatory Notes Section of your quarterly performance report for thevaluation hierarchy as provided by Bank of New York Mellon, as well as other important disclosures.
Notes
A To-Be-Announced ("TBA") security represents a "forward purchase" of a potential mortgage pool of similar characteristics such as coupon, yield and par value to beannounced by a broker bundling like mortgages. The cash segregated as collateral for these forward purchases, in an amount equal to the purchase price to be paid, maybe invested in liquid assets, such as cash, U.S. Government securities or other appropriate high grade debt obligations in a segregated account as described in Release10666 of the SEC. Voya reports these within "Portfolio Holdings". The valuation of this collateral is independent of the valuation of the TBA liability and may rise or fall,based on interest rates and market conditions.
FAS 157 Tier levels
FASB 157 establishes a framework for measuring fair value in Generally Accepted Accounting Principles. Under FAS, "fair value" is the price that would be received to sellan asset or paid to transfer a liability in an orderly transaction between market participants at the measurement date. FASB 157 identifies a fair value hierarchy to rank thereliability of inputs used in a valuation approach. The first - and highest - level (Level 1) refers to quoted prices for identical assets or liabilities in an active market. Whenthose prices are not available, the second - or middle - level (Level 2) will base fair value estimates on observable inputs that a market participant would use. If observableinputs are not available, the third - and lowest - level (Level 3) will require the use of unobservable inputs. Source: Valuation Research Corporation.
Voya Investment Management employs the following criteria for the tier selection under the FAS 157 Rule:
Level 2 is identified as any security for which we have received a price through one of our pricing vendors (currently IDC, Pricing Direct, and Markit Partners). We identifyas Level 3 any security (including mortgage-related securities) for which only a broker quote is available for valuation, as opposed to prices sourced from pricing vendors.Under our current policy, Level 1 is reserved for U.S. Treasury securities.
Effective January 1, 2013 , all Subprime assets that are priced by an external vendors are now classified as Tier 2. Prior to this time, Voya Investment Management wascategorizing subprime external vendor priced securities as Tier 3 since December 2008.
For financial professional or qualified institutional investor use only. Not for inspection by, distribution or quotation to, the general public.
Pasadena Fire and Police Ret. System 38

Jl~caIPERS
September 7, 2017
City of Pasadena 100 N Garfield Ave Rm 5135 Pasadena, CA 91101-1726
Re: Salvador Vidales Occupation: Police Officer
Dear Personnel Officer,
P.O. Box 2796 Sacramento, CA 95812-2796 ,,,.,. ·: 888 CalPERS (or 888-225-7377)
TTY: (877) 249-7442 I Fax: (916) 795-1280
·, . AS A. ~A;alpers.ca.gov CIT'{ Or lc\JQCES Ot.P1'.
HU\1 f\N RE · 2. ?\'\ tr.ii!i\3ia Public Employees' Retirement System
'7S£f>\ · .
CalPERSID: 3773558132
Salvador Vidales has filed an application for service retirement pending industrial disability retirement based upon his orthopedic (cervical and lumbar spine) condition. Your agency needs to make a determination of the member's disability in accordance with Government Code sections 21154 and 21156. You must make your oetermination within. six months of this request unless the local safety member waives the requirements,of ~his provision (Government Code section 21157).
However, in any of the following circumstances, your agency must forward all relevant personnel· documents and medical records to Cal PERS and obtain Cal PERS' determination that the member is eligible to apply for disability retirement before your agency starts the process:
• Disciplinary process underway prior to the member's separation from employment. • The member was terminated for cause. • The member resigned in lieu of termination. . . • The member signed an agreement to waive his or her reinstatement right as part of a legal
settlement (i.e., Employment Reinstatement Waiver). • The member has been convicted of or is being investigated for a work related felony.
Your determination shall be ori the basis of competent medical opinion. You shall .not use disability retirement as a substitute for the disciplin'ary process (Government Code section 21156(2)). If the disciplinary process occurred before the member's separation from employment, you are required to forward all relevant personnel documents to Cal PERS for determination of the member's eligibility for disability retirement before you start the process of adjudication.
Page 1of4
DATE: 2/21/2018ITEM#: 7

Under the California Public Employees' Retirement Law, disability means the incapacity of a member from the performance of duty in public services for permanent or extended and uncertain duration of twelve consecutive months or longer, as determined on the basis of competent medical opinion. Disability is not necessarily an inability to perform every function of a given position. Rather, the courts have concluded that the test in any case is whether the employee can.substantially perform his or her usual duties. Difficulty in performing certain tasks alone is not enough to support a finding of dis;:ibility. It is the inability to perform the essential functions of the actual and present job duties. that determines whether the member is substantially incapacitated for the performance of his or her job duties. A Cal PERS disability retirement must be based upon an actual and present (not prospective) inability to substantially perform the member's actual and usual job duties. Furthermore, prophylactic restrictions are not a basis for a disability retirement. If a disability is not currently present but just may occur in the future, the member is presently ineligible for a CalPERS disability retirement.
Disputed questions regarding the industrial relationship of the disabling injury to the member's work Will be resolved by the Workers' Compensation Appeals Board (WCAB). In the event there is no dispute, such a finding can be made by the employer. A Workers' Compensation Award is not sufficient evidence that a local safety member is disabled for retirement purposes. There must be a specific finding under Government Code section 21166, by the employer, with respect to the disability for which the member will be retired.
If it is determined that the member is not disabled from the performance of his or her duties, a Resolution to that effect must be filed with CalPERS. Please refer to sample Resolution No. 1 in the Public Agency and School Reference Guide - Benefits Procedures (see link below).
If the member is found to be disabled, Cal PERS will require the following documentation:
1. A statement certifying under penalty of perjury that the determination was made based on . competent medical opinion.
2. A statement certifying under penalty of perjury that the determination was not used as a substitute for the disciplinary process. If any of the above mentioned circumstances is met, a statement must also be included that confirms that all relevant personnel documents were forwarded to Cal PERS and Cal PERS' determination that the member is eligible to apply for disability retirement was obtained prior to starting the process of determination.
3. A finding indicating the member has been found to be substantially incapadtated from the performance of the usual duties of his or her position.
4. A statement confirming whether or not the member had filed a Workers' Compensation claim(s) for his or her disabling condition(s). If so, a statement is required as to whether the claim(s) was accepted.
5. A finding by the employer as to whether or not the causation of the disability was industrial.
Page 2 of 4

a) In case of a djspute about the causation of the disability, the employer must provide a copy of the Findings and Award by the Workers' Compensation Appeals Board (WCAB) resolving
. the question of industrial causation.
b) A member must have a minimum of five years of credited service to qualify for nonindustrial disability retirement. If a member does not meet the.minimum service requirements for disability retirement, the member may still qualify by re-depositing previously withdrawn contributions or contrjbuting an amount for service rendered prior to membership with Cal PERS. Generally, time during which the member is absent from state service by reason of injury or illness, which is determined within one-year after the end of such absence to be job-related, shall be considered as time spent in state service for the purpose of qualification for retirement and death benefits.
6. A statement by the employer documenting the member's last day on payroll. In case of a dispute regarding the effective date of the member's retirement, a request must be filed with the WCAB for finding of fact to determine the date the member's condition became permanent and stationary. The employer must provide a copy of the Finding of Fact and that date then becomes the effective date of member's retirement (Government Code section 21164).
7. A statement by the employer as to whether there is, or is not, a possibility of third-party liability present (meaning whether the member's disability was caused by negligence or an intentional act of a party other than the employer).
If a person (other than the employer) caused an injury that results in certain Cal PERS benefits being paid, then Cal PERS has the right to recover up to one-half of the total retirement benefit costs payable due to this injury from the responsible party (G.C. section 20250).
The employer should also advise Cal PERS if it is aware that the member is pursuing a claim (other than a Workers' Compensation claim) against any person or entity for the same injuries that also entitle the member to a disability retirement from Cal PERS.
8. A statement from the employer identifying the disabling condition(s) and body part(s) involved: i.e., orthopedic (right knee), psychological, cardiovascular, internal (kidney), neurological (leg) or .other.
9. A statement from the employer that there is competent medical opinion certifying the disability
is expected to be permanent or last at least twelve consecutive months from the date of an
application for benefits or will result in death.
10. If Advance Disability Pension Payments (ADPP) have been or will be paid to the member, the employer must include the monthly amount and the beginning date. The employer must also provide the address to which the reimbursement check should be mailed.
Page 3 of 4

It is the employer's responsibility to report to CalPERS the amount of ADPP paid to a member. If an employer fails to notify Cal PERS of ADPP or if the member retires, the local agency and the employee shall arrange for repayment. CalPERS will not reimburse the employer in these situations.
All such documentation submitted by your agency must be signed by the governing body or its lawful delegate {i.e., City Manager, Chief Administrative Officer, County Executive, or other comparable individual). If the governing body chooses to delegate the responsibility of making a determination, a certified copy, which is approved and signed by the governing body, of the delegation order of this authority must a~company the finding by such. delegate in each instance; For Public Agency and Schools Reference Guide - Benefits Procedures and sample resolutions, please refer to the following link for further information:
https://www.calpers.ca.gov/docs/forms-publications/pas-ref-guide.pdf
Thank you for your assistance. Your cooperation is appreciated.
We are here to assist you. If you have any questions, please visit our website at www.calpers.ca.gov, or you may call us toll free at 888 Cal PERS {888-225-7377).
Sincerely,
Stacey Olsen Retirement Program Specialist
· Disability Retirement Section.
Enclosures: LS - 1st Letter to Member Authorization to Disclose Protected Health Information
cc: Salvador Vidales
Page 4 of 4

Pasadena Fire &: Police Retirement System
AGENDA REPORT
TO: Chair Jones and Board Members of the Fire
FROM: Jill Fosselman, Secretary to the Board
DATE: February 21, 2018
ITEM: Resolution No. 326 Setting the Cost of Living Adjustment Effective July 1, 2018
RECOMMENDATION
Upon review of the report and presentation, the Board may:
1. Adopt Resolution No. 326 setting the cost of living adjustment at an increase of 3% for all eligible retirees and beneficiaries per Charter Section 1509.8 to become effective July 1, 2018, as determined by Bartel Associates, FPRS actuary, or
2. Other action as determined by the Board.
BACKGROUND
Attached for the Board's review is Resolution No. 326 (see Attachment 1) that sets the cost of living adjustment ("COLA") at an increase of 3% for all eligible retirees and beneficiaries per Charter Section 1509.8, effective July 1, 2018. The resolution has been reviewed by System's counsel for conformance with the Plan.
Article XV, Section 1509.8 of the City Charter specifies that pension benefits under the Pasadena Fire & Police Retirement System be adjusted each July 1st "to approximate the nearest one percent of the percentage of annual increase or decrease in the cost of living as of January 1 of that year as shown by the then current Bureau of Labor Statistics Consumers Price Index for the Los Angeles-Long Beach Metropolitan Area." The System's Actuary, Bartel Associates, has prepared the recommended COLA adjustment using the published data from the Bureau of Labor Statistics with the Board-approved methodology. Using this methodology, the benefit adjustment for payments commencing July 1, 2018 is +3%. The attached letter from Bartel Associates (see Attachment 2) provides the COLA recommendation and supporting documentation.
FISCAL IMPACT
The estimated budget amount for retiree payroll that includes the 3% increase in COLA will be included in the FY 2019 Recommended Budget. There is no immediate fiscal impact on the FY 2018 Adopted Budget from this action.
ATIACHMENTS
1. Resolution No. 326 2. 2018 Cost of Living Adjustment letter from Bartel Associates (dated January 24, 2018)
February 21, 2018 Page 1 of 1
Resolution No. 326, 2017 Retiree COLA Adjustment
DATE: 2/21/2018ITEM#: 8

RESOLUTION NUMBER 326
MOTION by _____ that the following resolution be adopted:
WHEREAS, the Retirement Board of the Pasadena Fire and Police Retirement
System hereby determines that the adjustment for the cost of living that occurred in 2017
as computed by the formula set forth in Charter Section 1509.8 was 3%, and
WHEREAS, those eligible retired members and beneficiaries shall receive a 3%
adjustment to their cost of living effective July 1, 2018, and
NOW, THEREFORE, BE IT RESOLVED, that the Secretary to the Retirement Board
shall take all necessary steps to implement this determination and order of the Retirement
Board.
Motion duly seconded and carried by the following votes:
AYES:
NOES:
ABSENT:
Adopted by the Retirement Board at the regular meeting of _____ _
Keith Jones Chair, Retirement Board
Jill Fosselman Administrator/Secretary to the Board

411 Borel Avenue, Suite 101 San Mateo, California 94402 main: 650/377-1600 fax: 650/345-8057 web: www.bartel-associates.com
January 24, 2018
Jill Fosselman Retirement Adminstrator/Secretary Pasadena Fire and Police Retirement System 100 North Garfield Ave, Room N204 Pasadena, CA 91101-1726
Re: Pasadena Fire and Police Retirement System 2018 Cost of Living Adjustment
Dear Ms. Fosselman:
Article XV, Section 1509.8 of the City Charter specifies that pension benefits under the Pasadena Fire and Police Retirement System be adjusted each July 1st “to approximate the nearest one percent of the percentage of annual increase or decrease in the cost of living as of January 1 of that year as shown by the then current Bureau of Labor Statistics Consumers Price Index for the Los Angeles-Long Beach Metropolitan Area.”
It is our understanding that the Retirement Board currently determines the annual cost of living adjustment for July 1st by comparing the average annual Consumer Price Index for All Urban Consumers (CPI-U) for the Los Angeles-Riverside-Orange County area (Base Period 1982-84=100) as published by the Bureau of Labor Statistics for the calendar year immediately preceding the July 1st to that of the second preceding calendar year.
Using this methodology, the benefit adjustment for payments commencing July 1, 2018 is +3%. This is determined by calculating the increase or decrease in the average annual CPI-U for 2017 (256.210) as compared to the average annual CPI-U for 2016 (249.246) and rounding to the nearest one percent. (The 2018 COLA calculation is 256.210/249.246 - 1 = 2.79%, which is 3% when rounded to the nearest 1%.)
Please let us know if you have any questions.
Sincerely,
Matthew Childs Actuarial Analyst
c: Joseph R. D’Onofrio, Bartel Associates, LLC
O:\Clients\PasadenaFPRS\Projects\Pension\2018\COLA\BA PasadenaFPRS 18-01-24 Pension 18-06-30 COLA.doc
Attachment 2

Year Jan Feb Mar Apr May Jun Jul Aug Sep Oct Nov Dec Annual2003 185.2 186.5 188.2 187.6 186.4 186.3 186.3 186.9 188.2 187.8 187.1 187.0 187.02004 188.5 190.1 191.5 191.9 193.3 193.7 193.4 193.1 194.5 196.3 196.9 195.2 193.22005 195.4 197.4 199.2 201.1 201.5 200.7 201.4 203.1 205.8 206.9 205.6 203.9 201.82006 206.0 207.5 208.5 210.5 212.4 211.1 211.4 211.9 212.9 211.4 211.1 210.6 210.42007 212.6 214.8 216.5 217.8 218.6 217.3 217.5 217.3 217.7 218.7 219.9 219.4 217.32008 220.918 221.431 223.606 224.625 226.651 229.033 229.886 228.484 227.449 226.159 222.229 219.620 225.0082009 220.719 221.439 221.376 221.693 222.522 223.906 224.010 224.507 225.226 225.264 224.317 223.643 223.2192010 224.610 224.620 225.483 225.916 226.438 225.877 225.991 226.373 226.048 226.794 225.941 226.639 225.8942011 228.652 229.729 232.241 233.319 233.367 232.328 231.303 231.833 233.022 233.049 232.731 231.567 231.9282012 233.441 234.537 236.941 236.866 237.032 236.025 235.776 237.222 238.104 240.111 237.675 236.042 236.6482013 238.015 239.753 239.995 239.043 239.346 239.223 238.920 239.219 239.611 239.940 238.677 238.742 239.2072014 239.857 241.059 242.491 242.437 243.362 243.528 243.727 243.556 243.623 243.341 241.753 240.475 242.4342015 239.724 241.297 243.738 243.569 246.093 245.459 247.066 246.328 245.431 245.812 245.711 245.357 244.6322016 247.155 247.113 247.873 248.368 249.554 249.789 249.784 249.700 250.145 251.098 250.185 250.189 249.2462017 252.373 253.815 254.525 254.971 255.674 255.275 256.023 256.739 257.890 258.883 259.135 259.220 256.210
http://data.bls.gov/pdq/SurveyOutputServlet?series_id=CUURA421SA0,CUUSA421SA0
January 24, 2018
Consumer Price Index - All Urban Consumers (CPI-U)Los Angeles-Riverside-Orange County, CA
Base Period: 1982-84=100

Pasadena Fire & Police Retirement System
AGENDA REPORT
TO: Chair Jones and Board Members of the Fire & Police Retirement System
FROM: Jill Fosselman, Administrator •
DATE: February 21, 2018
ITEM: Finalist Proposer Presentations for Auditing Financial Services
RECOMMENDATION
Upon review of the presentations and proposals, the Board may:
1. Determine the successful proposer for auditing financial services and award the contract, and 2. Direct staff to return with the contract for the audit and auditing financial services for the three
fiscal years ending June 30, 2018, 2019 and 2020, with the option of two (2) subsequent fiscal years, subject to counsel review, or
3. Other direction as provided.
BACKGROUND
The System's contract with auditor Macias Gini & O'Connell LLP (11MGO") expired after the completion of the June 30, 2017 financial audit. The Request for Proposal (11RFP") for auditing financial services was released this past December to 11 prospective firms, including MGO. The RFP was also posted on the government RFP website, "Planetbid." Staff collaborated with the City Controller on the preparation of the RFP, development of the proposal invitation list, and evaluation of the proposals submitted.
A total of four proposals were submitted, which were then reviewed and evaluated for compliance with the RFP. All of the proposals were deemed responsive to the RFP, including meeting the mandatory criteria specified: the proposing firm must be licensed to practice as a certified public accounting firm in the State of California, and the firm must have had a quality control review completed within the past three years. Proposals were submitted by MGO, Brown Armstrong, Lance Soll & Lughard LLP ("LSL"), and Moss Adams LLP ("Moss").
The responses were evaluated and scored on: • Firm Qualifications (25 points). Properly licensed, certified public accounting firm authorized to
practice in the State of California. The size of the firm, including its governmental audit staff, and the location of the office from which the work on the engagement is to be performed. Proposers were asked to provide information on the circumstances and status of any disciplinary action taken or pending against the firm during the past three (3) years with state or federal regulatory
February 21, 2018 Page 1of4
June 30, 2018 - 2020 Auditing Financial Services
DATE: 2/21/2018ITEM#: 9

bodies or professional organizations. Experience with comparable engagements that were performed in the past five years were requested .
• Personnel Qualifications (30 points). The location(s) of the office(s) from which the work is to be done and the number of partners, managers and other professional staff employed at that office. Evaluation of senior in-charge and management staff, including engagement partner(s), managers, other supervisors and specialists who will be assigned to the engagement. Relevant information includes whether each such person is registered or licensed to practice as a certified public accountant in California, the government auditing experience of each person, including information on relevant continuing professional education for the past three (3) years, and membership in professional organizations relevant to the performance of this audit.
• Methodology (20 points). Responsiveness to the request to demonstrate an understanding of the audit services to be performed, including appropriateness and adequacy of proposed procedures, reasonableness of time estimates and timeliness of expected completion. A general description of the methodology, approach, tools, and resources to be used to conduct the audit, and a clearlydefined explanation regarding how the firm controls the quality of services and the objectivity of results.
• Price Proposal (25 points). The price proposal required an all-inclusive annual maximum cost. The total all-inclusive maximum price shall contain all direct and indirect costs including all out-ofpocket expenses. In addition, the price proposal shall include a listing of hourly rates for services should it become necessary for the System to request additional services to supplement the services requested in the RFP or to perform additional work as a result of the specific recommendations included in any report issued on this engagement.
• Local Preference (5 points). Bonus points awarded for Pasadena proposers. (No such proposer was eligible for Local Preference points.)
Proposals were independently evaluated by Jill Fosselman, Elaine Wong and Robert Ridley (City Controller). Next, the group reviewed the evaluations, prepared follow-up questions for each of the proposers, and then jointly called each proposer to clarify components of the proposal, as well as evaluate each proposer's ability to verbally communicate difficult auditing concepts. Lastly, each evaluator independently reevaluated and updated their scoring of the proposals following the calls. Finally, references were called and the top three firms were invited to present to the Board at the February Board meeting. Although a responsive proposal was submitted by the City's current auditor, LSL, the firm was not invited to continue in the process with the Board due to their limited public pension auditing experience relative to the other proposers.
References were asked about their experience with the proposing firms and the engagement personnel regarding general communication, availability, timeliness, and responsiveness to issues. References discussed their experience/observations regarding the firm's quality control procedures, and how proactive the auditors were with implementing new GASB pronouncements. Billing practices were discussed. All three firms received outstanding comments from their references.
The attached RFP for Auditing Financial Services dated December 2017 (see Attachment 1) provides the reference for the responsiveness of the proposals. Copies of each of the finalist proposals are attached to this report (see Attachments 2, 3, and 4).
February 21, 2018 Page 2 of 4
June 30, 2018 - 2020 Auditing Financial Services

BOARD INTERVIEW PROCESS
The three firms invited to interview with the Board are: MGO, Moss, and Brown Armstrong. The finalists were advised that each firm will have a maximum of 20 minutes with the Board for their presentation, including questions and discussion. They were further advised to limit their presentation to 10 minutes.
Name of Firm Average Score Year 1 Cost 3-Year Cost Macias Gini & O'Connell LLP 86 $47,500 $142,500 Moss Adams LLP 83.3 $42,500 $130,050 Brown Armstrong 76.7 $35,000 $105,000
Guidance was provided regarding the Board's expectation of their presentation. Specifically, proposers were asked to:
1. Introduce their firm and the engagement team, 2. Discuss the firm's and engagement personnel's experience with public sector pension
plans/California public pension plans (or relevant experience), and 3. Highlight attributes that differentiate their firm from other auditing firms.
The order of the presentations/interviews will be as follows: 1) Brown Armstrong, 2) Moss Adams LLP, and 3) Macias Gini & O'Connell LLP. Each firm was invited to bring handouts of their presentation to supplement their proposal, although this was not required.
FINALIST SNAPSHOTS
Overall, staff was very pleased with the caliber of the firms that submitted proposals. Each of the three finalist firms has demonstrated considerable depth in experience, resources and quality of work. All of the firms are highly respected in their field, have a reputation for excellence and have received very strong references.
Brown Armstrong (See Attachment 2) Attending: Andrew Paulden, CPA (Managing Partner and Engagement Partner), Alaina Sanchez, CPA (Engagement Manager) Location where work will be performed: Bakersfield and Laguna Hills, California
• Medium-sized regional firm with four offices (main office in Bakersfield), 40+ years • 18 partners and managers and 41 employees in the two offices supporting the engagement • Firm is focused on California public plans • Firm currently audits 20 California retirement and pension plans • Performed the annual financial audit for FPRS from 2006-2014 • Notable comments from references: "Super-efficient audit." "They rotate their focus and
seem to dig deeper every year." "Andy Paulden very proactive with GASB education, and great about rolling it out." "New field staff every year, may not know the system well enough to dig deeply." "Field work 3-4 days, well-oiled machine"
February 21, 2018 Page 3 of 4
June 30, 2018 - 2020 Auditing Financial Services

Moss Adams LLP (See Attachment 3) Attending: Kory Hoggan, CPA (Engagement Partner), Jim Lanzarotta, CPA (Quality Control Review Partner), Katie Weiss, CPA (Engagement Manager) Location where work will be performed: Los Angeles, California
Large-sized national firm ("largest non-Big Four accounting firm in California") with 12 offices in California, 100+ years in Pacific Northwest In California, 120 partners and 900+ employees Firm specializes in tax-exempt clients and all types of benefit plans (audits 180 defined benefits plans - including public defined benefit plans) Notable comments from references: "Very smooth." "Every year build in more tests ... very, very big on controls." "Good at communicating what the best practice would be." "Discuss issues beforehand, before they become a problem." "Very available and very responsive." "Especially great with explaining things to elected officials and our Board." "Proactive on GASB, lots of guidance and good policy-level guidance."
Macias Gini & O'Connell LLP (See Attachment 4) Attending: James Godsey, CPA (Engagement Partner), Amy Chiang, CPA (Engagement Manager) Location where most of the work will be performed: Los Angeles and Newport Beach, California
Large-sized national firm with 10 offices in California, 5 partners and 32 employees in the two offices supporting the engagement, 30+ years in California MGO's State and Local Government Industry Group is one of the largest in the country with 250+ audit professionals, including serving as the current auditors of CalPERS, CalSTRS, Oregon PERS and 22 of the largest city and county government retirements systems in California MGO provides audit and advisory services to eight of the 10 largest cities and six of the 10 largest counties in California Notable comments from references: "Love them!" "Have had since 2010, and just renewed contract following an RFP." "Always looking where an agency has risk, constantly shifting focus through hot items." "Went above and beyond regarding GASB, very good training and education, including sessions with the plan sponsor."
FISCAL IMPACT
The contract for auditing financial services is a three-year contract with two optional one-year extensions. Funds for the June 30, 2018 financial audit will be included in the Fiscal Year 2019 Recommended Budget. The current budget for auditing financial services is $49,500, of which a total of $45,934 was expended this fiscal year on the June 30, 2017 audit. Based on the quotes provided by the finalists, the range of the Fiscal Year 2019 budget request for auditing financial services will be between $35,000 and $47,500.
ATIACHMENTS
1. RFP for Financial Auditing Services dated December 2017 (without attachments) 2. Brown Armstrong, proposal dated January 18, 2018 3. Moss Adams LLP, proposal dated January 18, 2018 4. Macias Gini & O'Connell LLP, proposal dated January 18, 2018
February 21, 2018 Page 4 of 4
June 30, 2018 - 2020 Auditing Financial Services

City of Pasadena
PASADENA
I POLICE RETIREMENT SYSTEM
Fire & Police Retirement System
REQUEST FOR PROPOSAL For
FINANCIAL AUDITING SERVICES
For the Fiscal Years Ending June 30, 2018-2020
(Plus, two (2) optional 1-year extensions with Board approval)
December 2017
Pasadena Fire & Police Retirement System 100 North Garfield Avenue, N204
Pasadena, CA 91101 (626) 744-4320
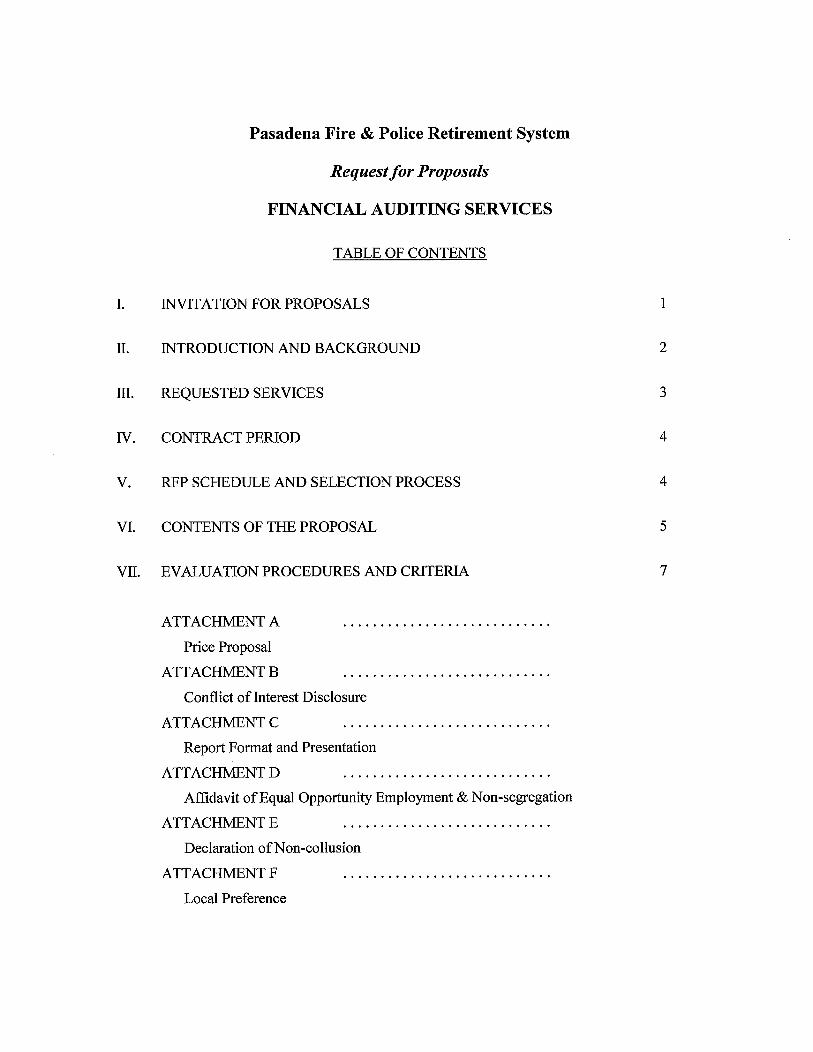
I.
IL
III.
IV.
v.
VI.
VIL
Pasadena Fire & Police Retirement System
Request for Proposals
FINANCIAL AUDITING SERVICES
TABLE OF CONTENTS
INVITATION FOR PROPOSALS
INTRODUCTION AND BACKGROUND
REQUESTED SERVICES
CONTRACT PERIOD
RFP SCHEDULE AND SELECTION PROCESS
CONTENTS OF THE PROPOSAL
EVALUATION PROCEDURES AND CRITERIA
ATTACHMENT A
Price Proposal
ATTACHMENT B
Conflict of Interest Disclosure
ATTACHMENT C
Report Format and Presentation
ATTACHMENT D
Affidavit of Equal Opportunity Employment & Non-segregation
ATTACHMENT E
Declaration of Non-collusion
ATTACHMENT F
Local Preference
1
2
3
4
4
5
7

Pasadena Fire & Police Retirement System
Request for Proposals
FINANCIAL AUDITING SERVICES
I. INVITATION FOR PROPOSALS
The Retirement Board ("Board") of the City of Pasadena Fire & Police Retirement System ("System") seeks the services of a qualified firm of certified public accountants to audit the System's financial statements for the three fiscal years ending June 30, 2018, 2019 and 2020, with the option of auditing its financial statements for each of the two (2) subsequent fiscal years.
Parties interested in responding ("Proposer") are asked to submit seven (7) paper copies and one electronic copy of the proposal no later than Thursday, January 18, 2018 by 5:00 pm to:
Jill Fosselman, Administrator Pasadena Fire & Police Retirement System
100 North Garfield A venue, Rm N204 Pasadena, CA 91101
All questions and requests for clarification/interpretation regarding the RFP, scope of work, or evaluation process must be directed in writing by email to the Retirement Office no later than Wednesday, December 20, 2017 to:
Elaine Wong Senior Office Assistant
Email: [email protected]
All questions will be answered to the extent practicable in the form of an addendum to the RFP. The addendum will be distributed to all intended recipients of the RFP, without divulging the source of the query, no later than Thursday, January 4, 2018.
Page 1

II. INTRODUCTION AND BACKGROUND
The System was established by the City of Pasadena City Charter, Article XV, in the early 1900's and has been in continuous operation since. The System was closed to new members on July 1, 1977, and is exempt from the regulation of the Employee Retirement Income Security Act of 1974 (BRISA), as well as is exempt from federal income taxes and California franchise tax. The System is a single-employer defined benefit retirement plan that provides service and disability retirement benefits and survivor benefits to approximately 240 retired employees and their beneficiaries (including 25 Domestic Relations Order payments). All members are in payment status and receive the same COLA adjustments, effective July 1 annually. There are three annuity options: Straight Life, 60% Joint and Survivor, and 100% Joint and Survivor. There is no retiree medical benefit.
The Board and the System are obligated under California law and Section 401(a) of the Internal Code to "exercise its responsibilities for the sole and exclusive benefit of the members and beneficiaries of the System." Benefits are administered by the Board, including, but not limited to: payment of retirement benefits, setting of employer contribution rates, investment of fund assets, and other such responsibilities traditionally performed by the fiduciary of a retirement system. The Board is comprised of five members: two are elected by retired Fire and Police members of the System; one is a member of the City Council, the legislative body of the City; and two are appointed by the legislative body.
Asset Class
US Large Cap
US Small Cap
Total Domestic Equity
International Equity
Total Equity
Core Fixed Income
Short-Term Gov't/Credit
Bank Loans
US TIPS
Total Fixed Income
Core Real Estate
Hedge Fund (Fund of Funds)
TOTAL Asset Allocation
Target
Allocation
16 4
20
20 40
20 10
10 5
45
10
5
100
As of June 30, 2017 the fiduciary net position for the Fund was $125,364,758. The Board contracts with an investment advisor to provide portfolio investment advice, including oversight of the System's portfolio and assets. All invested assets are held in trust by a custodial bank. The Board regularly reviews the System's asset allocation with the annual 10-year earnings projection. The Investment Policy Statement, as last approved by the Board on April 19, 2017, encompasses eleven asset classes and target allocations as illustrated in the following chart.
The System has two part-time employees (an Administrator and Senior Office Assistant, 0.75 FTE each) who are responsible for implementing the work of the Board, including
general benefits administration, managing retiree payroll, budget development and administration, and coordination with City divisions for financial processing and recording in the City's General Ledger. The Administrator is responsible for preparing the audit's MD&A, financial statements, notes to the financial statements and all related disclosures.
Page2

The Board contracts for an annual actuarial valuation, including development of plan sponsor contribution projections for the fund. The most recent actuarial valuation dated June 30, 2017 determined the Actuarial Value of Assets funded percentage of the plan was 82.5%. As of June 30, 2017, the Actuarial Value of Assets was approximately $122.4 million and the Actuarial Accrued Liability was $148.5 million.
III. REQUESTED SERVICES
The System's current auditor is Macias Gini & O'Connell ("MOO") who has conducted the audit for the past three years. During the fiscal year 2018 budget discussion, the Board expressed a desire to competitively rebid the System's long-term contracts upon their contract completion. The contract with MOO expired upon the Board's approval of the June 30, 2017 financial audit this past November. MOO has been invited to submit a proposal.
The System requests proposals from qualified firms of certified public accountants to audit its financial statements for the fiscal year ending June 30, 2018, 2019, and 2020, and two optional one-year extensions. The audits shall be performed in conformity to the then current professional standards for audits of local California government pensions, including all Federal, State, Governmental Accounting Standards Board, and other requirements. Compliance with the then current professional standards will not be considered a change of scope and will not result in a change to pricing. The results of the audit will be presented in a written report to the Board that contains the System's audited financial statements, findings, and recommendations for improvements in operations, internal controls, and accounting procedures. The auditor will also make an in-person presentation of such report to the Board. See Attachment C, Report Format and Presentation, for a description of the requested report. A copy of the recently approved report and audited financial statements for the fiscal year ended June 30, 2017 is available to proposers upon their request by contacting Ms. Wong by email at [email protected].
4. Detailed Audit Plan and PPC List 5. Fieldwork Begins
6. Draft Report Due 18-0ct-18 3rd Week October
7. Final Audit Report Due 13-Nov-18 One week befure Board meetin
8. Board Presentation fur A roval 21-Nov-18
Page3

Notes: The City's accounting records for the System's typically close in early August. Preliminary trial balance, general ledger detail, and estimated accruals will be provided prior to this date (or during the field visit). The final trial balance with supporting documentation for changes will be provided by early September.
Preparation of the notes and related schedules also rely upon the completion of the annual actuarial valuation. The final draft of the actuarial valuation is submitted to the Board for their review and approval at the Board's meeting in September. Upon its approval (generally in the third week in September), the final valuation will be provided to the auditor.
IV. CONTRACT PERIOD
The contract offered through this RFP is for three years, beginning with the audit period ending June 30, 2018, and will include a 30-day no fault termination clause. Subject to acceptable performance and cost, the contract may be extended by each of two (2) oneyear renewal periods upon mutual agreement. Proposers must be able to guarantee pricing for the first three years of the contract, as well as two optional one-year extensions. It should be noted that the System is closed and all members retired: thus, total membership (members and beneficiaries) continues to decrease annually. Proposers are encouraged to keep this in mind when developing their price proposal.
V. RFP SCHEDULE AND SELECTION PROCESS
The System anticipates following the schedule indicated below which will result in the approval of an auditing services contract by March 21, 2018. However, the System reserves the right to alter the schedule at any time.
December 4, 2017 December 20, 2017
18,2018 18-26, 2018 29-Februa 1, 2018
February 21, 2018
March 21, 2018
RFP Issued
Potential Candidate Interviews with the Board RFP Award Notification (initiate contract develo ment FPRS Board Contract A roval and Execution
Proposers may be invited to interview with a Proposal Review Committee and/or with the Board. Interviews may be conducted by phone, or will be held at City Hall, in the City of
Page4

Pasadena. Each such Proposer invited to interview will be notified of the specific date, time and location of their respective interview. Proposers invited to interview may do so at their own expense, which may not be included in the cost of the proposal.
The Board reserves the right to make an award without further discussion of the proposals received. Therefore, it is very important that proposals are submitted in the most complete manner possible.
Upon making the award, the Board shall provide written notification to all Proposers of its decision. Following, the contract between the Board and the successful Proposer shall be developed and executed as soon as reasonably practicable. However, the Board expects the contract to be executed no later than May 16, 2018.
VI. CONTENTSOFTHEPROPOSAL
Responses to this RFP must be submitted with seven (7) copies, including one ( 1) electronic copy, delineating the requested services and other required data as outlined within this section: A. Title Page: The proposal must identify the RFP subject, firm name, local address,
telephone number, name of contact person, contact person's phone number and email, and the date.
B. Table of Contents: The proposal must include a clear identification of the material included in the proposal by section and page number.
C. Transmittal Letter: The transmittal letter should not exceed two pages. It must provide the names of individual(s) authorized to make representations for the firm and their title(s), address( es), email address( es) and telephone number(s).
• The transmittal letter must be signed by the individual(s) authorized to bind the firm contractually.
D. Firm Qualifications: Verify that the firm is a properly licensed certified public accounting firm authorized to practice in the State of California. Proposer must state the size of the firm, the size of the firm's governmental audit staff, and the location of the office from which the work on this engagement is to be performed. If the Proposer is a joint venture or consortium, the qualifications of each firm comprising the joint venture or consortium should be separately identified and the firm that is to serve as the principal auditor should be noted, if applicable. In addition, the Proposer shall provide information on the circumstances and status of any disciplinary action taken or pending against the firm during the past three (3) years with state regulatory bodies or professional organizations.
For the firm's office that will be assigned responsibility for the audit, list the most comparable engagements (maximum - 3) performed in the last five years that are similar to the engagement described in this RFP. Indicate the scope of work, dates,
Page5

engagement partner(s), and the name and telephone number of the principal client contact.
E. Personnel Qualifications: Provide the location(s) of the office(s) from which the work is to be done and the number of partners, managers and other professional staff employed at that office. Describe the local office's capability to perform the audit, including the numbers and classifications of staff who will work on the audit. Identify the senior in-charge and management staff, including engagement partner(s), managers, other supervisors and specialists, who would be assigned to the engagement. Indicate whether each such person is registered or licensed to practice as a certified public accountant in California. Provide information on the government auditing experience of each person, including information on relevant continuing professional education for . the past three (3) years, membership in professional organizations relevant to the performance of this audit, relevant work experience, and years of auditing experience with your firm.
Engagement partners, managers, other supervisory staff and specialists may be changed if those personnel leave the firm, are promoted or are assigned to another office. These personnel may also be changed for other reasons with the express prior written permission of the System. However, in either case, the System retains the right to approve or reject replacements.
F. Methodology: The proposal must include a general description of the methodology, approach, tools, and resources to be used to conduct the audit ofFPRS. Explain how the firm controls the quality of services and the objectivity of results provided to clients.
G. Price Proposal: The completed and signed price proposal, Attachment A, must specify an all-inclusive annual maximum cost. The total all-inclusive maximum price shall contain all direct and indirect costs including all out-of-pocket expenses. In addition, the price proposal shall include a listing of hourly rates for services should it become necessary for the System to request additional services to supplement the services requested in this RFP or to perform additional work as a result of the specific recommendations included in any report issued on this engagement. Such additional work shall be performed only if set forth in an addendum to the contract between the System and the firm. • The Proposer should affirm that all prices, terms, and conditions would be held
firm for at least 90 days after the bid is submitted. • The Proposer must guarantee the conditions specified in the proposal for the
duration of the contract, which is for three years with two optional one-year extensions. (The contract shall be subject to a 60-day cancellation notice as set forth in the formal agreement.)
H. Additional Requested Forms and Information: In addition to the following items, the Proposer may include any additional information considered essential to the proposal in this section. The proposal should not include general information publications, such as directories or client lists.
Page6

• License. A copy of firm's license to practice in California. • Quality Control Review. Verify that the firm has participated in a quality control
review within the past three years that included a review of specific government engagements. The Proposer is required to submit a copy of the report on the firm's most recent external quality control review dated within three years of the date of response to this RFP.
• References. Provide at least three references for public pension plans for which the firm has recently performed a financial audit. For each reference, provide a brief synopsis of the services provided, the contact name, email address, and telephone number.
• Conflict of Interest. The Proposer must complete the Conflict of Interest Statement, Attachment B, and disclose any financial or other business relationship with the System that may affect the outcome of the contract. If there are none, a statement to that effect must be included. The Proposer shall also list current clients who may have a financial interest in the outcome of the contract. If there are none, a statement to that effect must be included.
• Affidavit of Equal Opportunity Employment & Non-segregation. The Proposer must complete the Affidavit, Attachment D, affirming the employment practices of the Proposing firm comply with all state and federal requirements.
• Declaration of Non-collusion. The Proposer must complete and sign the Declaration, Attachment E, affirming that all statements in such proposal are truthful, genuine, and non-collusive.
• Local Preference, if applicable. The System awards bonus points in the evaluation for Pasadena firms (see Attachment F).
• Vendor Data. The System requires that all parties entering into business transactions must provide their Taxpayer Identification Number.
• Relationship with the City. The Systems requires that the Proposer disclose the Proposer's professional relationships involving the City of Pasadena, or any of its component units/ agencies, for the past five (5) years together with a statement explaining why such relationships do not constitute a conflict of interest relative to performing the scope of services in this RFP.
A proposal under this RFP will not be considered complete unless it contains all of the items described within this section. Further, a proposal that is not submitted in complete form to the System by the due date will be rejected. Emphasis should be on completeness and clarity of content. Costs for developing the proposal, submission documentation, and interviews are entirely the responsibility of the bidder, and shall not be charged to the Plan.
VII. EVALUATION PROCEDURES AND CRITERIA
The merits of the proposals received will be evaluated in accordance with the criteria defined below. The Proposer is responsible for providing all information requested in this RFP; failure to do so may result in disqualification of the proposal. The evaluation committee will recommend to the Board selection of the proposal that is most responsive to the System's needs within available resources. The specifications identified in this
Page 7

RFP represent the minimum performance necessary to be deemed responsive.
A. Mandatory Criteria: • The firm must be licensed to practice as a certified public accounting firm in the
State of California. • The firm must have had a quality control review completed within the past three
years. A copy of the review must be included in the proposal.
B. Competitive Evaluation Criteria: Evaluation of the proposals will be based on a competitive selection process in which the evaluation will not be limited to price alone. The competitive selection evaluation criteria are as follows: • Firm Qualifications. Technical experience of the firm as documented by
experience in auditing similar entities and performing the type of work outlined; size and structure of the firm; ability to provide ongoing technical support when necessary. (25 points)
• Personnel Qualifications. Qualifications of staff to be assigned to the contract. The System expects the field senior in-charge to be a CPA with at least three years' experience in auditing public retirement systems. (30 points)
• Methodology. Responsiveness of the proposal in clearly stating an understanding of the audit services to be performed, including appropriateness and adequacy of proposed procedures, reasonableness of time estimates and timeliness of expected completion. (20 points)
• Price Proposal. Cost of contracted services. (25 points) • Local Preference. Local Pasadena businesses receive a 5% bonus. (5 points)
Other Considerations: • Work completed under this RFP is subject to the City of Pasadena's Minimum
Wage Ordinance, PMC Chapter 5.02 which requires employers to pay employees no less than the minimum wage set forth for each hour worked within the geographic boundaries of the city.
• Proof of Professional Errors & Omissions, Automobile Liability, General Liability, and Workers' Compensation insurance will be required of the successful Proposer.
• No personal contact should be made with any member of the Board regarding this RFP or any proposals submitted under this RFP.
• All proposals are open to the public after a contract is awarded. • The Board reserves the right to accept or reject, in part or in its entirety, any or all
proposals received as a result of this RFP, if it is in the best interest of the System to do so, with or without cause.
Page 8


Providing Auditing & Accounting
Services for 40 Years
i
SECTION 1 – Table of Contents
TABLE OF CONTENTS
Page
Section 1. Table of Contents ................................................................................ i
Section 2. Transmittal Letter ............................................................................... 1
Section 3. Executive Summary ............................................................................. 2
Section 4. Technical Proposal
a. Firm Qualifications .................................................................................... 3
b. Personnel Qualifications ............................................................................ 4
c. Methodology ............................................................................................ 5
d. Price Proposal .......................................................................................... 9
e. Additional Requested Forms and Information ............................................... 10
Section 5. Additional Data and Attachments
Attachment A – Resumes ............................................................................... 16
Attachment B – External Quality Control Review Report ..................................... 21

SECTION 2 Transmittal Letter
1
January 18, 2018
Jill Fosselman, Administrator
Pasadena Fire and Police Retirement System
100 North Garfield Avenue, Rm N204
Pasadena, CA 91101
Dear Ms. Fosselman:
Brown Armstrong Accountancy Corporation is pleased to respond to your
request for proposal to perform financial auditing services for Pasadena Fire
and Police Retirement System (System) for the fiscal years ending June 30,
2018, 2019, and 2020, with two (2) optional 1-year extensions with Board
approval.
Brown Armstrong is one of the largest regional accounting firms in California.
We have audited numerous agencies similar to yours for more than four
decades. We currently audit over 20 different retirement and pension plans.
Clients have continued to put their trust in us to provide them with excellent
service year after year, with us having served numerous clients continuously
for over 10 years.
I will be the engagement partner and primary liaison responsible for all
services to the System, and I am authorized to contractually bind the Firm. I
can be contacted at: 4200 Truxtun Avenue, Suite 300, Bakersfield, California
93309, Tel (661) 324-4971, Fax (661) 324-4997 or e-mail:
[email protected]. Our firm’s office website is www.bacpas.com.
Please call me if I can clarify or expand on any item contained in this
proposal. This proposal is a firm and irrevocable offer for ninety (90) days.
We appreciate the opportunity to continue to provide you with the outstanding
service you expect.
Sincerely,
BROWN ARMSTRONG
ACCOUNTANCY CORPORATION
By: Andrew J. Paulden, CPA
Managing Partner

Providing Auditing & Accounting
Services for 40 Years
2
SECTION 3 – EXECUTIVE SUMMARY
Executive Summary
We have thoroughly read your request for proposal and performed the due diligence
required to ensure that we completely understand the scope of the work to be done for the
Pasadena Fire and Police Retirement System (System). By submitting this proposal, we are
committing to perform the required work and issue our reports within the System’s time
frame. Our firm is the best qualified because of our benefit plan audit experience, our
involvement in CALAPRS, and our people.
We are the current auditors of several large governmental retirement plans as detailed in
the following page of this proposal. Mr. Paulden is a sponsoring member in CALAPRS.
Participation in this organization allows us to remain current on all administrative, legal, and
accounting issues impacting retirement systems. Our personnel assigned to your
engagement are experienced, professional, and take a “team” approach with client
personnel in the conduct of the audit.
We also have the experience necessary to assist you in implementing newly issued
accounting standards. As an example, we have assisted several clients as they implemented
GASB 67 (Financial Reporting for Pension Plans) GASB 68 (Accounting and Financial
Reporting for Pensions), and GASB 72 (Fair Value Measurements and Application).
Our firm, the engagement partner, and all assigned key professional staff are properly
licensed to practice public accounting in the State of California and are in good standing
with all licensing agencies. Our technical proposal follows.

Providing Auditing & Accounting
Services for 40 Years
3
SECTION 4 – TECHNICAL PROPOSAL
Technical Proposal
a. Firm Qualifications
Brown Armstrong is properly licensed to practice public accounting in the State of California.
Our Firm currently employs seventy-one (71) people, forty-three (43) of which are
professionals providing audit and accounting services to governmental entities. All services
to you will be provided from our Bakersfield and Laguna Hills offices.
All work provided to the System will be performed from our Bakersfield and Laguna Hills
office locations.
Brown Armstrong is not proposing as part of a joint venture or consortium.
Our Firm has not been the subject of any investigation, examination, complaint, disciplinary
action or other proceeding commenced by any state or federal regulatory body or
professional organization during the past three (3) years.
Brown Armstrong’s most comparable engagements performed in the last five (5) years are:
1. Santa Barbara County Employees Retirement System
Scope of work: Audit
Dates: June 30, 2012 to June 30, 2017
Engagement Partner: Andrew J. Paulden, CPA
Client Contact: Gregory Levin, Chief Executive Officer
Phone: (877) 568-2940
E-mail: [email protected]
2. Tulare County Employees Retirement Association
Scope of work: Audit
Dates: June 30, 2010 to Present
Engagement Partners: Andrew J. Paulden, CPA and Rosalva Flores
Client Contact: David Kehler, Retirement Administrator
Phone: (559) 730-2631
E-mail: [email protected]
3. Los Angeles City Employees’ Retirement System
Scope of work: Audit
Dates: June 30, 2005 to Present
Engagement Partners: Andrew J. Paulden, CPA and Rosalva Flores
All Staff Governmental Staff
Partners 10 Partners 7 Managers 10 Managers 6 Seniors 5 Seniors 4
Supervisors 4 Supervisors 2 Staff Accountants 21 Staff Accountants 21
Support Staff 21 Support Staff 3 Total 71 Total 43

Providing Auditing & Accounting
Services for 40 Years
4
SECTION 4 – TECHNICAL PROPOSAL
Client Contact: Rahoof (Wally) Oyewole, Departmental Audit Manager
Phone: (213) 978-6897
E-mail: [email protected]
b. Personnel Qualifications
All services provided to the System will be from our main office located in Bakersfield,
California, and Laguna Hills, California which are currently our closest offices to Pasadena,
California. Pertinent information for those offices are: (a): 4200 Truxtun Avenue, Suite 300,
Bakersfield, CA 93309 and 23272 Mill Creek Drive, Suite 255, Laguna Hills, CA 92653; (b)
telephone numbers: (661) 324-4971 and (949) 652-5422; (c) facsimile number: (661) 324-
4997. We also have offices in Fresno and Stockton. The Firm now employs 71 people as
follows as a whole. The numbers of partners, managers, and other professional staff for two
of our four offices that will be providing services to you are listed below.
Bakersfield Office Partners 9
Managers 7
Other Professional Staff 23
Laguna Hills Office Managers 2
The key professional staff that will be assigned to your engagement are as follows:
Name Position Office
Location
Years of Auditing
Experience at the
Firm
Andrew J. Paulden, CPA Engagement Partner Bakersfield 30
Lindsey McGuire, CPA Technical Review Partner Bakersfield 5
Alaina C. Sanchez, CPA Engagement Manager Laguna Hills 6
Marybeth Brooks, CPA Engagement Senior Bakersfield 4

Providing Auditing & Accounting
Services for 40 Years
5
SECTION 4 – TECHNICAL PROPOSAL
We believe we are providing a well-qualified audit team to the System’s engagement. Each
team member was selected based on their retirement and governmental audit experience,
their past experience with the System, their knowledge, and their overall commitment to
meet the complex deadlines and timeframes of the engagement. Each person identified as a
CPA is properly licensed to practice as a CPA in California. All identified personnel have
participated in audits of retirement systems and large and small governmental units. All
members regularly attend governmental and non-governmental continuing professional
education.
Attachment A of this proposal contains resumes for these and other team members detailing
their government auditing experience, information on relevant pension auditing, continuing
education, and membership in professional organizations relevant to the performance of
your audit.
Each year Brown Armstrong organizes four days of CPE seminars in Bakersfield (two, two-
day sessions covering 32 hours of CPE) for its professional staff and clients’ personnel. One
of the two-day CPE seminars is in the middle of January. It covers accounting and auditing
updates relating to for-profit businesses (FASB, PCAOB, and SAS). The other two-day CPE
seminar covering primarily governmental accounting and auditing updates (GASB,
Yellowbook, Single Audit) is typically in May. The course material covers emerging issues,
current pronouncements, auditing standards, risk alerts, information systems, reporting
issues, and other topics of interest which concern auditing and accounting with an emphasis
on governmental issues. Course materials are prepared by professional lecturers, our
partners, managers, and seniors based on their own experience, research, and learning.
Last year’s attendance included Brown Armstrong professionals and nearly 60 clients and
their accounting staff. All staff assigned to governmental entities meet the CPE
requirements in accordance with Government Auditing Standards.
We want to provide the most stable staffing available during our partnership. Excessive
personnel turnover can complicate engagements and decrease the efficiency of the audit
due to “catch-up” time needed. We acknowledge that no “key” personnel member will be
removed or replaced without prior written consent of the System. Any staffing replacements
during the term of the engagement will be of equal or greater qualifications and experience
of the staff that they replace.
c. Methodology
We emphasize "hands-on" partner involvement and consistency of staff assignments in our
audits. We believe this emphasis benefits our clients in two ways:
1. A superior, quality audit is delivered on time; and
2. We reduce the cost of the audit - in audit fees, and in that unseen cost, the "training
of an auditor" unfamiliar with the System’s personnel and procedures.
Planning and Scope of Work:
The objective of the planning phase is "to meet and confer with the appropriate Personnel;
provide them with verbal and written progress reports; and coordinate activities regarding
this audit will be met as follows:
Hold a conference with management to discuss the scope of the examination,
availability (vacation schedules) of your staff, and coordination of our audit efforts
with your efforts to produce the required financial reports.

Providing Auditing & Accounting
Services for 40 Years
6
SECTION 4 – TECHNICAL PROPOSAL
Hold conferences with all personnel involved in the engagement to discuss the scope
and timing of the engagement, and anticipated areas of audit emphasis.
The Engagement Partner and/or Engagement Manager will provide verbal and/or
written progress reports to Management, as required.
The Engagement Manager or Senior accountant will coordinate activities with
Management and submit information request (PBC lists) on or before the agreed
upon dates.
Key team members will meet with appropriate personnel throughout the process as
required in fulfilling the scope of this engagement.
The Engagement Manager will develop and submit a calendar of audit activities
("Critical Dates List") and requests to Management at least one month in advance of
performing the fieldwork. This will help us stay ahead of deadlines establish by the
System and our audit teams.
Perform risk assessment procedures.
Determine planning materiality for financial statements audits.
Perform preliminary analytical review.
Identify significant audit areas and determine nature and extent of audit procedures
for each of the significant audit areas.
Inquiry of your predecessor auditor.

Providing Auditing & Accounting
Services for 40 Years
7
SECTION 4 – TECHNICAL PROPOSAL
Testing, Internal Controls and Compliance, and Statistical Sampling:
Interview and becoming familiar with the System will be achieved primarily during our
onsite fieldwork visit by performing the following procedures:
Reviewing all related documents, policies, procedures, and day-to-day practices
regarding the System.
Performing interviews in person and via questionnaires with the System
representatives who are involved in the decision making process and handling of
items.
Evaluating the preceding points according to best practices and other applicable
accounting and security practices.
Perform SAS 99 (Fraud evaluation) procedures.
Study and Evaluation of Internal Control in Connection with the Financial
Statement Audit:
This is the cornerstone of the examination. Internal accounting control generally comprises
the plan of the organization and the procedures and records that are concerned with the
safeguarding of assets and the reliability of financial records. We will begin by preparing
memorandum to describe the internal control system. These memorandums are prepared
based on information obtained through our inquiry and observation of the System
personnel, walk-throughs of processes, and from our review of the System organizational
charts, procedural manuals and programs, and documented financial and management
information systems. Our memorandum will then be reviewed to isolate significant strengths
and weaknesses that would affect the extent of our substantive audit procedures to be
employed. Each strength is then tested and the results subjected to evaluation. These
evaluations assist us in determining the amount of reliance we can place on the significant
strengths we have identified. At this point we make adjustments to our auditing plan to
compensate for the significant strengths and weaknesses thus identified and substantiated.
We will have a progress conference with Management to summarize the results of our study
and evaluation of internal control. This conference will occur in accordance with the
approved “Critical Dates List”.

Providing Auditing & Accounting
Services for 40 Years
8
SECTION 4 – TECHNICAL PROPOSAL
Analytical Procedures, Year End Fieldwork:
Based on the results of our study and evaluation of the internal control structure, the results
of our participant testing, and the results of our planning analytical procedures, we prepare
our final audit plan. The plan is documented in our audit programs in accordance with
generally accepted auditing standards and reviewed by the engagement partner for
approval.
In this phase of the examination, we obtain sufficient competent evidential matter to afford
a reasonable basis for our opinions and reports. This evidential matter is obtained through
the performance of substantive procedures consisting of inspection, observation, inquiry,
confirmation, and analytical tests. We will confirm account balances using client prepared
confirmations.
At the end of our fieldwork, we will have an exit conference with Management. The purpose
of this meeting will be to summarize the results of our fieldwork and to review significant
findings. As part of this conference, we will review significant audit adjustments and items
needed to complete the audit, if any exist. We will also review significant commitments and
contingencies discovered during our audit and the need for disclosure. This conference will
occur at the end of fieldwork.
Supervision and Review:
The review process is constant throughout the engagement. Each working paper prepared
by a staff is reviewed by the engagement manager. The engagement partner then reviews
all working papers. To be effective, the reviews must be conducted as the engagement
progresses and as each important step is completed. Our procedure is for the audit
manager and partner to review the work at the conclusion of each significant task through
the engagement as an integral quality control procedure. An audit partner not directly
involved in the engagement then reviews the financial statements and reports for
concurrence prior to report issuance.
Computer Software:
All key personnel assigned to your audit have computer application skills and experience in
auditing computerized accounting systems. Each staff person has access to a personal
computer, and has knowledge of CCH Pfx Engagement software we have purchased for
auditing and report writing. We use this software in the beginning, inputting all prior year
actual numbers. We then input year-to-date numbers and run analytical work at the end of
the audit comparing appropriation-expenditure numbers to prior year. All significant
differences are investigated. Our software is capable of complete report writing.
Our laptops have both hard drive encryption technology and tracking software to help us
locate them in the case they are lost or stolen, and client data is regularly cleared off the
local drives after jobs are finished. The data on each laptop in our main auditing software
(CCH Pfx Engagement) is synced both with the central file room in our office and between
each laptop in the field so there are multiple copies of the data available in case a laptop
fails.

Providing Auditing & Accounting
Services for 40 Years
9
SECTION 4 – TECHNICAL PROPOSAL
a. Price Proposal

Providing Auditing & Accounting
Services for 40 Years
10
SECTION 4 – TECHNICAL PROPOSAL
b. Additional Requested Forms and Information
License:
The following is a copy of firm’s license to practice in California.
Quality Control Review:
As part of our commitment to quality control, our firm is a member of the Center for Public
Firms Auditors Section (Center) of the American Institute of Certified Public Accountants
(AICPA). We have completed several External Quality Control reviews under the AICPA's
guidance, all of which included one or more governmental audits. Attachment B of this
proposal contains a copy of our most recent report. As indicated in that report, our Firm
received a peer review rating of a “pass,” which is the highest rating available.
References:
Three (3) references for public pension plans, of which the firm has recently performed a
financial audit are included in the table below.
Name and Address Scope of
Work
Rahoof (Wally) Oyewole, Department
Audit Manager
Los Angeles City Employees Retirement
System
(213) 978-6897
Financial
Audit
Carl Nelson, Executive Secretary
San Luis Obispo County Pension Trust
(805) 781-5465
Financial
Audit
Jeff Wickman
Marin County Employees’
Retirement Association
(415) 473-3733
Financial
Audit

Providing Auditing & Accounting
Services for 40 Years
11
SECTION 4 – TECHNICAL PROPOSAL
Conflict of Interest:

Providing Auditing & Accounting
Services for 40 Years
12
SECTION 4 – TECHNICAL PROPOSAL
Affidavit of Equal Opportunity Employment and Non-segregation:

Providing Auditing & Accounting
Services for 40 Years
13
SECTION 4 – TECHNICAL PROPOSAL
Declaration of Non-collusion:

Providing Auditing & Accounting
Services for 40 Years
14
SECTION 4 – TECHNICAL PROPOSAL
Local Preference, if applicable:

Providing Auditing & Accounting
Services for 40 Years
15
SECTION 4 – TECHNICAL PROPOSAL
Vendor Data:
Brown Armstrong’s Taxpayer Identification number is 95-3109182.
Relationship with the System:
Our firm, the proposed partner in charge, or the engagement manager have no potential or
actual conflicts of interest in providing services to the System. Brown Armstrong previously
provided auditing services to the City of Pasadena from 2011 to 2014. These relationships
do not constitute a conflict of interest relative to performing the proposed audit.

Providing Auditing & Accounting
Services for 40 Years
16
SECTION 5 – ADDITIONAL DATA AND ATTACHMENTS
Attachment A
Resumes
Education California State University,
Chico, 1985
Bachelor of Science Degree in
Business Administration with a Concentration in Accounting
Andrew J. Paulden, CPA Engagement Partner
Andrew is a principal with over 30
years experience in governmental accounting. He has grown within the firm serving a diverse client base. His
expertise ranges from special districts and retirement systems to municipal
entities and nonprofit organizations. Andrew enjoys working “hands-on” with his clients and will never be too
far away from audit procedures.
Andrew has always ensured that we have the highest level of audit, tax, and consulting services for all of his
clients. He is actively involved in a number of professional organizations
such as the American Institute of Certified Public Accountants, and the California Society of Certified Public
Accountants. He will use this valuable experience to assist the System in
continuing to improve your financial
reports.
Roles and Responsibilities on the Engagement Overall responsibility for the audit
and delivery of client service.
Approves the overall audit risk
assessment and audit procedures.
Communicates with executive
management, and members of the
System, regarding audit planning,
fieldwork and reporting.
Available throughout the year to
ensure proactive issue identification
and service delivery.
Clients Served *Only selected clients are listed
Benefit Plans Los Angeles Fire and Police Pension System Los Angeles City Employees' Retirement System Los Angeles County Employees' Retirement
Association Contra Costa County Employees' Retirement
Association City of Fresno Retirement Systems Fresno County Employees' Retirement Association Imperial County Employees' Retirement System Marin County Employees' Retirement Association
San Diego County Employees' Retirement Association
San Francisco Bay Area Rapid Transit Deferred Compensation Plan
San Francisco Bay Area Rapid Transit Money Purchase Plan
San Luis Obispo County Pension Trust San Mateo County Employees' Retirement
Association Santa Barbara County Employees' Retirement
System
Sonoma County Employees' Retirement Association Tulare County Employees' Retirement Association Ventura County Employees' Retirement Association

Providing Auditing & Accounting
Services for 40 Years
17
SECTION 5 – ADDITIONAL DATA AND ATTACHMENTS
Roles and Responsibilities
Performs a second review of
the financial statements and
other reports to provide
additional assurance that the
audit confirms to the firm and
professional standards.
Available to assist the team
with technical matters.
Lindsey is a partner in Bakersfield with more
than 11 years of governmental auditing
experience. She has been with the firm
since August 2012 and her primary business
focus is governmental entities audit and
accounting. Her auditing and accounting
specialties include retirement systems and
municipalities.
Not only does she have experience in the
audit process, but she will be an integral
member of the team when it comes to
keeping standards up to date. Lindsey is
actively involved in a number of professional
organizations such as the American Institute
of Certified Public Accountants and the
California Society of Certified Public
Accountants.
Lindsey McGuire, CPA Technical Review Partner
Education
Azusa Pacific University, 2006
Bachelors of Science Degree in
Accounting
Clients Served *Only chosen clients are listed
Benefit Plans Public Employees’ Retirement System of Nevada San Joaquin County Employees’ Retirement Association Southwest Contractors, Inc. Profit Sharing Plan
San Luis Obispo County Pension Trust Kern County Deferred Compensation Plan Riverside County 401a Plan

Providing Auditing & Accounting
Services for 40 Years
18
SECTION 5 – ADDITIONAL DATA AND ATTACHMENTS
Roles and Responsibilities
1. Reports to the Partners
regarding audit and technical
matters
2. Assists in the coordination of
planning, fieldwork, and
reporting matters
3. Reviews audit documentation
for significant audit areas
4. Is in constant communication
with executive management
and members of the County
regarding audit planning,
fieldwork, and reporting
Alaina is an audit manager and located in our
Laguna Hills office. She has more than 7
years of governmental auditing experience at
Brown Armstrong. Her primary business
focus is governmental entities audit and
accounting. Her audit specialties include
retirement systems, cities, and counties.
Alaina will be highly involved in the fieldwork
and a face to face presence for Brown
Armstrong. She and the senior accountant
will be easily accessible for the System at all
times. Her ability to manage an audit has
become invaluable for Brown Armstrong. She
is actively involved in a number of
professional organizations such as the
American Institute of Certified Public
Accountants and the California Society of
Certified Public Accountants.
Alaina C. Sanchez, CPA Engagement Manager
Education
California Polytechnic State
University, San Luis Obispo, 2009
Bachelor of Science Degree in
Business Administration,
Concentration in Accounting
Clients Served *Only chosen clients are listed
Benefit Plans Pasadena Fire and Police Retirement System Los Angeles County Employees’ Retirement Association San Luis Obispo County Pension Trust Tulare County Employees’ Retirement Association Santa Barbara County Employees’ Retirement
System City of Fresno Retirement System Kern County Deferred Compensation Plan County of Orange 457 Defined Contribution Plan Imperial County Employees’ Retirement System San Francisco Bay Area Rapid Transit Deferred
Compensation Plan San Francisco Bay Area Rapid Transit Money
Purchase Plan Ventura County Employees' Retirement Association

Providing Auditing & Accounting
Services for 40 Years
19
SECTION 5 – ADDITIONAL DATA AND ATTACHMENTS
Marybeth Brooks, CPA Engagement Senior
Marybeth is an audit senior with
four years of governmental auditing experience. She has shown excellent performance in
leading fieldwork, compiling and preparing financial statements,
performing tests and analytical reviews, as well as creating strong working relationships with clients.
She has executed audits in the past with little issues and is great
at maximizing efficiency while performing audit work.
Roles and Responsibilities Leading fieldwork audit
team Reviews, analyzes, and
documents client internal
controls Completes complex audit
procedures Researches and performs
tests and analytical reviews
on issues under direction of the Engagement Manager
Reviews financial statements and workpapers before sending the drafts to
Engagement Manager and partners for further review.
Education California State University, Bakersfield
Bachelor of Science Degree in Business Administration, Concentration in Accounting
Clients Served *Only selected clients are listed
Benefit Plans Fresno County Employees’ Retirement
Association Imperial County Employees’ Retirements
System Los Angeles City Employees’ Retirement
System
Marin County Employees’ Retirement Association
Tulare County Employees Retirement System Los Angeles County Employees’ Retirement
Association San Diego County Employees’ Retirement
Association
Ventura County Employees’ Retirement Association

Providing Auditing & Accounting
Services for 40 Years
20
SECTION 5 – ADDITIONAL DATA AND ATTACHMENTS
Continuing Professional Education *Relevant Education Listed
Andrew J. Paulden, CPA Single Audits: A Case Study Approach, 2017 Single Audit Update, Internal Control Challenges, and Fraud, 2016 GASB Update and Common Accounting & Financial Reporting Issues, 2016 GASB 68 and 71: New Pension Standards, 2016 Governmental Accounting and Auditing Conference, 2015 Audit Update and Pension Accounting/Financial Reporting, 2015 GAAP Update, 2017 Practical Approach to Prevention and Detection, 2017 Single Audit Update, Internal Control Challenges, and Fraud, 2016 Ethical and Legal Standards for CPAs, 2016 Public Company Update: SEC, PCAOB, and Other Developments, 2016 U.S. GAAP and IFRS Divergence, 2015
Lindsey McGuire, CPA Common Financial Statement Deficiencies, The Financial Reporting Model Project and GASB Agenda, 2017 GASB 74/75-OPEB and GASB Update GAAP Update, 2017 Practical Approach to Prevention and Detection, 2017 Single Audits: A Case Study Approach, 2017 Ethical and Legal Standards for CPAs, 2016
Public Company Update: SEC, PCAOB, and Other Developments, 2016 GASB Update/Fiduciary Responsibilities of Public Officials, 2015 Audit Update and Pension Accounting/Financial Reporting, 2015 Fraud and the CPA Profession, 2015 Accounting and Auditing Update, 2015
Alaina C. Sanchez, CPA Auditing Employee Benefit Plans, 2017 Audits of 401k Plans, 2017 GAAP Update, 2017 Practical Approach to Prevention and Detection, 2017 Single Audits: A Case Study Approach, 2017 Single Audit Update, Internal Control Challenges, and Fraud, 2016 GASB Update and Common Accounting & Financial Reporting Issues, 2016 Ethical and Legal Standards for CPAs, 2016 Public Company Update: SEC, PCAOB, and Other Developments, 2016 GASB Update/Fiduciary Responsibilities of Public Officials, 2015 Audit Update and Pension Accounting/Financial Reporting, 2015 Accounting and Auditing Update, 2015 Fraud and the CPA Profession, 2015 Audit Quality Discussion Part I: Avoiding Common Audit Deficiencies in SLG Financial Audits, 2015
Marybeth Brooks, CPA Common Financial Statement Deficiencies, The Financial Reporting Model Project and GASB Agenda, 2017 GASB 74/75-OPEB and GASB Update Employee Benefit Plans Annual Audit Conference Webcast, 2017
GAAP Update, 2017 Single Audits: A Case Study Approach, 2017 GASB Update and Common Accounting & Financial Reporting Issues, 2016 Single Audit Update, Internal Control Challenges, and Fraud, 2016 Ethical and Legal Standards for CPAs, 2016 Public Company Update: SEC, PCAOB, and Other Developments, 2016 GASB Update/Fiduciary Responsibilities of Public Officials, 2015 Audit Update and Pension Accounting/Financial Reporting, 2015 Accounting and Auditing Update, 2015

Providing Auditing & Accounting
Services for 40 Years
21
SECTION 5 – ADDITIONAL DATA AND ATTACHMENTS
Attachment B
External Quality Control Review Report

FINANCIAL AUDITING SERVICES PROPOSAL FOR
PASADENA FIRE & POLICE RETIREMENT SYSTEM
Kory Hoggan, Engagement Leader (505) 878-7214
[email protected] Submitted on January 18, 2017
Moss Adams LLP 10960 Wilshire Boulevard, Suite 1100
Los Angeles, CA 90024 (310) 477-0450
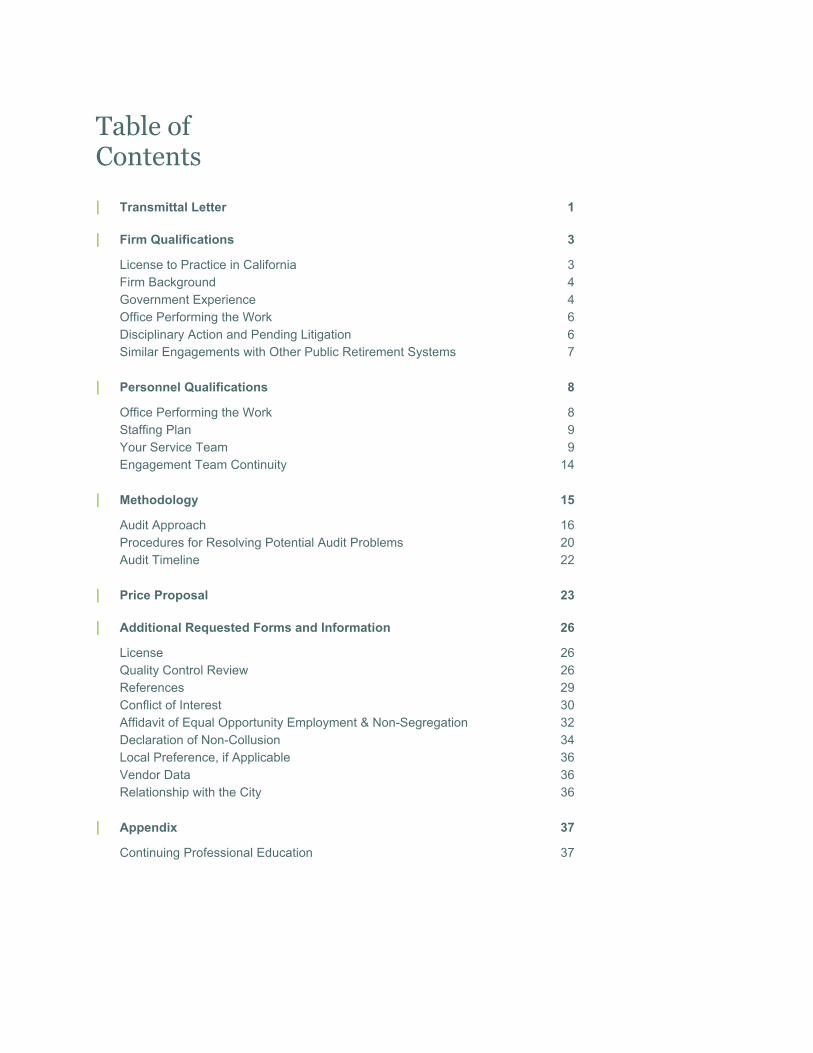
Table of Contents
| Transmittal Letter 1
| Firm Qualifications 3
License to Practice in California 3 Firm Background 4 Government Experience 4 Office Performing the Work 6 Disciplinary Action and Pending Litigation 6 Similar Engagements with Other Public Retirement Systems 7
| Personnel Qualifications 8
Office Performing the Work 8 Staffing Plan 9 Your Service Team 9 Engagement Team Continuity 14
| Methodology 15
Audit Approach 16 Procedures for Resolving Potential Audit Problems 20 Audit Timeline 22
| Price Proposal 23
| Additional Requested Forms and Information 26
License 26 Quality Control Review 26 References 29 Conflict of Interest 30 Affidavit of Equal Opportunity Employment & Non-Segregation 32 Declaration of Non-Collusion 34 Local Preference, if Applicable 36 Vendor Data 36 Relationship with the City 36
| Appendix 37
Continuing Professional Education 37

Moss Adams | Proposal for Pasadena Fire & Police Retirement System 1
January 18, 2018 Ms. Jill Fosselman Administrator
Pasadena Fire & Police Retirement System 100 North Garfield Avenue Rm N204 Pasadena, CA 91101
Transmittal Letter
Dear Ms. Fosselman:
We’re excited about the opportunity to work with the Pasadena Fire & Police
Retirement System (the System). We understand you’re looking for a firm to provide
financial audit services for the three fiscal years ending June 30, 2018, 2019, and
2020, with the option of auditing its financial statements for each of the two
subsequent fiscal years.
These are challenging times for public retirement systems. Budget constraints on
funding, fiduciary responsibilities, uncertain global markets that present challenges
to the system’s investment policy and managing risks, new accounting and reporting standards, and pressures from governments and credit rating agencies to maintain or
improve the funded status and minimize reported net pension liability are only a few
of the hurdles that retirement boards and management face in effectively providing
services to their employers and members.
As the System considers an independent accounting firm to conduct its financial
audit, you should consider a firm that has the experience, resources, and
qualifications to best assist you in meeting these challenges and being successful; a
firm that provides a fresh perspective on your financial statements and internal
procedures and can offer meaningful suggestions based on the technical standards and best practices among other retirement systems.
The System is dedicated to providing the highest level of retirement services and
managing system resources in an effective and prudent manner. You’ll be choosing a
firm that will not only conduct your financial audit, but also become a valuable
resource in fulfilling this mission. The firm that is the best fit will be the one that not
only meets your criteria, but also clearly provides the greatest value for the
investment of our time and limited resources in the audit process. We believe that
Moss Adams is the right choice for the following reasons:
Deep specialty in public employee retirement systems (PERS). As one
of the 15 largest accounting firms in the nation, we have the depth of resources
necessary to serve the System with firmwide resources at our disposal. Our
national PERS team serves as independent auditors to many public retirement
systems. We have a deep understanding of the accounting and operational issues
facing stand-alone PERS and will provide our firm’s top industry professionals to
the System.

January 18, 2018
Ms. Jill Fosselman Administrator
Pasadena Fire & Police Retirement System 100 North Garfield Avenue Rm N204 Pasadena CA 91101
• Experience with audits of governmental entities. Moss Adams is committed to serving governmental entities. We have numerous client service professionals who focus on governmental units that apply accounting principles promulgated by the Governmental Accounting Standards Board (GASB). All of the team members who will senre the System specialize in providing services to governmental and PERS entities.
• Open, timely, and effective communication. Part of the value we provide to you is a commitment to maintaining close and regular contact with you throughout the year. We're not once-a-year auditors who disappear for many months, only to return in time for the next audit. We're a hands-on resource with a bias for action and a constant resource for questions and advice.
• Fresh point of view. Moss Adams and our PERS professionals have worked closely ·with many clients in facilitating the transition of their financial audits from other accounting firms. We'll minimize disruption to you and your staff and make the transition period as smooth as possible. Rotation of auditors assures that a fresh set of eyes is overseeing yom audit. With a new perspective, we can suggest different ways to make your organization more efficient and cost effective. Our fresh viewpoint combined with our depth of experience is designed to result in a quality audit that properly assesses and responds to your unique risks and challenges.
With client service and open communication placed above all else, we're enthusiastic about the opportunity to serve the System and to provide efficient and effective solutions for your audit and compliance needs. Moss Adams has a dedicated service group of trained professionals who perform audits and consulting for public and private sector retirement plans, and we offer year-round availability and flexibility in our scheduling to complete your audit early. Kory Hoggan is designated as the primary liaison to the System and is also authorized to bind Moss Adams in a contract. His contact information is included below. Thank you for your consideration of our proposal. We're excited about this opp01iunity and about beginning a new relationship with you.
Sincerely,
~~~A 10960 Wilshire BouleYard , Suite 1100 Los Angeles, CA 90024 [email protected] (505) 878-7214

Moss Adams | Proposal for Pasadena Fire & Police Retirement System 3
Firm Qualifications
We’re pleased to present this proposal to the System. The proposal has been prepared providing a straightforward and concise description of Moss Adams capabilities and understanding of the work to be performed for the System.
LICENSE TO PRACTICE IN CALIFORNIA
With offices in San Francisco, Silicon Valley, Los Angeles, Woodland Hills, San Diego, Sacramento, Stockton, Santa Rosa, Napa, Walnut Creek, Fresno, and Irvine, Moss Adams LLP is duly licensed to practice public accountancy in the state of California. Senior members of the audit team who reside in California are individually licensed in California. Senior members of the audit team who don’t reside in California are duly licensed in their state of residence and will have practice privileges for California, as appropriate. All team members proposed are full-time employees.
Our Commitment to California
Moss Adams has long maintained a strong presence in the Golden State, growing our footprint in both Northern and Southern California to 12 locations, with approximately 120 partners and more than 925 employees. And we aren’t stopping there. Recently we’ve added expertise to our California teams, relocating senior-level practitioners from Oregon and Washington to bolster the resources we can offer in key industries and service areas.
With its complex state and local tax structure and maze of regulatory agencies, California presents a number of challenges to businesses based in the state and those hoping to do business there. Moss Adams has the resources, conveniently located offices, and technical expertise to help you navigate your way to success.
The Largest Non–Big Four Firm in California
You want to work with a firm that has a deep pool of resources, but you’re not interested in paying Big Four fees or working with their leverage model that means little attention from senior-level professionals. Moss Adams is a strong alternative to the Big Four firms in California and offers the perfect balance of big-firm resources with high levels of partner attention.

Moss Adams | Proposal for Pasadena Fire & Police Retirement System 4
FIRM BACKGROUND
Moss Adams is a fully integrated professional services firm dedicated to growing, managing, and protecting prosperity. With over 2,900 professionals and staff across more than 25 locations in the market capitals of the West and beyond, we work with the world’s most innovative, dynamic, and promising clients and markets. Through a full spectrum of accounting, consulting, and wealth management services, we bring the deep industry specialization and inspired thinking our mid-market clients seek.
Since we put down roots in the Pacific Northwest more than 100 years ago, we’ve steadily expanded to serve clients not only in the West, but also across the nation and globally. Our full range of services includes accounting (assurance and tax), consulting (IT, strategy & operations, transactions, and specialty), as well as individual and institutional wealth management.
Moss Adams is one of the 15 largest US accounting and consulting firms and a founding member of Praxity, AISBL, a global alliance of independent accounting firms providing clients with local expertise in the major markets of North America, South America, Europe, and Asia.
GOVERNMENT EXPERIENCE
Moss Adams has a firmwide team of over 180 professionals providing services within a group of specialized practices including governments, higher education institutions, not-for-profits, tribal and gaming entities, energy and utility entities, and federal contractors. The vast majority of these professionals specialize primarily—if not exclusively—in serving tax-exempt entities. This team currently serves almost 1,500 clients throughout the United States and provides more than 250,000 hours of service to those clients each year.
You’ll receive a more effective audit from our specialized professionals who have a deep understanding of your industry. They have significant experience working with governmental organizations and PERS, making them more likely to spot potential problems, create effective solutions, and understand the trends.
Tax-Exempt Clients Served Firmwide
Type of Plan Number of Plans Audited
TYPE NUMBER ALL PLANS 1,584
Not-for-Profit 1,265 Defined Contribution Plans 1,177
Government 200 Defined Benefit Plans (including PERS) 180
Data as of March 2017 403(b) Plans 119
Health & Welfare Plans 72
Employee Stock Ownership Plans 36

Moss Adams | Proposal for Pasadena Fire & Police Retirement System 5
Our Government Industry Involvement
Moss Adams stays on the leading edge of the government industry, including PERS, through our continued involvement in associations and with standard-setting entities. For these and other national and regional entities, our professionals attend annual meetings, trade shows, lectures, and industry-specific events as guests, speakers, and trainers.
From our clients’ perspective, these factors speak to the deep knowledge and expertise the professionals at Moss Adams possess—knowledge and expertise we bring to each client engagement. It means the Moss Adams accountants and consultants who serve you have been trained and mentored by some of the brightest minds in the accounting profession.
It also means, in addition to helping us stay abreast of evolving issues in accounting, our leadership roles give us a place at the table when regulatory bodies consider matters of vital importance. Some of our affiliations are noted in the following table and many of your team members have spoken at these events.
Type Our Industry Involvement
Speaking Engagements
AICPA Government and Not-for-Profit Training Program
AICPA Governmental Auditing and Accounting Conferences
Association of Government Accountants (local chapters) Events
Falmouth Institute’s Indirect Cost Summit
Government Finance Officers Association Conferences
Native American Finance Officers Association Semiannual Conference
Native Nation Events Tribal Accounting Conference
National Tribal Development Association Conference
Oregon Municipal Finance Officers Association Conference
Washington Public Utilities District Association
Professional Groups
Several partners and senior managers are members of the Special Review Committee for the Government Finance Officers Association’s (GFOA) Certificate of Achievement for Excellence in Financial Reporting.
Laurie Tish (national practice leader, government) serves on the GASB Recognition & Measurement Attributes Task Force and as a technical reviewer for the GFOA.
Since 2006, Moss Adams professionals have been selected to be a members of the AICPA’s Government Audit Quality Center (GAQC) Executive Committee. Erica Forhan (partner) is the chair.
Jim Lanzarotta, your proposed quality control review partner, served on the AICPA State and Local Government Expert Panel for six years, the last three as the chair. Jim will continue to serve on the AICPA pension task force and, in 2013, began a two-year term as the AICPA representative on the Governmental Accounting Standards Advisory Council (GASAC). He was reappointed for an additional two-year term starting in 2015.

Moss Adams | Proposal for Pasadena Fire & Police Retirement System 6
Type Our Industry Involvement
Kory Hoggan, your proposed engagement leader, is a former member of the State & Local Government Expert Panel Task Force for Public Employee Retirement Systems.
In 2013, Tasha Repp (partner) began a two-year term as the NAFOA representative on the GASAC. She was reappointed for an additional two-year term starting in 2015 and is currently a member of the GASAC executive committee.
Bertha Minnihan (employee benefit services chair) serves on the AICPA’s Employee Benefit Plans Expert Panel, and has previously served on the AICPA Employee Benefit Plan Audit Quality Center’s executive committee, has chaired the annual national AICPA Benefit Plan Conference for several years, and served on the AICPA’s Technical Standards Subcommittee, which assists with the DOL’s review of ERISA audits and auditors.
OFFICE PERFORMING THE WORK
The System will be served from our Los Angeles, California office with engagement leadership from our national PERS specialty team. The Los Angeles office serves governmental entities and PERS, and is well equipped to handle the financial and compliance audits of the System. Below is the location address and phone number for our office.
Los Angeles 10960 Wilshire Boulevard
Suite 1100 Los Angeles, CA 90024
(310) 477-0450
DISCIPLINARY ACTION AND PENDING LITIGATION
As with any large firm, Moss Adams is occasionally involved in addressing legal and regulatory issues. However, no action, suit, proceeding, inquiry, or investigation before or by any court or federal, state, municipal, or other governmental authority is pending, or to our knowledge is threatened against Moss Adams, related to or which would have a material effect upon the services contemplated herein.

Moss Adams | Proposal for Pasadena Fire & Police Retirement System 7
SIMILAR ENGAGEMENTS WITH OTHER PUBLIC RETIREMENT SYSTEMS
Selecting one advisor over another is much easier when a particular firm has experience working with organizations similar to yours in scope or organizational mission. For example, it allows for a clearer understanding of the specific issues you face, what to anticipate when conducting an audit, and how long it will take. This results in a more efficient experience and effective solution for you. Listed below are some organizations our firm serves that are similar to the System.
Client & Contact Information Scope of Work and Dates Engagement Leader
El Paso Firemen & Policemen’s Pension System
Mr. Tyler Grossman Executive Director (915) 771-8111
Financial statement audit
2010–Present
Kory Hoggan
City of Portland Fire and Police Disability and Retirement Fund
Ms. Stacy Jones Finance Manager (503) 823-6823
Financial statement audit
2010–Present
Jim Lanzarotta
Richmond Retirement System (includes Fire and Police)
Mr. Leo Griffin Executive Director (804) 646-5835
Financial statement audit and consulting
2013–Present
Kory Hoggan
Laurie Tish
The dynamics/interaction between Moss Adams and the Fund’s staff is very good. We not only get the job done effectively and efficiently, but we go to lunch together and have enjoyed discussions that are less business oriented (i.e., about families, extracurricular activities, and personal successes/accomplishments). There is no demeaning of staff or any gotcha attitude exhibited. The interaction is very professional yet relaxed and most often informative.
–Tyler Grossman, Executive Director El Paso Firemen & Policemen’s Pension System

Moss Adams | Proposal for Pasadena Fire & Police Retirement System 8
Personnel Qualifications
OFFICE PERFORMING THE WORK
The System will be served from our Los Angeles, California office with engagement leadership from our national PERS specialty team. The Los Angeles office serves governmental entities and PERS, and is well equipped to handle the financial and compliance audits of the System. Below is the location address and phone number for our office.
Los Angeles 10960 Wilshire Boulevard
Suite 1100 Los Angeles, CA 90024
(310) 477-0450
Number of Staff
Staff Level Number in Los Angeles
Partners 18
Senior Managers 14
Managers 17
Seniors 23
Staff 35
Associate 5
Total 112
Number and Classification of Staff to Be Employed on This Engagement
In today’s world of high technology, we’re used to working with clients seamlessly whether they’re down the street, on the other side of the country, or halfway around the world. Our priority is to create a close, responsive relationship with our clients, one that meets their schedule and needs. Our firm has video conference capabilities as well as built-in webcams on our laptops for face-to-face interactions—if that’s what you prefer. Or, of course, our client service professionals are readily available via phone. Whatever your location or your needs, we’re equipped to make your service experience a close, personal one, no matter your location.
Below are the numbers and classifications of professional staff to be employed on the engagement for the System. We anticipate one week of interim work before year-end to test internal controls (including information system controls and consideration of controls at the System’s service providers) and one week of final fieldwork. All members of your proposed team are full-time employees.

Moss Adams | Proposal for Pasadena Fire & Police Retirement System 9
Staff Level Number of Employees on the Engagement
Partner / Engagement Reviewer 2 (including quality control review partner)
Manager 1
Senior 1
Staff 1
Total 4–5
STAFFING PLAN
To make sure we conduct the best audit possible, all audits are assigned a manager who dedicates all of his or her time to auditing governmental entities and PERS. The manager, Katie Weiss, will be on-site for the majority of the audit to provide daily supervision of the senior and staff accountants. This involves directing and reviewing the efforts of the staff members performing the engagement and determining whether engagement objectives are being accomplished. Supervision will be performed in a timely manner as work is performed to identify and resolve issues or inefficiencies as they occur.
In addition, Kory Hoggan, engagement leader, will be involved throughout the process and is available for technical questions and support. He’ll also be on-site for portions of the fieldwork because we believe this improves client service and allows rapid responses to any questions that arise during fieldwork. It’s estimated that approximately 35%–40% of the expected time budgeted for the engagement will be performed by the managers and partners assigned to the engagement.
We’ll select and assign additional professional staff on the basis of their prior experience and their ability to complete each assignment with careful consideration of your deadlines and time frames. Because Moss Adams is an industry-based firm, our staff and seniors begin to focus on specializing within their careers early on. We’ll be happy to make these individuals available for interviews at your request.
YOUR SERVICE TEAM
Working with the right team of professionals makes all the difference to your engagement. The team members we’ve thoughtfully selected to serve your specific needs have years of governmental and PERS experience. But more than that, you’ll find they bring an optimistic perspective focused on helping the System explore and embrace emerging opportunity. Your Moss Adams team will personally engage with your team and bring a new level of energy and enterprise to your engagement.
The System will be served by some of our firm’s best client service partners and technical practitioners. All of these individuals receive continuing education well in excess of the requirements of their respective professional licensing. Each team member is in good standing, with no complaints leveled against them by a state board of accountancy or any other regulatory authority. The following individuals selected for your engagement team are all seasoned professionals and have provided services similar in scope to your current needs.

Moss Adams | Proposal for Pasadena Fire & Police Retirement System 10
Kory Hoggan, CPA, Audit Lead and Engagement Reviewer
Kory is licensed to practice in Washington and New Mexico and has practice privileges in California.
Professional Experience
Kory has over 20 years of accounting experience and specializes in the audits of public employee retirement systems and other employee benefit plans. He’s a member of the executive committee for the firm’s Employee Benefit Plan Services group and the technical committee for the firm’s Government Practice. Kory has led teams that developed audit templates and client tools and training for the implementation of Governmental Accounting Standards Board (GASB) Statements No. 67 and No. 68, related to pension accounting and reporting, and Statement No. 72 covering fair value measurements and reporting.
Kory’s current relevant experience comes from serving public pension systems both over and under $1 billion, including New Mexico Educational Retirement Board, New Mexico Public Employees Retirement Association, Richmond (Virginia) Retirement System, Warehousemen’s Pension Trust Fund (Port of Seattle), El Paso Firemen and Policemen’s Pension Fund, American Samoa Government Employees’ Retirement Fund, Kansas Public Employees Retirement System, Antelope Valley Hospital Medical Center Retirement Plan, Salinas Valley Memorial Healthcare District Employees Pension Plan, and many other single employee government and private sector defined benefit and defined contribution retirement funds. He has extensive experience managing and performing audits of complex investments including limited partnerships, real estate, derivatives, private equity, collective trusts and pooled investments accounts, and securities lending, as well as equity and fixed income securities.
Kory served on the AICPA State & Local Government Expert Panel Task Force for Public Employee Retirement Systems, a group tasked with addressing implementation issues for GASB No. 67 and 68. He was a speaker at the AICPA National Conference for Employee Benefit Plans from 2013 through 2015 with the topic of governmental pensions and is a frequent speaker to national and local audiences on recent GASB pronouncements, including implementation of the new governmental pension, OPEB, and fiduciary activities standards.
Kory also manages audit engagements for large governmental clients such as City of Albuquerque and the Territory of American Samoa.
Professional Affiliations
Former member, AICPA State & Local Government Expert Panel Task Force for Public Employee Retirement Systems
Member, American Institute of Certified Public Accountants

Moss Adams | Proposal for Pasadena Fire & Police Retirement System 11
Kory Hoggan, CPA, Audit Lead and Engagement Reviewer
Member, Government Finance Officers Association
Member, Association of Government Accountants
Member, Western Pension & Benefits Council
Education
MAcc, Brigham Young University
Continuing Professional Education
For the past three years, Kory has met the industry-specific and audit continuing professional education requirements in accordance with Government Auditing Standards. A detailed listing of governmental and nongovernmental CPE courses for the past three years is included in the Appendix of the proposal on pages 38 to 39.
Jim Lanzarotta, CPA, Quality Control Review Partner
Jim is licensed to practice in Oregon and has practice privileges in California.
Professional Experience
Jim serves as the national practice leader of the firm’s Government Practice. He has specialized in serving governmental entities for over 30 years including pension systems, cities, counties, port and transit authorities, universities and their foundations, state agencies, and many other special purpose governments. Jim’s relevant experience comes from serving public pension systems both over and under $1 billion, including New Mexico Educational Retirement Board, New Mexico Public Employees Retirement Association, City of Portland Fire and Police Disability and Retirement Fund, Spokane Employees Retirement System, American Samoa Government Employees Retirement Fund, University Foundations for the University of Oregon, San Francisco State, and Sonoma State Universities, and many other single employee government defined benefit and defined contribution retirement funds.

Moss Adams | Proposal for Pasadena Fire & Police Retirement System 12
Jim Lanzarotta, CPA, Quality Control Review Partner
Jim currently serves as the AICPA representative to the Government Accounting Standards Advisory Council responsible for meeting with GASB throughout the year to assist in setting GASBs research and technical agenda priorities, review all proposed accounting standards, and provide the GASB feedback on behalf of the AICPA. Jim completed six years of service in 2012, the last three as chair, to the AICPA State & Local Government Expert Panel responsible for providing feedback on behalf of the AICPA, and the CPA profession in general, to GASB, GAO, and other standard setters. Through his involvement with this panel, Jim has been involved in the revisions to the AICPA State and Local Government Accounting & Audit Guide, Audit Risk Alerts, and other AICPA Practice Aids. He continues to be involved with an AICPA pension task force responsible for addressing practice issues arising from GASB No. 67 and No. 68 on pension accounting and reporting. Jim previously served on GASB Advisory Committee responsible for working with GASB staff on GASB’s Annual Comprehensive Implementation Guide. Jim is a nationally recognized and sought-after speaker for organizations such as AICPA, Government Finance Officers Association, and National Association of College and University Business Officers, as well as several state CPA societies.
Professional Affiliations
Associate member, Government Finance Officers Association
Associate member, Oregon Government Finance Officers Association
CPA committee member, Oregon Society of Certified Public Accountants
Member, American Institute of Certified Public Accountants
Member, Financial Accounting Foundation’s Governmental Accounting Standards Advisory Council
Past chair, Governmental CPE Committee, Oregon Board of Accountancy
Education
BBA, accounting, University of Oregon
Continuing Professional Education
For the past three years, Jim has met the industry-specific and audit continuing professional education requirements in accordance with Government Auditing Standards. A detailed listing of governmental and nongovernmental CPE courses for the past three years is included in the Appendix of the proposal on page 40.

Moss Adams | Proposal for Pasadena Fire & Police Retirement System 13
Katie Weiss, CPA, Manager
Katie is licensed to practice in California.
Professional Experience
Katie has practiced public accounting since 2012. She’s been active in providing audit and attest services to a range of clients, including governmental, not-for-profit, and employee benefit plan entities. Some of these clients are Metrolink, Jewish Community Foundation, Claremont Colleges, Loma Linda University, ALPFA Inc., and MLK Hospital.
Professional Affiliations
Member, American Institute of Certified Public Accountants
Member, California Society of Certified Public Accountants
Education
BS, accounting, Loyola Marymount University
BBA, finance, Loyola Marymount University
Continuing Professional Education
For the past three years, Katie has met the industry-specific and audit continuing professional education requirements in accordance with Government Auditing Standards. A detailed listing of governmental and nongovernmental CPE courses for the past three years is included in the Appendix of the proposal on pages 41 to 42.

Moss Adams | Proposal for Pasadena Fire & Police Retirement System 14
ENGAGEMENT TEAM CONTINUITY
Avoiding turnovers not only saves you the time required to train a new engagement team during an audit, but also allows you to focus on what you do best—managing your day-to-day business. By keeping your audit team consistent from year to year, we can complete the audit in a more efficient and timely manner because the team is already familiar with the System’s operations.
Audit team continuity is the hallmark of a stable and efficient audit firm and, with an overall retention rate averaging over 80% firmwide over the past three years, we’re in a strong position to maintain your engagement team continuity.
Group 2017 Retention 2016 Retention 2015 Retention
Client Service Professionals 79.6% 81.4% 81.0%
Administrative Staff 87.4% 88.0% 87.6%
Our policy is to not rotate staff from an engagement team unless absolutely necessary. Typically, this would happen because the staff member left the firm or elected to change his or her professional focus to a different industry group. As our retention statistics indicate, neither situation is very common. Still, if it were to become necessary to change members of your engagement team, we pledge to:
We hired Moss Adams LLP for their strong knowledge and expertise in pension accounting. They have provided us excellent client service and we are extremely happy with our decision to partner with them as our auditors.
–Leo Griffin, Executive Director Richmond Retirement System

Moss Adams | Proposal for Pasadena Fire & Police Retirement System 15
Methodology
We know it’s not just about what we do; it’s how we do it. For us, an audit is not just a compliance exercise. We believe it’s an opportunity to view the System at a macro level, go well beyond the numbers, and provide greater value than simply complying with a requirement. And, because we have a deep respect for your time and don’t believe in the one-size-fits-all approach, we can offer you an audit approach that’s customized specifically to your organization. After all, why spend time on procedures that aren’t necessary? Customizing our process results in an efficient audit that’s complete in fewer hours.
What’s different about our approach? Rather than a checklist approach, which scales an audit from the needs of the largest organizations, we tailor our audits from the bottom up, focusing on the important areas of risk, relevant to the System’s operations and financial reporting.
TRANSITIONING TO MOSS ADAMS
It’s our first step in welcoming you as a new client—and it’s an important one. Our goal? To avoid disruption to your staff and make the transition period as smooth as possible. You’ll get:
Transition Steps
1. Entrance meetings. Conference with your finance department and other appropriate groups to discuss risks, expectations, processes, and timelines.
2. Planning sessions. Meet with key managers to discuss risks, expectations, the audit process and timelines, and to share key strategic, financial, and operational information.
3. Review working papers. Examine your prior auditor’s working papers to understand their audit approach and the timing of their procedures and to determine the scope of any additional procedures our team will perform on the opening balances in your financial statements.
4. Design audit approach. Devise an efficient and effective approach that addresses the potential risks we discover during the transition.

Moss Adams | Proposal for Pasadena Fire & Police Retirement System 16
AUDIT APPROACH
The following is a summary of our specific audit approach.
PLANNING
Throughout the planning phase of the audit, we’ll:
Perform planning inquiries and discussions with the System’s management to establish a mutually agreed-upon timeline for the audit and any changes with the System’s processes, provisions, or personnel during the year. Conduct planning sessions with the System’s management and staff to outline and share mutual expectations. By maintaining ongoing communication throughout the year, there are typically no surprises in these planning discussions.
Design an audit approach with effective risk coverage and efficient procedures.
Prepare a listing of audit schedules to be prepared by the System, with consideration of the format and information provided to the prior audit firm, and agreed-upon target dates to receive the information.
During the planning phase, we conduct preliminary analytical reviews, which consist of a comparison of current- and prior-year results, as well as actual and budgetary information. We also consider preliminary results, in light of information obtained, by reviewing the System’s board minutes and communications with management. Also, in conformity with audit standards, our team will hold internal “brainstorming” meetings and meeting with the System’s management and staff to discuss fraud risks related to the System.
Evaluating Risk
For each balance presented in your financial statements, we’ll evaluate the relative levels of inherent risk and control risk, as well as make an assessment of the risk of material misstatement resulting from fraud. Our customized audit design will reflect this assessment. We’ll tailor each audit program to obtain evidence from a combination of internal control testing, analytical procedures, and substantive testing. The degree of evidence to be obtained from each of the three general types of procedures is determined using an audit approach decision model taking into account the strength of the institution’s system of internal control.
Determining an Audit Approach for Each Transaction Cycle
After evaluating levels of materiality and performing an initial risk assessment, we’ll tailor our audit programs for the fieldwork to obtain evidence from a combination of tests of controls, analytical procedures, or substantive tests of details of transactions and ending balances.
Tests of controls. When assurance from internal control is contemplated, we’ll perform tests of the operating effectiveness of internal controls. For controls for which documentary evidence exists, we may choose to examine the documents. For other controls, such as segregation of duties or embedded control activities performed by application software, documentation may not exist. For these controls, we’ll observe the control in operation. Generally, investment authorizations and monitoring, benefit payments, and expenditures for services are typical transaction cycles that we obtain assurance through tests of controls. Sample sizes vary depending on the reliability and nature of the control(s) selected for testing and the frequency that the control activity occurs. For controls frequently performed sample sizes

Moss Adams | Proposal for Pasadena Fire & Police Retirement System 17
generally range from 18–36 samples. Sample sizes generally are smaller for those control activities that are performed less frequently, for example quarterly or monthly activities.
Analytical procedures. Analytical procedures are used to understand or test financial statement relationships or balances. They consist of evaluations of financial information through analysis of plausible relationships among both financial and nonfinancial data. A basic premise underlying the application of analytical procedures is that plausible relationships among data may reasonably be expected to exist and continue in the absence of conditions to the contrary. Application of an analytical procedure involves development by the auditor of an explicit and independent expectation of the financial statement relationship(s) or balance(s) that should exist under the particular circumstances. Application of an analytical procedure also involves a comparison of the recorded value(s) with the auditor’s independent expectation.
Substantive tests of details. In all audits; the auditor applies certain substantive tests of details that result in examining an entire transaction or account. Examples include confirmation of cash and investments, reading of contracts and minutes, and examination of an entire transaction or account balance. Directed testing allows us to use our expertise to focus on risk and is also simpler to perform and evaluate than audit sampling. Substantive audit sampling also may be the appropriate approach to use for accounts. Our sample sizes vary depending on the desired level of assurance, the size of the account balance, expected misstatements, number of individually significant items in a sample population, and the assessment of tolerable misstatement for a particular account balance.
Sampling Procedures
When applying sampling procedures, we use a statistically based sampling approach because it isn’t biased, and it’s effective and efficient. Specifically, we use random sampling methods for tests of controls and monetary sampling for substantive tests of details. We’ll use sampling throughout the engagement to test financial statement balances. Our sample sizes vary with the population size, risk of the area, reliance to be placed on the results, the expected number of errors, and other factors.
INTERIM FIELDWORK
Internal Controls Testing
The main objective of this phase is to assess the adequacy of the System’s internal controls, including financial, operational, and general computer controls. Gaining an understanding of the System’s internal controls, including those to make sure of compliance with laws and regulations is a critical first step in the audit process. Given the System’s frozen status, we will not perform extensive testing of employee census data as part of our testing of internal controls. Instead, we may request a copy of the audited employee census data from the System’s 2004 freeze date and leverage this previously audited information in our testing of participant data and benefit controls. During this time, we’ll also work with the System to prepare investment confirmations to be mailed and provide a clear listing of audit schedules to be provided by the System.
The following is our methodology for assessment of internal controls:
Obtain knowledge of design of controls relevant to each accounting cycle, financial reporting, and compliance with laws and regulations that have a direct and material effect on determination of financial statement amounts

Moss Adams | Proposal for Pasadena Fire & Police Retirement System 18
Obtain copies of system, policy, and procedure documentation
Evaluate whether controls are designed and implemented
Select and test key controls which mitigate risks identified during the planning phase and contribute to audit efficiency by reducing the need for analytical procedures and tests of details
Perform tests of controls that relate to financial statement assertions
FINAL SUBSTANTIVE TESTING
If the entrance conference hasn’t occurred during interim fieldwork, we’ll start our final fieldwork with an entrance conference with the System’s management to revisit the agreed-upon timeline for the audit, discuss specific risk areas identified during planning, and perform the required planning communications with those charged with governance.
As previously described, our audit approach will be tailored to the System based on our assessed risk of material misstatement, whether due to error or fraud, at both the financial statement and the assertion levels.
Significant Audit Area Risk Assessment
Test of Controls
Analytical Procedures
Test of Details
Cash and investments
Benefit payments and payables
Total pension liability
Financial reporting
Audit Approach for Significant Account Balances & Transactions
Our audit approach to the specific financial statement line items may include, but will not be limited to, the following procedures:
Investments and investment earnings. Our approach to auditing investments will be to first gain an understanding of the design and implementation of internal controls over investments (all types), especially related to “alternative investments,” those investments that don’t have quoted prices in active markets. We follow the guidance in the AICPA Technical Practice Aid Alternative Investments – Audit Considerations and inquiries of the System’s management to consider the effectiveness of control activities related to the monitoring and valuation of alternative investments.
Moss Adams will take the key controls identified and review what assertions they cover, what types of investments they address, and whether it’s advantageous to test operating effectiveness of the controls. For certain investment types, it will be our audit approach to test operating effectiveness and for others our approach will be to just assess the design and implementation of the control activities. Based on the results of our control testing, we’ll perform substantive audit procedures for investments as follows:
Send independent confirmations of investment values to a sample of investment managers
Obtain independent confirmation of investments from the custodian
Review audited financial statements for alternative investments and valuation reports for real estate holdings

Moss Adams | Proposal for Pasadena Fire & Police Retirement System 19
Review management’s monitoring activities with regard to investment managers and individual investment funds
Review investment statements provided by investment managers
Perform testing of investment earnings and transactions during the year
Perform testing of investment purchase and sale activity to authorization by the System’s Board or investment committee
Benefit payments. Our approach to auditing benefit payments also includes assessing reliance on internal controls, based on the results of our internal control work, and to place reliance on certain analytical and substantive procedures. During final fieldwork, auditing procedures include using audit software for various tests of benefit expenditures, comparisons of current-year benefit payment balances with prior-year balances and with budgeted amounts, and sampling of benefit payments made during the year to supporting documentation and retiree authorizations. In addition, we’ll test a sample of payments for accuracy in the payment amount against personnel records.
Actuarial information and related disclosures. Our approach to auditing the work of the actuary starts with a risk assessment involving a review of assumptions used by management and its actuary in the determination of the total pension liability, evaluation of the individual actuaries and actuarial firm’s experience and reputation, and testing of the assumptions and actuarial calculations for reasonableness and compliance with prescribed accounting guidelines. Pending results of these audit procedures, our intent would be to follow the guidance in the auditing standards over the ‘use of a specialist’.
Exit conference. At the conclusion of fieldwork, we’ll attend an exit conference with the System’s management to review the final audit report, management letter, and compliance report. We’ll share findings and recommendations from each report with the Board, as requested.
FINANCIAL STATEMENT REPORT DELIVERY AND PRESENTATION TO RETIREMENT BOARD
Finalizing the Audit
Our procedures will include testing of subsequent events, related party transactions, and disclosures related to risks and uncertainties. We’ll review minutes of meetings of the System’s Board and their committees, and we’ll consider procedures in place to identify illegal acts.
Throughout the course of the audit, we’ll keep in close communication with the System’s management through weekly status meetings to discuss engagement status, open items, and any preliminary findings as they arise to allow ample time for management to research and respond. Upon completion of our audit, we’ll prepare our reports and management letter, and will discuss them with management prior to their issuance. Meeting the System’s specific reporting deadlines, including internal deadlines and California State Controller’s Office deadlines, is extremely important and a priority in our audit timeline and approach.
Our communication process includes reporting to appropriate representatives any audit adjustments, internal control deficiencies, fraud, waste, and abuse—immediately upon discovery during the audit. The severity of the finding is determined by consensus of members of the engagement team after having been discussed with the management. Drafts of our communications will be provided to management to make sure we have the facts stated correctly, and any comments or questions are addressed before they’re finalized.

Moss Adams | Proposal for Pasadena Fire & Police Retirement System 20
Audit findings. We use a tiered approach that assesses the significance of the observed error, lack of effective control mechanism, or instance of noncompliance. We use an assessment that includes the materiality of the issue to each major program and a risk analysis of the pervasiveness of the issue. We identify and report only those major items that put the plan at risk or constitute significant noncompliance.
Reports. Once drafts of the System’s financial statements are presented to us, we’ll perform a thorough technical review for compliance with GAAP, as well as comparisons with the additional recommendations of the GFOA and best practices in the governmental pension industry. Our reviews require the engagement leader and concurring reviewer to look at all significant audit areas, our final conclusion on materiality, the severity of any audit findings, audit adjustments made and passed reports, and the financial statements, with the objective of making sure our engagement meets both firm and professional standards.
PROCEDURES FOR RESOLVING POTENTIAL AUDIT PROBLEMS
Based on our audit experience with similar governmental entities, we’ve identified the following anticipated potential problems that we’ll work with you to avoid:
There are delays in receiving actuarial or investment information which postpones delivery of requested audit schedules, supporting documentation for reported balances or activity, or the financial statement draft.
We train our audit professionals to be polite and flexible when working with client personnel and to keep the audit manager and engagement leader apprised of any difficulties encountered that could potentially delay the audit project. Once we identify delays in the receipt of requested items or a need for assistance, we work with your audit coordinator to identify options. We provide an agenda and updated progress chart in advance of each weekly audit status meeting and use this opportunity to identify any delays or challenges in meeting our initial timeline. Unexpected situations and delays are common in most audits, and we build flexibility into our schedule to allow for the unexpected.
Turnover in key management or staff positions at the System or among members of your Moss Adams audit team results in a loss of familiarity with the System’s procedures or accounting policies and requires additional time to respond to audit requests or to complete required audit programs.
Our policy is to not rotate staff from an engagement team from year to year unless absolutely necessary. Our audit quality and efficiency improves each year with returning team members who are familiar with your personnel, policies, and accounting processes. Turnover is low at Moss Adams. Typically, turnover in your audit team would happen because a staff member has left the firm, has been promoted to a position that requires a time commitment elsewhere, or has elected to change his or her professional focus to a different industry group. None of these situations is very common, and we have a very high retention rate.
Problem 1
Solution 1
Problem 2
Solution 2

Moss Adams | Proposal for Pasadena Fire & Police Retirement System 21
We’re ready to assist and adapt our audit timing when personnel changes occur with your management or accounting staff. We understand these changes, whether planned or unplanned, introduce disruptions to your daily operations and challenge your ability to provide audit requests and responses to our inquiries. In such situations, we’ll work with the System’s management to adjust our staffing and timeline to accommodate the transition period you require.
We understand that problems may arise or project needs may change. We believe our audit approach, hands-on management team, internal quality control review procedures, and weekly budget and milestone monitoring procedures allow us to properly plan and manage resources throughout each engagement to make sure the most efficient means of contract execution are applied.
The GASB Board or a regulatory agency introduces new accounting or reporting standards that require additional financial reporting and audit work.
Your audit team includes industry professionals who are involved with national standard-setting boards and interact regularly with governmental and PERS industry leaders. We can often communicate upcoming standards while they’re debated and assist with the implementation of such standards as their implementation dates approach. For example, Kory Hoggan and Jim Lanzarotta were both involved on AICPA panels that addressed issues related to the issuance of GASB No. 67 and No. 68 and were active in training and assisting our clients with implementation of these standards. More recently, we’ve assisted clients with implementation of GASB No. 72 (fair value measurements), GASB No. 82 (follow-up issues to GASB No. 68), and GASB No. 84 (fiduciary activities) which all directly impact public retirement systems.
Members of our firm’s participation on national committees such as those previously mentioned allows us to be responsive to important accounting and auditing issues as they’re developed and in turn proactively share these issues with our governmental clients. As a client of Moss Adams, you’ll have direct access to our leadership resources to discuss important implementation issues on these and other upcoming GASB pronouncements.
Engaging a new audit firm requires building new relationships with your independent auditors and becoming the potential for different audit methodologies and assessment of risks.
We’ll meet with you and your previous auditor as soon as possible after the selection process is completed to perform inquiries and become familiar with the information provided to the previous auditor.
Our approach will consider your current methodologies and documentation as a result of your normal ongoing processes. We don’t force our clients into a pre-established format, process, or schedule; we believe you know your organization best and have established processes that meet your needs However, if we see areas where improvement can be made or efficiencies obtained, we’ll certainly share those with you.
We’ll avoid disruption to you and your staff by starting early, communicating often, and making the transition period as smooth as possible.
Problem 3
Solution 3
Problem 4
Solution 4

Moss Adams | Proposal for Pasadena Fire & Police Retirement System 22
AUDIT TIMELINE
The following is a proposed first-year engagement schedule for the System. We’ll discuss any adjustments you may need when we meet with you.
Service Description Proposed Timing
AUDITOR TRANSITION
Schedule to meet with your prior auditor to review their working papers Upon award
AUDIT PLANNING
Meet with management for pre-audit planning and to obtain an understanding of systems, internal controls, and current-year issues
April 2018
Provide management with a detailed list of items needed to perform the audit, including the timing of when items are needed
Early May 2018
AUDIT FIELDWORK
Perform interim audit fieldwork and tests of internal controls May–June 2018
Send confirmations of cash, investment, and other accounts as deemed necessary
June 30, 2018
Perform final audit fieldwork August 2018
REPORT PREPARATION
Present reviewed drafts of financial statements audit reports, and management letter to management
By October 18, 2018
Present final audit report and management letter to management By November 13, 2018
BOARD COMMUNICATIONS
Present final audit report, financial statements, and management letter to the Board of Retirement
November 21, 2018

Moss Adams | Proposal for Pasadena Fire & Police Retirement System 23
Price Proposal
For our clients, it’s about more than the dollars you pay at the end of the day; it’s about value. Consider both the tangible and intangible benefits of working with us. You’ll get solid and timely deliverables. But more than that, the experience you’ll have working with forward-thinking, industry-specialized professionals who work side by side with you to explore new possibilities is where you’ll see the value. Invest in your future prosperity and experience a different style of service with us.
All prices, terms, and conditions will be held for at least 90 days after the bid is submitted. We guarantee the conditions specified in the proposal for the duration of the contract, which is for three years with two optional one-year extensions.
The completed and signed price proposal is attached on the following page.

Service
Annual financial audit, report and required disclosures (Section III, Requested Services)
Total Cost (2018-2020}:
Pasadena Fire & Police Retirement System
PRICE PROPOSAL FOR AUDITING SERVICES
June 30, 2018 June 30, 2019 June 30, 2020 Audit Cost, not Audit Cost, not Audit Cost, not
to exceed to exceed to exceed
$42,500 $43,350 $44,200
$130.050
ATTACHMENT A
Optional One-Year Extensions to the Contract
June 30, 2021 June 30, 2022 Audit Cost, not Audit Cost, not
to exceed to exceed
$45,100 $46,000
Per Section VI.G of the RFP, as a duly authorized representative of the firm, I affinn that all prices, terms and conditions are fixed for at least 90 days from the date of the proposal submission.
January 18, 2018
Kory Hoggan. Engagement Leader [Name, Title]
Moss Adams LLP [Firm Name]
Billing Rates for Additional Pre-Ai:mroved Services
Employee Name Job Title/ Classification Hourly Rate
Korv Hog1rnn Engagement Leader $260-$325
Jim Lanzarotta Concurring Review Partner $260-$325
Katie Weiss Manager $180-$210
TBD Senior $150-$180
TBD Staff $125-$150

Moss Adams | Proposal for Pasadena Fire & Police Retirement System 25
Billing Rates
Staff Level Hourly Rate
Partners / Engagement Leader $260–$325
Manager $180–$210
Seniors $150–$180
Staff $125–$150
Fee Details
Subject The Details
Client Acceptance Procedures
The scope of work and fee quotes are subject to our client acceptance process, which 1) verifies that all parties understand the specific services we’re being asked to perform, 2) ensures contract terms are acceptable to both parties and in agreement with professional standards, and 3) confirms we’ve staffed the engagement with individuals qualified with the necessary experience to fulfill our commitments to our prospective client. We’ll also need to complete our inquiries of your former auditor as required by our professional audit standards.
Cost Overruns During the course of the audit, we’ll measure our progress against our planned budget. If situations arise that are significantly different than our expectations, we’ll bring them to your attention immediately and discuss various options before we proceed. We’ll meet weekly during the course of fieldwork with the appropriate parties to ensure there are open lines of communication between our organizations.
Routine Phone Calls and Emails
Our policy is to not charge for short telephone calls seeking miscellaneous advice, and we appreciate having contact with our clients throughout the year. If a consultation requires significant additional work or research, we’ll discuss a fee estimate with you before incurring significant time.
Future New Audit and Accounting Standards
Our fee estimate discussed herein is based on accounting and professional standards that exist and are applicable as of the date of this proposal. To the extent that future rulemaking activities require modification to our audit approach, procedures, scope of work, etc., we’ll advise you of such changes and the impact on our fee proposal.
This proposal is contingent upon completion of the Moss Adams new client acceptance process, satisfaction of applicable professional standards (including communications with prior auditors), and execution of a mutually acceptable engagement agreement. We have successfully signed professional services agreements with thousands of clients, and we commit to working in good faith to successfully negotiate a mutually agreeable contract on a timely basis should we be awarded this contract.

Moss Adams | Proposal for Pasadena Fire & Police Retirement System 26
Additional Requested Forms and Information
LICENSE
QUALITY CONTROL REVIEW
Moss Adams participates in the AICPA Peer Review Program, as administered by the AICPA National Peer Review Committee. Through the peer review program, our system of quality control over the accounting and auditing practice applicable to non-SEC issuers is reviewed by another CPA firm every three years. Since the inception of the AICPA’s Peer Review Program, we’ve always achieved a “pass” opinion. A full copy of our most recent report is provided on the following pages of this proposal.
We were first subject to a peer review under the AICPA Peer Review Program in 1980 and have been reviewed every third year since 1986. Our report has always been unmodified. We don’t maintain specific records of the engagements selected for review. However, every year, at least one (typically several) governmental audit has been selected for review.

Moss Adams | Proposal for Pasadena Fire & Police Retirement System 27
Peer Review Report
Moss Adams | Proposal for Pasadena Fire & Police Retirement System 28
Peer Review Report (Cont.)

Moss Adams | Proposal for Pasadena Fire & Police Retirement System 29
REFERENCES
Hear for yourself the unique experience our clients have in working with our firm. We’re confident they’ll share stories of how we make their lives easier, help them identify and take advantage of rising opportunities, and guide them to increased prosperity.
AMERICAN SAMOA GOVERNMENT EMPLOYEES RETIREMENT FUND
Ms. Caroline Wendt Deputy Director [email protected] (684) 633-0262
Audits of Financial Statements & Employer Allocation Schedules, Consulting
2005–Present
ANTELOPE VALLEY HOSPITAL MEDICAL CENTER RETIREMENT PLAN
Ms. Janis Maher Controller [email protected] (661) 949-5768
Financial Statement Audit
2012–Present
CITY OF PORTLAND FIRE AND POLICE DISABILITY AND RETIREMENT FUND
Ms. Stacy Jones Finance Manager [email protected] (503) 823-6823
Financial Statement Audit
2010–Present
EL PASO FIREMEN & POLICEMEN’S PENSION SYSTEM
Mr. Tyler Grossman Executive Director [email protected] (915) 771-8111
Financial Statement Audit
2010–Present
NEW MEXICO EDUCATIONAL RETIREMENT BOARD
Ms. Jan Goodwin Executive Director [email protected] (505) 827-8030
Audits of Financial Statements & Employer Allocation Schedules, Consulting
2008–2017
RICHMOND RETIREMENT SYSTEM (VIRGINIA)
Mr. Leo Griffin Executive Director [email protected] (804) 646-5835
Financial Statement Audit, Consulting
2013–Present
SALINAS VALLEY MEMORIAL HEALTHCARE DISTRICT EMPLOYEES PENSION PLAN
Mr. Mike Lee Controller [email protected] (831) 759-1884
Financial Statement Audit
2013–Present

Moss Adams | Proposal for Pasadena Fire & Police Retirement System 30
CONFLICT OF INTEREST
The signed conflict of interest form is attached on the following page.
Moss Adams has served as the auditor for the ASG Employees’ Retirement Fund for over 10 years. The long-term relationship with the Fund has been due to the firm’s commitment to provide top-notch service to its clients through constant open and strong lines of communication at the management and partner level. Moss Adams has been able to provide management and staff with the knowledge and experience in the area of governmental auditing and public employee retirement systems. The Fund’s Board of Trustees and management are fortunate that the audit team is also at the forefront of all new GASB pronouncements. The team was instrumental in assisting the Fund to successfully implement GASB 67 and the allocation schedules required by GASB 68.
–Caroline Wendt, Deputy Director American Samoa Government Employees’ Retirement Fund

ATTACHMENT B
Pasadena Fire & Police Retirement System
CONFLICT OF INTEREST DISCLOSURE
All proposers are required to complete and sign this Attachment and include it with the proposal submission. If additional pages are needed, each page must be signed in the fonnat below.
1. A list and description of any financial or other business relationship (currently and for the past five years) with the City of Pasadena or any of its component units/agencies, Fire & Police Retirement System, or Board Members of the Fire & Police Retirement System, together with a statement explaining why such relationships do not constitute a conflict of interest relative to performing the financial audit. If there are none, a statement to that effect must be provided.
Moss Adams does not have a financial or other business relationship with the City of Pasadena or any of its component units/agencies, Fire & Police Retirement System, or Board Members of the Fire & Police Retirement System.
2. A list and description of the proposer's current clients who may have a financial interest in the outcome of the contract, together with a statement explaining why such relationships do not constitute a conflict of interest relative to perfonning the financial audit. If there are none, a statement to that effect must be provided.
Moss Adams current clients do not have a financial interest in the outcome of the contract.
3. I certify that we confonn to the independence standard promulgated in the General Accounting Office's Government Auditing Standards and that we will continue to conform throughout the audit engagement.
Moss Adams LLP Name of Firm
January 18, 2018 Date
Kory Hoggan Engagement Leader Printed Name Title

Moss Adams | Proposal for Pasadena Fire & Police Retirement System 32
AFFIDAVIT OF EQUAL OPPORTUNITY EMPLOYMENT & NON-SEGREGATION
The signed affidavit of equal opportunity employment and non-segregation is attached on the following page.

ATTACHMENT D
Pasadena Fire & Police Retirement System
AFFIDAVIT OF EQUAL OPPORTUNITY EMPLOYMENT & NON-SEGREGATION
By submitting this form you are declaring under penalty of perjury under the laws of the State of California and the laws of the United States that the information is true and correct. Furthermore, you are certifying that your firm will adhere to equal opportunity employment practices to assure that applicants and employees are not discriminated against because of their race, religion, color, national origin, ancestry, disability, sex or age. And, your firm does not and will not maintain or provide for its employees any segregated facilities at any of its establishments, and that it does not and will not permit its employees to perform their services at any location, under its control, where segregated facilities are maintained.
Moss Adams LLP (310) 477-0450 Name of Firm Telephone
10960 Wilshire Boulevard Suite 1100 Address
Los Angeles CA 90024 City State Zip Code
None Active City of Pasadena Business License Number
Same Remit Address (if different)
Januarv 18. 2018 Date
Kory Hoggan Engagement Leader Printed Name Title

Assurance, tax, and consulting offered through Moss Adams LLP. Investment advisory services offered through Moss Adams Wealth Advisors LLC. Investment banking offered through Moss Adams Capital LLC.
Moss Adams | Proposal for Pasadena Fire & Police Retirement System 34
DECLARATION OF NON-COLLUSION
The signed declaration of non-collusion is attached on the following page.

ATTACHMENT E
Pasadena Fire & Police Retirement System
DECLARATION OF NON-COLLUSION
The undersigned declares:
I am the Engagement Leader of -"M,,,o,,_s,_s A=da"'m"'s'-'L"L"-P _____________ . (Insert "Sole Owner", "Partner", "President, or other proper title) (Insert the na1ne of the Proposer)
The party making the forgoing bid/proposal submitted herewith to the Pasadena Fire & Police Retirement System declares:
That all statements of fact in such bid/proposal are true;
That such bid/proposal was not made in the interest of or on behalf of any undisclosed person, partnership, company, association, organization or corporation;
That such bid/proposal is genuine and not collusive or sham;
That said Proposer has not, directly or indirectly by agreement, communication or conference with anyone attempted to induce action prejudicial to the interest of the City of Pasadena, or of any other Proposer or anyone else interested in the proposed contract; and further
That prior to the public opening and reading of bids/proposals, said Proposer:
a. Did not directly or indirectly, induce or solicit anyone else to submit a false or sham bid/proposal; b. Did not directly or indirectly, collude, conspire, connive or agree with anyone else that said Proposer or
anyone else would submit a false or sham bid/proposal, or that anyone should refrain from bidding or withdraw his or her bid/proposal;
c. Did not, in any manner, directly or indirectly, sought by agreement, communication, or conference with anyone to raise or fix the bid/proposal price of said Proposer or of anyone else, or to raise or fix any overhead, profit, or cost element of the bid/proposal price, or of that of anyone else;
d. Did not, directly or indirectly, submit his or her bid/proposal price or any breakdown thereof, or the contents thereof, or divulge information or data relative thereto, to any corporation, partnership, company, association, organization, bid depository, or to any member or agent, or to any individual or group of individuals thereof to effectuate a collusive or sham bid, except the City of Pasadena, and has not paid, and will not pay, any person or entity for such purpose or to any person or persons who have a partnership or other financial interest with said Proposer in his or her business.
Any person executing this declaration on behalf of a Proposer that is a corporation, partnership, joint venture, limited liability company, limited liability partnership, or any other entity, hereby represents that he or she has full power to execute, and does execute, this declaration on behalf of the Proposer.
I certify under penalty of perjury of the laws of the State of California that the above information is correct.
January 18.2018 Date
Kory Hoggan Engagement Leader Printed Name Title

Moss Adams | Proposal for Pasadena Fire & Police Retirement System 36
LOCAL PREFERENCE, IF APPLICABLE
Moss Adams doesn’t have an office in Pasadena. Your engagement will be staffed primarily out of our Los Angeles, California office.
VENDOR DATA
Our firm’s federal tax ID number is 91-0189318. Our State of California taxpayer ID number is 201996173004.
RELATIONSHIP WITH THE CITY
Moss Adams doesn’t have a professional relationship involving the City of Pasadena, or any of its component units/agencies for the past five years.

Moss Adams | Proposal for Pasadena Fire & Police Retirement System 37
Appendix
CONTINUING PROFESSIONAL EDUCATION
Detailed CPE for your proposed service team members is attached on the following pages.

Training Title Field Of Study Training Date Delivery Method Provider Training Location Adv. Tax Credit
11/23/2017 Online (Self‐Study) Wolters Kluwer 4.00
Regulatory Ethics 4.00
10/5/2017 Group Live (Classroom) Moss Adams University Seattle, WA 15.50
Accounting 3.00
Auditing 9.50
Business Management & Organization 1.50
Personnel/HR 1.50
9/6/2017 Group‐Internet‐Based (Webcast)
Moss Adams University Virtual 1.50
Accounting 1.00
Auditing 0.50
7/16/2017 QAS Self‐Study Office ‐ National/Admin 1.00
Information Technology 1.00
7/11/2017 Group Live (Classroom) Office ‐ Dallas Dallas, TX 7.00
Business Management & Organization 4.50
Personal Development 2.50
6/16/2017 Online (Self‐Study) AICPA 9.50
Auditing (Governmental) 9.50
5/24/2017 Group Live (Classroom) New Mexico Society of CPAs (NMSCPA)
Albuquerque, NM 8.00
Auditing (Governmental) 4.50
Regulatory Ethics 2.00
Management Services 1.50
5/22/2017 Teaching ( Presenter) NP ‐ Employee Benefit Plans Seattle, WA 1.00
Auditing 1.00
5/22/2017 Group Live (Classroom) NP ‐ Employee Benefit Plans Seattle, WA 8.00
Auditing 8.00
5/12/2017 Teaching ( Presenter) Office ‐ Albuquerque Albuquerque, NM 1.00
Auditing (Governmental) 1.00
5/12/2017 Group Live (Classroom) Office ‐ Albuquerque Albuquerque, NM 12.50
Accounting (Governmental) 1.50
Auditing (Governmental) 2.00
Auditing 1.00
Personal Development 3.50
Specialized Knowledge 4.50
4/28/2017 Group Live (Classroom) NP ‐ Employee Benefit Plans Albuquerque, NM 7.00
Specialized Knowledge 7.00
4/4/2017 Group Live (Classroom) State of NM Office of the State Auditor
3.00
Auditing (Governmental) 3.00
1/6/2017 Group Live (Classroom) NP ‐ GNR San Diego, CA 14.00
Accounting 2.00
Auditing (Governmental) 3.00
Auditing 2.00
Business Management & Organization 2.00
Personal Development 2.00
Communications and Marketing 2.00
Specialized Knowledge 1.00
1/3/2017 Group Live (Classroom) Office ‐ Albuquerque Albuquerque, NM 9.00
Auditing 9.00
11/13/2016 Online (Self‐Study) External ‐ AICPA 2.50
Regulatory Ethics 2.50
11/11/2016 Group Live (Classroom) Moss Adams University Litchfield Park, AZ 28.00
Business Management & Organization 28.00
9/30/2016 Group Live (Classroom) Moss Adams University Seattle, WA 15.00
Accounting 7.00
Auditing 8.00
9/30/2016 Teaching ( Presenter) Moss Adams University Seattle, WA 1.00
Accounting (Governmental) 1.00
7/3/2016 QAS Self‐Study Office ‐ National/Admin 1.00
Specialized Knowledge & Applications 1.00
7/3/2016 Online (Self‐Study) Office ‐ National/Admin 0.00
0.00
5/12/2016 Group Live (Classroom) American Institute of CPAs (AICPA)
22.50
Accounting 4.00
Auditing 13.00
Economics 1.00
Personal Development 2.50
Taxes 2.00
4/29/2016 Group Live (Classroom) Office ‐ Albuquerque Albuquerque, NM 6.50
Accounting (Governmental) 6.50
4/26/2016 Group‐Internet‐Based (Webcast)
NP ‐ Employee Benefit Plans Virtual 2.00
Specialized Knowledge & Applications 2.00
1/7/2016 Teaching ( Presenter) Office ‐ National/Admin Albuquerque, NM 2.00
Auditing 2.00
1/6/2016 Group Live (Classroom) Moss Adams University San Diego, CA 8.00
2016 Assurance Government Training
2016 EBP Advanced Training Webcast
2015 Year End Assurance Alert
Single Audit Fundamentals (January 2016)
Assurance Services Conference
Assurance Services Conference
SECURITY BASICS
Workplace Harassment Prevention for Managers
2016 AICPA Employee Benefit Plans Conference
2017 Audit Rule Requirements for Contracting and Conducting Audits of Agencies (2.2.2 NMAC)
2017 Government, Not‐for‐Profit & Regulated Entities Industry
2017 Assurance Training
Professional Ethics: 2016 Update and Refresher (Independence)
Boot Camp
2017 EBP Advanced Training
2017 EBP Advanced Training
2017 Assurance Government/NFP Training
2017 Assurance Government/NFP Training
2017 EBP Intermediate Training
A&A Update: What You Need to Know to Plan Your 2017 Calendar Year end Assurance Work
Security Basics
Central Region Seminar for Directors & Senior Managers ‐ The
Applying The Uniform Guidance For Federal Awards In Your Single
New Mexico Emerging Issues & Ethics (Day 3)
HOGGAN, KORY (04313)
01/01/2015 ‐ 12/31/2017
Ethics and Professional Conduct for State of Washington CPAs ‐
Assurance Services Conference

Auditing 8.00
1/5/2016 Group Live (Classroom) NP ‐ GNR San Diego, CA 9.00
Accounting 2.50
Auditing (Governmental) 2.50
Business Management & Organization 2.00
Marketing 2.00
9/11/2015 Teaching ( Presenter) Moss Adams University Seattle, WA 1.50
Auditing (Governmental) 1.50
9/11/2015 Group Live (Classroom) Moss Adams University Seattle, WA 13.50
Accounting 2.50
Auditing 9.50
Specialized Knowledge & Applications 1.50
9/1/2015 Group‐Internet‐Based (Webcast)
NP ‐ MAAS Virtual 1.00
Auditing 1.00
8/27/2015 Group Live (Classroom) Moss Adams University Seattle, WA 3.00
Business Law 3.00
6/17/2015 Group Live (Classroom) Government Finance Officers Association
Philadelphia, PA 9.50
Auditing (Governmental) 9.50
5/27/2015 Teaching ( Presenter) Office ‐ Seattle Pago Pago 2.00
Accounting 2.00
5/20/2015 Group Live (Classroom) AICPA National Harbor, MD 21.00
Accounting 3.50
Auditing 14.00
Personal Development 1.50
Taxes 2.00
5/14/2015 Group Live (Classroom) NP ‐ Employee Benefit Plans Seattle, WA 7.00
Auditing 3.50
Personal Development 1.00
Specialized Knowledge & Applications 2.50
5/14/2015 Teaching ( Presenter) NP ‐ Employee Benefit Plans Seattle, WA 1.00
Auditing 1.00
5/4/2015 Group Live (Classroom) Office ‐ Albuquerque Albuquerque, NM 7.00
Auditing (Governmental) 7.00
4/23/2015 Teaching ( Presenter) Office ‐ Albuquerque Albuquerque, NM 1.00
Accounting (Governmental) 1.00
4/20/2015 Group Live (Classroom) NP ‐ Employee Benefit Plans Albuquerque, NM 8.00
Auditing 8.00
4/17/2015 Group‐Internet‐Based (Webcast)
Office ‐ National/Admin Virtual 2.50
Accounting (Governmental) 2.50
4/2/2015 Group Live (Classroom) State of New Mexico Office of the State Auditor
3.00
Auditing 3.00
4/1/2015 Group Live (Classroom) AGA Albuquerque 17.00
Auditing (Governmental) 10.00
Communications 1.00
Personal Development 6.00
3/18/2015 Group Live (Classroom) NP ‐ Employee Benefit Plans Seattle, WA 3.00
Finance 1.00
Personnel/HR 2.00
1/7/2015 Group Live (Classroom) NP ‐ GNR Scottsdale, AZ 14.00
Accounting 1.00
Auditing (Governmental) 6.00
Auditing 2.00
Business Management & Organization 1.00
Marketing 4.00
Total: 314.50
Spring 2015 Employee Benefit Plan Seminar
2015 Government, Not‐for‐Profit & Regulated Entities Industry
ABQ 2015 GASB Update Seminar
2015 EBP Staff Level II
PPG Presents: Auditor Planning Considerations of the New Single Audit Rules
2.2.2 NMAC (Audit Rule 2015)
The NM Area AGA PDT
Navigating the GASB New Pension Reporting Requirements
AICPA 2015 Employee Benefit Plans Conference
2015 EBP Engagement Reviewer and Manager Training
2015 EBP Engagement Reviewer and Manager Training
Albuquerque Government Training
Assurance Services Conference ‐ 2015
Assurance Services Conference ‐ 2015
SSAE 16 Reports – What’s the Big Deal?
Safety and Technical Excellence 2015
Government Finance Officers Administration's 109th Annual Conference
2016 Government, Not‐for‐Profit & Regulated Entities Industry

Training Title Field Of Study Training Date Delivery Method Provider Training Location Adv. Tax Credit
10/17/2017 Group Live (Classroom) Moss Adams University Eugene, OR 3.00
Management Services 3.00
10/5/2017 Group Live (Classroom) Moss Adams University Seattle, WA 11.00
Auditing 8.00
Business Management & Organization 1.50
Personnel/HR 1.50
9/6/2017 Group‐Internet‐Based (Webcast)
Moss Adams University Virtual 1.50
Accounting 1.00
Auditing 0.50
8/11/2017 Online (Self‐Study) Office ‐ National/Admin 0.00
0.00
6/20/2017 Online (Self‐Study) American CPE, Inc. 4.00
Regulatory Ethics 4.00
5/2/2017 Group Live (Classroom) Region ‐ Oregon OR 4.50
Accounting (Governmental) 1.00
Information Technology 2.00
Specialized Knowledge 1.50
1/6/2017 Group Live (Classroom) NP ‐ GNR San Diego, CA 8.00
Accounting 2.00
Business Management & Organization 2.00
Personal Development 2.00
Communications and Marketing 2.00
9/30/2016 Group Live (Classroom) Moss Adams University Seattle, WA 14.00
Accounting (Governmental) 1.00
Accounting 5.00
Auditing 8.00
8/24/2016 QAS Self‐Study Office ‐ National/Admin 1.00
Specialized Knowledge & Applications 1.00
7/25/2016 Group Live (Classroom) Office ‐ Eugene Portland, OR 6.50
Accounting (Governmental) 2.50
Auditing (Governmental) 3.00
Auditing 1.00
5/25/2016 Group Live (Classroom) Governmental Finance Officers Association
Toronto, Canada 17.00
Accounting (Governmental) 8.00
Business Management & Organization 4.50
Finance 2.00
Management Advisory Services 2.50
5/17/2016 Group Live (Classroom) OSCPA Eugene, OR 14.00
Accounting (Governmental) 7.00
Auditing (Governmental) 1.00
Auditing 4.00
Behavioral Ethics 1.00
Specialized Knowledge & Applications 1.00
5/3/2016 Group Live (Classroom) Office ‐ Eugene Portland, OR 6.00
Accounting (Governmental) 3.00
Management Advisory Services 1.00
Specialized Knowledge & Applications 2.00
5/3/2016 Teaching ( Presenter) Office ‐ Eugene Portland, OR 2.00
Accounting (Governmental) 2.00
1/6/2016 Group Live (Classroom) Moss Adams University San Diego, CA 8.00
Auditing 8.00
1/5/2016 Group Live (Classroom) NP ‐ GNR San Diego, CA 9.00
Accounting 2.50
Auditing (Governmental) 2.50
Business Management & Organization 2.00
Marketing 2.00
8/25/2015 Group Live (Classroom) Moss Adams University Rancho Cordova, CA 3.00
Business Law 3.00
8/13/2015 Online (Self‐Study) Office ‐ National/Admin 0.00
0.00
6/23/2015 Online (Self‐Study) PES 4.00
Regulatory Ethics 4.00
5/19/2015 Group Live (Classroom) OSCPA Eugene OR 16.00
Auditing (Governmental) 10.50
Finance 3.00
Specialized Knowledge & Applications 2.50
1/26/2015 Group Live (Classroom) OSCPA Wilsonville OR 8.00
Auditing (Governmental) 8.00
1/16/2015 Online (Self‐Study) External ‐ AICPA 2.00
Behavioral Ethics 2.00
1/15/2015 Group Live (Classroom) Office ‐ National/Admin Eugene, OR 1.50
Auditing (Governmental) 1.50
1/15/2015 Group Live (Classroom) Office ‐ Eugene Eugene, OR 1.00
Auditing 1.00
1/15/2015 Group Live (Classroom) Office ‐ National/Admin Eugene, OR 2.00
Auditing 2.00
1/7/2015 Group Live (Classroom) NP ‐ GNR Scottsdale, AZ 14.00
Accounting 1.00
Auditing (Governmental) 6.00
Auditing 2.00
Business Management & Organization 1.00
Marketing 4.00
Total: 161.00
An Overview of OMB's Uniform Grant Guidance
Audit Risk Management: Perfecting Your Game
2014 Annual Year End Assurance and Accounting Alert
2015 Government, Not‐for‐Profit & Regulated Entities Industry
Workplace Harassment Prevention for Managers ‐ v4
Ethics and Professional Conduct for Oregon CPAs
Governmental Accounting & Auditing Conference
OSCPA 2015 Winter GAAC
Independence: 2014 Update & Refresher
Governmental Accounting Conference
Governmental Accounting Conference
Single Audit Fundamentals (January 2016)
2016 Government, Not‐for‐Profit & Regulated Entities Industry
Safety and Technical Excellence 2015
Assurance Services Conference
SECURITY BASICS
2016 Oregon Region Government Training
Sharing Solutions & Strategies
Governmental Accounting & Auditing Conference
A&A Update: What You Need to Know to Plan Your 2017 Calendar Year end Assurance Work
Workplace Harassment Prevention for Managers
Ethics for Oregon
Moss Adams Governmental Accounting Conference
2017 Government, Not‐for‐Profit & Regulated Entities Industry
LANZAROTTA, JAMES (05134)
01/01/2015 ‐ 12/31/2017
Safety and Technical Excellence 2017
Assurance Services Conference

Training Title Field Of Study Training Date Delivery Method Provider Training Location Adv. Tax Credit
12/19/2017 Online (Self‐Study) External ‐ Checkpoint Learning 4.00
Auditing 4.00
12/6/2017 Online (Self‐Study) External ‐ AICPA 2.00
Regulatory Ethics 2.00
11/16/2017 Group Live (Classroom) Region ‐ Southern California/Phoenix
CA 6.50
Accounting 1.00
Auditing 5.50
9/6/2017 Group‐Internet‐Based (Webcast)
Moss Adams University Virtual 1.50
Accounting 1.00
Auditing 0.50
8/23/2017 Online (Self‐Study) Office ‐ National/Admin 0.00
0.00
8/23/2017 QAS Self‐Study Office ‐ National/Admin 1.00
Information Technology 1.00
8/11/2017 Group Live (Classroom) Moss Adams University Irvine, CA 8.50
Accounting 2.00
Auditing 4.50
Personal Development 2.00
7/10/2017 Group‐Internet‐Based (Webcast)
Moss Adams University Virtual 1.00
Auditing 1.00
6/1/2017 Group Live (Classroom) Region ‐ Southern California/Phoenix
Los Angeles, CA 7.00
Auditing 7.00
5/22/2017 Group Live (Classroom) Region ‐ Southern California/Phoenix
Costa Mesa, CA 6.50
Accounting 0.50
Auditing (Governmental) 5.00
Personal Development 1.00
5/19/2017 Group Live (Classroom) Office ‐ Los Angeles Irvine, CA 8.00
Auditing (Governmental) 8.00
1/12/2017 Group Live (Classroom) Office ‐ Silicon Valley Los Angeles, CA 2.50
Auditing 2.50
1/3/2017 Group Live (Classroom) Office ‐ Los Angeles Los Angeles, CA 4.00
Auditing 4.00
11/14/2016 Group Live (Classroom) Region ‐ Southern California/Phoenix
CA 6.00
Accounting 1.00
Auditing 4.00
Business Management & Organization 1.00
8/23/2016 Group Live (Classroom) CalCPA Education Foundation Los Angeles, CA 6.00
Regulatory Ethics 6.00
8/5/2016 Group Live (Classroom) Moss Adams University Irvine, CA 18.00
Accounting 2.00
Auditing 9.50
Business Law 4.50
Personal Development 2.00
7/26/2016 QAS Self‐Study Office ‐ National/Admin 1.00
Specialized Knowledge & Applications 1.00
7/18/2016 Group Live (Classroom) Region ‐ Southern California/Phoenix
Irvine, CA 5.00
Personal Development 5.00
5/23/2016 Group Live (Classroom) Region ‐ Southern California/Phoenix
Costa Mesa, CA 7.00
Accounting 3.50
Auditing 3.50
5/19/2016 Group Live (Classroom) NP ‐ Employee Benefit Plans Irvine, CA 8.00
Specialized Knowledge & Applications 8.00
5/17/2016 Group‐Internet‐Based (Webcast)
NP ‐ Employee Benefit Plans Virtual 2.00
Specialized Knowledge & Applications 2.00
1/8/2016 Group Live (Classroom) Region ‐ Southern California/Phoenix
Irvine, CA 6.00
Auditing 6.00
1/6/2016 Group Live (Classroom) Moss Adams University San Diego, CA 8.00
Auditing 8.00
12/15/2015 Online (Self‐Study) External ‐ AICPA 2.00
Behavioral Ethics 2.00
11/16/2015 Group Live (Classroom) Region ‐ Southern California/Phoenix
CA 7.00
Accounting 1.00
Auditing 5.00
Business Management & Organization 1.00
11/4/2015 Group Live (Classroom) Office ‐ Los Angeles Los Angeles, CA 1.50
Taxes 1.50
8/18/2015 Group Live (Classroom) CalCPA Los Angeles, CA 4.00
Auditing 4.00
8/7/2015 Group Live (Classroom) Moss Adams University Irvine, CA 18.00Assurance Practice Essentials Program ‐ 2015
Single Audit Fundamentals (January 2016)
Professional Ethics: 2015 Update and Refresher (Independence)
SoCal Regional BA LOPES Training
ASC 740 – Overview for Auditors
Fraud ‐ Practical Approaches to Prevention & Detection
Forum W Workshop – Getting Real: Straight Talk on Building Your Career & Investing in Your Future
NFP Training
2016 EBP Intermediate Training
2016 EBP Advanced Training Webcast
Regional Technical Training
Senior Training
2016 SoCal Regional BA Training
Ethical and Legal Standards for CPAs
Assurance Practice Essentials Program ‐ Track 2
SECURITY BASICS
Sampling: Harnessing the Power of Sampling Without Getting Shocked
SCP EBP Intermediate
SCP Regional Not for Profit Training
Single Audit Update
2016 Year End Assurance Alert
SCP 2017 LOPES Training
A&A Update: What You Need to Know to Plan Your 2017 Calendar Year end Assurance Work
Workplace Harassment Prevention for Employees
Security Basics
Assurance Practice Essentials Program ‐ Track 3
WEISS, CATHERINE (08277)
01/01/2015 ‐ 12/31/2017
Forensic Accounting: An Overview
Professional Ethics: 2017 Update and Refresher (Independence)

Accounting 1.00
Auditing 15.00
Personal Development 2.00
8/5/2015 Online (Self‐Study) Office ‐ National/Admin 0.00
0.00
5/21/2015 Group Live (Classroom) Office ‐ Orange County Irvine, CA 7.50
Auditing 7.50
5/21/2015 Group Live (Classroom) NP ‐ Employee Benefit Plans Irvine, CA 7.50
Auditing 7.50
5/18/2015 Group Live (Classroom) Office ‐ Los Angeles Costa Mesa, CA 5.50
Accounting 2.50
Auditing (Governmental) 1.00
Auditing 2.00
4/24/2015 Group Live (Classroom) Office ‐ Los Angeles Irvine, CA 8.00
Accounting (Governmental) 8.00
1/13/2015 Group Live (Classroom) Office ‐ National/Admin Los Angeles, CA 2.00
Auditing 2.00
1/13/2015 Group Live (Classroom) Office ‐ Los Angeles Los Angeles, CA 2.00
Auditing 2.00
Total: 184.50
A‐133 ‐ Single Audit Update with an Emphasis on Higher Education
2014 Annual Year End Assurance and Accounting Alert
ACL Beginners
Workplace Harassment Prevention for Employees ‐ v4
SoCal Regional 2015 EBP In‐Charge Training
2015 EBP Staff Level II
So. Cal Regional NFP Training

PRESENTED TO:PASADENA FIRE & POLICE RETIREMENT SYSTEMPROPOSAL FOR FINANCIAL AUDITING SERVICES FOR FISCAL YEARS ENDING JUNE 30, 2018 THROUGH JUNE 30, 2020
PREPARED FOR YOU BY:
Macias Gini & O'Connell LLP James Godsey, CPA/PARTNER777 S. Figueroa St., Suite 2500Los Angeles, CA 90017T: 213.408.8666| F: [email protected]
January 18, 2018


Table of ContentsSECTION 1Transmittal Letter ...................................... 1
SECTION 2 Firm Qualifications ................................... 3
SECTION 3 Personnel Qualifications ......................... 9
SECTION 4 Methodology ............................................. 17
SECTION 5 Price Proposal ...........................................31
SECTION 6 Additional Requested Formsand Information ........................................33
P A S A D E N A F I R E & P O L I C E R E T I R E M E N T S Y S T E M


SECTION 1
Transmittal Letter


1
January 18, 2018
On behalf of Macias Gini & O’Connell LLP (MGO), we are pleased to present our proposal in response to the Request for Proposal for Financial Auditing Services to perform audits of the Pasadena Fire and Police Retirement System (System) for the fiscal years ended June 30, 2018, 2019 and 2020, with two optional one-year extensions for the fiscal years ended June 30, 2021 and 2022.
Institutional Knowledge.The System is a valued MGO client that deserves seasoned engagement team with an unmatched breadth of experience and expertise in performing financial statement audits. Your proposed MGO team has the required commitment, experience, expertise as well as significant institutional knowledge of your operating environment, processes and internal control over financial reporting. As a result, we are the firm best qualified to perform the engagement and are committed to performing the highest quality work and meeting your timetable.
Proven Performance.MGO’s public agency practice not only includes the audit of the largest public pension plan in the Nation, the California Public Employees' Retirement System, but we also provide advisory services to the California State Teachers' Retirement System, the second largest public employees’ retirement systems, respectively. Further, we serve as the external auditor to the Oregon Public Employees Retirement System and twenty-two of the largest City and County government retirement systems throughout California. We also provide audit and advisory services to eight of the ten largest cities and six of the ten largest counties in California ensuring that we are at the forefront of the needs of local governments and their financial reporting requirements.
As a concluding point, MGO has a seat on the AICPA’s expert panel for State and Local Governments, of which our first assigned task was to review and offer revisions to pension guidance provided to auditors in the AICPA’s Audit and Accounting Guide (Guide) for State and Local Governments. The System will continue to benefit from our experience and resources at the local, state and national level to ensure timely resolution of accounting and financial reporting issues.
Unparalleled Understanding.The System completed its conversion from the legacy Pension Gold System to U.S. Bank for the Benefit Payments Administration during fiscal year 2017. The conversion was one that required extensive effort from the management of the System. MGO was able to provide technical advice to help strengthen the internal control over the new processes. As the System looks to the future facing its unique challenges of being a closed plan, MGO is committed to assisting the System in navigating technical matters and providing clarification on any new accounting pronouncements that may affect the System.
Moreover, with the institutional knowledge we gained over the last three years and our understanding of the City of Pasadena, we are in an excellent positon to appreciate the Board of Retirement’s needs and concerns and stand ready to discuss all matters with them at any time. We welcome the opportunity to continue to serve as the external auditors for the System.
As a Partner, I am authorized to represent and bind the firm to all commitments made in this proposal. If there are any questions regarding this proposal, please feel free to contact me.
Very Truly Yours,
James Godsey, CPA/PartnerT: (213) 408-8666F: (213) 995-6970E: [email protected]
SECTION 1 | TRANSMITTAL LETTER

2
This page intentionally left blank.
SECTION 1 | TRANSMITTAL LETTER

SECTION 2
FirmQualifications


3
Firm Profile.CALIFORNIA CPAS DEDICATED TO GOVERNMENT AUDIT
Founded in 1987, MGO is a professional services firm with a staff of over 250 highly skilled professionals providing auditing, tax, outsourcing, and advisory services to governmental entities, nonprofits, corporations, partnerships, and individuals. We are a statewide Limited Liability Partnership (LLP) certified public accounting and consulting firm with 10 offices throughout California.
MGO’s State and Local Government Industry Group is one of the largest in the country and offers unmatched experience, expertise and depth of resources. In addition to general-purpose units of government, we serve public employees' retirement systems, authorities, boards and commissions. We work in the areas of pension and other postemployment benefits, economic development, education, finance, health and human services, housing, justice, public safety, public works and transportation.
This diversity provides us with a well-balanced perspective and a tremendous base of experience. We already have the resources you require for this engagement available and are ready to serve you in accordance with your timeline.
MGO is committed to devoting the necessary resources to complete the work described in the Request for Proposal (RFP). Our reputation was built on our deep government experience, understanding of internal systems/procedures and ability to work with client staff to implement complex accounting and reporting pronouncements.
The System's audit will be primarily staffed out of our Los Angeles/Orange County offices.
SECTION 2 | FIRM QUALIFICATIONS

4
A National FootprintBecause of our long-term involvement and national and state liaisons, we are the firm best positioned to keep you up to date on changing accounting and auditing standards – and we will. Our record of thought leadership includes working with:
Auditing Standard Setters• MGO is an active participant on the AICPA State and Local
Government Expert Panel (EP). The EP is a fifteen person nationwide panel responsible for addressing practice and emerging issues in the public sector and serves as the profession’s primary liaison to the GASB and regulators such as the U.S. Government Accountability Office and the U.S. Office of Management and Budget. David Bullock, Partner, is serving on the EP for a three-year term that began January 2015. As an EP member, MGO reviewed and offered revisions to the pension guidance provided to auditors in the AICPA’s Audit and Accounting Guide (Guide) for State and Local Governments. Prior participation includes Caroline Walsh, MGO’s Chief Quality Officer, appointment from October 2006 through September 2009, who participated in the review of the 2008 and 2009 Guides for Statement Local Governments and Government Auditing Standards and Circular A-133; and Kevin O’Connell’s, Managing Partner, appointment in 2003-2006.
• Scott Johnson was appointed to the AICPA Government Performance and Accountability Committee (GPAC). Scott is the only public firm representative on the GPAC committee. He begins his 15-month term on February 1, 2018.
• In 2015, David Bullock, Partner, was appointed to the Governmental Accounting Standards Board’s (GASB) Financial Reporting Model Reexamination Task Force. The task force is comprised of a diverse group of users, preparers, and auditors of government financial statements. The objective of the task force is to provide perspective to GASB members on project issues that arise during the development of the guidance over the financial reporting model.
• In 2012, Richard Green was appointed to the AICPA State and Local Government Expert Panel Pension Comment Letter Task Force, which reviewed the issued Government Accounting Standards Board (GASB) exposure drafts on pension accounting and reporting for employers and benefit plans.
• In 2012, Caroline Walsh was appointed to GASB’s GAAP Hierarchy Advisory Committee, which provides input to GASB on its GAAP Hierarchy Project. This project considered possible modifications
The same MGO leaders who actively participate in shaping the national professional standards are members of your proposed engagement team
FAST FACTS
Standards &Emerging issues
NATIONAL AUDIT & ACCOUNTING
AICPA STATE AND LOCAL GOVERNMENT
EXPERT PANEL
SECTION 2 | FIRM QUALIFICATIONS
5
to the GAAP hierarchy. It re-examined the hierarchy levels to assess whether the standards-setting process and the governmental financial reporting environment have sufficiently evolved since the establishment of the original hierarchy by the AICPA in 1992. In June 2015, the GASB issued the final statement for the standard (GASB Statement No. 75).
• In 2012, Richard Green served on the Government Finance Officers Associations’ (GFOA) Special Review Committee for the Certificate of Achievement for Excellence in Financial Reporting Program. This committee performs reviews of comprehensive annual financial reports submitted to the program, which promotes the highest quality financial reporting for state and local governments. In addition, he was a member of the Governmental Accounting Standards Board Task Force on Pension Accounting Research. This task force assesses the effectiveness of current accounting and financial reporting requirements for pension plans and employers.
• In 2009, Caroline Walsh chaired the EP task force for the GASB’s Invitation to Comment on Pension Accounting and Financial Reporting and presented testimony to GASB on behalf of the AICPA. As a former member of the EP, she was invited to serve as an EP task force member to review and comment on the GASB’s exposure draft, which codifies pre-November 30, 1989 accounting standards.
• MGO is a member of the AICPA Governmental Audit Quality Center (GAQC). The GAQC was established in 2004 and its primary purpose is to provide resources to promote high quality governmental audits. To demonstrate our commitment to quality auditing practices, MGO was one of the first firms in the U.S. to join the GAQC.
• In 2011, Caroline Walsh was appointed to the Executive Committee of the AICPA GAQC and served on the committee through 2014.
• In 2009, Caroline Walsh was appointed for a three-year term to the GASB Implementation Guide Advisory Committee to assist the GASB in developing the annual edition of the Comprehensive Implementation Guide related to the GASB’s pronouncements. Caroline reviewed proposed new items and revisions to prior questions and answers and provided input to GASB project managers.
• David Bullock, Partner, also served on the GASB Sales and Pledges task force developing GASB Statement No. 48 related to Securitizations.
SECTION 2 | FIRM QUALIFICATIONS

6
Experience in Retirement PlansMGO has a longstanding record of service to California retirement systems. Our capabilities in this area led to the award of the largest employee retirement system engagement in the Country - the California State Public Employees’ Retirement System (CalPERS).
The following is a representative list of retirement systems for which MGO has recently provided audit and advisory services:• Pasadena Fire & Police Retirement System• California Public Employees’ Retirement System• Orange County Employees' Retirement System• Sacramento City Employees' Retirement System• San Diego County Retirement Association• San Diego City Employees' Retirement System• San Bernardino County Employees' Retirement Association• California State Teachers’ Retirement System*• San Mateo County Employees' Retirement Association*
*Advisory Services
Experience in Large Complex Local Governmental Units.Our firm’s State and Local Governmental practice is one of the largest in the U.S. and offers unmatched resources in serving this highly complex sector, with specialists whom are dedicated to year-round service. In California, our local government specialists have served over 100 cities, 16 counties and more than 200 special purpose units of government. Rest assured we will use our experience to provide a highly focused, efficient, and effective audit. MGO's county clients include the following: Los Angeles, San Diego, Orange, Santa Clara, Alameda, Sacramento, Contra Costa, San Francisco, San Mateo, Tuolomne, Yolo, and Solano.
MGO audits more top California cities than any other firm. During the last 5 years, we’ve been the principal auditors for 9 of the top 12 cities – San Diego, San José, San Francisco, Fresno, Sacramento, Oakland, Riverside, Santa Ana – and we served our state’s largest city, Los Angeles, for more than 10 years, helping them win their first ever CAFR award.
In addition to our extensive auditing experience, MGO also provides advisory services, such as internal audit services related to the complex investment portfolio for the California State Teachers' Retirement System and internal control assessment and system conversion review of the pension administration software implementation for San Mateo County Employees' Retirement Association.
MGO audits CalPERS, the largest pension system in the country.
RETIREMENT PLAN EXPERIENCEFAST FACTS
MGO is the leading provider of audit services to large government entities in California:
OF THE TOP
PROVEN EXPERIENCEFAST FACTS
129LARGEST CITIES IN
CALIFORNIA
MGO HAS AUDITED
COUNTY EXPERIENCE
FAST FACTS
OF THE TOP5
LARGEST COUNTIESIN CALIFORNIA
MGO AUDITS THE
10
SECTION 2 | FIRM QUALIFICATIONS

7
License to Practice in State of California.Our firm and all key professional staff assigned to the engagement are properly licensed by the State of California to practice as Certified Public Accountants. MGO meets all requirements imposed by federal, state and local laws, rules, and regulations.
Disciplinary Action.There have been no disciplinary actions taken or pending against the firm during the past three years with state regulatory bodies or professional organizations, as well as any pending or settled litigation within the past three years.
SECTION 2 | FIRM QUALIFICATIONS

8
Similar Engagements.The following references are of our most significant contracts with other large organizations similar to the project described in the RFP.
Client:San Bernardino County Employees' Retirement Association
Orange County Employees' Retirement System
San Diego City Employees' Retirement System
Description of Work Performed:
Conducted financial and/or compliance audits with the following deliverables:
• Financial Statements• GASB 68 Schedules
Conducted financial and/or compliance audits with the following deliverables:
• Financial Statements• GASB 68 Schedules
Conducted financial and/or compliance audits with the following deliverables:
• Financial Statements• GASB 68 Schedules
Engagement Partner:James Godsey Linda Hurley Linda Hurley
Term of Engagement:2009 - Current 2005 - Current 2007 - Current
Client Contact Information:Julie UnderwoodChief of Fiscal ServicesT: (909) 885-7980 EXT 330E: [email protected]
Brenda ShottAssistant CEO, Finance and Internal OperationsT: (714) 558-6201E: [email protected]
Lee ParravanoInternal AuditorT: (619) 525-3608E: [email protected]
SECTION 2 | FIRM QUALIFICATIONS

SECTION 3
PersonnelQualifications


9
Proposed Staffing and Project Organization.EDUCATION, EXPERIENCE, AND APPLICABLE PROFESSIONAL CREDENTIALS.
Our team was selected for their energy, expertise and ability to meet the complex demands of the engagement. The following organizational chart provides an overview of the lines of communication among the key professionals comprising the engagement team:
James GodseyENGAGEMENT PARTNER
Linda HurleyPROFESSIONAL STANDARDS
REVIEWER
Amy ChiangENGAGEMENT MANAGER
PASADENA FIRE & POLICE RETIREMENT SYSTEM
MGO PROFESSIONAL ASSOCIATES
Joyce LinENGAGEMENT SENIOR
Jasmine CostaINFORMATION TECHNOLOGY
SPECIALIST
SECTION 3 | PERSONNEL QUALIFICATIONS

10
Engagement Team.We have assembled a group of key professionals that possess a firm grasp of the subject matter, as well as the maturity, experience and confidence required for this engagement. All key members of the engagement leadership team assigned to the System's audits as identified in this section are employed on a full-time basis. The engagement team represents the strong, balanced blend of talent, professional skills and industry experience that are most critical to working effectively with you. Each of our key engagement team members possess experience in the following:
• Generally Accepted Auditing Standards (AICPA)• Generally Accepted Government Auditing Standards (GAGAS)• Governmental Accounting Standards (GASB)• California Civil Code Section 1939 and Government Code 50474 as
amended by AB 2051• Federal Aviation Administration's Passenger Facility Charge Audit Guide• Office of Management and Budget Uniform Guidance (Single Audit)
including audit of the Airport Improvement Program (CFDA #20.106)
All team members are experienced in fiduciary fund accounting and auditing and preparing or assisting in the preparation of basic financial statements and award-winning CAFRs. The team was designed with the most complementary skill sets and experience in providing local government assurance services as well as experience performing pension plan audits. The continual involvement and immediate access to the principal members of the engagement team ensures that the System will be able to contact the decision makers at all times and utilize the full range of our resources. We are committed to conducting the audits and meeting all of the System's requirements.
Continuing Professional Education of Employees.In compliance with auditing standards generally accepted in the United States of America, our firm administers a program to ensure that all professional staff meets continuing professional education (CPE) requirements. Since a large composition of MGO’s client base includes governmental entities, we are aware of the strict educational guidelines required by Government Auditing Standards. All members of the audit team have satisfied these requirements, having at least 80 hours of continuing professional education every two years, of which 24 must directly relate to the government environment and to government accounting and auditing standards. MGO will also inform the System of the status of the required CPE, including courses taken for each member of the audit team on an annual basis.
SECTION 3 | PERSONNEL QUALIFICATIONS

11
Personnel Changes.MGO understands that Engagement partners, directors, managers, other supervisory staff and specialists may be changed if those personnel leave the firm, are promoted, or are assigned to another office. These personnel may also be changed for other reasons with the express prior written permission of the System and that the System retains the right to approve or reject replacements.
Availability of Key Personnel.It is our firm’s policy to have our leadership team and subject matter experts very involved during your audit. This policy will ensure your access to someone very knowledgeable of your operations throughout the duration of our professional contract. Experienced auditors who can offer quality recommendations and support the System’s management as requested in analyzing difficult financial matters will assure you of a quality audit. Each key team member we propose for your engagement has made a personal commitment to serve the System and will spend a significant amount of time on-site to supervise staff and promote a smooth audit process.
Office Location.The System's audit will be primarily staffed out of our Los Angeles/Orange County offices which consists of the following:
Partners:Directors:Managers:Supervisors:Seniors:Other Professional Staff:
5373910
SECTION 3 | PERSONNEL QUALIFICATIONS
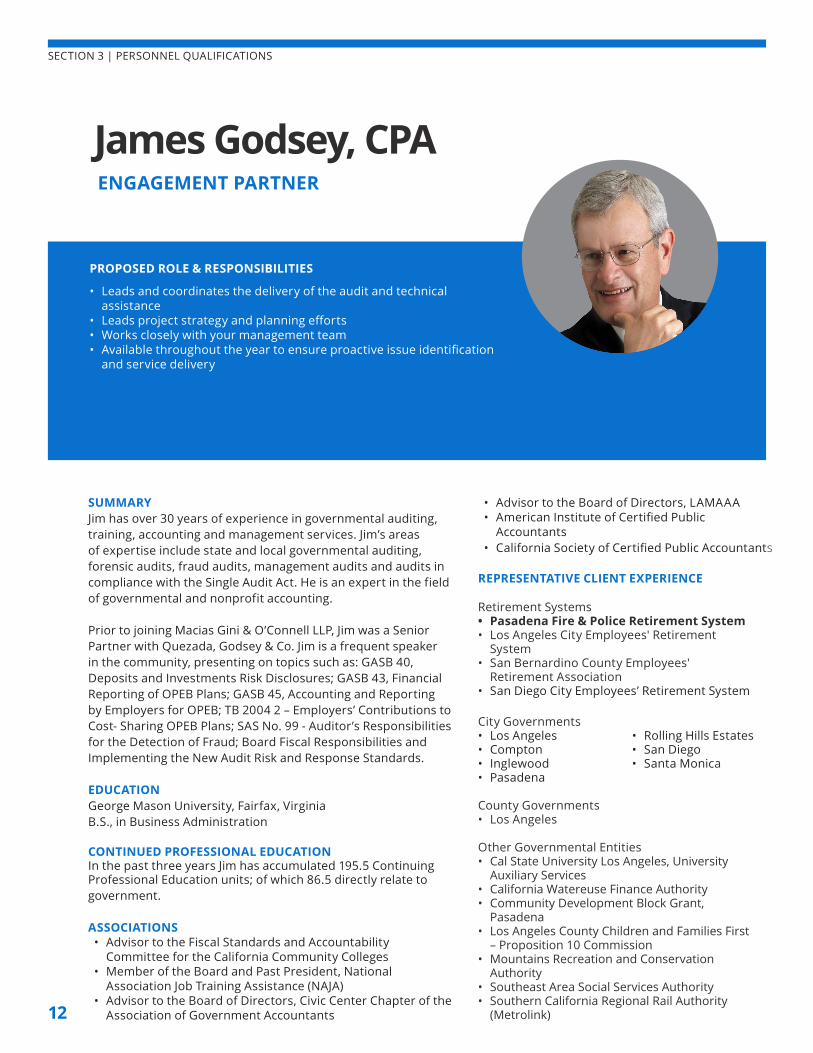
12
• Advisor to the Board of Directors, LAMAAA• American Institute of Certified Public
Accountants• California Society of Certified Public Accountants
REPRESENTATIVE CLIENT EXPERIENCE
Retirement Systems• Pasadena Fire & Police Retirement System• Los Angeles City Employees' Retirement
System• San Bernardino County Employees'
Retirement Association• San Diego City Employees’ Retirement System
City Governments • Los Angeles• Compton• Inglewood• Pasadena
• Rolling Hills Estates• San Diego• Santa Monica
County Governments• Los Angeles
Other Governmental Entities• Cal State University Los Angeles, University
Auxiliary Services• California Watereuse Finance Authority• Community Development Block Grant,
Pasadena• Los Angeles County Children and Families First
– Proposition 10 Commission• Mountains Recreation and Conservation
Authority• Southeast Area Social Services Authority• Southern California Regional Rail Authority
(Metrolink)
SUMMARYJim has over 30 years of experience in governmental auditing, training, accounting and management services. Jim’s areas of expertise include state and local governmental auditing, forensic audits, fraud audits, management audits and audits in compliance with the Single Audit Act. He is an expert in the field of governmental and nonprofit accounting.
Prior to joining Macias Gini & O’Connell LLP, Jim was a Senior Partner with Quezada, Godsey & Co. Jim is a frequent speaker in the community, presenting on topics such as: GASB 40, Deposits and Investments Risk Disclosures; GASB 43, Financial Reporting of OPEB Plans; GASB 45, Accounting and Reporting by Employers for OPEB; TB 2004 2 – Employers’ Contributions to Cost- Sharing OPEB Plans; SAS No. 99 - Auditor’s Responsibilities for the Detection of Fraud; Board Fiscal Responsibilities and Implementing the New Audit Risk and Response Standards. EDUCATIONGeorge Mason University, Fairfax, VirginiaB.S., in Business Administration
CONTINUED PROFESSIONAL EDUCATION In the past three years Jim has accumulated 195.5 Continuing Professional Education units; of which 86.5 directly relate to government.
ASSOCIATIONS• Advisor to the Fiscal Standards and Accountability
Committee for the California Community Colleges• Member of the Board and Past President, National
Association Job Training Assistance (NAJA)• Advisor to the Board of Directors, Civic Center Chapter of the
Association of Government Accountants
PROPOSED ROLE & RESPONSIBILITIES
• Leads and coordinates the delivery of the audit and technical assistance
• Leads project strategy and planning efforts• Works closely with your management team • Available throughout the year to ensure proactive issue identification
and service delivery
ENGAGEMENT PARTNER
James Godsey, CPA
SECTION 3 | PERSONNEL QUALIFICATIONS

13
SECTION 3 | PERSONNEL QUALIFICATIONS
ASSOCIATIONS• American Institute of Certified Public Accountants• California Society of Certified Public Accountants• California Society of Municipal Finance Officers• Government Finance Officers Association• BDO & BDO Siedman Alliance Government
Industry Group Advisory Council (former member)
REPRESENTATIVE CLIENT EXPERIENCE
Retirement Systems and Plans• Orange County Employee's Retirement
System• California Public Employees' Retirement
System• City of San José Federated City Employees’
Retirement System• City of San José Police and Fire Department
Retirement Plan• Alameda Health System Defined Benefit
Pension Plan• San Diego City Employees Retirement System
City Governments• Antioch • Encinitas • Foster City • Fresno • Huntington Beach • La Habra • Pleasanton
• Riverside • Rohnert Park • San Diego • San Francisco • San Jose • Santa Ana • Santa Rosa
County Government• Alameda • Contra Costa • Orange • Fresno • Los Angeles
• San Mateo • Santa Clara • Solano • Yolo
SUMMARYLinda has over 20 years of professional experience providing auditing, accounting and consulting service to the public sector. In the public sector assurance practice, Linda has lead audits of numerous large government engagements.
Linda currently serves as the lead audit partner on the Orange County Employee’s Retirement System (OCERS) and assisted OCERS in implementing both GASB 67 and 68. Though there were many complexities to the plan, the implementation process was one of the smoothest yielding only one question to the auditor from plan sponsors. Linda and her teams efforts and strong working relationship with OCERS and its actuaries ensured that information provided to plan sponsors was clear, complete and delivered timely.
Linda has also served as lead for the City of San Jose Retirement Plans. One of the biggest challenges during her tenure was the collapse of the economy in 2008. She was diligent in working with the Plans and the City of San Jose to ensure known losses, contingencies and uncertainties in fair value reporting were appropriately reported. She also assisted the Plans in the implementing several new standards and ensured timely reporting to the City as a pension trust fund.
Linda currently serves as the engagement partner for the San Diego City Employees Retirement Plan and and as the Professional Standards Partner for CalPERS.
EDUCATIONSt. Mary's College, Moraga, CaliforniaB.S., Economics & Business Administration (Accounting)
CONTINUED PROFESSIONAL EDUCATION In the past three years Linda has accumulated 137 Continuing Professional Education units; of which 53 directly relate to government.
PROPOSED ROLE & RESPONSIBILITIES
• Performs a second review of the financial statements and other reports to provide additional assurance that the audit conforms to the firm and professional standards.
• Available to assist the team with any technical issues that may arise during the audits.
PROFESSIONAL STANDARDS REVIEWER
Linda Hurley, CPA

14
ASSOCIATIONS• American Institute of Certified Public
Accountants• California Society of CPAs (CalCPA)• Certified IDEA Data Analyst (CIDA)• GFOA Special Review Committee
REPRESENTATIVE CLIENT EXPERIENCE
Retirement Systems• Pasadena Fire and Police Retirement
System• San Bernardino County Employees'
Retirement Association • San Diego City Employees' Retirement
System
Counties and Cities Governments• Los Angeles• San Diego• Santa Monica
Other Governmental Entities• California State Los Angeles Auxiliaries• County of Los Angeles Investment Pool• Housing Authority of the City of Los Angeles• Port of Los Angeles• San Diego County Investment Pool• South Orange County Community College
District
SUMMARYAmy is a Senior Manager at MGO, and is based in the Los Angeles office. She has over 10 years of auditing experience and has performed financial, compliance and single audits. Her responsibilities have included: planning engagements including preparing audit programs and time budgets; performing various accounting, financial and operational assignments; preparing and reviewing workpapers and supporting schedules; performing tests of details; reviewing and analyzing client internal controls; preparing account reconciliations; supervising and training staff auditors; drafting or reviewing all workpapers and documents prepared by subordinates; completing financial statements and preparing management recommendation letters. Amy also specializes in data analysis using IDEA software. She is certified IDEA Data Analyst (CIDA), which is designed to show case technical abilities to provide an independent validation of skills and expertise using data analytics.
EDUCATIONMasters of Accounting, University of Southern CaliforniaB.S., Accounting, University of Southern California
CONTINUED PROFESSIONAL EDUCATION In the past three years Amy has accumulated 179.5 Continuing Professional Education units; of which 104.5 directly relate to government.
PROPOSED ROLE & RESPONSIBILITIES
• Assists engagement partner in planning, controlling, reviewing and evaluating fieldwork.
• Consults with audit team on issues and progress of fieldwork.
• Discusses accounting and control issues with clients and assists in resolving those issues.
• Manages the execution of the audit activities, monitor progress and ensure on-time delivery of required deliverables.
• Reviews work performed by our actuarial specialists (on pension plans audit)
ENGAGEMENT MANAGER
Amy Chiang, CPA, CGMA
SECTION 3 | PERSONNEL QUALIFICATIONS

15
SECTION 3 | PERSONNEL QUALIFICATIONS
Joyce LinENGAGEMENT SENIOR
PROPOSED ROLE & RESPONSIBILITIES
• Performs engagement planning
• Reviews and analyzes client internal controls
• Supervises engagement staff
• Reviews workpapers prepared by staff
• Ensures audit work performed conforms to professional and firm quality control standards
• Reports engagement status to the Manager
REPRESENTATIVE CLIENT EXPERIENCE
Retirement Systems• Pasadena Fire and Police Retirement
System• San Bernardino County Employees'
Retirement Association
City Governments• Compton• Los Angeles
County Governments• Los Angeles• San Bernardino
Other Governmental Entities• Burbank-Glendale Pasadena Airport
Authority• California State University, Los Angeles
University Auxiliary Services, Inc. • Housing Authority of the City of Los Angeles• Palos Verdes Peninsula Transit Authority
SUMMARYJoyce is a Senior at Macias Gini & O'Connell, LLP, with four years of experience in the financial statement audits such as San Bernardino County Employees' Retirement Association, County of Los Angeles, and City of Los Angeles. On her engagements, Joyce’s responsibilities include conducting entrance meetings, SAS 99 interviews, and walkthrough meetings with clients, performing risk assessments and data analytics, and executing audit procedures. Joyce is passionate about helping governmental entities maintain transparency and accountability over financial reporting by communicating recommendations and building strong client relations.
EDUCATIONCalifornia State University of Los AngelesB.S. Business Administration - Accounting
CONTINUED PROFESSIONAL EDUCATION Although Joyce is not a certified public accountant, she has attended numerous in-house trainings which have accumulated to 92.5 YellowBook hours.
PROFESSIONAL MEMBERSHIPS• California Society of CPAs (CalCPA)• Information Systems Audit and Control Association• Ascend

16
INFORMATION TECHNOLOGY SPECIALIST
Jasmine Costa, CISA
PROPOSED ROLE & RESPONSIBILITIES
• Conducts IT general and application controls assessments and focus reviews on system security and governance as directed by the Project Liaisons.
• Works closely with assurance professionals to conduct the information systems review.
CONTINUED PROFESSIONAL EDUCATION In the past three years Jasmine has accumulated 38 Continuing Professional Education units.
ASSOCIATIONS• California Society of CPAs (CalCPA)• ISACA
RELEVANT CAREER EXPERIENCEMacias, Gini & O’Connell, 2017 – Present Manager, Advisory Services
NuVasive, Inc., 2015 – 2016 Lead IT Internal Auditor
Sharp Healthcare, 2015 – 2015 IT Risk Management, Change Management & Project Implementation
Bridgepoint Education, 2011 – 2015 IT Compliance
CoreLogic, 2007 – 2011 Enterprise Risk Management & Information Security
SUMMARYJasmine has over 10 years of experience in IT audit and compliance, risk management, and information security, with a major emphasis on IT SOX 404 and operational audits. Her areas of expertise include developing and executing comprehensive IT general controls and application controls test plans, development of controls where necessary, documentation, testing, and remediation, and overall project management. She has also managed first year audits and IT compliance initiatives, including SSAE16 SOC reviews, mapping of service provider controls to company’s internal control framework, and working with third-party vendors to ensure compliance with company’s policies and standards. Additionally, she has had exposure to financial controls and has assisted in testing and evaluating said controls under the SOX 404 program.
Jasmine has worked in a variety of industries from healthcare and for-profit higher education to financial services.
She has a proven track record in facilitating partnerships between IT, internal and external auditors, and business management in order to achieve compliance for the company.
EDUCATIONUniversity College London, U.K., Undergraduate Master of Science in Computer Science
SECTION 3 | PERSONNEL QUALIFICATIONS

SECTION 4
Methodology


17
Understanding of Project and Proposed Deliverables.Communication is Key.We will address up front all key accounting and reporting issues that could potentially affect our audit opinion. We are confident that proper planning, timely communication, and the prompt resolution of reporting issues with special emphasis on the requirements for consideration of all component units of the System as defined in the accounting literature will lead to a smooth process to the final Annual Financial Report
Scope of Services.MGO will provide the following auditing services beginning with the fiscal years ending June 30, 2018 through June 30, 2020:
Finanical Statements.We will audit the System's financial statements in accordance with auditing standards generally accepted in the United States of America (GAAS) as promulgated by the American Institute of Certified Public Accountants (AICPA) and the standards applicable to financial audits contained in Government Auditing Standards, issued by the Comptroller General of the United States for the purpose of issuing an Independent Auditor's Report that includes our opinion on the fair presentation of the basic financial statements, in conformity with accounting principles generally accepted in the United States of America (GAAP).
GAAP provides for certain required supplementary information (RSI), such as management’s discussion and analysis (MD&A), and pension schedules as prescribed by GASB 67, to accompany the basic financial statements. As part of our engagement, we will apply certain limited procedures to the RSI. These limited procedures will consist principally of inquiries of management regarding methods of measurement and presentation. Supplementary information other than RSI, also accompanies the basic financial statements. We will subject certain supplementary information to auditing procedures applied in our audit, which we will provide an opinion “in relation” to the basic financial statements.
SECTION 4 | METHODOLOGY

18
We will issue a Report on Internal Control Over Financial Reporting and on Compliance and Other Matters Based on an Audit of Financial Statements Performed in Accordance with Government Auditing Standards. Included in this report, if applicable, will be deficiencies identified during the audit that upon evaluation are considered significant deficiencies or material weaknesses as defined by AU-C 265 Communicating Internal Control Related Matters Identified in an Audit, of the AICPA's Codification of Auditing Standards.
Our approach entails an analysis of audit risks leading to a focus of audit effort. MGO uses this approach in our public company and government entity audits and have provided training and educational programs related to these standards for over 10 years so that we can implement them seamlessly and without interruption to your schedule.
SECTION 4 | METHODOLOGY

19
We don't just check it over, we triple check it over.Our audit strategy recognizes that the System is operating as a closed plan and our audit work plan carefully considers the unique characteristics of the Plan.
Over time, we have developed a thorough and efficient audit work plan. Our audit, including statistical sampling and analytical procedures, reflect the current operating environment and will continue to evolve as accounting rules change and new audit risks surface. Based on our extensive experience and understanding of the System' operations, our audit work plan will address the following significant financial statement and audit areas:
Contributions*• Design and function of
internal controls over contributions, including:
• Use of proper contribution rates
• Proper calculation of City's contribution based on the terms under Contribution Agreement No. 16,900 with the City.
• Confirmation of contributions received from the City.
• Proper recording of the City's contribution in the financial statements of the System.
Benefit Payments• Design and function
of internal controls over benefit payments, including:
• Eligibility to receive benefits
• Calculation and review of benefit payments in accordance with plan provisions
• Support for distributions and withdrawals (as applicable)
• Application of new benefit provisions or legislative changes
• Performance of high precision analytical procedures, using IDEA software, query benefit payments to identify anomalies or unusual and duplicate payments
• Performance of analytical procedures for unusual or significant changes from the prior year
• Proper recording as to member, amount and period
Reporting• Review financial
statements and related disclosures to ensure conformity with GAAP
• Design and function of internal controls over investments, including the following:
• Development of investment policies and guidelines, including asset allocation, benchmarking, securities lending, derivative, foreign currency management and real estate leveraging
• Hiring and monitoring of the custodian bank, asset and fund managers and other investment consultants
• Methodologies and techniques used to determine fair values
• Account reconciliations and general ledger posting of investment transactions
• Performance and review of investment account reconciliations
• Compliance with asset allocation, derivative, and leverage policies
• Classification of investments
• Using statistical sampling method to determine investment sample size and to validate fair value of investment transactions
• Recording of investment transactions, including purchases, sales, capital calls, distributions, interest and dividends
• Selection and payment of asset and fund managers
• Monitoring and reporting of the custodian bank, asset and fund managers, advisors and general partners
• Performance of high precision analytical procedures by comparing actual investment rate of returns to the target and benchmark rate of returns
• Conformity of financial statement disclosures to accounting and financial reporting standards
Investments
Actuarial Data • Application of plan
provisions in actuarial valuations
• Compliance of actuarial assumptions and methods with Actuarial Standards of Practice
• Compliance of actuarial assumptions and methods with generally accepted accounting principles
• GASB Statement No. 67, Financial Reporting for Pension Plans - An Amendment of GASB Statement No. 25
• Accuracy and reliability of member data
• Performance of data mining procedures using IDEA software, query member data provided by the System and member data used by the third-party actuary to verify accuracy and completeness of data used in performing the annual actuarial valuation report
*In the event that the required minimum funded percentage was not achieved and additional supplemental contributions are required from the System, MGO will perform the audit procedures as stated in this section.
SECTION 4 | METHODOLOGY

20
Approach.Work Plan.
Our audit approach carefully considers the identification of key risk areas and allocation of appropriate resources. Professionals with extensive accounting and auditing experience lead all phases of our audit. With our experienced leaders in the field, our efficiency and effectiveness increase when dealing with complex accounting and auditing issues. This section further presents discussions on our approach to the services we will provide to the System, details our framework for planning and performing the audit, and sets forth our audit scope and timing.
Terms of Engagement.The goal of our examination is to render an opinion that the System‘s financial statements are fairly stated, in all material respects, in conformity with accounting principles generally accepted in the United States of America. In order to accomplish this goal with minimal disruption to you, it is imperative that communications are continuous and in a timely manner when obstacles occur or if any issues arise. We consider the System to be a “Partner” in accomplishing our mutual goal and will develop a joint work plan, which incorporates the needs, timing and expectations of the audit from both perspectives. The Engagement Manager, Amy Chiang, will serve as MGO‘s project manager on the engagement. Information Gathering.The key element of effective audit planning is a thorough understanding of the System‘s operations. This includes operating environment, accounting and internal accounting control structure, and financial position. Our experience provides us the knowledge to develop a detailed understanding of these elements. We can, therefore, effectively identify the nature of significant account balances/transaction classes, assess risk, and design audit tests. Information gathering includes the following procedures:
Information Gathering
01 02
Terms of Engagement
Execution
03 04
Strategy & Planning
05
Form Opinion& Reporting
APPROACH General Audit Approach
01
02
SECTION 4 | METHODOLOGY

21
• Update information on the System‘s environment.• Document our understanding of the System’s general
controls over the critical transaction streams.• Meet with the System personnel and members of the
Board of Retirement to acquire additional knowledge of areas of concern.
Strategy and Planning.Based on the information gathered, the engagement team will develop an audit plan, which responds to the areas we have identified as areas of concern as it relates to the financial reporting process. During this process, we perform the following:
• Assess the risk of inadequate financial statement presentation by evaluating the financial reporting process.
• Continually reassess the System‘s processes as we become aware of additional risk areas.
• Develop audit procedures to address our risk assessment.
In the event that the System upgrades or changes its existing information systems, it must evaluate the potential impacts on existing policies and processes and data integrity. Our Information Technology (IT) consultants are specifically skilled in evaluating computer-based systems to determine whether systems are operating effectively to provide reliability and integrity of, and security over, the data being processed.
Execution.Based on the information gathered in the risk assessment process, we will perform:
• Tests on the general controls and IT general controls.• Tests on data and review for abnormalities and
relationships.• Tests of audit procedures.
As exceptions become known, we will work with management of the System to ensure our understanding is correct and develop recommendations for improvements.
03
04
SECTION 4 | METHODOLOGY

22
Form Opinion and Reporting.The key element in this phase is to receive timely and accurate information. This eliminates the duplication of work for both the System and MGO.
This phase includes:• Validation of information in the management’s
discussion and analysis, notes, other required supplementary information and other supplementary information. Agreement of balances in the financial statements and supplementary schedules to the accounting records and ensure expected relationships within the financial statements are noted.
• Our technical reviewer also reviews the entire reports to provide a “fresh” and “cold” review.
• MGO will issue our opinion upon completion of our reporting process, including receipt of the management representation letter.
05
SECTION 4 | METHODOLOGY

23
Risk Assessment.SUMMARYIn Step 1, the financial statement risk assessment, audit plan, roles and responsibilities, and communication protocols are developed collectively with engagement team members.
ACTIVITIES• Identify financial reporting risks (including fraud) via
brainstorming sessions and interviews• Determine financial statement account risks by
analyzing quantitative and qualitative factors, including the review of interim financial statements prepared by management of the System
• Identify relevant assertions and related risks• Review and evaluate the System's internal control
system and risk assessment process to determine the level of risk and mitigating controls
• Establish status reporting and communication protocols
• Develop audit plans
Transaction-level Control Assessment.SUMMARYDuring Step 3, the engagement team will identify significant financial reporting and compliance controls for higher risk areas. An assessment will be made as to whether controls are appropriately designed to mitigate the identified risks. The risk that a control might fail to operate will also be evaluated.
ACTIVITIES• Identify key financial reporting controls• Perform walkthroughs to assess design
effectiveness and document results• Evaluate the risk of control failure, considering
factors such as: • Past errors• Entity-level controls• Experience of personnel
• Develop/evaluate risk and control matrices of all key risks related to control points
• Perform tests of application controls, as appropriate• Assess the design of controls
Entity-level Controls.SUMMARYThe objective of Step 2 is to evaluate the System's entity-level control environment using the widely accepted COSO evaluation framework, as applicable. Although not directly involved with the processing of transactions, these pervasive controls can have a significant effect on the financial reporting process. Information technology controls associated with financial reporting are also evaluated using the COBIT (Control Objectives for Information Technology) framework established by ISACA.
ACTIVITIES• Review elements of COBIT and COSO for the
System's systems• Document and test entity-level controls via
walkthroughs, interviews and detailed testing• Identify and test general controls over information
technology systems upon which other significant application controls are dependent
• Report key findings and discuss remediation steps• Prepare summary of entity-level controls
(including IT)
Testing and Reporting.
SUMMARYThe final stage of our internal controls approach involves developing and executing a test plan of the transaction-level key controls. An assessment is made as to whether the controls are operating as intended to mitigate the associated risk. The nature, timing and extent of testing is correlated with the risk of control failure determined in Step 3.
ACTIVITIES• Develop testing strategy and plan for key controls,
including the nature, timing and extent of testing• Execute testing and summarize results• Evaluate whether controls are operating
effectively• Investigate root cause(s) of control weaknesses• Design substantive tests for account balances
based on control testing results
Our Proven 4-step Approach to Assessing Control Risk.During the Strategy & Planning and Execution phases of the audit, we will consider the System's internal control over financial reporting and compliance to determine the audit procedures that are appropriate in the circumstances for the purpose of expressing our opinions on the financial statements.
Assessing Control Risk.
Entity LevelControls
01 02Risk Assessment Testing &
Reporting
03 04Transaction Level
Control Assessment
Assessing Control RiskAPPROACH
01
03
02
04
SECTION 4 | METHODOLOGY

24
MGO’s Approach to Analytical Procedures. Auditing standards require the use of analytical procedures in the planning and overall review stages of the audit. They may be used throughout the audit: 1. To direct our attention during the planning stage to areas where
amounts appear unusual to the extent that we are put on warning that a material amount may be misstated;
2. To provide an important source of audit evidence at the execution stage or substantive analytical procedure; and
3. In forming an opinion on the financial statements by assessing the overall reasonableness of these statements.
Preliminary Analytical Reviews – assist us in planning the nature, timing, and extent of auditing procedures that will be used to obtain evidential matter for specific account balances or classes of transactions. To accomplish this, we focus on enhancing our understanding of the client’s business and the transactions and events that have occurred since the last audit date and identifying areas that may represent specific risks relevant to the audit.
Our work will normally cover a comparison of:• Actual results to budget;• Current year operating results and financial position with the prior
year;• Key financial and operating ratios with the prior year, the industry,
and with each other;• Relationships among elements of financial information within the
period; and• Relevant non-financial information (e.g., number of employees,
square footage, etc.).
Substantive Analytical Procedures - (SAPs) - essentially involve a comparison of an amount in the financial statements with what we would expect that amount to be based on our knowledge of the organization and having regard to other audit evidence.
Our work will normally involve utilizing the following techniques:• Using data mining software (IDEA) to extract data and prepare
subsequent analysis to concentrate on.• Determining whether there is a valid relationship between the
items being compared (e.g., between interest and interest bearing balances).
• Disaggregating information to compute ratios, percentages and amounts for different funds separately.
• Use of pivot tables to identify unusual or unexpected trends.
SECTION 4 | METHODOLOGY

25
Our use of IDEA Data Analysis Software enables the audit team to summarize and stratify data that help identify risk of fraud in financial statements. The following are just a few examples of fraud tests that can be performed with IDEA.
• Summarizing 100% of general ledger detail (as opposed to a sample) to identify unusual balances (i.e. high number of benefit payments over the year, extremely high or low amount of benefit payments).
• The ability to stratify samples among high- and low-dollar value populations for better audit coverage using IDEA scripts.
• Using IDEA pivot tables or scripts, we can perform analytical procedures using disaggregated data (e.g., benefit payments by month by retirees or beneficiaries during the current and prior reporting periods).
• The ability to extract information to uncover possible fraud (for example, the ability to search a vendor list to find similar names but different addresses could uncover potential fraud by an employee who has access to cash disbursements and maintains the vendor list for check payments).
• IDEA can help isolate debits and credits in an account or group of accounts to help facilitate more detailed analysis.
Considering the quality of the data being used in the procedure factoring whether we tested the data and the source of the data.
Obtaining audit evidence is a cumulative process. As a result, we recognize that a single SAP may not give us sufficient assurance that an amount is fairly stated. However, where we apply a series of SAPs to an amount stated in the financial statements and in each case our conclusion is that the procedure provides evidence that the amount is consistent with our expectations, then we have obtained a degree of assurance that the amount is validly stated.
Overall Analytical Review - assists us in assessing the conclusions reached and in the evaluation of the overall financial statement presentation. We use a wide variety of analytical procedures for this purpose. The overall review would generally include reading the financial statements and notes and considering the adequacy of evidence gathered in response to unusual or unexpected balances identified in planning the audit or in the course of the audit; and unusual or unexpected balances or relationships that were not previously identified.
Results of an overall review may indicate that additional evidence may be needed.
SECTION 4 | METHODOLOGY

26
MGO’s Approach to Sampling.Audit sampling is the application of an audit procedure to less than 100% of the items within an account balance or class of transactions for the purpose of evaluating the value of the balance or class. Substantive test (“variables”) sampling provides a technique for estimating the extent of monetary misstatement in a class of transactions or balances. It can also be used for estimating the amount of a population. It answers the question, “How much?” rather than “How many?” as in sampling for attributes (such as the operation of a control), and is normally used to help decide if a balance is materially misstated. Sampling can be very useful in performing substantive tests on, for example, inventory or accounts receivable. Sampling is sometimes also used for determining sample sizes for substantive tests of recorded transactions (e.g., vouching of sales, purchases).
There are situations when the more formal approach to sample size determination is often not practical. These situations include:• Test counting during inventory observations.• Examining canceled checks when reviewing a bank reconciliation.• Checking depreciation calculations.• Requesting vendor statements.• Testing accruals.• Interviewing client personnel in conjunction with observation and
inquiry procedures.• Applying analytical procedures.
This does not mean that we would never use sampling for the above types of procedures. For example, sampling might be used when determining the extent of testing for:• Examining canceled checks when the client’s outstanding check list
consists of an unusually large number of items which are similar in amount, such as a payroll account for a very large client.
• Selecting invoices for verifying an accounts payable listing consisting of an unusually large number of items similar in amount.
• Testing an accrual comprised of a large number of small items.
The application of sampling requires significant auditor judgment in areas such as:• Considering alternative audit approaches (e.g., use of Computer
Assisted Audit Techniques (CAATs)).• Defining the population and defining the sampling item.• Assessing the overall risk level for related control, analytical
procedures, and risk assessment activities.• Determining materiality as a base for calculating the tolerable
misstatement (error).• Selecting items for 100% examination. • Determining the sample size, considering factors such as:
a. Expected misstatement (errors) to be found.
SECTION 4 | METHODOLOGY
27
b. The effect of other tests on the account being tested.Sampling may also be used to determine items to be tested against compliance requirements. Tests of compliance requirements are considered substantive procedures, thus the sampling approach described above would be used when account balances relate to compliance. If an account balance is not associated with a compliance requirement (i.e. single audit requirements), statistical sampling and/or judgment is used depending on the population size of the sampling unit to determine appropriate sample sizes. In larger populations statistical sampling is used. In summary our sampling procedures include the following:1. Define the objective2. Define the population and the sampling unit3. Define tolerable misstatement4. Remove items for 100% examination5. Specify the desired level of sampling assurance and the acceptable risk
of over-auditing6. Estimate the expected (anticipated) misstatement7. Select the sampling technique (e.g., non-statistical, Probability
Proportional to Size, Stratified Random Sampling)8. Determine the sample size9. Select the sample10. Examine the sample items and evaluate the sample result
Benefits to you.The benefits from our methodology stem from our commitment to:
• Process efficiencies without sacrificing audit quality. We understand the importance of keeping the cost of our services affordable and our audit methodology has been specifically designed to provide your engagement team with the tools they need to perform a high quality audit in a cost effective manner.
• Integrated and ongoing audit process with emphasis on internal controls. Financial statement and internal control testing is performed by the same individuals and our methodology is specifically designed to help plan and perform the integrated audit as a single audit, as opposed to separate and uncoordinated financial statement and internal control audits.
Why MGO’s Approach is Distinctive.• Technologically advanced. MGO commits substantial “R&D”
resources each year to develop and improve our audit methodology to equip your MGO engagement team with the latest technology possible. For example, our audit methodology employs proprietary audit programs and our audit workpapers are fully networked and encrypted. This allows multi-location engagement teams to collaborate in real time while maintaining our high standards of security and confidentiality of your data.
SECTION 4 | METHODOLOGY

28
• Effective communications. Effective listening and regular, proactive two-way communication throughout our audit process is an essential cornerstone of our audit quality and superior client service. This focus on communication allows your MGO audit teams to gather information necessary to perform the audit and keep you up to date on the status of our services so that you can provide timely input and evaluate whether our services meet your high expectations.
• Scalable. Every entity we audit is unique, and obtaining a strong understanding of your operations is essential to tailoring our services to your entity’s unique risks and needs, and avoiding a “one size fits all” approach. Our audit methodology has been specifically designed to be flexible and scalable so that your engagement teams can incorporate its understanding of your entity and departments into the audit approach to appropriately size our efforts to your entity.
• Early and Continuous Partner Involvement. Our professional staff to partner ratio is lower than our major competitors, enabling more time for partners to be actively involved in the audit. Your assurance partners have considerable governmental and audit experience, and MGO believes the engagement partners should be actively involved throughout the audit process in a hands-on manner. Our audit methodology has been specifically designed to facilitate this level of partner involvement.
• Environmentally friendly. Our network electronic audit platform significantly reduces MGO’s carbon footprint by reducing travel, work paper storage and transportation costs.
Coordinated Approach with the System.• We will place significant emphasis on close coordination with the
management of the System to gain a meaningful understanding of the System’s own risk assessments and procedures in place to address those risks in order to make our own work as efficient and effective as possible.
• We will gather sufficient information on the other similar governmental entities and key audit risks to enable us to design appropriate audit procedures, and conduct the audit in the most efficient manner and within the agreed time frame and budget. Information gathering will also include a “client participation schedule” list with agreed timetable for provision of information and pre-year-end planning meetings.
• We will promote clear and timely communication of issues to avoid last minute surprises and to enable smooth and timely reporting.
• We also seek to provide feedback to management in ways that controls can be improved as early as possible, to help management in performing its responsibilities to maintain effective controls, and leverage any changes made by management early in our audit process.
SECTION 4 | METHODOLOGY

29
Law and Order.When planning and performing audit procedures and in evaluating and reporting the results thereof, we need to recognize that an illegal act may materially affect the financial statements. Laws and regulations vary considerably in their relation to the financial statements.
Quality Control.MGO‘s mission is to enable us to provide outstanding service to our clients, be responsive to our community, and succeed on our pillar of quality and integrity. Clearly, our professionals are the most important component of the quality service we provide, and it is essential that we support our professionals with a system of quality controls that helps ensure their success.
MGO quality control requires a systematic of review of all work, with increasing levels based on our assessment of risk. Our quality control system also require a concurring review of the reports prior to issuance. As you have experienced with MGO over the last 3 years, our firm specializes in auditing state and local government (SLG) agencies. Only qualified, experienced SLG professionals will be assigned to the System's engagement. They will provide you with personalized, professional, and timely service. It is our firm’s policy to have our management personnel very involved during the audit of the System. This policy should ensure that the System will have someone very knowledgeable of government operations throughout the duration of our professional contract with the System.
SECTION 4 | METHODOLOGY

30
This page intentionally left blank.
SECTION 4 | METHODOLOGY

SECTION 5
PriceProposal


31
Cost Approach.MGO maintains a high degree of flexibility in our audit plan, modifying it annually as your organization risks change or new accounting or auditing standards or regulatory requirements are added. We believe that we always look for the most cost effective alternatives and we are able to provide quality audits that are both flexible and cost efficient. What you get from working with MGO is more than just an audit of your financial statements. The System is regarded as one of our key clients and will continue to receive direct attention from our most senior and experienced professionals.
WITH US, YOU DEAL WITH DECISION MAKERS. Our senior engagement manager is hands-on in the field. Your engagement partner and manager are regularly on-site with your team to ensure that issues are dealt with and decisions are made on a real-time basis to avoid unnecessary delays.
DEPTH AND BREADTH OF TALENT. We’re prepared for any emergency. We have the bench strength to provide additional team members with minimal lead-time to help ensure that unforeseen events do not delay the financial reporting process. We have immediate access to firm and industry experts to resolve technical issues.
Professional Fee Philosophy.Our fee philosophy is to foster long-term client relationships by offering fair and competitive pricing. As a result, we are sensitive to the System need to control costs. It is our commitment to offer quality service at competitive and fair rates. Our proposed not-to-exceed fees and estimated hours to provide audit services for the System for the years ending June 30, 2018, 2019 and 2020, with an anticipated period of two-year option at the System's election for the fiscal year ending June 30, 2021 and 2022 are included on the following pages.
The proposed fees are based on the assumption that there will not be any major changes in scope, which includes new accounting or auditing standards and legal or regulatory requirements, that are not foreseeable at this time; therefore, the impacts cannot be determined. If the scope of the audit is expanded, our fees may be adjusted accordingly.
MGO affirms that all prices, terms, and conditions are held firm for at least 90 days beginning January 18, 2018.
SECTION 5 | PRICE PROPOSAL

32
ATTACHMENT A
ServiceJune 30, 2018
Audit Cost, not to exceed
June 30, 2019 Audit Cost, not to
exceed
June 30, 2020 Audit Cost, not
to exceed
June 30, 2021 Audit Cost, not
to exceed
June 30, 2022 Audit Cost, not
to exceed
Annual financial audit, report and required
disclosures (Section III, Requested Services)
$ 49,500.00 50,985.00$ 52,514.55$ 54,089.99$ 55,712.69$
Total Cost (2018-2020): 152,999.55$
PartnerInformation Technology Specialist
Pasadena Fire & Police Retirement System
PRICE PROPOSALFOR AUDITING SERVICES
325$ 325$ 210$ 210$ 114$ 105$
Partner
Stephanus Tedja
Macias Gini & O'Connell LLP[Firm Name]
Billing Rates for Additional Pre-Approved Services
Employee Name Job Title/Classification Hourly Rate
Senior ManagerSenior
Associate
[Name, Title]
Optional One-Year Extensions to the Contract
Per Section VI.G of the RFP, as a duly authorized representative of the firm, I affirm that all prices, terms and conditions are fixed for at least 90 days from the date of the proposal submission.
Authorized Signature / Date
James Godsey, Partner
James GodseyLinda HurleyJasmine CostaAmy Chiang
Joyce Lin
SECTION 5 | PRICE PROPOSAL

SECTION 6
Additional RequestedForms and Information


33
License to Practice in State of California.Our firm and all key professional staff assigned to the engagement are properly licensed by the State of California to practice as Certified Public Accountants. MGO meets all requirements imposed by federal, state and local laws, rules, and regulations.
Quality Control Review.MGO’s commitment to performing quality assurance work has been recognized by our clients and the national standards setters. The quality of our State and Local Government Industry Group is evident by the results of our Peer Review when we received an unqualified opinion – the highest level of assurance possible – with no comments from the firm of Carr, Riggs & Ingram. The results of these reviews provide independent validation of our commitment to providing quality assurance services. Please refer to the following page for a copy of our most recent peer review report.
SECTION 6 | ADDITIONAL REQUESTED FORMS AND INFORMATION

34
SECTION 6 | ADDITIONAL REQUESTED FORMS AND INFORMATION

35
Similar Engagements.The following references are of our most significant contracts with other large organizations similar to the project described in the RFP.
Client:San Bernardino County Employees' Retirement Association
Orange County Employees' Retirement System
San Diego City Employees' Retirement System
Description of Work Performed:
Conducted financial and/or compliance audits with the following deliverables:
• Financial Statements• GASB 68 Schedules
Conducted financial and/or compliance audits with the following deliverables:
• Financial Statements• GASB 68 Schedules
Conducted financial and/or compliance audits with the following deliverables:
• Financial Statements• GASB 68 Schedules
Engagement Partner:James Godsey Linda Hurley Linda Hurley
Term of Engagement:2009 - Current 2005 - Current 2007 - Current
Client Contact Information:Julie UnderwoodChief of Fiscal ServicesT: (909) 885-7980 EXT 330E: [email protected]
Brenda ShottAssistant CEO, Finance and Internal OperationsT: (714) 558-6201E: [email protected]
Lee ParravanoInternal AuditorT: (619) 525-3608E: [email protected]
SECTION 6 | ADDITIONAL REQUESTED FORMS AND INFORMATION

36
ATTACHMENT B
Pasadena Fire & Police Retirement System
CONFLICT OF INTEREST DISCLOSURE
All proposers are required to complete and sign this Attachment and include it with the proposal submission. If additional pages are needed, each page must be signed in the format below.
1. A list and description of any financial or other business relationship (currently and for the pastfive years) with the City of Pasadena or any of its component units/agencies, Fire & PoliceRetirement System, or Board Members of the Fire & Police Retirement System, together witha statement explaining why such relationships do not constitute a conflict of interest relative
2. A list and description of the proposer’s current clients who may have a financial interest in theoutcome of the contract, together with a statement explaining why such relationships do notconstitute a conflict of interest relative to performing the financial audit. If there are none, astatement to that effect must be provided.
3. I certify that we conform to the independence standard promulgated in the GeneralAccounting Office’s Government Auditing Standards and that we will continue to conformthroughout the audit engagement.
Name of Firm
Authorized Signature Date
Printed Name Title
to performing the financial audit. If there are none, a statement to that effect must be provided. MGO is under contract with the City of Pasadena (City) for advisory services related to a fraud risk assessment, specifically for six departments since December 21, 2015. The contract was amended on October 10, 2016, to expand the scope of the services provided, to include a modified enterprise risk assessment and conduct risk assessment for an additional five departments. The advisory services provided by MGO to the City doesn't constitute a conflict of interest relative to performing the financial audit of the system. MGO doesn't assume any management responsibilities for the City under this contract. The scope of services is for risk assessment, risk identification and risk mitigation. In addition, MGO was contracted by the System for the financial audit services for fiscal years 2015, 2016 and 2017.
Macias Gini & O'Connell LLP
January 18, 2018
James Godsey Partner
SECTION 6 | ADDITIONAL REQUESTED FORMS AND INFORMATION

37
ATTACHMENT D
Pasadena Fire & Police Retirement System
AFFIDAVIT OF EQUAL OPPORTUNITY EMPLOYMENT & NON-SEGREGATION
By submitting this form you are declaring under penalty of perjury under the laws of the State of California and the laws of the United States that the information is true and correct. Furthermore, you are certifying that your firm will adhere to equal opportunity employment practices to assure that applicants and employees are not discriminated against because of their race, religion, color, national origin, ancestry, disability, sex or age. And, your firm does not and will not maintain or provide for its employees any segregated facilities at any of its establishments, and that it does not and will not permit its employees to perform their services at any location, under its control, where segregated facilities are maintained.
Name of Firm Telephone Address City State Zip Code Active City of Pasadena Business License Number Remit Address (if different) Authorized Signature Date Printed Name Title
Macias Gini & O'Connell LLP (213) 408-8666
777 S. Figueroa St., Suite 2500
Los Angeles CA 90017
Application was submitted on January 17, 2018
3000 S. Street, Suite 300, Sacramento, CA 95816
January 18, 2018
James Godsey Partner
SECTION 6 | ADDITIONAL REQUESTED FORMS AND INFORMATION

38
ATTACHMENT E
Pasadena Fire & Police Retirement System
DECLARATION OF NON-COLLUSION The undersigned declares: I am the of . (Insert "Sole Owner", "Partner", "President, or other proper title) (Insert the name of the Proposer) The party making the forgoing bid/proposal submitted herewith to the Pasadena Fire & Police Retirement System declares:
That all statements of fact in such bid/proposal are true; That such bid/proposal was not made in the interest of or on behalf of any undisclosed person, partnership, company, association, organization or corporation; That such bid/proposal is genuine and not collusive or sham; That said Proposer has not, directly or indirectly by agreement, communication or conference with anyone attempted to induce action prejudicial to the interest of the City of Pasadena, or of any other Proposer or anyone else interested in the proposed contract; and further That prior to the public opening and reading of bids/proposals, said Proposer:
a. Did not directly or indirectly, induce or solicit anyone else to submit a false or sham bid/proposal; b. Did not directly or indirectly, collude, conspire, connive or agree with anyone else that said Proposer or
anyone else would submit a false or sham bid/proposal, or that anyone should refrain from bidding or withdraw his or her bid/proposal;
c. Did not, in any manner, directly or indirectly, sought by agreement, communication, or conference with anyone to raise or fix the bid/proposal price of said Proposer or of anyone else, or to raise or fix any overhead, profit, or cost element of the bid/proposal price, or of that of anyone else;
d. Did not, directly or indirectly, submit his or her bid/proposal price or any breakdown thereof, or the contents thereof, or divulge information or data relative thereto, to any corporation, partnership, company, association, organization, bid depository, or to any member or agent, or to any individual or group of individuals thereof to effectuate a collusive or sham bid, except the City of Pasadena, and has not paid, and will not pay, any person or entity for such purpose or to any person or persons who have a partnership or other financial interest with said Proposer in his or her business.
Any person executing this declaration on behalf of a Proposer that is a corporation, partnership, joint venture, limited liability company, limited liability partnership, or any other entity, hereby represents that he or she has full power to execute, and does execute, this declaration on behalf of the Proposer. I certify under penalty of perjury of the laws of the State of California that the above information is correct.
Authorized Signature Date Printed Name Title
Partner Macias Gini & O'Connell LLP
January 18, 2018
James Godsey Partner
SECTION 6 | ADDITIONAL REQUESTED FORMS AND INFORMATION

39
ATTACHMENT F
Pasadena Fire & Police Retirement System
LOCAL PREFERENCE
The proposer may complete this Attachment and include it with the proposal submission only if the firm is eligible to claim local preference. Local preference is defined as maintenance of an office in the City of Pasadena from which the services requested in this RFP will be provided.
1.
2.
Name of Firm
Authorized Signature Date
Printed Name Title
Physical location and mailing address of the office: MGO does not qualify for local preference as we do not have an office within the City of
Pasadena.
If at this location for less than three years, the prior location and mailing address:
Macias Gini & O'Connell LLP
James Godsey
January 18, 2018
Partner
SECTION 6 | ADDITIONAL REQUESTED FORMS AND INFORMATION
40
Vendor Data. Taxpayer Identification Number: 680300457
Relationship With The City.MGO is under contract with the City of Pasadena (City) for advisory services related to a fraud risk assessment, specifically for six departments since December 21, 2015. The contract was amended on October 10, 2016, to expand the scope of the services provided, to include a modified enterprise risk assessment and conduct risk assessment for an additional five departments. The advisory services provided by MGO to the City doesn't constitute a conflict of interest relative to performing the financial audit of the system. MGO doesn't assume any management responsibilities for the City under this contract. The scope of services is for risk assessment, risk identification and risk mitigation. In addition, MGO was contracted by the System for the financial audit services for fiscal years 2015, 2016 and 2017.
SECTION 6 | ADDITIONAL REQUESTED FORMS AND INFORMATION

This page intentionally left blank.
41
SECTION 6 | ADDITIONAL REQUESTED FORMS AND INFORMATION

The West Coast is our home. WE HAVE CHEERFUL OFFICES THROUGHOUT CALIFORNIA.
mgocpa.com
Beverly Hills8383 Wilshire Boulevard, Suite 500Beverly Hills, CA 90211T: 310.652.0222
El Segundo2321 Rosecrans Avenue Suite 4210El Segundo, CA 90245 T: 310.953.3486
LA/Century City2029 Century Park EastSuite 1500Los AngelesCalifornia 90067 T: 310.277.3373
LA/Downtown777 S. FigueroaSuite 2500Los AngelesCalifornia 90017T: 213.408.8700
Newport Beach4675 MacArthur CourtSuite 600Newport BeachCalifornia 92660T: 949.221.0025
Sacramento HQ3000 S Street Suite 300SacramentoCalifornia 95816T: 916.928.4600
San Diego /Del Mar12264 El Camino RealSuite 402San DiegoCalifornia 92130T: 858.792.2210
San Francisco 315 Montgomery StreetSuite 806San FranciscoCalifornia 94104T: 415.829.4312
Walnut Creek2121 N. California Blvd.Suite 750Walnut CreekCalifornia 94596T: 925.274.0190
Woodland Hills 21031 Ventura Blvd.Suite 550Woodland HillsCalifornia 91364

Pasadena Fire & Police Retirement System
AGENDA REPORT
TO: Chair Jones and Board Members of the Fire
FROM: Jill Fosselman, Secretary to the Board
DATE: February 21, 2018
ITEM: Amendment to Agreement No. 20,823, Beneficial Interest Assignment of 275 East Cordova Street
RECOMMENDATION
Upon receipt of the presentation and discussion, the Board may:
1. Approve Amendment to Agreement No. 20,823, or 2. Other direction provided by the Board.
BACKGROUND
In 1989, the City acquired The Concord, a senior affordable housing property, at a total cost of $1.5 million utilizing $1.4 million of funds from the City's FY 1989 and FY 1990 discretionary contributions to the Fire & Police Retirement System ("FPRS"). In the Board of Directors Agenda Report for the July 18, 1989 meeting, it's stated that in lieu of the City's FY 1989 and FY 1990 cash contributions to FPRS, the City assigned 93% of the beneficial interest in the property and all cash flow until 2031 to FPRS, and 7% beneficial interest in the property to the Pasadena Community Development Commission or its successor agency for its contribution of $100,000. Attached to this report are the July 12, 1989 Board of Directors Agenda Report, excerpted minutes from the July 18, 1989 Board of Directors meeting, and excerpted minutes from the July 19, 1989 FPRS Board meeting.
This past fall the Board directed staff to develop an agreement between the City and FPRS to formalize the 1989 assignment of beneficial interest in the Concord property. City staff insisted on memorializing the beneficial interest in the current contribution agreement between FPRS and the City so as to enhance future implementation of the beneficial interest as resultant funds are realized by the City. It is important to note that no changes were made to the existing language in the contribution agreement. Importantly, the amendment does not change required minimum funding percentages or required supplementary contributions from the City.
Staff worked with City staff and FPRS counsel to draft the amendment which has been approved as-toform by FPRS counsel. The key tenants of the amendment include:
1. Beneficial interest assigned in 1989 is memorialized through amendment of Amended and Restated Contribution Agreement No. 20,823 (the "2011 Agreement"). Settlement and Release
February 21, 2018 Page 1 of 2
Beneficial interest Assignment
DATE: 2/21/2018ITEM#: 10

Agreement No. 18,550 (the "2004 Agreement") and the "2011 Agreement" remain in full force and effect.
2. Beneficial interest in the ground lease rent:
o FPRS is assigned 100% of the ground lease rent and interest on past-due ground lease
rent from the operation of the property as Concord Senior Housing from 1989 through 2031, or if and until the City sells the property, whichever occurs first; and
o If the property, or a portion of the property, is sold or leased, proceeds generated from the sale shall first be applied to satisfy past due-ground lease rent and related accrued
interest through the date of sale.
3. Beneficial interest in the property shall be assigned 93% to FPRS and 7% to the Housing Successor Agency for the production of low and moderate income housing:
o FPRS shall maintain 93% beneficial interest assignment in the property for all future
transactions related to the original parcel boundaries, including any transactions related
to subdivisions/lot line adjustments, until the City is no longer fee title owner to land within the original parcel boundaries.
4. Any funds realized by the City and provided to FPRS under this assignment of beneficial interest
shall be considered FPRS assets for annual valuation purposes.
5. FPRS cannot force or prevent the City from engaging in transactions regarding the property.
NEXT STEPS
City staff anticipates presenting the amendment to the City Council Ed Tech Committee on March 20, 2018. Following the Ed Tech Committee review, the amendment will be presented to the City Council for approval and adoption at the March 26, 2018 City Council meeting.
FISCAL IMPACT
As of the July 31, 2017 audited financial statements for the Concord property, a total of $2,813,331 was recorded as a liability for current and past due rent, and $3,255,409 was recorded as a liability for interest on the past due rent. As of July 31, 2017, t he total outstanding amount due to the City for current and past due rent and related interest is $6,068,745.
ATIACHMENTS
1. Amendment to Agreement No. 20, 823 (Beneficial Interest Assignment of 275 E. Cordova Street) 2. July 12, 1989 Agenda Report to the Board of Directors for the July 18, 1989 meeting (Agenda Item
No. VI-B-3) and excerpted minutes.
February 21, 2018 Page 2 of 2
Beneficial interest Assignment

AMENDMENT TO AGREEMENT NO. 20,823
THIS AMENDMENT TO THE AMENDED AND RESTATED CONTRIBUTION
AGREEMENT NO. 20,823 ("Amendment") is entered into between the CITY OF
PASADENA ("City") and the PASADENA FIRE AND POLICE RETIREMENT SYSTEM
("System").
WHEREAS, On July 31, 1989, the City and Pasadena RHF Housing, Inc. ("RHF")
entered into a ground lease agreement for the Concord Senior Housing Apartments
("Concord") located 275 East Cordova Street, Pasadena, California 91101 ("Ground
Lease") wherein RHF, as tenant, agreed (i) to pay annual rent to the City in the amount
of $130,000 ("Annual Rent"), limited to the availability of net cash flow from the operation
of the Concord, as defined by the U.S. Department of Housing and Urban Development
("HUD"), and (ii) to defer payment of the remainder of any Annual Rent not paid for a
fiscal year (due to insufficient net cash flow) until such time as the net cash flow from the
Concord is sufficient to pay.
WHEREAS, the Concord has frequently failed to generate sufficient net cash flow
for the payment of the Annual Rent and as of July 31, 2017, the accrued and unpaid
Annual Rent plus interest is $6,068,745 ("Accrued Rent").
WHEREAS, on November 1, 2011, the City and the System entered into Amended
and Restated Contribution Agreement No. 20,823 (the "Contribution Agreement");
WHEREAS, the parties wish to amend the Contribution Agreement to memorialize
the System's beneficial interest in the Concord, the Accrued Rent and the ongoing Annual
Rent; and
24924.00002\30483358.2 1

WHEREAS, the parties wish to have the Contribution Agreement remain in full
force and effect, and to have any proceeds actually received by the System as a result of
the beneficial interest assigned by the City to the System pursuant to this Amendment
counted towards the City's minimum funding percentages for the System as set forth in
Section 4(a) of the Contribution Agreement.
NOW, THEREFORE the Parties agree to amend the Contribution Agreement as
follows:
1. A new Section 4.5 (between Section 4 and Section 5) shall be added, and
shall read as follows:
"Section 4.5 Beneficial Interest in Concord Senior Housing Facility
(a) Concord Transactions. As of the date this Amendment is signed by
all required parties, the City is engaging in and/or intending to engage in transactions
related to the Concord Senior Housing Facility, located at 275 East Cordova Street,
Pasadena, California (the "Concord"), as further described in the legal description found
in Exhibit "A" of the July 31, 1989 Ground Lease between the City of Pasadena and
Pasadena RHF Housing, Inc. (the "Ground Lease").
(b) Ownership of the Concord. Notwithstanding the City's ownership
interest in the Concord, the City acknowledges and agrees that the funds used for the
purchase of the Concord were from set aside monies from the City's 1989 discretionary
contribution fund to the System (the "Discretionary Contribution Fund") and that this use
served the dual public purpose of securing low income senior housing for the residents
of the City, while also providing an asset for the benefit of the System. In lieu of
24924.00002\30483358.2 2

contributing the Discretionary Contribution Fund to the System, the City agreed to assign
to the System a 93% beneficial interest in the Concord.
(c) Income from Operations. It was further the intent of the City at the
time of the City's purchase of the Concord in 1989 and the use of the Discretionary
Contribution Fund for such purpose that the System be entitled to payment of all cash
income which is collected by the City from the lease, rental or operation of the Concord
during the period between July 31, 1989 through August 1, 2031 ("Payment Period"). The
Concord has frequently failed to generate sufficient net cash flow for the payment of the
annual rent as required under the terms of the Ground Lease ("Annual Rent") and as of
July 31, 2017, the accrued and unpaid Annual Rent plus interest is $6,068,745 ("Accrued
Rent").
(d) The City hereby assigns to the System:
(1) Ninety Three percent (93%) beneficial interest in the Concord;
and
(2) One Hundred percent (1 00%) of all Ground Lease rent
payments and related accrued interest on past-due and future Ground Lease rent on the
Concord for the Payment Period, or until the City sells the Concord, whichever occurs
first.
(e) Sale of Concord.
(1) If the City sells the Concord, or a portion thereof,
(A) The proceeds generated from the sale, including any
transactions related to subdivisions/lot line adjustments (collectively the "Future Concord
Transactions") shall first be paid to the System in the amount of the Accrued Rent plus
24924.00002\30483358.2 3

any subsequent Annual Rent, including interest at a rate of eight and one-half percent
(8.5%), that is accrued and unpaid through the date the City's interest in the Concord is
sold;
(B) The remainder of the proceeds from the sale, including
any proceeds from Future Concord Transactions, shall be allocated as follows: (i) ninety
three percent (93%) to the System; and (ii) seven percent (7%) to the Pasadena Housing
Successor (''Housing Successor"), a Special Revenue Fund of the City of Pasadena.
(f) Any proceeds actually received by the System as a result of the
beneficial interests described herein shall be considered and treated as assets of the
System for annual valuation purposes, and shall be counted towards the City's minimum
funding percentages, as described in Section 4 (Supplemental Payments by City) of this
Contribution Agreement.
(g) This Section is intended to establish a beneficial interest in the
System related to the above-mentioned transactions. This Section is not intended to
create an obligation that the City initiate or complete any particular transaction, nor is it
intended to create a bar to the City engaging in other transactions related to the Concord.
The parties agree that the City retains sole and absolute discretion regarding decisions
related to the Concord."
2. For purposes of this Amendment, the Effective Date shall be the date upon
which this Amendment is signed by all required parties.
3. All other sections and subsections of the Contribution Agreement not
amended by this Amendment shall remain in full force and effect.
24924.00002\30483358.2 4

IN WITNESS WHEREOF, the parties hereto have caused this Amendment to be
executed by their duly authorized representatives as of the date set forth below.
DATED: ______________ __
ATTEST:
Mark Jomsky, CMC City Clerk
APPROVED AS TO FORM:
Javan N. Rad Chief Assistant City Attorney
DATED: ----------------
24924.00002\30483358.2 5
CITY OF PASADENA
By: Steve Mermell City Manager
PASADENA FIRE AND POLICE RETIREMENT SYSTEM
By: Keith Jones Chair

'I .;· .
Agenda Report
DATE: JULY 12, 1989
TO: BOARD OF DIRECTORS
FROM: DONALD F. MciNTYRE 1 CITY MANAGER
SUBJECT: CONCORD TRANSACTION
RECOMMENDATION:
That the City Board of Directors:
1. • .
2.
Authorize the expenditure of no more than $1.,600,000 from the City's FY 1988-89 ($1,000,000) and FY 1.989-90 ($600,000) Discretionary Contributions to the Fire and ~olice Retirement system for the cost of the acquisition and rehabilitation of the Concord Apartments.
Adopt a resolution:
a. Approving the terms and conditions of a Purchase Agreement between the City of Pasadena and the Pasadena Retirement Housing Foundation for the acquisition of the fee title to the land and subsequently improvements located at 275 East Cordova,
b. Approving the terms and conditions of a Ground Lease between the city of Pasadena and the Pasadena Retir~m~nt Housing Foundation providing for continued operal9¥n of the Concord Apartments until 2016, and .
c. Declaring the City's intention to continue the operation of the Concord Apartments as low and moderate income housing for the elderly until 2031.
3. Authorize the assignment of beneficial interest in the Cityowned land and improvements located at 275 East Cordova to:
a. The Fire and Police Retirement System, in the amount of 93%, and
b. The Community Development Commission, or its successor, in the amount of 7%, specifically for the production of low and moderate income housing.
MEETING OF 7-18-89 AGENDA ITEM NO. VI-B-3

BACKGROUND:
The Concord Senior Housing Apartments (Concord) is a 14 story 150 unit federally financed, low income senior citizens housing project ~ocated at 275 East Cordova Street. The Concord was construpted in 1966 by ·the Churchman Foundation on a 1.3 acre site as subsidized housing with funds lent by the u.s. Department of Housing and Urban Development (HOD) under Section 202 of the Housing --Act of 1959. As such, the concord wasjis subject to federal statutes, regulations · and accompanying regulatory provisions which together a) restricts the occupancy of the building to the elderly, b) requires the owner of the building to be anon-profit organization, c) limits the rents to an amount for building maintenance and debt service and d) authorizes the provision of federa~ rental ~ssistance (now termed Section 8 existing). These provisions were to remain in effect for the life of the Section 202 ~oan until the year 2016.
Unfortunately, in the spring of 1982 the new owner of the Concord, Concord Senior Housing Foundation, (an affiliate of United Community Church of Glendale) induced HOD to accept prepayment of the Section 202 loan and cancel the regulatory provisions cited above. On August 25, 1982, the tenants and prospective tenants of the Concord brought a class action lawsuit seeking a declaration that HUD's purported authorization of prepayment violated federal housing laws.
Subsequently, in July, 1983, the tenants, HUD and the Concord Foundation executed a Stipulation of settlement which reinstated the Section 202 loan and all .the regulatory provisions for the original term ending in the year 2016 and providing a 15 year Section 8 commitment until 1998.
However, on November 22, 1985, the Concord Foundation filed a petition for bankruptcy under Chapter 11 of the u.s. Bankruptcy Code and sought the sale of the Concord to a for-profit organization at a substantial profit. It was felt by the tenants and others that this action was contemplated to attempt a sale of the Concord free and clear of the interest of creditors and regulatory authorities. At that time, the legal representatives of the tenants approached the City Board for support in denying any sale which would have the effect of directing much-needed federal Section 8 rent subsidy away from Pasadena or the elimination of any units of the concord from the low-income senior citizen housing supply prior to the intended expiration of the Section 202 loan and ancillary regulatory provisions in the year 2016.
Although, the City Board and tenants were successful in ensuring that the aforementioned provisions were again upheld, it became quite apparent that the integrity of the new owner could not;would not be guaranteed by the Bankruptcy Court. In January,
2
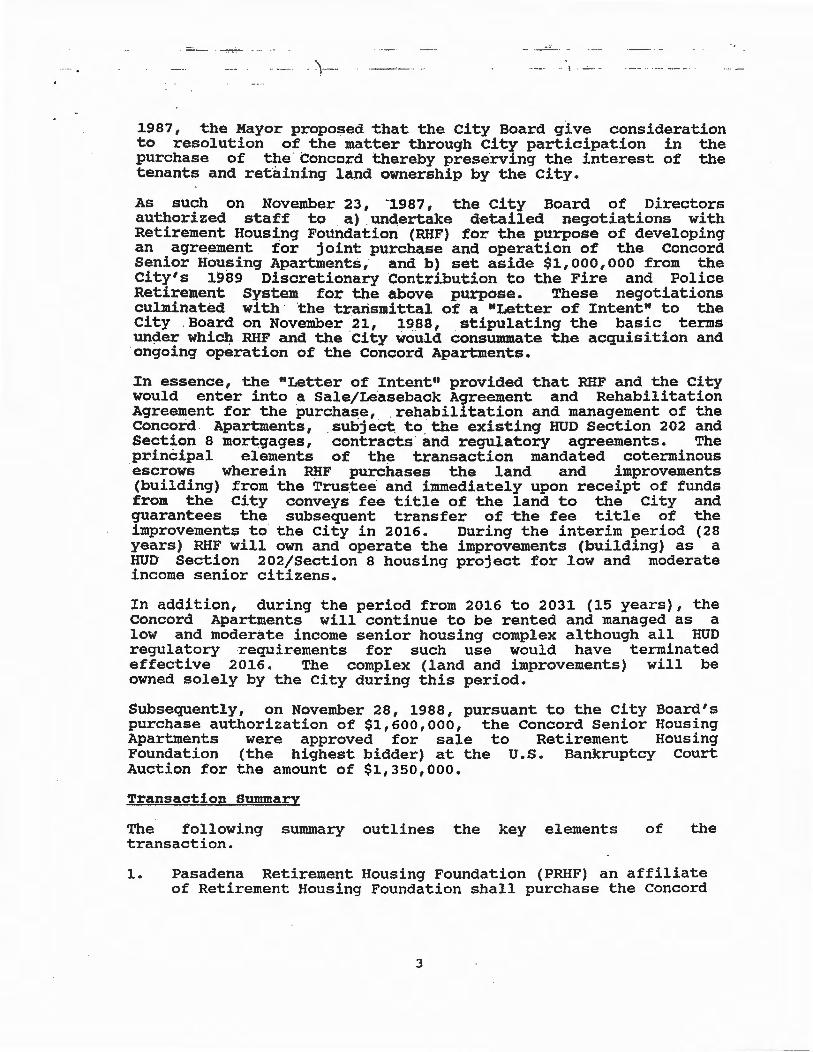
. ~- · . \
1987, the Mayor proposed that the City Board give consideration to resolution of the matter through city participation in the purchase of the · concord thereby preserving the interest of the tenants and retaining land ownership by the City.
As such on November 23, -1987, the city Board of Directors authorized staff to a) .undertake detailed negotiations with Retirement Housing Foundation (RHF) for the purpose of developing an agreement for joint purchase and operation of the Concord Senior Housing Apartments, and b) set aside $1,000,000 from the City's 1989 Discretionary Contribution to the Fire and Police Retirement System for the above purpose. These negotiations culminated with · the ·trarismittal of a "Letter of Intent" to the City . Board on November 21, 1988, stipulating the basic terms under which RHF and the City would consummate the acquisition and ongoing operation of the Concord Apartments.
In essence, the "Letter of Intent" provided that RHF and the city would enter into a Sale/Leaseback Agreement and Rehabilitation Agreement for the purchase, . rehabilitation and management of the Concord Apartments, .subject to . the existing HUD Section 202 and Section 8 mortgages, contracts and regulatory agreements. The principal elements of the transaction mandated coterminous escrows wherein RHF purchases the land and improvements (building) from the Trustee· and immediately upon receipt of funds from the City conveys fee title of the land to the City and guarantees the subsequent transfer of the fee title of the improvements to the City in 2016. During the interim period (28 years) RHF will own and operate the improvements (building) as a HUD Section 202/Section 8 housing project for low and moderate income senior citizens.
In addition, during the period from 2016 to 2031 (15 years), the Concord Apartments will continue to be rented and managed as a low and moderate income senior housing complex although all HUD regulatory requirements for such use would have terminated effective 2016. The complex (land and improvements) will be owned solely by the City during this period.
Subsequently, on November 28, 1988, pursuant to the City Board's purchase authorization of $1,600,000, the concord Senior Housing Apartments were approved for sale to Retirement Housing Foundation (the highest bidder) at the u.s. Bankruptcy court Auction for the amount of $1,350,000.
Transaction summary
The following summary outlines the key elements transaction.
of the
1. Pasadena Retirement Housing Foundation (PRHF) an affiliate of Retirement Housing Foundation shall purchase the Concord
3

-.
Apartments, $1,350,000 Pasadena.
) - ·
via the u.s. Bankruptcy Auction, for the sum of with the £inancial assistance of the City of
2. Simultaneous with the purchase of the Concord by PRHF, the City and PRHF shall enter into a Purchase Agreement and Ground Lease wherein:
a. PRHF ~hall immediately sell fee title of the land to the City,
b. PRHF shall leaseback the land from the City until 2016 for $125,000 annually (approximately 8.5% of the City's total . acquisit;ion investment), which may be deferred pending the availability of funds,
c. PRHF shall retain fee title of the improvements and fixtures until 2016 when said ownership shall be transferred to the City,
d. Foundation . Property Management an affiliate of Retirement Housing Foundation shall uanage the improvements as a Section 202/Section 8 senior housing complex subject to HUD requirements until 2016, and
e. The City shall deposit no less than $1,350,000 into escrow -for acquisition costs.
3. The City's financial investment in the acquisition of the Concord (approximately $1,500,000 and the earnings accruing therefrom} shall be assigned as beneficial interest:
a. 93% of the investment and all cashflows until 2031 to the City's Fire ·and Police Retirement System (FPRS) in lieu of a portion the City's FY 1989 and FY 1990 cash contribution to the Retirement System, and
b. 7% of .the investment to the community Development Commission based on a cash contribution of $100,000.
4. The total City investment for acquisition is expected to earn a minimum of 8.5% return (combination o~ annual cash flow and land appreciation).
5. The City and PRHF may enter into a rehabilitation agreement wherein the City shall make a loan to PRHF to pay a portion of the necessary rehabilitation costs not otherwise funded by HUD (estimated at not more than $100,000). HUD has committed to finance the cost of retrofitting the building with an automatic sprinkler system (estimated at $425,000) and shall also pursue repair of certain outstanding code violations with the Trustee prior to the close of escrow.
4

·- · . .. -- -· --· . ..
6. Estimated Budget
Acquisition $1,500,000
Purchase Price Legal Administrative Appraisal Sl?-rvey
$1,350,000 90,000 50,000 7,000 3,000
Rehabilitation $ 525,000
Repairs and Maintenance Automatic Sprinkler System (HUD)
Grand Total
$ 100,000 425,000
' $2,025,000
7. Based on a determination of qualification, a portion of the City's financial investment shall be credited against the City'$ liability ~nder Section 2 (D) of the .First Amendment to · the Amended and Restated Reimbursement Agreement (No. 13,177), dated July 7, 1986.
Ground Lease Terms and Conditions (General)
1) Premises are 275 East Cordova Street
2) Parties to the Agreement
a) Landlord - City of Pasadena
b) Tenant - ~asadena RHF Housing, Inc.
3) Lease term of 27 years ending in 2016
4) Basic Annual Rental is $125,000, which may be deferred pending availability of funds
5) PRHF shall retain title to the improvements and fixtures subject to the HUD Section 202 loans, HUD Section 8 Contracts and HUD Regulatory Agreement until 2016, when the Land, Improvements and FF & E shall vest immediately and unconditionally in the Landlord,
6)
7)
PRHF shall not sell or assign either rights or its rights under the lease written approval of the City
its ownership without prior
city shall ownership obligations affirmative
have the right of improvements to HUD or City but position
5
to cure andjor assign upon default in RHF city has no liability or

i ·
8) RHF or an affiliate (Foundation Property Management) shall manage the improvements for a management fee equal to 6% of gross revenues
9) In the event that no funds are available to pay rent, RHF shall subordinate its management fee, in the form of a loan for an amount of 1.5% of gross revenues on terms that provide for repayment on an equitable basis from residual receipts in the future
10) Landlord shall be entitled to inspect, examine and copy Tenant's books
11) Tenant shall not discriminate
12) PRHF shall provide a plan to improve and restore the Premises for City approval and authorization to proceed
13) Tenant shall maintain insurance policies providing coverage for:
a) Loss or damage to Premises and FF& E resulting from fire, earthquake, etc.
b) Use and occupancy or business interruption,
c) Public liability
d) Worker's compensation, and
e) Other, as reasonably required by Lanlord.
commission Participation
The above recommendation has been prepared in response to the Community Development Committee's thorough review and discussion of the proposed Concord Transaction. In essence, the Committee raised significant concerns regarding the Senate Bill 481 (SB481} crediting that is contemplated from the transaction and the resultant short term benefit (15 additional years of occupancy) which will accrue to the low-moderate income seniors. Therefore, it is herein proposed that the community Development co.nunission participate with the City in its investment in the Concord Apartments via a cash contribution of $100,000. The funds shall be delivered to the City for deposit with the Fire and Police Retirement System upon assignment of a beneficial interst to the Commission. As such, the Commission shall be assigned a 7% beneficial interest in the residual value of the equity or cashflow from the disposition of the Concord in 2031, specifically, for the production of low and moderate income housing. It is estimated that this participation should generate
6

.-) ______ _
a net future value of either $1,400,000 in equity or $140,000 annual cashflow.
Although, the recommended participation by the Commission seeks to ~ddress the production of future low and moderate income housing, the Community _ Development Committee maintains its concerns .Iegarding the proposed amount of the SB481 Credit. Specifically, the Committee is alarmed by the crediting of present day dollars for a benefit which will not occur for approximately 27 years and that will not generate new low and moderate income housing. However, at this time the Committee wishes to advise the City aoard _that it has approved the Concord Transaction, but shall entertain a more thorough discussion of the SB481 credit .with the Endownient commission. Upon conclusion of these discussions the committee shall then provide the City Board with its recommendation of a special dollar amount for the SB481 credit.
FISCAL IMPACT
The acquisition ~f the Concord s~nior Housing Apartments by the City for approximately $1,4oo;ooo (based on the Commission's participation of $100,000) shall secure for the City an asset currently valued at $2,800,000 (Land-$2,350,000; Building$500,000). Furthermore, in lieu of the City's Discretionary Constribution to the Fire and Police Retirement System a beneficial interest in this asset shall be assigned to the Ret;irement System.- The Retirement System 1 s Actuary has indicated that the interest iri this asset shall be carried on the book of Retirement system at the acquisition cost ($1,400,000'). However, it is estimated that the net future value of the asset in 2031, after the provisions for low and moderate income housing have been retired, will be approximately $20,000,000.
Respectfully submitted,
Prepared /
~~.wo~ MARY B :fi:_f{
Director of Finance I ~A
a t1A-1::;0_ , v \
B12:CTGR:veg
7

RECOMMENDATIONS FROM OFFICERS AND DEPARTMENTS
Director Holden was excused at 2:21 P.M.
Director Cole arrived at 2:40 P.M.
AYES:
NOES: ABSTAIN: ABSENT:
Directors Crowley, Thomson None Director Paparian Director Cole
Holden, Hughston, Nack,
The Chairman announced that now was the time for the report on the Concord Transaction.
The City Manager stated this item would come back to the Community Development Commission agenda later but that action needed to be taken at the present time by the Board of Directors.
William Reynolds, Director of Housing and Development, stated the closing transaction was proceeding as scheduled for July 26, 1989 but that the ground lease concept was still pending in Washington due to HUD's present legal conflict, which could interfere with the closing as scheduled. He said he was prepared to communicate with the Trustee and ask for an extension of the escrow closing date should this happen.
Gregg Robinson, Project Manager, reviewed the report dated July 12, 1989, and answered questions posed by the Board.
The City Manager stated the City should receive an answer from HUD to the project by the last week of July.
The Chairman and Board members complimented Mr. Robinson for doing a thorough and competent job on this project.
Director Crowley requested clarification on whether the cash flow during the period 1989 to 2031 would be split between the Community Development Commission and the Fire and Police Retirement System.
Mr. Robinson clarified that the monies would not be split and all cash flow between 1989 to 2031 would be paid to the Fire and Police Retirement System.
Hr. Laverne Joseph, Chief Executive Officer of the Retirement Housing Foundation, Long Beach, complimented staff for their work and the manner the negotiation was being executed.
Director Crowley and Mr. Joseph discussed disposition of excess funds and maintenance of the facilities.
Motion by Director Crowley, second by Director Nack, to:
- 11 - 7/18/89

,_
1. Authorize the expenditure of no more than $1,600,00~ from the City's FY 1988-89 ($1,000,000) and FY 1989-90 {$600,000) Discretionary Contributions to the Fire and ' Police Retirement system for the cost of the acquisition and rehabilitation of the Concord Apartments.
2. Adopt a resolution:
a. Approving the terms and conditions of a Purchase Agreement between the City of Pasadena and the Pasadena Retirement Housing Foundation for the acquisition of the fee title to the land and subsequent improvements located at 275 East Cordova.
b. Approving the terms and conditions of a Ground Lease between the City of Pasadena and the Pasadena Retirement Housing Foundation providing fo.r continued op~ration of the Concord Apartments until 2016, and
c. Declaring the City's intention to continue the operation of the Concord Apartments as low and
. moderate income housing for the e1derly until 2031.
Resolution 6179
3. Authorize the assignment of beneficial interest in the City-owned land and improvements located at 275 East Cordova to:
a. The Fire and Police Reitrement System, in the amount of 93%, and
b. The Community Development Commission, or its successor, in the amount of 7%, .specifically for the production of low and moderate income housing.
Director Paparian stated that as representative of the Fire and Police Retirement Board, he would prefer Board action be postponed for one week until the Fire and Police Retirement Board had the opportunity to review the transaction being made on their behalf.
Director Crowley stated he supported the presentation of the matter by staff during the meeting of the Fire and Police Retirement Board but would prefer action by the Board during the current meeting, with the understanding that should there be a problem with the transaction, it could be remedied at a later meeting.
Director Cole noted the motion left open the issue of crediting the City's liability under Section 2.0 of the 1st amendment to the amended and restated reimbursement agreement per Senate Bill 481.
- 12 - 7/18/89

,;.-.;.;· ~=w;· ...... _ - - - ·-· • _ ..
1 I
Director Holden returned at 2:53 P.M.
Recessed at 3:00 P.M.
Reconvened at 4:03 P.M.
PUBLIC HEARINGS AND OTHER SCHEDULED DISCUSSIONS
Director Crowley responded that Senate Bill 481 was prepared after the concept for acquisition of the Concord Apartments had been drafted and refined.
AVES: Directors Cole, Crowley, Hughston, Nack, Paparian Thomson
NOES: None ABSTAIN: Director Holden
The Chairman announced that now was the time for th~ report on the proposed water rate ordinance amendments·~
David Plumb, General Manager, Water and Power Depart~t, answered questions from the Board on effective d ie of the first bill, which would be three months from he date the ordinance was approved, and efforts bein made to advise the public of the new rates.
A discussion followed on the appropriat date for the public hearing, one that would give sta sufficient time to notify the public of this matter.
order of the Chairman, the blic hearing for the pr osed water rate ordinanc amendments was set for Augu 22, 1989 at 4:30 P.M.
On order f the Chairman the regular meeting recessed at 3:00 P.M. o an ad rned meeting and closed session regarding Pe onneV and Instruction to Negotiators pursuant to Go rnment Code Section 54957 - Performance Evaluation of C Manager, City Attorney, Administrative Assistant to e Ma or.
On order , the regular meeting reconvened at 4:03 .H.
//
/
/
/The Chairman announced that now as the time for the report on the relocation of the Memo ·al Flagpole.
/ /
/ ~ Robert Edgerly, Director of Adminis rative Services
/ Agency, reviewed the report dated July 1
Director Cole questioned whether considerat1 n had been given to relocating the flagpole to the Civic nter.
Mr. Edgerly stated the Board had reviewed this early in 1988 and the consensus was to keep it same general area.
- 13 -
matter i ~e
""" 7/18/89

REGULAR MEETING
PASADENA FIRE & POLICE RETIREMENT BOARD
WEDNESDAY, JVLY 19, 1989
The Retirement Board of the Pasadena Fire and Police
Retirement System met on Wednesday, July 19, 1989 at 3:00 p.m.
in the Finance Department Conference Room.
ROLL CALL: Members: Davis
staff:
McKeon (Absent)
Misch
Paparian
Tennant
Lathrop
Stroud
Also present was Deputy City Attorney carolyn Williams.
on motion by Mr. Davis, carried with Mr. Tennant
abstaining, the minutes of the June 21, 1989 meeting were
approved.
On motion by Mr. Davis, unanimously carried, Mr. Misch
was elected Chairman for the year ending Jun~ 30, 1990.
On motion by Mr. Paparian, unanimously carried, Mr. Davis
was elected Vice Chairman for the year ending June 30, 1990.
On motion by Mr. Davis, unanimously carried, the Board
appointed Mr. Lathrop as Secretary for the year ending June
30, 1990.
City Director John Crowley and Gregg Robinson from the
Housing & Development Department entered the meeting.

PASADENA FIRE & POLICE RETIREMENT BOARD 7-/?-89 PAGE 2
Motion was made by Mr. Paparian and unanimously carried
that a review by the Retirement Board of the action taken by
the Board of City Directors on July 18, 1989 regarding
acquisition of the Concord Senior Housing Apartment, a
beneficial interest in which shall be assigned to the
Retirement system, is an emergency item which arose subsequent
to posting of the agenda for this meeting and needs to be
heard by the Retirement Board as soon as possible.
Director Crowley briefly reviewed the history of and the
financing of the Concord transaction which will be
accomplished by the expenditure of not more than $1,600,000.00
from the City;s FY89 and FY90 Discretionary Contributions to
the System. This will be the first step taken by the City to
accomplish the goals intended under SB 481.
Board members expressed their thanks for the information
provided by Director Crowley and Mr. Robinson.
A copy of the pertinent excerpt from the minutes of the
Board of City Directors regular meeting July 18, 1989 as well
as a copy of the agenda report dates July 12, 1989 on the
Concord transaction are attached to and made a part of these
minutes.
e Chairman reported that questions have been
June 21, 1989
reached in that
On motion
not present at the
to agendize for
on
the decision
carried, the
1989
subject of reconsideration in the Shirley s
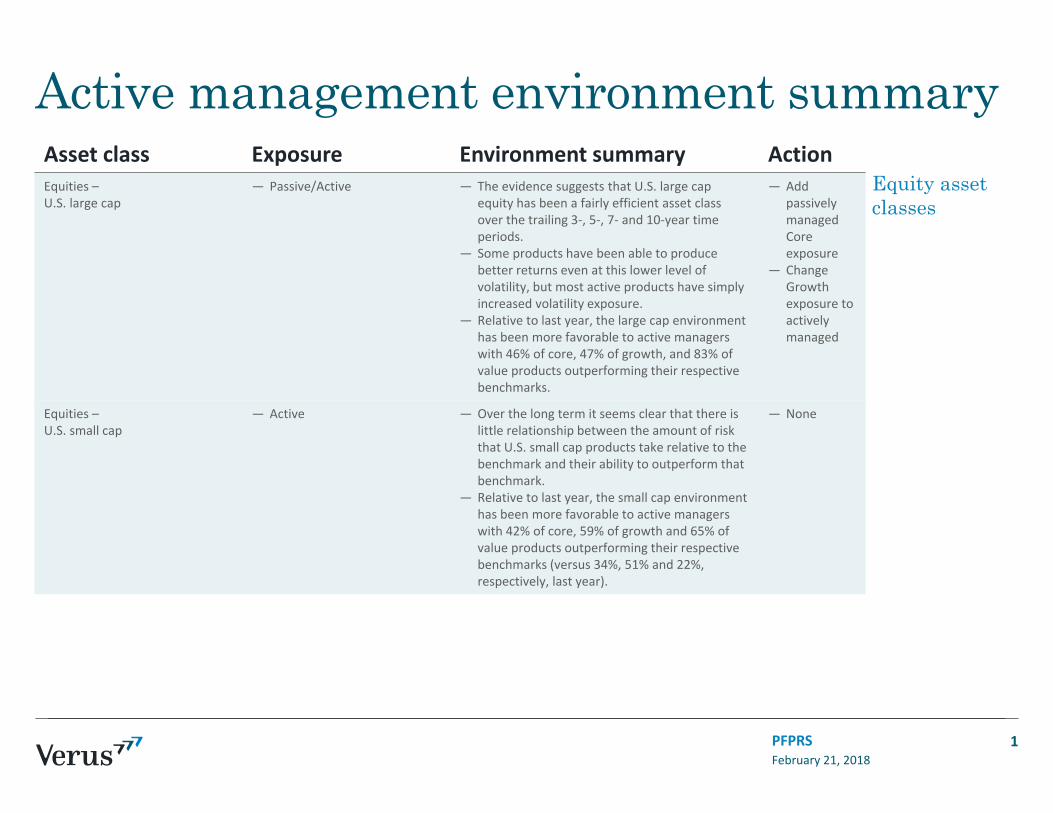
Active management environment summaryAsset class Exposure Environment summary ActionEquities –U.S. large cap
― Passive/Active ― The evidence suggests that U.S. large cap equity has been a fairly efficient asset class over the trailing 3‐, 5‐, 7‐ and 10‐year time periods.
― Some products have been able to produce better returns even at this lower level of volatility, but most active products have simply increased volatility exposure.
― Relative to last year, the large cap environment has been more favorable to active managers with 46% of core, 47% of growth, and 83% of value products outperforming their respective benchmarks.
― Add passively managed Core exposure
― Change Growth exposure to actively managed
Equities –U.S. small cap
― Active ― Over the long term it seems clear that there is little relationship between the amount of risk that U.S. small cap products take relative to the benchmark and their ability to outperform that benchmark.
― Relative to last year, the small cap environment has been more favorable to active managers with 42% of core, 59% of growth and 65% of value products outperforming their respective benchmarks (versus 34%, 51% and 22%, respectively, last year).
― None
February 21, 2018PFPRS
Equity asset classes
1

Active management environment summaryAsset class Exposure Environment summary ActionEquities –International developed
― Active ― In the most recent 3 years, active management was as likely to outperform the benchmark as to underperform, and volatility was less than in longer periods.
― Performance and risk of international equity is comprised of both non‐U.S. equity as well as the foreign currency in which the company is listed. Active currency positions can be an important driver of excess returns and tracking error.
― None
Equities –Emerging markets
― Active ― The past 3‐ and 5‐ years have seen a distinct improvement in active management within the emerging markets equity universe with a major portion of products outperforming the index.
― A significant portion of products in the universe are taking less risk than the benchmark, and a large portion of them have outperformed the index.
― The 5‐ and 7‐year periods reflect the characteristics of earlier periods characterized by greater volatility in emerging markets. During these periods, emerging market equities experienced volatility influenced by commodity price swings and sensitivity to U.S. monetary policy in certain economies with negative current account balances.
― None
February 21, 2018PFPRS
Equity asset classes
2

Active management environment summaryAsset class Exposure Environment summary ActionFixed Income –U.S. TIPS
― Passive ― Over each time period examined the TIPS asset class has been highly efficient, with active products producing minimal added value relative to the benchmark, and with a tight distribution of outcomes relative to the benchmark.
― Although TIPS are considered a “real return” instrument, these securities possess a high duration, making them sensitive to interest rate movement.
― While active management in TIPS has provided little excess return relative to the benchmark, TIPS exposure may still provide somediversification and risk management benefits.
― None
Fixed Income –U.S. core plus
― Active ― Over the long‐term, the core plus fixed income product universe demonstrated higher dispersion than the core bond universe.
― Over the long‐term, there seems to be a positive trade‐off between risk and return within the space.
― More recently, as market volatility has decreased, products with exposures to higher beta assets have reallocated to higher quality securities due to diminishing compensation for higher risk securities.
― The role of active management in the core plus fixed income space, while generally limited, is predicated on the belief that products can add value through security selection and sector rotation while minimizing volatility.
― None
February 21, 2018PFPRS
Fixed income asset classes
3
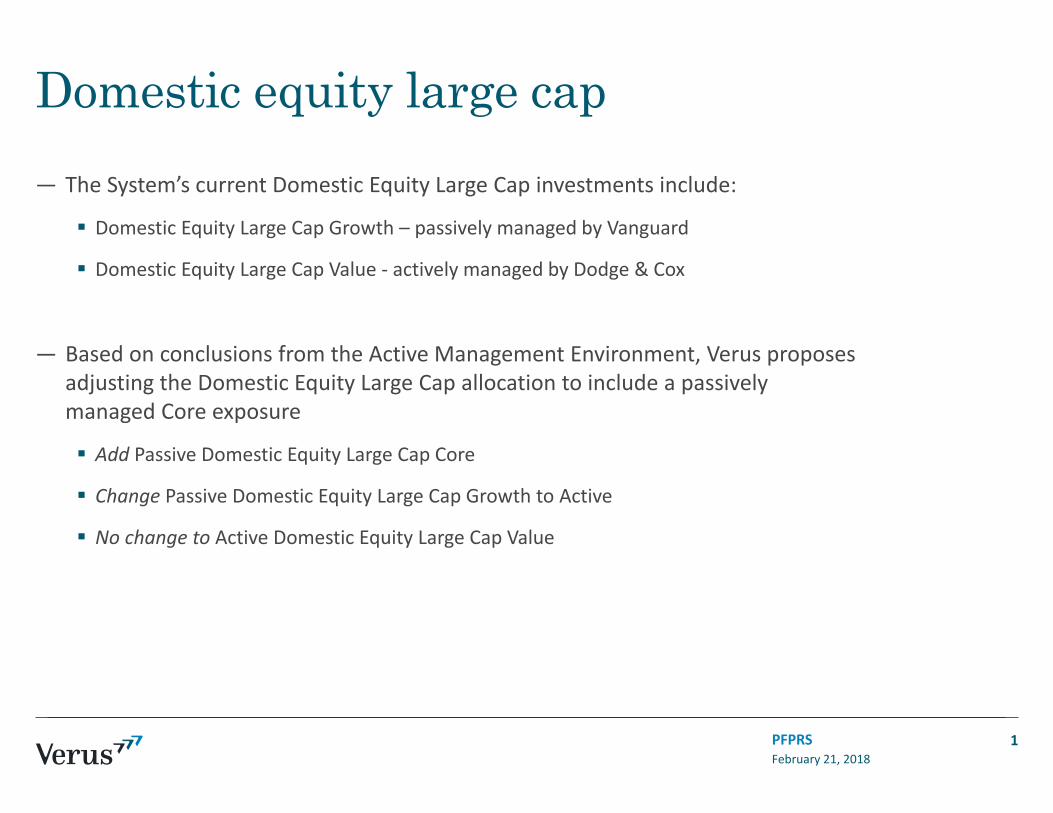
Domestic equity large cap— The System’s current Domestic Equity Large Cap investments include:
Domestic Equity Large Cap Growth – passively managed by Vanguard
Domestic Equity Large Cap Value - actively managed by Dodge & Cox
— Based on conclusions from the Active Management Environment, Verus proposes adjusting the Domestic Equity Large Cap allocation to include a passively managed Core exposure
Add Passive Domestic Equity Large Cap Core
Change Passive Domestic Equity Large Cap Growth to Active
No change to Active Domestic Equity Large Cap Value
February 21, 2018PFPRS 1

Domestic equity large cap— Current allocation
— Proposed allocation
February 21, 2018PFPRS
Data as of December 31, 20171 Manager shown for illustrative purposes
— Annual fees paid to Domestic Equity Large Cap managers currently $57,915 or 0.29%
— Proposed Domestic Equity Large Cap allocations increase annual fees marginally by $74
2
Strategy IPS Target Allocation Assets Annual Fees Expense Ratio
Vanguard Growth Index Passive 8% $9,801,075 $4,901 0.05%
Dodge & Cox Stock Active 8% $10,195,037 $53,014 0.52%
Total $19,996,112 $57,915 0.29%
Strategy IPS Target Allocation Assets Annual Fees Expense Ratio
Vanguard Institutional Index 1 Passive 8.0% $9,998,056 $3,999 0.04%
T. Rowe Price Instl Large Cap Growth 1 Active 4.0% $4,999,028 $27,995 0.56%
Dodge & Cox Stock Active 4.0% $4,999,028 $25,995 0.52%
Total $19,996,112 $57,989 0.29%
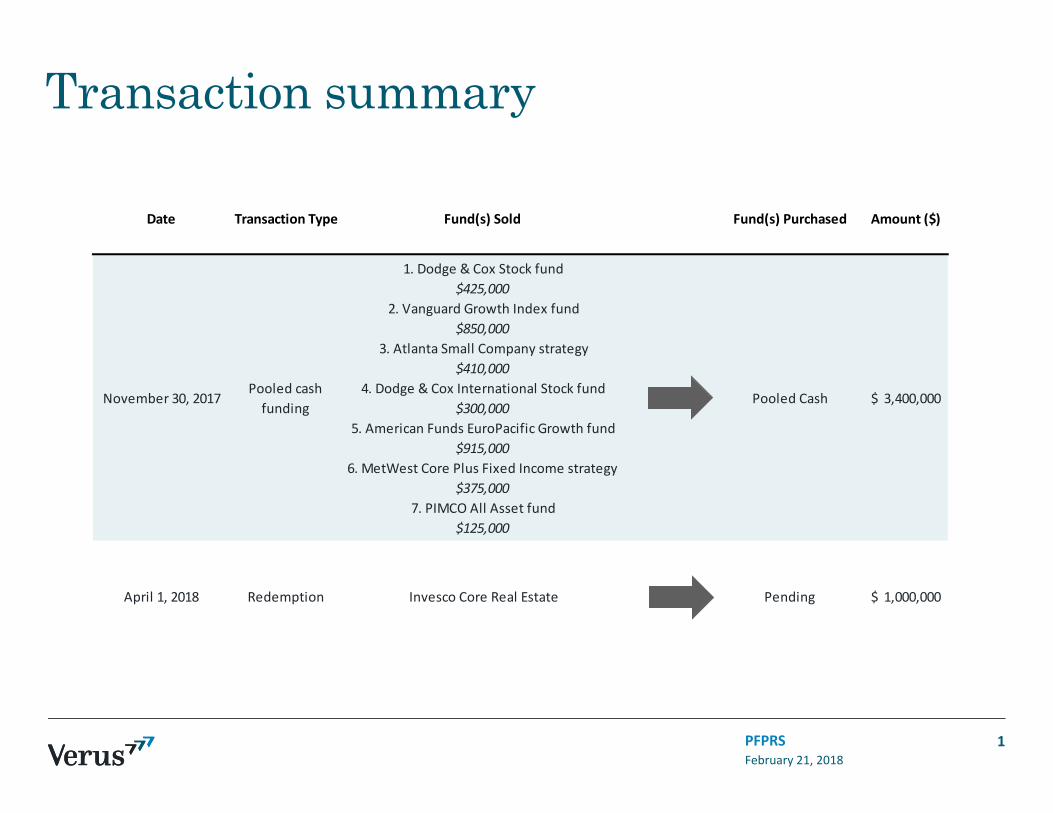
Transaction summary
February 21, 2018PFPRS 1
Date Transaction Type Fund(s) Sold Fund(s) Purchased Amount ($)
November 30, 2017Pooled cash funding
1. Dodge & Cox Stock fund$425,000
2. Vanguard Growth Index fund$850,000
3. Atlanta Small Company strategy$410,000
4. Dodge & Cox International Stock fund$300,000
5. American Funds EuroPacific Growth fund$915,000
6. MetWest Core Plus Fixed Income strategy$375,000
7. PIMCO All Asset fund$125,000
Pooled Cash 3,400,000$
April 1, 2018 Redemption Invesco Core Real Estate Pending 1,000,000$

PERIOD ENDING: DECEMBER 31, 2017
Investment Performance Review for
Pasadena Fire & Police Retirement System

VERUSINVESTMENTS.COM
SEATTLE 206‐622‐3700LOS ANGELES 310‐297‐1777
SAN FRANCISCO 415‐362‐3484
Table of Contents
Investment Landscape TAB I
Investment Performance Review
TAB I I

1ST QUARTER 2018Investment Landscape

VERUSINVESTMENTS.COM
SEATTLE 206‐622‐3700LOS ANGELES 310‐297‐1777
SAN FRANCISCO 415‐362‐3484
Table of Contents
2
Economic environment 5
Fixed income rates & credit 18
Equity 24
Other assets 35
Appendix 38

4th quarter summaryTHE ECONOMIC CLIMATE
—Global growth forecasts for 2018 have been revised higher, most notably in the Eurozone. U.S. expected 2018 GDP growth is 2.6%, above the expansion average. p. 15
—The Eurozone has experienced an impressive economic recovery. In the third quarter, real GDP accelerated to 2.6%, the fastest pace of growth since 2011. p. 16
—The House and Senate agreed to a final tax bill that was signed into law by President Trump on December 22nd. The bill, formally known as the Tax Cuts & Jobs Act, represents a major overhaul of the U.S. tax system. p. 27
PORTFOLIO IMPACTS
—A synchronized pickup in global economic growth, low inflation, strong employment, and accommodative central banks should support global equities moving forward. We recommend maintaining an overweight equity position. p. 14
—Markets remain expensive by most measures. However, it is important to note the merits and flaws of various valuation metrics. p. 32
1st Quarter 2018Investment Landscape
THE INVESTMENT CLIMATE
—Global equities produced strong returns over the quarter and finished the year on a positive note. Emerging market equities led the way, driven by high earnings growth and expansion of valuation multiples off of low levels. p. 25
—The outlook for U.S. equity earnings has improved further, following the signing of the Tax Cuts and Jobs Act. S&P 500 earnings expectations for 2018 were revised upwards from 11.1% to 13.1%. p. 27
—U.S. high yield spreads became increasingly tight. Credit premiums are near all time lows, which may warrant an underweight to U.S. credit. p. 22
ASSET ALLOCATION ISSUES
—Risk assets continue to deliver strong performance, fueled by improving fundamentals and accelerating growth. The current environment appears accommodative for further gains. p. 4
—Equity volatility is very low, helped by stable economic conditions and inflation. Historically, low volatility has indicated less risk of an equity downside event. p. 33
We believe a moderate overweight to risk is warranted
3
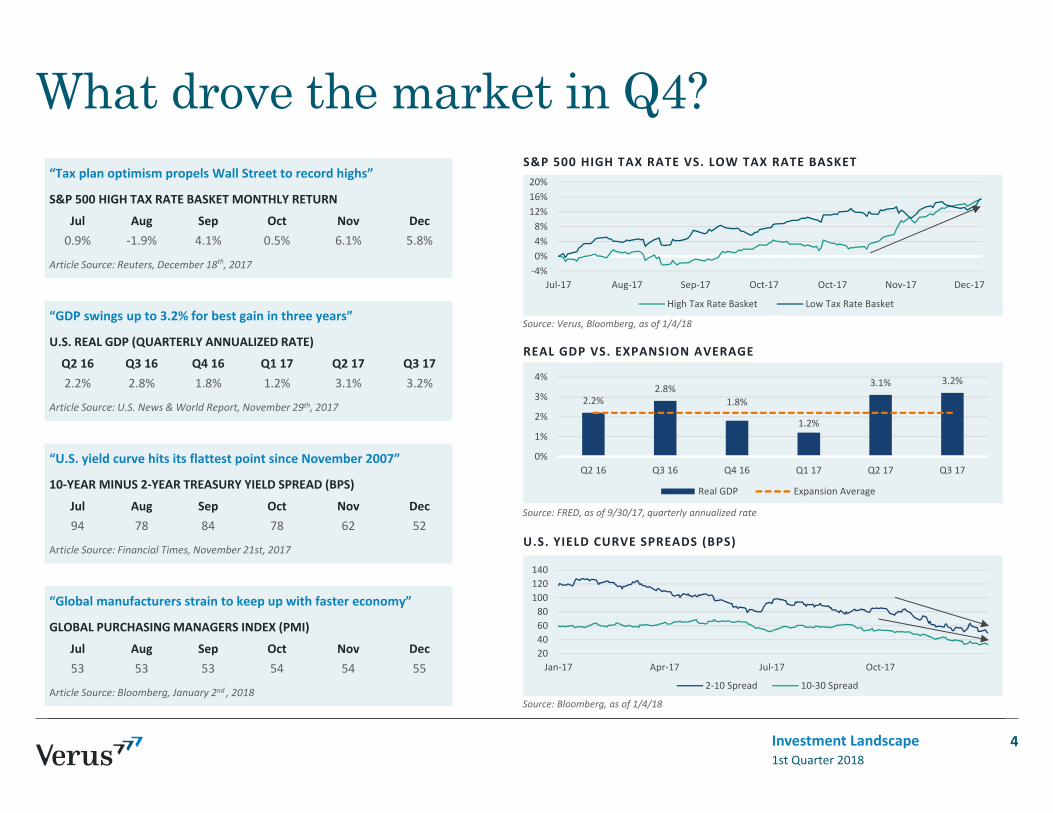
What drove the market in Q4?
1st Quarter 2018Investment Landscape 4
U.S. YIELD CURVE SPREADS (BPS)
REAL GDP VS. EXPANSION AVERAGE
Source: Bloomberg, as of 1/4/18
Source: Verus, Bloomberg, as of 1/4/18
Source: FRED, as of 9/30/17, quarterly annualized rate
“Tax plan optimism propels Wall Street to record highs”
S&P 500 HIGH TAX RATE BASKET MONTHLY RETURN
Jul Aug Sep Oct Nov Dec0.9% ‐1.9% 4.1% 0.5% 6.1% 5.8%
Article Source: Reuters, December 18th, 2017
S&P 500 HIGH TAX RATE VS. LOW TAX RATE BASKET
‐4%0%4%8%12%16%20%
Jul‐17 Aug‐17 Sep‐17 Oct‐17 Oct‐17 Nov‐17 Dec‐17
High Tax Rate Basket Low Tax Rate Basket
2.2%2.8%
1.8%
1.2%
3.1% 3.2%
0%
1%
2%
3%
4%
Q2 16 Q3 16 Q4 16 Q1 17 Q2 17 Q3 17
Real GDP Expansion Average
20406080100120140
Jan‐17 Apr‐17 Jul‐17 Oct‐17
2‐10 Spread 10‐30 Spread
“GDP swings up to 3.2% for best gain in three years”
U.S. REAL GDP (QUARTERLY ANNUALIZED RATE)
Q2 16 Q3 16 Q4 16 Q1 17 Q2 17 Q3 172.2% 2.8% 1.8% 1.2% 3.1% 3.2%
Article Source: U.S. News & World Report, November 29th, 2017
“U.S. yield curve hits its flattest point since November 2007”
10‐YEAR MINUS 2‐YEAR TREASURY YIELD SPREAD (BPS)
Jul Aug Sep Oct Nov Dec94 78 84 78 62 52
Article Source: Financial Times, November 21st, 2017
“Global manufacturers strain to keep up with faster economy”
GLOBAL PURCHASING MANAGERS INDEX (PMI)
Jul Aug Sep Oct Nov Dec53 53 53 54 54 55
Article Source: Bloomberg, January 2nd , 2018

Economic environment
1st Quarter 2018Investment Landscape 5

U.S. economics summary
1st Quarter 2018Investment Landscape 6
—U.S. real GDP grew 2.3% from the previous year in Q3, the fastest pace in more than two years. Growth was driven by consumer spending, private inventory accumulation, and business investment.
— Growth in business investment has provided a material support to the economy over recent periods for the first time in the recovery. Rising domestic and external demand has influenced companies to ramp up production. Survey based measures indicate firms are planning to increase capex over the next six months.
— Core inflation rose slightly from 1.7% to 1.8% over the quarter, driven by higher shelter prices. Strong demand, higher raw material prices, and a weaker dollar may provide modest pressures on inflation, but overall levels remain low. Any material rise
in inflation would likely be met by more aggressive monetary tightening than what is priced into markets.
— The U3 unemployment rate fell further from 4.2% to 4.1%, its lowest level in 17 years.
—Net job creation averaged 204,000 per month in Q3 ‐ above the expansion average of 196,000. Despite robust job gains and low unemployment, wage growth remained modest at 2.5% YoY.
— The Fed raised interest rates for the third time this year to a target rate of 1.25‐1.50%. Fed dot plots indicate three more interest rate hikes in 2018, while the market is only forecasting two. Officials noted that strong economic growth is expected to continue, and raised the 2018 GDP forecast from 2.1% to 2.5%.
Most Recent 12 Months Prior
GDP (YoY) 2.3%9/30/17
1.5%9/30/16
Inflation(CPI YoY, Core)
1.8%12/31/17
2.2%12/31/16
Expected Inflation (5yr‐5yr forward)
2.1%12/31/17
2.1%12/31/16
Fed Funds Target Range
1.25 – 1.50%12/31/17
0.50 – 0.75%12/31/16
10 Year Rate 2.4%12/31/17
2.4%12/31/16
U‐3 Unemployment 4.1%12/31/17
4.7%12/31/16
U‐6 Unemployment 8.1%12/31/17
9.1%12/31/16

GDP growthReal GDP rose by 2.3% from the previous year (3.2% quarterly annualized rate) in Q3, the fastest pace of growth in two years. Economic growth picked up meaningfully in 2017 and consumer and business surveys indicate further strength. Support to the economy includes strong consumer demand both domestically and abroad, low unemployment, and stable core inflation. Despite Fed moves toward normalizing monetary policy, financial conditions have yet to slow down the expansion, likely due to a slower pace of interest rate hikes than expected by the market.
All major components of the economy were positive contributors to growth in Q3, which has only happened in 6% of quarters since 1947. The main source of growth was consumer spending, which rose 2.5% from the previous quarter and contributed 1.4% to the overall growth rate. A faster pace of inventory accumulation was the second largest contributor to GDP, followed by non‐residential business investment. According to the Atlanta Fed GDPNow forecast, real GDP growth is expected to be 3.3% in Q4. Looking ahead to 2018, we believe the economic backdrop is positive, and will remain supportive of the recent pickup in growth.
1st Quarter 2018Investment Landscape
Economic growth has accelerated over the past two quarters
Source: Bloomberg, as of 9/30/17 Source: BEA, annualized quarterly rate, as of 9/30/17
7
U.S. REAL GDP GROWTH (YOY) U.S. GDP COMPONENTS
‐6%
‐3%
0%
3%
6%
9%
12%
15%
Dec‐55 Sep‐69 May‐83 Jan‐97 Oct‐10
Real GDP % Change YoY
0%
2%
4%
Sep‐15 Jun‐17 2.0%
0.9% 0.6%
2.2%
2.8%
1.8%1.2%
3.1%3.2%
‐3%
‐2%
‐1%
0%
1%
2%
3%
4%
Q3 15 Q4 15 Q1 16 Q2 16 Q3 16 Q4 16 Q1 17 Q2 17 Q3 17
Consumption Investment Government Exports Imports Inventories

Business investmentDuring most of the current expansion, corporate investment has been minimal. Many companies have held higher than normal cash balances or used the abundant liquidity created by easy monetary policy to buy back stock. Over the past year, however, there has been a meaningful increase in business capital expenditure (capex) as firms have needed to ramp up production to meet rising global demand. With the labor market close to full employment and jobs more difficult to fill, businesses may rely on investment to meet rising demand. Moving
forward, business capex will likely be an important factor if economic growth is set to continue.
Survey based measures indicate that businesses are making plans to increase investment over the next six months. In addition to rising demand, the changes to the U.S. tax code should provide incentives for businesses to invest. Most notably, the mandatory repatriation of foreign profits at a special tax rate will give firms an ample source of cash that can be used for investment.
1st Quarter 2018Investment Landscape
Business investment has been a material contributor to the recent pickup in growth
Source: Philadelphia FRB Business Outlook Survey, the x‐axis represents the % of firms expecting to increase capex minus the % of firms expecting to decrease capex over the next six months
8
NON‐FINANCIAL CORPORATE CAPEX GROWTH (YOY) SIX MONTH FORECAST OF CAPEX INCREASES
‐40%
‐30%
‐20%
‐10%
0%
10%
20%
30%
40%
Sep‐01 May‐04 Jan‐07 Sep‐09 May‐12 Jan‐15 Sep‐1710
15
20
25
30
35
40
45
50
Sep‐01 May‐04 Jan‐07 Sep‐09 May‐12 Jan‐15 Sep‐17
Average
Source: Bloomberg, as of 9/30/17

InflationCore U.S. inflation picked up slightly to 1.8% YoY in December, a rise from 1.7% in September. Increases in housing and healthcare costs contributed to the move. Headline inflation fell from 2.2% to 2.1% over the quarter.
Market based inflation expectations increased slightly as the 10‐year TIPS breakeven inflation rate moved from 1.8% to 2.0%. Investors expect inflation to stay low for the long‐run based on market pricing.
Low inflation remains a roadblock for central banks hoping to normalize interest rates. However, lower inflation may benefit markets overall by dampening the need for central bank market intervention, which contributes to lower borrowing costs and lower market volatility through greater price stability. The current inflation level may provide markets with a happy medium.
1st Quarter 2018Investment Landscape
Low inflation may be supportive of further economic expansion
Source: FRED, as of 12/31/17 Source: Federal Reserve, as of 12/31/17 Source: Bloomberg, as of 12/31/17
9
U.S. CPI (YOY) U.S. TIPS BREAKEVEN RATES INFLATION EXPECTATIONS
1.8%1.6%
1.9%2.0% 1.7% 2.0%
0.0%
0.5%
1.0%
1.5%
2.0%
2.5%
3.0%
3.5%
4.0%
1 Year Prior 6 Months Prior Dec‐17
5‐Year Implied Inflation
10‐Year Implied Inflation
0%
1%
2%
3%
4%
5%
6%
Apr‐01 Apr‐04 Mar‐07 Mar‐10 Feb‐13 Jan‐16
US Breakeven 10 Year UMich Expected Change in Price
1%
2%
3%
Dec‐16 Dec‐17
‐4%
0%
4%
8%
12%
16%
Jun‐68 Feb‐82 Oct‐95 Jul‐09
US CPI Ex Food & Energy US CPI
1%
2%
3%
Dec‐16 Dec‐17

Labor marketThe U.S. labor market tightened further as unemployment fell from 4.2% to 4.1% over the quarter. Net job creation was robust, averaging 204,000 per month in the third quarter, higher than the expansion average of 196,000. A falling unemployment rate and above average job creation points toward some remaining slack in the labor market despite the longer length of the recovery relative to history. Wage growth improved modestly at 2.5% YoY, but remains below average relative to past economic expansions.
In previous quarters, we noted that the headline unemployment rate may be overstating tight labor market conditions due to discouraged or longer‐term unemployed workers not included in traditional measures. It appears these individuals are slowly making their way back into the labor force, especially during the past two years. The core age (25‐54) participation rate was 81.9% in December, up from a low of 80.6% in September of 2015. This figure was 83.3% prior to the global financial crisis, suggesting there may still be room for additional workers to reenter the labor force.
1st Quarter 2018Investment Landscape
Source: FRED, as of 12/31/17 Source: Bloomberg, as of 11/30/17 Source: FRED, as of 12/31/17
10
UNEMPLOYMENT RATE AVERAGE HOURLY EARNINGS (YOY) CORE AGE PARTICIPATION RATE
1%
2%
3%
4%
5%
6%
Sep‐85 Jul‐92 May‐99 Mar‐06 Jan‐13
0%
4%
8%
12%
16%
20%
Jun‐05 Jun‐07 Jun‐09 May‐11 May‐13 May‐15 Apr‐17
U3 U6
80%
81%
82%
83%
84%
Jun‐05 Jun‐08 May‐11 May‐14 Apr‐17
4%
6%
8%
Jun‐17 Oct‐172%
3%
3%
Dec‐16 Sep‐17

The consumerPositive economic conditions are providing continued support to strong consumer demand, although this has not led to signs of late‐cycle overheating. Consumer spending was 4.5% YoY in November, up from 4.0% three months prior.
Low unemployment, low inflation, and modest wage gains have helped create consistent growth in consumer spending. Monetary tightening has yet to have a material negative impact on consumers through higher borrowing costs and increasing interest payments on existing debt. Furthermore,
a portion of individual costs are determined by the long end of the curve, which has remained fairly stable.
Low interest rates have not led individuals to take on large debt loads as both borrowers and lenders remain cautious. Consumer debt has seen modest growth, while mortgage debt is still recovering from a sharp decline following the 2008‐2009 financial crisis. Growth in consumer debt has been mostly fueled by increases in student and auto loans, which would likely be impacted by further interest rate rises.
1st Quarter 2018Investment Landscape
Source: Bloomberg, as of 11/30/17 Source: FRED, as of 9/30/17 Source: Bloomberg, as of 7/31/17
11
CONSUMER SPENDING (YOY GROWTH) DEBT GROWTH (YOY) HOUSEHOLD NET WORTH
‐5%
0%
5%
10%
15%
20%
Mar‐04 Sep‐06 Mar‐09 Sep‐11 Mar‐14 Sep‐16
Mortgage Debt Consumer Debt
$1,000
$2,000
$4,000
$8,000
$16,000
$32,000
$64,000
$128,000
Oct‐51
Oct‐57
Oct‐63
Oct‐69
Oct‐75
Oct‐81
Oct‐87
Oct‐93
Oct‐99
Oct‐05
Oct‐11
Log Scale
$96,900
‐6%
‐3%
0%
3%
6%
9%
Jan‐00 Mar‐04 May‐08 Jul‐12 Sep‐16
3%4%5%6%
Jan‐17 Jul‐17

SentimentMeasures of consumer and business sentiment remained above average in the fourth quarter. The University of Michigan Consumer Sentiment Index was 95.9 in December, which placed it in the 85th percentile relative to its own history, since 1978. The average value of the index in 2017 was the highest since 2000, driven by consumers’ positive attitudes toward current economic conditions. U.S. tax reform did not result in an increase in sentiment and was only mentioned by 29% of respondents, who demonstrated mixed reactions.
The NFIB Small Business Optimism Index increased to 107.5 in November – near a record high. This indicator jumped following the election in 2016 and has stayed high, reflecting positive attitudes towards policy changes, deregulation, and economic conditions. A net 37% of small businesses expect the economy to improve and a net 27% are planning on increasing capital outlays. Companies also reported that finding qualified workers to hire is getting increasingly difficult. Higher labor costs would be a headwind to small businesses.
1st Quarter 2018Investment Landscape
Consumers and small businesses have a positive outlook on the economy
Source: Bloomberg, as of 12/31/17 (see Appendix) Source: University of Michigan, as of 12/31/17 (see Appendix) Source: NFIB, as of 11/30/17 (see Appendix for details)
12
CONSUMER COMFORT INDEX CONSUMER SENTIMENT NFIB SMALL BUSINESS OPTIMISM INDEX
40
60
80
100
120
140
Jun‐85 Jun‐90 Jun‐95 Jun‐00 Jun‐05 Jun‐10 Jun‐15
U of Michigan Consumer Sentiment Survey
90 95
100105
Dec‐16 Aug‐17
20
30
40
50
60
70
Jul‐87 Jul‐92 Jul‐97 Jul‐02 Jul‐07 Jul‐12 Jul‐17
Bloomberg US Weekly Consumer Comfort Index
80
85
90
95
100
105
110
Jan‐88 Aug‐92 Mar‐97 Oct‐01 May‐06 Dec‐10 Jul‐15

Housing Growth in U.S. home prices has steadily accelerated over the past three years. National home prices increased 6.2% YoY in October, according to the S&P/Case‐Shiller Index, up from a growth rate of 5.2% one year prior. Sales growth continued to be constrained by a lack of supply, which has helped lead to higher prices due to demand outpacing supply. At the current sales rate, it would take only 4.7 months to completely exhaust the supply in the market, below the long‐term historical average of 6.1.
Thus far, tightening from the Fed has not led to a material rise in mortgage rates. Home ownership has remained affordable as lower interest costs have somewhat offset rising home prices.
Total mortgage debt outstanding has just recently recovered from the global financial crisis. Mortgage lending standards are still tight, which has led to a higher quality pool of mortgage borrowers relative to past cycles.
1st Quarter 2018Investment Landscape
Source: FRED, as of 10/31/17 Source: Bloomberg, as of 11/30/17 Source: FRED, as of 11/30/17
13
CASE‐SHILLER HOME PRICE INDEX HOUSING SALES MONTHLY SUPPLY OF HOMES
‐30%
‐20%
‐10%
0%
10%
20%
30%
40%
50%
Jul‐09 Apr‐12 Dec‐14 Sep‐17
US Existing Homes Sales YoY SA
20
40
80
160
320
Jan‐75 May‐83 Sep‐91 Jan‐00 May‐08 Sep‐16
Price (lo
g scale)
0
2
4
6
8
10
12
14
May‐63 May‐78 May‐93 May‐08

International economics summary
1st Quarter 2018Investment Landscape 14
— Economic growth advanced in the third quarter across developed and emerging markets. The United States grew at 2.3% YoY, the Eurozone improved to 2.6%, and overall growth in the BRICS nations accelerated to 5.6%. Central bank policy is still broadly accommodative, which is supportive of continued progress.
— Expectations for global GDP growth for the next two years has been revised upward in the past six months, according to the consensus estimate from Bloomberg. The upward revision to global growth forecasts were driven by the Eurozone and emerging markets.
—A pickup in lending and investment, strong external demand, and accommodative monetary policy has helped fuel an impressive economic recovery in the Eurozone. GDP grew 2.6% in Q3 from the
previous year and the unemployment rate fell to 8.8%, the lowest level in nine years.
— PMIs across major markets were all above 50, indicating further expansion in the manufacturing sector.
— There are still concerns of a hard landing in China because the central bank has been tightening financial conditions on the short‐end of the yield curve to reign in excessive leverage. Thus far, this process has been successful with economic growth slowing only moderately.
— Low inflation in developed economies has persisted, contributing to slower monetary tightening as central banks have been reluctant to raise rates too quickly.
AreaGDP
(Real, YoY)Inflation (CPI, YoY) Unemployment
United States 2.3%9/30/17
2.1%12/31/17
4.1%12/31/17
Western Europe
2.5%9/30/17
1.6%12/31/17
7.4%12/31/17
Japan 2.1%9/30/17
0.6%11/30/17
2.7%11/30/17
BRICS Nations
5.6%9/30/17
2.0%12/31/17
5.7%9/30/17
Brazil 1.4%9/30/17
3.0%12/31/17
12.1%12/31/17
Russia 1.8%9/30/17
2.5%12/31/17
5.1%11/30/17
India 5.3%9/30/17
4.9%11/30/17
8.0%12/31/16
China 6.8%9/30/17
1.8%12/31/17
4.0%9/30/17

International economicsEconomic growth accelerated broadly over the quarter, while inflation remained moderate in the developed world and fell in many emerging markets. Emerging economies appear to be very early in their cycle. Brazil and Russia recently pulled out of recession, with economic slack and room for expansion. Improving economic conditions and rising global demand have led to a material pickup in growth expectations for future years. The consensus forecast for 2018 Eurozone real GDP growth was revised upwards by 50 bps over the past six months.
Central bank policies in developed markets remained accommodative, but the intent to move towards tighter financial conditions has been clearly communicated. Stimulus from central banks, notably the ECB and BOJ, is likely still necessary to support the recent improvement in economic growth. A lack of pressure in inflation, however, should allow central banks to take a careful approach to future policy changes.
1st Quarter 2018Investment Landscape
Growth accelerated, while inflation remained moderate
Source: Bloomberg, as of 9/30/17 Source: Bloomberg, as of 11/30/17 Source: Bloomberg, as of 11/30/17 or most recent release
15
REAL GDP GROWTH (YOY) INFLATION (CPI) UNEMPLOYMENT
‐8%
‐4%
0%
4%
8%
12%
Mar‐95 Jan‐99 Oct‐02 Aug‐06 Jun‐10 Apr‐14
U.S. Japan Eurozone BRICS
‐4%
‐2%
0%
2%
4%
6%
8%
10%
Jun‐00 Apr‐04 Feb‐08 Dec‐11 Oct‐15
U.S. Japan China U.K. Eurozone
0%
2%
4%
6%
8%
10%
12%
14%
Dec‐03 Jan‐06 Feb‐08 Feb‐10 Mar‐12 Apr‐14 Apr‐16
U.S. Eurozone Japan BRICS

Eurozone economic recoveryA pickup in lending and investment, strong external demand, and accommodative monetary policy has helped fuel an impressive economic recovery in the Eurozone. In Q3, real GDP was 2.6% YoY ‐ its highest rate of growth since 2011. Economic data has come in better than expected for most of the past year and economic forecasts have been revised upwards significantly. Additionally, labor markets have also improved markedly with the overall Eurozone unemployment rate falling from 9.6% to 8.8% over the past year, with further room for improvement.
The continuing recovery is not without risks. Most notably, economies are still heavily reliant on monetary stimulus. The ECB has already started to taper asset purchases, although any additional tightening will likely be considered with caution. The recovery in economic conditions has been led by Germany, while periphery countries such as Italy and Spain have lagged behind and are still experiencing high unemployment rates. Finally, political risk in Europe, such as the Italian election this year, is still lurking in the background.
1st Quarter 2018Investment Landscape
The Eurozone is experiencing an impressive economic recovery
Source: Bloomberg, as of 9/30/17 Source: Bloomberg, as of 10/31/17
16
REAL GDP GROWTH UNEMPLOYMENT RATE
Treasuries
MBS
Other
‐8%
‐6%
‐4%
‐2%
0%
2%
4%
6%
8%
Sep‐02 Mar‐04 Sep‐05 Mar‐07 Sep‐08 Mar‐10 Sep‐11 Mar‐13 Sep‐14 Mar‐16 Sep‐17
Germany France Italy Spain Eurozone
0%
5%
10%
15%
20%
25%
30%
Sep‐02 Mar‐04 Sep‐05 Mar‐07 Sep‐08 Mar‐10 Sep‐11 Mar‐13 Sep‐14 Mar‐16 Sep‐17
Germany France Italy Spain Eurozone

Global PMIs
1st Quarter 2018Investment Landscape 17
Source: Bloomberg, as of 12/31/17 – PMIs are based on survey data compiled from purchasing and supply managers. Survey questions are asked about several different components of each sector, such as new orders, employment, prices, etc. The final PMI reading is based on the percentage of respondents with a positive view on the sector. A reading above 50 indicates expansion in the sector while a reading below 50 indicates contraction. Historically, PMIs have had a relatively strong positive relationship with actual economic activity.
PMI 1 YEAR (CROSS SECTION) – BLUE HIGH / ORANGE LOW
Row LabelsJan‐17 Feb‐17 Mar‐17 Apr‐17 May‐17 Jun‐17 Jul‐17 Aug‐17 Sep‐17 Oct‐17 Nov‐17 Dec‐17
Manufacturing
Global 53 53 53 53 53 53 53 53 53 54 54 55
Developed 54 54 54 54 54 54 54 54 55 55 56 56
US 56 58 57 55 55 58 56 59 61 59 58 60
UK 55 55 54 57 56 54 55 57 56 56 58 56
Eurozone 55 55 56 57 57 57 57 57 58 59 60 61
Germany 56 57 58 58 60 60 58 59 61 61 63 63
Japan 53 53 52 53 53 52 52 52 53 53 54 54
EM 51 51 52 51 51 51 51 52 51 51 52 52
Services
Global 54 53 54 54 54 54 54 54 54 54 54 54
Developed 55 54 54 54 54 55 55 55 55 55 54 54
US 57 58 55 58 57 57 54 55 60 60 57 56
UK 55 53 55 56 54 53 54 53 54 56 54 54
Eurozone 54 56 56 56 56 55 55 55 56 55 56 57
Germany 53 54 56 55 55 54 53 54 56 55 54 56
Japan 52 51 53 52 53 53 52 52 51 53 51 51
EM 54 56 56 56 56 55 55 55 56 55 56 57

Fixed income rates & credit
1st Quarter 2018Investment Landscape 18

Interest rate environment
1st Quarter 2018Investment Landscape
Source: Bloomberg, as of 12/31/17
19
—On December 13th, the Federal Reserve raised the benchmark interest rate by 25 bps to a target range of 1.25%‐1.50%. The Fed has communicated three rate hikes in 2018, while the market is pricing in only two.
—U.S. Treasury yields experienced significant increases on the short end of the curve, while longer term rates were modestly higher. The 2‐and 10‐year yields rose 40 bps and 8 bps, respectively. The increase in short‐term rates was likely caused by the Fed raising overnight borrowing rates.
— The Fed began to reduce its balance sheet slowly. Approximately $30 billion in Treasuries and mortgage‐backed securities were trimmed from the balance sheet over the quarter, which did not have a material impact on the market.
—Minutes from the ECB meeting in December showed that officials discussed additional tapering of asset purchases in early 2018 due to stronger than expected economic growth.
—Markets generally expect minimal yield rises across developed markets – between 0% and 0.3% movement over the next year in U.S., U.K., German, and Japanese sovereign bonds. However, we remain watchful of bond market reactions to balance sheet unwinding, given the unprecedented size of central bank assets.
—We remain underweight to U.S. and developed sovereign bonds (currency hedged) primarily due to low yields. It is important to keep in mind the diversification benefits that fixed income provides to the portfolio, despite near record prices.
Area Short Term (3M) 10 Year
United States 1.38% 2.41%
Germany (0.80%) 0.42%
France (0.78%) 0.78%
Spain (0.58%) 1.56%
Italy (0.63%) 2.00%
Greece 1.40% 4.10%
U.K. 0.36% 1.19%
Japan (0.15%) 0.04%
Australia 1.74% 2.63%
China 3.95% 3.90%
Brazil 6.77% 10.25%
Russia 6.55% 7.42%
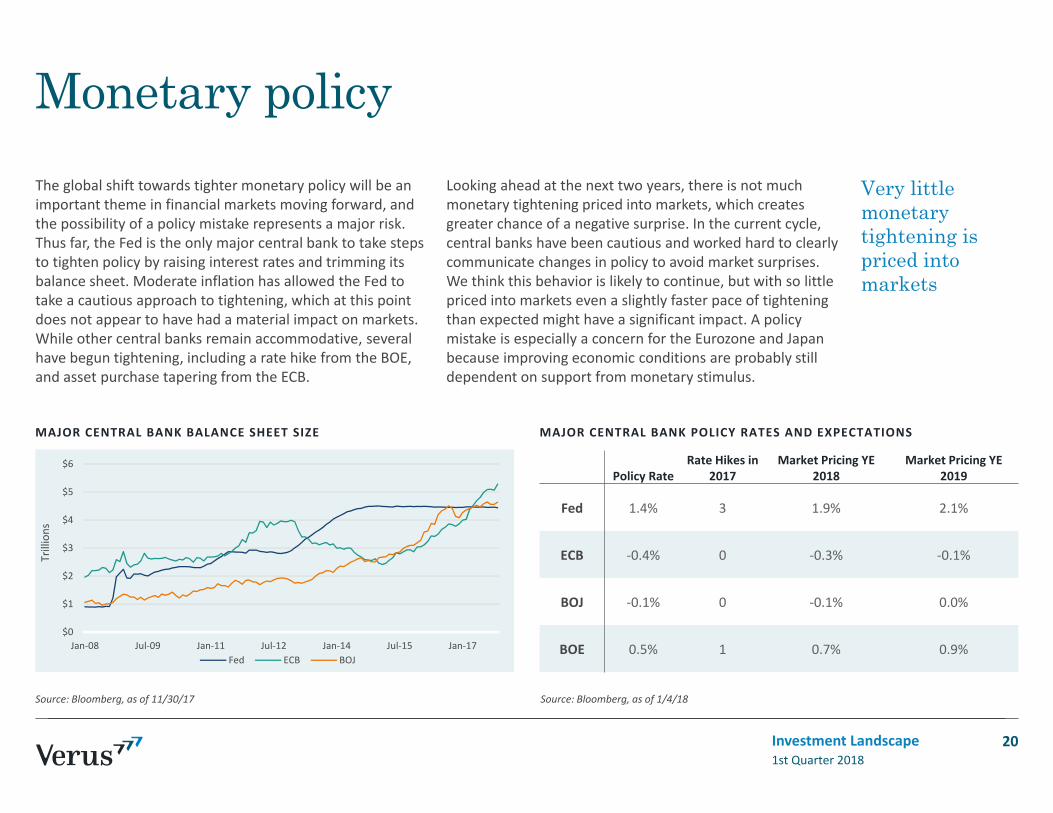
Monetary policyThe global shift towards tighter monetary policy will be an important theme in financial markets moving forward, and the possibility of a policy mistake represents a major risk. Thus far, the Fed is the only major central bank to take steps to tighten policy by raising interest rates and trimming its balance sheet. Moderate inflation has allowed the Fed to take a cautious approach to tightening, which at this point does not appear to have had a material impact on markets. While other central banks remain accommodative, several have begun tightening, including a rate hike from the BOE, and asset purchase tapering from the ECB.
Looking ahead at the next two years, there is not much monetary tightening priced into markets, which creates greater chance of a negative surprise. In the current cycle, central banks have been cautious and worked hard to clearly communicate changes in policy to avoid market surprises. We think this behavior is likely to continue, but with so little priced into markets even a slightly faster pace of tightening than expected might have a significant impact. A policy mistake is especially a concern for the Eurozone and Japan because improving economic conditions are probably still dependent on support from monetary stimulus.
1st Quarter 2018Investment Landscape
Very little monetary tightening is priced into markets
Source: Bloomberg, as of 11/30/17 Source: Bloomberg, as of 1/4/18
20
MAJOR CENTRAL BANK BALANCE SHEET SIZE MAJOR CENTRAL BANK POLICY RATES AND EXPECTATIONS
$0
$1
$2
$3
$4
$5
$6
Jan‐08 Jul‐09 Jan‐11 Jul‐12 Jan‐14 Jul‐15 Jan‐17
Trillions
Fed ECB BOJ
Policy RateRate Hikes in
2017Market Pricing YE
2018Market Pricing YE
2019
Fed 1.4% 3 1.9% 2.1%
ECB ‐0.4% 0 ‐0.3% ‐0.1%
BOJ ‐0.1% 0 ‐0.1% 0.0%
BOE 0.5% 1 0.7% 0.9%

Yield environment
1st Quarter 2018Investment Landscape
Source: Bloomberg, as of 12/31/17
21
YIELD CURVE CHANGES OVER LAST FIVE YEARS IMPLIED CHANGES OVER NEXT YEAR
GLOBAL GOVERNMENT YIELD CURVESU.S. YIELD CURVE
0.0%
0.2%
0.4%
0.6%
0.8%
1.0%
1M 3M 6M 1Y 2Y 3Y 4Y 5Y 7Y 9Y 10Y 12Y 15Y 20Y 30Y
US Treasury UK Treasury Japan TreasuryGermany Treasury Canada Treasury Australia TreasuryItaly Treasury
‐3%
‐2%
‐1%
0%
1%
2%
1M3M6M 1Y 2Y 3Y 4Y 5Y 7Y 9Y 10Y 12Y 15Y 20Y 30Y
US Japan CanadaGermany United Kingdom FranceItaly China
‐1%
0%
1%
2%
3%
4%
5%
1M 2M 3M 6M 1Y 2Y 3Y 5Y 7Y 10Y12Y 15Y 20Y 30YUS Treasury Curve 12/31/17 US Treasury Curve 12/31/16
US Treasury Curve 12/31/15 US Treasury Curve 12/31/10
US Treasury Curve 12/31/05
‐1%
0%
1%
2%
3%
4%
5%
1M3M6M 1Y 2Y 3Y 4Y 5Y 7Y 9Y 10Y 12Y 15Y 20Y 30Y
US Treasury Curve 12/31/17 Japan Curve 12/31/17Canada Curve 12/31/17 Germany Curve 12/31/17United Kingdom Curve 12/31/17 France Curve 12/31/17Italy Curve 12/31/17 China Curve 12/31/17

Credit spreads fell throughout 2017 to all‐time tight levels. U.S. high yield option‐adjusted spreads compressed in the fourth quarter to 3.4%, and the asset class generated a 0.5% total return for the quarter and 7.5% for 2017 (BBgBarc U.S. Corp. High Yield Index). High yield spreads are tighter than those of bank loans on a duration‐neutral basis.
Credit spreads in both high yield and loans have continued to tighten close to multi‐year lows, driven by strong corporate fundamentals and general macroeconomic improvement.
The combination of tighter credit spreads and higher yields over Treasuries led credit to broadly outperform U.S. Treasuries in Q4. High yield spreads began the year at 4.1% and tightened by 66 bps in 2017. Credit spreads have historically been a good indicator of future performance relative to Treasuries.
Based on low interest rates and tight spreads, we recommend an underweight to U.S. investment and high yield credit.
Credit environment
1st Quarter 2018Investment Landscape
Credit spreads are tight across the capital structure
Source: Barclays, Bloomberg, as of 12/31/17 Source: Bloomberg, as of 12/31/17 Source: Barclays, Credit Suisse, Bloomberg, as of 12/31/17
22
SPREADS HIGH YIELD SECTOR SPREADS (BPS)
MarketCredit Spread (12/31/17)
Credit Spread (1 Year Ago)
Long US Corporate 1.4% 1.6%
US Aggregate 0.9% 1.2%
US High Yield 3.4% 4.1%
US High YieldEnergy 4.6% 4.6%
US Bank Loans 3.6% 3.9%
100
400
700
1000
1300
Apr‐12 Aug‐13 Dec‐14 May‐16 Sep‐17
Bloomberg US HY Energy USD HY ConsDisc. OASUSD HY Financials Snr OAS USD HY Comm. OASUSD HY Comm. OAS USD HY Materials OASUSD HY Technology OAS USD HY Industrial OASUSD HY HealthCare OAS USD HY ConsStaple OAS
0%
5%
10%
15%
20%
Dec‐95 Dec‐99 Dec‐03 Dec‐07 Dec‐11 Dec‐15Barclays Long US Corp. Barclays US Agg.Barclays US HY Bloomberg US HY EnergyIG Energy

Issuance and defaultDefault activity remains low and stable in U.S. and international credit markets. The par‐weighted U.S. default rate remains below its long‐term average of 3.0‐3.5%. Four U.S. companies defaulted in December totaling $1.6 Billion in bonds and $582 Million in loans. Total default activity during 2017 was at levels not seen since 2013.
Senior loan and high yield markets normalized in 2017, compared to 2016 when a majority of defaults were generated from energy and metals/mining sectors.
Issuance in bonds and loans both increased in 2017. The majority of proceeds were used for refinancing activity as the market continues to be borrower‐friendly, allowing issuers to refinance at lower rates.
Active management may offer value to investors in the high yield space.
1st Quarter 2018Investment Landscape
The effects of commodity related defaults are subsiding
Source: BofA Merrill Lynch, as of 12/31/17 Source: BofA Merrill Lynch, as of 12/31/17 Source: Bloomberg, BofA Merrill Lynch, as of 12/31/17
23
HY DEFAULT TRENDS (ROLLING 1 YEAR) ENERGY DEFAULT TRENDS GLOBAL ISSUANCE
0
50
100
150
200
250
300
350
400
450
1998
1999
2000
2001
2002
2003
2004
2005
2006
2007
2008
2009
2010
2011
2012
2013
2014
2015
2016
2017
$ Billion
Global Bank Loan Issuance Global HY Issuance
0
5
10
15
20
Jan‐00 Jan‐03 Jan‐06 Jan‐09 Jan‐12 Jan‐15
Default (%)
Developed Market High YieldUS High YieldUS ex‐Commodities
0
5
10
15
20
25
30
Jan‐98 Jan‐01 Jan‐04 Jan‐07 Jan‐10 Jan‐13 Jan‐16
Default (%)
US High Yield High Yield Energy

Equity
1st Quarter 2018Investment Landscape 24

Equity environment
1st Quarter 2018Investment Landscape
Source: Russell Investments, MSCI, STOXX, FTSE, Nikkei, as of 12/31/17
25
—We maintain an overweight position to equities with a preference for emerging markets. Equity markets delivered strong returns over the quarter and were supported by robust earnings growth. Emerging markets provided outsized gains as is often the case in periods of strong economic growth.
— U.S. corporate earnings are expected to increase by 13.1% YoY in 2018 according to Factset. Expectations improved by a net 2% following the Tax Cuts & Jobs Act, which lowered the corporate tax rate from 35% to 21%, effective January 1st, 2018. Energy and Financial sectors are expected to lead in earnings with growth of 47% and 25%, respectively.
— The way businesses spend tax savings may have significant positive effects on wages, capital investment, and equity returns.
We will be monitoring this activity throughout the year.
— Equity volatility has stayed extraordinarily low. U.S. market volatility over the past year was 3.9% (S&P 500), followed by International at 4.2% (MSCI EAFE) and emerging markets at 6.5% (MSCI Emerging Markets). Low equity volatility has historically indicated less risk of an equity downside event.
— Currency movement contributed to volatility and uncertainty in international assets for investors with unhedged exposure. Recently, the U.S. dollar has weakened, creating a tailwind for unhedged performance.
QTD TOTAL RETURN YTD TOTAL RETURN1 YEAR TOTAL
RETURN
(unhedged) (hedged) (unhedged) (hedged) (unhedged) (hedged)
US Large Cap (Russell 1000)
6.6% 21.7% 21.7%
US Small Cap (Russell 2000)
3.3% 14.6% 14.6%
US Large Value(Russell 1000
Value)5.3% 13.7% 13.7%
US Large Growth(Russell 1000 Growth)
7.9% 30.2% 30.2%
International Large
(MSCI EAFE)4.3% 4.0% 25.7% 16.8% 25.7% 16.8%
Eurozone (Euro Stoxx 50)
(0.4%) (1.8%) 25.3% 11.1% 25.3% 11.1%
U.K. (FTSE 100)
6.0% 5.3% 22.6% 12.9% 22.6% 12.9%
Japan (NIKKEI 225)
12.0% 12.3% 25.7% 21.9% 25.7% 21.9%
Emerging Markets
(MSCI Emerging Markets)
7.3% 5.3% 37.3% 28.6% 37.3% 28.6%

Domestic equityU.S. equities produced gains over the quarter (S&P 500 +6.6%), adding to record highs. Over the past year, U.S. equity performance (S&P 500 +21.8%) has lagged international developed equities (MSCI EAFE +25.0%) and emerging markets (MSCI Emerging Markets +37.3%). Performance of each equity market is in line with the degree of earnings growth – emerging markets have produced the strongest year‐over‐year growth and the U.S. has produced the weakest earnings growth. However, earnings growth in the U.S. has still been strong relative to history.
U.S. corporate earnings are expected to increase by 13.1% YoY in 2018, according to Factset. Forecasts were revised upwards by a net 2% following the passing of tax cuts. Energy and Financial sectors are expected to lead in earnings with growth of 47% and 25%, respectively. The way businesses spend additional tax savings may have significant positive effects on wages, capital investment, and equity returns. We will be monitoring the situation throughout the year.
1st Quarter 2018Investment Landscape
We maintain a neutral weight to U.S. equities
Source: Russell Investments, as of 12/31/17 Source: MSCI, as of 12/31/17, YoY growth in forward earnings Source: FactSet, as of 1/12/18
26
U.S. EQUITIES EARNINGS GROWTH 2018 S&P 500 EARNINGS EXPECTATIONS
3000
4000
5000
6000
7000
8000
9000
Jul‐12 Jul‐13 Jul‐14 Jul‐15 Jul‐16 Jul‐17Russell 3000
0% 10% 20% 30% 40% 50%
Energy
Financials
Materials
S&P 500
Info. Technology
Industrials
Consumer Disc.
Consumer Staples
Health Care
Real Estate
Utilities
Telecom Services
‐10%
‐5%
0%
5%
10%
15%
20%
Jan‐12 Jan‐13 Jan‐14 Jan‐15 Jan‐16 Jan‐17

‐4%
0%
4%
8%
12%
16%
20%
Jul‐17 Aug‐17 Sep‐17 Oct‐17 Nov‐17 Dec‐17 Jan‐18
High Tax Rate Basket Low Tax Rate Basket
U.S. tax reformThe House and Senate passed a final tax bill, which was then signed into law by President Trump on December 22, 2017. The most widely publicized component of the bill is a corporate tax cut that lowers the statutory tax rate from 35% to 21%. The tax cut should result in a material boost to corporate earnings, which was priced into markets as the proposal was negotiated. Equities with relatively high effective tax rates significantly outperformed those with low effective tax rates since November. We believe that higher earnings growth resulting from the one‐time tax cut is likely fully priced into equities.
The second component to the tax cut relates to the way corporations choose to use the savings. Its impact is more difficult to determine. In the past, firms have used tax savings to return capital to shareholders, which will likely play an important role once again. We believe that in the current economic and deregulatory environment, a material gain in business investment and wages is possible. A rise in investment could lead to further earnings growth and would have a more lasting impact on the economy than if firms simply return the savings to shareholders.
1st Quarter 2018Investment Landscape
Corporate tax cuts will be a boost to earnings
Source: Bloomberg, Verus, as of 1/4/18 Source: FactSet, as of 1/5/18
27
S&P 500 HIGH TAX RATE VS. LOW TAX RATE BASKET S&P 500 2018 EARNINGS EXPECTATIONS
10.6% 10.1%11.6% 11.2% 11.1%12.0% 12.3%
13.4% 13.0% 13.1%
0%2%4%6%8%
10%12%14%16%
Q1 2018 Q2 2018 Q3 2018 Q4 2018 2018
12/1/2017 1/5/2018
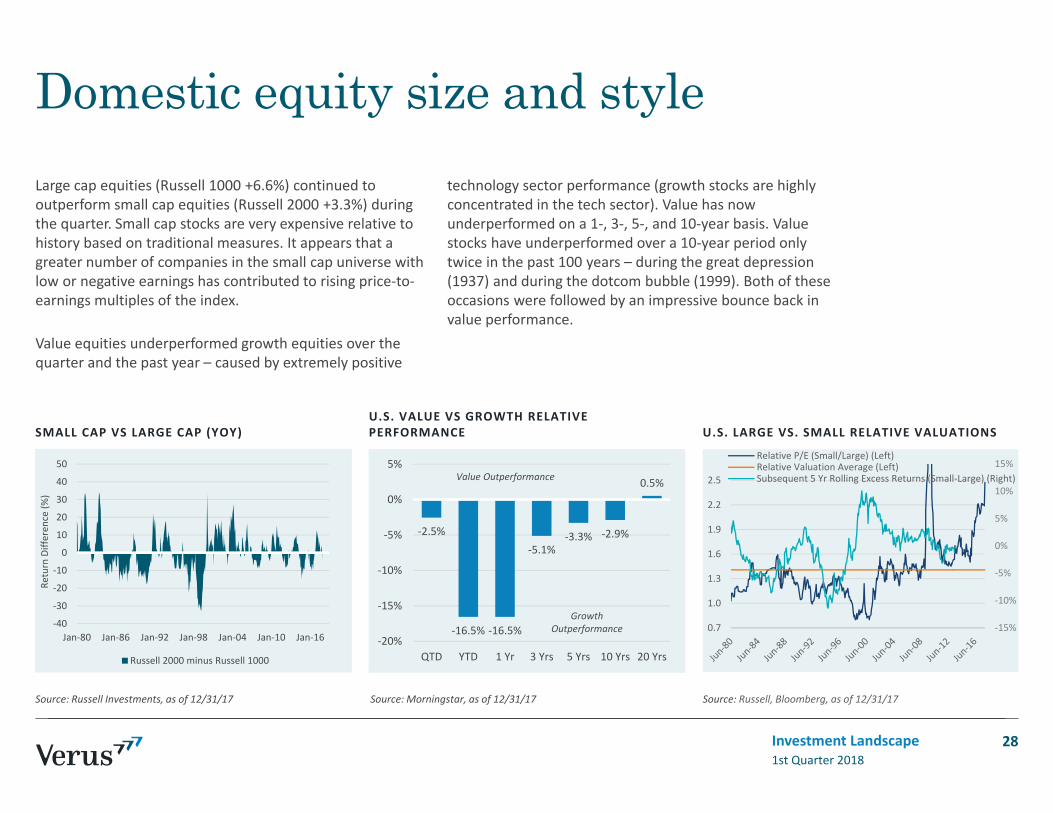
Domestic equity size and styleLarge cap equities (Russell 1000 +6.6%) continued to outperform small cap equities (Russell 2000 +3.3%) during the quarter. Small cap stocks are very expensive relative to history based on traditional measures. It appears that a greater number of companies in the small cap universe with low or negative earnings has contributed to rising price‐to‐earnings multiples of the index.
Value equities underperformed growth equities over the quarter and the past year – caused by extremely positive
technology sector performance (growth stocks are highly concentrated in the tech sector). Value has now underperformed on a 1‐, 3‐, 5‐, and 10‐year basis. Value stocks have underperformed over a 10‐year period only twice in the past 100 years – during the great depression (1937) and during the dotcom bubble (1999). Both of these occasions were followed by an impressive bounce back in value performance.
1st Quarter 2018Investment Landscape
Source: Russell Investments, as of 12/31/17 Source: Morningstar, as of 12/31/17 Source: Russell, Bloomberg, as of 12/31/17
28
SMALL CAP VS LARGE CAP (YOY)U.S. VALUE VS GROWTH RELATIVE PERFORMANCE U.S. LARGE VS. SMALL RELATIVE VALUATIONS
‐40
‐30
‐20
‐10
0
10
20
30
40
50
Jan‐80 Jan‐86 Jan‐92 Jan‐98 Jan‐04 Jan‐10 Jan‐16
Return Differen
ce (%
)
Russell 2000 minus Russell 1000
‐15%
‐10%
‐5%
0%
5%
10%
15%
0.7
1.0
1.3
1.6
1.9
2.2
2.5
Relative P/E (Small/Large) (Left)Relative Valuation Average (Left)Subsequent 5 Yr Rolling Excess Returns (Small‐Large) (Right)
‐2.5%
‐16.5% ‐16.5%
‐5.1%‐3.3% ‐2.9%
0.5%
‐20%
‐15%
‐10%
‐5%
0%
5%
QTD YTD 1 Yr 3 Yrs 5 Yrs 10 Yrs 20 Yrs
Value Outperformance
Growth Outperformance

International developed equityInternational equities lagged U.S. equities during the fourth quarter as U.S. tax reform contributed to a strong domestic rally. The MSCI EAFE Index returned 4.3% (+4.0% hedged) while the S&P 500 returned 6.6%. Emerging markets continued to outperform (MSCI EM +7.4% unhedged).
Japan outperformed among developed markets, which is particularly notable when considering the pessimism baked into Japan’s equity valuations. Japan generated a
12.0% return in the fourth quarter and a 25.7% return in 2017 (Nikkei 225 unhedged). Recent equity gains were fundamentally supported by earnings growth.
Currency effects added a positive 0.3% to the unhedged MSCI EAFE in Q4 (+8.9% year‐to‐date), as the U.S. dollar weakened slightly against a trade weighted basket of currencies.
1st Quarter 2018Investment Landscape
Source: Bloomberg, as of 12/31/17 Source: MSCI, as of 12/31/17 – YoY growth in forward earnings Source: MSCI, as of 12/31/17
29
EQUITY PERFORMANCE (3YR ROLLING) EARNINGS GROWTH EFFECT OF CURRENCY (1 YEAR ROLLING)
‐20%
‐10%
0%
10%
20%
30%
40%
Jan‐09 Jan‐11 Jan‐13 Dec‐14 Dec‐16
MSCI EAFE MSCI ACWI ex USA MSCI EM
‐30%
‐20%
‐10%
0%
10%
20%
30%
Jan‐12 Jan‐14 Jan‐16
ACWI Developed Ex US US EM
‐10
‐5
0
5
10
15
20
25
30
35
Feb‐11 Feb‐13 Feb‐15 Feb‐17
3 year ro
lling
ann
ualized
(%)
US Large International DevelopedEmerging Markets Global Equity
‐5%
0%
5%
10%
Jun‐17 Dec‐17
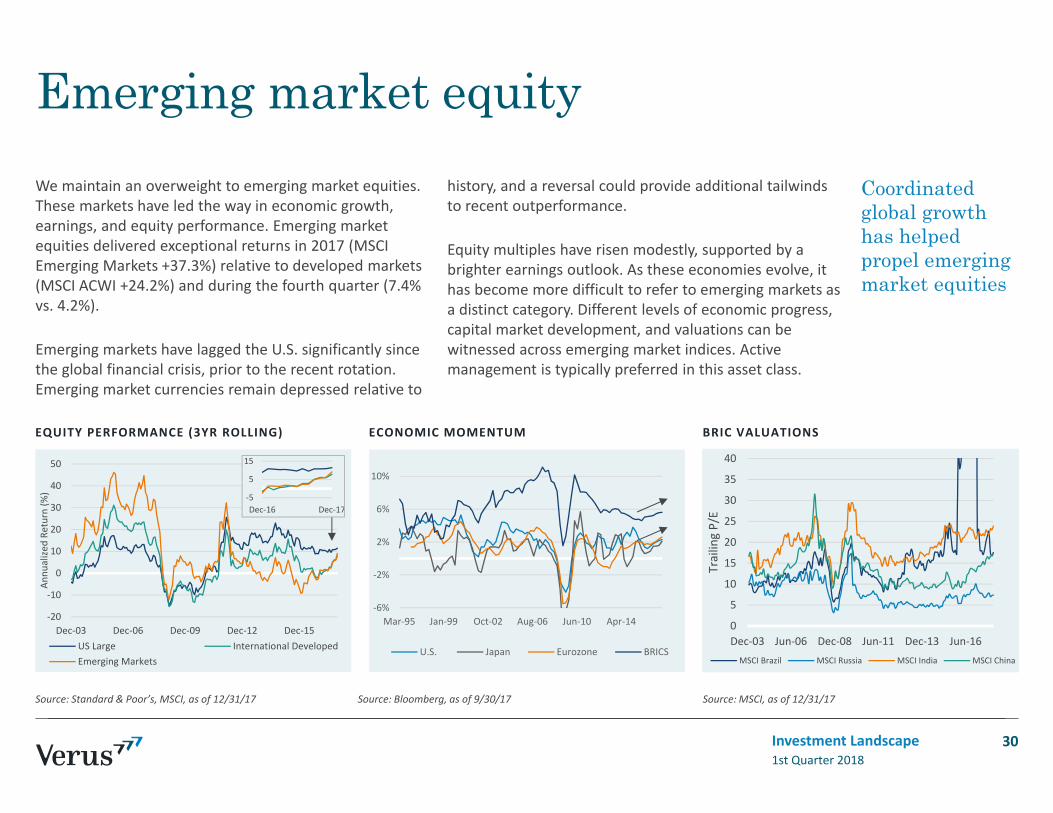
Emerging market equityWe maintain an overweight to emerging market equities. These markets have led the way in economic growth, earnings, and equity performance. Emerging market equities delivered exceptional returns in 2017 (MSCI Emerging Markets +37.3%) relative to developed markets (MSCI ACWI +24.2%) and during the fourth quarter (7.4% vs. 4.2%).
Emerging markets have lagged the U.S. significantly since the global financial crisis, prior to the recent rotation. Emerging market currencies remain depressed relative to
history, and a reversal could provide additional tailwinds to recent outperformance.
Equity multiples have risen modestly, supported by a brighter earnings outlook. As these economies evolve, it has become more difficult to refer to emerging markets as a distinct category. Different levels of economic progress, capital market development, and valuations can be witnessed across emerging market indices. Active management is typically preferred in this asset class.
1st Quarter 2018Investment Landscape
Coordinated global growth has helped propel emerging market equities
Source: Standard & Poor’s, MSCI, as of 12/31/17 Source: Bloomberg, as of 9/30/17 Source: MSCI, as of 12/31/17
30
BRIC VALUATIONSECONOMIC MOMENTUMEQUITY PERFORMANCE (3YR ROLLING)
‐20
‐10
0
10
20
30
40
50
Dec‐03 Dec‐06 Dec‐09 Dec‐12 Dec‐15
Annu
alized
Return (%
)
US Large International DevelopedEmerging Markets
0
5
10
15
20
25
30
35
40
Dec‐03 Jun‐06 Dec‐08 Jun‐11 Dec‐13 Jun‐16
Trailing P/E
MSCI Brazil MSCI Russia MSCI India MSCI China
‐6%
‐2%
2%
6%
10%
Mar‐95 Jan‐99 Oct‐02 Aug‐06 Jun‐10 Apr‐14
U.S. Japan Eurozone BRICS
‐5
5
15
Dec‐16 Dec‐17

Equity valuationsEquity valuations grew slightly richer over the quarter and remain high. However, strong underlying earnings growth has sustained above‐average performance. Global economic acceleration, robust earnings growth, and accommodative monetary policies contribute to our view that a risk overweight position is warranted.
Comparing valuation increases to earnings growth demonstrates that the recent pickup in equity performance is fundamentally driven (fueled by earnings rather than higher equity prices). In this environment the forward P/E measure tends to provide a more accurate representation of
valuations. Equity price is a product of expectations for future earnings and cash flows. The forward P/E measure takes into account future earnings while the trailing P/E focuses on past earnings, which leads the trailing P/E measure to incorrectly rise during times when prices and earnings may in fact be rising at the same pace (implying no true valuation movement).
Higher valuations imply lower future equity returns over the longer‐term. However, over shorter periods of time equities may produce strong returns despite high valuations, as seen recently.
1st Quarter 2018Investment Landscape
Source: MSCI, as of 12/31/17 Source: Bloomberg, as of 12/31/17 Source: Bloomberg, as of 12/31/17 ‐ trailing P/E
31
FORWARD P/E RATIOS TRAILING P/E RATIOS VALUATION METRICS
68101214161820222426
Jan‐08 Jul‐09 Jan‐11 Jul‐12 Jan‐14 Jul‐15 Jan‐17
S&P 500 MSCI EAFE MSCI EM
6
8
10
12
14
16
18
20
22
24
26
Jan‐08 Jun‐10 Dec‐12 Jun‐15 Dec‐17
S&P 500 MSCI EAFE MSCI EM
1.8
19.7 19.2
3.0
5.13.3
22.5 23.0
1.9
4.41.8
15.8 15.0
2.3
6.3
0
5
10
15
20
25
P/BV P/E Price/FCF DividendYield (%)
EarningsYield (%)
MSCI EAFE
MSCI U.S.
MSCI EM

Shiller P/E
1st Quarter 2018Investment Landscape
— The Shiller P/E, or CAPE ratio (cyclically adjusted price‐to‐earnings), uses current market price divided by average real (inflation‐adjusted) corporate earnings of the past 10 years to arrive at a valuation multiple.
— The CAPE ratio is currently very high relative to history, though this can be partly explained by the fact that the past 10 years of earnings includes the global financial crisis –one of worst earnings depressions in history (which has pushed the CAPE ratio upward).
— The chart on the left illustrates that the CAPE ratio will come down significantly in the near future, all other things being equal, as the global financial crisis falls out of the CAPE’s 10 year earnings window.
Source: Robert Shiller, Verus – The light blue line is Robert Shiller’s CAPE ratio over the past 30 years. Each line illustrates how the CAPE ratio will move assuming various after‐inflation earnings growth rates, and assuming equity prices increase at the rate of inflation.
32
10
15
20
25
30
35
40
45
Jan‐88 Mar‐92 May‐96 Jul‐00 Sep‐04 Nov‐08 Jan‐13 Mar‐17
0% earnings growth ‐5% earnings growth +5% earnings growth

Equity volatilityEquity volatility has stayed extraordinarily low. U.S. market volatility over the past year was 3.9% (S&P 500), compared to its historical average annualized volatility of 14.2%. International equity volatility has also been low with developed markets at 4.2% (MSCI EAFE) and emerging markets at 6.5% (MSCI Emerging Markets). Implied volatility as indicated by the VIX has also remained suppressed. Muted volatility environments have historically resulted in a lower probability of a significant market drawdown.
The current low volatility environment has been influenced by very few significant economic surprises. Steady increases in GDP growth and consistent inflation, which is likely a byproduct of central bank intervention, has helped lead to stable asset price movements. Volatility may begin to return to more normal levels if central banks stay on course with monetary tightening. However, central banks will likely remain very sensitive to contributing to market volatility.
1st Quarter 2018Investment Landscape
Equity volatility has trended downwards
Source: CBOE, as of 12/31/17 Source: Bloomberg, as of 12/31/17 Source: CBOE, as of 12/31/17
33
U.S. IMPLIED VOLATILITY (VIX) REALIZED 1‐YEAR ROLLING VOLATILITY U.S. VOLATILITY SKEW
0
10
20
30
40
50
60
70
80
90
Jun‐90 May‐95 May‐00 Apr‐05 Mar‐10 Feb‐15
0%
10%
20%
30%
40%
50%
60%
Dec‐01 Jun‐04 Dec‐06 Jun‐09 Dec‐11 Jun‐14 Dec‐16
U.S. EAFE EM
100
110
120
130
140
150
Jan‐96 May‐99 Sep‐02 Jan‐06 May‐09 Sep‐12 Jan‐16
CBOE SKEW INDEX Average

500
1000
1500
2000
2500
3000
3500
4000
Dec‐08 Dec‐10 Dec‐12 Dec‐14 Dec‐16
Growth of $
1,000
S&P 500 Russell 2000 MSCI EAFE MSCI EAFE Small Cap MSCI EM MSCI ACWI
Long-term equity performance
1st Quarter 2018Investment Landscape
Source: MPI, as of 12/31/17
34

Other assets
1st Quarter 2018Investment Landscape 35

Real estateThe core real estate market experienced lower returns in recent quarters than earlier in the cycle as price appreciation has slowed. In the third quarter, the NCREIF Property Index returned 1.7%, of which a net 1.1% came from income. With cap rates at 4.4% as of September 30th, further real estate price appreciation may be difficult. Income will likely continue to play a central role in overall returns.
Although valuations are high, fundamentals remain positive. Growth in net operating income (NOI) has leveled out, but is still healthy at 5.2% and transaction volumes are
above average. NOI growth has been driven by industrial properties, which have benefitted from the expansion of e‐commerce. On the other side of the e‐commerce trend, retail properties have experienced weak NOI growth. The downtrend in vacancy rates has flattened out, but vacancies are still low relative to history at 6.7%.
Given where real estate stands in the cycle, we recommend a conservative approach to leverage, liquidity, and quality. We are more constructive on core real estate, as opposed to value add or opportunistic.
1st Quarter 2018Investment Landscape
Source: NCREIF, as of 9/30/17 Source: NCREIF, as of 9/30/17 Source: NCREIF, as of 9/30/17
36
NCREIF PROPERY INDEX RETURNS NOI GROWTH & CAP RATES VACANCY RATES
‐8%
‐6%
‐4%
‐2%
0%
2%
4%
6%
8%
Mar‐78 Nov‐84 Jul‐91 Mar‐98 Nov‐04 Jul‐11
Income Return Capital Return
‐10%
‐5%
0%
5%
10%
15%
Mar‐83 Nov‐89 Jul‐96 Mar‐03 Nov‐09 Jul‐16
NOI Growth Cap Rates
0%
2%
4%
6%
8%
10%
12%
14%
16%
Mar‐88 Jan‐94 Nov‐99 Sep‐05 Jul‐11 May‐17

CurrencyThe U.S. dollar was little changed in the fourth quarter, but finished the year down 7%. Investors with unhedged international asset exposure have seen large disparities in performance as currency movement continued to contribute to volatility and uncertainty.
Recent strengthening of developed and developing economies relative to the U.S. has likely contributed to U.S. dollar weakness. The U.S. Federal Reserve is engaged in monetary tightening, which implies a stronger dollar on a standalone basis. However, U.S. growth expectations
have shifted relative to international economies which has influenced exchange rates and contributed to recent U.S. dollar movement. Fluctuations in relative growth expectations implies changes in expected inflation and interest rate levels, which directly impacts the foreign exchange market.
Forecasting currency movement over short periods of time can be extremely difficult. Hedging currency risk is an appropriate method for mitigating currency volatility and uncertainty.
1st Quarter 2018Investment Landscape
Source: Federal Reserve, as of 12/27/17 Source: MPI, as of 12/31/17 Source: Federal Reserve, as of 12/31/17
37
U.S. DOLLAR TRADE WEIGHTED INDEX EFFECT OF CURRENCY (1‐YEAR ROLLING) U.S. DOLLAR MAJOR CURRENCY INDEX
‐6%
‐4%
‐2%
0%
2%
4%
6%
60
80
100
120
140
Jul‐74 Jul‐88 Jul‐02 Jul‐16US Major Currency Index (real) Average Currency Index ValueSubsequent 10 Year Return
‐20%
‐10%
0%
10%
20%
30%
Jan‐09 Jan‐11 Jan‐13 Dec‐14 Dec‐16
MSCI EAFE MSCI ACWI ex USA MSCI EM
80
90
100
110
120
130
140
Jan‐95 Jan‐00 Jan‐05 Jan‐10 Jan‐15

Appendix
1st Quarter 2018Investment Landscape 38

Large Cap Equity Small Cap Growth Commodities
Large Cap Value International Equity Real Estate
Large Cap Growth Emerging Markets Equity Hedge Funds of Funds
Small Cap Equity US Bonds 60% MSCI ACWI/40% BBgBarc Global Bond
Small Cap Value Cash
Periodic table of returns
39
Source Data: Morningstar, Inc., Hedge Fund Research, Inc. (HFR), National Council of Real Estate Investment Fiduciaries (NCREIF). Indices used: Russell 1000, Russell 1000 Value, Russell 1000 Growth, Russell 2000, Russell 2000 Value, Russell 2000 Growth, MSCI EAFE, MSCI EM, BBgBarc US Aggregate, T‐Bill 90 Day, Bloomberg Commodity, NCREIF Property, HFRI FOF, MSCI ACWI, BBgBarc Global Bond. NCREIF Property Index performance data as of 9/30/17.
Investment Landscape
BEST
WORS
T
1st Quarter 2018
1994 1995 1996 1997 1998 1999 2000 2001 2002 2003 2004 2005 2006 2007 2008 2009 2010 2011 2012 2013 2014 2015 2016 YTD 5‐Year 10‐Year
Emerging Markets Equity 16.6 38.4 23.2 35.2 38.7 66.4 31.8 14.0 25.9 56.3 26.0 34.5 32.6 39.8 5.2 79.0 29.1 14.3 18.6 43.3 13.5 13.3 31.7 37.3 17.3 10.0
Large Cap Growth 8.1 37.8 23.1 32.9 27.0 43.1 22.8 8.4 10.3 48.5 22.2 21.4 26.9 16.2 1.4 37.2 26.9 7.8 18.1 38.8 13.2 5.7 21.3 30.2 15.2 9.2
International Equity 6.4 37.2 22.4 31.8 20.3 33.2 12.2 7.3 6.7 47.3 20.7 20.1 23.5 15.8 ‐6.5 34.5 24.5 2.6 17.9 34.5 13.0 0.9 17.3 25.0 15.7 8.7
Small Cap Growth 4.4 31.0 21.6 30.5 19.3 27.3 11.6 3.3 1.6 46.0 18.3 14.0 22.2 11.8 ‐21.4 32.5 19.2 1.5 17.5 33.5 11.8 0.6 12.1 22.2 14.1 8.6
Large Cap Equity 3.2 28.5 21.4 22.4 16.2 26.5 7.0 2.8 1.0 39.2 16.5 7.5 18.4 11.6 ‐25.9 28.4 16.8 0.4 16.4 33.1 6.0 0.0 11.8 21.7 14.0 8.2
60/40 Global Portfolio 2.6 25.7 16.5 16.2 15.6 24.3 6.0 2.5 ‐5.9 30.0 14.5 7.1 16.6 10.9 ‐28.9 27.2 16.7 0.1 16.3 32.5 5.6 ‐0.4 11.3 17.1 13.0 7.1
Small Cap Equity 0.4 19.6 14.4 13.9 8.7 21.3 4.1 ‐2.4 ‐6.0 29.9 14.3 6.3 15.5 10.3 ‐33.8 23.3 16.1 ‐2.1 15.3 23.3 4.9 ‐0.8 11.2 14.6 10.3 6.2
Large Cap Value ‐1.5 18.5 11.3 12.9 4.9 20.9 ‐3.0 ‐5.6 ‐11.4 29.7 12.9 5.3 15.1 7.0 ‐35.6 20.6 15.5 ‐2.9 14.6 12.1 4.2 ‐1.4 8.0 13.7 7.9 4.3
Small Cap Value ‐1.8 15.2 10.3 10.6 1.2 13.2 ‐7.3 ‐9.1 ‐15.5 25.2 11.4 4.7 13.3 7.0 ‐36.8 19.7 13.1 ‐4.2 11.5 11.0 3.4 ‐2.5 7.1 7.8 6.8 4.0
Hedge Funds of Funds ‐2.0 11.6 9.9 9.7 ‐2.5 11.4 ‐7.8 ‐9.2 ‐15.7 23.9 9.1 4.6 10.4 5.8 ‐37.6 18.9 10.2 ‐5.5 10.5 9.0 2.8 ‐3.8 5.7 7.7 4.3 1.9
Real Estate ‐2.4 11.1 6.4 5.2 ‐5.1 7.3 ‐14.0 ‐12.4 ‐20.5 11.6 6.9 4.6 9.1 4.4 ‐38.4 11.5 8.2 ‐5.7 4.8 0.1 0.0 ‐4.4 2.6 5.1 4.0 1.7
US Bonds ‐2.9 7.5 6.0 2.1 ‐6.5 4.8 ‐22.4 ‐19.5 ‐21.7 9.0 6.3 4.2 4.8 ‐0.2 ‐38.5 5.9 6.5 ‐11.7 4.2 ‐2.0 ‐1.8 ‐7.5 1.0 3.5 2.1 1.1
Commodities ‐3.5 5.7 5.1 ‐3.4 ‐25.3 ‐0.8 ‐22.4 ‐20.4 ‐27.9 4.1 4.3 3.2 4.3 ‐1.6 ‐43.1 0.2 5.7 ‐13.3 0.1 ‐2.3 ‐4.5 ‐14.9 0.5 1.7 0.3 0.3
Cash ‐7.3 ‐5.2 3.6 ‐11.6 ‐27.0 ‐1.5 ‐30.6 ‐21.2 ‐30.3 1.0 1.4 2.4 2.1 ‐9.8 ‐53.2 ‐16.9 0.1 ‐18.2 ‐1.1 ‐9.5 ‐17.0 ‐24.7 0.3 0.9 ‐8.5 ‐6.8

Major asset class returns
Investment Landscape
Source: Morningstar, as of 12/31/17 Source: Morningstar, as of 12/31/17
40
ONE YEAR ENDING DECEMBER TEN YEARS ENDING DECEMBER
1st Quarter 2018
1.1%
1.7%
2.3%
3.5%
4.2%
6.2%
7.5%
7.8%
13.7%
14.6%
21.8%
22.2%
25.0%
30.2%
37.3%
‐10% 0% 10% 20% 30% 40% 50%
BBgBarc US Agency Interm
Bloomberg Commodity
BBgBarc US Treasury
BBgBarc US Agg Bond
Wilshire US REIT
BBgBarc US Credit
BBgBarc US Corp. High Yield
Russell 2000 Value
Russell 1000 Value
Russell 2000
S&P 500
Russell 2000 Growth
MSCI EAFE
Russell 1000 Growth
MSCI EM
‐6.8%
1.7%
1.9%
2.5%
3.3%
4.0%
5.4%
7.1%
7.3%
8.0%
8.2%
8.5%
8.7%
9.2%
10.0%
‐10% ‐5% 0% 5% 10% 15%
Bloomberg Commodity
MSCI EM
MSCI EAFE
BBgBarc US Agency Interm
BBgBarc US Treasury
BBgBarc US Agg Bond
BBgBarc US Credit
Russell 1000 Value
Wilshire US REIT
BBgBarc US Corp. High Yield
Russell 2000 Value
S&P 500
Russell 2000
Russell 2000 Growth
Russell 1000 Growth

S&P 500 sector returns
Investment Landscape
Source: Morningstar, as of 12/31/17 Source: Morningstar, as of 12/31/17
41
4TH QUARTER ONE YEAR ENDING DECEMBER
1st Quarter 2018
0.2%
1.5%
3.2%
3.6%
6.0%
6.1%
6.5%
6.6%
6.9%
8.6%
9.0%
9.9%
‐5% 0% 5% 10% 15%
Utilities
Health Care
Real Estate
Telecom
Energy
Industrials
Consumer Staples
S&P 500
Materials
Financials
Information Technology
Consumer Discretionary
‐1.3%
‐1.0%
10.8%
12.1%
13.5%
21.0%
21.8%
22.1%
22.2%
23.0%
23.8%
38.8%
‐20% ‐10% 0% 10% 20% 30% 40% 50%
Telecom
Energy
Real Estate
Utilities
Consumer Staples
Industrials
S&P 500
Health Care
Financials
Consumer Discretionary
Materials
Information Technology

Detailed index returns
42Investment Landscape
Source: Morningstar, as of 12/31/17
1st Quarter 2018
DOMESTIC EQUITY FIXED INCOMEMonth QTD YTD 1 Year 3 Year 5 Year 10 Year Month QTD YTD 1 Year 3 Year 5 Year 10 Year
Core Index Broad Index
S&P 500 1.1 6.6 21.8 21.8 11.4 15.8 8.5 BBgBarc US Treasury US TIPS 0.9 1.3 3.0 3.0 2.1 0.1 3.5
S&P 500 Equal Weighted 1.2 6.2 18.9 18.9 10.1 15.8 10.2 BBgBarc US Treasury Bills 0.1 0.2 0.8 0.8 0.4 0.3 0.5
DJ Industrial Average 1.9 11.0 28.1 28.1 14.4 16.4 9.3 BBgBarc US Agg Bond 0.5 0.4 3.5 3.5 2.2 2.1 4.0
Russell Top 200 1.2 6.8 23.0 23.0 11.9 16.0 8.4 Duration
Russell 1000 1.1 6.6 21.7 21.7 11.2 15.7 8.6 BBgBarc US Treasury 1‐3 Yr 0.0 (0.3) 0.4 0.4 0.6 0.6 1.5
Russell 2000 (0.4) 3.3 14.6 14.6 10.0 14.1 8.7 BBgBarc US Treasury Long 1.7 2.4 8.5 8.5 2.8 3.5 6.6
Russell 3000 1.0 6.3 21.1 21.1 11.1 15.6 8.6 BBgBarc US Treasury 0.3 0.1 2.3 2.3 1.4 1.3 3.3
Russell Mid Cap 0.9 6.1 18.5 18.5 9.6 15.0 9.1 Issuer
Style Index BBgBarc US MBS 0.3 0.2 2.5 2.5 1.9 2.0 3.8
Russell 1000 Growth 0.8 7.9 30.2 30.2 13.8 17.3 10.0 BBgBarc US Corp. High Yield 0.3 0.5 7.5 7.5 6.4 5.8 8.0
Russell 1000 Value 1.5 5.3 13.7 13.7 8.7 14.0 7.1 BBgBarc US Agency Interm 0.0 (0.3) 1.1 1.1 1.1 1.0 2.5
Russell 2000 Growth 0.1 4.6 22.2 22.2 10.3 15.2 9.2 BBgBarc US Credit 0.8 1.0 6.2 6.2 3.6 3.2 5.4
Russell 2000 Value (1.0) 2.0 7.8 7.8 9.5 13.0 8.2
INTERNATIONAL EQUITY OTHER
Broad Index Index
MSCI ACWI 1.6 5.7 24.0 24.0 9.3 10.8 4.7 Bloomberg Commodity 3.0 4.7 1.7 1.7 (5.0) (8.5) (6.8)
MSCI ACWI ex US 2.2 5.0 27.2 27.2 7.8 6.8 1.8 Wilshire US REIT (0.1) 1.7 4.2 4.2 5.2 9.3 7.3
MSCI EAFE 1.6 4.2 25.0 25.0 7.8 7.9 1.9 CS Leveraged Loans 0.4 1.2 4.2 4.2 4.5 4.3 4.6
MSCI EM 3.6 7.4 37.3 37.3 9.1 4.3 1.7 Regional Index
MSCI EAFE Small Cap 2.7 6.1 33.0 33.0 14.2 12.9 5.8 JPM EMBI Global Div 0.7 1.2 10.3 10.3 7.1 4.6 7.3
Style Index JPM GBI‐EM Global Div 2.0 0.8 15.2 15.2 2.5 (1.5) 3.6
MSCI EAFE Growth 1.7 5.2 28.9 28.9 9.2 8.8 2.7 Hedge Funds
MSCI EAFE Value 1.5 3.2 21.4 21.4 6.4 6.9 1.1 HFRI Composite 0.9 2.5 8.5 8.5 4.2 4.9 3.2
Regional Index HFRI FOF Composite 0.9 2.0 7.7 7.7 2.6 4.0 1.1
MSCI UK 5.0 5.7 22.3 22.3 4.1 5.2 1.5 Currency (Spot)
MSCI Japan 0.7 8.5 24.0 24.0 11.6 11.2 3.2 Euro 0.7 1.6 13.8 13.8 (0.3) (1.9) (1.9)
MSCI Euro (0.5) 0.4 26.5 26.5 7.6 7.9 (0.3) Pound (0.1) 0.8 9.5 9.5 (4.6) (3.6) (3.8)
MSCI EM Asia 2.8 8.4 42.8 42.8 11.0 7.9 3.6 Yen (0.7) (0.1) 3.5 3.5 2.1 (5.2) (0.1)
MSCI EM Latin American 4.4 (2.3) 23.7 23.7 3.8 (3.2) (1.7)

1st Quarter 2018Investment Landscape 43
DefinitionsBloomberg US Weekly Consumer Comfort Index ‐ tracks the public’s economic attitudes each week, providing a high‐frequency read on consumer sentiment. The index, based on cell and landline telephone interviews with a random, representative national sample of U.S. adults, tracks Americans' ratings of the national economy, their personal finances and the buying climate on a weekly basis, with views of the economy’s direction measured separately each month. (www.langerresearch.com)
University of Michigan Consumer Sentiment Index ‐ A survey of consumer attitudes concerning both the present situation as well as expectations regarding economic conditions conducted by the University of Michigan. For the preliminary release approximately three hundred consumers are surveyed while five hundred are interviewed for the final figure. The level of consumer sentiment is related to the strength of consumer spending. (www.Bloomberg.com)
Citi Economic Surprise Index ‐ objective and quantitative measures of economic news. Defined as weighted historical standard deviations of data surprises (actual releases vs Bloomberg survey median). A positive reading of the Economic Surprise Index suggests that economic releases have on balance been beating consensus. The indices are calculated daily in a rolling three‐month window. The weights of economic indicators are derived from relative high‐frequency spot FX impacts of 1 standard deviation data surprises. The indices also employ a time decay function to replicate the limited memory of markets. (www.Bloomberg.com)
NFIB Small Business Outlook ‐ Small Business Economic Trends (SBET) is a monthly assessment of the U.S. small‐business economy and its near‐term prospects. Its data are collected through mail surveys to random samples of the National Federal of Independent Business (NFIB) membership. The survey contains three broad question types: recent performance, near‐term forecasts, and demographics. The topics addressed include: outlook, sales, earnings, employment, employee compensation, investment, inventories, credit conditions, and single most important problem. (http://www.nfib‐sbet.org/about/)
Notices & disclosuresPast performance is no guarantee of future results. This report or presentation is provided for informational purposes only and is directed to institutional clients and eligible institutional counterparties only and should not be relied upon by retail investors. Nothing herein constitutes investment, legal, accounting or tax advice, or a recommendation to buy, sell or hold a security or pursue a particular investment vehicle or any trading strategy. The opinions and information expressed are current as of the date provided or cited only and are subject to change without notice. This information is obtained from sources deemed reliable, but there is no representation or warranty as to its accuracy, completeness or reliability. Verus Advisory Inc. and Verus Investors, LLC expressly disclaim any and all implied warranties or originality, accuracy, completeness, non‐infringement, merchantability and fitness for a particular purpose. This report or presentation cannot be used by the recipient for advertising or sales promotion purposes.
The material may include estimates, outlooks, projections and other “forward‐looking statements.” Such statements can be identified by the use of terminology such as “believes,” “expects,” “may,” “will,” “should,” “anticipates,” or the negative of any of the foregoing or comparable terminology, or by discussion of strategy, or assumptions such as economic conditions underlying other statements. No assurance can be given that future results described or implied by any forward looking information will be achieved. Actual events may differ significantly from those presented. Investing entails risks, including possible loss of principal. Risk controls and models do not promise any level of performance or guarantee against loss of principal.
“VERUS ADVISORY™ and VERUS INVESTORS™ and any associated designs are the respective trademarks of Verus Advisory, Inc. and Verus Investors, LLC. Additional information is available upon request.

Pasadena Fire & Police Retirement SystemInvestment Performance Review
Period Ending: December 31, 2017

Contributions and withdrawals may include intra-account transfers between managers/funds. Portfolio Reconciliation does not include Pooled Cash.
Portfolio Reconciliation
Last ThreeMonths Fiscal Year-To-Date
_
Beginning Market Value $123,370,489 $124,156,286
Contributions $3,400,000 $8,422,836
Withdrawals -$6,845,513 -$16,314,436
Net Cash Flow -$3,445,513 -$7,891,600
Net Investment Change $2,883,934 $6,544,224
Ending Market Value $122,808,910 $122,808,910
Net Change -$561,578 -$1,347,376_
Total FundPortfolio Reconciliation Period Ending: December 31, 2017
Pasadena Fire & Police Retirement System 1

Does not include Pooled Cash. Invesco Core Real Estate ending market value includes dividend payable. First American Treasury funded 12/1/2015. Vanguard Short-Term Investment Grade funded 3/27/2017.
Total FundCash Flow by Manager Period Ending: December 31, 2017
Pasadena Fire & Police Retirement System 2
BeginningMarket Value Contributions Withdrawals Net Investment
ChangeEnding
Market Value_
Vanguard Growth Index Ins $10,039,914 $0 -$850,000 $611,161 $9,801,075Dodge & Cox Stock $10,054,495 $0 -$425,000 $565,542 $10,195,037Atlanta Capital Management Company $5,112,972 $0 -$420,226 $265,476 $4,958,222Dodge & Cox Intl Stock $12,410,489 $0 -$300,000 $145,661 $12,256,151American Funds Europacific Growth R6 $12,407,716 $0 -$915,000 $522,165 $12,014,881Metropolitan West Core Plus Fixed Income $24,680,134 $0 -$396,595 $118,986 $24,402,524Voya Senior Loan Fund $12,168,738 $0 -$13,691 $147,022 $12,302,069Vanguard Short-Term Investment Grade Adm $12,152,314 $0 $0 -$5,986 $12,146,328Vanguard Inflation-Protected Securities Adm $4,548,158 $0 $0 $54,180 $4,602,339Invesco Core Real Estate $13,736,698 $0 $0 $271,872 $14,008,570PIMCO All Asset Ins $6,057,974 $0 -$125,000 $187,853 $6,120,827First American Treasury Obligation Z $886 $3,400,000 -$3,400,000 $2 $889Total $123,370,489 $3,400,000 -$6,845,513 $2,883,934 $122,808,910
XXXXX

CurrentBalance
CurrentAllocation Policy Difference Policy Range Within IPS
Range?_
Domestic Equity Large CapGrowth $9,801,075 8.0% 8.0% -$23,638 3.0% - 20.0% Yes
Domestic Equity Large CapValue $10,195,037 8.3% 8.0% $370,324 3.0% - 20.0% Yes
Domestic Equity Small CapCore $4,958,222 4.0% 4.0% $45,866 0.0% - 10.0% Yes
International Equity $24,271,032 19.8% 20.0% -$290,750 10.0% - 25.0% YesDomestic Fixed Income Core $24,402,524 19.9% 20.0% -$159,258 10.0% - 35.0% YesDomestic Fixed Income BankLoans $12,302,069 10.0% 10.0% $21,178 0.0% - 15.0% Yes
Domestic Fixed Income ShortTerm $12,146,328 9.9% 10.0% -$134,563 0.0% - 15.0% Yes
Domestic Fixed Income RealReturn $4,602,339 3.7% 5.0% -$1,538,107 0.0% - 10.0% Yes
Real Estate $14,008,570 11.4% 10.0% $1,727,679 0.0% - 15.0% YesAlternative Investment $6,120,827 5.0% 5.0% -$19,618 0.0% - 10.0% YesCash and Equivalents $889 0.0% 0.0% $889 0.0% - 10.0% YesTotal $122,808,910 100.0% 100.0%
XXXXX
Total FundAsset Allocation vs. Policy Period Ending: December 31, 2017
Pasadena Fire & Police Retirement System 3

Policy Index as of 4/01/2017: 8% Russell 1000 Value, 8% Spliced Vanguard Large Growth, 4% Russell 2000, 20% MSCI EAFE, 20% BBgBarc US Aggregate, 5% BBgBarc US TIPS, 10% S&P/LSTA Leveraged Loan, 10% BBgBarc US Credit1-5 Year, 10% NCREIF-ODCE, 5% CPI+5%. CPI LOCAL (LA) includes Los Angeles-Riverside-Orange County. FY: 6/30.
Market Value % ofPortfolio 3 Mo Fiscal
YTD YTD 1 Yr 3 Yrs 5 Yrs Fiscal2017
Fiscal2016
Fiscal2015
Fiscal2014
Fiscal2013
_
Total Fund 122,808,910 100.0 2.3 5.4 12.3 12.3 6.5 8.0 10.7 0.4 3.7 15.4 12.5Policy Index 2.4 5.1 11.2 11.2 6.2 7.6 8.9 1.8 3.0 14.8 11.3
Total Domestic Equity 24,954,334 20.3 5.8 10.6 21.2 21.2 11.8 16.2 22.5 -0.4 8.3 26.4 24.2S&P 500 6.6 11.4 21.8 21.8 11.4 15.8 17.9 4.0 7.4 24.6 20.6
Total International Equity 24,271,032 19.8 2.7 9.8 27.6 27.6 7.8 8.9 26.2 -14.2 -1.3 25.8 19.6MSCI EAFE 4.2 9.9 25.0 25.0 7.8 7.9 20.3 -10.2 -4.2 23.6 18.6MSCI ACWI ex USA 5.0 11.5 27.2 27.2 7.8 6.8 20.5 -10.2 -5.3 21.8 13.6
Total Domestic Fixed 53,453,259 43.5 0.5 1.4 3.3 3.3 2.4 2.1 0.9 4.4 1.8 4.7 1.5BBgBarc US Aggregate TR 0.4 1.2 3.5 3.5 2.2 2.1 -0.3 6.0 1.9 4.4 -0.7
Total Real Estate 14,008,570 11.4 2.0 3.1 7.1 7.1 9.6 10.6 7.3 9.8 15.2 9.6 9.3NCREIF-ODCE 2.1 4.0 7.6 7.6 10.4 11.5 7.9 11.8 14.4 12.7 12.2NCREIF Property Index 1.8 3.5 7.0 7.0 9.4 10.2 7.0 10.6 13.0 11.2 10.7
Total Alternatives 6,120,827 5.0 3.1 6.5 14.0 14.0 5.6 -- 10.8 0.1 -5.8 11.5 --CPI + 5% 1.1 3.1 7.2 7.2 6.7 -- 6.7 6.0 5.1 7.2 --CPI (UNADJUSTED) -0.1 0.6 2.1 2.1 1.6 -- 1.6 1.0 0.1 2.1 --CPI LOCAL (LA) 0.5 1.5 3.6 3.6 2.5 -- 2.2 1.8 0.8 1.8 --
XXXXX
Pasadena Fire & Police Retirement System 4
Total FundExecutive Summary (Net of Fees) Period Ending: December 31, 2017

Invesco Core Real Estate market value includes dividend payable. Total Fund does not include Pooled Cash.
TotalMarketValue
% ofPortfolio
DomesticEquity
Large CapGrowth
DomesticEquity
Large CapValue
DomesticEquity
Small CapCore
International Equity
DomesticFixed
IncomeCore
DomesticFixed
IncomeBank Loans
DomesticFixed
IncomeShort Term
DomesticFixed
IncomeReal Return
Real Estate AlternativeInvestment
Cash andEquivalents
_
Total Domestic Equity Vanguard Growth Index Ins $9,801,075 8.0% $9,801,075Dodge & Cox Stock $10,195,037 8.3% $10,195,037Atlanta Capital Management Company $4,958,222 4.0% $4,958,222
Total International Equity Dodge & Cox Intl Stock $12,256,151 10.0% $12,256,151American Funds Europacific Growth R6 $12,014,881 9.8% $12,014,881
Total Domestic Fixed Metropolitan West Core Plus Fixed Income $24,402,524 19.9% $24,402,524Voya Senior Loan Fund $12,302,069 10.0% $12,302,069Vanguard Short-Term Investment Grade Adm $12,146,328 9.9% $12,146,328Vanguard Inflation-Protected Securities Adm $4,602,339 3.7% $4,602,339
Total Real Estate Invesco Core Real Estate $14,008,570 11.4% $14,008,570
Total Alternatives PIMCO All Asset Ins $6,120,827 5.0% $6,120,827
Cash First American Treasury Obligation Z $889 0.0% $889
Total $122,808,910 100.0% $9,801,075 $10,195,037 $4,958,222 $24,271,032 $24,402,524 $12,302,069 $12,146,328 $4,602,339 $14,008,570 $6,120,827 $889XXXXX
Pasadena Fire & Police Retirement System 5
Total FundAsset Allocation by Account Period Ending: December 31, 2017
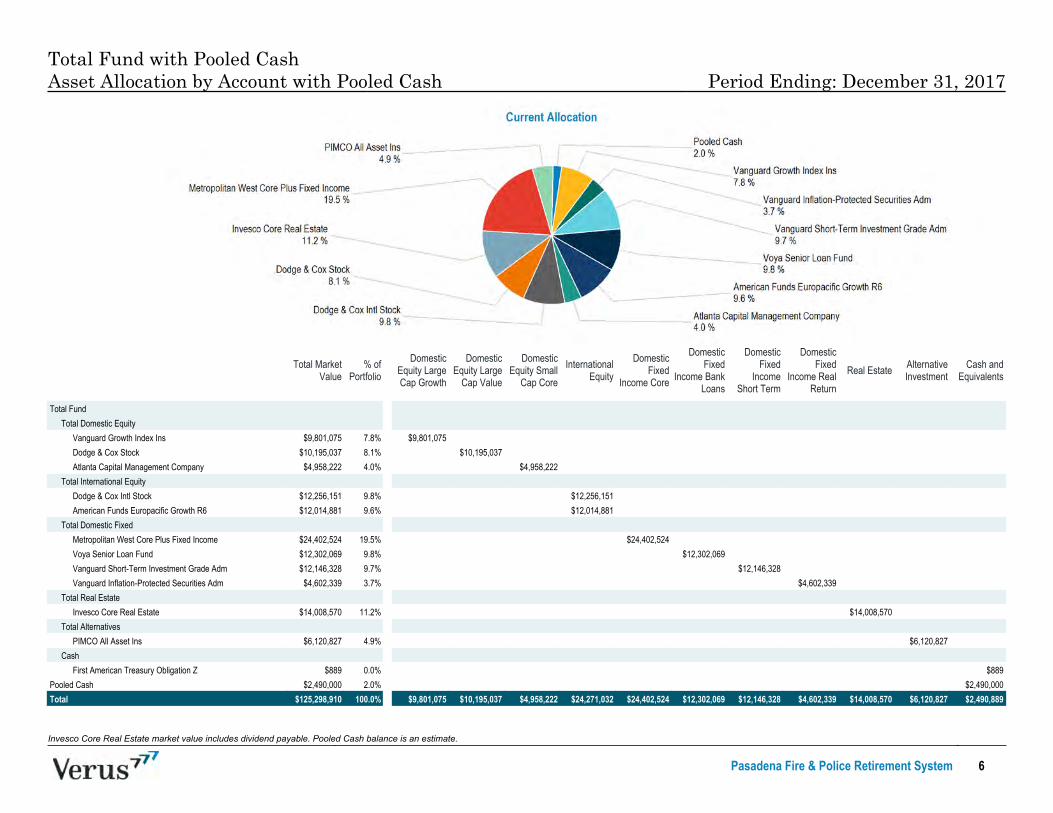
Invesco Core Real Estate market value includes dividend payable. Pooled Cash balance is an estimate.
Total Fund with Pooled CashAsset Allocation by Account with Pooled Cash Period Ending: December 31, 2017
Pasadena Fire & Police Retirement System 6
Total MarketValue
% ofPortfolio
DomesticEquity LargeCap Growth
DomesticEquity Large
Cap Value
DomesticEquity Small
Cap Core
InternationalEquity
DomesticFixed
Income Core
DomesticFixed
Income BankLoans
DomesticFixed
IncomeShort Term
DomesticFixed
Income RealReturn
Real Estate AlternativeInvestment
Cash andEquivalents
_
Total Fund Total Domestic Equity
Vanguard Growth Index Ins $9,801,075 7.8% $9,801,075Dodge & Cox Stock $10,195,037 8.1% $10,195,037Atlanta Capital Management Company $4,958,222 4.0% $4,958,222
Total International Equity Dodge & Cox Intl Stock $12,256,151 9.8% $12,256,151American Funds Europacific Growth R6 $12,014,881 9.6% $12,014,881
Total Domestic Fixed Metropolitan West Core Plus Fixed Income $24,402,524 19.5% $24,402,524Voya Senior Loan Fund $12,302,069 9.8% $12,302,069Vanguard Short-Term Investment Grade Adm $12,146,328 9.7% $12,146,328Vanguard Inflation-Protected Securities Adm $4,602,339 3.7% $4,602,339
Total Real Estate Invesco Core Real Estate $14,008,570 11.2% $14,008,570
Total Alternatives PIMCO All Asset Ins $6,120,827 4.9% $6,120,827
Cash First American Treasury Obligation Z $889 0.0% $889
Pooled Cash $2,490,000 2.0% $2,490,000Total $125,298,910 100.0% $9,801,075 $10,195,037 $4,958,222 $24,271,032 $24,402,524 $12,302,069 $12,146,328 $4,602,339 $14,008,570 $6,120,827 $2,490,889
XXXXX

Weighted returns shown in attribution analysis may differ from actual returns.
Performance AttributionQuarter YTD
Wtd. Actual Return 2.34% 12.30%Wtd. Index Return * 2.40% 11.24%Excess Return -0.06% 1.06%Selection Effect -0.10% 1.10%Allocation Effect 0.04% 0.01%Interaction Effect 0.00% -0.04%
*Calculated from benchmark returns and weightings of each component.
Attribution SummaryLast Three Months
Wtd. ActualReturn
Wtd. IndexReturn
ExcessReturn
SelectionEffect
AllocationEffect
InteractionEffects
TotalEffects
Total Domestic Equity 5.8% 5.3% 0.6% 0.1% 0.0% 0.0% 0.1%Total International Equity 2.7% 4.2% -1.5% -0.3% 0.0% 0.0% -0.3%Total Domestic Fixed 0.5% 0.5% 0.0% 0.0% 0.0% 0.0% 0.0%Total Real Estate 2.0% 2.1% -0.1% 0.0% 0.0% 0.0% 0.0%Total Alternatives 3.1% 1.1% 2.0% 0.1% 0.0% 0.0% 0.1%Total 2.3% 2.4% -0.1% -0.1% 0.0% 0.0% -0.1%
Total FundAttribution Analysis - Asset Class Level (Net of Fees) Period Ending: December 31, 2017
Pasadena Fire & Police Retirement System 7

Anlzd StandardDeviation Anlzd Alpha Beta R-Squared Up Mkt
Capture RatioDown Mkt
Capture RatioInformation
Ratio Tracking Error Sharpe Ratio_
Total Fund 4.06% -0.24% 1.09 0.95 105.87% 108.76% 0.32 0.93% 1.50
Total Domestic Equity 7.85% 0.11% 1.03 0.90 108.07% 121.97% 0.16 2.45% 1.45
Total International Equity 12.24% -1.15% 1.15 0.94 105.81% 109.82% 0.01 3.32% 0.61
Total Domestic Fixed 2.48% 0.76% 0.73 0.94 88.16% 67.05% 0.14 1.08% 0.81
Total Real Estate 2.23% -0.51% 0.97 0.48 91.40% -- -0.51 1.61% 4.13
Total FundRisk Analysis - 3 Years (Net of Fees) Period Ending: December 31, 2017
Pasadena Fire & Police Retirement System 8

Pasadena Fire & Police Retirement System 9
Total FundRolling Risk Statistics (Net of Fees) Period Ending: December 31, 2017

Pasadena Fire & Police Retirement System 10
Total FundRolling Performance Relative to Policy (Net of Fees) Period Ending: December 31, 2017

Page excludes managers with less than 5 years of history.
Anlzd StandardDeviation Anlzd Alpha Beta R-Squared Up Mkt
Capture RatioDown Mkt
Capture RatioInformation
Ratio Tracking Error Sharpe Ratio_
Vanguard Growth Index Ins 8.29% -0.06% 1.00 1.00 99.64% 100.25% -2.12 0.02% 1.91
Dodge & Cox Stock 10.00% 1.37% 1.06 0.80 121.41% 109.29% 0.50 4.48% 1.60
Atlanta Capital Management Company 9.37% 5.68% 0.70 0.77 86.45% 36.50% 0.25 5.76% 1.63
Dodge & Cox Intl Stock 12.20% 1.32% 1.06 0.83 109.83% 88.84% 0.34 5.05% 0.68
American Funds Europacific Growth R6 10.49% 2.78% 0.95 0.90 116.57% 87.64% 0.73 3.30% 0.85
Metropolitan West Core Plus Fixed Income 2.71% 0.55% 0.86 0.96 95.05% 74.19% 0.38 0.69% 0.78
Vanguard Short-Term Investment Grade Adm 1.35% 0.08% 0.94 0.99 95.35% 85.54% -0.16 0.17% 1.14
Vanguard Inflation-Protected Securities Adm 5.10% -0.06% 1.03 1.00 102.12% 103.41% -0.18 0.34% -0.03
Invesco Core Real Estate 2.15% -1.13% 1.02 0.49 91.19% -- -0.55 1.53% 4.85
PIMCO All Asset Ins 7.02% -11.93% 2.40 0.25 62.80% 2,129.79% -0.44 6.42% 0.49XXXXX
Total FundRisk Analysis by Manager - 5 Years (Net of Fees) Period Ending: December 31, 2017
Pasadena Fire & Police Retirement System 11
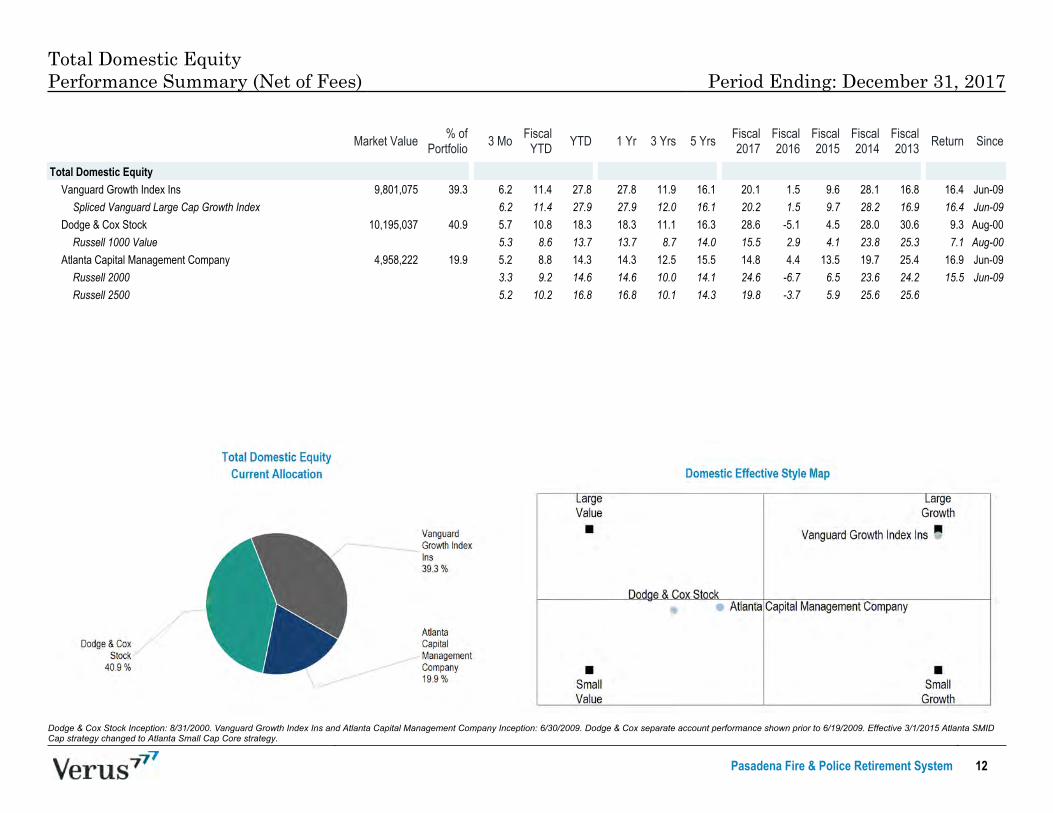
Dodge & Cox Stock Inception: 8/31/2000. Vanguard Growth Index Ins and Atlanta Capital Management Company Inception: 6/30/2009. Dodge & Cox separate account performance shown prior to 6/19/2009. Effective 3/1/2015 Atlanta SMIDCap strategy changed to Atlanta Small Cap Core strategy.
Market Value % ofPortfolio 3 Mo Fiscal
YTD YTD 1 Yr 3 Yrs 5 Yrs Fiscal2017
Fiscal2016
Fiscal2015
Fiscal2014
Fiscal2013 Return Since
_
Total Domestic EquityVanguard Growth Index Ins 9,801,075 39.3 6.2 11.4 27.8 27.8 11.9 16.1 20.1 1.5 9.6 28.1 16.8 16.4 Jun-09
Spliced Vanguard Large Cap Growth Index 6.2 11.4 27.9 27.9 12.0 16.1 20.2 1.5 9.7 28.2 16.9 16.4 Jun-09Dodge & Cox Stock 10,195,037 40.9 5.7 10.8 18.3 18.3 11.1 16.3 28.6 -5.1 4.5 28.0 30.6 9.3 Aug-00
Russell 1000 Value 5.3 8.6 13.7 13.7 8.7 14.0 15.5 2.9 4.1 23.8 25.3 7.1 Aug-00Atlanta Capital Management Company 4,958,222 19.9 5.2 8.8 14.3 14.3 12.5 15.5 14.8 4.4 13.5 19.7 25.4 16.9 Jun-09
Russell 2000 3.3 9.2 14.6 14.6 10.0 14.1 24.6 -6.7 6.5 23.6 24.2 15.5 Jun-09Russell 2500 5.2 10.2 16.8 16.8 10.1 14.3 19.8 -3.7 5.9 25.6 25.6
XXXXX
Total Domestic EquityPerformance Summary (Net of Fees) Period Ending: December 31, 2017
Pasadena Fire & Police Retirement System 12

Dodge & Cox Intl Stock Inception: 9/30/2004. American Funds Europacific Growth R6 Inception: 2/24/2012. Dodge & Cox separate account performance shown prior to 6/19/2009.
Market Value % ofPortfolio 3 Mo Fiscal
YTD YTD 1 Yr 3 Yrs 5 Yrs Fiscal2017
Fiscal2016
Fiscal2015
Fiscal2014
Fiscal2013 Return Since
_
Total International Equity Dodge & Cox Intl Stock 12,256,151 50.5 1.2 8.2 23.9 23.9 6.0 8.5 30.4 -18.9 -3.6 29.3 23.5 7.6 Sep-04
MSCI ACWI ex USA 5.0 11.5 27.2 27.2 7.8 6.8 20.5 -10.2 -5.3 21.8 13.6 6.8 Sep-04American Funds Europacific Growth R6 12,014,881 49.5 4.2 11.4 31.2 31.2 9.7 9.2 22.2 -9.6 1.0 22.4 15.9 9.0 Feb-12
MSCI ACWI ex USA 5.0 11.5 27.2 27.2 7.8 6.8 20.5 -10.2 -5.3 21.8 13.6 6.6 Feb-12XXXXX
Total International EquityPerformance Summary (Net of Fees) Period Ending: December 31, 2017
Pasadena Fire & Police Retirement System 13

Metropolitan West Core Plus Fixed Income Inception: 7/31/2000. Vanguard Inflation-Protected Securities Ins Inception: 6/30/2011. Voya Senior Loan Fund Inception: 6/27/2014. Vanguard Inflation-Protected Securities underwent share classchange on 4/27/2016. Vanguard Short-Term Investment Grade funded 3/27/2017.
Total Domestic FixedPerformance Summary (Net of Fees) Period Ending: December 31, 2017
Pasadena Fire & Police Retirement System 14
Market Value % ofPortfolio 3 Mo Fiscal
YTD YTD 1 Yr 3 Yrs 5 Yrs Fiscal2017
Fiscal2016
Fiscal2015
Fiscal2014
Fiscal2013 Return Since
_
Total Domestic Fixed Metropolitan West Core Plus Fixed Income 24,402,524 45.7 0.4 1.4 3.9 3.9 2.3 2.4 0.6 4.8 1.9 5.0 2.2 5.8 Jul-00
BBgBarc US Aggregate TR 0.4 1.2 3.5 3.5 2.2 2.1 -0.3 6.0 1.9 4.4 -0.7 5.0 Jul-00Voya Senior Loan Fund 12,302,069 23.0 1.1 1.9 3.2 3.2 4.0 -- 5.7 1.5 2.9 -- -- 3.4 Jun-14
S&P/LSTA Leveraged Loan Index 1.1 2.2 4.1 4.1 4.4 -- 7.4 0.9 1.8 -- -- 3.5 Jun-14Vanguard Short-Term Investment Grade Adm 12,146,328 22.7 0.0 0.5 2.1 2.1 2.0 1.8 1.3 3.3 1.1 3.3 1.8 1.3 Mar-17
BBgBarc US Credit 1-5 Yr TR -0.1 0.6 2.3 2.3 2.0 1.8 1.3 3.1 1.3 3.4 2.1 1.5 Mar-17Vanguard Inflation-Protected Securities Adm 4,602,339 8.6 1.2 2.0 2.9 2.9 1.9 0.1 -0.8 4.8 -1.9 4.5 -5.1 2.2 Jun-11
BBgBarc US TIPS TR 1.3 2.1 3.0 3.0 2.1 0.1 -0.6 4.4 -1.7 4.4 -4.8 2.3 Jun-11XXXXX

Invesco Core Real Estate Inception: 10/1/2012. Invesco Core Real Estate market value includes dividend payable.
Total Real EstatePerformance Summary (Net of Fees) Period Ending: December 31, 2017
Pasadena Fire & Police Retirement System 15
Market Value % ofPortfolio 3 Mo Fiscal
YTD YTD 1 Yr 3 Yrs 5 Yrs Fiscal2017
Fiscal2016
Fiscal2015
Fiscal2014
Fiscal2013 Return Since
_
Total Real Estate Invesco Core Real Estate 14,008,570 100.0 2.0 3.1 7.1 7.1 9.6 10.7 7.3 9.8 15.2 10.0 -- 10.5 Oct-12
NCREIF-ODCE 2.1 4.0 7.6 7.6 10.4 11.5 7.9 11.8 14.4 12.7 -- 11.4 Oct-12XXXXX

PIMCO All Asset Ins Inception: 5/28/2013.
Pasadena Fire & Police Retirement System 16
Total AlternativesPerformance Summary (Net of Fees) Period Ending: December 31, 2017
Market Value % ofPortfolio 3 Mo Fiscal
YTD YTD 1 Yr 3 Yrs 5 Yrs Fiscal2017
Fiscal2016
Fiscal2015
Fiscal2014
Fiscal2013 Return Since
_
Total AlternativesPIMCO All Asset Ins 6,120,827 100.0 3.1 6.5 14.0 14.0 5.6 3.7 10.8 0.1 -5.8 11.4 5.8 3.6 May-13
CPI + 5% 1.1 3.1 7.2 7.2 6.7 6.5 6.7 6.0 5.1 7.2 6.8 6.3 May-13HFRI Fund of Funds Composite Index 1.9 4.3 7.6 7.6 2.6 4.0 6.5 -5.4 4.0 7.6 7.3
XXXXX

Does not include Pooled Cash. Invesco Core Real Estate market value includes dividend payable. First American Treasury Obligation expense ratio is discounted to fund's actual yield when below 20 bps. Mutual fund fees shown are sourcedfrom Morningstar and are as of the most current prospectus.
Total FundInvestment Fund Fee Analysis Period Ending: December 31, 2017
Pasadena Fire & Police Retirement System 17
Name Asset Class Identifier Fee Schedule Market Value Estimated FeeValue Estimated Fee
Vanguard Growth Index Ins Domestic Equity VIGIX 0.05% of Assets $9,801,075 $4,901 0.05%Dodge & Cox Stock Domestic Equity DODGX 0.52% of Assets $10,195,037 $53,014 0.52%
Atlanta Capital Management Company Domestic Equity0.80% of First $50.0 Mil,0.70% of Next $105.0 Mil,0.60% of Next $255.0 Mil
$4,958,222 $39,666 0.80%
Dodge & Cox Intl Stock International Equity DODFX 0.64% of Assets $12,256,151 $78,439 0.64%American Funds Europacific Growth R6 International Equity RERGX 0.50% of Assets $12,014,881 $60,074 0.50%
Metropolitan West Core Plus Fixed Income Domestic Fixed Income0.35% of First $25.0 Mil,0.25% of Next $75.0 Mil,0.20% of Next $100.0 Mil
$24,402,524 $85,409 0.35%
Voya Senior Loan Fund Domestic Fixed Income 0.45% of Assets $12,302,069 $55,359 0.45%Vanguard Short-Term Investment Grade Adm Domestic Fixed Income VFSUX 0.10% of Assets $12,146,328 $12,146 0.10%Vanguard Inflation-Protected Securities Adm Domestic Fixed Income VAIPX 0.10% of Assets $4,602,339 $4,602 0.10%Invesco Core Real Estate Real Estate 1.10% of Assets $14,008,570 $154,094 1.10%PIMCO All Asset Ins Alternatives PAAIX 0.87% of Assets $6,120,827 $53,251 0.87%First American Treasury Obligation Z Cash and Equivalents FUZXX 0.20% of Assets $889 $2 0.20%Total $122,808,910 $600,958 0.49%
XXXXX

Pasadena Fire & Police Retirement System 18
Total FundAsset Allocation History Period Ending: December 31, 2017

Effective 1/01/2017, only traditional asset class (public equity, public fixed income, REITs) investment management fees will be included in the gross of fee return calculation.
Pasadena Fire & Police Retirement System 19
Total FundPeer Universe Comparison: Cumulative Performance (Gross of Fees) Period Ending: December 31, 2017

Effective 1/01/2017, only traditional asset class (public equity, public fixed income, REITs) investment management fees will be included in the gross of fee return calculation.
Total FundPeer Universe Comparison: Consecutive Periods (Gross of Fees) Period Ending: December 31, 2017
Pasadena Fire & Police Retirement System 20

Pasadena Fire & Police Retirement System 21
Total FundPeer Universe Comparison: Asset Allocation Period Ending: December 31, 2017

Pasadena Fire & Police Retirement System 22
Data Sources & Methodology Period Ending: December 31, 2017

PI MC 0
4Q17
All Asset Fund PIMCO All Asset Fund utilizes an active asset allocation approach to invest in a portfolio of mutual funds managed by PIMCO. The chart here shows portfolio manager Arnott and Chris Brightman's quarterly sector strategy allocations since 20031
• The fund allocations are shown on the reverse.
SYMBOLS
A shares-PASAX C shares-PASCX D shares-PASDX P shares- PALPX
A company of Alllanz (@
R shares-PATRX lnst. shares-PAAIX Admin. shares-PAALX
110%
100
90 -
80 -
70 -
60 -c 0
·.;::= Ill 50 -.... 0
~ 40 -
30 -
20 -
10 -
0
-10 ~--~--~----~--~--~--~----~--~--~--~~--~--~--~----~--1 . . .
Year 2003 : 2004 : 2005 : 2006 : 2007 2008 : 2009 : 2010 : 2011 2012 : 20132 : 2014 : 2015 2016 : 2017
craes~~~n::~~~!~~=~=) 15.31%:11.12%: 5.82% : 4.69% : 7.92% ~15.91"Ai22.20%: 13.06%: 1.87% :14.92%: 0.18% : 0.38% :-9.27% 2.89%:13.50%
• EM equity strategies • Global bond strategies • U.S. long maturity bond strategies
• Commodities and REIT strategies • Inflation-related bond strategies • Short -term bond strategies2
• EM bond strategies • Alternative strategies • U.S. equity strategies
• Credit strategies • U.S. core bond strategies • Developed ex-U.S. equity strategies
Performance quoted represents past performance. Past performance is not a guarantee or a reliable indicator of future results. Investment return and the principal value of an investment will fluctuate. Shares may be worth more or less than original cost when redeemed. Current performance may be lower or higher than performance shown. For performance current to the most recent month-end, visit pimco.com or cai!BBB.Bl.PIMCO. Performance does not take into account the maximum initial sales charge and would be lower if it did. There is no assurance that any fund, including any fund that has experienced high or unusual performance for one or more periods, will experience similar levels of performance in the future. High performance is defined as a significant increase in either 1) a fund's total return in excess of that of the fund's benchmark between reporting periods or 2) a fund's total return in excess of the fund's historical returns between reporting periods. Unusual performance is defined as a significant change in a fund's performance as compared to one or more previous reporting periods.
' Mr. Arnott is the Chairman and Founder of Research Affiliates, LLC and has managed the Fund since its inception in July 2002. Mr. Brightman is Chief Investment Officer of Research Affiliates, LLC and has managed the Fund since November 2016.
2 The negative allocation to short-term strategies is due to unsettled trades.

PI MC 0 PIMCO ALL ASSET FUND I INDIVIDUAL FUND ALLOCATIONS-% (1 JAN '10 • 31 DEC '17)
2010 2011 2012 2013 2014 2015 2016 2017
Third Pillar· Diversifiers 86.83% 86.21% 80.32% 82.04% 74.17% 81.91% 74.27% 70.82%
EM equities
RAE Fundamental Emerging Markets RAE Fundamental PLUS EMG 5.87% 8.91% 9.71% 11.63% 4.12% 4.65%
4.63% 3.39%
RAE Low Volatility PLUS EMG 0.02% 7.70% 9.46% 10.74%
.................................... ~.9.~ .. ~!!!~.~9.!~.9 .. ~.~!.~~~ ......................................... : ............ .0 ... 2.5.'*.! ...•... .0 ... 2.1.'*.! ...•... .0 ... 2.1.'*.! ...•... .0:.0.2.'*.! ...•........ : ........•........ : ........•.................. Commodities CommoditiesPLUSTM Strategy 3.05% 4.49% 2.36% 2.79% 3.06% 1.68% 3.47% & KElTs CommodityReaiReturn Strategy" 4.24% 4.47% 0.08% 1.35% 3.97% 1.62% 0.53%
.................................... R.e_ai_Es_(a_te_R_e~IR.~t~r~_S.!r~t~9.Y. ...................•.... 1.:5.3.'*.! ...•.. J .. 2_9_'*.! ...•.................•.. J .. 4_5_'*.! ...•.. ..2.-.8_6_'*.! ...•.... 2.-.2_3_'*.! ...•.... 1.-.2_6_'*.! ...•.................. EM bonds Emerging Local Bond 1.53% 5.75% 7.45% 7.23% 9.10% 8.48% 6.98%
Emerging Markets Currency 2.97% 7.14% 6.96% 7.44% 9.05% 11.94% 12.99% Emerging Markets Bond 0.57% 2.68% 3.37% 3.75% 0.47% 0.32%
.................................... E.m._er~i~~-~~r~e~s.S~rp~r~t~.B.~~~---··················································.0.._7_8_'*.! ...•.... 1.-_4.0.'*.! ...•... .0.-.2.0.'*.! ...•... .0:.0.9.'*.! ...•.................•.................. Credit High Yield 3.88% 6.52% 6.24% 4.76% 2.64% 2.53% 2.35%
High Yield Spectrum 0.81% 1.62% 3.02% 4.32% 2.90% 3.84% 4.64% Income 8.94% 9.09% 10.31% 10.66% 6.21% 6.34% 7.63% Diversified Income 3.59% 4.37% 4.28% 3.59% 0.10% 0.24% 0.49% Low Duration Income 6.13% 7.45% 6.56% 1.99% 0.06% 0.29% Senior Floating Rate 0.82% 2.64% 2.19% 2.30% 2.07% 2.34% Convertible 3.71% 3.40% 0.74%
OOOOOOOOOOOOOOOOOOOOOOOOOOOOOOOOOOOOOOOOOOOOOOOOOOOOOOOOOOOOOOOOOOOOOOOOOOOOOOOOOOOOOOOOOOOOOOOOOOOOOMOOOOOOOOOOOOOOOOOMOOOOOOOOOOOOOO .. OMOOOOOOOOOOOOOOOOOHOOOOOOOOOOOOOOOOOHOOOOOOOOOOOOOOOOOHOOOOOOOOOOOOOOOOOHOOOOOOOOOOOOOOOOOMOOOOOOOOOOOOOOOOOO
Global bonds Foreign Bond (Unhedged) 0.79% 1.51% 2.69% 0.05% 0.30% 0.29%
.................................... ~!~~~-~-~~-~~~!~~~--~!!.~.~~9Y. .............................. ?.:?.?.'*.! ...•.. ..2.·.7.0.'*.! ...•.. ..3.-.1_9_'*.! ...•.... 1:.0.2.'*.! ...•... .0:.0.5.'*.! ...•.... ~ ... ~.~-'*.! ...•........ : ........•.................. Inflation-linked Real Return 1.65% 0.03% 0.01% 0.31% 1.38% 0.81% 3.19% bonds Real Return Asset 8.23% 5.33% 0.00% 0.34% 1.27% 6.99% 0.54%
.................................... ~lo.b_al_i\(jV<J".Ill~.e~_l".fla_li_o_n:_Lin_ke.d __ B_o_n~_E_T~ .................•.................•.... o.-_o_9_'*.! ...•.... o.-_o_8_'*.! ...•.... o.-_o_8_'*.! ...•.... o.-_1_0_'*.! ...•.... o.-_1_2_'*.! ...•.................. Alternative strategies
Unconstrained Bond Credit Absolute Return Mortgage Opportunities TRENDS Managed Futures Strategy EqS Long/Short RAE Worldwide Long/Short PLUS RAE Fundamental Advantage PLUS RAE Worldwide Fundamental Adv PLUS
11.04% 2.59% 0.24%
15.74% 3.60%
3.80% 0.53%
0.35%
4.14% 0.83%
3.84% 2.04% 0.55%
0.44%
2.28% 4.34%
1.79% 0.76% 0.61% 0.19% 0.49% 3.08% 4.84% 4.57%
2.08% 0.23% 0.74% 0.26%
7.96% 2.62% 3.16%
0.00% 0.74% 0.30%
5.73% 1.06% 1.15%
Second Pillar- Core bonds 10.51% 8.28% 10.83% 5.42% 13.80% 10.78% 14.67% 19.88%
U.S. core bonds Total Return 0.17% 0.03% 1.46% 0.53% 2.25% 1.65% 1.92%
.................................... 1.n~~st_m._e~t_(;_ra_d_e_s_o_rp_o_ra_te __ B~_n_d ..............•.... 5_._3.0.'*.! ...•.... 4.-_9_7_'*.! ...•.... 2.-_8_5_'*.! ...•... .0.-.2_5_'*.! ...•.. ..2.·_3_4_'*.! ...•.. ..2.·.0.1.'*.! ...•.. ..2.-_7_6_'*.! ...•.................. U.S. long Extended Duration 1.51% maturity bonds Long-Term US Government 0.07% 0.05% 1.04% 0.05% 3.91% 0.00% 2.41%
Long-Term Credit 4.20% 3.03% 3.68% 3.82% 1.93% 0.88% 0.17%
.................................... L~~~.O._ur~ti~~-T_ot;JI __ R~t_ur_n .........................•... .0.-.0_3_'*.! ...•... .0.-.1_3_'*.! ...•.... 1J.9.'*.! ...•... .0:.1_4_'*.! ...•.... 1_._8_6_'*.! ...•.... 1_._4_2_'*.! ...•.... 1_._2_0_'*.! ...•.................. Short-term bonds
Low Duration 0.67% 0.03% 0.00% 0.55% 0.53% 1.54% 2.44% Low Duration Active ETF 0.22% 0.19% Short Term Government Money Market Money Market Fund Net Short Duration Instruments
0.07% 0.05% 0.00% 0.00% 0.00% 0.80% 2.26%
3.13% 0.02% 0.08% -0.02% -0.04% -0.01%
First Pillar- Core stocks 2.65% 5.51% 8.84% 12.54% 12.03% 7.32% 11.06% 9.30%
U.S. equities RAE Fundamental PLUS RAE Low Volatility PLUS RAE Fundamental PLUS Small StocksPLuse Small FundamentallndexPLUSTM StocksPLuse
0.45% 0.19% 0.07% 0.10% 0.02%
0.62% 0.60% 0.82% 0.06% 0.14% 0.14% 0.11% 0.09% 0.07% 0.01% 0.01% 0.01%
0.55% 2.70% 0.74% 0.02% 0.00% 0.00%
StocksPLuse Absolute Return 0.31% 0.31% 0.11% 0.11% 0.01%
1.21% 0.32%
0.25%
·····································································································-·················-·················-·················-·················-·················-·················-·················-·················· Developed RAE Fundamental PLUS Inti 0.80% 5.30% 6.91% 3.01% 1.51% 2.51% ex-U.S. equities RAE Low Volatility PLUS Inti 0.02% 3.79% 4.24% 5.31%
StocksPLUSe Inti (USD-Hedged) 0.28% 0.45% 0.17% 0.21% 0.01% 0.05% 2.93% StocksPLuse Inti (Unhedged) 0.27% 0.57% 0.57% 0.64% 0.02% 0.16% EqS Global Dividend 0.11% 0.10% 0.11% 0.01% EqS Pathfinder 1.12% 2.30% 1.77% 3.48% 1.16%
PPC4018_56188-4Q17
PERFORMANCE Returns as of 31 Dec '17 (after fees)
Class A at NAV
Class A at MOP
Class P
Class lnst.
Bloomberg Barclays U.S. TIPS: 1-10Year Index
CPI + 5%
Lipper Alternative Global Macro Funds Average
1-yr. 3-yr.
13.50% 5.14%
9.24% 3.81%
13.85% 5.56%
13.98% 5.65%
1.90% 1.78%
7.12% 6.62%
10.09% 3.18%
5-yr. 10-yr.
3.17% 4.75%
2.39% 4.35%
3.57% 5.20%
3.67% 5.29%
0.09% 2.83%
6.41% 6.61%
3.04% 3.00%
Inception
6.70%
6.44%
7.20%
7.30%
4.05%
7.10%
5.97%
Share inception date
0413012003
0413012003
0413012008
0713112002
If this material is used after 31 January '18, it must be accompanied by the most recent performance supplement. Performance quoted represents past performance. Past performance is no guarantee of future results. Investment return and the principal value of an investment will fluctuate. Shares may be worth more or less than original cost when redeemed. Current performance may be lower or higher than performance shown. Returns shown are annualized. For performance current to the most recent month-end, visit pimco.com. The maximum offering price (MOP) returns take into account the 5.50% maximum initial sales charge. The fund's A. P and Institutional class total annual operating expenses are 1.515%, 1.165% and 1.065%, respectively. The fund's A, P and Institutional class net expense ratios ex-fee waivers are 1.375%, 1.025% and 0.925%, respectively. Differences in the fund's performance versus the index and related attribution information with respect to particular categories of securities or individual positions may be attributable, in part, to differences in the pricing methodologies used by the fund and the index. Investments made by a fund and the results achieved by a fund are not expected to be the same as those made by any other PIMCO-advised fund, including those with a similar name, investment objective or policies. A new or smaller fund's performance may not represent how the fund is expected to or may perform in the long-term. New funds have limited operating histories for investors to evaluate and new and smaller funds may not attract sufficient assets to achieve investment and trading efficiencies. A fund may be forced to sell a comparatively large portion of its portfolio to meet significant shareholder redemptions for cash, or hold a comparatively large portion of its portfolio in cash due to significant share purchases for cash, in each case when the fund otherwise would not seek to do so, which may adversely affect performance. Ask your investment professional for more information about this fund. You can also visit pimco.com.
Investors should consider the investment objectives, risks, charges and expenses of the funds carefully before investing. This and other information is contained in each fund's prospectus and summary prospectus, if available, which may be obtained by contacting your investment professional, by visiting pimco.com or by calling 888.87.PIMCO. Please read them carefully before you invest or send money . A word about risk: The fund invests in other PIMCO funds and performance is subject to underlying investment weightings which will vary. Investing in the bond market is subject to certain risks, including market, interest rate, issuer, credit and inflation risk; bond prices generally fall as interest rates rise. The fund invests in other PIMCO funds, and performance is subject to underlying investment weightings, which will vary. The cost of investing in a fund that invests in other funds will generally be higher than the cost of investing in a fund that invests directly in individual stocks and bonds. Derivatives may involve certain costs and risks such as liquidity, interest rate, market, credit, management and the risk that a position could not be closed when most advantageous. Investing in derivatives could lose more than the amount invested. The cost of investing in the Fund will generally be higher than the cost of investing in a fund that invests directly in individual stocks and bonds. Diversification does not ensure against loss. Bloomberg Barclays U.S. TIPS: 1-10 Year Index is an unmanaged index comprised of U.S. Treasury Inflation-Protected Securities having a maturity of at least 1 year and less than 1 0 years. The CPI + 5% benchmark is created by adding 5% to the annual percentage change in the Consumer Price Index (CPI}. The Consumer Price Index is an unmanaged index representing the rate of inflation of the U.S. consumer prices as determined by the U.S. Department of Labor Statistics. It is not possible to invest directly in an index. The Alternative Global Macro Funds Average is a total return performance average of funds tracked by Lipper, Inc. that employ opportunistic trading strategies by investing in instruments based on inflection points in macroeconomic trends across various financial instruments and asset classes. The minimum initial investment for Institutional and P class shares is $1 million; however, it may be modified for certain financial intermediaries who submit trades on behalf of eligible investors. Performance reflects changes in share price, reinvestment of dividends and capital gains distributions. All periods longer than one year are annualized. This material has been distributed for informational purposes only and should not be considered as investment advice or a recommendation of any particular security, strategy or investment product. Information contained herein has been obtained from sources believed to be reliable, but not guaranteed. No part of this material may be reproduced in any form, or referred to in any other publication, without express written permission. PIMCO is a trademark of Allianz Asset Management of America L.P. in the United States and throughout the world. PIMCO Investments LLC, distributor, 1633 Broadway, New York, NY 10019, is a company of PIMCO. ©2018, PIMCO
pimco.com

Allocation Effect: An attribution effect that describes the amount attributable to the managers' asset allocation decisions, relative to the benchmark.
Alpha: The excess return of a portfolio after adjusting for market risk. This excess return is attributable to the selection skill of the portfolio manager. Alpha is calculated as: Portfolio Return - [Risk-free Rate +
Portfolio Beta x (Market Return - Risk-free Rate)].
Benchmark R-squared: Measures how well the Benchmark return series fits the manager's return series. The higher the Benchmark R-squared, the more appropriate the benchmark is for the manager.
Beta: A measure of systematic, or market risk; the part of risk in a portfolio or security that is attributable to general market movements. Beta is calculated by dividing the covariance of a security by the
variance of the market.
Book-to-Market: The ratio of book value per share to market price per share. Growth managers typically have low book-to-market ratios while value managers typically have high book-to-market ratios.
Capture Ratio: A statistical measure of an investment manager's overall performance in up or down markets. The capture ratio is used to evaluate how well an investment manager performed relative to an
index during periods when that index has risen (up market) or fallen (down market). The capture ratio is calculated by dividing the manager's returns by the returns of the index during the up/down market,
and multiplying that factor by 100.
Correlation: A measure of the relative movement of returns of one security or asset class relative to another over time. A correlation of 1 means the returns of two securities move in lock step, a correlation of
-1 means the returns of two securities move in the exact opposite direction over time. Correlation is used as a measure to help maximize the benefits of diversification when constructing an investment
portfolio.
Excess Return: A measure of the difference in appreciation or depreciation in the price of an investment compared to its benchmark, over a given time period. This is usually expressed as a percentage and
may be annualized over a number of years or represent a single period.
Information Ratio: A measure of a manager's ability to earn excess return without incurring additional risk. Information ratio is calculated as: excess return divided by tracking error.
Interaction Effect: An attribution effect that describes the portion of active management that is contributable to the cross interaction between the allocation and selection effect. This can also be explained as
an effect that cannot be easily traced to a source.
Portfolio Turnover: The percentage of a portfolio that is sold and replaced (turned over) during a given time period. Low portfolio turnover is indicative of a buy and hold strategy while high portfolio turnover
implies a more active form of management.
Price-to-Earnings Ratio (P/E): Also called the earnings multiplier, it is calculated by dividing the price of a company's stock into earnings per share. Growth managers typically hold stocks with high
price-to-earnings ratios whereas value managers hold stocks with low price-to-earnings ratios.
R-Squared: Also called the coefficient of determination, it measures the amount of variation in one variable explained by variations in another, i.e., the goodness of fit to a benchmark. In the case of
investments, the term is used to explain the amount of variation in a security or portfolio explained by movements in the market or the portfolio's benchmark.
Selection Effect: An attribution effect that describes the amount attributable to the managers' stock selection decisions, relative to the benchmark.
Sharpe Ratio: A measure of portfolio efficiency. The Sharpe Ratio indicates excess portfolio return for each unit of risk associated with achieving the excess return. The higher the Sharpe Ratio, the more
efficient the portfolio. Sharpe ratio is calculated as: Portfolio Excess Return / Portfolio Standard Deviation.
Sortino Ratio: Measures the risk-adjusted return of an investment, portfolio, or strategy. It is a modification of the Sharpe Ratio, but penalizes only those returns falling below a specified benchmark. The
Sortino Ratio uses downside deviation in the denominator rather than standard deviation, like the Sharpe Ratio.
Standard Deviation: A measure of volatility, or risk, inherent in a security or portfolio. The standard deviation of a series is a measure of the extent to which observations in the series differ from the arithmetic
mean of the series. For example, if a security has an average annual rate of return of 10% and a standard deviation of 5%, then two-thirds of the time, one would expect to receive an annual rate of return
between 5% and 15%.
Style Analysis: A return based analysis designed to identify combinations of passive investments to closely replicate the performance of funds
Style Map: A specialized form or scatter plot chart typically used to show where a Manager lies in relation to a set of style indices on a two-dimensional plane. This is simply a way of viewing the asset loadings
in a different context. The coordinates are calculated by rescaling the asset loadings to range from -1 to 1 on each axis and are dependent on the Style Indices comprising the Map.
Glossary

This report contains confidential and proprietary information and is subject to the terms and conditions of the Consulting Agreement. It is being provided for use solely by the customer. The reportmay not be sold or otherwise provided, in whole or in part, to any other person or entity without written permission from Verus Advisory, Inc., (hereinafter Verus) or as required by law or any
regulatory authority. The information presented does not constitute a recommendation by Verus and cannot be used for advertising or sales promotion purposes. This does not constitute an offer
or a solicitation of an offer to buy or sell securities, commodities or any other financial instruments or products.
The information presented has been prepared using data from third party sources that Verus believes to be reliable. While Verus exercised reasonable professional care in preparing the report, itcannot guarantee the accuracy of the information provided by third party sources. Therefore, Verus makes no representations or warranties as to the accuracy of the information presented. Verus
takes no responsibility or liability (including damages) for any error, omission, or inaccuracy in the data supplied by any third party. Nothing contained herein is, or should be relied on as a promise,
representation, or guarantee as to future performance or a particular outcome. Even with portfolio diversification, asset allocation, and a long-term approach, investing involves risk of loss that the
investor should be prepared to bear.
The information presented may be deemed to contain forward-looking information. Examples of forward looking information include, but are not limited to, (a) projections of or statementsregarding return on investment, future earnings, interest income, other income, growth prospects, capital structure and other financial terms, (b) statements of plans or objectives of management,
(c) statements of future economic performance, and (d) statements of assumptions, such as economic conditions underlying other statements. Such forward-looking information can be identified
by the use of forward looking terminology such as believes, expects, may, will, should, anticipates, or the negative of any of the foregoing or other variations thereon comparable terminology, or by
discussion of strategy. No assurance can be given that the future results described by the forward-looking information will be achieved. Such statements are subject to risks, uncertainties, and
other factors which could cause the actual results to differ materially from future results expressed or implied by such forward looking information. The findings, rankings, and opinions expressed
herein are the intellectual property of Verus and are subject to change without notice. The information presented does not claim to be all-inclusive, nor does it contain all information that clients
may desire for their purposes. The information presented should be read in conjunction with any other material provided by Verus, investment managers, and custodians.
Verus will make every reasonable effort to obtain and include accurate market values. However, if managers or custodians are unable to provide the reporting period's market values prior to thereport issuance, Verus may use the last reported market value or make estimates based on the manager's stated or estimated returns and other information available at the time. These estimates
may differ materially from the actual value. Hedge fund market values presented in this report are provided by the fund manager or custodian. Market values presented for private equity
investments reflect the last reported NAV by the custodian or manager net of capital calls and distributions as of the end of the reporting period. These values are estimates and may differ
materially from the investments actual value. Private equity managers report performance using an internal rate of return (IRR), which differs from the time-weighted rate of return (TWRR)
calculation done by Verus. It is inappropriate to compare IRR and TWRR to each other. IRR figures reported in the illiquid alternative pages are provided by the respective managers, and Verus has
not made any attempts to verify these returns. Until a partnership is liquidated (typically over 10-12 years), the IRR is only an interim estimated return. The actual IRR performance of any LP is not
known until the final liquidation.
Verus receives universe data from InvestorForce, eVestment Alliance, and Morningstar. We believe this data to be robust and appropriate for peer comparison. Nevertheless, these universes maynot be comprehensive of all peer investors/managers but rather of the investors/managers that comprise that database. The resulting universe composition is not static and will change over time.
Returns are annualized when they cover more than one year. Investment managers may revise their data after report distribution. Verus will make the appropriate correction to the client account
but may or may not disclose the change to the client based on the materiality of the change.
Disclaimer

Policy Index as of 4/01/2017: 8% Russell 1000 Value, 8% Spliced Vanguard Large Growth, 4% Russell 2000, 20% MSCI EAFE, 20% BBgBarc US Aggregate, 5% BBgBarc US TIPS, 10% BBgBarc US 1-5 Yr Credit, 10% S&P/LSTA LeveragedLoan, 10% NCREIF-ODCE, 5% CPI + 5%. FY: 6/30. Pooled Cash not included in Total Fund calculation. CPI LOCAL (LA) includes Los Angeles-Riverside-Orange County. All manager returns shown net of fees. Effective 3/1/2015 AtlantaSMID Cap strategy changed to Atlanta Small Cap Core strategy. First American Treasury Obligation underwent share class change on 2/18/2016. Vanguard Inflation-Protected Securities underwent share class change on 4/27/2016. VanguardShort-Term Investment Grade funded 3/27/2017. Invesco Core Real Estate market value is as of 12/31/2017. All data is preliminary.
Market Value % ofPortfolio 1 Mo YTD Fiscal
YTD 1 Yr_
Total Fund 125,658,179 100.0 2.3 2.3 7.8 13.2Policy Index 1.7 1.7 6.9 11.9Total Domestic Equity 26,382,615 21.0 5.8 5.8 17.0 25.4
S&P 500 5.7 5.7 17.8 26.4Vanguard Growth Index Ins 10,474,349 8.3 6.9 6.9 19.0 31.8
Spliced Vanguard Large Cap Growth Index 6.9 6.9 19.0 31.8MSCI US Prime Market Growth 7.4 7.4 21.3 32.8
Dodge & Cox Stock 10,775,865 8.6 5.7 5.7 17.1 22.3Russell 1000 Value 3.9 3.9 12.8 17.2
Atlanta Capital Management Company 5,132,401 4.1 3.6 3.6 12.7 19.3Russell 2000 2.6 2.6 12.1 17.2Russell 2500 3.0 3.0 13.6 18.7
Total International Equity 25,787,810 20.5 6.2 6.2 16.7 29.9MSCI EAFE 5.0 5.0 15.4 27.6MSCI ACWI ex USA 5.6 5.6 17.7 29.7Dodge & Cox Intl Stock 13,036,713 10.4 6.4 6.4 15.1 26.4
MSCI ACWI ex USA 5.6 5.6 17.7 29.7American Funds Europacific Growth R6 12,751,097 10.1 6.1 6.1 18.2 33.3
MSCI ACWI ex USA 5.6 5.6 17.7 29.7Total Domestic Fixed 53,211,373 42.3 -0.4 -0.4 1.0 2.5
BBgBarc US Aggregate TR -1.2 -1.2 0.1 2.1Metropolitan West Core Plus Fixed Income 24,127,525 19.2 -1.1 -1.1 0.4 2.5
BBgBarc US Aggregate TR -1.2 -1.2 0.1 2.1Voya Senior Loan Fund 12,420,845 9.9 1.0 1.0 2.9 3.9
S&P/LSTA Leveraged Loan Index 1.0 1.0 3.1 4.5Vanguard Short-Term Investment Grade Adm 12,102,014 9.6 -0.4 -0.4 0.2 1.4
BBgBarc US Credit 1-5 Yr TR -0.4 -0.4 0.1 1.5Vanguard Inflation-Protected Securities Adm 4,560,990 3.6 -0.9 -0.9 1.1 1.0
BBgBarc US TIPS TR -0.9 -0.9 1.3 1.3
Current % Policy %_
Domestic Equity LargeCap Growth $10,474,349 8.3% $10,052,654 8.0%
Domestic Equity LargeCap Value $10,775,865 8.6% $10,052,654 8.0%
Domestic Equity SmallCap Core $5,132,401 4.1% $5,026,327 4.0%
International Equity $25,787,810 20.5% $25,131,636 20.0%Domestic FixedIncome Core $24,127,525 19.2% $25,131,636 20.0%
Domestic FixedIncome Bank Loans $12,420,845 9.9% $12,565,818 10.0%
Domestic FixedIncome Short Term $12,102,014 9.6% $12,565,818 10.0%
Domestic FixedIncome Real Return $4,560,990 3.6% $6,282,909 5.0%
Real Estate $14,008,570 11.1% $12,565,818 10.0%Alternative Investment $6,266,921 5.0% $6,282,909 5.0%Cash and Equivalents $890 0.0% $0 0.0%Total $125,658,179 100.0% $125,658,179 100.0%
XXXXX
Pasadena Fire & Police Retirement SystemExecutive Summary - Preliminary (Net of Fees) Period Ending: January 31, 2018
Pasadena Fire & Police Retirement System 1

Policy Index as of 4/01/2017: 8% Russell 1000 Value, 8% Spliced Vanguard Large Growth, 4% Russell 2000, 20% MSCI EAFE, 20% BBgBarc US Aggregate, 5% BBgBarc US TIPS, 10% BBgBarc US 1-5 Yr Credit, 10% S&P/LSTA LeveragedLoan, 10% NCREIF-ODCE, 5% CPI + 5%. FY: 6/30. Pooled Cash not included in Total Fund calculation. CPI LOCAL (LA) includes Los Angeles-Riverside-Orange County. All manager returns shown net of fees. Effective 3/1/2015 AtlantaSMID Cap strategy changed to Atlanta Small Cap Core strategy. First American Treasury Obligation underwent share class change on 2/18/2016. Vanguard Inflation-Protected Securities underwent share class change on 4/27/2016. VanguardShort-Term Investment Grade funded 3/27/2017. Invesco Core Real Estate market value is as of 12/31/2017. All data is preliminary.
Pasadena Fire & Police Retirement SystemExecutive Summary - Preliminary (Net of Fees) Period Ending: January 31, 2018
Pasadena Fire & Police Retirement System 2
Market Value % ofPortfolio 1 Mo YTD Fiscal
YTD 1 Yr_
Total Real Estate 14,008,570 11.1 N/A N/A N/A 7.1NCREIF-ODCE N/A N/A N/A 7.6NCREIF Property Index N/A N/A N/A 7.0Invesco Core Real Estate 14,008,570 11.1 N/A N/A N/A 7.1
NCREIF-ODCE N/A N/A N/A 7.6Total Alternatives 6,266,921 5.0 2.4 2.4 9.0 14.1
CPI + 5% N/A N/A N/A 6.2CPI (UNADJUSTED) N/A N/A N/A 1.5CPI LOCAL (LA) N/A N/A N/A 2.7PIMCO All Asset Ins 6,266,921 5.0 2.4 2.4 9.0 14.1
CPI + 5% N/A N/A N/A 6.2HFRI Fund of Funds Composite Index N/A N/A N/A 6.5
Cash 890 0.0 0.1 0.1 0.6 0.8Citi 3mth Treasury Bill 0.1 0.1 0.6 0.9First American Treasury Obligation Z 890 0.0 0.1 0.1 0.6 0.8
Citi 3mth Treasury Bill 0.1 0.1 0.6 0.9XXXXX

Pasadena Fire & Police Retirement SystemExecutive Summary with Pooled Cash - Preliminary Period Ending: January 31, 2018
Pasadena Fire & Police Retirement System 3
Total MarketValue
% ofPortfolio
DomesticEquity LargeCap Growth
DomesticEquity Large
Cap Value
DomesticEquity Small
Cap Core
InternationalEquity
DomesticFixed
Income Core
DomesticFixed
Income BankLoans
DomesticFixed
IncomeShort Term
DomesticFixed
Income RealReturn
Real Estate AlternativeInvestment
Cash andEquivalents
_
Total Fund Total Domestic Equity
Vanguard Growth Index Ins $10,474,349 8.2% $10,474,349Dodge & Cox Stock $10,775,865 8.5% $10,775,865Atlanta Capital Management Company $5,132,401 4.0% $5,132,401
Total International Equity Dodge & Cox Intl Stock $13,036,713 10.3% $13,036,713American Funds Europacific Growth R6 $12,751,097 10.0% $12,751,097
Total Domestic Fixed Metropolitan West Core Plus Fixed Income $24,127,525 19.0% $24,127,525Voya Senior Loan Fund $12,420,845 9.8% $12,420,845Vanguard Short-Term Investment Grade Adm $12,102,014 9.5% $12,102,014Vanguard Inflation-Protected Securities Adm $4,560,990 3.6% $4,560,990
Total Real Estate Invesco Core Real Estate $14,008,570 11.0% $14,008,570
Total Alternatives PIMCO All Asset Ins $6,266,921 4.9% $6,266,921
Cash First American Treasury Obligation Z $890 0.0% $890
Pooled Cash $1,390,000 1.1% $1,390,000Total $127,048,179 100.0% $10,474,349 $10,775,865 $5,132,401 $25,787,810 $24,127,525 $12,420,845 $12,102,014 $4,560,990 $14,008,570 $6,266,921 $1,390,890
XXXXX

Asset Class Manager Name Ticker Symbol CUSIP Actual $ Actual % Targets %Above / Under
Target % Target $Re‐Balance Estimate
Re‐Balance Actual New $ New %
Variance to Targets (%)
Domestic EquityLarge Cap Value Dodge & Cox Stock DODGX 256219106 9,976,725$ 8.2% 8.0% 0.2% 9,442,376$ (534,350)$ (750,000) 9,226,725$ 7.8% ‐0.2%Large Cap Growth Vanguard Growth Index VIGIX 922908868 9,723,859$ 8.0% 8.0% 0.0% 9,442,376$ (281,483)$ (500,000) 9,223,859$ 7.8% ‐0.2%Small Cap Core Atlanta Capital Management n/a n/a 4,804,053$ 4.0% 4.0% 0.0% 4,721,188$ (82,865)$ (150,000) 4,654,053$ 3.9% ‐0.1%Total Domestic 24,504,637$ 20.2% 20.0% 0.2% 23,605,939$ (898,698)$ (1,400,000) 23,104,637$ 19.6% ‐0.4%
International EquityInternational Value Dodge & Cox Int'l Stock DODFX 256206103 12,010,075$ 9.9% 10.0% ‐0.1% 11,802,969$ (207,106)$ (450,000) 11,560,075$ 9.8% ‐0.2%International Growth American Funds EuroPacific Growth RERGX 298706821 11,796,584$ 9.7% 10.0% ‐0.3% 11,802,969$ 6,385$ (250,000) 11,546,584$ 9.8% ‐0.2%Total International 23,806,659$ 19.6% 20.0% ‐0.4% 23,605,939$ (200,721)$ (700,000) 23,106,659$ 19.6% ‐0.4%
Total Equity 48,311,296$ 39.9% 40.0% ‐0.1% 47,211,878$ (1,099,418) (2,100,000) 46,211,296$ 39.2% ‐0.8%
Fixed Income
Core Fixed MetWest Core Plus 1 n/a n/a 23,873,555$ 19.7% 20.0% ‐0.3% 23,605,939$ (267,616)$ (375,000) 23,498,555$ 19.9% ‐0.1%Short‐Term Fixed Vanguard Short‐Term Investment‐Grade VFSUX 922031836 12,090,564$ 10.0% 10.0% 0.0% 11,802,969$ (287,595)$ (375,000) 11,715,564$ 9.9% ‐0.1%Senior Bank Loans Voya Senior Bank Loan CIT n/a n/a 12,413,009$ 10.2% 10.0% 0.2% 11,802,969$ (610,039)$ 12,413,009$ 10.5% 0.5%Real Return Vanguard Inflation‐Protected Securities VIPIX 922031745 4,501,662$ 3.7% 5.0% ‐1.3% 5,901,485$ 1,399,822$ 4,501,662$ 3.8% ‐1.2%Total Fixed 52,878,790$ 43.6% 45.0% ‐1.4% 53,113,362$ 234,572$ (750,000) 52,128,790$ 44.2% ‐0.8%
Real Estate
Real Estate Invesco Core Real Estate 2 n/a n/a 14,008,570$ 11.6% 10.0% 1.6% 11,802,969$ (2,205,601)$ 14,008,570$ 11.9% 1.9%Total Real Estate 14,008,570$ 11.6% 10.0% 1.6% 11,802,969$ (2,205,601)$ 0 14,008,570$ 11.9% 1.9%
Liquid AlternativesLiquid Alternatives PIMCO All Asset PAAIX 722005626 6,030,148$ 5.0% 5.0% 0.0% 5,901,485$ (128,663)$ (350,000) 5,680,148$ 4.8% ‐0.2%
Total Alternatives 6,030,148$ 5.0% 5.0% 0.0% 5,901,485$ (128,663)$ (350,000) 5,680,148$ 4.8% ‐0.2%
Cash First American Treasury Obligations FUZXX 195998BA6 890$ 0.0% 0.0% 0.0% ‐$ (890)$ 890$ 0.0% 0.0%
Total Assets 121,229,694$ 100% 100% 0% 118,029,694$ (3,200,000)$ (3,200,000)$ 118,029,694$ 100% 0.0%
Total assets including Pooled Cash ($1,390,000) 122,619,694$ 1 Including negative cash from mortgage TBD forward contracts2 As of 12/31/2017
Pasadena Fire and Police Retirement PlanFebruary 12, 2018

Invesco Core Real Estate – U.S.A., L.P.
Ratification of Advisory Committee Members
2018
Per section 12.1 of the Amended and Restated Limited Partnership Agreement for Invesco Core Real Estate – U.S.A., L.P. (the “Partnership Agreement”), and subject to the terms and conditions thereof (including the confidentiality provisions set forth in Section 6.3), the following is a list of Limited Partners whose designees have been appointed Advisory Committee Members by the General Partner for the year 2018. Capitalized terms used but not defined herein shall have the meanings given in the Partnership Agreement.
Arkansas Public Employees’ Retirement System
Callan Associates
Los Angeles City Employees’ Retirement System
Russell Investment Advisors
San Mateo County Employees’ Retirement Association
California State Teachers’ Retirement System
Blue Sky Group
The Employees’ Retirement Fund of the City of Dallas
Texas Permanent School Fund
Employees Retirement System of Texas
Sovereign Wealth Fund
ATP Real Estate
Aon Hewitt
Illinois Municipal Retirement Fund
Ohio Bureau of Workers’ Compensation
PGGM
M&G Real Estate
SEI
confidential
confidential

Horizon Alternative Investments SHEPP Holdings Ltd
Los Angeles Department of Water and Power Retirement Plan
Australian Superannuation Fund
HOPF‐REI INVESTMENTS LTD.
Approve All
By checking the relevant boxes and executing the signature page, the undersigned Limited Partner hereby ratifies the list of Limited Partners whose designees have been appointed Advisory Committee Members by the General Partner for the year 2018. Please return via email or facsimile to the attention of Celeste Andrini at [email protected] or +1 415 445 7549 by March 1, 2018. Please direct any questions to: Melissa Neckar at [email protected] or +1 972 715 7414.
[Signature Page follows]
confidential
confidential

Date: ____________________ ___________________________________________ (Print or Type Name of Member) By:__________________________________________ Name: Title:
confidential
confidential
rdinnison
Typewritten Text
Pasadena Fire & Police Retirement System
rdinnison
Typewritten Text
rdinnison
Typewritten Text
rdinnison
Typewritten Text
rdinnison
Typewritten Text
Keith Jones
rdinnison
Typewritten Text
Chairman, Retirement Board

A
Acct# 1 2 751000
3 668900 4 703200 5 6 7 8 800500/5800 9 802200 10 11 12 13 810100 14 810900 15 811000 16 811300 17 810800 18 813500 19 813900 20 812400 21 812700/2900 22 815600 23 811400 24 811400 25 811400 26 811400 27 811400 28 811400 29 811400 30 811400 31 811400 32 860700 33 34 814800 35 814800 36 814800 37 814800 38 814800 39 40 41 42 860700 43 814400 44 862600 45 861100 46 861200 47 48
Fire and Police Retirement Board l"'\llTC ? /?I l•i'9
Administration and Operating Expenses -· . - •I I II. J
·--- .. 1-
FY 2018 11 CJVI ~ I / __ r:l.
Comparison of Actual to Budget For the Month and Year Ended January 31, 2018
B c D E F G H Actual Budget Variance Actual Variance
For For For Year To Budget Year To Descriptions Month Month Month Date Year To Date Date
System Revenue:
Concord Asset Income 0 0 0 0 0 0 Miscellaneous Cash/Income 0 0 0 2,196 0 2,196 Citv Cash Contributions 0 0 0 0 0 0 Total System Revenues 0 0 0 2,196 0 2,196
Expenses: Personnel Costs 10,326 17,667 7,340 107,622 123,667 16,045 Retiree Payroll 1069561 1 100 000 30 439 7 508 640 7 700 000 191 360 Subtotal Pers./Retiree Payroll 1,079,887 1,117,667 37,780 7,616,262 7,823,667 207,405
Services & Supplies: Materials and Supplies 52 63 11 252 438 186 Small Equipment Purchases 0 0 0 0 0 0 Outside Printing & Duplication 0 0 0 454 367 (87' Equip. Lease Payments 123 175 52 770 1,225 455 Computer Related Supplies - Software 0 0 0 0 0 0 Reference Materials - Subscriptions 0 0 0 0 0 0 Water 33 29 (4) 210 204 (6' Dues and Memberships 500 500 0 750 750 0 Conferences/Meetings - Board/Staff 0 167 167 0 1,167 1,167 Insurance 0 0 0 22,749 22,749 0 Contract Services: 0 0 0 0 0 0
Misc Services 0 0 0 0 0 0 Actuarial Services 0 0 0 10,800 16,000 5,200 Asset Managers 0 0 0 0 0 0 Auditing Services 0 0 0 45,934 49,500 3,566 PensionGold Svs 660 692 32 4,628 4,842 213 Custodial Bank Svs 0 0 0 0 0 0 Investment Consultant Svs 0 0 0 0 0 0 Outside Legal Counsel 0 0 0 0 0 0 Berwyn Group 0 0 0 300 300 0
Subtotal Contract Services 660 692 32 61,662 70,642 8,979 Investment Expenses
Misc/Other Fees 0 0 0 0 0 0 Custodial Bank Svs 1,850 1,760 (90) 13,091 12,320 (771) Investment Consultant Svs 9,583 9,583 0 67,083 67,083 0
Subtotal Investment Expenses 11 433 11 343 (90) 80 175 79 403 (771) Subtotal Services & Supplies 12,802 12,968 167 167,021 176,944 9,923
Internal Service Charges: Printing 0 17 17 0 67 67 Postage 125 71 (54) 272 496 224 Mail Services 0 8 8 0 58 58 IS-Applic. Devel. & Support 0 17 17 0 117 117 IS-PC Network Suonort 0 21 21 0 146 146 Subtotal Int. Service Charges 125 133 8 272 883 612
Page 1 of2
2/13/2018 2:55 PM FPRS Adopted Budget FY 2018 linked2
January

A
Acct# 49 50 850400 51 850600 52 53 54 55 860100/2000/3400 56 860400 57 860500 58 862200 59 863600 60 864300 61 62
63 64
65
66
67 68
Fire and Police Retirement Board Administration and Operating Expenses
FY 2018 Comparison of Actual to Budget
For the Month and Year Ended January 31, 2018
B c D E F G H Actual Budget Variance Actual Variance
For For For Year To Budget Year To Descriptions Month Month Month Date Year To Date Date
Equipment: Equipment/Furniture 0 0 0 0 0 0 Computer Eauipment 0 0 0 0 0 0 Subtotal Equipment 0 0 0 0 0 0
City Service Charges: Struct Maint/Prev Maint/Sec 439 439 0 3,074 3,074 (0) Utilities and Insurance 180 180 0 1,260 1,260 0 Housekeeping 140 140 0 983 982 (1) Telephones 5 13 8 64 88 24 DolT Desktop Replacement Prag 24 24 (0) 165 166 1 FY 2014 Cost Allocation Proo 0 0 0 0 0 0 Subtotal City Serv Charges 788 796 8 5,546 5,569 23
Subtotal FPRS Admin Expenses 24,041 31,564 7,523 280,460 307,063 26,603
Total FPRS Operating Expenses 1,093,602 1,131,564 37,962 7,789,101 8,007,063 217,963
City Legal Expenses (I. Safie) 0 24,815
Balance of FPRS Funds Actual for Actual for
US Bank - Beg. Of Month 122,720,006 Investment Expenses Month YTD
Receipts 0 Atlanta Cap Qtly (USB) 9,916 20,142
Investment Income 83,403 MetWest Qtlv (USB) 21,352 42,947
Disbursements (1,555) Invesco (USB) 0 82,006
Fees & Expenses (35,963) Voya (USB) 4,695 32,123
Net Chg in Unrealized Gain/Loss 2,850,103 Class Action Fees (USB) 0 153
Realized Gains/Losses (66 142) Misc/Other 0 0
US Bank - End Of Month 125,549,853 US Bank 1,850 13,091
Equity in Pooled Cash (100100) 1,397,463 Verus Investments 9 583 67 083
Concord Investment 0 Total Investment Exp 47,396 257,547
Total FPRS Funds on Deposit 126,947,316
Page 2 of2
2/13/2018 2:55 PM FPRS Adopted Budget FY 2018 linked2
January