firat university
112
TÜRKİYE FIRAT UNIVERSITY GRADUATE SCHOOL OF NATURAL AND APPLIED SCIENCES INVESTIGATION OF SPECTROSCOPIC AND OPTOELECTRONIC PROPERTIES OF BENZIMIDAZOBENZOPHENANTHROLIE MOLECULE Dyari Mustafa MAMAND Master’s Thesis Department of Physics Program: Molecular Physics JULY 2020
-
Upload
khangminh22 -
Category
Documents
-
view
0 -
download
0
Transcript of firat university

TÜRKİYE
FIRAT UNIVERSITY GRADUATE SCHOOL OF NATURAL AND APPLIED SCIENCES
INVESTIGATION OF SPECTROSCOPIC AND
OPTOELECTRONIC PROPERTIES OF
BENZIMIDAZOBENZOPHENANTHROLIE
MOLECULE
Dyari Mustafa MAMAND
Master’s Thesis
Department of Physics
Program: Molecular Physics
JULY 2020

TÜRKİYE
FIRAT UNIVERSITY GRADUATE SCHOOL OF NATURAL AND APPLIED SCIENCES
Department of Physics
Master’s Thesis
INVESTIGATION OF SPECTROSCOPIC AND OPTOELECTRONIC
PROPERTIES OF BENZIMIDAZOBENZOPHENANTHROLIE MOLECULE
Author
Dyari Mustafa MAMAND
Supervisor
Prof. Dr. Niyazi BULUT
Co-Supervisor
Assoc. Prof. Dr. Bayram GÜNDÜZ
JULY 2020
ELAZIĞ

TÜRKİYE
FIRAT UNIVERSITY GRADUATE SCHOOL OF NATURAL AND APPLIED SCIENCES
Department of Physics
Master’s Thesis
Title: Investigation of Spectroscopic and Optoelectronic Properties of
Benzimidazobenzophenanthroline Molecule
Author: Dyari Mustafa MAMAND
First Delivery Date: 24/06/2020
Defense Date: 08/07/2020
THESIS APPROVAL This thesis, which was prepared according to the thesis writing rules of the Graduate
School of Natural and Applied Sciences, Fırat University, was evaluated by the
committee members who have signed the following signatures and was unanimously
approved after the defense exam made open to the academic audience.
Danışman:
Prof. Dr. Niyazi BULUT
Signature
Firat University, Faculty of Science
Second supervisor: Assoc. Prof. Dr. Bayram GÜNDÜZ
Malatya Turgut Ozal University Faculty of Science
President: Prof. Dr. Sinan AKPINAR
Firat University, Faculty of Science
Member: Assoc. Prof. Dr. Ömer KAYĞILI Firat University, Faculty of Science
Member: Assoc. Prof. Dr. Sultan ERKAN
Cumhuriyet University, Faculty of Science
This thesis was registered at the meeting of the Board of Directors of the Institute on ....... /
........ / 20 ........
Signature
Prof. Dr. Soner ÖZGEN director of Graduate School

DECLARATION
I hereby declare that I wrote this Master’s Thesis titled “Investigation of Spectroscopic and
Optoelectronic Properties of Benzimidazobenzophenanthroline Molecule” in consistent with the thesis
writing guide of the Graduate School of Natural and Applied Sciences, Firat University. I also declare that
all information in it is correct, that I acted according to scientific ethics in producing and presenting the
findings, cited all the references I used, express all institutions or organizations or persons who supported the
thesis financially. I have never used the data and information I provide here in order to get a degree in any
way.
8 July 2020
Dyarı Mustafa MAMAND

iv
PREFACE
The BBL molecule is an insulator at room temperature, but it will become a good semiconductor by
increases the temperature. Thermal stability is extremely high and more than 500 °C. BBL molecule has a
rigid road and planar surface structure. The BBL molecule is insoluble in some solvents such as water and
sulfuric acid, but it was solved in methane sulfuric acid. Because of the importance of these characteristics
of BBL, extended applications in everyday life. can be used for fabricating the pigments such as P-type and
N-type semiconductor, light-emitting diode, detector, photoelectric cell. The BBL molecule bandgap energy
is very suitable for the production of dyes, at the first time used in the US of Navy military. In this message,
the BBL bandgap energy is specified. As a result of BBL's bandgap energy was achieved through the
Gaussian09 program with three different basis set. Each of the basis set has a different result associated with
FTIR, HOMO and LUMO, UV-vis. The Gaussian score is the main target compared to the experimental
result. Most importantly, I might want to offer my thanks to Enormous Allah to empowering me to finish this
thesis on computational quantum. We need to require exertion in this task. In any case, it would not have
been conceivable without the thoughtful help and help of numerous people, we might want to stretch out our
genuine gratitude to every one of them.
Setting up a class of any division or subject is truly testing work for anyone. being the understudy of
an administration and to set up a report on the particular point, I acknowledge it with demands, opportunity
and furthermore ended up effective to give the workshop our complete attempt. We are profoundly obliged
to Prof. Dr Niyazi BULUT for their direction and consistent supervision just as giving essential data in
regards to the thesis and likewise for help in finishing the thesis. Without his benevolent heading and
appropriate direction, this investigation would have been a little achievement. In each period of the
responsibility, his supervision and direction formed this report to be totally superbly. I would like to express
my utmost gratitude to my advisor, Assoc. Prof. Dr Bayram GÜNDÜZ for his sincere and selfless support,
prompt and useful advice during my thesis. He gives me a lifetime unforgettable memory of his benevolence,
patience, intelligence, diligence and erudition. I submit my heartiest gratitude to my respected teacher Dr
Sinan Akpinar and Prof. Dr Ali YEŞİL, the lectures of quantum mechanics and mathematical physics.
Finally, I want to thank for my friend M. Hanifi KEBIROGLU contribution. Our thanks and thankfulness
additionally go to the individuals who are straightforwardly or in a roundabout way helped us out in creating
a task.
Dyari Mustafa MAMAND
Elazığ, 2020

v
TABLE OF CONTENTS
Page
PREFACE ................................................................................................................................................. iv
TABLE OF CONTENTS .............................................................................................................................. v
ABSTRACT .............................................................................................................................................vii
ÖZET ................................................................................................................................................... viii
LIST OF FIGURES .................................................................................................................................... ix
LIST OF TABLES ..................................................................................................................................... xi
SYMBOLS AND ABBREVIATIONS ............................................................................................................xii
1. INTRODUCTION ...................................................................................................................................... 1
2. MATERIALS AND METHODS .................................................................................................................. 4
2.1. Construct The Hartee-Fock Equatıon ............................................................................................. 4
2.1.1. Unrestricted and Restricted Hartree-Fock Models .............................................................. 9
2.1.2. Hamiltonian Operator with DFT ....................................................................................... 10
2.1.3. Electron Density as the Basic Variable of DFT ................................................................ 11
2.1.4. Calculating the Total Energy of Atomic Orbitals ............................................................. 13
2.2. Quantum Computatıonal Spectroscopy ........................................................................................ 16
2.2.1. The Absorption Spectrum Range ...................................................................................... 17
2.2.2. Types of Electron Transitions ........................................................................................... 19
2.2.3. UV Visible Transmittance and Absorption ....................................................................... 20
2.2.4. Fourier-Transform Infrared Spectroscopy ........................................................................ 21
2.2.5. IR Absorption of Light Energy ......................................................................................... 23
2.2.6. Electrostatic Potential of Atoms and Molecular................................................................ 25
2.2.7. Coulomb’s Law and the Electrostatic Potential of Atoms and Molecules ........................ 26
2.2.8. Potential Energy ................................................................................................................ 29
2.2.9. Electrostatic Potential Maps .............................................................................................. 29
2.2.10. Electrostatic Potential Map ............................................................................................... 30
2.2.11. Highest Occupied Molecular Orbital and Lowest Unoccupied Molecular Orbital ........... 32
2.2.12. Frontier Molecular Orbitals (FMOs) ................................................................................. 33
2.3. Poly Benzimidazobenzophenanthrolıne Properties ........................................................................ 34
2.3.1. Polymer Characteristics ...................................................................................................... 37
3. RESULT AND DISCUSSION ................................................................................................................ 42
3.1. Determination the Band Gap ......................................................................................................... 47
3.1.1. Fermi Level of BBL ........................................................................................................... 54
3.1.2. Fourier-Transform Infrared Spectroscopy .......................................................................... 56
3.1.3. Ultra Violet Spectroscopy .................................................................................................. 63
3.1.4. Tauc Plot ............................................................................................................................ 70
3.1.5. BBL Transition ................................................................................................................... 74
3.1.6. Chromophores and UV-Vis Spectra ................................................................................... 75
3.1.7. BBL Transition from π→π* ............................................................................................... 76
3.2. The Solution and UV-Vis Spectra of BBL Polymer ...................................................................... 78
3.2.1. Spectroscopy Properties of the BBL Solution .................................................................... 78
3.2.2. BBL Transition ................................................................................................................... 83
3.2.3. Chromophores and UV-Vis Spectra ................................................................................... 84
3.2.4. BBL Transition from π→π* ............................................................................................... 86

vi
3.2.5. The Solution and UV-Vis Spectra of BBL Polymer .......................................................... 87
3.2.6. Spectroscopy Properties of the BBL Solution .................................................................... 88
4. CONCLUSION .................................................................................................................................... 92
REFERENCES .......................................................................................................................................... 93
CURRICULUM VITAE

vii
ABSTRACT
Investigation of Spectroscopic and Optoelectronic Properties of
Benzimidazobenzophenanthroline Molecule
Dyari Mustafa MAMAND
Master’s Thesis
FIRAT UNİVERSİTY Graduate School of Natural and Applied Sciences
Department of Physics July 2020, Page: xiii + 97
During this thesis, the band gap energy of the BBL molecule was determined. The quantum
computational method was used to calculate band gap energy of BBL for HF and DFT approximations to the
basis sets (3-21G, 6-31G, 6-311G). Thus, these approaches were compared for the BBL molecule. The
electrostatic potential map implements the charge distribution on the surface of the BBL molecule. FTIR
exhibits the functionality of the group that contributed to the production of the BBL. To determine the band
gap energy of the BBL, HOMO and LUMO band gap energies were investigated and the orbital boundary
molecule was offered. The most exceptional work is to apply to visible ultraviolet, radiation the basis of the
electron transmission of BBL and is to explain the band gap energy according to the ultraviolet radiation of
the Tauc plot. UV spectra of the BBL solution were performed using a spectrophotometer. Also, UV spectra
and optical band gaps of the theoretical and experimental were compared with each other.
Keywords: Hartree-Fock and Density Functional Theory, FTIR, HOMO and LUMO, Optical Band Gap.

viii
ÖZET
Benzimidazobenzophenanthroline Molekülünün Spektroskopik ve
Optoelektronik Özelliklerinin İncelenmesi
Dyari Mustafa MAMAND
Yüksek Lisans Tezi
FIRAT ÜNİVERSİTESİ Fen Bilimleri Enstitüsü
Fizik Anabilim Dalı
Temmuz 2020, Sayfa: xiii + 97
Bu tez sırasında, BBL molekülünün bant aralığı enerjisi belirlenmiştir. Temel setlere HF ve DFT
yaklaşımları için BBL'nin bant aralığı enerjisini hesaplamak için kuantum hesaplama yöntemi kullanıldı (3-
21G, 6-31G, 6-311G). Böylece, bu yaklaşımlar BBL molekülü için karşılaştırılmıştır. Elektrostatik potansiyel
haritası, BBL molekülünün yüzeyindeki yük dağılımını uygular. FTIR, BBL'nin üretimine katkıda bulunan
grubun işlevselliğini sergiliyor. BBL'nin bant boşluk enerjisini belirlemek için HOMO ve LUMO bant boşluk
enerjileri araştırıldı ve yörünge sınır molekülü önerildi. En istisnai çalışma, görünür ultraviyole, radyasyona
BBL'nin elektron iletiminin temelini uygulamak ve bant aralığı enerjisini Tauc grafiğinin ultraviyole
radyasyonuna göre açıklamaktır. BBL çözeltisinin UV spektrumları bir spektrofotometre kullanılarak
yapıldı. Ayrıca teorik ve deneysel UV spektrumları ile optik bant boşlukları birbirleriyle karşılaştırıldı.
Anahtar Kelimeler: Hartree-Fock ve Yoğunluk Fonksiyonel Teorisi, FTIR, HOMO ve LUMO, Optik Bant
Aralığı.

ix
LIST OF FIGURES
Page
Figure 2.1. Electromagnetic radiation spectrum. ..................................................................................... 16
Figure 2.2. Transition energy states. ........................................................................................................ 17
Figure 2.3. UV-vis spectrum. ................................................................................................................... 18
Figure 2.4. Transition levels of electron. ................................................................................................. 19
Figure 2.5. Output UV visible spectrum. ................................................................................................. 20
Figure 2.6. IR spectrum. .......................................................................................................................... 22
Figure 2.7. Schematic diagram of IR functional groups region. .............................................................. 24
Figure 2.8. Electrostatic distribution ........................................................................................................ 30
Figure 2.9. Electrostatic potential map .................................................................................................... 31
Figure 2.10. Electrostatic potential color code ........................................................................................ 31
Figure 2.11. HUMO and LUMO diagram ............................................................................................... 32
Figure 2.12. HOMO and LUMO FMOs. ................................................................................................. 34
Figure 2.13. Chemical structure of benzimidazobenzophenanthroline (C20H6N4O2)............................... 34
Figure 2.14. Mass composition by element (g/mol) of BBL elements. ................................................... 40
Figure 3.1. Electrostatic potential map of C20H6N4O2. 6-31G Hartree-Fock approximation basis set..... 42
Figure 3.2. Electrostatic potential map of C20H6N4O2 by using 3-21G Hartree-Fock approximation ..... 43
Figure 3.3. Electrostatic potential map of C20H6N4O2 by using 6-311G Hartree-Fock approximation ... 43
Figure.3.4. Electrostatic potential map of C20H6N4O2 by using 3-21G DFT. .......................................... 43
Figure 3.5. Electrostatic potential map of C20H6N4O2 by using 6-31G, DFT. ......................................... 44
Figure 3.6. Electrostatic potential map of C20H6N4O2 by using 6-311G, DFT. ....................................... 44
Figure 3.7. Valence electron atoms of BBL molecule ............................................................................. 47
Figure 3.8. HUMO and LUMO of BBL molecule for HF approximation 3-21G basis set. .................... 48
Figure 3.9. HUMO and LUMO Hartree-Fock 6-31G basis set ................................................................ 49
Figure 3.10. HOMO and LUMO for Hartree-Fock at 6-311G basis set .................................................. 50
Figure 3.11. HUMO and LUMO for DFT at 3-21G basis set .................................................................. 51
Figure 3.12. Band gap energy between HUMO and LUMO for DFT 6-31G basis set ............................ 52
Figure 3.13. Band gap energy between HUMO and LUMO for DFT 6-311G basis set .......................... 52
Figure 3.14. The position of fermi level in semiconductor label ............................................................. 54
Figure 3.15. Natural diagram of semiconductor ...................................................................................... 55
Figure 3.16. IR spectrum 3-21G Basis set for HF approximation for the smallest basis set .................... 57
Figure 3.17. BBL IR spectrum 6-31G basis set for HF ........................................................................... 58

x
Figure 3.18.BBL IR spectrum 6-311G Hartree-Fock. ............................................................................. 59
Figure 3.19. BBL IR spectrum DFT 3-21G basis set Density functional theory at B3LYP level, .......... 60
Figure 3.20. BBL IR spectrum 6-31G Basis set DFT .............................................................................. 61
Figure 3.21. IR BBL spectrum DFT 6-311G Basis set ........................................................................... 62
Figure 3.22. UV spectroscopy for 3-21G basis set HF approximation .................................................... 64
Figure 3.23. UV spectroscopy for 6-31G basis set of HF approximation ................................................ 65
Figure 3.24.UV spectroscopy for 6-311G basis set of HF approximation. .............................................. 65
Figure 3.25. DFT UV visible 3-21G Basis set ......................................................................................... 66
Figure 3.26. DFT UV-visible 6-31G Basis set......................................................................................... 67
Figure 3.27. DFT 6-311G Basis set UV-vis spectrum ............................................................................. 68
Figure 3.28. Tauc plot for 3-21G Basis set at HF approximation ............................................................ 70
Figure 3.29. UV-vis Tauc plot for HF approximation 6-31G Basis set ................................................... 71
Figure 3.30.Tauc plot for 6-311G basis set of HF ................................................................................... 71
Figure 3.31.UV-vis Tauc plot 3-21G DFT .............................................................................................. 72
Figure 3.32. UV-vis Tauc plot for 6-31G Basis set DFT. ........................................................................ 73
Figure 3.33.UV-vis Tauc plot for 6-311G Basis set DFT. ....................................................................... 73
Figure 3.34. Influence of single, double and triple bond on the band gap. .............................................. 76
Figure 3.35. The range of absorption of UV-vis to transition. ................................................................. 77
Figure 3.36. A C=C two-fold bond performances a chromophore. ......................................................... 77
Figure 3.37. BBL, UV-Vis-spectra recorded and dissolved in MeSO3H experimentally ....................... 78
Figure 3.38. UV-vis spectra for different basis sets associated with HF and DFT. ................................. 80
Figure 3.39. The curves of the transmittance wavelength in methane sulfuric acid solution of BBL. .... 81
Figure 3.40. Experimental Tauc plot result of BBL associate with UV-vis. ........................................... 82
Figure 3.41. Determine the band gap energy of BBL corresponds to Tauc plot for different basis set ... 82
Figure 3.42. Influence of single, double and triple bond on the bandgap ................................................ 85
Figure 3.43. The range of absorption of UV-vis to transition .................................................................. 86
Figure 3.44. BBL, UV-Vis-spectra recorded and dissolved in MeSO3H experimentally ....................... 87
Figure 3.45. UV-vis spectra for different basis sets associated with HF and DFT .................................. 89
Figure 3.46. The curves of the transmittance wavelength in methane sulfuric acid solution of BBL ..... 90
Figure 3.47. Experimental Tauc plot result of BBL associate with UV-vis ............................................ 91
Figure 3.48. Determine the band gap energy of BBL corresponds to Tauc plot for different basis set ... 91

xi
LIST OF TABLES
Page
Table 2.1. IR peaks labeled. .......................................................................................................................... 23
Table 2.2. BBL atomic structure and elements with symbols and number atoms with mass percent. .......... 40
Table 3.1. Periodic table with electronegativity of atoms. ............................................................................ 45
Table 3.2. Band gap energy of BBL molecule for different basis set at B3LY level. ................................... 53
Table 3.3. Fermi energy level of BBL for different basis set of HF and DFT. ............................................. 55
Table 3.4. IR label peaks for BBL molecular with the type of peaks. .......................................................... 63
Table 3.5. Band gap energies of HF and DFT for different basis sets. ......................................................... 69
Table 3.6. Difference of the transition between n → π ∗and π → π ∗ .......................................................... 75
Table 3.7. Difference of the transition between n→π*and π→π* of the BBL molecule .............................. 84

xii
SYMBOLS AND ABBREVIATIONS
Symbols
Abbreviations
MOs
: molecule orbitals
AMO : Atomic molecule orbital
HF : Hartee-Fock
DFT : density functional theory
BLYP : Becke-Lee-Yang-Parr
Basis Set : Finite set of functions used to approximately express the Molecular orbital
wavefunction(s) of system, normally atom centered, consisting of AOs differing
in local angular momentum for each atom.
CI : Configuration Interaction
HMO : Hückel Molecular Orbital theory
HOMO : Highest Occupied Molecular Orbital
LUMO : Lowest unoccupied molecular orbital
LCAO : Linear Combination of Atomic Orbitals
RHF : Restricted Hartree-Fock
ROHF : Restricted Open-shell Hartree-Fock
jth
: sub-atomic orbital (MO) is given as the arrangement (wave-function) of the
Schrödinger equation
H : Hamiltonian
T : Kinetic energy operator
V : Potential energy operator
Vnn : Potential energy from nuclear repulsion
Vne : Potential energy of nuclear and electron attraction
Vee : Repulsion potential energy of electrons
Vext : External potential energy
h : Plank’s constant
Te : Electronic kinetic energy
∅ : Orbital function
χ (x) : Spin orbital function
x : Spin multiplicity
α and β : Spin-orbital function
P : Permutation
pij : Permutes two electrons
pijk : Permutes three electrons
EHF : Hartree-Fock energy
ᴪ : Wavefunction
R : Distance of the nuclear in space
n (r ) : Electron density
HK : Hohenberg-Kohn equation
Q[n] : Real general function
εj : Eigenvalues
Exc[n] : Exchange-correlation energy xc : Exchange correlation
HEG : Homogeneous electron gas
ec( n ) : Correlation energy per electron
kF(n ( r )) : Local Fermi wavelength
ξ( r ) : Dimensional quantity
λ : Wavelength
σ , σ∗, π, π∗ : Different energy levels

xiii
SCF : Self-Consistent Field
STO : Slater-Type Orbital
UHF : Unrestricted Hartree-Fock
Z : Atomic mass number
e : Electronic charge
rij : Nuclear core electron separates and the Electron-: : electron remove
C : Carbon atom
O : Oxygen atom
N : Nitrogen atom
H : Hydrogen atom
PE : Potential energy
q : Charge of electron
W : Work
F : Force
FMOs : Frontier molecular orbitals.
C : Carbon atom
H : Hydrogen atom
O : Oxygen atom
N : Nitrogen atom
AO : Atomic Orbital
UV vis : Ultraviolet visible light
IR : Infrared radiation
LDA : Local density approximation
LSDA : Local spin density approximation
GGA : Generalized Gradient Approximation

1. INTRODUCTION
The Hartree-Fock hypothesis is the key to the minimum electronic construction hypothesis.
This is the quantum computational assumption of the molecular orbit (MO) hypothesis, which
determines that each electron will be imaged by unilateral (orbital) molecular function
unconditioned by a free arrangement of the rapid movements of an alternative negative charge such
as electrons. A large number of you have likely found out about Hückel MO hypothesis [1], which
takes Hartree-Fock MO hypothesis as an understood establishment and discards the majority of the
terms to make it tractable for basic computations [2]. The spread of tropical ideas in science is a
declaration of the alien force and natural conspiracy of the Hartree-Fock MO hypothesis. In any
case, remember that these orbits are numerical developments that do not exceed reality. Only for a
hydrogen particle (or functions of a single-electron frame, as it is +) are valid orbital functions of a
complete electronic Hamilton. For any period of time we should think about atoms close to their
equilibrium geometry, the Hartree-Fock hypothesis regularly gives an appropriate starting stage to
gradually illustrate virtual technologies that are better approximations of Schrödinger's electronic
state (for instance, many-body irritations hypothesis, single-reference collaboration). So how can
we be sure that the atomic orbits of the Hartree-Fock hypothesis are used? This is the subject of
these observations; will illustrate the Hartree-Fock theory in a preliminary dimension [3].
We consume an understanding of quantum mechanical calculation with a lower dimension
of energy. In an atomic orbit that consists of many electrons, the wavefunctions are exchanging to
very complex. Since the electrons in an atom and molecule are adversely charged, they repulse one
another, which unmistakably influences their movement. Over some time, they may even have a
similar district of the place giving greatest repulsion powers. Consequently, at any moment, there
is a strong attraction for the electrons to avoid one another, Which limits the repulsion energy and,
in this way, balance the function of the frame. Later, their movements are exceptionally correlated.
The problem of terminating a wave function for a large number of electrons associated with it is
one of the major difficulties in current computing science [4]. The first stage of calculating a large
part of the strategies in quantum computing is to provide an estimate that the motion of the particles
is not related and to build a wave function for these independent particles. This estimate is known
as free-radical speculation [5]. These particles may at present cooperate, however, every molecule
encounters not a momentary connection with alternate particles. The collaboration variations as the
electrons transfer (which will confound its movement). A connection of molecule coming about
because of an obvious description of the found the middle value of the position of every single
other molecule can be incorporated. Upon completion of this estimation, the problem of currently
detecting discrete wave functions - a single wave function for each molecule is solved. Even though
we realize that the autonomous molecule estimates on which they are based are regularly a genuine

2
misrepresentation, much of the time those discrete wavefunctions are determined to give a lot of
understanding hooked on the concoction conduct of a particle [6]. The principle of Density
functional theory is a computation in quantum mechanical hypothesis utilized in material science
with science to examine the electronic construction (mainly the electrons are in-ground state) of
numerous-body schemes, specifically iotas, atoms, molecules and the dense stages [7].
In accordance with this hypothesis, multiple electronic background properties can be controlled
through the use of equations and functions, for example, add-on elements, which for this situation
is the 𝐸[𝑛].
1. Different item calculations (for example, CI) require large hypothesis sets because of the
low range set. When the electronic section is small, apart from that, DFT can generate
accurate results using fairly small-medium basis set.
2. DFT has turned into the most well-known and adaptable technology in computational
science, which accounts for about 95% of the full counts at present. The purpose of this
tendency is that the scaled functional density theory with an indistinguishable request from
the HF hypothesis (N3, where 𝑁 is corresponding to system estimate)
DFT stays far from the cost of the usual strategies and obtaining energy specifically from the
electron probability density, unlike the molecular wave function, in this way radically reduces the
difficulty. Regardless of how many electrons one should use in this method, the three-dimensional
density is reliable.
DFT has been highly influential for estimates in the heavy materials science that later the 1970s.
DFT accounts palatably agreed with test information. Besides, computational expenses were
moderately low when they contradicted the HF theory and his relatives. Apart from that, DFT was
not seen as accurate enough to perform calculations in quantum computational science pending the
1990s. while this assumption used in the hypothesis was too complex to show 𝐸𝐶 and 𝐸𝑋
connectivity more easily. Functional density theory is currently a major method aimed at
determining the electronic structure of science as well as the stimulating science of materials in the
range [8]. Regardless of improvements in the theory of functional density, there are still challenges
in using the practical density hypothesis towards the legitimate representation of intermolecular
assemblies, in particular:
1. van der Waals forces(distribution)
2. charge transmission between the states and excitations
3. conditions transition
4. international potential energy surfaces and some other emphatically connected structures
5. the band hole or band gap energy in semiconductors calculations.
His scattered behavior in scattering reduces the theory of unsatisfactory functional density
(however, unaccompanied one-time use) aimed at the behavior of scatter-driven systems (for

3
example, a cooperation of respected gas molecules) or when the discrepancy is fundamentally
opposed to the effects Different (for instance; in biomolecules) [9]. Improving the functional theory
of innovative density methods aimed at overcoming this problem, by making adjustments to the
practical aspects or by looking at added relationships, is a look at momentum.

2. MATERIALS AND METHODS
In this section, a detailed information about using material and methods in this thesis are
given in detail as below.
2.1. Construct The Hartee-Fock Equatıon
The Hartree-Fock assumption assumes the largest essentially reciprocal system implemented
in almost every quantitative calculation, especially in the chemical sequence [2]. This means a
change in Hartree's behavior. The wave function of many electrons is an asymmetric element for
single-electron wave functions (slater determination). The motion of each electrons in the spin
orbital interplanetary are freely and it encounters a repulsion-repulsion amongst electrons
(Coulombic repulsion) because of the normal places of electrons [1]. Due to the antisymmetrization
and because of this reason, it encounters exchange interaction. Take understood previous that a
single electron spins orbital important stands:
⟨∅i|O|∅j⟩ = ⟨i|O|j⟩ = ∫∅ix1 Ori(∅j(x1)dx1 (2.1)
Correspondingly, a double-electron integral can remain inscribed as:
[∅i∅j/∅k∅l] = [ij/kl] = ∫∫∅i(x1)∅j(x1)1
r12∅k(x2)dx1 dx2 (2.2)
Now, the square shelf in the above equations is usually used to show that it is a practical site
function, not an electronic function. At any time, you need to determine the quantum operative
prediction rate associated with the Schrödinger equation, repeat in one side with the compound of
the wave function of quantum mathematical equations and integrate the entire planets. In the event
that the function is composed as ᴪHF including the relating energy by means of EHF, at that point
the Schrödinger condition can be composed by way of:
⟨ᴪHF|H|ᴪHF ⟩ = ⟨ᴪHF|EHF|ᴪHF⟩
⟨ᴪHF|H|ᴪHF ⟩ = EHF⟨ᴪHF/ᴪHF⟩ (2.3)

5
EHF =⟨ᴪHF|H|ᴪHF ⟩
⟨ᴪHF/ᴪHF⟩ (2.4)
If ᴪHF is identified towards us, EHF can be effectively determined. The difference theorem
expresses us that the accurate wave function between completely conceivable slater determinants
in the individual for which EHF is the minimal:
Emin = ⟨ᴪHF|H|ᴪHF ⟩ < ⟨ᴪ|Helectron|ᴪ⟩ (2.5)
That implies that so as to discover the wavefunction in the Hartree-Fock equation, need to
minimize the articulation energy of Hartree-Fock as for variations in the single electron orbitals
∅1 → ∅1 + δ∅1from which build the Slater determinant ∅. The arrangement of single-electron
orbitals represented by in equation 2.2 ∅i for which get the most minimal energy are the Hartree-
Fock orbitals or the answers for the Hartree-Fock calculations. Realize that the type of spin function
is orthonormal. That implies:
⟨α/β⟩ = ⟨β/α⟩ = 0 (2.6)
⟨α/α⟩ = ⟨β/β⟩ = 1 (2.7)
Equations 2.6 and 2.7 together can be streamlined as pursues:
⟨∅i/∅j⟩ = δij (2.8)
where δij represents the Krönecker delta and is possible to use the amount of value 1 for i = j and
0 then Henceforward, the energy countenance is expressed by
EHF = ⟨ᴪHF / H /ᴪHF⟩ (2.9)
The Hartree-Fock function is not symmetrized orbital function include antisymmetrized
orbital function is presenting the exchange function Kij of the Hamiltonian operator. Kij can be
register by way of pursues:
⟨Π|gij|p12Π⟩ = ⟨∅1(1)∅2(2)|gij|∅2(2)∅1(1)⟩⟨∅3(3)|∅3(3)⟩… ⟨∅N(N)|∅N(N)⟩
⟨∅1(1)∅2(2)|gij|∅2(2)∅1(1)⟩ = K12 (2.10)

6
Here K12 represents the exchange integral. The facility does not have a simple. The basis for
the designation exchange arises after the way in which binary electrons exchange their positions
after the left to one side of the equation in equation 2.10. This precisely indicates that Pauli setup
will take approximately. It compares the location of the exchange of electrons in binary orbits. The
function depends on the full focus on the planets because they depend on the position with respect
to the different electrons of the planets. Thus, the amount of potential energy and physical operators
remain assumed to be local. The relevant participation is still responsible for this arrangement of
artificial bonds. Kij is equal to
Kij = ⟨∅i(1)∅j(2)|1
r12|∅i(2)∅j(1)⟩ (2.11)
Be that as it may, in the determined expression, the antisymmetrization impact ought to be there,
someplace. Fact is expressed, the Kij "exact" the Coulomb integrals to keep up the not the same
symmetry of the wavefunction. I noticed that electrons (especially individuals of the same rotation)
will generally remain far apart and preferably additional to the Slater selectors that appear in the
Hartree element view, so the Kij ought to misrepresent the (repulsion-repulsion) Coulomb revulsion
of the electrons. The sign of the exchange integrals, are negative, a component dedicated to this
enhancement. In the essential term, on the off chance that i=j, this appearance prompts the electron
potential because of the Coulomb integral association from an electron by himself. Henceforth,
regardless of whether we register the vitality of a single-electron frame function, the condition
stretches a value and exchange potential amount is non-zero. On the off chance that i = j, the J𝑖𝑗 −
K𝑖𝑗 drop respectively additional by way of they take a similar incentive by the opposing symbol.
That drops to impact from self-interaction [10]. Corresponds with a binary-electron frame function
such as helium energy, that equation moves toward becoming:
HHe = h1 + h2 + J12 ∓ K12 (2.12)
HF status may lead to growth or decrease in the amount of energy after Hartree energy
stability. The effect of the spin relationship between similar spin electrons leads to an increase in
vitality, although the relationship between reverse spin electrons leads to a decrease in energy. By
reducing energy, there is a primarily supported adaptation state, the electronic rotation of the orbit
is determined in another way (Pauli removal). Through this case, the built-in Coulomb signal will
reach and approach the negative value [11]. The general agreement on the full range of potential
electron vitality due to electronic-electronic repulsion henceforth is considered a separation from
dual relationships:

7
Vee = Jee − Kee = ∑ .∑ (Jee − Kee)nj
ni (2.13)
The amount of energy specified in the Slater is delivered by including both the overhead of the
term. In general mode with the association of network components such as spin orbits, only one
achieves the associated expression [12];
E = VNN +∑ hii +nelectroni=1
∑ ∑ (Jee − Kee)nelectronj
nelectroni (2.14)
According to a closed shell frame function (a spin singlet anywhere altogether the possessed
orbitals take binary electrons in them) the numerous of orbitals can express by n-orbitals, the energy
articulation can be composed by way of:
E = VNN + 2∑ hii +norbitali=1
∑ ∑ (2 Jee − Kee)norbitalj
norbitali (2.15)
To apply the different guideline, the integral and trade Coulomb are composed by way of
administrators:
Ee = ∑ ⟨∅i|hi|∅i⟩ +1
2∑ ∑ (⟨∅j|Ji|∅j⟩ − ⟨∅j|Ki|∅j⟩) + VNN
Nj
Ni
Ni=1 (2.16)
where:
ji|∅j(2)⟩ = ⟨∅i(1)|g12|∅i(1)⟩∅j(2)⟩ (2.17)
and:
Ki|∅j(2)⟩ = ⟨∅i(1)|g12|∅j(1)⟩∅i(2)⟩ (2.18)
This goal currently remains to determine the largest orbits that limit this vitality (or possibly
stay constant regarding additional variations ∅i) in maintaining orthogonality between the orbital
energy of an electron. With this different guideline, the specific energy determination is more than
the actual ground state energy of the electronic energy mark. In this way, while locating this
arrangement of subatomic orbits that limit the individual's estimate of energy, because ⟨ᴪ|H|ᴪ⟩ is
stationary as for little varieties in the atomic orbitals, δ∅ at the base, and meanwhile ⟨ᴪ/ᴪ⟩ must
stay consistent through a minor δ∅l, at that point "Lagrange's strategy for undecided multipliers"
might obtain utilized to infer the character. As far as atomic orbitals, the Lagrange equation will be

8
composed as:
L = E − ∑ λij(⟨∅i|∅j⟩Nij − δij) (2.19)
δL = δE − ∑ λij(⟨δ∅i|∅j⟩ + ∑ λij(⟨∅i|δ∅j⟩Nij ) = 0N
ij (2.20)
The adjustment in L regarding little changes in ∅i ought to be zero. Henceforth, the variation
of the amount energy through deference changes of ∅i moves toward becoming:
δE = ∑ ( ⟨δ∅i|hi|∅i⟩Ni=1 + ⟨∅i|hi|δ∅i⟩) + ∑ ( ⟨δ∅i|Jj − Kj|∅i⟩ + ( ⟨∅i|Jj − Kj|δ∅i⟩
Nij )(2.21)
Presently, present another operator, Fi, known as the Fock operator Fi= hi + ∑ (Jj − Kj)NJ .
This administrator is a successful one-electron administrator, related by the variety in the vitality.
Varying the energy expression regarding the Fock operator:
δE = ∑ ( ⟨δ∅i|Fi|∅i⟩Ni=1 + ⟨∅i|Fi|δ∅i⟩) (2.22)
and
δL = ∑ ( ⟨δ∅i|Fi|∅i⟩Ni=1 + ⟨∅i|Fi|δ∅i⟩) + δE = ∑ λij( ⟨δ∅i|Fi|∅i⟩
Nij + ⟨∅i|Fi|δ∅i⟩) = 0 (2.23)
Conferring the variational value, the greatest orbitals, ∅i, determination brand δ = 0. Through
this replacement, with the revision, it became a simple condition referred to by the HF condition as
follows.
Fi∅i′ = ∑ λij∅j
Nij (2.24)
Subsequently unitary changes, λij approach to zero (λij→ 0) and λij→ εi, Hartree-Fock
conditions regarding standard molecule orbitals and can calculate the amount of diagonal Lagrange
multipliers can be composed by way of:
Fi∅i′ = εi∅i
′ (2.25)
The HF conditions cast along these lines, shape a lot of pseudo-eigenvalue conditions. An
explicit Fock orbital must be resolved once the various involved electron orbitals are identified. An

9
explicit Fock electron orbital energy should resolve if these various possessed orbitals are
identified, and iterative techniques should consequently be utilized aimed at deciding the orbitals.
A lot of orbitals that is an answer for the HF equation (equation 2.25) are called self-consistence
field (SCF) orbitals [13].
2.1.1. Unrestricted and Restricted Hartree-Fock Models
In a closed regulating function with a fully occupied electronic orbital frame function, the
binary dimension is consecutively engaged by binary electrons during the reverse rotation, while
in the open-shell frame function there are mostly occupied dimensions containing only one electron.
In this case, the amount of electrons in the frame function is not equal and strange, at this stage, the
system becomes an open shell [14]. Three occupied sub-orbits are available in the 7N nuclear frame
function through the electronic configuration system structure 1S2, 2S2, 2Px1, 2py
1 , 2pz1. On this off
chance that the quantity of electrons existing is not odd and it is even, the frame function requires
not to stay constantly closed-shell considering there might not be generated and be degenerate
orbital each of one consist just an individual electron. While 2He by electronic arrangement 1s2 is
not an open Shell, but it is a closed shell nuclear frame function, whereas 8O through electronic
configuration1S2, 2S2, 2Px1, 2py
1 , 2pz1, is an open-shell atomic frame function [15]. At the point
where an individual electron is included in the function of a closed shell frame, the relationship
between the electron-negative charged particle through those electrons already present in this frame
function will be unique. These additional electron directions including the single electron from the
individual frame protection function are connected in parallel with the rotating electron. In the case
of a closed-frame function, electronic orbits can be grouped in groups according to the equivalent
energy orbital credit with orbital energy to date by reverse rotation (spin capacities β with α). The
integration of this HF approximation is shown by the imposition of this double occupation and
guideline of the population and is defined as a specific HF specific (RHF). In the case of the orbital
function of the open shell frame, blending does not occur during each stage of the calculation. There
are conceivable results for the pair to extend HF censuses through the functions of the open box
framework:
1. Entirely assuming that orbital combination doesn’t happen at each where of the state.
Respectively spin-orbital is permitted as possessing its three-dimensional fragment. The kind
regarding demonstrating is recognized as Unrestricted HF (UHF) displaying.
2. The Restricted Hartree-Fock system extends to spatial orbits that participate separately from
other orbits. This type is recognized by an open HF open display (ROHF).
During UHF VHFα with VHF
β orbitals will become distinctive actual potentials energy. UHF
bears conditions which mean a lot less difficult than the ROHF. While unrestricted HF,
10
wavefunctions stand made out of solitary Slater determining factor, but in ROHF case,
wavefunctions are made out from this direct blend of a couple of slater determinants [16], anywhere
the development coefficients imply chosen by a symmetry from this situation. Be that as it may,
the unrestricted Hartree-Fock Slater determinant isn't an eigenfunction of the all-out spin
administrator S2. The desire estimation of spin ⟨S2⟩ maybe strayed from the genuine worth S(S+1),
while S is representing the spin quantum number of the electron orbital comparing with the whole
spin at this frame function. That more numerous the difference, that more extra will remain the
destruction in the slater determinant with function comparing through conditions regarding higher-
level spin-orbital multiplicity.
2.1.2. Hamiltonian operator with DFT
The many-electron wavefunction ᴪ(r 1, σ1; . . . . . . r N , σN ) is not a multifaceted vector and
is a multifaceted scalar field. Its three-dimensional fragment, which relies upon the 3N electron
coordinates, the properties of this coordinate can estimate and characterized in a cartesian
interplanetary of measurement 3N = 126. How about guess we pick a separate work toward speak
near the wavefunction in interplanetary. The distance across of the (C6H6) molecule is around
4.5A°; income a cubic form container 10 Å wide, in which the possessed electronic conditions of
the particle are all around confined. Likewise take M = 50 to add the wavefunction on respectively
three-dimensional coordinate, bringing about a work by focuses that remain 0.2 Å removed after
one another. Thusly, the assurance of each one of matrix component at these genuine interplanetary
needs M3N = 50126 activities. So as to realize the ground state wavefunction, through utilizing the
difference rule, one needs to limit the matrix component ⟨ᴪHᴪ⟩/⟨ᴪᴪ⟩, where H is represent the
Hamiltonian [16]. This needs a reiteration of 50126 activities, a few periods. Correspond to present,
that maximum dominant PCs able to complete around 1018 activities every additional. Thusly,
unmistakably it is difficult to discover even the ground-state wavefunction of C6H6 through such a
clear strategy (not to try and make reference to the excited states) because this would need in excess
of a lifetime of human. An answer for such an issue remained projected by Hartree and Fock, who
completed a disentangled presumption around the wavefunction; Ψ is composed as an N × N
determinant of N, one-molecule orbitals: Ψ = Det (∅1, . . ., ∅N ). At that point, the energy of the N-
electron scheme is minimalized giving the determinantal type of the wavefunction and an
arrangement of N conditions for the one-molecule orbitals ⟨∅i⟩ is inferred. The potential period Vi
to the 𝑖𝑡ℎ orbital ∅i relies upon the additional ∅j (j ≠ i). Vi is typically called the (SCF), which
implies that it must be create reliably by the wavefunction Det (∅1, . . ., ∅N).
After a numerical perspective, the HF conditions are integral-differential conditions, in this
way more required to be illuminated than a Schrödinger conditions by an immovable exterior

11
potential energy of electron orbitals of the sort [−ħ2∇2
2m+ V
(r) ]∅(r) = ε∅(r) . However, this multi-
electron problem can be maintained in the structure of the Hartree-Fock strategy, which is
implemented in a few logical beams. It is necessary to consider how the HF hypothesis allows for
understanding the electron conditions associated with N, rather than managing the Schrödinger
state with the original N wave function of the electron, a task that requires many mathematical
perspectives.
The basic plan to simplify the issue of electron N involves the discovery of a physical amount
that describes an evolutionary pattern that is unusually deprived of complexity by an element of
electrons N. Obviously, it may not be the N-electron wave function. Moreover, it was completed
in the 1960s by the introduction of the theory of functional density, which focused on the electron
concentration slightly rather than on wave function. Insistence understands that the current
executions of the functional density theory are further based on self-consistent (SC) conditions, to
be defined in Kohn-Sham conditions, which closely resemble in character to HF conditions [17].
2.1.3. Electron Density as the Basic Variable of DFT
Electron density denoted by n( r ), rather, remains a component of the three-dimensional
arranges just, regardless of the regulatory action these days, allow an estimate of the order of the
electron N exposed to stable external possibilities Vexternal( r ). A unique character can express the
ability to calculate a Coulomb potential and its ability to calculate it through the nucleus on
electrons, just like some additional electromagnetic field [18]. Here, we consider the nonrelativistic
furthest reaches of a hole remunerated scheme, without outside attractive fields. The relating
numerous-electron Schrodinger condition inscribes:
Hᴪ( r 1, … , r N) = ε ᴪ( r 1, … , r N) (2.26)
where the Hamiltonian remains assumed through that aggregate of single-body and binary-body
relations:
𝐻 = ∑ [−ℏ2∇𝑖
2
2𝑚+ 𝑉𝑒𝑥𝑡(𝑟1)] + ∑
𝑒2
|𝑟𝑖→−
𝑟𝑗→ |
𝑖>𝑗𝑁𝑖=1 (2.27)
At the point at the point when a framework is in an express, its energy can be enlisted as E[ᴪ] =
⟨ᴪHᴪ⟩
⟨ᴪᴪ⟩. The difference rule expresses that the minimization of the useful E[ᴪ] concerning every by
N-electrons wavefunctions give the ground state |ᴪ0⟩ and ground state energy E𝑜 = E[ᴪ0]. Aimed
at an arrangement of N-electron in the outer potential represented by Vexternal, this difference

12
standard characterizes a method to decide the ground-level wavefunction |ᴪ0⟩, it is possible to
calculate the ground-state energy E0, and agreement with other ground-state possessions, between
which the n( r ). By shifting Vexternal at settled N, |ᴪ0⟩ and E0 alteration; accordingly, the ground
state energy equation of the many-electron system is afunctional of the outer potential Vext and
depended on external potential: E0 = E[Vext] The amount of electron density n( r ) can express
from these relations can be acquired from the many-electron wavefunction ᴪ ( r 1, … , r N) through
mix:
n(r ) = ⟨ᴪ| ∑ δNi=1 ( r − r i )|ᴪ⟩
= ∫d3r2 … ∫ d3 rN|ᴪ( r , r 2,…r N)|
2+ ∫d3r1…∫d
3 rN−1 |ᴪ( r 1,…r N−1)|2
= N∫d3r2…∫d3 rN|ᴪ( r , r 2,…r N)|
2 (2.28)
where δ(r ) is represent the Dirac delta function was exist in the equation (2.28) [19]. They
benefited in this way that electrons were indistinguishable and that electrons could not be
distinguished, and that the purpose of this phase of their directions could change that wave function
only by a factor of ±1. The ordinary approach to decide the n( r ) is to fathom the Schrodinger
condition initially, acquire the wavefunction lastly, through utilizing condition (2.28), discover
density electron n( r ). Consequently, when the Hamiltonian (H) is kept in touch with, one can on
a basic level decide the n( r ), which compose as H → n( r ) after the Hamiltonian to the electron
density. It may be surprising that Hamilton is determined by the density of the electron, that is, the
density of the electron → Hamilton (from density to Hamilton), however, this should already be
possible. For instance, how about we consider the ground condition of a confined atom, for which
the value of electron density at the ground state n0(r ) should be actually recognized, then endeavor
toward determine the comparing Hamiltonian. Aimed at such a situation, the Hamiltonian can be
composed by way of:
H = ∑ [−ħ2∇i
2
2m−
Ze2
|r i−R |]N
i=1 + ∑e2
|r i−r j|i>j (2.29)
where Z is the nuclear number (for example, the number of protons) the positive particle of the
nuclear) and R and is the position of the nucleus in the planets. Hamiltonian is also solved when
the three parameters Z, N, R and R are obtained and the Hamiltonian result depends on these
parameters. The full amount of negative charges can be obtained by directly adding planets to the
electron density of the ground state by [20];
N = ∫d3 r n0( r ) (2.30)

13
where a0 from the equation 2.30 is represent the Bohr range of the Hydrogen atom (H) this radius
can express and calculate depended on the mass of the atom, a0 =ħ2
2me2. Subsequently the
wavefunction can on a basic level be gotten from the Hamiltonian, in this specific case the point by
point information of the electron density is adequate to decide altogether the physical possessions
of the scheme. This outcome is recognized as the Kato hypothesis. The speculation of the past
outcome, that is, n( r ) → H, to a system with a settled quantity of electrons N and for self-assertive
outside possibilities was properly assumed by Hohenberg and Kohn in 1964, finished dual
hypotheses:
1. Aimed at non-degenerate ground states, each two Hamiltonian have various ground state and
two distinctive Hamiltonians can't have a similar ground-state electron density. In this way,
it is conceivable to characterize the ground-state vitality as a function of corresponds to this
equation n ( r ): E = E[n].
2. E = E[n] is negligible associate with the condition of n (r ) is the real ground-state density,
amongst every conceivable electron density.
The binary past hypotheses permit the 𝐸𝑜 to be originate by minimalizing E[n] as opposed
to going finished the assurance of the numerous-electron wavefunction. That’s actually what we’re
searching aimed at! In any case, the HK hypotheses [21], albeit correct (a proof is given beneath)
don't give any clue on how the energy relies upon the density by means of the E[n] practical. We
envision that, separated nearly couple of exceptional cases, the correct E[n] is obscure and just
surmised functionals are utilized practically speaking. Increasingly finished, the first definition of
the HK hypotheses is confined to the ground condition of a shut arrangement of N electrons; as a
result, it smears neither to energized conditions nor to contrast schemes and a shifting quantity of
electrons.
2.1.4. Calculating the Total Energy of atomic orbitals
The complete energy, recently characterized in equation 2.32, is
E[n] = Ts[n] + ∫d3r Vext(n)( r ) + EH[n] + Exc[n] (2.32)
Explaining the Kohn-Sham conditions is proportional to discover the density n( r ) that minimizes
E[n], for the genuine exchange-correlation useful Exc[n], which is essentially approximated for
genuine systems. The relating single-particle orbitals ᴪi( r ) are subsequently self- consistent,
similar to the density and the elective potential, as they create themselves through the Kohn-Sham
conditions. When self- consistent orbitals ᴪi( r ) and density n( r ) have been gotten, the whole
vitality of the ground state [22], for approximated exchange correlation practical, can be figured.

14
the kinetic energy Ts[n] of the virtual, non-interrelating system can be correlated as:
Ts[n] = −ħ2
2m∑ fjᴪj
∗( r )∇2ᴪj( r )j (2.33)
while alternate terms more often than not depend exclusively on the density. A proportionate
articulation can be acquired:
∑ fj ∫d3r ᴪj
∗ ( r ) [−ħ2∇2
2m+ Vext( r )+e
2 ∫d3r′ n ( r ′)
|r −r ′|+ Vxc( r ; [n])] ᴪj( r ) =j
∑ fjd3r εjᴪj
∗( r )ᴪj( r )j (2.34)
that is,
Ts[n] = ∑ fjεj −e2
2j ∫d3r ∫ d3r′n( r )n (r ′)
|r −r ′|+ ∫d3r n( r ) Vxc(r ; [n]) = ∑ fjεjj (2.35)
from this condition, the active energy can be communicated as far as eigenvalues εj and density
n( r ). By supplanting the kinetic energy with this articulation, one acquires for the complete energy:
En = ∑ fjεj −e2
2∫d3r ∫ d3r′
n( r ) n( r ′)
|r −r ′|+ Exc[n] − ∫d
3r n( r ) Vxc(r ; [n])j (2.36)
Calculation of the Exchange-Correlation Energy Functional The exchange-correlation
energy is a principle of DFT to overcome on accurate calculations denoted by Exc[n]
remained presented by way of an update among the obscure correct E[n] and the whole
assumed by the Ts[n] of the non-interacting electron at the gas phase at a similar density,
in addition to the Hartree expression and the involvement of the outer potential energy [23].
Exc[n] can be characterized by way of:
Exc[n] = E[n] − Eknown[n] (2.37)
Eknown[n] = Ts[n] + ∫d3r Vext( r )n(r ) + EH[n] (2.38)
Along these lines, Exc[n] should represent all the simply quantum impacts, to be specific
Exc[n], and take out the phony electron self-consistent period that is available in EH[n] also.
Perceive that exchange and correlation Exc[n] is essentially a function of the 𝐸[𝑛]and is free where

15
these electrons are in the outer potential, with the goal that it would exertion for every resource.
Frequently, exchange and correlation is composed by way of a total of a period which is because
of unadulterated exchange in addition to a commitment from electron correlation as Exc[n] =
Ex[n] + Ec[n]. realize the Ex[n] term expressly as far as the one-molecule orbitals that system the
Fock determinant Det(∅1, … , ∅N), which can be composed by way of:
Ex[{∅i}] =e2
2∑ ∫d3r ∫ d3r′
∅i∗( r )∅j
∗( r ′) ∅i(r ′)∅j( r )
|r −r ′|i,j (2.39)
In every case, the outflow of the Ex[n]as a function and depend on the electron density isn't actually
recognized, aside from insufficient situations, for example, the homogeneous electron gas for which
the density is equivalent to its unkind regard n = N V⁄ wherever
EXHGE ( n ) = −
3e2
4(3
π )
1
3V n
4
3 = −Cx N
V n1
3 (2.40)
Note that in the homogeneous electron gas (HEG) the exchange influence is constantly
negative quantity and accordingly adds toward expand the union through bringing down the
repulsion force between electron-electron [24].
Notwithstanding the energy involvement from the dynamic correlation amongst electrons is
exchange term, In fact, notwithstanding aimed at electrons through different spin, the likelihood of
conclusion an electron in r once additional is in r gets a lot littler than 1 (which would be the
boundary to noninteracting electrons, deprived of relationship impacts) when r → r . In this manner,
lengthways its heading in space, the electron sees around itself a dejection of the density beginning
from substitute electrons, who’s typical is by and large suggested as the 𝐸𝑥𝑐hole 𝑛𝑥𝑐(𝑟 , 𝑟′ ). Its trade
fragment is only fruitful amongst electrons with a comparative spin. The update is simply because
of relationship impacts and is at some point so-called the Coulomb hole.
𝐸𝑥𝑐 impacts can be justifiably treated inside the numerous-body hypothesis. The principal
precedent is the He molecule, with only two electrons.
Clearly, the past meaning of Exc[n] does not assistance in discovery an appearance for the
Exc functional. At the same time, the complexities of the multiple electron problem are uprooted
from electron density to exchange and bonding. On another side, the principle contributions of
particles to the complete vitality of atoms and particles, atoms with solids go to the recognized
piece of the utilitarian Eknown[n]; as an outcome, the relative error in total energy is very small,
and exchange and bonds are freely estimated. Again, one usually wants to look at binary systems,
which may vary in size, geometry, nuclear synthesis, the number of electrons, the nearest outer
fields, etc. For this situation, what makes a difference is the contradiction between the energies of

16
the entire dual system. The contribution of Exc[n] impacts to such energy contrasts might be very
applicable by and large. In this way, finding strong estimates of exchange and correlation is
fundamental to the theory of functional density, as evidenced by the amount of production wherever
it occurs. Detected so far because exact exchange and correlation is not specified.
2.2. Quantum Computatıonal Spectroscopy
Ultraviolet and Visible Light (UV-Vis), retention spectroscopy is an estimate to reduce light
emission after a sample passage or reflection after the sample surface. The retention estimate can
be solitary or even other universal wavelength. The ultraviolet rays in the past are called infrared
rays while the last ultraviolet rays are called ultraviolet rays. Electromagnetic radiation spectrum is
seen in the Figure 2.1. The UV wavelength range starts at the blue part of the arrangement (400
nm) and at (200 nm) [25].
Figure 2.1. Electromagnetic radiation spectrum [25]
Ultra violet absorption process was occurred when the electron from a lower state jump to
another high state, this process requires some amount energy such as electromagnetic with quite
sufficient energy. The amount of energy can be calculating when a molecule gets and achieved an
enough frequency of ultraviolet, by rely the transmission states from lower level to high level. E1 −
E0 = hυ and
Etotal = Eelectronic + Evibrational + Erotational (2.38)
According to the transition of electron and while UV absorption spectra rise after change of
an electron inside a molecule from an inferior state to an advanced state. The electron in that
molecule experiences a change from minor to a higher state a molecule absorbs UV energy of
frequency. The energy required to the transition can calculate. Thus, the amount of energy of visible
range and energy of the radiation is normally 36 to 72 kal⁄mole although the ultraviolet range is
more than this range approximately is 143 kal/mole [26]. Transition energy states is seen in the
Figure 2.2. The energy is decrease in the following order:

17
Figure 2.2. Transition energy states [26].
2.2.1. The Absorption Spectrum Range
When an analyzer or an example is unprotected to light vitality that matches the vitality
contrast between a conceivable electronic change inside the particle, a segment of the light energy
would be consumed by the atom and the electrons would be elevated to the higher level and attempt
to go a higher energy state orbital. A spectrometer records the level of the retention by an example
at various wavelength and the subsequent plot of absorbance (A) against wavelength (λ) is
identified as a range.
The significant features
1- λmax wavelength at which here is extreme absorption by the atoms particle.
2- εmax the maximum intensity due to the maximum absorption.
Always a molecule was creating by the bonds, each of them has an orbital atom and every
orbital consist and present an electron and they are move around this orbital shell, the level of
energy is orientated like a properly form. Each orbital has a different energy than other orbital. The
atoms and molecules in a bond consume their atomic orbitals compound to form molecular orbitals
which can be possessive by electrons of dissimilar energy states. From the lower level the electron
from ground state molecular orbitals can be transfer to a higher level which means anti-bonding
molecular orbital.

18
Figure 2.3. UV-vis spectrum [27].
Electrons are activated if they are given with vitality with light radiation to form the highest
occupied molecular orbital (HUMO) to the lowest unmanned molecular orbit (LUMO) [27]. UV-
vis spectrum is seen in Figure 2.3. Different molecules can absorb an alternate frequency and
wavelength of light, and if an atom encounters retention of light in bright or clear language in the
electromagnetic range. The wavelength or wavelengths of light consumed by the atomic particle
can be detected. Basically, this is that it shines a light with a range of wavelengths. The wavelength
ranges from about 200 nm as far as possible to 800 nm. This set of wavelengths of light shine
through a sample of exacerbations that gets the absorption range.
If we look at the above figure, we can detect this molecule and the atom accommodates the
maximum force strongly, and the descending landing can understand what the wavelength of light
is absorbed by the maximum force through the molecules or compound. Equal to 300 nm, we call
it lambda max, absorb in the ultraviolet region, do not consume shade, but they are monochromatic
or colorless.

19
2.2.2. Types of Electron Transitions
According to UV-vis spectroscopy, molecule undergoes electronic transition connecting
σ, π and n electrons state. The possibility of the transition of the electron is contained Four kinds.
1. σ → σ∗ transition
2. n → σ∗ transition
3. n → π∗ transition
4. π → π∗ transition
The first type of electron transition starts from σ to σ*, when an electron absorbs the energy in
a σ bond of the raised orbital molecule to extra level or an anti-bond orbital. The process occurs
when the development of electron radiation, it means absorbed energy. The transition of an electron
from σ to σ* requires high energy.
In the second type of transitions, an electron moves from n to σ * state. The electron pairs must
not share saturated compounds. Most of the tips have appeared below 200 nm, which means some
energy is required for this process compared to the previous transition. For example, the peaks in
the U.V area are relatively mild [26].
Transition levels of electron is seen in the Figure 2.4. In the third and fourth transitions there is
u occurring in n → π* and π → π*. The energies
require that the procedures transport the absorption ranges hooked in the spectral area. All of the
above electronic transition directly related to the ultraviolet spectroscopy according to
quantum computational calculation. It can be estimated the transition states of electrons
associated with gaussian09.
Figure 2.4. Transition levels of electron [26].

20
2.2.3 UV Visible Transmittance and Absorption
If the compound of the example molecule has not assimilated the energy of light of an
assumed wavelength, it can express this case as (I = I0). Output UV visible spectrum isv seen in the
Figure 2.5. In any case, in the case that the example compound assimilates the light, at that time I
am below I0, and this distinction could be plotted against the wavelength, it has appeared on the
right side. Ingestion may occur as a transmission (T = I/I0) or light energy absorbance (A= log I0/I).
In the case that there has been no retention, T = 1.0 and A= 0. Many spectrometer pigments show
absorbance in the perpendicular center, and the regularly observed variety is 0 (100%
transmittance) to 2 (1% transmission). The wavelength of the most extreme absorbance light is a
characteristic value, assigned by λ max.
Figure 2.5. Output UV visible spectrum [26].
Various compounds can include high contrast retention and absorption. Adherence to
heavy mixtures is maintained in a weaker order, to determine the vitality of light to be observed by
the site, then this needs the utilization of totally straightforward (non-engrossing) solutions. The
most exceptional regularly appropriated of solvents are ethanol, water, cyclohexane and hexane.
Solvents having triple or double bonds, or substantial Atoms (for example, S, Br, l), are by and
large prepared a strategic from the range. Because the absorbance of a sample will exist
corresponding to its molar concentration in the sample cuvette, a rectified retention worth identified
as the molar absorptivity is utilized after contrasting the spectra of various mixes. Molar
absorptivity is denoted by
ε, ε =A
cl (2.39)

21
where A represented absorption of light when absorbed by the particle in the cuvette, the taster
concentration is denoted by c and the unit of the sample concentration is moles/litre, a distance of
the light way pass through the cuvette is constant and depend on the type of cuvette in (1cm).
2.2.4. Fourier-Transform Infrared Spectroscopy
Infrared spectroscopy is useful for detecting atomic structure and organic compounds such
as the analytical method. We can determine the vibration frequency of a molecule because some
amount of the energy of a photon of light emission is absorbed by the bond atoms.
IR spectroscopy consists of a wide purpose in everyday life nowadays due to the development of
the application of chemical and physical sciences, synthesis identification of compounds,
investigation of organic compounds and classification of functional groups of various fundamental
compounds. It is practiced to determine the development of the reaction between atoms. Extremely
useful for learning and explaining covalent bonds. It is quite necessary to measure the number of
paints and radiate [28]. The most important point for IR spectroscopy and has a strong relation with
physics is used to measuring the rate of transfer in a complex compound.
Wavelength and wave number are expressed by the position of the bands amongst the atoms. At
infrared spectra, wavenumbers (n) are utilized rather than the wavelength (λ), for referencing the
character. Atoms were forming a bond with each different inside σ bond. If both bonds of atoms
caught each other or together have a mutual attraction force because of the existence of a common
electron pair, lies between the bond atoms. Both atoms were not stated at a fixed place and were
moving a limit distance, it means does not remain consistent. 1 crest as this unit has a favorable
location of obtaining through by the energy of radiation (E).

22
Figure 2.6. IR spectrum [29].
IR spectrum is seen in the Figure 2.6. The electrons can move with the motion from forward
and backwards around medium separation, identified the average bond length of the two atoms.
These developments possess a unique character and are named stretching vibrations. The bond
center (characterized by way of the band straightforwardly associate double bond atoms) of one
bond where produce could move forward and backward inside the plane it allows to another bond
or drops forward and backward outside the plane area of motion. These advances are another type
of motion called flexural vibration [29]. Together bending vibration and stretching vibration have
the energy level, it means each vibration denoted by the energy level of a molecule. The difference
between the two energy levels, both stretching vibration and bending vibration represent the
wavelength of the electromagnetic spectrum in an infrared region those going after 2.5 to 15
micrometers (μm; 1 μm = 10-6 m). IR radiation at the peak level absorption is come to descending
since the vertical axis (y-axis or is the transmission of the spectrum that pathing passes through the
molecule sample. IR provides a lot of the essential information structure of the molecules.
The carbon-hydrogen bonds absorb the tensile vibration stretching of IR radiation at 4.4 μm.
Due to the appearance of hydrogen atoms in the C-H bond, a sharp peak appears in the (3.2) μm
range. Most bending vibrations occur in the range of 7 to 25 μm, and the actual absorption of
hydrogen bonds occurs. This region is very, complex because each molecule absorbs the same
amount of IR beam energy and is a unique region, and there is almost no difference between these
molecules. It is valuable for identifying vibration traction. Tensile vibration for C = C can imply

23
see at 6.1μm, but stretching vibration for C = O occurred at 5.8μm. Another functional group for
IR absorption such as C = C and C = O has the same characteristics. The resulting infrared is
important for identifying the types of functional groups existing in an organic molecule.
1450 cm−1 to 4000 cm−1 is the region of the functional group, and the fingerprint started from
500 cm−1 to 1450 cm−1. The area of functional group was comparatively insufficient crests. They
are characteristically related to the stretching vibrations. The stretching vibration is changed from
one to another, and each functional group is different from a narrow range.
For the fingerprint region, all peaks appeared in the range below 1450 cm−1 with in the molecule.
This region is more complicated and very difficult to pick out the bond by bond in the fingerprint
region. The fingerprint region has some advantage because each peak has own unique pattern of
complex compound [30].
2.2.5. IR Absorption of Light Energy
These patterns in absorption can obtain additionally condensed into the accompanying
classifications. In the initial review mentioned above, the whole IR range container is split outwards
into two lines. The left-hand, near over 2000 cm−1, as a rule a moderately formed peak but
exceptionally indicative data can be specified here. To start with alkane C-H extending
assimilations impartial below approximately 3000 cm−1 exhibition the nearness of saturated
carbons, and the colors only indicate unsaturation above 3000 cm−1. An exceptionally wide top in
the district somewhere in the range of 3100 and 3600 cm−1 shows the nearness of replaceable of
positive charge (protons), ordinarily from amine, alcohol or carboxylic, amide corrosive gatherings.
The frequencies range after 2800 to 2000 cm−1 are regularly bereft of different absorptions, so the
nearness of nitrile or alkyne gatherings container be effectively observed here.
Table 2.1. IR Peaks Labeled [31]
Wavenumber range
(cm-1)
Bond type
1500 - 500 A-B
1900 - 1500 A=B
2700 - 1900 A ≡ B
3600 - 2700 A-H

24
It is interesting that the correct part and the exact part of the domain, below 2000 cm−1,
typically contains various pinnacles of changing forces a considerable a lot of which are not
promptly recognizable. Two types which can be seen unmistakably here can obtain noticed is the
carbonyl gathering, which is a solid top round 1700 cm−1, and the carbon and oxygen single bond
with can be a couple of solid tops around 1200 cm−1. This mind-boggling lower district is otherwise
called the "fingerprint region" on the grounds that attractive much every natural compound delivers
a one of a kind examples around there. Therefore character can regularly be affirmed by correlation
of this area to a known range [31].
If the energy like the infrared strikes the atoms and molecules, it produces vibrational
frequency between those atoms and molecules. When an incident infrared frequency is equal to the
original frequency of the atoms bond vibration, it indicates that do not change compared to before.
After that absorption, the IR radiation takes place and will produce the peaks. Most of the functional
groups absorb the characteristic of IR radiation. Henceforth stretches the characteristic peak worth.
As infrared radiation hits atoms and causes one molecule to collide, part of the infrared radiation
means that absorbed by the molecule it affects. Finally, due to the absorbed energy, the vibration
of the molecule increases. After hitting the energy returns to its original state, the excited electrons
return to their original state because the electrons release energy at a given wavelength and are
present in the light spectrum. The unit of frequency scale at the base of the outline is assumed in
components of corresponding centimeters (cm−1) as opposed to Hertz (Hz). Because the numbers
are gradually reasonable. One centimeter of the number of wave cycles is equal; while, frequency
in cycles every second or Hz is equivalent to the number of wave sequences in 3 ∗ 1010 cm (the
separation canvassed by light in one moment). Schematic diagram of IR functional groups region
is seen in the Figure 2.7.
Figure 2.7. Schematic diagram of IR functional groups region [31].

25
A micrometer is the unit of wavelength, microns mean denoted by (μ), rather than nanometers (nm)
for a similar aim. Most comprehensive IR spectra are shown taking place a straight frequency scale
measurement, has appeared.
2.2.6. Electrostatic Potential of Atoms and Molecular
Electrostatics is the fragment of physics that defines interactions between stationary charges.
You are probably acquainted with Coulomb’s Law, the essential rule of electrostatics. This rule
declares that binary charged particles apply a force on each other equivalent to [32]:
F =q1q2
r122 (2.40)
According to equation 2.40, F has represented the electrical force, it is directly proportionate
with the multiply two particles denoted by q1 and q2, but electrical force is contrariwise with the
square distance between these double particles,r1,2. Another valuable property of a charging system
remains the potential energy (V), is designated by PE, but the potential energy (V) remains to
produce when the charged particles are interacting with each other and are equal to:
PE =q1q2
r12 (2.41)
This formula was extremely close to the coulomb’s formula. Both rules have the difference between
them, the potential energy is inverse with the distance of the particles, but in the coulombs rule, the
electric force is inverse with the square distance of the charged particle.
❖ Below is the electrostatic potential map section. Predicting the molecule's strength can imply
predicted using color code. The MEPM destination involves some parts such as:
❖ It is used for specifying the polar and nonpolar on the parts of the molecule.
❖ Comparing the charges between one molecule with another molecule, for getting information
about the product of chemical reaction.
❖ Investigate about the shape of an atoms electron cloud and Revealing irregularities
❖ It is used to know which section has the highest electron density or concentrated and which
region has a lowest electron density or depletion.
❖ Specifying the charge atoms that repel or attract in the molecules. Specify precipitation atoms
that are repelled or absorbed by molecules, The interactions between molecules. These
interactions are also related to the chemical reaction. These interactions as well have a relation
with the chemical reactivity.

26
The electrostatic potential exists generated by the electrons and the nucleus of the atoms,
directly possess an influential relationship with Coulomb’s law. A fundamental concept in
chemistry and physic is that each atom is comparatively electron-rich (negative charge), another
part is approximately electron-poor (positive charge). Electronegativity has described the surface
of the molecule and predicting for the regions, the charges how distributed and how can finding the
majority charge and minority charge at a various region on the molecule surfaces, attempting to
additional quantify this.
Electronegativity and atomic charges cannot be specified by experimentally. It is a problem
to establish the concept. Molecular Electrostatic Potential surface (MEP) remains to identify the
negative charges besides a positive charge. Electrostatic potential on the molecule surface a few
mentioned has a color scale that shows that the negative value and positive value. Viewed as
negative absolute and blue as positive maximum, the red color with negative sign indicates the
minimum electrostatic potential that means it is extra electrons or bound insecurely, and act by way
of electrophilic attack. The maximum electrostatic potential is demonstrating by performances
contradictory. When the electrostatic potential energy is getting a higher value, it means that at this
region exceeding positive charge exists more intense and this region has a low negative charge and
has a weak bond. The positive sign of electrostatic potential map indicates the increased potential
energy value the negative charge was absence, imply a very small electron at this region low
electrostatic potential, defines exist a large number of negative charges and electrons. This property
can apply for the molecule, to describing the polarization of electrons and investigating the charge
distribution [33].
2.2.7. Coulomb’s Law and the Electrostatic Potential of Atoms and Molecules
Suppose that we have two-point charges at a constant position and stable state, these two
charges will remain separated at a distance R. Can determine these separations R. the unit vector is
represented by I, have the same direction with the point charges Q1to Q2.
F =1
4πε0 Q1Q2
R2 i. (2.42)
where ε0is the permittivity of the medium and it is constant, it was changed from one medium to
another, the value of F is positive when the Q1and Q2 have the same sign in the path, and Q1and Q2
are replied each other due to the same sign charge. If the value of Q1and Q2 are different from the
sign direction or reverse to the direction of i [34]. F will remain negative, and the two charges attract
each other another case when the two charges are very far away from each other from infinity
Assume Q2 is moved from unendingness to the division, R can describe the amount of work

27
included (or the interaction energy ∆E) is assumed through;
W = ∆E = ∫ F. dRR
∞= ∫ |F| COSθ|dR|
R
∞. (2.43)
anywhere the angle between the potential force (F) with dR is equal toward θ, dR and R have a
reverse direction. If θ = 1800and cos1800is equal to (-1) then the force must be positive and
repulsive but if the angle between F and dR it means θ = 0°and cos00 make (1), at this time the F
value is negative (attractive).
From the equation 2.42 & 2.43 and integrating we can get the energy formula
∆E =1
4πε0 Q1Q2
R (2.44)
The value of ∆E is not constant, and it changes corresponds to the sign of ∆E > 0, tell us the
direction sign of Q1and Q2 have same sign direction and repel each other energy necessity remain
consumed to transport them together. But if the direction of Q1and Q2 is different from each other
the difference in energy value is smaller than zero ∆E < 0 , and approach to Q2 release energy. We
can calculate the electrostatic potential value V (R) from the separation where it is said by R for the
first time Q1. If the third equation or the interaction energy equation divided by the second time
Q2.
V(R) =1
4πε0 Q1
R (2.45)
where V(R) is not a vector quantity and is represent a scalar quantity has not direction, besides
representing the potential for Q1with another charge Qi providing have a distance R between them.
Q1 and V(R) have a different sign due to the different directions. The value of the strength of the
interaction ∆E of the two charges it equal to ∆E = Qi ∗ V(R). May be had the attraction and
repulsive since directly have a relation with the sign direction between Qi and V(R), when these
two variables have the same or various sign direction. The part of 'electrostatic' reproduces the
reality that’s Q1, the source the potential V(R), is motionless. From the equation 2.45 can simply
be explained for accomplishment electrostatic potential at r point.
V(R) =1
4πε0 Qi
Ri (2.46)
The distance between the electron and the nucleus is represented by (r). The electrostatic potential
is characterized, by the interaction of electrons with nuclei on the surface of the molecule. The

28
movement of the nuclei approximate, zero it implies that not have motion and is a constant because
the mass of an electron is larger than the nucleus mass. But the electron did not have a constant
motion that treats a moving charge point. Given the electron density function ρ (r), one can
determine their average value from each component of the size of dr.
The amount of electron charge in each element can be assumed to remain -eρ(r)dr, the
representation of the electrons implying represented by (-e). To calculate the subsequent
electrostatic potential the conclusion resolves, that a limitless number of charged particles
increases.
V(r) =1
4πε° [∑
ZAe
|RA−r|A − e
ρ(r,)dr,
|r,−r|] (2.47)
The above equation is the law, at the point r for electrostatic potential, the nucleus charge A is
denoted by ZAe, situated at the RA. |RA − r| states to its separation after r, similarly as |r − r| is the
separation of each electronic charge from one to another and increase ρ(r,)dr, from r. For atoms,
the summation in equation 2.47 takes only one part.
The electrostatic potential is denoted by V(r) but, the electrons around the orbital are not having a
constant motion because ρ(r) is the average number over volume element. V(r) following the result
of the nuclei charges and electrons are controlled beyond, maybe consuming a positive and negative
for each value and this potential. For convenience, V (r) can be written in another form with the
term au.
V(r) =1
4πε° [∑
ZA
|RA−r|A − e
ρ(r,)dr,
|r,−r|] (2.48)
The type of positive potential or negative and magnitude of V(r)are the identical it would be a
positive unit and point charge particle located on r with interaction energy of the system, for
instance, a proton.
It has in certainty turned out to be standard to prompt potential V(r) in units of vitality instead of
energy/charge, by way of compares to a potential. From equation 2.48 is assumed in (a.u) of energy,
cab be changing very simply to KJ⁄mol, Kcal⁄ (mol), and another unit. 1 Kcal⁄ mol = 4.184 kJ/mol
and (1 Hartree = 627.5 kcal/mol.

29
2.2.8. Potential Energy
Potential energy is a proportion of the work it needs to move a charged molecule from a vast
separation to a distinct separation in an electric field, where potential energy is zero implies it is in
the origin of the electric field. A molecule at an infinity separation encounters zero power from the
electric field.
𝐸𝑙𝑒𝑐𝑡𝑟𝑜𝑠𝑡𝑎𝑡𝑖𝑐 𝐸𝑛𝑒𝑟𝑔𝑦 = 𝐹𝑜𝑟𝑐𝑒 ∗ 𝛥𝐷𝑖𝑠𝑡𝑎𝑛𝑐𝑒 = 𝛥(𝐹 ∗ 𝐷) = 𝐹𝑖𝐷𝑖 − 𝐹𝑓𝐷𝑓 (2.49)
𝐸𝑙𝑒𝑐𝑡𝑟𝑜𝑠𝑡𝑎𝑡𝑖𝑐 𝐸𝑛𝑒𝑟𝑔𝑦 = 𝐹𝑜𝑟𝑐𝑒 ∗ 𝛥𝐷𝑖𝑠𝑡𝑎𝑛𝑐𝑒 = 𝛥(𝐹 ∗ 𝐷) = 𝐹𝑖𝐷𝑖 – 𝐹𝑓𝐷𝑓 (2.50)
Consequently, the potential energy is exclusively the tracking power on the molecule at the last
separation time, which is the separation of this molecule from the field origins. Accordingly, the
conditions appeared as results, this applies in with the open framework of Columbus's law from
flexibility to the current position. Note that one of the values in the duration of potential electrical
energy is the charged component of the works and over the discharge, the device should be featured.
The defective device in this situation is a test experiment. Also, note that the initial complete energy
is now completely electrostatic potential energy.
Total electrostatic potential energy = ∑ electrostatic potential energy (2.51)
2.2.9. Electrostatic Potential Maps
The absolute energy of a path is the total of the energies of the molecule associating with
each electric field bringing part along the pathway. It requires the whole of nine separate electric
potential conditions to locate the electric potential at a certain point. Each location on the outside
of the parts finds an alternative all-out potential energy. To get an exact type of absolutely the base
energy, assume it would take ten sections for each segment. There are nine parts, ten records for
each segment, and ten counts for every perusing. To locate the all-out scope of potential energies
would take 900 counts. To approach this method, 900 datasets are used. Electrostatic mapping can
be done, but the samples are data-free but constructing pathways that correspond to the specific
regions of the charge components is a complicated process of translating information.
The various ideal appearance to illustrate this knowledge is to describe, requiring the information
onto a model that is comparable to the genuine item to protect the spatial directions of the
information. It would then be conceivable to put the electrostatic potential qualities with their
comparing positions. In any case, it is very arranged to break down the patterns of 900 differential
electrostatic possibilities on an example. To determine this issue, a color code could be combined.

30
MEP maps represent knowledge concerning the formation of a molecule charge including a
difference, of potential electrostatic energy. The transfer of a positive charge on the symmetric
spherical surface of the atom obtains analyzed in Figure 2.8. The amount of electric field of the
nucleus is constant, as it is radically released, a little quantity of the negative particle obtains at
higher electrical energy, giving the impression of a strong positive charge, indicating the presence
of small electrons in this field, the opposite is also true. Spectral limits would be related to
boundaries in electrostatic potential energy, and the color-coded lead would be anything, but
difficult to translate and prepare it.
Figure 2.8. Electrostatic distribution [34].
2.2.10. Electrostatic Potential Map
Electrostatic potential map is actual valuable three-dimensional charts of molecules.
Electrostatic potential map is seen in the Figure 2.9. They important for explain the charge
distribution of charges on the surface of molecule and investigating the properties of molecules.
They permit us to imagine the form and size of molecule. The amount of Electrostatic potential has
a very influential for predicting the behavior of complex molecules.

31
Figure 2.9. Electrostatic potential map [35].
We must be using the color codes, for specifying the charge distribution. Electrostatic
potential color code is seen in the Figure 2.10. The default color scale starts from the red and to
dark blue region. The red color tells us the region have a higher electron density, it means
electrostatic potential is decrease and in lowest level. If looking for the red region in the above
figure we can see at the top surface, very with the oxygen bond.
The most negative potential is hued RED [35]. The best potential is hued BLUE. Middle of the
road possibilities are relegated hues as indicated by the shading range: RED < ORANGE <
YELLOW < GREEN < BLUE In view of this plan, one can more often than not recognize RED
districts of a guide just like the most electron-rich locales of an atom, and BLUE areas of a guide
similar to the most electron-poor districts of a particle. An electrostatic potential guide of a water
particle is appeared as follows, alongside a legend that demonstrates how potential changes with
shading. Note that the RED area is found close oxygen and the two BLUE locales are found close
to the two hydrogens. This implies the oxygen is moderately electron-wealthy in this atom, and the
hydrogens are generally electron-poor.
Figure 2.10. Electrostatic potential color code [35].

32
For clarifying the charge distribution, we cannot explain by mathematical, we must be
obeying the electrostatic potential map. In this principle the red area on the map is represent
negative charge. Blue area on the map represent a positive charge. Green area on the map represent
no charge. This molecule maps has colors but most of the part was green color it means that no
charge and electron density at this region is equal two zero, but at the top layer it has a red color it
means that the charge distribution is very large and most of the charges was collected at that region.
The above map is consist the blue color and represent a positive charge, have lowest electron
density, generally the charges is distributed randomly and not a symmetric, at the same region has
a yellow and most of the middle part is green color, at some regions has a blue color in the discrete
form.
2.2.11. Highest Occupied Molecular Orbital and Lowest Unoccupied Molecular Orbital
In this section, the HUMO and LUMO orbitals of a few reactions will be determined.
HOMO and LUMO orbitals are now recall Lewis-acid base reaction, which is a simply reaction
amongst the highest occupied molecular orbital known as the HOMO one compound and the lowest
unoccupied molecular orbital of a second compound known as the LUMO. We basically have a
pair of electrons gram and other molecular or compound [36].
Figure 2.11. HUMO and LUMO diagram [36].
Figure 2.11. shows the graph of the HOMO and LUMO of an atom. Each circle expresses to
an electron in an orbital; when light of a sufficiently high recurrence is consumed by an electron in
the HOMO, it hops to the LUMO.

33
Many organic molecular molecules, including conjugated electrons, are described by
extensive estimates of primary atomic hyperpolarization, and are dissected through methods of
oscillatory spectroscopy. The result of the interaction of two molecules (or) orbital atoms of new
binary orbital products varies with virgin orbital energy. One of the new orbits produced by the
reaction is higher in bio than the first ones (related to anti-correlation orbital) and the other less
(lower orbital). LUMO, HOMO Energy depicts the ability and ability to obtain a compatible
electron. When one of the new orbital orbitals is loaded through pairs of electrons (Lewis base)
with the other (Lewis acid), we can place the binary electrons in the lowest vitality of the two new
orbitals. The "empty" atoms or molecules react in this way. While being able to interact with
subatomic orbitals, the two that communicate are the highest energy-circulating molecule (HOMO)
and the lowest empty atomic orbital (LUMO) orbital of the compound. These orbitals are a pair or
pairs of orbitals that are not a single orbital in the complex, which enables them to communicate
firmly generally. These orbitals are once in a while called the frontier orbitals, in light of the fact
that they lie at the peripheral frontiers of the electrons of a compound. The energy gap band
reproduces the compound action of the particle. Since the electron is moved from the bottom up,
LUMO is at the top level and since the electronic recipient expresses the ability to obtain the
electron, HOMO indicates the ability to donate the electron. In addition, the low catalyst in the
HOMO and LUMO band gap illustrates the inevitable interactions of the exchange of charge
particles that occur within molecule molecules.
2.2.12. Frontier Molecular Orbitals (FMOs)
To clarify a few sorts of response and for the reaction the most receptive position in
conjugated frameworks, atomic orbitals, and their properties, for example, energy is utilized. The
highest occupied molecular orbital is representing by HOMO and the lowest unoccupied molecular
orbital is representing by LUMO, which is the most significant orbitals in an atom. It creates a
reason, because LUMO and HOMO are the two different orbits that can be incorporated into the
chemical reaction between atoms and molecules. HOMO and LUMO FMOs is seen in the Figure
2.12. These reactions require redistribution of electrons (production and consumption of bonds,
condensation. An atom having a small frontier orbitals gap is progressively polarizable and is by
and large connected with low kinetic energy and high chemical reactivity.
HOMO which can be however as the external orbital containing electrons, will in general
stretch these electrons by way of an electron donor and henceforth the ionization potential is
straightforwardly identified with the energy of the HOMO. Then, again LUMO can acknowledge
electrons and the LUMO energy is straightforwardly identified with electron affinity. Two
imperative atomic orbitals were analyzed for the compound.

34
Figure 2.12. HOMO and LUMO FMOs [36].
2.3. Poly Benzımidazobenzophenanthroline Properties
Poly benzimidazobenzophenanthroline (BBL) is the conjugate polymer. It has important
behavior, for instance, n-type conductivity, great photoconductivity, huge nonlinear optical
properties and the high-level electron empathy between recognized, n-type semiconducting
polymers, which brand the material an intriguing contender for optoelectronic applications.
.
Figure 2.13. Chemical structure of benzimidazobenzophenanthroline (C20H6N4O2) [40].
Chemical structure of benzimidazobenzophenanthroline (C20H6N4O2) is seen in the Figure
2.13. BBL was first coupled between the late '60s in the US as auxiliary material in military flying
by Van Deusen [37, 38], and was attempted by progressively exhaustive searches by Arnold and
Van Deusen [39, 40]. Due to the fragrant ladder-type structure, it is extremely safe against warm
and blends corruption. Deficient cyclization, which can be an aftereffect of the utilization of
polluted monomers, prompts chain scission in firmly essential conditions diminishing the atomic
weight of the material [41]. The BBL has thermal stability and it gradually oxidizes to temperatures
above 500°C but still starts below 700 °C, under warming temperatures. BBL has regulated as a
rule by responding to 1,4,5,8, -Napthalenetetracarboxylic and acid 1,2,4,5-benzene tetramine at
high temperatures in polyphosphoric corrosion. Robotically the response is a polycondensation and

35
does not take into account exact power over the sub-atomic charges or sub-atomic weight
appropriations. In this manner, the average level of polymerization can be controlled to some degree
by modifying the stoichiometry of the beginning materials.
Arnold and Van Deusen considered the properties of BBL on the mid 70's utilizing mostly
films arranged either by throwing from acid arrangements or gathering scattered stringy accelerates
on a frit pursued by drying [40]. Both of the approaches are to deliver solid films. BBL can
furthermore obtain produced into strands utilizing methane sulphonic acid as dissolvable since
established BBL analogues utilizing combined ring tetramines as the other monomer and
demonstrated that BBL has better film-forming properties. [42]. The logical enthusiasm for BBL
was restored at mid80's as the conjugated structure proposed that it could be dopable into a
semiconductor. The considers on the semiconducting properties of BBL demonstrated that the
conductivity can be expanded by a few requests of extent from the underlying protecting locale of
10-12 S/cm of the unblemished polymer to the semiconducting locale of 10-2-102 S/cm by doping
either synthetically or electrochemically [43, 44]. Irvin et al demonstrated that the electrochemical
reaction of BBL films can remain upgraded by expanding the film porosity by co-throwing BBL
with an ionic fluid in MSA. [45]. Particle implantation of BBL films utilizing Kr+ or Ar+ was
appeared to increase the conductivity up to 102 S/cm, yet high portions brought about the corruption
of the polymer stepping stool structure. Dissimilar to many conjugated polymers BBL can be
artificially doped to both p-type semiconductor utilizing solid acids or certain Lewis acids and to
n-type utilizing natural potassium or potassium naphthalide. In any case, it isn't doped successfully
by I2 or Br2, however, can be prepared into the semiconducting area utilizing warm tempering. BBL
has likewise been appeared to be photoconductive [46].
High electron proclivity of BBL has been used in parallel mixes of BBL and p-type directing
polymers as charge exchange between the polymers could be initiated either by radioactivity with
light [47], electrochemically [48], or thermally [49], prompting critical increment in the
conductivity of the mix. Polypyrrole (PPy) was appeared to show conductivity up to 10-6 S/cm with
little extent of PPy even before the light actuated electron exchange [48]. Subsequently, BBL-PEO
square copolymers, which have been used to align the donor-donor composite layers with
electrolyzed poly (BBL) films, have also been used in binary mixtures with graphene and graphene
oxide. However, much of the electrical conductivity led to a cross-section of graphene sheets [50].
Advanced BBL was, utilized as a grid material in photograph decrease of graphene oxide in movies
made of BBL graphene oxide twofold mixes [51]. Hong et al. considered the electronic structures
of n-doped BBL hypothetically and suggested that up to 4 electrons could be added to each
rehashing uni [52]. The stepping stool type spine powers the polymer into a coplanar structure
which has been appeared to result in non-linear optical properties [53]. The n-type conductivity
properties, strict planarity of the chain and power of the polymer have been the primary inspirations

36
in the investigations of BBL regardless of the challenges associated with preparing it. So far BBL
has been appeared to work as electroactive material in various photovoltaic gatherings [54, 55],
photodetectors [56], capacitors and unique transistor gatherings [57,58].
BBL molecule can be decreased (n-doped) electrochemically and appears different decrease
states. BBL bang gap is very large more 2 eV without any doping fundamentally undoped. This
conjugate ladder category polymer can be utilized like both n-type and p-type semiconductor. Its
electrochemical properties have been generally considered and n-type conduction has brought
enthusiasm up in its utilization in organ electronic gadgets. It has been exhibited to function as an
n-conductive material in organic transistors, photovoltaics also, photodetectors and has been
appeared to be electrically dynamic in a composite material framed with a p-type polymer [59]. In
most cases, BBL is handled from methane sulfonic corrosive or nitromethane/ Lewis corrosive
arrangements which are destructive and introduction to stickiness in air promptly accelerates the
polymer [60]. Sonication was likewise utilized by Briseno et al. who scattered BBL in chloroform
and methanol as nano belts [60]. In both cases the conventions contain numerous means and
utilization of poisonous solvents. The DC conductivity of BBL has been accounted for to be in the
scope of 10-10 -10-12 S/cm depending upon the preparing conditions and the type of the samples
[61]. BBL is for the most part arranged by reacting napthalenetetracarboxylic corrosive and
benzenetetramine at raised temperature in polyphosphoric acid, in spite of the fact that it can
likewise be set up in dissolve. In the polymerization react, a polyimide is shaped first [62]. This is
trailed by intrachain cyclization which shapes the conjugated aromatic structure.
All the more as of late, because of conjugate and its electronic conjugation, the chemical structure
was shown in the Figure 2.13, BBL molecule has gotten to be a good semiconductor and as a
conductive and nonlinear optical substantial. Unblemished BBL is not a semiconductor molecule
and in a room temperature, conductivity of BBL is approach to of 3*10-10 S/cm. A solid state term
beginning in the photograph conductivity, the conductivity was rise up and comfortable is apparent
with an excitation energy of about 1.9 eV [63], and electrochemically doped tests exhibit the
electrical conductivities as high as 20 S/cm. BBL likewise has good electrical possessions, in that
it can be use like a reversibly n-doped reduced. moreover, artificially or electrochemically to wind
up electrically conductive and can use to construct a part of pigments. A few examinations have
demonstrated that BBL's electrical conductivity increments more than 10 requests of extent after
doping. Particle implantation has brought about conductivities on the request of 200 S/cm. Due to
its mechanical and rigid road planar and electrical properties, BBL has more potential use in
submissions that include conductivity [64].
A precise investigation of BBL's conductivity remained achieved by two scientist Murray and
Wilbourn Murray who analyzed electrical conductivity property as a component of doping
potential. Main assumptions remained that

37
1. greatest conductivity happens when the grouping of dopant negative charges is one electron
for each two rehash units.
2. direction of electrons has a motion and move drift [65] in reaction to an electric field
according to Ohm's law. In dry examples, yet, they move by dispersion in dissolvable swelled
examples. The inward electric field is diminished due to the polarization or divergence of
counterions.
Because BBL has a different characteristic, most of researchers published investigations such as
conductivity of BBL at the pristine is equal to 10-12 S/cm [66]. BBL can be doped using krypton,
boron, argon implantation by ion [67]. BBL can be degraded or oxidized including electron
acceptors and donors chemically [68]. Kim detailed of BBLs doping chemically include strong
acids such as MSA, reductants, oxidants and obtained has high electrical conductivity about 2 S/cm
[67]. But Jenekhe declared the BBL conductivity raise up to 20 S/cm by the reduction (n-doping)
electrochemically [69]. In a different article, Wilbourn and Murray investigated on the films
wherewith the conductivity of BBL changes including potential through electrochemical reduction.
The result of their investigations displayed the electrode potential related to conductivity and
demonstrated two heights that vary by approximately 10 rates in conductivity [43, 70]. Color of
BBL is different in different solvents and phases such as will appear deep red in sulfuric acid
solutions, in aqueous alkali solvents will appear brown and it is black at solid-state [39]. The
absorption of BBL in photocurrent precedes whereas a function of energy exhibited the broad
approximately the band layer in contradiction to the clear and sharp absorption edge about 1.68 eV
[63].
2.3.1. Polymer Characteristics
There are more than 100 conductive polymers in this word, some polymers are naturally
present in this word, and some polymers can be achieved by chemical interaction between atoms
that have been blended by scientific experts with a wide range of explicit electrical connections.
Many of these polymers are ideal and suitable for the manufacture and manufacture of electronic
tools. The conducting of semiconducting properties and polymers has the potential to synthesize
materials in a wide area such as solar cells and film preparation, and capacitance such as n-dopant
and p-dopants can be used, which means participation in electronic dyes [69]. In this thesis, we
investigate the BBL's electrical conductivity. The creation of electronic and microwave instruments
can be achieved by using these extraordinary polymers that are impractical with state-silicon or
gallium arsenide. Large-scale adaptable electronic intersections can be created. Polymers especially
BBL have a low thickness, so the conductivity to weight ratio can be better than minerals. Optical
straightness remained with electrical conductivity had been achieved.

38
Polymers are extremely important and occur in wildlife and the entire container to help clear
requirements. Manufactured polymers were present in nature in various forms and can be three-
dimensional systems that have not yet melted their formation. Some systems are called thermal
polymers. One of the polymer applications such as epoxy pitches used in two-part adhesives is
thermoplastics. Manufactured polymers have some special properties such as, one-dimensional
chains can also liquefy. These chains are thermoplastic polymers because they are complex and not
a simple chain similarly called linear polymers. Plastic containers, cup films, yarn and fibers are
another sample of thermoplastics [70, 71]. Polymers in the word has a particular behavior but most
of the polymers have following general attributes and BBL have the same characteristic with most
of them.
1. Polymers can be affected by artificial concoctions. Consider all the cleaning fluids in your
home that are assembled with plastic. By looking at the notice signs depicting what happens
when the compound interacts with or is taken up by the skin or eyes, it will emphasize the
requirements of artificial blockage in plastic beams. While solvents effectively disintegrate
some plastics, various plastics provide safe and fragile packages for strong solvents [72].
2. Polymers can be use like electrical insulator and thermal. A stroll through your home will
strengthen this idea, as you think about every one of the apparatuses, ropes, electrical outlets
and wiring that are made or secured with polymeric materials. Thermal resistance is obvious
in the kitchen with pot and container handles made of polymers, the espresso pot handles,
the froth center of iceboxes and freezers, protected cups, coolers, and microwave cookware.
The warm clothing that numerous skiers wear is made of polypropylene and the fiberfill in
winter coats is polyester and acrylic, that exist in many other things in the home furniture
[73].
3. For the most part, polymers are exceptionally lightweight with remarkable degrees of
solidarity. Think of the range of uses, from toys to the structure of the chamber terminals, or
from delicate nylon fibers in pantyhose to Kevlar, which are used in impenetrable jackets. It
is very important for a military man and woman. A few polymers drift into the water while
others sink. However, unlike stone, steel, steel, copper or aluminum, all plastics are
lightweight [74].
4. Polymers can be handled in different ways. Expulsion creates fine filaments, films, feeding
bottles or overwhelming funnel. The infusion beautification can offer extremely baffling
parts or enormous composite body panels. Plastics can be formed into drums or mixed with
solvents to move into glue or paint some polymers that have a high static stability that
remains in warm air and maintains the composition of the compound which is very important
for coating. Synthetic rubber has a few stretch plastics and is really adaptable. A few plastics

39
is prepared in preparation for holding its shape, for example, pop soda containers. Different
polymers such as polystyrene, polyurethane and polyethylene can permeate [75].
5. Polymers are materials with a seemingly limitless range of qualities and shapes. Polymers
have many innate properties that can be further upgraded through a wide range of additives
to expand their uses and applications. Polymers can be made to copy cotton, silk and wool
threads. Porcelain and marble. And aluminum and zinc. Polymers can similarly make
potential elements that do not immediately arise from the natural world, for example, pure
leaves and adaptable films [75].
6. Polymers are generally made of oil, but not in general. Abundant polymers are made from
rework units obtained from petroleum gas, coal or unrefined oil. Either way, repeated square
units can be built now and again using sustainable materials, for example, cellulose of cotton
or polylactic acid of corn or. At the point where structural squares can be made of material
more sustainable than petroleum derivatives, old plastics can find new raw materials or
innovative plastics [76].
7. Polymers can be used to make things that do not contain different materials. Polymers can
be used in sharp illustrations or water or rain resistant films. PVC is used to manufacture
restorative tubes and blood packs that extend the time frame for the possibility of real use of
blood and blood elements. PVC is safely transported with flammable oxygen in consumable
pipes. What's more, anticoagulants, such as heparin, can be incorporated into adaptable
plastic catheters for the medical operation of open heart, dialysis and blood accumulation.
Many medical instruments rely on polymers to allow convincing action [77].
According to the physical properties, polymers have some properties such as molar size,
crystallization of the molecular density of materials, polymerization and some other properties.
In the polymer chain, quantum repetition units remain represented by the degree of polymerization
indicated by (DP) -n in the polymer molecule. For instance, BBL [C20 H6 N4O2]n. Multiplication
between the weight molecule of the re-polishing component with the polymer gradient is called the
molecular weight of the polymer molecule.
The BBL molecule is an aromatic compound, and it has another behavior that includes certain
properties different from other compounds and most polymers have general features such as:
1. Fragrant mixes are cyclic mixes in which all ring particles take an interest in a system of
bonds, bringing about uncommon strength.
2. Alkenes are high responsive than the aromatic compounds, making them helpful modern
solvents for nonpolar mixes.
3. The aromatic compounds can be extracted from the oil and derivatives of petrol and coat tar.
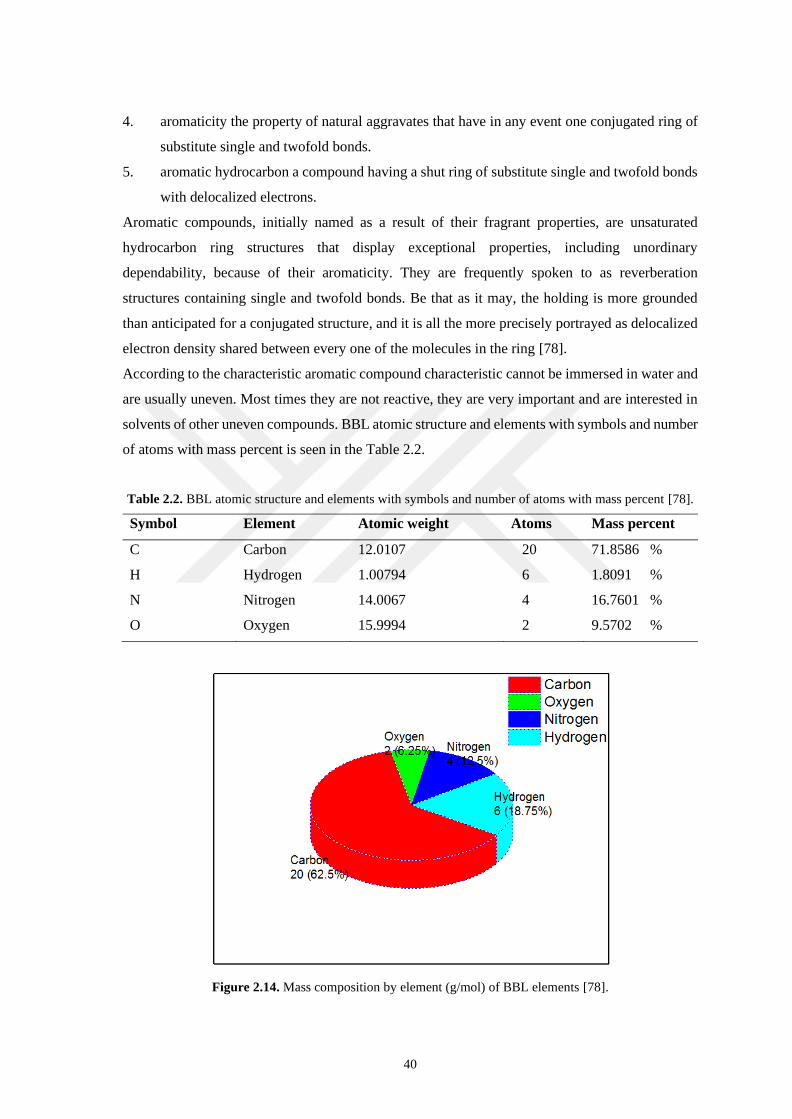
40
4. aromaticity the property of natural aggravates that have in any event one conjugated ring of
substitute single and twofold bonds.
5. aromatic hydrocarbon a compound having a shut ring of substitute single and twofold bonds
with delocalized electrons.
Aromatic compounds, initially named as a result of their fragrant properties, are unsaturated
hydrocarbon ring structures that display exceptional properties, including unordinary
dependability, because of their aromaticity. They are frequently spoken to as reverberation
structures containing single and twofold bonds. Be that as it may, the holding is more grounded
than anticipated for a conjugated structure, and it is all the more precisely portrayed as delocalized
electron density shared between every one of the molecules in the ring [78].
According to the characteristic aromatic compound characteristic cannot be immersed in water and
are usually uneven. Most times they are not reactive, they are very important and are interested in
solvents of other uneven compounds. BBL atomic structure and elements with symbols and number
of atoms with mass percent is seen in the Table 2.2.
Table 2.2. BBL atomic structure and elements with symbols and number of atoms with mass percent [78].
Symbol Element Atomic weight Atoms Mass percent
C Carbon 12.0107 20 71.8586 %
H Hydrogen 1.00794 6 1.8091 %
N Nitrogen 14.0067 4 16.7601 %
O Oxygen 15.9994 2 9.5702 %
Figure 2.14. Mass composition by element (g/mol) of BBL elements [78].

41
Like every polymers BBL have four atoms and Figure 2.14. Mass composition by element (g/mol)
of BBL elements explain the number of elements that are participate to create the polymer of BBL
with the ratio percent of each atoms. Formula in Hill system is C20H6N4O2.

3. RESULT AND DISCUSSION
Potential static electricity maps are three-dimensional schemes of atoms. It enables us to
visualize the charges of dispersing atoms and charging particle-related properties. It also enables
us to visualize the size and state of molecules. In natural sciences, potential maps of static electricity
are valuable in predicting the behavior of complex particles.
Potential maps of molecular static electricity show data on particle charge dispersion. Potential
maps of static electricity pass the charge distribution data of an atom due to the properties of the
nucleus and the nature of the electrostatic voltage energy. For safety, consider transferring a
charged test charge undoubtedly along the surface of the circular molecule. The steadily charged
nucleus emits from a radial static electric field. A higher-than-normal ESP appears near a more
positive charge or a weaker negative charger. The voltage map is a three-dimensional map of real
value for molecules. It is important to explain the charge distribution of charges on the surface of
the molecule and to verify the properties of the molecules. They allow us to imagine the shape and
size of the molecule. The electrostatic ability is very strong to predict the behavior of complex
molecules. The result of gaussian09 is explained by the potential map of the static electricity
obtained and the distribution of distributions to BBL molecules on the basis of three different bases,
dedicated to both HF and DFT. Another important element in MEP is to explain and display
electronegativity on the surface of particles with polarized charges.
For each basis have the same result, the different of charge distribution of each atom of a BBL
molecule approximately is the same. We must be using the color codes, for specifying the charge
distribution. The default color scale starts from the red and to dark blue region. The red color tells
us the region have a higher electron density, it means electrostatic potential is decrease and in lowest
level. Electrostatic potential map of C20H6N4O2. Using 6-31G Hartree-Fock approximation basis
set is seen in the Figure 3.1.
Figure 3.1. Electrostatic potential map of C20H6N4O2. 6-31G Hartree-Fock approximation basis set.

43
Figure 3.2. Electrostatic potential map of C20H6N4O2 by using 3-21G Hartree-Fock approximation.
Figure 3.3. Electrostatic potential map of C20H6N4O2 by using 6-311G Hartree-Fock approximation.
Figure 3.4. Electrostatic potential map of C20H6N4O2 by using 3-21G DFT.

44
Figure 3.5. Electrostatic potential map of C20H6N4O2 by using 6-31G, DFT.
Figure 3.6. Electrostatic potential map of C20H6N4O2 by using 6-311G, DFT.
The above figures are the output result of gaussian09 program to calculation the electrostatic
potential map and electronegativity for Hartree-Fock approximation and density functional theory,
examined three different basis set (3-21G, 6-31G, 6-311G) respectively according to arrangement
of figures. If looking for the red region in the above figure, we can see at the top surface, very with
the oxygen bond. Electrostatic potential map of C20H6N4O2 by using 3-21G Hartree-Fock
approximation is seen in the Figure 3.2. Electrostatic potential map of C20H6N4O2 by using 6-
311G Hartree-Fock approximation is seen in the Figure 3.3. The red area is the smallest region that
occupied the charge distribution of the BBL. The most negative charges are collected in that region.
About the green color, Green is always a potential mediator between predominance (red and dark
blue). Green occupies approximately the surface of the edge of the molecule and pretends to be
surrounded by the outer surface edge. Electrostatic potential map of C20H6N4O2 by using 3-21G
DFT is seen in the Figure 3.4. The BBL molecule, which mediates the positive and negative charge

45
distribution is understandable. The center of this molecule has a huge blue color. This is the second
line to fill the surface of the molecule. Aqueous coding details are potentially more electrostatic
due to the scarcity of electrons available. It tells us that there is a positive charge and hydrostatic
power of BBL molecule is divided into two parts, by multiple layers in the foreground or between
them and green the cover hydrogen bonds. Electrostatic potential map of C20H6N4O2 by using 6-
31G, DFT is seen in the Figure 3.5. The final yellow color does not appear with a large party it only
splits colors and appears in some places above the oxygen atoms. The yellow description is very
close to the red distribution of loads, which means there are negative loads, but negative loads do
not have the same red effect in the center between green and red. Electrostatic potential map of
C20H6N4O2 by using 6-311G, DFT is seen in the Figure 3.6.
The electrostatic potential in three dimensional at a point (x, y, z) is assumed by potential energy
between the molecule and a fantasy charged (+1) ion situated at (x, y, z). the potential is negative
if the ion attracted to the molecule. The potential is positive if the ion is repelled by the molecule.
At the red region ion has +1 charge and this region attracted the electron and it will be electron-rich
region of the molecule. At BBL molecule the red region is surrounded by the oxygen atom at the
middle layers and edge side and red color dominated, in the fact that it is very little region and it
means highest electron negativity. At another of two regions the other colors were appeared like
green and light blue and yellow, it is very obvious the most region is blue and green respectively it
means very big part is positive potential due to absence electron and ion it has -1 charge it will not
attract to electron-rich. The charge distribution is not uniquely. Be attention looking the
electrostatic potential map of BBL the hydrogen atoms are repelled.
The BBL molecule was consist four atoms, each of atoms has a different for electronegativity (O >
N > C > H >), according to periodic table order the oxygen atom is highest electronegativity but
hydrogen is lowest electronegativity increments from base to top in a section in the periodic table
despite the fact that there are more protons in the components at the bottom of the column. Periodic
table with electronegativity of atoms is seen in the Table 3.1. Components at the highest point of a
section have more prominent electronegativities than elements bat the bottom of a given column.
Oxygen has a higher electronegativity esteem than other atoms.
Table 3.1. Periodic table with electronegativity of atoms.

46
Oxygen atoms would subsequently have a higher electron density around them than other
particles. Along these lines the round district that compares to an oxygen particle would have a red
bit on it. Presently note that there are two oxygen molecules in carbon and nitrogen and hydrogen.
There are two circle formed articles that have red locales. These zones compare to the area of the
oxygen particles. The blue polluted circle at the top relates to the area of the hydrogen atoms.
Electroconductivity is absolutely unrelated to electronegativity. As a matter of first importance
electronegativity has meaning just when an atom create bond with a unique component.
Electroconductivity alludes to a bulk property of a component or a compound. Particles on the
upper right sideways according to periodic table periodic table are the maximum electronegative,
while molecules on the base left sideways are electropositive. By way of you move from left to
directly along the periodic table, the components become increasingly electronegative in light of
the fact that they are picking up protons in their nuclei.
The electronegativity values of BBL molecule for Oxygen, Carbon, Hydrogen and Nitrogen are
3.44, 2.55, 2.2 and 3.04, respectively. The output result for each basis set is satisfied with the
theoretical value of periodic table.
We should investigate BBL for a moment. BBL contains four atoms, six hydrogen atoms, two
oxygen, four nitrogen’s and twenty carbons. While oxygen has 6 electrons and 6 protons, every
hydrogen has just a single electron and one proton. Every atom has a parity of charges; however,
valence electrons are shared between the four iotas. Oxygen is said to be more electronegative than
hydrogen or other atoms, on the grounds that those 6 protons at its nucleus characterize a densely
packed concentration of positive charge. Hydrogen's single electron is imparted to oxygen, yet the
electron is drawn far from hydrogen's nuclei towards the oxygen.
As carbon is the primary component of the fourth gathering of periodic table, the outer shell of
carbon consists four valence electrons, which can all be, used during bond arrangement. Along
these lines, C doesn't have any lone pairs of negative charge. Nitrogen, then again, is the first
component of gathering 5 and has 5 valence electrons. Three of these can be utilized during holding,
while the staying two structure a lone pair. Nitrogen, is situated in gathering 15, which implies that
it has 5 valence electrons. As you probably are aware, nitrogen exists as diatomic atoms, N2. Every
nitrogen particle comprises of two molecules of nitrogen that are fortified by a triple covalent bond.
As you go down the periodic table Figure 3.7. Valence electron atoms of BBL molecule,
components increase still more protons. In any case, each shell of electrons additional to the
component shields the hidden nucleus through a layer of negative charge.

47
Figure 3.7. Valence electron atoms of BBL molecule
At each of the basis for HF and DFT is confirmed with the real electronegativity of BBL
molecule. Because at each basis set the Oxygen atom is high level in electronegativity by
considering the Error! Reference source not found.
3.1. Determination the Band Gap
The band gap energy amongst the conduction band and valence band exist at every
semiconductor and insulators material. The size of the band gap directly depended on the absorption
of light where absorb by the valence band electrons. If the difference between HUMO and LUMO
is large, it means more energy required to occur transition and change the state of molecular from
the insulator to conductor. Other factors contributing to the separation of the HUMO and LUMO
states, such as the distance between the electrons and the separation between them, are the other
cause of the electrical atoms of the element. The small bandwidth is due to the large order between
large interatomic arrangement, and small changes in electronegativity.
Used three different bases set for each method density functional theory and Hartree-Fock
approximation. BBL has 32 atoms, DFT and HF are suitable for application on this molecule
because it is not a complex. The type of basis set is the most significant to calculation. Can
determine which basis set is comfortable to BBL because the output result of HUMO and LUMO
is different to each basis sets (6-311G, 6-31G, 3-21G). The band gap for the
Poly(benzimidazobenzophenanthroline) is equal to the difference between the HOMO and LUMO.
The value of HOMO and LUMO are 0.32525 and 0.05695, respectively. The below figures show
the HOMO and LUMO. The distinction in vitality between these two wilderness orbitals can be
utilized to anticipate the quality and strength of progress metal buildings.
The value of band gap energy is represented by ∆𝐸 is equal to the 0.29555 eV for BBL molecule
by using the Hartree-Fock method and 3-21G bases set, in Gaussian program. By change the unit
value of band gap just for simplicity and convenience are equal to the 8.22661091 and this value is
very different and very far from the real or experimental value.

48
Figure 3.8. HUMO and LUMO of BBL molecule for HF approximation 3-21G basis set.
Because the Hartree-Fock approximation is not very accurate for some molecular
calculations for example for, complex molecular and the number of electrons directly have an
obvious relation with the result, because of the Hartree-Fock method not successes in exchange and
correlation case.
The real value of HUMO and LUMO for BBL are 5.9 and 4 eV, respectively. HUMO and
LUMO of BBL molecule for HF approximation 3-21G basis set is seen in the Figure 3.8. The band
gap energy is equal to 1.9 eV. But according to Figure 3.8, HUMO and LUMO of BBL molecule
for HF approximation to 3-21G basis set and the band gap of BBL molecule are very large, and
they are impossible and incorrect values. The shortcoming is equal to the 5.4007113 eV due to
some other factor such as exchange and correlations were neglected by HF approximation. The
result of the 3-21G basis set is not accurate if compare with other basis sets. Each of the basis set
consist of some special property and is different from another. The BBL has 175 electrons. The
density functional theory may be more suitable and accurate than the HF. In this section,
calculations were made for some basis set after that we estimated the values of band gap energy
because the pristine of BBL is an insulator but it can become a semiconductor at room temperature.
But according to this basis set for HF approximation, it is impossible and remains insulator
molecule.

49
Figure 3.9. HUMO and LUMO Hartree-Fock 6-31G basis set
Each of the basis set has a limit for calculation. According to Figure 3.9. for HF
approximation of 6-21G basis set the band gap value is equal to 8.3948995 eV. According to this
basic set, the BBL molecule can become a semiconductor, because the distance between HUMO
and LUMO is more than 8 eV, more energy required to transition of electrons and change the state
of the molecule's electron. Because the BBL pristine is insulator but can be used p-type and an n-
type semiconductor, absolutely must be neglect this basis set. For instance, if BBL participates to
the material structure may be destroying the pigment, due to the hitting energy and warm the
pigment, due to the high temperature of the instruments but it is impossible because the large
separation between the conduction band and band gap require a large amount of energy. The error
ratio is equal to 6.4948995 eV. According to the quantum computational, this basis set is more
accurate but has more error ratio than another basis set.

50
Figure 3.10. HOMO and LUMO for Hartree-Fock at 6-311G basis set
The values of HUMO and LUMO based on a 6-311G base group are 0.33274 and 0.03540
eV, respectively. The band gap energy associated with Figure 3.10 equals 8.09109714 eV. The
error in this main set is at the lowest level compared to any other basis set for the HF method. The
factors of the Hartree-Fock conditions intensively rely upon themselves, so they should be tackled
iteratively.

51
Figure 3.11. HUMO and LUMO for DFT at 3-21G basis set
Density functional theory is more precise than HF approximation, it can obtain if look the
output result of HUMO and LUMO and compare the result. Figure 3.11 shows the HUMO and
LUMO of 3-21G basis set of DFT. The values are equal to 0.24541 and 0.21188 eV, respectively
and band gap value is equal to 0.91238483 eV. The output result according to this basis set is
possible, actually has some error ratio because the real value is equal to 1.9 eV and the error ratio
is equal to 0.98761517 eV. But it does not mean this basis set in not comfortable to the calculation
of BBL molecule. But the difference between the HF and DFT for the same basis set is very large
and very close to real value.
According to DFT and 3-21G, the BBL molecule can be semiconductor because the distance
between the valence band and the conductive band is very small. BBLs containing 32 atoms and
175 electrons have interactions between electrons. The exchange and bonding effect are very high.
Fortunately, the variables in the functional density theory equations do not depend on themselves,
but the HF approximation depends on the variables of the equation, the field of self- consistency.

52
Figure 3.12. Band gap energy between HUMO and LUMO for DFT 6-31G basis set
Figure 3.13. Band gap energy between HUMO and LUMO for DFT 6-311G basis set
The accuracy of the base set is varied. The large base set is accurate. The size of a molecule
is very important for the base set in the Figure 3.12. The result of the gaussian09 program with the
applied density hypothesis applied to the base 6-31G gives the HUMO and LUMO (0.25023 and
0.14524 eV, respectively). The gap band energy is 2.85688289 eV. The band width energy of the
BBL molecule is possible using the DFT method to accept the research. This value is not real but

53
very close, and the error is relatively small. The error ratio is 0.95688289 eV. According to this
basis set, the BBL molecule can be semiconductor because the capacitance and transmission band
are very small and are reliable for switching from insulator to semiconductor. Most errors and
deficiencies in the results are values depending on the basis set type. Theoretical reviews in this
thesis are verified and validated by quantum computation theory formulas for the set of principles.
6-311G is a large basis set in this thesis for investigation about the optical properties of the BBL
molecule. The output results of DFT in the Figure 3.13 for HUMO and LUMO are equal to 0.25899
and 0.15235 eV, respectively. The band gap value is equal to 2.90184502 eV.
The disadvantage of DFT is that no one knows how to use and improve a particular DFT account.
This seems to differ from other approaches because of the expert can guide on how to develop the
results additional until Schrödinger's specific electronic problem is resolved. The reason everyone
uses DFT is that it has very accurate economic results compared to some economic calculation
systems.
A molecular orbital is the arrangement of molecular orbitals coming about because of the cover of
atomic orbitals. The two new orbitals which are shaped from the association of two atomic orbitals
are antibonding and stabilized bonding orbital. The antibonding orbital is destabilized and has
higher energy than stabilized bonding orbital.
Table 3.2. Band gap energy of BBL molecule for different basis set at B3LY level.
Method HOMO (a.u) LUMO (a.u) 𝐄𝐠(𝐚. 𝐮) 𝐄𝐠(𝐞𝐕)
HF
3-21G 0.32894 0.02662 0.30232 8.22661091
6-31G 0.32787 0.03242 0.29545 8.3948995
6-311G 0.33274 0.03540 0.29734 8.09109714
DFT
3-21G 0.24541 0.21188 0.03353 0.91238483
6-31G 0.25023 0.14524 0.10499 2.85688289
6-311G 0.25899 0.15235 0.10664 2.90184502
The resolution of the BBL molecule may be a semiconductor or not related to the amount of band
gap energy. The values of HF and DFT are different because all values in DFT are less than 3 eV
and indicate that BBL is a good semiconductor. But if we look at the HF values away from the DFT
energy band gap, it becomes impossible to become a semiconductor. Band gap energy of BBL
molecule for different basis set at B3LY level is seen in the Table 3.2.

54
3.1.1. Fermi Level of BBL
The Fermi surface is known as the various important atomic orbitals involved in the valence-
K band so that in the presence of metal, different levels are available for accepting electrons. It is
worth noting that this is not the case for semiconductors because capacities and conference groups
are separated. There is the Fermi-Level in the band gap along these lines. It tends to be found in
Figure 3.14. The probability of controlling the energy level depends on the form used.
Figure 3.14. The position of fermi level in semiconductor label
To determine the electron in energy state it is probability, depend on the temperature, can
express by mathematically.
f(E) =1
1+e(E−EfKBT
) (3.1)
where KB = 1.38 ∗ 1023 JK−1, KB represent the Boltzmann constant, T is the absolute temperature.
Substitute E instead of Ef, can get by applying to above first equation.
f(E) =1
1 + e(E−EfKBT
)=
1
1 + e0
f(E) =1
1+1=1
2 (3.2)
This indicates that the Fermi level is a surface which it can obtain predicted that the electron
will be available exactly half of the time. The diffusion function is to pretend only the probability
density function that can apply to a specific energy level to indicate, the probability of a particular
molecule. Shortly, it is very obvious to determine the Fermi energy level of BBL at the pristine, by
using the result of HOMO and LUMO for each basis sets of HF approach and DFT. Intrinsic
semiconductors material are pure semiconductor which has no polluting characters at inside them.
Therefore, they are characterized by an equivalent probability of finding band gap energy as that

55
of an electron. This, in development, indicates that they have the Fermi-level, precisely in the
middle of the conduction and valence band.
Figure 3.15. Natural diagram of semiconductor
The intrinsic semiconductor the fermi level is in the middle of the valence band and
conduction band as seen in Figure 3.15. The BBL molecule can be used similar p-type
semiconductor and an n-type semiconductor it indicates the Fermi energy level is not constant. The
level of Fermi level depends on the amount of donor and acceptor. Fermi energy level of BBL for
different basis set of HF and DFT is seen in the Table 3.3.
Table 3.3. Fermi energy level of BBL for different basis set of HF and DFT.
Method Basis set Ef = 𝐄𝐠/𝟐(𝐚. 𝐮) Ef = 𝐄𝐠/𝟐(𝐞𝐕)
HF
3-21G 0.13415 3.65035565
6-31G 0.147725 4.19744975
6-311G 0.130145 3.413756
DFT
3-21G 0.016765 0.45619242
6-31G 0.052495 1.42844144
6-311G 0.01389 0.3779912
Each bond orbitals have negative energy, while all anti-bonding orbital will produce positive
energy, but agree with the HUMO and LUMO results of the BBL molecule. This is because the
zero-energy value is known as a non-bonded state, the bond orbital is gradually stabilized below
zero, while the bond-related orbital of energy is less stable than zero. Most non-bonding orbitals
are almost at zero energy. The outcomes demonstrate that the HOMO is steadier than the LUMO,
and the gap has a positive worth. LUMO occupied the lowest energy than the HOMO for every
situation. The negative sign is restoring to the HOMO is higher state vitality than the LUMO, which

56
remains incredible in the ground state and at the same time my system is excited.
Low band gap conjugated polymers are popular in electronic devices because of their natural
conductivity and are used in addition to toys, such as solar cells and LEDs. The band gap in
conjugated polymers is represented by their compound structures. At the subatomic level, Eg is
related to the adiabatic change energy. Pure DFT (BLYP) produced with a respectable exercise,
absolute error is of 1.22 eV with base set 6-311G, 0.768 eV with base set 3-21G and 1.17 eV with
base set 6-31G. As predictable, the (RHF) energy band gap of BBL conjugate polymer
overestimates associated with investigational worth because of the abundance the correlation
contribution or exchange and correlation effect between the electrons. The enhancement of the band
gap is found in applying a first three basis sets, the absolute error is 6.5466, 6.71489, and 6.41109
eV with 3-21G, 6-31G and 6-311G basis set, respectively. One important of the fundamental
objectives of the polymers according to the field of electrically conducting is to have a total
comprehension of the connection transport amongst the substance construction of the chemical
material polymer and its electronic properties and conduction possessions.
3.1.2. Fourier-Transform Infrared Spectroscopy (Infrared)
Infrared spectroscopy (IR) is one of the most common methods of spectroscopy used by real
scientists and inorganic physicists. Currently, this estimate is to absorb various infrared frequencies
with the sample in the infrared beam path. The main purpose of infrared spectroscopy is to identify
the functional chemical groups in the sample. FT-IR represents Fourier transform infrared, a
favorite infrared spectroscopy technique. Infrared spectroscopy, IR radiation passes through the
sample, some of the infrared rays are consumed by the sample, and some of it is lost (transmitted).
The next field expresses to the adsorption and transport of light energy into the molecule, creating
a subatomic impression of the sample. Like a unique brand, no two major atomic structures produce
the equivalent infrared range. This causes infrared spectroscopy valuable for several types of
examinations. Gaussian is a most utilized computational science programming program, while
Gauss View is an economical full-included graphical user for Gaussian. One can submit
contributions to Gaussian and can watch yield graphically, which is generally created by Gaussian
programming using utilizing Gauss View.

57
Figure 3.16. IR spectrum 3-21G Basis set for HF approximation for the smallest basis set.
The effect of each core group varies, but the difference in quantity is very small and can be
ignored. Because each vertex in FTIR represents the bond between two atoms, it has a range for
each specified bond in a small area, for example, the amide IR group forms the band range in the
1705-1755 cm-1 band. Figure 3.16 is the result of Gaussian09 for the HF approximation, the peaks
appeared not wide and sharp, and the tip is so short and slightly more extensive than the results of
other base sets. The sharp peak it means more photon energy was absorbed by the atom, but broad
require a small energy need to produce compare with sharp peaks. There is a sharp peak in single
bonds like C-H. BBL molecule has six singles between C-H. in the range 2149 cm-1. The locale
from around 1300-900 cm-1 is known as the fingerprint region. The groups in this area start in
communicating vibrational modes bringing about a mind-boggling ingestion design. As a rule, this
district is very unpredictable and regularly hard to translate; notwithstanding, every organic
compound has its very own special retention example (or fingerprint) in this area and therefore an
IR range be utilized to recognize a compound by coordinating it with an example of a known
compound.

58
Figure 3.17. BBL IR spectrum 6-31G basis set for HF
The C=O extending vibration is normal in the area 1850-1600 cm-1. In the present
investigation, it had been seen at 1703 cm-1 in HF/B3LYP level. The out of plane twisting methods
of C=O bonds are seen at 507 cm-1 in FT-IR. The output result of 6-31G basis set is Figure 3.17. It
shows the IR spectrum of the BBL with 6-31G basis set for HF. This basis set is better than 3-21G
basis set, because the peaks are sharp and the finger print region is much close. The important
comparison is every peaks value was raised up approximately 50 cm-1. The carbonyl group
functions in the range 1806 cm-1 of C=O. Aromatic hydrocarbons show ingestions in the districts
1600-1559 cm-1 and 1484-1407 cm-1 because of carbon-carbon extending vibrations in the aromatic
ring.

59
Figure 3.18. BBL IR spectrum 6-311G for Hartree-Fock.
Look at the C-H extending frequencies at 3000 cm-1. Retention groups at frequencies
marginally bigger than 3000 cm-1 are demonstrative of fragrant hydrogens. The nearness of these
pinnacles ought to be reliable with the level of unsaturation of BBL particle. The nonattendance of
ingestion over 3000 cm-1 however the nearness of some unsaturation in the sub-atomic equation
are steady with a cyclic compound. The BBL molecule is unsaturated because the range frequency
between C-H is more than 3000 cm-1. Carbon-Carbon stretching frequency is the same with the
carbon- nitrogen frequencies.
The final basis for this thesis in the Hartree-Fock approximation is 6-311 G, and the result is
Gaussian 09 in Figure 3.18. It shows spectrum BBL IR 6-311G Hartree-Fock. In this foundation
group, the peaks are not many and the peaks are sharp, in the range of fingerprints the absorption
is except one peak. The peaks are far from other adjacent peaks when compared to the other HF
baseline group. For large basics located near the exact value of some small neglect and neglect, the
absolute photon energy will be absorbed by the bonds between the atoms.
Each individual carbonyl compound is maintained in an area of 1750-1603 cm-1 due to the
vibration of the extension of the association of C = O. Triple bonds have higher extending
frequencies than relating two fold bonds, which thusly have higher frequencies than single bonds.
The C-N stretching in the range 1211-1274 cm-1, at this group function was appeared a little peak,
but at another result of HF basis set was appeared more peaks. The BBL molecule have more
resonance due to the benzene ring and double bond resonance. Conjugate will inferior characteristic
absorption frequencies of dual bond due to the existence of solitary bond between C-H character.

60
Another factor of conjugation, ring is straining in cyclical composite goes the last method
and growth the frequency such as C=C, C=O. C=C double bond in the range 1603, 1750 cm-1 is a
conjugated and originates at inferior frequency. Generally according to Hartree-Fock
approximation, all of the peaks were sharp for 6-311G basis set and have a little number of peaks.
The frequency value is medium between 3-21G and 6-31G basis set. The 6-311G basis set is more
accurate and precise.
Figure 3.19. BBL IR spectrum DFT 3-21G basis set Density functional theory at B3LYP level
Figure 3.19 indicates IR spectrum of the BBL with DFT 3-21G basis set. HF approximation is
different with DFT. It can be obtained at FTIR spectroscopy because the value of peaks and the
ratio of absorption photon energy by the atom and number of peaks were appear at DFT. The =C–
H extend in aromatics is seen at 3100-3000 cm-1. This is a helpful instrument for deciphering IR
spectra: Only alkenes and aromatics demonstrate a C–H extend somewhat higher than 3000 cm-1.
Intensifies that don't have a C=C bond show C–H extends just beneath 3000 cm-1.
Aromatic hydrocarbons show ingestions in the districts 1547-1498 cm-1 and 1470 cm-1 because of
carbon-carbon extending vibrations in the fragrant ring. Groups in the area 1232-1008 cm-1 are
because of C–H in-plane bowing, in spite of the fact that these groups are too feeble to ever be seen
in most aromatic mixes.

61
Figure 3.20. BBL IR spectrum 6-31G Basis set DFT
C-N extending ingestions are originating at 1211 to 1356 cm-1 for aromatic ring. The
nitrogen standard expresses that a particle that has no or significantly number of nitrogen atom has
an even ostensible mass, though an atom that has an odd number of nitrogen molecules has an odd
ostensible mass. Figure 3.20 indicates the output result of Gaussian program for FTIR at 6-31G
basis set with DFT. In this basis set, the sharp peak is very obvious and the finger print region
approximately it was equal in the left-hand side of the C-H bond was going to appear just one small
peaks in the right-hand side, but in another above basis sets appeared like two or three small basis
set. The number of atoms and number of bonds of molecule and type of functional group have
influence on the IR spectrum. The BBL peak is close to each other because it consists 32 atoms and
it was a conjugate. The number of functional groups is the same, generally DFT basis sets have the
same result for FTIR spectrum but some basis set is more accurate than another. According to BBL
molecule the difference between basis set is not get a range refuse the basis set.

62
Figure 3.21. IR BBL spectrum DFT 6-311G Basis set.
Figure 3.21 shows IR spectrum of the BBL for DFT with 6-311G basis set.Vibrational
wavenumbers rely upon the power constants which are determined as second subsidiaries of the
potential at equilibrium state, whereas force relies upon the vibrational wave functions and the
dipole moment. According to 6-311G basis set, the finger print region started from under 431, 901
cm-1. This region comprises several complicate bands. This section of the FTIR spectrum is unique
for every compound, rarely used to calculate for identification of the functional group.
C-H aromatic group sharply appeared just one small sharp peak in region 3318 cm-1, another basis
set was consisting of more than one peak. Hydrogens involved in sp2 carbons; aromatic carbon-
hydrogen bonds are establishing in this area.
C=O in the region 1652 cm-1 is inclined to augmentations and nucleophilic assault on the grounds
that or carbon's certain charge and oxygen's negative charge. The resonance of the carbon fractional
positive charge permits the negative charge on the nucleophile to assault the Carbonyl group and
become a piece of the structure and a positive charge (ordinarily a proton hydrogen) assaults the
oxygen. The carbon-oxygen two fold bond is polar, oxygen is more electronegative than carbon
and has most electronegativity in BBL, so electron density is higher on the oxygen side of the bond
and lower on the carbon side. On account of the aromaticity of benzene, the subsequent atom is
planar form with every C-C.

63
Table 3.4. IR label peaks for BBL molecular with the type of peaks.
Appearance Absorption (cm-1) Compound Class Group
Weak 1946.18 aromatic compound C-H bending
Weak 1910.8 aromatic compound C-H bending
Strong 1766.3 carboxylic acid C=O stretching
Strong 1673.91 conjugated ketone C=O stretching
Strong 1492.67 nitro compound N-O stretching
Strong 1281.89 aromatic amine C-N stretching
Strong 1243.53 alkyl aryl ether C-O stretching
Strong 911.634 alkene C=C bending
Weak 1401 Aromatic C=C bending
Strong 1652 Aromatic C=C stretching
Table 3.4 indicates IR label peaks for BBL molecular with the type of peaks. BBL molecule is
completely aromatic. Finger print area (1400-700 cm-1) of most single bond signals have alike
frequencies. At the right-hand, figure appears the aromatic compound that consist C-H bending
vibration. This region is approximately term 1900-2000 cm-1. The bond between hydrogen and
carbon appeared very strong because it is a single bond. Another region was appeared between
1670-1780 cm-1 it is carboxylic acid group function the bonds between C=O and stretching
vibration, this bond it has a weak energy if compare to C-H bonds, it is a double bond. The bonds
between C-N is aromatic amine was appeared at 1280 cm-1. Another group is occurred between the
same atoms and it is carbon. The wave number appeared in term 900-1000 cm-1, it is bending strong
vibration C=C. Totally, IR spectrum of BBL contains four main groups and most of the peaks was
strength and sharp but was not have a broad peak.
3.1.3. Ultra Violet Spectroscopy
UV-Vis spectroscopy (UV-Vis) is the calculation of the amount of light emitted after passing
the sample or after reflection from the sample surface. The absorption estimates can be extended to
a single wavelength or even a range. BBL molecule consumes a small amount of light energy and
the electron moves to a higher orbital energy level. The spectrometer captures the level of retention
by a sample at different wavelengths and reaches the absorption map against the wavelength as the
amplitude. The optical properties and structure of the BBL can be defined using UV spectroscopy.
More than three basis sets were used for density approximation and density functional theory, each
showing strong electromagnetic absorption in the visible region, light blue to deep blue depending
on wavelength calculation or comparison with the visible spectrum.

64
Figure 3.22. UV spectroscopy for 3-21G basis set HF approximation
Three different base sets (3-21G, 6-31G, 6-311G) were used, according to the Hartree-Fock
approximation theory and functional density theory. Output results for each base set are different.
Two or more peaks appeared in some results.
The most simplistic basis set in HF approximating in this thesis is the 3-21G basis set. In Figure
3.22, UV spectroscopy for 3-21G basis set at HF approximation was confirmed only one peak, and
the highest wavelength is 326.3 nm. The electron transition has occurred in the carbonyl group in
the group (C=O). The band gap energy corresponding to BBL molecule for this basis set is equal
to 3.812634 eV, but the exact value of the pristine BBL is 1.9 eV. The difference between the actual
value and the results of the 3-21G basis set is equal to 1.91263445 eV. This band gap is very large
for BBL molecule because BBL can be a semiconductor at room temperature. But if we obey this
basis set for BBL molecule, it needs more energy to transition.

65
Figure 3.23. UV spectroscopy for 6-31G basis set of HF approximation
The second basis set is 6-31G for the Hartree-Fock approximation. This basis set is accurate
in estimation but is not suitable for use in the BBL molecule, because the band gap energy of this
basis set is 6.76019 eV. But the real value of the BBL asset is 1.9 eV. But the output result after
calculation for Figure 5.23, UV spectroscopy for a 6-31G basis set of HF approximation maximum
wavelength is equal to 184 nm, it is the half amount of recent basis set.
Figure 3.24. UV spectroscopy for 6-311G basis set of HF approximation.

66
The great foundation specified for the Hartree-Fock approximation is 6-311G as seen in
Figure 3.24. UV spectroscopy for a 6-311G basis set of HF approximation was the output result of
gaussian09. This base set is more accurate than modern set sets. Two different peaks have been
created, meaning that in this case, two types of transitions have occurred. The first transition is
between 𝑛 → 𝜋 in the carbonyl group between C=O bond. The band gap energy for the first peak
on the right-side of figure (186.666211 nm) is equal to 6.663779 eV, this value is related the
transition between 𝜋 → 𝜋∗ because for large band gap required more energy to transition of electron
but according to the left side peak the wavelength is equal to 335.009 nm and band gap of BBL
molecule is 3.712959 eV. It is the half amount of the energy compare the first peak.
Figure 3.25. DFT UV visible 3-21G Basis set.
For the complex molecule, the DFT is convenient from HF approximation. Figure 3.25
shows DFT UV visible 3-21G Basis set. It shows the output result for 3-21G basis set. The band
gap of BBL molecule is 3.831096 eV. This value is very close to the exact real value of the band
gap energy because the real value is 1.9 eV. For this basis set, the transition is between 𝑛 → 𝜋 level.
A small amount of energy needs to be transferred from the electron because the beam gap no longer
exists.

67
Figure 3.26. DFT UV-visible 6-31G Basis set
To compare the accuracy and precision of basis set, the result of UV-vis is suitable. Figure
3.26 indicates the UV-visible for 6-31G basis set with DFT. It has two complete peaks and one
small peak, this cause is restoring to not smooth of the BBL valence band state, and accurate of the
basis set and responsible to transition and motion of the electron. Two peaks have two transitions,
and the band gap for the first peak in the right side of above figure is equal to 3.702009 eV and for
the second transition in the left side is equal to 2.715884 eV, and the difference band gap energy
with real value is 0.815884 eV. The error for this basis set is very small.

68
Figure 3.27. DFT 6-311G Basis set UV-vis spectrum
If the electron transmission occurs after the photon energy associated with the UV spectrum
is encountered, the sharp peak of the base group is accurate in Figure 3.27. Rule 6-311G of the
theory of functional density is much better than current core groups. The band gap energy for the
first transition at 258.8 nm is equal to 4.806 eV, it is an incredible basis set because for large band
gap require a large amount of energy. For the second peak where the maximum wavelength is equal
to 332 nm, is equal to 3.7020099 eV.
Electron transition was occurred and depended on the nature of bonding, this transition occurs
between n → π∗. The wavelength of ultraviolet radiation will produce the transition depending on
the energy of antibonding orbital and bonding orbital. As the electron moved to the BBL molecule,
the first excitation occurred and jumped from the non-bonding state to the nearest bonding state. A
large excitation of electrons needs more energy, but for a short excitation requires a small amount
of photon energy. The type of permeability depends on the absorption of photon energy. The
electron permeability of the BBL molecule is very short due to the energy of the small beam gap,
which means that the BBL molecule absorbs a small amount of photon energy. We can define the
wavelength law λ =c
v , where c is velocity of light. According to these two laws can be calculated
for the energy gap.
E = hc
λ . (5.1)

69
by using the maximum value for wavelength:
E = hc
λ → E = 6.634 ∗ 10−34
3∗108
324∗10−9
E = 6.634 ∗ 10−34 ∗ 0.00925926 ∗ 1017
E = 0.06142593 ∗ 10−17 J
E = 3.8339121 eV
The result of the band gap used in UV-vis spectroscopy is of large. This value is required for
BBL polymer implementation. The band gap is much larger than other molecules band gap and is
displayed while the frequency is absorbed too high. The relationship between the energy gap and
the frequency is directly proportional. But the relation between wavelength and frequency is the
opposite, which means that the BBL frequency is absorbed very low, the absorption is less than the
visible range with UV. This file can be used as evidence.
Table 3.5. Band gap energies of HF and DFT for different basis sets.
Type of
method
Basis set Band gap (eV) Band gap (J)
HF
3-21G 3.812634 0.06122144 * 10-17
6-31G 4.091694 0.06546711 * 10-17
6-311G 6.663779, 3,712959 (0.0120, 0.059402593) ∗ 10−17
DFT
3-21G 3.831096 0.5405285 * 10-17
6-31G 3.702009, 2.715884 (0.0592, 0.043454144) * 10-17
6-311G 4.806, 3.702, 2.724 (0.1586169, 0.05923214) *10-17
Theoretical results of the BBL band gap energy are exhibited in Table 3.5. The energy value of the
experimental work is closer corresponds to a basis set calculation associated with the HF and DFT
methods. The exact value obtained from the DFT calculation the HF method differs from the DFT
calculation, and more precisely it can be used to calculate the band gap energy in this thesis
according to the above table.

70
3.1.4 Tauc Plot
Tauc plot is the best theoretical approach to determine the band gap energy associated with
the UV-vis light. After the light energy strike on the electron and absorb. The nearest and closest
result exist reached at Tauc plot because at each basis set has a few variations with the real value
of BBL molecules band gap. In this thesis, the Tauc scheme approximation is more reliable than
other approaches for determining the band gap energy of the molecules. The band gap energy is a
fundamental characteristic of electronic construction for elements, including general, that
determine their potential use, chemical and physical behaviors. The basic Tauc plot is the
relationship between the optical absorption coefficient and band gap energy.
Figure 3.28. Tauc plot for 3-21G Basis set at HF approximation
According to Figure 3.28, the band gap value is equal to 2.3676334 eV for the 3-21G basis
set. To this basis set and this way is better than another way such as UV-vis and HUMO and LUMO,
because the difference between the real value is 0.542 eV. This basis set for HF approximation is
better to compare with 6-31G, 6-311G. Besides, this is the simplest basic set but very close to the
experimental value. This package provides the deficiency of the HF approach, neglecting
parameters such as the exchange and correlation between electrons in the estimate. The extended
basis set is more accurate than the small base set.
In this study, the result of the band gap energy is the primary purpose of the BBL molecule.
Corresponds to the plots Tauc result is very close to the real value because other results have some
shortcomings but associated with errors this method does not exceed 1.5 eV. This is why the Tauc
plot is too wide to be used to determine the band gap energy.

71
Figure 3.29. UV-vis Tauc plot for HF approximation 6-31G Basis set
Band gap value is 3.467 eV for Figure 3.29 and the base set 6-31G. The Tauc scheme method
is not feasible in mastering the base set. UV-vis Tauc plot for HF approximation 6-31G Basis set
takes after the range of the circuitous changes in BBL in addition to a tail because of limited states
at lower energies, and proposed an extrapolation to locate the optical gap. Typically, a Tauc plot
demonstrates the amount hν (the energy of the light) on the abscissa and the amount (αhν)1/r on the
ordinate, where α is the assimilation coefficient of the material.
Figure 3.30.Tauc plot for 6-311G basis set of HF

72
Band gap energy in Figure 3.30 for 6-311G basis set according to HF approximation is equal
to 3.3 eV. The Hartree-Fock strategy for this design can develop a guess of the numerous electron
wave function from the single-molecule wave function. This inexact wave function must comply
with the Pauli standard.
Figure 3.31. UV-vis Tauc plot 3-21G DFT
In this basis set, the determinants of the Hartree-Fock and the energy states using the
coefficients are correlated. Consequently, the energy difference between the accurate energy of the
exact original state and the Hartree-Fock fundamental state is called correlation energy. 𝐸𝐶 =
𝐸𝑒𝑥𝑎𝑐𝑡 − 𝐸𝐻𝐹 , this is the original HF approach. For small molecules with fewer electrons, the HF
approximation much better than DFT.
The best theoretical approach remains exhibited in Figure 3.31. The UV-vis Tauc for 3-21G DFT
design concerning the 3-21G base set is the best and closest result to any other base set for each HF
and DFT. This is a small base set, but it works well for the band width energy of the BBL molecule.
The band gap energy is equal to 2.28 eV, but the real value of BBL band gap is 1.9 eV. The different
between empirically and theoretical is equivalent to 0.455 eV.

73
Figure 3.32. UV-vis Tauc plot for 6-31G Basis set DFT.
In this section, the band gap of BBL molecule were computed using the density functional
theory with a 6-31G basis set in Figure 3.32. The results presented that gave the closest value of
the band gap as 2.97742818 eV associated with the experimental value of 1.9 eV. In overall, the
use of density functional can be stretched to compute the band gap of further semiconductors. The
difference between experimental and theoretical is 1.07742818 eV.
Figure 3.33. UV-vis Tauc plot for 6-311G Basis set DFT.

74
The molecule and the number of bonds and functional groups are most important to calculate.
Figure 3.33 explains the 6-311G basis set of UV-vis for DFT. The band gap of the BBL molecule
using the Tauc scheme method is equal to 2.26 eV is large, but this basis set is the largest basis set
in this thesis, compared to other basis sets. The HF approximation and density theory performance
with this part are the most unfavorable result due to the high-efficiency result.
These above figures illustrate the bang gap of BBL molecule, by using Hartree-Fock approximation
for three different types of basis sets. Each of the figures directly can determine the value of the
band gap, the x-axis values were changed to energy with electron volt unit before the x-axis is equal
to or represent the wavenumber. But some value we must be neglect due to having large mistake
ratio. Because some basis set is not sufficient, accurate and not perfect for calculating the band gap
because the real value is equal to 1.9 eV. This value is very smaller if compare with output result
of the Hartree-Fock approximation for this basis sets. This differences it is apparent not by using
the graphs because when determining the maximum absorbance for ultraviolet each of the peaks
had differentiated the maximum wavelength have a direct relation with the energy gap. Tested
three-way or basis sets for calculating but maybe another basis set is accurate more than these bases
sets.
3.1.5. BBL Transition
This BBL molecule absorbs light near the visible region and appears to be dark blue in
theory. The lambda max value indicates the color of the BBL molecule. The better the quantity of
C=C, the longer the observed λmax. This molecule (BBL) has numerous double bonds and
conjugation has a very extend change of pi-electron conjugation. Assuming for absorbing is longer
due to the existing very narrow energy gap between the HUMO and LUMO.
An electron transition has a fundamental transition probability. The probability that the photon
absorbs. The UV absorption range of a compound molecule can remain identified by the adsorption
property of the many chemical groups (chromophores) already in the molecule. The chromophore
is a composite complex that absorbs ultraviolet radiation at a particular wavelength, with small
effect on the molecule's different band. Repeated chromophores in the organic molecule are C=C
double bonds, C=O carboxylic groups and aromatic rings. Just when at least two of these groups
are conjugated, a meaningful change in their absorption properties is observed.
A chromophore is a functional group has differed from another due some distinct behavior or
combination of functional gathering that retains UV vis light. There are two general sorts of
chromophores, π, π∗and n, π∗. These contradictions are in some ways branded in Table 3.6.
Further, the patterns in λmax (the wavelength of maximal absorbance) are not difficult to occur.

75
Table 3.6. Difference of the transition between n→π* and π→π*
𝛑, 𝛑∗ 𝐧, 𝛑∗
"Allowed" ε > 103 "Forbidden" ε < 102
Enlarged polarity of solution enlarged λmax (red
shift).
The amplified polarity of solution
diminished λmax (blue shift).
∆E(S1 − T1) > 20 kcal/mol. ∆E(S1 − T1) < 10 kcal/mol.
To illustrate or write the transition between π, π* is important only for the convenience and
understanding of the properties of the BBL molecule of n, π*, for evaluating the behavior and
application of the transition state.
3.1.6. Chromophores and UV-Vis Spectra
The chromophore is the part of a molecule or chemical group which is responsible for its
color. The color develops when a molecule absorbs certain and transmits or reflects others. In
science, atoms that support to expose or recognize the vitality of light, the Chromophore is a cross-
section that causes the particles to deform when exposed to light. The color range is given for
transparent electromagnetic radiation. The chemical structure of BBL the eleven conjugated double
bonds that structure. At the point once white light photon energy goes through the sample or this
light photon energy is reflected through a hued material, a trademark segment of the wavelengths
blended is retained. The staying light will at that point require the identical color to the wavelength
absorbed. During this manner, the absorption of photon energy has a particular behavior for each
component, for example, the absorption of the electron in range of 420-430 nm light analyses a
material yellow, and retention of photon energy in range 500-520 nm light makes it red. The green
color of electromagnetic is special and differ from another before in that it very well may be made
by absorption of photon energy in a range near 400 nm just as absorption close to 800 nm. Primary
people esteemed hued colors and utilized them for embellishing purposes. A considerable a lot of
these were inorganic minerals however, a few necessary natural colors were additionally known.
These incorporated the ruby color, kermes acid, the blue color, indigo color, and the yellow saffron
color and crocetin. An uncommon dibromo-indigo subordinate, pumicing, was utilized to shading
the robes of the magnificent and rich. According to other colors or more than wavelength than
before that explained the profound orange hydrocarbon carotene is generally appropriated in
herbage or plants, yet isn't adequately constant to be utilized as unchanging color, other than for
sustenance color. A functional group capable of consuming distinguishing electronic transitions
from lower state energy to higher state energy is named a chromophore. The compound containing
a chromophore is chromogen (C=C, C=O). It can remain defined as an isolated unsaturated group

76
covalently bonded responsible for electronic absorption. The BBL molecule was chromophore and
concentrated only on this molecule. BBL contains n and π electrons.
Identification of chromophore depends on some important factors:
1- The UV-vis band spectrum are very close to 300 μm sometimes consists of two or more
conjugate units.
2- Absorption band approximately or produce in term 270-350 μm but the intensity in the lower
level near εmax 10 − 100 because of transition occur from n to pi star level of the carbonyl
group.
3- The value εmax between 1000-10,000 with absorption shown an aromatic system.
The BBL structure contains more double bonds C=C and C=O. These bonds are directly
affected by the separation of HOMO and LUMO. The following diagram shows the bond energy
for the double bonds, single bonds, between the bond atoms of the molecule in Figure 3.34. As the
double bond in the molecule increases, the electron requires the energy to move the electrons from
the non-bonding state to the pi state if compared to a single bond between atoms.
Figure .3.34. Influence of single, double and triple bond on the band gap.
As extend delocalization increases energy and therefore maximum wavelength π∗ transition, the
level n is uniform because of the solvent effect (H bond bonding). When moving from non-polar
solvent to polar excessive or blue shift occurs. The energy decreases and the wavelength increase.
3.1.7. BBL Transition from 𝛑 → 𝛑∗
Absorption happens when the vitality contained in a photon is consumed by an electron
bringing about a change to an energized state. Since photon and electron vitality levels are
quantized, we can just get explicitly permitted changes.
Usually the peak is more pronounced due to the transfer of pi to pi * because both orbits are in the
same region, while the peak from n to pi * is relatively weak because n is orbital (in-plane)
perpendicular to pi * Is orbital (perpendicular to the molecular plate) and has little transfer potential.

77
Furthermore, the energy gap between π → π∗ is bigger than that n → π∗, so the π → π∗ peak has
higher wavenumber in the spectrum in Figure 3.35.
Figure 3.35. The range of absorption of UV-vis to transition.
The σ → σ∗ transfer involves the absorption of a wavelength photon that is absent in the UV-
vis series. Thus, only π → π∗ and n → π∗ transitions happened in the UV-vis region are detected.
The second BBL transition in the range 450 nm means that more energy needed to occur this
transition because the band gap is larger than another peak, the wavenumber is very large. It is
inducing evidence to establish the band gap is more and required more absorption photon
absorption by a C=C double bond excited a π electron into an antibonding π* orbital. The
chromophore action is in this manner due to a 𝜋 → 𝜋∗ transition at the point when the twofold
bond is a piece of a conjugated chain, the energies of the atomic orbitals lie nearer together and the
𝜋 → 𝜋∗ change moves to longer wavelength; it might even lie in the noticeable locale if the
conjugated framework is sufficiently long. A C=C two-fold bond performances a chromophore.
Unique of its significant transition is the π to π star transition, in which an electron is indorsed from
π orbital to consistent anti-bonding orbital is seen in the Figure 3.36.
Figure 3.36. A C=C two-fold bond performances a chromophore.
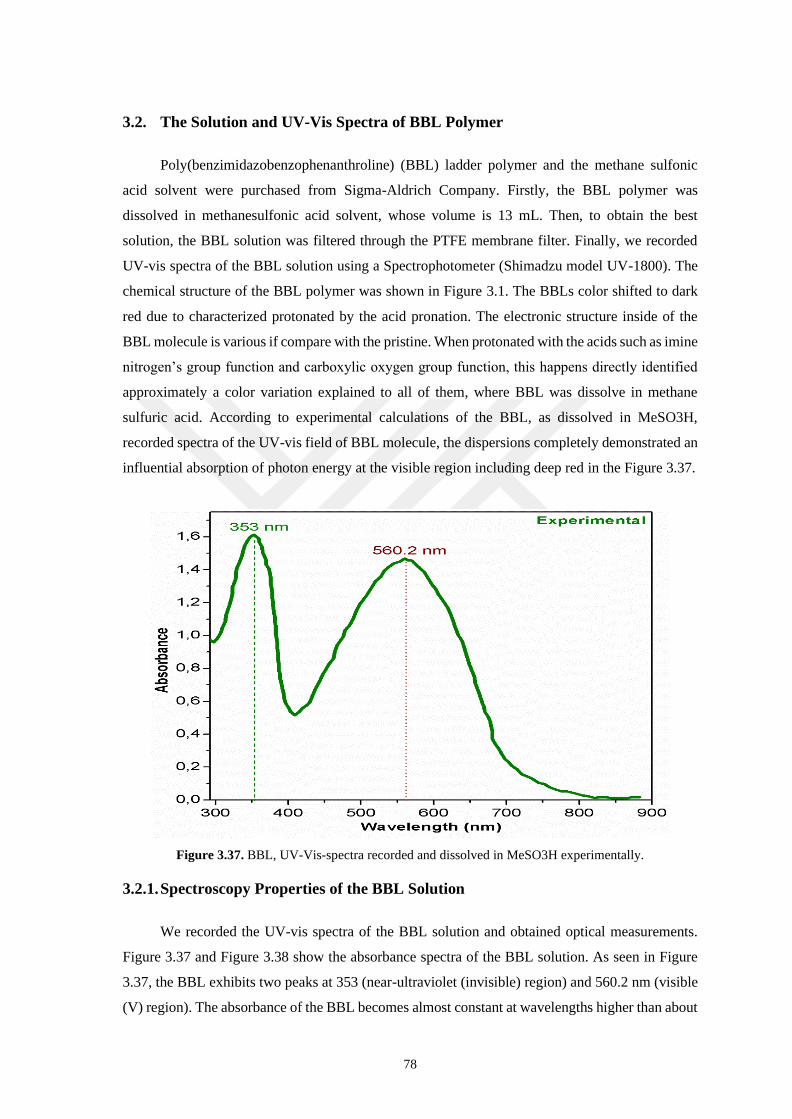
78
3.2. The Solution and UV-Vis Spectra of BBL Polymer
Poly(benzimidazobenzophenanthroline) (BBL) ladder polymer and the methane sulfonic
acid solvent were purchased from Sigma-Aldrich Company. Firstly, the BBL polymer was
dissolved in methanesulfonic acid solvent, whose volume is 13 mL. Then, to obtain the best
solution, the BBL solution was filtered through the PTFE membrane filter. Finally, we recorded
UV-vis spectra of the BBL solution using a Spectrophotometer (Shimadzu model UV-1800). The
chemical structure of the BBL polymer was shown in Figure 3.1. The BBLs color shifted to dark
red due to characterized protonated by the acid pronation. The electronic structure inside of the
BBL molecule is various if compare with the pristine. When protonated with the acids such as imine
nitrogen’s group function and carboxylic oxygen group function, this happens directly identified
approximately a color variation explained to all of them, where BBL was dissolve in methane
sulfuric acid. According to experimental calculations of the BBL, as dissolved in MeSO3H,
recorded spectra of the UV-vis field of BBL molecule, the dispersions completely demonstrated an
influential absorption of photon energy at the visible region including deep red in the Figure 3.37.
Figure 3.37. BBL, UV-Vis-spectra recorded and dissolved in MeSO3H experimentally.
3.2.1. Spectroscopy Properties of the BBL Solution
We recorded the UV-vis spectra of the BBL solution and obtained optical measurements.
Figure 3.37 and Figure 3.38 show the absorbance spectra of the BBL solution. As seen in Figure
3.37, the BBL exhibits two peaks at 353 (near-ultraviolet (invisible) region) and 560.2 nm (visible
(V) region). The absorbance of the BBL becomes almost constant at wavelengths higher than about

79
800 nm. Transmittance plays a role in the optical transition of a material. Figure 6.3 gives the
transmittance spectra of the BBL solution. As seen in Figure 3.39, the BBL shows two small peaks
at 297.4 (NUV region) and 409.1 nm (V region). The transmittance of the BBL sharply increases
from about 600 to 820 nm. According to theoretical investigation in Figure 3.38 associated with a
quantum computational method with gaussian09 program the peaks produces, appeared at very
short region term and close to each other, they should not reach the visible region at most results of
basis set, the first and second peaks are located at the invisible region. Noticed that first peaks for
each basis set even close to experimental value, but according to the second peak, the theoretical
results are smaller than experimental value, while BBL was dissolved in methane sulfuric acid. The
transmittance of the theoretical methodology is non producing much complex, especially for HF
method at 3-21G basis set, and for DFT method at 6-31G, 6-311G basis sets have more similarity
with experimental result and transmittance started from about 600 nm and damped or disappear at
800 nm like experimental. The optical behavior of BBL was studied and explained utilized UV-vis
spectroscopy field. Optical properties of the BBL studied and applied the UV-Vis spectrometry
field. Calculations obtained determined optionally under neutral solutions because several times
tried to dissolve just from that made substances remain dissolvable, which is MeSO3H. Spectra
result was applied on BBLs, obtained and designated including into this to give them higher
relative. At this experimental investigation achieved the BBL is not fluorescent below illumination
of UV-vis, at the range of wavelength 353 nm in aqueous dispersion. But in aqueous dispersion
BBL is fluorescent due to the illumination UV-vis light and show red-orange fluorescent.
Dispersions specifically give sharp absorptions within the visible range including the deep blue.
Both explain has a high absorption at nearly 560.2 nm attributed to π-π*-transition including a small
height at 353 nm attributed to n-π*-transition. Each of them demonstrates very narrow band gap
energy. These corresponding the amount of energy and intensities of the each of one absorption
maxima differ. Unfortunately, cannot obey and rely on theoretical methodology associated with the
second peak, but the first peak is right and very close according to each basis sets for HF and DFT.

80
Figure 3.38. UV-vis spectra for different basis sets associated with HF and DFT.
From the UV-vis state, it is possible to calculate, and estimate in range 200-2000 nm of light
transmittance higher a wavelength but the sample should be the film or casts in Figure 3.38. While
the solvent becomes darker that is indicates the transmittance is at a lower state of the visible light
region, and higher absorbing visible light. From the absorbance state, can calculate the ratio of light
energy absorbance from 0 to 1. If the absorbance is equal to zero that is, means the light wholly
passed through the solution and has a higher transmittance, but while the value of absorbance is
equal to 1 that is indicates the transmittance at in the lower level and the light was absorbed by the
solution (the resolution is opaque). Transmittance plays a role in the optical transition of a material.
Figure 3.39 gives the transmittance spectra of the BBL solution. As seen in Figure 3.38, the BBL
shows two small peaks at 297.4 (NUV region) and 409.1 nm (V region). The transmittance of the
BBL sharply increases from about 600 to 820 nm.

81
Figure 3.39. The curves of the transmittance wavelength in methane sulfuric acid solution of BBL.
The optical band gap (Eg) is the most important parameter for optical properties and
fabrication of optoelectronic devices in the Figure 3.39. The Eg of optical transitions for
semiconductor polymers.
𝛼(ℎ𝑣) = 𝐴∗(ℎ𝑣 − 𝐸𝑔)1/2
(6.1)
where α is absorption coefficient, hv is photon energy, A* is a constant and Eg is the forbidden
bandwidth. For BBL material, the best fitting was found to be for the plot of (αhʋ)1/2 versus photon
energy (E). That is, the character of the optical transition is the allowed direct transition and kind
of the optical band gap (Egd). Obtained allowed direct optical band gap of the BBL molecule from
linear regions is equal to 1.826 eV, while it was dissolved in methane sulfuric acid solvent, as
illustrated in Figure 3.38. The experimental result is extremely near to real value and the proper
value of the BBLs band gap energy. Corresponds to theoretical investigation the result of band gap
energy is differ from one basis set to another but the very close result can expect from 6-31G basis
set in DFT method the band gap energy is 2.25 Ev. The difference was between them just equal to
0.424 eV.

82
Figure 3.40. Experimental Tauc plot result of BBL associate with UV-vis.
Figure 3.41. Determine the band gap energy of BBL corresponds to Tauc plot for different basis set.
Experimental Tauc plot result of BBL associate with UV-vis is seen in the Figure 3.40.
HOMO and LUMO are molecular orbitals, and both of them the energy can at origin be computed
with accurate calculation, including every particle in the molecule that is participating in
interactions. Determined the band gap energy with HOMO and LUMO this method is practiced.
Associate with the HOMO and LUMO, the theoretical method applied for three different basis set
3-21G, 6-31G and 6-311G for HF and DFT are 8.22661091, 8.3948995, 8.09109714, 0.91238483,
2.85688289 and 2.90184502, respectively. But the best method is 3-21G basis set for DFT and the
difference between it and experimentally just is equal to 0.91 eV. Determine the band gap energy
of BBL corresponds to Tauc plot for different basis set is seen in the Figure 3.41.

83
3.2.2. BBL Transition
This BBL molecule absorbs light near the visible region and appears to be dark blue in
theory, But because of the absorption range between purple and dark blue. The lambda max value
indicates the color of the BBL molecule. But to get a confirmation value more than five cases have
been tested and each base set has a different result, but very close value. The better the quantity of
C=C, the longer the observed λmax. This molecule (BBL) has numerous double bonds and
conjugation has a very extend change of pi-electron conjugation. Assuming for absorbing is longer
due to the existing very narrow energy gap between the HUMO and LUMO. UV-visible peaks can
be smaller or larger. Dependent on this relating number from photons absorbed, by the molecule.
The range of the UV-vis spectrum is not uniform but varies from an individual molecule to another.
The amount of UV absorptions depends on the number of bonds in the molecule the relationship
between the amount of photon energy absorbed and the bond between the atoms are equivalent. If
any molecule becomes more bonds, it indicates further photon energy to transmit electrons and
establish peaks. Short peaks represent a small amount of energy required for transmission.
An electron transition has a fundamental transition probability. The probability that the
photon absorbs. That depends principally on the effects. The more comprehensive the polarity
change between the HOMO and LUMO positions. The polarity difference between two HOMO
and LUMO states, the greater the probability of transition. n– π * transition, this type of transition
occurs in unsaturated complexes containing heteroatom has an unshared electron pair. unshared
electron (n) on hetero atom excited to (π *) state. Energy of n– π * transition fewer than energy of
other transition and existence at more wavelengths.
The UV absorption range of a compound molecule can remain identified by the adsorption
property of the many chemical groups (chromophores) already in the molecule. The chromophore
is a composite complex that absorbs ultraviolet radiation at a particular wavelength, with small
effect on the molecule's different band. Repeated chromophores in the organic molecule are C=C
double bonds, C=O carboxylic groups and aromatic rings. Just when at least two of these groups
are conjugated, a meaningful change in their absorption properties is observed. A chromophore is
a functional group has differed from another due some distinct behavior or combination of
functional gathering that retains UV vis light. There are two general sorts of chromophores,
π, π∗and n, π∗, And these contradictions are in some ways branded. Further, the patterns in
λmax (the wavelength of maximal absorbance) are it is not difficult to occur. As the π π method
increases, the wavelength of the π adsorption increases, π* expands. For a prominent chromophore,
for example, a carbonyl group, the process of n to π* becomes less energetic (longer or longer
wavelength) than the transition from π to π*, which is expected by the principles of combining MO
with more energy relative to a combination of π MO.

84
Table 3.7. Difference of the transition between 𝐧 → 𝛑∗and 𝛑 → 𝛑∗ of the BBL molecule
𝛑, 𝛑∗ 𝐧, 𝛑∗
"Allowed" ε > 103 "Forbidden" ε < 102
Enlarged polarity of solution enlarged λmax (red shift). The amplified polarity of solution diminished
λmax (blue shift).
∆E(S1 − T1) > 20 kcal/mol. ∆E(S1 − T1) < 10 kcal/mol.
To illustrate or write the transition between π, π* is important only for the convenience and
understanding of the properties of the BBL molecule of n, π*, for evaluating the behavior and
application of the transition state in the Table 3.7.
3.2.3. Chromophores and UV-Vis Spectra
The chromophore is the part of a molecule or chemical group which is responsible for its
color. The color develops when a molecule absorbs certain and transmits or reflects others. The
atomic grouping on which the color of a substance depends. Any chemical compound or buildup
(as NO2; N2; or O2) which bestows some chosen color to the compound of which it is fixing.
visible light that hits the chromophore would thus be able to be consumed by excited an electron
from its ground state into an energized state. In science, atoms that support to expose or recognize
the vitality of light, the Chromophore is a cross-section that causes the particles to deform when
exposed to light. The color range is given for transparent electromagnetic radiation. The chemical
structure of BBL the eleven conjugated double bonds that structure. At the point once white light
photon energy goes through the sample or this light photon energy is reflected through a hued
material, a trademark segment of the wavelengths blended is retained. The staying light will at that
point require the identical color to the wavelength absorbed. During this manner, the absorption of
photon energy has a particular behavior for each component, for example, the absorption of the
electron in range of 420-430 nm light analyses a material yellow, and retention of photon energy
in range 500-520 nm light makes it red. The green color of electromagnetic is special and differ
from another before in that it very well may be made by absorption of photon energy in a range
near 400 nm just as absorption close to 800 nm. Primary people esteemed hued colors and utilized
them for embellishing purposes. A considerable a lot of these were inorganic minerals however, a
few necessary natural colors were additionally known. These incorporated the ruby color, kermes
acid, the blue color, indigo color, and the yellow saffron color and crocetin. An uncommon
dibromo-indigo subordinate, pumicing, was utilized to shading the robes of the magnificent and
rich. According to other colors or more than wavelength than before that explained the profound
orange hydrocarbon carotene is generally appropriated in herbage or plants, yet isn't adequately
constant to be utilized as unchanging color, other than for sustenance color. The probability that

85
molecular wastes absorb the energy of photons when they strike molecules in the range of areas
from 200 to 800 nm is a function of the electrons and heteroatoms that consume the non-binding
outer layer of an orbital molecule called electron pairs of The Valencian layer Such light absorption
groups are mentioned utilizing chromophores.
A functional group capable of consuming distinguishing electronic transitions from lower
state energy to higher state energy is named a chromophore. The compound containing a
chromophore is chromogen (C=C, C=O). It can remain defined as an isolated unsaturated group
covalently bonded responsible for electronic absorption. The BBL molecule was chromophore and
concentrated only on this molecule. BBL which contains n and π electrons. Identification of
chromophore depending on some important factors
4- The UV-vis band spectrum very close to 300 μm sometimes consists of two or more
conjugate units.
5- Absorption band approximately or produce in term (270-350) μm but the intensity in the
lower level near εmax 10 − 100 because of transition occur from n to pi star level of the
carbonyl group.
6- The value εmax between 1000-10,000 with absorption shown an aromatic system.
The BBL structure that contain more double bonds C=C and C=O. where has a carbonyl
group function. These bonds are directly affected by the separation of HOMO and LUMO. The
following diagram shows the bond energy for the double bonds, single bonds, between the bond
atoms of the molecule. As the double bond in the molecule increases, the electron requires the
energy to move the electrons from the non-bonding state to the pi state if compared to a single bond
between atoms. And vice versa for a molecule that triple bonds to complement the structure of
molecular bonds. Influence of single, double and triple bond on the bandgap is seen in the Figure
3.42.
Figure 3.42. Influence of single, double and triple bond on the bandgap.
As extend delocalization increases energy and therefore maximum wavelength π∗ transition,
the level n is uniform because of the solvent effect (H bond bonding). When moving from non-
polar solvent to polar excessive or blue shift occurs.

86
3.2.4. BBL Transition from 𝛑 → 𝛑∗
Absorption happens when the vitality contained in a photon is consumed by an electron
bringing about a change to an energized state. Since photon and electron vitality levels are
quantized, we can just get explicitly permitted changes.
Usually the peak is more pronounced due to the transfer of pi to pi * because both orbits are
in the same region, while the peak from n to pi * is relatively weak because n is orbital (in-plane)
perpendicular to pi * Is orbital (perpendicular to the molecular plate) and has little transfer potential.
Furthermore, the energy gap between π → π∗ Bigger than that n → π∗, so the π → π∗ peak has
higher wavenumber in the spectrum in Figure 3.43.
Figure 3.43. The range of absorption of UV-vis to transition.
The σ → σ∗ The transfer involves the absorption of a wavelength photon that is absent in the
UV-vis series. Thus, only π → π∗ and n → π∗ transitions happen in the UV-vis region are detected.
The second BBL transition in the range 450 nm it means more energy needed to occur this transition
because the bandgap is larger than another peak, the wavenumber is very large it is inducing
evidence to establish the bandgap is more and required more absorption photon absorption by a
C=C double bond excited a π electron into an antibonding π* orbital. The chromophore action is in
this manner due to a 𝜋 → 𝜋∗ transition at the point when the twofold bond is a piece of a
conjugated chain, the energies of the atomic orbitals lie nearer together and the 𝜋 → 𝜋∗ change
moves to longer wavelength; it might even lie in the noticeable locale if the conjugated framework
is sufficiently long.

87
3.2.5. The Solution and UV-Vis Spectra of BBL Polymer
Poly(benzimidazobenzophenanthroline) (BBL) ladder polymer and the methane sulfonic
acid solvent were purchased from Sigma-Aldrich Company. Firstly, the BBL polymer was
dissolved in methanesulfonic acid solvent, whose volume is 13 mL. Then, to obtain the best
solution, the BBL solution was filtered through the PTFE membrane filter. Finally, we recorded
UV-vis spectra of the BBL solution using a Spectrophotometer (Shimadzu model UV-1800). The
chemical structure of the BBL polymer was shown in Figure 3.44. This conclusion anisotropic with
isotropic resolutions mean beneficial to fabricating coatings, films, fiber’s also additional
applications from these macromolecules.in the BBL chain concentrated strong acids protonate the
imine nitrogen heteroatoms and carbonyl oxygen the solution manner is expedited. The BBLs color
shifted to dark red due to characterized protonated by the acid pronation. The electronic structure
inside of the BBL molecule is various if compare with the pristine. When protonated with the acids
such as imine nitrogen’s group function and carboxylic oxygen group function, this happens
directly identified approximately a color variation explained to all of them, where BBL was dissolve
in methane sulfuric acid. According to experimental calculations of the BBL, as dissolved in
MeSO3H, recorded spectra of the UV-vis field of BBL molecule, the dispersions completely
demonstrated an influential absorption of photon energy at the visible region including deep red.
Figure 3.44. BBL, UV-Vis-spectra recorded and dissolved in MeSO3H experimentally

88
3.2.6. Spectroscopy Properties of the BBL Solution
We recorded the UV-vis spectra of the BBL solution and obtained optical measurements.
Figure 3.45 shows the absorbance spectra of the BBL solution. As seen in Figure 3.45, the BBL
exhibits two peaks at 353 (near-ultraviolet (invisible) region) and 560.2 nm (visible (V) region).
The absorbance of the BBL becomes almost constant at wavelengths higher than about 800 nm.
Transmittance plays a role in the optical transition of a material. Fig. Q gives the transmittance
spectra of the BBL solution. As seen in Fig. Q, the BBL shows two small peaks at 297.4 (NUV
region) and 409.1 nm (V region). The transmittance of the BBL sharply increases from about 600
to 820 nm. According to theoretical investigation associated with a quantum computational method
with gaussian09 program the peaks produces, appeared at very short region term and close to each
other, they should not reach the visible region at most results of basis set, the first and second peaks
are located at the invisible region. Noticed that first peaks for each basis set even close to
experimental value, but according to the second peak, the theoretical results are smaller than
experimental value, while BBL was dissolved in methane sulfuric acid. The transmittance of the
theoretical methodology is non producing much complex, especially for HF method at 3-21G basis
set, and for DFT method at (6-31G, 6-311G) basis sets have more similarity with experimental
result and transmittance started from about 600 nm and damped or disappear at 800 nm like
experimental. The optical behavior of BBL was studied and explained utilized UV-vis spectroscopy
field. Optical properties of the BBL studied and applied the UV-Vis spectrometry field.
Calculations obtained determined optionally under neutral solutions because several times tried to
dissolve just from that made substances remain dissolvable, which is MeSO3H. Spectra result was
applied on BBLs, obtained and designated including into this to give them higher relative. At this
experimental investigation achieved the BBL is not fluorescent below illumination of UV-vis, at
the range of wavelength 353 nm in aqueous dispersion. But in aqueous dispersion BBL is
fluorescent due to the illumination UV-vis light and show red-orange fluorescent. dispersions
specifically give sharp absorptions within the visible range including the deep blue. Both explain
has a high absorption at nearly (560.2 nm) attributed to π-π*-transition including a small height at
(353 nm) attributed to n-π*-transition. Each of them demonstrates very narrow bandgap energy.
These corresponding the amount of energy and intensities of the each of one absorption maxima
differ. Unfortunately, cannot obey and rely on theoretical methodology associated with the second
peak, but the first peak is right and very close according to each basis sets for HF and DFT.

89
Figure 3.45. UV-vis spectra for different basis sets associated with HF and DFT.
Can calculate the ratio of light while transmitted or path through the transparent material, the
whole amount of light where transmittance through the transparent material is identical with the
complete incident light strikes the material, less the amount of light scattered and some of the light
absorbed. From the UV-vis state, it is possible to calculate, and estimate in range (200-2000) nm
of light transmittance higher a wavelength but the sample should be the film or casts in Figure 3.44.
While the solvent becomes darker that is indicates the transmittance is at a lower state of the visible
light region, and higher absorbing visible light. From the absorbance state, can calculate the ratio
of light energy absorbance from 0 to 1. If the absorbance is equal to zero that is, means the light
wholly passed through the solution and has a higher transmittance, but while the value of
absorbance is equal to 1 that is indicates the transmittance at in the lower level and the light was
absorbed by the solution (the resolution is opaque).
Transmittance plays a role in the optical transition of a material. Figure 3.46, gives the
transmittance spectra of the BBL solution. As seen in Figure 3.46, the BBL shows two small peaks
at 297.4 (NUV region) and 409.1 nm (V region). The transmittance of the BBL sharply increases
from about 600 to 820 nm.

90
Figure 3.46. The curves of the transmittance wavelength in methane sulfuric acid solution of BBL.
The optical band gap (Eg) is the most important parameter for optical properties and
fabrication of optoelectronic devices. The Eg of optical transitions for semiconductor polymers.
𝛼(ℎ𝑣) = 𝐴∗(ℎ𝑣 − 𝐸𝑔)1/2
(3.5)
Connecting to the Tauc plot to determine the BBL band gap energy is a very useful method used to
distinguish the functional optical properties of materials. The most important characteristics of
semiconductors are bandgap energy because the bandgap energy can estimate and evaluate other
cartoonists such as electrophysiology, stiffness, hardness, and the amount of materials needed to
make dyes. where α is absorption coefficient, hv is photon energy, A* is a constant and Eg is the
forbidden bandwidth. For BBL material, the best fitting was found to be for the plot of (αhʋ)1/2
versus photon energy (E). That is, the character of the optical transition is the allowed direct
transition and kind of the optical bandgap (Egd). Obtained allowed direct optical bandgap from
linear regions is equal to (1.826 eV) to the BBL molecule, while it was dissolved in methane sulfuric
acid solvent, as illustrated in Figure 3.46. the experimental result is extremely near to real value
and the proper value of the BBLs bandgap energy. Corresponds to theoretical investigation the
result of bandgap energy is differ from one basis set to another but the very close result can expect
from (6-31G) basis set in DFT method the bandgap energy is 2.25 eV can accept the value. The
difference was between them just equal to (0.424 eV).

91
Figure 3.47. Experimental Tauc plot result of BBL associate with UV-vis.
Figure 3.48. Determine the band gap energy of BBL corresponds to Tauc plot for different basis set.
Experimental Tauc plot result of BBL associate with UV-vis is seen 3.47. HOMO and
LUMO are Molecular Orbitals, and both of them the energy can at origin be computed with accurate
calculation, including every particle in the molecule that is participating in interactions. Determined
the bandgap energy with HOMO and LUMO this method is practiced. Determine the band gap
energy of BBL corresponds to Tauc plot for different basis set is seen in the Figure 3.48. Associate
with the HOMO and LUMO, the theoretical method applied for three different basis set (3-21G, 6-
31G, 6-311G) for HF and DFT respectively are (8.22661091, 8.3948995, 8.09109714, 0.91238483,
2.85688289, 2.90184502) but the best method is 3-21G basis set for DFT and the difference
between it and experimentally just equal to (0.91 eV)

4. CONCLUSION
The purpose of this thesis is to explore the electronic and optical properties of BBL in the quantum
computational application and to correlate with HF and DFT. The BBLs energy gap determined,
by uses a different basis set and showed the difference result, between the results of each basis set.
BBL joined polymer ladder has a specific structure and interested in applications. Quantum
computational theory and the method of stimulation have an attractive view from scientists because
they have a small coast to predict the properties of the molecule and chemical behaviors. The real
range gap energy in BBL is equal to 1.8 volts, but the result of each basis set is different. Some
basis set differs from the real value of the band gap, as DFT techniques provide a system of study
levels, anywhere that remains neutral in calculation validity. Also, we completed ab initio
computations and described over the form that lowest energy at the pristine electronic transition of
ideal BBL. Certain estimates predict the excitation energy state to slightly smaller than 2 eV, in the
limited arrangement among determined spectroscopic electronic transitions. This investigation of
quantum computational calculations toward thermoelectric properties should explain, how this
accuracy of quantum thermochemical calculations remains connected based on a basis set,
practiced within the improvement of these geometric shapes. This can be understood to be deprived
of the important challenge of accuracy, and this is also effective in improving the carbonate
geometry including a weaker level of assumption also when a more valuable state is run at the time
of energy calculation. This study contains a BBL molecule, that is complicated for HF due to the
large error and reduction of energy required to change the calculation. Comparatively representing,
the complexity explained for a particular molecule, and the expected approximate calculation to
accuracy are quite constant. It obtained concluded that BBL is a challenge in principle, including
increasing the complexity of the molecule as well as reducing any energy of atomizing energies.
According to experimental result associate with the UV-vis light, determined the ratio of
absorbance and transmittance of light that passed through the BBL molecule, and found the value
of band gap energy experimentally, where BBL was solved in methane sulfuric acid and it is not
dissolved in some solvents such as sulfuric acid and that was not dissolved in water because it has
a rigid rod surface and planer backbone. Theoretical method results with experiments are identical
and have many similarities in some of the resulting results, especially in the DFT method because
they are more accurate than HF approximation.
This study demonstrated the optical properties of BBL, which is very proper to mechanical
application and manufacture in instruments. Corresponds the band gap energy value is equal
to1.825 eV, displayed BBL has become a good semiconductor at room temperature, at the pristine
the BBL molecules was an insulator. But with overheating the BBL, that has been transformed to
a semiconductor from insulator situation.

REFERENCES [1] Young, D., (2004). Computational chemistry: a practical guide for applying techniques to real world
problems, John Wiley & Sons, New Jersey, USA.
[2] Sherrill, C.D. (2000). An introduction to Hartree-Fock molecular orbital theory, School of
Chemistry and Biochemistry Georgia Institute of Technology, Atlanta, USA.
[3] Visscher, L., Enevoldsen, T., Saue, T., Jensen, H.J.A., and Oddershede, J. (1999). Full four‐
component relativistic calculations of NMR shielding and indirect spin–spin coupling tensors in
hydrogen halides, Journal of computational chemistry, 1262-1273.
[4] VeszpreÂmi, T. and FeheÂr, M. (1999). Quantum Chemistry, Fundamentals to Applications
Kluwer, Dordrecht, Springer US, New York, USA.
[5] Cook, D., (1998). Handbook of Computational Quantum Chemistry Oxford University Press, New
York, USA.
[6] Mechanics, M.Q., PW Atkins and RS Friedman, (1997). Oxford University Press, New York, USA.
[7] Parr, R.G., (1980). Density functional theory of atoms and molecules, in Horizons of Quantum
Chemistry, Springer. 5-15.
[8] Sholl, D. and Steckel, J.A., (2011). Density functional theory: a practical introduction, John Wiley
& Sons, New Jersey, USA.
[9] Seifert, G. and Joswig, J.O. (2012). Density‐functional tight binding—An approximate density‐
functional theory method, Wiley Interdisciplinary Reviews: Computational Molecular Science, 456-
465.
[10] Hammond, B.L., Lester, W.A., and Reynolds, P.J., (1994). Monte Carlo methods in ab initio
quantum chemistry, World Scientific, New Jersey, USA.
[11] Swan, P. (1955). The relation between zero-energy scattering phase-shifts, the Pauli exclusion
principle and the number of composite bound states, Proceedings of the Royal Society of London.
Series A. Mathematical and Physical Sciences, 10-33.
[12] Galanakis, I., Mavropoulos, P., and Dederichs, P.H. (2006). Electronic structure and Slater–Pauling
behaviour in half-metallic Heusler alloys calculated from first principles, Journal of Physics D:
Applied Physics, 765.
[13] Goddard, J.D., Handy, N.C., and Schaefer III, H.F. (1979). Gradient techniques for open‐shell
restricted Hartree–Fock and multiconfiguration self‐consistent‐field methods, The Journal of
Chemical Physics, 1525-1530.
[14] Korchowiec, J., Gu, F.L., and Aoki, Y. (2005). Elongation method at restricted open‐shell Hartree–
Fock level of theory, International journal of quantum chemistry, 875-882.
[15] Murray-Rust, P. and Glusker, J.P. (1984). Directional hydrogen bonding to sp2-and sp3-hybridized
oxygen atoms and its relevance to ligand-macromolecule interactions, Journal of the American
Chemical Society, 1018-1025.
[16] Dovesi, R., Civalleri, B., Roetti, C., Saunders, V.R., and Orlando, R. (2005). Ab initio quantum
simulation in solid state chemistry, Reviews in computational chemistry,. 1-125.
[17] Garza, J., Vargas, R., and Vela, A. (1998). Numerical self-consistent-field method to solve the Kohn-
Sham equations in confined many-electron atoms, Physical Review E, 3949.

94
[18] Marques, M.A., Ullrich, C.A., Nogueira, F., Rubio, A., Burke, K., and Gross, E.K., (2006). Time-
dependent density functional theory, Springer-Verlag Berlin Heidelberg, Germany.
[19] Tsuneda, T. (2014). Density functional theory in quantum chemistry, Springer, Japan.
[20] Kohn, W. (1999). Nobel Lecture: Electronic structure of matter—wave functions and density
functionals, Reviews of Modern Physics, 1253.
[21] Gilbert, T. (1975). Hohenberg-Kohn theorem for nonlocal external potentials, Physical Review B,
2111.
[22] Savin, A., Umrigar, C.J., and Gonze, X. (1998). Relationship of Kohn–Sham eigenvalues to
excitation energies, Chemical Physics Letters, 391-395.
[23] Harbola, M.K. and Sahni, V. (1989). Quantum-mechanical interpretation of the exchange-
correlation potential of Kohn-Sham density-functional theory, Physical review letters, 489.
[24] Schönhammer, K. (1988). Nonlinear friction in a homogenous electron gas: Exact results, Physical
Review B, 7735.
[25] Misra, P. and Dubinskii, M.A., (2002). Ultraviolet spectroscopy and UV lasers, Taylor & Francis
publishing group, London, UK.
[26] Scheinmann, F., (2013). An introduction to spectroscopic methods for the identification of organic
compounds: Mass spectrometry, ultraviolet spectroscopy, electron spin resonance spectroscopy,
nuclear magnetic resonance spectroscopy (recent developments), use of various spectral methods
together, and documentation of molecular spectra, Elsevier, University of Salford, England.
[27] Muthu, S., Rajamani, T., Karabacak, M., and Asiri, A. (2014). Vibrational and UV spectra, first
order hyperpolarizability, NBO and HOMO–LUMO analysis of 4-chloro-N-(2-methyl-2, 3-
dihydroindol-1-yl)-3-sulfamoyl-benzamide, Spectrochimica Acta Part A: Molecular and
Biomolecular Spectroscopy, 1-14.
[28] Günzler, H. and Gremlich, H.-U. (2002). IR spectroscopy. An introduction, John Wiley & Sons,
New Jersey, USA.
[29] Nikolic, G., (2011). Fourier Transforms: New Analytical Approaches and FTIR Strategies, BoD–
Books on Demand, IntechOpen, London, UK.
[30] Maltoni, D., Maio, D., Jain, A.K., and Prabhakar, S., (2009). Handbook of fingerprint recognition,
Springer Science & Business Media, Springer-Verlag London, UK.
[31] Pretsch, E., Clerc, T., Seibl, J., and Simon, W., (2013). Tables of spectral data for structure
determination of organic compounds, Springer Science & Business Media, Springer-Verlag Berlin
Heidelberg, Germany.
[32] Politzer, P. and Murray, J.S. (1991). Molecular electrostatic potentials and chemical reactivity,
Reviews in computational chemistry, 273-312.
[33] Politzer, P. and Truhlar, D.G., (2013). Chemical applications of atomic and molecular electrostatic
potentials: reactivity, structure, scattering, and energetics of organic, inorganic, and biological
systems, Springer Science & Business Media, Springer US, New York, USA.
[34] Mason, M. and Weaver, W. (1929). The electromagnetic field, Dover Publications, New York, USA.
[35] Bergmann, D. and Hinze, J., (1987). Electronegativity and charge distribution, in Electronegativity,
Springer. 145-190.

95
[36] Soukoulis, C.M., (2012). Photonic band gap materials, Springer Science & Business Media,
Springer Netherlands, Holland.
[37] Van Deusen, R. (1966). Benzimidazo‐benzophenanthroline polymers, Journal of Polymer Science
Part B: Polymer Letters,. 211-214.
[38] Van Deusen, R., Goins, O., and Sicree, A. (1968). Thermally stable polymers from 1, 4, 5, 8‐
naphthalenetetracarboxylic acid and aromatic tetraamines, Journal of Polymer Science Part A‐1:
Polymer Chemistry, 1777-1793.
[39] Arnold, F.E. and Van Deusen, R. (1969). Preparation and properties of high molecular weight,
soluble oxobenz [de] imidazobenzimidazoisoquinoline ladder polymer, Macromolecules, 497-502.
[40] Arnold, F. and Van Deusen, R. (1971). Unusual film‐forming properties of aromatic heterocyclic
ladder polymers, Journal of Applied Polymer Science, 2035-2047.
[41] Powell, J.W. and Chartoff, R.P. (1974). Viscoelastic properties and stability of BBL ladder
polymers, Journal of Applied Polymer Science,. 83-91.
[42] Sicree, A., Arnold, F., and Van Deusen, R. (1974). New imidazoisoquinoline ladder polymers,
Journal of Polymer Science: Polymer Chemistry Edition, 265-272.
[43] Wilbourn, K. and Murray, R.W. (1988). The dc redox versus electronic conductivity of the ladder
polymer poly (benzimidazobenzophenanthroline), The Journal of Physical Chemistry, 3642-3648.
[44] Quinto, M., Jenekhe, S.A., and Bard, A.J. (2001). Polymer films on electrodes. 30. Electrochemistry
and scanning electrochemical microscopy characterization of benzimidazolebenzophenanthroline-
type ladder (BBL) and semiladder (BBB) polymer films, Chemistry of materials, 2824-2832.
[45] David J. Irvin, John D. Stenger‐Smith, Gregory R. Yandek, Jamie R. Carberry, Daniel A. Currie,
Nikoleta Theodoropoulou, Jennifer A. Irvin. (2012). Enhanced electrochemical response of solution‐deposited n‐doping polymer via cocasting with ionic liquid, Journal of Polymer Science Part B:
Polymer Physics,. 1145-1150.
[46] Manoj, A., Alagiriswamy, A., and Narayan, K, (2003). Photogenerated charge carrier transport in
p-polymer n-polymer bilayer structures, Journal of applied physics, 4088-4095.
[47] Jenekhe, S.A., de Paor, L.R., Chen, X.L., and Tarkka, R.M. (1996). Photoinduced electron transfer
in binary blends of conjugated polymers, Chemistry of materials, 2401-2404.
[48] Chen, X.L. and Jenekhe, S.A. (1997). Bipolar conducting polymers: Blends of p-type polypyrrole
and an n-type ladder polymer, Macromolecules,. 1728-1733.
[49] Babel, A., Zhu, Y., Cheng, K.F., Chen, W.C., and Jenekhe, S.A. (2007). High electron mobility and
ambipolar charge transport in binary blends of donor and acceptor conjugated polymers, Advanced
Functional Materials, 2542-2549.
[50] Park, J.-H., Choudhury, A., Farmer, B., Dang, T., and Park, S.-Y. (2012). Chemically modified
graphene oxide/polybenzimidazobenzophenanthroline nanocomposites with improved electrical
conductivity, Polymer,. 3937-3945.
[51] Jun, Y.-w., Casula, M.F., Sim, J.-H., Kim, S.Y., Cheon, J., and Alivisatos, A.P. (2003). Surfactant-
assisted elimination of a high energy facet as a means of controlling the shapes of TiO2 nanocrystals,
Journal of the American Chemical Society,. 15981-15985.
[52] Hong, S.Y., Kertesz, M., Lee, Y.S., and Kim, O.K. (1992). Geometrical and electronic structures of
a benzimidazobenzophenanthroline-type ladder polymer (BBL), Macromolecules, p. 5424-5429.

96
[53] Lindle, J., Bartoli, F., Hoffman, C., Kim, O.K., Lee, Y., Shirk, J., and Kafafi, Z. (1990). Nonlinear
optical properties of benzimidazobenzophenanthroline type ladder polymers, Applied Physics
Letters, p. 712-714.
[54] Alam, M.M. and Jenekhe, S.A. (2004). Efficient solar cells from layered nanostructures of donor
and acceptor conjugated polymers, Chemistry of materials, p. 4647-4656.
[55] Manoj, A. and Narayan, K. (2003). Photovoltaic properties of polymer p–n junctions made with
P3OT/BBL bilayers, Optical Materials, p. 417-420.
[56] Basavaraj, V., Manoj, A., and Narayan, K. (2003). Solution processing of active semiconducting
polymers and conducting polymer anodes for fabricating photodetectors, IEE Proceedings-Circuits,
Devices and Systems, p. 552-555.
[57] Jernigan, J., Wilbourn, K., and Murray, R. (1987). A benzimidazobenzophenanthroline polymer
molecular transistor fabricated using club sandwich electrodes, Journal of electroanalytical
chemistry and interfacial electrochemistry, p. 193-200.
[58] Lipomi, D.J., Ilievski, F., Wiley, B.J., Deotare, P.B., Loncar, M., and Whitesides, G.M. (2009).
Integrated fabrication and magnetic positioning of metallic and polymeric nanowires embedded in
thin epoxy slabs, ACS nano, p. 3315-3325.
[59] Chiklis, C.K. and Grasshoff, J.M. (1970). Swelling of thin films. I. Acrylamide–N‐
isopropylacrylamide copolymers in water, Journal of Polymer Science Part A‐2: Polymer Physics,
p. 1617-1626.
[60] Hirvonen, S.-P. (2015). Enhancing The Processability Of Poly (Benzimidazobenzophenanthroline)
Through Chemical Modification, Department of Chemistry, University of Helsinki, Finland.
[61] Bittner, E.R., Ramon, J.G.S., and Karabunarliev, S. (2005). Exciton dissociation dynamics in model
donor-acceptor polymer heterojunctions. I. Energetics and spectra, The Journal of chemical physics,
p. 214719.
[62] Roberts, M.F. and Jenekhe, S.A. (1994). Lewis acid coordination complexes of polymers: 3. Poly
(benzobisimidazobenzophenanthroline) ladder and semiladder polymers, Polymer, p. 4313-4325.
[63] Narayan, K., Taylor, B., Spry, R., and Ferguson, J. (1994). Photoconductivity of the ladder polymer
BBL, Journal of luminescence, p. 482-484.
[64] Ramon, J.G.S. and Bittner, E.R. (2006). Exciton Regeneration Dynamics in Model Donor− Acceptor
Polymer Heterojunctions, The Journal of Physical Chemistry B, p. 21001-21009.
[65] Antoniadis, H., Abkowitz, M., Osaheni, J., Jenekhe, S., and Stolka, M. (1993). Generation and drift
of photocarriers in a conjugated ladder polymer, Synthetic metals, p. 149-157.
[66] Yu, L., Chen, M., and Dalton, L.R. (1990). Ladder polymers: recent developments in syntheses,
characterization, and potential applications as electronic and optical materials, Chemistry of
materials, p. 649-659.
[67] Jenekhe, S.A. and Tibbetts, S.J. (1988). Ion implantation doping and electrical properties of high‐
temperature ladder polymers, Journal of Polymer Science Part B: Polymer Physics, p. 201-209.
[68] Tsuchida, E., Ohno, H., and Kobayashi, N. (1988). Single-ion conduction in poly [(oligo
(oxyethylene) methacrylate)-co-(alkali-metal methacrylates)], Macromolecules, p. 96-100.
[69] Briseno, A.L., Mannsfeld, S.C., Shamberger, P.J., Ohuchi, F.S., Bao, Z., Jenekhe, S.A., and Xia, Y.
(2008). Self-assembly, molecular packing, and electron transport in n-type polymer semiconductor
nanobelts, Chemistry of materials, 4712-4719.

97
[70] Wilbourn, K. and Murray, R.W. (1988). The electrochemical doping reactions of the conducting
ladder polymer benzimidazobenzophenanthroline (BBL), Macromolecules, 89-96.
[71] Carraher Jr, C.E., (2003). Seymour/Carraher's polymer chemistry, Taylor & Francis publishing
group, London, UK.
[72] Sanchez, I.C. and Lacombe, R.H. (1978). Statistical thermodynamics of polymer solutions,
Macromolecules, American Chemical Society Publications, 1145-1156.
[73] Mark, J.E., (2007). Physical properties of polymers handbook, Springer Nature, Switzerland,
[74] Wool, R. and Sun, X.S., (2011). Bio-based polymers and composites, Academic Press, Elsevier,
USA.
[75] Billmeyer, F.W. and Billmeyer, F.W. (1984). Textbook of polymer science, John Wiley & Sons,
New Jersey, USA.
[76] Shah, D.O., (2012). Improved oil recovery by surfactant and polymer flooding, Academic Press,
Elsevier, USA.
[77] Salaneck, W.R., Seki, K., Kahn, A., and Pireaux, J.-J., (2001). Conjugated Polymer and Molecular
Interfaces: Science and Technology for Photonic and Optoelectronic Application, Taylor & Francis
publishing group, London, UK..
[78] Pospíšil, J., (1995). Aromatic and heterocyclic amines in polymer stabilization, in Polysoaps
/Stabilizers/ Nitrogen-15 NMR, Springer-Verlag Berlin Heidelberg. 87-189.

CURRICULUM VITAE
Dyari Mustafa MAMAND
PERSONAL INFORMATIONS
Birth of Place : Rania, Sulaymaniyah, Iraq
Birth of Date : 1990
Nationalty : Kurd
E-mail : [email protected]
Languages : English (B2)
EDUCATION
Bachelor : Salahaddin University, Science Faculty, Department of 2014
High School : Chawrqurna, Sulaymaniyah City, 2009
RESEARCH EXPERIENCES
✓ GaussView Software and Origin Lab Software