
Resource Management of Bridge Deck Rehabilitation: Jacques Cartier Bridge Case Study
Upload
khangminh22Category
view
5download
0
International Journal of Civil Engineering, Vol. 13, No. 1, Transaction A: Civil Engineering, March 2015
Finite element modeling of incremental bridge launching and study on behavior of the bridge during construction stages
A. Shojaei1, H. Tajmir Riahi
2,*, M. Hirmand
3
Received: January 2014, Accepted: April 2014
Abstract
Incremental launching is a widespread bridge erection technique which may offer many advantages for bridge designers.
Since internal forces of deck vary perpetually during construction stages, simulation and modeling of the bridge behavior, for
each step of launching, are tedious and time consuming tasks. The problem becomes much more complicated in construction
progression. Considering other load cases such as support settlements or temperature effects makes the problem more intricate.
Therefore, modeling of construction stages entails a reliable, simple, economical and fast algorithmic solution. In this paper, a
new Finite Element (FE) model for study on static behavior of bridges during launching is presented. Also a simple method is
introduced to normalize all quantities in the problem. The new FE model eliminates many limitations of some previous models. To
exemplify, the present model is capable to simulate all the stages of launching, yet some conventional models of launching are
insufficient for them. The problem roots from the main assumptions considered to develop these models. Nevertheless, by using
the results of the present FE model, some solutions are presented to improve accuracy of the conventional models for the initial
stages. It is shown that first span of the bridge plays a very important role for initial stages; it was eliminated in most researches.
Also a new simple model is developed named as "semi infinite beam" model. By using the developed model with a simple
optimization approach, some optimal values for launching nose specifications are obtained. The study may be suitable for
practical usages and also useful for optimizing the nose-deck system of incrementally launched bridges.
Keywords: Incremental bridge launching, Finite element method, Nose – deck system, Optimization, Semi infinite beam model.
1. Introduction
Bridge piers are constructed first in incremental bridge
launching method and after that, deck segments are pushed
forward above them until they reach their final positions
(Fig. 1). Constructing, curing, pre-stressing and pushing
the segments are done on a construction platform close to
bridge abutments [2, 3]. These segments may be over a
half- length of the bridge spans; therefore, number of
structural weak points in junctions is reduced
considerably. Some other advantages such as high speed
working due to eliminating casting molds, reducing
manpower and constructional costs, proper and accurate
supervisions, no needing to block obstacles under the
bridge during launching and minimizing the destruction of
the environment in construction location, make
incremental launching more competitive in comparison to
other erection techniques [4-6]. Temporary tensions
occurred during construction stages may be different and
much more critical than those in service life.
* Corresponding author: [email protected]
1 Graduate student of structural engineering, Isfahan University
of Technology, Isfahan, Iran
2 Assistant professor, University of Isfahan, Isfahan, Iran
3 Graduate student of structural Engineering, Sharif University
of Technology, Tehran, Iran
Therefore, an appropriate method should be used to
reduce these forces and thus avoid wasting the advantages
of the method by using overdesigned structural members.
Different methods have so far been introduced by engineers
and researchers for this purpose. Among them, using a nose-
deck system, owing to its simplicity and efficiency, has been
known as the standard method. In this sense, a light nose
girder, attached in front of the deck, is used to reduce the
cantilever moment of deck at its end [2]. Nose specifications
have significant effects on the nose-deck interaction.
Researchers have focused on two main categories of
study for incremental bridge launching. The first category is
related to study on the nose-deck interaction, and it pertains
to find some proper values for nose specifications. To this
end, a simple model of the nose-deck system is required.
Marchetti used the elastic load analyze method to present a
simplified model for launched bridges [7]. This model
became as a prototype model for other researches. For
instance, Rosignoli studied on this model to investigate the
nose-deck system and find optimal specifications of nose
via a try and error method [4]. Also Fontan et al. discussed
the optimal ranges of nose specifications by some
mathematical optimization approaches via Marchetti’s
model [8].
Structure-
Concrete
[ D
OI:
10.
2206
8/IJ
CE
.13.
1.11
2 ]
[ D
ownl
oade
d fr
om ij
ce.iu
st.a
c.ir
on
2022
-08-
25 ]
1 / 14

A. Shojaei, H. Tajmir Riahi, M. Hirmand 113
Fig. 1 Incremental bridge launching [1]
The second category is related to developing proper
methods for simulating stages of construction during
launching. Analyzing movement of a superstructure over
fixed piers needs to consider different schemes for
arrangement of the piers. Nevertheless, the best method is the
fastest one which works with repetitive algorithms and can be
easily implemented in computer programming. The method
should provide most information in the least possible time.
Rosignoli simulated the incremental bridge launching with
Reduced Transfer Matrix (RTM) method [9]. Sasmal et al.
presented Transient Transfer Matrix (TTM) method for
structural analysis of launched bridges [10]. Sasmal and
Ramanjaneyulu developed this method for pre-stressed
concrete bridges [11]. Arici and Granata extended the TTM
method to study construction stages of curved box girder
bridges with constant radius [12]. RTM and TTM methods
are generally inefficient for parametric study of nose-deck
interaction. Therefore, majority of the researchers have shown
their results only for some case studies.
The present study uses finite element method to model
incremental launching for both aforementioned categories. It
will be shown that not only does this method have the
advantages of the RTM and TTM methods but also it is
much more systematic and convenient for computer
programming. Also a simple method is used to normalize all
the parameters involved in the model. An extensive study is
done along with considering some new factors such as shear
strain and temperature gradient effects; they were eliminated
in some previous studies. It will be shown that studying on
the rotation of deck sections leads the analyzer to evaluate
the accuracy of Marchetti’s model easily. Therefore, some
solutions are suggested to improve the accuracy of this
conventional model for initial stages of launching as well as
forthcoming ones. The effects of first span length and
platform of the construction, on the structural behavior of
the bridge, are included. Some solutions are suggested to
optimize the bridge performance by taking these two factors
in to account. Likewise, a new simplified model is
developed named as “semi-infinite beam” model. The
model is useful for parametric studies on the nose-deck
interaction. In the final analysis, a simple mathematical
approach is investigated to find some proper ranges for
optimal design of the nose girders.
2. Assumptions and Definitions of the Parameters
In this study some assumptions are considered for
generating the finite element model. This section gives
some explanations about assumptions and definitions used
here.
2. 1. Arrangement scheme of piers
Various schemes of pier arrangement can be
considered in the model. But it is more reasonable to set
the arrangement of piers based on optimum static
performance of the bridge in service time. Constructional
stresses can be controlled by other practices such as using
a light nose girder attached in front of deck, pre-stressing
or using some temporary piers. In the present study, the
bridge structure consists of some identical mid spans and
shorter end ones. Most bridges with continuous system
were constructed according to this pattern around the
world due to its structural and architectural benefits.
2. 2. Definition of stage, station and phase
The nose tip passes through all spans during launching
and the number of launching spans equals the launching
stage. The number of piers behind the launching stage is
defined as the station. For each stage of launching two
different phases can be considered. Phase one refers to the
position that nose tip has not reached the next pier and the
nose-deck system has a cantilever scheme. This phase lasts
till nose tip reaches the next pier. Phase two starts after
that and lasts till nose girder passes the pier completely.
Definitions of stage, station and phase are shown in Fig. 2.
Fig. 2 Definition of stage, station and phase
St. N
Phase 1-Stage N Phase 2-Stage N
thN Span
St. N+1
[ D
OI:
10.
2206
8/IJ
CE
.13.
1.11
2 ]
[ D
ownl
oade
d fr
om ij
ce.iu
st.a
c.ir
on
2022
-08-
25 ]
2 / 14

114 International Journal of Civil Engineering, Vol. 13, No. 1, Transaction A: Civil Engineering, March 2015
2. 3. Specifications of launching nose
Although majority of noses are constructed with
tapered sections, in this study it is assumed that the nose
girder is prismatic. Using mean values of the tapered nose
specifications for an equivalent prismatic nose will
introduce a very small error (less than 2%) [13, 14];
therefore, this assumption is accurate enough. Flexural
stiffness, dead load, length and height of nose are defined
by n nE I , nq ,
nL and nH , respectively.
2. 4. Normalizing the formulations
In this study, three main specifications of deck
including flexural stiffness (D DE I ), dead load ( Dq ) and
mid spans length ( DL ) have been considered as the
measurement scales i.e. their values are assumed to be
unit. Any other quantity in the problem can be stated
normalized to these values. Therefore, nL , nq , n nE I and
nH , in normalized dimensionless formats, are presented
by four dimensionless parameters as L (ratio of nose
length to mid span length), q (ratio of nose load to deck
load), EI (ratio of nose flexural stiffness to deck flexural
stiffness) and HN (ratio of nose section height to mid
span length). Such an approach leads to expressing the
unknown forces in a dimensionless format as a coefficient
of deck characteristics. For instance, internal moment for
each section of deck is obtained as a coefficient of 2
DDLq .
Length of end spans and deck height, in the normalized
format, are denoted by 1 and HD , respectively. This
method is so beneficiary and useful for parametric studies
on the nose-deck interaction.
2. 5. Deck specifications
It is assumed that the bridge is straight and without any
horizontal curvilinear. In most cases, especially for
highway bridges, adoption of box girders is usual. Since
box girders have high torsional rigidity, the torsional
moment effect is not critical for these bridges during
launching. Therefore, the straight beam theory can be
sufficient [9]. It is also assumed that the mechanical
specifications of deck including flexural rigidity and dead
load are constant along its length. Since all the deck sections periodically experience
negative and positive moments during launching, it is
reasonable to use a central prestressing scheme. This
central prestressing will not affect bending moment of
deck; hence the launching internal forces can be calculated
irrespective to this prestressing. In practice, after the
launching time, this central prestressing will be replaced
with an appropriate parabolic pre-stressing scheme.
Pre-stressed composite bridges may experience
considerable deformations due to shear slip of the shear
studs located between concrete slab and steel girders [2,
15, 16]. However, the effect of shear slip is not considered
and only shear strain effect is considered here.
2. 6. Modeling the construction platform
During launching, one or two deck segments are kept
on the construction platform usually. When nose reaches
piers, axial stiffness of platform can be neglected in
comparison to very high axial stiffness of the bridge piers.
Therefore, platform segments have a cantilever behavior
during lunching, and the effects of segments on the
platform can be replaced with a concentrated shear force
and a moment on the first station. The average normalized
length of segments on the platform is denoted by 0 .
3. Finite Element Formulation
It is well-understood that the axial stiffness of the
bridge deck is high and its axial force is relatively small;
therefore, axial displacements are negligible and thus usual
beam elements are sufficient to model the continuous deck
of the bridge; for these elements axial degree of freedom is
not considered.
In this section, bold letters refer to matrix variables.
For a beam element, shown in Fig. 3, nodal forces vector,
r, and displacements vector, d, for a generic element are
defined as follow:
T
ji rrr ; T
i rr 21r , T
j rr 43r (1)
T
i jd d d ; T
i dd 21d , T
j dd 43d (2)
Fig. 3 The Beam element
The finite element formulation for a beam element, in
the view of stiffness method, can be written as:
dkrr . f ,
tqf rrr (3)
where k is the element stiffness matrix and fr is
summation of qr (equivalent element nodal forces vector
due to external distributed loads) and tr (equivalent
element nodal forces vector due to thermal loads). The
element stiffness matrix, by assuming all the properties to
be constant along the element, is as follows:
[ D
OI:
10.
2206
8/IJ
CE
.13.
1.11
2 ]
[ D
ownl
oade
d fr
om ij
ce.iu
st.a
c.ir
on
2022
-08-
25 ]
3 / 14

A. Shojaei, H. Tajmir Riahi, M. Hirmand 115
jjji
ijii
ss
ssk
(4)
where:
L
GAEIL
L
ii 3
24
6
612
s ,
L
GAEIL
L
ij 6
22
6
612
s ,
L
GAEIL
L
ji 6
22
6
612
s ,
L
GAEIL
L
jj 3
24
6
612
s (5)
GAEIL
EI
12
2
(6)
E and G are the modulus of elasticity and the shear
modulus of the material, I and A are the moment of
inertia and area of the section, L is the length of the
element and is the shear constant (ratio of the
maximum shear stress to the average shear stress at the
section). Considering a uniform distributed load on the
element and a linear thermal gradient within the element
section, qr and tr vectors can be written as:
T
q
qLqLqLqL
122122
22
r (7)
TTt
H
TEI1010
..
r (8)
where, q , T , H and T are the uniform
distributed load on the element per unit length, the
difference between the temperature at top and bottom of
the section, height of the section and the thermal
expansion coefficient, respectively.
As it was described before, the characteristics of the
structure should be written in a dimensionless format by
normalizing them on the basis of the deck specifications.
Therefore, the values of the parameters in the stiffness
matrix and load vectors should be written in a normalized
format.
Shear stiffness is only considered for the concrete deck
section, and it is neglected for the nose girder. The GA
term, which shows the effects of shear deformation in the
stiffness matrix, can be written in a normalized
dimensionless format as:
2. rsGA
; D
gyrr
L
r , 2 1s (9)
gyrr and are the radius of gyration of the deck
section and the Poisson’s ratio, respectively. To elucidate,
the stiffness matrix of first element (first bridge span), in a
parametric form, using equations (4-6), can be written as
follows:
To sum up, analysis of the whole structure can be
performed by solving the following system of
equations:
K.DRR f (11)
Where K is the global stiffness matrix, R is the
global nodal forces vector and fR is the global
equivalent nodal forces vector obtained by superposition
of external distributed loads and thermal loads, and D is
the global nodal displacement vector. Support settlements
can be directly taken into account; it suffice to replace
their normalized values in the appropriate row of D .
When numbering of the elements is started from the
first span of the bridge and continued one by one to the
last element, K and fR can be assembled as:
According to equation (12), the global stiffness
matrix is obtained banded and the calculation time of
solving equation (11) can be reduced significantly due
to narrow band width of K . A banded stiffness matrix
(which is the result of appropriate element numbering)
compensates its higher dimensions in comparison to
matrices used in RTM and TTM methods. Moreover,
the RTM and TTM methods require repetitive
computations and satisfying boundary conditions of
each element in each step, while in the FE method
boundary conditions are directly imposed and the
solution is thoroughly summarized to build the global
stiffness matrix and the nodal forces vectors. As a
repercussion, the FE method may be more suitable for
systematic computer analysis.
[ D
OI:
10.
2206
8/IJ
CE
.13.
1.11
2 ]
[ D
ownl
oade
d fr
om ij
ce.iu
st.a
c.ir
on
2022
-08-
25 ]
4 / 14

116 International Journal of Civil Engineering, Vol. 13, No. 1, Transaction A: Civil Engineering, March 2015
1
3 2 2 2 3 2 2 2
1 1 1 1 1 1 1 1
1 1
2 2 2 2 2 2
1 1 1 1 1 1 1 1
3 2 2
1 1 1
12 6 12 6
12 12 12 12
3 6 3
12 12 12
12 6
12
element
EI EI EI EI
EI r s EI r s EI r s EI r s
EI EI EI EI EI
EI r s EI r s EI r s
EI EI
EI r s
K
2
1
1
2 2
1 1 1
3SYM
12
EI r s
EI EI
EI r s
(10)
elements ofnumber : For ;
1
0)(
)22:32,2:12(
)2:12,22:32(
)2:12,2:12(
1
1
1
a
otherwise
aaaa
aaaa
aaaa
aelement
aelement
aelementaelement
ji
ij
iijj
K
sK
sK
ssK
(12)
aelement
if
aelement
jff aa
rrR 1
)2:12( (13)
4. Nose-Deck Interaction
In contrary to simplified conventional model that
assumes infinite number of spans behind a station, the
present FE model does not have this limitation. Fig. 4 shows
moment variation of fifteenth station for different values of
EI with L and
q as 0.5 and 0.1, respectively. This
station is selected because it can represent stations with
infinite number of spans behind them. Nose end distance
from the under study station is denoted by that is
normalized based on the length of mid spans.
According to Fig. 4, in phase 1 (zone A) internal
moment of this section is independent of the nose flexural
stiffness; therefore, curves are completely overlapped in
this region. In contrary to phase 1, in phase 2 (zone B), the
moment is dependent on EI significantly.
Optimum specifications of the nose should be chosen
in a manner that the maximum moment of deck in the
foremost pier in phases 1 and 2 of launching, denoted by
1M and 2M in Fig. 4, approaches to -1/12 as much as
possible [8]. Moreover, not any maximum moment should
emerge along the deck that exceeds that of 1M and
2M
(marked with triangles). As shown in Fig. 4, choosing a
sufficiently large value for EI may control the latter
criterion. It should be noted that the station moment in
zone C (moment of second station before launching span)
is also dependent on the nose specifications. An optimal
design for nose specifications must prevent the maximum
moment of zone C to be more critical than maximum
moment of zones A and B. More complexities arise out of
optimization of nose specifications due to interdependency
of the nose characteristics. Therefore, an exact and
effective optimization requires mathematical approaches
along with difficult engineering assessments. Fontan et al.
completely discussed this problem in a mathematical point
of view [8]. However, in Section 7, a brief investigation
into optimization of the nose specification via a simple and
insightful approach will be presented.
0 0.5 1 1.5 2 2.5 3-0.16
-0.14
-0.12
-0.1
-0.08
-0.06
-0.04
-0.02
0
1/12
0.100EI
0.200EI
0.050EI
0.025EI
A B C
2F
ifte
enth
Sta
tion M
om
ent
DD
Mq
L
()
1M
2M
Fig. 4 Moment variation of fifteenth station for βL=0.5, βq=0.1 and different values of βEI
[ D
OI:
10.
2206
8/IJ
CE
.13.
1.11
2 ]
[ D
ownl
oade
d fr
om ij
ce.iu
st.a
c.ir
on
2022
-08-
25 ]
5 / 14

A. Shojaei, H. Tajmir Riahi, M. Hirmand 117
Fig. 5 shows the variation of fifteenth station moment
in fifteenth stage for different values of L and constant
values of EI and q . Also Fig. 6 shows the variation of
this station for different values of q and constant values
of EI and L . According to these figures, increscent of
q has an identical effect with decreasing of L on
performance of the system. It can be concluded that larger
values for q require larger values for length of the nose
girder to achieve the equality of 1M and 2M (Fig. 4).
Hence, for each value of q there is a proper value for
L which causes this matter. Some compatible values for
nose specifications which make its performance
approximately optimum during launching are as
0.65L , 0.1q and 0.2EI . It should be
remarked here that these values are rather used in practice,
and they have been suggested by some of the researchers
in the literature [2, 5]. Fig. 7 shows the fifteenth station
moment obtained by these well-known values of nose
specifications. It should be noted that the yellow mark in
the figure indicates the maximum moment of station for
fifteenth stage of launching. Hereinafter, these values are
considered for nose specifications to study on the effect of
other parameters that governs the nose-deck interaction.
0 0.2 0.4 0.6 0.8 1 1.2-0.16
-0.14
-0.12
-0.1
-0.08
-0.06
-0.04
-0.02
0
2F
ifte
enth
Sta
tion M
om
ent
DD
Mq
L
(
)
1/12
0.5L
0.6L
0.7L
0.8L
Fig. 5 Variation of fifteenth station moment in fifteenth stage for βEI =0.15, βq=0.1 and different values of βL
0 0.2 0.4 0.6 0.8 1 1.2-0.16
-0.14
-0.12
-0.1
-0.08
-0.06
-0.04
-0.02
0
2F
ifte
enth
Sta
tion M
om
ent
DD
Mq
L
(
)
1/12
0.10q
0.20q
0.05q
0.15q
Fig. 6 variation of fifteenth station moment in fifteenth stage for βEI =0.2, βL=0.65 and different values of βq
[ D
OI:
10.
2206
8/IJ
CE
.13.
1.11
2 ]
[ D
ownl
oade
d fr
om ij
ce.iu
st.a
c.ir
on
2022
-08-
25 ]
6 / 14

118 International Journal of Civil Engineering, Vol. 13, No. 1, Transaction A: Civil Engineering, March 2015
0 0.5 1 1.5 2 2.5 3-0.12
-0.1
-0.08
-0.06
-0.04
-0.02
0
2F
ifte
enth
Sta
tion M
om
ent
DD
Mq
L
(
)
1/12
1M 2M
Fig. 7 Variation of fifteenth station moment for optimum nose specifications
0 0.2 0.4 0.6 0.8 1 1.2-0.12
-0.1
-0.08
-0.06
-0.04
-0.02
0
2F
ifte
enth
Sta
tion M
om
ent
DD
Mq
L
(
)
1/12
0T
10T
10T
20T
20T
Fig. 8 Variation of fifteenth station moment with different values of temperature gradient
In order to show the temperature gradient effects on
performance of the nose-deck system, variation of
fifteenth station moment with different values of
temperature gradient is illustrated in Fig. 8. HN and
HD are considered to be 1/20 and 1/10, respectively. The
coefficients of thermal expansion for concrete deck and
steel nose girder are assumed to be 11.3×10⁻⁶
1/C˚ and
8.5×10⁻⁶
1/C˚, respectively. This figure indicates that the
effect of temperature gradient on variation of station
moment is not significant in general. Moreover, it can be
concluded that negative gradient (higher temperature in
top of the section) increases the station moment and makes
the condition more critical. To study on the shear strain
deformation effect on the nose-deck interaction, variation
of fifteenth station moment regarding this effect is shown
in Fig. 9. The moment station variation is plotted once
with shear strain effects neglected ( 0s ) and once with
respect to this effect for 3.2s and different values of
r . According to this figure, it can be concluded, the
shear strain effect on the station moment for values of r
less than 0.02 is negligible. Generally, for composite box
girder sections, r is less than 0.02 (see [16]) and thus
shear strain effect is negligible in most practical cases. It
should be noted that in spite of shear strain effect, shear
slip effect of studs for composite bridges may be more
significant as mentioned before.
[ D
OI:
10.
2206
8/IJ
CE
.13.
1.11
2 ]
[ D
ownl
oade
d fr
om ij
ce.iu
st.a
c.ir
on
2022
-08-
25 ]
7 / 14

A. Shojaei, H. Tajmir Riahi, M. Hirmand 119
0.2 0.4 0.6 0.8 1 1.2-0.12
-0.1
-0.08
-0.06
-0.04
2F
ifte
enth
Sta
tion M
om
ent
DD
Mq
L
(
)
1/12
0.20 , 3.2r s
0.15 , 3.2r s
0.10 , 3.2r s
0.05 , 3.2r s
For 0 and all values ofs r
Fig. 9 Variation of fifteenth station moment considering shear strain effect
Fig. 10 Assumption of the conventional simplified model
5. Study on the Conventional Simplified Model
As discussed earlier, when there are a large number of
spans behind a station, structural behavior of the bridge, at
the section of this station, is identical to a continuous beam
with infinite number of spans. Fig. 10 shows a continuous
deck during launching with infinite spans behind the
launching stage. Marchetti proposed the rotation of a
generic section , for a launching deck with infinite
number of spans as follows [7]:
21 aMa ;
1
10.288675
1
2 3 DD D D
aE E II
,
3 3
2 0.02424 3
056D D D D
D DD D
q
I
L q La
E EI
(14)
where M is the station moment, 1a and 2a are
constant coefficients dependant on the deck specifications
only. By using this relation for any station of deck, the
problem can be reduced to analyze a continuous beam with
lower degrees of indeterminacy. In this section, the
precision of this formula is examined for each stage of
launching to find out when continuous bridge reaches its
infinite scheme.
Fig. 11 illustrates the variation of internal moment and
rotation of stations 2 to 6. In this figure it is assumed that
all spans are identical and 0 is zero. Also the behavior of
fifteenth station is shown in this figure. The superscript (*)
implies that the rotation is obtained by equation (14). The
results obtained by Marchetti’s model are included in the
figure.
As shown, stations 2 to 6 may be more critical than
farther stations (for example fifteenth station). Accurate
rotations of these stations are different from results given
by equation (14); especially for stations 2 to 4. But rotation
of station 5 has good matching with the results of this
equation and fifteenth station behavior. For station 6 and
next stations, results obtained from equation (14)
completely agree with the results obtained from the FE
model. This conclusion is valid for any nose
specifications. In a nutshell, (14) is valid only when there
are at least 5 spans behind the station.
On the other hand, for fourth station and the next ones
when nose tip is 2.5 to 3 spans farther, the station rotation
nearly tends to zero and remains constant i.e. treats as a
fixed support. So it can be concluded that existence of at
least three stations behind and farther a station is required
to approximately assume the station as a fixed support.
Therefore, instead of analyzing the whole structure, a new
simplified model named as "semi infinite beam" model can
be analyzed (Fig. 12). It should be noted that this model
may not be useful when there are not enough spans (at
least 3 spans) behind the fixed support; it is the problem
for launching of the initial stages.
[ D
OI:
10.
2206
8/IJ
CE
.13.
1.11
2 ]
[ D
ownl
oade
d fr
om ij
ce.iu
st.a
c.ir
on
2022
-08-
25 ]
8 / 14

120 International Journal of Civil Engineering, Vol. 13, No. 1, Transaction A: Civil Engineering, March 2015
0 0.5 1 1.5 2 2.5 3-0.14
-0.12
-0.1
-0.08
-0.06
-0.04
-0.02
0
2S
tati
on M
om
ent
DD
Mq
L
(
)
1/12
Station15
Station 2
Marchetti's Model
0 0.5 1 1.5 2 2.5 3-0.02
-0.01
0
0.01
0.02
0.03
0.04
3S
tati
on R
ota
tion
DD
DE
Iq
L
()
Station15
Station 2*Station 2
(a-1) (a-2)
0 0.5 1 1.5 2 2.5 3-0.12
-0.1
-0.08
-0.06
-0.04
-0.02
0
2S
tati
on M
om
ent
DD
Mq
L
(
)
1/12
Station15
Station 3
Marchetti's Model
0 0.5 1 1.5 2 2.5 3-0.01
-0.005
0
0.005
0.01
0.015
0.02
3S
tati
on R
ota
tion
DD
DE
Iq
L
()
Station15
Station 3*Station 3
(b-1) (b-2)
0 0.5 1 1.5 2 2.5 3-0.12
-0.1
-0.08
-0.06
-0.04
-0.02
0
2S
tati
on M
om
ent
DD
Mq
L
()
1/12
Station15
Station 4
Marchetti's Model
0 0.5 1 1.5 2 2.5 3
-0.01
-0.005
0
0.005
0.01
0.015
0.02
3S
tati
on R
ota
tion
DD
DE
Iq
L
(
)
*Station 4
Station 4
Station15
(c-1) (c-2)
0 0.5 1 1.5 2 2.5 3-0.12
-0.1
-0.08
-0.06
-0.04
-0.02
0
2S
tati
on M
om
ent
DD
Mq
L
()
1/12
Station 5
Station15
Marchetti's Model
0 0.5 1 1.5 2 2.5 3-0.01
-0.005
0
0.005
0.01
0.015
0.02
3S
tati
on R
ota
tion
DD
DE
Iq
L
()
Station 5*Station 5
Station15
(d-1) (d-2)
0 0.5 1 1.5 2 2.5 3-0.12
-0.1
-0.08
-0.06
-0.04
-0.02
0
2S
tati
on M
om
ent
DD
Mq
L
(
)
1/12
Station15
Station 6
Marchetti's Model
0 0.5 1 1.5 2 2.5 3-0.01
-0.005
0
0.005
0.01
0.015
0.02
3S
tati
on R
ota
tion
DD
DE
Iq
L
(
)
Station15
Station 6*Station 6
(e-1) (e-2) Fig. 11 Variations of moment and rotation for stations 2 to 6
[ D
OI:
10.
2206
8/IJ
CE
.13.
1.11
2 ]
[ D
ownl
oade
d fr
om ij
ce.iu
st.a
c.ir
on
2022
-08-
25 ]
9 / 14

A. Shojaei, H. Tajmir Riahi, M. Hirmand 121
Fig. 12 The semi infinite beam model
(a) (b)
Fig. 13 Scenario of internal bending moment of eighth stage; a) phase 1, b) phase 2
Table 1 Appropriate values of a1 and a2 for different values of β1 and β0
β1 1 0.9 0.85 0.8
β0 0 0.5 0.75 0 0.5 0.75 0 0.5 0.75 0 0.5 0.75
St.2 a1 0.3325 0.3337 0.3334 0.3 0.3 0.3 0.2834 0.2833 0.2834 0.2667 0.2666 0.2667
a2 0.0416 0.0396 0.037 0.0304 0.0285 0.0262 0.0256 0.0238 0.0216 0.0213 0.0197 0.0176
St.3 a1 0.2916 0.2917 0.2917 0.2895 0.2895 0.2895 0.2883 0.2883 0.2883 0.287 0.287 0.287
a2 0.0208 0.0214 0.022 0.0227 0.0232 0.0238 0.0235 0.024 0.0246 0.0242 0.0246 0.0252
6. Study on the Initial Stages of Launching
Moments of some stations in the initial stages of
launching are more critical than farther stations. The
problem lies in the fact that the bridge has not reached to
its infinite continuous scheme yet. In this section the issue
is discussed and some solutions are presented to reduce
these station moments. To overcome the problem of
critical conditions in the initial stages of launching, two
main solutions are suggested:
1. Keeping some segments of the deck on the
construction platform during launching of the initial
stages. Generally, in practical projects a piece of
superstructure, over half size of a mid span (one deck
segment), is kept on the platform for each stage of
launching.
2. Increasing bending stiffness of second station by
shortening the length of the first span.
As will be concluded later, not only does second
solution reduce temporary construction tensions but also it
is suitable to optimize the static behavior of the bridge
after construction in service time.
Fig. 13 shows the scenario of internal bending moment
of superstructure parts during launching of phases one and
two of eighth stage as an example. Moments are just
shown for first four spans. Temperature effects, support
settlements, shear deformation and platform loads are
neglected and all spans are considered to be identical.
Bridge spans act like fixed ends beams and moment at
their supports and midpoints are approximately –1/12 and
+1/24, respectively, except for some initial spans. This
matter agrees with the results obtained in the previous
sections.
In construction process, first span posses the maximum
positive and negative bending moment (Fig. 13). By
reducing length of the first span appropriately, maximum
positive and negative moments of the first span can be
reduced to be closer to that of other spans.
A numerical study is done for station two in the second
stage and also for station three in the third stage of
launching (Table. 1). In this table, values of 1a and 2a
(Defined by equation (14)) for different values of 1 and
0 are given. The presented coefficients can be replaced
in equation (14) to modify it for the initial stations. The
bolded values of 1 and 0 ( 1 0.85 and 0 0.5 )
are suitable to make initial stations behavior close to
farther ones; because 1a and 2a are nearly equal to the
values given by equation (14). It should be noted that 1a
[ D
OI:
10.
2206
8/IJ
CE
.13.
1.11
2 ]
[ D
ownl
oade
d fr
om ij
ce.iu
st.a
c.ir
on
2022
-08-
25 ]
10 / 14

122 International Journal of Civil Engineering, Vol. 13, No. 1, Transaction A: Civil Engineering, March 2015
and 2a are completely independent of geometrical and
mechanical specifications of the nose.
Fig. 14 illustrates moment variation of station 2 in the
second stage of launching with optimum values of 1 and
0 versus its moment variation with 1 and 0 as 1 and
0, respectively. This figure indicates that by choosing
optimum values for 1 and 0 , the moment variation of
station 2 in second stage of launching completely
conforms to the moment variation of station 15 in fifteenth
stage.
Fig. 15 shows internal moment diagram of deck in an
instant for launching of eighth stage (when nose tip
distance from the first pier is 9.5 in normalized format) for
1 equal to 1 and 0.85. Again, moments are just shown
for first four spans. It can be concluded that not only does
choosing optimum values for 1 and 0 optimize the
launching moment of initial stations in their launching
stages but also balances moment of different stations
during all the stages of launching.
Similar moment diagram can be obtained when
launching of bridge will be finished and the construction
platform will be removed ( 0 0 ); moment diagram of
this position resembles that of service time. Therefore, it
can be concluded that the suggested value for 1 can
optimize the static performance of bridge in service time,
as well.
X
X
X
X
X
X
X
X
XX
X X X X X X X X X X X
0.2 0.4 0.6 0.8 1-0.14
-0.12
-0.1
-0.08
-0.06
-0.04
X
1/12
00.85 , 0.5, Station 2l
01 , 0, Station 15l
01, 0, Station 2l
2S
tati
on M
om
ent
DD
Mq
L
(
)
Fig. 14 Moment variation of the second station in second stage of launching with optimum values of β1 and β0
(a) (b)
Fig. 15 Moment diagram of deck in eighth stage; a) β1=0.85, b) β1=1
[ D
OI:
10.
2206
8/IJ
CE
.13.
1.11
2 ]
[ D
ownl
oade
d fr
om ij
ce.iu
st.a
c.ir
on
2022
-08-
25 ]
11 / 14

A. Shojaei, H. Tajmir Riahi, M. Hirmand 123
7. Optimum Design of Nose Girder
This section leads to a comprehensive study on the
developed semi infinite beam model. It should be noted
that the main point to introduce the semi infinite beam
model is its efficiency for parametric study on the nose-
deck interaction through a simple structure with lower
degrees of indeterminacy. It is intuitively obvious that the
beam model, shown in Fig. 12, can be analyzed
symbolically through different structural analysis
techniques such as the theory of virtual work or the slope
deflection method. In the previous section some remedies
were suggested to preserve the advantages of a designed
nose for all spans of launching. All in all, to give more
insight into the realm of nose girder optimization, this
developed simple model is applied along with considering
a simple feasible directions method technique for
optimization [18]. For the sake of brevity and simplicity,
only absolute values of negative bending moment are
taken in to account.
The foremost optimality criterion is that the nose-deck
system performs optimal provided that the maximum
bending moments at support B in the first and second
phases of launching are equated as much as possible. Let
1BM and 2BM stand for the bending moment of
support B in phase 1 and 2 of launching, respectively.
Some required functions as 1f , 2f and f are defined as
follow:
1 1 2 2
2
1 2
(1 ), Max( ),
( )
B L Bf M f M
f f f
(15)
Likewise, the optimization problem regarding this
optimality criterion can be stated as:
Find: , , ,
Minimize:
Subjected to: 1- 1, 0 , , 1
L q EI
L L q EI
f
(16)
It is obvious that this problem may have many
solutions as there are many combinations for L , q
and EI to satisfy the equality for maximum moment
of B in the both phases of launching. However, the
problem can be constrained based on the qualitative
studies given in Section 4. In this sense, by choosing a
proper value for relative stiffness of the nose girder,
0.2EI , maximum bending moment of support B
will take place at 1 (end of phase 2). The value of
this maximum moment is independent of EI that is
denoted by EoL
BM (i.e., end of launch moment).
Therefore, 2f can be rewritten as:
2 2Max( ) EoL
B Bf M M (17)
In the other words, by focusing on 1 position,
EI can be eliminated from the unknown variables and
thus for an arbitrary value of q , optimal values of L
can be obtained by solving the following problem:
Find:
Minimize:
Subjected to: 0 1, =predetermined
L
opt
L q
f
(18)
It should be remarked here that in general the values of
EI are interrelated with values of q ; therefore, they
must be chosen appropriately (See reference [2]).
Nevertheless, in this section two different sets of values
are assumed to make the solution procedure feasible; these
values are rather close to that are used by the designers in
the majority of practical projects. Now by considering
0.25EI and 0.1q , the following results are
obtained:
1 20.667, , 0.0998,
0.673 14 0
Max( ) 0.0997
opt
L
C
f f
f E
M
(19)
where, CM stands for the moment of support C. Again
by considering 0.3EI and 0.15q the following
results are obtained:
1 20.793, , 0.0931,
0.4735 14 0
Max( ) 0.0930
opt
L
C
f f
f E
M
(20)
It is worth noting that in both of these cases, the
maximum bending moment at support C is smaller than
1f and 2f . As can be seen, using the simple semi infinite
beam model makes a good platform for optimal design of
the nose girder.
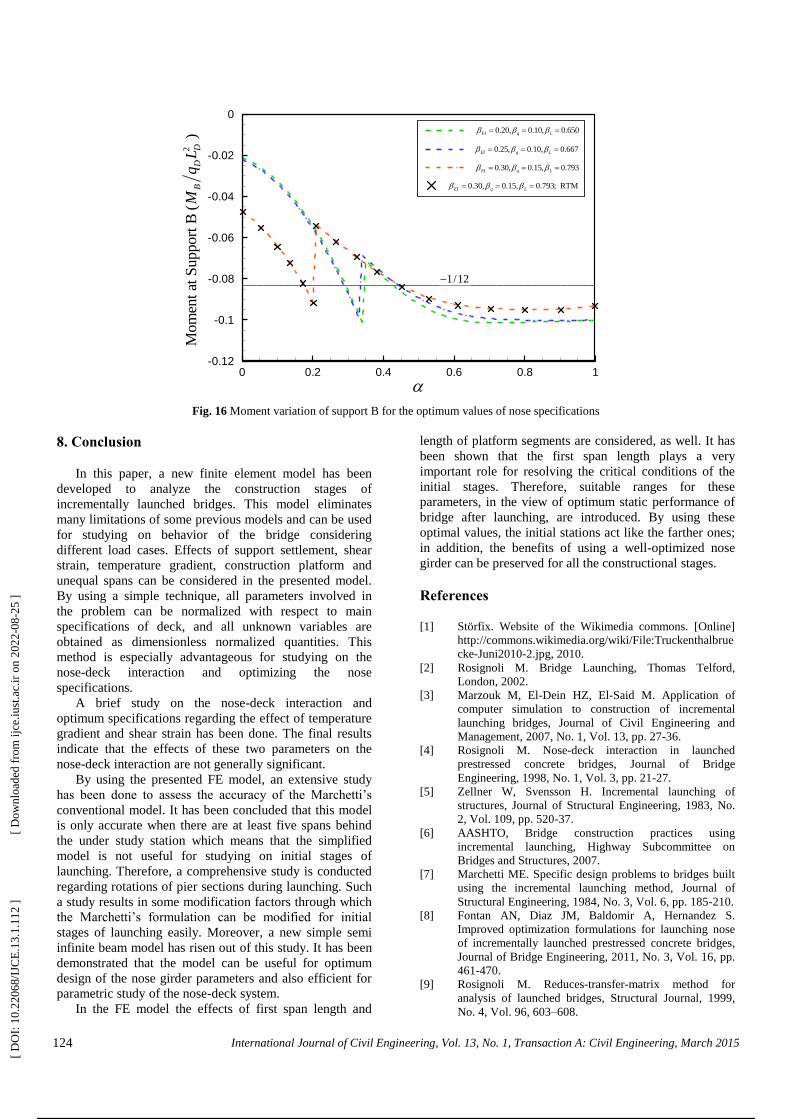
The moment variation of support B, as in Fig. 12,
through the FE model, based on the obtained values for
nose specifications in (19) and (20) and that well-known
values introduced in Section 4, are shown in Fig. 16.
Moreover, for the sake of verification, the results of RTM
method developed in [9], for 0.3EI , 0.15q and
0.793L , are shown in this figure. It should be pointed
out that all the spans are assumed to be identical, and
effects of support settlement, shear deformation and
platform load are neglected.
[ D
OI:
10.
2206
8/IJ
CE
.13.
1.11
2 ]
[ D
ownl
oade
d fr
om ij
ce.iu
st.a
c.ir
on
2022
-08-
25 ]
12 / 14
124 International Journal of Civil Engineering, Vol. 13, No. 1, Transaction A: Civil Engineering, March 2015
0 0.2 0.4 0.6 0.8 1-0.12
-0.1
-0.08
-0.06
-0.04
-0.02
0
2M
om
ent
at S
upport
B
BD
DM
qL
(
)
1/12
0.20, 0.10, 0.650EI q L
0.25, 0.10, 0.667EI q L
0.30, 0.15, 0.793EI q L
0.30, 0.15, 0.793; RTMEI q L
Fig. 16 Moment variation of support B for the optimum values of nose specifications
8. Conclusion
In this paper, a new finite element model has been
developed to analyze the construction stages of
incrementally launched bridges. This model eliminates
many limitations of some previous models and can be used
for studying on behavior of the bridge considering
different load cases. Effects of support settlement, shear
strain, temperature gradient, construction platform and
unequal spans can be considered in the presented model.
By using a simple technique, all parameters involved in
the problem can be normalized with respect to main
specifications of deck, and all unknown variables are
obtained as dimensionless normalized quantities. This
method is especially advantageous for studying on the
nose-deck interaction and optimizing the nose
specifications.
A brief study on the nose-deck interaction and
optimum specifications regarding the effect of temperature
gradient and shear strain has been done. The final results
indicate that the effects of these two parameters on the
nose-deck interaction are not generally significant.
By using the presented FE model, an extensive study
has been done to assess the accuracy of the Marchetti’s
conventional model. It has been concluded that this model
is only accurate when there are at least five spans behind
the under study station which means that the simplified
model is not useful for studying on initial stages of
launching. Therefore, a comprehensive study is conducted
regarding rotations of pier sections during launching. Such
a study results in some modification factors through which
the Marchetti’s formulation can be modified for initial
stages of launching easily. Moreover, a new simple semi
infinite beam model has risen out of this study. It has been
demonstrated that the model can be useful for optimum
design of the nose girder parameters and also efficient for
parametric study of the nose-deck system.
In the FE model the effects of first span length and
length of platform segments are considered, as well. It has
been shown that the first span length plays a very
important role for resolving the critical conditions of the
initial stages. Therefore, suitable ranges for these
parameters, in the view of optimum static performance of
bridge after launching, are introduced. By using these
optimal values, the initial stations act like the farther ones;
in addition, the benefits of using a well-optimized nose
girder can be preserved for all the constructional stages.
References
[1] Störfix. Website of the Wikimedia commons. [Online]
http://commons.wikimedia.org/wiki/File:Truckenthalbrue
cke-Juni2010-2.jpg, 2010.
[2] Rosignoli M. Bridge Launching, Thomas Telford,
London, 2002.
[3] Marzouk M, El-Dein HZ, El-Said M. Application of
computer simulation to construction of incremental
launching bridges, Journal of Civil Engineering and
Management, 2007, No. 1, Vol. 13, pp. 27-36.
[4] Rosignoli M. Nose-deck interaction in launched
prestressed concrete bridges, Journal of Bridge
Engineering, 1998, No. 1, Vol. 3, pp. 21-27.
[5] Zellner W, Svensson H. Incremental launching of
structures, Journal of Structural Engineering, 1983, No.
2, Vol. 109, pp. 520-37.
[6] AASHTO, Bridge construction practices using
incremental launching, Highway Subcommittee on
Bridges and Structures, 2007.
[7] Marchetti ME. Specific design problems to bridges built
using the incremental launching method, Journal of
Structural Engineering, 1984, No. 3, Vol. 6, pp. 185-210.
[8] Fontan AN, Diaz JM, Baldomir A, Hernandez S.
Improved optimization formulations for launching nose
of incrementally launched prestressed concrete bridges,
Journal of Bridge Engineering, 2011, No. 3, Vol. 16, pp.
461-470.
[9] Rosignoli M. Reduces-transfer-matrix method for
analysis of launched bridges, Structural Journal, 1999,
No. 4, Vol. 96, 603–608.
[ D
OI:
10.
2206
8/IJ
CE
.13.
1.11
2 ]
[ D
ownl
oade
d fr
om ij
ce.iu
st.a
c.ir
on
2022
-08-
25 ]
13 / 14

A. Shojaei, H. Tajmir Riahi, M. Hirmand 125
[10] Sasmal S, Ramanjaneluyu K, Srinivas V, Gopalakrishnan
S. Simplified computational methodology for analysis
and studies on behavior of incrementally launched
continuous bridges, Structural Engineering & Mechanics,
2004, No. 2, Vol. 17, pp. 245-266.
[11] Sasmal S, Ramanjaneluyu K. Transfer matrix method for
construction phase analysis of incrementally launched
prestressed concrete bridges, Engineering Structures,
2006, No. 13, Vol. 28, pp. 1897-1910.
[12] Arici M, Granata MF. Analysis of curved incrementally
launched box concrete bridges using the transfer matrix
method, Journal of Bridge Engineering, 2007, Nos. 3-4,
Vol. 3, pp. 165–181.
[13] Jung K, Kim K, Sim CW, Jay Kim JH. Verification of
incremental launching construction safety for the ilsun
bridge, the world’s longest and widest prestressed
concrete box girder with corrugated steel web section,
Journal of Bridge Engineering, 2011, No. 3, Vol. 16, pp.
453-460.
[14] Lee HW, Ahn TW, Kim KY. Nose-deck interaction in
ilm bridge proceeding with tapered sectional
launching nose, Computational Mechanics, Beijing,
China, 2004.
[15] Nie JG, Cai CS. Steel–concrete composite beams
considering shear slip effects, Journal of Structural
Engineering, 2003, No. 4, Vol. 129, pp. 495-506.
[16] Nie JG, Cai CS, Zhou TR, Li Y. Experimental and
analytical study of prestressed steel–concrete composite
beams considering slip effect, Journal of Structural
Engineering, 2007, No. 4, Vol. 133, pp. 530-540.
[17] Sennah K, Kennedy JB, Nour S. Design for shear in
curved composite multiple steel box girder bridges,
Journal of Bridge Engineering, 2003, No. 3, Vol. 8, pp.
144-152.
[18] Vanderplaats GN. Numerical Optimization Techniques
for Engineering Design: with Applications, McGraw-Hill
New York, 1984.
[ D
OI:
10.
2206
8/IJ
CE
.13.
1.11
2 ]
[ D
ownl
oade
d fr
om ij
ce.iu
st.a
c.ir
on
2022
-08-
25 ]
Powered by TCPDF (www.tcpdf.org)
14 / 14
Copyright © 2022 FDOKUMEN