Fine-Grained Evaluation of Local Positioning Systems for Specific Target Applications
15
Fine-grained Evaluation of Local Positioning Systems for Specific Target Applications Erwin Aitenbichler 1 , Fernando Lyardet 2 , Aristotelis Hadjakos 1 , and Max M ¨ uhlh¨ auser 1 1 Technische Universit¨ at Darmstadt, Hochschulstrasse 10, 64289 Darmstadt, Germany 2 SAP Research CEC Darmstadt, 64283 Darmstadt, Germany Abstract. Location-aware software has become widespread outdoors. Indoor ap- plications are now on the rise. However, careful selection of the appropriate lo- cal positioning system (LPS) and application fine-tuning are required in order to guarantee acceptable user experience. We present a simulation-based approach that includes application characteristics, LPS characteristics, and building char- acteristics to this complex task and illustrate how the appropriate LPS can be chosen and how applications can be fine-tuned. A sophisticated indoor naviga- tion system is used as sample application. The paper also provides insights into subtle details and caveats of different LPS technologies from an application and building viewpoint. 1 Introduction While the Global Positioning System (GPS) is the de-facto standard for outdoor posi- tioning, there is currently no single standard for indoor positioning. Here, developers can choose from several different Local Positioning System (LPS) technologies which all have their specific advantages and disadvantages [1, 2]. The most important question for a developer when choosing an LPS is if it suits the needs of a specific application. A first hurdle for the comparison is that depending on the underlying technology, the accuracy of an LPS is specified in different ways. For RF-based systems it is common to specify the radius of a circle containing 95% of all measurements for a given location or the RMS error as accuracy. In contrast, for an Infrared Badge system the maximum range could be specified as a property. Beside accuracy, the resolution of an LPS is an important property. These two prop- erties are often only loosely connected. For example, the system with the highest reso- lution may often not be the best choice. Consider an application that needs to determine in which room a user currently is. WLAN-based systems provide 3D coordinates with centimeter resolution and are known to have an accuracy of about 2-3 meters, but if the user is standing close to a wall, a system accuracy of 2-3 meters does not allow to dis- tinguish between rooms reliably. An Infrared Badge system has only room resolution, but because light does not pass through walls, it also has room accuracy. Thus, the latter system is a better match for the given application. A more fundamental problem is that these diverse LPS properties cannot be directly matched with the diverse requirements of an application. For example, the following application requirement could be specified: “Explain object X to the user as soon as she
-
Upload
tu-darmstadt -
Category
Documents
-
view
2 -
download
0
Transcript of Fine-Grained Evaluation of Local Positioning Systems for Specific Target Applications

Fine-grained Evaluation of Local Positioning Systemsfor Specific Target Applications
Erwin Aitenbichler1, Fernando Lyardet2, Aristotelis Hadjakos1, and Max Muhlhauser1
1 Technische Universitat Darmstadt, Hochschulstrasse 10, 64289 Darmstadt, Germany2 SAP Research CEC Darmstadt, 64283 Darmstadt, Germany
Abstract. Location-aware software has become widespread outdoors. Indoor ap-plications are now on the rise. However, careful selection of the appropriate lo-cal positioning system (LPS) and application fine-tuning are required in order toguarantee acceptable user experience. We present a simulation-based approachthat includes application characteristics, LPS characteristics, and building char-acteristics to this complex task and illustrate how the appropriate LPS can bechosen and how applications can be fine-tuned. A sophisticated indoor naviga-tion system is used as sample application. The paper also provides insights intosubtle details and caveats of different LPS technologies from an application andbuilding viewpoint.
1 Introduction
While the Global Positioning System (GPS) is the de-facto standard for outdoor posi-tioning, there is currently no single standard for indoor positioning. Here, developerscan choose from several different Local Positioning System (LPS) technologies whichall have their specific advantages and disadvantages [1, 2]. The most important questionfor a developer when choosing an LPS is if it suits the needs of a specific application.
A first hurdle for the comparison is that depending on the underlying technology, theaccuracy of an LPS is specified in different ways. For RF-based systems it is commonto specify the radius of a circle containing 95% of all measurements for a given locationor the RMS error as accuracy. In contrast, for an Infrared Badge system the maximumrange could be specified as a property.
Beside accuracy, the resolution of an LPS is an important property. These two prop-erties are often only loosely connected. For example, the system with the highest reso-lution may often not be the best choice. Consider an application that needs to determinein which room a user currently is. WLAN-based systems provide 3D coordinates withcentimeter resolution and are known to have an accuracy of about 2-3 meters, but if theuser is standing close to a wall, a system accuracy of 2-3 meters does not allow to dis-tinguish between rooms reliably. An Infrared Badge system has only room resolution,but because light does not pass through walls, it also has room accuracy. Thus, the lattersystem is a better match for the given application.
A more fundamental problem is that these diverse LPS properties cannot be directlymatched with the diverse requirements of an application. For example, the followingapplication requirement could be specified: “Explain object X to the user as soon as she

can see it, but never if she cannot see it.” To match application requirements with thecharacteristics of currently available LPSes, a general approach is needed. In this paper,we present a simulation framework allowing a detailed analysis of the impact of LPSproperties on an application.
This paper is structured as follows. After a discussion of related work in Section 1.1,we present the architecture of our simulation framework in Section 2. The general prop-erties of LPS are evaluated in Section 3. As an example for a reasonably complex appli-cation we present the Context-aware Indoor Navigation System (CoINS) in Section 4.Then we present the results of a simulation-based evaluation of CoINS with four differ-ent LPSes currently useable with modern mobile phones in Section 5. We then derivethe application success rate from the experimental data. This measure denotes the prob-ability that the user can be guided correctly, i.e., the system will provide the user withthe correct directions at the correct time. Finally, the paper is concluded in Section 6.
1.1 Related Work
General descriptions of LPS properties and system comparisons are subject of bookchapters in [2] and [1]. Over the past few years, a notable progress in the field of LPSresearch was the fusion of data from multiple LPS systems with very different charac-teristics. Hightower et al. describe the use of particle filters to combine the data fromWLAN and Infrared, which is a symbolic location source [3]. Woodman et al. describethe combination of WLAN with a Pedometer, which is a relative location source [4].
However, to the knowledge of the authors, there are currently no existing approachesfor the generic matching of LPS properties with application requirements.
2 Simulation Framework
Figure 1 shows the architecture of the simulation framework. The Application De-scription is an XML file specifying the requirements of an application in an LPS-independent way. The most important elements for pedestrian applications are locationtests and walk tests:
– Point(P): Expresses that the application needs to determine that a user is at a loca-tion P. The permitted tolerance can be specified as a simulation parameter.
– Rect(P,Q): Expresses that the application needs to determine that a user is in thespatial area defined by a cuboid ranging from P to Q.
– Walk(P,Q): Expresses that a user is expected to walk from P to Q and the applica-tion needs to determine that the user has reached Q.
Such elementary tests can be combined to describe more complex requirements:
– Test is a structuring element that surrounds the tags described above. The simulatordetermines the probabilities of true positives (TP), false positives (FP), true nega-tives (TN), and false negatives (FN) for each test. Tests can be nested and previouslyexecuted tests can be referenced and included as subtests.

Simulation Framework
Parser
GSM
WLAN WorldModel
UserModel
PedometerReporting
SimulationEngine
LPS Modules
ConfigurationDescription
ApplicationDescription
Manual or Script-basedGeneration
RSS Fingerprints
Application(e.g., CoINS)
...
Fig. 1. Simulation Framework Architecture
– Testunit serves as a structuring element to group tests of the same kind. The differ-ence to nested tests is that nesting expresses a is-subtest-of relationship, while testunits express an is-kind-of relationship.
The Application Description can either be written manually or generated automat-ically using a script. For complex applications like CoINS the latter approach is benefi-cial. Here, the script directly interacts with the route planning component of CoINS togenerate test cases.
The LPS Modules simulate the behavior of specific LPS systems. These mod-ules may need additional information from the World Model, such as Received SignalStrength (RSS) fingerprints or user body dimension data to simulate a pedometer-basedLPS. The LPS modules and their associated data are application-independent.
The Configuration Description controls the whole simulation. It defines whichtests of the application description should be executed using which LPS systems andwhat kind of reports should be generated.
2.1 LPS Modules
This section gives a brief overview of the indoor positioning systems that are supportedby the LPS Modules of the simulator.
Wireless LAN: Devices with WLAN interfaces can be tracked within a WLANinfrastructure. The simplest form of WLAN tracking determines in which cell the usercurrently is. This way, it is possible to locate users with an accuracy of about 25-50m.By using location fingerprinting, the accuracy of WLAN systems can be improved toabout 3m [5, 6]. However, fingerprinting requires the creation and maintenance of radiosignal propagation maps, which is considerable effort if not done by robots [3]. WLANtracking can be completely done in the infrastructure without requiring any specialsoftware on the client or it can be done on the client. There are several software productsfor WLAN positioning available, e.g., PlaceLab [7] or Ekahau [8]. The big advantage
of this approach is that it does not require any specialized hardware and thus can beused in conjunction with off-the-shelf smartphones and portable computing devices.
GSM: The location of a mobile phone can be either determined network-basedor client-based. Unfortunately, there is only little standardization of APIs beside theE911 requirement and cellphone locations can often only be obtained by purchasingoperator-specific APIs. These are often limited to single operators and countries, andeach location fix costs a fee. However, similar to WLAN, it is also possible to per-form client-based positioning with GSM [9]. Furthermore, it is also possible to applyfingerprinting techniques.
Ultra-WideBand: UWB systems utilize a much larger RF spectrum for their mea-surement signals. This allows them to handle multipath effects adequately, resulting inan order of magnitude better accuracy compared to systems based on a single frequency.One of the most advanced UWB location systems is available from Ubisense [10]. TheUbisense system comprises UbiTags carried by people or objects and several stationaryUbiSensors. UWB systems employ the so-called inverse-GPS (IGPS) principle, whichis similar to GPS, but with reversed roles: UbiTags emit short UWB pulses, which arereceived by at least three UbiSensors. The sensors measure the time differences of ar-rival of the UWB pulse and use trilateration to calculate the tag’s position. In addition,Ubisense measures the angles of arrival to improve the reliability of the position infor-mation. UWB systems provide an accuracy down to about 15cm. However, they requirespecialized hardware at the user and in the infrastructure.
Pedometer: Pedometers are usually based on an acceleration sensor and count stepsby analyzing its signal data. This principle works most reliable when wearing the sensoron the foot or in the shoe [11]. The accuracy decreases when the sensor is worn ona helmet [12], in the pocket [13], or in the hand [14], but users can still be locatedwith a reasonable accuracy. Such a positioning system is typically constructed out of apedometer and an electronic compass to get orientation information. However, becausethe positioning error continuously increases in such a system, sensor fusion with anabsolute positioning system, e.g., WLAN, can considerably improve its accuracy [4].
QR Codes: Quick Response (QR)-Codes [15] are two-dimensional barcodes thatwere standardized by ISO in the year 2000 (ISO/IEC 18004). To date, QR reading soft-ware is available for almost any smartphone. QR codes can be used to create “physicalworld hyperlinks”. A user having a camera phone can scan the image of a QR Codecausing the phone’s browser to launch and redirect to the programmed URL. QR codescan be used to determine physical location by encoding locations into URLs.
Infrared Badge Systems detect if a badge worn by a user is within line-of-sightdistance of a stationary receiver. Elpas [16] is a badge-based system that combinesInfrared, low frequency RF proximity sensing, and high frequency RF. It can coverentire buildings and depending on the amount of infrastructure deployed, its accuracyvaries between 25m and 2m. Elpas provides only symbolic location. The number ofsupported distinct positions is equal to the number of sensors deployed.
It is also interesting to investigate the use of GPS indoors. GPS [17] is basically notsuitable for indoor positioning, because the system requires a direct line of sight fromthe receiver to multiple satellites. GPS Repeaters can be installed into the infrastructureof buildings to make GPS available indoors. A repeater consists of a receiving antenna

mounted with a clear view to the sky and a sending antenna mounted indoors. Thesender has a range of about 3-10 meters and forwards the combined signals of all visiblesatellites observed at the location of the outdoor antenna. Consequently, the number ofsupported distinct positions is equal to the number of repeaters.
3 Evaluation of Positioning Systems
Because WLAN, GSM, acceleration sensors, and cameras are available in modern cell-phones, we selected positioning based on WLAN, GSM, pedometer, and QR codes fora detailed evaluation. As a first prerequisite for a simulation, the LPS properties aredetermined at the application site. WLAN and GSM positioning require the creation ofRSS fingerprint maps. To simulate pedometer input, the movement characteristics ofseveral people using body-worn sensors are collected.
0
1
2
3
A B C D E
Stairs
Elevator
Entrance Door
WLAN Fingerprint
GSM+WLAN Fingerprint
Floor 1
Fig. 2. Layout of the Piloty Building and Fingerprint Locations for One Floor
Figure 2 shows the Piloty Building at the University of Darmstadt. It is a four-story building that accommodates most of the computer science groups. The floors are
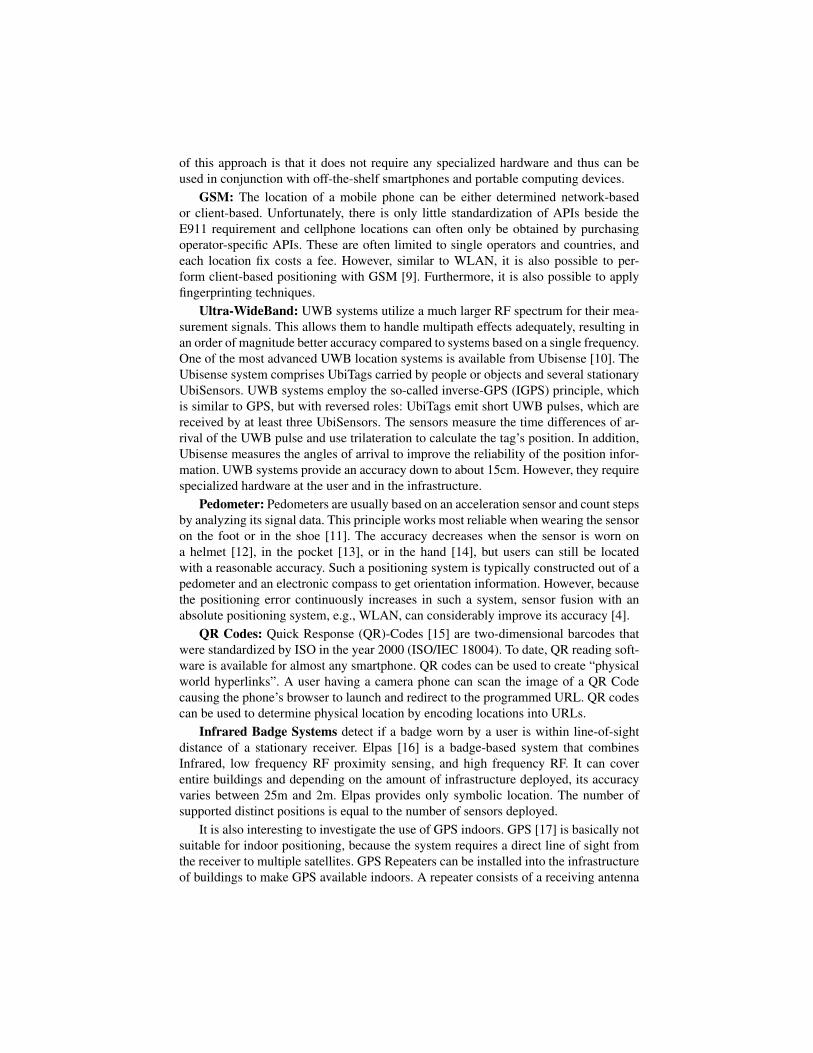
connected through six different stairs and four elevators. The footprint of the buildingis approximately 110m x 55m.
The small dots show the locations where the WLAN fingerprints were measured.A fingerprint was typically taken in front of each office door. The big dots show thelocations where WLAN and GSM fingerprints where measured. In total we took WLANfingerprints at 225 different locations and GSM fingerprints at 43 different locations.
3.1 WLAN FingerprintingA single RSS measurement of the access point i is denoted as si. When all visible accesspoints are measured at a certain location, then the result is a vector S = (s1, ..., sm).To reduce the effect of noise, S is measured multiple times, resulting in a data setT = (S1, ..., Sn). A fingerprint for a defined position p = (x, y, z) is a tuple of locationand average RSS vector: f = (p, 1
n
∑ni=1 Si). Fingerprints are measured at all loca-
tions important to an application. The result is the set F = {f1, ..., fn} containing allfingerprints.
A mobile terminal that wants to determine its position first measures an RSS vectorSx. Because of the structure of this environment, the position is estimated by calculatingthe weighted average of the two closest fingerprints in signal space. These are
(p1, S1) = arg min(p,S)∈F |S − Sx| and(p2, S2) = arg min(p,S)∈F∧p 6=p1 |S − Sx|.
The estimated position px is
px =|S1 − Sx|
|S1 − Sx|+ |S2 − Sx|p2 +
|S2 − Sx||S1 − Sx|+ |S2 − Sx|
p1
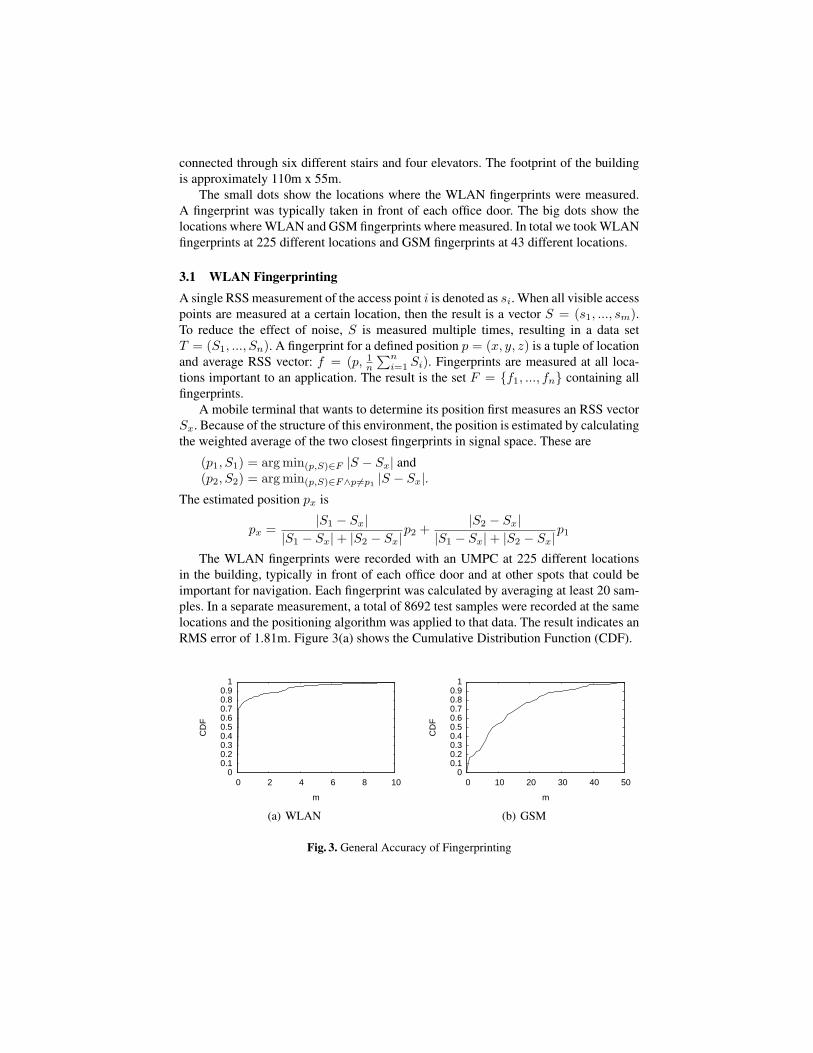
The WLAN fingerprints were recorded with an UMPC at 225 different locationsin the building, typically in front of each office door and at other spots that could beimportant for navigation. Each fingerprint was calculated by averaging at least 20 sam-ples. In a separate measurement, a total of 8692 test samples were recorded at the samelocations and the positioning algorithm was applied to that data. The result indicates anRMS error of 1.81m. Figure 3(a) shows the Cumulative Distribution Function (CDF).
0 0.1 0.2 0.3 0.4 0.5 0.6 0.7 0.8 0.9
1
0 2 4 6 8 10
CD
F
m
(a) WLAN
0 0.1 0.2 0.3 0.4 0.5 0.6 0.7 0.8 0.9
1
0 10 20 30 40 50
CD
F
m
(b) GSM
Fig. 3. General Accuracy of Fingerprinting

3.2 GSM Fingerprinting
GSM positioning uses the same algorithm as described before for WLAN. The GSMfingerprints were recorded with an iPhone at 43 different locations in the building. In aseparate measurement, a total of 430 test samples were recorded at the same locations.The result indicates an RMS error of 16.82m and the CDF is shown in Figure 3(b). Theresults of WLAN and GSM fingerprinting are summarized in Table 1.
Property WLAN GSMNumber of fingerprint locations 225 43Number of test point samples 8692 430Minimum number base stations per location 2 3Maximum number base stations per location 13 9Average number of base stations per location 6.16 6.72RMS error 1.81m 16.82m
Table 1. Collected Fingerprints
3.3 Pedometer
To collect the necessary sample data for the Pedometer LPS simulation module weused our MotionNet [18] sensor system and recorded data from six different users.One sensor was worn on the foot, one on the head (on a headset) and one attached toan UMPC in the hand. Figure 4 shows the sensor signals and the derived step signalsacquired during a 28m walk.
Steps can be detected very reliably from the foot signal using the following signalprocessing steps. First, a highpass filter (IIR, Butterworth, 10 Hz, 10th order) is appliedto remove static and low-frequency components from the signal. Next, the signal is rec-tified. A moving average filter (window size 0.1s) is then used to smoothen the signal.Finally, a hysteresis threshold filter obtains the binary step signal.
User E(lstep) σ(lstep) Foot Head Hand1 75.3 cm 1.98 cm 100% 98% 94%2 83.1 cm 3.66 cm 100% 94% 94%3 83.2 cm 3.39 cm 100% 96% 97%4 70.1 cm 4.33 cm 100% 95% 96%5 85.3 cm 2.33 cm 100% 99% 99%6 72.2 cm 1.82 cm 100% 99% 98%Avg 78,2 cm 2.92 cm 100% 97% 96%
Table 2. Step Detection Recognition Rates
The signals from hand and head are significantly weaker and therefore more difficultto process. To detect steps, we first apply a bandpass filter (IIR, Butterworth, 1-3 Hz,

Head
Hand
Foot
Fig. 4. Sensor Data and Derived Step Signals for Pedometer LPS
10th order) to obtain a sine-like signal. Steps are counted if the maximum value betweenzero crossings exceeds a threshold value.
From the calculated step signals we can derive the average step length, its standarddeviation, and the recognition rates at the foot, head, and hand of each user. Table 2summarizes the results.
4 The CoINS Application
After the general analysis of the positioning systems, the next step is to create the ap-plication description. In this work we use the Context-aware Indoor Navigation System(CoINS) [19] as reference application that should be simulated. First, the followingsection provides a brief overview of CoINS.
The aim of the Context-aware Indoor Navigation System (CoINS) is to provide effi-cient user navigation in buildings with a strong emphasis on the “human factor”. Whenconsidering the human as part of the system, the term efficient does not longer simplycorrespond to the shortest path calculated by some mathematical method. To efficientlynavigate users to their destinations, it is also vital that they can quickly comprehendand execute the navigation instructions they receive from the navigation system. Forexample, a good route description would consist of a low number of turns, turns wouldbe at ”landmarks” the user can easily identify, and would always clearly indicate thedirections in which the user is supposed to walk.
4.1 World Model
The CoINS world model is a hybrid model that combines symbolic graph-based modelswith geometric models. A symbolic model is required for indoor navigation, because

room numbers, corridor names, floor numbers, etc. have an intuitive semantics to users.Using geometric coordinates for end-user interaction would not be suitable. The ge-ometric model is needed for determining the shortest paths and to obtain orientationinformation for guiding users into the correct directions. The world model serves twomain purposes.
First, it supports transformations between geometric coordinates and symbolic lo-cations and vice versa. When a 3D tracking system is used that provides geometriccoordinates to locate users, the model must be able to transform this coordinate into asymbolic location, such as a room number. The pathfinding algorithm of CoINS startswith the symbolic models to create a coarse plan of the route. After that, the geometricmodels are used for fine-planning.
Second, the model enables efficient pathfinding. The design of the CoINS worldmodel has been refined over several iterations to ensure that the search sets are as smallas possible and that the basic relations needed by the pathfinding algorithm can bechecked efficiently. In most cases, users will mostly move in two dimensions. Move-ments in the height dimension usually only occur when changing floors, which is mod-eled by using separate maps for each floor.
4.2 User Centric Adaptation
The user model we have developed and applied in our indoor navigation technologycombines three aspects besides user identification data: physical capabilities, user pref-erences, and location access rights. This model presents a Multiattribute Utility Theory-based architecture that enables decision making according to user interests.
To select the most suitable path for a specific user we use the Simple Multi-AttributeRating Technique [20]. Under this technique, every path can be described by individ-ual preference attributes and through the value functions of each single attribute, thepreference strength can be measured.
4.3 CoINS Architecture
CoINS is based on the open-source communication middleware MundoCore [21]. Forthe implementation of CoINS, we adopted a service-oriented architecture, because itallows deploying application components according to different scenarios and improvetheir reuse by other applications. E.g., if a client only supports a web browser, all com-ponents of CoINS can run on a server in the Internet. A more powerful client such asan UMPC could already run the whole CoINS system locally.
CoINS uses the Mundo Context Server [22] to track the locations of users. Becausethis software provides an abstraction layer above the physical sensors, CoINS can usestandardized queries and does not have to be aware of the underlying sensor technology.
The Presentation Component of CoINS can be either accessed as web interfacethrough a web server or from rich clients. The web-based solution has the advantagethat no software deployment is necessary on clients, but location tracking is limited toQR codes or purely infrastructure-based solutions. In contrast, rich clients can providemore customized user interfaces and support additional local positioning systems.

5 Evaluation of CoINS
We performed our experiments in the Piloty building of TU Darmstadt. Despite roomnumbers being systematically constructed of building wing letter, floor number, androom number, e.g., A121 stands for wing A, floor 1, room 21, navigation in the buildingis not always straightforward. For example, one computer pool in level 0 is accessible tostudents 24 hours a day. The connecting doors around this area are locked for securityreasons. Also, several connecting doors on other levels cannot be passed by studentsor visitors. Not all elevators can reach all levels and the three wings of level 3 arenot directly interconnected on level 3. Consequently, the building structure is complexenough to pose some challenges to an indoor navigation system.
Directions = { IntermediateSegment Connector } EndSeg-ment End;IntermediateSegment = [ Turn ] ”walk” (”to end of corridor” |Straight);EndSegment = [ Turn ] [ Straight ];Connector = Door | Elevator | Stairs | ε;End = ”destination is on your” ( ”left” | ”right” );Straight = ”straight for” number ”meters”;Door = ”go through door”;Elevator = ”take elevator” [ Side ] Floor;Stairs = ”take stairs” [ Side ] Floor;Side = ”on your” ( ”left” | ”right” );Floor = ”to floor” Number;
Fig. 5. CoINS: EBNF Grammar for Directions and Screenshot
To start the guiding process, a user opens the CoINS application on her mobile ter-minal and selects the desired destination. The application allows to search the databasefor people, room numbers, events, etc. Alternatively, a user could read a QR code fromthe business card of an employee to select the destination. CoINS then determines theuser’s current location and calculates the navigation route.
CoINS gives the user textual directions how to proceed to finally get to the desireddestination location. Figure 5 shows the grammar describing the directions CoINS couldpossibly generate. It is somewhat simplified but in principle covers all possible direc-tions CoINS would generate for the Piloty building
The locations that must be recognized by an LPS can be derived from this grammar.The whole navigation route can be decomposed into multiple segments. An LPS isexpected to provide the information if the user has reached the end of a segment, i.e.,Connector or End. This way, CoINS is able to verify whether the user has successfullyfollowed the instructions and it can proceed with explaining the next segment to user.
A route consists of a start location, an arbitrary number of intermediary segments,and one end segment. In case of the Piloty building, an intermediary segment alwaysends with the end of a corridor, a connecting or exit door, stairs, an elevator, or in open

space. When the end of such a segment is reached, the user receives the next direction.Finally, the end segment ends with the desired destination, e.g., an office room. Hence,a location system suitable for CoINS must fulfill the following requirements:
– When starting the navigation, the system must be able to determine the absoluteposition of the user with a high accuracy. At least floor and section of the buildingmust be correct.
– The ends of intermediary segments must be detected with a very high accuracy,because a navigation route will typically consist of multiple segments. Especiallyit is vital that the system does not report any false positives, because the user mustbe able to see the stairs or an elevator when the system tells her to use it.
– The accuracy when detecting the end of the end segment should be reasonably high,but it does not have to be as high as for the ends of intermediary segments, becausethe user is already close to the destination. It is not so important that the system isable to recognize the exact door when navigating to a specific office.
5.1 Start Locations
The start locations for navigation are often identical with the ends of intermediary seg-ments, because the user would often start at an entrance door or elevator. However, ingeneral it is necessary to detect the correct floor and wing anywhere in the building.Table 3 shows the results for WLAN and GSM fingerprinting. The user can also take apicture of a QR code to determine her location. QR codes are printed on the doorplatesin the Piloty building. The column TP contains the percentage of true positives and thecolumn FP contains the percentage of false positives.
Test GSM TP GSM FP WLAN TP WLAN FP QR TP QR FPCorrect floor 26% 8.75% 99.8% 0% 100% 0%Correct floor and wing 13.1% 2.21% 99.1% 0% 100% 0%Correct entrance 100% 1.14% 100% 0% 100% 0%
Table 3. Start Locations
The results show that GSM is not accurate enough to distinguish between the floorsof the building. For that reason, we introduce a new test that tries to distinguish betweenthe six entrance doors of the building in one level. The results are shown in Figure 6and indicate that this is possible. We choose the radius rs=8m for the small circle andthe radius rl=12m for the large circle. rl must not exceed 13m, because the minimumdistance between any two test points in this set is 26m. The meaning of these two circlesis explained below.
5.2 Intermediary Segments
There are 33 areas in the building which are ends of intermediary segments. To verifythat we can reliably detect these areas, the following experiment was performed. From

0
0.2
0.4
0.6
0.8
1
0 2 4 6 8 10
CD
F
m
(a) True Positives
0.004 0.006 0.008
0.01 0.012 0.014 0.016 0.018
0.02 0.022
8 9 10 11 12 13 14 15 16
Prob
abilit
y
m
(b) False Positives
Fig. 6. Accuracy of Locating Entrance Doors with GSM
the center of each area we draw two concentric circles and then distinguish the followingcases.
– If a user stands in the small circle, i.e., very close to the location of a Connector,we absolutely expect the system to react. We chose 3 meters as diameter for thiscircle. It is mandatory that an LPS detects this occurance with a probability close to100%. The test is counted as a true positive if 50% of the test point samples fulfillthis criteria.
– If a user stands in the large circle, i.e., close enough to the location of a Connectorto physically see it, then it is acceptable when the system reports that the user hasreached the segment end. From empirical tests we have determined that about 4meters are the upper bound for this feature.
– If the user stands anywhere outside these two circles, the system must never reportthat the user has reached the end of the segment. This would result in the userreceiving an instruction that would be useless to her. Hence, such false positivesmust be avoided and the probability of this occurance must be close to 0%.
5.3 End Segments
The end segment extends from the last intermediary segment to the destination locationof the navigation. This is typically the location of an office. Hence, the simulator simu-lates a user walking from the location of the last connector to the destination location.The error calculation is the same as for intermediary segments.
5.4 Routes
A route consists of a start point, zero or more intermediary segments, and an end seg-ment. The application description comprises 2282 different combinations of interme-diary segments. Figure 7 shows an example route and how the individual errors areaccumulated to give the TP and FP values for the whole route. The test method is verystrict: If some segment of the route fails with a probability P , then the whole route alsofails at least with probability P .

Segment Segment TP FPType Namestart E120 0.98 0.05intermediate EC1 1.00 0.00intermediate CA2 1.00 0.40end A210 1.00 0.00route E120-A210 0.98 0.43
(a) Error Calculation (b) Route Example
Fig. 7. Accumulation of Errors when Testing Routes
0.95
0.96
0.97
0.98
0.99
1
0 1 2 3 4 5 6
CD
F
m
(a) True Positives for WLAN LPS
0 0.02 0.04 0.06 0.08
0.1 0.12 0.14 0.16
1 2 3 4 5 6Pr
obab
ility
m
(b) False Positives for WLAN LPS
0.1 0.2 0.3 0.4 0.5 0.6 0.7 0.8 0.9
1
0 1 2 3 4 5 6 7 8
CD
F
m
foothandhead
(c) True Positives for Pedometer LPS
0 0.1 0.2 0.3 0.4 0.5 0.6 0.7 0.8
0 1 2 3 4 5 6 7 8
Prob
abilit
y
m
foothandhead
(d) False Positives for Pedometer LPS
Fig. 8. Success and Failure Rates for Entire Routes
Figure 8 shows the results of the WLAN test. Based on the TP curve, we can selectrs=1m, which meets the defined requirement. However, the false positives are still con-siderable at rl=4m. We can either stay with this requirement and accept a FP probabilityof 3.6% or change rl to 4.3m.
Figure 8 shows the results from the Pedometer test. The sensor worn on the footprovides the best results. Steps can be detected reliably from this sensor, while not allsteps can be detected based on the data from the head and hand sensors.
5.5 Application Success Rates
Finally, from the simulation output, the overall application success rates can be calcu-lated. The results are summarized in Table 4. The results indicate that WLAN position-ing with the initial requirements rs=150cm, rl=400cm cannot be satisfied well, because

the application success rate would only be 95.5%. If we allow rl=430cm then the ap-plication success rate becomes 99.1% and is only limited by the accuracy of the startposition fix. An application success rate of 99.1% means that about 110 of 111 userswill not encounter a single glitch when interacting with the CoINS system.
The test case GSM+Pedometer is constrained, because GSM is only able to dis-tinguish between the six building entrances. Hence, guidance can only start at the en-trances in this case.
Reading a QR code is a reliable way to determine one’s start position. However,this method requires manual user interaction. Once the position is known, CoINS canperform quite accurately using compass and pedometer. If the step sensor is mountedon the foot or in the shoe, the results are significantly better compared to sensor on heador in the hand. The case sensor in the hand is quite interesting, because a mobile phonewith an acceleration sensor could be directly used to implement a pedometer.
System(s) Start Location Route TotalWLAN (4.3m) 99.1% 100.0% 99.1%WLAN (3.2m) 99.1% 96.4% 95.5%GSM+Pedometer (foot, 5m) 98.8% 100.0% 98.8%QR+Pedometer (foot, 5m) 100.0% 100.0% 100.0%QR+Pedometer (foot, 4m) 100.0% 98.3% 98.3%QR+Pedometer (head, 4m) 100.0% 97.2% 97.2%QR+Pedometer (hand, 4m) 100.0% 94.0% 94.0%
Table 4. CoINS Application Success Rates
6 Conclusion
We have described an application-oriented method for evaluating LPS systems in an ap-plication and building context. The system uses a clear separation between the descrip-tions of application requirements and LPS properties to make both parts interchange-able. Building characteristics are considered where appropriate. The system providesthe following three key benefits:
– Most importantly, with the calculation of the application success rate it is possibleto directly get an estimate for the end user experience from the LPS characteristics.This result can be used as a basis for LPS selection.
– The simulator helps to determine the optimal values for application parameters,such as tolerance values.
– The reporting function can be used to identify the subtests responsible for the high-est errors. A user could then selectively improve the LPS system in those areas,e.g., by measuring additional fingerprints or deploying additional sensors.
The presented evaluation method was applied to our CoINS system together withLPS technologies that are available in modern mobile phones. With the help of thesimulator, we could confirm that CoINS can perform well with the given LPS systemsif the application parameters are configured properly.

Acknowledgements This work was supported by the SmartProducts project, funded as part ofthe Seventh Framework Programme of the EU under grant number 231204.
References1. Aitenbichler, E.: A Focus on Location Context. In Max Muhlhauser, I.G., ed.: Ubiquitous
Computing Technology for Real Time Enterprises, ISR (2008) 257–2812. Kolodziej, K.: Local Positioning Systems: LBS applications and services. CRC Press (2006)3. Hightower, J., Borriello, G.: Particle Filters for Location Estimation in Ubiquitous Com-
puting: A Case Study. In: UbiComp 2004: Ubiquitous Computing. Volume 3205 of LNCS.,Nottingham, UK, Springer (2004) 88–106
4. Woodman, O., Harle, R.: Pedestrian Localisation for Indoor Environments. In: UbiComp2008: Ubiquitous Computing. (2008)
5. Song, Y.: In-House Location Tracking. Master’s thesis, Darmstadt University of Technology(2002)
6. Bahl, P., Padmanabhan, V.N.: A Software System for Locating Mobile Users: Design, Eval-uation, and Lessons. Technical report, Microsoft Research (2001)
7. LaMarca, A., et al.: Place Lab: Device Positioning Using Radio Beacons in the Wild. In:Proceedings of Pervasive 2005. (2005)
8. Ekahau: WiFi-based Real-time Tracking and Site Survey Solutions. http://www.ekahau.com/(2009) last visited: 16.01.2009.
9. Hartl, A.: A Provider-Independent, Proactive Service for Location Sensing in Cellular Net-works. In: GTGKVS Fachgesprach (Online Proceedings). (2005)
10. Ubisense: Homepage. The Smart Space Company. http://www.ubisense.net/ (2009) lastvisited: 16.01.2009.
11. Nike: Nike Plus. http://nikeplus.nike.com/ (2009) last visited: 19.01.2009.12. Beauregard, S.: A Helmet-Mounted Pedestrian Dead Reckoning System. In: 3rd Interna-
tional Forum on Applied Wearable Computing (IFAWC). (2006)13. Blanke, U., Schiele, B.: Sensing Location in the Pocket. In: UbiComp 2008 Adjunct Pro-
ceedings. (2008)14. Randell, C., Djiallis, C., Muller, H.: Personal Position Measurement Using Dead Reckon-
ing. In: Proceedings of the Seventh IEEE International Symposium on Wearable Computers.(2003)
15. Denso Wave Inc.: QR Code Homepage. http://www.denso-wave.com/qrcode/ (2009) lastvisited: 19.01.2009.
16. Visonic Technologies: Elpas. http://www.visonictech.com (2009) last visited: 16.01.2009.17. Kaplan, E.: Understanding GPS Principles and Applications. Artech House Publishers
(1996)18. Hadjakos, A., Aitenbichler, E., Muhlhauser, M.: SYSSOMO: A Pedagogical Tool for An-
alyzing Movement Variants Between Different Pianists. In Ruffaldi, E., Fontana, M., eds.:Enactive08 Proceedings, Pisa, Edizioni ETS (2008) 75–80
19. Lyardet, F., Szeto, D.W., Aitenbichler, E.: Context Aware Indoor Navigation. In: Proceedingsof the European Conference on Ambient Intelligence (AmI’2008). Volume 5355 of LNCS.,Springer (2008) 290–307
20. von Winterfeldt, D., Edwards, W.: Decision Analysis and Behavorial Research. CambridgeUniversity Press (1986)
21. Aitenbichler, E., Kangasharju, J., Muhlhauser, M.: MundoCore: A Light-weight Infrastruc-ture for Pervasive Computing. Pervasive and Mobile Computing 3(4) (August 2007) 332–361 doi:10.1016/j.pmcj.2007.04.002.
22. Aitenbichler, E., Lyardet, F., Muhlhauser, M.: Designing and Implementing Smart Spaces.Cepis Upgrade (August 2007) 31–37