Final Report on Electric Clothes Dryers and ... - InspectAPedia
150
Final Report on Electric Clothes Dryers and Lint Ignition Characteristics May 2003 Abstract In FY 2002, U.S. Consumer Product Safety Commission staff completed a test program to evaluate residential electric clothes dryers under various test conditions. The test program included measurements of temperature and airflow characteristics for different electric clothes dryer designs under normal operating conditions and conditions of partially-blocked and fully-blocked exhaust ducting. The ignition characteristics of lint in relation to electric clothes dryer operation were also evaluated. The test program produced data on different dryer operating and design characteristics that can be used to help reduce the risk of lint ignition in a clothes dryer and help prevent fires. The experiments described in this research report were undertaken to support future advances in clothes dryer safety. This report should not be used to suggest that current clothes dryers are unsafe or defective.
-
Upload
khangminh22 -
Category
Documents
-
view
1 -
download
0
Transcript of Final Report on Electric Clothes Dryers and ... - InspectAPedia
Final Report on Electric Clothes Dryers and Lint Ignition Characteristics May 2003 Abstract In FY 2002, U.S. Consumer Product Safety Commission staff completed a test program to evaluate residential electric clothes dryers under various test conditions. The test program included measurements of temperature and airflow characteristics for different electric clothes dryer designs under normal operating conditions and conditions of partially-blocked and fully-blocked exhaust ducting. The ignition characteristics of lint in relation to electric clothes dryer operation were also evaluated. The test program produced data on different dryer operating and design characteristics that can be used to help reduce the risk of lint ignition in a clothes dryer and help prevent fires. The experiments described in this research report were undertaken to support future advances in clothes dryer safety. This report should not be used to suggest that current clothes dryers are unsafe or defective.

IMPORTANT
All airflow measurements are reported in Standard Feet per Minute (SFPM). These measurements are referenced to 25ºC and 29.92 inches Hg.

FINAL REPORT ON
ELECTRIC CLOTHES DRYERS AND LINT IGNITION CHARACTERISTICS May 2003
The experiments described in this research report were undertaken to support future advances in clothes dryer safety. This report should not be used to
suggest that current clothes dryers are unsafe or defective.
U.S. CONSUMER PRODUCT SAFETY COMMISSION 4330 EAST WEST HIGHWAY, BETHESDA, MARYLAND 20814

i
U.S. CONSUMER PRODUCT SAFETY COMMISSION
DIRECTORATE FOR ENGINEERING SCIENCES
FINAL REPORT ON
ELECTRIC CLOTHES DRYERSAND LINT IGNITION CHARACTERISTICS
May 2003
Arthur LeeElectrical Engineer
Division ofElectrical Engineering
ES
Directorate for
ngineering
ciences

US CONSUMER PRODUCT SAFETY COMMISSIONFINAL REPORT ON ELECTRIC CLOTHES DRYERS AND LINT IGNITION CHARACTERISTICS
May 2003
ii
ACKNOWLEDGMENTS
This project was completed with the help of CPSC staff in the Directorate for LaboratorySciences; Directorate for Engineering Sciences; Directorate for Economics Analysis; andDirectorate for Epidemiology.
Frank Dunmore, Ph.D., Directorate for Laboratory Sciences, provided technical expertisein all aspects of the project, and specifically in coordinating and implementing Task 3 - MonitorLint Distribution. He also authored the section of this report that discusses Task 3.
Timothy Smith, Directorate for Engineering Sciences - Division of Human Factors,conducted an analysis of consumer behavior with regard to clothes dryers, particularly related toabnormal operating conditions.
Sheela Kadambi, Directorate for Engineering Sciences, Division of ElectricalEngineering, conducted the initial work on clothes dryers in 1998, which set the foundation forthis project.
Terrance R. Karels, Directorate for Economic Analysis, provided information on theclothes dryer market over the past 10 years.
Mark Levenson, Ph.D., Directorate for Epidemiology – Division of Hazard Analysis,developed estimates of clothes dryer fire losses for a 10-year period and analyzed in-depthinvestigations of fire incidents associated with clothes dryers.
US CONSUMER PRODUCT SAFETY COMMISSIONFINAL REPORT ON ELECTRIC CLOTHES DRYERS AND LINT IGNITION CHARACTERISTICS
May 2003
iii
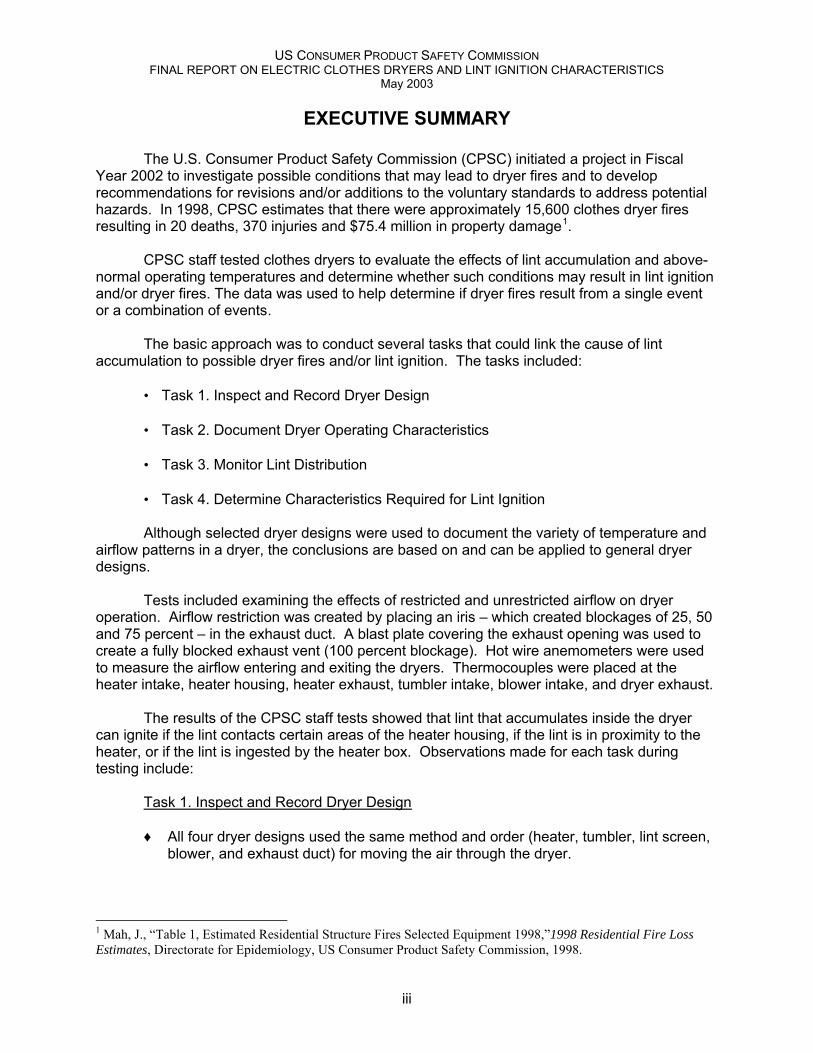
EXECUTIVE SUMMARY
The U.S. Consumer Product Safety Commission (CPSC) initiated a project in FiscalYear 2002 to investigate possible conditions that may lead to dryer fires and to developrecommendations for revisions and/or additions to the voluntary standards to address potentialhazards. In 1998, CPSC estimates that there were approximately 15,600 clothes dryer firesresulting in 20 deaths, 370 injuries and $75.4 million in property damage1.
CPSC staff tested clothes dryers to evaluate the effects of lint accumulation and above-normal operating temperatures and determine whether such conditions may result in lint ignitionand/or dryer fires. The data was used to help determine if dryer fires result from a single eventor a combination of events.
The basic approach was to conduct several tasks that could link the cause of lintaccumulation to possible dryer fires and/or lint ignition. The tasks included:
• Task 1. Inspect and Record Dryer Design
• Task 2. Document Dryer Operating Characteristics
• Task 3. Monitor Lint Distribution
• Task 4. Determine Characteristics Required for Lint Ignition
Although selected dryer designs were used to document the variety of temperature andairflow patterns in a dryer, the conclusions are based on and can be applied to general dryerdesigns.
Tests included examining the effects of restricted and unrestricted airflow on dryeroperation. Airflow restriction was created by placing an iris – which created blockages of 25, 50and 75 percent – in the exhaust duct. A blast plate covering the exhaust opening was used tocreate a fully blocked exhaust vent (100 percent blockage). Hot wire anemometers were usedto measure the airflow entering and exiting the dryers. Thermocouples were placed at theheater intake, heater housing, heater exhaust, tumbler intake, blower intake, and dryer exhaust.
The results of the CPSC staff tests showed that lint that accumulates inside the dryercan ignite if the lint contacts certain areas of the heater housing, if the lint is in proximity to theheater, or if the lint is ingested by the heater box. Observations made for each task duringtesting include:
Task 1. Inspect and Record Dryer Design
♦ All four dryer designs used the same method and order (heater, tumbler, lint screen,blower, and exhaust duct) for moving the air through the dryer.
1 Mah, J., “Table 1, Estimated Residential Structure Fires Selected Equipment 1998,”1998 Residential Fire LossEstimates, Directorate for Epidemiology, US Consumer Product Safety Commission, 1998.

US CONSUMER PRODUCT SAFETY COMMISSIONFINAL REPORT ON ELECTRIC CLOTHES DRYERS AND LINT IGNITION CHARACTERISTICS
May 2003
iv
♦ The length of the dryer’s exhaust duct extending out of the dryer may not allow thehouse duct to slide far enough onto the dryer’s exhaust duct to provide a securepressure fit.
♦ Using rigid external ducting does not allow for a secure pressure fit around thedryer’s male duct.
Task 2. Document Dryer Operating Characteristics
♦ The temperatures within a dryer, under both normal and abnormal conditions, weresimilar for the four different dryer designs tested, with only slight variations due todryer internal configurations.
♦ The temperatures measured inside the heater box, heater intake, and intake into thetumbler increased when the exhaust vent was partially blocked or fully blocked. Thetemperatures inside the tumbler, blower and exhaust vent decreased when theexhaust vent was partially blocked or fully blocked.
♦ When the exhaust vent was blocked up to 50 percent, the temperatures inside thedryer were similar to those measured when there was no blockage of the exhaustvent. When the exhaust vent was 75 percent or 100 percent blocked, temperaturesin certain areas inside the dryer increased significantly.
♦ Under normal operation, the airflow inside the exhaust vent decreased dramaticallyas the lint screen became blocked with lint particles.
♦ In general, the dryers only cycled on the high-limit thermostat when the exhaust ventwas 75 or 100 percent blocked, which caused the temperatures near the heater toincrease significantly.
♦ When the primary thermostat was bypassed (simulating a thermostat failure), thedryer operated at higher than normal temperatures – temperatures similar to thosemeasured when the exhaust vent was blocked 50 to 75 percent. In general (3 of the4 dryer designs tested), a failed-closed primary thermostat did not cause the dryer tocycle on the high limit thermostat for the unblocked exhaust vent condition.
Task 3. Monitor Lint Distribution
♦ Lint begins to accumulate inside a dryer chassis upon first use. Lint accumulates onthe dryer’s components, including the heater and the dryer floor. This accumulationoccurs even when the dryer’s lint screen has been cleaned after each usage, and thedryer is properly exhausted.
♦ Seals in the dryer’s interior exhaust venting may not be adequate to prevent linty airfrom escaping into the dryer’s interior.

US CONSUMER PRODUCT SAFETY COMMISSIONFINAL REPORT ON ELECTRIC CLOTHES DRYERS AND LINT IGNITION CHARACTERISTICS
May 2003
v
Task 4. Determine Characteristics Required for Lint Ignition
♦ Lint that accumulates on the heater housing can easily ignite under conditions of afailed high-limit thermostat and a blocked exhaust vent.
♦ Lint accumulating near the heater intake can ignite before the high-limit thermostatswitches the heater element off.
♦ Lint ingested by the heater and embers expelled from the heater outlet can easilyignite additional lint or fabric in the air stream, resulting in additional embers in thedryer system and exhaust vent.
The CPSC staff noted the following during testing and analysis:
♦ The high-limit thermostat may prematurely fail when subjected to high ambienttemperatures.

US CONSUMER PRODUCT SAFETY COMMISSIONFINAL REPORT ON ELECTRIC CLOTHES DRYERS AND LINT IGNITION CHARACTERISTICS
May 2003
vi
TABLE OF CONTENTS
ACKNOWLEDGMENTS ..................................................................................................iiEXECUTIVE SUMMARY ................................................................................................ iii1.0 INTRODUCTION ...................................................................................................... 1
1.1 General ............................................................................................................... 11.2 Project Objective................................................................................................. 11.3 Focus Objective .................................................................................................. 11.4 Technical Approach ............................................................................................ 2
1.4.1 Task 1: Inspect and Record Dryer Design .................................................. 21.4.2 Task 2: Document Dryer Operating Characteristics .................................... 21.4.3 Task 3: Monitor Lint Distribution ................................................................. 21.4.4 Task 4: Determine Characteristics Required for Lint Ignition ...................... 3
1.4.4.1 Ignition of Lint on and near the Heater Housing ................................. 31.4.4.2 Ignition of Lint Ingested into the Heater.............................................. 3
1.5 Organization of the Report .................................................................................. 31.6 Statement of Test Methodology........................................................................... 31.7 Global Terminology ............................................................................................. 4
2.0 DESCRIPTION OF TESTS AND TEST RESULTS ................................................... 62.1 Task 1: Inspect and Record Dryer Design........................................................... 6
2.1.1 Airflow Pattern ............................................................................................ 62.1.2 Heater Location and Configuration ............................................................. 72.1.3 Lint Screen Location................................................................................... 72.1.4 Tumbler Design .......................................................................................... 72.1.5 Blower (Fan) Design................................................................................... 82.1.6 Operating Features .................................................................................... 82.1.7 Safety Device Locations ............................................................................. 8
2.2 Task 2: Document Dryer Operating Characteristics............................................. 82.2.1 Exhaust Vent Setup.................................................................................... 82.2.2 Instrumentation Setup .............................................................................. 102.2.3 Global Test Procedure and Setup ............................................................ 132.2.4 Dryer Design A......................................................................................... 14
2.2.4.1 Dryer Design A –Temperature and Airflow Characteristics, Blockedand Unblocked Exhaust Vent Conditions ............................................... 14
2.2.4.2 Dryer Design A – Airflow.................................................................. 202.2.4.3 Dryer Design A – Primary Thermostat Bypassed............................. 25
2.2.5 Dryer Design B......................................................................................... 272.2.5.1 Dryer Design B –Temperature and Airflow Characteristics, Blocked
and Unblocked....................................................................................... 272.2.5.2 Dryer Design B – Airflow.................................................................. 342.2.5.3 Dryer Design B – Primary Thermostat Bypassed............................. 38
2.2.6 Dryer Design C......................................................................................... 402.2.6.1 Dryer Design C – Temperature and Airflow Characteristics, Blocked
and Unblocked....................................................................................... 402.2.6.2 Dryer Design C – Airflow.................................................................. 472.2.6.3 Dryer Design C – Primary Thermostat Bypassed............................. 51
2.2.7 Dryer Design D......................................................................................... 532.2.7.1 Dryer Design D –Temperature and Airflow Characteristics, Blocked
and Unblocked....................................................................................... 53

US CONSUMER PRODUCT SAFETY COMMISSIONFINAL REPORT ON ELECTRIC CLOTHES DRYERS AND LINT IGNITION CHARACTERISTICS
May 2003
vii
2.2.7.2 Dryer Design D – Airflow.................................................................. 602.2.7.3 Dryer Design D – Primary Thermostat Bypassed............................. 64
2.3 Task 3: Monitor Lint Distribution ........................................................................ 662.3.1 Test Setup................................................................................................ 662.3.2 Test Description ....................................................................................... 67
2.3.2.1 Method 1 – Weight Loss of Load ..................................................... 672.3.2.2 Method 2 – Visual Examination........................................................ 68
2.3.3 Examination of Dryer Design A................................................................. 692.4 Task 4: Determine Characteristics Required for Lint Ignition ............................. 71
2.4.1 Test Setup................................................................................................ 712.4.2 Instrumentation Setup .............................................................................. 712.4.3 Phase I – Ignition Characteristics of Lint On and Near the Heater Box ..... 75
2.4.3.1 Top of Heater Housing..................................................................... 752.4.3.2 Side of the Heater Housing.............................................................. 792.4.3.3 Lint Samples at the Heater Intake.................................................... 83
2.4.4 Phase II – Ignition Characteristics of Lint Ingested into the Heater Box .... 892.4.4.1 Part 1 – Lint Samples Ingested by the Heater Box........................... 892.4.4.2 Part 2 – Ignition of Target Materials Downstream from the Heater
Exhaust ................................................................................................. 903.0 DISCUSSION ......................................................................................................... 95
3.1 Task 1: Inspect and Record Dryer Design......................................................... 953.2 Task 2: Document Dryer Operating Characteristics........................................... 95
3.2.1 Normal Operation (Unblocked Exhaust Vent) ........................................... 953.2.2 Partially-Blocked and 100%-Blocked Conditions ...................................... 99
3.3 Task 3: Monitor Lint Distribution ...................................................................... 1083.3.1 Dryer Design A at Positive Pressure....................................................... 1083.3.2 Other Dryer Designs at Positive Pressure .............................................. 109
3.4 Task 4: Determine Characteristics Required for Lint Ignition ........................... 1113.4.1 Lint on the Heater Housing ..................................................................... 1113.4.2 Lint Samples at the Heater Intake .......................................................... 111
3.4.2.1 High-Limit Thermostat Bypassed and No Airflow ........................... 1113.4.2.2 High-Limit Connected in Series and No Airflow.............................. 1163.4.2.3 High-Limit Connected in Series and Airflow ................................... 119
3.4.3 Lint Samples Ingested into the Heater .................................................... 1213.4.4 Ignition of Target Material Downstream from the Heater Exhaust ........... 1223.4.5 High-Limit Thermostat Analysis .............................................................. 122
3.4.5.1 High-Limit Thermostat 1 (HLT1) Analysis ...................................... 1233.4.5.2 High-Limit Thermostat 2 (HLT2) Analysis ...................................... 127
4.0 SUMMARY AND CONCLUSIONS ........................................................................ 133Appendices A to J........................................................................................................A-J

US CONSUMER PRODUCT SAFETY COMMISSIONFINAL REPORT ON ELECTRIC CLOTHES DRYERS AND LINT IGNITION CHARACTERISTICS
May 2003
viii
LIST OF FIGURES
Figure 1. Dryer Design Characteristics ......................................................................................6Figure 2. Heating Element in a Heater Box Configuration ...........................................................7Figure 3. Circular Heating Element in Dryer Design D ................................................................7Figure 4. Exhaust Vent Setup .....................................................................................................9Figure 5. Thermocouple Response Before Task 2 Testing .......................................................11Figure 6. Thermocouple Response After Task 2 Testing ..........................................................11Figure 7. Average Responses per Oven Set Temperatures and Day ........................................12Figure 8. Dryer Design A Intake and Exhaust ...........................................................................14Figure 9. Dryer Design A – Thermocouple and Airflow Measurements with a Wet Load ...........16Figure 10. Dryer Design A – T1 Heater Intake Comparison ......................................................17Figure 11. Dryer Design A – T3 Heater Housing Comparison ...................................................18Figure 12. Dryer Design A – T2 Heater Exhaust Comparison ...................................................19Figure 13. Dryer Design A – Intake Air Velocity ........................................................................21Figure 14. Dryer Design A – Exhaust Air Velocity .....................................................................22Figure 15. Dryer Design A – Average Airflow Velocities (High Heat and Dry Load)...................23Figure 16. Dryer Design A – Average Airflow Velocities (No Heat and No Load) ......................24Figure 17. Dryer Design A – Primary Thermostat Bypassed .....................................................26Figure 18. Dryer Design B – Air Flow Through the Tumbler ......................................................27Figure 19. Dryer Design B – Thermocouple and Airflow Measurements (Wet Load) .................30Figure 20. Dryer Design B – T1 Heater Intake Comparison ......................................................31Figure 21. Dryer Design B – T3 Heater Housing Comparison ...................................................32Figure 22. Dryer Design B – T5 Intake into the Blower Comparison..........................................33Figure 23. Dryer Design B – Intake Air Velocity ........................................................................35Figure 24. Dryer Design B – Exhaust Vent Air Velocity .............................................................36Figure 25. Dryer Design B – Average Airflow Velocities (High Heat and Wet Load) ..................37Figure 26. Dryer Design B – Primary Thermostat Bypassed .....................................................39Figure 27. Dryer Design C – Airflow through the Tumbler .........................................................40Figure 28. Dryer Design C – Thermocouple and Airflow Measurements (Wet Load).................43Figure 29. Dryer Design C – T1 Heater Intake Comparison ......................................................44Figure 30. Dryer Design C – T3 Heater Housing Comparison...................................................45Figure 31. Dryer Design C – T5 Intake into the Blower Comparison .........................................46Figure 32. Dryer Design C – Intake Air Velocity ........................................................................48Figure 33. Dryer Design C – Exhaust Vent Air Velocity .............................................................49Figure 34. Dryer Design C – Average Airflow Velocities (High Heat and Wet Load)..................50Figure 35. Dryer Design C – Primary Thermostat Bypassed .....................................................52Figure 36. Dryer Design D – Airflow Through the Tumbler ........................................................53Figure 37. Setup with a Relay and Battery for T2 Analog..........................................................54Figure 38. Dryer Design D – Thermocouple and Airflow Measurements (Wet Load).................56Figure 39. Thermocouple, Airflow and Relay (T2 Analog) Measurements.................................57Figure 40. Dryer Design D – T1 Heater Intake Comparison ......................................................58Figure 41. Dryer Design D – T3 Heater Housing Temperature Comparison..............................59Figure 42. Dryer Design D – Intake Air Velocity ........................................................................61Figure 43. Dryer Design D – Exhaust Vent Air Velocity .............................................................62Figure 44. Dryer Design D –Average Airflow Velocities (High Heat and No Load) ....................63Figure 45. Dryer Design D – Primary Thermostat Bypassed .....................................................65Figure 46. Dryer Design A Used in Task 3 Testing ...................................................................66

US CONSUMER PRODUCT SAFETY COMMISSIONFINAL REPORT ON ELECTRIC CLOTHES DRYERS AND LINT IGNITION CHARACTERISTICS
May 2003
ix
Figure 47. Lint Accumulated at Bottom of Dryer After 100 cycles..............................................68Figure 48. Lint Accumulated on Interior of Dryer After 48 Cycles ..............................................69Figure 49. Lint Accumulated on Interior of Dryer After 100 Cycles ............................................69Figure 50. Lint Build-up at Blower Housing Seal and Dryer Floor..............................................70Figure 51. Test Setup for Lint Ignition .......................................................................................73Figure 52. Test Setup for Lint Ignition .......................................................................................74Figure 53. Location of Lint Samples on the Housing .................................................................75Figure 54. Lint Sample on Heater Housing at Location A..........................................................76Figure 55. Sample Smoldering at Location A ............................................................................77Figure 56. Sample s5-8 at Location B .......................................................................................78Figure 57. Thermocouple Data for Sample s5-8 .......................................................................78Figure 58. Sample s2-7 on the Side of the Heater Housing at Location C.................................80Figure 59. Sample s2-7 Thermocouple Traces .........................................................................80Figure 60. Sample s2-2 Tested at Location D ...........................................................................81Figure 61. Sample s2-6 Tested at Location E ...........................................................................82Figure 62. Thermocouple Traces for Sample s2-6 at Location E...............................................83Figure 63. Lint Sample at Heater Intake....................................................................................84Figure 64. Infrared Camera Setup ............................................................................................84Figure 65. Sample s3-10, Video Camera and Infrared Camera.................................................87Figure 66. Sample s3-10 – Thermocouple and Airflow Data .....................................................88Figure 67. Setup with Glass Tube.............................................................................................89Figure 68. Setup with Target Material in the Glass Tube...........................................................91Figure 69. Target Sample Igniting During Test 1.......................................................................93Figure 70. Test 1 – Thermocouple and Airflow Measurements Task 4- Test 1 ..........................94Figure 71. Dryer Design Comparison for T1, Heater Intake ......................................................97Figure 72. Dryer Design Comparison for T3, Heater Housing ...................................................97Figure 73. Dryer Design Comparison for T5, Blower Intake ......................................................98Figure 74. Dryer Design Comparison for T4, Exhaust Vent.......................................................98Figure 75. Maximum Temperatures Measured at Location .......................................................99Figure 76. Intake into the Heater.............................................................................................101Figure 77. Heater Exhaust Temperature.................................................................................101Figure 78. Heater Housing Temperature.................................................................................102Figure 79. Exhaust Vent Temperature ....................................................................................102Figure 80. Intake into the Blower Temperature .......................................................................103Figure 81. Intake into the Tumbler Temperature .....................................................................103Figure 82. Maximum Temperatures for All Dryers at Each Location and Condition .................105Figure 83. Comparison of Exhaust Air Velocity for all Dryer Designs ......................................107Figure 84. Calculated Average Exhaust Air Velocity ...............................................................107Figures 85 (a) and (b). Dryer Design A – Blower Assembly ....................................................108Figure 86. An Illustration of Airflow through the Dryer and Blower ..........................................109Figure 87. Junction Between the Blower and Exhaust Vent ....................................................110Figure 88. Lint Samples Tested 3 Inches from the Heater Housing Edge ...............................112Figure 89. T1 Only - 3 Inches from the Heater Housing Edge .................................................113Figure 90. T2 Only - 3 Inches from the Heater Housing Edge .................................................113Figure 91. T3 Only - 3 Inches from the Heater Housing Edge .................................................114Figure 92. Lint Samples Tested 4 Inches from the Heater Housing Edge ...............................115Figure 93. Ignition Time for 2 and 3 Inches from Heater Edge ................................................116Figure 94. Lint Samples s3-16 and s3-17 Tested 1 Inch from the Heater Edge ......................117Figure 95. Lint Samples s3-14 and s3-18 Tested 2 Inches from the Heater Edge...................118Figure 96. High Limit Activation Time Comparison at Sample 2 and 3 inches .........................119
US CONSUMER PRODUCT SAFETY COMMISSIONFINAL REPORT ON ELECTRIC CLOTHES DRYERS AND LINT IGNITION CHARACTERISTICS
May 2003
x
Figure 97. Lint Samples Tested 1 Inch from the Heater Edge with Airflow ..............................120Figure 98. Samples Tested at 1 Inch, With and Without High-Limit Thermostat......................121Figure 99. Sample s3-13 Test with the High Limit Thermostat in Series .................................123Figure 100. Failed Thermostat compared to a Replacement Thermostat ................................124Figure 101. X-ray Images of High-Limit Thermostat 1 (HLT1) .................................................125Figure 102. Contacts for High-Limit Thermostat 1 (HLT1).......................................................125Figure 103. Contact Pads for High-Limit Thermostat 1 (HLT1)................................................126Figure 104. Sample s5-14 with High Limit Thermostat in Series .............................................127Figure 105. High-Limit Thermostat 2 (HLT2) before and after Failure .....................................128Figure 106. X-ray Images of High-Limit Thermostat 2 (HLT2) .................................................129Figure 107. Internal View for High-Limit Thermostat 2 ............................................................129Figure 108. Setup for Testing High-Limit Thermostats ............................................................130Figure 109. New High Limit Thermostat ..................................................................................130Figure 110. Thermocouple Data for the New High-Limit Thermostat.......................................131Figure 111. Second Failed High Limit Thermostat, HLT2........................................................131Figure 112. Comparison between New and Failed High Limit Thermostats ............................132
LIST OF TABLES
Table 1. Unrestricted and Restricted Duct Configurations...........................................................9Table 2. Equivalent Linear Duct Length ....................................................................................10Table 3. General Locations of Thermocouples and Anemometers............................................12Table 3-continued. General Locations of Thermocouples and Anemometers ...........................13Table 4. Dryer Design A Measurement Data (°C and sfpm)......................................................15Table 5. Dryer Design B Statistics (°C and sfpm)......................................................................28Table 6. Dryer Design C – Statistics (°C and sfpm)...................................................................41Table 6. Thermocouple Location and Setup..............................................................................71Table 7. Testing on Top of the Heater Housing at Location A ...................................................76Table 8. Testing on Top of the Heater Housing at Location B. ..................................................77Table 9. Testing on the Side of the Heater Housing at Location C ............................................79Table 10. Testing on Top of the Heater Housing at Location D .................................................81Table 11. Testing on the Side of the Heater Housing at Location E ..........................................82Table 12. Lint Samples at the Heater Intake .............................................................................86Table 13. Lint Samples for Task 4 - Phase II Testing................................................................90Table 14. Target Materials for Task 4 - Phase II Testing...........................................................91Table 15. Change in Minimum Temperature ...........................................................................106Table 16. Change in Average Temperature ............................................................................106Table 17. Change in Maximum Temperature ..........................................................................106Table 18. Ignition Times at Heater Intake ...............................................................................115Table 19. Approximate High Limit Thermostat Activation Times .............................................118Table 20. Life History of Failed High-Limit Thermostats ..........................................................123

US CONSUMER PRODUCT SAFETY COMMISSIONFINAL REPORT ON ELECTRIC CLOTHES DRYERS AND LINT IGNITION CHARACTERISTICS
May 2003
1
1.0 INTRODUCTION
1.1 General
Over the years, the number of safety devices included in clothes dryers to reduce theincidence of fire has increased. The increased safety of dryers has likely contributed to theslowed growth rate in dryer fires. However, there were an estimated 15,600 clothes dryer firesresulting in 20 deaths, 370 injuries and $75.4 million in property damage in 1998 2.
In 1998, 56.2% of all U.S. households had an electric clothes dryer, and 17.9% had agas dryer3. In total, over 74% of all U.S. households had at least one clothes dryer in 1998.There are just over 100 million US households; thus, there are over 74 million clothes dryers inuse in the U.S. Over the period 1990 through 1998, shipments (gas, electric, and compactdryers) increased 41% overall, from almost 4.6 million units to almost 6.5 million units3. In 2001,the number of dryer shipments was over 6.7 million units4. There was a consistent growth in thesales of clothes dryers in the U.S. from 1990 to 2001.
The U.S. Consumer Product Safety Commission (CPSC) initiated a project in FiscalYear (FY) 2002 to investigate possible conditions that may lead to dryer fires and to assess theadequacy of the applicable voluntary standards in addressing potential hazards.
Four years earlier, in FY 1998, CPSC staff began an initial evaluation of clothes dryers.The results of the tests conducted during that evaluation showed that, when the dryer exhaustwas blocked, some areas of the dryer would run cooler than normal and other areas would runhotter. CPSC staff believed that long-term operation of a dryer under conditions of restrictedairflow, such as that caused by lint accumulation, could eventually lead to premature failure ofcomponents that may result in a fire.
1.2 Project Objective
The CPSC clothes dryer project was initiated to determine the cause(s) for clothes dryerfires and to develop recommendations for revisions and/or additions to the voluntary standardsto address those causes and help prevent dryer fires.
1.3 Focus Objective
The focus objective of this project was to evaluate the effects of lint accumulation andabove-normal operating temperatures in electric clothes dryers and determine whether suchconditions may result in dryer fires and/or lint ignition.
2 Mah, J., ”Table 1, Estimated Residential Structure Fires Selected Equipment 1998,”1998 Residential Fire LossEstimates, Directorate for Epidemiology, US Consumer Product Safety Commission, 1998.3 Appliance Magazine, Statistically Review, A Dana Chase Publication, May 19994 Appliance Magazine, U.S. Shipment Statistics, A Dana Chase Publication, March 2002

US CONSUMER PRODUCT SAFETY COMMISSIONFINAL REPORT ON ELECTRIC CLOTHES DRYERS AND LINT IGNITION CHARACTERISTICS
May 2003
2
1.4 Technical Approach
The overall goal was to determine whether lint accumulation could result in clothes dryerfires and/or lint ignition. To accomplish this large task, smaller tasks were designed to link thecause of lint accumulation to possible dryer fires and/or lint ignition. The tasks were set up toeliminate as many dryer design variables as possible.
Tests were conducted with sample clothes dryers at both normal and above-normaloperating temperatures; with dryers operating in the high-limit cycle mode (caused by either afully or partially blocked exhaust vent); with bypassed temperature limiting devices (simulatingcomponent failure); and without any safety temperature limiting devices.
The following four smaller tasks were defined to accomplish the main objective:
1.4.1 Task 1: Inspect and Record Dryer Design
The objective of this task was to record the types and locations of the internalcomponents and layout for each sample dryer and to photograph the internal configuration ofeach dryer. The airflow path throughout each dryer was illustrated and the locations of theheater, blower, and lint screen were documented. Based on the results of the examination ofthe dryers, the location of instrumentation was determined for Task 2 - Document DryerOperating Characteristics.
1.4.2 Task 2: Document Dryer Operating Characteristics
The objective of this task was to characterize the airflow patterns and temperaturesinside each dryer design during normal (unblocked) and restricted (blocked) airflow through theexhaust vent. The dryers were characterized by operating according to the manufacturer’sinstructions with a (wet and/or dry) clothes load and without a load (a dryer may have been fullycharacterized with a wet load if the test data developed for a dry load and wet load, with noexhaust blockage, were not comparable.) The data in this task was used to set the testvariables in Task 4 - Determine the Characteristics for Lint Ignition.
1.4.3 Task 3: Monitor Lint Distribution
The objective of this task was to monitor lint distribution and accumulation in areas withina clothes dryer during operation with normal airflow. The load for these tests consisted of 10wet (washed and spun dry) bath towels. A dryer was operated according to the manufacturer’sinstructions and subjected to normal use drying cycles. The dryer was operated for a total of100 cycles. After 48 cycles, the accumulation of lint was recorded near the heater housing,internal exhaust duct, and internal dryer floor. The dryer was examined at the end of 100cycles.
Lint accumulation was characterized in one dryer. An analysis of potential causes for lintaccumulation in other dryer designs was conducted.

US CONSUMER PRODUCT SAFETY COMMISSIONFINAL REPORT ON ELECTRIC CLOTHES DRYERS AND LINT IGNITION CHARACTERISTICS
May 2003
3
1.4.4 Task 4: Determine Characteristics Required for Lint Ignition
This task had two objectives: Evaluate the ignition characteristics of lint samples on andnear the heater box, and evaluate the ignition characteristics of lint when samples wereingested into the heater box. The lint samples used in these tests were 100% cotton and weretaken from the lint that accumulated during tests conducted in Task 3, unless otherwise noted.
1.4.4.1 Ignition of Lint on and near the Heater Housing
The heat output and airflow through a heater were varied. Lint samples were placed atvarious locations on and near the heater box. Power to the heating element was introducedinstantaneously or was stepped up to observe the different effects on the lint samples. Sometests were conducted with the high limit thermostat in series with the heating element, and somewere conducted with the thermostat bypassed. The test results were categorized as one of thefollowing: no ignition, charred only, smoldered, or ignition (flames).
1.4.4.2 Ignition of Lint Ingested into the Heater
Lint was introduced into the airflow of the heater intake. The lint samples were placed infront of the heater opening and restrained until ready for release. The system (heater,temperature, and air velocity) was stabilized for 5 minutes before proceeding. When the systemhad stabilized, the lint samples were released. The results were observed for 15 minutes, orless if the samples were consumed.
1.5 Organization of the Report
This report is presented in two parts. The first part discusses the overall testing programand includes pertinent test descriptions and resultant data, analysis, findings and conclusions.The organization is such that each task is headed as a major test phase.
The second part contains appendices that present expanded test data to support thefindings and the conclusions. The appendices are also contained on the compact disk (CD),which can be accessed through a sub menu.
1.6 Statement of Test Methodology
The test program was designed to identify and eliminate as many dryer design variablesas possible for Task 4 testing. During the tests, temperature and airflow characteristics of eachdryer design were recorded. Observations regarding dryer designs that may have causedvariances in the test data are noted in the report.
A large amount of test data was collected during this test program. Only the pertinentdata for each task are presented. All data collected are noted in the report but may not bepresented if the data are not pertinent to the discussion or conclusions.
The clothes dryers used in this test program were selected by design, cost and featuresavailable. Different dryer designs were selected to demonstrate the variety of temperature and

US CONSUMER PRODUCT SAFETY COMMISSIONFINAL REPORT ON ELECTRIC CLOTHES DRYERS AND LINT IGNITION CHARACTERISTICS
May 2003
4
airflow patterns in a dryer. The dryers selected were in the price range of $300 to $400 andincluded similar selectable dryer settings and features.
Although only electric dryers were tested in this program, many of the conclusions maybe applicable to gas-fueled clothes dryers.
1.7 Global Terminology
Lint 100% cotton fibers that were expelled from a clothes load of cotton terry towelsduring the drying process. The lint material may refer to the material collectedfrom the lint screen or the material that accumulated inside the cabinet (housing)of the dryer.
Units Unless otherwise specified, all temperatures reported are in degrees Celsius(°C), all airflow measurements are in standard feet per minute (sfpm), and allweight measurements are in grams (g), and length in inches (in) and feet (ft).
Top The side of the dryer that is viewed from above.
Front The side of the dryer containing the door.
Rear The side of the dryer containing the dryer’s exhaust vent and power cord.
Floor The internal side of the bottom of the dryer that rests on the building floor.
Inside The interior of the dryer containing the motor, drum, blower, and heater.
Smolder May contain one or more of the following: smoke, embers, or charring with noevidence of flames.
Ignition Flames are visible.
Test Load The load of towels used in the dryer, either dry or wet load.
Wet Load Ten 100% cotton terry towels that were washed and spun dry in a washingmachine, unless otherwise specified. No detergent was used.
Dry Load Ten 100% cotton terry towels that were dry to the touch, unless otherwisespecified.
Damp Load Ten 100% cotton terry towels that were wet to the touch, but weighedsubstantially less then a wet load, unless otherwise specified. No detergent wasused.
High Limit ThermostatThe thermostat located near the heating element of the dryer (High-Limit Switch).

US CONSUMER PRODUCT SAFETY COMMISSIONFINAL REPORT ON ELECTRIC CLOTHES DRYERS AND LINT IGNITION CHARACTERISTICS
May 2003
5
Primary ThermostatThe thermostat located between the lint screen and the blower (OperatingSwitch, Operating Thermostat).
Thermostat OpenedThe thermostat reached its upper set point temperature and separated thecontacts.
Thermostat ClosedThe thermostat reached its lower set point temperature and closed the contacts.
Abnormal Operating ConditionThe dryer operating or cycling on the high-limit thermostat, or tests conductedwith all devices bypassed.
Normal Operating ConditionThe dryer operating or cycling on the primary thermostat.
High-Limit CyclingThe dryer operating or cycling on the High-Limit Thermostat.
Exhaust VentThe venting from the dryer to the outside of the building. All venting material was4-inch rigid metal duct. All joints were sealed with foil tape except for theconnection to the dryer; the exhaust vent was secured to the dryer using a 4-inchduct (hose) clamp.
Fully Blocked ExhaustThe exhaust vent was completely obstructed with a blast plate (100% blocked).
Partially Blocked ExhaustThe airflow in the exhaust vent was restricted by an iris opening less than 4inches in diameter (25%, 50%, and 75% blocked).
Unblocked ExhaustThe exhaust vent contained no obstruction.
Heater The mechanism to warm the air flowing through the dryer (the heating element).
Heater Box A rectangular shaped housing containing the heating element.
US CONSUMER PRODUCT SAFETY COMMISSIONFINAL REPORT ON ELECTRIC CLOTHES DRYERS AND LINT IGNITION CHARACTERISTICS
May 2003
6
2.0 DESCRIPTION OF TESTS AND TEST RESULTS
2.1 Task 1: Inspect and Record Dryer Design
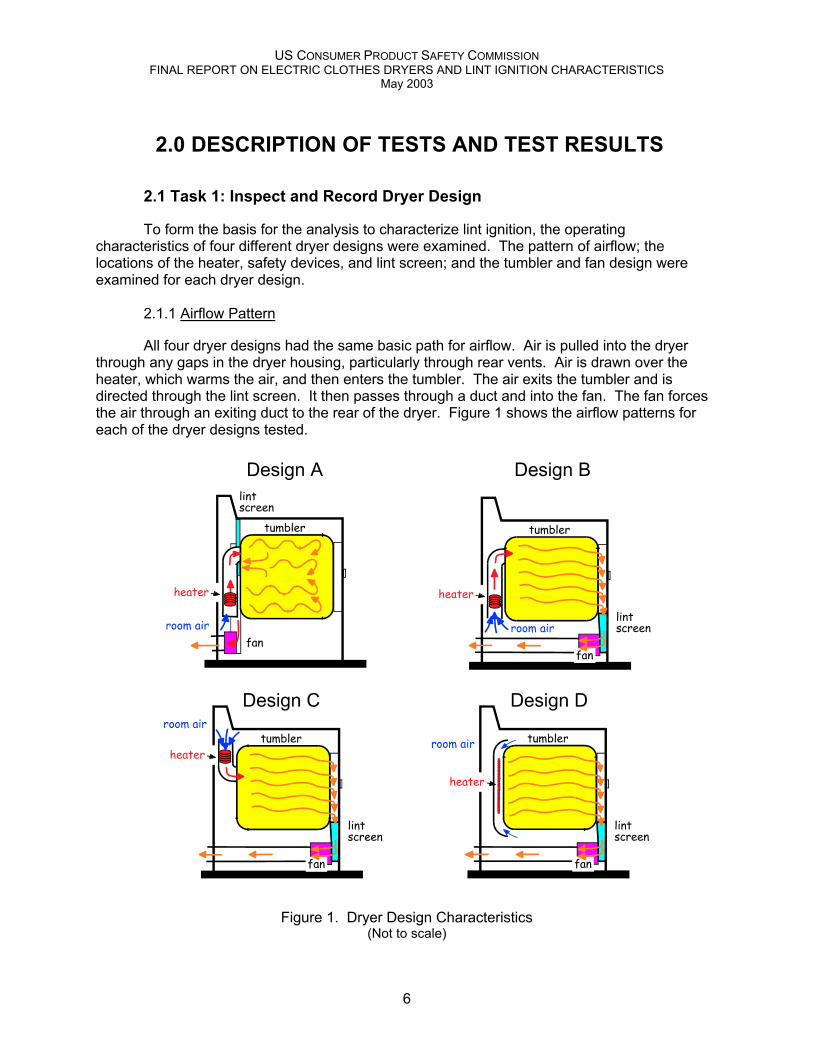
To form the basis for the analysis to characterize lint ignition, the operatingcharacteristics of four different dryer designs were examined. The pattern of airflow; thelocations of the heater, safety devices, and lint screen; and the tumbler and fan design wereexamined for each dryer design.
2.1.1 Airflow Pattern
All four dryer designs had the same basic path for airflow. Air is pulled into the dryerthrough any gaps in the dryer housing, particularly through rear vents. Air is drawn over theheater, which warms the air, and then enters the tumbler. The air exits the tumbler and isdirected through the lint screen. It then passes through a duct and into the fan. The fan forcesthe air through an exiting duct to the rear of the dryer. Figure 1 shows the airflow patterns foreach of the dryer designs tested.
Figure 1. Dryer Design Characteristics(Not to scale)

US CONSUMER PRODUCT SAFETY COMMISSIONFINAL REPORT ON ELECTRIC CLOTHES DRYERS AND LINT IGNITION CHARACTERISTICS
May 2003
7
2.1.2 Heater Location and Configuration
In all four clothes dryers, the heaters were located at the rear of the dryer. In three ofthe dryer designs, the heating element was contained in a rectangular metal enclosure, or“heater box” (Dryer Designs A, B and C). The location of the heater box varied among thesethree dryers. In two dryers, the heater boxes were oriented with the air intake directed towardsthe floor of the dryers (Dryer Designs A and B); and in the other dryer, the heater box waslocated near the top and the air intake directed towards the top of the dryer (Dryer Design C).The heating elements contained either one or two rows inside the heater box, as shown inFigure 2. The fourth dryer (Dryer Design D) had a circular heating element configuration asshown in Figure 3. The circular heating element was located behind the tumbler.
Figure 2. Heating Element in a Heater Box Configuration(Does not represent any specific dryer design)
Figure 3. Circular Heating Element in Dryer Design D(Not to Scale)
2.1.3 Lint Screen Location
In three of the four dryers, the lint screen was located at the front of the dryer and wasaccessible at the bottom of the door opening (Dryer Designs B, C and D). The lint screen of thefourth dryer was located at the rear of the dryer and was accessible from the top of the dryer(Dryer Design A).
2.1.4 Tumbler Design
The tumbler designs and sizes were similar for all four dryers with several noteddifferences. All the tumblers contained gaskets at the front and rear of the tumbler. Three of

US CONSUMER PRODUCT SAFETY COMMISSIONFINAL REPORT ON ELECTRIC CLOTHES DRYERS AND LINT IGNITION CHARACTERISTICS
May 2003
8
the tumbler designs contained three baffles each that were spaced evenly. The other tumblercontained two baffles and a hump, evenly spaced.
2.1.5 Blower (Fan) Design
All four dryers used a centrifugal-type fan. The centrifugal fan drew air through thecenter and forced it outward. All the fan “blades” were constructed of plastic or plasticreinforced with fibers.
2.1.6 Operating Features
All dryer designs offered a choice of drying cycles: Timed Dry, Air Dry and Auto Dry. Toeliminate any possible design variance in drying times during testing, only the Timed Dry cyclewas used.
2.1.7 Safety Device Locations
The locations of the safety devices on the dryers were similar. All four dryers had aminimum of two safety devices. One temperature switch (the primary or operating thermostat)was located after the lint screen and before the blower air intake. The second temperatureswitch (the high-limit thermostat) was located near the heater air intake.
2.2 Task 2: Document Dryer Operating Characteristics
The main objective of this task was to record any similar or varying characteristics of aclothes dryer during normal and abnormal operations. The normal operation test wasconducted with unrestricted airflow in the exhaust vent. Abnormal operation was defined as thedryer not cycling on the primary thermostat or cycling on the high-limit thermostat. The effectsof a restricted exhaust vent were examined. The effects of a bypassed primary thermostat (tosimulate thermostat failure) were also characterized.
2.2.1 Exhaust Vent Setup
The same length and configuration of exhaust duct was used to vent each dryer designduring testing. All venting material was 4-inch rigid metal duct. All joints were sealed with foiltape except the connection from the ducting to the dryer, which was secured using a 4-inch duct(hose) clamp. The exhaust vent was connected to a 4” angled wall cap. The wall capcontained a rodent screen with a grid of ¼-inch square openings. Figure 4 illustrates the setupused to vent the dryers.

US CONSUMER PRODUCT SAFETY COMMISSIONFINAL REPORT ON ELECTRIC CLOTHES DRYERS AND LINT IGNITION CHARACTERISTICS
May 2003
9
Figure 4. Exhaust Vent Setup
For tests in which airflow was restricted, an iris – placed in series with the exhaust ductbetween the first and second 90-degree elbows – was used to create a partially-blockedexhaust vent condition. Blockages of 25%, 50% and 75% were created using the iris. Thepercentage of blockage was calculated from that part of the cross section of the 4-inch duct thatremained unblocked, as shown in Table 1.
A blast plate covering 100% of the opening was used to create a fully-blocked exhaustvent (100% blockage). The blast plate was placed in the same location as the iris in theexhaust vent.
Table 1. Unrestricted and Restricted Duct Configurations
d (inches) Blockage (%)
4 0unrestricted
3.46 25partially
2.83 50partially
2 75partially
0 100blocked
US CONSUMER PRODUCT SAFETY COMMISSIONFINAL REPORT ON ELECTRIC CLOTHES DRYERS AND LINT IGNITION CHARACTERISTICS
May 2003
10
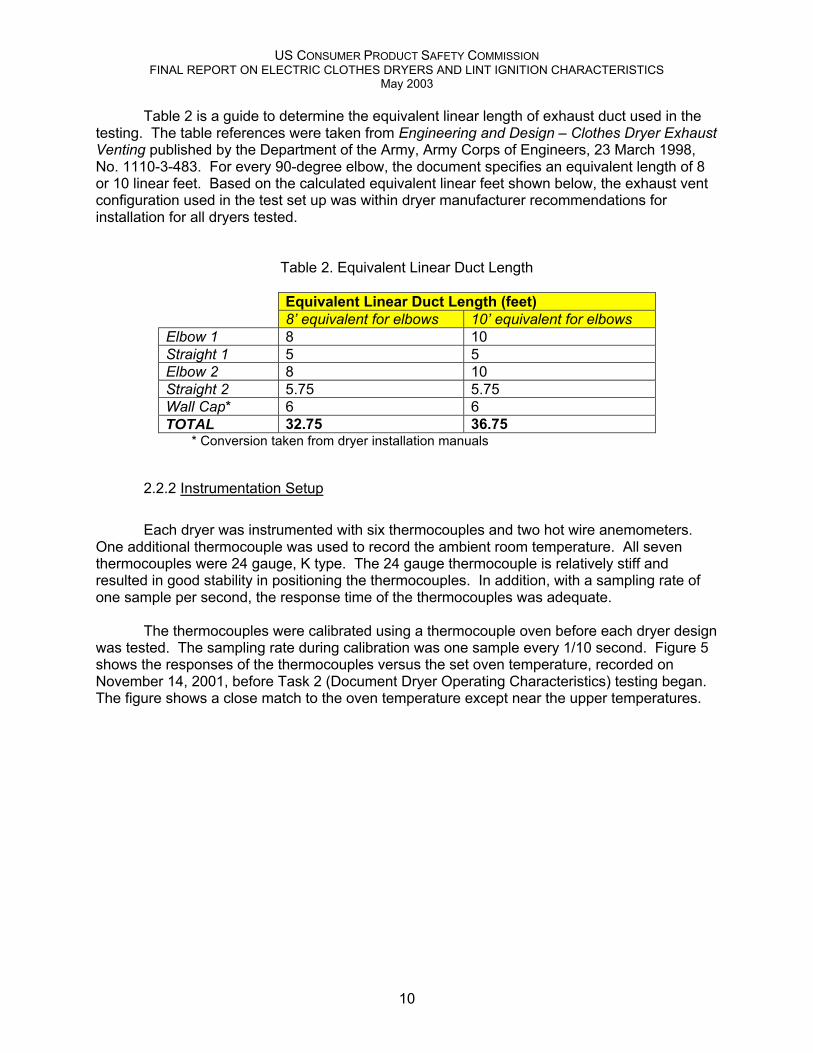
Table 2 is a guide to determine the equivalent linear length of exhaust duct used in thetesting. The table references were taken from Engineering and Design – Clothes Dryer ExhaustVenting published by the Department of the Army, Army Corps of Engineers, 23 March 1998,No. 1110-3-483. For every 90-degree elbow, the document specifies an equivalent length of 8or 10 linear feet. Based on the calculated equivalent linear feet shown below, the exhaust ventconfiguration used in the test set up was within dryer manufacturer recommendations forinstallation for all dryers tested.
Table 2. Equivalent Linear Duct Length
Equivalent Linear Duct Length (feet)8’ equivalent for elbows 10’ equivalent for elbows
Elbow 1 8 10Straight 1 5 5Elbow 2 8 10Straight 2 5.75 5.75Wall Cap* 6 6TOTAL 32.75 36.75
* Conversion taken from dryer installation manuals
2.2.2 Instrumentation Setup
Each dryer was instrumented with six thermocouples and two hot wire anemometers.One additional thermocouple was used to record the ambient room temperature. All seventhermocouples were 24 gauge, K type. The 24 gauge thermocouple is relatively stiff andresulted in good stability in positioning the thermocouples. In addition, with a sampling rate ofone sample per second, the response time of the thermocouples was adequate.
The thermocouples were calibrated using a thermocouple oven before each dryer designwas tested. The sampling rate during calibration was one sample every 1/10 second. Figure 5shows the responses of the thermocouples versus the set oven temperature, recorded onNovember 14, 2001, before Task 2 (Document Dryer Operating Characteristics) testing began.The figure shows a close match to the oven temperature except near the upper temperatures.

US CONSUMER PRODUCT SAFETY COMMISSIONFINAL REPORT ON ELECTRIC CLOTHES DRYERS AND LINT IGNITION CHARACTERISTICS
May 2003
11
Thermocouple CalibrationNovember 14, 2001
0
20
40
60
80
100
120
140
160
180
200
0 50 100 150 200
Oven Temperature Data Points
Tem
pera
ture
(C)
Oven temperatureT1T2T3T4T5T6T7
Figure 5. Thermocouple Response Before Task 2 Testing
At the end of this task, the thermocouples were re-checked, as shown in Figure 6.Figure 6 shows the high temperature closely follows the oven set temperature. Thecalibration/check tests taken in December 2001 and early January 2002 also have similarresponses.
Thermocouple CalibrationJanuary 22, 2002
0
50
100
150
200
250
300
0 50 100 150 200 250 300Oven Temperature Data Points
Tem
pera
ture
(C)
Oven temperatureT1T2T3T4T5T6T7
Figure 6. Thermocouple Response After Task 2 Testing
Figure 7 shows the average temperatures for all thermocouples compared to the oventemperatures for the days they were calibrated. The responses of the thermocouples show theyare slightly below the oven set temperatures. The data presented in this document do notincorporate any correction factors in the thermocouple readings.

US CONSUMER PRODUCT SAFETY COMMISSIONFINAL REPORT ON ELECTRIC CLOTHES DRYERS AND LINT IGNITION CHARACTERISTICS
May 2003
12
Thermocouple Calibration Comparison
0
50
100
150
200
250
300
0 50 100 150 200 250 300
Oven Tempertuare Data Points
Tem
pera
ture
(C)
Oven temperature November 14 2001 December 10 2001 January 2 2002 January 22 2002
Figure 7. Average Responses per Oven Set Temperatures and Day
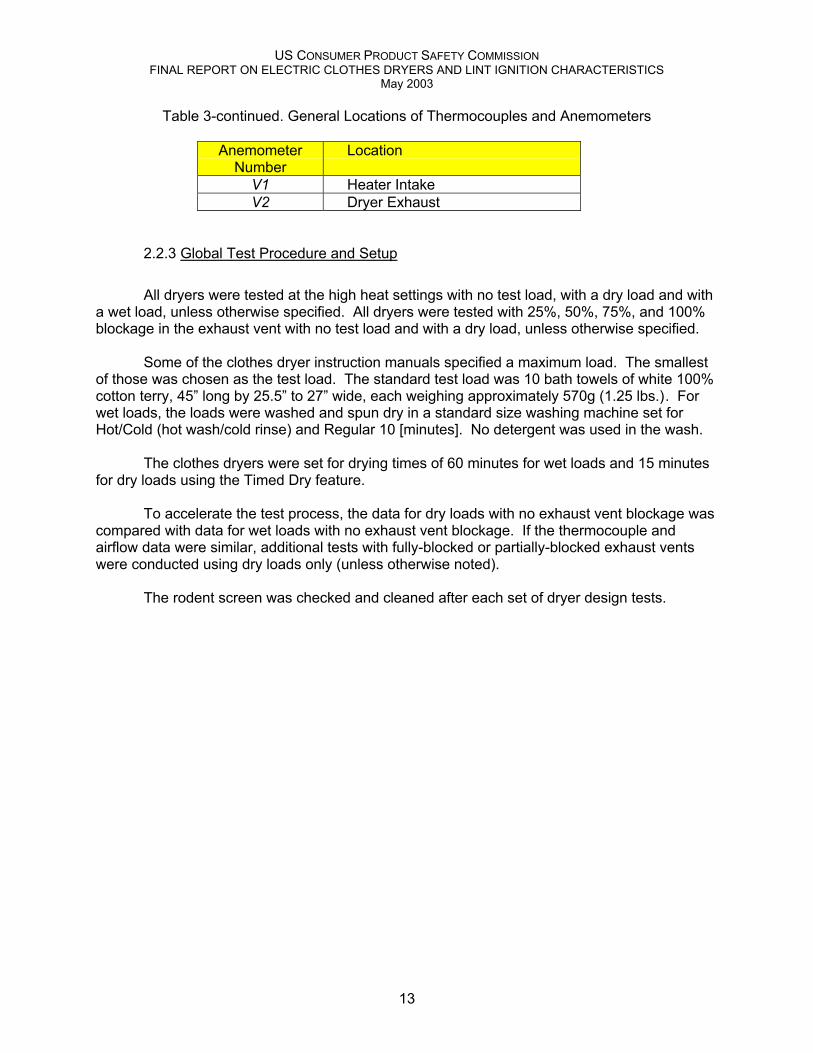
Table 3 lists the general locations of the thermocouples and anemometers in the dryers.Depending on the dryer design, the actual location may have varied slightly.
Two hot wire anemometers were used to measure the airflow entering and exiting eachdryer. One anemometer was placed at the intake into the heater, and the second anemometerwas placed in the exhaust vent. Because of instrumentation limits, the sampling rate for theanemometers was one sample every 2 seconds. However, this was adequate since theanalysis only needed to show trends in airflow.
Table 3. General Locations of Thermocouples and Anemometers
ThermocoupleNumber
Location
T1 Heater IntakeT2 Heater ExhaustT3 Heater HousingT4 Vent ExhaustT5 Intake into BlowerT6 Intake into the TumblerT7 Ambient Room
US CONSUMER PRODUCT SAFETY COMMISSIONFINAL REPORT ON ELECTRIC CLOTHES DRYERS AND LINT IGNITION CHARACTERISTICS
May 2003
13
Table 3-continued. General Locations of Thermocouples and Anemometers
AnemometerNumber
Location
V1 Heater IntakeV2 Dryer Exhaust
2.2.3 Global Test Procedure and Setup
All dryers were tested at the high heat settings with no test load, with a dry load and witha wet load, unless otherwise specified. All dryers were tested with 25%, 50%, 75%, and 100%blockage in the exhaust vent with no test load and with a dry load, unless otherwise specified.
Some of the clothes dryer instruction manuals specified a maximum load. The smallestof those was chosen as the test load. The standard test load was 10 bath towels of white 100%cotton terry, 45” long by 25.5” to 27” wide, each weighing approximately 570g (1.25 lbs.). Forwet loads, the loads were washed and spun dry in a standard size washing machine set forHot/Cold (hot wash/cold rinse) and Regular 10 [minutes]. No detergent was used in the wash.
The clothes dryers were set for drying times of 60 minutes for wet loads and 15 minutesfor dry loads using the Timed Dry feature.
To accelerate the test process, the data for dry loads with no exhaust vent blockage wascompared with data for wet loads with no exhaust vent blockage. If the thermocouple andairflow data were similar, additional tests with fully-blocked or partially-blocked exhaust ventswere conducted using dry loads only (unless otherwise noted).
The rodent screen was checked and cleaned after each set of dryer design tests.
US CONSUMER PRODUCT SAFETY COMMISSIONFINAL REPORT ON ELECTRIC CLOTHES DRYERS AND LINT IGNITION CHARACTERISTICS
May 2003
14
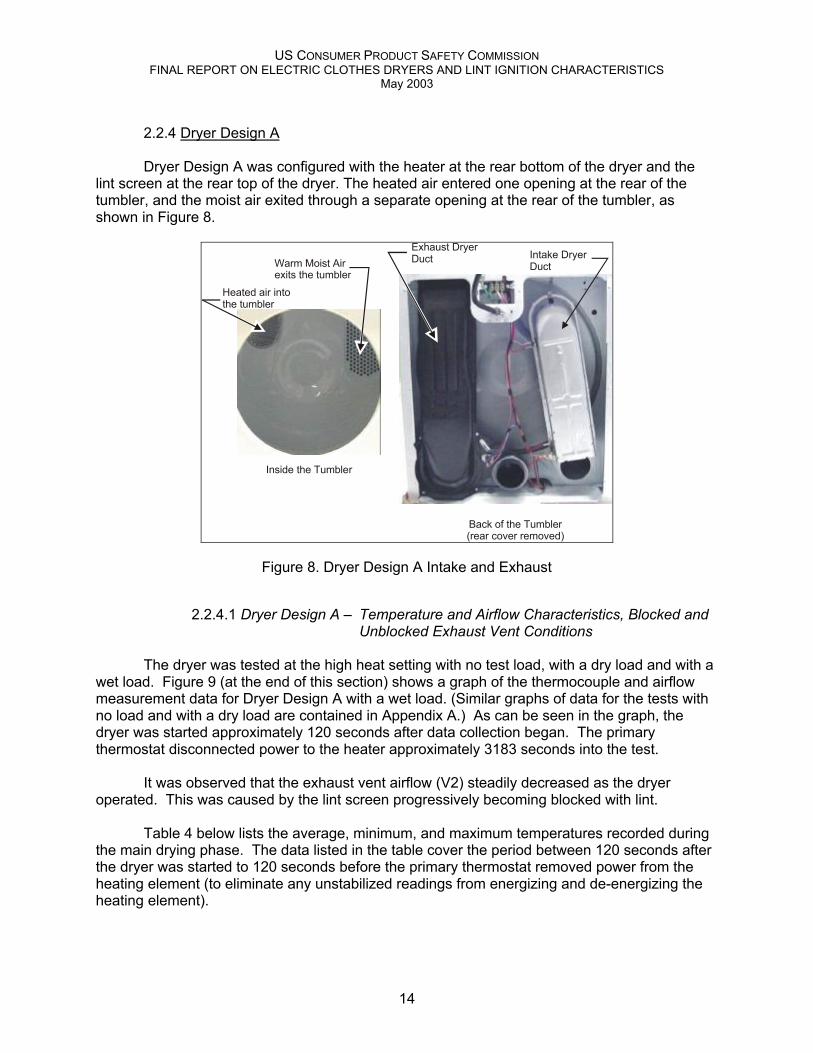
2.2.4 Dryer Design A
Dryer Design A was configured with the heater at the rear bottom of the dryer and thelint screen at the rear top of the dryer. The heated air entered one opening at the rear of thetumbler, and the moist air exited through a separate opening at the rear of the tumbler, asshown in Figure 8.
Inside the Tumbler
Back of the Tumbler(rear cover removed)
Warm Moist Airexits the tumbler
Exhaust DryerDuct Intake Dryer
Duct
Heated air intothe tumbler
Figure 8. Dryer Design A Intake and Exhaust
2.2.4.1 Dryer Design A – Temperature and Airflow Characteristics, Blocked andUnblocked Exhaust Vent Conditions
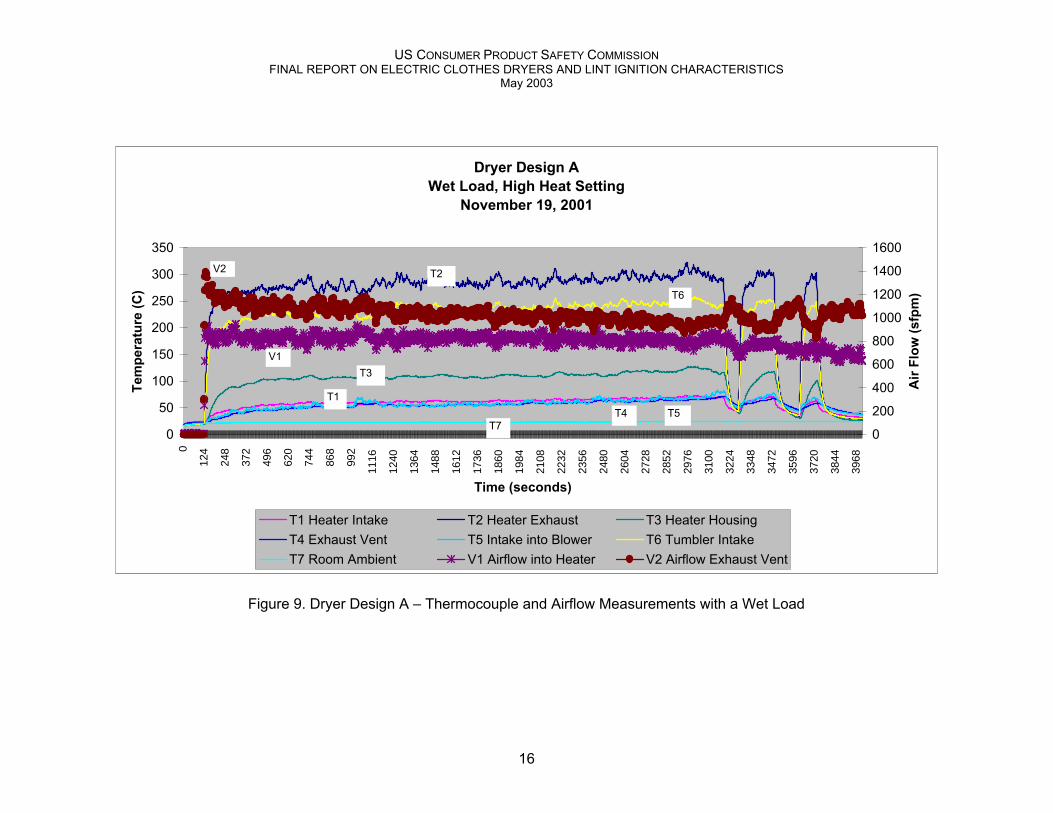
The dryer was tested at the high heat setting with no test load, with a dry load and with awet load. Figure 9 (at the end of this section) shows a graph of the thermocouple and airflowmeasurement data for Dryer Design A with a wet load. (Similar graphs of data for the tests withno load and with a dry load are contained in Appendix A.) As can be seen in the graph, thedryer was started approximately 120 seconds after data collection began. The primarythermostat disconnected power to the heater approximately 3183 seconds into the test.
It was observed that the exhaust vent airflow (V2) steadily decreased as the dryeroperated. This was caused by the lint screen progressively becoming blocked with lint.
Table 4 below lists the average, minimum, and maximum temperatures recorded duringthe main drying phase. The data listed in the table cover the period between 120 seconds afterthe dryer was started to 120 seconds before the primary thermostat removed power from theheating element (to eliminate any unstabilized readings from energizing and de-energizing theheating element).

US CONSUMER PRODUCT SAFETY COMMISSIONFINAL REPORT ON ELECTRIC CLOTHES DRYERS AND LINT IGNITION CHARACTERISTICS
May 2003
15
Table 4. Dryer Design A Measurement Data (°C and sfpm)
Temp Min Average Max Flow Min Average MaxT1 43 62 73 V1 718 825 952T2 249 285 323 V2 871 1034 1234T3 81 109 127T4 33 56 70T5 37 58 84T6 198 236 262T7 21 23 24
The dryer was tested with a partially-blocked exhaust vent (25%, 50%, 75% blockage),and a 100% blocked exhaust vent. For these tests, dry loads were used, since the temperaturedata from the thermocouples were similar for both dry and wet loads for the unblockedcondition. (Appendix A shows the comparison between the dry and wet towel loads with noblockage in the exhaust vent.)
Figures 10 through 12 (at the end of this section) show a comparison of temperaturemeasurement data for thermocouples T1, T3 and T2 for unblocked, partially-blocked, and fully-blocked vent conditions. (Appendix A contains graphs of the temperature data for the remainingthermocouples, T4, T5, T6 and T7.)
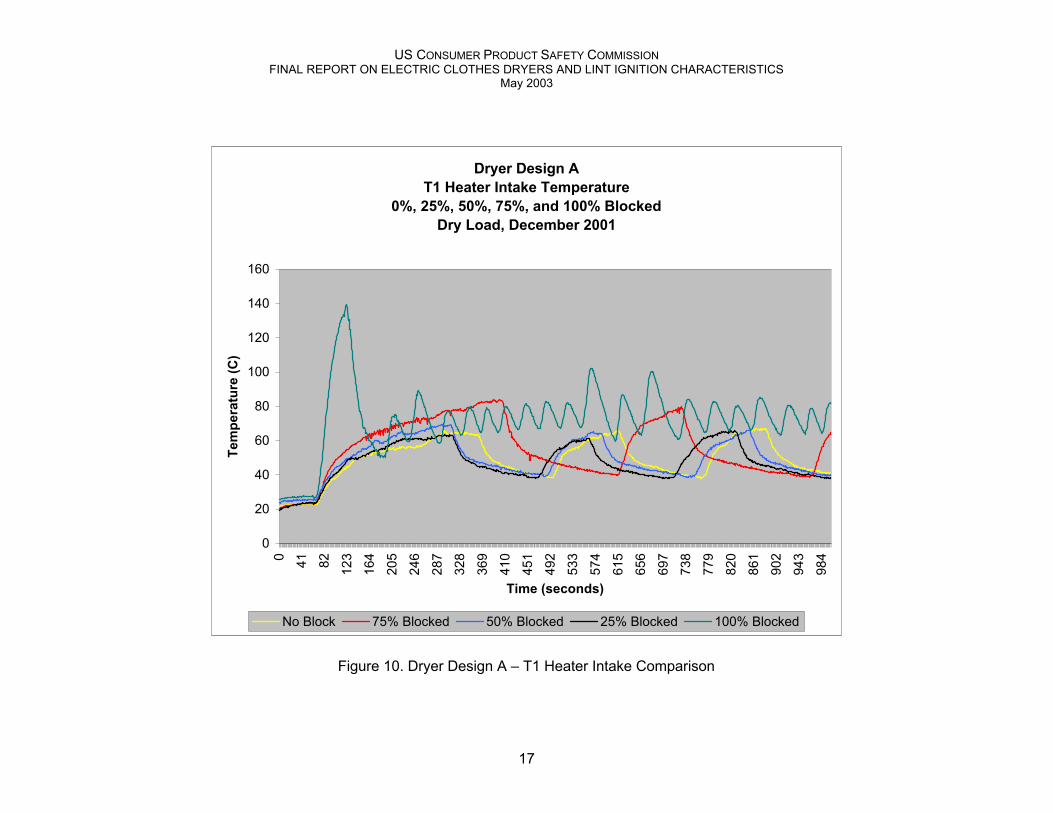
In Figure 10, it can be seen that the dryer began to operate on the high limit thermostatonly when the exhaust duct was fully (100%) blocked. For the 25% and 50% blocked exhaustvent conditions, the temperatures measured were similar to those measured for the unblockedexhaust vent condition.
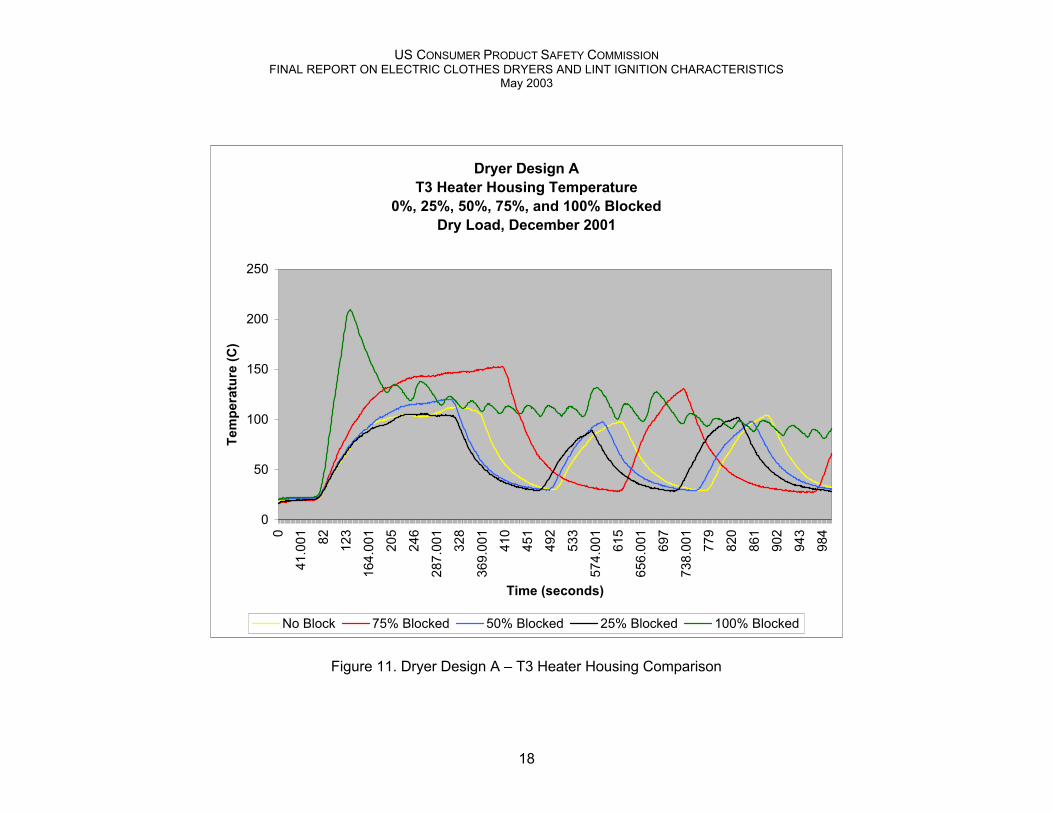
With a 75% blocked exhaust vent, the dryer still operated on the primary thermostat butat elevated temperatures; Figure 11 shows the heater box reached up to 150°C. In theunblocked condition or with exhaust vent blockages of 25% or 50%, the temperature of theheater box reached slightly over 100°C.
At exhaust vent blockages of 100% and 75%, the peak heater exhaust temperatureswere similar – around 325°C to 375°C – as shown in Figure 12. However, the period duringwhich the heater exhaust operated near the peak temperature differed for the two conditions. At100% blockage, the temperature was not maintained at the peak temperature very longbecause the high limit thermostat cycled the heating element more rapidly. At 75% blockage,the duration the heater exhaust stayed near the peak temperature was approximately 100 to300 seconds – until the primary thermostat switched the heating element off
.
US CONSUMER PRODUCT SAFETY COMMISSIONFINAL REPORT ON ELECTRIC CLOTHES DRYERS AND LINT IGNITION CHARACTERISTICS
May 2003
16
Dryer Design AWet Load, High Heat Setting
November 19, 2001
0
50
100
150
200
250
300
350
0
124
248
372
496
620
744
868
992
1116
1240
1364
1488
1612
1736
1860
1984
2108
2232
2356
2480
2604
2728
2852
2976
3100
3224
3348
3472
3596
3720
3844
3968
Time (seconds)
Tem
pera
ture
(C)
0
200
400
600
800
1000
1200
1400
1600
Air
Flow
(sfp
m)
T1 Heater Intake T2 Heater Exhaust T3 Heater HousingT4 Exhaust Vent T5 Intake into Blower T6 Tumbler IntakeT7 Room Ambient V1 Airflow into Heater V2 Airflow Exhaust Vent
T6
T4
T2
T3
T7
T1T5
V2
V1
Figure 9. Dryer Design A – Thermocouple and Airflow Measurements with a Wet Load
US CONSUMER PRODUCT SAFETY COMMISSIONFINAL REPORT ON ELECTRIC CLOTHES DRYERS AND LINT IGNITION CHARACTERISTICS
May 2003
17
Dryer Design AT1 Heater Intake Temperature
0%, 25%, 50%, 75%, and 100% BlockedDry Load, December 2001
0
20
40
60
80
100
120
140
1600 41 82 123
164
205
246
287
328
369
410
451
492
533
574
615
656
697
738
779
820
861
902
943
984
Time (seconds)
Tem
pera
ture
(C)
No Block 75% Blocked 50% Blocked 25% Blocked 100% Blocked
Figure 10. Dryer Design A – T1 Heater Intake Comparison
US CONSUMER PRODUCT SAFETY COMMISSIONFINAL REPORT ON ELECTRIC CLOTHES DRYERS AND LINT IGNITION CHARACTERISTICS
May 2003
18
Dryer Design AT3 Heater Housing Temperature
0%, 25%, 50%, 75%, and 100% BlockedDry Load, December 2001
0
50
100
150
200
2500
41.0
01 82 123
164.
001
205
246
287.
001
328
369.
001
410
451
492
533
574.
001
615
656.
001
697
738.
001
779
820
861
902
943
984
Time (seconds)
Tem
pera
ture
(C)
No Block 75% Blocked 50% Blocked 25% Blocked 100% Blocked
Figure 11. Dryer Design A – T3 Heater Housing Comparison

US CONSUMER PRODUCT SAFETY COMMISSIONFINAL REPORT ON ELECTRIC CLOTHES DRYERS AND LINT IGNITION CHARACTERISTICS
May 2003
19
Dryer Design AT2 Heater Exhaust Temperature
0%, 25%, 50%, 75%, and 100% BlockedDry Load, December 2001
0
100
200
300
400
500
6000 40 80 120
160
200
240
280
320
360
400
440
480
520
560
600
640
680
720
760
800
840
880
920
960
100
Time (seconds)
Tem
pera
ture
(C)
No Block 75% Blocked 50% Blocked 25% Blocked 100% Blocked
Figure 12. Dryer Design A – T2 Heater Exhaust Comparison

US CONSUMER PRODUCT SAFETY COMMISSIONFINAL REPORT ON ELECTRIC CLOTHES DRYERS AND LINT IGNITION CHARACTERISTICS
May 2003
20
2.2.4.2 Dryer Design A – Airflow
Airflow was measured using hot wire anemometers placed at the intake of the heaterbox and in the exhaust vent. Both anemometers were placed in the center of the cross-sectionof the air streams. The anemometer placed in the exhaust vent was positioned 36” after the firstelbow to avoid circular turbulence effects from the dryer blower. As mentioned earlier, the irisand blast plate for the partially-blocked and 100% blocked conditions, respectively, were placedbefore the hot wire anemometer located in the exhaust vent.
Figure 13 shows comparisons of intake air velocities when the exhaust vent wasunblocked, partially blocked, and fully blocked, and the dryer contained a dry load. The intakevelocities were similar for the unblocked and 25% and 50% blocked conditions. There was aslight drop in the air velocity for the 75% blocked condition, but it was not significant enough tocause the dryer to operate in the high-limit cycling mode (as can be observed from thethermocouple data in Figure 12). With a 100% blocked exhaust vent, the air intake velocitydropped to about 200 sfpm.
Figure 14 is a graph comparing exhaust air velocities when the exhaust vent wasunblocked, partially blocked, and fully blocked, and the dryer contained a dry load. The graphshows a slight overshoot in air velocity at initial startup of the dryer. The size of the overshootdecreased as the blockage increased. This was expected, since the anemometer waspositioned after the blockage, which created a dampening effect. There was a slight increase inthe velocity around 400 seconds, which was when the primary thermostat de-energized theheater. (This was also seen in Figure 9 – Thermocouple and Airflow with a Wet Load, when thedryer began cycling.) This was caused by the hot wire anemometer not responding fast enoughto the change in temperature.
Figure 15 shows the average intake and exhaust air velocities for the different conditionsof exhaust blockage. The data from 120 seconds to 1000 seconds were averaged. Thisexcluded the initial overshoot when the blower was first powered. The intake air velocity stayedfairly constant for the unblocked, 25% and 50% blocked conditions; however, it began todecrease more rapidly when the exhaust vent was 50% and 75% blocked. At 100% blockage,the exhaust air velocity was near zero, as expected, and the average intake velocity was 179sfpm.
Figure 16 is a graph similar to Figure 15 except that the dryer was operated with no testload and with no heat. The graph shows increased intake and exhaust air velocities when thetumbler was not filled as expected. Compared to Figure 15, there was a slightly more dramaticeffect in the decrease of the air velocities as the exhaust vent was progressively blocked.

US CONSUMER PRODUCT SAFETY COMMISSIONFINAL REPORT ON ELECTRIC CLOTHES DRYERS AND LINT IGNITION CHARACTERISTICS
May 2003
21
Dryer Design AVelocity Intake Comparison
High Heat, Dry Load
0
200
400
600
800
1000
1200
1400
0 22 44 66 88 110 132 154 176 198 220 242 264 286 308 330 352 374 396 418 440 462 484
Time (seconds)
Velo
city
(sfp
m)
No Block Intake 100% Blocked Intake 75% Blocked Intake
50% Blocked Intake 25% Blocked Intake
Figure 13. Dryer Design A – Intake Air Velocity

US CONSUMER PRODUCT SAFETY COMMISSIONFINAL REPORT ON ELECTRIC CLOTHES DRYERS AND LINT IGNITION CHARACTERISTICS
May 2003
22
Dryer Design AVelocity Exhaust Comparison
High Heat, Dry Load
0
200
400
600
800
1000
1200
1400
0 22 44 66 88 110 132 154 176 198 220 242 264 286 308 330 352 374 396 418 440 462 484
Time (seconds)
Velo
city
(sfp
m)
No Block Exhaust 100% Blocked Exhaust 75% Blocked Exhaust50% Blocked Exhaust 25% Blocked Exhaust
Figure 14. Dryer Design A – Exhaust Air Velocity

US CONSUMER PRODUCT SAFETY COMMISSIONFINAL REPORT ON ELECTRIC CLOTHES DRYERS AND LINT IGNITION CHARACTERISTICS
May 2003
23
Dryer Design AIntake and Exhaust Velocity Average
High Heat, Dry LoadDecember 2001
0
200
400
600
800
1000
1200
0 (No Block) 25 50 75 100 (FullyBlocked)
Blockage (percentage)
Ave
rage
Vel
ocity
(sfp
m)
IntakeExhaust
Figure 15. Dryer Design A – Average Airflow Velocities (High Heat and Dry Load)

US CONSUMER PRODUCT SAFETY COMMISSIONFINAL REPORT ON ELECTRIC CLOTHES DRYERS AND LINT IGNITION CHARACTERISTICS
May 2003
24
Dryer Design AIntake and Exhaust Velocity Average
No Heat, No LoadDecember 2001
0200400600800
10001200140016001800
0 (No Block) 25 50 75 100 (FullyBlocked)
Blockage (percentage)
Ave
rage
Vel
ocity
(sfp
m)
IntakeExhaust
Figure 16. Dryer Design A – Average Airflow Velocities (No Heat and No Load)

US CONSUMER PRODUCT SAFETY COMMISSIONFINAL REPORT ON ELECTRIC CLOTHES DRYERS AND LINT IGNITION CHARACTERISTICS
May 2003
25
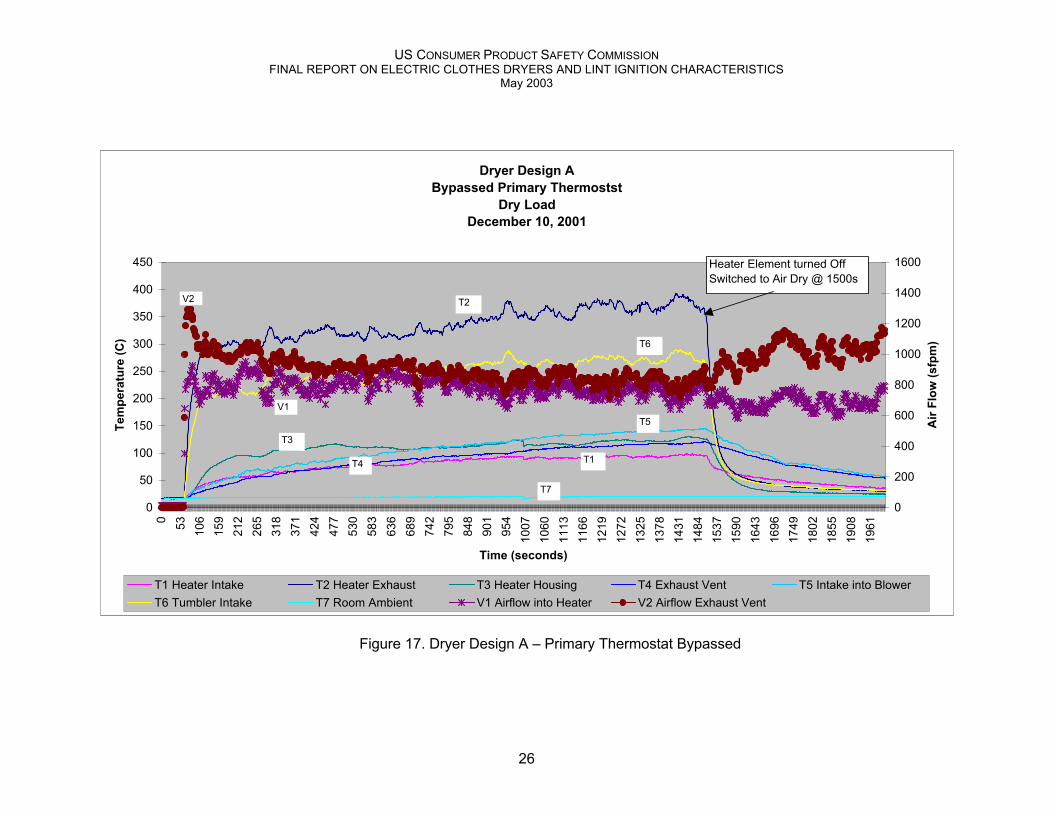
2.2.4.3 Dryer Design A – Primary Thermostat Bypassed
The primary thermostat was bypassed to simulate a failure mode in which it failedclosed. The thermostat was removed from the intake blower housing, and the hole it left wascovered with foil tape. The thermostat was placed in a cool part of the dryer to prevent it fromswitching open. The dryer was operated with full airflow (no exhaust vent blockage) and a dryload.
Figure 17 shows the temperature and airflow data for Dryer Design A with a bypassedthermostat. The dryer was switched to Air Dry at approximately 1500 seconds into the test.The temperature at the heater intake appeared to level out at 95° C and would not havetriggered the High-Limit Thermostat.
US CONSUMER PRODUCT SAFETY COMMISSIONFINAL REPORT ON ELECTRIC CLOTHES DRYERS AND LINT IGNITION CHARACTERISTICS
May 2003
26
Dryer Design ABypassed Primary Thermostst
Dry LoadDecember 10, 2001
0
50
100
150
200
250
300
350
400
450
0 53 106
159
212
265
318
371
424
477
530
583
636
689
742
795
848
901
954
1007
1060
1113
1166
1219
1272
1325
1378
1431
1484
1537
1590
1643
1696
1749
1802
1855
1908
1961
Time (seconds)
Tem
pera
ture
(C)
0
200
400
600
800
1000
1200
1400
1600
Air
Flow
(sfp
m)
T1 Heater Intake T2 Heater Exhaust T3 Heater Housing T4 Exhaust Vent T5 Intake into BlowerT6 Tumbler Intake T7 Room Ambient V1 Airflow into Heater V2 Airflow Exhaust Vent
T6
T4
T2
T3
T7
T1
T5
V2
V1
Heater Element turned OffSwitched to Air Dry @ 1500s
Figure 17. Dryer Design A – Primary Thermostat Bypassed
US CONSUMER PRODUCT SAFETY COMMISSIONFINAL REPORT ON ELECTRIC CLOTHES DRYERS AND LINT IGNITION CHARACTERISTICS
May 2003
27
2.2.5 Dryer Design B
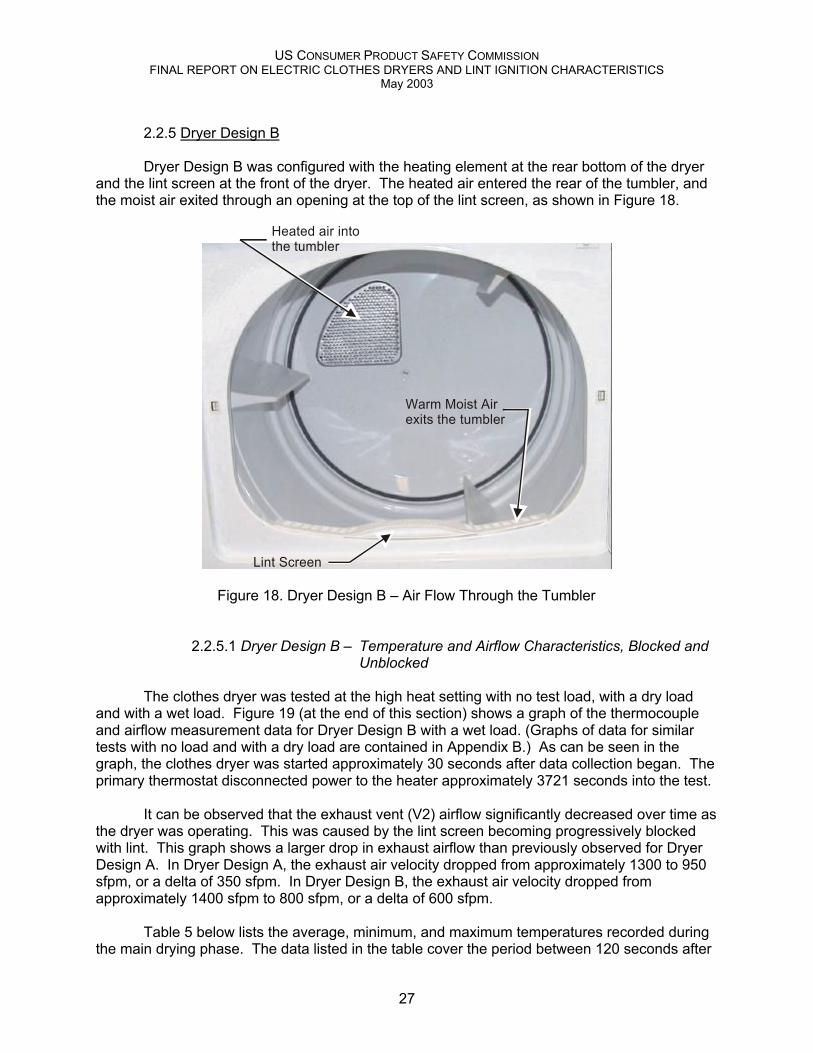
Dryer Design B was configured with the heating element at the rear bottom of the dryerand the lint screen at the front of the dryer. The heated air entered the rear of the tumbler, andthe moist air exited through an opening at the top of the lint screen, as shown in Figure 18.
Warm Moist Airexits the tumbler
Heated air intothe tumbler
Lint Screen
Figure 18. Dryer Design B – Air Flow Through the Tumbler
2.2.5.1 Dryer Design B – Temperature and Airflow Characteristics, Blocked andUnblocked
The clothes dryer was tested at the high heat setting with no test load, with a dry loadand with a wet load. Figure 19 (at the end of this section) shows a graph of the thermocoupleand airflow measurement data for Dryer Design B with a wet load. (Graphs of data for similartests with no load and with a dry load are contained in Appendix B.) As can be seen in thegraph, the clothes dryer was started approximately 30 seconds after data collection began. Theprimary thermostat disconnected power to the heater approximately 3721 seconds into the test.
It can be observed that the exhaust vent (V2) airflow significantly decreased over time asthe dryer was operating. This was caused by the lint screen becoming progressively blockedwith lint. This graph shows a larger drop in exhaust airflow than previously observed for DryerDesign A. In Dryer Design A, the exhaust air velocity dropped from approximately 1300 to 950sfpm, or a delta of 350 sfpm. In Dryer Design B, the exhaust air velocity dropped fromapproximately 1400 sfpm to 800 sfpm, or a delta of 600 sfpm.
Table 5 below lists the average, minimum, and maximum temperatures recorded duringthe main drying phase. The data listed in the table cover the period between 120 seconds after

US CONSUMER PRODUCT SAFETY COMMISSIONFINAL REPORT ON ELECTRIC CLOTHES DRYERS AND LINT IGNITION CHARACTERISTICS
May 2003
28
the dryer was started to 120 seconds before the primary thermostat removed power from theheating element (to eliminate any unstabilized readings during energizing and de-energizing ofthe heating element).
Table 5. Dryer Design B Statistics (°C and sfpm)
Temp Min Average Max Flow Min Average MaxT1 35 48 57 V1 307 375 483T2 214 252 282 V2 796 1181 1432T3 61 81 92T4 31 50 67T5 31 51 73T6 140 167 183T7 22 24 26
The dryer was tested with a partially-blocked exhaust vent (25%, 50%, 75% blockage)and 100% blocked exhaust vent. For these tests, wet towels (washed and spun dry) were used,since there was enough variation in the temperature data between dry and wet loads.(Appendix B shows the comparison between the dry and wet towel loads with no blockage inthe exhaust vent.)
Figures 20 to 22 (at the end of this section) show comparisons of temperature data forthermocouples T1, T3, and T5 for unblocked, partially-blocked, and fully-blocked ventconditions. (Appendix B contains graphs of the temperature data for the remainingthermocouples, T2, T4, T6, and T7.)
In Figure 20, it can be seen that the dryer began to operate on the high limit thermostatonly when the exhaust duct was either 75% or 100% blocked. For the 25% and 50% blockedexhaust vent conditions, the temperatures measured were similar to those measured for theunblocked exhaust vent condition.
With a 75% and 100% blocked exhaust vent, the dryer operated on the high-limitthermostat. However, in the 75% blocked vent condition, the dryer operated at a highertemperature than that seen for the 100% blocked condition. Figure 21 shows the heater boxreached up to 150°C for the 75% blocked condition whereas, for the 100% blocked condition,the high-limit thermostat periodically switched the temperature at approximately 125°C.
The period at which the high-limit thermostat switched on and off also differed for the75% and 100% blocked exhaust vent conditions. This was most likely caused by the differencein airflow for the two conditions. With the 75% blockage, the additional airflow resulted in anincrease in the time required for the high-limit thermostat to reach its set point for opening. Inaddition, the periodic rate at which the thermostat switched on and off changed during thecourse of the test; the high limit thermostat began switching at a faster rate around 2850seconds. This was most likely caused by the lint screen becoming progressively blocked, whichfurther reduced airflow through the dryer.
Figure 20 also shows that the temperatures measured for the unblocked, 25% blockedand 50% blocked exhaust vent conditions are similar – both in value and signature – until 2331

US CONSUMER PRODUCT SAFETY COMMISSIONFINAL REPORT ON ELECTRIC CLOTHES DRYERS AND LINT IGNITION CHARACTERISTICS
May 2003
29
seconds. The graph for the 50% blocked condition shows the heating element began switchingrapidly on the primary thermostat, which is explained in the next paragraph.
Figure 21 shows that the temperature at which the operating thermostat switches on andoff is nearly equal for the unblocked, 25% blocked and the 50% blocked conditions. The rapidswitching of the primary thermostat was caused by the load no longer tumbling, although thedrum was still rotating. (More on this phenomenon is discussed under Dryer Design D.) Thiseffect was more evident for the 50% blocked exhaust condition, as shown in Figure 22.
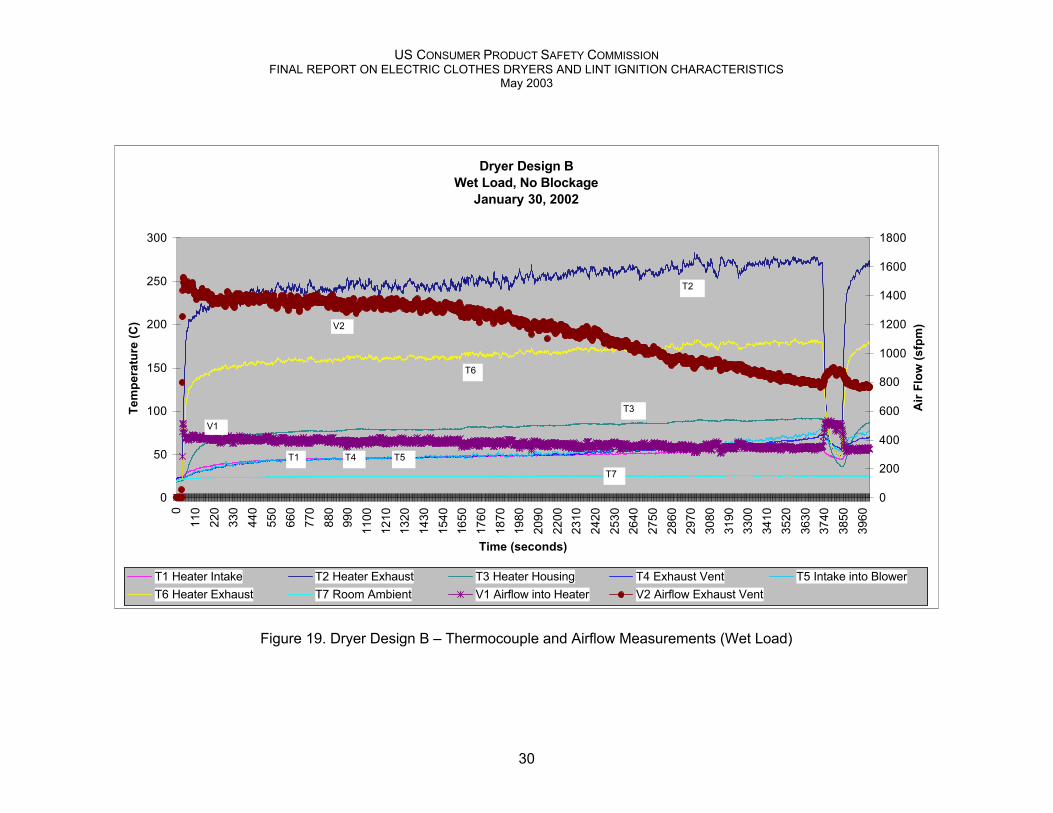
US CONSUMER PRODUCT SAFETY COMMISSIONFINAL REPORT ON ELECTRIC CLOTHES DRYERS AND LINT IGNITION CHARACTERISTICS
May 2003
30
Dryer Design BWet Load, No Blockage
January 30, 2002
0
50
100
150
200
250
300
011
022
033
044
055
066
077
088
099
011
0012
1013
2014
3015
4016
5017
6018
7019
8020
9022
0023
1024
2025
3026
4027
5028
6029
7030
8031
9033
0034
1035
2036
3037
4038
5039
60
Time (seconds)
Tem
pera
ture
(C)
0
200
400
600
800
1000
1200
1400
1600
1800
Air
Flow
(sfp
m)
T1 Heater Intake T2 Heater Exhaust T3 Heater Housing T4 Exhaust Vent T5 Intake into BlowerT6 Heater Exhaust T7 Room Ambient V1 Airflow into Heater V2 Airflow Exhaust Vent
T6
T4
T2
T3
T7
T1 T5
V2
V1
Figure 19. Dryer Design B – Thermocouple and Airflow Measurements (Wet Load)
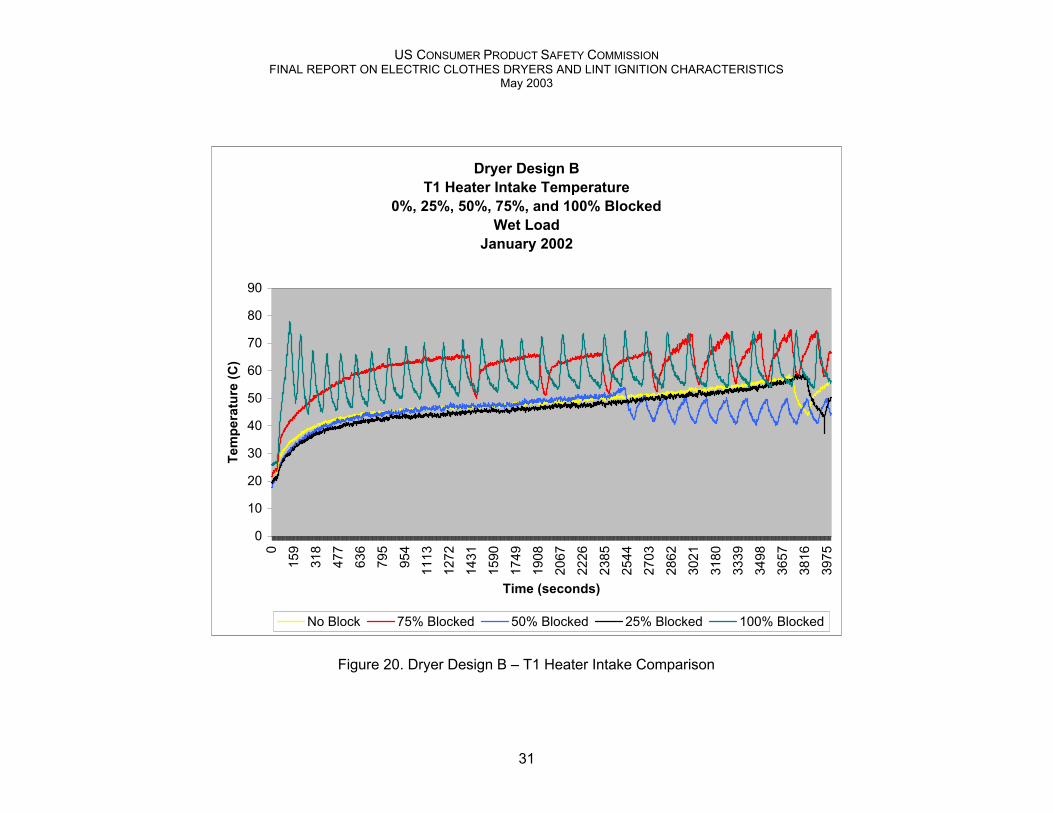
US CONSUMER PRODUCT SAFETY COMMISSIONFINAL REPORT ON ELECTRIC CLOTHES DRYERS AND LINT IGNITION CHARACTERISTICS
May 2003
31
Dryer Design BT1 Heater Intake Temperature
0%, 25%, 50%, 75%, and 100% BlockedWet Load
January 2002
0
10
20
30
40
50
60
70
80
900
159
318
477
636
795
954
1113
1272
1431
1590
1749
1908
2067
2226
2385
2544
2703
2862
3021
3180
3339
3498
3657
3816
3975
Time (seconds)
Tem
pera
ture
(C)
No Block 75% Blocked 50% Blocked 25% Blocked 100% Blocked
Figure 20. Dryer Design B – T1 Heater Intake Comparison

US CONSUMER PRODUCT SAFETY COMMISSIONFINAL REPORT ON ELECTRIC CLOTHES DRYERS AND LINT IGNITION CHARACTERISTICS
May 2003
32
Dryer Design BT3 Heater Housing Temperature
0%, 25%, 50%, 75%, and 100% BlockedWet Load
January 2002
0
50
100
150
200
2500
161
322
483
644
805
966
1127
1288
1449
1610
1771
1932
2093
2254
2415
2576
2737
2898
3059
3220
3381
3542
3703
3864
Time (seconds)
Tem
pera
ture
(C)
No Block 75% Blocked 50% Blocked 25% Blocked 100% Blocked
Figure 21. Dryer Design B – T3 Heater Housing Comparison
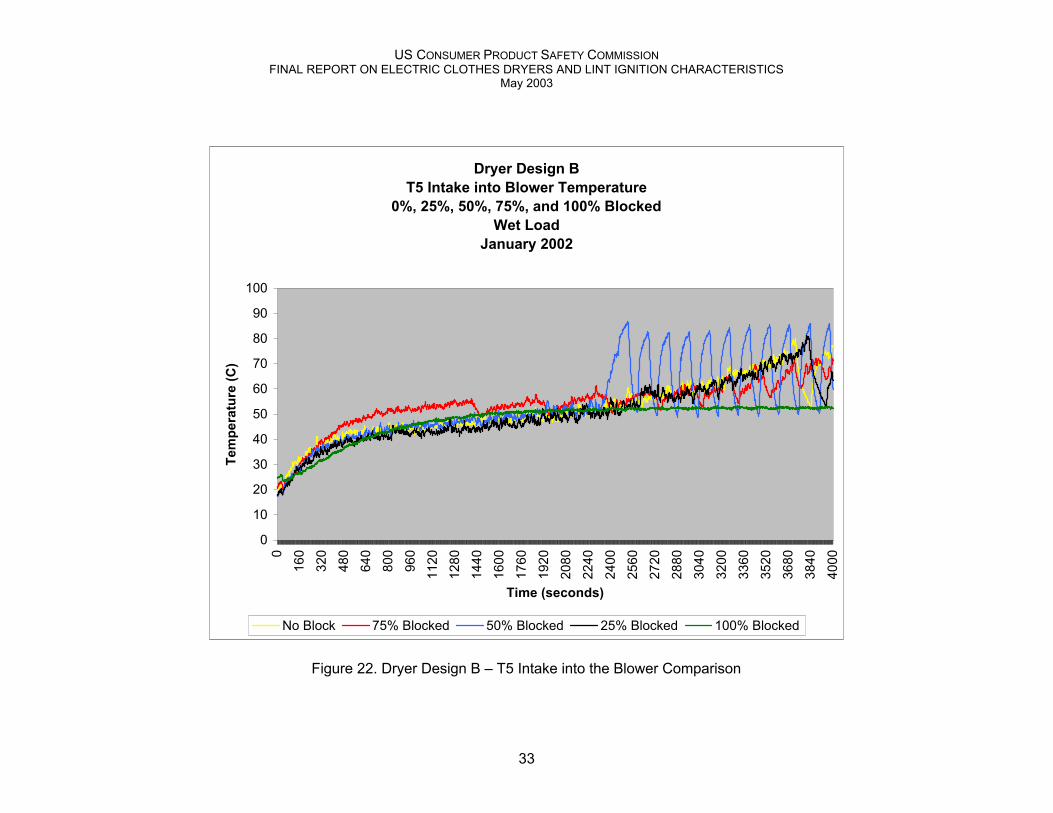
US CONSUMER PRODUCT SAFETY COMMISSIONFINAL REPORT ON ELECTRIC CLOTHES DRYERS AND LINT IGNITION CHARACTERISTICS
May 2003
33
Dryer Design BT5 Intake into Blower Temperature
0%, 25%, 50%, 75%, and 100% BlockedWet Load
January 2002
0
10
20
30
40
50
60
70
80
90
1000
160
320
480
640
800
960
1120
1280
1440
1600
1760
1920
2080
2240
2400
2560
2720
2880
3040
3200
3360
3520
3680
3840
4000
Time (seconds)
Tem
pera
ture
(C)
No Block 75% Blocked 50% Blocked 25% Blocked 100% Blocked
Figure 22. Dryer Design B – T5 Intake into the Blower Comparison

US CONSUMER PRODUCT SAFETY COMMISSIONFINAL REPORT ON ELECTRIC CLOTHES DRYERS AND LINT IGNITION CHARACTERISTICS
May 2003
34
2.2.5.2 Dryer Design B – Airflow
The airflow was measured using hot wire anemometers placed at the air intake into theheater box and in the exhaust vent. Both anemometers were placed in the center of the cross-section of the air streams. The anemometer placed in the exhaust vent was positioned 36” afterthe first elbow to avoid circular turbulence effects from the dryer blower. As mentioned earlier,the iris and blast plate for the partially and 100% blocked conditions, respectively, were placedbefore the hot wire anemometer.
Figure 23 shows the intake air velocity comparisons for the unblocked, partially blocked,and fully blocked exhaust vent conditions. The intake air velocities were similar for theunblocked, 25% and 50% blocked conditions. There was a slight drop in the velocity for the75% blocked condition that was significant enough to cause the dryer to operate in the high-limitcycling mode, as seen in the thermocouple data (shown previously in Figure 21). When theexhaust vent was 100% blocked, the intake air velocity fluctuated between near zero to about200 sfpm. The fluctuation to 200 sfpm coincided with the heating element being de-energizedby the high-limit thermostat. This was caused by the anemometer not responding fast enoughto the change in temperature at the heater intake.
Figure 24 shows the exhaust air velocity comparisons for the unblocked, partiallyblocked, and fully blocked exhaust vent conditions. The graph shows a slight overshoot at initialstartup of the dryer, but it was not as prominent as that seen in Dryer Design A. The size of theovershoot decreased as the blockage increased, as expected, since the second anemometer, inthe exhaust vent, was located after the iris.
Figure 25 shows the average intake and exhaust air velocities for the different blockageconditions. The data from 120 seconds to 1000 seconds were averaged. This avoided the initialovershoot when the blower was first powered. The intake velocity stayed steady until theexhaust vent was 25% blocked, and it began to decrease more rapidly between 25% and 50%blockage. When the exhaust vent was 100% blocked, the exhaust velocity was near zero, asexpected, and the average intake air velocity was 90 sfpm.
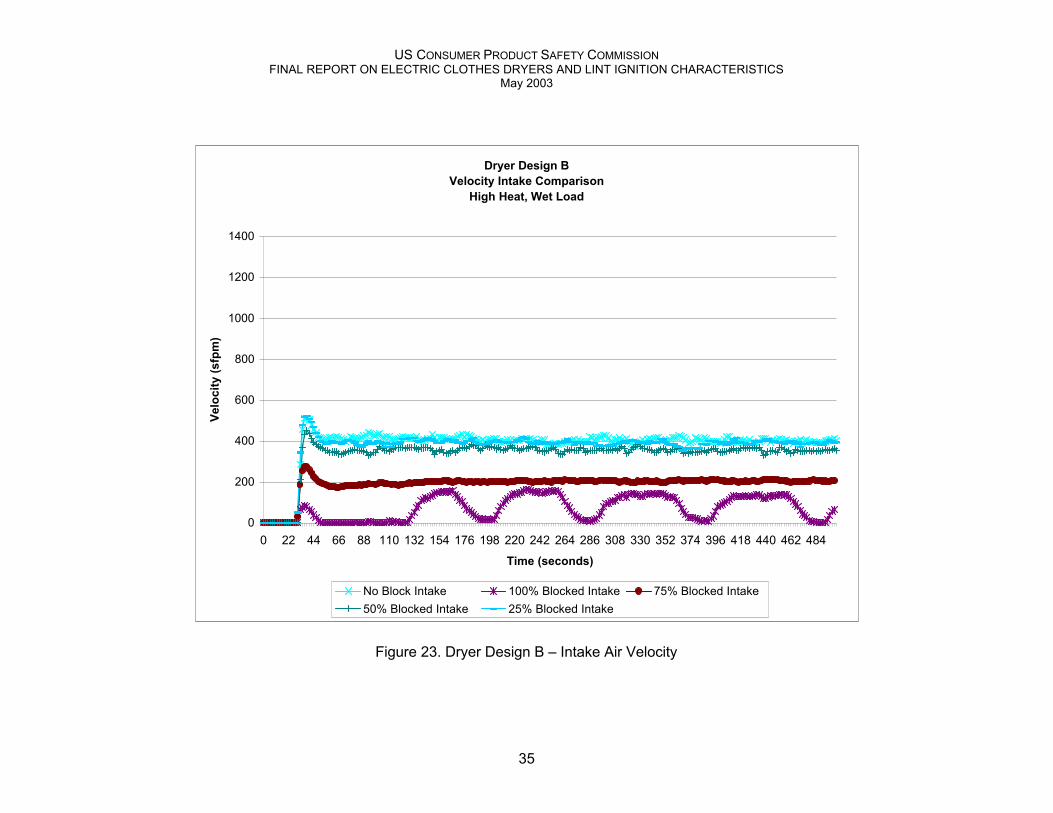
US CONSUMER PRODUCT SAFETY COMMISSIONFINAL REPORT ON ELECTRIC CLOTHES DRYERS AND LINT IGNITION CHARACTERISTICS
May 2003
35
Dryer Design BVelocity Intake Comparison
High Heat, Wet Load
0
200
400
600
800
1000
1200
1400
0 22 44 66 88 110 132 154 176 198 220 242 264 286 308 330 352 374 396 418 440 462 484
Time (seconds)
Velo
city
(sfp
m)
No Block Intake 100% Blocked Intake 75% Blocked Intake50% Blocked Intake 25% Blocked Intake
Figure 23. Dryer Design B – Intake Air Velocity

US CONSUMER PRODUCT SAFETY COMMISSIONFINAL REPORT ON ELECTRIC CLOTHES DRYERS AND LINT IGNITION CHARACTERISTICS
May 2003
36
Dryer Design BVelocity Exhaust Comparison
High Heat, Wet Load
0
200
400
600
800
1000
1200
1400
1600
1800
0 22 44 66 88 110 132 154 176 198 220 242 264 286 308 330 352 374 396 418 440 462 484
Time (seconds)
Velo
city
(sfp
m)
No Block Exhaust 100% Blocked Exhaust 75% Blocked Exhaust50% Blocked Exhaust 25% Blocked Exhaust
Figure 24. Dryer Design B – Exhaust Vent Air Velocity

US CONSUMER PRODUCT SAFETY COMMISSIONFINAL REPORT ON ELECTRIC CLOTHES DRYERS AND LINT IGNITION CHARACTERISTICS
May 2003
37
Dryer Design BIntake and Exhaust Velocity Average
High Heat, Wet LoadJanuary 2002
0200400600800
1000120014001600
0 (No Block) 25 50 75 100 (FullyBlocked)
Blockage (percentage)
Ave
rage
Vel
ocity
(sfp
m)
IntakeExhaust
Figure 25. Dryer Design B – Average Airflow Velocities (High Heat and Wet Load)

US CONSUMER PRODUCT SAFETY COMMISSIONFINAL REPORT ON ELECTRIC CLOTHES DRYERS AND LINT IGNITION CHARACTERISTICS
May 2003
38
2.2.5.3 Dryer Design B – Primary Thermostat Bypassed
The primary thermostat was bypassed to simulate a failure mode in which it had failedclosed. The thermostat was removed from the intake blower housing, and the hole it left wascovered with foil tape. The thermostat was placed in a cool part of the dryer to prevent it fromswitching open. The dryer was operated with full airflow and with a wet load.
Figure 26 shows the thermocouple and airflow measurement data for Dryer Design Bwhen the thermostat was bypassed. The dryer’s Timed Dry feature shut off at approximately4000 seconds. The dryer was restarted for an additional 30 minutes with the Timed Dry feature.The temperature at the heater box intake appeared to level out at approximately 65° C andwould not have triggered the High-Limit Thermostat.

US CONSUMER PRODUCT SAFETY COMMISSIONFINAL REPORT ON ELECTRIC CLOTHES DRYERS AND LINT IGNITION CHARACTERISTICS
May 2003
39
Dryer Design BBypassed Primary Thermostst
Wet LoadFebruary 11, 2002
0
50
100
150
200
250
300
350
400
016
332
648
965
281
597
811
4113
0414
6716
3017
9319
5621
1922
8224
4526
0827
7129
3430
9732
6034
2335
8637
4939
1240
7542
3844
0145
6447
2748
9050
5352
1653
7955
4257
0558
68
Time (seconds)
Tem
pera
ture
(C)
0
200
400
600
800
1000
1200
1400
1600
Air
Flow
(sfp
m)
T1 Heater Intake T2 Heater Exhaust T3 Heater Housing T4 Exhaust Vent T5 Intake into BlowerT6 Heater Exhaust T7 Room Ambient V1 Airflow into Heater V2 Airflow Exhaust Vent
T6
T4
T2
T3
T7
T1T5
V2
V1
Dryer Timed SettingSwitched Off
Reset Timed Setting for 30 minutesSwitched Off
Figure 26. Dryer Design B – Primary Thermostat Bypassed
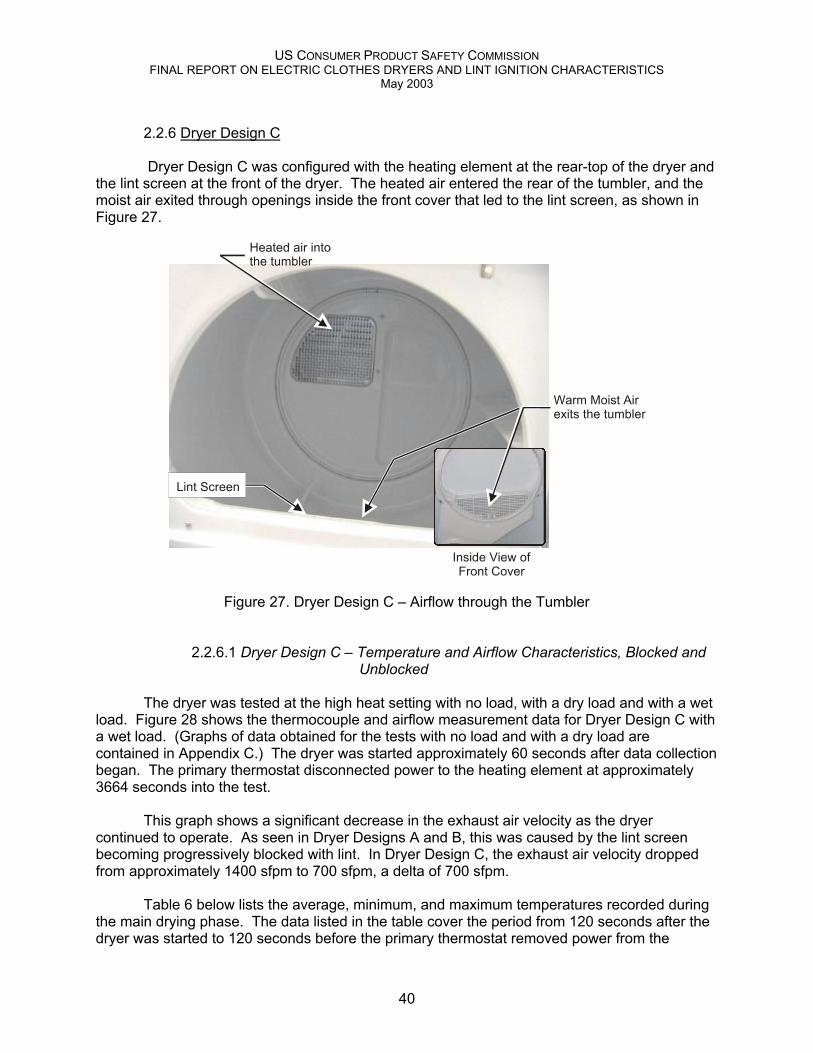
US CONSUMER PRODUCT SAFETY COMMISSIONFINAL REPORT ON ELECTRIC CLOTHES DRYERS AND LINT IGNITION CHARACTERISTICS
May 2003
40
2.2.6 Dryer Design C
Dryer Design C was configured with the heating element at the rear-top of the dryer andthe lint screen at the front of the dryer. The heated air entered the rear of the tumbler, and themoist air exited through openings inside the front cover that led to the lint screen, as shown inFigure 27.
Warm Moist Airexits the tumbler
Heated air intothe tumbler
Lint Screen
Inside View ofFront Cover
Figure 27. Dryer Design C – Airflow through the Tumbler
2.2.6.1 Dryer Design C – Temperature and Airflow Characteristics, Blocked andUnblocked
The dryer was tested at the high heat setting with no load, with a dry load and with a wetload. Figure 28 shows the thermocouple and airflow measurement data for Dryer Design C witha wet load. (Graphs of data obtained for the tests with no load and with a dry load arecontained in Appendix C.) The dryer was started approximately 60 seconds after data collectionbegan. The primary thermostat disconnected power to the heating element at approximately3664 seconds into the test.
This graph shows a significant decrease in the exhaust air velocity as the dryercontinued to operate. As seen in Dryer Designs A and B, this was caused by the lint screenbecoming progressively blocked with lint. In Dryer Design C, the exhaust air velocity droppedfrom approximately 1400 sfpm to 700 sfpm, a delta of 700 sfpm.
Table 6 below lists the average, minimum, and maximum temperatures recorded duringthe main drying phase. The data listed in the table cover the period from 120 seconds after thedryer was started to 120 seconds before the primary thermostat removed power from the

US CONSUMER PRODUCT SAFETY COMMISSIONFINAL REPORT ON ELECTRIC CLOTHES DRYERS AND LINT IGNITION CHARACTERISTICS
May 2003
41
heating element (to eliminate any instability in the readings from energizing and de-energizingthe heating element).
Table 6. Dryer Design C – Statistics (°C and sfpm)
Temp Min Average Max Flow Min Average MaxT1 36 54 72 V1 111 197 296T2 106 140 177 V2 654 1023 1450T3 34 50 67T4 31 48 61T5 31 48 63T6 146 185 228T7 20 21 22
The dryer was tested with a partially-blocked exhaust vent (25%, 50% and 75%blockage) and a 100% blocked exhaust vent. For these tests, wet towels (washed and spundry) were used. (A comparison of temperature and airflow data obtained for the dry and wettowel loads with no blockage in the exhaust vent are contained in Appendix C.)
Figures 29 through 31 (at the end of this section) show a comparison of the temperaturemeasurement data for thermocouples T1, T2, and T5 for unblocked, partially-blocked, and fully-blocked vent conditions. (Appendix C contains graphs of the temperature measurement datafor unblocked, partially-blocked, and fully-blocked vent conditions for the remainingthermocouples, T3, T4, T6, and T7.)
Figure 29 shows that the dryer operated on the high-limit thermostat only when theexhaust duct was 75% or 100% blocked. For the 25% and 50% blocked exhaust ventconditions, the temperatures measured were similar to those measured when the exhaust ventwas unblocked.
Figure 29 also shows that, with 75% and 100% exhaust vent blockages, there appearedto be a difference in the temperature at which the high-limit thermostat operated. At 75%blockage, upper high-limit switching occurred around 195°C; however, for a 100% blockedexhaust vent, upper high limit switching appeared to have occurred at 225°C. This discrepancyin the data was caused by the location of the T1 thermocouple and the orientation of the heaterbox. As mentioned previously, Dryer Design C drew intake air into the heater box from the topand directed it downward toward – and eventually into – the tumbler. When the exhaust ventwas 75% blocked, there was slight airflow over the heating element to direct some heat awayfrom the T1 thermocouple and the high-limit thermostat. With 100% blockage, convective heatcaused the T1 thermocouple to read a higher value – a higher temperature than was actuallypresent at the high-limit thermostat when it opened.
Figure 30 shows that when the exhaust vent was either partially or fully blocked, theheater housing temperature was only slightly above the maximum temperature for theunblocked vent condition. The operation of the high-limit thermostat prevented the heater boxtemperature from increasing much higher than 80°C.

US CONSUMER PRODUCT SAFETY COMMISSIONFINAL REPORT ON ELECTRIC CLOTHES DRYERS AND LINT IGNITION CHARACTERISTICS
May 2003
42
Figure 31 shows the air temperature at the intake to the blower reached around 50°C inthe unblocked and partially-blocked conditions, until around 2100 seconds. For the unblocked,25% and 50% blocked conditions, the temperature continued to increase to over 60°C. With theexhaust vent 75% blocked, switching of the high-limit thermostat prevented the temperature ofthe air entering the blower from increasing to the set point at which the primary thermostatwould open.

US CONSUMER PRODUCT SAFETY COMMISSIONFINAL REPORT ON ELECTRIC CLOTHES DRYERS AND LINT IGNITION CHARACTERISTICS
May 2003
43
Dryer Design CHigh Heat, Wet LoadDecember 11, 2001
0
50
100
150
200
250
010
921
832
743
654
565
476
387
298
110
9011
9913
0814
1715
2616
3517
4418
5319
6220
7121
8022
8923
9825
0726
1627
2528
3429
4330
5231
6132
7033
7934
8835
9737
0638
1539
24
Time (seconds)
Tem
pera
ture
(C)
0
200
400
600
800
1000
1200
1400
1600
1800
Air
Flow
(sfp
m)
T1 Heater Intake T2 Heater Exhaust T3 Heater Housing T4 Exhaust Vent T5 Intake into BlowerT6 Heater Exhaust T7 Room Ambient V1 Airflow into Heater V2 Airflow Exhaust Vent
T6
T4
T2
T3
T7
T1
T5
V2
V1
Figure 28. Dryer Design C – Thermocouple and Airflow Measurements (Wet Load)

US CONSUMER PRODUCT SAFETY COMMISSIONFINAL REPORT ON ELECTRIC CLOTHES DRYERS AND LINT IGNITION CHARACTERISTICS
May 2003
44
Dryer Design CT1 Heater Intake Temperature
0%, 25%, 50%, 75%, and 100% BlockedHigh Heat, Wet Load
December 2001
0
20
40
60
80
100
120
1400
161
322
483
644
805
966
1127
1288
1449
1610
1771
1932
2093
2254
2415
2576
2737
2898
3059
3220
3381
3542
3703
3864
Time (seconds)
Tem
pera
ture
(C)
No Block 75% Blocked 50% Blocked 25% Blocked 100% Blocked
Figure 29. Dryer Design C – T1 Heater Intake Comparison

US CONSUMER PRODUCT SAFETY COMMISSIONFINAL REPORT ON ELECTRIC CLOTHES DRYERS AND LINT IGNITION CHARACTERISTICS
May 2003
45
Dryer Design CT3 Heater Housing Temperature
0%, 25%, 50%, 75%, and 100% BlockedHigh Heat, Wet Load
December 2001
0
10
20
30
40
50
60
70
80
90
1000
163
326
489
652
815
978
1141
1304
1467
1630
1793
1956
2119
2282
2445
2608
2771
2934
3097
3260
3423
3586
3749
3912
Time (seconds)
Tem
pera
ture
(C)
No Block 75% Blocked 50% Blocked 25% Blocked 100% Blocked
Figure 30. Dryer Design C – T3 Heater Housing Comparison
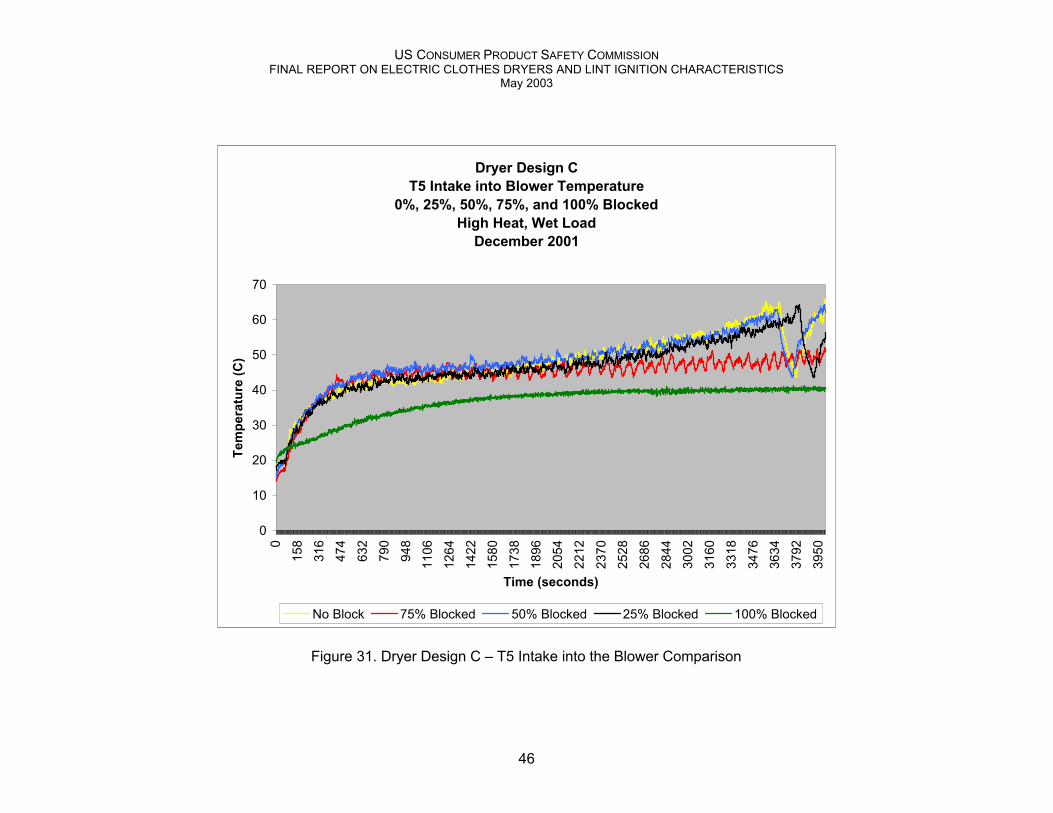
US CONSUMER PRODUCT SAFETY COMMISSIONFINAL REPORT ON ELECTRIC CLOTHES DRYERS AND LINT IGNITION CHARACTERISTICS
May 2003
46
Dryer Design CT5 Intake into Blower Temperature
0%, 25%, 50%, 75%, and 100% BlockedHigh Heat, Wet Load
December 2001
0
10
20
30
40
50
60
700
158
316
474
632
790
948
1106
1264
1422
1580
1738
1896
2054
2212
2370
2528
2686
2844
3002
3160
3318
3476
3634
3792
3950
Time (seconds)
Tem
pera
ture
(C)
No Block 75% Blocked 50% Blocked 25% Blocked 100% Blocked
Figure 31. Dryer Design C – T5 Intake into the Blower Comparison

US CONSUMER PRODUCT SAFETY COMMISSIONFINAL REPORT ON ELECTRIC CLOTHES DRYERS AND LINT IGNITION CHARACTERISTICS
May 2003
47
2.2.6.2 Dryer Design C – Airflow
The airflow was measured using hot wire anemometers placed at the intake airflow intothe heater box and in the exhaust vent. Both anemometers were placed in the center of thecross-section of the air streams. The anemometer placed in the exhaust vent was positioned36” after the first elbow to avoid circular turbulence effects from the dryer blower. As mentionedearlier, the iris and blast plate for the partially- and fully-blocked conditions, respectively, wereplaced before the hot wire anemometer located in the exhaust vent.
Figure 32 shows the intake air velocity comparisons for unblocked, partially-blocked, andfully-blocked exhaust vent conditions. The intake air velocity appeared to have very lowreadings; this was caused by the presence of side louvers in the heater box. The anemometerdid not measure the air intake from the side louvers. As seen previously when the exhaust ventwas 100% blocked, the intake air velocity fluctuated between near zero to about 200 sfpm. Thefluctuation to 200 sfpm coincided with the heating element being de-energized by the high-limitthermostat. This was caused by the anemometer not responding fast enough to thetemperature change when the heater was de-energized.
Figure 33 shows the exhaust air velocity comparisons for unblocked, partially-blocked,and fully-blocked exhaust vent conditions. The graph shows a slight overshoot at initial startupof the dryer, but it is not as prominent as that seen for Dryer Design A. The size of theovershoot decreased as the blockage increased, as expected, since the second anemometerwas located after the exhaust vent blockage. The exhaust air velocity decreased when theexhaust vent was 25% and 50% blocked, and it decreased further when the exhaust vent was75% blocked.
Figure 34 shows the average intake and exhaust air velocities for the different blockageconditions. The data from 120 seconds to 1000 seconds were averaged. This avoided theinitial overshoot when the blower was first powered.

US CONSUMER PRODUCT SAFETY COMMISSIONFINAL REPORT ON ELECTRIC CLOTHES DRYERS AND LINT IGNITION CHARACTERISTICS
May 2003
48
Dryer Design CVelocity Intake Comparison
High Heat, Wet Load
0
200
400
600
800
1000
1200
1400
0 22 44 66 88 110 132 154 176 198 220 242 264 286 308 330 352 374 396 418 440 462 484
Time (seconds)
Velo
city
(sfp
m)
No Block Intake 100% Blocked Intake 75% Blocked Intake50% Blocked Intake 25% Blocked Intake
Figure 32. Dryer Design C – Intake Air Velocity

US CONSUMER PRODUCT SAFETY COMMISSIONFINAL REPORT ON ELECTRIC CLOTHES DRYERS AND LINT IGNITION CHARACTERISTICS
May 2003
49
Dryer Design CVelocity Exhaust Comparison
High Heat, Wet Load
0
200
400
600
800
1000
1200
1400
1600
1800
0 22 44 66 88 110 132 154 176 198 220 242 264 286 308 330 352 374 396 418 440 462 484
Time (seconds)
Velo
city
(sfp
m)
No Block Exhaust 100% Blocked Exhaust 75% Blocked Exhaust50% Blocked Exhaust 25% Blocked Exhaust
Figure 33. Dryer Design C – Exhaust Vent Air Velocity
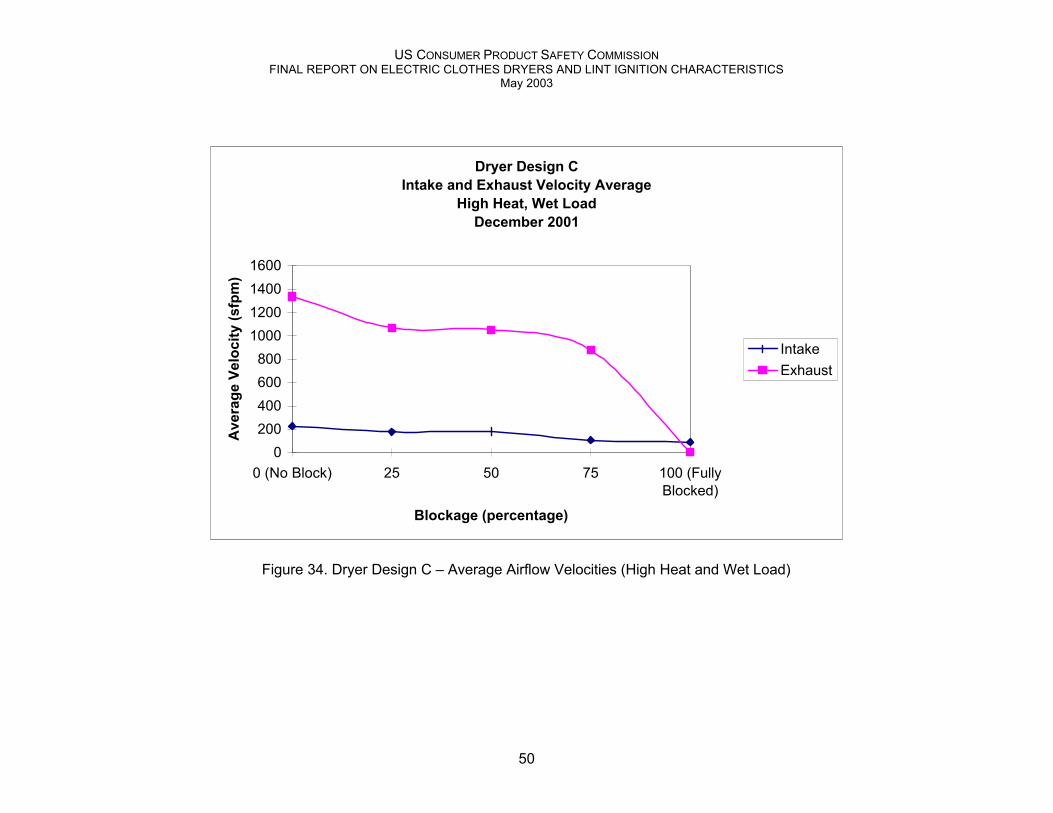
US CONSUMER PRODUCT SAFETY COMMISSIONFINAL REPORT ON ELECTRIC CLOTHES DRYERS AND LINT IGNITION CHARACTERISTICS
May 2003
50
Dryer Design CIntake and Exhaust Velocity Average
High Heat, Wet LoadDecember 2001
0200400600800
1000120014001600
0 (No Block) 25 50 75 100 (FullyBlocked)
Blockage (percentage)
Ave
rage
Vel
ocity
(sfp
m)
IntakeExhaust
Figure 34. Dryer Design C – Average Airflow Velocities (High Heat and Wet Load)

US CONSUMER PRODUCT SAFETY COMMISSIONFINAL REPORT ON ELECTRIC CLOTHES DRYERS AND LINT IGNITION CHARACTERISTICS
May 2003
51
2.2.6.3 Dryer Design C – Primary Thermostat Bypassed
The primary thermostat was bypassed to simulate a failure mode in which it failedclosed. The thermostat was removed from the intake blower housing, and the hole it left wascovered with foil tape. The thermostat was placed in a cool part of the dryer to prevent it fromswitching open. The dryer was operated with full airflow (no exhaust blockage) and with a dryload.
Figure 35 shows the thermocouple and airflow measurement data for Dryer Design Cwith a bypassed primary thermostat. The graph shows that the dryer began operating on thehigh-limit thermostat. Since evaluations of Dryer Designs A and B did not result in high-limitcycling when the primary thermostat was bypassed, inspection for a blocked exhaust vent wasconducted. It was determined that lint on the rodent screen at the vent hood reduced airflowsufficiently to cause the dryer to operate in the high-limit cycling mode. The lint (approximately0.69 grams and distributed evenly) was removed at approximately 2000 seconds into the test.For the remainder of the test, the dryer no longer cycled on the high-limit thermostat.

US CONSUMER PRODUCT SAFETY COMMISSIONFINAL REPORT ON ELECTRIC CLOTHES DRYERS AND LINT IGNITION CHARACTERISTICS
May 2003
52
Dryer Design CPrimary Thermostat Bypassed
Dry LoadJanuary 02, 2002
0
50
100
150
200
250
012
725
438
150
863
576
288
910
1611
4312
7013
9715
2416
5117
7819
0520
3221
5922
8624
1325
4026
6727
9429
2130
4831
7533
0234
2935
5636
8338
1039
37
Time (seconds)
Tem
pera
ture
(C)
0
200
400
600
800
1000
1200
1400
Air
Flow
(sfp
m)
T1 Heater Intake T2 heater Exhaust (3.5) T3 Heater HousingT4 Exhaust Vent T5 Intake into Blower T6 Heater Exhaust (5.5)T7 Room Ambient V1 Airflow into Heater V2 Airflow Exhaust Vent
T6
T4
T2
T3
T7
T1
T5V2
V1
Switching on theHigh-Limit Thermostat
Cleaned Blocked Exhaust
Figure 35. Dryer Design C – Primary Thermostat Bypassed
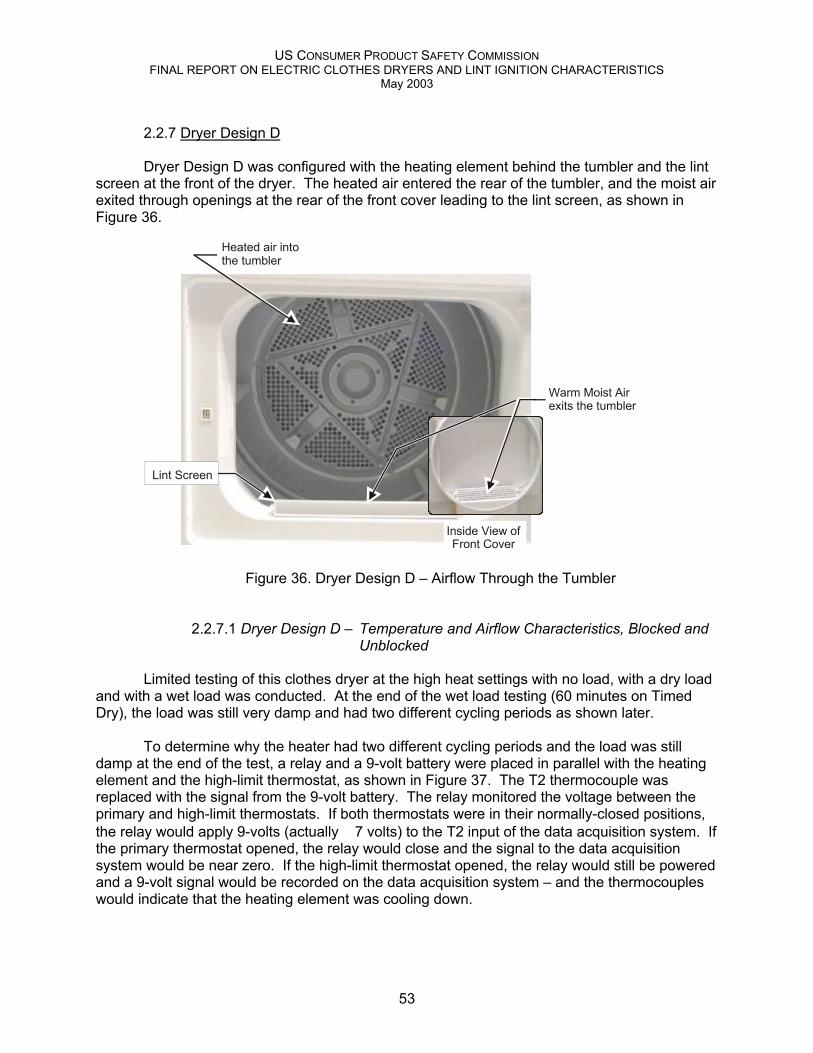
US CONSUMER PRODUCT SAFETY COMMISSIONFINAL REPORT ON ELECTRIC CLOTHES DRYERS AND LINT IGNITION CHARACTERISTICS
May 2003
53
2.2.7 Dryer Design D
Dryer Design D was configured with the heating element behind the tumbler and the lintscreen at the front of the dryer. The heated air entered the rear of the tumbler, and the moist airexited through openings at the rear of the front cover leading to the lint screen, as shown inFigure 36.
Warm Moist Airexits the tumbler
Heated air intothe tumbler
Lint Screen
Inside View ofFront Cover
Figure 36. Dryer Design D – Airflow Through the Tumbler
2.2.7.1 Dryer Design D – Temperature and Airflow Characteristics, Blocked andUnblocked
Limited testing of this clothes dryer at the high heat settings with no load, with a dry loadand with a wet load was conducted. At the end of the wet load testing (60 minutes on TimedDry), the load was still very damp and had two different cycling periods as shown later.
To determine why the heater had two different cycling periods and the load was stilldamp at the end of the test, a relay and a 9-volt battery were placed in parallel with the heatingelement and the high-limit thermostat, as shown in Figure 37. The T2 thermocouple wasreplaced with the signal from the 9-volt battery. The relay monitored the voltage between theprimary and high-limit thermostats. If both thermostats were in their normally-closed positions,the relay would apply 9-volts (actually ∼ 7 volts) to the T2 input of the data acquisition system. Ifthe primary thermostat opened, the relay would close and the signal to the data acquisitionsystem would be near zero. If the high-limit thermostat opened, the relay would still be poweredand a 9-volt signal would be recorded on the data acquisition system – and the thermocoupleswould indicate that the heating element was cooling down.

US CONSUMER PRODUCT SAFETY COMMISSIONFINAL REPORT ON ELECTRIC CLOTHES DRYERS AND LINT IGNITION CHARACTERISTICS
May 2003
54
120 VAC
120 VAC
240 VAC
PrimaryThermostat
High-LimitThermostat
HeaterElement
9-voltbattery
Relay
To DataAcquisition (T2)
Figure 37. Setup with a Relay and Battery for T2 Analog
Figure 38 shows the thermocouple and airflow measurement data for Dryer Design Dwith a wet load before setup, as shown in Figure 37. The primary thermostat first disconnectedpower to the heater at approximately 779 seconds into the test. The heater cycledapproximately every 374 seconds, until 3133 seconds into the test. After 3133 seconds, itbegan to cycle approximately every 190 seconds. At the end of the test – 60 minutes on TimedDry – the load was still very damp (Lists of the tests and additional figures for Dryer Design Dare located in Appendix D.)
The standard load of 10 towels was tested again, but with the T2 analog signal/relay.Figure 39 shows the thermocouple, airflow, and T2 analog data for a wet load. The graphshows that the dryer behaved the same as it had in the previous test; i.e., it exhibited thephenomenon of two periodic cycles for the thermostats. In this case, however, it could bedetermined from the T2 signal that the first periodic cycling was caused by the high-limitthermostat, and the second periodic cycling was caused by the primary thermostat. As before,the towels were still very damp at the end of the 60-minute (Timed Dry) drying cycle.
The most likely cause for the dryer to begin operating on the high-limit thermostat in theunblocked exhaust vent condition was inadequate airflow through the tumbler. The dryerappeared to be responding to an overload condition in which the load restricted the airflowthrough the tumbler.
To determine why the primary thermostat began cycling later in the test, the dryer doorwas removed and replaced with a sheet of rigid clear plastic. It was observed that, after aperiod, the load stopped tumbling and began to ride along the sides of the rotating drum. Thisexplained why the dryer began cycling on the primary thermostat. When the load was riding onthe rotating drum, this allowed the heated air to pass freely through the tumbler and into the lint
US CONSUMER PRODUCT SAFETY COMMISSIONFINAL REPORT ON ELECTRIC CLOTHES DRYERS AND LINT IGNITION CHARACTERISTICS
May 2003
55
screen/blower. The primary thermostat was able to detect the increase in temperature, causingit to open or cycle the heater off. When the tumbler temperature cooled, the primary thermostatclosed or cycled the heater on. This also explained why the load was still damp at the end ofthe 60-minute drying cycle. This same phenomenon occurred when the dryer was tested withwet or damp loads of 10, 7, or 5 towels, as shown in Appendix D. (A video clip demonstratingthis phenomenon is included in Appendix J.) This phenomenon also occurred with DryerDesign B, but it was not as repeatable as it was with Dryer Design D.
The thermocouple and airflow measurement data for Dryer Design D are not listed here.The data would not be meaningful because of the operating characteristics of the dryer; i.e.,immediate high-limit cycling due to overloading and the phenomenon of the load riding along thesides of the rotating drum.
To obtain steady and consistent data, the dryer was tested with no load with a partially-blocked exhaust vent (25%, 50%, 75% blockage), and a 100% blocked exhaust vent.
Figures 40 and 41 show comparisons of temperature measurement data for unblocked,partially-blocked, and fully- blocked exhaust vent conditions for T1 and T3 thermocouples.(Appendix D contains graphs of the temperature data for the remaining thermocouples, T2, T4,T5, T6, and T7.)
Figure 40 shows that the dryer began to operate on the high-limit thermostat when theexhaust duct was 75% or 100% blocked. For the 25% and 50% blocked exhaust ventconditions, the temperatures measured were similar to those measured when the exhaust ventwas unblocked. For the 75% and 100% exhaust vent blockage conditions, the graph shows twodifferent periodic rates at which the high-limit thermostat cycled. With the exhaust vent 75%blocked, the lower set point temperature for the high-limit thermostat was 50° C; when theexhaust vent was 100% blocked, it appeared to be switching at 100° C. It could not bedetermined why the high-limit thermostat was cycling at two different lower set points for the75% and 100% blocked conditions.
Figure 41 shows comparisons of temperature data at the heater box T3 thermocouple,for unblocked, partially-blocked, and fully blocked exhaust vent conditions. The housingtemperature increased to approximately 50°C for the unblocked, 25% and 50% blocked ventconditions. At blockages of 75% and 100%, the housing temperature increased toapproximately 150°C.

US CONSUMER PRODUCT SAFETY COMMISSIONFINAL REPORT ON ELECTRIC CLOTHES DRYERS AND LINT IGNITION CHARACTERISTICS
May 2003
56
Dryer Design DHigh Heat, Wet Load
January 03, 2002
0
50
100
150
200
250
300
010
621
231
842
453
063
674
284
895
410
6011
6612
7213
7814
8415
9016
9618
0219
0820
1421
2022
2623
3224
3825
4426
5027
5628
6229
6830
7431
8032
8633
9234
9836
0437
1038
1639
22
Time (seconds)
Tem
pera
ture
(C)
0
200
400
600
800
1000
1200
1400
1600
1800
Air
Flow
(sfp
m)
T1 Heater Intake T2 Heater Exhaust T3 Heater Housing T4 Exhaust Vent T5 Intake into BlowerT6 Tumbler Intake T7 Room Ambient V1 Airflow into Heater V2 Airflow Exhaust Vent
T6
T4
T2
T3
T7
T1
T5
V2
V1
Figure 38. Dryer Design D – Thermocouple and Airflow Measurements (Wet Load)

US CONSUMER PRODUCT SAFETY COMMISSIONFINAL REPORT ON ELECTRIC CLOTHES DRYERS AND LINT IGNITION CHARACTERISTICS
May 2003
57
Dryer Design DHigh Heat, Wet Load, with Analog (T2)
January 07, 2002
0
50
100
150
200
250
300
010
921
832
743
654
565
476
387
298
110
9011
9913
0814
1715
2616
3517
4418
5319
6220
7121
8022
8923
9825
0726
1627
2528
3429
4330
5231
6132
7033
7934
8835
9737
0638
1539
24
Time (seconds)
Tem
pera
ture
(C)
0
200
400
600
800
1000
1200
1400
1600
1800
Air
Flow
(sfp
m)
T1 Heater Intake Analog T3 Heater Housing T4 Exhaust Vent T5 Intake into BlowerT6 Tumbler Intake T7 Room Ambient V1 Airflow into Heater V2 Airflow Exhaust Vent
T6
T4
T2 analog
T3
T7
T1T5
V2
V1
Figure 39. Thermocouple, Airflow and Relay (T2 Analog) Measurements

US CONSUMER PRODUCT SAFETY COMMISSIONFINAL REPORT ON ELECTRIC CLOTHES DRYERS AND LINT IGNITION CHARACTERISTICS
May 2003
58
Dryer Design DT1 Heater Intake Temperature
0%, 25%, 50%, 75%, and 100% BlockedHigh Heat, No Load
January 2002
0
50
100
150
200
250
300
350
4000 41 82 123
164
205
246
287
328
369
410
451
492
533
574
615
656
697
738
779
820
861
902
943
984
Time (seconds)
Tem
pera
ture
(C)
No Block 75% Blocked 50% Blocked 25% Blocked 100% Blocked
Figure 40. Dryer Design D – T1 Heater Intake Comparison

US CONSUMER PRODUCT SAFETY COMMISSIONFINAL REPORT ON ELECTRIC CLOTHES DRYERS AND LINT IGNITION CHARACTERISTICS
May 2003
59
Dryer Design DT3 Heater Housing Temperature
0%, 25%, 50%, 75%, and 100% BlockedHigh Heat, No Load
January 2002
0
50
100
150
200
2500 41 82 123
164
204.
999
246
287
328
369
410
451
492
533
574
614.
999
656
697
737.
999
779
820
861
901.
999
943
984
Time (seconds)
Tem
pera
ture
(C)
No Block 75% Blocked 50% Blocked 25% Blocked 100% Blocked
Figure 41. Dryer Design D – T3 Heater Housing Temperature Comparison
US CONSUMER PRODUCT SAFETY COMMISSIONFINAL REPORT ON ELECTRIC CLOTHES DRYERS AND LINT IGNITION CHARACTERISTICS
May 2003
60
2.2.7.2 Dryer Design D – Airflow
The airflow was measured using hot wire anemometers placed at the intake airflow intothe heater and in the exhaust vent. The anemometer at the exhaust vent was placed in thecenter of the cross-section of the air stream. The other anemometer was placed at top-center ofthe circular heater intake. The anemometer placed in the exhaust vent was positioned 36” afterthe first elbow to avoid circular turbulence effects from the dryer blower. As mentioned earlier,the iris and blast plate for the partially-blocked and fully-blocked conditions, respectively, wereplaced before the hot wire anemometer located in the exhaust vent.
Figure 42 shows the intake air velocity comparisons for the unblocked, partially-blocked,and fully-blocked exhaust vent conditions with no load. Due to the configuration of the heatingelement, the intake air velocity measurement data were not as accurate as the exhaust airvelocity data. The air intake was configured in a 360° ring behind the tumbler, with a longnarrow slot. The shape and surface area of the heater intake caused the airflow velocity to bebelow the resolution of the anemometer instrumentation.
Figure 43 shows the exhaust air velocity comparisons for the unblocked, partially-blocked, and fully-blocked exhaust vent conditions with no load. The graph shows a slightovershoot at initial startup of the dryer, which was caused by the blower being energized, asseen with the other dryer designs. There were periodic increases in exhaust airflow, whichcorresponded to the heating element cycling off when the primary thermostat opened. Theincrease in exhaust airflow was caused by the anemometer responding slowly to the suddentemperature changes.
Figure 44 shows the average intake and exhaust air velocities for the different blockageconditions. The data from 120 seconds to 1000 seconds were averaged. This would avoid theinitial overshoot when the blower was first powered. The 25% and 50% blocked exhaustconditions displayed a more pronounced, higher exhaust airflow velocity than did the unblockedcondition; this was not seen during examination of the other dryer designs.

US CONSUMER PRODUCT SAFETY COMMISSIONFINAL REPORT ON ELECTRIC CLOTHES DRYERS AND LINT IGNITION CHARACTERISTICS
May 2003
61
Dryer Design DVelocity Intake Comparison
High Heat, No Load
0
200
400
600
800
1000
1200
1400
0 22 44 66 88 110 132 154 176 198 220 242 264 286 308 330 352 374 396 418 440 462 484
Time (seconds)
Velo
city
(sfp
m)
No Block Intake 100% Blocked Intake 75% Blocked Intake50% Blocked Intake 25% Blocked Intake
Figure 42. Dryer Design D – Intake Air Velocity

US CONSUMER PRODUCT SAFETY COMMISSIONFINAL REPORT ON ELECTRIC CLOTHES DRYERS AND LINT IGNITION CHARACTERISTICS
May 2003
62
Dryer Design DVelocity Exhaust Comparison
High Heat, No Load
0
200
400
600
800
1000
1200
1400
1600
1800
0 22 44 66 88 110 132 154 176 198 220 242 264 286 308 330 352 374 396 418 440 462 484
Time (seconds)
Velo
city
(sfp
m)
No Block Exhaust 100% Blocked Exhaust 75% Blocked Exhaust50% Blocked Exhaust 25% Blocked Exhaust
Figure 43. Dryer Design D – Exhaust Vent Air Velocity

US CONSUMER PRODUCT SAFETY COMMISSIONFINAL REPORT ON ELECTRIC CLOTHES DRYERS AND LINT IGNITION CHARACTERISTICS
May 2003
63
Dryer Design DIntake and Exhaust Velocity Average
High Heat, No LoadJanuary 2002
0200400600800
1000120014001600
0 (No Block) 25 50 75 100 (FullyBlocked)
Blockage (percentage)
Ave
rage
Vel
ocity
(sfp
m)
IntakeExhaust
Figure 44. Dryer Design D –Average Airflow Velocities (High Heat and No Load)

US CONSUMER PRODUCT SAFETY COMMISSIONFINAL REPORT ON ELECTRIC CLOTHES DRYERS AND LINT IGNITION CHARACTERISTICS
May 2003
64
2.2.7.3 Dryer Design D – Primary Thermostat Bypassed
The primary thermostat was bypassed to simulate a failed closed primary thermostat.The thermostat was removed from the intake blower housing, and the hole was covered with foiltape. The thermostat was placed in a cool part of the dryer to prevent it from switching open.The dryer was operated with full airflow (no exhaust blockage) and a wet (washed and spun dry)load. To avoid the phenomenon where the load stopped tumbling after a period, the dryer loadwas reduced to six cotton towels. Five of the six towels were of the same size as used before.The sixth towel was a different size, approximately 25% larger, to help prevent the load fromriding the tumbler. The T2 analog signal was used to determine if either the primary or the high-limit thermostat opened.
Figure 45 shows the thermocouple and airflow measurement data for Dryer Design Dwith a bypassed primary thermostat. The load began to ride the sides of the tumbler atapproximately 1900 seconds after the dryer was started. Approximately 3000 seconds after thedryer was started, the high-limit thermostat opened, as shown by the graph of the T2 analogsignal. For unknown reasons, the T1 thermocouple became very erratic just before the high-limit switch opened. The test was stopped at approximately 3250 seconds after the dryer wasstarted.

US CONSUMER PRODUCT SAFETY COMMISSIONFINAL REPORT ON ELECTRIC CLOTHES DRYERS AND LINT IGNITION CHARACTERISTICS
May 2003
65
Dryer Design DWet Load (6 towels)
January 16, 2002
0
50
100
150
200
250
300
012
324
636
949
261
573
886
198
411
0712
3013
5314
7615
9917
2218
4519
6820
9122
1423
3724
6025
8327
0628
2929
5230
7531
9833
2134
4435
6736
9038
13
Time (seconds)
Tem
pera
ture
(C)
0
200
400
600
800
1000
1200
1400
1600
1800
Air
Flow
(sfp
m)
T1 Heater Intake T2 Analog T3 Heater HousingT4 Exhaust Vent T5 Intake into Blower T6 Heater ExhaustT7 Room Ambient V1 Airflow into Heater V2 Airflow Exhaust Vent
T6
T4
T2
T3
T7
T1
T5
V2
V1
The Load stops Tumbling
High-Limit Switch Opens
T3
Power Turned Off Switch Opens
Figure 45. Dryer Design D – Primary Thermostat Bypassed
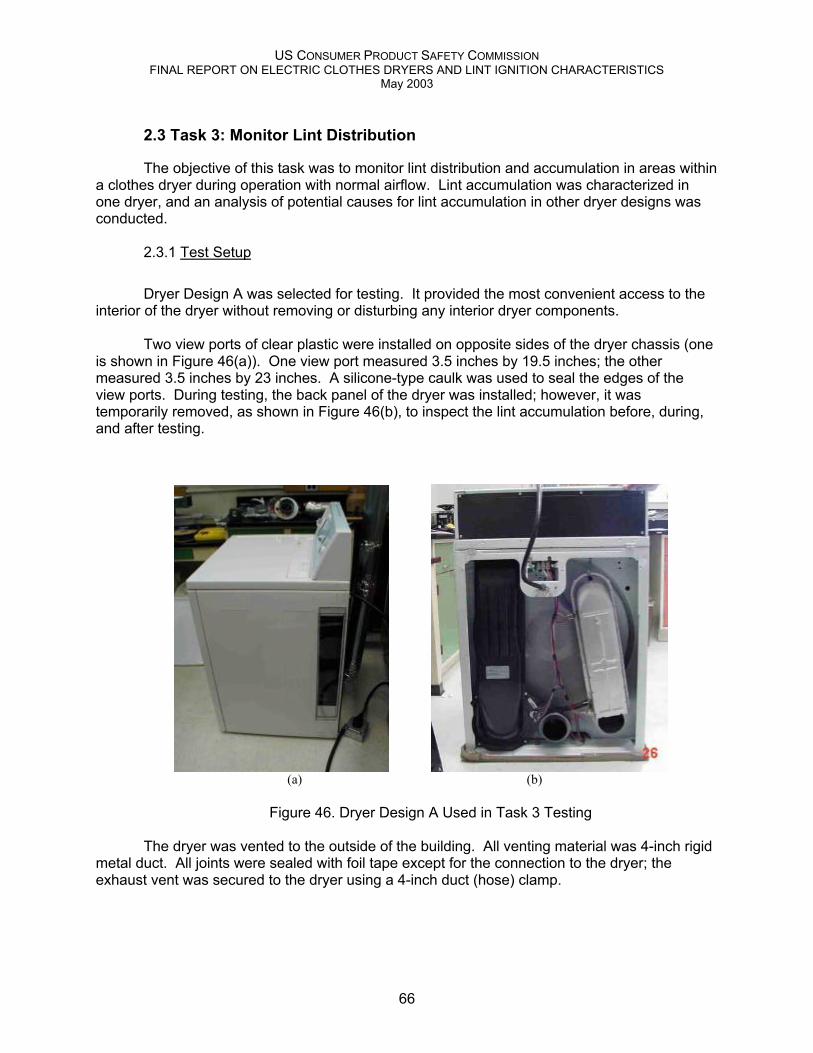
US CONSUMER PRODUCT SAFETY COMMISSIONFINAL REPORT ON ELECTRIC CLOTHES DRYERS AND LINT IGNITION CHARACTERISTICS
May 2003
66
2.3 Task 3: Monitor Lint Distribution
The objective of this task was to monitor lint distribution and accumulation in areas withina clothes dryer during operation with normal airflow. Lint accumulation was characterized inone dryer, and an analysis of potential causes for lint accumulation in other dryer designs wasconducted.
2.3.1 Test Setup
Dryer Design A was selected for testing. It provided the most convenient access to theinterior of the dryer without removing or disturbing any interior dryer components.
Two view ports of clear plastic were installed on opposite sides of the dryer chassis (oneis shown in Figure 46(a)). One view port measured 3.5 inches by 19.5 inches; the othermeasured 3.5 inches by 23 inches. A silicone-type caulk was used to seal the edges of theview ports. During testing, the back panel of the dryer was installed; however, it wastemporarily removed, as shown in Figure 46(b), to inspect the lint accumulation before, during,and after testing.
(a) (b)
Figure 46. Dryer Design A Used in Task 3 Testing
The dryer was vented to the outside of the building. All venting material was 4-inch rigidmetal duct. All joints were sealed with foil tape except for the connection to the dryer; theexhaust vent was secured to the dryer using a 4-inch duct (hose) clamp.

US CONSUMER PRODUCT SAFETY COMMISSIONFINAL REPORT ON ELECTRIC CLOTHES DRYERS AND LINT IGNITION CHARACTERISTICS
May 2003
67
2.3.2 Test Description
For this task, loads of towels were alternately washed in detergent-free hot water andspun dry, then dried for approximately 60 minutes in the dryer using the Timed Dry feature (onewashing followed by drying equals one cycle). A total of 100 cycles was completed. After 48and 100 cycles, the interior of the dryer was inspected and the presence of any lintaccumulation was documented.
Four loads of towels were used in Task 3 testing; a load consisted of 10 white cottontowels. During the first 48 cycles, two of the four loads were used for the test. For cycles 49through 100, the remaining two loads were used.
Before each cycle, a load was conditioned overnight (for approximately twelve hours) ina conditioning chamber with a controlled relative humidity (RH) of 50 ± 5% and a temperature of23° to 25° C.
Two test methods to record the amount of lint accumulation in the dryer were attempted.Method 1 was to record the weight loss of a load resulting from the washing and drying cycles.Method 2 was to visually inspect the interior of the dryer for lint accumulation.
2.3.2.1 Method 1 – Weight Loss of Load
Method 1 was used to estimate the amount of towel material lost (as lint) into the interiorof the test dryer by recording the weight loss of a load resulting from the washing and dryingcycles. The weight of a conditioned load was recorded before the start of a cycle. The amountof towel material lost during washing, the amount that accumulated on the lint screen duringdrying, and the amount lost through the dryer vent were recorded. The remainder of any lostmaterial was assumed to have escaped into the interior of the dryer chassis.
This method proved to be unsuitable for two reasons. The first was the fluctuation in thehumidity level in the conditioning chamber, which varied by ± 5% RH. The second was the rateat which the towels lost moisture outside the conditioning chamber, depending on the humidity.
To determine the weight variation in the conditioned load due to the fluctuation inrelatively humidity of the conditioning chamber, a load of towels was stored overnight in a roomwith approximately 25% RH. The load was then transferred to the conditioning chamber. Afterconditioning for a minimum of 14 hours, the towel load was weighed. The consequent weightgain was approximately 100g, or 4g per 1% RH. With the conditioning chamber having avariation of ± 5% RH, the weight of a 5000g load could vary by ± 20g.
The difference in humidity between the conditioning chamber and the test room causedthe weight of the towels to vary more significantly than the amount of lint lost. The towels wereweighed in the test room after they were removed from the conditioning chamber. During thetime that the towels were weighed, moisture in the towels could evaporate. The relativehumidity levels in the test room and the conditioning chamber were 20-30% RH and 50 ± 5%RH, respectively.
The average weights of lint samples collected during one cycle were 0.6g (after wash),0.4g (in the lint screen), and 0.2g (in the dryer vent), or a combined weight of 1.2g. The
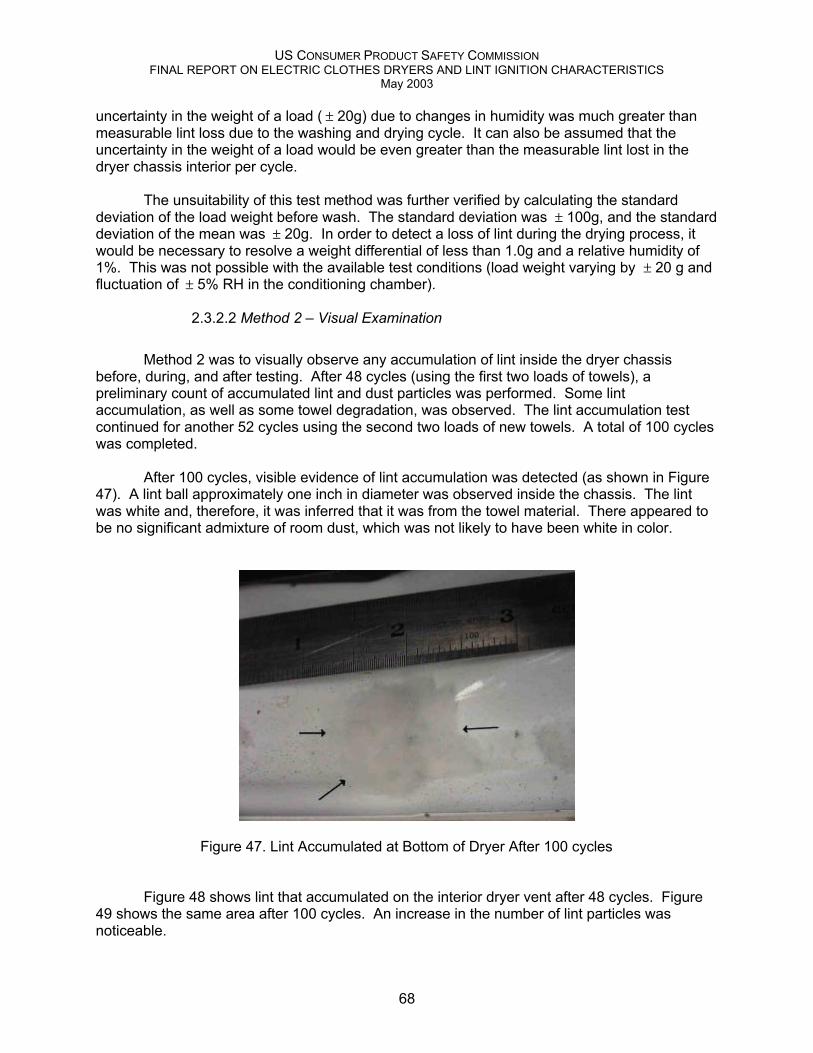
US CONSUMER PRODUCT SAFETY COMMISSIONFINAL REPORT ON ELECTRIC CLOTHES DRYERS AND LINT IGNITION CHARACTERISTICS
May 2003
68
uncertainty in the weight of a load ( ± 20g) due to changes in humidity was much greater thanmeasurable lint loss due to the washing and drying cycle. It can also be assumed that theuncertainty in the weight of a load would be even greater than the measurable lint lost in thedryer chassis interior per cycle.
The unsuitability of this test method was further verified by calculating the standarddeviation of the load weight before wash. The standard deviation was ± 100g, and the standarddeviation of the mean was ± 20g. In order to detect a loss of lint during the drying process, itwould be necessary to resolve a weight differential of less than 1.0g and a relative humidity of1%. This was not possible with the available test conditions (load weight varying by ± 20 g andfluctuation of ± 5% RH in the conditioning chamber).
2.3.2.2 Method 2 – Visual Examination
Method 2 was to visually observe any accumulation of lint inside the dryer chassisbefore, during, and after testing. After 48 cycles (using the first two loads of towels), apreliminary count of accumulated lint and dust particles was performed. Some lintaccumulation, as well as some towel degradation, was observed. The lint accumulation testcontinued for another 52 cycles using the second two loads of new towels. A total of 100 cycleswas completed.
After 100 cycles, visible evidence of lint accumulation was detected (as shown in Figure47). A lint ball approximately one inch in diameter was observed inside the chassis. The lintwas white and, therefore, it was inferred that it was from the towel material. There appeared tobe no significant admixture of room dust, which was not likely to have been white in color.
Figure 47. Lint Accumulated at Bottom of Dryer After 100 cycles
Figure 48 shows lint that accumulated on the interior dryer vent after 48 cycles. Figure49 shows the same area after 100 cycles. An increase in the number of lint particles wasnoticeable.

US CONSUMER PRODUCT SAFETY COMMISSIONFINAL REPORT ON ELECTRIC CLOTHES DRYERS AND LINT IGNITION CHARACTERISTICS
May 2003
69
Figure 48. Lint Accumulated on Interior of Dryer After 48 Cycles
Figure 49. Lint Accumulated on Interior of Dryer After 100 Cycles(same location as shown in Figure 48)
The number of lint particles in an approximately half-inch square shown in Figures 48and 49 was estimated. Approximately 83 particles were counted after 48 cycles; there wereapproximately 250 particles after 100 cycles. Some areas of the dryer did not show anobservable gain in lint coverage, while other areas had significant gains.
2.3.3 Examination of Dryer Design A
Figure 50 shows an area of the blower fan housing after 100 cycles. A significantaccumulation of lint was observed at a sealed joint for the blower housing (shown by whitearrow), and a lint ball was observed on the dryer floor (shown by black arrow). Thisaccumulation was not apparent at the start of Task 3 testing or after 48 cycles.

US CONSUMER PRODUCT SAFETY COMMISSIONFINAL REPORT ON ELECTRIC CLOTHES DRYERS AND LINT IGNITION CHARACTERISTICS
May 2003
70
Figure 50. Lint Build-up at Blower Housing Seal and Dryer Floor
US CONSUMER PRODUCT SAFETY COMMISSIONFINAL REPORT ON ELECTRIC CLOTHES DRYERS AND LINT IGNITION CHARACTERISTICS
May 2003
71
2.4 Task 4: Determine Characteristics Required for Lint Ignition
The main objective of this task was to record the ignition characteristics of lint on, near,and ingested into the heater. The test variables used in the Task 4 testing were developed fromdata collected in Task 2. Document Dryer Operating Characteristics. The testing was dividedinto two phases. Phase I consisted of examining the ignition characteristics of lint on and nearthe heater. Phase II consisted of examining the ignition characteristics of lint that was ingestedinto the heater.
2.4.1 Test Setup
A test apparatus was constructed to house the heater box/element (from Dryer DesignA) and venting material for the heater exhaust, as shown in Figures 51 and 52. The test setupallowed precise control of the test conditions. Two fans and irises were installed toindependently control the airflow external and through the heater box. The heater was wired toa variable transformer to control the heat output, if needed. All venting material was 4-inch rigidmetal duct. All joints were sealed with foil tape. Appendix F illustrates the dimensions of thetest setup used in Task 4.
Although a heater from one of the dryer designs was used, the test setup removed manyof the design variables found in any particular dryer design, and staff believes the test resultsmay be applied to the other dryer designs.
2.4.2 Instrumentation Setup
The test setup was instrumented with six thermocouples and two hot wire anemometers.One additional thermocouple was used to record the ambient room temperature. All seventhermocouples were 24 gauge, K type. The same thermocouples used in the Task 2 testingwere used in this phase of testing.
Table 6 lists the locations of the thermocouples. The T3 thermocouple was cemented tothe heater housing using a ceramic based cement.
Table 6. Thermocouple Location and Setup
Thermocouple LocationT1 Heater IntakeT2 Heater ExhaustT3 Heater Housing or Lint Sample*T4 Intake into Blower/Heater ExhaustT5 Intake into Blower/Outside HeaterT6 Chamber TemperatureT7 Ambient Room
* Location may differ, as specified in the report

US CONSUMER PRODUCT SAFETY COMMISSIONFINAL REPORT ON ELECTRIC CLOTHES DRYERS AND LINT IGNITION CHARACTERISTICS
May 2003
72
Two anemometers were used in this phase of testing. One anemometer was placed atthe heater box intake. The second anemometer was placed near the top of the heater box tomeasure the airflow over the heater box housing.

US CONSUMER PRODUCT SAFETY COMMISSIONFINAL REPORT ON ELECTRIC CLOTHES DRYERS AND LINT IGNITION CHARACTERISTICS
May 2003
73
Heater
View Ports
InletHeaterExhaust
Figure 51. Test Setup for Lint Ignition

US CONSUMER PRODUCT SAFETY COMMISSIONFINAL REPORT ON ELECTRIC CLOTHES DRYERS AND LINT IGNITION CHARACTERISTICS
May 2003
74
Anemometer
Heater Box
Airflow Direction
Figure 52. Test Setup for Lint Ignition

US CONSUMER PRODUCT SAFETY COMMISSIONFINAL REPORT ON ELECTRIC CLOTHES DRYERS AND LINT IGNITION CHARACTERISTICS
May 2003
75
2.4.3 Phase I – Ignition Characteristics of Lint On and Near the Heater Box
In this phase of testing, lint samples were placed on top of the heater housing, at oneside of the heater housing, and at the heater intake. All lint samples were conditioned for aminimum of 24 hours at 23°C to 25°C and 50% to 55% relative humidity.
The lint samples were tested at five different locations on the heater housing as shownin Figure 53. Lint samples were tested in two locations on top of the heater housing, locations Aand B. Lint samples were tested at three locations on one side of the housing, locations C, Dand E.
AirflowDirection
Figure 53. Location of Lint Samples on the Housing
2.4.3.1 Top of Heater Housing
The first series of tests was conducted with lint samples placed on top of the heaterhousing at location A, as shown in Figure 54. The high-limit thermostat was bypassed for thisseries of tests.
The lint samples measured approximately 2 x 2 x ¼ inches and weighed approximately0.30 grams. The samples were 100% cotton lint collected from the lint screen during Task 3testing.

US CONSUMER PRODUCT SAFETY COMMISSIONFINAL REPORT ON ELECTRIC CLOTHES DRYERS AND LINT IGNITION CHARACTERISTICS
May 2003
76
T3 Thermocouple
Lint Sample
Figure 54. Lint Sample on Heater Housing at Location A
Table 7 provides a list of the lint ignition tests that were conducted at location A on top ofthe heater housing. The table includes the weights of the lint samples tested, test conditions,and the observed results.
Table 7. Testing on Top of the Heater Housing at Location A
Location Number Weight(grams)
Power Intake Airflow(sfpm)
OutsideAirflow(sfpm)
High-LimitThermostat
Result
A s1-1 0.32 step 0 0 bypassed smolderA s1-2 0.33 step 0 0 bypassed smolderA s1-3 0.33 step 0 40 bypassed smolderA s1-4 0.34 instant 0 40 bypassed smolderA s1-5a 0.32 instant 0 40 bypassed smolderA s2-8 0.30 instant 0 40 bypassed smolderA s5-1 0.32 instant 650 Ä
0@400s40 bypassed smolder
The samples either smoldered or charred during the tests, as shown in Figure 55. In thefirst three tests (Sample Numbers s1-1, s1-2, and s1-3), the power to the heater wasincrementally increased. In the next three tests (s1-4, s1-5a, s2-8), power was appliedinstantaneously to the heating element. In all these tests, the samples smoldered but did notignite. In test s5-1, the airflow through the heater was initially 650 sfpm until 400 seconds whenit was decreased to zero sfpm. The sample charred and smoldered.

US CONSUMER PRODUCT SAFETY COMMISSIONFINAL REPORT ON ELECTRIC CLOTHES DRYERS AND LINT IGNITION CHARACTERISTICS
May 2003
77
Sample 1-5a Sample 1-5a
Before Smoldering
Figure 55. Sample Smoldering at Location A
Table 8 provides a list of the lint ignition tests that were conducted at location B on top ofthe heater housing. The lint samples measured approximately 2 x 2 x ¼ inches and weighedapproximately 0.30 grams. The samples were 100% cotton lint collected from the lint screenduring Task 3 tests. The table includes the weights of the lint samples tested, test conditions,and the observed results.
Table 8. Testing on Top of the Heater Housing at Location B.
Location Number Weight(grams)
Power IntakeAirflow(sfpm)
OutsideAirflow(sfpm)
High-LimitThermostat
Result
B s5-8 0.34 instant 0 40 bypassed ignitedB s5-9 0.28 instant 0 40 bypassed ignitedB s5-10 0.34 instant 0 40 bypassed ignitedB s5-11 0.32 instant 0 40 series smolderB s5-12 0.34 instant 300 40 series smolderB s5-13 0.34 instant 200 40 series smolder
In three of the six tests conducted at location B, the high-limit thermostat was bypassed;in the other three, the high-limit thermostat was connected in series with the heating element.The airflow through the heater was set at either 200 or 300 sfpm in the last two tests. In the firstthree tests at location B (s5-8, s5-9, and s5-10), the samples ignited. Figure 56 shows samples5-8 igniting during the test. Figure 57 shows a graph of the thermocouple data for sample s5-8. The sample ignited approximately 30 seconds after power was applied to the heatingelement.

US CONSUMER PRODUCT SAFETY COMMISSIONFINAL REPORT ON ELECTRIC CLOTHES DRYERS AND LINT IGNITION CHARACTERISTICS
May 2003
78
Sample 5-8
Before Smoldering IgnitionFigure 56. Sample s5-8 at Location B
Sample s5-80.34 grams
July 12, 2002
0
100
200
300
400
500
600
700
0 7 14 21 28 35 42 49 56 63 70 77 84 91 98 105
112
119
126
133
140
147
154
161
168
175
182
189
196
Time (seconds)
Tem
pera
ture
(C)
0
200
400
600
800
1000
1200
1400
1600
Air
Flow
(sfp
m)
T1 Heater Intake T2 Heater Exhaust T3 Liint SampleT4 Exhaust Vent Heater T5 Exhaust Vent Outside Heater T6 ChamberT7 Room Ambient V1 Airflow into Heater V2 Airflow External Heater
Lint SampleIgnites
Power toHeater Removed
T2
T3
T1
T4
Figure 57. Thermocouple Data for Sample s5-8
In the last three tests, the high-limit thermostat was connected in series with the heatingelement. In the test for sample s5-11, the power was applied instantaneously to the heatingelement, and the sample smoldered until the high-limit thermostat opened and disconnectedpower to the heating element. For samples s5-12 and s5-13, the intake airflow into the heater

US CONSUMER PRODUCT SAFETY COMMISSIONFINAL REPORT ON ELECTRIC CLOTHES DRYERS AND LINT IGNITION CHARACTERISTICS
May 2003
79
was 300 and 200 sfpm, respectively. The samples smoldered until the high-limit thermostatopened and disconnected power to the heating element.
2.4.3.2 Side of the Heater Housing
Twenty-two tests were conducted with samples placed at three different locations (C, D,and E) on one side of the heater housing. All the samples were held in place with a fingerprobe. Three of the tests were conducted using lint samples obtained from a consumer’s dryerand are labeled as “hl” in Tables 10 and 11 below.
Table 9 provides a list of the lint ignition tests that were conducted at location C on theside of the heater housing. The high-limit thermostat was bypassed in all tests conducted atlocation C. The lint samples used measured approximately 2 x 2 x ¼ inches and weighedapproximately 0.30 grams. The samples were 100% cotton lint taken from the lint screencollected during Task 3 testing. The table includes the weights of the lint samples tested, testconditions, and the observed results.
Table 9. Testing on the Side of the Heater Housing at Location C
Location Number Weight(grams)
Power IntakeAirflow(sfpm)
OutsideAirflow(sfpm)
High-LimitThermostat
Result
C s2-7 0.32 instant 650 Ä0@400s
40 bypassed ignited
C s5-2 0.32 instant 0 40 bypassed smolderC s5-3 0.32 instant 650 Ä
0@400s40 bypassed smolder
C s5-4 0.30 instant 650 Ä0@400s
40 bypassed smolder
Four samples were tested at location C. Three of the samples (s5-2, s5-3 and s5-4)smoldered, and one (s2-7) ignited.
Lint sample s2-7 was tested at location C, as shown in Figure 58. The T3 thermocouplewas placed above the sample as an indicator of ignition. Figure 59 graphs the temperaturesand airflow obtained during the test. Sample s2-7 was tested with 650 sfpm airflow (V1) initiallythrough the heater box. At 400 seconds, the blower for the V1 airflow was stopped, and thetemperature inside the heater rose rapidly, as expected. The sample ignited approximately 90seconds after the blower was stopped.
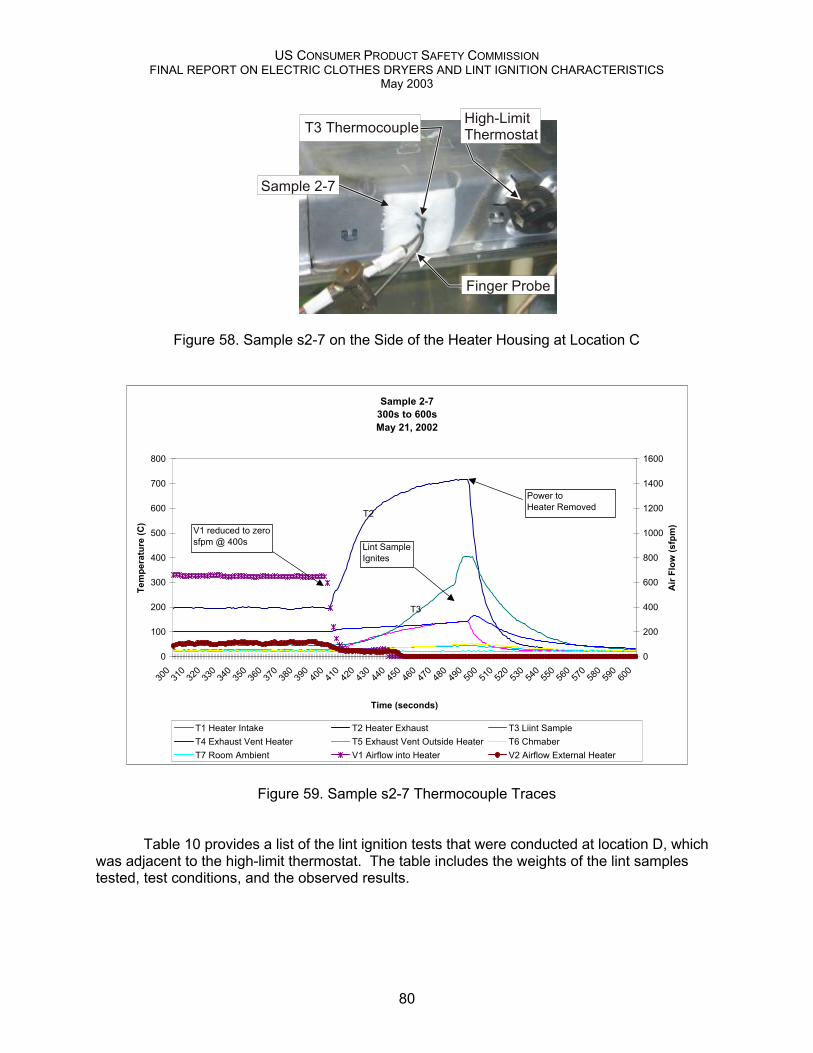
US CONSUMER PRODUCT SAFETY COMMISSIONFINAL REPORT ON ELECTRIC CLOTHES DRYERS AND LINT IGNITION CHARACTERISTICS
May 2003
80
High-LimitThermostat
Sample 2-7
T3 Thermocouple
Finger Probe
Figure 58. Sample s2-7 on the Side of the Heater Housing at Location C
Sample 2-7300s to 600sMay 21, 2002
0
100
200
300
400
500
600
700
800
300
310
320
330
340
350
360
370
380
390
400
410
420
430
440
450
460
470
480
490
500
510
520
530
540
550
560
570
580
590
600
Time (seconds)
Tem
pera
ture
(C)
0
200
400
600
800
1000
1200
1400
1600
Air
Flow
(sfp
m)
T1 Heater Intake T2 Heater Exhaust T3 Liint SampleT4 Exhaust Vent Heater T5 Exhaust Vent Outside Heater T6 ChmaberT7 Room Ambient V1 Airflow into Heater V2 Airflow External Heater
T2
T3
Lint SampleIgnites
Power toHeater Removed
V1 reduced to zero sfpm @ 400s
Figure 59. Sample s2-7 Thermocouple Traces
Table 10 provides a list of the lint ignition tests that were conducted at location D, whichwas adjacent to the high-limit thermostat. The table includes the weights of the lint samplestested, test conditions, and the observed results.

US CONSUMER PRODUCT SAFETY COMMISSIONFINAL REPORT ON ELECTRIC CLOTHES DRYERS AND LINT IGNITION CHARACTERISTICS
May 2003
81
Table 10. Testing on Top of the Heater Housing at Location D
Location Number Weight(grams)
Power IntakeAirflow(sfpm)
OutsideAirflow(sfpm)
High-LimitThermostat
Result
D s1-5 0.30 instant 0 43 bypassed ignitedD s2-1 0.35 instant 650,
0@500s43 series charred
D s2-1f 0.35 instant 0 43 bypassed smolderD s2-2 0.35 instant 0 43 bypassed smolderD hl1-1* 0.36 instant 0 43 bypassed smolderD s5-5 0.31 instant 0 40 bypassed smolder
* Consumer lint
Six lint samples were tested at Location D, as shown in Figure 60. The samples wereheld in place using a single finger probe. The T3 thermocouple was placed on the lint sampleas an indicator of lint ignition. Four of the samples smoldered, one charred, and one ignited.
Sample
T3 Thermocouple
Finger Probe
High-LimitThermostat
Figure 60. Sample s2-2 Tested at Location D
In five of the tests, including one using lint material from a consumer’s home, the high-limit thermostat was bypassed, and there was no airflow through the heater box. Four of thetests resulted in smoldering of the lint sample (s2-1f, s2-2, hl1-1, and s5-5), and in one test, thesample ignited (s1-5).
In a sixth test with the high limit thermostat in series with the heater, the lint samplecharred (s2-1). The initial airflow was at 650 sfpm; at 400 seconds, the airflow was dropped to 0sfpm. The sample charred until the high-limit thermostat opened and disconnected power to theheating element.
Table 11 below provides a list of the lint ignition tests that were conducted at location E,which was at a tab opening (punch-out) used to hold the heating element. Twelve tests wereconducted at this location. The table includes the weights of the lint samples tested, testconditions, and the observed results.

US CONSUMER PRODUCT SAFETY COMMISSIONFINAL REPORT ON ELECTRIC CLOTHES DRYERS AND LINT IGNITION CHARACTERISTICS
May 2003
82
Table 11. Testing on the Side of the Heater Housing at Location E
Location Number Weight(grams)
Power IntakeAirflow(sfpm)
OutsideAirflow(sfpm)
High-LimitThermostat
Result
E s1-6 0.35 instant 0 43 bypassed ignitedE s1-7 0.31 instant 800 40 bypassed charredE s1-7f 0.31 instant step
down40 bypassed smolder
E s2-3 0.36 instant 0 43 bypassed ignitedE hl1-2* 0.26 instant 0 43 bypassed ignitedE s2-4 0.37 instant 0 43 bypassed ignitedE hl1-3* 0.40 instant 650 Ä
0@400s43 bypassed smolder
E s2-5 0.38 instant 650 Ä0@400s
43 bypassed ignited
E s2-6 0.39 instant 650 Ä0@400s
43 bypassed ignited
E s3-1 0.35 instant 0 43 bypassed ignitedE s5-6 0.29 instant 0 40 bypassed ignitedE s5-7 0.39 instant 0 40 bypassed ignited
* Consumer lint
In seven of the tests, including one using consumer lint material, the airflow into theheater was 0 sfpm, and power to the heating element was applied instantaneously. All sevensamples ignited (s1-6, s2-3, hl1-2, s2-4, s3-1, s5-6 and s5-7).
Three tests were conducted with the airflow initially set at 650 sfpm; and at 400 seconds,airflow was dropped to 0 sfpm. Two samples (s2-5, s2-6) ignited, and the consumer lint sample(hl1-3) smoldered.
Figure 61 shows sample s2-6 before and after it ignited. Figure 62 shows thethermocouple traces for sample s2-6. The T3 thermocouple shows when the lint sample ignitedby the rapid increase in temperature. The sample ignited approximately 60 seconds after theblower was turned off.
Sample 2-6 Sample2-6
Before Ignition
Figure 61. Sample s2-6 Tested at Location E
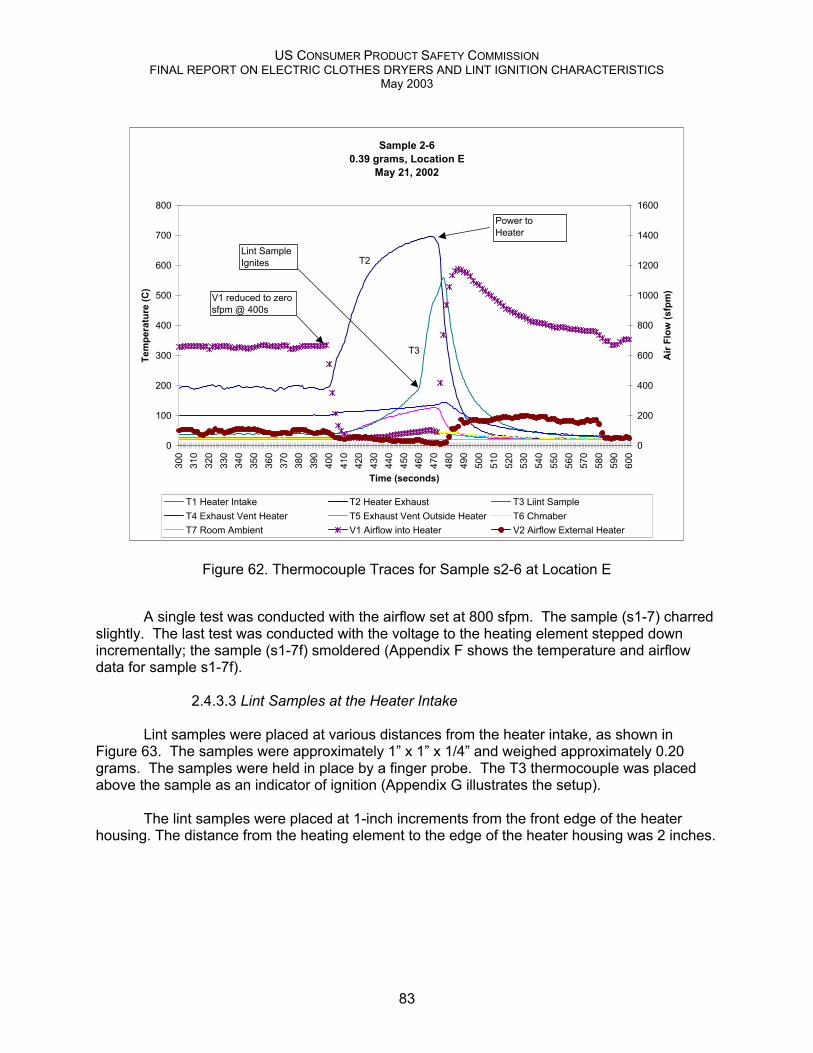
US CONSUMER PRODUCT SAFETY COMMISSIONFINAL REPORT ON ELECTRIC CLOTHES DRYERS AND LINT IGNITION CHARACTERISTICS
May 2003
83
Sample 2-60.39 grams, Location E
May 21, 2002
0
100
200
300
400
500
600
700
800
300
310
320
330
340
350
360
370
380
390
400
410
420
430
440
450
460
470
480
490
500
510
520
530
540
550
560
570
580
590
600
Time (seconds)
Tem
pera
ture
(C)
0
200
400
600
800
1000
1200
1400
1600
Air
Flow
(sfp
m)
T1 Heater Intake T2 Heater Exhaust T3 Liint SampleT4 Exhaust Vent Heater T5 Exhaust Vent Outside Heater T6 ChmaberT7 Room Ambient V1 Airflow into Heater V2 Airflow External Heater
T2
T3
Lint SampleIgnites
Power toHeater Removed
V1 reduced to zero sfpm @ 400s
Figure 62. Thermocouple Traces for Sample s2-6 at Location E
A single test was conducted with the airflow set at 800 sfpm. The sample (s1-7) charredslightly. The last test was conducted with the voltage to the heating element stepped downincrementally; the sample (s1-7f) smoldered (Appendix F shows the temperature and airflowdata for sample s1-7f).
2.4.3.3 Lint Samples at the Heater Intake
Lint samples were placed at various distances from the heater intake, as shown inFigure 63. The samples were approximately 1” x 1” x 1/4” and weighed approximately 0.20grams. The samples were held in place by a finger probe. The T3 thermocouple was placedabove the sample as an indicator of ignition (Appendix G illustrates the setup).
The lint samples were placed at 1-inch increments from the front edge of the heaterhousing. The distance from the heating element to the edge of the heater housing was 2 inches.

US CONSUMER PRODUCT SAFETY COMMISSIONFINAL REPORT ON ELECTRIC CLOTHES DRYERS AND LINT IGNITION CHARACTERISTICS
May 2003
84
Lint Sample
T3 Thermocouple
Finger Probe
Figure 63. Lint Sample at Heater Intake
An infrared camera was positioned to view the lint samples, as shown in Figure 64, andwas used to capture the temperature of the lint during the test. Infrared data was not capturedfor all of the lint samples tested.
IR Camera
Video
Heater Box
Cooling Fan
Figure 64. Infrared Camera Setup

US CONSUMER PRODUCT SAFETY COMMISSIONFINAL REPORT ON ELECTRIC CLOTHES DRYERS AND LINT IGNITION CHARACTERISTICS
May 2003
85
For the following test series, the airflow outside the heater boxes for the different dryerdesigns measured between 0 and 43 sfpm depending on whether the exhaust vent was blockedor unblocked. The airflow over the heater box/housing was set at approximately 43 sfpm tosimulate a slight airflow caused by the drum rotating and intake into the heater.
The first series of tests was conducted with no airflow through the heater box and thehigh-limit thermostat bypassed. In this series of tests, the lint samples ignited at a distanceranging from 3 to 4 inches from the housing edge.
A second series of tests was conducted similar to the first set, except that the high-limitthermostat was connected in series with the heating element. The samples ignited at a distancebetween 1 to 2 inches from the housing edge.
A third series of tests was conducted similar to the second series but with airflow throughthe heater box. The lint samples were fixed at a distance of one inch from the heater edge.The samples ignited when the airflow at the heater intake was between 300 and 400 sfpm.
A single test was conducted with a lint sample placed 1-inch from the edge of the heaterhousing, the high-limit thermostat bypassed, and the airflow through the heater box set at 400sfpm. The lint sample ignited.
Table 12 lists the tests conducted with lint samples at the heater intake. The list ispresented in chronological order (the order in which the tests were conducted). The distance isthe number of inches from the heater housing edge to the front face of the sample. The columnlabeled High-Limit Thermostat indicates whether the thermostat was connected in series withthe heating element or not (“yes” means the thermostat was connected in series; “no” meansthe thermostat was bypassed.)

US CONSUMER PRODUCT SAFETY COMMISSIONFINAL REPORT ON ELECTRIC CLOTHES DRYERS AND LINT IGNITION CHARACTERISTICS
May 2003
86
Table 12. Lint Samples at the Heater Intake
LintSample #
Weight(grams)
Distance(inches)
High-LimitThermostat
Airflow(sfpm)
Result
s3-2 0.19 2 no 0 ignitions3-3 0.20 3 no 0 igniteds3-4 0.18 4 no 0 no ignitions3-5 0.19 2 no 0 igniteds3-6 0.18 2 no 0 igniteds3-7 0.19 2 no 0 igniteds3-8 0.18 2 no 0 igniteds3-9 0.19 3 no 0 igniteds3-10 0.16 3 no 0 igniteds3-11 0.21 4 no 0 no ignitions3-12 0.16 4 no 0 no ignition
s3-13* 0.19 2 yes 0 igniteds3-14 0.16 2 yes 0 no ignitions3-15 0.19 0 yes 0 igniteds3-16 0.18 1 yes 0 igniteds3-17 0.17 1 yes 0 igniteds3-18 0.18 2 yes 0 no ignition
s3-19 0.19 1 yes 200 igniteds3-20 0.21 1 yes 400 no ignitions1-8 0.21 1 yes 300 igniteds1-9 0.20 0 yes 400 no ignition
s1-10 0.21 1 no 400 ignited* The high-limit failed; s3-13 is later discussed in the Discussion Section, Task 4
Figure 65 shows a sequence of images from the infrared camera and a video camera forSample s3-10. The figure shows the lint sample began to ignite at approximately 452° C.Figure 66 shows the thermocouple data for sample s3-10. The sample ignited 1 minute 11seconds into the test. The sample ignited approximately 40 seconds after the heater wasenergized.

US CONSUMER PRODUCT SAFETY COMMISSIONFINAL REPORT ON ELECTRIC CLOTHES DRYERS AND LINT IGNITION CHARACTERISTICS
May 2003
87
Smoldering
Flames
00:50
01:11
01:13
Sample 3-10 Sample 3-10
Sample 3-10 Sample 3-10
Ignition
Sample 3-10 Sample 3-10
Figure 65. Sample s3-10, Video Camera and Infrared Camera

US CONSUMER PRODUCT SAFETY COMMISSIONFINAL REPORT ON ELECTRIC CLOTHES DRYERS AND LINT IGNITION CHARACTERISTICS
May 2003
88
Sample 3-10weight 0.16g
sample 3" from edgeJune 4, 2002
0
100
200
300
400
500
600
7000 10 20 30 40 50 60 70 80 90 100
110
120
130
140
150
160
170
180
190
200
210
220
230
240
250
260
270
280
290
300
Time (seconds)
Tem
pera
ture
(C)
0
200
400
600
800
1000
1200
1400
1600
Air
Flow
(sfp
m)
T1 Heater Intake T2 Heater Exhaust T3 Lint SampleT4 Exhaust Vent Heater T5 Exhaust Vent Outside Heater T6 ChamberT7 Room Ambient V1 Airflow into Heater V2 Airflow External Heater
Ignition
Power to Heater turned off
T2
T3
T4
T1
Figure 66. Sample s3-10 – Thermocouple and Airflow Data

US CONSUMER PRODUCT SAFETY COMMISSIONFINAL REPORT ON ELECTRIC CLOTHES DRYERS AND LINT IGNITION CHARACTERISTICS
May 2003
89
2.4.4 Phase II – Ignition Characteristics of Lint Ingested into the Heater Box
This phase of testing was divided into two parts. Part 1 of the tests involved observationof the heater exhaust as the lint samples of varying weights and sizes were ingested into theheater box. Part 2 was to observe whether target materials downstream of the heater exhaustcould be ignited by embers as they exited the heater exhaust.
The test setup was designed to allow the airflow into the heater intake to carry lintsamples past the heating element and exhaust any embers through the ducts. To observe theheater exhaust, a 28-inch section of the metal duct from Phase I tests was replaced with a 4”diameter high-temperature glass tube, as shown in Figure 67. (The actual dimensions for thetest setup can be found in Appendix H.)
Heater
Glass Tube
Airflow Direction
View Ports
Figure 67. Setup with Glass Tube
2.4.4.1 Part 1 – Lint Samples Ingested by the Heater Box
For these tests, different weights and sizes of lint were drawn into the heater box. Sixseries of tests were completed:
1. The first series included 5 samples weighing between 0.24g and 0.77g.2. The second series consisted of 8 samples weighing between 0.04g and 0.18g.3. The third series consisted of 5 samples weighing between 0.14g and 0.48g.4. The fourth series consisted of 10 samples at 0.10 ±0.10 grams.5. The fifth series consisted of 10 samples at 0.20 ±0.10 grams.6. The sixth series consisted of 10 samples at 0.30 ±0.10 grams.

US CONSUMER PRODUCT SAFETY COMMISSIONFINAL REPORT ON ELECTRIC CLOTHES DRYERS AND LINT IGNITION CHARACTERISTICS
May 2003
90
Table 13 below lists the six series of tests and the lint sample weights used in each.
Table 13. Lint Samples for Task 4 - Phase II Testing(Observation of Samples Ingested into Heater Box)
SeriesNumber
Sample Number Weight(grams)
1 0.242 0.373 0.384 0.64
1
5 0.771 0.182 0.183 0.044 0.105 0.076 0.067 0.11
2
8 0.081 0.482 0.433 0.274 0.25
3
5 0.144 1 to 10 0.105 1 to 10 0.206 1 to 10 0.30
For all tests conducted, embers were visible exiting the heater box. The embers variedin size and number. It was observed that larger lint samples produced more and/or largerembers than smaller lint samples did, but two lint samples of the same size did not produce thesame ember size and/or number of embers. The number and size of the embers in the heaterexhaust were dependent on how and where the lint samples contacted the heating element.For example, if the lint sample became trapped on the heating element, smaller embers wereproduced in the exhaust as the sample burned. However, if the sample contacted the heatingelement, ignited, and continued through the heater box, larger embers were observed exitingthe heater exhaust.
2.4.4.2 Part 2 – Ignition of Target Materials Downstream from the Heater Exhaust
Four series of tests were conducted to observe whether target materials downstream ofthe heater exhaust could be ignited by embers as they exited the heater exhaust. Targetmaterials were placed inside the glass tube, as shown in Figure 68. After the target materialwas placed in the glass tube, lint samples were drawn into the heater box approximately every 3

US CONSUMER PRODUCT SAFETY COMMISSIONFINAL REPORT ON ELECTRIC CLOTHES DRYERS AND LINT IGNITION CHARACTERISTICS
May 2003
91
to 4 seconds. The airflow was set at 800 sfpm at the heater intake. This airflow velocitysimulated the airflow inside a dryer near the end of the drying cycle (when the dryer would havea full lint screen). For each of the four tests, the lint samples drawn into the heater box consistedof ten samples of 0.10g each, then 10 samples of 0.20g each and, finally, ten samples of 0.30g.
Target Material
Glass Tube
Clips to securematerial
Airflow Direction
Test 1
Figure 68. Setup with Target Material in the Glass Tube
Table 14 outlines the types, sizes and weights of the target materials used for each testseries. The target samples were either sheets of 100% cotton lint or cotton terry towel material.The lint target samples weighed between 2 and 5 grams and measured approximately 6 x 10inches. The lint target material varied in thickness from 1/8 to ½ inch. The lint target materialswere collected during Task 3 testing. The cotton terry towel material was a section cut from atowel used in Task 3 testing; the section measured 7 ½ x 10 inches and weighed 35.2 grams.
Table 14. Target Materials for Task 4 - Phase II Testing(Ignition of Target Materials by Exhaust Embers)
Test Number Target Material Size (inches) Weight (grams)1 Lint Sheet 10 x 6 ½ x ½ to ˜ 5.082 Lint Sheet 7 x 5 ½ x ½ x ˜ 3.043 Lint Sheet 7 ½ x 6 ¼ to ˜ 2.084 Cotton Towel 7 ½ x 10 35.20

US CONSUMER PRODUCT SAFETY COMMISSIONFINAL REPORT ON ELECTRIC CLOTHES DRYERS AND LINT IGNITION CHARACTERISTICS
May 2003
92
In all four tests, the target material ignited:
1. In Test 1, the target material ignited on the fifth lint sample of 0.10 g.2. In Test 2, the target material ignited on the sixth sample of 0.20 g.3. In Test 3, the target sample ignited on the tenth sample of 0.10 g.4. In Test 4, the target material ignited on the eighth sample of 0.30 g.
Figure 69 shows the target sample igniting during Test 1. The sample was consumed inless than 6 seconds and produced additional embers downstream. The exhaust temperature,T4 thermocouple, increased to over 260° C in less than 5 seconds, as shown in Figure 70.(Test data for Tests 2, 3, and 4 are contained in Appendix H. Video clips of the lint sampletesting are included in Appendix J.)
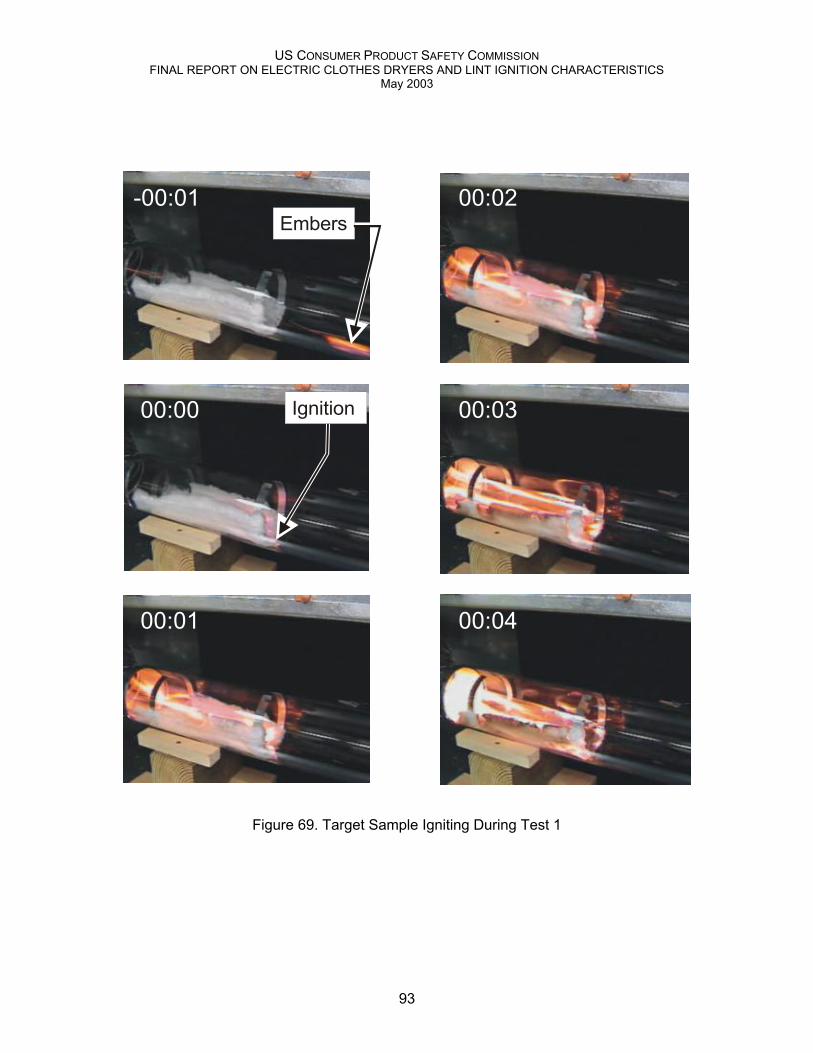
US CONSUMER PRODUCT SAFETY COMMISSIONFINAL REPORT ON ELECTRIC CLOTHES DRYERS AND LINT IGNITION CHARACTERISTICS
May 2003
93
Embers
Ignition00:00
-00:01
00:01
00:02
00:03
00:04
Figure 69. Target Sample Igniting During Test 1

US CONSUMER PRODUCT SAFETY COMMISSIONFINAL REPORT ON ELECTRIC CLOTHES DRYERS AND LINT IGNITION CHARACTERISTICS
May 2003
94
Test 1Target Material - Lint - weight 5 grams
June 14, 2002
0
50
100
150
200
250
300
350
4000 10 20 30 40 50 60 70 80 90 100
110
120
130
140
150
160
170
180
190
200
210
220
230
240
250
260
270
280
290
300
Time (seconds)
Tem
pera
ture
(C)
0
200
400
600
800
1000
1200
1400
1600
Air
Flow
(sfp
m)
T1 Heater Intake T2 Heater Exhaust T3 Glass Tube InternalT4 Exhaust Vent Heater T5 Exhaust Vent Outside Heater T6 ChamberT7 Room Ambient V1 Airflow into Heater V2 Airflow External Heater
Ignition
Heater Turned Off
T4
Figure 70. Test 1 – Thermocouple and Airflow Measurements Task 4- Test 1(Ignition of Target Materials by Exhaust Embers)

US CONSUMER PRODUCT SAFETY COMMISSIONFINAL REPORT ON ELECTRIC CLOTHES DRYERS AND LINT IGNITION CHARACTERISTICS
May 2003
95
3.0 DISCUSSIONThis section of the report presents a discussion of the tests and the test results reported in
Section 2.0 Description of Test and Test Results for each of the four project tasks. Eachdiscussion section is supported by its corresponding section in Section 2.0, unless otherwisespecified.
3.1 Task 1: Inspect and Record Dryer Design
Four clothes dryers (Dryer Designs A, B, C and D) were used for testing. As part ofeach dryer’s exhaust system, there was a 4-inch diameter male duct, a short length of whichprotruded outside the dryer housing. This short length of duct was slightly tapered and wasintended for connection to external venting (the external vent slid over the tapered male duct).The external vent material used for the clothes dryers was 4-inch diameter rigid metal ducting,as recommended in the manufacturers’ installation instructions.
The interface of the male duct and the external venting was sealed and/or secured witha 4-inch hose clamp. The hose clamp nut was tightened by hand with a nut driver until it couldnot be tightened any further. The amount of torque applied to the hose clamp nut had littleeffect on actually tightening the connection between the male duct and the external vent. Twofactors contributed to the poor seal:
1. The length of the dryer’s male duct (which varied slightly among the designs) wasinsufficient to allow the external vent to slide far enough onto the duct to provide asecure pressure fit.
2. Both mating pieces were rigid; thus, the external venting could not compress aroundthe dryer’s male duct when the hose clamp was tightened.
(Additional comments regarding dryer designs are included in the Discussion section ofTask 3: Monitor Lint Distribution.)
3.2 Task 2: Document Dryer Operating Characteristics
Testing showed that each dryer design reacts slightly differently when the exhaust ventis unblocked, partially blocked, or 100% blocked. The data for temperature and airflow variedslightly with each dryer, but certain characteristics were similar for all the dryer designs tested.
3.2.1 Normal Operation (Unblocked Exhaust Vent)
When the dryers were tested with an unblocked exhaust vent, similar temperatures – theintake air temperature into the heater, the heater housing temperature, the intake airtemperature into the blower, and the exhaust vent temperature – were measured among alldryer designs. Figures 71 through 75 show comparisons of temperatures measured for each ofthe dryer designs when tested with a wet load. Dryer Design D used only 7 towels so that thedryer would not operate in the high-limit cycling mode. (Additional graphs demonstrating dryerdesign comparisons can be found in Appendix I).

US CONSUMER PRODUCT SAFETY COMMISSIONFINAL REPORT ON ELECTRIC CLOTHES DRYERS AND LINT IGNITION CHARACTERISTICS
May 2003
96
Figure 71 shows that the heater intake temperature (T1) was higher for Dryer Design Cthan for other dryer designs, and it reached a maximum of 75°C. Dryer Designs A and Cexhibited similar maximum temperatures before the primary thermostat opened. Dryer DesignB had a slightly lower maximum temperature. Since the load in Dryer Design D began riding thedrum after approximately 1900 seconds, the airflow through the tumbler was less restrictedcausing the primary thermostat to reach its opening set point sooner.
Figure 72 shows the heater housing temperatures did not extend much higher than120°C for all the dryer designs tested. The housing temperatures for Dryer Designs A and Dwere similar – until the load in Dryer Design D stopped tumbling after approximately 1900seconds. The heater housing in Dryer Design B had a significant number of punch-outs on oneside, which were used to mount the heating element inside the heater housing. This appearedto allow the heater housing to operate at a slightly cooler temperature than either Dryer DesignA or D. Dryer Design C had louvers on one side of the heater housing; this allowed the heaterhousing to operate at an even lower temperature – approximately 66°C, as shown in the graph.
Figure 73 shows the intake temperature into the blower for all the dryer designs tested.The temperatures are very similar for all the dryers, as shown in the graph. The intaketemperature into the blower did not extend much higher than 100°C for all the dryer designstested. Dryer Design A and D had a slightly higher operating curve than the other dryers. Theload in Dryer Design D began to stop tumbling at approximately 1900 seconds after the dryerwas started, as shown in the graph.
Figure 74 shows the exhaust vent temperatures for all the dryer designs tested. Thetemperatures are very similar for all the dryers, as shown in the graph. The exhaust ventingtemperature did not extend much higher than 70°C for all the dryer designs tested. The exhaustvent temperatures for Dryer Design A were slightly higher than those for the other dryers.
Figure 75 shows the maximum temperatures measured at each thermocouple locationfor each dryer design. All the dryers had similar temperatures at each thermocouple location,except at the heater exhaust and tumbler intake. Design characteristics had a contributingfactor on temperatures at these locations. Dryer Design C had an increase in temperature fromthe heater exhaust to the tumbler intake, which was also observed during testing in Task 2. Thelouvers on the side of the heater housing may have contributed to the higher temperaturereadings at T6, but it has not yet been determined why this actually occurred.

US CONSUMER PRODUCT SAFETY COMMISSIONFINAL REPORT ON ELECTRIC CLOTHES DRYERS AND LINT IGNITION CHARACTERISTICS
May 2003
97
T1 Heater Intake TemperatureDryer Design Comparison
Wet Load
0
10
20
30
40
50
60
70
80
0
159
318
477
636
795
954
1113
1272
1431
1590
1749
1908
2067
2226
2385
2544
2703
2862
3021
3180
3339
3498
3657
3816
3975
Time (seconds)
Tem
pera
ture
(C)
Design A Design B Design C Design D
A
B
C
D
Figure 71. Dryer Design Comparison for T1, Heater Intake
T3 Heater Housing TemperatureDryer Design Comparison
Wet Load
0
20
40
60
80
100
120
140
160
0
161
322
483
644
805
966
1127
1288
1449
1610
1771
1932
2093
2254
2415
2576
2737
2898
3059
3220
3381
3542
3703
3864
Time (seconds)
Tem
pera
ture
(C)
Design A Design B Design C Design D
A
B
C
D
Figure 72. Dryer Design Comparison for T3, Heater Housing
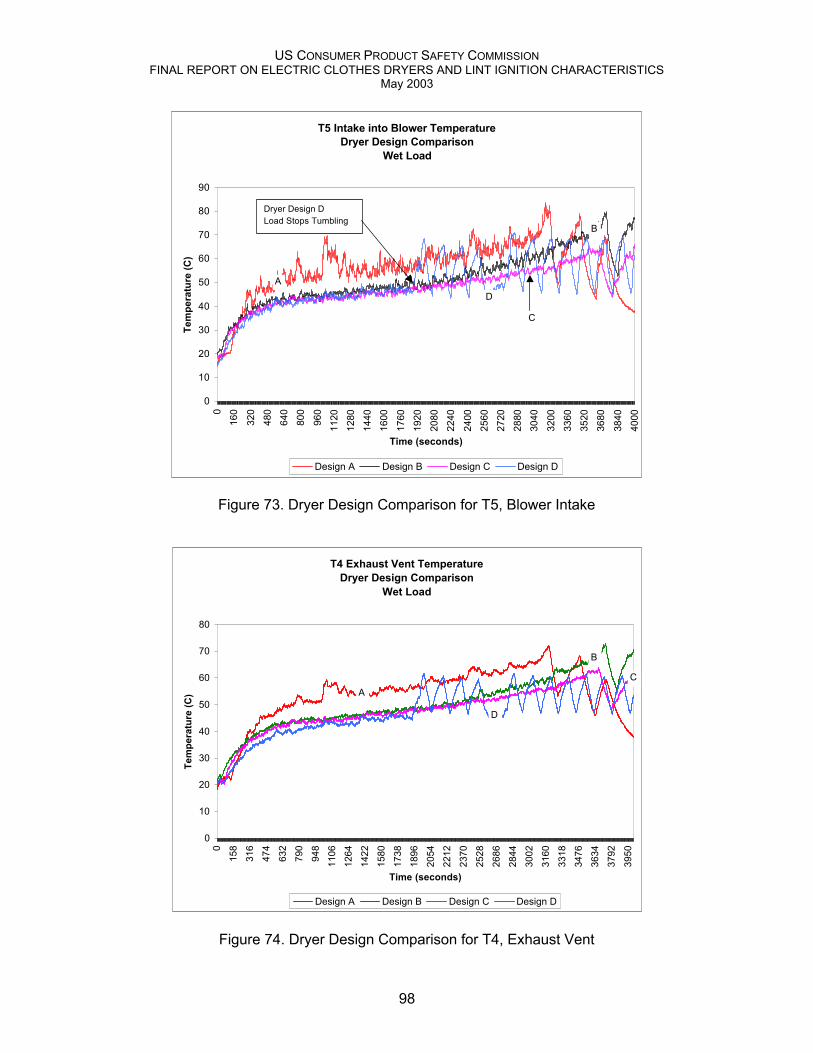
US CONSUMER PRODUCT SAFETY COMMISSIONFINAL REPORT ON ELECTRIC CLOTHES DRYERS AND LINT IGNITION CHARACTERISTICS
May 2003
98
T5 Intake into Blower TemperatureDryer Design Comparison
Wet Load
0
10
20
30
40
50
60
70
80
90
0
160
320
480
640
800
960
1120
1280
1440
1600
1760
1920
2080
2240
2400
2560
2720
2880
3040
3200
3360
3520
3680
3840
4000
Time (seconds)
Tem
pera
ture
(C)
Design A Design B Design C Design D
A
B
C
D
Dryer Design DLoad Stops Tumbling
Figure 73. Dryer Design Comparison for T5, Blower Intake
T4 Exhaust Vent TemperatureDryer Design Comparison
Wet Load
0
10
20
30
40
50
60
70
80
0
158
316
474
632
790
948
1106
1264
1422
1580
1738
1896
2054
2212
2370
2528
2686
2844
3002
3160
3318
3476
3634
3792
3950
Time (seconds)
Tem
pera
ture
(C)
Design A Design B Design C Design D
A
B
C
D
Figure 74. Dryer Design Comparison for T4, Exhaust Vent

US CONSUMER PRODUCT SAFETY COMMISSIONFINAL REPORT ON ELECTRIC CLOTHES DRYERS AND LINT IGNITION CHARACTERISTICS
May 2003
99
Dryer Design ComparisonMaximum Temperature at Test Locations
Wet Load
0
50
100
150
200
250
300
350
Heater Intake HeaterExhaust
HeaterHousing
Dryer Vent Intake toBlower
Intake intothe Tumbler
RoomTemperature
Location
Tem
pera
ture
(C)
Design A Design B Design C Design D
Analog SignalNot TemperatureA B C D
Figure 75. Maximum Temperatures Measured at Location
3.2.2 Partially-Blocked and 100%-Blocked Conditions
Each dryer design reacted slightly differently when the exhaust vent was partiallyblocked and/or 100% blocked. The responses for each dryer design were discussed in Task 2of the Testing section. The discussion below examines the general characteristics of a dryer byanalyzing the data without compensating for variances in dryer designs. The data presented inthis section are in general terms and do not represent a specific dryer tested.
The data was generated from Dryer Design A/dry load, Dryer Design B/wet load, DryerDesign C/wet load, and Dryer Design D/no load. Dryer Design A/dry load was used since theoperating temperatures for a dry load were similar to a wet load, although the time scale wasdifferent. Dryer Design D/no load was used to avoid using data in which the dryer quickly beganoperating in the high-limit cycle mode for a full load or in which operation was unpredictable (theload stopped tumbling).
The maximum temperatures measured for each dryer for each test condition (blockedexhaust vent, partially blocked vent, or unblocked vent) were extracted from each data set. Thetemperatures were then categorized as highest, lowest, and average for each set. Figures 76through 81 show comparisons of maximum temperatures measured at each test location underunblocked conditions, the range of blocked conditions, and with the primary thermostatbypassed.

US CONSUMER PRODUCT SAFETY COMMISSIONFINAL REPORT ON ELECTRIC CLOTHES DRYERS AND LINT IGNITION CHARACTERISTICS
May 2003
100
Figure 76 shows the range of highest to lowest maximum intake air temperatures at theheater for each test condition. The temperatures did not change significantly up to a 50%blockage of the exhaust vent. At 75% blockage, the temperatures (highest, average, andlowest) increased significantly, with the highest temperature measuring over 350°C. Theaverage maximum temperature was slightly over 150°C with a 75% blockage. The maximumtemperatures when the exhaust vent was 100% blocked were similar to the 75% blockedcondition. The maximum temperatures with the primary thermostat bypassed were similar tothe temperatures when the exhaust vent was 50% blocked.
Figure 77 shows the range of highest to lowest maximum heater exhaust temperaturesfor each test condition. The temperatures did not change significantly from the unblockedexhaust vent condition to a 25% blocked exhaust vent. As the exhaust vent was blockedbeyond 25%, there was a slow increase in temperatures. The highest maximum temperaturemeasured nearly 600°C for the 100% blocked condition. The maximum temperatures with theprimary thermostat bypassed were similar to the temperatures when the exhaust vent was 75%blocked.
Figure 78 shows the range of highest to lowest maximum heater housing temperaturesfor each test condition. The temperatures generally showed a slight increase from theunblocked exhaust vent condition to a 50% blocked exhaust vent. When the vent was 75%blocked, the maximum temperatures increased more rapidly. When the exhaust vent was 100%blocked, the maximum temperatures were similar to the temperatures reached for a 75%blocked vent. The highest maximum temperature measured between 200°C and 250°C for the75% and 100% blocked conditions. The maximum temperatures with the primary thermostatbypassed were similar to those for a 75% blocked exhaust vent.
Figure 79 shows the range of highest to lowest maximum dryer exhaust venttemperatures for each test condition. The temperatures did not change significantly from theunblocked exhaust vent condition to a 50% blocked exhaust vent. Beyond a 50% blockage, themaximum temperatures measured began to drop rapidly. The highest maximum temperaturemeasured dropped from approximately 70°C to 30°C. The maximum temperatures measuredwhen the primary thermostat was bypassed were much higher than those measured for any ofthe blocked or unblocked exhaust vent conditions. The highest maximum temperaturemeasured was slightly over 100°C.
Figure 80 shows the range of highest to lowest maximum temperatures at the intake intothe blower for each test condition. The temperature curves shown in this graph are similar tothose for the dryer exhaust vent (Figure 79), although the changes were not as dramatic.Another similarity between Figures 80 and 79 is that, when the primary thermostat wasbypassed, maximum temperatures were much higher than those measured for any of theblocked or unblocked exhaust vent conditions. The highest maximum temperature measuredwas slightly over 120°C.
Figure 81 shows the range of highest to lowest maximum temperatures at the intake intothe tumbler for each test condition. The temperature curves shown in this graph are similar tothose for the heater exhaust (Figure 77), except that the maximum temperature measured whenthe exhaust vent was fully blocked was lower – approximately 400°C. Another similaritybetween Figures 81 and 77 is that, when the primary thermostat was bypassed, maximumtemperatures were similar to those for the 75% blocked condition.

US CONSUMER PRODUCT SAFETY COMMISSIONFINAL REPORT ON ELECTRIC CLOTHES DRYERS AND LINT IGNITION CHARACTERISTICS
May 2003
101
All DryersIntake into the Heater
0
50
100
150
200
250
300
350
400
0% 25%
50%
75%
100%
Bypas
sed
Percent Blocked
Tem
pera
ture
C
maximumaverageminimum
Figure 76. Intake into the Heater
All DryersHeater Exhaust
0
100
200
300
400
500
600
700
0% 25%
50%
75%
100%
Bypas
sed
Percent Blocked
Tem
pera
ture
C
maximumaverageminimum
Figure 77. Heater Exhaust Temperature

US CONSUMER PRODUCT SAFETY COMMISSIONFINAL REPORT ON ELECTRIC CLOTHES DRYERS AND LINT IGNITION CHARACTERISTICS
May 2003
102
All DryersHeater Housing Temperature
0
50
100
150
200
250
0% 25%
50%
75%
100%
Bypas
sed
Percent Blocked
Tem
pera
ture
C
maximumaverageminimum
Figure 78. Heater Housing Temperature
All DryersExhaust Vent Temperature
0
20
40
60
80
100
120
0% 25%
50%
75%
100%
Bypas
sed
Percent Blocked
Tem
pera
ture
C
maximumaverageminimum
Figure 79. Exhaust Vent Temperature

US CONSUMER PRODUCT SAFETY COMMISSIONFINAL REPORT ON ELECTRIC CLOTHES DRYERS AND LINT IGNITION CHARACTERISTICS
May 2003
103
All DryersIntake into the Blower
0
20
40
60
80
100
120
140
0% 25%
50%
75%
100%
Bypas
sed
Percent Blocked
Tem
pera
ture
C
maximumaverageminimum
Figure 80. Intake into the Blower Temperature
All DryersHeated Air into the Tumbler
0
50
100
150
200
250
300
350
400
450
0% 25%
50%
75%
100%
Bypas
sed
Percent Blocked
Tem
pera
ture
C
maximumaverageminimum
Figure 81. Intake into the Tumbler Temperature
US CONSUMER PRODUCT SAFETY COMMISSIONFINAL REPORT ON ELECTRIC CLOTHES DRYERS AND LINT IGNITION CHARACTERISTICS
May 2003
104
Figure 82 shows the data from Figures 76 through 81 in an illustrated dryerconfiguration. The dryers’ main components are illustrated in a linear representation. Thefigure shows the maximum temperatures for all the dryer designs at each location for the rangeof unblocked and blocked exhaust vent conditions, as well as for when the primary thermostatwas bypassed.
The figure shows that there was a significant increase in maximum temperatures at theintake into the tumbler when the vent was 75% and 100% blocked. The air temperatures exitingthe tumbler and entering the exhaust vent decreased, as expected. For the unblocked, 25%blocked and 50% blocked exhaust vent conditions, the maximum temperatures did not show asignificant change. When the primary thermostat was bypassed, there was little change inmaximum temperatures at T1 (heater intake) and T3 (heater housing). There was an increasein the maximum temperatures after the heater exhaust and into the exhaust vent.
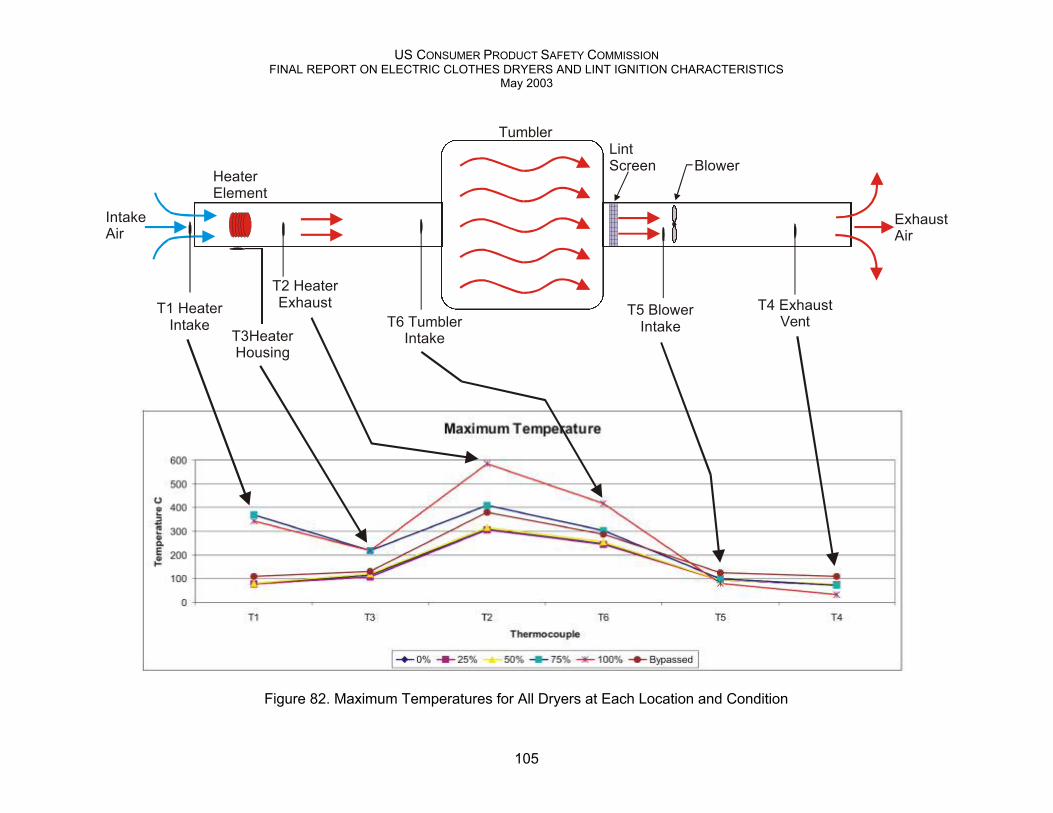
US CONSUMER PRODUCT SAFETY COMMISSIONFINAL REPORT ON ELECTRIC CLOTHES DRYERS AND LINT IGNITION CHARACTERISTICS
May 2003
105
T1 HeaterIntake
T3HeaterHousing
T2 HeaterExhaust
T6 TumblerIntake
T5 BlowerIntake
T4 ExhaustVent
BlowerLintScreen
Tumbler
HeaterElement
IntakeAir
ExhaustAir
Figure 82. Maximum Temperatures for All Dryers at Each Location and Condition
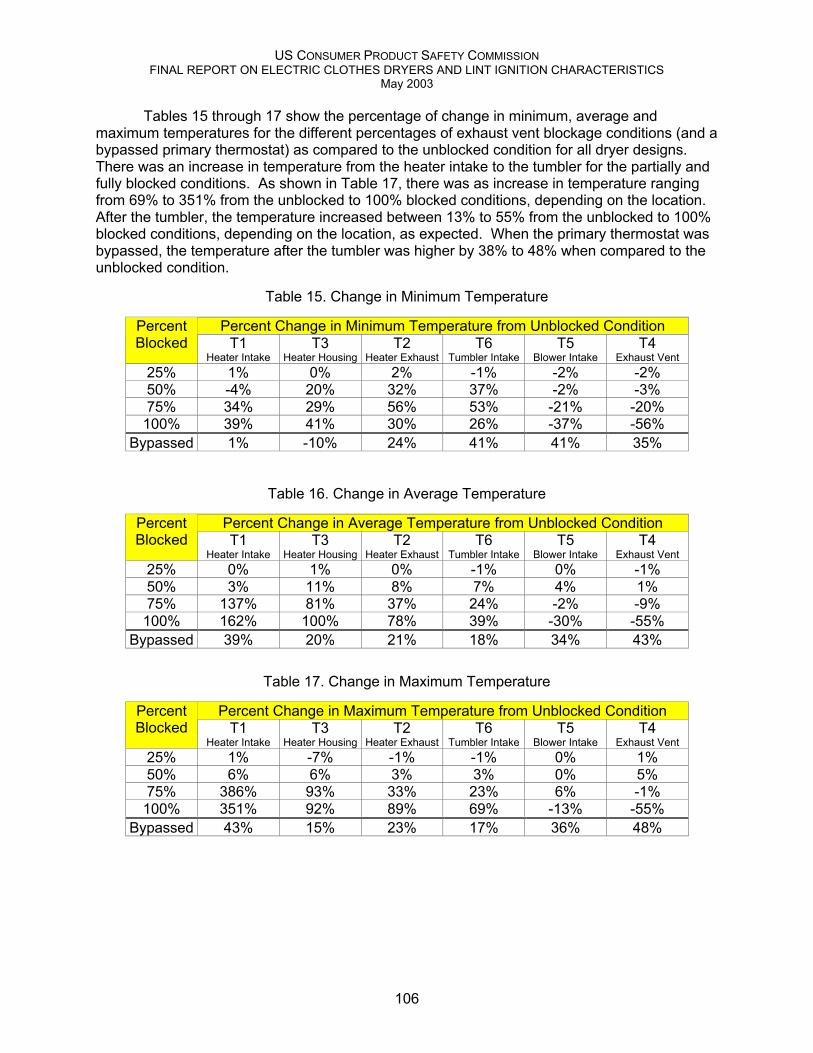
US CONSUMER PRODUCT SAFETY COMMISSIONFINAL REPORT ON ELECTRIC CLOTHES DRYERS AND LINT IGNITION CHARACTERISTICS
May 2003
106
Tables 15 through 17 show the percentage of change in minimum, average andmaximum temperatures for the different percentages of exhaust vent blockage conditions (and abypassed primary thermostat) as compared to the unblocked condition for all dryer designs.There was an increase in temperature from the heater intake to the tumbler for the partially andfully blocked conditions. As shown in Table 17, there was as increase in temperature rangingfrom 69% to 351% from the unblocked to 100% blocked conditions, depending on the location.After the tumbler, the temperature increased between 13% to 55% from the unblocked to 100%blocked conditions, depending on the location, as expected. When the primary thermostat wasbypassed, the temperature after the tumbler was higher by 38% to 48% when compared to theunblocked condition.
Table 15. Change in Minimum Temperature
Percent Change in Minimum Temperature from Unblocked ConditionPercentBlocked T1
Heater IntakeT3
Heater HousingT2
Heater ExhaustT6
Tumbler IntakeT5
Blower IntakeT4
Exhaust Vent25% 1% 0% 2% -1% -2% -2%50% -4% 20% 32% 37% -2% -3%75% 34% 29% 56% 53% -21% -20%100% 39% 41% 30% 26% -37% -56%
Bypassed 1% -10% 24% 41% 41% 35%
Table 16. Change in Average Temperature
Percent Change in Average Temperature from Unblocked ConditionPercentBlocked T1
Heater IntakeT3
Heater HousingT2
Heater ExhaustT6
Tumbler IntakeT5
Blower IntakeT4
Exhaust Vent25% 0% 1% 0% -1% 0% -1%50% 3% 11% 8% 7% 4% 1%75% 137% 81% 37% 24% -2% -9%100% 162% 100% 78% 39% -30% -55%
Bypassed 39% 20% 21% 18% 34% 43%
Table 17. Change in Maximum Temperature
Percent Change in Maximum Temperature from Unblocked ConditionPercentBlocked T1
Heater IntakeT3
Heater HousingT2
Heater ExhaustT6
Tumbler IntakeT5
Blower IntakeT4
Exhaust Vent25% 1% -7% -1% -1% 0% 1%50% 6% 6% 3% 3% 0% 5%75% 386% 93% 33% 23% 6% -1%100% 351% 92% 89% 69% -13% -55%
Bypassed 43% 15% 23% 17% 36% 48%
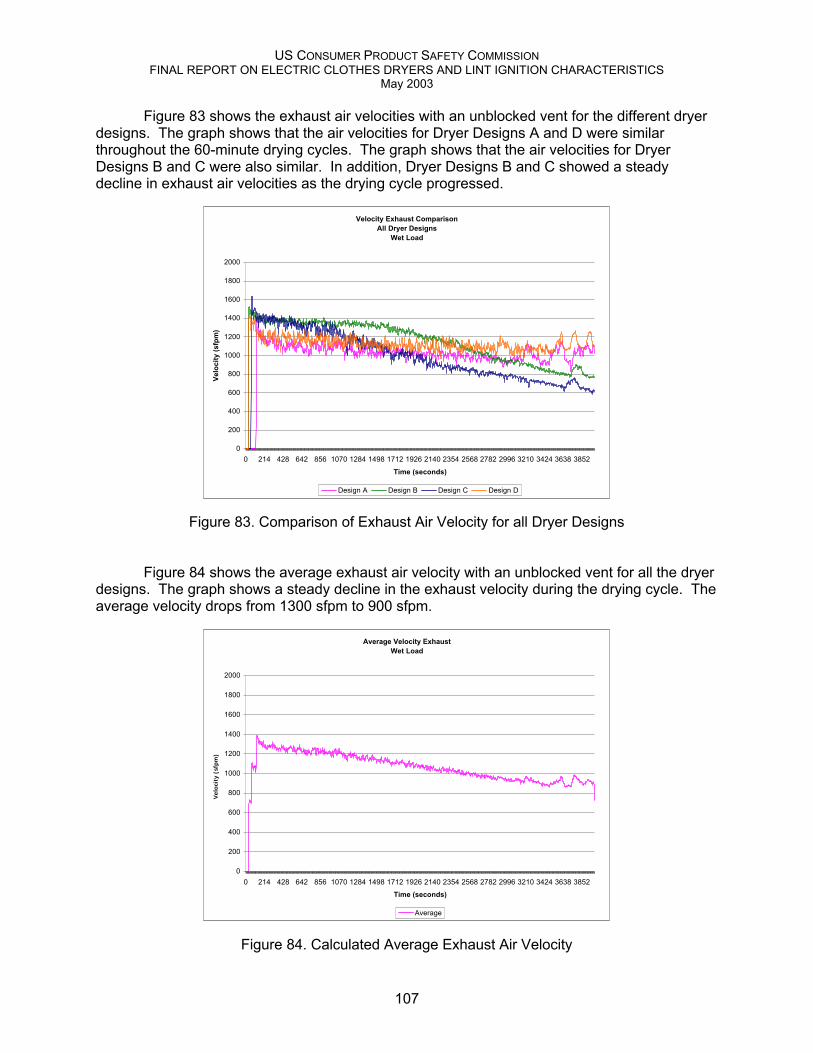
US CONSUMER PRODUCT SAFETY COMMISSIONFINAL REPORT ON ELECTRIC CLOTHES DRYERS AND LINT IGNITION CHARACTERISTICS
May 2003
107
Figure 83 shows the exhaust air velocities with an unblocked vent for the different dryerdesigns. The graph shows that the air velocities for Dryer Designs A and D were similarthroughout the 60-minute drying cycles. The graph shows that the air velocities for DryerDesigns B and C were also similar. In addition, Dryer Designs B and C showed a steadydecline in exhaust air velocities as the drying cycle progressed.
Velocity Exhaust ComparisonAll Dryer Designs
Wet Load
0
200
400
600
800
1000
1200
1400
1600
1800
2000
0 214 428 642 856 1070 1284 1498 1712 1926 2140 2354 2568 2782 2996 3210 3424 3638 3852
Time (seconds)
Velo
city
(sfp
m)
Design A Design B Design C Design D
Figure 83. Comparison of Exhaust Air Velocity for all Dryer Designs
Figure 84 shows the average exhaust air velocity with an unblocked vent for all the dryerdesigns. The graph shows a steady decline in the exhaust velocity during the drying cycle. Theaverage velocity drops from 1300 sfpm to 900 sfpm.
Average Velocity ExhaustWet Load
0
200
400
600
800
1000
1200
1400
1600
1800
2000
0 214 428 642 856 1070 1284 1498 1712 1926 2140 2354 2568 2782 2996 3210 3424 3638 3852
Time (seconds)
Vel
oci
ty (
sfp
m)
Average
Figure 84. Calculated Average Exhaust Air Velocity

US CONSUMER PRODUCT SAFETY COMMISSIONFINAL REPORT ON ELECTRIC CLOTHES DRYERS AND LINT IGNITION CHARACTERISTICS
May 2003
108
3.3 Task 3: Monitor Lint Distribution
Based on the test data and observations presented in Section 2.3, even when the lintfilter was cleaned after each use of the dryer, there was visible lint accumulation inside thechassis. This section further evaluates the mechanisms within dryers that may allow lint to leakinto the dryer structure. The areas of positive pressure in the airflow were the most likelycauses for lint leaking into the dryer chassis.
3.3.1 Dryer Design A at Positive Pressure
Examination of Dryer Design A showed that lint/air can leak through a sealed joint in theblower housing. To examine more closely the nature of the origin of the lint/air leak, the blowerfan compartment was opened on a blower from another dryer of Design A. Figures 85(a) and(b) show the blower housing assembled and opened, respectively.
(a) Blower removed from the dryer
(b) Blower housing separated
Figures 85 (a) and (b). Dryer Design A – Blower Assembly
The blower is a centrifugal type fan. The blower operates by sucking air through thecenter hole at negative pressure and forcing the air outward at positive pressure as shown in

US CONSUMER PRODUCT SAFETY COMMISSIONFINAL REPORT ON ELECTRIC CLOTHES DRYERS AND LINT IGNITION CHARACTERISTICS
May 2003
109
Figure 86. It is noteworthy that a foam gasket was used to seal the outer portion where there ispositive pressure.
Figure 86. An Illustration of Airflow through the Dryer and Blower
3.3.2 Other Dryer Designs at Positive Pressure
The other dryer designs (B, C, and D) did not contain the same configuration thatresulted in positive pressure after the blower. As shown in Dryer Design A, the blower was atthe rear of the dryer chassis. This configuration allowed the blower housing and connection tothe external dryer vent to be the same component. In the other dryer designs, the blower waslocated toward the front of the dryer chassis, where the lint screen was also located.
These dryers required a short section of duct between the rear of the dryer and theblower housing. The section of the dryer vent/ducting after the blower and inside the chassiswas an area of positive pressure. Most importantly, the connection between the short section ofduct and the blower was at positive pressure. Figure 87 shows the junction was at positivepressure (white arrow). Though the fitting of the metal duct to the plastic nozzle of the fan wassnug, it was not airtight. In some case, there was no seal between the blower housing and theshort section of exhaust vent.
DRUM
HEATERCOIL
FAN
DRYER CHASSISEXTERIOR
DRYER CHASSISINTERIOR
LINTSCR
ATMOSPHERICPRESSURE
BELOWATMOSPHERIC
PRESSURE
ABOVEATMOSPHERIC
PRESSURE

US CONSUMER PRODUCT SAFETY COMMISSIONFINAL REPORT ON ELECTRIC CLOTHES DRYERS AND LINT IGNITION CHARACTERISTICS
May 2003
110
Dryer Design B
Figure 87. Junction Between the Blower and Exhaust Vent
Under the test conditions, which included rigid exhaust ducting, two 90° elbows, and noblockage in the ducting, there was lint accumulation in the chassis interior. The setup producedminimal backpressure in the dryer exhaust vent (See Appendix E). In the event that a seriousblockage did occur, lint leakage could be expected to increase as the backpressure in theexhaust vent increased. The extent to which leakage would be made worse would depend onthe location of the leakage. Close to the blower impeller – on the side opposite of the exhaustport yet inside impeller housing – the positive pressure is greatest.

US CONSUMER PRODUCT SAFETY COMMISSIONFINAL REPORT ON ELECTRIC CLOTHES DRYERS AND LINT IGNITION CHARACTERISTICS
May 2003
111
3.4 Task 4: Determine Characteristics Required for Lint Ignition
Based on the test data and observations presented in Section 2.4, ignitioncharacteristics of lint were observed on and near the heater housing (heater box) and when lintwas ingested into the heater box. This section further assesses the ignition times andtemperatures under the various conditions tested. This section also includes an examination ofhigh limit devices that had failed during the course of testing.
3.4.1 Lint on the Heater Housing
Twenty-two lint samples were tested at five different locations on the heater housing.The samples at either locations B or E were more likely to ignite than samples placed atlocations A, C, or D on the heater housing. The samples located at B and E ignited morefrequently under conditions of no airflow and when the high-limit thermostat was bypassed. Thesamples would smolder but generally not ignite when placed at the other locations and/or whentested under other conditions. Instead, the lint material would be consumed by pyrolysis orthermal decomposition.
3.4.2 Lint Samples at the Heater Intake
This phase of testing was divided into three test series. The first series of tests wasconducted under conditions of no airflow through the heater box, and the high-limit thermostatbypassed. This simulated a condition in which the exhaust vent was blocked and the high-limitthermostat had failed to open. The second test series was conducted with no airflow throughthe heater box, but the high-limit thermostat was connected in series with the heating element.This simulated a condition where the exhaust vent was fully blocked, but the high-limitthermostat was operational. The third series of tests was conducted with various airflowvelocities through the heater box, and the high-limit thermostat connected in series with theheating element. This simulated a partially blocked exhaust vent with an operational high-limitthermostat.
In these tests, the primary purpose of the T3 thermocouple, which was placed on the lintsample, was to indicate when the sample ignited. The T3 thermocouple temperature datashould not be used as an analysis tool to compare samples, since the placement of thethermocouple on the samples may not have been identical. The thermocouple was placedabove the sample, to achieve the maximum change in temperature should the sample ignite.
3.4.2.1 High-Limit Thermostat Bypassed and No Airflow
Eleven tests were conducted in the first series of tests. Lint samples were placed atdistances ranging from 2 to 4 inches from the edge of the heater box. (This would equate to 4to 6 inches from the heater element.) The data shows the threshold for ignition and no ignitionwas approximately 3 inches and 4 inches (from the edge of the heater housing), respectively.(Appendix I shows data for the lint sample tested 2 inches from the heater intake.)
Figure 88 below shows the temperatures at the T1 Heater Intake, T2 Heater Exhaustand T3 Lint Sample thermocouples for samples s3-3, s3-9, and s3-10, which were tested 3inches from the heater housing edge. (The heating element was energized approximately 35seconds into the test.)
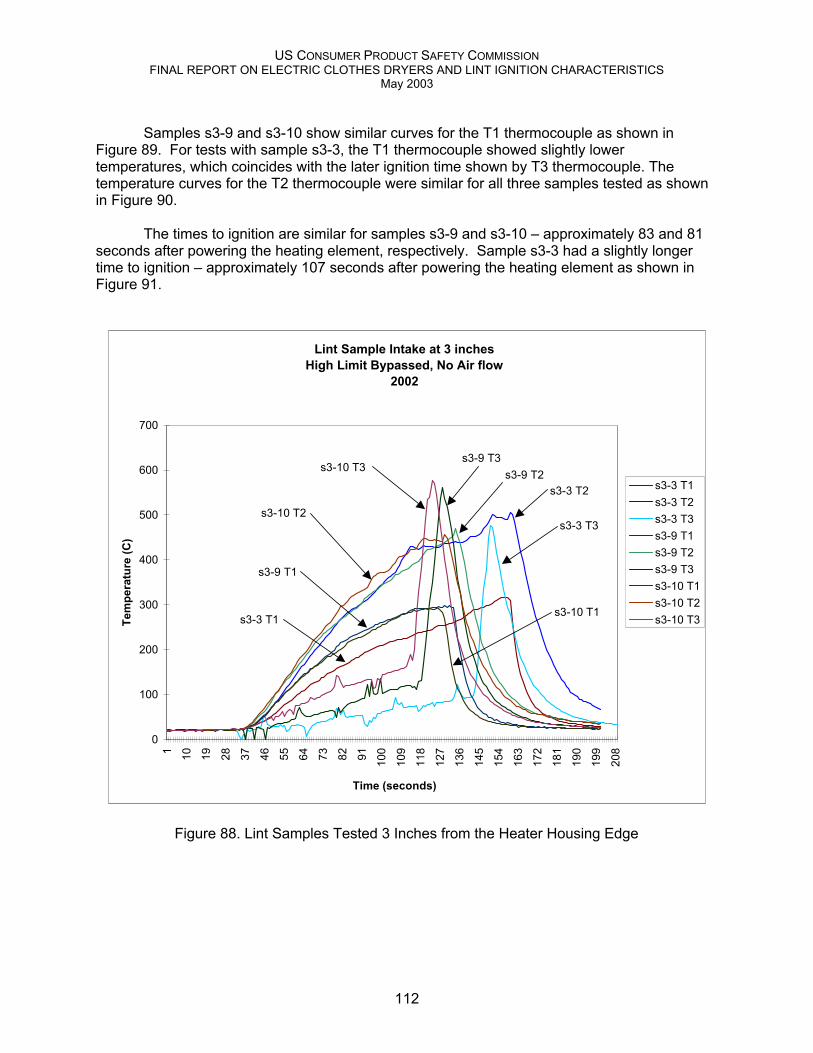
US CONSUMER PRODUCT SAFETY COMMISSIONFINAL REPORT ON ELECTRIC CLOTHES DRYERS AND LINT IGNITION CHARACTERISTICS
May 2003
112
Samples s3-9 and s3-10 show similar curves for the T1 thermocouple as shown inFigure 89. For tests with sample s3-3, the T1 thermocouple showed slightly lowertemperatures, which coincides with the later ignition time shown by T3 thermocouple. Thetemperature curves for the T2 thermocouple were similar for all three samples tested as shownin Figure 90.
The times to ignition are similar for samples s3-9 and s3-10 – approximately 83 and 81seconds after powering the heating element, respectively. Sample s3-3 had a slightly longertime to ignition – approximately 107 seconds after powering the heating element as shown inFigure 91.
Lint Sample Intake at 3 inchesHigh Limit Bypassed, No Air flow
2002
0
100
200
300
400
500
600
700
1 10 19 28 37 46 55 64 73 82 91 100
109
118
127
136
145
154
163
172
181
190
199
208
Time (seconds)
Tem
pera
ture
(C)
s3-3 T1s3-3 T2s3-3 T3s3-9 T1s3-9 T2s3-9 T3s3-10 T1s3-10 T2s3-10 T3
s3-10 T1
s3-9 T1
s3-9 T3s3-9 T2
s3-3 T3
s3-10 T3
s3-3 T2
s3-10 T2
s3-3 T1
Figure 88. Lint Samples Tested 3 Inches from the Heater Housing Edge

US CONSUMER PRODUCT SAFETY COMMISSIONFINAL REPORT ON ELECTRIC CLOTHES DRYERS AND LINT IGNITION CHARACTERISTICS
May 2003
113
T1 Only - Lint Sample Intake at 3 inchesHigh Limit Bypassed, No Airflow
2002
0
50
100
150
200
250
300
350
0 10 20 30 40 50 60 70 80 90 100
110
120
130
140
150
160
170
180
190
200
Time (seconds)
Tem
pera
ture
(C)
3-3 T13-9 T13-10 T1average T1
Figure 89. T1 Only - 3 Inches from the Heater Housing Edge
T2 Only - Lint Sample Intake at 3 inchesHigh Limit Bypassed, No Airflow
2002
0
100
200
300
400
500
600
1 11 21 31 41 51 61 71 81 91 101
111
121
131
141
151
161
171
181
191
201
Time (seconds)
Tem
pera
ture
(C)
3-3 T23-9 T23-10 T2average T2
Figure 90. T2 Only - 3 Inches from the Heater Housing Edge

US CONSUMER PRODUCT SAFETY COMMISSIONFINAL REPORT ON ELECTRIC CLOTHES DRYERS AND LINT IGNITION CHARACTERISTICS
May 2003
114
T3 Only - Lint Sample Intake at 3 inchesHigh Limit Bypassed, No Airflow
2002
0
100
200
300
400
500
600
7001 11 21 31 41 51 61 71 81 91 101
111
121
131
141
151
161
171
181
191
201
Time (seconds)
Tem
pera
ture
(C)
3-3 T33-9 T33-10 T3average T3
Figure 91. T3 Only - 3 Inches from the Heater Housing Edge
Figure 92 shows the temperatures at the T1, T2 and T3 thermocouples for samples s3-4, s3-11, and s3-12, which were tested 4 inches from the heater housing edge. (The heatingelement was energized approximately 35 seconds into the test.) All three samples smoldered,but no flames were present. The T1, T2 and T3 thermocouple traces were similar for all threesamples tested.

US CONSUMER PRODUCT SAFETY COMMISSIONFINAL REPORT ON ELECTRIC CLOTHES DRYERS AND LINT IGNITION CHARACTERISTICS
May 2003
115
Lint Sample Intake at 4 inchesHigh Limit Bypassed, No Airflow
2002
0
100
200
300
400
500
600
700
1 10 19 28 37 46 55 64 73 82 91 100
109
118
127
136
145
154
163
172
181
190
199
Time (seconds)
Tem
pera
ture
(C) s3-4 T1
s3-4 T2s3-4 T3s3-11 T1s3-11 T2s3-11 T3s3-12 T1s3-12 T2s3-12 T3
s3-11 T1 s3-12 T1
s3-4 T3
s3-4 T2
s3-11 T3s3-12 T3
s3-11 T2
s3-12 T2
s3-4 T1
Figure 92. Lint Samples Tested 4 Inches from the Heater Housing Edge
Table 18 lists the ignition times for samples tested at 2 and 3 inches from the heaterintake edge. Figure 93 plots the minimum, maximum, and average ignition times for samplestested at 2 and 3 inches from the heater edge.
Table 18. Ignition Times at Heater Intake
3 inches from Heater Intake 2 inches from Heater IntakeSampleNumber
DataTime(sec)
HeaterEnergized(seconds)
ActualTime(sec)
SampleNumber
DataTime(sec)
HeaterEnergized(seconds)
ActualTime(sec)
s3-3 143 36 107 s3-2 108 35 73s3-9 118 35 83 s3-8 83 37 46s3-10 115 34 81 s3-5 75 37 38
max 107 s3-6 80 39 41average 90 s3-7 76 40 36min 81 max 73
average 47min 36

US CONSUMER PRODUCT SAFETY COMMISSIONFINAL REPORT ON ELECTRIC CLOTHES DRYERS AND LINT IGNITION CHARACTERISTICS
May 2003
116
Ignition Times for Lint Samples 2 and 3 inches from Intake
81 90
107
36 47 73
1
2
3
4
0 10 20 30 40 50 60 70 80 90 100 110 120 130 140 150
Time (seconds)
Sam
ple
Dis
tanc
e
Figure 93. Ignition Time for 2 and 3 Inches from Heater Edge
3.4.2.2 High-Limit Connected in Series and No Airflow
Six tests were conducted in this series of tests in which the high-limit thermostat wasconnected in series with the heating element and there was no airflow through the heater box.Lint samples were placed at distances ranging from 0 to 2 inches from the edge of the heaterbox (2 to 4 inches from the heating element, respectively). The data show a threshold ofbetween 1 and 2 inches from the heater housing edge for ignition and no ignition, respectively.
In the first test, sample s3-13 ignited, and the high-limit thermostat did not open anddisconnect power to the heating element. It was determined that the high-limit thermostat hadfailed. (An investigation of the cause of failure for the high-limit thermostat was conducted, andthe results are reported at the end of this Discussion Section.) The remainder of the discussionin this subsection, therefore, will not include data from sample s3-13.
The high-limit thermostat was replaced with a similar high-limit thermostat taken from adryer of the same make and model. Several baseline tests were conducted to confirm that thereplacement thermostat operated properly when the temperature inside the heater housingreached a set temperature.
Figure 94 shows the T1, T2, and T3 thermocouple data for samples s3-16 and s3-17,tested at a distance of 1 inch from the heater edge. The times to ignition for samples s3-16 ands3-17 were approximately 55 and 65 seconds after powering the dryer, respectively. The steepincreases observed in the data for thermocouple T3 indicate ignition of the sample. The profilesof the data obtained from thermocouples T1 and T2 were similar for both samples tested.
This figure shows that the samples ignited before the high-limit thermostat opened anddisconnected power to the heating element. For both samples, the sample ignited
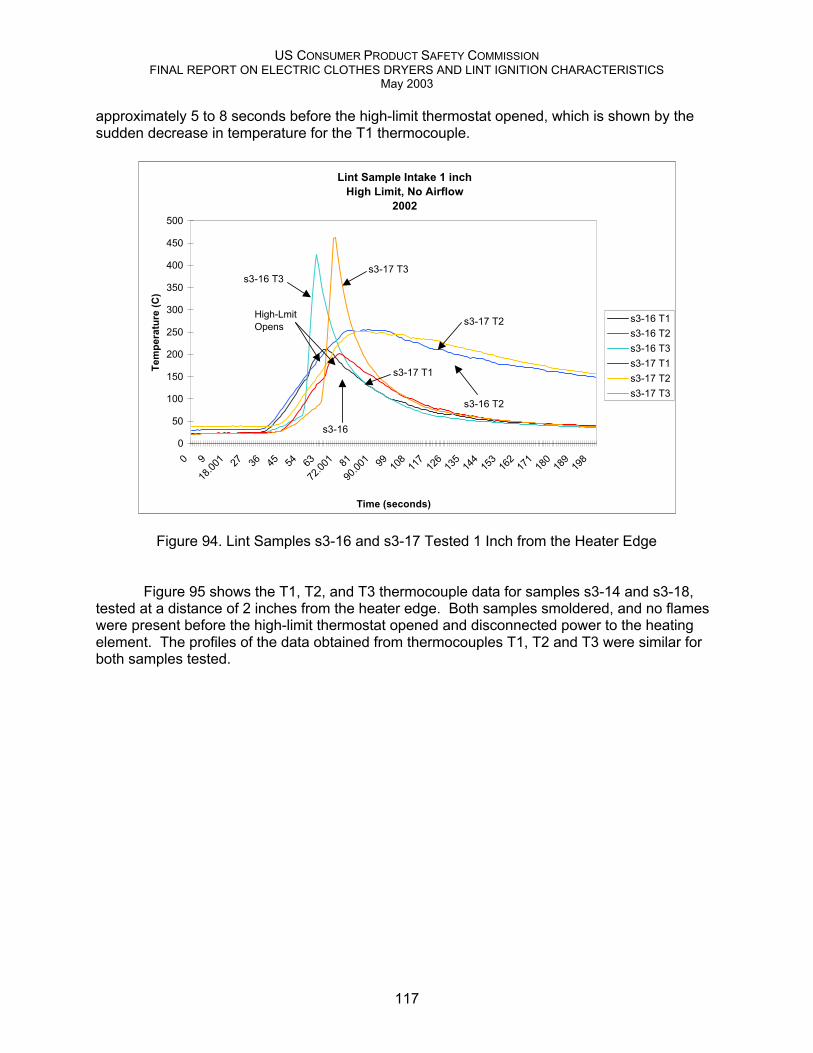
US CONSUMER PRODUCT SAFETY COMMISSIONFINAL REPORT ON ELECTRIC CLOTHES DRYERS AND LINT IGNITION CHARACTERISTICS
May 2003
117
approximately 5 to 8 seconds before the high-limit thermostat opened, which is shown by thesudden decrease in temperature for the T1 thermocouple.
Lint Sample Intake 1 inchHigh Limit, No Airflow
2002
0
50
100
150
200
250
300
350
400
450
500
0 9
18.00
1 27 36 45 54 63
72.00
1 81
90.00
1 99 108
117
126
135
144
153
162
171
180
189
198
Time (seconds)
Tem
pera
ture
(C)
s3-16 T1s3-16 T2s3-16 T3s3-17 T1s3-17 T2s3-17 T3
s3-16
s3-17 T3
s3-16 T2
s3-17 T2
s3-16 T3
s3-17 T1
High-Lmit Opens
Figure 94. Lint Samples s3-16 and s3-17 Tested 1 Inch from the Heater Edge
Figure 95 shows the T1, T2, and T3 thermocouple data for samples s3-14 and s3-18,tested at a distance of 2 inches from the heater edge. Both samples smoldered, and no flameswere present before the high-limit thermostat opened and disconnected power to the heatingelement. The profiles of the data obtained from thermocouples T1, T2 and T3 were similar forboth samples tested.

US CONSUMER PRODUCT SAFETY COMMISSIONFINAL REPORT ON ELECTRIC CLOTHES DRYERS AND LINT IGNITION CHARACTERISTICS
May 2003
118
Lint Sample Intake at 2 inchesHigh Limit, No Air flow
2002
0
50
100
150
200
250
300
0 9
18.00
1 27 36 45 54 63
72.00
1 81
90.00
1 99 108
117
126
135
144
153
162
171
180
189
198
Time (seconds)
Tem
pera
ture
(C)
s3-14 T1s3-14 T2s3-14 T3s3-18 T1s3-18 T2s3-18 T3
s3-18
s3-14 T2
s3-14 T3
s3-18 T3
s3-18 T2
s3-14 T1
Figure 95. Lint Samples s3-14 and s3-18 Tested 2 Inches from the Heater Edge
In previous tests in which the high-limit thermostat was bypassed, a lint sample placed 2inches from the heater edge ignited. Table 19 lists the high-limit thermostat activation times.The average activation time was 39 seconds. Figure 96 shows a similar figure as in Figure 93but with the average high-limit thermostat activation time at 93 seconds. The figure indicatesthe high-limit thermostat opens 8 seconds before the average sample at 2 inches from theheater edge would ignite. In some cases, a lint sample 2 inches from the heater edge mayignite before the high limit activates as shown in the figure.
Table 19. Approximate High Limit Thermostat Activation Times
High Limit Activation2 inches from Heater Intake with High Limit
SampleNumber
DataTime
(seconds)
HeaterEnergized(seconds)
ActualTime
(seconds)s3-18 74 36 38s3-14 75 35 40
average 39

US CONSUMER PRODUCT SAFETY COMMISSIONFINAL REPORT ON ELECTRIC CLOTHES DRYERS AND LINT IGNITION CHARACTERISTICS
May 2003
119
Ignition Tim e s for Lint Samples 2 and 3 inche s from Intake
81 90
107
36 47 73
391
2
3
4
0 10 20 30 40 50 60 70 80 90 100 110 120 130 140 150
Tim e (seconds)
Sam
ple
Dis
tanc
e
Hig
h Li
mit
Act
ivat
ion
Figure 96. High Limit Activation Time Comparison at Sample 2 and 3 inches
3.4.2.3 High-Limit Connected in Series and Airflow
Four tests were conducted in this last series of tests, in which the high-limit thermostatwas connected in series with the heating element and airflow through the heater box wasvaried. Lint samples were placed at distances either 0 or 1 inch from the edge of the heater box(either 2 or 3 inches from the heating element). Airflow velocity, as measured at the intake, wasvaried from 200 to 400 sfpm. For a sample placed 1 inch from the heater housing edge, thethermocouple and anemometer data showed a threshold between 300 and 400 sfpm for ignitionand no ignition, respectively.
Figure 97 shows T1, T2, and T3 thermocouple data for samples s3-19, s3-20, and s1-8,which were tested at a distance of 1 inch from the heater edge with different airflow velocities.The graph shows that samples tested with airflow below 300 sfpm ignited. With an airflow of200 sfpm, the sample ignited approximately 60 seconds after powering the heating element.With an airflow of 300 sfpm, the sample ignited approximately 80 seconds after powering theheating element.
The graph also shows that samples tested with airflow below 300 sfpm ignited before thehigh-limit thermostat opened and disconnected power to the heating element. For both samplestested at 200 and 300 sfpm airflow, the samples ignited approximately 10 seconds before thehigh-limit thermostat opened (as shown by the decrease in temperature measured atthermocouple T2). Since thermocouple T1 was in close proximity to the lint sample, thethermocouple data for T1 and T3 showed similar responses. T2 thermocouple was used toapproximate the time at which the high-limit thermostat opened and disconnected power to theheating element.
Sample s1-9 was placed 1 inch from the heater housing edge; the airflow was set at 400sfpm, and the high-limit thermostat was connected in series with the heating element. Samples1-9 did not ignite. With an intake airflow of 400 sfpm and the high-limit thermostat connected
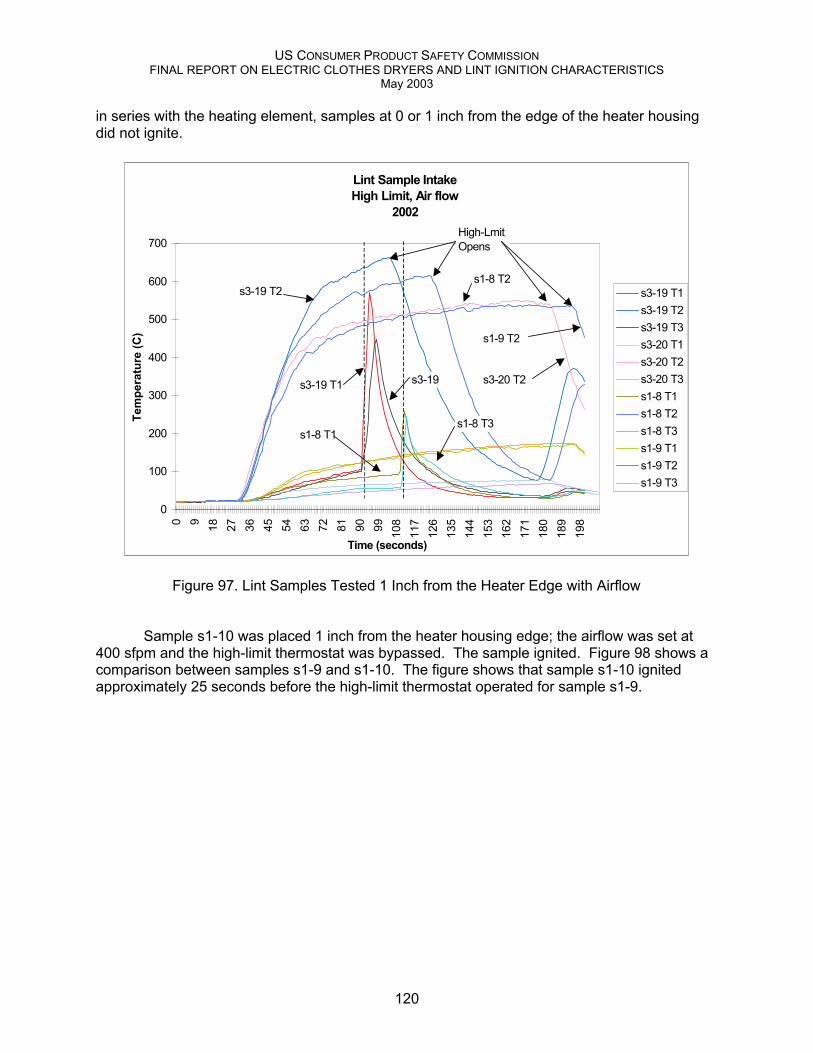
US CONSUMER PRODUCT SAFETY COMMISSIONFINAL REPORT ON ELECTRIC CLOTHES DRYERS AND LINT IGNITION CHARACTERISTICS
May 2003
120
in series with the heating element, samples at 0 or 1 inch from the edge of the heater housingdid not ignite.
Lint Sample IntakeHigh Limit, Air flow
2002
0
100
200
300
400
500
600
700
0 9 18 27 36 45 54 63 72 81 90 99 108
117
126
135
144
153
162
171
180
189
198
Time (seconds)
Tem
pera
ture
(C)
s3-19 T1s3-19 T2s3-19 T3s3-20 T1s3-20 T2s3-20 T3s1-8 T1s1-8 T2s1-8 T3s1-9 T1s1-9 T2s1-9 T3
s3-19
s3-19 T2
s3-20 T2
s1-8 T2
s1-9 T2
s3-19 T1
High-Lmit Opens
s1-8 T3s1-8 T1
Figure 97. Lint Samples Tested 1 Inch from the Heater Edge with Airflow
Sample s1-10 was placed 1 inch from the heater housing edge; the airflow was set at400 sfpm and the high-limit thermostat was bypassed. The sample ignited. Figure 98 shows acomparison between samples s1-9 and s1-10. The figure shows that sample s1-10 ignitedapproximately 25 seconds before the high-limit thermostat operated for sample s1-9.

US CONSUMER PRODUCT SAFETY COMMISSIONFINAL REPORT ON ELECTRIC CLOTHES DRYERS AND LINT IGNITION CHARACTERISTICS
May 2003
121
Lint Sample Intake at 1 inchwith and without High Limit, Air flow 400 sfpm
2002
0
100
200
300
400
500
600
7000 9 18 27 36 45 54 63 72 81 90 99 108
117
126
135
144
153
162
171
180
189
198
Time (seconds)
Tem
pera
ture
(C)
s1-9 T1s1-9 T2s1-9 T3s1-10 T1s1-10 T2s1-10 T3
s1-10 T2
s1-9 T2
High-Lmit Opens
s1-9 T1s1-9 T3 s1-10 T1
s1-10 T3
sample 1-9 ignites
power turned off
Figure 98. Samples Tested at 1 Inch, With and Without High-Limit Thermostat
3.4.3 Lint Samples Ingested into the Heater
The ignition characteristics of lint were evaluated by observing the heater exhaust as lintsamples of varying weights and sizes were ingested into the heater box. The test setup wasdesigned to allow the airflow into the heater intake to carry lint samples past the heatingelement and to exhaust any embers through a 4” diameter glass tube.
In these tests, lint samples ranging from 0.04 g to 0.48 g were observed igniting, andembers traveled through the exhaust vent. The following observations were made (smallembers are defined as particles approximately the size of a pinhead; large embers are definedas particles close to the size of a thumb tack head):
1. Sample contacted the center heating element coil and ignited.Result – Small embers exited the heater box.
2. Sample contacted the edge of the heating coil and ignited.Result – Small to large embers exited the heater box. In some instances, smallportions of the sample that were either flaming or contained large embers broke away.
3. Sample passed between the heating element and the heater housing.Result – The sample ignited and exited the heater box.

US CONSUMER PRODUCT SAFETY COMMISSIONFINAL REPORT ON ELECTRIC CLOTHES DRYERS AND LINT IGNITION CHARACTERISTICS
May 2003
122
4. Sample became lodged between the two layers of heating coils, on the insulator.Result – Small embers exited the heater housing, and unburned lint stayed lodgedon the insulator.
3.4.4 Ignition of Target Material Downstream from the Heater Exhaust
Four tests were conducted to determine whether embers that exited the heater couldignite target materials placed downstream of the heater exhaust. The target material was either100% cotton lint or 100% cotton terry towel.
In all four tests conducted, the target material ignited. The test results showed thatfewer ingested lint samples were required to ignite the 100% lint target material than the 100%cotton terry target material. The target material of 100% cotton lint ignited on the fifth sample of0.10 g, the sixth sample of 0.20 g, and the tenth sample of 0.10 g ingested into the heater box.The target material of 100% cotton terry ignited on the eighth sample of 0.30 g.
When the target material ignited, the target material would produce additional embersthat were carried through the exhaust vent. The 100% cotton terry towel burned substantiallylonger than the lint target material. The terry towel also produced significantly more embers,which were carried further into the exhaust venting.
3.4.5 High-Limit Thermostat Analysis
Two high-limit thermostats failed during the course of testing. The life histories of boththermostats were compiled and are presented in Table 20:
– Column 1 (High Limit Thermostat) labels the thermostats (HLT1 represents the high-limit thermostat that failed first, and HLT2 represents the second).
– Column 2 (Life Below 100°C) lists the approximate number of hours to which thehigh-limit thermostat was exposed to the following conditions: The dryer operated onthe primary thermostat or it operated while the temperature at T1 (intake air into theheater box) was below 100°C. This would include testing (Task 2) in which the dryeroperated with an unblocked exhaust vent or with a partially-blocked exhaust vent,and it would include testing (Task 4) with just the heater box in the unblocked andpartially blocked conditions.
– Column 3 (Life Above 100°C) lists the approximate number of hours to which thehigh-limit thermostat was exposed to the following conditions: The high-limitthermostat was bypassed or the temperature at T1 (intake air into the heater box)was above 100°C. This would only include testing in which the heater box wasinstalled in the test apparatus.
– Column 4 (Number of Cycles) lists the number of times the high-limit thermostatcycled; one cycle represents opening and closing of the high-limit thermostat. Thehigh-limit cycling duration was not included in either of the total times listed in column2 and 3.

US CONSUMER PRODUCT SAFETY COMMISSIONFINAL REPORT ON ELECTRIC CLOTHES DRYERS AND LINT IGNITION CHARACTERISTICS
May 2003
123
Table 20. Life History of Failed High-Limit Thermostats
High LimitThermostat
Life Below100° C
Life Above100° C
Number of Cycles
HLT1 9.3 hours 0.79 hours 47HLT2 97.6 hours 0.20 hours 26
3.4.5.1 High-Limit Thermostat 1 (HLT1) Analysis
The first high-limit thermostat failed in June 2002 during Task 4 testing. This high-limitthermostat was used in Task 2: Dryer Design A – Document Dryer Operating Characteristics,and Task 4: Determine Characteristics Required for Lint Ignition. The high-limit thermostat wasconnected in series with the heating element when it was discovered that it had failed to open.Figure 99 shows the thermocouple data for test Sample s3-13 when the high-limit first failed tooperate. The figure shows the sample ignited, which was unexpected, and the T1 temperaturerose to almost 200°C.
Sample s3-13High Limit in Series
0.19g, 2" from heater box edge, ignitionJune 2002
0
100
200
300
400
500
600
0 4 8 12 16 20 24 28 32 36 40 44 48 52 56 60 64 68 72 76 80 84 88 92 96 100
Time (seconds)
Tem
pera
ture
(C)
0
200
400
600
800
1000
1200
1400
1600
Air
Flow
(sfp
m)
T1 Heater Intake T2 Heater Exhaust T3 Liint SampleT4 Exhaust Vent Heater T5 Exhaust Vent Outside Heater T6 ChamberT7 Room Ambient V1 Airflow into Heater V2 Airflow External Heater
T3 Sample Ignites
T2T1
T4
Figure 99. Sample s3-13 Test with the High Limit Thermostat in Series
Figure 100 shows a comparison for thermocouples T1, T2, and T3 between the failedhigh-limit thermostat (HLT1) and a replacement high-limit thermostat (HLT2). The

US CONSUMER PRODUCT SAFETY COMMISSIONFINAL REPORT ON ELECTRIC CLOTHES DRYERS AND LINT IGNITION CHARACTERISTICS
May 2003
124
thermocouples were placed at the heater intake, the heater exhaust, and 2 inches from theheater edge for T1, T2 and T3, respectively. The figure shows T1 for HLT2 rose toapproximately 150° C before the high-limit thermostat opened and disconnected power to theheating element. The temperatures for HLT1 continued to rise until power was manually turnedoff at approximately 170 seconds.
High Limit Thermostat 1 (HLT1) and Replacement High Limit Thermostat 2 (HLT2)June 2002
0
100
200
300
400
500
600
06.9
99
13.99
9 21 28 35
41.99
9 49 56
62.99
9
69.99
9 77 84
90.99
9
97.99
910
511
211
912
613
314
014
715
416
116
817
518
218
919
6
Time (seconds)
Tem
pera
ture
(C)
T1 HLT1 T2 HLT1 T3 HLT1 T1 HLT2 T2 HLT2 T3 HLT2
T1 HLT1 Intake Heater
T1 HLT2 Inatke Heater
T2 HL2 Heater Exhaust
T3 HLT2 2" from Heater Intake
T3 HLT1 2" from Heater Intake
T2 HLT1 Heater Exhaust
High-Limit Opens
Power to the heatermanually turned off
Figure 100. Failed Thermostat compared to a Replacement Thermostat
The high-limit thermostat was removed and x-rayed as shown in Figure 101. The high-limit thermostat uses a bi-metal disc that “pops” at a certain set temperature. When theconcave disc pops and becomes convex, it pushes on a rod that sequentially opens thecontacts. The x-rays did not reveal any abnormalities.

US CONSUMER PRODUCT SAFETY COMMISSIONFINAL REPORT ON ELECTRIC CLOTHES DRYERS AND LINT IGNITION CHARACTERISTICS
May 2003
125
Contacts
Rod
Bi-Metal Disc
Figure 101. X-ray Images of High-Limit Thermostat 1 (HLT1)
The high-limit thermostat was opened and examined under a microscope, as shown inFigure 102. It appeared that the contacts were welded together, but this could not beconfirmed.
Fixed ContactMoving Contact
Moving Contact
Fixed Contact
Figure 102. Contacts for High-Limit Thermostat 1 (HLT1)
Figure 103 shows the surface of the contact pads. Pitting and scorch marks are visibleand indicate there was a concentration of high heat. Figures 102 and 103 also show thatapproximately 50% to 60% of the contact pad surfaces were making contact when thethermostat was in the closed position.

US CONSUMER PRODUCT SAFETY COMMISSIONFINAL REPORT ON ELECTRIC CLOTHES DRYERS AND LINT IGNITION CHARACTERISTICS
May 2003
126
Fixed Contact
Moving Contact
Figure 103. Contact Pads for High-Limit Thermostat 1 (HLT1)

US CONSUMER PRODUCT SAFETY COMMISSIONFINAL REPORT ON ELECTRIC CLOTHES DRYERS AND LINT IGNITION CHARACTERISTICS
May 2003
127
3.4.5.2 High-Limit Thermostat 2 (HLT2) Analysis
The second high-limit thermostat failed during tests in July 2002 during Task 4:Determine Characteristics Required for Lint Ignition. This high-limit thermostat was used inTask 3 Monitor Lint Distribution testing and as a replacement thermostat for Task 4:Characteristics for Lint Ignition tests. The high-limit thermostat was in series with the heatingelement when it was discovered that it had failed to open. Figure 104 shows the thermocoupledata for test Sample s5-14 when the high-limit failed to operate. The figure shows the T2temperature rose to almost 600°C. (The T1 thermocouple and V1 anemometer were not in theheater intake air stream during this test.)
s5-14July 12, 2002
0
100
200
300
400
500
600
700
0 10 20 30 40 50 60 70 80 90 100
110
120
130
140
150
160
170
180
190
200
210
220
230
240
250
260
270
280
290
300
Time (seconds)
Tem
pera
ture
(C)
0
200
400
600
800
1000
1200
1400
1600
Airf
low
(sfp
m)
T1 Heater Intake T2 Heater Exhaust T3 Liint SampleT4 Exhaust Vent Heater T5 Exhaust Vent Outside Heater T6 ChamberT7 Room Ambient V1 Airflow into Heater V2 Airflow External Heater
T3 Lint Sample
T2 Heater Exhaust
Power to the heatermanually turned off
T4 Heater Exhaust
Figure 104. Sample s5-14 with High Limit Thermostat in Series
Figure 105 shows a comparison of temperature data from thermocouples T2 and T3 forthe high-limit thermostat before it failed (HLT2 Before) and after it failed (HLT2 After). Thethermocouples were placed at the heater exhaust and 2 inches from the heater edge for T2 andT3, respectively. (The T1 thermocouple and V1 anemometer were not in the heater intake airstream during the HL2 After test.)
The figure shows T1 temperature for HL2 Before rose to approximately 150°C before thehigh-limit thermostat opened and disconnected power to the heating element. The sample lintin the HLT2 After test ignited unexpectedly approximately 55 seconds after powering the heater.

US CONSUMER PRODUCT SAFETY COMMISSIONFINAL REPORT ON ELECTRIC CLOTHES DRYERS AND LINT IGNITION CHARACTERISTICS
May 2003
128
The temperatures for HLT2 After continued to rise until power was manually turned off atapproximately 170 seconds.
High Limit Thermostat 2 Before Failure (HLT2 Before) and After Failure (HLT2 After)
0
100
200
300
400
500
600
06.9
99 14 21 28 35 42 49
55.99
9
62.99
9 70 77 84 91 98 105
112
119
126
133
140
147
154
161
168
175
182
189
196
Time (seconds)
Tem
pera
ture
(C)
T1 HLT1 after T2 HLT1 after T3 HLT1 after T1 HLT2 before T2 HLT2 before T3 HLT2 before
T1 HLT2 after
T1 HLT2 (before)Intake Heater
T2 HLT2 (after)Heater Exhaust
T3 HLT2 (before) 2" from Heater Intake
T3 HLT2 (after) 2" from Heater Intake
T2 HLT2 (before)Heater Exhaust
High-Limit Opens(before)
Power to the heatermanually turned off
Sample Ignites
Figure 105. High-Limit Thermostat 2 (HLT2) before and after Failure
The high-limit thermostat was removed and x-rayed, as shown in Figure 106. The theoryof operation for the second failed thermostat, HLT2, is the same as that for the first failedthermostat, HLT1. The x-rays did not reveal any abnormalities.
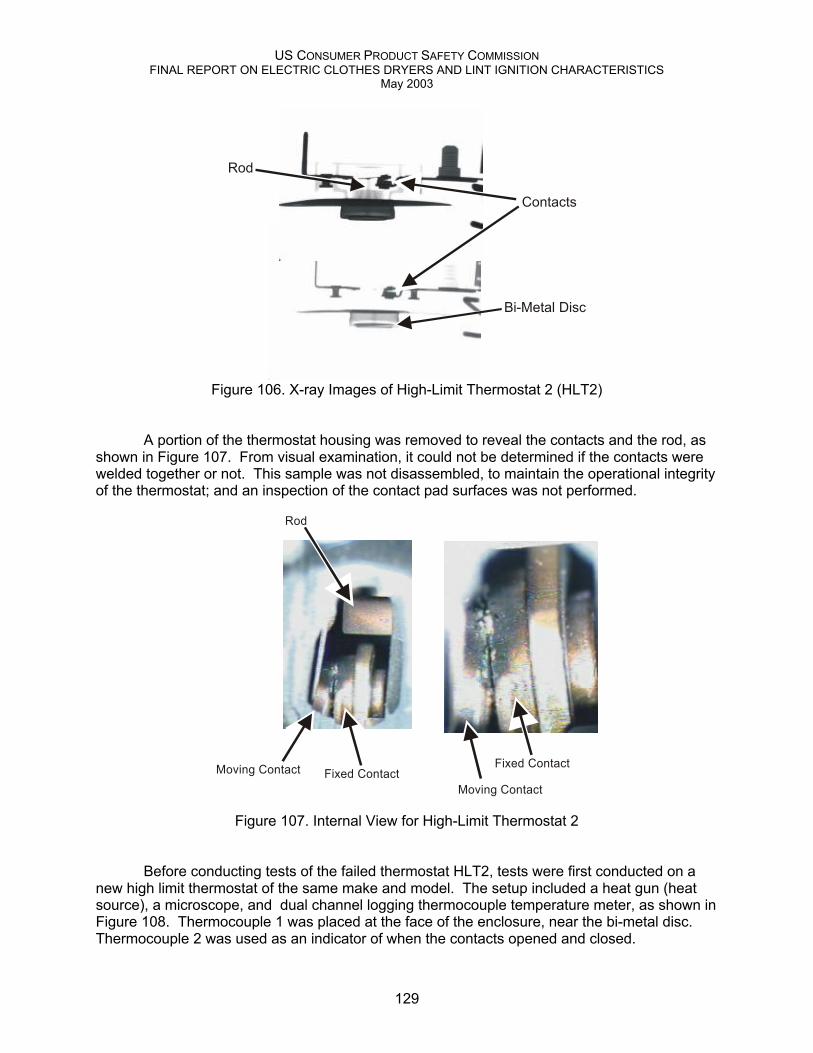
US CONSUMER PRODUCT SAFETY COMMISSIONFINAL REPORT ON ELECTRIC CLOTHES DRYERS AND LINT IGNITION CHARACTERISTICS
May 2003
129
Rod
Contacts
Bi-Metal Disc
Figure 106. X-ray Images of High-Limit Thermostat 2 (HLT2)
A portion of the thermostat housing was removed to reveal the contacts and the rod, asshown in Figure 107. From visual examination, it could not be determined if the contacts werewelded together or not. This sample was not disassembled, to maintain the operational integrityof the thermostat; and an inspection of the contact pad surfaces was not performed.
Moving ContactMoving Contact
Rod
Fixed ContactFixed Contact
Figure 107. Internal View for High-Limit Thermostat 2
Before conducting tests of the failed thermostat HLT2, tests were first conducted on anew high limit thermostat of the same make and model. The setup included a heat gun (heatsource), a microscope, and dual channel logging thermocouple temperature meter, as shown inFigure 108. Thermocouple 1 was placed at the face of the enclosure, near the bi-metal disc.Thermocouple 2 was used as an indicator of when the contacts opened and closed.
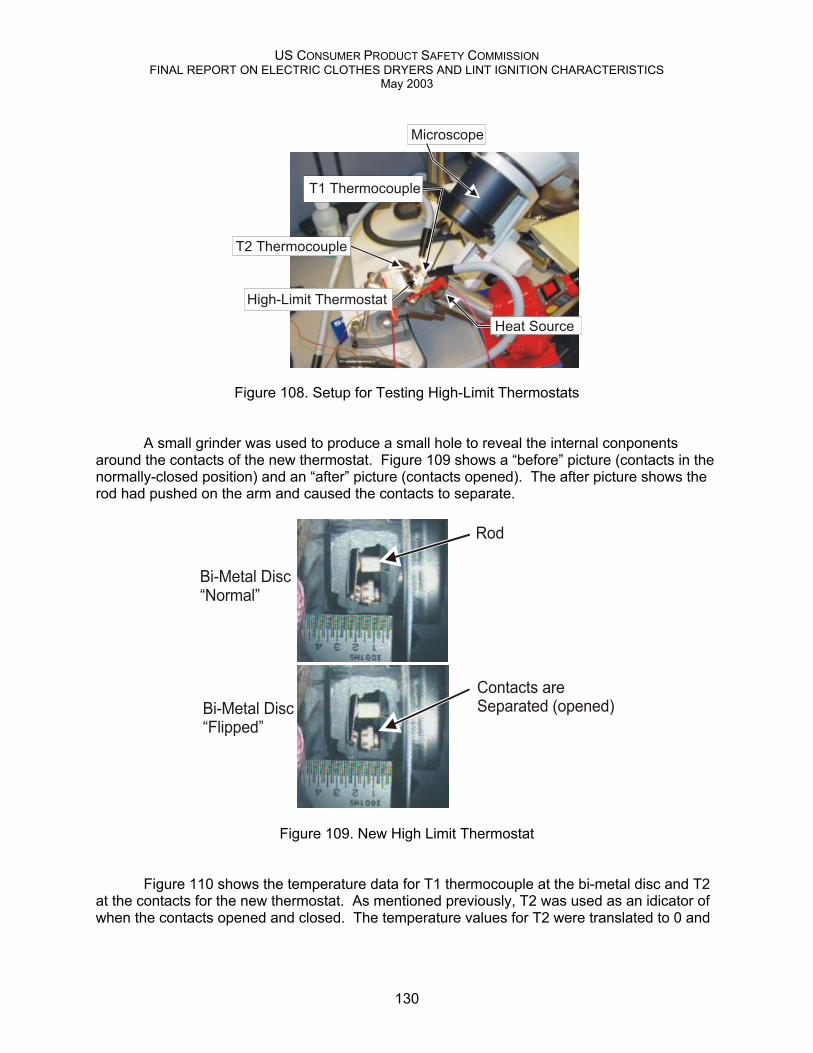
US CONSUMER PRODUCT SAFETY COMMISSIONFINAL REPORT ON ELECTRIC CLOTHES DRYERS AND LINT IGNITION CHARACTERISTICS
May 2003
130
High-Limit Thermostat
Microscope
T2 Thermocouple
T1 Thermocouple
Heat Source
Figure 108. Setup for Testing High-Limit Thermostats
A small grinder was used to produce a small hole to reveal the internal conponentsaround the contacts of the new thermostat. Figure 109 shows a “before” picture (contacts in thenormally-closed position) and an “after” picture (contacts opened). The after picture shows therod had pushed on the arm and caused the contacts to separate.
Rod
Contacts areSeparated (opened)
Bi-Metal Disc“Normal”
Bi-Metal Disc“Flipped”
Figure 109. New High Limit Thermostat
Figure 110 shows the temperature data for T1 thermocouple at the bi-metal disc and T2at the contacts for the new thermostat. As mentioned previously, T2 was used as an idicator ofwhen the contacts opened and closed. The temperature values for T2 were translated to 0 and

US CONSUMER PRODUCT SAFETY COMMISSIONFINAL REPORT ON ELECTRIC CLOTHES DRYERS AND LINT IGNITION CHARACTERISTICS
May 2003
131
1, where 0 indicates a closed contact and 1 indicates an open contact. The contacts openedwhen T1 was at 113.4°C and closed when T1 was at 49.6°C.
New High Limit ThermostatTest New 1-3
0
20
40
60
80
100
120
140
1 8 15 22 29 36 43 50 57 64 71 78 85 92 99 106
113
120
127
134
141
148
Time (seconds)
Tem
pera
ture
(C)
0
0.2
0.4
0.6
0.8
1
Con
tact
s (0
clo
sed,
1
open
)
T1 Contacts
113.4
49.6
Figure 110. Thermocouple Data for the New High-Limit Thermostat
The second failed high limit thermostat (HLT2) was tested in the setup. An audible clickcould be heard when the bi-metal disc “popped.” When the bi-metal disc popped, it pushed onthe rod, which should have separated the contacts. However, the T2 signal did not indicate aseparation of the contacts. The resistance was measured at 0.0 to 0.1 ohms throughout thetest.
Figure 111 shows a picture before the bi-metal disc popped and an after picture. Thebefore picture (Bi-Metal Disc “Normal”) shows a small gap between the rod and the arm for themoving contact. The after figure shows the rod had moved and contacted the arm which shouldseparate the contacts. However, the contacts remained closed.
Rod
Contacts remainClosed
Bi-Metal Disc“Normal”
Bi-Metal Disc“Flipped”
Figure 111. Second Failed High Limit Thermostat, HLT2

US CONSUMER PRODUCT SAFETY COMMISSIONFINAL REPORT ON ELECTRIC CLOTHES DRYERS AND LINT IGNITION CHARACTERISTICS
May 2003
132
Figure 112 shows a comparison between a new (exemplar) high limit thermostat and thesecond failed high limit thermostat (HLT2). When the HLT2 thermostat was tested, an audibleclick could be heard at approximately 113°C and 35.5°C, indicating that the opening and closingtemperatures for the failed HLT2 thermostat. The new thermostat opening and closingtemperatures were similar.
New and Old (HLT2) High Limit ThermostatTest New 1-3 and Old Test 10
0
20
40
60
80
100
120
140
1 14 27 40 53 66 79 92 105
118
131
144
157
170
183
196
209
222
235
248
261
274
287
Time (seconds)
Tem
pera
ture
(C)
0
0.22113
0.44226
0.66339
0.88452
1.10565
Con
tact
s (0
clo
sed,
1 o
pen)
T1 New T1 Old (HLT2) Old Disc FlippedOld Disc Flipped Contacts New Contacts Old (HLT2)
NewOpened113.4
NewClosed49.6
Old Disc Flipped 113 degrees
Old Disc Flipped 35.5 degrees
Figure 112. Comparison between New and Failed High Limit Thermostats

US CONSUMER PRODUCT SAFETY COMMISSIONFINAL REPORT ON ELECTRIC CLOTHES DRYERS AND LINT IGNITION CHARACTERISTICS
May 2003
133
4.0 SUMMARY AND CONCLUSIONSThe overall goal of the project was to determine whether lint accumulation could result in
clothes dryer fires. To accomplish this large goal, separate tasks were designed to link thecause of lint accumulation to possible dryer fires and/or lint ignition. The smaller taskscompleted were:
Task 1. Inspect and Record Dryer DesignsTask 2. Document Dryer Operating CharacteristicsTask 3. Monitor Lint Distribution, andTask 4. Determine Characteristics Required for Lint Ignition.
The objective of this project was to evaluate the effects of lint accumulation and above-normal operating temperatures in electric clothes dryers and determine whether such conditionsmay result in dryer fires and/or lint ignition. The project demonstrated the following,
♦ Lint accumulates inside a dryer with properly vented exhaust ducting and withproperly maintained lint screen (as discussed in Section 3.3 Task 3, Monitor LintDistribution)
♦ Lint on the heater housing and in proximity to the heater intake can ignite (asdiscussed in Section 3.4 Task 4, Determine Characteristics Required for LintIgnition), and
♦ Material downstream of the heater can be ignited by lint ingested by the heater (asdiscussed in Section 3.4 Task 4, Determine Characteristics Required for LintIgnition).
The following provides a summary for each task presented in Section 3.0 Discussion:
Task 1. Inspect and Record Dryer Design
♦ All four dryer designs used the same method and order for moving the air throughthe dryer.
• Air was pulled into the body of the dryer through any gaps in the dryer, buttypically through rear vents. It was drawn through the heater, which warmed theair, and then entered the tumbler. The air exited the tumbler and was directedthrough the lint screen. It passed through a duct in the dryer and into the fan.The fan forced the air through an exiting duct to the back of the dryer, where itwas exhausted.
♦ The dryer designs had variations in the location and configuration of the heater, thelocation the air exited out of the tumbler, and location and size of the lint screen.
♦ The length of the dryer’s exhaust duct extending out of the dryer may not allow thehouse duct to slide far enough onto the dryer’s exhaust duct to provide a securepressure fit.

US CONSUMER PRODUCT SAFETY COMMISSIONFINAL REPORT ON ELECTRIC CLOTHES DRYERS AND LINT IGNITION CHARACTERISTICS
May 2003
134
♦ Using rigid external ducting does not allow for a secure pressure fit around thedryer’s exhaust duct.
Task 2. Document Dryer Operating Characteristics
♦ The temperatures within the dryer, under both normal and abnormal conditions, weresimilar for the four different dryer designs tested, with only slight variations due todryer internal configurations.
• The temperatures measured inside the heater box, heater intake, and intake intothe tumbler increased when the exhaust duct was partially blocked or fullyblocked. The temperatures inside the tumbler, blower and exhaust ventdecreased when the exhaust vent was partially blocked or fully blocked.
• When the exhaust vent was blocked up to 50 percent, the temperatures insidethe dryer were similar to those measured when there was no blockage of theexhaust vent. When the exhaust vent was 75 percent or 100 percent blocked,temperatures in certain areas inside the dryer increased significantly.
� For one dryer design, the heater intake temperature reached temperaturesover 200° C for the 100% blocked exhaust condition, a 92% increase overthe unblocked condition. For all dryer designs, the average maximumtemperature was near 325° C for the 100% blocked exhaust condition, a351% increase over the unblocked condition.
� For one dryer design, the heater exhaust temperature reached nearly 600° C,an 89% increase over the unblocked condition. For all dryer designs, theaverage maximum temperature was near 600° C for the 100% blockedexhaust condition, an 89% increase over the unblocked condition.
� For one dryer design, the heater housing temperature reached over 200° C, a92% increase over the unblocked condition. For all dryer designs, theaverage maximum temperature was over 200° C for the 100% blockedexhaust condition, a 92% increase over the unblocked condition.
• Under normal operation, the airflow inside the exhaust vent decreaseddramatically as the lint screen became blocked with lint particles. For all dryerdesigns, the average exhaust air velocity with an unblocked exhaust ventdropped from 1300 sfpm (standard feet per minute) to 900 sfpm.
• In general, the dryers only cycled on the high-limit thermostat when the exhaustvent was 75 or 100% blocked, which caused the temperatures near the heater toincrease significantly.

US CONSUMER PRODUCT SAFETY COMMISSIONFINAL REPORT ON ELECTRIC CLOTHES DRYERS AND LINT IGNITION CHARACTERISTICS
May 2003
135
• When the primary thermostat was bypassed (simulating a thermostat failure), thedryer operated at higher than normal temperatures – temperatures similar tothose measured when the exhaust vent was blocked 50 to 75%. In general (3 ofthe 4 dryer designs tested), a failed-closed primary thermostat did not cause thedryer to cycle on the high limit thermostat for the unblocked exhaust ventcondition.
Task 3. Monitor Lint Distribution
♦ Lint begins to accumulate inside a dryer chassis upon first use. Lint accumulates onthe dryer’s components, including the heater and the dryer floor. This accumulationoccurs even when the dryer’s lint screen has been cleaned after each usage, and thedryer is properly exhausted.
♦ After 100 cycles, there was evidence of lint settling on dryer components and insidethe dryer floor. Leaks in the fan housing and exhaust vent allowed lint-containing airinside the dryer chassis.
♦ Seals in the dryer’s interior exhaust venting may not be adequate to prevent linty airfrom escaping into the dryer’s interior.
Task 4. Determine Characteristics Required for Lint Ignition
♦ Lint that accumulates on the heater housing can ignite under conditions of a failedhigh-limit thermostat and a blocked exhaust vent.
• Lint on the heater housing ignited under certain conditions.
� Lint ignited on the heater housing when the airflow through the heater was100% blocked and the high-limit thermostat had been bypassed (simulating athermostat failing to open).
� Only some areas of the heater housing were susceptible to lint igniting, undercertain conditions.
� In most conditions, lint tended to be consumed by pyrolysis or thermaldecomposition.
♦ Lint accumulating near the heater intake can ignite before the high-limit thermostatswitches the heater element off.
• Lint placed at the heater intake ignited under certain conditions. Under someconditions of reduced airflow, lint near the heater ignited even with a functionalhigh-limit thermostat.
� Lint ignited up to 5 inches from the heater element with no airflow into theheater and the high-limit thermostat bypassed.

US CONSUMER PRODUCT SAFETY COMMISSIONFINAL REPORT ON ELECTRIC CLOTHES DRYERS AND LINT IGNITION CHARACTERISTICS
May 2003
136
� Lint ignited up to 3 inches from the heater element with no airflow through theheater and with a functional high-limit thermostat (i.e., thermostat connectedin series with the heater element).
� Lint placed 3 inches from the heater element ignited with airflow into theheater reduced to 300 sfpm. The high-limit thermostat was connected inseries with the heater element.
♦ Lint ingested by the heater and embers expelled from the heater exhaust can easilyignite additional lint or fabric in the air stream, resulting in additional embers in thedryer system and exhaust vent.
• Lint ingested into the heater ignited material downstream.
� In all three tests conducted, lint samples ingested into the heater ignitedadditional lint material downstream. The lint samples ingested by the heaterweighed only 0.10 gram.
� Lint samples ingested into the heater ignited a sample of 100% cotton towelmaterial in the air stream. The lint samples ingested by the heater weighed0.30 gram.
The CPSC staff noted the following during testing and analysis of the data:
♦ The high-limit thermostat may prematurely fail when subjected to high ambienttemperatures.
• Two high-limit thermostats failed during the test program.
� The first high-limit thermostat failed after approximately 10 hours and 47cycles (includes total estimated time the thermostat was exposed totemperatures above and below the upper set point).
� The second high-limit thermostat failed after approximately 98 hours and 26cycles (includes total estimated time the thermostat was exposed totemperatures above and below the upper set point).

US CONSUMER PRODUCT SAFETY COMMISSIONFINAL REPORT ON ELECTRIC CLOTHES DRYERS AND LINT IGNITION CHARACTERISTICS
May 2003
A-J
Appendices A to JThe appendices can be accessed under the voluntary standards page at www.cpsc.gov
Appendices
Appendix A - Additional test data on Dryer Design A – Task 2
Appendix B - Additional test data on Dryer Design B – Task 2
Appendix C - Additional test data on Dryer Design C – Task 2
Appendix D - Additional test data on Dryer Design D – Task 2
Appendix E - Additional data for Task 3
Appendix F - Additional test data for Task 4 (Lint on the Heater Housing)
Appendix G - Additional test data for Task 4 (Lint at the Heater Intake)
Appendix H - Additional test data for Task 4 (Lint Ingested into the Heater)
Appendix I - Supporting test data for Discussion
Appendix J - Video clips of Task 4 testing