
final report - Inside Cotton
30
1 of 30 FINAL REPORT Part 1 - Summary Details Cotton CRC Project Number: 4.03.06 Project Title: Industrial testing and commercial development of moisture and contamination sensors for Australian gins (Ginning II) Project Commencement Date: 7/2009 Project Completion Date: 6/2012 Cotton CRC Program: Value Chain Part 2 – Contact Details Administrator: Jo Cain Organisation: CSIRO Plant Industry Postal Address: Locked Bag 59, Narrabri NSW 2390 Ph: 02 6799 1513 Fax: 02 6793 1186 E-mail: [email protected] Principal Researcher: Dr Andrew Krajewski Organisation: CSIRO Materials Science and Engineering Postal Address: PO Box 21. Belmont VIC 3216 Ph: 03 5246 4000 Fax: 03 5246 4057 E-mail: [email protected] Supervisor: Dr Stuart Gordon Organisation: CSIRO Materials Science and Engineering Postal Address: PO Box 21, Belmont VIC 3216 Ph: 03 5246 4000 Fax: 03 5246 4057 E-mail: [email protected] Signature of Research Provider Representative:
-
Upload
khangminh22 -
Category
Documents
-
view
0 -
download
0
Transcript of final report - Inside Cotton

1 of 30
FINAL REPORT
Part 1 - Summary Details Cotton CRC Project Number: 4.03.06
Project Title: Industrial testing and commercial development of moisture and contamination sensors for Australian gins (Ginning II)
Project Commencement Date: 7/2009 Project Completion Date: 6/2012
Cotton CRC Program: Value Chain
Part 2 – Contact Details Administrator: Jo Cain Organisation: CSIRO Plant Industry
Postal Address: Locked Bag 59, Narrabri NSW 2390 Ph: 02 6799 1513 Fax: 02 6793 1186 E-mail: [email protected] Principal Researcher: Dr Andrew Krajewski Organisation: CSIRO Materials Science and Engineering
Postal Address: PO Box 21. Belmont VIC 3216 Ph: 03 5246 4000 Fax: 03 5246 4057 E-mail: [email protected] Supervisor: Dr Stuart Gordon Organisation: CSIRO Materials Science and Engineering
Postal Address: PO Box 21, Belmont VIC 3216 Ph: 03 5246 4000 Fax: 03 5246 4057 E-mail: [email protected] Signature of Research Provider Representative:
2 of 30
Part 3 – Final Report Guide (due at 31st May 2012) Background The drive to measure and ensure optimum moisture levels for seed-cotton and lint is associated with optimizing the ginning process to allow good cleaning, ginning, baling and safe storage. Dry cotton is easier to clean but will be damaged during ginning and lint cleaning. On the other hand, cotton with excessive moisture is difficult to gin and clean, and will degrade during storage. To optimise processing and fibre quality the amount of moisture taken up or lost by cotton under ambient conditions needs to be balanced with the amount of drying or moisture applied during the pre-cleaning, ginning and baling processes. Accurate moisture sensing is critical to these needs. The issue with contamination is that even a single foreign fibre can lead to the downgrading of yarn, fabric or garments or even rejection of an entire batch. Most contamination arises from impurities incorporated into the bale as a result of human interaction during harvesting, ginning and baling. Australia must ensure that its low-contamination ‘type’ is maintained in order for growers to continue to receive their current premiums. Spinners indicate that low-contamination is one of the most favourable aspects of Australian cotton1
. However, despite this view mills have reported increasing incidences of contaminants, particularly from the yellow and green module plastic that now covers around 60% of the harvested 2012 crop.
Objectives Two broad, ambitious objectives were set out for this project. The first was to design and build a moisture measuring sensor without the operational shortcomings of current sensors and to connect this sensor with a moisture replenishing system. The second objective was to design and build a sensor to detect contamination in loose fibre linked with a system to remove the detected contamination from transport ducting. Both objectives are aligned with the industry’s strategy of maintaining and improving fibre quality. Both moisture and contamination sensing systems were designed and built during this project. Of the two, the moisture measuring system progressed further and was tested and improved after trials in industry for the three years of the project. A full international patent for the moisture sensor is being tested in various countries; and a second peer review paper is being written on the sensor’s performance in industry and its results when linked to a commercial drying management system. The contamination sensor, which underwent preliminary testing using the CSIRO gin, was not tested in industry. Design of a full scale version of the contamination sensor was completed and reviewed by potential manufacturing partners. Late in the project (after the 2011 season) work on the contamination sensor dovetailed with industry concerns over increased incidences of the yellow and green plastic module wrap contaminating export cotton. As a result new proposals were written to industry (the ACGA and CRDC) to expedite development of an integrated contamination sensing system. At the time of writing pledges to fund these proposals had been received.
1 Gordon, S., van der Sluijs, M. and Prins, M., ‘Quality Issues for Australian Cotton from a Mill Perspective’, pub
Australian Cotton CRC, June 2004

3 of 30
The status of set project objectives is detailed in Table 1 below. Table 1 – Project objectives, milestones, performance indicators and achievement
Objective Milestone Performance Indicator Status
Analyse performance and calibration data of CSIRO moisture sensor after second gin season
Report showing performance and calibration data for CSIRO moisture sensor
Performance of sensor is improved and calibration range is extended by trials during second season
Achieved
Connect moisture sensor to moisture restoration and/or air drying systems
Interface connections are known and viable for CSIRO moisture sensor
Achieved
Review provisional patent/IP situation
Ensure IP is secure Achieved
Interface CSIRO moisture sensor with gin control system
Physical connections are made to gin control system
Moisture sensor provides information to gin control
Achieved
Moisture sensor provides workable data for gin control
Data showing feedback mechanism from sensor to ginner and potential savings/benefits from information
Achieved
Commercial plan for CSIRO moisture sensor is developed
Commercial potential of CSIRO moisture sensor is realised
Achieved
Analyse sensitivity of CSIRO contamination sensor
Report showing sensitivity of CSIRO moisture sensor
CSIRO contamination sensor is viable in terms of its sensitivity.
Achieved
Review novelty of sensor in light of previous IP
Review of IP reveals any novelty
Achieved
Reviewing mechanisms for removing and/or counting contaminant pieces in baled cotton
Engineering flow diagrams showing possible exit points for contamination and mechanisms
Achieved
Build contamination removal system for gin
Report reviewing plans to implement contamination removal system
Engineering flow diagrams showing mechanism of removal and exit points for contamination
Achieved
Trial prototype de-contamination system
Prototype is built and tested Achieved
Prototype testing continues
Conclude prototype testing and initiate discussions for industrial trial
Achieved

4 of 30
Methods Moisture sensing The moisture sensor was trialled in commercial gins during the 2009, 2010 and 2011 gin seasons. Improvements were made after each season. In 2011 the sensor was moved from the Auscott Narrabri Gin to the NW Gin at Moree so trials could be conducted using gin hopper (pre-gin) humidifiers. The moisture sensor measures the dielectric properties of any water in cotton (measured by a large area capacitor) and light transmission through cotton as it moves through the duct between the gin stand and lint cleaner. Details on the design, construction and testing of the moisture sensing device are described in a peer-review paper entitled ‘An In-Line, Non-Invasive Cotton Moisture Measurement Device for Gin Ducts’ published in Transactions of the American Society for Agricultural and Biological Engineering2. An abridged version of this paper was also prepared for the Beltwide Cotton Ginning Conference held January 20103
.
A description of the device’s working elements can be found in an international (PCT) patent application entitled ‘An apparatus and process for measuring properties’ (‘moisture meter’) lodged in December 2009. During the 2011 ginning season the sensor was successfully used to track the moisture of ginned lint travelling at 20 m/sec through a modern, commercial gin. Energy consumption by the gin’s dryers and humidifiers was measured and fibre quality was measured against changes in moisture content, which was varied at set intervals using Samuel Jackson gin humidifying hoppers. Results from the 2011 season indicate the moisture sensor can be used to control dryers and humidifiers in order to keep fibre moisture consistent and in doing so improve fibre quality, and reduce gas consumption. Analyses of the energy added to the bale in order to alter fibre quality were conducted. Information from the analysis was combined to develop a control system for the gin’s dryers and humidifiers. Using data from the 2011 trials a simulation of the control system showed a large amount of gas energy could be conserved, with associated large savings each season to gin operating costs (gas). The trials provided further evidence that the non-invasive moisture sensing device was sensitive and reliable enough to be used to reduce energy costs and improve fibre quality. The device may be used, apart from online moisture control, for the research on gin’s energy conservation. A paper describing this work was prepared for the Beltwide Cotton Ginning Conference held in January 20124
. A peer-review version of this paper is currently being prepared.
2 Krajewski, A. S. and Gordon, S. G., An In-Line, Non-Invasive Cotton Moisture Measurement Device for Gin Ducts, Trans. of the ASABE, 53(4), 1-9, 2010 3Krajewski, A. S. and Gordon, S. G., Non-Invasive Cotton Moisture Measurement Device for Gin Ducts, proceed. Beltwide Cotton Conferences, National Cotton Council, New Orleans LA, 2010 4 Krajewski, A. S. and Gordon, S. G., Non-invasive Cotton Moisture Measurement for Gin Ducts and its Impact on Cotton Fibre and Gin Performance, proceed. Beltwide Cotton Conferences, National Cotton Council, Orlando FL, 2012

5 of 30
Contamination detection Australian cotton is viewed as a quality product with little or no contamination and is usually purchased (at a premium) to produce high quality, fine count ring spun yarn. Spinner’s responses in fibre quality surveys indicate low contamination is one of the most favourable properties associated with Australian cotton. Preliminary investigations of capturing images of cotton contamination travelling at high speed through air were performed using a purposely built closed circuit duct. A high speed camera (up to 2000 fps) was used to record footage of the flying cotton and contamination in the duct (see Final Report for CRC Project 4.03.04, September 2009). The colour and the size of the contaminant were chosen after examination of contaminants collected manually from the bale (Figure 1)5
.
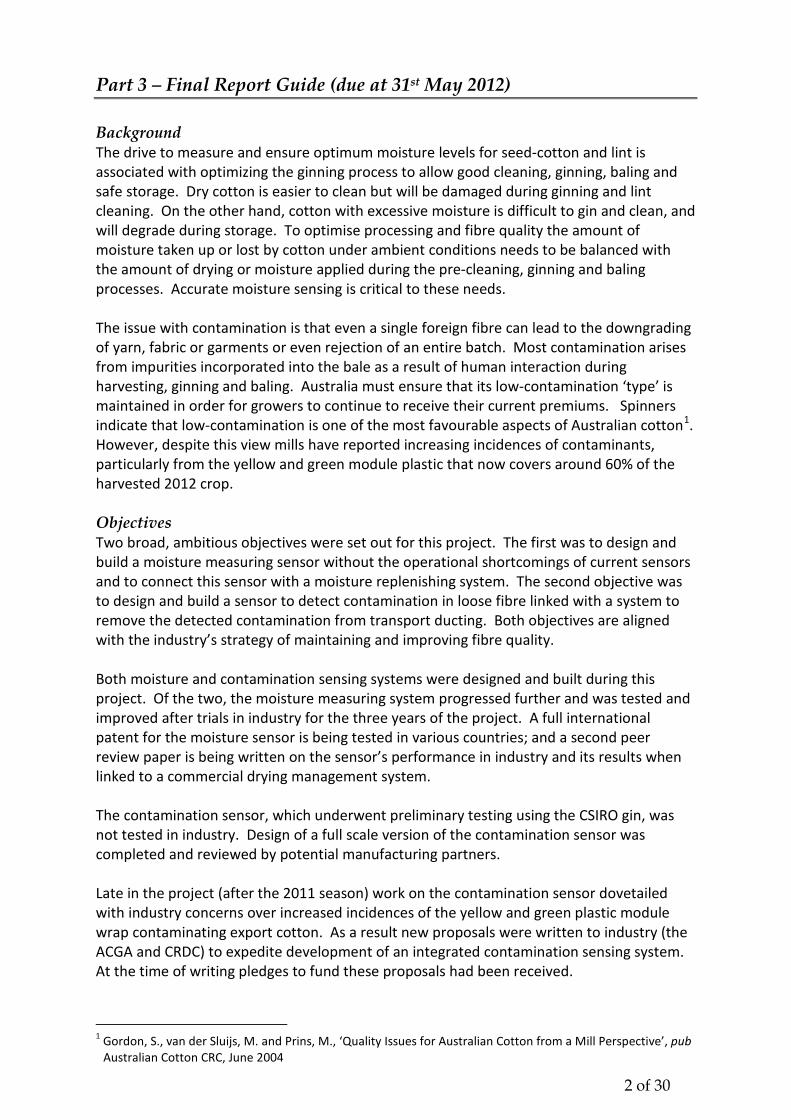
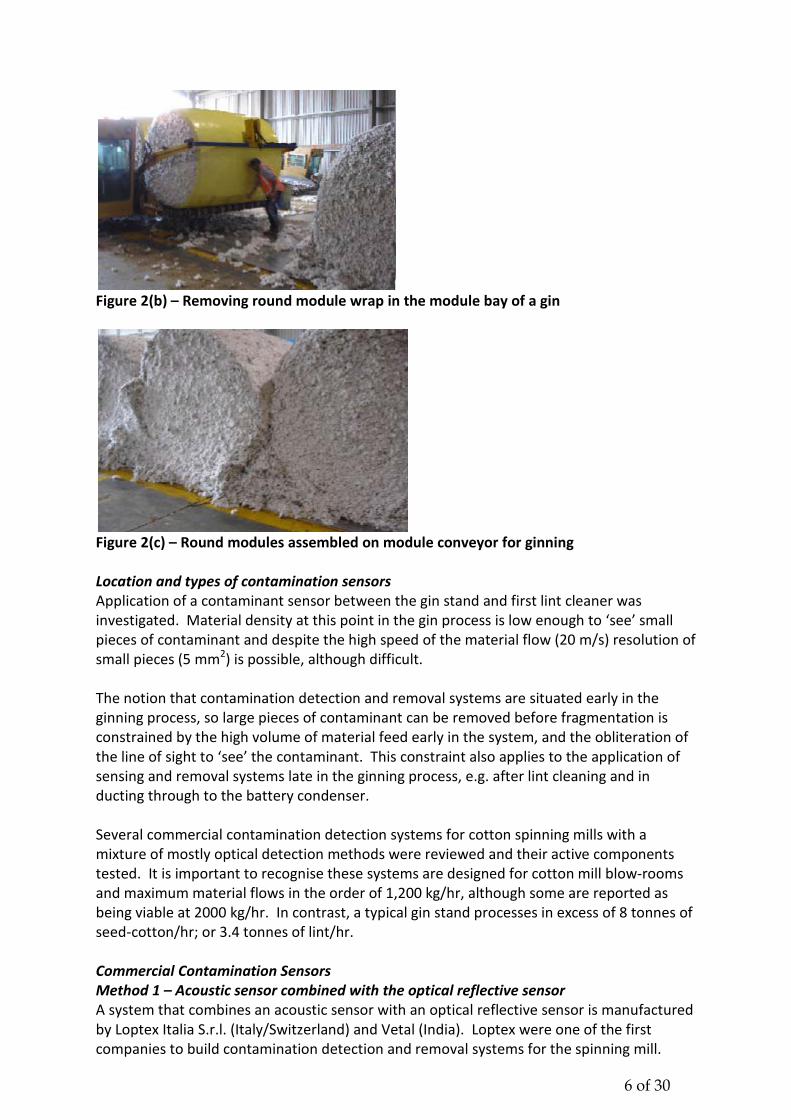
Figure 1 – Samples of cotton contaminants New harvesters introduce a new contaminant The advent of new cotton harvesters that produce wrapped modules on the harvester has reduced harvest costs. However, the pale yellow and green plastic that encases these modules is a serious contamination risk. Recorded evidence from ginners over the last two seasons indicates that not all plastic wrap is removed in the module feed area by operators or the mechanised systems used to remove the wraps. Figures 2(a), (b) and (c) show the new wrapped modules and one of the semi-automatic systems used to remove wraps in the module bay of the gin. Improper removal and puncturing of the wrap during transport from the farm to the gin means that fragments of plastic are finding their way into the gin and into high-value export bales. There is a matter of urgency to measure and solve this issue. It is expected in excess of 80% of Australia’s cotton crop will be harvested using these new round module pickers in 2013.
Figure 2(a) – Round modules in gin yard
5 Van der Sluijs, M.H. J., Contamination and its significance to the Australian cotton industry, 31 pp, CCC CRC (pub.), May 2009
6 of 30
Figure 2(b) – Removing round module wrap in the module bay of a gin
Figure 2(c) – Round modules assembled on module conveyor for ginning Location and types of contamination sensors Application of a contaminant sensor between the gin stand and first lint cleaner was investigated. Material density at this point in the gin process is low enough to ‘see’ small pieces of contaminant and despite the high speed of the material flow (20 m/s) resolution of small pieces (5 mm2) is possible, although difficult. The notion that contamination detection and removal systems are situated early in the ginning process, so large pieces of contaminant can be removed before fragmentation is constrained by the high volume of material feed early in the system, and the obliteration of the line of sight to ‘see’ the contaminant. This constraint also applies to the application of sensing and removal systems late in the ginning process, e.g. after lint cleaning and in ducting through to the battery condenser. Several commercial contamination detection systems for cotton spinning mills with a mixture of mostly optical detection methods were reviewed and their active components tested. It is important to recognise these systems are designed for cotton mill blow-rooms and maximum material flows in the order of 1,200 kg/hr, although some are reported as being viable at 2000 kg/hr. In contrast, a typical gin stand processes in excess of 8 tonnes of seed-cotton/hr; or 3.4 tonnes of lint/hr. Commercial Contamination Sensors Method 1 – Acoustic sensor combined with the optical reflective sensor A system that combines an acoustic sensor with an optical reflective sensor is manufactured by Loptex Italia S.r.l. (Italy/Switzerland) and Vetal (India). Loptex were one of the first companies to build contamination detection and removal systems for the spinning mill.

7 of 30
Initially Loptex used the optical detection and removal system patented by CSIRO6
. Later, to improve detection efficiency they introduced an acoustic sensor in tandem with the optical sensor. An Indian company Vetal (India) now manufactures (copies) a similar system.
Figure 3 shows the components of the Loptex Optosonic system7
. The optical sensors measure the average brightness of the raw material and recognize darker coloured contamination. The sonic (or acoustic) sensor measures the average density of the cotton and recognizes contaminants on the basis of their different density; the acoustic sensor is useful in indicating colourless contaminants, e.g. light coloured polypropylene and polyethylene. Furthermore, since its acoustic waves penetrate the fibre flock, hidden contamination is reportedly detected. Loptex systems are matched to equal the capacity of standard mill blow-rooms, i.e. between 600 kg/hr to 1,200 kg/hr; the 1200 kg/hr system representing the maximum throughput.
Figure 3 – Loptex's Optosonic Technology (5) Method 2 – Visible light together with UV and polarised light and multiple detectors An optical based system is manufactured by Trützschler GmbH & Co. KG (Germany), a company whose main products include early stage opening, cleaning (blow-room) and short staple carding machines. The Trützschler system uses visible (white) light together with UV and polarised light sources. Although their system is built for cotton spinning mills, the system has also recently been applied to slower production roller gins (in India). The detection system in the Trützschler system combines light sources of different wavelengths (visible and UV light) and different polarisation states (polarised/unpolarised) in order to highlight and detect contaminants. Detection by the different lighting states is combined, without the cameras, inspection chambers, glass channels or evaluating components having to be present in duplicate, or without the UV light and polarised light interfering with one another8,9
6 Abbott, G. M., Allen, L. A. and Johnson, D. M., Sorting pneumatically conveyed material, PCT International Patent Classification B07C 5/342, 5/00, B65G 47/18, 1988
. Figure 4 shows the components of the Trützschler
7 Loptex Italia S.r.l., Technology: Measuring channel of the Optosonic system [online], available: http://www.loptex.it/tecnology.html [accessed 17 Mar 2010] 8 Trützschler GmbH & Co. KG, A modular approach to solving the foreign matter problem in ginning and spinning, Pakistan Textile Journal, September 2009

8 of 30
Securoprop SP-FPO system. Fibre tufts, which are moved by air through the machine, enter the device through an upper opening (D) via (2a) and are transported vertically down a transport duct with a cross-section of 150 mm x 1800 mm, along which the system’s lighting and detectors (cameras) are arranged. The first detector is located in the upper part of the duct and comprises two CCD line-scan cameras (4’ and 4’’) and lighting system (6’ and 6’’), which emits visual light. Coloured foreign material is detected within this first detection module. In a second housing is another detector device, comprising another CCD camera (9). The lighting system (11) within the second housing is equipped with polarisation filters, while on the other side a lighting system (12) for UV light is arranged. The UV and polarised light features of this second system allow white and transparent foreign materials, e.g. white PP and PE, to be detected. Below this second detection module (7’’) is a separation module (13), which comprises a row of air nozzles (14) able to function independently or in unison depending on where and how much contaminant in the airstream is detected. On the opposite site of the row of nozzles is a collection container (15), which under suction enables contaminants blown out of the conveyed stream to be extracted. De-contaminated material exits the system at (2b). The capacity of the Securoprop SP-FPO system is nominally matched to the capacity of Trützschler blow-rooms, the most modern and productive of which reach throughputs of 2000 kg/hr.
Figure 4 – Trützschler apparatus for detection of foreign matter in fibre material (6) Method 3 – Diffused illumination The Cotton Sorter by BarcoVision uses ultra-fast CCD cameras to detect contaminants highlighted using diffused illumination, from raw cotton and which are then removed by means of high speed air valves10
.
9 Trützschler GmbH & Co. KG (2010), Apparatus for detection of foreign matter in fibre material, GB Pat. 2461967 10 Barco Cotton Sorter, BARCO-Loepfe S.r.l, Italy Information Brochure

9 of 30
The system can be installed in existing blow-room lines without adding any fan capacity to elevate the cotton and drop it through the inspection zone. This system has a transparent tunnel where cotton is diffusely illuminated in the inspection zone. The individual tufts are observed by means of four high-resolution CCD line scan cameras that acquire images from both the sides simultaneously, thus enhancing the detection capability. Contaminants are described as a deviation in colour and size from raw cotton in terms of contaminant width (number of pixels) and length (number of scan lines). Tolerances in colour are defined by means of threshold levels (limits). The objects with a colour value below this limit are being identified as a contaminant. Method 4 – Optical-reflective method that compares different reflective surfaces Jossi Systems AG, located in Switzerland offers two different detection systems, which can be used on their own, or in combination. The production rate of Jossi systems is similar to other systems, i.e. around 1,200 kg/hr, with a working width of the detection duct from 800 or 1200 mm. One system is called the Vision Shield, which detects coloured contaminants. The second system, called MagicEye M1 is able to detect white and transparent contamination. It relies on plastic contaminants having a different reflective surface than cotton; the surfaces of plastic contaminants are more likely to be specularly reflective (shiny) whereas the surface of cotton-based, e.g. fabric, or natural contaminants is more likely to be diffuse in its reflection characteristics – see Figure 5. In the MagicEye M1 a retro-reflective material is used to enhance the return signal (reflectance) from the contaminant. A signal is sent to the separator when the photo-detector signal exceeds a predetermined duration and intensity.
Figure 5 – Detection of white and invisible contamination with Jossi's Magic Eye (10) The material flow is irradiated alternately at many different orientations, so that the opportunity of catching the reflectance from contaminants is increased. In their patent Jossi11,12
11 Jossi Holding AG, Verfahren und Vorrichtung zum Erkennen und Ausscheiden von Fremdstoffen, WO Pat. 2008/058573 A1
explain the different ways of illuminating and capturing contaminants. In one method two types of cameras; a colour and a black and white camera are used. The cameras are synchronised with the lighting system, which consists of an alignment of LED light sources. Figure 6 shows how the components in this method are arranged. With this alignment the advantages of both cameras can be combined. To detect coloured
12 Jossi Holding AG, Contamination of Polypropylene MAGIC EYE M1 [online], available: http://www.jossisystems.ch/images/stories/me_en.pdf [accessed 16 Mar 2010].

10 of 30
contamination with the colour camera, all LEDs are activated, so that a balanced plane (2-dimensional) illumination is achieved. To detect plastic contamination with the black and white (b/w) camera, the LEDs are activated singularly or in groups. The best detection rates of plastic and textile contamination is achieved when the LEDs and the detection unit, consisting of the b/w and the colour camera, are used alternately. This means, that in one moment the b/w camera is recording reflected light and in the other moment the colour camera is recording coloured pictures.
Figure 6 – Jossi detection method (10) Method 5 – Infra red and near infra red spectroscopy methods There have been some attempts to use infrared (IR) or near-infrared (NIR) radiation in order to detect contamination in cotton. This research has been conducted especially to detect transparent and white foreign matter. In 1997 Jossi Systems AG filed a patent13
for a device that measures the reflection (or absorbance) of wavelengths in the 400 to 2500 nm range, i.e. using a combination of visible light (400 to 700 nm) and near-infrared (700 to 2500 nm). However, this detection system has never been commercialised or tested in commercial production.
In 2005 research14
13 Jossi Holding AG (1997), Vorrichtung zum Erkennen und Ausscheiden von Fremdstoffen in Fasermaterial, DE Pat. 297 19 245 U 1
was done to develop an optimal wavelength imaging system for detecting foreign fibres in the NIR region, i.e. from 750 to 2500 nm. This method is based on the principle that different fibres have different spectral absorption and reflectance characteristics. Using Fast Fourier Transforms on the spectra, the optimal wavelength for detecting foreign fibres was determined and accordingly an optimal wavelength for illuminating and imaging contaminants was developed. The wavelength selection experiment showed that 940 nm was the most appropriate wavelength for detection and imaging of a wide range of foreign fibres in cotton. The system consisted of a NIR CCD camera, a dual light source, and a computer equipped with a frame grabber. The light source consisted of a pair of LED array light sources in the 940 nm band. Figure 7(a) shows the images of contaminants against raw cotton fibre under visible light. Clearer, images of
14 D. Jia, T. Ding (2005), Detection of foreign fibers in cotton using near infrared optimal wavelength imaging, Optical Engineering, 44(7), 1-6.

11 of 30
these contaminants is seen when the same specimen is illuminated by light (radiation) at 940 nm, although image contrast between the cotton and contaminants remains low.
Figure 7 – Representative images: (a) visible light and (b) 940 nm wavelength (14) For further target extraction a single-point processing method based on the intensity of single pixels was applied, with emphasis on the modification or transformation of pixel brightness to enhance the image. Figure 8 illustrates the enhanced image and the subsequent binary image.
Figure 8 – Extraction of foreign fibres: (a) enhanced image and (b) binary image (14) The application of NIR and IR chemical spectra has also been investigated to detect contaminants in raw cotton, although the signal response is frustrated by noise and resolution difficulties. Moreover, as mentioned previously spectrometer instruments are expensive and not generally practical for application in the harsh gin environment. In 2006 researchers15
15 D.S. Himmelsbach, J.W. Hellgeth, and D.D. McAlister (2006), Development and Use of an Attenuated Total Reflectance/ Fourier Transform Infrared (ATR/FT-IR) Spectral Database To Identify Foreign Matter in Cotton, Journal of Agricultural and Food Chemistry, 54, 7405-7412.
from the USA looked at the use of an attenuated total reflectance/Fourier transform infrared (ATR/FT-IR) spectral database to identify foreign matter in cotton and to ameliorate the signal loss and insensitivity of direct radiation transmission/reflection techniques. To this end, ATR/FT-IR spectra of retrieved foreign matter were collected and subsequently rapidly matched to an authentic spectrum in a spectral database. The database included contaminants typically classified as “trash”, cotton plant parts and grass plant parts; “foreign objects and materials”, synthetic materials; organic materials; plus entomological and physiological sugars and inorganic materials. The spectral matching resulted in consistently high-score identification of the foreign matter based on chemical composition, irrespective of its particle size. In this research the fingerprint region (1800 to 650 cm-1 or 5500 to 15500 nm) was chosen to search, because it generally gave the higher matches. However, for the spectra of samples where the fingerprint region was weak or showed few features, the addition X-H stretch region of the spectrum (3700 to 2700 cm-1 or 2700 to 3700 nm) to the search increased the match quality to the database library.

12 of 30
Method 6 – CSIRO-CRC Contamination Sensor – Balanced Illumination For the system developed in this project a balanced light was chosen as a preferable method of contaminant illumination. This system is used in the Loptex and Trutzschler systems and represents a technology with proven repute in this application. The system uses a high-speed b/w or colour camera or cameras to cover the full width of duct (2400 mm); line scan b/w or colour cameras could also be considered. A light arrangement was designed in order to achieve an optimal balanced light. It is shaped in the form of a circle, with lamps illuminating the cotton tufts from different directions towards to the centre of the duct. Figure 9 depicts a schematic diagram of the design and the light arrangement on the duct (see Final Report for CRC Project 4.03.04, September 2009).
Figure 9 – Small duct balanced light arrangement: (a) schematic diagram, (b) actual system Removal system There are many contaminant removal devices connected to the above commercial systems. Because of the large number of options for removing contaminants, the project team decided to defer technical work on devising removal and exit mechanisms until a sound detection system had been tested and agreed to by commercial partners. At the time of writing, Loptex Italia had entered an agreement to co-develop a contamination detection system with CSIRO for high-speed ginning. To this end the air valve system used across the Loptex Optosonic Sorter was being adapted for the deeper, higher volume gin duct (150 x 2400 mm).

13 of 30
Results Moisture sensor Figure 10 shows results from the moisture sensor recorded in a modern, commercial gin and off-line results measured using a VOMAX 465 microwave moisture tester. These results were measured in June 2011 as part of checks on the sensor after it was commissioned. Conditions during this period of testing testing were often wet as a result of rainfall. Previous tests of the sensor in industry were affected by narrow ranges in the moisture of the cotton tested (between 5% and 6%), although as reported at the time correlations approaching 80% were likely with an increased range of values in the calibration. The data in Figure 10 supported this proposition with a R2 of 0.786 on a range of values tested from 4.8% to 7.8%.
Figure 10 – Moisture sensor results versus off-line reference values measured using a VOMAX 465 Microwave Analyser Trials of the sensor were conducted using consistent runs of cotton in August 2011. Runs were selected on the basis of consistency (in variety, production method and paddock) and fibre length near the base grade for length applied to Australian cotton, i.e. 1.125 inches (28.6 mm). At the time of ginning, cotton not achieving the Australian base length grade was subject to discounts in the order of 2.5 to 6 cents US/lb. Three runs of cotton were tested. Growers, production and harvest methods differed between runs. All runs were delivered to the gin as conventional rather than newer round modules. Table 2 lists the production and harvest method for each run along with the average High Volume Instrument (HVI) properties for each run. Table 2 – Cotton runs measured
Day/Run Bales/Run Production method
Harvest Ginning rate
(bales/hr)
MIC LEN (inch)
STR (g/tex)
7/8/11 72 Irrigated Spindle 54 4.28 1.127 33.16
8/8/11 327 Irrigated Spindle 54 4.33 1.130 31.66
11/8/11 219 Skip row – partial irrigation
Stripper 36 4.25 1.124 31.83
14 of 30
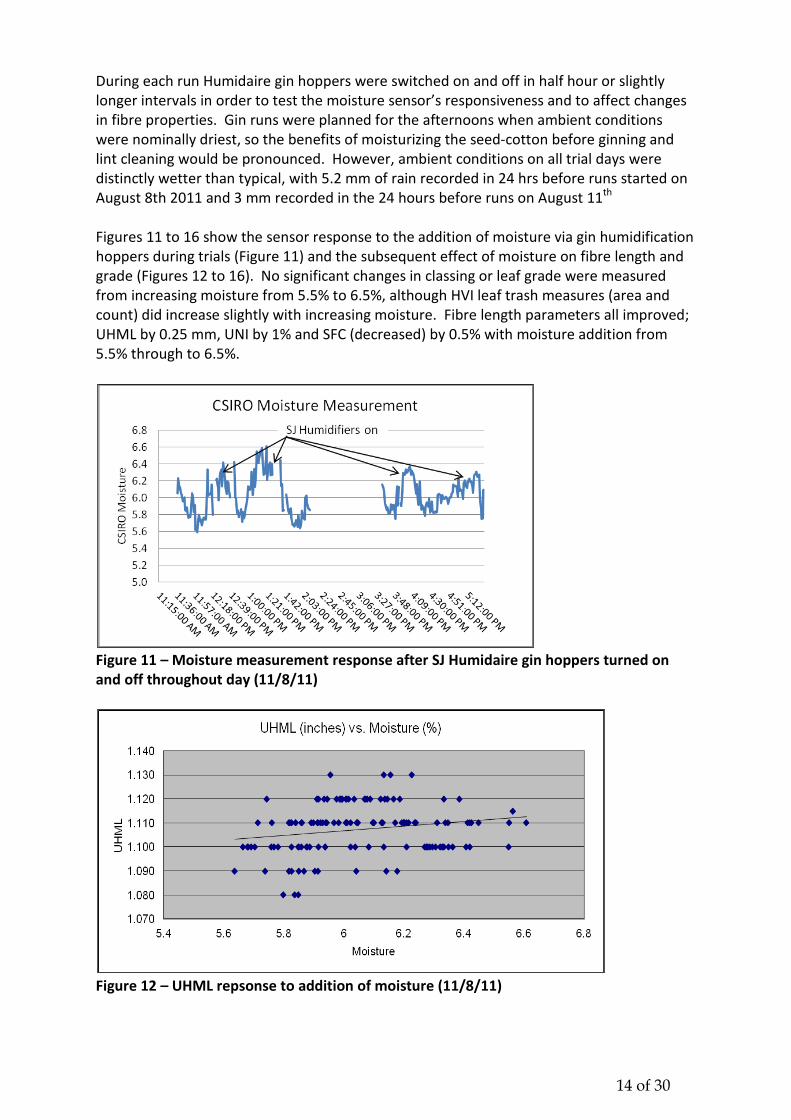
During each run Humidaire gin hoppers were switched on and off in half hour or slightly longer intervals in order to test the moisture sensor’s responsiveness and to affect changes in fibre properties. Gin runs were planned for the afternoons when ambient conditions were nominally driest, so the benefits of moisturizing the seed-cotton before ginning and lint cleaning would be pronounced. However, ambient conditions on all trial days were distinctly wetter than typical, with 5.2 mm of rain recorded in 24 hrs before runs started on August 8th 2011 and 3 mm recorded in the 24 hours before runs on August 11th Figures 11 to 16 show the sensor response to the addition of moisture via gin humidification hoppers during trials (Figure 11) and the subsequent effect of moisture on fibre length and grade (Figures 12 to 16). No significant changes in classing or leaf grade were measured from increasing moisture from 5.5% to 6.5%, although HVI leaf trash measures (area and count) did increase slightly with increasing moisture. Fibre length parameters all improved; UHML by 0.25 mm, UNI by 1% and SFC (decreased) by 0.5% with moisture addition from 5.5% through to 6.5%.
Figure 11 – Moisture measurement response after SJ Humidaire gin hoppers turned on and off throughout day (11/8/11)
Figure 12 – UHML repsonse to addition of moisture (11/8/11)

15 of 30
Figure 13 – Length uniformity response to addtion of moisture (11/8/11)
Figure 14 – Short fibre content response to addtion of moisture (11/8/11)
Figure 15 – Classers Grade response to addtion of moisture (11/8/11)

16 of 30
Figure 16 – Leaf Grade (classer) response to addtion of moisture (11/8/11) These trials are discussed in a greater detail in the conference paper entitled ‘Non-Invasive cotton moisture measurement for gin ducts and its impact on cotton fiber and gin performance’ presented to the Beltwide Cotton Ginning Conference, Orlando, January 201216
.
During these trials the concept of using the moisture sensor as an on-line cotton moisture and energy input controller was developed. A simple theoretical model of a drying and humidifying control system was considered. A central processing unit collects the data from the moisture sensor and calculates the fibre moisture changes in the machine direction. An appropriate feedback signal is generated and fed through the control unit to the humidifiers or dryers in order to adjust the cotton moisture to the reference level – nominally 6% after the gin stand. Figure 17 illustrates the basic concept of the model.
Figure 17 – Set-up for the humidifiers/dryers moisture control system.
During the ginning process many irregularities in moisture levels occur. They may be caused by properties of the raw material, e.g. its moisture and density, and external factors like temperature and relative humidity. These variations are mainly compensated by the dryer and humidifying systems that are typically manually adjusted by the gin manager. 16 Krajewski, A. S. and Gordon, S. G., Non-invasive Cotton Moisture Measurement for Gin Ducts and its Impact on Cotton Fibre and Gin Performance, proceed. Beltwide Cotton Conferences, National Cotton Council, Orlando FL, 2012

17 of 30
However, manual adjustment is insensitive and causes overlaps in drying and humidification applications. This causes unnecessary gas consumption, which impacts on the overall cost of running the gin and mitigates holding the fibre at an optimum moisture level for fibre quality. The moisture sensor used in these trials can be used as a moisture controlling device. Such a system can be designed to control driers and humidifiers simultaneously. In the system the moisture sensor would continuously examine the amount of moisture in the cotton by sampling and reporting the cotton condition within set time intervals. A control system was simulated using Labview software (see Figure 18) and the real data collected from the gin run shown in Figure 11.
Figure 18 – Moisture control system showing sensing and control pathways Using this simulation the cost of adding water via humidified air to bring the cotton to 6% moisture was calculated at less than 0.50 cents AUD/bale; energy use (gas consumption) for humidifying cotton above the gin stand represented less than 4% compared with 12% for the battery condenser humidification and 84% for heating air to dry incoming cotton. The simulated system allowed for the humidifiers and dryers to be switched on or off separately or simultaneously at any time so the moisture of the cotton could be maintained at the set level. The system allows saving gas energy in the event when both the humidifiers and driers are switched OFF.
Assuming the pattern of moisture variation on the test day (4.1 hours on 11/8/11) was average in terms of ambient weather conditions and bale moisture content, the total simulated time where both dryers and humidifiers could be switched off was 1.07 hours (25% of the time) eliminating a gas cost/bale of AUD $2.16/bale and a saving of AUD $83.84 in gas for this period of just over one hour. Extrapolating these savings out to 24 hours of production, the total gas savings amount to nearly AUD $500/day. For 12 weeks of gin operation (an average season) the savings are in excess of AUD $40,000.

18 of 30
Contamination Detection A range of detection (camera) and illumination (lighting) methods including those adopted by commercial contamination sensors were reviewed for application in ginning, where material flow, contaminant speeds and transport air volumes are greater. These studies focussed on detection of the yellow (and green) plastic from round module pickers. The following illumination methods were also assessed or reviewed for their effectiveness in detecting yellow plastic.
UV and polarised light Ultraviolet (UV) and polarised light sources as used by the Trützschler Securoprop SP-FPO system were tested with a focus on yellow plastic. The effectiveness of these light sources depends on the optical properties of the contaminant being viewed, e.g. is the contaminant fluorescent or anisotropic in nature? Figure 19(a) shows the contaminant pieces illuminated by visible light, while Figures 19 (b) and (c) show the same fov illuminated at two different levels of UV light. The experiments did not produce meaningful results. Low power UV light did not reduce reflection by the plastic contaminant enough to clarify its image’s boundaries.
Figure 19(a) – Yellow plastic contaminant in cotton by visible light and (b) and (c) the same fov illuminated by two levels of UV light intensity Similarly, polarised light transmission was introduced and tested. The Trützschler system uses a crossed polar arrangement, i.e. polarised light is crossed using one polarising filter set 90 degrees normal to the incident plane (filter), to illuminate specimens. Setup of the polarised illumination arrangements was arranged using the CSIRO balanced light system as per Figure 9. The position of polarising filters is illustrated in Figure 20.

19 of 30
Figure 20 – Setup for the polarised light experiment; sheet 1 shows polarising filters in one plane, while sheet 2 shows polarising filters in second crossed plane (at 90 degrees) Three pieces of yellow plastic were inserted into a cotton tuft. Figure 21 shows the plastic captured (red circles) in balanced visible light by a b/w camera.
Figure 21 – Contaminants in the cotton tuft Figures 22 (a), (b) and (c) show images of the plastic when polarising sheets 1 and 2 were inserted and the top and/or bottom lights were switched on and off. The images show that no meaningful signal related to contaminant detection signal was detected. Following this result the use of polarised light as a means for illuminating detection was abandoned.

20 of 30
Figure 22(a) – Top light on and bottom light off with crossed polarising filters
Figure 22(b) – Top light off and bottom light on with crossed polarising filters
Figure 22(c) – Top light on and bottom light on with crossed polarising filters

21 of 30
Infrared light A system based on infrared (IR) light source and using an IR camera was used to detect the yellow plastic. The feature of this system is its ability to distinguish a specimen on the basis of it temperature differential to its background. Figure 23 illustrates the optical arrangement for the experiment. Infrared illumination source with spectra in between wavelengths of 2 and 14 μm were used for the experiments.
Figure 23 – Setup for the experiments involving infra red camera The images in Figure 24 show changes in the colour of the plastic and seed-cotton after exposure to a heat gun over a short period (< 2 minutes). The results indicate the method might be applicable in detecting large pieces of plastic located on the surface of seed-cotton after heating, e.g. after the gin drying towers. However, pieces of plastic occluded by the cotton remained undetected.
Figure 24 – Infrared camera images showing colour change of seed-cotton and plastic positioned after exposure to a heat gun; LHS at 0 minutes, centre at 2.5 minutes, RHS at 5 minutes exposure Balanced lighting – steps taken to optimise illumination and detection; and compaction of the illumination and detection system After reviewing this range of illumination techniques, balanced lighting was considered the best means of illuminating small pieces of contaminants circulating with cotton at high speed. To test the efficacy of this system further small, coloured beads of about 5 mm2 were attached to a revolving nylon line driven by a small electric motor around two spindle heads. Beads were fixed to the line, surrounded with pieces of cotton and then imaged travelling across the camera fov. The speed of the line was set initially at 20 m/s.
plastic plastic plastic
cotton cotton
cotton

22 of 30
In the first instance a b/w high speed camera was to establish the level of detection for a range of different coloured beads set at two depths of field; in the top half of the duct depth, i.e. within 50-75 mm of the camera lens, and in the bottom half of the duct away from the camera, i.e. within 100-125 mm of the camera lens. Camera shutter speed was set at 1/1250s seconds (s). Detection was determined on the basis of the detected, captured image achieving a percent area according to a constant threshold. The results listed in Table 3 show all bead colours were detected in the upper part of the duct except for the yellow and orange, which were difficult to ‘see’. Detection rate of the beads moving in the lower part of the duct were reduced with only darker beads being detected. This was a result of reduced power to lower part of the test duct – see Figure 9. Table 3 – Different coloured beads carried at 20 m/s in the upper and lower part of the duct across the camera fov; * detection rate about 50%, ** no detection
colour black blue purple light purple
light blue
light green
top part
bottom part ** **
green yellow orange light brown brown red grey
** *
** ** ** ** Camera shutter speeds were increased to improve detection of lighter coloured (light brown and purple) beads. Figure 25 compares different coloured beads at 13 m/s at different shutter speeds. While all of the three beads can be clearly detected with a shutter speed of 1/1875s the light brown and the light purple beads were not visible at a speed of 1/1250s.
Figure 25 – Effect of shutter speed on image detection (a) shutter speed 1/1875s (b) 1/1250s Detection can also be improved by increasing illumination of the specimen. An additional three LED lamps were added to the existing lamps in the underside of the system. Figure 26 shows the upgraded system.

23 of 30
Figure 26 – Small duct balanced light arrangement with extra LED lamps to improve illumination in lower part of duct With the new light arrangement it was possible to increase the shutter speed from 1/1875s to 1/2500s with the frame rate still at 125 Hz. With the higher shutter speed it was possible to detect almost all colours, even in the lower part of the duct, although yellow and light green were still not detectable. Table 4 shows the detection rates for the various colours tested. Table 4 – Different coloured beads carried at 20 m/s at different shutter speeds in the bottom part of the duct; * detection rate about 50%, ** no detection
colour black blue purple light purple light blue light
green 1/1875 s ** ** 1/2500 s *
green yellow orange light brown brown red grey
** ** ** ** **
Since illuminating power decreases to the square with the distance the LED lamps in Figure 26 were moved 80 mm inwards to the centre of the circular lamp arrangement. With more lamps in the bottom section mounted closer together, it was possible to replace the heavy diffusing plate between the bottom light and the duct, which absorbed a proportion of the incident light, with five lighter diffusing sheets, which absorbed less light. Diffusers are necessary to distribute the lamp light evenly across the specimen fov. With increased illumination it was possible to further increase shutter speed to 1/3750s. Since the maximum shutter speed with a frame rate of 125 fps is 1/2500s, the frame rate also had to be increased to 250 fps. The higher shutter speed increased the quality of the pictures – see Table 5, which compares images at shutter speeds of 1/2500s and 1/3750s. At this stage all colours but yellow were detected with high contrast; 50% of the yellow was detectable at 1/3750s.

24 of 30
Table 5 – Different coloured beads carried at 20 m/s at different shutter speeds in the bottom part of the duct; * detection rate about 50%, ** no detection
colour black blue purple light purple
light blue
light green
1/2500s * 1/3750s
green yellow orange light brown brown red grey
** *
Compaction of the image fov In order to make the illumination and detection system more compact in order for it to be applied to gin ducting in an industrial environment, a convex mirror arrangement was tested. Figure 27 shows the arrangement with arrows indicating the new dimensions of the system. In the corner top left you can see the bended (convex) mirror (radius = 500 mm); in the middle a straight mirror positioned at 45 degrees to the horizontal and in the top right hand corner the camera.
Figure 27 – Two mirror arrangement The intention of this arrangement was to transmit and consolidate images captured from across the whole 650 mm wide duct. Prior to these changes the limited angle camera lens used in these experiments could only capture a 180 mm wide fov across the duct. The mirrors also allowed the system dimensions to be reduced from 900 mm in height to around 450 mm. However, this two mirror arrangement failed to clearly detect dark contamination at speeds of 20 m/s. This was attributed to the distortion of the reflected image by the 500 mm radius convex mirror. Figure 28 compares images of dark coloured beads at highs speeds with and without the mirror system.

25 of 30
Figure 28 – Black, violet and blue beads at 20 m/s; (a) without mirror (200 mm wide picture), (b) with 500 mm radius mirror (650 mm wide picture) To investigate the issue of image distortion further only one mirror was used in the configuration as illustrated in Figure 29. This configuration allowed for a reduction in the distance between the duct and mirror, and respectively between the mirror and camera, although the fov was decreased to a width of about 200 mm. The radius of the mirror was increased to 920 mm to prevent deformation to the camera image. The quality of the images, from this arrangement, was very similar to pictures taken without a mirror. Table 6 compares the pictures from the system with and without the mirror. Again yellow images were poor in terms of detection.
Figure 29 – One mirror arrangement Table 6 – Comparison of the pictures of different coloured beads at 20 m/s with (mirror radius = 920 mm) and without the single mirror system; * detection rate about 80%
colour black blue purple light purple
light blue
light green
without mirror with mirror
green yellow orange light brown brown red grey
*
*
In order to estimate the impact of convexity on the quality of the picture the radius of the mirror was changed back to 500 mm and the single mirror tests repeated. At reduced radii

26 of 30
the convex mirror captures a wider fov, in this case about 230 mm across the duct. As expected the picture quality deteriorated in comparison with the pictures recorded during the previous experiment, although the beads were detectable at 20 m/s. Table 7 compares images of the different coloured beads between convex mirrors of different radius. Table 7 – Comparison of the pictures of different coloured beads at 20 m/s with mirror radius at 920 mm and 500 mm; * detection rate about 80%
colour black blue purple light purple
light blue
light green
920 mm mirror
500 mm mirror
green yellow orange light brown brown red grey
*
*
An industrial scale sensor Based on these experiments a full scale contamination sensor for a 2.4 m (2400 mm) wide duct was designed using a single convex mirror married with a wide angle camera lens. The location of the sensor as nominated earlier would be between the gin stand and first lint cleaner. The nominal overall dimensions of the contamination-detection sensor duct would be 2400 x 905 x 150 mm. Two illumination systems were proposed; one visible light and one either UV or IR based. The proposed contamination detection sensor duct is shown in Figure 30 below.
Figure 30 – Full width contamination sensor duct showing cameras with wide angle lens, (nominally) two balanced light arrangements and (convex) mirrors to concentrate image capture across duct fov

27 of 30
Advice was sought from Trützschler engineers with regard to the mechanical and optical design of the sensor. Following their suggestions the following design changes were implemented: • The depth of the duct at 150 mm could present a mal-focus problem – see also Table 3.
Solution: Utilize two cameras to ‘look’ from both sides of a duct. • At least 1.0 to 1.5 m of straight duct are required before the contamination sensor to
mitigate the impact of centrifugal force at 15 m/s after the Super-J on tuft distribution adversely affecting detection efficiency.
• Convex mirrors as well as the cameras must have means for fine adjustment in all axes. • The current arrangement of (LED) tubes could cause dead spots in the middle and on the
far left and right hand margins of the duct, where image is not illuminated. To avoid these, fluorescent or LED tubes should overlap. Solution: Use 2.5 m long LED tubes.
• The glass pane protecting illumination sources, mirrors and cameras should be accessible for regular cleaning. Slightly angling (to 4°) the glass panes towards the inside of the duct, ensures they are hit by cotton tufts, which 'wipe' the surface and keep it clean for a longer periods.
• Use 3CCD colour line scan cameras for truly optimum results. • Reduce camera (lens) viewing angle from 42° to 15° using convex mirror(s) with large
radius. • Use high quality aluminium mirrors, featuring a number of dielectric amplification layers
were recommended. Such mirrors yield above 95% reflection. • Sealing the sensor components against the dust is an important issue. Building and testing a test sensor at the CMSE gin Belmont A shortfall in funding available for objectives around the contamination sensor in the latter part of this project meant the manufacture and installation of an industrial scale contamination sensor was limited to the CMSE gin at Belmont. The gin at Belmont, whilst of a (vintage) industrial scale, has been configured to operate at only a third of its capacity, i.e. 2 bales per hour. A 600 mm wide duct transports ginned lint from the rear of the gin to the first and second lint cleaners. Figure 31 shows a photo of the duct between the rear of the gin stand and first lint cleaner. Figure 32 shows a diagram of the CSIRO contamination sensor fitted into this section of the duct after the advice above from Trützschler engineers.
Figure 31 – Ducting (600 mm wide) between the rear of the CMSE gin stand and first lint cleaner; note no ‘Super-J’ bend between gin and lint cleaner

28 of 30
Figure 32 – Small size contamination detection system for the CMSE gin duct A series of tests using a high speed colour 3CCD camera were conducted in order to test the effectiveness of the contamination sensor in detecting light (pale) yellow contaminants in cotton tufts. As noted, detection using a b/w high speed camera was poor – see Tables 3 to 7. Cotton tufts were ‘doped ‘with the pale yellow module packing material and green and black contaminants. Pictures were captured by the 3CCD camera attached as per Figure 32. The positive detection of yellow plastic was achieved through colour, hue, and illumination manipulations of the captured digital images. These separate image analysis procedures were designed to detect this light coloured contaminants and carried out off-line. Figures 33 (a) and (b) show yellow plastic captured (red circles) by the 3CCD colour camera and highlighted by these procedures. The darker spot in 33(a) and the triangular blobs in 33(b) represent darker pieces of (plastic) contaminant, which can be included or excluded from the analysis.
Figure 33 (a) – Detection of pale yellow contaminant – setup 1

29 of 30
Figure 33 (b) – Detection of pale yellow contaminant – setup 2 Contamination sensor for gins in 2012 A research proposal to the ACGA is attached in Appendix 1. It details efforts during late 2011 and early 2012 to raise funds to install and commission ‘contamination sensors’ in four Australian gins in time for the 2012 season. Loptex Italia S.r.l. visited Australian gins in February 2012 after an invitation by CSIRO. Invitations were also extended to the Trützschler and Jossi companies. In March 2012, the ACGA pledged $150K to engage CSIRO to implement contamination sensor systems into member gins. Loptex subsequently agreed to join this project to provide sensors, valves for contamination extraction and designs to CSIRO for incorporation of their sensor into gin ducting. Work and funding towards the objectives of this new project are currently underway in lieu of new funding from the CRDC. Conclusion Moisture sensor A non-invasive and accurate moisture sensor has been designed, built and successfully tested in industry. Test results show the sensor gives stable, accurate results that can be used to manage heating and humidification in the gin. Results from the sensor were used to model a gin heating/humidifying control system. The model showed the system could improve fibre quality and return significant savings in energy to ginners. Applications for the moisture sensor patent in various countries are currently being made. Commercial interest in the sensor to date has been circumspect; Cotton Incorporated has indicated interest, along with Samuel Jackson (Lubbock TX). More representation to industry is needed to establish the benefits of this invention. Contamination sensor During this project a proof-of-concept contamination sensor was designed, built and tested at CSIRO. Components of the sensor include balanced illumination using visible light, a high speed colour line-scan camera and image analysis software. No extraction points for contaminants were developed as this is already a mature technology implemented in commercial systems for spinning mills. The components for this system were selected after review of a wide range of applicable technologies. At the time of writing, Australian ginners were facing increasing complaints from OS spinning mills as a result of yellow module plastic being found in high quality export bales. The increased incidences galvanised the industry (via the ACGA) late 2011 to take action. Early in 2012, ACGA members pledged to provide extra funding to CSIRO in order to expedite the application of contamination detection and removal systems. This work is currently underway.

30 of 30
Part 4 – Final Report Executive Summary Provide a one page Summary of your research that is not commercial in confidence, and that can be published on the World Wide Web. Explain the main outcomes of the research and provide contact details for more information. It is important that the Executive Summary highlights concisely the key outputs from the project and, when they are adopted, what this will mean to the cotton industry. Two ambitious objectives were set for this project. The first objective was to design and build a moisture measuring sensor without the operational shortcomings of current sensors and the connection of this sensor with a moisture replenishing system. The second, unrelated to moisture management, but no less important in terms of fibre quality preservation, was to design and build a sensor to detect contamination in loose fibre linked with a system to remove detected contamination from transport ducting. Both objectives are aligned with the industry’s strategy of maintaining and improving fibre quality. Moisture sensor The moisture sensor was built and successfully tested in industry. Test results show the sensor gives stable, accurate results that can be used to manage heating and humidification in the gin. Results from the sensor were used to model a gin heating/humidifying control system. The model showed the system could improve fibre quality and return significant savings in energy to ginners. Applications for the moisture sensor patent in various countries are currently being made. Commercial interest in the sensor to date has been circumspect; Cotton Incorporated has indicated interest, along with Samuel Jackson (Lubbock TX). More representation to industry is needed to establish the benefits of this invention. Contamination sensor During this project a proof-of-concept contamination sensor was designed, built and tested at CSIRO. Components of the sensor include balanced illumination using visible light, a high speed colour line-scan camera and image analysis software. No extraction points for contaminants were developed as this is already a mature technology implemented in commercial systems for spinning mills. The components for this system were selected after review of a wide range of applicable technologies. Work is continuing with the Australian ginning industry and Loptex Italia on development and installation of contamination sensors for Australian gins.