Final End Term Paper
62
Value versus Growth: Evidence in NEPSE Value versus Growth: Evidence in NEPSE PAPI Fund Page 1 Submitted to: Sabin Bikram Panta Submitted by: Prajol Joshi Pralin Raj Regmi Ashish Bahadur Silwal End Term
Transcript of Final End Term Paper

Value versus Growth: Evidence
in NEPSE
Value versus Growth: Evidence in NEPSE
PAPI Fund Page 1
Submitted to:
Sabin Bikram Panta
Submitted by:
Prajol JoshiPralin Raj RegmiAshish Bahadur
Silwal
End Term

Table of ContentsBackground:....................................................1Purpose of Study...............................................2Scope of Study.................................................3Limitations of Study...........................................3Conceptual Framework...........................................4Growth Stocks:................................................4Value Stocks:.................................................4Book-to-market equity (B/M) ratio:............................5Earnings to Price (E/P) ratio:................................5Cash Flow to Price (C/P) Ratio:...............................5Dividends to Price (D/P) Ratio:...............................6Value versus Growth:..........................................6
Literature Review..............................................7Diagrammatic Presentation of Concept of Study:.................8Input.........................................................9Process.......................................................9Output.......................................................10
Analysis:.....................................................10Conclusion:...................................................14Scope for further study:......................................15References:...................................................17Annex:........................................................18

Value versus Growth: Evidence in NEPSE
Background:
“As Buffet said in the speech, He’s not looking at quarterly earnings projections,
he’s not looking at next year’s earnings, he’s not thinking about what day of the
week it is, he doesn’t care what investment research from any place says, he’s not
interested in price momentum, volume or anything. He’s simply asking: What is
the business worth?”
Investors generally subscribe to the conventional wisdom that
growth stocks outperform value stocks. But a study of
international portfolios by professors at the University Of
Chicago Graduate School Of Business and the Yale School of
Management has shown that in reality the reverse is true: Value
stocks reap higher returns than growth stocks in markets around
the world.
"Value Versus Growth: The International Evidence," a 1997 working
paper co-written by finance professor Eugene Fama of the
University of Chicago Graduate School of Business and Kenneth R.
French, a former Chicago faculty member now at the Yale School of
Management, argues that the conventional wisdom is wrong. Fama
and French have concluded that Value Stocks have higher returns
than growth stocks in markets around the world. For the period
1975 through 1995, the difference between the average returns on
global portfolios of high and low book-to-market stocks is 7.68
percent per year, and value stocks outperform growth stocks in
twelve of thirteen major markets. Speaking about growth stocks,
PAPI FUND Page 1

Fama says "people think because these are good companies, their
stock returns will be high. But in fact, their prices are pegged
so high by the market that their returns actually tend to be
low."
Fama and French define value stocks as those stocks that have
high ratios of book value to market value and growth stocks as
those that have low ratios of book value to market value. "The
intuition is that value stocks have low prices relative to their
book value, so the market feels they're relatively distressed,"
says Fama. "The intuition is the opposite for growth stocks."
Investment managers classify firms that have high ratios of book-
to-market equity (B/M), earnings to price (E/P), or cash flow to
price (C/P) or Dividends to price (D/P) as value stocks because
they tend to have persistently low earnings and low B/M, E/P, C/P
and D/P stocks tend to be strong (growth) firms with persistently
high earnings.
The sharp rise and decline in recent years of technology and
other growth-oriented stocks calls into question the argument
that growth stocks are less risky investments. Rather, the
evidence suggests that value stocks are not more risky than
growth stocks, based on a variety of indicators including beta
and return volatility. Indeed, using one popular risk indicator
which focuses on performance in down markets, value stocks suffer
less severely than growth stocks when the stock market or the
overall economy does poorly. (Chan & Lakonishok, 2002).

In Nepal stock exchange (NEPSE) also, there are number of stocks
that provide regular income and are valued high in the market as
well as there exists another pool of stocks that doesn’t provide
regular incomes. This study has identified three stocks as value
and other three as growth stocks based on the ratios of book-to-
market (B/M) ratios as done by Fama and French in their study.
Based on the classified, returns has been calculated for last 60
months and based on calculated returns the difference in average
returns is calculated. As studied by Fama and French, value
stocks outperform growth stocks in twelve of thirteen major
markets and this study seeks to examine if the value stock
outperform growth stocks in NEPSE as in major stocks market.
Purpose of Study
A large body of empirical research indicates that value stocks on
average earn higher returns than growth stocks. The reward to
value investing is more pronounced for small stocks but it is
also present in the larger stocks. The value premium also exists
in equity markets outside the U.S.
The primary purpose of this study is to examine if the value
stocks of NEPSE even outperform the performance of growth stocks
of NEPSE. This also intends to examine if there is difference in
average returns on portfolios of high and low book-to-market
stocks. To achieve this primary objective, there are several
other specific objectives of this study:

To classify the stocks listed in NEPSE into value and
growth stocks based on book-to-market (B/M) equity ratio
and examine its possibility and applicability
Calculate the average returns on the portfolio of value
stocks and portfolio of growth stocks based on data
available from NEPSE
To examine if their exist a significant difference in
annual returns of value and growth stocks
Scope of Study
This study exclusively focuses on the comparison of annual
returns of value and growth stocks of NEPSE based on technique
used by Fama and French in their working paper: Value versus
Growth: Thee International Evidence (Fama & French, Value versus
Growth: The International Evidence, 1998). The value stock
portfolio includes three value stocks i.e. KIST bank, Prime Life
Insurance and Citizen Bank International. The growth stock
portfolio includes three growth stocks i.e. Standard Chartered
Bank Nepal, Everest Bank and Nabil Bank. The selection of value
and growth stocks was based on book-to-market equity ratio of ten
stocks listed in NEPSE i.e. KIST bank, Prime Life Insurance,
Citizen Bank International, Standard Chartered Bank Nepal,
Everest Bank, Nabil Bank, Himalayan Bank Nepal, Siddhartha Bank
Limited, Nepal SBI Bank Limited and Butwal Power Ltd. The book-
to-market equity ratio was calculated based on annual reports of
last five fiscal years 2007/8 – 2012/13. The annual returns of

value and growth stocks was for last 60 months data available
i.e. 2065 Shrawan to 2070 Asadh. During this period, NEPSE soared
to its record high index (in 2008) as well plummeted record low
(in 2011) which could possibly have impact on our study of
calendar anomalies due to those extremes. This analysis is based
on descriptive statistics (mean and standard deviations).
Limitations of Study
The limitations for this study are as follow:
The selection of growth and value stock was done from the
pool of ten different stocks listed in NEPSE (KIST bank,
Prime Life Insurance, Citizen Bank International, Standard
Chartered Bank Nepal, Everest Bank, Nabil Bank, Himalayan
Bank Nepal, Siddhartha Bank Limited, Nepal SBI Bank Limited
and Butwal Power Ltd.)
The selection criterion for value and growth stock was book-
to-market equity (B/M) ratio as used by Fama and French in
their working paper: Value versus Growth.
To calculate the book-to-market equity ratio, last five
fiscal year data was used.
The return calculation was based on 60 months month end
closing price of each stock i.e. 2065 Shrawan to 2070 Asadh.
Within this period, few stocks’ were not traded so, only few
data were available for them.
Conceptual Framework

When evaluating which stocks to include in our portfolio, we are
likely to run across two labels that may be confusing: Growth
stocks and Value stocks. Both types of stocks seek to provide the
best possible returns. The difference is in the approach they
take, the way they pick stocks, and the types of markets for
which they are best suited.
Growth Stocks:Growth stocks refer to those companies that investors believe
will experience faster than average growth as measured by
revenues, earnings, or cash flow. Growth companies by definition
are those that have substantial potential for growth in the
foreseeable future. Growth companies may currently be growing at
a faster rate than the overall markets, and they often devote
most of their current revenue toward further expansion. Every
sector of the market has growth companies, but they are more
prevalent in some areas such as technology, alternative energy
and biotechnology. Most growth stocks tend to be newer companies
with innovative products that are expected to make a big impact
in the market in the future, but there are exceptions. Some
growth companies are simply very well-run entities with good
business models that have capitalized on the demand for their
products.
Value Stocks:Undervalued companies can often provide long-term profits for
those who do their homework. The goal of value stock investors is
to find proverbial diamonds in the rough; that is, companies

whose stock prices don’t necessarily reflect their fundamental
worth. The reasons for these stocks being undervalued by the
market can vary. Sometimes a company or industry has fallen on
hard times. Other times a poor quarterly earnings report or some
external event can temporarily depress a company’s stock price
and create a longer-term buying opportunity. In searching for
these companies, managers look for what many experts call a
"margin of safety." This means that the market has discounted a
security more than it should have and that its market value, the
price at which it is trading, is less than its intrinsic value,
the present value of its future cash flows. One example would be
a stock that is trading at Rs. 900, but whose intrinsic value is
Rs. 1000. The stock price may also have dropped due to public
perception regarding factors that have little to do with the
company’s current operations. Smart investors know that this is a
good time to buy the stock, as the public will soon forget about
the incident and the price will most likely revert to its
previous level.
Book-to-market equity (B/M) ratio:A ratio used to find the value of a company by comparing the book
value of a firm to its market value. Book value is calculated by
looking at the firm's historical cost, or accounting value.
Market value is determined in the stock market through its market
capitalization. The book-to-market ratio attempts to identify
undervalued or overvalued securities by taking the book value and
dividing it by market value. A high ratio is often interpreted as
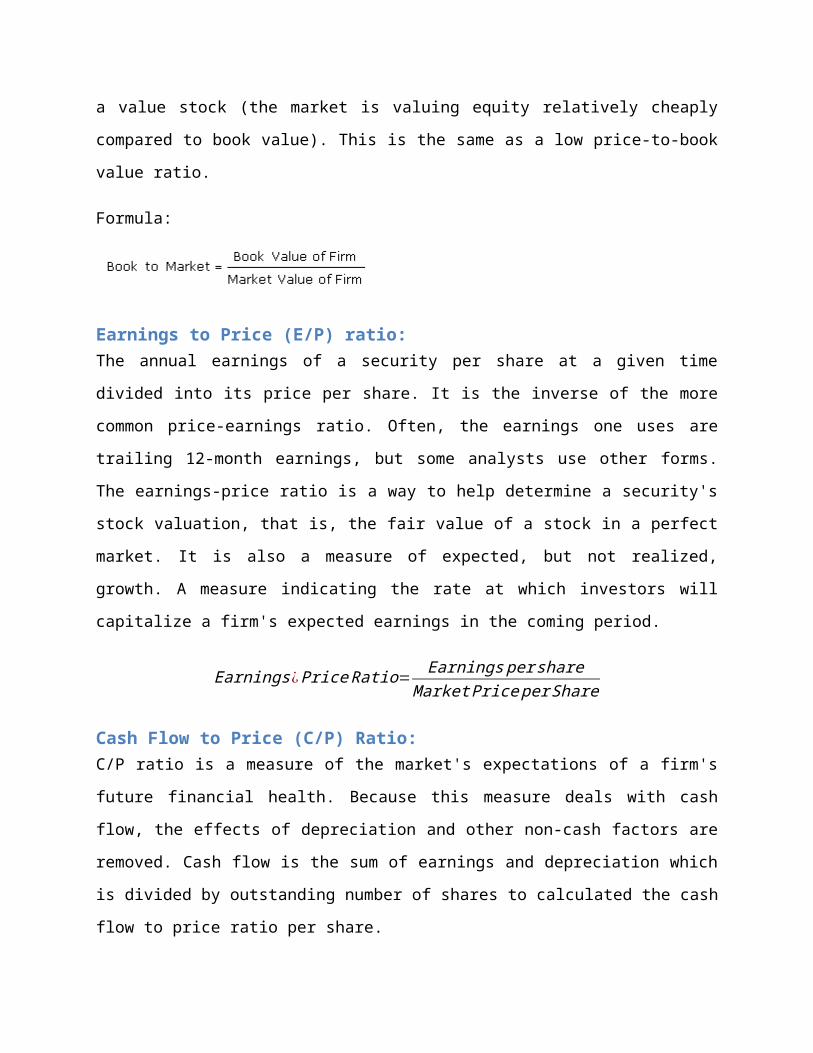
a value stock (the market is valuing equity relatively cheaply
compared to book value). This is the same as a low price-to-book
value ratio.
Formula:
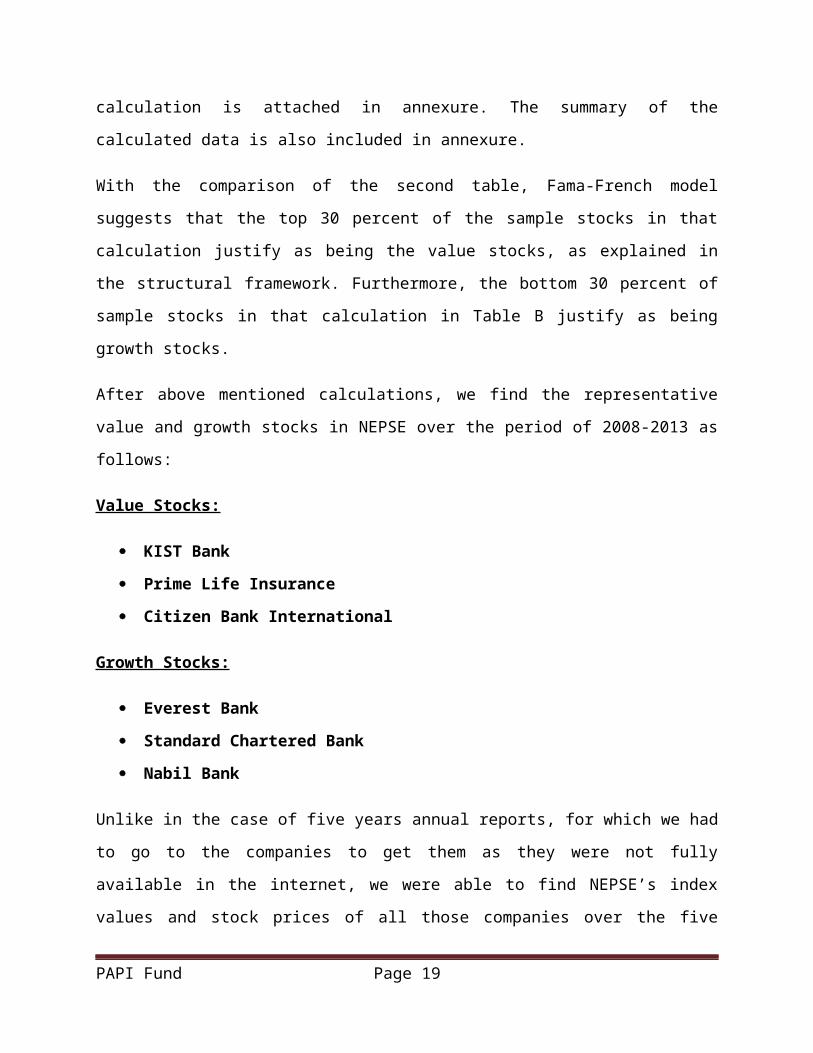
Earnings to Price (E/P) ratio:The annual earnings of a security per share at a given time
divided into its price per share. It is the inverse of the more
common price-earnings ratio. Often, the earnings one uses are
trailing 12-month earnings, but some analysts use other forms.
The earnings-price ratio is a way to help determine a security's
stock valuation, that is, the fair value of a stock in a perfect
market. It is also a measure of expected, but not realized,
growth. A measure indicating the rate at which investors will
capitalize a firm's expected earnings in the coming period.
Earnings¿PriceRatio=Earningspershare
MarketPriceperShare
Cash Flow to Price (C/P) Ratio:C/P ratio is a measure of the market's expectations of a firm's
future financial health. Because this measure deals with cash
flow, the effects of depreciation and other non-cash factors are
removed. Cash flow is the sum of earnings and depreciation which
is divided by outstanding number of shares to calculated the cash
flow to price ratio per share.

Cashflow¿PriceRatio=(NetIncome+Depreciation )pershare
MarketPriceperShare
Dividends to Price (D/P) Ratio:The other measure is dividends to price ratio which compares the
dividends paid by the companies each period against the market
price per share. If the ratio is high then, it means the company
is distributing income to shareholders than retaining them which
reduces the probability of growth.
Dividends¿PriceRatio= DividendpershareMarketPriceperShare
Value versus Growth: “Value versus Growth” debate has been there since very long and
different academic researchers have pointed down several findings
regarding the returns offered by value stocks or growth stocks
which are always contradicting. Investors have the conventional
thought that growth stocks outperform value stocks and thus,
offer higher returns for them But, Contrary to this wisdom Fama
and French in their working paper (Fama & French, Value versus
Growth: The International Evidence, 1998) has claimed that value
stocks outperform the growth stocks. The implication for
investors is that value stocks have higher returns than growth
stocks in markets around the world. Looking at book-to-market
equity, Fama and French found that value stocks outperformed
growth stocks in 12 of 13 developed countries from 1975 to 1995,
and that the difference between average returns on global
portfolios of high and low book-to-market stocks was 7.6 percent

per year. Furthermore, when earnings-to-price, cash flow-to-price
and dividend-to-price were examined, the value premium continued
to be evident. In our study, we thus, intend to examine if the
same applies in Nepal Stock exchange (NEPSE) thus, we have
calculated the differentials in earnings between value and growth
stocks.

Literature Review
Value stocks are usually defined as those traded at low price-to-
earnings ratios (stock prices divided by earnings per share), low
price-to-book ratios (stock prices divided by book value per
share) or high dividend yields (dividends per share divided by
stock prices). Growth stocks, on the other hand, are traded at
high price-to-earnings ratios, high price-to-book ratios or low
dividend yields.
The explosion of academic interest in value and growth investment
strategies can be traced back to Fama and French (1992), and
Lakonishok, Shleifer and Vishny (1994). The results of Fama and
French delivered a stunning blow to the explanatory power of the
Capital Asset Pricing Model, and sparked debates about the “death
of beta.” In the wake of this study, academics shifted their
attention to the ratio of book-to-market value of equity, and
firm size as the leading explanatory variables for the cross-
section of average stock returns. In turn, this work built on
earlier studies of stock market “anomalies.” Basu (1977), for
example, showed that stocks with low price-to-earnings ratios
subsequently tend to have higher average returns than stocks with
high ratios. Chan, Hamao and Lakonishok (1991) study Japanese
data and find strong support for the superior performance of
value investment strategies.Based on the accumulated weight of
the evidence from studies on the book-to-market effect and
related anomalies, the academic community has generally come to
PAPI Fund Page 11

agree that value strategies on average outperform growth
investment strategies. There is much less consensus, however, on
the underlying reasons for the superior returns. On the one hand,
Fama and French take the position of the efficient markets
hypothesis, and attribute the higher returns of value strategies
to their increased risk. On the other hand, Lakonishok, Shleifer
and Vishny suggest that cognitive biases underlying investor
behavior, and the agency costs of professional investment
management are at the root of the rewards to value investing. Yet
another explanation for the returns to value investing rests on
methodological issues of data selection bias (see Kothari,
Shanken and Sloan (1995)). A careful study by Chan, Jegadeesh and
Lakonishok (1995), however, suggests that any such bias cannot
explain the differential performance of value and growth
investing.
Investment manager classify firm that have high ratios of book-
to-market equity (B/M), earnings to price (E/P), or cash flow to
price (C/P) as value stocks. Fama and French (1992, 1996) and
Lakonishok, Shleifer, and Vishny (1994) show that for U.S. stocks
there are a strong value premium in average returns. High B/M,
E/P, or C/P stocks have higher average returns than low B/M, E/P,
or C/P stocks. Fama and French (1995) and Lakonishok et al.
(1994) also show that the value premium is associated with
relative distress. High B/M, E/P, and C/P firms tend to have
persistently low earnings; low B/M, E/P, and C/P stocks tend to
be strong (growth) firms with persistently high earnings.
PAPI Fund Page 12

Month-End Closing price of each individual Stock from 2065 Shrawan to 2070 Asadh then, mean annual return of value & growth stock returnsTools & Techniques: - Statistical tools Comparative Analysis
Average Return difference in Value and Growth stocks of NEPSE
Lakonishok et al. (1994) and Haugen (1995) argue that the value
premium in average returns arises because the market undervalues
distressed stocks and overvalues growth stocks. When these
pricing errors are corrected, dis-tressed (value) stocks have
high returns and growth stocks have low re-turns. In contrast,
Fama and French (1993, 1995, and 1996) argue that the value
premium is compensation for risk missed by the capital asset
pricing model (CAPM) of Sharpe (1964) and Lintner (1965). This
conclusion is based on evidence that there is common variation in
the earnings of distressed firms that is not explained by market
earnings, and there is common variation in the returns on
distressed stocks that is not explained by the market return.
Most directly, including a risk factor for relative distress in a
multifactor version of Merton's (1973) inter temporal capital
asset pricing model (CAPM).
The Journal of Finance or Ross's (1976) arbitrage pricing theory
(APT) captures the value premiums in U.S. returns generated by
sorting stocks on B/M, E/P, C/P, or D/P (dividend yield). Still
another position, argued by Black (1993) and MacKinlay (1995), is
that the value premium is sample-specific. Its appearance in past
U.S. returns is a chance result unlikely to recur in future
returns.
Diagrammatic Presentation of Concept of Study:
PAPI Fund Page 13

The input-output model gives a glimpse of the overall study. The
main output of this study is to find whether there is significant
difference in annual returns of value and growth stocks in long
run in NEPSE listed stocks based on empirical studies on stock
market from developed and emerging countries. The research on U.S
stocks market and other International major stocks markets of
World has shown the evidence that value stocks generally
outperform the growth stocks. Thus, this study intends to examine
if same is the case in Nepal and the only stock market of Nepal
(NEPSE). To understand this, we need to analyze the returns of
number of different value and growth stocks over a long
historical period and compare the average returns between value
and growth stocks. Statistical tools like mean and standard
deviation has been used and finally comparative analysis is
conducted to interpret the final outcome.
InputThe inputs for our analysis include two levels of data. First of
all, to calculate the book-to-market ratio so as to differentiate
growth and value stocks, we used the annual reports of last five
fiscal years of all the companies which were available in their
PAPI Fund Page 14

corporate website. After distinction between growth and value
stock, the second step was to calculate the average returns of
value and growth stocks. For this, we used the month end closing
price of last 60 months from 2065 Shrawan to 2070 Asadh retrieved
from the website www.nepalstock.com.np
Book to market ratio was calculated using:
And, the average monthly returns on each stock =Pt−Pt−1
Pt−1
ProcessThere involved two steps of calculation in our analysis. First of
all, growth and value stocks were identified based on book to
market equity ratio. This was calculated from the data retrieved
from company’s annual reports and its financial performance. We
calculated the book-to-market equity ratio of 10 stocks out of
which stocks having book-to-market equity ratio fall in top 30%
was the portfolio of value stocks. In contrast, stocks having
book-to-market equity ratio fall in bottom 30% was the portfolio
of growth stocks. After then, monthly return on all the
individual stocks was extracted from which average monthly return
of each individual stock was calculated and finally, the average
of all three value and three growth stocks was calculated and
annualized to get the average annual returns in value and growth
stocks of NEPSE.
PAPI Fund Page 15

OutputThe main outcome of the study was to examine the annual average
returns of value and growth stocks in Nepal. In International
context, different research on various key stock markets revealed
that value stocks outperform the growth stocks in average so,
this study intends to evaluate if same is applicable in the
Nepal’s stock market. This can tell if the country’s only stock
market is following the general trend or as claimed by critics is
manipulated by few big investors for their personal benefit.
Analysis:
Our analysis was based on an article published on 1998 after a
research by Eugene Fama and Kenneth French regarding the returns
of value stocks and growth stocks in various capital markets
around the world. Originally, Fama-French had found that the US
capital market data proved that value stocks provided higher
average returns compared to growth stocks. Then Fama-French tried
to apply this same conclusion to thirteen capital markets around
the world. Their conclusion was that for the study period of 20
years (1975-1995), value stocks outperformed growth stocks in
twelve out of thirteen countries, and the difference between
average returns of value stocks and growth stocks was 7.68%.
In Nepalese context, awareness level among general investors is
very low about the concepts of value or growth stocks, which seem
to be limited among only a small proportion of individuals who
have educational background about the issue. As such, we still
PAPI Fund Page 16

wanted to see if the value and growth stocks performed in a
similar way with the global market patterns. We used the same
criterion applied by Fama-French, i.e. book-to-market ratio
(B/M), earning to price (E/P), cash flow to price (C/P), and
dividend to price (D/P), to separate between value stocks and
growth stocks. All of these calculations and their significance
have been explained in detail in the structural framework of this
research earlier.
In order to do all the calculations, we needed representative
stocks from the Nepalese capital market (NEPSE). We chose to
study the returns of 10 sample stocks over a period of five years
from 2008 to 2013.
The selection of these sample stocks from NEPSE needed to
accurately represent the structure of the overall market. Hence,
we separated NEPSE’s structure into three categories according to
their capital size: banking stocks, insurance stocks, and other
stocks. The overall banking sector has commanded in average
around 80 percent of the total share of Nepalese capital market
over the study period of 2008-2013. Furthermore, insurance sector
has held around 10 percent level over the same period and other
sectors made up the remaining 10 percent. Within those
categories, the stocks were chosen at random by the study team.
These were the representative stocks from the Nepalese stock
market with their respective categories in our study:
Category S.No. Name
PAPI Fund Page 17

Banking
1 Standard Chartered Bank (SCB)
2 KIST Bank (KIST)
3 Nabil Bank (Nabil)
4 Himalayan Bank (HBL)
5 Siddhartha Bank (SBL)
6 Citizens Bank International (CBIL)
7 Everest Bank (EBL)
8 Nepal SBI Bank (SBI)
Insurance 9 Prime Life Insurance (PLI)
Others 10 Butwal Power Company (BPC)
In order to collect the necessary data, we first went to the
respective companies and received annual reports from them for
five years from 2008 to 2013. These annual reports provided data
like annual book value per share, annual closing market value per
share, annual earnings per share, annual increment/decrement in
cash flow per share, annual dividends per share (including
monetary adjustments for shares and cash dividends), and other
financial data.
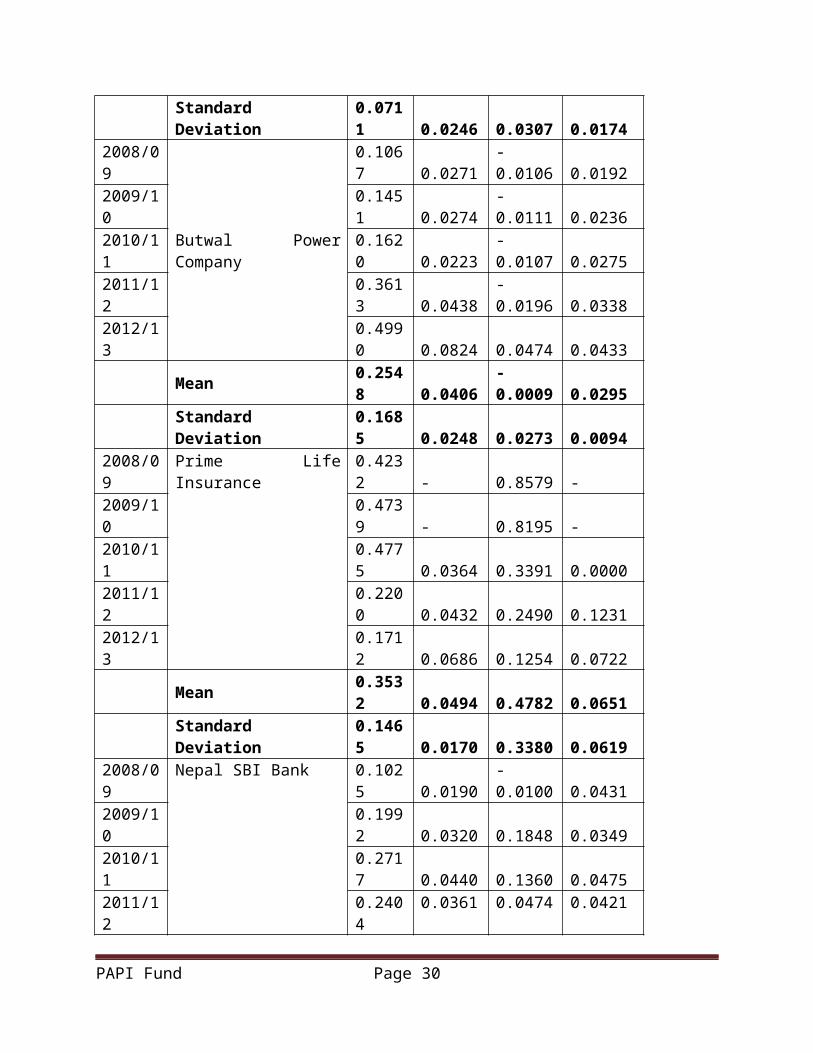
All of the aforementioned data were used in calculation purposes
to come to arithmetic mean and standard deviation of B/M, E/P,
C/P, and D/P for the selected ten stocks from NEPSE. The
PAPI Fund Page 18
calculation is attached in annexure. The summary of the
calculated data is also included in annexure.
With the comparison of the second table, Fama-French model
suggests that the top 30 percent of the sample stocks in that
calculation justify as being the value stocks, as explained in
the structural framework. Furthermore, the bottom 30 percent of
sample stocks in that calculation in Table B justify as being
growth stocks.
After above mentioned calculations, we find the representative
value and growth stocks in NEPSE over the period of 2008-2013 as
follows:
Value Stocks:
KIST Bank
Prime Life Insurance
Citizen Bank International
Growth Stocks:
Everest Bank
Standard Chartered Bank
Nabil Bank
Unlike in the case of five years annual reports, for which we had
to go to the companies to get them as they were not fully
available in the internet, we were able to find NEPSE’s index
values and stock prices of all those companies over the five
PAPI Fund Page 19

years period between 2008-2013 in NEPSE’s official website. All
of the data we have used are publicly available for free of cost.
In order to know whether the value stocks gave better returns
than growth stocks, we listed monthly returns data of NEPSE index
between 2008-2013. Although daily data was available, we wanted
to minimize the effect of noise in the daily data, leading to a
choice of monthly data. We also listed monthly price of the three
value and three growth stocks so that they can be compared for
being the prices of the same days.
With a change in the NEPSE index prices between each of the
consecutive months of the study period, we computed average NEPSE
return in percentage form. Similarly, we calculated the returns
of all six stocks to come to average monthly returns in
percentage form for the same months under study.
To find the total average monthly returns by NEPSE, three value
stocks, and three growth stocks, we took an arithmetic mean of
the sixty months study period, and found out the average returns
by each of those companies. The monthly returns were then
adjusted into annual terms for easier comparison.
As the study period consisted of a time of decline in the capital
market performance for NEPSE, the average returns over the five
years under study were bound to come in negative values. The mean
NEPSE index return was -11.97% per year between 2008 and 2013. In
regards to the companies being studied, only one stock (value)
had given a positive annual return, i.e. Prime Life InsurancePAPI Fund Page 20

Company with 0.28%. Other two value stocks had the following
annual returns: KIST Bank with -10.26% and Citizens Bank
International with -8.02%. Three growth companies had the
following annual returns: Nabil Bank with -11.81%, Standard
Chartered Bank with -22.52% and Everest Bank with -8.25%.
Fama-French had calculated the collective average annual returns
of their calculated value and growth stocks. Hence, the
collective mean annual return of the three value stocks from
NEPSE was -6.0007%. Similarly, the collective mean annual return
of growth stocks from NEPSE was -14.1926%.
PAPI Fund Page 21

NEPSEReturnin %
KISTReturnin %
PrimeLife
Insurance Return
in %
Citizens
Intl.Bank
Returnin %
NabilBank
Returnin %
Std.Chartered BankReturnin %
EverestBank
Return in%
Mean Return (Monthly)
-0.9975%-
0.8549%
0.0229%-
0.6681%
-0.9844
%-1.8766% -0.6871%
Mean Return (Annual)
-11.9700%
-10.259
3%0.2751%
-8.0178
%
-11.812
8%
-22.5196% -8.2454%
Average Return ofValue Stocks (H)
-6.0007%
Average Return ofGrowth Stocks (L)
-14.1926%
High - Low Return
8.1919%
Looking at the difference between the returns of value and growth
stocks in NEPSE, we found a spread of significant 8.19%. This
premium for value stocks compared to growth stocks is consistent
with the findings of Fama-French where they had concluded a
spread of 7.68% in the global capital market. This spread is
justified by the higher risk level associated with the value
stocks, which are usually ignored by mainstream investors.
Conclusion:
PAPI Fund Page 22

Value stocks have more than double returns than growth stocks in
the Nepalese capital market. Value stocks also outperform the
overall market by a significant proportion in Nepalese context.
Due to various reasons, the market was continuously going down
so, Investors are actually losing their investment in these last
60 months trend but, the amount they are losing is less with the
value stocks than with the growth stocks. The investors are
losing more with the growth stocks i.e. -14.20% whereas they are
just losing -6% with the value stocks.
Sorting on book-to-market ratio, and other three calculations,
value stocks are proven to be better investment opportunities in
NEPSE rather than otherwise-popular growth stocks. Although
globally value stocks gave 7.68 percent higher returns than
growth stocks, in Nepalese context we found an even higher
premium for investing in value stocks, with a higher returns of
8.19 percent. All of the calculations clearly conclude that the
return premium for value stocks is higher than other stocks,
especially growth stocks.
Our study even supports the conclusion drawn by Fama and French
in their highly appreciated working paper (Fama & French, Value
versus Growth: The International Evidence, 1998) where they
concluded that globally value stocks gave 7.68% higher returns
than growth stocks. This was because, most of investors think
because these are good companies, their stock returns will be
high. But in fact, their prices are pegged so high by the market
PAPI Fund Page 23

that their returns actually tend to be low in compare to their
market price. But, the value stocks are usually priced very low
by the market and in many occasions are undervalued in the market
so, with slight increase in their price value investors can gain
more. With value investment, risk is usually higher as returns
are uncertain so, investors must be offered higher return to
compensate for higher risk.
Our conclusion backs up the rationale of investors who choose to
invest in value stocks that are ignored by major investors in our
markets. While making portfolio decisions in Nepalese equity
market, it is advisable to have a higher proportion of value
stocks in terms of B/M, E/P, C/P, and D/P in a portfolio to get
higher returns than the market in average.
Scope for further study:
Due to various limitations, we could only calculate the book-to-
market equity ratio of ten stocks listed in NEPSE but, the
conclusion would be more relevant if we could calculate the book-
to-market equity ratio of all the listed stocks and based on that
data, we could chose stocks with 30% top B/M ratio as value
stocks and bottom 30% as growth stocks. In future, there remains
a scope to include all the stocks listed in NEPSE in this study
and find a conclusion of Value versus Growth and evaluate if the
Nepalese stocks also follow the same trend like in Global stock
market. It would provide a concrete answer of if the NEPSE also
PAPI Fund Page 24

provide higher premium for bearing the higher risk of holding the
value stocks in place of growth stock.
Instead of using just last five fiscal years as our base to
calculate the book-to-equity ratio, we can use all the data of
trading available to us for all the stocks listed since inception
of stock market, that got de-listed in the middle and some other
new stocks got listed in the stock market. If we could use all
these data to calculate the book-to-equity ratio then, the
conclusion drawn would be more concrete. So, there is a scope of
the detail research in this field of stock market.
PAPI Fund Page 25

References:
2005 Growth and Value Stocks: Risks Associated With Value’s Outperformance of Growth California State University
Income, Value and Growth Stocks
Nepal Stock Exchange. (2065/66, 2066/67, 2067/68, 2068/69, 2069/70). Annual Reports: NEPSE. Retrieved from NEPAL Stock Exchange Ltd.: http://nepalstock.com/reports/annual.php
Rethinking Stock Returns: New Evidence on Value Versus Growth
Value and Growth Investing: A review and update 2002
Value versus Growth: The International Evidence 1998 The Journal of Finance
Prime Life Annual Reports (2007, 2008, 2009, 2010, 2011, 2012, 2013)
Butwal Power Company (2007, 2008, 2009, 2010, 2011, 2012, 2013)
Nepal SBI Bank (2007, 2008, 2009, 2010, 2011, 2012, 2013)
Himalayan Bank Limited (2007, 2008, 2009, 2010, 2011, 2012, 2013)
KIST Bank Limited (2007, 2008, 2009, 2010, 2011, 2012, 2013)
Nabil Bank Limited (2007, 2008, 2009, 2010, 2011, 2012, 2013)
Standard Chartered Bank (2007, 2008, 2009, 2010, 2011, 2012, 2013)
Siddhartha Bank Limited (2007, 2008, 2009, 2010, 2011, 2012, 2013)
Citizens Bank International Limited (2007, 2008, 2009, 2010, 2011, 2012, 2013)
PAPI Fund Page 26

Everest Bank Limited (2007, 2008, 2009, 2010, 2011, 2012, 2013)
Annex:
Calculation of B/M, E/P, C/P, & D/P for 10 stocks:
FiscalYear Stock Name B/M
Earnings toprice
Cashflowtoprice
Dividends toPrice
2008/09
StandardChartered Bank
0.0545 0.0183 0.0187 0.3053
2009/10
0.0639 0.0237 0.0212 0.3341
2010/11
0.1269 0.0386 0.0395 0.2189
2011/12
0.1237 0.0404 0.0358 0.2695
2012/13
0.1244 0.0361 0.0333 0.2208
Mean 0.0987 0.0314 0.0297 0.2697
StandardDeviation
0.0362 0.0098 0.0092 0.0510
2008/09
KIST Bank 0.2730 0.0119 0.0526 0.0339
2009/10
0.5138 0.0362 0.0425 0.0489
2010/11
0.6914
0.0174 0.0432 0.0000
PAPI Fund Page 27

2011/12
0.9271 0.0414 0.0724 0.0000
2012/13 N/A N/A N/A N/A
Mean 0.6013 0.0267 0.0527 0.0207
StandardDeviation
0.2767 0.0143 0.0139 0.0247
2008/09
Nabil Bank
0.0441 0.0232 0.0154 0.3934
2009/10
0.0793 0.0352 0.0250 0.3701
2010/11
0.1797 0.0564 0.0566 0.1333
2011/12
0.1649 0.0617 0.0547 0.2684
2012/13
0.1210 0.0524 0.0421 0.2960
Mean 0.1178 0.0458 0.0388 0.2923
StandardDeviation
0.0570 0.0161 0.0182 0.1026
2008/09
Himalayan BankLtd
0.1252 0.0317 0.0212 0.0126
2009/10
0.1458 0.0352 0.0230 0.0068
2010/11
0.2779 0.0390 0.0350 0.0145
2011/12
0.3473 0.0777 0.1172 0.0293
2012/13
0.4487 0.0612 0.1152 0.0206
Mean 0.2690 0.0489 0.0623 0.0168
StandardDeviation
0.1363 0.0198 0.0495 0.0085
2008/09
Siddhartha BankLtd
0.1662
0.0222 0.0122 0.0203
PAPI Fund Page 28

2009/10
0.1143 0.0210 0.0025 0.0138
2010/11
0.1460 0.0220 0.0045 0.0084
2011/12
0.2860 0.0446 0.0156 0.0226
2012/13
0.5000 0.0756 0.0347 0.0370
Mean 0.2425 0.0371 0.0139 0.0204
StandardDeviation
0.1579 0.0237 0.0128 0.0108
2008/09
CitizenInternational
0.1712 0.0186 0.0052 0.0152
2009/10
0.2200 0.0431 0.0045 0.0257
2010/11
0.4775 0.0568 0.0056 0.0249
2011/12
0.4739 0.0465 0.0791 0.0366
2012/13
0.4232 0.0736 0.1118 0.0562
Mean 0.3532 0.0477 0.0412 0.0317
StandardDeviation
0.1465 0.0201 0.0508 0.0156
2008/09
Everest Bank
0.0252 0.0293 0.0038 0.0064
2009/10
0.0449 0.0407 0.0056 0.0122
2010/11
0.0577 0.0419 0.0213 0.0126
2011/12
0.1350 0.0760 0.0570 0.0457
2012/13
0.1944 0.0857 0.0711 0.0015
Mean 0.0915 0.0547 0.0318 0.0157
PAPI Fund Page 29
StandardDeviation
0.0711 0.0246 0.0307 0.0174
2008/09
Butwal PowerCompany
0.1067 0.0271
-0.0106 0.0192
2009/10
0.1451 0.0274
-0.0111 0.0236
2010/11
0.1620 0.0223
-0.0107 0.0275
2011/12
0.3613 0.0438
-0.0196 0.0338
2012/13
0.4990 0.0824 0.0474 0.0433
Mean 0.2548 0.0406
-0.0009 0.0295
StandardDeviation
0.1685 0.0248 0.0273 0.0094
2008/09
Prime LifeInsurance
0.4232 - 0.8579 -
2009/10
0.4739 - 0.8195 -
2010/11
0.4775 0.0364 0.3391 0.0000
2011/12
0.2200 0.0432 0.2490 0.1231
2012/13
0.1712 0.0686 0.1254 0.0722
Mean 0.3532 0.0494 0.4782 0.0651
StandardDeviation
0.1465 0.0170 0.3380 0.0619
2008/09
Nepal SBI Bank 0.1025 0.0190
-0.0100 0.0431
2009/10
0.1992 0.0320 0.1848 0.0349
2010/11
0.2717 0.0440 0.1360 0.0475
2011/12
0.2404
0.0361 0.0474 0.0421
PAPI Fund Page 30
2012/13
0.1897 0.0385 0.1101 0.0379
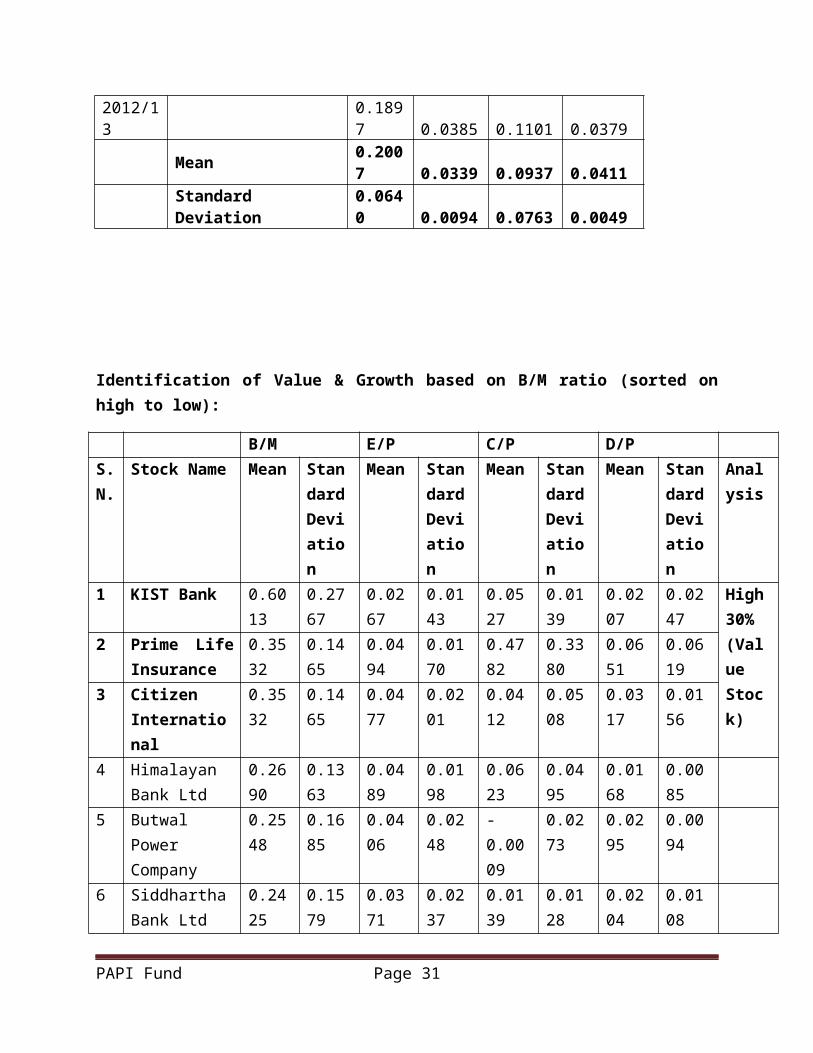
Mean 0.2007 0.0339 0.0937 0.0411
StandardDeviation
0.0640 0.0094 0.0763 0.0049
Identification of Value & Growth based on B/M ratio (sorted onhigh to low):
B/M E/P C/P D/P S.N.
Stock Name Mean StandardDeviation
Mean StandardDeviation
Mean StandardDeviation
Mean StandardDeviation
Analysis
1 KIST Bank 0.6013
0.2767
0.0267
0.0143
0.0527
0.0139
0.0207
0.0247
High30%(ValueStock)
2 Prime LifeInsurance
0.3532
0.1465
0.0494
0.0170
0.4782
0.3380
0.0651
0.0619
3 CitizenInternational
0.3532
0.1465
0.0477
0.0201
0.0412
0.0508
0.0317
0.0156
4 HimalayanBank Ltd
0.2690
0.1363
0.0489
0.0198
0.0623
0.0495
0.0168
0.0085
5 ButwalPowerCompany
0.2548
0.1685
0.0406
0.0248
-0.0009
0.0273
0.0295
0.0094
6 SiddharthaBank Ltd
0.2425
0.1579
0.0371
0.0237
0.0139
0.0128
0.0204
0.0108
PAPI Fund Page 31

7 Nepal SBIBank
0.2007
0.0640
0.0339
0.0094
0.0937
0.0763
0.0411
0.0049
8 Nabil Bank 0.1178
0.0570
0.0458
0.0161
0.0388
0.0182
0.2923
0.1026
Low30%(GrowthStock)
9 StandardCharteredBank
0.0987
0.0362
0.0314
0.0098
0.0297
0.0092
0.2697
0.0510
10 EverestBank
0.0915
0.0711
0.0547
0.0246
0.0318
0.0307
0.0157
0.0174
PAPI Fund Page 32

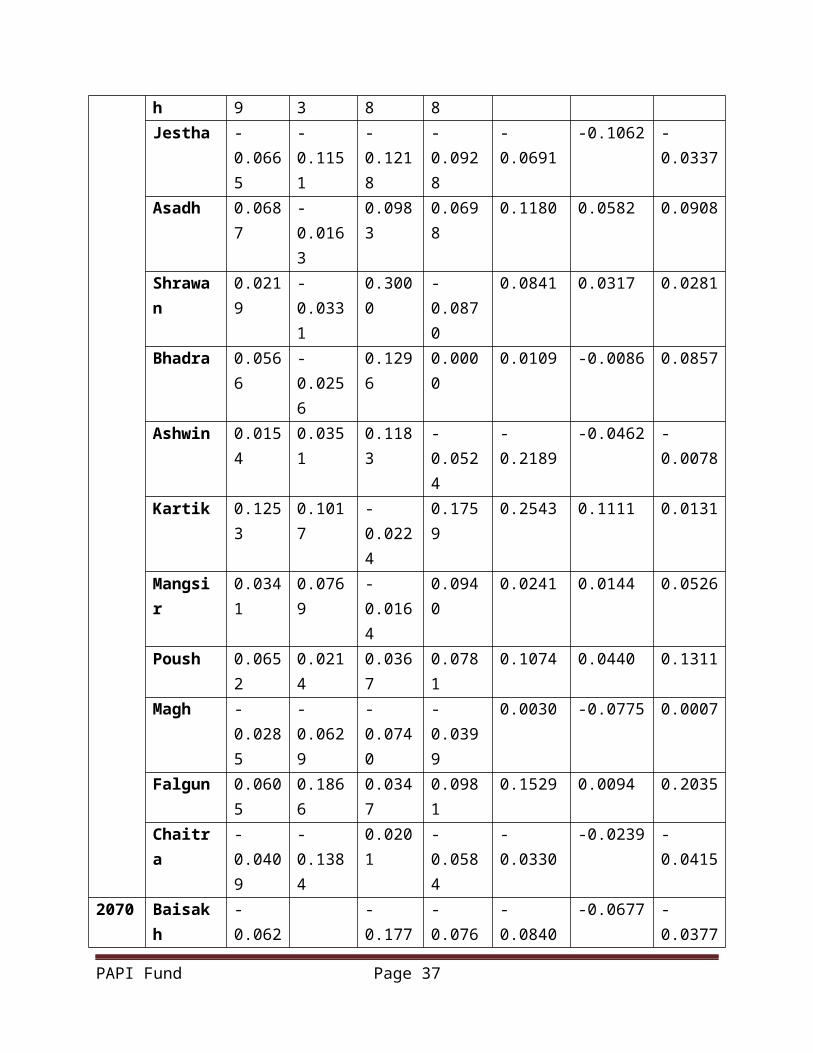
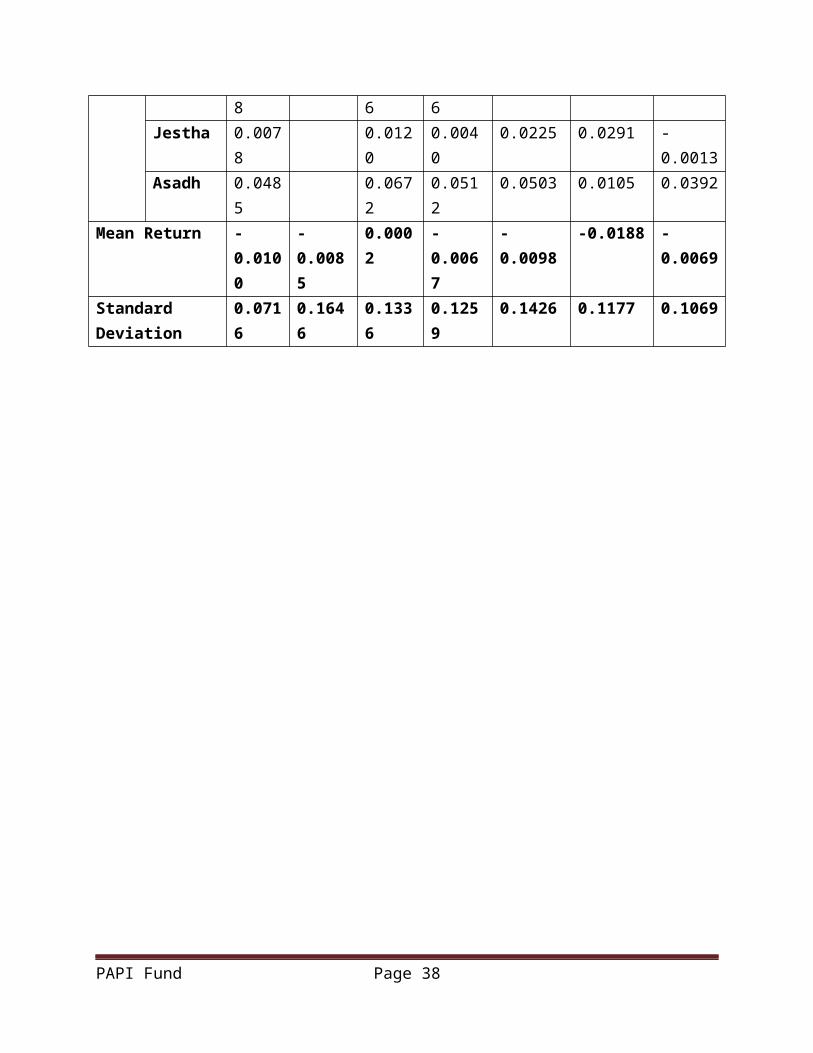
Detail Calculation of Monthly Returns on each stock:
NEPSEReturn in%
KISTReturn in%
PrimeLifeInsuranceReturn in%
CitizensIntl.BankReturn in%
NabilBankReturnin %
Std.Chartered BankReturnin %
Everest BankReturnin %
2065 Shrawan
Bhadra -0.1003
-0.3280
-0.0783 -0.0766
Ashwin -0.0431
-0.0293
-0.0137 -0.0254
Kartik -0.1361
-0.0515
-0.3432 -0.2245
Mangsir
-0.0893
-0.0196
-0.0422 -0.1093
Poush -0.1021
-0.0948
-0.0291 -0.0329
Magh 0.0056
0.0627 -0.0260 -0.0054
Falgun 0.0055
-0.0112
-0.0022 0.0124
Chaitra
-0.0089
0.0114 0.0215 0.0931
2066 Baisak - 0.0281 0.0268 -
PAPI Fund Page 33

h 0.0005
0.0471
Jestha 0.0269
0.1519 0.1554 0.1035
Asadh 0.1037
0.0107
0.2022
0.1620 0.0780 0.0469
Shrawan
-0.0426
0.0714
0.0758
0.0092 0.0293 0.0794
Bhadra -0.1218
-0.1481
-0.0310
-0.4296
-0.1537 -0.1358
Ashwin -0.0323
0.0696
-0.0102
0.0213 -0.2970 0.0437
Kartik -0.0699
-0.0325
-0.0822
-0.0625
-0.0304 -0.2690
Mangsir
-0.0323
-0.0728
-0.0272
-0.0407
-0.0163 -0.0143
Poush -0.0298
-0.0483
-0.0625
0.0039 -0.0584 -0.0685
Magh -0.0737
-0.2603
-0.1053
-0.1077
-0.0862 -0.0143
Falgun -0.0254
0.1159
-0.0471
-0.0254
0.0351 -0.0196
Chaitra
-0.0655
-0.1808
-0.1584
-0.0977
-0.0739 -0.0652
2067 Baisak - - 0.073 0.0784 0.0086 -
PAPI Fund Page 34

h 0.0190
0.0986
3 0.0738
Jestha 0.0797
0.1563
0.1390
0.0455 0.0959 0.1833
Asadh 0.0044
-0.1036
-0.0180
0.0365 0.0247 0.0264
Shrawan
-0.0503
-0.0201
-0.3622
-0.3890
-0.1103
-0.1235 -0.0442
Bhadra -0.1086
-0.1128
-0.1695
-0.0333
-0.0736
-0.2589 -0.2850
Ashwin 0.0392
0.2312
0.0306
0.0069
-0.2351
0.1366 -0.0350
Kartik 0.0110
-0.0939
0.1089
0.0274
-0.0546
-0.1152 0.0781
Mangsir
-0.0774
-0.1140
-0.0982
-0.1567
-0.1823
-0.1335 -0.1372
Poush 0.0298
0.0409
-0.0099
-0.0119
0.1446 0.0911 0.1000
Magh 0.0019
-0.0112
0.0450
-0.0320
0.0165 0.0025 -0.0273
Falgun -0.0667
-0.0398
-0.0766
-0.1033
-0.1191
-0.1074 -0.0196
Chaitra
-0.0114
-0.2130
-0.0881
-0.0968
0.0227 -0.0453 0.0686
2068 Baisak - - - 0.061 - -0.0480 -
PAPI Fund Page 35

h 0.0605
0.0376
0.1136
2 0.1043 0.1338
Jestha -0.1343
-0.1953
-0.1026
-0.2404
-0.2044
-0.1900 -0.0525
Asadh 0.1954
0.5049
0.2214
0.4051
0.4424 0.3493 0.1891
Shrawan
-0.0262
0.0323
-0.0994
-0.1036
-0.0168
-0.0611 -0.1088
Bhadra -0.0910
-0.0813
-0.0844
-0.1156
-0.2486
-0.1953 0.0051
Ashwin 0.0305
-0.0408
0.1844
-0.0682
0.0249 0.0809 -0.0357
Kartik -0.0163
-0.0638
0.0180
0.0244
-0.0770
-0.0816 -0.1746
Mangsir
-0.0287
-0.0530
-0.0059
-0.0119
-0.0754
-0.0237 -0.0192
Poush 0.0517
0.0480
-0.0178
0.0663
0.1174 0.0698 -0.0484
Magh -0.0624
0.4885
-0.0120
-0.0678
-0.0675
-0.0553 -0.0618
Falgun 0.0065
-0.4513
-0.1646
-0.0061
0.0439 0.0360 -0.0190
Chaitra
0.0192
0.1215
0.1533
0.1646
0.1227 0.0507 0.1209
2069 Baisak 0.220 0.158 0.246 0.240 0.3178 0.3117 0.3049
PAPI Fund Page 36
h 9 3 8 8Jestha -
0.0665
-0.1151
-0.1218
-0.0928
-0.0691
-0.1062 -0.0337
Asadh 0.0687
-0.0163
0.0983
0.0698
0.1180 0.0582 0.0908
Shrawan
0.0219
-0.0331
0.3000
-0.0870
0.0841 0.0317 0.0281
Bhadra 0.0566
-0.0256
0.1296
0.0000
0.0109 -0.0086 0.0857
Ashwin 0.0154
0.0351
0.1183
-0.0524
-0.2189
-0.0462 -0.0078
Kartik 0.1253
0.1017
-0.0224
0.1759
0.2543 0.1111 0.0131
Mangsir
0.0341
0.0769
-0.0164
0.0940
0.0241 0.0144 0.0526
Poush 0.0652
0.0214
0.0367
0.0781
0.1074 0.0440 0.1311
Magh -0.0285
-0.0629
-0.0740
-0.0399
0.0030 -0.0775 0.0007
Falgun 0.0605
0.1866
0.0347
0.0981
0.1529 0.0094 0.2035
Chaitra
-0.0409
-0.1384
0.0201
-0.0584
-0.0330
-0.0239 -0.0415
2070 Baisakh
-0.062
-0.177
-0.076
-0.0840
-0.0677 -0.0377
PAPI Fund Page 37
8 6 6Jestha 0.007
8 0.012
00.0040
0.0225 0.0291 -0.0013
Asadh 0.0485
0.0672
0.0512
0.0503 0.0105 0.0392
Mean Return -0.0100
-0.0085
0.0002
-0.0067
-0.0098
-0.0188 -0.0069
StandardDeviation
0.0716
0.1646
0.1336
0.1259
0.1426 0.1177 0.1069
PAPI Fund Page 38

Average Annual Return Calculation and difference in return ofGrowth and Value Stock:
NEPSEReturnin %
KISTReturnin %
PrimeLifeInsuranceReturnin %
CitizensIntl.BankReturnin %
NabilBankReturnin %
Std.Chartered BankReturnin %
Everest BankReturnin %
Mean Return(Monthly)
-0.9975%
-0.8549%
0.0229%
-0.6681%
-0.9844%
-1.8766%
-0.6871%
Mean Return(Annual)
-11.97% -10.25% 0.2751%
-8.0178%
-11.8128%
-22.5196%
-8.2454%
AverageReturn ofValue Stocks(H)
-6.0007%
AverageReturn ofGrowthStocks (L)
-14.1926%
High - LowReturn 8.1919%
PAPI Fund Page 39

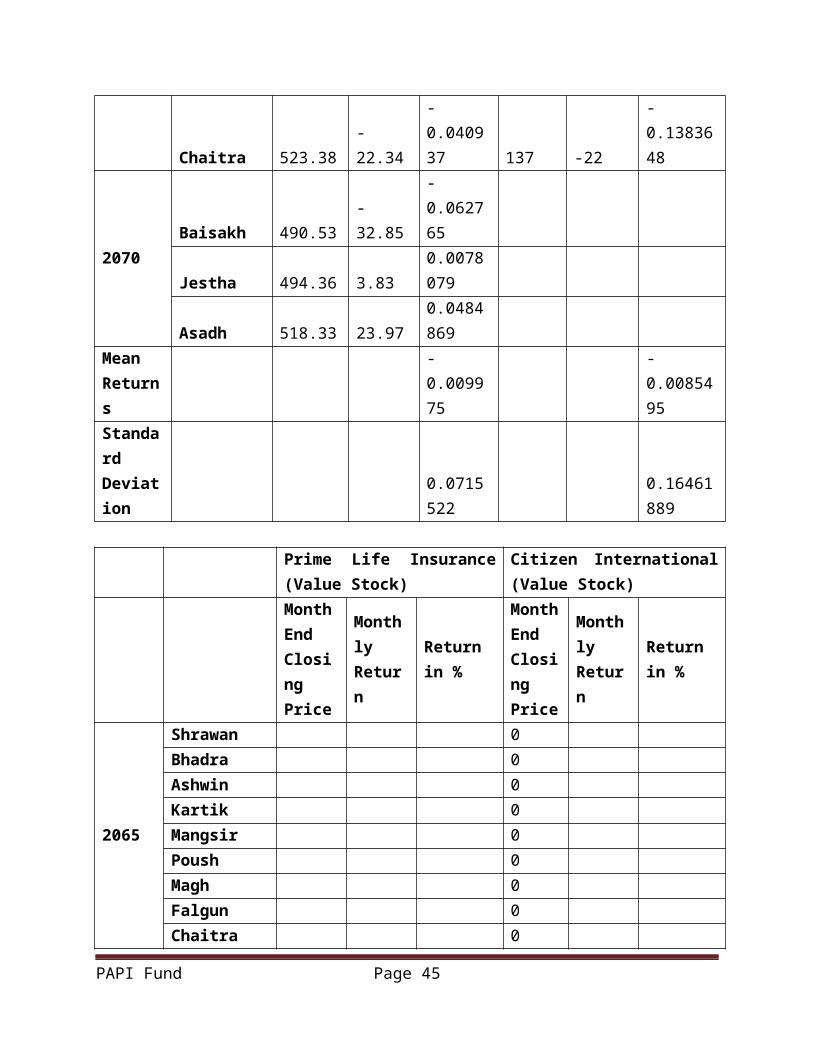
Detail Calculation of Return based on Month End Closing Price:
NEPSEKIST Bank (ValueStock)
MonthEndNEPSEIndex
MonthlyReturn
Returnin %
MonthEndClosingPrice
MonthlyReturn
Returnin %
2065Shrawan
1084.76
Bhadra 976.01
-108.75
-0.100253
Ashwin 933.97-42.04
-0.043073
Kartik 806.9
-127.07
-0.136054
Mangsir 734.85-72.05
-0.089292
Poush 659.81 - -
PAPI Fund Page 40

75.040.102116
Magh 663.52 3.710.0056228
Falgun 667.2 3.680.0055462
Chaitra 661.27 -5.93
-0.008888
2066
Baisakh 660.97 -0.3
-0.000454
Jestha 678.74 17.770.0268847 374
Asadh 749.1 70.360.1036627 378 4
0.01069519
Shrawan 717.2 -31.9
-0.042584 405 27
0.07142857
Bhadra 629.88-87.32
-0.121751 345 -60
-0.1481481
Ashwin 609.55-20.33
-0.032276 369 24
0.06956522
Kartik 566.94-42.61
-0.069904 357 -12
-0.0325203
Mangsir 548.61-18.33
-0.032331 331 -26
-0.0728291
Poush 532.26 -16.35
-0.029803
315 -16 -0.0483384
PAPI Fund Page 41

Magh 493.02-39.24
-0.073723 233 -82
-0.2603175
Falgun 480.49-12.53
-0.025415 260 27
0.11587983
Chaitra 449.04-31.45
-0.065454 213 -47
-0.1807692
2067
Baisakh 440.53 -8.51
-0.018952 192 -21
-0.0985915
Jestha 475.65 35.120.0797222 222 30 0.15625
Asadh 477.73 2.080.004373 199 -23
-0.1036036
Shrawan 453.7-24.03
-0.0503 195 -4
-0.0201005
Bhadra 404.43-49.27
-0.108596 173 -22
-0.1128205
Ashwin 420.3 15.870.0392404 213 40
0.23121387
Kartik 424.93 4.630.0110159 193 -20
-0.0938967
Mangsir 392.04-32.89
-0.077401 171 -22
-0.1139896
Poush 403.71 11.670.0297674 178 7
0.04093567
Magh 404.47 0.76 0.0018 176 -2 -
PAPI Fund Page 42

8250.011236
Falgun 377.5
-26.97
-0.06668 169 -7
-0.0397727
Chaitra 373.2 -4.3
-0.011391 133 -36
-0.2130178
2068
Baisakh 350.62
-22.58
-0.060504 128 -5
-0.037594
Jestha 303.53
-47.09
-0.134305 103 -25
-0.1953125
Asadh362.85 59.32 0.1954
337155 52 0.50485
437
Shrawan 353.33 -9.52
-0.026237 160 5
0.03225806
Bhadra 321.18
-32.15
-0.090991 147 -13
-0.08125
Ashwin 330.99 9.81
0.0305436
141 -6
-0.0408163
Kartik 325.61 -5.38
-0.016254 132 -9
-0.0638298
Mangsir 316.27 -9.34
-0.028685 125 -7
-0.0530303
Poush332.62 16.35 0.0516
963131 6 0.048
Magh 311.88 - - 195 64 0.48854
PAPI Fund Page 43

20.740.062353 962
Falgun 313.92 2.040.006541 107 -88
-0.4512821
Chaitra 319.95 6.030.0192087 120 13
0.12149533
2069Baisakh 390.63 70.68
0.2209095 139 19
0.15833333
Jestha 364.67-25.96
-0.066457 123 -16
-0.1151079
Asadh 389.74 25.070.0687471 121 -2
-0.0162602
Shrawan 398.28 8.540.021912 117 -4
-0.0330579
Bhadra 420.83 22.550.0566185 114 -3
-0.025641
Ashwin 427.3 6.470.0153744 118 4
0.03508772
Kartik 480.85 53.550.1253218 130 12
0.10169492
Mangsir 497.27 16.420.0341479 140 10
0.07692308
Poush 529.69 32.420.065196 143 3
0.02142857
Magh 514.57-15.12
-0.028545 134 -9
-0.0629371
Falgun 545.72 31.15 0.060536
159 25 0.18656716
PAPI Fund Page 44
Chaitra 523.38-22.34
-0.040937 137 -22
-0.1383648
2070Baisakh 490.53
-32.85
-0.062765
Jestha 494.36 3.830.0078079
Asadh 518.33 23.970.0484869
MeanReturns
-0.009975
-0.0085495
StandardDeviation
0.0715522
0.16461889
Prime Life Insurance(Value Stock)
Citizen International(Value Stock)
MonthEndClosingPrice
MonthlyReturn
Returnin %
MonthEndClosingPrice
MonthlyReturn
Returnin %
2065
Shrawan 0 Bhadra 0 Ashwin 0 Kartik 0 Mangsir 0 Poush 0 Magh 0 Falgun 0 Chaitra 0
PAPI Fund Page 45

2066
Baisakh 0 Jestha 549
Asadh 660 1110.20218579
Shrawan 710 500.07575758
Bhadra 688 -22
-0.0309859
Ashwin 681 -7
-0.0101744
Kartik 625 -56
-0.082232
Mangsir 608 -17 -0.0272Poush 570 -38 -0.0625
Magh 510 -60
-0.1052632
Falgun 486 -24
-0.0470588
Chaitra 409 -77
-0.1584362
2067Baisakh 439 30
0.07334963
Jestha 500 610.13895216
Asadh 370 491 -9 -0.018Shrawan 236 -134 -
0.3621622
300 -191 -0.389002
PAPI Fund Page 46

Bhadra 196 -40
-0.1694915 290 -10
-0.0333333
Ashwin 202 60.03061224 292 2
0.00689655
Kartik 224 220.10891089 300 8
0.02739726
Mangsir 202 -22
-0.0982143 253 -47
-0.1566667
Poush 200 -2
-0.009901 250 -3
-0.0118577
Magh 209 9 0.045 242 -8 -0.032
Falgun 193 -16
-0.076555 217 -25
-0.1033058
Chaitra 176 -17
-0.0880829 196 -21
-0.0967742
2068
Baisakh 156 -20
-0.1136364 208 12
0.06122449
Jestha 140 -16
-0.1025641 158 -50
-0.2403846
Asadh 171 310.22142857 222 64
0.40506329
Shrawan 154 -17
-0.0994152 199 -23
-0.1036036
Bhadra 141 -13 -0.0844156
176 -23 -0.1155779
PAPI Fund Page 47

Ashwin 167 260.18439716 164 -12
-0.0681818
Kartik 170 30.01796407 168 4
0.02439024
Mangsir 169 -1
-0.0058824 166 -2
-0.0119048
Poush 166 -3
-0.0177515 177 11
0.06626506
Magh 164 -2
-0.0120482 165 -12
-0.0677966
Falgun 137 -27
-0.1646341 164 -1
-0.0060606
Chaitra 158 210.15328467 191 27
0.16463415
2069Baisakh 197 39
0.24683544 237 46
0.2408377
Jestha 173 -24
-0.1218274 215 -22
-0.092827
Asadh 190 170.0982659 230 15
0.06976744
Shrawan 247 57 0.3 210 -20
-0.0869565
Bhadra 279 320.12955466 210 0 0
Ashwin 312 33 0.11827957
199 -11 -0.052381
PAPI Fund Page 48

Kartik 305 -7
-0.0224359 234 35
0.1758794
Mangsir 300 -5
-0.0163934 256 22
0.09401709
Poush 311 110.03666667 276 20
0.078125
Magh 288 -23
-0.073955 265 -11
-0.0398551
Falgun 298 100.03472222 291 26
0.09811321
Chaitra 304 60.02013423 274 -17
-0.0584192
2070Baisakh 250 -54
-0.1776316 253 -21
-0.0766423
Jestha 253 3 0.012 254 10.00395257
Asadh 270 170.06719368 267 13
0.0511811
Mean Returns
0.00022923
-0.0066815
StandardDeviation
0.13358531
0.125939
Nabil Bank (GrowthStock)
Standard CharteredBank (Growth Stock)
MonthEnd
Monthly
Returnin %
MonthEnd
Monthly
Returnin %
PAPI Fund Page 49

ClosingPrice
Return
ClosingPrice
Return
2065
Shrawan 6101 8526
Bhadra 4100 -2001
-0.327979 7858 -668
-0.0783486
Ashwin 3980 -120
-0.0292683 7750 -108
-0.013744
Kartik 3775 -205
-0.0515075 5090 -2660
-0.3432258
Mangsir 3701 -74
-0.0196026 4875 -215
-0.0422397
Poush 3350 -351
-0.0948392 4733 -142
-0.0291282
Magh 3560 2100.06268657 4610 -123
-0.0259877
Falgun 3520 -40
-0.011236 4600 -10
-0.0021692
Chaitra 3560 40
0.01136364 4699 99
0.02152174
2066 Baisakh 3660 100
0.02808989 4825 126
0.02681422
Jestha 4216 5560.15191257 5575 750
0.15544041
Asadh 4899 683 0.1620019
6010 435 0.07802691
PAPI Fund Page 50

Shrawan 4944 45
0.00918555 6186 176
0.02928453
Bhadra 2820 -2124
-0.4296117 5235 -951
-0.1537342
Ashwin 2880 600.0212766 3680 -1555
-0.2970392
Kartik 2700 -180 -0.0625 3568 -112
-0.0304348
Mangsir 2590 -110
-0.0407407 3510 -58
-0.0162556
Poush 2600 100.003861 3305 -205
-0.0584046
Magh 2320 -280
-0.1076923 3020 -285
-0.086233
Falgun 2261 -59
-0.025431 3126 106
0.03509934
Chaitra 2040 -221
-0.0977444 2895 -231
-0.0738964
2067 Baisakh 2200 160
0.07843137 2920 25
0.00863558
Jestha 2300 1000.04545455 3200 280
0.09589041
Asadh 2384 840.03652174 3279 79
0.0246875
Shrawan
2121 -263 -0.11031
2874 -405 -0.12351
PAPI Fund Page 51

88 33
Bhadra 1965 -156
-0.0735502 2130 -744
-0.2588727
Ashwin 1503 -462
-0.2351145 2421 291
0.13661972
Kartik 1421 -82
-0.0545576 2142 -279
-0.1152416
Mangsir 1162 -259
-0.182266 1856 -286
-0.1335201
Poush 1330 1680.14457831 2025 169
0.09105603
Magh 1352 220.01654135 2030 5
0.00246914
Falgun 1191 -161
-0.1190828 1812 -218
-0.1073892
Chaitra 1218 27
0.02267003 1730 -82
-0.0452539
2068
Baisakh 1091 -127
-0.1042693 1647 -83
-0.0479769
Jestha 868 -223
-0.2043996 1334 -313
-0.1900425
Asadh 1252 3840.44239631 1800 466
0.34932534
Shrawan 1231 -21
-0.0167732 1690 -110
-0.0611111
PAPI Fund Page 52

Bhadra 925 -306
-0.2485784 1360 -330
-0.1952663
Ashwin 948 230.02486486 1470 110
0.08088235
Kartik 875 -73
-0.0770042 1350 -120
-0.0816327
Mangsir 809 -66
-0.0754286 1318 -32
-0.0237037
Poush 904 950.11742892 1410 92
0.06980273
Magh 843 -61
-0.0674779 1332 -78
-0.0553191
Falgun 880 370.04389087 1380 48
0.03603604
Chaitra 988 108
0.12272727 1450 70
0.05072464
2069 Baisakh 1302 314
0.31781377 1902 452
0.31172414
Jestha 1212 -90
-0.0691244 1700 -202
-0.106204
Asadh 1355 1430.1179868 1799 99
0.05823529
Shrawan 1469 114
0.08413284 1856 57
0.03168427
Bhadra 1485 160.01089176 1840 -16
-0.0086207
Ashwin 1160 -325 -0.21885
1755 -85 -0.04619
PAPI Fund Page 53

52 57
Kartik 1455 2950.25431034 1950 195
0.11111111
Mangsir 1490 35
0.02405498 1978 28
0.01435897
Poush 1650 1600.10738255 2065 87
0.04398382
Magh 1655 50.0030303 1905 -160
-0.0774818
Falgun 1908 2530.15287009 1923 18
0.00944882
Chaitra 1845 -63
-0.0330189 1877 -46
-0.023921
2070
Baisakh 1690 -155
-0.0840108 1750 -127
-0.0676612
Jestha 1728 380.02248521 1801 51
0.02914286
Asadh 1815 870.05034722 1820 19
0.01054969
Mean Returns
-0.009844
-0.0187663
StandardDeviation
0.14264467
0.11766251
Everest Bank (GrowthStock)
PAPI Fund Page 54

MonthEndClosingPrice
MonthlyReturn
Returnin %
2065
Shrawan 3370
Bhadra 3112 -258
-0.0765579
Ashwin 3033 -79
-0.0253856
Kartik 2352 -681
-0.2245302
Mangsir 2095 -257
-0.1092687
Poush 2026 -69
-0.0329356
Magh 2015 -11
-0.0054294
Falgun 2040 250.01240695
Chaitra 2230 1900.09313725
2066 Baisakh 2125 -105
-0.0470852
Jestha 2345 2200.10352941
PAPI Fund Page 55

Asadh 2455 1100.04690832
Shrawan 2650 1950.07942974
Bhadra 2290 -360
-0.1358491
Ashwin 2390 1000.04366812
Kartik 1747 -643
-0.2690377
Mangsir 1722 -25
-0.0143102
Poush 1604 -118
-0.068525
Magh 1581 -23
-0.0143392
Falgun 1550 -31
-0.0196078
Chaitra 1449 -101
-0.0651613
2067Baisakh 1342 -107
-0.073844
Jestha 1588 2460.18330849
Asadh 1630 420.02644836
PAPI Fund Page 56

Shrawan 1558 -72
-0.0441718
Bhadra 1114 -444
-0.2849807
Ashwin 1075 -39
-0.035009
Kartik 1159 840.07813953
Mangsir 1000 -159
-0.1371872
Poush 1100 100 0.1
Magh 1070 -30
-0.0272727
Falgun 1049 -21
-0.0196262
Chaitra 1121 720.0686368
2068
Baisakh 971 -150
-0.1338091
Jestha 920 -51
-0.0525232
Asadh 1094 1740.18913043
Shrawan 975 -119
-0.1087751
PAPI Fund Page 57

Bhadra 980 50.00512821
Ashwin 945 -35
-0.0357143
Kartik 780 -165
-0.1746032
Mangsir 765 -15
-0.0192308
Poush 728 -37
-0.048366
Magh 683 -45
-0.0618132
Falgun 670 -13
-0.0190337
Chaitra 751 810.12089552
2069Baisakh 980 229
0.30492676
Jestha 947 -33
-0.0336735
Asadh 1033 860.09081309
Shrawan 1062 290.02807357
Bhadra 1153 910.08568738
Ashwin 1144 -9 -
PAPI Fund Page 58

0.0078057
Kartik 1159 150.01311189
Mangsir1220 61 0.05263
158
Poush1380 160 0.13114
754
Magh1381 1 0.00072
464
Falgun1662 281 0.20347
574
Chaitra 1593 -69
-0.0415162
2070
Baisakh 1533 -60
-0.0376648
Jestha 1531 -2
-0.0013046
Asadh 1591 600.03919007
Mean Returns
-0.0068712
StandardDeviation
0.10693141
PAPI Fund Page 59