
FINAL Davidson Commons East Hotel Transportation Impact ...
49
FINAL Davidson Commons East Hotel Transportation Impact Analysis Davidson Commons East Lots 4AB Parcel ID# 00323190 (127 Davidson Gateway Drive) and Parcel ID# 00323191 (151 Davidson Gateway Drive) Prepared for: Town of Davidson 216 S. Main Street Davidson, NC 28036 Prepared by: Stantec Consulting Services Inc. 2127 Ayrsley Town Blvd. Suite 300 Charlotte, NC 28273 February 23, 2017
-
Upload
khangminh22 -
Category
Documents
-
view
5 -
download
0
Transcript of FINAL Davidson Commons East Hotel Transportation Impact ...
FINAL Davidson Commons East Hotel Transportation Impact Analysis
Davidson Commons East Lots 4AB Parcel ID# 00323190 (127 Davidson Gateway Drive) and Parcel ID# 00323191 (151 Davidson Gateway Drive)
Prepared for: Town of Davidson 216 S. Main Street Davidson, NC 28036
Prepared by: Stantec Consulting Services Inc. 2127 Ayrsley Town Blvd. Suite 300 Charlotte, NC 28273
February 23, 2017


FINAL DAVIDSON COMMONS EAST HOTEL TRANSPORTATION IMPACT ANALYSIS
February 23, 2017
kr u:\171001817\transportation\design\report\final_davidson commons east hotel tia.docx i
Table of Contents
EXECUTIVE SUMMARY ................................................................................................................ III
1.0 INTRODUCTION ................................................................................................................ 1
2.0 INVENTORY OF TRAFFIC CONDITIONS ........................................................................... 3 2.1 STUDY AREA .......................................................................................................................... 3 2.2 EXISTING CONDITIONS ........................................................................................................ 3 2.3 PROJECTED ROADWAY IMPROVEMENTS ......................................................................... 7 2.4 PUBLIC TRANSPORTATION .................................................................................................. 7
3.0 TRAFFIC GENERATION ..................................................................................................... 7 3.1 METHODOLOGY .................................................................................................................. 7 3.2 INTERNAL CAPTURE .............................................................................................................. 8 3.3 MULTI-MODAL CONNECTIVITY REDUCTION ..................................................................... 9 3.4 TRIP GENERATION – PROPOSED DEVELOPMENT ............................................................. 9 3.5 TRIP GENERATION – PREVIOUSLY APPROVED DEVELOPMENT ...................................... 9
4.0 TRAFFIC DISTRIBUTION ................................................................................................... 12 4.1 SITE TRIP DISTRIBUTION ....................................................................................................... 12 4.2 PASS-BY TRIP DISTRIBUTION ............................................................................................... 14
5.0 TRAFFIC VOLUMES ......................................................................................................... 16 5.1 APPROVED DEVELOPMENTS ............................................................................................ 16 5.2 FUTURE TRAFFIC GROWTH ................................................................................................ 16 5.3 TOTAL BUILD TRAFFIC WITH PROPOSED DEVELOPMENT ............................................... 17 5.4 TOTAL BUILD TRAFFIC WITH PREVIOUSLY APPROVED DEVELOPMENT ........................ 17
6.0 TRAFFIC ANALYSIS ......................................................................................................... 28 6.1 GRIFFITH STREET AT HARBOUR PLACE DRIVE / DAVIDSON GATEWAY DRIVE ............ 30 6.2 GRIFFITH STREET AT JETTON STREET ................................................................................... 31 6.3 GRIFFITH STREET AT DAVIDSON GATEWAY DRIVE ......................................................... 32 6.4 GRIFFITH STREET AT BEATY STREET/SLOAN STREET .......................................................... 33 6.5 JETTON STREET AT DAVIDSON GATEWAY DRIVE ........................................................... 35 6.6 DAVIDSON GATEWAY DRIVE AT SITE DRIVEWAY .......................................................... 36
7.0 SIMTRAFFIC OPERATIONS .............................................................................................. 37
8.0 MULTIMODAL ANALYSIS ................................................................................................ 38
9.0 RECOMMENDATIONS .................................................................................................... 41
10.0 CONCLUSIONS ............................................................................................................... 42
11.0 REFERENCES.................................................................................................................... 43
FINAL DAVIDSON COMMONS EAST HOTEL TRANSPORTATION IMPACT ANALYSIS
February 23, 2017
kr u:\171001817\transportation\design\report\final_davidson commons east hotel tia.docx ii
LIST OF TABLES Table 1: Davidson Commons East Proposed Hotel Trip Generation Table ......................... 10 Table 2: Davidson Commons East Previously Approved Office-Retail Trip
Generation Table ........................................................................................................... 11 Table 3: Level of Service Criteria – Signalized Intersections ................................................... 28 Table 4: Level of Service Criteria – Unsignalized Intersections ............................................... 29 Table 5: Level of Service Criteria – Roundabouts .................................................................... 29 Table 6: Level of Service and Delay for Griffith St. @ Harbour Place Dr. / Davidson
Gateway Dr. .................................................................................................................... 30 Table 7: Level of Service and Delay for Griffith St. @ Jetton St. ............................................. 31 Table 8: Level of Service and Delay for Griffith St. @ Davidson Gateway Dr. ..................... 32 Table 9: Level of Service and Delay for Griffith St. @ Beaty St/Sloan St. .............................. 34 Table 10: Level of Service and Delay for Jetton St. @ Davidson Gateway Drive. ............. 35 Table 11: Level of Service and Delay for Davidson Gateway Drive @ Site
Driveway. ......................................................................................................................... 36 Table 12: Bicycle and Pedestrian LOS Criteria ......................................................................... 39 Table 13: Bus LOS Criteria ............................................................................................................. 39 Table 14: Multimodal LOS Summary – 2016 Existing ................................................................. 39 Table 15: Multimodal LOS Summary – 2018 No Build ............................................................... 40 Table 16: Multimodal LOS Summary – 2018 Build w/ Proposed Development ................... 40 Table 17: Corridor Multimodal LOS Summary – 2016 Existing ................................................. 40 Table 18: Corridor Multimodal LOS Summary – 2018 No Build ............................................... 40 Table 19: Corridor Multimodal LOS Summary – 2018 Build w/ Proposed
Development .................................................................................................................. 41
LIST OF FIGURES Figure 1: Site Location and Study Area Map .............................................................................. 1 Figure 2: Site Plan ............................................................................................................................. 2 Figure 3: Existing Geometry ............................................................................................................ 6 Figure 4: Davidson Commons Trip Distribution ........................................................................ 13 Figure 5: Davidson Commons Pass-By Trip Distribution .......................................................... 15 Figure 6: Existing (2016) Traffic Volumes .................................................................................... 18 Figure 7: Future (2018) No Build AM Traffic Volumes .............................................................. 19 Figure 8: Future (2018) No Build Mid-Day Traffic Volumes ..................................................... 20 Figure 9: Future (2018) No Build PM Traffic Volumes ............................................................... 21 Figure 10: Future (2018) Build AM Traffic Volumes – Proposed Development .................... 22 Figure 11: Future (2018) Build Mid-Day Traffic Volumes – Proposed Development ........... 23 Figure 12: Future (2018) Build PM Traffic Volumes – Proposed Development ..................... 24 Figure 13: Future (2018) Build AM Traffic Volumes – Previously Approved
Development .................................................................................................................. 25 Figure 14: Future (2018) Build Mid-Day Traffic Volumes – Previously Approved
Development .................................................................................................................. 26 Figure 15: Future (2018) Build PM Traffic Volumes – Previously Approved
Development .................................................................................................................. 27

FINAL DAVIDSON COMMONS EAST HOTEL TRANSPORTATION IMPACT ANALYSIS
February 23, 2017
kr u:\171001817\transportation\design\report\final_davidson commons east hotel tia.docx iii
Executive Summary
The proposed Davidson Commons Hotel Development is located in the southeast quadrant of the Griffith Street at Davidson Gateway Drive intersection in Davidson, North Carolina.
The purpose of this report is to evaluate the proposed development in terms of projected traffic conditions, evaluate the ability of the adjacent roadways and multi-modal facilities to accommodate the additional traffic and pedestrian volumes, and to recommend transportation improvements needed to mitigate congestion that may result from additional site traffic. This report presents trip generation, trip distribution, traffic analyses, multi-modal analyses, and recommendations for improvements needed to meet anticipated traffic demands. This report examines 2016 Existing conditions, 2018 No Build conditions, 2018 Build with the Proposed Development, and 2018 Build with the Previously Approved Development for the AM, Mid-Day (school peak), and PM peak hours.
The results of the transportation study show that the proposed development will not have a significant impact on the surrounding roadways or multi-modal infrastructure in the vicinity of the site. For the purposes of this study, the term significant impact is defined as having an impact large enough to cause an overall intersection to reach level of service E or F, if it is not expected to be LOS E or F in the existing or no build conditions.
The proposed roundabout at the intersection of Griffith Street and Beaty Street / Sloan Street results in an improved level of service over the existing signal control in the future year build scenario. Therefore, it is recommended that plans continue to move forward for the conversion of that intersection from a signal to a roundabout. However, the southbound approach of the roundabout is expected to operate at a failing level of service during the PM peak hour. Consideration should be given to the addition of an exclusive right-turn lane on that approach to accommodate the high traffic demand. However, this proposal should be carefully examined in light of the Town’s emphasis on pedestrian mobility and safety, along with surrounding uses such as a major park.
The stop-controlled approach of Davidson Gateway Drive at Griffith Street is expected to experience an unsatisfactory level of service in the build scenarios, although it is not uncommon for this to occur during the peak periods at unsignalized intersections. The major street (Griffith Street) does not experience any significant delays as a result of the proposed site. Additionally, in urban areas such as this, emphasis is not placed on the performance of individual vehicular movements, but instead on more qualitative factors such as economic development and quality of life.
At all locations, the impacts of the previously approved development, which includes office and retail land uses, are much greater than those of the proposed hotel and restaurant land uses. There are minimal changes in delay and level of service at most locations between the 2018 No Build and 2018 Build with Proposed Development scenarios.
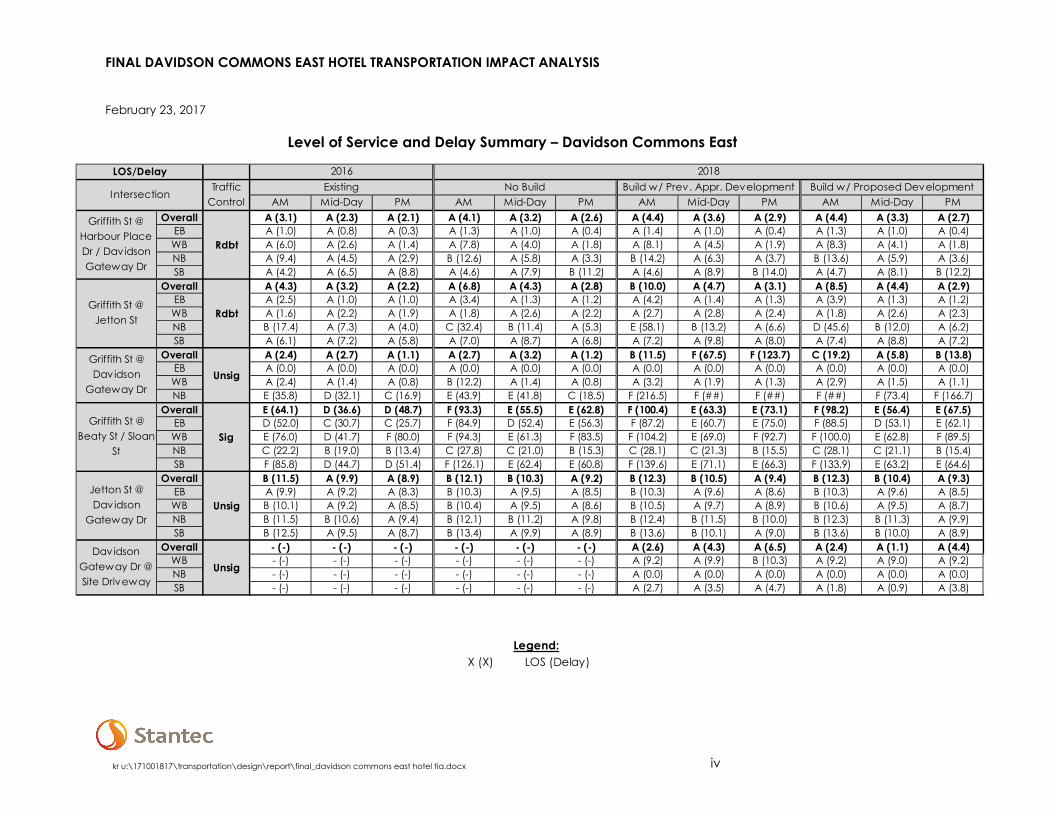
The table below shows the overall vehicular level of service and average delay (in seconds) for each study area intersection and approach included in this Transportation Impact Analysis (TIA). Further information about these results can be found in Section 6.0.
FINAL DAVIDSON COMMONS EAST HOTEL TRANSPORTATION IMPACT ANALYSIS
February 23, 2017
kr u:\171001817\transportation\design\report\final_davidson commons east hotel tia.docx iv
Level of Service and Delay Summary – Davidson Commons East
X (X) LOS (Delay)
Legend:
AM Mid-Day PM AM Mid-Day PM AM Mid-Day PM AM Mid-Day PMOverall A (3.1) A (2.3) A (2.1) A (4.1) A (3.2) A (2.6) A (4.4) A (3.6) A (2.9) A (4.4) A (3.3) A (2.7)
EB A (1.0) A (0.8) A (0.3) A (1.3) A (1.0) A (0.4) A (1.4) A (1.0) A (0.4) A (1.3) A (1.0) A (0.4)WB A (6.0) A (2.6) A (1.4) A (7.8) A (4.0) A (1.8) A (8.1) A (4.5) A (1.9) A (8.3) A (4.1) A (1.8)NB A (9.4) A (4.5) A (2.9) B (12.6) A (5.8) A (3.3) B (14.2) A (6.3) A (3.7) B (13.6) A (5.9) A (3.6)SB A (4.2) A (6.5) A (8.8) A (4.6) A (7.9) B (11.2) A (4.6) A (8.9) B (14.0) A (4.7) A (8.1) B (12.2)
Overall A (4.3) A (3.2) A (2.2) A (6.8) A (4.3) A (2.8) B (10.0) A (4.7) A (3.1) A (8.5) A (4.4) A (2.9)EB A (2.5) A (1.0) A (1.0) A (3.4) A (1.3) A (1.2) A (4.2) A (1.4) A (1.3) A (3.9) A (1.3) A (1.2)WB A (1.6) A (2.2) A (1.9) A (1.8) A (2.6) A (2.2) A (2.7) A (2.8) A (2.4) A (1.8) A (2.6) A (2.3)NB B (17.4) A (7.3) A (4.0) C (32.4) B (11.4) A (5.3) E (58.1) B (13.2) A (6.6) D (45.6) B (12.0) A (6.2)SB A (6.1) A (7.2) A (5.8) A (7.0) A (8.7) A (6.8) A (7.2) A (9.8) A (8.0) A (7.4) A (8.8) A (7.2)
Overall A (2.4) A (2.7) A (1.1) A (2.7) A (3.2) A (1.2) B (11.5) F (67.5) F (123.7) C (19.2) A (5.8) B (13.8)EB A (0.0) A (0.0) A (0.0) A (0.0) A (0.0) A (0.0) A (0.0) A (0.0) A (0.0) A (0.0) A (0.0) A (0.0)WB A (2.4) A (1.4) A (0.8) B (12.2) A (1.4) A (0.8) A (3.2) A (1.9) A (1.3) A (2.9) A (1.5) A (1.1)NB E (35.8) D (32.1) C (16.9) E (43.9) E (41.8) C (18.5) F (216.5) F (##) F (##) F (##) F (73.4) F (166.7)
Overall E (64.1) D (36.6) D (48.7) F (93.3) E (55.5) E (62.8) F (100.4) E (63.3) E (73.1) F (98.2) E (56.4) E (67.5)EB D (52.0) C (30.7) C (25.7) F (84.9) D (52.4) E (56.3) F (87.2) E (60.7) E (75.0) F (88.5) D (53.1) E (62.1)WB E (76.0) D (41.7) F (80.0) F (94.3) E (61.3) F (83.5) F (104.2) E (69.0) F (92.7) F (100.0) E (62.8) F (89.5)NB C (22.2) B (19.0) B (13.4) C (27.8) C (21.0) B (15.3) C (28.1) C (21.3) B (15.5) C (28.1) C (21.1) B (15.4)SB F (85.8) D (44.7) D (51.4) F (126.1) E (62.4) E (60.8) F (139.6) E (71.1) E (66.3) F (133.9) E (63.2) E (64.6)
Overall B (11.5) A (9.9) A (8.9) B (12.1) B (10.3) A (9.2) B (12.3) B (10.5) A (9.4) B (12.3) B (10.4) A (9.3)EB A (9.9) A (9.2) A (8.3) B (10.3) A (9.5) A (8.5) B (10.3) A (9.6) A (8.6) B (10.3) A (9.6) A (8.5)WB B (10.1) A (9.2) A (8.5) B (10.4) A (9.5) A (8.6) B (10.5) A (9.7) A (8.9) B (10.6) A (9.5) A (8.7)NB B (11.5) B (10.6) A (9.4) B (12.1) B (11.2) A (9.8) B (12.4) B (11.5) B (10.0) B (12.3) B (11.3) A (9.9)SB B (12.5) A (9.5) A (8.7) B (13.4) A (9.9) A (8.9) B (13.6) B (10.1) A (9.0) B (13.6) B (10.0) A (8.9)
Overall - (-) - (-) - (-) - (-) - (-) - (-) A (2.6) A (4.3) A (6.5) A (2.4) A (1.1) A (4.4)WB - (-) - (-) - (-) - (-) - (-) - (-) A (9.2) A (9.9) B (10.3) A (9.2) A (9.0) A (9.2)NB - (-) - (-) - (-) - (-) - (-) - (-) A (0.0) A (0.0) A (0.0) A (0.0) A (0.0) A (0.0)SB - (-) - (-) - (-) - (-) - (-) - (-) A (2.7) A (3.5) A (4.7) A (1.8) A (0.9) A (3.8)
Griffith St @ Beaty St / Sloan
StSig
Jetton St @ Davidson
Gateway DrUnsig
Davidson Gateway Dr @ Site Driveway
Unsig
Griffith St @ Jetton St Rdbt
Griffith St @ Davidson
Gateway DrUnsig
Griffith St @ Harbour Place Dr / Davidson Gateway Dr
Rdbt
Build w/ Proposed DevelopmentIntersection
Traffic Control
Existing No Build Build w/ Prev. Appr. Development2016 2018LOS/Delay
FINAL DAVIDSON COMMONS EAST HOTEL TRANSPORTATION IMPACT ANALYSIS
February 23, 2017
kr u:\171001817\transportation\design\report\final_davidson commons east hotel tia.docx 1
1.0 INTRODUCTION
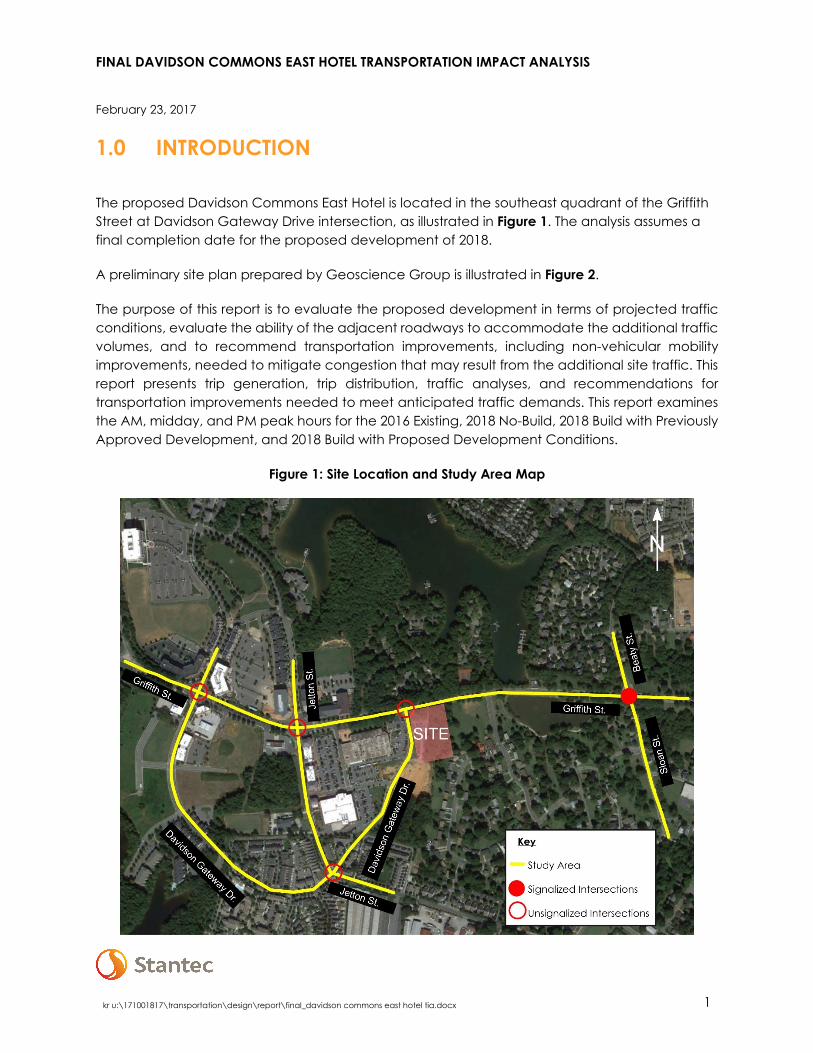
The proposed Davidson Commons East Hotel is located in the southeast quadrant of the Griffith Street at Davidson Gateway Drive intersection, as illustrated in Figure 1. The analysis assumes a final completion date for the proposed development of 2018.
A preliminary site plan prepared by Geoscience Group is illustrated in Figure 2.
The purpose of this report is to evaluate the proposed development in terms of projected traffic conditions, evaluate the ability of the adjacent roadways to accommodate the additional traffic volumes, and to recommend transportation improvements, including non-vehicular mobility improvements, needed to mitigate congestion that may result from the additional site traffic. This report presents trip generation, trip distribution, traffic analyses, and recommendations for transportation improvements needed to meet anticipated traffic demands. This report examines the AM, midday, and PM peak hours for the 2016 Existing, 2018 No-Build, 2018 Build with Previously Approved Development, and 2018 Build with Proposed Development Conditions.
Figure 1: Site Location and Study Area Map

FINAL DAVIDSON COMMONS EAST HOTEL TRANSPORTATION IMPACT ANALYSIS
Introduction February 23, 2017
kr u:\171001817\transportation\design\report\final_davidson commons east hotel tia.docx 2
Figure 2: Site Plan

FINAL DAVIDSON COMMONS EAST HOTEL TRANSPORTATION IMPACT ANALYSIS
Inventory of Traffic Conditions February 23, 2017
kr u:\171001817\transportation\design\report\final_davidson commons east hotel tia.docx 3
2.0 INVENTORY OF TRAFFIC CONDITIONS
2.1 STUDY AREA
The Town of Davidson requested that the following intersections be analyzed:
• Griffith Street at Harbour Place Drive / Davidson Gateway Drive • Griffith Street at Jetton Street • Griffith Street at Davidson Gateway Drive • Griffith Street at Beaty Street / Sloan Street • Jetton Street at Davidson Gateway Drive
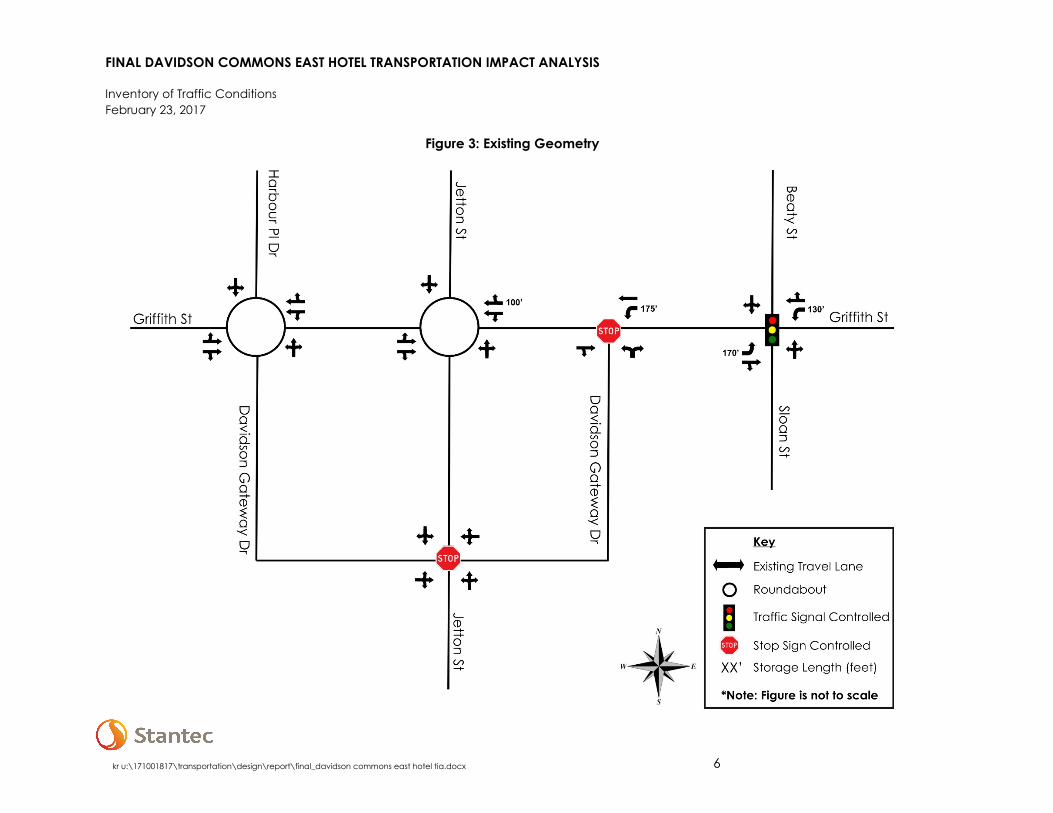
Figure 3 shows a diagram of the existing lane geometry and traffic control in the study area.
2.2 EXISTING CONDITIONS
Griffith Street (SR 2158) is an east-west facility through the study area. The western portion of Griffith Street is a four-lane divided section, while the eastern portion is a two-lane section. In the area around the proposed site, the existing land use is primarily residential and mixed use. Griffith Street has sidewalks throughout much of the study area, and dedicated bike lanes from Spinnaker Cove Drive eastward through the Beaty/Sloan intersection. The posted speed limit along Griffith Street is 25 miles per hour (mph). The NCDOT 2014 Average Daily Traffic1 (ADT) for Griffith Street at the western end of the study area is 21,000 vehicles per day (vpd); the 2014 ADT at the eastern end of the study area is 11,000 vpd.

FINAL DAVIDSON COMMONS EAST HOTEL TRANSPORTATION IMPACT ANALYSIS
Inventory of Traffic Conditions February 23, 2017
kr u:\171001817\transportation\design\report\final_davidson commons east hotel tia.docx 4
Harbour Place Drive is a two-lane local road at the west end of the study area. There is on-street parallel parking along Harbour Place Drive serving the residential/mixed use developments. There is no posted speed limit for Harbour Place Drive, and no ADT was available.
Davidson Gateway Drive is a two-lane local road serving the residential and retail developments in the southern portion of the study area. Davidson Gateway Drive forms a loop that intersects Griffith Street twice and Jetton Street once within the study area. The proposed site is located at the eastern end of Davidson Gateway Drive. The posted speed limit for Davidson Gateway Drive is 25 mph. No ADT data was available for this road.
Jetton Street is a two-lane local road running north to south through the study area. The primary land use along Jetton Street within the study area is residential. However, the northern portion of Jetton Street contains a mix of residential and commercial uses. Davidson Day School is located at the corner of Jetton Street and Griffith Street. The posted speed limit for Jetton Street is 25 mph. No ADT data was available.
FINAL DAVIDSON COMMONS EAST HOTEL TRANSPORTATION IMPACT ANALYSIS
Inventory of Traffic Conditions February 23, 2017
kr u:\171001817\transportation\design\report\final_davidson commons east hotel tia.docx 5
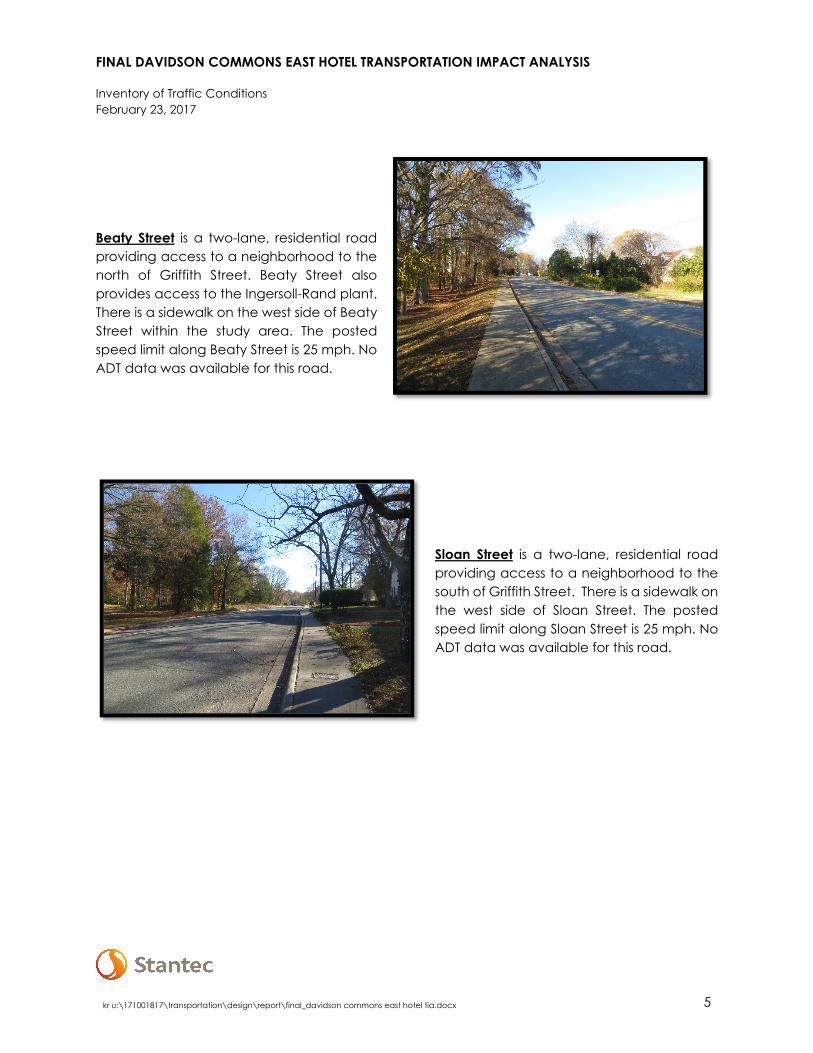
Beaty Street is a two-lane, residential road providing access to a neighborhood to the north of Griffith Street. Beaty Street also provides access to the Ingersoll-Rand plant. There is a sidewalk on the west side of Beaty Street within the study area. The posted speed limit along Beaty Street is 25 mph. No ADT data was available for this road.
Sloan Street is a two-lane, residential road providing access to a neighborhood to the south of Griffith Street. There is a sidewalk on the west side of Sloan Street. The posted speed limit along Sloan Street is 25 mph. No ADT data was available for this road.
FINAL DAVIDSON COMMONS EAST HOTEL TRANSPORTATION IMPACT ANALYSIS
Inventory of Traffic Conditions February 23, 2017
kr u:\171001817\transportation\design\report\final_davidson commons east hotel tia.docx 6
Figure 3: Existing Geometry

FINAL DAVIDSON COMMONS EAST HOTEL TRANSPORTATION IMPACT ANALYSIS
Traffic Generation February 23, 2017
kr u:\171001817\transportation\design\report\final_davidson commons east hotel tia.docx 7
2.3 PROJECTED ROADWAY IMPROVEMENTS
There are no known transportation projects planned in the immediate vicinity of this development that will be constructed prior to the build out year of 2018. There is a project to convert the signalized intersection at Griffith St. / Beaty St. / Sloan St. to a roundabout. That project is expected to begin in 2018. The roundabout at this location is evaluated under the 2018 Build scenario for the proposed development for informational purposes.
2.4 PUBLIC TRANSPORTATION
The Charlotte Area Transit System (CATS) provides the primary bus service for the City of Charlotte, and surrounding areas. The project area is currently served by Route 77X (North Mecklenburg Express) and Route 97 (Village Rider). Information on operations of these routes is noted below:
Route 77X (North Mecklenburg Express)
- Operates Monday through Friday with pick-ups between approximately 5:15 AM to 9:00 AM and 3:45 PM to 9:00 PM.
- Pick-up frequency ranges from every 10 to 30 minutes, depending on the specific time of day.
- It provides a connection mainly for commuters between Davidson and other northern Mecklenburg County communities and uptown Charlotte.
- The route currently stops at a park-and-ride at the intersection of Gateway Crossing Drive and Davidson Gateway Drive and has stops along Griffith Street at Beaty Street / Sloan Street, Lakeside Avenue, and near the intersection of Jetton Street.
Route 97 (Village Rider)
- Operates from 6:30 am – 7:30 pm Monday thru Friday, 8:30 am – 7:30 pm Saturday, 9:30 am – 6:30 pm Sunday
- Pick-up frequency is every 60 minutes - Provides a connection for local residents and visitors between Huntersville, Cornelius,
Davidson, and other points in northern Mecklenburg County. - The route has a stop along Griffith Street at Lakeside Avenue.
3.0 TRAFFIC GENERATION
3.1 METHODOLOGY
Standard practice is to use trip generation rates and equations provided in the ITE Trip Generation Manual, 9th Edition2 to develop the estimated number of trips generated for each land use on a site. While this methodology was used for the calculation of AM and PM peak hour

FINAL DAVIDSON COMMONS EAST HOTEL TRANSPORTATION IMPACT ANALYSIS
Traffic Generation February 23, 2017
kr u:\171001817\transportation\design\report\final_davidson commons east hotel tia.docx 8
trips, there is limited guidance for calculating the number of Mid-Day peak hour trips. Therefore, additional resources were necessary in developing the estimated number of trips during the peak period for school traffic (determined to be 2:45pm – 3:45pm). Below is a description of the methodology used for each land use type in this study.
• Hotel – In order to generate the number of Mid-Day peak hour trips for the proposed site, traffic counts were collected at the Homewood Suites in Davidson. The total mid-day trip rate per room was determined to be 0.18 trips per room. This rate was applied to the proposed 107 room hotel. The traffic counts from the hotel site are included in the Appendix.
• Restaurant – Mid-Day trip generation for the restaurant land use was calculated based on information provided in the Table within the section of the ITE Trip Generation Manual, 9th Edition which covers Land Use Code 932, High-Turnover Sit-Down Restaurant. Based on this table, 3% of the daily entering traffic occurs between 3pm and 4pm and 4% of the daily exiting traffic occurs between 3pm and 4pm. This table can be found in the Appendix.
• Office – Mid-Day office trips were counted for a similar site in Raleigh, NC with proximity to a mixed-use development. The proportion of mid-day traffic relative to the daily traffic per square foot was applied to the land use intensity for this site. The total mid-day trip generation rate was calculated to be 1.41 trips per 1000 square feet of office space. Trip generation information from the study used is located in the Appendix.
• Retail – Mid-Day trip generation for the retail land uses was calculated based on information provided in Table 1 of the section of the ITE Trip Generation Manual, 9th Edition which covers Land Use Code 820, General Retail. Based on this table, 7.8% of the daily entering traffic occurs between 3pm and 4pm and 8.8% of the daily exiting traffic occurs between 3pm and 4pm. This table is attached to this memorandum.
3.2 INTERNAL CAPTURE
For developments with multiple land uses, a certain percentage of the traffic is assumed to be generated from within the development itself. These analyses examine the number of trips, also referred to as internally captured trips, that are not generated on a site because the services provided on site can be accessed by users already on the property via non-vehicular means (such as a hotel guest eating at a restaurant within the same building). Internal capture percentages for the AM and PM peak hours were calculated using NCHRP 08-51 methodology. Due to limitations in this methodology, the daily and mid-day internal capture percentages were calculated using ITE methodology. Both practices are widely accepted in the field of transportation engineering.
Internal capture rates for the proposed development range between 5 and 9 percent, depending on the time of day, while rates for the previously approved development range

FINAL DAVIDSON COMMONS EAST HOTEL TRANSPORTATION IMPACT ANALYSIS
Traffic Generation February 23, 2017
kr u:\171001817\transportation\design\report\final_davidson commons east hotel tia.docx 9
between 5 and 8 percent, depending on the time of day. The rates for each scenario and peak period are shown in Tables 1 and 2.
3.3 MULTI-MODAL CONNECTIVITY REDUCTION
Due to the proximity of retail, restaurant, and other land uses to the Linden Apartments as well as to the proposed Davidson Commons site, it was assumed that some portion of the residents and patrons would walk or bike to the adjacent parcels, rather than driving. Based on internal capture rates for the proposed and previously approved developments, which range from 5 to 9 percent, it was assumed that a conservative 5 percent of the total traffic generated by these developments would be captured in part by the adjacent land uses during each peak hour studied. This percentage applies to the Linden Apartments Approved Development, the Davidson Commons Previously Approved Development, and the Davidson Commons Proposed Development.
3.4 TRIP GENERATION – PROPOSED DEVELOPMENT
The proposed Davidson Commons East Hotel development consists of a hotel and a restaurant.
• 107 Room Hotel
• 5,000 Square Feet of Restaurant Space
Table 1 shows the number of anticipated trips that will be generated by the proposed development (daily and AM / PM entering and exiting).
3.5 TRIP GENERATION – PREVIOUSLY APPROVED DEVELOPMENT
As previously noted, an additional scenario was evaluated which studied the impacts of the potential development of the Davidson Commons East parcels under the existing zoning. For this scenario, the following land uses were assumed:
• 40,000 Square Feet of Office Space
• 20,000 Square Feet of Retail Space
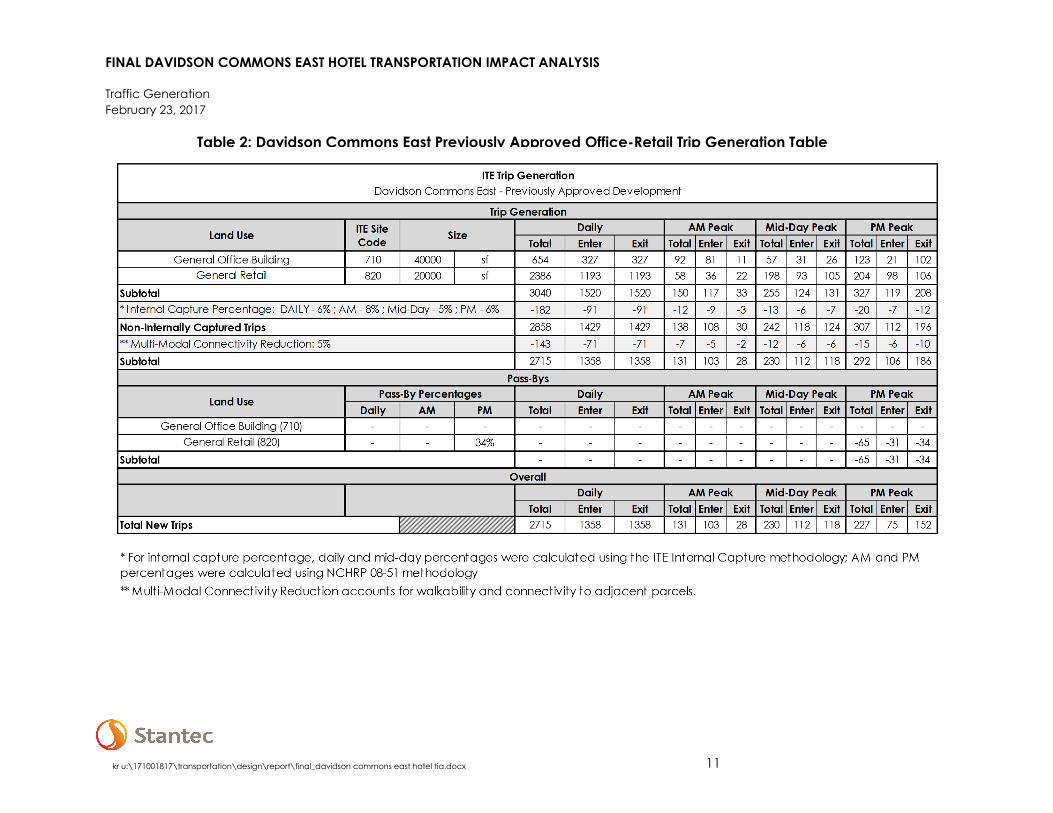
Table 2 shows the number of anticipated trips that would be generated by the previously approved development (daily, AM peak, Mid-Day peak, and PM peak entering and exiting).
As the tables below will show, the previously approved development is expected to generate 2,715 total new trips during a typical weekday, with 131 of those occurring during the AM peak hour, 230 during the Mid-Day peak hour, and 227 during the PM peak hour. The proposed development is estimated to generate less than half of that in terms of total new daily trips, with 1,319 trips expected during a typical weekday. The AM peak hour is expected to carry 110 of those; the Mid-Day peak will have 37 total new trips; and 100 trips are estimated to occur during the PM peak hour.

FINAL DAVIDSON COMMONS EAST HOTEL TRANSPORTATION IMPACT ANALYSIS
Traffic Generation February 23, 2017
kr u:\171001817\transportation\design\report\final_davidson commons east hotel tia.docx 10
Table 1: Davidson Commons East Proposed Hotel Trip Generation Table
Total Enter Exit Total Enter Exit Total Enter Exit Total Enter ExitHotel 310 107 rooms 874 437 437 56 33 23 20 12 8 64 33 31
High-Turnover Sit-Down Restaurant 932 5000 sf 636 318 318 66 35 31 23 10 13 93 50 431510 755 755 122 68 54 43 22 21 157 83 74-121 -60 -60 -6 -3 -3 -4 -2 -2 -13 -7 -61389 695 695 116 65 51 39 20 19 144 76 68-69 -35 -35 -6 -3 -3 -2 -1 -1 -7 -4 -3
1319 660 660 110 62 48 37 19 18 137 72 65
Daily AM PM Total Enter Exit Total Enter Exit Total Enter Exit Total Enter ExitHotel (310) - - - - - - - - - - - - - - -
High-Turnover Sit-Down Restaurant (932) - - 43% - - - - - - - - - -37 -20 -17- - - - - - - - - -37 -20 -17
Total Enter Exit Total Enter Exit Total Enter Exit Total Enter Exit1319 660 660 110 62 48 37 19 18 100 52 48
** Multi-Modal Connectivity Reduction accounts for walkability and connectivity to adjacent parcels.
* For internal capture percentage, daily and mid-day percentages were calculated using the ITE Internal Capture methodology; AM and PM percentages were calculated using NCHRP 08-51 methodology
** Multi-Modal Connectiv ity Reduction: 5%Subtotal
Total New Trips
Subtotal
AM Peak PM PeakOverall
Daily Mid-Day Peak
Non-Internally Captured Trips* Internal Capture Percentage: DAILY - 8% ; AM - 5% ; Mid-Day - 9% ; PM - 8%
Land UseAM Peak PM Peak
Pass-BysDailyPass-By Percentages Mid-Day Peak
Subtotal
ITE Trip GenerationDavidson Commons East Hotel
Land Use ITE Site Code SizeDaily AM Peak PM Peak
Trip GenerationMid-Day Peak
FINAL DAVIDSON COMMONS EAST HOTEL TRANSPORTATION IMPACT ANALYSIS
Traffic Generation February 23, 2017
kr u:\171001817\transportation\design\report\final_davidson commons east hotel tia.docx 11
Table 2: Davidson Commons East Previously Approved Office-Retail Trip Generation Table

FINAL DAVIDSON COMMONS EAST HOTEL TRANSPORTATION IMPACT ANALYSIS
Traffic Distribution February 23, 2017
kr u:\171001817\transportation\design\report\final_davidson commons east hotel tia.docx 12
4.0 TRAFFIC DISTRIBUTION
4.1 SITE TRIP DISTRIBUTION
In order to accurately determine the effect of the proposed development on the surrounding roadway network, an estimate of the expected distribution of traffic entering and exiting the site is needed. The following percentages were used in the AM, midday, and PM peak hours for the proposed site.
o 50 percent to/from the west on Griffith Street
o 5 percent to/from Harbour Place Drive
o 2 percent to/from the north on Jetton Street
o 10 percent to/from the south on Jetton Street
o 15 percent to/from the north on Beaty Street
o 15 percent to/from the east on Griffith Street
o 3 percent to/from the south on Sloan Street
These percentages were developed using a combination of existing traffic volume counts, historic AADTs provided by NCDOT, and engineering judgment. Figure 4 shows the distributions described above as well as the turning movement percentages at each intersection.

FINAL DAVIDSON COMMONS EAST HOTEL TRANSPORTATION IMPACT ANALYSIS
Traffic Distribution February 23, 2017
kr u:\171001817\transportation\design\report\final_davidson commons east hotel tia.docx 13
Figure 4: Davidson Commons Trip Distribution

FINAL DAVIDSON COMMONS EAST HOTEL TRANSPORTATION IMPACT ANALYSIS
Traffic Distribution February 23, 2017
kr u:\171001817\transportation\design\report\final_davidson commons east hotel tia.docx 14
4.2 PASS-BY TRIP DISTRIBUTION
A pass-by trip is a vehicle that would normally be passing by a location on their way to an ultimate destination, but with the addition of the proposed site, they are expected to make a stop at the proposed development and then continue in the direction they were previously driving.
As shown in Tables 1 and 2 in Section 3.0, a percentage of the PM peak hour restaurant and retail trips generated by the proposed and previously approved developments, respectively, are assumed to be pass-by trips. Based on engineering judgment and examination of travel patterns through the study area, it was not believed that the travel patterns of those pass-by trips would differ greatly depending on the type of use. Therefore, the same pass-by trip distribution was assumed for both the previously approved and proposed sites.
The distributions of the pass-by traffic are as follows and are displayed graphically in Figure 5.
• 35% from the west on Griffith Street • 65% from the east on Griffith Street

FINAL DAVIDSON COMMONS EAST HOTEL TRANSPORTATION IMPACT ANALYSIS
Traffic Distribution February 23, 2017
kr u:\171001817\transportation\design\report\final_davidson commons east hotel tia.docx 15
Figure 5: Davidson Commons Pass-By Trip Distribution
FINAL DAVIDSON COMMONS EAST HOTEL TRANSPORTATION IMPACT ANALYSIS
TRAFFIC VOLUMES February 23, 2017
kr u:\171001817\transportation\design\report\final_davidson commons east hotel tia.docx 16
5.0 TRAFFIC VOLUMES
Morning (6:00 – 9:00 am) and afternoon / evening (2:00 – 7:00 pm) turning movement counts were collected on Tuesday, Novermber 15th, 2016 at the intersections listed below. It should be noted that these counts were collected on a normal business and school operating day.
• Griffith Street at Harbour Place Drive / Davidson Gateway Drive (roundabout) • Griffith Street at Jetton Street (roundabout) • Griffith Street at Davidson Gateway Drive (unsignalized) • Griffith Street at Beaty Street / Sloan Street (signalized) • Jetton Street at Davidson Gateway Drive (unsignalized)
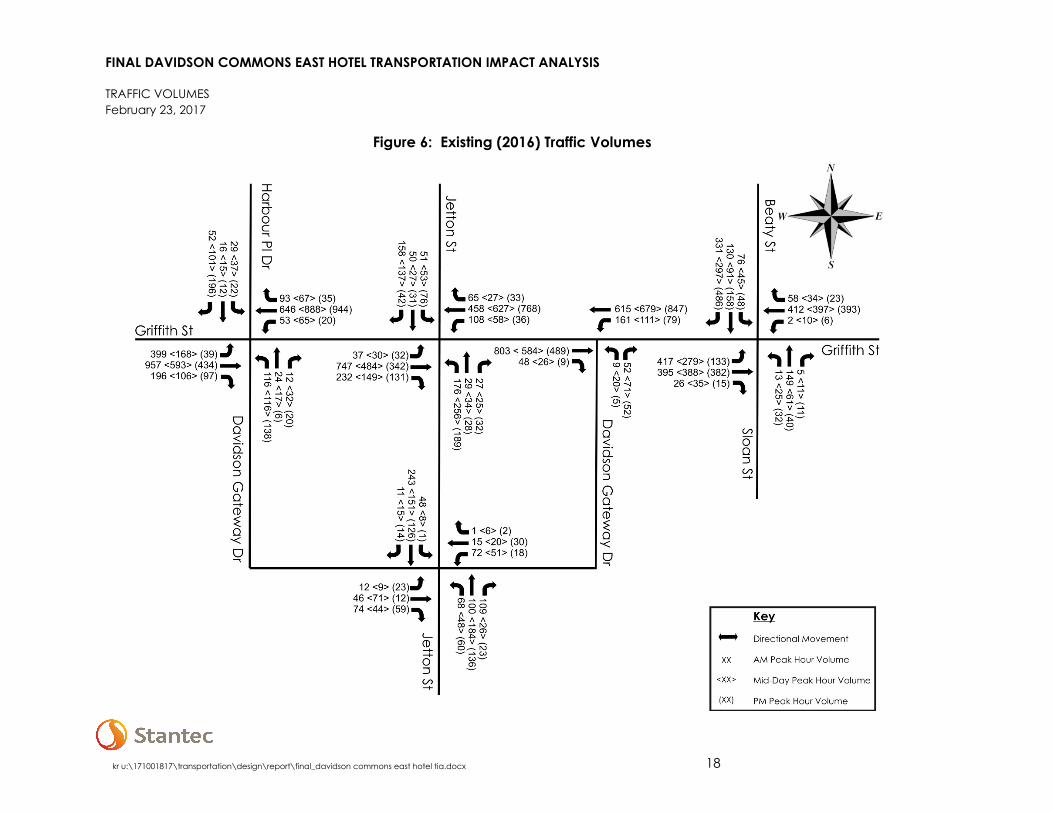
Raw count data for these locations are included on the project CD. The existing traffic volumes are shown on Figure 6.
5.1 APPROVED DEVELOPMENTS
According to the Town of Davidson, there are two approved developments in this area that will be completed prior to the proposed site’s build out year of 2018. The two approved developments are:
• The Linden Apartments - 164 Apartment Units & 5,000 SF General Retail (see note below)
• Williams Place Retirement Home – 115 Units It should be noted that the Linden Apartments include 164 units in total, but it was assumed that one third of the units (55 units) were open and occupied at the time the traffic counts were collected. Therefore, the additional traffic generated was assumed to only be two-thirds (109 units) of the total build-out.
Because no Transportation Impact Studies had been completed for either of these developments, trip generation, site trip distributions, and pass-by distributions (as applicable) were developed for each. This information can be found in the Appendix.
5.2 FUTURE TRAFFIC GROWTH
Future traffic growth is the increase in traffic volumes due to usage increases and non-specific growth throughout the area. The 2016 existing volumes were grown by a 2 percent annual rate to estimate the traffic volumes for the 2018 background traffic volume. The 2018 No-Build volumes, which include background traffic and approved development traffic, are shown in Figures 7 through 9.

FINAL DAVIDSON COMMONS EAST HOTEL TRANSPORTATION IMPACT ANALYSIS
TRAFFIC VOLUMES February 23, 2017
kr u:\171001817\transportation\design\report\final_davidson commons east hotel tia.docx 17
5.3 TOTAL BUILD TRAFFIC WITH PROPOSED DEVELOPMENT
To obtain the total 2018 Build Out traffic volumes, the distributed site traffic was added to the 2018 No Build traffic volumes. The total AM and PM peak hour turning movement volumes for the study area intersections were then calculated and analyzed for the year 2018. The 2018 Build Out traffic volumes are illustrated in Figures 10 through 12.
5.4 TOTAL BUILD TRAFFIC WITH PREVIOUSLY APPROVED DEVELOPMENT
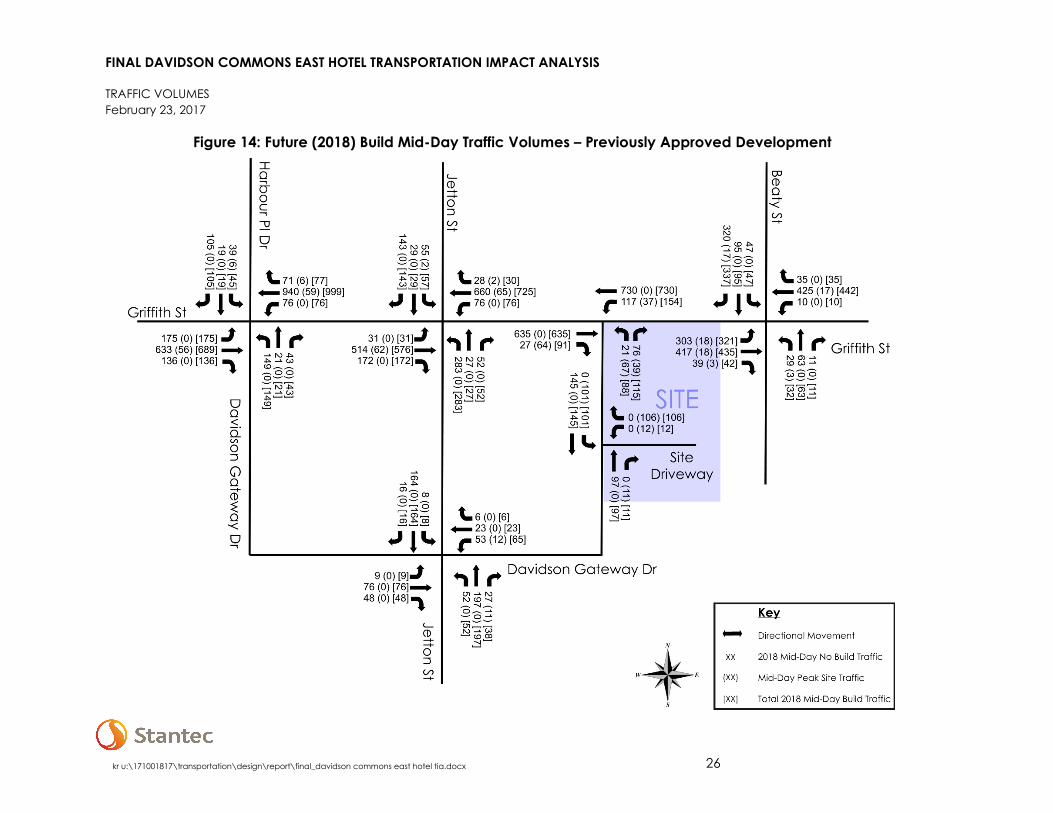
To generate the total 2018 Build Out traffic volumes with the previously approved development on this site, the distributed office + retail traffic was added to the 2018 No Build traffic volumes. The total AM, midday, and PM peak hour turning movement volumes for the study area intersections were then calculated and analyzed for the year 2018. The 2018 Build Out with Previously Approved Development traffic volumes are illustrated in Figures 13 through 15.
FINAL DAVIDSON COMMONS EAST HOTEL TRANSPORTATION IMPACT ANALYSIS
TRAFFIC VOLUMES February 23, 2017
kr u:\171001817\transportation\design\report\final_davidson commons east hotel tia.docx 18
Figure 6: Existing (2016) Traffic Volumes

FINAL DAVIDSON COMMONS EAST HOTEL TRANSPORTATION IMPACT ANALYSIS
TRAFFIC VOLUMES February 23, 2017
kr u:\171001817\transportation\design\report\final_davidson commons east hotel tia.docx 19
Figure 7: Future (2018) No Build AM Traffic Volumes

FINAL DAVIDSON COMMONS EAST HOTEL TRANSPORTATION IMPACT ANALYSIS
TRAFFIC VOLUMES February 23, 2017
kr u:\171001817\transportation\design\report\final_davidson commons east hotel tia.docx 20
Figure 8: Future (2018) No Build Mid-Day Traffic Volumes

FINAL DAVIDSON COMMONS EAST HOTEL TRANSPORTATION IMPACT ANALYSIS
TRAFFIC VOLUMES February 23, 2017
kr u:\171001817\transportation\design\report\final_davidson commons east hotel tia.docx 21
Figure 9: Future (2018) No Build PM Traffic Volumes

FINAL DAVIDSON COMMONS EAST HOTEL TRANSPORTATION IMPACT ANALYSIS
TRAFFIC VOLUMES February 23, 2017
kr u:\171001817\transportation\design\report\final_davidson commons east hotel tia.docx 22
Figure 10: Future (2018) Build AM Traffic Volumes – Proposed Development

FINAL DAVIDSON COMMONS EAST HOTEL TRANSPORTATION IMPACT ANALYSIS
TRAFFIC VOLUMES February 23, 2017
kr u:\171001817\transportation\design\report\final_davidson commons east hotel tia.docx 23
Figure 11: Future (2018) Build Mid-Day Traffic Volumes – Proposed Development

FINAL DAVIDSON COMMONS EAST HOTEL TRANSPORTATION IMPACT ANALYSIS
TRAFFIC VOLUMES February 23, 2017
kr u:\171001817\transportation\design\report\final_davidson commons east hotel tia.docx 24
Figure 12: Future (2018) Build PM Traffic Volumes – Proposed Development

FINAL DAVIDSON COMMONS EAST HOTEL TRANSPORTATION IMPACT ANALYSIS
TRAFFIC VOLUMES February 23, 2017
kr u:\171001817\transportation\design\report\final_davidson commons east hotel tia.docx 25
Figure 13: Future (2018) Build AM Traffic Volumes – Previously Approved Development
FINAL DAVIDSON COMMONS EAST HOTEL TRANSPORTATION IMPACT ANALYSIS
TRAFFIC VOLUMES February 23, 2017
kr u:\171001817\transportation\design\report\final_davidson commons east hotel tia.docx 26
Figure 14: Future (2018) Build Mid-Day Traffic Volumes – Previously Approved Development

FINAL DAVIDSON COMMONS EAST HOTEL TRANSPORTATION IMPACT ANALYSIS
TRAFFIC VOLUMES February 23, 2017
kr u:\171001817\transportation\design\report\final_davidson commons east hotel tia.docx 27
Figure 15: Future (2018) Build PM Traffic Volumes – Previously Approved Development
FINAL DAVIDSON COMMONS EAST HOTEL TRANSPORTATION IMPACT ANALYSIS
TRAFFIC ANALYSIS February 23, 2017
kr u:\171001817\transportation\design\report\final_davidson commons east hotel tia.docx 28
6.0 TRAFFIC ANALYSIS
Capacity analyses were performed for the roadway network in the project study area. The traffic analysis program Synchro© Version 9.1 was used to analyze all signalized and stop-controlled intersections according to methods put forth by the Transportation Research Board’s Highway Capacity Manual (HCM)3. Sidra Intersection Version 6.1 was used to evaluate the roundabouts in the study area, also using the methodology outlined in the HCM. The Highway Capacity Manual defines capacity as “the maximum rate of flow at which persons or vehicles can be reasonably expected to traverse a point or uniform section of a lane or roadway during a specified time period under prevailing roadway, traffic, and control conditions, usually expressed as vehicles per lane per hour.”
Level-of-service (LOS) is a term used to describe different traffic conditions and is defined as a “qualitative measure describing operational conditions within a traffic stream, and their perception by motorists/ or passengers.” LOS varies from Level A, representing free flow, to Level F where traffic breakdown conditions are evident. Traffic conditions with LOS of E or F are deemed unacceptable and represent significant travel delay, increased accident potential, and inefficient motor vehicle operation. At an unsignalized intersection, the primary traffic on the main roadway is virtually uninterrupted. Therefore, the overall delay for the intersection is usually less than what is calculated for the minor street movements. The overall intersection delay and the delay for the intersection’s minor street(s) are reported in the summary tables of this report. Generally, LOS D is acceptable for signalized intersections in suburban areas during peak periods. The ITE Recommended Practice Manual, “Designing Walkable Urban Thoroughfares: A Context Sensitive Approach”5 states, ”Often in urban areas, thoroughfare capacity is a lower priority than other factors such as economic development or historical preservation, and higher levels of congestion are considered acceptable.” With the current method of reporting LOS for unsignalized intersections, it is not uncommon for some of the minor street movements to be operating at a LOS F during peak hour conditions.
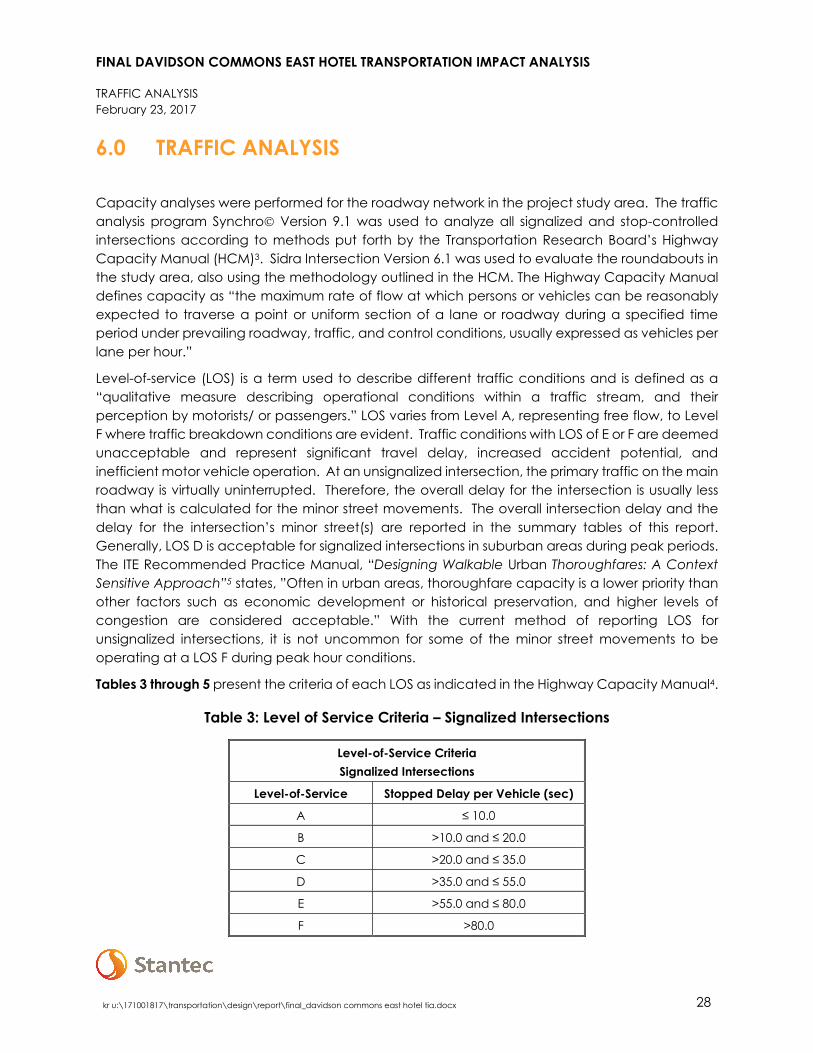
Tables 3 through 5 present the criteria of each LOS as indicated in the Highway Capacity Manual4.
Table 3: Level of Service Criteria – Signalized Intersections
Level-of-Service Criteria Signalized Intersections
Level-of-Service Stopped Delay per Vehicle (sec)
A ≤ 10.0
B >10.0 and ≤ 20.0
C >20.0 and ≤ 35.0
D >35.0 and ≤ 55.0
E >55.0 and ≤ 80.0
F >80.0

FINAL DAVIDSON COMMONS EAST HOTEL TRANSPORTATION IMPACT ANALYSIS
TRAFFIC ANALYSIS February 23, 2017
kr u:\171001817\transportation\design\report\final_davidson commons east hotel tia.docx 29
Table 4: Level of Service Criteria – Unsignalized Intersections
Level-of-Service Criteria Unsignalized Intersections
Level-of-Service Stopped Delay per Vehicle (sec)
A ≤ 10.0
B >10.0 and ≤ 15
C >15 and ≤ 25
D >25 and ≤ 35
E >35 and ≤ 50
F >50
Table 5: Level of Service Criteria – Roundabouts
Level-of-Service Criteria Roundabout Intersections
Stopped Delay per Vehicle (sec)
Level-of-Service If v/c ≤ 1.0
Level of Service If v/c > 1.0
≤ 10.0 A F
>10.0 and ≤ 15 B F
>15 and ≤ 25 C F
>25 and ≤ 35 D F
>35 and ≤ 50 E F
>50 F F
Capacity Analyses were performed for the following intersections defined within the study area for 2016 Existing, 2018 No-Build, 2018 Build with Previously Approved Development, and 2018 Build with Proposed Development.
• Griffith Street at Harbour Place Drive / Davidson Gateway Drive (roundabout) • Griffith Street at Jetton Street (roundabout) • Griffith Street at Davidson Gateway Drive (unsignalized) • Griffith Street at Beaty Street / Sloan Street (signalized) • Jetton Street at Davidson Gateway Drive (unsignalized)
All Synchro and Sidra files and detailed printouts can be found on the Appendix CD. A brief summary of the results of the analyses is provided in the following sub-sections.

FINAL DAVIDSON COMMONS EAST HOTEL TRANSPORTATION IMPACT ANALYSIS
TRAFFIC ANALYSIS February 23, 2017
kr u:\171001817\transportation\design\report\final_davidson commons east hotel tia.docx 30
6.1 GRIFFITH STREET AT HARBOUR PLACE DRIVE / DAVIDSON GATEWAY DRIVE
The levels of service and delays for the roundabout intersection of Griffith Street and Harbour Place Drive / Davidson Gateway Drive are shown in Table 6.
Table 6: Level of Service and Delay for Griffith St. @ Harbour Place Dr. / Davidson Gateway Dr.
As the table shows, the roundabout intersection operates at a level of service A in all scenarios. The proposed development does not significantly impact this intersection, which has additional capacity available. Therefore, no improvements are recommended at this location to mitigate the additional site traffic.
Overall EB WB NB SBAM A (3.1) A (1.0) A (6.0) A (9.4) A (4.2)
Mid-Day A (2.3) A (0.8) A (2.6) A (4.5) A (6.5)PM A (2.1) A (0.3) A (1.4) A (2.9) A (8.8)AM A (4.1) A (1.3) A (7.8) B (12.6) A (4.6)
Mid-Day A (3.2) A (1.0) A (4.0) A (5.8) A (7.9)PM A (2.6) A (0.4) A (1.8) A (3.3) B (11.2)AM A (4.4) A (1.4) A (8.1) B (14.2) A (4.6)
Mid-Day A (3.6) A (1.0) A (4.5) A (6.3) A (8.9)PM A (2.9) A (0.4) A (1.9) A (3.7) B (14.0)AM A (4.4) A (1.3) A (8.3) B (13.6) A (4.7)
Mid-Day A (3.3) A (1.0) A (4.1) A (5.9) A (8.1)PM A (2.7) A (0.4) A (1.8) A (3.6) B (12.2)
X (X) LOS (Delay)Legend:
LOS/DelayGriffith St @ Harbour Place Dr / Davidson
Gateway Dr
2016 Existing
2018 No Build
2018 Build w/ Prev. Appr. Development
2018 Build w/ Proposed Development
Roundabout
Roundabout
Roundabout
Traffic Control
Roundabout

FINAL DAVIDSON COMMONS EAST HOTEL TRANSPORTATION IMPACT ANALYSIS
TRAFFIC ANALYSIS February 23, 2017
kr u:\171001817\transportation\design\report\final_davidson commons east hotel tia.docx 31
6.2 GRIFFITH STREET AT JETTON STREET
The levels of service and delays for the roundabout intersection of Griffith Street and Jetton Street are shown in Table 7.
Table 7: Level of Service and Delay for Griffith St. @ Jetton St.
As the table shows, the roundabout intersection operates at a level of service A in the majority of the scenarios. The overall intersection remained at a LOS A for the 2016 Existing, 2018 No Build, and 2018 Build with Proposed Development scenarios. However, the overall intersection delay increases by approximately 6 seconds in the AM peak for the 2018 Build with Previously Approved Development scenario. The operations with the proposed development in place are LOS A; therefore, no improvements are recommended at this location to mitigate the additional site traffic.
Overall EB WB NB SBAM A (4.3) A (2.5) A (1.6) B (17.4) A (6.1)
Mid-Day A (3.2) A (1.0) A (2.2) A (7.3) A (7.2)PM A (2.2) A (1.0) A (1.9) A (4.0) A (5.8)AM A (6.8) A (3.4) A (1.8) C (32.4) A (7.0)
Mid-Day A (4.3) A (1.3) A (2.6) B (11.4) A (8.7)PM A (2.8) A (1.2) A (2.2) A (5.3) A (6.8)AM B (10.0) A (4.2) A (2.7) E (58.1) A (7.2)
Mid-Day A (4.7) A (1.4) A (2.8) B (13.2) A (9.8)PM A (3.1) A (1.3) A (2.4) A (6.6) A (8.0)AM A (8.5) A (3.9) A (1.8) D (45.6) A (7.4)
Mid-Day A (4.4) A (1.3) A (2.6) B (12.0) A (8.8)PM A (2.9) A (1.2) A (2.3) A (6.2) A (7.2)
X (X) LOS (Delay)Legend:
LOS/DelayGriffith St @ Jetton St
2016 Existing
2018 No Build
2018 Build w/ Prev. Appr. Development
2018 Build w/ Proposed Development
Traffic Control
Roundabout
Roundabout
Roundabout
Roundabout

FINAL DAVIDSON COMMONS EAST HOTEL TRANSPORTATION IMPACT ANALYSIS
TRAFFIC ANALYSIS February 23, 2017
kr u:\171001817\transportation\design\report\final_davidson commons east hotel tia.docx 32
6.3 GRIFFITH STREET AT DAVIDSON GATEWAY DRIVE
The levels of service and delays for the unsignalized intersection of Griffith Street and Davidson Gateway Drive are shown in Table 8.
Table 8: Level of Service and Delay for Griffith St. @ Davidson Gateway Dr.
The analyses indicate that the unsignalized intersection currently operates at LOS A overall during all three peak hours. The overall intersection remained at a LOS A for the 2018 No Build. With the previously approved development in place in 2018, the intersection operations worsen. The intersection is expected to operate at LOS B in the AM peak and LOS F in the Mid-Day and PM peak periods. As compared to the 2018 No Build conditions, the proposed development does have an impact on the operations at this intersection, although the significant delays are generally isolated to the unsignalized approach on Davidson Gateway Drive. As noted previously, it is not uncommon for an unsignalized approach to reach a level of service F using HCM methodology. It should be noted, however, that traffic volumes associated with the proposed development are generally lower than those associated with the previously approved development, and therefore delays are lower on Davidson Gateway Drive with the proposed development in place
Although there is an increase in delay associated with the unsignalized approach of Davidson Gateway Drive as a result of the proposed development, the major street approaches on Griffith
Overall EB WB NBAM A (2.4) A (0.0) A (2.4) E (35.8)
Mid-Day A (2.7) A (0.0) A (1.4) D (32.1)PM A (1.1) A (0.0) A (0.8) C (16.9)AM A (2.7) A (0.0) B (12.2) E (43.9)
Mid-Day A (3.2) A (0.0) A (1.4) E (41.8)PM A (1.2) A (0.0) A (0.8) C (18.5)AM B (11.5) A (0.0) A (3.2) F (216.5)
Mid-Day F (67.5) A (0.0) A (1.9) F (##)PM F (123.7) A (0.0) A (1.3) F (##)AM C (19.2) A (0.0) A (2.9) F (##)
Mid-Day A (5.8) A (0.0) A (1.5) F (73.4)PM B (13.8) A (0.0) A (1.1) F (166.7)
X (X) LOS (Delay)## Delay exceeds 300 seconds
Legend:
LOS/DelayGriffith St @ Davidson Gateway Dr
2016 Existing
2018 No Build
2018 Build w/ Prev. Appr. Development
2018 Build w/ Proposed Development
Traffic Control
Stop Sign
Stop Sign
Stop Sign
Stop Sign
FINAL DAVIDSON COMMONS EAST HOTEL TRANSPORTATION IMPACT ANALYSIS
TRAFFIC ANALYSIS February 23, 2017
kr u:\171001817\transportation\design\report\final_davidson commons east hotel tia.docx 33
Street experience minimal to no delay, and the peak hour volumes exiting Davidson Gateway Drive are relatively low. As described in Section 7.0, queuing is not expected to extend past the site driveway for an extended period of time in any given peak hour.
The developer should consult the Town of Davidson Planning Department during the development application process to define the pedestrian needs required by adopted ordinances. Required pedestrian facilities shall adhere to Section 6.8.1 of the Planning Ordinance as well as planned projects in the Town of Davidson Pedestrian Master Plan (adopted in 2010). Section 6.10.5 of the ordinance describes the discretion of facility development with Payment In Lieu being permitted as an acceptable mitigation measure in select cases. Additional and/or improved sidewalks in the area will encourage pedestrian activity to and from the hotel, which may further reduce the amount of vehicular traffic to and from the hotel beyond what has been assumed in this study.
6.4 GRIFFITH STREET AT BEATY STREET/SLOAN STREET
The signal plan for the intersection of Griffith Street at Beaty Street / Sloan Street was obtained from NCDOT to determine the existing signal phasing, minimum green, yellow, and red times. These timings were used for the 2016 existing scenario. For all future year scenarios, timings and phasing outlined in the NCDOT Congestion Management Guidelines4 were used, and the cycle length and splits were optimized in Synchro. The levels of service and delays for each scenario are shown in Table 9.
As previously mentioned, it should be noted that there is a project expected to begin in 2018 which constructs a roundabout at this intersection. Plans for this roundabout were obtained from the Town of Davidson and used in this analysis for the Build with Proposed Development scenario only. Additionally, there is a project proposed to connect Sloan Street to Potts Street, south of the study area, which is not considered in this analysis. It is likely that the operations at the Griffith / Sloan / Beaty intersection will change if and when the Potts / Sloan / Beaty connection is made.

FINAL DAVIDSON COMMONS EAST HOTEL TRANSPORTATION IMPACT ANALYSIS
TRAFFIC ANALYSIS February 23, 2017
kr u:\171001817\transportation\design\report\final_davidson commons east hotel tia.docx 34
Table 9: Level of Service and Delay for Griffith St. @ Beaty St/Sloan St.
The analyses indicate that the intersection currently operates at LOS E during the AM peak hour, and LOS D for both the Mid-Day and PM peak hours. The levels of service for the intersection are expected to worsen for the 2018 No Build, 2018 Build with Previously Approved Development, and 2018 Build with Proposed Development scenarios to LOS F for the AM peak and LOS E for both Mid-day and PM peak. Although the proposed development does increase the delay slightly at this intersection, the levels of service are worsened by background traffic present in the 2018 No Build scenario. Additionally, conditions at this intersection are expected to be worse with the previously approved development (office + retail) than with the proposed hotel land use.
With the construction of the roundabout in 2018, the operations at the roundabout are improved for all three peak periods, with LOS D, B, and E during the AM, Mid-Day, and PM peak periods, respectively. It should be noted that the southbound approach is still expected to operate at LOS F during the PM peak period. It is recommended that the configuration on that approach be further evaluated for feasibility of a slip-lane or exclusive right-turn lane, due to the high vehicular demand. Additionally, as noted above, the roundabout operations are likely to change considerably once the Potts / Sloan / Beaty connection is made.
Overall EB WB NB SBAM E (64.1) D (52.0) E (76.0) C (22.2) F (85.8)
Mid-Day D (36.6) C (30.7) D (41.7) B (19.0) D (44.7)PM D (48.7) C (25.7) F (80.0) B (13.4) D (51.4)AM F (93.3) F (84.9) F (94.3) C (27.8) F (126.1)
Mid-Day E (55.5) D (52.4) E (61.3) C (21.0) E (62.4)PM E (62.8) E (56.3) F (83.5) B (15.3) E (60.8)AM F (100.4) F (87.2) F (104.2) C (28.1) F (139.6)
Mid-Day E (63.3) E (60.7) E (69.0) C (21.3) E (71.1)PM E (73.1) E (75.0) F (92.7) B (15.5) E (66.3)AM F (98.2) F (88.5) F (100.0) C (28.1) F (133.9)
Mid-Day E (56.4) D (53.1) E (62.8) C (21.1) E (63.2)PM E (67.5) E (62.1) F (89.5) B (15.4) E (64.6)AM D (50.6) D (53.8) E (62.9) C (25.1) D (42.7)
Mid-Day B (10.5) A (5.4) B (11.5) A (8.5) B (18.3)PM E (60.2) A (3.0) A (3.6) A (5.8) F (148.1)
X (X) LOS (Delay)RoundaboutSignalized Intersection
Legend:
2018 Build w/ Proposed Development
2018 Build w/ Proposed Development
Signal
Roundabout
LOS/DelayGriffith St @ Beaty St / Sloan St
2016 Existing
2018 No Build
2018 Build w/ Prev. Appr. Development
Traffic Control
Signal
Signal
Signal

FINAL DAVIDSON COMMONS EAST HOTEL TRANSPORTATION IMPACT ANALYSIS
TRAFFIC ANALYSIS February 23, 2017
kr u:\171001817\transportation\design\report\final_davidson commons east hotel tia.docx 35
6.5 JETTON STREET AT DAVIDSON GATEWAY DRIVE
The levels of service and delays for the intersection of Jetton Street and Davidson Gateway Drive are shown in Table 10.
Table 10: Level of Service and Delay for Jetton St. @ Davidson Gateway Drive.
Analyses indicate that the unsignalized intersection currently operates at LOS B during the AM peak and LOS A for both the Mid-Day and PM peak periods. The levels of service remain the same for the 2018 scenarios during the AM and PM peak periods. The level of service during the Mid-Day peak changes from LOS A in 2016 to LOS B in all three 2018 scenarios.
The proposed development does not significantly impact this intersection, which has additional capacity available. Therefore, no improvements are recommended at this location to mitigate the additional site traffic.
Overall EB WB NB SBAM B (11.5) A (9.9) B (10.1) B (11.5) B (12.5)
Mid-Day A (9.9) A (9.2) A (9.2) B (10.6) A (9.5)PM A (8.9) A (8.3) A (8.5) A (9.4) A (8.7)AM B (12.1) B (10.3) B (10.4) B (12.1) B (13.4)
Mid-Day B (10.3) A (9.5) A (9.5) B (11.2) A (9.9)PM A (9.2) A (8.5) A (8.6) A (9.8) A (8.9)AM B (12.3) B (10.3) B (10.5) B (12.4) B (13.6)
Mid-Day B (10.5) A (9.6) A (9.7) B (11.5) B (10.1)PM A (9.4) A (8.6) A (8.9) B (10.0) A (9.0)AM B (12.3) B (10.3) B (10.6) B (12.3) B (13.6)
Mid-Day B (10.4) A (9.6) A (9.5) B (11.3) B (10.0)PM A (9.3) A (8.5) A (8.7) A (9.9) A (8.9)
X (X) LOS (Delay)Legend:
LOS/DelayJetton St @ Davidson Gateway Dr
2016 Existing
2018 No Build
2018 Build w/ Prev. Appr. Development
2018 Build w/ Proposed Development
Traffic Control
4-Way Stop
4-Way Stop
4-Way Stop
4-Way Stop

FINAL DAVIDSON COMMONS EAST HOTEL TRANSPORTATION IMPACT ANALYSIS
TRAFFIC ANALYSIS February 23, 2017
kr u:\171001817\transportation\design\report\final_davidson commons east hotel tia.docx 36
6.6 DAVIDSON GATEWAY DRIVE AT SITE DRIVEWAY
The levels of service and delays for the intersection of Davidson Gateway Drive and Site Driveway are shown in Table 11.
Table 11: Level of Service and Delay for Davidson Gateway Drive @ Site Driveway.
As the table shows, this intersection operates at a level of service A in all scenarios. All approaches operate at LOS B or better during all peak periods. Therefore, no improvements other than construction of a site driveway and appropriate turn lanes, as required by the Town, are recommended at this location.
Overall WB NB SBAM A (2.6) A (9.2) A (0.0) A (2.7)
Mid-Day A (4.3) A (9.9) A (0.0) A (3.5)PM A (6.5) B (10.3) A (0.0) A (4.7)AM A (2.4) A (9.2) A (0.0) A (1.8)
Mid-Day A (1.1) A (9.0) A (0.0) A (0.9)PM A (4.4) A (9.2) A (0.0) A (3.8)
X (X) LOS (Delay)
Stop Sign
Legend:
LOS/DelayDavidson Gateway Dr @ Site Driveway
2018 Build w/ Prev. Appr. Development
2018 Build w/ Proposed Development
Traffic Control
Stop Sign

FINAL DAVIDSON COMMONS EAST HOTEL TRANSPORTATION IMPACT ANALYSIS
February 23, 2017
kr u:\171001817\transportation\design\report\final_davidson commons east hotel tia.docx 37
7.0 SIMTRAFFIC OPERATIONS
SimTraffic runs were completed for all four scenarios outlined in Section 1.0 to observe the predicted traffic operations throughout the study area during each of the peak hours. As is standard practice, ten SimTraffic analysis runs were performed for each scenario to get an average. Detailed SimTraffic Queuing and Blocking Reports can be found on the Appendix CD. A brief summary of the simulation observations is provided below.
The simulations indicate that there are currently significant queuing issues at the Beaty Street / Sloan Street at Griffith Street intersection. The issues at this intersection are on southbound Beaty Street as well as westbound on Griffith Street in the AM peak hour. There are also significant queuing issues in the existing conditions on the eastbound approach of Griffith Street in the Mid-Day and PM peak hours. Queuing at this location continues into the No Build and Build scenarios, and has significant impacts on the other intersections in the network.
Due to the extents of the queuing from the Beaty Street / Sloan Street intersection, it was difficult to determine the exact impacts the proposed site had on the network. Therefore, a Synchro / SimTraffic model was developed for the Build with Proposed Development scenario, which excluded the Beaty St / Sloan Street intersection from the network. This allowed for the targeted evaluation of queues at the Davidson Gateway / Griffith Street intersection, which is believed to be the most heavily impacted by the proposed site. Upon running this simulation, it was observed that queues along Davidson Gateway Drive occasionally extended back to the Site Driveway, but only for short periods of time. There was no queuing in the Griffith Street westbound left turn lane that extended past the storage length currently provided.

FINAL DAVIDSON COMMONS EAST HOTEL TRANSPORTATION IMPACT ANALYSIS
MultiModal Analysis February 23, 2017
kr u:\171001817\transportation\design\report\final_davidson commons east hotel tia.docx 38
8.0 MULTIMODAL ANALYSIS
According to the Town of Davidson’s Planning Ordinance, which was updated in August 2015, the Town requires evaluation of not only vehicular operations as part of the Transportation Impact Study, but also the capacity and function of other modes of transportation, such as pedestrians, bicyclists, and transit services. Through this added level of transportation planning evaluation, the Town’s goal is to ensure that all new projects within the Town of Davidson will provide appropriate and adequate facilities that allow for the safe and convenient movement for all users, including bicyclists, pedestrians, transit riders, and motorists.
ARTPLAN 2012 Conceptual Planning Analysis software was used in this study to evaluate pedestrian, bicycle, and bus levels-of-service within the proposed study area. ARTPLAN was developed by the Florida Department of Transportation (FDOT) to quantitatively evaluate these multimodal components. This application was developed based on the 2010 Highway Capacity Manual (HCM) methodologies for automobiles and further expanded to account for the entire multimodal system. ARTPLAN evaluates a network’s multimodal components based on a variety of existing conditions, including, but not limited to:
• Signal Timing Data (cycle lengths, g/C ratios, etc.) • Roadway Conditions (number of lanes, turning lane storage lengths, median widths,
speed limits, etc.) • Traffic Volumes (peak hour turning movement, AADT, etc.) • Existing Multimodal Facilities (sidewalks, bicycle lanes, bus stops, barriers between
pedestrians and motorists, etc.)
Similar to capacity analysis results, as outlined in the HCM and described earlier in this report, multimodal analysis provides quantitative output in the form of a level-of-service (LOS) grade. As comparable to the results in capacity analyses, the multimodal analysis LOS can vary from a Level A, being most desirable and conducive to all modes of transportation, to a Level F, being least desirable and most dangerous for pedestrians, bicyclists, and/or transit users. Tables 12 and 13 below indicate what LOS corresponds with the ARTPLAN score for bicycle and pedestrian analysis, and bus frequency for transit analysis. There are limitations to the ARTPLAN analysis, as detailed in the following paragraph; one of these limitations is regarding bus service. Therefore, the bus service LOS provided by ARTPLAN is not applicable for this case. Tables 14 through 16 show the results of the ARTPLAN analysis.
Analysis using ARTPLAN is heavily dependent on the presence of signalized intersections along a roadway. Because the study area for this project only includes one signalized intersection (Griffith Street at Beaty Street / Sloan Street), this methodology was limited. As a supplement to the ARTPLAN analysis, generalized level of service tables, published by the Florida Department of Transportation, were used in an effort to evaluate the corridor as a whole. These tables are widely accepted in the field of traffic engineering for use on planning-level studies, and are included in the Appendix. The results are shown in Tables 17 through 19.

FINAL DAVIDSON COMMONS EAST HOTEL TRANSPORTATION IMPACT ANALYSIS
MultiModal Analysis February 23, 2017
kr u:\171001817\transportation\design\report\final_davidson commons east hotel tia.docx 39
Table 12: Bicycle and Pedestrian LOS Criteria
Bicycle and Pedestrian Level of Service Criteria
(based on FDOT LOS Standards) Level of Service ARTPLAN Score
A ≤ 1.5
B > 1.5 and ≤ 2.5
C > 2.5 and ≤ 3.5
D > 3.5 and ≤ 4.5
E > 4.5 and ≤ 5.5
F > 5.5
Table 13: Bus LOS Criteria
Bus Level of Service Criteria (based on the Transit Capacity and
Quality of Service Manual)
Level of Service Adjusted Bus Frequency (buses/hr)
A ≥ 5
B < 5 and ≥ 4
C < 4 and ≥ 3
D < 3 and ≥ 2
E < 2 and ≥ 1
F < 1
Table 14: Multimodal LOS Summary – 2016 Existing
Griffith St/Beaty St Intersection 2016 Existing PM Conditions
Bicycle LOS Pedestrian LOS Bus LOS
ARTPLAN Score
Level of
Service
ARTPLAN Score
Level of
Service
Adjusted Bus
Frequency
Level of
Service 2.66 C 1.46 A 2.66 D

FINAL DAVIDSON COMMONS EAST HOTEL TRANSPORTATION IMPACT ANALYSIS
MultiModal Analysis February 23, 2017
kr u:\171001817\transportation\design\report\final_davidson commons east hotel tia.docx 40
Table 15: Multimodal LOS Summary – 2018 No Build
Griffith St/Beaty St Intersection 2018 No Build PM Conditions
Bicycle LOS Pedestrian LOS Bus LOS
ARTPLAN Score
Level of
Service
ARTPLAN Score
Level of
Service
Adjusted Bus
Frequency
Level of
Service 2.66 C 1.48 A 2.66 D
Table 16: Multimodal LOS Summary – 2018 Build w/ Proposed Development
Griffith St/Beaty St Intersection 2018 Build PM Conditions
Bicycle LOS Pedestrian LOS Bus LOS
ARTPLAN Score
Level of
Service
ARTPLAN Score
Level of
Service
Adjusted Bus
Frequency
Level of
Service 2.59 C 0.89 A 2.66 D
ARTPLAN indicates that the bicycle level of service at the Griffith Street / Beaty Street intersection improves slightly in the build scenario, with a score of 2.59, as compared to 2.66 in the existing and no build scenarios. The pedestrian level of service improves significantly in the build scenario due to improved pedestrian facilities. The bus level of service remains the same throughout all three scenarios.
Table 17: Corridor Multimodal LOS Summary – 2016 Existing
Generalized Volume Tables 2016 Existing
Griffith Street Segment Bicycle LOS Pedestrian LOS Bus LOS Harbour Place Dr. to Jetton St. C B E
Jetton St. to Beaty St. A B E
Table 18: Corridor Multimodal LOS Summary – 2018 No Build
Generalized Volume Tables 2018 No Build
Griffith Street Segment Bicycle LOS Pedestrian LOS Bus LOS Harbour Place Dr. to Jetton St. C C E
Jetton St. to Beaty St. A B E

FINAL DAVIDSON COMMONS EAST HOTEL TRANSPORTATION IMPACT ANALYSIS
February 23, 2017
kr u:\171001817\transportation\design\report\final_davidson commons east hotel tia.docx 41
Table 19: Corridor Multimodal LOS Summary – 2018 Build w/ Proposed Development
Generalized Volume Tables 2018 Build w/ Proposed Development
Griffith Street Segment Bicycle LOS Pedestrian LOS Bus LOS Harbour Place Dr. to Jetton St. C C E
Jetton St. to Beaty St. A A E
The corridor level of service determined by the Florida LOS tables shows that the bicycle and bus LOS remain unchanged for all three scenarios. The pedestrian level of service degrades in the 2018 No Build scenario between Harbour Place Drive and Jetton Street, but improves in the Build between Jetton Street and Beaty Street, due to on-street parking adjacent to the site along Griffith Street.
If improvements are made to the pedestrian, bicycle, and/or bus facilities in the area, some or all these levels of service may improve. The analysis shows that if a bench and shelter are provided at the bus stop at Lakeside Avenue, the bus LOS for the 2018 Build condition will improve from an LOS E to LOS D.
9.0 RECOMMENDATIONS
The results of the analyses indicate that the proposed site will not have a significant impact on the surrounding roadways or multi-modal facilities. It was noted that the proposed roundabout at the intersection of Griffith Street and Beaty Street / Sloan Street results in an improved level of service in the future year build scenario. Therefore, it is recommended that plans continue to move forward for the conversion of that intersection from a signal to a roundabout. However, the southbound approach of the roundabout is expected to operate at a failing level of service during the PM peak hour. Consideration should be given to the addition of an exclusive right-turn lane on that approach to accommodate the high traffic demand. It is understood that other factors would go into that decision, such as the Town’s emphasis on pedestrian safety and mobility, impacts on other multi-modal facilities, and the adjacent park and playground. It should be noted that without some sort of capacity improvements, the southbound approach is expected to operate at an unsatisfactory vehicular level of service.
The stop-controlled approach of Davidson Gateway Drive at Griffith Street is expected to experience an unsatisfactory level of service in the build scenarios, although it is not uncommon for this to occur during the peak periods at unsignalized intersections. The major street (Griffith Street) does not experience any significant delays as a result of the proposed site.
The developer should consult the Town of Davidson Planning Department during the development application process to define the pedestrian needs required by adopted ordinances. Required pedestrian facilities shall adhere to Section 6.8.1 of the Planning Ordinance as well as planned projects in the Town of Davidson Pedestrian Master Plan (adopted
FINAL DAVIDSON COMMONS EAST HOTEL TRANSPORTATION IMPACT ANALYSIS
February 23, 2017
kr u:\171001817\transportation\design\report\final_davidson commons east hotel tia.docx 42
in 2010) and the Davidson Walks and Rolls: Active Transportation Master Plan (adopted in 2013). Section 6.10.5 of the ordinance describes the discretion of facility development with Payment In Lieu being permitted as an acceptable mitigation measure in select cases. Additional and/or improved sidewalks in the area will encourage pedestrian activity to and from the hotel, which may further reduce the amount of vehicular traffic to and from the hotel beyond what has been assumed in this study. Improvements to existing crosswalks and the addition of new crosswalks at key locations will help clarify both vehicular and pedestrian movements, increasing safety for all users at the intersection.
Additionally, the Town requests that the developer consider the following measures to encourage patrons and guests to walk or bike to and from the proposed development:
• Offering of bike rentals to hotel guests;
• Travel Demand Management (TDM) measures, such as the offering of bus passes for employees or guests; the addition of bike racks on-site; and incentives for employee ride-sharing;
• Addition of amenities such as benches, trash cans, and/or a shelter at the existing bus stop;
• Relocation of the bus stop on Lakeside Avenue to be closer to the existing and improved pedestrian facilities; and,
• Addition of a pedestrian refuge island on Griffith Street to provide safe access to a relocated bus stop, if it continues to be located on the north side of the street.
10.0 CONCLUSIONS
The results of the transportation study show that the proposed development will not have a significant impact on the surrounding roadways or multi-modal infrastructure in the vicinity of the site.
The intersection of Griffith Street and Davidson Gateway Drive will experience the most impact from the proposed site, and the stop-controlled approach on Davidson Gateway Drive will operate at a level of service F during all three peak periods studied. However, it is not uncommon for an unsignalized approach to operate at LOS F during the peak periods, even with minimal turning volumes. Recommendations have been made to upgrade the pedestrian and transit facilities in this area, and increase options for bicycle riding. With some or all of these improvements, it should encourage more users to walk, bike, or ride to and from their destination, reducing the operational impact on this intersection.

FINAL DAVIDSON COMMONS EAST HOTEL TRANSPORTATION IMPACT ANALYSIS
February 23, 2017
kr u:\171001817\transportation\design\report\final_davidson commons east hotel tia.docx 43
The intersection of Griffith Street and Beaty Street / Sloan Street is expected to operate at a level of service F during the PM peak hour, and LOS E during the AM and Mid-Day peak hours. There are plans to convert this location to a roundabout in the future. The roundabout analysis indicates that it will operate at LOS D or better during the AM and Mid-Day peak periods, and LOS E during the PM peak period. It is expected that once the Potts-Sloan-Beaty connection project is completed, operations at this intersection will change, but the analysis indicates that the proposed development does not appear to have a significant impact on the performance of this intersection.
All other study area intersections are expected to operate at an acceptable level of service.
At all locations, the impacts of the previously approved development, which includes office and retail land uses, are much greater than those of the proposed hotel and restaurant land uses. There are minimal changes in delay and level of service at most locations between the 2018 No Build and 2018 Build with Proposed Development scenarios.
11.0 REFERENCES
1 2014 NCDOT Average Daily Traffic Volumes, Charlotte Urban Area Mapping, http://www.ncdot.gov/travel/statemapping/trafficvolumemaps/default.html (Charlotte, Sheet 1)
2 Trip Generation (9th Edition), Institute of Transportation Engineers (ITE), 2012.
3 HCM 2010: Highway Capacity Manual. Washington D.C.: Transportation Research Board, 2010.
4 NCDOT Congestion Management Capacity Analysis Guidelines. North Carolina Department of Transportation (NCDOT), 2012.
5 Designing Walkable Urban Thoroughfares: A Context Sensitive Approach. Institute of Transportation Engineers (ITE), 2010.


![Prosiding[Halal Hotel]](https://static.fdokumen.com/doc/165x107/6345e46cdf19c083b10845eb/prosidinghalal-hotel.jpg)

