Final-Annual-Report-2021.pdf - Chris Hani District Municipality
495
1
-
Upload
khangminh22 -
Category
Documents
-
view
1 -
download
0
Transcript of Final-Annual-Report-2021.pdf - Chris Hani District Municipality

1

2
Table of Content CONTANT PAGE
CHAPTER 1 ..................................................................................................................................................... 6
1.2 MUNICIPAL MANAGER’S FOREWORD .................................................................................................... 6
1.3 MUNICIPAL OVERVIEW ........................................................................................................................... 7
1.4 ECONOMIC OVERVIEW ......................................................................................................................... 30
1.5 SERVICE DELIVERY OVERVIEW .............................................................................................................. 39
1.6 FINANCIAL HEALTH OVERVIEW ............................................................................................................ 44
1.7 ORGANISATIONAL DEVELOPMENT OVERVIEW ................................................................................... 44
1.8 REPORT OF THE AUDITOR GENERAL .................................................................................................... 46
1.9 STATUTORY ANNUAL REPORT PROCESS .............................................................................................. 47
CHAPTER 2 – GOVERNANCE ....................................................................................................................... 50
2.1. GOVERNANCE STRUCTURES ................................................................................................................ 50
COMPONENT B: .......................................................................................................................................... 58
2.2 INTERGOVERNMENTAL RELATIONS ..................................................................................................... 58
COMPONENT C: ........................................................................................................................................... 62
2.3 PUBLIC ACCOUNTABILITY AND PARTICIPATION .................................................................................. 62
COMPONENT D ........................................................................................................................................... 66
2.4 CORPORATE GOVERNANCE .................................................................................................................. 66
CHAPTER 3 – SERVICE DELIVERY PERFORMANCE (PERFORMANCE REPORT PART 1) .............................. 74
3.1 INTRODUCTION ..................................................................................................................................... 75
COMPONENT A: BASIC SERVICE DELIVERY ................................................................................................. 80
3.2 WATER PROVISION ............................................................................................................................... 80
3.3 SANITATION PROVISION ....................................................................................................................... 87
3.4 HUMAN SETTLEMENTS ......................................................................................................................... 91
3.5 FREE BASIC SERVICES AND INDIGENT SUPPORT .................................................................................. 95
COMPONENT B: ROADS AND TRANSPORT ................................................................................................ 96
3.6 ROADS ................................................................................................................................................... 96
3.7 TRANSPORT ........................................................................................................................................... 98
COMPONENT C ............................................................................................................................................ 99
3.8 PLANNING AND DEVELOPMENT ........................................................................................................... 99
3.9 LOCAL ECONOMIC DEVELOPMENT ..................................................................................................... 105
COMPONENT D: COMMUNITY SERVICES ................................................................................................. 124
3.10 CHILD CARE, AGED CARE, SOCIAL PROGRAMMES ........................................................................... 124
COMPONENT E .......................................................................................................................................... 132
3.11 ENVIRONMENTAL MANAGEMENT: BIODIVERSITY .......................................................................... 132

3
COMPONENT F .......................................................................................................................................... 137
3.12 ENVIRONMENTAL HEALTH ............................................................................................................... 137
COMPONENT G: FIRE SERVICES AND DISASTER MANAGEMENT ............................................................ 143
3.13 FIRE SERVICES .................................................................................................................................... 143
3.14 DISASTER MANAGEMENT ................................................................................................................. 148
COMPONENT I: CORPORATE POLICY OFFICES AND OTHER SERVICES .................................................... 151
3.15 EXECUTIVE AND COUNCIL ................................................................................................................. 151
3.16 FINANCIAL SERVICES ......................................................................................................................... 152
3.17 HUMAN RESOURCE SERVICES .......................................................................................................... 155
3.18 INFORMATION AND COMMUNICATION TECHNOLOGY (ICT) SERVICES ......................................... 157
3.19 PROPERTY, LEGAL, RISK MANAGEMENT AND PROCUREMENT SERVICES ...................................... 161
COMPONENT K: ORGANISATION PERFORMANCE SCORECARD .............................................................. 170
CHAPTER 4 – ORGANISATIONAL DEVELOPMENT PERFORMANCE .......................................................... 300
4.1 PERFORMANCE REPORT PART II......................................................................................................... 300
COMPONENT A: ........................................................................................................................................ 300
4.2 MUNICIPAL PERSONNEL ..................................................................................................................... 300
COMPONENT B: ........................................................................................................................................ 303
4.3 MANAGING THE MUNICIPAL WORKFORCE ....................................................................................... 303
4.4. PERFORMANCE REWARDS................................................................................................................. 307
COMPONENT C: ......................................................................................................................................... 308
4.5 CAPACITATING THE MUNICIPAL WORKFORCE .................................................................................. 308
4.6 EMPLOYEE WELLNESS ......................................................................................................................... 312
4.7 LABOUR RELATIONS ............................................................................................................................ 314
COMPONENT D: ........................................................................................................................................ 315
4.8 MANAGING THE WORKFORCE EXPENDITURE ................................................................................... 315
CHAPTER 5 FINANCIAL PERFORMANCE ................................................................................................... 317
COMPONENT A: STATEMENTS OF FINANCIAL PERFORMANCE ............................................................... 317
CHAPTER 6 – AUDITOR GENERAL AUDIT FINDINGS ................................................................................. 339
COMPONENT A: AUDITOR GENERAL OPINION OF FINANCIAL STATEMENTS IS NOT YET AVAILABLE ... 339
AUDITOR GENERALS AUDIT ACTION PLAN FOR 2019/2020 F/Y IS NOT YET AVAILABLE ....................... 354
APPENDIX A – COUNCILLORS, COMMITTEE ALLOCATION AND COUNCIL ATTENDANCE ....................... 375
APPENDIX B – COMMITTEES AND COMMITTEE PURPOSES .................................................................... 376
APPENDIX C – THIRD TIER ADMINISTRATIVE STRUCTURE ...................................................................... 377
APPENDIX D – FUNCTION OF MUNICIPAL ENTITY ................................................................................... 377
APPENDIX G – AUDIT COMMITTEE REPORT ............................................................................................ 378
APPENDIX I – MUNICIPAL ENTITY/SERVICE PROVIDER PERFORMANCE SCHEDULE ............................... 392

4
APPENDIX J – DISCLOSURES OF FINANCIAL INTEREST ............................................................................. 396
APPENDIX K (i) – REVENUE COLLECTION PERFORMANCE BY VOTE ........................................................ 398
APPENDIX K (ii) – REVENUE COLLECTION PERFORMANCE BY SOURCE................................................... 399
APPENDIX N – CAPITAL PROGRAMME BY PROJECT YEAR ....................................................................... 400
APPENDIX L – CONDITIONAL GRANTS: EXCLUDING MIG ........................................................................ 402
VOLUME II: ANNUAL FINANCIAL STATEMENT ............................................................................................. 0
ANNEXURE A – CHRIS HANI DEVELOPMENT AGENCY ................................... Error! Bookmark not defined.

5

6
CHAPTER 1
1.2 MUNICIPAL MANAGER’S FOREWORD
The Chris Hani District Municipality prepared its Annual Report for the
year under review in line with Section 121 of the Local Government
Municipal Finance Management Act, No. 56 of 2003 as well as
accompanying circulars, templates and guidelines. This report provides
the overview on the performance and progress made by the district in
fulfilling its strategic objectives and priorities as aligned in the Integrated
Development Plan (IDP), Budget as well as Provincial and National
strategic directives.
As part of this report, highlights of all the programmes and projects that
were embarked on during this period to enhance service delivery within
our area of jurisdiction are also presented here. We also do
acknowledge our limitations which requires our concerted efforts in our
quest to deliver quality services to our community.
The outbreak of Covid-19 has put a strain on everyone globally including
the district and it has significantly impacted on our programmers,
particularly those that were planned for the last two quarters of the
period under review.
This year has proven to be particularly difficult for our district due to a
range of issues that transpired. Economic conditions confronting us as
the country continued to impact negatively on the collection rate of the
municipality. The district also experienced financial challenges which
have compromised the municipality’s ability to perform certain of its
deliverables. Our dysfunctional billing system coupled with the prevalent
culture of non-payment for municipal services by some residents served
as a major contributing factor to our financial situation.
While water and sanitation services provision remains our main priority
as the district, during this period, the service was faced with a myriad
challenges related to aging infrastructure and backlogs. We are however
making all strides towards mitigating both our strategic and operational
risks focused on improved billing systems for enhanced municipal
revenue collection, water and sanitation services infrastructure and
improved audit outcomes. As the district, we are also hard at work
employing all possible measures to move from the disclaimer of an
opinion we have obtained to an improved audit outcome that we will all
pride ourselves of. With the expertise we have at our disposal, we are
confident that the ground has been levelled to achieve this goalpost.
We extend our deepest gratitude to the political leadership for their
tenacity and oversight role on the work that we do. The manner in which
our staff members executed their responsibilities during this period
carried us through in playing a meaningful role on the lives of those we
serve. Our existence as the district mostly depends on the community
and we would like to take a pause to express sincere appreciation on
the constructive criticism from our community which serves as a
steppingstone to realize our objectives.

7
1.3 MUNICIPAL OVERVIEW
1.3.1 Spatial Overview
Chris Hani District Municipality is situated on the northern region of the Eastern Cape Province and
covers a surface area of 36,756 Km2. Only 35.2% of the district population live in areas classified
as urban, while 63.8% live in predominantly rural areas. The district also shares borders with five
other districts, namely, Pixley ka Seme DM, Joe Gqabi DM, Sarah Baartman DM, Amathole DM and
O.R. Tambo DM.
After the 2016 Local Government Elections (3 August 2016), the number of local municipalities
decreased from eight to six with the merger of Tsolwana LM, Inkwanca LM and Lukanji LM into a
newly established municipality, Enoch Mgijima LM, which also hosts the district municipal
headquarters and council chambers in Komani.
Map 1. Chris Hani District Municipal Boundary
Source: IHS Markit GIS & Municipal Demarcation Board, 2016
The following list presents the six LMs of the district with their urban nodes:
Inxuba Yethemba LM: Cradock and Middleburg.
Enoch Mgijima LM: Komani, Whittlesea, Tarkastad, Hofmeyer Molteno and Sterkstroom.
Emalahleni LM: Cacadu, Dordrecht and Indwe.
Intsika Yethu LM: Cofimvaba and Tsomo.
Sakhisizwe LM: Cala and Ekhowa.
Engcobo LM: Engcobo

8
The Chris Hani District is comprised of three historically distinct areas, the result of which is seen in
the spatial development of the district. The former Ciskei – made up of Hewu and Glen Grey
magisterial districts – and the former Transkei – which includes primarily the districts of Ngcobo,
Cala, Cofimvaba, Tsomo and Lady Frere magisterial districts – are characterised by significant
underdevelopment and a high level of poverty.
The balance of the Chris Hani District Municipality area is made up of former RSA magisterial
districts. The settlement and land use patterns in the two former homeland areas are distinctively
different. Settlement in the former Ciskei and Transkei is predominantly of the dispersed “traditional”
rural village settlement type, where subsistence-farming practices (pastoral and dry land cultivation)
are the dominant forms of land use activity apart from the residential function of these areas. In
contrast, settlement and land use in the former RSA component of the district is largely characterised
by nodal urban development (small service towns) and commercial farms.
Largely, the spatial pattern of the Study Area is characterised by a “mismatch” of separate rural and
urban areas, which are nevertheless functionally interrelated and dependent on a core area like
Komani. It is important to note that the spatially fragmented settlement pattern of the Study Area is
the result of different political historical factors, as well as administrative and ideological based
development initiatives implemented in the area over the last century.
Map 2. Chris Hani District Land Cover
Source: IHS Markit GIS & Municipal Demarcation Board, 2016

9
Settlement Characteristics
The district municipality is predominantly rural in character with a number of urban settlements. They
are as follows: Cradock, Middleburg, Komani, Whittlesea, Tarkastad, Molteno, Hofmeyer, Cacadu
(Lady Frere), Dordrecht, Indwe, Cofimvaba, Tsomo, Cala, Khowa and Engcobo. Komani is an
economic hub, due to its strategic position in the Chris Hani District Municipality. Komani has signs
of more compactness compare to other small urban areas in the district municipality. The settlement
patterns that occur within district municipality are in the form of rural sprawl and low-density urban
sprawl in small towns in municipality.
This reflects the existent texture of the already existing urban centers together with the rural villages.
These above-mentioned patterns are not sustainable or effective and has given rise to settlements
that range from low density agrarian communities to relatively high density urban settlements. The
layout of these rural villages is informal and are based firstly on family units and secondly on
community units.
Map 3. Chris Hani District Settlements
Source: IHS Markit GIS & Municipal Demarcation Board, 2016

10
Settlement Nodes
Type Location Local Municipality Function of Settlement and
associated typical land uses
District
Centre
Komani Enoch Mgijima District-level Administrative centre
Major district service centre for
commercial and social goods and
services
Centre of educational excellence
Industrial centre for value adding
processes and local based
manufacturing
Residential development
covering full range of economic bands
(High income – Low-income)
Sub-
District
Centres
Cradock Inxuba Yethemba Municipal-scale Administrative Centre
Municipal-scale service centre for
commercial and
social goods and services
Residential development covering
limited range of economic bands
(Middle income– Low-income)
Potential for value-adding agro-
industrial processes
Potential for event-related tourism
events
Ngcobo Engcobo
Cofimvaba Intsika Yethu
Cacadu Emalahleni
Cala Sakhisizwe

11
Type Location Local Municipality Function of Settlement and
associated typical land uses
Local
Centres
Middelburg Inxuba Yethemba Municipal-scale Administrative Centre
Local-scale Service Centre for
commercial and social goods and
services
Residential development covering
limited range of economic bands
(Middle income– Low-income)
Potential for value-adding agro-
industrial processes
Tarkastad Enoch Mgijima
Hofmeyer Enoch Mgijima
Molteno Enoch Mgijima
Ekhowa Sakhisizwe
Dordrecht Emalahleni
Sub-Local
Centres
Sterkstroom Enoch Mgijima Minor Administrative Functions
Minor service centre for social goods
and services
Focused support of local economic
initiatives –agriculture-based
Sada/Whittle
sea
Enoch Mgijima
Indwe
VaalBank
Emalahleni
Tsomo Intsika Yethu
Ilinge Enoch Mgijima
Thornhill Enoch Mgijima
Lower Lufuta Sakhisizwe
Clarkebury Engcobo

12
Type Location Local Municipality Function of Settlement and
associated typical land uses
Mnyolo, Engcobo
Ncora Intsika Yethu
Qamata Intsika Yethu
St Marks Intsika Yethu
Rural
Settlement
s
Rural
settlements
across the
district
All Local
Municipalities
Primarily residential and livelihood
subsistence function
Some provision of limited social goods
and services
1.3.2 Municipal Powers and Functions
The Chris Hani District Municipality is a category C2 municipality mandated to perform those powers
and functions vested in District Municipalities as contemplated in schedules 4 and 5 of the
Constitution of the Republic of South Africa, Act 108 of 1996. In addition to these powers and
functions as contemplated in the Act, the CHDM is mandated to perform such functions and powers
as determined by the MEC responsible for Local Government and as gazzetted by the province. In
relation to this, therefore, the core mandate of the CHDM is the supply of bulk water and sanitation
infrastructure, disaster management, municipal planning, municipal health services, tourism, local
economic development and maintenance of provincial roads as per the agreement entered into
between the CHDM and the Department of Roads and Public Works. The table below therefore
depicts those powers and functions vested in the district and those allocated to the various local
municipalities within the district jurisdiction.

13
Table 1: Municipal powers and functions
FUNCTION
CHRIS
HANI
DM
ENOCH
MGIJIMA
LM
INTSIKA
YETHU
LM
ENGCOB
O LM
SAKHISIZW
E LM
EMALAHL
ENI LM
INXUBA
YETHEMB
A LM
Air pollution Yes Yes Yes Yes Yes Yes Yes
Building
regulations
N/A Yes Yes Yes Yes Yes Yes
Child Care
facilities
N/A Yes Yes Yes Yes Yes Yes
Electricity
reticulation
N/A Yes Yes Yes Yes Yes Yes
Fire Fighting Yes Yes Yes Yes Yes Yes Yes
Local
Tourism
Yes Yes Yes Yes Yes Yes Yes
Municipal
Planning
Yes Yes Yes Yes Yes Yes Yes
Municipal
Health
Services
Yes No No No No No No

14
FUNCTION
CHRIS
HANI
DM
ENOCH
MGIJIMA
LM
INTSIKA
YETHU
LM
ENGCOB
O LM
SAKHISIZW
E LM
EMALAHL
ENI LM
INXUBA
YETHEMB
A LM
Storm water N/A Yes Yes Yes Yes Yes Yes
Trading
regulations
N/A Yes Yes Yes Yes Yes Yes
Bulk and
portable
Water
supply
Yes No No No No No No
Bulk and
Sanitation
supply
Yes No No No No No No
Billboards
and the
display of
adverts in
public
places
N/A Yes Yes Yes Yes Yes Yes
Cemeteries,
Crematoria
and funeral
parlours
N/A Yes Yes Yes Yes Yes Yes
Cleansing N/A Yes Yes Yes Yes Yes Yes
Control of
public
nuisances
N/A Yes Yes Yes Yes Yes Yes

15
FUNCTION
CHRIS
HANI
DM
ENOCH
MGIJIMA
LM
INTSIKA
YETHU
LM
ENGCOB
O LM
SAKHISIZW
E LM
EMALAHL
ENI LM
INXUBA
YETHEMB
A LM
Control of
undertaking
s that sell
liquor to the
public
N/A Yes Yes Yes Yes Yes Yes
Fencing and
fences
N/A Yes Yes Yes Yes Yes Yes
Licensing
and control
of
undertaking
s that sell
food to the
public
Yes No No No No No No
Local
amenities
N/A Yes Yes Yes Yes Yes Yes
Local sport
facilities
N/A Yes Yes Yes Yes Yes Yes
Markets N/A Yes Yes Yes Yes Yes Yes
Municipal
abattoirs
N/A Yes Yes Yes Yes Yes Yes
Municipal
parks and
N/A Yes Yes Yes Yes Yes Yes

16
FUNCTION
CHRIS
HANI
DM
ENOCH
MGIJIMA
LM
INTSIKA
YETHU
LM
ENGCOB
O LM
SAKHISIZW
E LM
EMALAHL
ENI LM
INXUBA
YETHEMB
A LM
recreational
facilities
Municipal
roads
N/A Yes Yes Yes Yes Yes Yes
Noise
pollution
N/A Yes Yes Yes Yes Yes Yes
Pounds N/A Yes Yes Yes Yes Yes Yes
Public
places
N/A Yes Yes Yes Yes Yes Yes
Refuse
removal,
refuse
dumps and
solid waste
disposal
Manage
ment of
solid
waste
sites
Yes Yes Yes Yes Yes Yes
Street
trading
N/A Yes Yes Yes Yes Yes Yes
Street
lighting
N/A Yes Yes Yes Yes Yes Yes
Traffic and
parking
N/A Yes Yes Yes Yes Yes Yes

17
FUNCTION
CHRIS
HANI
DM
ENOCH
MGIJIMA
LM
INTSIKA
YETHU
LM
ENGCOB
O LM
SAKHISIZW
E LM
EMALAHL
ENI LM
INXUBA
YETHEMB
A LM
Licensing of
vehicles
N/A Yes Yes Yes Yes Yes Yes
Road
maintenanc
e
Yes
(Agent:
DORT)
Yes Yes Yes Yes Yes Yes
Libraries N/A Yes Yes Yes Yes Yes Yes
1.3.3 District Demographic Profile
In this section, an overview is provided of the demography of the Chris Hani District Municipality and
all its neighbouring regions, the Eastern Cape Province and South Africa as a whole. This section
will also provide population distributions across race, age and gender as well as an indication of
population densities and various household dynamics.
Population Levels
Population statistics is important when analysing an economy, as the population growth directly and
indirectly impacts employment and unemployment, as well as other economic indicators such as
economic growth and per capita income.
Table 2: Total population - Chris Hani, Eastern Cape and National Total, 2007-2017 [NUMBERS / PERCENTAGE]
Chris Hani Eastern Cape National Total Chris Hani as % of
province
Chris Hani as % of
national
2007 801,000 6,470,000 48,400,000 12.4% 1.65%
2008 803,000 6,500,000 49,100,000 12.4% 1.63%
2009 806,000 6,540,000 49,800,000 12.3% 1.62%
2010 810,000 6,600,000 50,700,000 12.3% 1.60%
2011 813,000 6,650,000 51,500,000 12.2% 1.58%
2012 816,000 6,710,000 52,400,000 12.2% 1.56%

18
Chris Hani Eastern Cape National Total Chris Hani as % of
province
Chris Hani as % of
national
2013 821,000 6,780,000 53,200,000 12.1% 1.54%
2014 827,000 6,850,000 54,100,000 12.1% 1.53%
2015 834,000 6,930,000 54,900,000 12.0% 1.52%
2016 842,000 7,010,000 55,700,000 12.0% 1.51%
2017 849,000 7,080,000 56,500,000 12.0% 1.50%
Average Annual growth
2007-2017 0.58% 0.91% 1.56%
Source: IHS Markit Regional eXplorer version 1479
With 849 000 people, the Chris Hani District Municipality housed 1.5% of South Africa's total
population in 2017. Between 2007 and 2017 the population growth averaged 0.58% per annum
which is more than half than the growth rate of South Africa as a whole (1.56%). Compared to
Eastern Cape's average annual growth rate (0.91%), the growth rate in Chris Hani's population at
0.58% was close to half than that of the province.
Total population - Chris Hani and the rest of Eastern Cape, 2017 [Percentage]

19
When compared to other regions, the Chris Hani District Municipality accounts for a total population
of 849,000, or 12.0% of the total population in the Eastern Cape Province, with the O.R. Tambo
being the most populous region in the Eastern Cape Province for 2017. Chris Hani decreased in
importance from ranking fourth in 2007 to sixth in 2017. In terms of its share the Chris Hani District
Municipality was slightly smaller in 2017 (12.0%) compared to what it was in 2007 (12.4%). When
looking at the average annual growth rate, it is noted that Chris Hani ranked seventh (relative to its
peers in terms of growth) with an average annual growth rate of 0.6% between 2007 and 2017.

20
Table 3: Total population - local municipalities of Chris Hani District Municipality, 2007, 2012
and 2017
[NUMBERS / PERCENTAGE]
2007 2012 2017 Average Annual growth
Inxuba Yethemba 63,500 66,300 70,300 1.03%
Intsika Yethu 153,000 152,000 154,000 0.09%
Emalahleni 119,000 122,000 126,000 0.59%
Engcobo 157,000 157,000 162,000 0.28%
Sakhisizwe 63,400 63,200 65,200 0.29%
Enoch Mgijima 246,000 0256,000 272,000 1.02%
Chris Hani 801,407 816,266 849,231 0.58%
Source: IHS Markit Regional eXplorer version 1479
Inxuba Yethemba Local Municipality increased the most, in terms of population, with an average
annual growth rate of 1.03%, Enoch Mgijima Local Municipality had the second highest growth in
terms of its population, with an average annual growth rate of 1.02%. Intsika Yethu Local Municipality
had the lowest average annual growth rate of 0.09% relative to other Local Municipalities within the
Chris Hani District Municipality.
1.3.3.2 Population by population group, Gender and Age
The total population of a region is the total number of people within that region measured in the
middle of the year. Total population can be categorised according to the population group, as well
as the sub-categories of age and gender. The population groups include African, White, Coloured
and Asian, where the Asian group includes all people originating from Asia, India and China. The
age subcategory divides the population into 5-year cohorts, e.g. 0-4, 5-9, 10-13, etc.

21
Table 4: Population by gender - Chris Hani and the rest of Eastern Cape Province, 2017 [Number]
Male Female Total
Chris Hani 410,000 439,000 849,000
Nelson Mandela Bay 616,000 657,000 1,270,000
Buffalo City 413,000 445,000 859,000
Sarah Baartman 248,000 252,000 500,000
Amatole 415,000 452,000 867,000
Joe Gqabi 181,000 196,000 377,000
O.R.Tambo 699,000 794,000 1,490,000
Alfred Nzo 402,000 465,000 867,000
Eastern Cape 3,380,000 3,700,000 7,080,000
Source: IHS Markit Regional eXplorer version 1479
Chris Hani District Municipality's male/female split in population was 93.5 males per 100 females in
2017. The Chris Hani District Municipality appears to be a fairly stable population with the share of
female population (51.69%) being very similar to the national average of (51.05%). In total there
were 439 000 (51.69%) females and 410 000 (48.31%) males. This is different from the Eastern
Cape Province as a whole where the female population counted 3.7 million which constitutes 52.23%
of the total population of 7.08 million.

22
Table 5: Population by population group, Gender and Age - Chris Hani District Municipality,
2017 [Number]
African White Coloured Asian
Female Male Female Male Female Male Female Male
00-04 45,300 46,900 416 416 1,710 1,680 112 90
05-09 46,200 48,300 410 486 1,660 1,610 74 73
10-14 39,700 42,300 523 415 1,700 1,620 54 71
15-19 33,300 37,500 422 395 1,350 1,500 64 49
20-24 32,500 35,900 372 370 1,430 1,500 63 148
25-29 33,500 37,800 532 547 1,490 1,360 80 263
30-34 29,200 31,100 524 495 1,250 1,050 96 203
35-39 24,800 24,700 521 508 1,140 1,080 66 145
40-44 17,700 14,300 529 554 1,100 998 68 134
45-49 16,200 9,600 592 547 885 997 53 69
50-54 17,800 9,810 666 642 832 802 29 57
55-59 19,500 11,000 613 614 823 687 43 26
60-64 16,700 10,400 553 480 702 601 45 39
65-69 13,400 9,410 459 464 549 410 12 21
70-74 11,700 7,770 321 343 374 249 11 12
75+ 15,200 8,240 505 349 391 205 26 17
Total 413,000 385,000 7,960 7,630 17,400 16,400 896 1,420
Source: IHS Markit Regional eXplorer version 1479
In 2017, Chris Hani District Municipality's population consisted of 93.92% African (798 000), 1.84%
White (15 600), 3.97% Coloured (33 700) and 0.27% Asian (2 310) people.
The largest share of population is within the children’s bracket (0-14 years) age category with a total
number of 282 000 or 33.2% of the total population. The age category with the second largest
number of people is the young working age (25-44 years) age category with a total share of 26.8%,
followed by the teenagers and youth (15-24 years) age category with 147 000 people. The age
category with the least number of people is the retired / old age (65 years and older) age category
with only 70 400 people, as reflected in the population pyramids below.

23
1.3.3.3 Population Pyramids
A population pyramid is a graphic representation of the population categorised by gender and age,
for a specific year and region. The horizontal axis depicts the share of people, where the male
population is charted on the left-hand side and the female population on the right-hand side of the
vertical axis. The vertical axis is divided in 5-year age categories.
With the African population group representing 93.9%of the Chris Hani District Municipality's total
population, the overall population pyramid for the region will mostly reflect that of the African
population group. The chart below compares Chris Hani's population structure of 2017 to that of
South Africa.
Population pyramid - Chris Hani District Municipality vs. South Africa, 2017 [Percentage]

24
When comparing 2007 population pyramid with 2017 pyramid for the Chris Hani District Municipality,
some interesting differences are visible:
In 2007, there were a significant smaller share of young working age people - aged 20 to 34 (21.7%)
- compared to 2017 (24.9%).
Fertility in 2007 was slightly lower compared to that of 2017.
The share of children between the ages of 0 to 14 years is significantly larger in 2007 (34.8%)
compared to 2017 (33.2%).
Life expectancy is increasing.
In 2017, the female population for the 20 to 34 years age group amounted to 11.1% of the total
female population while the male population group for the same age amounted to 10.6% of the total
male population. In 2007 the male working age population at 13.0% still exceeds that of the female
population working age population at 11.9%.
1.3.3.4 Population Density
Population density measures the concentration of people in a region. To calculate this, the population
of a region is divided by the area size of that region. The output is presented as the number of people
per square kilometer.
Population pyramid - Chris Hani District Municipality vs. South Africa, 2017 [Percentage]
By comparing the population pyramid of the Chris Hani District Municipality with the national age
structure, the most significant differences are:
There is a significant smaller share of young working age people - aged 20 to 34 (24.9%) -
in Chris Hani, compared to the national picture (28.0%).
The area seems to be a migrant sending area, with many people leaving the area to find work
in the bigger cities.
Fertility in Chris Hani is significantly higher compared to South Africa as a whole.
Spatial policies changed since 1994.
The share of children between the ages of 0 to 14 years is significantly larger (33.2%) in
Chris Hani compared to South Africa (29.1%). Demand for expenditure on schooling as
percentage of total budget within Chris Hani District Municipality will therefore be higher than
that of South Africa.

25
Population density - Chris Hani, Eastern Cape and National Total, 2017 [number of people per
square km]
In
2017, with an average of 23.3 people per square kilometre, Chris Hani District Municipality had a
lower population density than Eastern Cape (41.9 people per square kilometre). Compared to South
Africa (46.3 per square kilometre) it can be seen that there are less people living per square kilometre
in Chris Hani District Municipality than in South Africa.

26
Table 6: Population density - Chris Hani and the rest of Eastern Cape, 2007-2017 [number of people
per km]
Chris Hani
Nelson Mandela Bay
Buffalo City
Sarah Baartman
Amatole Joe Gqabi
O.R.Tambo Alfred Nzo
2007 22.01 560.10 279.68 7.29 41.96 13.64 111.01 74.04
2008 22.04 567.03 281.33 7.39 41.58 13.63 111.70 74.33
2009 22.13 575.35 283.76 7.52 41.30 13.67 112.65 74.80
2010 22.24 584.52 286.76 7.65 41.09 13.74 113.76 75.37
2011 22.33 593.87 289.92 7.78 40.91 13.84 114.93 76.02
2012 22.42 603.33 293.21 7.91 40.74 13.95 116.03 76.63
2013 22.56 613.05 296.86 8.05 40.68 14.09 117.29 77.37
2014 22.72 622.78 300.69 8.19 40.69 14.24 118.65 78.18
2015 22.91 632.28 304.55 8.32 40.77 14.40 120.06 79.04
2016 23.11 641.45 308.38 8.45 40.90 14.56 121.50 79.92
2017 23.33 650.41 312.21 8.58 41.07 14.73 122.92 80.79
Average Annual growth
2007-2017 0.58% 1.51% 1.11% 1.65% -0.21% 0.77% 1.02% 0.88%
Source: IHS Markit Regional eXplorer version 1479
In 2017, Chris Hani District Municipality had a population density of 23.3 per square kilometre and it
ranked highest amongst its piers. The region with the highest population density per square kilometre
was the Nelson Mandela Bay with a total population density of 650 per square kilometre per annum.
In terms of growth, Chris Hani District Municipality had an average annual growth in its population
density of 0.58% per square kilometre per annum. The region with the highest growth rate in the
population density per square kilometre was Sarah Baartman with an average annual growth rate of
1.65% per square kilometre. In 2017, the region with the lowest population density within Eastern
Cape Province was Sarah Baartman with 8.58 people per square kilometre. The region with the
lowest average annual growth rate was the Amatole with an average annual growth rate of -0.21%
people per square kilometre over the period under discussion.
Population Density - Inxuba Yethemba, Intsika Yethu, Emalahleni, Engcobo, Sakhisizwe and
Enoch Mgijima local municipalities,2017 [percentage]

27
In terms of the population density for each of the regions within the Chris Hani District Municipality,
Engcobo Local Municipality had the highest density, with 65.1 people per square kilometre. The
lowest population density can be observed at Inxuba Yethemba Local Municipality with a total of
6.03 people per square kilometre.
1.3.3.5 Number of Households by Population Group
A household is either a group of people who live together and provide themselves jointly with food
and/or other essentials for living, or it is a single person living on his/her own. An individual is
considered part of a household if he/she spends at least four nights a week within the household. To
categorise a household according to population group, the population group to which the head of the
household belongs, is used.
If the number of households is growing at a faster rate than that of the population it means that the
average household size is decreasing, and vice versa. In 2017, the Chris Hani District Municipality
comprised of 230 000 households. This equates to an average annual growth rate of 1.46% in the
number of households from 2007 to 2017. With an average annual growth rate of 0.58% in the total
population, the average household size in the Chris Hani District Municipality is by implication
decreasing. This is confirmed by the data where the average household size in 2007 decreased from
approximately 4 individuals per household to 3.7 persons per household in 2017.

28
Table 7: Number of households - Chris Hani, Eastern Cape and National Total, 2007-2017
[Number Percentage]
Chris Hani Eastern Cape National Total Chris Hani as
% of province
Chris Hani as
% of national
2007 198,000 1,600,000 13,100,000 12.4% 1.51%
2008 203,000 1,630,000 13,400,000 12.5% 1.52%
2009 210,000 1,670,000 13,700,000 12.5% 1.53%
2010 211,000 1,680,000 13,900,000 12.5% 1.52%
2011 213,000 1,700,000 14,200,000 12.5% 1.50%
2012 214,000 1,710,000 14,500,000 12.5% 1.48%
2013 216,000 1,730,000 14,700,000 12.5% 1.46%
2014 216,000 1,740,000 15,000,000 12.4% 1.44%
2015 220,000 1,770,000 15,400,000 12.4% 1.43%
2016 225,000 1,810,000 15,700,000 12.4% 1.43%
2017 229,000 1,860,000 16,100,000 12.4% 1.43%
Average Annual growth
2007-2017 1.46% 1.52% 2.02%
Source: IHS Markit Regional eXplorer version 1479
Relative to the province, the Chris Hani District Municipality had a lower average annual growth rate
of 1.46% from 2007 to 2017. In contrast, the South Africa had a total of 16.1 million households, with
a growth rate of 2.02%, thus growing at a higher rate than the Chris Hani.

29
Number of households by population group - Chris Hani District Municipality, 2017
[Percentage]
The composition of the households by population group consists of 93.4% which is ascribed to the
African population group with the largest number of households by population group. The Coloured
population group had a total composition of 3.7% (ranking second). The White population group had
a total composition of 2.5% of the total households. The smallest population group by households is
the Asian population group with only 0.4% in 2017.
The growth in the number of African headed households was on average 1.52% per annum between
2007 and 2017, which translates in the number of households increasing by 30 000 in the period.
Although the Asian population group is not the biggest in size, it was however the fastest growing
population group between 2007 and 2017 at 12.42%. The average annual growth rate in the number
of households for all the other population groups has increased with 1.43%.

30
Number of households by population group - local municipalities of Chris Hani District
Municipality, 2017 [percentage]
1.4 ECONOMIC OVERVIEW
1.4.1 Number of Households by Income category
The number of households is grouped according to predefined income categories or brackets, where
income is calculated as the sum of all household gross disposable income: payments in kind, gifts,
homemade goods sold, old age pensions, income from informal sector activities, subsistence
income, etc.). Note that income tax is included in the income distribution.
Income categories start at R0 - R2, 400 per annum and go up to R2 400,000 per annum. A household
is either a group of people who live together and provide themselves jointly with food and/or other
essentials for living, or it is a single person living on his/her own. These income brackets do not take
into account inflation creep: over time, movement of households "up" the brackets is natural, even if
they are not earning any more in real terms.

31
Table 8: Households by income category - Chris Hani, Eastern Cape and National Total, 2017
[Number / Percentage]
Chris
Hani
Eastern Cape National Total Chris Hani as
% of province
Chris Hani as
% of national
0-2400 29 226 1,650 12.6% 1.73%
2400-6000 516 4,330 32,500 11.9% 1.59%
6000-12000 4,800 40,400 315,000 11.9% 1.52%
12000-18000 9,580 79,600 626,000 12.0% 1.53%
18000-30000 28,900 233,000 1,730,000 12.4% 1.67%
30000-42000 31,700 242,000 1,750,000 13.1% 1.82%
42000-54000 27,200 207,000 1,550,000 13.2% 1.76%
54000-72000 29,900 223,000 1,670,000 13.4% 1.79%
72000-96000 25,300 188,000 1,520,000 13.4% 1.66%
96000-132000 21,200 162,000 1,430,000 13.1% 1.48%
132000-192000 17,500 142,000 1,370,000 12.3% 1.28%
192000-360000 17,200 159,000 1,760,000 10.8% 0.98%
360000-600000 8,580 90,900 1,160,000 9.4% 0.74%
600000-1200000 5,490 61,900 840,000 8.9% 0.65%
1200000-2400000 1,800 19,300 266,000 9.3% 0.68%
2400000+ 258 2,830 42,000 9.1% 0.61%
Total 230,000 1,860,000 16,100,000 12.4% 1.43%
Source: IHS Markit Regional eXplorer version 1479
It was estimated that in 2017 19.06% of all the households in the Chris Hani District Municipality,
were living on R30, 000 or less per annum. In comparison with 2007's 49.69%, the number is about
half. The 30000-42000 income category has the highest number of households with a total number
of 31 700, followed by the 54000-72000 income category with 29 900 households. Only 28
households fall within the 0-2400 income category.

32
Households by income bracket - Chris Hani District Municipality, 2007-2017 [Percentage]
For
the period 2007 to 2017 the number of households earning more than R30, 000 per annum has
increased from 50.31% to 80.94%. The number of households with income equal to or lower than
R6, 000 per year has decreased by a significant amount.
1.4.2 Annual Total Personal Income
In a growing economy among which production factors are increasing, most of the household
incomes are spent on purchasing goods and services. Therefore, the measuring of the income and
expenditure of households is a major indicator of several economic trends. It is also a good marker
of growth as well as consumer tendencies.
Personal income is an even broader concept than labour remuneration. Personal income includes
profits, income from property, net current transfers and net social benefits.
Annual total personal income is the sum of the total personal income for all households in a specific
region. The definition of income is the same as used in the income brackets (Number of Households
by Income Category), also including the income tax. For this variable, current prices are used,
meaning that inflation has not been considered.

33
Table 9: Annual total personal income – Chris Hani, Eastern Cape and National Total [Current
Prices, R billions]
Chris Hani Eastern Cape National Total
2007 11.6 120.6 1,432.2
2008 12.9 133.8 1,587.9
2009 14.0 143.0 1,695.1
2010 15.0 153.9 1,843.3
2011 16.4 168.0 2,033.0
2012 18.4 187.7 2,226.5
2013 20.4 204.8 2,412.1
2014 22.4 219.9 2,590.6
2015 24.8 238.8 2,778.6
2016 27.3 258.8 3,009.7
2017 30.6 285.6 3,238.9
Average Annual growth
2007-2017 10.22% 9.00% 8.50%
Source: IHS Markit Regional eXplorer version 1479
Chris Hani District Municipality recorded an average annual growth rate of 10.22% (from
R 11.6 billion to R 30.6 billion) from 2007 to 2017, which is more than both Eastern Cape's (9.00%)
as well as South Africa's (8.50%) average annual growth rates.

34
Annual total personal income by population group - Chris Hani and the rest of Eastern Cape
[Current Prices, R billions]
The total personal income of Chris Hani District Municipality amounted to approximately
R 30.6 billion in 2017. The African population group earned R 24.9 billion, or 81.31% of total personal
income, while the White population group earned R 3.7 billion, or 12.10% of the total personal
income. The Coloured and the Asian population groups only had a share of 5.91% and 0.69% of
total personal income respectively.
Table 10: Annual total personal income - Inxuba Yethemba, Intsika Yethu, Emalahleni,
Engcobo, Sakhisizwe and Enoch Mgijima local Municipalities [Current Prices, R billions]
Inxuba
Yethemba
Intsika
Yethu
Emalahleni Engcobo Sakhisizwe Enoch
Mgijima
2007 1.66 1.69 1.25 1.64 0.92 4.40
2008 1.85 1.89 1.42 1.83 1.01 4.94
2009 1.98 2.03 1.54 1.98 1.08 5.35
2010 2.14 2.17 1.66 2.12 1.15 5.80
2011 2.33 2.34 1.80 2.30 1.24 6.37
2012 2.63 2.61 2.01 2.58 1.39 7.17
2013 2.94 2.88 2.24 2.85 1.52 7.92
2014 3.24 3.18 2.48 3.13 1.67 8.67
2015 3.55 3.54 2.76 3.47 1.84 9.59
2016 3.88 3.93 3.09 3.84 2.02 10.59
2017 4.40 4.49 3.53 4.36 2.30 11.52

35
Inxuba
Yethemba
Intsika
Yethu
Emalahleni Engcobo Sakhisizwe Enoch
Mgijima
Average Annual growth
2007-2017 10.21% 10.28% 10.89% 10.29% 9.61% 10.10%
Source: IHS Markit Regional eXplorer version 1479
When looking at the annual total personal income for the regions within Eastern Cape Province the
Enoch Mgijima Local Municipality had the highest total personal income with R 11.5 billion which
increased from R 4.4 billion recorded in 2007. The Sakhisizwe Local Municipality had the lowest total
personal income of R 2.3 billion in 2017, this increased from R 918 million in 2007.
1.4.3 Annual per Capita Income
Per capita income refers to the income per person. Thus, it takes the total personal income per
annum and divides it equally among the population. Per capita income is often used as a measure
of wealth particularly when comparing economies or population groups. Rising per capita income
usually indicates a likely swell in demand for consumption.
Per capita income - Chris Hani, Eastern Cape and National Total, 2017 [Rand, current prices]
The per capita income in Chris Hani District Municipality is R 36,000 and is lower than both the
National Total (R 57,300) and of the Eastern Cape Province (R 40,300) per capita income.

36
Table 11: Per capita income by population group - Chris Hani and the rest of Eastern Cape
Province, 2017 [Rand, current prices]
African White Coloured Asian
Chris Hani 31,200 236,000 53,700 94,400
Nelson Mandela Bay 29,700 226,000 52,100 120,000
Buffalo City 40,900 252,000 67,000 138,000
Sarah Baartman 31,800 230,000 42,900 85,800
Amatole 30,200 217,000 46,600 80,700
Joe Gqabi 32,500 243,000 54,800 N/A
O.R.Tambo 25,500 168,000 64,200 81,200
Alfred Nzo 22,500 153,000 50,800 71,100
Source: IHS Markit Regional eXplorer version 1479
Nelson Mandela Bay Metropolitan Municipality has the highest per capita income with a total of
R 60,400. Buffalo City Metropolitan Municipality had the second highest per capita income at
R 57,100, whereas Alfred Nzo District Municipality had the lowest per capita income at R 23,000. In
Chris Hani. District Municipality, the White population group has the highest per capita income, with
R 236,000, relative to the other population groups. The population group with the second highest
per capita income within Chris Hani District Municipality is the Asian population group (R 94,400),
where the Coloured and the African population groups had a per capita income of R 53,700 and
R 31,200 respectively.
1.4.4 Access to Basic Household Services
As per the requirements of planning and social development, a Municipality must consider household
infrastructure data within its area of jurisdiction as an essential value. Assessing household
infrastructure involves the measurement of five indicators:
Access to dwelling units
Access to proper sanitation
Access to running water
Access to refuse removal
Access to electricity
A household is considered "serviced" if it has access to all five of these basic services. If not, the
household is considered to be part of the backlog. The way access to a given service is defined
(and how to accurately measure that specific Definition over time) gives rise to some distinct
problems. IHS has therefore developed a unique model to capture the number of households and
their level of access to the four basic services.

37
A household is defined as a group of persons who live together and provide themselves jointly with
food and/or other essentials for living, or a single person who lives alone.
The next few sections offer an overview of the household infrastructure of the Chris Hani District
Municipality between 2017 and 2007.
1.4.5 Household by Dwelling Type
Using the StatsSA definition of a household and a dwelling unit, households can be categorised
according to type of dwelling. The categories are:
Very formal dwellings - structures built according to approved plans, e.g. houses on a
separate stand, flats or apartments, townhouses, rooms in backyards that also have running
water and flush toilets within the dwelling. .
Formal dwellings - structures built according to approved plans, i.e. house on a separate
stand, flat or apartment, townhouse, room in backyard, rooms or flatlet elsewhere etc, but
without running water or without a flush toilet within the dwelling.
Informal dwellings - shacks or shanties in informal settlements, serviced stands, or
proclaimed townships, as well as shacks in the backyards of other dwelling types.
Traditional dwellings - structures made of clay, mud, reeds, or other locally available
material.
Other dwelling units - tents, ships, caravans, etc.
Households by dwelling unit type - Inxuba Yethemba, Intsika Yethu, Emalahleni, Engcobo, Sakhisizwe
and Enoch Mgijima local municipalities, 2017 [Number]
Local
Municipalities
Very
Formal
Formal Informal Traditional Other
dwelling
type
Total
Inxuba
Yethemba
13,000 6,930 145 114 135 20,400
Intsika Yethu 426 11,700 9,970 21,000 306 43,400
Emalahleni 1,480 13,600 6,620 11,800 493 34,000
Engcobo 238 10,200 10,800 18,000 555 39,900
Sakhisizwe 2,230 9,810 2,130 3,160 102 17,400
Enoch Mgijima 25,800 39,800 2,150 6,880 162 74,900
Total
Chris Hani
43,244 92,179 31,860 60,950 1,754 229,987
Source: IHS Markit Regional eXplorer version 1479

38
The area within Chris Hani District Municipality with the highest number of very formal dwelling units
is the Enoch Mgijima Local Municipality with 25 800 or a share of 59.72% of the total very formal
dwelling units across the District. The area with the lowest number of very formal dwelling units is
Engcobo Local Municipality with a total of 238 or a share of 0.55% of the total very formal dwelling
units within Chris Hani District Municipality.
When looking at the formal dwelling unit backlog (number of households not living in a formal
dwelling) over time, it can be seen that in 2007 the number of households not living in a formal
dwelling were 82 400 within Chris Hani District Municipality. From 2007 this number increased
annually at 1.39% to 94 600 in 2017.
The total number of households within Chris Hani District Municipality increased at an average
annual rate of 1.46% from 2007 to 2017, which is higher than the annual increase of 2.02% in the
number of households in South Africa.

39
1.5 SERVICE DELIVERY OVERVIEW
In terms of structural arrangements of CHDM three of the six directorates deal directly with service
delivery, viz: Engineering, Health and Community Services and Intergrated Planning and Economic
Development (IPED). The other remaining three directorates are support departments which
essentially ensures that the municipality is able to deliver on its mandate, viz: Corporate Services,
Strategic Services and Budget and Treasury Office (BTO).
1.5.1 Engineering Services Directorate
This directorate is mandated to ensure the roll-out of water and sanitation infrastructure development
projects and water services provision within its six local municipalities. Its main focus areas are as
follows:
Planning of future water and sanitation infrastructure
Implementation of water and sanitation of projects including project management and
monitoring
Provision of water and sanitation across the district
Maximising employment opportunities through Expanded Public Works Programme (EPWP)
Various projects were initiated within the directorate and a number of these are in the pipeline while
some have been completed. These projects which are aimed at addressing water services backlog,
ensuring quality drinking water through refurbishment of water and waste water treatment works
amongst others.
With regards to water schemes and the provision of water infrastructure, the growth in terms of
human settlements and limited water sources in the district make the provision of sufficient access
to water and sanitation challenging. The vast distances and small catchment areas are major
obstacles to the achievement of economies of scale. During this period, the district was still battling
with the persisting spell of drought which has proven to be a major contributor to challenges that
confronted the district related to water provision. Covid-19 pandemic also presented its own
challenges towards the completion of planned projects as the outbreak rapidly spread across the
globe.
In terms of the current state of water treatment plants in the CHDM, the following can be revealed:
CHDM currently has 28 water treatment plants across the district with at least a few within
each local municipality including supply systems (boreholes) which are also chlorinated.
The western half of the district is characterized with vast distances between towns and only
a few settlements which are mostly provided with services on or above RDP level.

40
The majority of the eastern sections show that they are mostly on or below RDP level.
A number of settlements within Intsika Yethu and Engcobo remain unserved.
The proportion of households with access to basic services can be summarized as follows:
Table 12: Proportion of Households with minimum level of Basic services
Proportion of Households with minimum level of Basic services
2017/2018 2018/2019 2019/2020
Electricity service connections 89%
Water - available within 200 m from dwelling 68.8% 68.9% 69.2%
Sanitation - Households with at leats VIP service 75.1% 75.7% 78.6%
Waste collection - kerbside collection once a week 44%
PROPORTION OF HOUSEHOLDS WITH ACCESS TO BASIC SERVICES
The proportion of households with access to basic services in Chris Hani District Municipalities
are indicated in the following tables for water, sanitation, electricity and refuse services.
(i) Water

41
(ii) Electricity
(iii) Sanitation

42
(iv) Refuse Removal
1.5.2 Health and Community Services
Schedule 4 Part B of the SA Constitution and relevant legislative requirements clearly outlines some
of the functions of the district related to the Municipal Health Services. These functions vary from
Water Quality monitoring, Food Control Monitoring, Waste Management and General Hygiene
Management, Health Surveillance of Premises, Environmental Pollution Control to Disposal of the
Dead in respect to funeral parlour inspections, pauper burials and exhumations.
In executing our responsibility in this regard, we made all strides in ensuring that water provided to
communities is safe for human consumption and adequate for domestic use as well as recreational,
industrial, food production and any other human or animal use. Water monitoring was conducted to
ensure that we are able to detect chemical/bacteriological contamination and advice on control
measures for prevention of any diseases that may be water related.

43
In ensuring compliance with related legislation for the prevention and abatement of any condition on
any food premises which are likely to constitute a health hazard, a number of food premises were
evaluated in this regard. Food samples were taken and analysed throughout this period to ensure
quality of all food for human consumption and optimal hygiene control throughout the food supply
chain in line with Regulation 962 and Regulation 1555 under Foodstuffs, Cosmetics Disinfectants
Act (Act 54 of 1972).
As part of CHDM Waste Management programmes, Local Municipalities were advised on proper
waste management practices to ensure alignment with the Integrated Waste Management Plan
(IWMP) as detailed in the Waste Management Act. Local municipalities have also been supported
through clearing and rehabilitating illegal dumping sites to ensure a conducive healthy environment.
CHDM has successfully developed a Climate Change Response Strategy while the process of
developing the Air Quality Management Plan is still underway.
1.5.3 Integrated Planning and Economic Development (IPED)
Integrated Planning and Economic Development Directorate (IPED) has a responsibility of planning
for the district as a whole. This Planning function is multidimensional focusing on Spatial Planning,
Development Planning as well Economic Planning and Development. In implementing these
programmes the directorate seeks to ensure both the fulfilment of Council plans and further extricate
the masses from the morass of poverty, unemployment and inequality.
To discharge this critically important function, the directorate is made up of various sub units, namely:
Integrated Development Planning, Town Planning services, Housing development, Agricultural
development, Forestry and related sector development, Tourism Development and Marketing, and
Business development.
As part of CHDMs decisive intervention in the economy, the following initiatives were undertaken:
Poverty alleviation programmes focusing in Poultry and Piggery in some of the local
municipalities,
Livestock Improvement Programme with a specific focus on Inoculation and dosing of
animals, Construction of shearing sheds.
A noticeable dent in the farming industry was made as a support to Irrigation schemes rooted
out joblessness in many parts of the district.
An array of projects and programmes to boost and exploit the tourism potential of the Chris
Hani District municipality were initiated, these includes Jazz Festival, Tourism and
Institutional Support for Tourism Development and Tourism SMME Support.

44
1.6 FINANCIAL HEALTH OVERVIEW
The financial sustainability of the Chris Hani District Municipality are described in the tables below:
Table 13: CHDM Financial Overview
Financial Overview: 2019/2020 R' 000
Details Original budget Adjustment Budget Actual
Income:
Grants 1 057 826 000 1 137 645 347 1 042 665 648,00
Taxes, Levies and tariffs 244 461 260 303 532 083 300 505 479,00
Other 1 154 476 77 985 397 80 516 392,00
Sub Total 1 303 441 736 1 519 162 827 1 423 687 519,00
Less: Expenditure 1 351 408 458 1 126 448 211 1 250 680 578,00
Net Total* -47 966 722 392 714 616 173 006 941,00
* Note: surplus/(defecit) T 1.4.2
1.7 ORGANISATIONAL DEVELOPMENT OVERVIEW
Chapter 7 Section 51 of the Municipal Systems Act 32 of 2000, mandates the Municipality to
establish and organise its administration in a manner that would enable the municipality to be
responsive to the needs of the local community. Furthermore, Section 67(1) of the MSA compels the
Municipality to develop and adopt appropriate systems and procedures to ensure a fair, efficient
effective and transparent personnel administration.
The strategic objective of the directorate is to establish and maintain a skilled, healthy labour force
guided by relevant policies, systems procedures that are geared towards realizing the needs of
communities. Municipal transformation and organizational development is key to service delivery,
hence much emphasis is on the implementation of Batho Pele principles in all municipal structures,
systems, procedures, policies and strategies. During the year under review, the Chris Hani District
Municipality completed the following to achieve the strategic objective: The municipal organogram
for the 2018/2019 Financial Year has been tabled to Council where the operational structure was
table and adopted by Council as informed by objectives of the municipality. For the financial year
2019/2020, the organizational structure has again as it is annual imperative to review the structure,
it has since been reviewed and the Council has adopted the reviewed on 29 June 2020 in its Council
meeting.
Municipalities are required to establish mechanisms for monitoring and reviewing of their
Performance Management System furthermore to ensure monitoring, measuring and evaluating

45
performance of staff in line with Chapter 6 and Chapter 7 of the Municipal Systems Act of 2000,
respectively. The CHDM council adopted the Performance Management Framework for the period
under review subsequent engagements with all affected stakeholders.
An institutional Workplace Skills Development Plan developed in terms of the Skills Development
Act (1998), was completed and implemented during the financial year under review. Ninety one
employees have received training at a cost of R871 777.00.00 during the year under review. A total
of four (04) training programmes were implemented.
The municipality also implemented a number of skills development related programmes, including:
Fifty one (51) students received experiential training for a duration of 18 months as part of their
curriculum.
Within the year under review a total of fourteen (14) employees have received assistance to further
their studies in the following fields:
Finance
Engineering
Disaster
Forestry
Administration
Labour Relations

46
1.8 REPORT OF THE AUDITOR GENERAL
Chris Hani District Municipality was subjected to an intensive audit process by the Auditor General
in terms of the Public Audit Act 25 of 2004. This process as required by the legislation, in the
main seeks to assess the state of finances of the municipality as well as matters relating to internal
controls, governance and pre-determined objectives. Currently the opinion of the Auditor General
is based on the audit of finances. For the previous financial year the municipality has also got
Disclaimer the table below demonstrates the outcomes over the years.
Table 14: Audit Record
Financial Year Unqualified Qualified Adverse Disclaimer
2019/2020 √
2018/2019 √
2017/2018 √
2016/2017 √
1.8.1 Basis For The disclaimer of Opinion
• The Disclaimer audit opinion that the AG has issues for the municipality was
based on the following:
Property Plant and Equipment's
Revenue from exchange transactions
Receivables from exchange and payable transactions
VAT receivable
Unspent Conditional Grants and Receipts
General expenses & Irregular expenditure
Water Distribution losses
Agregagation of immaterial uncorrected misstatements
Corresponding Figures
Contracted services
Cash and cash equivalent

47
1.9 STATUTORY ANNUAL REPORT PROCESS
In terms of the Local Government Municipal Finance Management Act (MFMA) No 56 of 2003,
Section 121, the Council of a Municipality must within nine months after the end of the financial
year deal with Annual Report of the municipality and of any municipal entity under the
municipality’s sole or shared control in accordance with Section 129 of the MFMA. The table
below demonstrates the process the municipality followed in the preparation of the Annual Report
for Adoption by Council.
Table 15: Annual Report Process

48
No. Activity Timeframe
1
Consideration of next financial year’s Budget and IDP process
plan. In-year reporting formats to ensure that reporting and
monitoring feeds seamlessly into the Annual Report process at
the end of the Budget/IDP implementation period July
2 Implementation and monitoring of approved Budget and IDP
commences (In-year financial reporting).
3 Finalise the 4th quarter Report for previous financial year
4
Submit draft previous financial year Annual Report and evidence
to Internal Audit and the Auditor-General including annual
financial statements and non financial information August
5 Municipal entities submit draft annual reports to MM
6 Performance Audit Committee considers draft Annual Report of
municipality
7
Municipality submits draft Annual Report including consolidated
annual financial statements and performance report to Auditor
General September
- October 8 Annual Performance Report as submitted to Auditor General to
be provided as input to the IDP Analysis Phase
9 Auditor General audits Annual Report including consolidated
Annual Financial Statements and Performance data
10 Municipalities receive and start to address the Auditor General’s
comments November
11
Executive Mayor tables Annual Report and audited Financial
Statements to Council complete with the Auditor- General’s
Report
January
12 Audited Annual Report is made public and representation is
invited February
13 Oversight Committee assesses Annual Report February -
March
14 Council adopts Oversight report March
15 Oversight report is made public within seven days of its adoption
April 16
Oversight report is submitted to Legislatures, Treasuries and
Cogta

49
Ch
ap
ter
2

50
CHAPTER 2 – GOVERNANCE
COMPONENT A:
2.1. GOVERNANCE STRUCTURES
The Chris Hani District Municipality was established in terms of provisions contained in chapter 1
of the Local Government Structures Act, 17 of 1998 (MSA). As per the aforesaid provisions,
CHDM is a category C municipality (district municipality) and as such the district utilises the
Mayoral Executive System. In this type of system the exercise of executive authority is through
the Executive Mayor, in whom the executive leadership of the municipality is vested. The
Executive Mayor is assisted by a Mayoral Committee which chairs section 80 committees referred
to as Standing Committees namely;
Finance and Fiscal
Health and Community Services
Infrastructure
Governance and Institutional Transformation
Integrated Planning and Economic Development.
The Council of CHDM has various Section 79 committees, namely;
Municipal Public Accounts Committee [MPAC])
Women’s Caucus,
Rules and Ethics Committee and
Whippery
All the above committees are chaired by a Councillor elected from within Council. Independent
oversight bodies namely; Audit Committee, Performance Audit Committee and Risk Management
Committee which are established in terms of Section 166 of the Municipal Finance Management
Act were also appointed by Council. Sittings of Council meetings are chaired by the Speaker of
Council whose responsibility also includes convening and presiding over such meetings. The
Political structure of the CHDM can be illustrated as per the diagram below.

51
Diagram 1 : Council Political Structure
2.1.1 Political Governance Structure
As would be reflective in the local sphere of government, the Council of the Chris Hani District
Municipality is the legislative component of the municipal governance. It is in this structure that
local laws are promulgated, decisions around the direction of development for the district are
taken, and is the body charged with overseeing the operations of the municipality such that they
adhere to the democratic principles as enshrined in the South African Constitution. Membership
to Council is through the electoral process of the country where there are Councillors directly
elected and become full time Councillors of the Council, as well as Councillors that are elected to
represent their local municipalities in the district Council. Currently, the Council of CHDM is made
up of 42 Councillors, 17 of which are on Proportional Representation (PR) and 25 direct
SPEAKER
MAYORALCOMMITTEE
EXECUTIVE MAYOR
MUNICIPAL PUBLIC
ACCOUNTS COMMITTEE
AUDIT COMMITTEE
PERFORMANCE AUDIT
COMMITTEE
STANDING
COMMITTEE
Integrated
Planning and
Economic
Development
STANDING
COMMITTEE
Health and
Community
Services
STANDING
COMMITTEE
Governance and
Institutional
Transformation
STANDING
COMMITTEE
Infrastructure
Services
STANDING
COMMITTEE
Finance and
Fiscal
COUNCIL

52
representatives from local municipalities within the District. Eight of the PR Councillors are
members of the Mayoral Committee.
During the period under review, vacancies were declared with the Independent Electoral
Committee and the parties concerned followed the process of replacement. Cllr Nyameka Goniwe
resigned from the Mayoral Committee as the Portfolio Heaad for Head for Health and Community
Sevices and was replaced by Cllr Bonisile Bobo. Cllr Madoda Papiyana resigned as Chief Whip
in May 2020 and Cllr Thumeka Bikwana was elected as the new Chief Whip, leaving a vacancy
in MPAC which was filled by Cllr Yanga Zicina. Cllr Nonzukiso Matiwane resigned as Portfolio
head for SPU and directly elected Cllr to the district Council, she was replaced by Cllr Nobantu
Mgidi who is an ordinary councillor. The Deputy Executive Mayor is the caretaker for the SPU
Portfolio.
2.1.1.1 Composition of Council
The table below depicts the composition of Council in terms of party representation of the
Proportional Representatives (PR) Councillors:
Table 16: Composition of Council
POLITICAL PARTY NUMBER GENDER DISTRIBUTION
ANC 13 7 MALES
6 FEMALES
DA 2 2 MALES
UDM 1 1 MALE
AIC 1 1 MALE
EFF 1 1 FEMALE
TOTAL 17 11 MALES
Additionally, the table below represents the composition of Council, inclusive of the 25 Councillors
representing local municipalities:

53
Table 17: Party Demographic Distribution
COUNCIL COMPOSITION NO OF COUNCILLORS GENDER DISTRIBUTION
MALE FEMALE
Councillors 40 (2 vacancies) 22 18
Traditional leaders 8 7 1
Further information on Councillors is provided in Appendix A

54
2.1.1.2 POLITICAL STRUCTURE OF COUNCIL IN PHOTOS

55

56
2.1.1.3 POLITICAL DECISION-TAKING
In accordance with Section 60 of Municipal Structures Act No. 117 of 1998, the Executive Mayor
appointed a Mayoral Committee. Specific responsibilities including presiding over specific Portfolio
Committees being assisted by Councillors deployed to each portfolio committees has been
delegated to each Portfolio Head. For the meeting to quorate 50 + 1 Councillors must be present for
the meeting to proceed.
Portfolio Committees recommend to the Mayoral Committee presided over by the Executive Mayor
and in his absence further delegates such responsibility to the Deputy Executive Mayor who was
sworn in during the financial year under review. The Executive Mayor has delegations to resolve on
issues assisted by the Mayoral Committee members, however there are matters that the Executive
Mayor cannot resolve and only the Council can ratify/ approve such e.g. passing of Policies, By –
Laws and Budget.
Council meetings are convened quarterly, over and above this, Special Council meetings are
convened when the need arises. The Mayoral Committee meetings are convened monthly.
The institution has developed a resolution register for the Mayoral and Council meetings with a view
to monitoring implementation of Council resolutions as well as easy access to information when
requests for access to information is submitted by citizens.
The Accounting Officer reports on progress made on the implementation of resolutions taken by
Council. The report also informs the Council of any reasons of non- implementation should there be
any resolution not yet implemented and the action is accordingly provided to address the delays.
2.1.2 Administrative Governance Structure
The Municipal Manager is the Head of the administration and Accounting Officer as defined in the
Municipal Systems Act 32 of 2000. The responsibilities of the Municipal Manager include managing
the administrative and financial affairs of the municipality and to ensure that municipal services are
delivered in an efficient, effective and economical manner. With his complement of directors
appointed in terms of Section 56 of the MSA, the Municipal Manager determines the pace of
development within the municipal area as per Council directives. Each director is responsible for
their area of expertise. From time to time, an Executive Management meeting is held where the
Municipal Manager engages the directors on various matters that affect service delivery. The
diagram below illustrates the high-level administrative structure:

57
Diagram 2: Top Administrative Structure

58
COMPONENT B:
2.2 INTERGOVERNMENTAL RELATIONS
Chapter 3 of the Constitution (1996) describes the three spheres of government (National, Provincial
and Local) as being ‘distinctive, interdependent and interrelated’ and enjoins them to ‘cooperate with
one another in mutual trust and good faith’. An important element of this cooperative relationship is
that there needs to be a clear understanding of each sphere of government’s powers and functions
to ensure that a sphere of government or organ of state ‘does not encroach on the geographical,
functional or institutional integrity of government in another sphere’. In addition to the Constitution,
various pieces of legislation governs or organises the system of intergovernmental relations. Among
other things, the legislation formalises the different spheres’ roles and responsibilities with regard to
various functions and provides for a range of consultative structures .The South African system of
intergovernmental relations is complex and continues to evolve as better modes of cooperation and
coordination emerge and as functions are shifted between the spheres. The following key elements
and principles underpin the intergovernmental system:
Accountability: Each sphere has specific constitutionally defined powers and
responsibilities, is accountable to its legislature or council, and is empowered to set its own
priorities. The power of national government to intervene in provincial and local government
matters, and provincial governments to intervene in local government matters, depends on
whether the relevant sphere fails to carry out an executive obligation.
Transparency and good governance: Accountability of political representatives to the
electorate and transparent reporting arrangements within and between spheres is at the heart
of the intergovernmental system. While political executives are responsible for policy and
outcomes, the accounting officers are responsible for implementation and outputs.
Mutual support: National and provincial governments have a duty to strengthen the capacity
of municipalities. Spheres of government must also act cooperatively towards each other, for
instance through avoiding legal action until all other mechanisms have been exhausted.
Redistribution: The three spheres all have important roles to play in redistribution, but
because inequalities exist across the country, the redistribution of resources is primarily a
national function. Where provinces and municipalities undertake redistribution, the challenge
is to do this in line with their fiscal capacity and not to undermine economic activity and their
financial viability. Redistribution among the three spheres is achieved through the vertical
division of revenue. Redistribution among provinces and municipalities is effected through
their respective equitable share formulae.
Vertical division: Determining the allocation to each sphere of government inevitably
involves trade-offs that are made in the course of a comprehensive budget process driven
by political priorities, and which covers all aspects of governance and service delivery.

59
Separate and ad hoc requests for funds fragment the coherence of the budget and undermine
the political process of prioritisation.
Revenue-sharing: The fiscal system takes into account the fiscal capacity and functions
assigned to each sphere. Provinces and municipalities are funded from own revenues,
equitable share allocations, and conditional and unconditional grants. The grant system must
be simple and comprehensive and not compensate provinces and municipalities that fail to
collect own revenues.
Broadened access to services: The Constitution and current government policy prioritises
broadening access to services. The responsible spheres are expected to design appropriate
levels of service to meet customer needs in an affordable manner, explore innovative and
efficient modes of delivery, and leverage public and private resources to fund infrastructure.
Responsibility over budgets: Each sphere of government has the right to determine its
own budget and the responsibility to comply with it. To reduce moral hazard and ensure
fairness, national government will not bail out provinces or municipalities that mismanage
their funds, nor provide guarantees for loans.
As such, understanding that the delivery of services cannot be the sole mandate of any one sphere
of government, the continued cooperation between the spheres of government within the Chris Hani
Region have contributed enormously to the question of development in areas such as education,
social development, housing and water provisioning.

60
2.2.1 Key Intergovernmental Relations Structures
To effectively engage in intergovernmental matters, the Chris Hani District Municipality established
IGR structures that would amongst other things ensure that there is continued engagement, sharing
of information and effective decision making. These structures are informed partly by the current
arrangements both National and Provincial, but also take into account the contextual realities within
the CHDM. The diagram below illustrates the structures currently existing in CHDM and their levels
in terms of decision making:
Diagram 3: Key Intergovernmental Relations Structures
During the financial year under review, the municipality has made significant strides in as far as
operationalising its key IGR instruments. To this effect, the municipality has been actively involved
in all National and Provincial IGR programmes. Key amongst these is the maximum attendance of
the municipality in Provincial IGR stuctures such as the Premiers Coordinating Forum (PCF), the
MuniMec as well as the Technical MuniMec.
All Executive Mayors and Mayors within the district area of juridisction are convened on a quarterly
basis to engage on matters of mutual interest under the ambit of the District Mayors Forum
(DIMAFO). A Technical IGR led by the Municipal Manager which precedes DIMAFO also provides
technical support to the structure for informed decision making on matters of development.

61
2.2.2 Relationships with Municipal Entities
The Chris Hani District Municipality, as a parent municipality over the Chris Hani Development
Agency (CHDA), established the entity in terms of the Municipal Systems Act (2000) and Municipal
Financial Management Act (2003) in 2012. The Chris Hani Development Agency is governed by a
Board of Directors appointed by the Chris Hani District Municipality, with the Advocate Mini as the
newly appointed Board Chairperson.
The position of Chief Executive Officer has since been filled with the recruitment of Mr Zolile Duze
during the period under review.
The district annually enters into a service level agreement (SLA) with the Chris Hani Development
Agency, for implementation of certain agricultural projects and this was the case for the 2019/2020
financial year.

62
COMPONENT C:
2.3 PUBLIC ACCOUNTABILITY AND PARTICIPATION
Community participation, through appropriate structures, is a fundamental requirement of the
Constitution (1996), the Municipal Systems Act (2006), the Municipal Finance Management Act
(2003) and all other legislation that is applicable to Local Government in South Africa. CHDM council
has institutionalised community participation mechanisms in its affairs to allow communities an
opportunity to participate in the decision-making processes of council.
Section 16 of the MSA requires municipalities to complement formal representative government with
a system of participatory governance, and must for this purpose, inter alia, encourage, and create
conditions for the local community to participate in the affairs of the municipality, including in the
preparation, implementation and review of its integrated development plan, the establishment,
implementation and review of its performance management , the monitoring and review of its
performance, including the outcomes and impact of such performance and the preparation of its
budget. Therefore, in line with this requirement, the centrepiece of the public participation ethos of
the Chris Hani District Municipality is anchored on the processes related to the preparation and
reporting on the implementation of the municipality’s Integrated Development Plan (IDP) and Budget
each year.
The Annual Report is also published each year for public comment before it is adopted by Council.
It is therefore evident that public participation should be promoted in order to achieve, inter alia, the
following objectives:
Consult with the community on their developmental challenges;
Form the basis for people-centred governance and bottom-up planning process;
Improve the relationship between council and the communities and thereby improve political
accountability and transparency;
Empower communities through information dissemination/assimilation;
Establish a community feedback programme, which allows local leaders the opportunity to interact
with communities on issues of service delivery;
Provide communities with a platform to influence the developmental trajectory of municipalities and
government in general; and
Provides the municipality with a project/programme evaluation and implementation monitoring
feedback mechanism.

63
During the period under review, the above objectives were fulfilled as the CHDM facilitated public
involvement in line with the requirements of Chapter 4 of the Municipal Systems Act. Whilst public
participation is the process through which people and communities highlight their needs and
aspirations, accountability is the end toward which the municipal Council strives. This is to ensure
that the authority delegated by communities to the Council is utilised in a manner consistent with the
provisions of law and the attainment of the needs of the communities. In the past financial year
Council made an effort to account to its communities on the use of authority in relation to the
management of financial affairs within the municipality, commitments made by the municipality
regarding the service delivery needs of communities (ranging from basic services such as water and
sanitation, roads, municipal health services as well as the development of the local economy) and
the progress in achieving those, and finally, on matters of good governance
2.3.1 Public Meetings
2.3.1.1 Communication, Participation and Forums
The Chris Hani District Municipality undertakes IDP and Budget roadshows on an annual basis in all
municipalities. In addition it hosts several public knowledge sharing days on health issues, hygiene,
water and sanitation usage, supply chain management, disaster and fire prevention strategies and
fire, occupational health and safety, LED, GIS and Planning. In addition to these platforms, the office
of the Speaker leads public participation programs for an engaged citizenry; these are, The Moral
Regeneration Movement, whose aim is to influence the society towards the charter of positive moral
values; the District Initiation Forum led by traditional leaders to respond to, prevent and intervene on
the scourge of deaths of initiates in the circumcision program; the Women’s Caucus which seeks to
strengthen women representation, capacity and voice of women in political and administrative offices
and the Civic education program which seeks to educate the electorate on various issues of
governance and social programs.
To strengthen the relations with Traditional Leadership the House of Traditional Leadership of the
region is a stakeholder that sits on the IDP Representatives Forum. In accordance with the Local
Government Municipal Systems Act, the CHDM holds regular Integrated Development Plan (IDP)
Representative Forum meetings in drafting its IDP. At the beginning of the planning cycle,
advertisements are placed in the local newspapers calling for interested parties to contact the CHDM
for registration to become part of the process.

64
Once the IDP and budget have been drafted and tabled at Council, the CHDM places another
advertisement calling for public comments. Copies of the document are lodged at all the Libraries
within the district and at Local Municipalities. After this process, the CHDM embarks on IDP and
Budget roadshows to the communities at all local municipalities. This is done in conjunction with the
support and assistance of the local municipalities who assist the CHDM’s officials, through their Ward
Councillors, to mobilize the ward community members to attend the roadshow events. The Draft IDP
is summarized and presented to communities in English and isiXhosa for comment and discussion.
Records of these meetings are kept and a document is drafted to keep track of the responses and
to disseminate to other government departments for follow up and auctioning, where necessary,
through intergovernmental forum meetings and the IDP Representative Forum.
Once all the comments and discussions have been taken into consideration towards an amended
IDP and Budget, the above process is followed up by a Council Open Day, where members of the
local community can attend a Council meeting where they are allowed to participate in proceedings.
All comments received from the local community are collated into a document to be considered by
council when adopting the IDP.
2.3.2 IDP Participation and Alignment
2.3.2.1 IDP-Budget-PMS Process Plan
Table 18: IDP/Budget/PMS Process Plan
IDP-BUDGET-PMS PROCESS PLAN
PARTICIPATION STRUCTURES & MEETING DATES
Mayoral Committee Meeting to look on IDP Process Plan 14 August 2019
Council Approval of Framework Plan & Process Plan 28 August 2019
DIMAFO 11 September 2019
IDP/Budget/PMS Managers forum (pre-planning and review
implementation)
13 September 2019
IDP/Budget/PPMS Steering Committee 17 September 2019
IDP/PMS/Budget Representative Forum [district-wide
development priorities]
26 September 2019
Technical IGR 06 November 2019
DIMAFO 20 November 2019
IDP Rep Forum 28 November 2019
Mayoral Committee Meeting 04 December 2019
IDP Phase Assessment ( Situation Analysis ) 05 December 2019

65
Mid-Year Performance Assessment HOD’s 21 January 2020
Mayoral Committee 22 January 2020
Council Meeting ( Final 2018/19 Draft Annual Report & Mid-
Year Report
29 January 2020
Budget Steering Committee –Adjustment Budget 04 February 2020
Technical IGR 05 February 2020
DIMAFO 12 February 2020
MPAC 13 February 2020
Mayoral Committee 19 February 2020
Council Meeting Adopting Adjustment Budget 26 February 2020
Policy Workshop 27-28 February 2020
Institutional Strategic planning session 04-06 March 2020
IDP /Budget/PMS Steering Committee Meeting 10 March 2020
Annual report engagement 11 march 2020
Policy Workshop 12-13 March 2020
Budget Steering Committee 13 March 2020
Mayoral Committee Meeting 18 March 2020
IDP Rep Forum 19 March 2020
Council approval of the draft IDP & Budget 25 March 2020
Draft IDP and Draft Budget published. Advertise for public
comments (21days)
27 March 2020
IDP/ Budget road shows (public presentation hearings at LMs) 07 -09 April 2020
IDP/Budget/PMS Steering Committee to incorporate inputs
into the IDP Roadshows
April- May 2020
MPAC 24 April 2020
Policy Workshop 28-30 April 2020
Mayoral Committee May 2020
Technical IGR/IDP Alignment session May 2020
DIMAFO May 2020
IDP Rep Forum May 2020
Council Meeting (Final Adoption of IDP & Budget) 31 May 2020

66
COMPONENT D
2.4 CORPORATE GOVERNANCE
2.4.1 Risk Management
The realisation of the institutional strategic plans depends on the ability to take calculated risks in
a way that does not jeopardise the direct interests of stakeholders. Sound management of risk will
enable the institution to anticipate and respond to changes in the service delivery environment, as
well as to take informed decisions under conditions of uncertainty.
The Chris Hani District Municipality subscribes to the fundamental principles that all resources will
be applied economically to ensure:
The highest standards of service delivery;
A management system containing the appropriate elements aimed at minimising risks and
costs in the interest of all stakeholders;
Education and training of all staff to ensure continuous improvement in knowledge, skills
and capabilities which facilitate consistent conformance to the stakeholders expectations;
and
Maintaining an environment which promotes the right attitude and sensitivity towards
internal and external stakeholder satisfaction.
An Enterprise Risk Management (ERM) approach to risk management is adopted by the Chris
Hani District Municipality, which means that every key risk in each part of the municipality is
included in a structured and systematic process of risk management. It is expected that the risk
management processes become embedded into the municipality’s systems and processes,
ensuring that the responses to risks remain current and dynamic. All risk management efforts are
focusing on supporting the municipal objectives. Equally, they must ensure compliance with
relevant legislation, and fulfil the expectations of employees, communities and other stakeholders
in terms of corporate governance.
The role of the Risk Management function is:
To ensure an effective and efficient risk management system in the district municipality;
To advise the council and municipal manager on the strategic risks and operational risks
of the district municipality that may impact on the achievement of the strategic objectives;
Advise the municipal manager and management on alignment of the strategic objectives
with the strategic risks and operational risks;

67
To coordinate the governance structures through the implementation of the combined
assurance model;
To develop and implement the risk management policy, strategy, and the risk management
implementation plan; and
To provide guidance to the local municipalities on risk management, anti-fraud and
corruption;
2.4.1.1 Compliance
The risk management function has the following compliance objectives:
To render effective and efficient internal controls in the district municipality.
To provide compliance framework to the district municipality and also provide guidance to
the local municipality.
To enforce compliance on MFMA and other related prescripts.
To ensure compliance with MFMA, SCM policies, and other National Treasury practice
notes on finance and supply chain.
2.4.1.2 Top five (5) Institutional risks
The following top five risks were identified in the risk register for Chris Hani District Municipality:
Table 19: Top five (5) Institutional risks

68
Strategic objective Risk description Mitigation measure
To Ensure an Effective,
Efficient and Co-ordinated
Financial Management that
enables CHDM to deliver its
mandate
Financial loss 1. Install and replacement of bulk
and consumer water
meters(Queenstown and Cradock)
2. implementation of meter audit
recommendations
3. Investigate and implement
consequence management.
4. Implementation of MPAC
recommendations
5. Refurbishment of satellite stores.
To ensure provision of
Municipal Health,
Environmental Management
and Basic Services in a well-
structured, efficient and
integrated manner.
Inability to deliver
quality, sufficient water
and provide proper
sanitation to our
communities.
1.Review communication strategy
both internal and external
2.Review and implementation of
by-laws
3.Review water conservation and
demand management strategy
4. Implementation of operational
and maintenance plan
5.Review and implement the water
services master plan
6.Enforce compliance in PMS
monitoring and evaluation
7.Strenghten implementation of the
procurement plan
Ageing infrastructure 1. Review and implementation of
maintenance
plan based on the infrastructure
assessment report
2. Prioritation and implementation
of infrastructure to be refurbished in
line with the budget and the plan.
Poor performance of
contractors
1. Monthly site meetings to be
made more effective.
2. Vetting of suppliers by SCM.

69
3. Enforcement of general
conditions of construction (GCC).
4.Enforcement of the SCM
regulations and PPPFA(Reference
checks SCM performance
evaluation reports on completed
projects)
Ineffective monitoring
of projects
1.Filling of the approved PMU &
WSA/ WSP positions
2.Consideration on essential user
car scheme & car allowance(to be
presented in management
meeting)
3. Development of the standardised
project monitoring tool.
4. Awareness on a civil contracts
module
5. Cascading of PMS to
management levels
2.4.1.3 Anti-Corruption and Fraud
The risk management function has the following anti-fraud and corruption objectives:
To implement the fraud prevention plan which includes a fraud prevention policy in the district
municipality.
To develop and implement an investigation policy.
To monitor a case management system that will ensure effective and efficient management
of cases.
To monitor a whistle blowing hot-line of the municipality.
To develop a whistle blowing policy that will support the whistle blowing hot-line in the district
municipality.

70
To provide assurance to the council and the municipal manager on the management of fraud
risks.
Promote professional ethics in the district municipality.
The following activities took place in the year under review:
Maintenance of the anti-fraud and corruption hotline.
Marketing of the use of the anti-fraud and corruption hotline in order to create awareness
Sitting of the anti-fraud and Risk Management Committee to ensure sound management of
fraud risk within the municipality
2.4.2 Supply Chain Management
Section 217 of the Constitution state that when an organ of state in the national, provincial or local
sphere of government, or any other institution identified in national legislation, contracts for goods or
services, it must do so in accordance with a system which is fair, equitable, transparent, competitive
and cost effective.
In order to ensure that the municipality achieves this constitutional mandate, the following Strategic
Objectives have to be attained:
To ensure that the municipality has and implements a supply chain management policy this
gives effect to the provisions of the Act;
To ensure procurement of goods and services in a fair, equitable, transparent, competitive
and cost effective and comply with the prescribed regulatory framework;
That all reasonable steps are taken to ensure that proper mechanisms are in place and
separation of duties in the supply chain management system is implemented to minimize
likelihood of fraud, corruption, favouritism and unfair and irregular practices;
To ensure that all contracts/agreement are in writing and are procured in line with the Supply
Chain Management;
To ensure that the supply chain management delegations are properly enforced and
managed;
That the municipal bid structures are in place and effective, to ensure competitive bidding
process;
Ensure submission of proper, accurate and applicable reports as per MFMA to ensure the
disposal of municipal assets in accordance with the applicable legislation; and
Ensure that municipal inventory levels are kept at an acceptable level as per the Municipal
SCM policy.

71
The Chris Hani District Municipality has developed and implemented the following policies and
practices relating to Supply Chain Management:
Supply Chain Management Policy
Irregular, Wasteful and Fruitless Expenditure Policy
Infrastructure Provision Policy
2.4.3 BY-LAWS
Table 20: Update on Municipal By-Laws developed
By-laws Introduced during Year 2019/2020
Newly Developed Revised Public
Participation
Conducted
Prior to
Adoption of
By-Laws
(Yes/No)
Dates of
Public
Participation
By-Laws
Gazetted*
(Yes/No)
Date of
Publication
Water and
Sanitation By-law
The document
being
reviewed is at
draft stage,
and is still
going to be
subjected to
internal
workshops
and public
participation
process
YES N/A YES 2006
Municipal Health
Services By-law
No YES May 2017 YES 19 Nov
2018
*Note: See MSA
section 13.
N/A N/A N/A N/A N/A
Municipal Health Services By-law has been promulgated.

72
2.4.4 WEBSITE
Table 21: Status of Municipal Website
Municipal Website: Content and Currency of Material
Documents published on the Municipality's / Entity's Website Yes /
No
Publishing
Date
Current annual and adjustments budgets and all budget-
related documents (Council Resolution Final Budget 2010)
Yes 10 June 2020
All current budget-related policies No
The previous annual report YES 07 February
2020
The annual report published/to be published No
All current performance agreements required in terms of section 57(1)(b) of the Municipal
Systems Act (Year 0) and resulting scorecards No
All service delivery agreements 2019/2020 Yes
All long-term borrowing contracts 2019/2020 N/A
All supply chain management contracts above a prescribed
value (30000) 2019/2020
YES Monthly
An information statement containing a list of assets over a prescribed value that have been
disposed of in terms of section 14 (2) or (4) during 2019/2020
Contracts agreed in Year 0 to which subsection (1) of section 33 apply,
subject to subsection (3) of that section
Public-private partnership agreements referred to in section
120 made in
N/A
All quarterly reports tabled in the council in terms of section
52 (d) during
No
SDBIP 2019/20 Yes
The Chris Hani District Municipality has established a functional website which can be accessed at
http://www.chrishanidm.gov.za. The website complies with section 75 of the Municipal Finance
Management Act (2003) and 21 A of the Municipal Systems Act (2000). On the website, users can
inter alia access the Districts previous Annual Reports, IDP’s, SDBIP’s, Performance Agreements,
Supply Chain Management info etc.

73
2.4.5 Public Satisfaction on Municipal Services
The Chris Hani District Municipality (CHDM) having completed a Customer Satisfaction Survey to
evaluate the satisfaction levels of its customers for the 2018/19 financial year, an improvement plan
was developed and currently being implemented. One of the major aspects of the plan is improving
customer experience. The municipality has put systems in place improve the turn-around time in
resolving customer complaints. Furthermore, the 24 hour Call Centre has been identified as a
coordinating point for all customer complaints in order to ensure the effectiveness in improving turn-
around time in resolving complaints. Even though the municipality did not conduct the customer
satisfaction survey in the 2019/2020 financial year, as the municipality we are committed to
continuously improve and strengthen our systems. During the 2020/2021 financial year, the
municipality will once again conduct the public perception survey in order to received feedback from
the public.

74
CHAPTER 3 – SERVICE DELIVERY PERFORMANCE (PERFORMANCE REPORT PART 1)

75
3.1 INTRODUCTION
Section 46 of the Local Government: Municipal Systems Act, 32 of 2000 (MSA) requires that
municipalities must, at the end of the financial year, prepare an annual performance report. The
report required in terms of this Section must reflect the performance of the municipality and each
of the external service providers engaged by the municipality for the year. Furthermore, this section
prescribes that the performances reflected above must be compared with performances for the
previous financial year and include measures to improve performance where underperformance
was recorded.
In terms of the Local Government: Municipal Finance Management Act, 56 of 2003 (MFMA), Sec
53(1)(c)(ii) a municipality’s Service Delivery and Budget Implementation Plan (SDBIP) must be
approved by the Mayor within 28 days after the approval of the budget. The SDBIP gives effect
to the Integrated Development Plan (IDP) and budget of the municipality.
The district municipality, at the beginning of 2019/20 Financial Year, adopted a “pro-poor” budget
which gives effect to the strategic priorities of the municipality. The SDBIP therefore serves as a
“contract” between the administration, Council and community expressing the goals and objectives
set by the Council as quantifiable outcomes that can be implemented by the administration over a
twelve month period. This provides the basis for measuring performance in service delivery
against end-of-year targets and implementing the budget. Once approved, the SDBIP forms the
basis of the performance plan of the Municipal Manager and cascaded down to inform the
performance plans of the Section 56 managers. This ultimately forms the basis for measuring the
performance of the municipality as well as the individual performances of the municipal manager
and his senior management team.
In line with this requirement, the Executive Mayor of the Chris Hani District Municipality approved
the SDBIP for the 2019/2020 financial year in June 2019 while the Performance Agreements of
the Senior Managers were concluded in July 2019. During the development of the SDBIP, a
balanced scorecard model was utilised.
This means that all aspects of the operation of the municipality are included in the SDBIP (internal
business processes, financial perspectives, and service delivery perspective) with a view of
ensuring that all operational aspects are monitored and evaluated against the impact they have
on the operation of the municipality and the delivery of services.
For purposes of consolidation, the SDBIP for 2019/20 was divided in terms of the five key
performance areas applicable to local government viz.

76
KPA 1: Municipal Transformation and Institutional Development;
KPA 2 : Basic Service Delivery and Infrastructure Development;
KPA 3: : Local Economic Development;
KPA 4: Municipal Financial Viability and Management; and
KPA 5: Good Governance and Public Participation.
KPA 1: the main focus is on the provision of support services internally. These would speak chiefly
to matters of human resource provisioning and development, employee wellness, information
communication technologies, fleet management services and legal services.
KPA 2: the main focus is of tangible service delivery matters such as water and sanitation, roads
maintenance, housing and town planning services.
KPA 3: this focuses on those indicators seeking to ensure that conducive conditions are created
for broader economic growth and ultimately to boost the district economy. Typically, these
indicators would focus on amongst others, issues such as tourism promotion and development,
forestry programmes, heritage development, the Expanded Public Works Programme (EPWP),
and agriculture.
KPA 4: focuses on the internal financial management processes. As such, this would focus on
matters relating to budget development, supply chain management issues, asset management as
well as income and expenditure management.
KPA 5: focuses on good governance matters such as public participation, stakeholder
engagegement, customer care and performance management, the effectiveness of oversight
structures, internal audit matters, risk management and communications.
During the 2019/2020 Financial Year the overall CHDM performance results reflect a progressive
rate caused by improved performance results of departments in implementing the Integrated
Development Plan, Budget and Service Delivery and Budget Implementation Plan of the
Municipality. The tables below provides a general overview of the performance of the institution in
percentage terms for each KPA and finally for the institution as a whole.
Table 22: Comparison summary for 2017/2018, 2018/2019 and 2019/2020 financial years

77
KPA Overall Performance
Percentage
(2017/2018 FY)
Overall Performance
Percentage
(2018/2019 FY)
Overall Performance
Percentage
(2019/2020 FY)
Municipal
Transformation and
Organizational
Development
73% 67% 48%
Basic service delivery
and infrastructure
Development
77% 53% 64%
Local Economic
Development
71% 84% 70%
Financial Management
and Viability
59% 17% 32%
Good Governance and
Public Participation
69% 84% 79%
Overall Institutional
Performance
71% 64% 63%
The performance of the institution varies over the years with a decline recorded across all
directorates due to various reasons that will be detailed in the report. The summary below outlines
the overall performance of the district for the past three years.
PERFORMANCE HIGHLIGHTS FOR 2019/2020
KPA 1: Municipal Transformation and Organizational Development
Relations with labour remained stable: Continued Local Labour Forums (LLF) convened
assisted in ensuring sound employer and employee relations within the district.
Filling of vacant posts: A total number 22 vacant positions were filled to ensure sufficient
human capital to assist the municipality with on-going operations and fast track service
delivery.
4 Medical Assessments and Vaccination programme for employees conducted
Occupational Health and Safety Strategy was approved by Council.

78
Integrated Health, Wellness and Safety programmes for Employees and Councillors:
These were conducted consistently.
KPA2: Basic Service Delivery and Infrastructure Development
Monitoring and support of Funeral parlours: Routine inspections were conducted for funeral
parlours and sanitation structures across the district to ensure compliance with standards.
Provision of certificates of acceptability where applicable.
Monitoring of compliance of both drinking water and waste water quality: Water samples
were taken to assess the quality of both drinking water as well as waste water to primarily
improve the blue and green drop status.
Completion of the following water project; Upper Mnxe Cluster 2, Noluthando lukavala
phase 2, Jiphita makiki, Lokshini and Xonxa bulk water
6295 Households were served with safe basic sanitation
A Process Audit was conducted in all 18 Waste Water Treatment Works.
In respect to fire services and disaster management, the CHDM was able to respond to all
incidents reported within the stipulated timeframes.
Completion of Molteno Oxidation Ponds upgrades
KPA 3: Local Economic Development (LED)
Support has been provided for tree nurseries and afforestation projects at Intsika Yethu,
Engcobo and Sakhisizwe Local Municipalities.
Enterprises participated on the EMPRETEC training at Small Enterprise Development
Agency (SEDA) as part of the SMME programmes implementation
Irrigation schemes were supported as per SLA with CHDA
KPA 4: Municipal Financial Viability and Management
Compilation and approval of a funded Credible Budget to ensure effective cash flow
management that will support the implementation of the SDBIP and improve its
performance.
KPA 5: Good Governance and Public Participation
Implementation of Risk Management Framework: The districts’ risk management
instruments remain strong in ensuring adherence to a clean administration and
accountable governance.

79
Various initiatives were undertaken during the year under review to improve risks
associated with fraud and corruption.
CHDM continues to excel in implementing mechanisms to strengthen the public
participation function.
The implementation of the Intergrated Marketing and Communication strategy of the district
immensely paved the way for effective engagement with all relevant stakeholders across
the district.

80
COMPONENT A: BASIC SERVICE DELIVERY
This component includes water, waste water (sanitation), housing services; and a summary of free
basic services.
3.2 WATER PROVISION
3.2.1 Introduction To Water Provision
Chris Hani District Municipality is a Water Services Authority (WSA) and Water Services Provider
(WSP) in all local Municipalities within the district area of juridisction in terms of the powers and
functions as outlined in the Municipal Structures Act, 117 of 1998.
With regards to water schemes and the provision of water infrastructure, the growth in terms of
human settlements and limited water sources in the district make the provision of sufficient access
to water and sanitation challenging. The vast distances and small catchment areas are major
obstacles to the achievement of economies of scale. Drought has also proven to be a major
contributor of water provision in the district.
In terms of the current state of water treatment plants in the CHDM, the following can be revealed:
CHDM currently has 28 water treatment plants across the district with at least a few within
each local mucipality including supply systems (boreholes) which are also chlorinated.
The western half of the district is characterised with vast distances between towns and
only a few settlements which are mostly provided with services on or above RDP level.
The majority of the eastern sections show that they are mostly on or below RDP level.
A number of settlements within Intsika Yethu and Engcobo remain unserved.
Table 23: Households with access to water
Households
Description 2016/2017 2017/2018 2018/2019 2019/2020
Actual Actual Actual Actual
No. No. No. No
Water: (above min level)
Piped water inside dwelling 44590 44590 44590 44590
Piped water inside yard (but not in dwelling) 33864 33864 33864 33864
Using public tap (within 200m from dwelling ) 64613 71754 71837 72534

81
Other water supply (within 200m)
Minimum Service Level and Above sub-total 143067 150208 150291 150988
Minimum Service Level and Above Percentage 66% 69% 68.9% 69,2 %
Water: (below min level)
Using public tap (more than 200m from dwelling) 18299 18299 18299 18299
Other water supply (more than 200m from dwelling 56849 49708 49625 49625
No water supply
Below Minimum Service Level sub-total
75148 68007 67924 67924
Below Minimum Service Level Percentage 34% 31% 31.1% 31.1%
Total number of households* 218214 218214 218214 218214
Source: HIS Global Insight Regional Explorer version
1029
Table 24: Water Services objectives
Water Service Policy Objectives as per IDP
Service
Indicator
s
Outline
Service
Targets
2016/2017 2017/2018 2018/2019 2019/20
20
2020/21
Target Actu
al
Target Actu
al
Target Actu
al
Target Actual
*Previo
us Year
*Previo
us Year
Curre
nt
Year
*Previo
us Year
*Curre
nt Year
Previou
s year
*Current
Year
*Followin
g Year
(i) (ii) (iii) (iv) (v) (vi) (vii) (viii) (ix) (x) (xi) (xii)
Service
Objective
No of
househol
ds
served
with
quality
basic
water
supply
5195
househol
ds
served
with
Quality
basic
water
supply
by 30
June
2020
2920 1238 1238 7141 4174 4533 1632 83 83 5195 697 11848

82
No of
water
reticulati
on
projects
complete
d
10 Water
reticulati
on
projects
complete
d by 30
June
2020
21 7 7 14 11 11 6 2 2 10 5 11
No of
bulk
water
supply
projects
Complet
ed
1 Bulk
water
supply
projects
complete
d by 30
June
2020
0 0 0 9 8 8 3 1 1 2 1 8
Number
of Full
SANS
Audit
conducte
d in all 28
Water
Treatme
nt Works
1 Full
SANS
Audit
conducte
d in all 28
Water
Treatme
nt Works
by 30
June
2019
80% 99% 99% 16 16 16 1 0 1 1
No of
water
treatment
works
construct
ed
01 Water
Treatme
nt works
Complet
ed by 30
June
2020
4 4 4 4 3 3 1 0 0 1 0 1
No of
water
schemes
refurbish
ed
02 Water
Scheme
s
refurbish
ed by 30
June
2019
14 7 7 10 10 2 2 1 5 3

83
Table 25: Water Services employees
Table 26: Water Services Capital Expenditure
Capital Expenditure Year: 2018/2019
Water Services
R' 000
Capital Projects
2018/2019
Budget Adjustment
Budget
Actual
Expenditure
Variance from
original budget
Total
Project
Value
Total All
EMPLOYEES WATER SERVICES
2016/2017 2017/2018 2018/2019
Job Level Employees Post Employees Vacancies Post Employees Vacancies Vacancy %
0-3 57 71 71 0 116 58 58 50%
4-6 30 113 63 50 114 83 31 27%
7-9 4 4 4 0 0 0 0 0
10-12 0 24 15 9 22 15 7 32%
13-15 10 10 10 0 10 8 2 20%
16-18 0 0 0 0 0 0 0 0
19-20 0 0 0 0 0 0 0 0
TOTALS 101 222 163 59 262 164 98 37%
EMPLOYEES WATER SERVICES
2017/2018 2018/2019 2019/2020
Job
Level
Employees Post Employees Vacancies Post Employees Vacancies Vacancy
%
0-3 71 116 58 58 117 97 20 17%
4-6 63 114 83 31 207 196 11 5%
7-9 4 0 0 0 49 31 18 36%
10-12 15 22 15 7 58 58 1 2%
13-15 10 10 8 2 10 10 0 0%
16-18 0 0 0 0 1 1 0 0
19-20 0 0 0 0 0 0 0 0
TOTALS 163 262 164 98 443 393 50 %

84
Gugwini reservoir 1,777,450.00 1,777,450.00 925,617.44 0%
Cl8 lunda water
supply
6,000,000.00 6,000,000.00 4,194,839.76
0%
Total project value represents the estimated cost of the project on approval by council
(including past and future expenditure as appropriate.

85
Table 27: Water Services Financial Performance
Financial Performance 2019/2020: Water Services
R'000
Details
2018/2019 2019/2020
Actual Original Budget Adjustment Budget
Actual Variance to Budget
Total Operational Revenue 221 941 635 187 502 717 244 291 799 241 312 886 22%
Expenditure:
Employees 129 207 255 151 650 579 142 914 573 165 989 712 9%
Repairs and Maintenance 72 129 500 10 583 755 49 770 680 28 457 433 63%
Other 482 528 383 1 928 256 108 052 388 95 486 160 98%
Total Operational Expenditure 683 865 138 164 162 590 300 737 641 289 933 305 43%
Net Operational Expenditure 461 923 503 (23 340 127) 56 445 842 48 620 419 148%
Net expenditure to be consistent with summary T 5.1.2 in Chapter 5. Variances are calculated by dividing the difference between the Actual and Original Budget by the Actual. T 3.1.8
OVERALL WATER SERVICES PERFORMANCE
The following capital projects were completed during 2019/2020:
Bulk Projects: Xonxa pumpstation
Water Retitulation: and Lokshini Villages project, RS1 phase 2C -Jiphutha makiki project.
Noluthando lukavala phase 2, Upper Mnxe project, Mhlanga water supply

86
Cluster 6 lokshini water supply project constructed in Engcobo Local Municipality.
Cluster 2 Jiphutha Makiki water supply project.

87
3.3 SANITATION PROVISION
Table 28: Sanitation Service Delivery Levels
Sanitation Service Delivery Levels *Households
Description Year -3 Year -2 Year -1 Year 0
Outcome Outcome Outcome Actual
No. No. No. No.
Sanitation/sewerage: (above minimum level)
Flush toilet (connected to sewerage) 68 68 68 930
Flush toilet (with septic tank) – – – 535
Chemical toilet – – – 601
Pit toilet (ventilated) 91 95 97 100 Other toilet provisions (above
min.service level) – – – 11
Minimum Service Level and Above sub-total 159 164 165 2 178
Minimum Service Level and Above Percentage 73,0% 75,1% 75,7% 63,1%
Sanitation/sewerage: (below minimum level)
Bucket toilet 1 1 1 720 Other toilet provisions (below
min.service level) 30 30 30 535
No toilet provisions 28 23 22 15
Below Minimum Service Level sub-total 59 54 53 1 271
Below Minimum Service Level Percentage 27,0% 24,9% 24,3% 36,9%
Total households 218 218 218 3 449
*Total number of households including informal settlements T 3.2.3
Within this period, a total of 697 households were supplied with water across the district as listed
below:
Name of Project Number of Households
Lokshini Villages project
RS1 phase 2C -Jiphutha makiki project
Noluthando lukavala phase 2
163
407
127
Table 29: Sanitation Service Policy Objectives as per IDP

88
Sanitation Service Policy Objectives as per IDP
Service
Indicators
Outline
Service
Targets
2017/201
8
2018/2019 2019/2029 2020/202
1
2021/202
2
Target Actua
l
Target Actua
l
Target Actua
l
Target
*Previous
Year
*Previou
s Year
Curren
t Year
*Previou
s Year
Curren
t Year
*Current
Year
*Followin
g Year
(i) (ii) (iii) (iv) (v) (vi) (vii) (viii) (ix) (x) (ix) (x)
Service
Objective
No of
household
s with safe
sanitation
5839
household
s served
by 30 June
2020
4589 6424 4589 1394 1254 1394 5839 6298 799 567
No of
waste
water
treatment
works
constructe
d
1 Waste
Water
Treatment
Works by
30 June
2020
1 0 1 1 0 1 1 0 2 0
Number of
Process
Audit
conducted
in all 18
Waste
Water
Treatment
Works
1Process
Audit
conducted
in all 18
Waste
Water
Treatment
Works by
30 June
2020
16 6 16 1 1 1 1 1 1 1

89
Sanitation project for VIP toilets

90
Table 30: Employees Sanitation Services
EMPLOYEES SANITATION SERVICES
2017/2018
2018/2019
2019/2020
Job
Level
Employees Post Employees Vacancies Post Employees Vacancies Vacancy
%
0-3 110 226 226 0 28 17 11 39%
4-6 10 49 10 39 43 34 9 21%
7-9 22 22 22 0 0 0 0 0
10-12 37 37 37 0 2 2 0 0
13-15 0 0 0 0 0 0 0 0
16-18 0 2 0 2 0 0 0 0
19-20 0 0 0 0 0 0 0 0
TOTALS 179 336 295 41 73 53 20 50%
Table 31: Sanitation Services Financial Performance
Financial Performance Year 2019/2020: Sanitation Services
R'000
Details
2018/2019 2019/2020
Actual Original Budget Adjustment Budget
Actual Variance to Budget
Total Operational Revenue 53 094 194 56 958 543 59 240 284 59 192 593
0,04
Expenditure:
Employees 2 708 344 - - - -
Repairs and Maintenance 1 586 676 10 583 755 4 950 224 3 024 285 -
Other 17 612 204 1 928 256 1 225 331 1 145 748 -0,68
Total Operational Expenditure 21 907 224 12 512 011 6 175 555 4 170 034
-2,00
Net Operational Expenditure (31 186 970) (44 446 532) (53 064 729) (55 022 559)
0,19
Net expenditure to be consistent with summary T 5.1.2 in Chapter 5. Variances are calculated by dividing the difference between the Actual and Original Budget by the Actual. T 3.2.8

91
Table 32: Sanitation Services Capital Expenditure Capital
Expenditure Year 2018/2019: Sanitation Services
R' 000
Capital Projects
Year 2018/2019
Budget Adjustment
Budget
Actual
Expenditure
Variance from adjustment
budget
Total
Project
Value
Regional 1 Sanitation
Backlog MIG
4,850,000.00 8,950,000.00 7,038,518.49 1,911,481.51
Regional 1 Sanitation
Backlog WSIG
5,000,000.00 5,000,000.00 5,000,000.00 0.00
Regional 2 Sanitation
Backlog MIG
5,024,990.00 15,000,000.00 14,625,096.38 374,903.62
Total All 14 874 990,0 28 950 000,00 26 663 614.87 2,286,385.13
Total project value represents the estimated cost of the project on approval by council (including past and
future expenditure as appropriate).
SANITATION SERVICES PERFORMANCE OVERALL
A total of 1254 households received sanitation during the 2018/2019 financial year as the following
capital projects were completed:
Region 1 Sanitation Backlog( MIG ) : 92 households provided with sanitation
Region 1 Sanitation Backlog ( WSIG ): 350 households provided with sanitation
Region 2 Sanitation Backlog: 812 households provided with sanitation
3.4 HUMAN SETTLEMENTS
3.4.1 Introduction
This function is performed to provide support and guidance to Local Municipalities although it’s
not a core mandate of the District. The support focuses on municipalities that are faced with
capacity challenges and financial constraints in human settlements delivery. Furthermore, it
coordinate infrastructure projects that are directly affecting human settlements in as far as
sanitation and water services are concerned. Such coordination seeks to eliminate duplication of
effort and assist in the monitoring of human settlement projects.

92
In trying to address these challenges that are facing the District in so far as human settlements
development is concerned, CHDM ensures that human settlements forum is coordinated every
quarter and chaired by the portfolio councillor responsible for this function.
The forum is comprised of portfolio heads and officials that deals with human settlements;
infrastructure and town planning in the district and all its 6 Local Municipalities; the Department of
Human Settlement in the Province and the Region also forms part of the gatherings.
3.4.2 Support On Human Settlements Development Plan
3.4.2.1 The Destitute Human Settlements Programme
This initiative was born in 2013 out of dire housing conditions experienced by certain families within
the District without excluding people from the vulnerable groups. The budget for this programme
is catered for under equitable share. Since its establishment, it’s been rolled- out in each financial
year throughout the District until to date. In 2019/2020 financial year only 4 destitute beneficiaries
were considered to benefit in the programme due to fiscal constrains in the district. The
construction of houses was delayed due COVID-19 and will be implemented in 2020/2021 financial
year.
Assessments is always conducted in order to ascertain and justify whether the beneficiaries are
legitimate. This process is done in consultation with the local municipalities and other relevant
role-players.
3.4.2.2 Emergency Human Settlements Programme
Chris Hani District Municipality has a responsibility to develop 427 emergency houses as per its
Service Level Agreement with the Department of Human Settlements. Since this agreement came
into existence, a total of 17 local emerging contractors were appointed for this programme.
The breakdown of the 427 emergency houses per Local Municipality is as follows:
Table: 33 breakdown of the emergency houses
= Number of
Emergency houses
planned
Number of
Emergency
houses under
construction
Number of
Emergency
houses completed
Comments
Intsika Yethu LM 67 10 9 Works have
been suspended
in all sites due to
Enoch Mgijima LM 143 6 0
Emalahleni LM 49 0 0

93
Sakhisizwe LM 65 29 10 foundation
design that were
submitted by
ECDHS to
NHBRC for
home
enrolment.
NHBRC is now
questioning
whether the
foundation
design that were
approved are
meeting the
required
standard of the
worst case
scenario of soil
types. CHDM is
busy with the
rational
statement to
prove the
required
standard of the
foundation
design for the
worst case
scenario and
also the
development of
new design.
Engcobo LM 73 10
Inxuba Yethemba LM 30 0
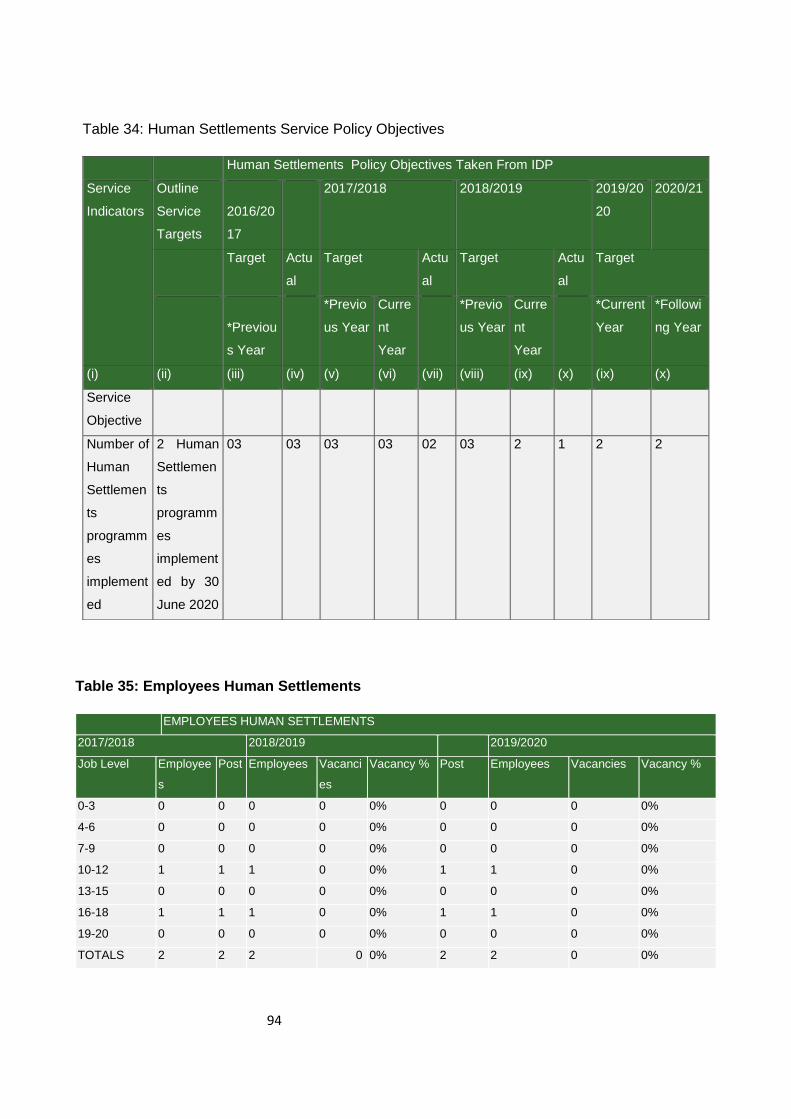
94
Table 34: Human Settlements Service Policy Objectives
Human Settlements Policy Objectives Taken From IDP
Service
Indicators
Outline
Service
Targets
2016/20
17
2017/2018 2018/2019 2019/20
20
2020/21
Target Actu
al
Target Actu
al
Target Actu
al
Target
*Previou
s Year
*Previo
us Year
Curre
nt
Year
*Previo
us Year
Curre
nt
Year
*Current
Year
*Followi
ng Year
(i) (ii) (iii) (iv) (v) (vi) (vii) (viii) (ix) (x) (ix) (x)
Service
Objective
Number of
Human
Settlemen
ts
programm
es
implement
ed
2 Human
Settlemen
ts
programm
es
implement
ed by 30
June 2020
03 03 03 03 02 03 2 1 2 2
Table 35: Employees Human Settlements
EMPLOYEES HUMAN SETTLEMENTS
2017/2018 2018/2019 2019/2020
Job Level Employee
s
Post Employees Vacanci
es
Vacancy % Post Employees Vacancies Vacancy %
0-3 0 0 0 0 0% 0 0 0 0%
4-6 0 0 0 0 0% 0 0 0 0%
7-9 0 0 0 0 0% 0 0 0 0%
10-12 1 1 1 0 0% 1 1 0 0%
13-15 0 0 0 0 0% 0 0 0 0%
16-18 1 1 1 0 0% 1 1 0 0%
19-20 0 0 0 0 0% 0 0 0 0%
TOTALS 2 2 2 0 0% 2 2 0 0%

95
3.5 FREE BASIC SERVICES AND INDIGENT SUPPORT
3.5.1 Introduction to Free Basic Services
The provision of access to free basic services is to cater for the basic needs of indigent households
is a constitutional imperative. In response to this requirement, Chris Hani District Municipality
developed an Indigent Support Policy. In the main, the policy addresses all issues related to the
sustainable provision of basic services to indigent households in communities falling under the
jurisdiction of Chris Hani District Municipality. It further sets out procedures and guidelines for the
effective subsidization of basic service charges to approved indigent households within budgetary
and intergovernmental grant guidelines. The policy also provides clarity on issues related to eligibility
for benefiting from the basket of services organized under this policy.
Table 36: Free Basic Services to Low Income Households
Free Basic Services To Low Income Households
Number of households
Total
Households earning less than R1,100 per month
Free Basic Water Free Basic Sanitation
Total Access % Access %
2016/2017 218,214 5,650 4,945 88% 4,945 88%
2017/2018 218,214 5,650 4,549 81% 4,549 81%
2018/2019 218,214 4,287 4,023 94% 3718 87%
2019/2020 218,214 4,287 4,036 94% 4021 94%
Table 37: Financial Performance on Free Basic Services Delivered
Financial Performance 2019/2020: Cost to Municipality of Free Basic Services Delivered
Services Delivered
2018/19 2019/2020
Actual Budget Adjustment Budget
Actual Variance to Budget
Water 13 213 289,93 8 745 000,00 5 987 970,00 5 987 967,23 -46%
Waste Water (Sanitation) 8 629 236,26 3 582 800,00 2 950 100,00 2 950 002,11 -21%
Total 21 842 526,19 12 327 800,00 8 938 070,00 8 937 969,34 -38%
T 3.6.4
The CHDM has a three year cycle for its indigent register which started in 2018. The register is
reviewed every year within that that period of three years. A total of 4287 applicants were approved
and included in the register as at 30 June 2020. As per CHDMs Indigent Policy, indigent households
get free basic water for the first 6 Kilolitres used and a further free sanitation service rebate for the

96
first 4 Kilolitres used which makes it 10 Kilolitres free basic services. Furthermore, indigent
households are subsidised in full for availability charges for water and sanitation.
COMPONENT B: ROADS AND TRANSPORT
3.6 ROADS
3.6.1 INTRODUCTION
The District is responsible for maintaining certain identified roads in the Inxuba Yethemba area on
an agency basis through a 3-year Service Level Agreement (Road Maintenance Contract) with the
Department of Roads & Public Works in April 2016 until 31 March 2019. This agreement was limited
to the Provincial Proclaimed Roads within the InxubaYethemba Area and a portion of Tsolwana area.
The budget allocation on average was between R25 million and R30 million per annum for the 3
financial years. The Service Level Agreement has been extended for a period of 1 year, commencing
from the 01 April 2019 to the 31 March 2020 and the budget allocated is R28 million.
The list of roads maintained through this programme in the 2018/2019 Financial Year include the following:
MR653, MR654, MR660, MR00666, MR00654, MR00653, MR00652, MR00648, MR00643,
MR00610, MR00609, DR02654, DR02653, DR02650, DR02647, DR02638, DR02635, DR02589,
DR02634, DR02571, DR02631, DR02630, DR02629, DR02559DR02622, DR02613, DR02611,
DR02602, DR02598, DR02595, DR02588, DR02570, DR02567, DR02565, DR02563, DR02558,
DR02555, DR02554, DR02553, DR02550, DR02549, DR02548, DR02547, DR02544, DR02543,
DR02540, DR02539, DR02538, DR02537, DR02536, DR02535, DR02534, DR02532, DR02531,
DR02528, DR02527, DR02526, DR02524, DR02523, DR02522, DR02515, DR02508, DR02504,
DR02503, DR02431, DR02427, DR02423, DR02422, DR02420, DR02419, DR02417, DR02416,
DR02415, DR02413, DR02412, DR02407, DR02394, DR2549, DR255, DR2558, DR2568, DR2571,
DR2572, DR2590, DR2600, DR2605, DR2606, DR2611 and DR2612.
Table 38: Roads Service Policy Objectives
Roads Service Policy Objectives as per IDP
Service
Indicator
s
Outline
Service
Targets
2017/20
18
2018/2019 2019/2020 2020/20
21
2021/22
Target Actual Target Actual Target Actual Target
*Previou
s Year
*Previo
us Year
Current
Year
*Previou
s Year
Current
Year
*Current
Year
*Followi
ng Year
(i) (ii) (iii) (iv) (v) (vi) (vii) (viii) (ix) (x) (xi) (xii)

97
Service
Objectiv
e
Number
of
kilomete
rs of
roads
maintain
ed
1603.86
kilomete
rs and
29.3
kilomete
rs of
roads
maintain
ed by 30
June
2020
2000 2259.
21
and
46.70
2148
and 30
2652 Km
Blading
and 30
Km for
regravelli
ng
1051.94
kilomete
rs
bladed
and 5
kilomete
rs
regravell
ed
2652 Km
Blading
and 30
Km for
regravelli
ng
1603.86
kilomete
rs and
29.3
kilomete
rs of
roads
maintain
ed
1476.26
kilomete
rs and
54.1
kilomete
rs of
roads
maintain
ed
2148
and 30
2148
and 30
Table 39: Employees Roads
EMPLOYEES ROADS
2017/2018 2018/2019 2019/2020
Job
Level
Employee
s
Pos
t
Employee
s
Vacancie
s
Vacanc
y %
Pos
t
Employee
s
Vacancie
s
Vacanc
y %
0-3 12 21 8 13 7 7 0 0%
4-6 9 21 4 17 3 3 0 0%
7-9 3 3 3 0 1 1 0 0%
10-12 2 4 2 2 0 0 0 0%
13-15 0 2 0 2 0 0 0 0%
16-18 0 1 0 1 0 0 0 0%
19-20 0 0 0 0 0 0 0 0%
TOTAL
S
35 52 26 26 11 11 0 0%

98
Table 40:
Roads Financial Performance
Financial Performance 2017/2018: Road Services
R'000
Details
2018/2019 Year 2019/2020
Actual Original Budget Adjustment Budget
Actual Variance to Budget
Total Operational Revenue 20 679 101,00 28 000 000,00 28 000 000,00 20 679 101,00
-0,35
Expenditure:
Employees 5 243 729 6 593 364,00 7 795 937,00 5 592 320
-0,18
Other 15 435 372 21 406 582,00 20 212 974,00 16 326 459
-0,31
Total Operational Expenditure 20 679 101,14 27 999 946,00 28 008 911,00 21 918 778,21
-0,28
Net Operational Expenditure 0,14
-54,00 8 911,00 1 239 677,21 1,00
Net expenditure to be consistent with summary T 5.1.2 in Chapter 5. Variances are calculated by dividing the difference between the Actual and Original Budget by the Actual.
T 3.7.8
3.7 TRANSPORT
3.7.1 Introduction
The District municipality is only responsible for transport planning in so far as transport is concerned.
In this regard it has developed a Master Plan which objectives are to ensure that the District meets
the demand for safe transport services and facilities. The Master plan positions the District to provide
maximum accessibility to the amenities available in its area of jurisdiction. The Master plan intends
to provide guidance on the infrastructure requirements to improve major roads and key facilities in
towns, signage to guide visitors as well as public transport services and facilities.
There are two national roads passing through the district in a north-south direction (i.e. the N10 and
N6) and two railway lines. The two railway routes link Port Elizabeth and East London to the interior.
The main east-west road corridors are along the R61 from Cradock, through Queenstown and
beyond, the R359 from Queenstown through Lady Frere and Cala to Elliot and the R56 from
Queenstown through Sterkstroom, Molteno and Steynsburg to Middelburg.
The district is currently in a progress of appointing a service provider to develop the Intergrated
Transportation Plan. Therefore ultimate goal will be a joint effort with the Local Municipalities
contributing to implementation of the developed plan in their respective areas.

99
COMPONENT C
3.8 PLANNING AND DEVELOPMENT
3.8.1 Introduction
The Constitution of the Republic of South Africa, Act 108 of 1996, Part B of Schedules 4 and 5
places the function of town planning on Local Municipalities. However, the CHDM Council is
responsible for District Planning by providing hands on support to all its Local Municipalities. In
adherence to the prescripts of the Local Government: Municipal Structures Act, 117 of 1998, the
CHDM has, through its Development Planning Unit in the Integrated Planning and Economic
Development Directorate (IPED), established the position of a Town Planner with the task of
assisting Local Municipalities in the following aspects:
Determine the efficiency and consistency of municipal spatial tools, i.e.; SDFs, GIS and
LUMS in addressing spatial matters;
Identifying and prioritizing municipalities requiring urgent assistance particularly those
without the services of a Town Planner;
Ensure alignment of CHDM SDFs and Local SDFs in terms of development, review and
implementation;
Provide technical support to Local Municipalities in terms of developing credible SDFs;
LSDF’s, Land Use and Land development applications and
To keep abreast of legislation and trends as this relates to Town and Regional Planning.
The Spatial Planning and Land Use Management Act, 2013 (SPLUMA) was assented to by the
President on the Republic of South Africa on the 05 August 2013. The Act came into effect as from
01 July 2014. SPLUMA is a National Planning Legislation which is intended to create a single and
uniform approach towards Spatial Planning and Land Use Management Systems.
In terms of Spatial Planning Land Use Management Section 34 (2) (No. 16 of 2013), Chris Hani
District Council with the agreement of the local municipalities, established Chris Hani District
Municipal Tribunal, this was resolved on the 31st March 2015 in the Council meeting. All six local
councils took a resolution to form part of the District Municipal Tribunal.
Therefore the Municipal Councils of the local municipalities below resolved to form a District
Municipal Planning Tribunal (DMPT):
Inxuba Yethemba,
Intsika Yethu,
Engcobo

100
Emalahleni &
Sakhisizwe
A District Town Planner’s Forum was also established to specifically deal with town planning/
spatial planning issues affecting the spatial planning function throughout the district. This forum is
functional and active, comprised of variety of development parastatals such as town planners/land
use administrators/ environmental officials and/or spatial planning officials from CHDM,
Government Departments namely; Housing, DEDEAT, Public Works, SANRAL, Eskom and all
development departments within the Province and all its local Municipalities.
3.8.2 Spatial Planning
3.8.2.1 Preparation and approval process of a District Spatial Development Framework
In terms of chapter 5 section 20(1) (2) of the enacted Spatial Planning and Land Use Management
Act 16 of 2013, Municipal Spatial Development Framework (SDF) must be prepared as part of a
Municipality’s IDP in accordance with the provisions of the Municipal Systems Act. CHDM has
reviewed its SDF for the next 5 years in line with the directives of the National Spatial Development
Plan (NSDP), National Development Plan and the Provincial Spatial Development Plan (PSDP).
The review was in consultation with all relevant stakeholders.
This reviewed SDF has considered the Spatial Planning and Land use Management Act, 2013
norms and standards, inter alia, changes in local municipality boundaries.
3.8.2.2 Land use management
Whilst the CHDM does not have a direct role to play in terms of land use management, Chapter 6
Section 34(1) & (2) of SPLUMA Act influence the district to play a role in Land use management
and as such the Act requires the Formation of Planning Tribunals to process Land Use applications
through a District municipal planning tribunal. Land use and land development applications are
processed in terms of SPLUMA. Tribunal is scheduled to sits quarterly in terms of the formed
Terms of Reference.

101
Table 41: SPLUMA LAND USE APPLICATION REGISTER
SPLUMA LAND USE APPLICATION REGISTER
2017/2018 2018/2019 2019/2020
Applications Submitted 13 0 7
Special Tribunal 0 3 1
Approved 5 2 4
Deferred Application 7 1 3
Not Approved 0 0 0
3.8.2.3 Small Town Revitalisation
The Small Towns Development approach looks at the redesigning of town layouts, reviving urban
planning and environmental planning with the aim of ensuring the potential of the space in and
around small towns is fully realised.
The concept of Small towns’ revitalization also proposes any future developments the municipality
approves or endorsed as part of social responsibility from the developers. This must also
accommodate the hawkers, malls, ranks, infrastructure development, paving, landscaping,
greening, street naming and development of Local Municipalities.
Chris Hani has developed a Regional Economic Development Strategy highlighting the need to
identify and prioritise small towns along identified economic corridors that have the potential to
participate actively in the value chain of identified economic sectors, and to implement small town
development initiatives.
Cofimvaba and Engcobo were identified as the towns with the potential to grow as it is one of the
main service centres on the R61 east corridor. This culminated in CHDM and the IntsikaYethu
Local Municipality, embarking on the Small-Town Development Plan for Cofimvaba and Tsomo by
formalising and upgrading the informal trading within town Engcobo and CHDM also entered into
a Service Level Agreement to revitalise the town with the assistance of SANRAL.
The Small-Town Revitalisation concept is aimed at creating a development plan with a 30 year
future outlook of its growth potential, as well as creating a plan that seeks to realise that potential.

102
The plan does not place the district or the IntsikaYethu Local Municipality nor Engcobo Local
Municipality as the sole role players in realising developmental objectives of Engcobo, Cofimvaba
and Tsomo towns, but rather looks at creating plans to be used as a spatial guiding foundation
that will assist stakeholders/investors in defining their roles in the overall growth/development of
these towns. Tarkastad Small Town Revitalisation Strategy was also developed Tarkastad is
situated along the R61, 81km east of Cradock, 64km west of Queenstown and approximately
365km from Port Elizabeth and 257km from East London.
The town is easily accessible and linked to surrounding administrative and urban nodes via the
R61, R344 (Fort Beaufort) and R344 (Sterkstroom). Residential areas include Zola and Ivanliew
with an approximate population of 6038 or 1877 households.
The urban area is approximately 260ha in extent and is the secondary administrative centre for
the Enoch Mgijima District’s, that includes the towns of Tarkastad and Hofmeyr, large rural
commercial farming areas, dominated by the hunting industry, and various rural settlements to the
east and south. The implementation is intended to create a holistic approach to the re-
development and revitalisation of Tarkastad, thereby unleashing development potential, attracting
investment and removing blockages inherited from previous planning methods.
The Small Town Revitalisation Strategy (STRS) is a joint venture initiative by CHDM and Enoch
Mgijima Municipality. This project is seen as an important tool to support adequate planning and
service delivery and infrastructure needed in Tarkastad.
The following reflect the aims behind Small Town Development:
Strengthen the retail, business, industrial and employment role of the town centres;
To develop the community, civic and educational roles of the two centres as key attributes
of vibrant town centres;
Build on the unique function of each of the sub-centres serviced by these major centres as
a defining characteristic of these areas and a contribution to the Corridor Development
Initiative in the district;
Improve connections between the sub-centres and encourage activities adjoining access
routes between the major centres and the sub-centres to create a more physically
contiguous and integrated town centre service area;
Consolidate the individual roles of the centres so that they can better serve the sub-centres,
and act as destinations for sub-centre communities by providing an extensive and unique
range of retail, community and leisure opportunities;

103
Encourage new housing in and around the town centres that increases the range of
housing choices;
Create an attractive and distinctive built environment that supports the range of activities
of the town centres; and
Create a positive urban image for each part of the town centres through the design of
buildings and spaces.
The following highlights are worth reporting:
CHDM has implemented paving programmes as part of small-town revitalisation in the following
areas:
Middelburg in InxubaYethemba Local Municipality
Cradock in Inxuba Yethemba Local Municipality
Tarkastad in Enoch Mgijima Municipality
3.8.3 Planning
Table 42: Planning Service Policy Objectives
Planning Service Policy Objectives as per IDP
Service
Indicato
rs
Outline
Service
Targets
2017/2
018
2018/2019 2019/2020 2020/20
21
2021//22
Target Actu
al
Target Actu
al
Target Actual Target
*Previo
us Year
*Previ
ous
Year
Curr
ent
Yea
r
*Previ
ous
Year
Curre
nt
Year
*Current
Year
*Following Year
(i) (ii) (iii) (iv) (v) (vi) (vii) (viii) (ix) (x) (xi) (xii)
Service
Objectiv
e
Number
of
spatial
plannin
g
progra
03
Spatial
planning
program
mes
impleme
1 0 1 3 3
1 1 1 3 3

104
mmes
implem
ented
as per
SPLUM
A
nted as
per
SPLUMA
by 30
June
2020
Number
of small
town
revitaliz
ation
progra
mmes
support
ed
03 Small
Town
Revitaliz
ation
program
mes
supporte
d by 30
June
2020
3 3 3 3 2 3 1 1 3 3
Table 43: Employees Planning Services
PLANNING SERVICES
2017/ 2018 2018 2019 2019/2020
Job
Level
Employees Post Employees Vacancies Vacancy
%
Post Employees Vacancies Vacancy %
0-3 0 0 0 0 0% 0 0 0 0%
4-6 0 0 0 0 0% 0 0 0 0%
7-9 0 0 0 0 0% 0 0 0 0%
10-12 0 0 0 0 0% 0 0 0 0%
13-15 2 2 2 0 0% 2 2 0 0%
16-18 2 2 1 1 50% 1 1 1 0%
19-20 0 0 0 0 0% 0 0 0 0%
TOTALS 3 4 4 0 0% 3 3 0 0%

105
Table 44: Planning Services Financial Performance
Financial Performance Year 0: Planning Services
R'000
Details
2018/2019 Year 2019/2020
Actual Original Budget
Adjustment Budget
Actual Variance to Budget
Total Operational Revenue 0 - 0%
Expenditure:
Employees 2 880 449,91 3 489 069,00 3 189 276,00 3 364 729,91 -4%
Repairs and Maintenance 0 100 000,00 573783 0%
Other 8 964 747,95 15 283 203,00 12 142 219,00 2 924 456,99 0%
Total Operational Expenditure 11 845 197,86
18 872 272,00 15 331 495,00 6 862 970,33 -175%
Net Operational Expenditure 11 845 197,86 18 872 272,00 15 331 495,00 6 862 970,33 -175%
Net expenditure to be consistent with summary T 5.1.2 in Chapter 5. Variances are calculated by dividing the difference between the Actual and Original Budget by the Actual.
T 3.10.5
3.9 LOCAL ECONOMIC DEVELOPMENT
3.9.1 INTRODUCTION
During the 2018/19 Financial Year, Chris Hani District Municipality (CHDM) started the process of
reviewing her Regional Economic Development Strategy (CHREDS). The review of the Chris Hani
Regional Economic Development Strategy was built on the success and gaps identified during the
previous work (CRED Strategy reviewed in 2014), adding new insights and understanding that has
resulted from discussions with key stakeholders, business representatives and partners through
structures organised by the IPED Directorate of Chris Hani District Municipality. Our economic
entities, namely the Chris Hani Development Agency (CHDA) and the Co-operative Development
Centre (CHCDC) play a significant role in the economic development and growth of our district.
Economic Sector departments, particularly the former Department of Rural Development and
Agrarian Reform (DRDAR) and the Department of Rural Development and Land Reform (DRDLR),
as well as the Department of Economic Development, Environmental Affairs and Tourism
(DEDEAT) played a major role in shaping the rural and broader economic development of the
region. DRDAR and DRDLR are in the process of merging, in line with the national developments,
to form the Department of Agriculture, Land Reform and Rural Development (DALRRD). CHDM
can never be left behind in these attempts that seek to strengthen radical socio- economic

106
transformation and address the national land question (Land reform to ensure that land is returned
to its rightful ownership).
The strategy review process has gone through a number of different versions, each of which took
into consideration the detailed inputs made by key stakeholders, including those of the CHDM
councillors and officials.
3.9.2 Chris Hani Development Agenda And Corridor Development Approach
CHREDS deals with economic development as a theme that cuts across all sectors in Chris Hani
District area. Whilst administrative boundaries may be tightly drawn in terms of local municipalities
that fall under the district, partnerships and trade across boundaries are supported.
While the Development Agenda is based on the potential of each local municipality, the CHREDS
is focused more on creating an enabling environment by developing programmes and making
available resources to support projects that, in turn, are identified by local municipalities, private
sector and entrepreneurs.
Chris Hani District Municipality is in a competitive position in a geographic sense. Its economic
capital, Komani lies at the geographical heart of region, and is a gateway between the various
powerhouses such as East London, Port Elizabeth, Bloemfontein, Johannesburg, Cape Town and
Pretoria, and in an excellent position for business. It was for this reason that Komani, in the Enoch
Mgijima Municipality, was identified as the economic hub of the district.
The four economic corridors, as defined by stakeholders, cut across different local municipalities
and are as follows:
Corridor 1: Komani Cofimvaba TsomoNgcobo
Corridor 2: Komani Cacadu Cala Ekhowa Indwe Dordrecht
Corridor 3: Komani TarkastadHofmyr Cradock Middelburg
Corridor 4: Komani SterkstroomMolteno Middelburg

107
3.9.2.1 Key Performance Highlights
Based on the Development Agenda and the economic potential identified in each corridor, the
following programmes were implemented to enhance the economic development of the CHDM:
i) Forestry Development Programmes
Forestry development in the district mainly focused on Nursery, Charcoal, Sawmilling,
Rehabilitation of Woodlots/Plantations and Agro-Forestry.
Tree Nursery Employment and Beneficiation
Tree nursery involves growing indigenous and exotic trees (Pine and Gum) driven as a commercial
enterprise. The concept is based at supporting volumes of tree production by supplying seedlings
and resources for the public and private sector. Vusisizwe Tree Nursery situated in Qumanco along
R61 is one of the projects that benefited from this programme.
The project started in 2011 beneficiating three local municipalities viz Intsika Yethu, Engcobo and
Sakhisizwe. Each local municipality provided five beneficiaries which sum up to 15 beneficiaries:
CURRENT EMPLOYMENT STATUS
Beneficiaries Four (1 Sakhisizwe, 1 Engcobo, 2 Intsika Yethu)
Project officer One (1)
Security Two (1 Day, 1 Night)
Temporary labour Three (Required when necessary)
Key operations included manual propagation of indigenous and alien plants, Manual and chemical
weeding, Yard Cleaning and maintenance, River water carting and purification.
Thus far the support to this project amounted to R 1, 000, 000.00 (One million rands) which
is inclusive of repairing infrastructure, project operations, maintenance and marketing.
Project managed to secure an off-take agreement with Hansmeresky for two consecutive
years now.

108
They also managed to have a working relationship with Amalinda nursery as and when they
bulk indigenous seedlings
Beneficiaries were paid monthly at a rate of R 90.00 per day through CHDM EPWP fund.
2.) Charcoal Employment And Beneficiation
The Charcoal projects named Egoso and Cala Pass charcoal primary cooperative were initiated to
assist in reducing alien species that covered most of our Agricultural and Forestry land. The project
was also used to fight poverty within CHDM communities by converting the alien species (Black
wattle) into charcoal production.
The project started in 2011 beneficiating Engcobo and Sakhizwe Local Municipalities. During the
period under review sixteen (16) beneficiaries were employed in Engcobo Local Municipality with
two securities manning the site day and night.
Key Project Highlights :
Both sites are fully fenced with operational equipment;
Both sites are legally allowed to operate;
Water tanks installed at Egoso;
Three toilets constructed at Egoso;
Borehole installed at Egoso.
A partnership has been secured with Ayango biodiesel and is to start operating in the
2019/20 financial year
Key operations included Harvesting of wood, filling of kilns with wood, burning and cooling of burnt
charcoal, packaging for sales, manual and chemical weeding, yard cleaning and maintenance.
Thus far the support to this project amounted to R 1, 000, 000.00 (One million rands.) which is
inclusive of repairing infrastructure, project operations, maintenance and marketing.
Sawmill Project
Sawmilling is about timber harvesting from nearby government plantations, cut into logs and
being graded accordng to the required standards. Different produce is being processed from
pair lines, rafters, and wooden chips for mulching
CHDM provides support through procuring protective clothing, machinery and equipment
and trainings required.
Rehabilitation Project

109
Community woodlot rehabilitation is about reshaping the jungle into a manageable
plantation, providing life for commercialization.
Delvinne Trust (Sakhisizwe) and Goboti (Engcobo) were provided with the support of
fencing community woodlots.
iii) Agricultural Development Programmes:
Various initiatives embarked on under this programme included Irrigation Schemes, Dryland Crop
Production including Rural Agro-Finance Initiative (RAFI) and Livestock Development
Programmes.
Irrigation Schemes :
CHDM in collaboration with the DRDAR, DRDLR, CHDA, CHCDC and Eastern Cape Rural
Development Agency (ECRDA), continued their effort to resuscitate the Irrigation Schemes
in Chris Hani District Municipality. These institutions constitute the Task Team that
spearhead the operations in the Irrigation schemes.
The District Municipality and the DRDAR assisted the farmers with production inputs and
remuneration of core staff.
In order to ensure the sustainability of the Irrigation Schemes DRDAR and CHDM through
CHDA facilitated partnership arrangements for Ncorha/Qhumanco, Shiloh and Qamata
Irrigation Schemes.
CHDA was also assigned with further development of the Schemes and investment
promotion.
Update on the programme implemented at Section 1a and 1b at Qamata Irrigation Scheme
Section 1a, (Lanti), accepted the government led initiative to change the irrigation method from
flood to centre pivots. Installation of the required irrigation infrastructure has been completed.
Electrical connection by ESKOM is still outstanding though.
Humansdorp Coop and the Section 1a community co-op have established an operating company
where the former will own 40% shares in it while the communities retain the majority shareholding
of 60%. Section 1b, (Mtyhintyini), has rejected the initiative and DRDAR has stopped the service
provider.
There are plans to introduce the irrigation system upgrade initiative to Sections 1c and 2, but
thorough consultation is still to be done to determine acceptance thereof by the target community.

110
Humansdorp Co-op is still interested to partner with the communities for running the farming
business.
Introduction of the programme to other sections will take note of the lessons learnt from Section 1b.
Vineyard Project at Shiloh Irrigation Scheme
The yield obtained from the recent harvest early this year was 28.5 tons, which is expected to
translate to 25 000 bottles of INKOSI wine. At the current retail price of R50 per bottle, this will
generate a revenue of R1 250 000.00. Funding application to Anglo Gold Ashanti of R17 million for
the Winery establishment (R12 million) and 10ha vineyard expansion (R5 million) has been made.
Anglo Gold has visited the project and is busy looking at the application.Another funding application
submitted to Hortfin for R25 million for further expansion of the vineyard establishment by 20ha.
Application has passed first round of assessment by Hortfin investment committee.
Piggery Production in Bilatye Irrigation Scheme
100 pigs were sold to the local market. The project is now busy raising second cycle of pigs due to
be sold in August 2019. CHDA is busy with identifying more marketing channels to ensure that the
project gets the highest prices for the pigs.
Plans are in place by DRDLR to further support the project with R1 million and CHDA will be
advising on procurement of piglets and feed and facilitation of market linkages.
Qamata Mechanization Centre
DRDAR transferred nine (9) tractors and equipment to the centre and approved an operational plan
for the centre to generate more funding. SLA between DRDAR and CHDA is in the process of being
finalized which looks at funding of the centre during the initial stages. CHDA has started with the
readiness of the equipment to prepare for the planting season, including:
Service
Recruitment of operators
Renovation of storage shed
The centre has benefited 863 farmers and in that process managed to generate R 940 000
revenue.The centre has affordable options for farmers to pay for services according to the
affordability of the farmer.

111
Ncorha/Qumanco Irrigation Scheme Report
Communities have accepted the establishment of the Trust that will represent all beneficiaries of
Ncora from 10 villages. CHDA appointed a legal expert to facilitate this process and on 12 July
2019, there will be community meetings from each village, to be led by the political representatives,
to nominate community representatives to the Trust.
Each village will nominate 1 person, therefore there will be 10 members representing communities
in the Trust. Government will further appoint additional 5 members to advise and build capacity to
the Trust. The trust will have 15 members in total.
After the Trust has been established, capacity building programme will be done to capacitate the
Trust members to understand their roles and how to account to the beneficiaries
CHDM approved a budget of R3 million in the 2018/19 financial year for the irrigation schemes and
Mechanization Centre. This money was since transferred to CHDA, through quarterly transfers. In
the 2019/20 Financial Year, a budget of R5 million has been put aside to cater for Irrigation
schemes, including small irrigation schemes.
iv) DRYLAND CROP PRODUCTION
CHDM Rural Agro-Finance Initiative (RAFI) Commercial Pilot
The Chris Hani District Municipality committed 500ha for the commercial pilot of the RAFI
programme. The pilot was done into two (2) Local municipalities, namely, Engcobo ad Intsika Yethu.
The total planted during the commercial pilot was 415 hectares: Maize 350ha & Soya 65ha.
After land preparations some areas proved to be very dry, which made it difficult to plant the full
500ha planned. The average rainfall was 900mm/year, the expected yield for the maize was
5,5tons/ha from a target of 6 tons/ha, Soya expected was 2.5 tons/ha from a target of 3 tons/ha
due to dry season experienced.
Harvesting has commenced in all three pilots. The harvesting is done manually due to the following
reason:
The areas are less than 50 ha each, the cost of getting a combine to each area will be high.
Due to the late planting reference day length, the stems are short meaning that a combine
wheat table will have difficulty in cutting low enough.

112
Average of ten (10) labour per s/hectare have been employed
The storage has been secured in all three sites.
Full Scale Commercialisation (40000ha)
Planning of 40000ha hectares for the full commercialization is progressing very well. Consultation
with Kingdoms to get buy-in of the program has been completed and consultation with the traditional
councils is in progress
Livestock Development Programmes
Partnership with National Wool Growers Association
The municipality transferred funds to Zulukama Trust to ensure that they buy material and
pay labourer for the work. Through this programme there were short time jobs created.
Between 5 and 6 casual workers were employed in each village and the total of 70 jobs
were created.
The municipality transferred funds to National Wool Growers Association (NWGA) for the
purchase of 100 rams of Dohne Rams as per the signed Memorandum of Agreement
(MOA). The rams were purchased and delivered to the farmers. They were officially handed-
over during Chris Hani Month at the Wool Growers Congress by the Executive Mayor at
Mbenge village in Sakhisizwe Municipality.
Animal Dosing and Innoculation
Animal Dosing and Innoculation which is implemented through CHDA has catered for 24 job
opportunities, of which 8 are unemployed Agricultural Graduates within Chris Hani Region.
There are five (5) local municipalities which benefited from the programme. Inxuba Yethemba LM
did not benefit as the project was mainly targeted for the communal farmers.
Custom Feeding Facilities
The Department of Rural Development and Agrarian Reform (DRDAR) and the Chris Hani District
Municipality (CHDM) are spearheading Livestock production in partnership with NAMC. Through
this programme Kamastone Custom Feeding Facility was assisted with the Feed storage container.

113
Continuous technical support was also provided to all the seven existing custom feedlots in the
District.
v.) TOURISM DEVELOPMENT PROGRAMME
CHDM undertook various Tourism Development Programmes namely:
Local Tourism Organization (LTO) support and Destination Marketing amongst others :
LTO’s with tourism stakeholders in the entire district benefitted from R 900 000 set aside for
their operations
As part of destination marketing, Tourism Indaba was attended where destination branding
tools were showcased
Discussions with National Department of Tourism to include Chris Hani Liberation Heritage
Route are in progress
On Arts and Craft support, Inkcubeko Fashion Show was successfully hosted during
Heritage and Tourism Month 2018 in partnership with Eastern Cape Provincial Arts and
Culture Council
vi) HERITAGE DEVELOPMENT PROGRAMME
The following initiatives were embarked on:
Successful implementation of the 2019 Chris Hani Month programme
Successfully hosted the annual Chris Hani Month Marathon which continues to attract local
and national athletes
Successful implementation of 2018 Heritage and Tourism Month programmes which
included events such Horse Racing, Chris Hani Choral Music Association District
Championships and Chris Hani Jazz Festival amongst others
Sabalele Development Centre supported with R800 000 as an annual operational funding
Nine remains of people who were PAC members were executed between 1960 and 1990
were handed over at Intsika Yethu. Five of the remains are already laid to rest.
vii) ENTERPRISE DEVELOPMENT PROGRAMME
The Chris Hani District Municipality, as part of its local economic development agenda,
received applicants for funding from all Local Municipalities in 2019/20

114
A total of 420 applications were received. Due to budget cuts, no applications were
processed. Subject to funding availability, they will be processed in the 2020/21 Financial
Year
The Memorandum of Agreement with the Eastern Cape Development Corporation was
signed and a taring programme for the Enterprise Development programme was agreed
to. The first training, the Empretec programme, was carried out in Conjunction with SEDA
in February 2020. 7 previously funded Enterprises took part.
Due to the COVID – 19 Pandemic, the rest of the training programme has been deferred and will
be resumed once the Pandmeic is under Control.
The Contractor Development Programme was implemented in the last financial year. The
contractor Development Committee allocated sub-contractors to projects based on the projects
requirements. To date the allocations are as follows:
INTSIKA YETHU LM GASINI B (VUYISILE MINI) PROJECT
COMPANY
NAME
CONTRACTOR
GRADE(S)
LOCAL MUNICIPALITY Awarded Amount
Kwandalane
Trading CC
1ME PE, 1SH PE, 1GB
PE, 3CE PE, 1SG PE,
1SQ PE
Intsika Yethu LM R 1 244 317,25
Lisocinga
Contractors
3CE PE, 1GB PE, 1SQ
PE
Intsika Yethu LM R 888 557.19
ENGCOBO LM WATER TREATMENT WORKS PROJECT
COMPANY NAME CONTRACTOR
GRADE(S)
LOCAL
MUNICIPALITY
Awarded Amount
Banqo Trading CC 1GB PE, 3CE PE Engcobo LM
Coronado Trading 5CE PE, 1GB PE Engcobo LM R 3 600 000.00

115
DPKL Trading
Enterprise
5CE PE, 1GB PE Engcobo LM R 3 300 000.00
TPSK Builders 4GB PE Engcobo LM
Calition Trading 5CE PE, 3SQ PE, 2ME
PE
Sakhisizwe LM
Zamankosi
Development (PTY)
LTD
4CE Sakhisizwe LM
INTSIKA YETHU LM TSOMO TREATMENT WORKS PROJECT
COMPANY NAME CONTRACTOR GRADE(S) Local Municipality
Simbolekwa Trading 2CE PE, 1GB PE, 1SK PE Instika Yethu LM
INTSIKA YETHU LM KWAMZOLA MATHAFENI-NCORA FLATS PROJECT
COMPANY
NAME
CONTACT
NUMBER
CONTACT
PERSON
CONTRACTOR
GRADE(S)
Awarded Amount
Makhwemnte
Trading cc
072 199 2468 Siyamdumisa
Gwentshe
3CE PE, 1GB
PE
R 1 896 866.85
EMALAHLENI LM UMHLANGA BULK SUPPLY PROJECT
COMPANY NAME CONTRACTOR GRADE(S) LOCAL MUNICIPALITY

116
N. N. W Sibhoma
Construction & Plant Hire
5GB, 3CE Emalahleni LM
Pish Construction 2GB, 3CE Emalahleni LM
Victor Ticket 771 5CE PE, 1SO PE, 4GB PE,
4SQ PE
Emalahleni LM
Imvusa Trading 1628cc 1EP PE, 4CE PE, 1GB PE
1SQ PE
Enoch Mgijima LM
MMP Contractors 6CE PE Enoch Mgijima LM
CONSTRUCTION OF CHDM VILLAGE OFFICES PARK- PHASE 1 (District wide)
COMPANY NAME CONTRACTOR GRADE(S)
Fenako's Trading Enterprise 3EB PE
Khumbeni Construction and Trading 4GB PE, 4CE PE, 1SK PE
Rubbie Construction cc 3CE PE
Ruby and Mary Construction 3CE
Fani's & Hani Civil Engineering and
General
3GB PE, 1CE PE, 1SQ PE
Sibhozo Building Construction 4CE PE, 3GB PE
Vokuhle Trading (Pty) Ltd 1GB PE, 3CE PE, 1SK PE

117
Percevierence and Pray Prevails Trading
cc
4CE PE, 4GB PE, 1ME PE, 3SQ PE
Mandila Trading 3CE PE, 2GB PE
AMS Rhudulu Projects (PTY) LTD 4CE, 1GB, 1SK
EMALAHLENI LM CONSTRUCTION OF GABIONS AT KHAVALA VILLAGE
COMPANY NAME CONTRACTOR GRADE(S)
Amaqwathe Contsruction (Pty) Ltd 1CE PE
Anetha Trading Enterprise 1CE PE
Calvin and Major Trading and Services 1CE PE, 2GB PE
Buyilumkile General Projects (Pty) Ltd 1SQ PE, 1CE PE, 1SK PE
INSTIKA YETHU ELECTRICAL GATE AT QHUMANCO SANITATION RESOURCE CENTRE
COMPANY NAME CONTRACTOR GRADE(S)
Kozozo Trading Enterprise 1GB PE, 1CE PE
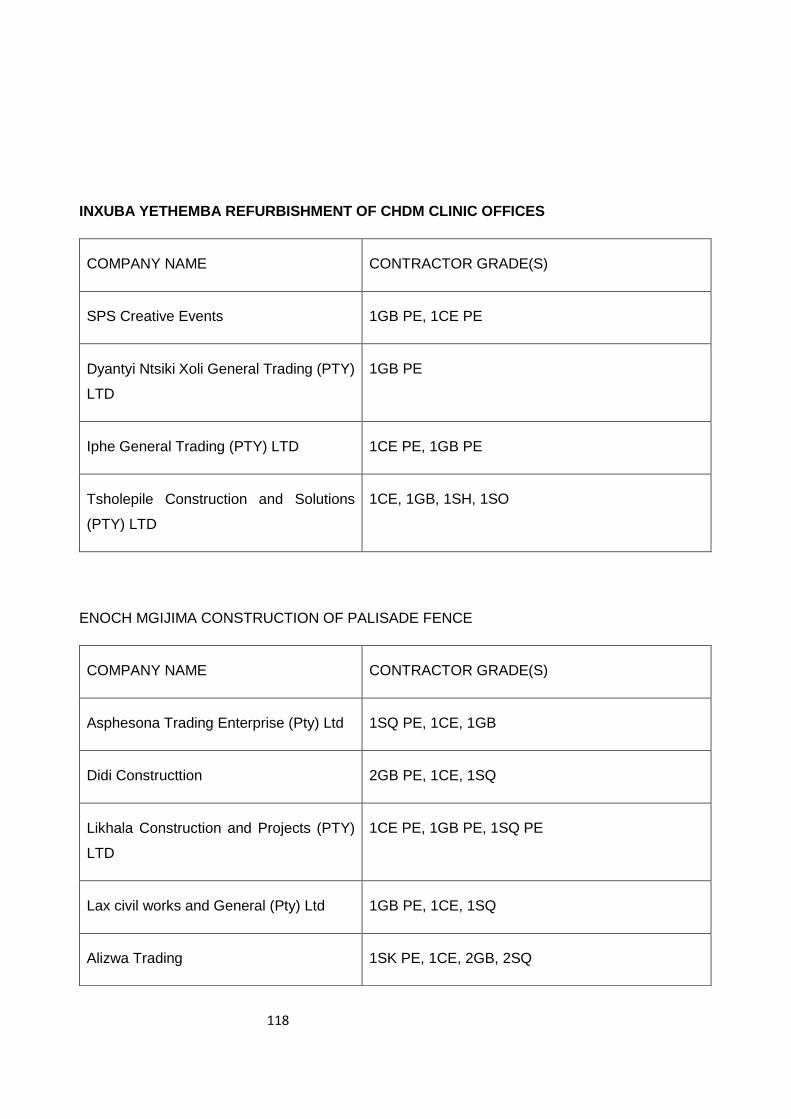
118
INXUBA YETHEMBA REFURBISHMENT OF CHDM CLINIC OFFICES
COMPANY NAME CONTRACTOR GRADE(S)
SPS Creative Events 1GB PE, 1CE PE
Dyantyi Ntsiki Xoli General Trading (PTY)
LTD
1GB PE
Iphe General Trading (PTY) LTD 1CE PE, 1GB PE
Tsholepile Construction and Solutions
(PTY) LTD
1CE, 1GB, 1SH, 1SO
ENOCH MGIJIMA CONSTRUCTION OF PALISADE FENCE
COMPANY NAME CONTRACTOR GRADE(S)
Asphesona Trading Enterprise (Pty) Ltd 1SQ PE, 1CE, 1GB
Didi Constructtion 2GB PE, 1CE, 1SQ
Likhala Construction and Projects (PTY)
LTD
1CE PE, 1GB PE, 1SQ PE
Lax civil works and General (Pty) Ltd 1GB PE, 1CE, 1SQ
Alizwa Trading 1SK PE, 1CE, 2GB, 2SQ

119
Some of the challenges identified include:
1) Local Contractor Forums seeking to influence appointment of contractors for sub-contracting in
certain projects. In some instances there have been threats to stop some projects. To resolve this,
the Committee, led by the Director IPED have engaged these forums to address these concerns.
2). Appointed sub-contractors not having financial resources to carry out the projects. Cessions
with the main contractor have been developed to overcome this challenge
The District continues to support the Chris Hani District Business Forum through payment
of office rentals, telephone and another critical requirement. Funds are paid directly to
service providers on behalf of the forum.
Table 45: LED Service Policy Objectives
LED Service Policy Objectives as per IDP
Service
Indicators
Outline
Service
Targets
2017/2018 2018/2019 2019/2020 2020/20
21
2021/20
22
Targ
et
Actu
al Target
Actu
al
Target
Actu
al
*Previo
us Year
*Curre
nt
Year
*Previo
us Year
*Curre
nt
Year
*Current
Year
*Followi
ng Year
(i) (ii) (iii) (iv) (v) (vi) (vii) (viii) (ix) (x) (xi) (xii)
Service
Objective
Number of
Agricultura
l
programm
es
implement
ed
4
Agricultura
l
programm
es
implement
ed by 30
June 2020
5 4 5 5 5 5 4 3 4 4
Number of
SMME
programm
es
1 SMME
programm
es
Implement
3 2 3 3 3 3 1 1 3 3

120
Implement
ed as per
concept
document
ed as per
concept
document
by 30 June
2020
% of
budget
spent on
local
businesse
s as per
Preferenti
al
Procurem
ent
regulation
monitored
30% of
budget
spent on
local
businesse
s per
preferentia
l
procureme
nt
monitored
by 30 June
2020
30% 30% 30% 30% 30% 30% 30% 30% 30% 30%
Number of
tourism
programm
es
implement
ed
6 tourism
programm
es
implement
ed by 30
June 2020
3 2 3 3 2 6 6 3 6 6
Number of
Forestry
programm
es
implement
ed
02
Forestry
Programm
es
implement
ed by 30
June 2020
(1. Tree
Nursery 2.
Afforestati
on 3.
Charcoal)
3 3 3 3 2 3 2 2 3 3

121
Table 46: Employees Local Economic Development
LOCAL ECONOMIC DEVELOPMENT
2017/2018 2018/2019 2019/2020
Job
Level
Employees Post Employees Vacancies
Vacancy
% Post Employees Vacancies
Vacancy
%
0-3 0 0 0 0 0% 0 0 0 0%
4-6 0 0 0 0 0% 0 0 0 0%
7-9 0 0 0 0 0% 0 0 0 0%
10-12 6 7 6 1 11% 7 7 0 0%
13-15 1 2 1 1 50% 1 1 0 0%
16-18 1 1 1 0 0% 1 1 0 0%
19-20 0 0 0 0 0% 0 0 0 0%
TOTALS 8 10 8 2 10% 9 9 0 0%
Table 47: Financial Performance Year 0: Local Economic Development Services
Financial Performance Year 0: Local Economic Development Services
R'000
Details
Year 2018/19 Year 2019/2020
Actual Original Budget Adjustment Budget
Actual Variance to Budget
Total Operational Revenue -2 084 000,00 -28 600 832,00 1 182 747,00 276%
Expenditure:
Employees 3 203 765,94 6 935 415,00 6 414 795,00 3 378 312,40 -105%
Repairs and Maintenance - 1 537 227,00 980 260,00 - -
Other 342 634,87 44 938 626,00 39 453 124,00 156 705,14 -28577%
Total Operational Expenditure 3 546 400,81 53 411 268,00 46 848 179,00 3 535 017,54 -1411%
Net Operational Expenditure 3 546 400,81 55 495 268,00 75 449 011,00 2 352 270,54 -2259%
Net expenditure to be consistent with summary T 5.1.2 in Chapter 5. Variances are calculated by dividing the difference between the Actual and Original Budget by the Actual. T 3.11.9
3.9.3 CHDM Economic Development Agency
The Chris Hani Development Agency’s (CHDA) strategic framework is premised on the
understanding that its role is to promote, support and facilitate economic development in the Chris

122
Hani District Municipality. This will be achieved by improving factors of production that will lead to
value adding activities with spin - offs for small and medium enterprises.
The focus areas of the CHDA are:
The development of irrigation schemes
The development of the fruit industry (stone fruit and citrus)
Livestock production
Value addition and marketing
The Chris Hani Development Agency’s (CHDA’s) Strategic Framework maps out specific and
general strategic goals, objectives and issues relating to its establishment and effective
operationalization. The strategic goals are:
Proficient and Viable Institution
Viable and Sustainable Clusters and
Partnership building and stakeholder relations.
The core business of the Agency is the delivery of projects that is aimed at contributing to the
economic transformation of the District. This is achieved through leveraging funding from the parent
municipality, provincial and national departments and other institutions in development finance
space.
CHDA has identified strategic focus areas such as agriculture and agro processing linked to
infrastructure and mechanisation support, skills development, Investment and Enterprise
development. To maximize the economic benefit to rural communities in the Chris Hani District,
programmes have to be financially viable and address both the economic and development needs
of the District.
The main focus area is facilitation and implementation of programmes that ensure the
operationalization of the four main Irrigation Schemes, increased production of high value crops,
fruit, vegetables and new forest plantations. Linked to this is the dedicated focus towards the
development of support infrastructure that includes storage facilities, roads, fencing, infield irrigation
and facilities to support value addition. Apart from the above, the Agency operates mechanisation
centres whose intention is to reduce costs of mechanisation and provision of excellent
mechanisation services to the farming community.
Future sustainability of the Agency depends on its ability to position itself as an economic
development catalyst and coordinator for the realisation of the economic growth of the District

123
municipality. In pursuit of this the Agency has to adopt the following key considerations in its
planning and operation framework:
innovative fundraising and co-funding initiatives;
continuous development of project pipeline by identifying new project; and
own revenue generation initiatives

124
COMPONENT D: COMMUNITY SERVICES
3.10 CHILD CARE, AGED CARE, SOCIAL PROGRAMMES
3.10.1 Introduction To Special Programmes
According to the South African Constitution (1996), there is commitment to the attainment of
social justice and the improvement of quality of life for everyone. The founding values of the
society to be ‘human dignity, the achievement of equality and the advancement of human rights
and freedom are also declared in the constitution.” The Bill of Rights (Chapter 2 of the
Constitution) highlights equality of all persons. It specifically mentions the right to equality and
non-discrimination against persons on the grounds of disability, gender, race, age and religion.
These rights and values provide a solid rationale and basis for Local Government to prioritise
the needs and challenges of the marginalised and designated groups and to act within their core
mandate.
Municipalities play a critical role in ensuring an effective and well-co-ordinated response to the
challenges faced by the society especially with regard to addressing the challenges facing the
designated groups. These groups include People with Disabilities; Women, Children, Elderly
and Youth who are being unfairly discriminated against in the broader society, workplace and
access to basic services. The creation of barriers such as fear and stereotypes have resulted in
the marginalisation of designated groups within the society. In line with the developmental
agenda of the South African government, municipalities have a responsibility to develop and
implement policies and strategies that are appropriate to the specific needs of the entire society
Key programme highlights:
Executive Mayors Excellence Awards
The Chris Hani District Municipality (CHDM) in partnership with its Local Municipalities,
Department Education, Department of Sport, Recreation, Arts and Culture and District Sport
Confederation embarked on back to school support programme and sport recognition initiative
as part of its efforts to promote the provision of quality education and sport development within
the district. This was done as part of the commitment in providing support to education and sport
development.
The programme was implemented through recognition of best performing schools in one senior
secondary/ high school per Local Municipality. The sport recognition awarded those athletes
who achieved in the national and international participation.

125
Top Performing Schools & Percentages For 2019
CHDM resolved to support Six (6) best performing schools from previously disadvantaged
backgrounds, one senior secondary/ high school from each local municipality. The schools have
excelled in the Matric results of the 2019 Academic Year.
NO. NAME OF SCHOOL AREA PERCENTAGE
1. J A Calata High School Inxuba Yethemba 98.5 %
2. Arthur Mfebe High School Intsika Yethu 97.7%
3. Free Mantle High School Emalahleni 96.6 %
4. Nyanga High School Engcobo 95.5%
5. L. Jentile High School Sakhisizwe 95.2%
6. Bulelani Sen. Sec. School Enoch Mgijima 90.2 %
Best Performed In Environmental Management
CHDM executive Mayor recognised the best performance to a school that excelled in the Enviro-
awards Competition. Department of Economic Development, Environmental Affairs and Tourism
(DEDEAT) has a programme that is focusing on schools, called Enviro-awards Competition.
School Name Local Municipality Accolade
Rainbow Preparatory
Academy
Intsika Yethu LM Best performance to a
school that excelled in the
Enviro-awards Competition

126
Sport Excellence Awards
CHDM Executive Mayor awarded Sport Excellence to recognize all those athletes and teams
that performed exceptionally well during 2019 period. These are the District participants that
managed to represent the District at National and International level.
LIST OF SPORT NOMINEES FOR AWARDS:
Name And
Surname
Sport Code Municipality Achievement
Justice Booi Relay Male 70+ The Older People’s Team represented
the district in
Vuyani Bakana Relay Male 70+ Engcobo LM in the national games in Port Elizabeth
in 2019 and
Malipheze Neti Relay Male 70+ emerged as winners in the sport
category.
Dan Mbekelwa Relay Male 70+
Mila Mdyeshana
(Disability Sport)
Cross Country Sakhisizwe Attained position 1 and gold medal in
4km cross country in the national
games.
Vuyo Magam
(Disability Sport)
Basketball Sakhisizwe Obtained a silver medal in national
games in Gauteng
Luvuyo Sizani Boxing Enoch Mgijima After qualifying for 2016 Olympics in
Scotland, in 2019 won the African
Boxing Union title belt.
Sabelo Ngebiyana
Boxing Enoch Mgijima Won WBA title, crowned Legend
Boxing Federation, SA Bantamweight

127
Champion, rated 15 by IBO World
Boxing Organization.
Landile Ngxeke Boxing Enoch Mgijima Won international title for African
Boxing Union Bantamweight.
Marhasi Oyisa Soccer Engcobo LM Won on under SA under 17 in
Mauritius 2019, in 2019 was selected
for Eastern Cape and won in SA
Champions. Top goal scorer of the
tournament.
Cwenga Nose Marathon
(middle and
long distance)
Engcobo Bronze (u19 5000m at the SA School
National Championship in PE 2019.
Gold (u20 10000m SA junior track field
national championship in Paarl 2019,
ranked number 1 in Athletic South
Africa (ASA) junior top 10 rankings.
Silver (u20 5000m at ASA juniors’
national championship, ranked
number 3.
Anacadia Minaar Women Rugby Inxuba
Yethemba
Played SA under 20 and SA Women
Senior Team at number 10 flyhalf.
Played at SVT Games and Geneva
Scholz Tournament.
Amahle Nyoba Women Rugby Inxuba
Yethemba
Played SA under 20 and SA number 3
best in under 20. Played at SVT
Games and Geneva Scholz
Tournament.
Siyahluma Hlathi Netball Enoch Mgijima Emerged as the best player in the
Gauteng Netball Championship 2019.

128
Fuzile Mabhuti
Mapeyi
Boxing
(Coaching)
Enoch Mgijima Achieved level 1 provincial certificate,
level 3 national certificate, AIBA
International 1-2 Star Coaching, 2017
tour to Germany for the province.
Nicolene Van
Schalkwyk
Netball
Administrator
Enoch Mgijima Won bronze medal for the under 19
Spar Netball Championship in
Johannesburg as the Team Manager
and Organizer.
Chris Hani Netball
team
Netball (12
players, 1
coach, a
manager, 1
scorer)
1 Emalahleni
1 Inxuba
Yethemba
1 Sakhisizwe
9 Enoch
Mgijima
Achieved position 3 (bronze) in
Gauteng Netball Championships
2019.
Amavarara
Football Team
Soccer Emalahleni LM Qualified for Nedbank Cup 2019/20
(National Games)
Qualified for ABC Motsepe League
2019/20 (National Games)
Digital Skills workshop for Youth
The Startup Mzansi Foundation partnered with South African Domain Name Authority
(ZADNA) to train, equip, and empower young entrepreneurs and the youth in general within the
country. This joint initiative was as a result of ZADNA’s efforts to help youth South Africans
especially those from previously disadvantaged communities to tap into the digital world. The
workshop is conducted over a period of 2 days and entails various topic ranging from Business
of Domains, Internet, 4th Industrial Revolution (4IR), and the general business management
modules. ZADNA fully sponsors the workshops and attendees are presented with Certificates
of attendance upon completion of the training. These workshops have been offered by ZADNA

129
to the young people between the ages of 18-35 years, throughout the country, one city per
province.
The workshop was conducted over a period of two (2) days, the 16th -17th March 2020 at the
Thobi Kula Indoor Sports Centre, from 09:00am-5pm. It was conducted by Mr Cedrick from
ZADNA. The expected number of participants was 50 young people. The actual number of
participants in attendance was 42, with 36 Females and 6 males. The participants were
introduced to the concept of Domain name registration, and what a “Domain name “was, the
importance of choosing the correct one for one’s business and for personal use.
SPU Mainstreaming Programmes for Designated Groups
The Disability Awareness & Information day programme was conducted at Emadlelweni Day
Care Centre in Chris Hani District on the 10 March 2020. The Department of Rural Development
and Agrarian Reform (DRDAR) in partnership with the Chris Hani District Municipality led and
coordinated the programme. This event allowed a platform for stakeholder government
departments to take services closer to the disability sector and the surrounding community. The
event was honoured by the MEC for DRDAR with various guests who delivered messages of
support as part of the programme. Programme participants included the Honourable Mayor of
Emalahleni Local Municipality, Chris Hani District SPU Portfolio Head and other members of the
mayoral committee of Emalahleni Local Municipality, Department of Social Development,
Disability sector and Indwe community.
The work done at Emadlelweni Centre over the years has proved to be impactful to the Disability
sector and the surrounding community and that was acknowledged by the MEC. There was
good mobilization and maximum participation of the disability sector ensured that the target
group was reached as the higher percentage of the people who attended the programme were
from the disability sector.
District Golden Games event was held at Cradock sport grounds on the 05 September 2019
with the support of the Chris Hani District Municipality (CHDM) led by the Department of Social
Development (DSD) in partnership with Department of Sport, Recreation, Arts and Culture
(DSRAC). Sucessful participation of the older persons from the whole district was witnessed on
the day. Culminating from the District games, the Ngcobo relay for older persons and Pegging
Washing Pegs participant were selected to participate in the National Golden games that were
held in Port Elizabeth. There was also an older person’s parliament in which the District Older
Persons Forum participated with the Support of the District Municipality.

130
District Integrated HIV, STIs and TB Programmes
The STI and Condom Week programme was planned be rolled out as an activation program at
Ikhala TVET Queenstown Campus. The activation campaign targeted students of Ikhala TVET
College, however due to student unrest the venue of the programme was moved to DICLA
Training and Projects were Ikhala students conducting their in-service training, learnerships and
vocational courses are hosted to obtain on the job training. The programme was conducted on
the 10th March 2020. The following activities were conducted as part of the activation campaign:
Male and Female Condom Distribution
Sexual Reproductive Health Awareness and Education
HIV Testing Services (HTS)
TB Screening
Dialogues (Shap Shap chats)
Both students and staff members participated in the programme.
16 Days of Activism campaign and World AIDS Day commemorations was conducted and
launched at Intsika Yethu LM. This was informed by the HIV prevalence (hotspot) and incidence
of social ills (crime area) that are occurring at the same area. The District Municipality also
planned on ensuring that these programmes rotate throughout the Local Municipalities of the
District to influence communities on having better living conditions. The programme on the 4th
December 2019 comprised of various presentations from government departments and non-
governmental organisations. There were services on wheels which were made available to
community members including: HIV testing, TB screening, birth registration and social security
assessments and registrations. Activists from different population groups (i.e. youth, young
woman, professional woman, elderly women, men, LGBTI) motivated the community to come
forward, get tested and start treatment through sharing their experiences.
Political, religious and traditional leadership of Ncorha made a commitment to support
community members. The staff at the clinic committed to ensure their safety and the
implementation of more programmes to ensure sustainability and empowerment of community
members. Intsika Yethu LM also allowed community members to register for free basic services.
EPWP through Community Development programmes
The Expanded Public Works Programme (EPWP) is then utilised as one of the vehicles to
achieve the job creation targets towards reduction of the unemployment rate and reduction of
poverty within the communities. The Special Programmes Unit (SPU) within the CHDM
implemented a project of War Room Facilitators employed on contract basis for improving the

131
implementation of Integrated Service Delivery Model (ISDM) Programme. War rooms are a
service delivery engine set up at ward level to deliver a fully coordinated and integrated basket
of service by different stakeholders.
Integrated Service Delivery Model (ISDM) programme is the project that the Chris Hani District
Municipality implements as an ongoing intervention strategy to strengthen the functionality of
the war rooms in all 110 wards. 9 War Room Facilitators have been functional and assist in the
functionality of the war rooms to improve the implementation of Integrated Service Delivery
Model programme. Contract for the district war room facilitators started on the 1st of July 2019.
For five local municipalities it started on the 1st of August 2019 except for Enoch Mgijima, then
for two war room facilitators of Enoch Mgijima the contract started on the first of September
2019. The contracts for all local municipality war room facilitators lasted until the 31st of January
2020 and for the district war room facilitators’ contacts end on the 30th of June 2020. Each war
room facilitator works for a maximum of 23 days per month (5 days per week) and this excludes
weekends. They are also paid for the days they attend for the trainings. Their function is to
strengthen the functionality of the war room.
Integrated Service Delivery Programmes (ISDM)
Chris Hani District Integrated Service Delivery Forum, and Enoch Mgijima Local Municipality
conducted an Integrated Service Delivery Programme at Ward 30 (Thornhill) – Enoch Mgijima
Local Municipality. The focus was on addressing identified challenges of the community in an
integrated manner and bringing services to the people. War room stakeholder’s identified
community challenges through war room community meetings and the programme was an
intervention strategy to address those challenges. The program involved all sector departments,
nongovernmental organizations, Enoch Mgijima local municipality, Chris Hani District
municipality and community stakeholders. The programme integrated all departments, working
together in solving community problems from the ground. The programme promoted human
values, fighting crime, diseases and social ills to ensure moral regeneration.
Government departments and non-governmental organizations provided services to the people
in addressing identified challenges or action plan on issues that needs immediate interventions.
The programme at Ward 30 war room was coordinated in the form of provision of services on
wheels to the community members, garden tools to identified six (6) Agricultural Project from all
six (6) local municipalities and three elderly centres at Intsika Yethu, Engcobo and Sakhisizwe
LM, sanitary towels and thirty (30) school shoes to identified needy children within ward

132
COMPONENT E
3.11 ENVIRONMENTAL MANAGEMENT: BIODIVERSITY
3.11.1 Introduction
Environmental Management function strives to ensure the realization of the Environmental right
stipulated in the Bill of rights under Section 24 of the Constitution of the Republic of South Africa,
1996. The constitutional right in section 24 elevates environmental protection, environmental
management and environmental law considerations within the context of the undertaking of
developments or other projects. The National Environmental Management Act (Act No. 107 of 1998)
(NEMA) acts as a framework legislation giving effect to section 24 of the Constitution. NEMA
provides for co-operative governance, ensures public participation in environmental decision-
making, seeks to alleviate environmental injustice and ensures sustainable development. The Local
Government: Municipal Systems Act 32 or 2000 (“the Municipal Systems Act”) gives further effect to
these constitutional imperatives. Municipalities have the duty to strive to ensure that municipal
services are provided in an environmentally sustainable manner. All organs of State also have the
responsibility to protect, promote and conserve the needs of the people. The section also stipulates
that the organs of State have to serve as custodians of the environment, and it is their duty to guide
the implementation of this Act. The Chris Hani District Municipality (CHDM) through the
Environmental Management Unit seeks to adhere to the provisions of the above-mentioned pieces
of legislations. Critical to the Environmental Management unit is to provide policy direction for the
District through the development of Environmental Planning Tools (i.e. Environmental Management
Plan, Climate Change Strategy, Integrated Waste Management Plans etc). These planning tools
were developed in collaboration with all other interested and affected stakeholders. These strategic
documents were adopted by Council and seek to address adaptation & mitigation measures in an
attempt to conserve the natural resources that exist within the District.
During the financial year under review, CHDM implemented the following programmes to ensure
sound environmental Management practices:
Climate Change & Awareness Programmes
The concept of Environmental management and Law today requires an acknowledgement that
climate change and habitat destruction are global and complex. They demand far deeper
transformations of the economy, culture and political life - if human kind carry on the way they do
currently, the planet will implode. The Chris Hani District Municipality (CHDM) with the support from
the Department of Environmental Affairs (DEA) and Department of Economic Development
Environmental Affairs and Tourism (DEDEAT), established a fully functional District Environment
and Climate Change Forum to engage stakeholders on environmental issues and the impacts they

133
have on our communities. The Forum intends to ensure an ongoing dialog within the District on
matters pertaining to environmental management and Climate change, furthermore it seeks to raise
environmental consciousness and facilitate environmental capacity building within the District. The
Environment and Climate Change Forum is intended to enhance environmental governance and
ensure capacity building initiatives are in the form of educational presentations to relevant
stakeholders on particular matters concerning the environment. The Forum convene on a quarterly
basis and serves as a platform for Local Municipalities and government departments to report on
matters pertaining to Climate Change and Environmental Management broadly.
Environmental awareness programmes jointly with key stakeholders and are conducted twice in
each quarter which amounts to a minimum of eight (8) programs per financial year. The target
audience are mainly disadvantaged communities (rural communities) and school learners. The
CHDM contributes towards the celebration and observation of days identified in the environmental
calendar which are celebrated annually with different selected themes (World Wetlands Day, Arbor
Week and Clean-up and recycling week etc). These calendar days serve as awareness programmes
that afford various stakeholders particularly the disadvantaged communities / youth an opportunity
to be capacitated on the importance of environment and how the environment can positively impact
on human life if utilized in a sustainable manner.
CHDM adopted the Alien Invasive and Bushing Encroaching Plant Management Strategy that is
currently being implemented in the District. This strategy seeks to provide appropriate treatment
measures of alien invasive species and in turn unlock economic opportunities in the form of job
creation and potential business ventures emanating from the eradication of alien invasive species.
This strategy will improve the state of biodiversity, reduce habitat destruction, minimize effects of
drought, and provide better management practices for grazing and agricultural land. In the
2019/2020 financial year CHDM Implemented a Lapesi eradication project at Machibini Village under
Enoch Mgijima Local Municipality where 100 jobs were created.
The CHDM initiatives towards addressing climate change has resulted to entering in a partnership
with United States Agency and International Development (USAID) which is heading South Africa
Low Emissions Development Program (SA-LED). The project through USAID has appointed a
Technical Advisor that provides technical support and advice on how the CHDM can effectively roll
out projects relating to climate change. The partnership assisted in the review of the CHDM
Environment and Climate Change Strategy which was then adopted by Council in June 2018,
furthermore USAID developed the Enoch Mgijima LM Waste- Water Treatment Works Feasibility
Study which is intended to provide solutions that will resuscitate the operations of the plant if
implemented adequately.

134
The Chris Hani District Municipality adopted a District – wide Environmental Management Plan
(EMP) as per the provisions of the National Environmental Management Act (Act No. 107 of 1998)
(NEMA). NEMA mandates organs of state (sector Departments and Municipalities) that exercise
functions that affect the environment to develop an Environmental Management Plan (EMP). The
“Chris Hani District Environmental Management Plan” seeks to ensure that the resources in the
District are used to their fullest potential in promoting and protecting a sustainable environment,
identifying elements and locations of economic growth to improve the quality of life for its people in
the communities.
Rural Sustainable Villages Project
The CHDM Sustainable Villages Programme (housed within the Municipal Health Services
Directorate of the Chris Hani District Municipality) has been conducting a pilot programme (from
2009 to 2014) that has had, at its core, the implementation and support of a variety of sustainable
technologies that were directed at assisting government to meet the need for basic service, food
security and environmental health within South Africa's rural landscape. In the 2017/18 financial year
CHDM in collaboration with the Department of Economic Development, Environmental Affairs and
Tourism (DEDEAT) acquired funding from National Treasury – European Union General Budget
Support Programme to implement the Rural Sustainable Villages Project.
The project officially commenced in the 2018/19 financial year after having concluded all the
contractual processes with the project implementers (Wildlife and Environment Society of South
Africa – WESSA). The project continued in the 2019/2020 and the second tranche (R4, 126 373.75)
of the funding was received in May 2020. The project is centred around the pilot rollout of the Agama
Pro 6 system at schools linked to rain water harvesting, agricultural digestion of food waste, manures
and garden residues, and agro-ecological food garden production based on the success of the of
the multi-award winning pilot at Three Crowns School.
The system has demonstrated a reliable, robust and low maintenance approach to providing rural
schools with decent, dignified and safe waterborne sanitation linked to onsite renewable energy
generation for the cooking of school meals, nutrient beneficiation and resource recycling. The total
budget for the project is R10.326 373.75 million and will be implemented over a duration of two
financial years. The total budget of the project has already been transferred to CHDM and is currently
being utilized in the project implementation through the appointed project implementer. Temporarily
jobs have been created for 27 local beneficiaries in the different villages where the project is being
implemented. The project has benefited eleven (11) schools with the District, three (3) being the
main schools where the new biogas system is being installed (Agama Pro6 digesters),two (2) are
the existing schools that are undergoing repairs and maintenance and six (6) schools are registered

135
as part of the Eco schools programme. The Eco-Schools programme is an international programme
of the Foundation for Environmental Education (FEE) that was developed to support environmental
learning in the classroom. The programme is aimed at creating awareness and action around
environmental sustainability in schools and their surrounding communities as well as supporting
Education for Sustainable Development in the national curriculum.
Greening and Land Care Programmes
Trees are planted for purposes of greening especially in towns, villages and schools. Trees are a
valuable resource providing both environmental and economic benefits. By planting trees, the
country can make a difference as trees contribute to cleaner air, lower energy costs, greater
protection of soil and water supplies, reduced noise levels, contribute to food security and a more
ambient environment in which to live. Additionally, emphasis is made to highlight the need for the
conservation of forests and in particular indigenous trees that are threatened by extinction.
In relation to greening, CHDM has resolved to ‘green’ its events by planting trees as a means of
striving to counteract the carbon footprint. As part of observing environmental calendar days that
also have a greening component, CHDM commemorated the Arbor Week programme at Qamata
Township at Intsika Yethu Municipality (13th September 2019) and World Wetlands Day at St Marks
Intsika Yethu Municipality (30th January 2020).
Council adopted its Alien Invasive and Bush Encroaching Plant Management Strategy 2017-2022
F/Y that is implemented concurrently with the greening and land care programme which is intended
to promote job creation and poverty alleviation. The Strategy seeks to reduce environmental
degradation by means of eradicating invasive alien plants (Silver and Black Wattle) and bush
encroaching species like Euryops (Lapesi). The Lapesi eradication project was implemented at
Machibini village, Enoch Mgijima LM and 100 jobs were created for local people within the rural
communities of CHDM.
Environmental Education and Awareness Programmes
Awareness programmes were conducted to impart knowledge pertaining to environmental quality
management, land care and sustainable development in relation to climate change, biodiversity
management and waste management. Observation of environmental days such as Arbor Week and
Wetlands Day were commemorated with selected themes on an annual basis and contribute towards
raising environmental awareness and education. Environmental education programmes were also
conducted in schools and communities. Environmental awareness programmes were conducted
during the year under review and will continue to be implemented. The impact of these awareness
sessions cannot be overemphasized as CHDM is currently well positioned to address the scourge

136
of climate change and make it beneficial to the citizens of this region through greening, recycling,
and renewable energy initiatives. The current pandemic (COVID-19) that is severe will also be
incorporated in the messages shared within upcoming awareness programmes in order to curb the
surge of COVID-19.
Environmental Planning and Management
CHDM has adopted a number of Environmental Management tools that are provisions of NEMA and
other Specific Environmental Management Acts (SEMA’s). CHDM Council adopted the Environment
and Climate Change Strategy (2018 – 2023)), Environmental Management Plan (2018-2023), Alien
Invasive and Bush Encroaching Plant Management Strategy (2017 – 2022). The Air Quality
Management Plan was adopted by Council in July 2019. The Integrated Waste Management Plan
for the District is reviewed in the 2019/2020 financial year and adopted by Council in June 2020.
These sector environmental plans assist the District in providing long term strategic planning and
direction to ensure effective implementation of sustainable environmental management practices.
The process for developing these sector plans was concluded following a comprehensive
consultation process with a wide range of stakeholders and structures.

137
COMPONENT F
3.12 ENVIRONMENTAL HEALTH
3.12.1 Introduction
Environmental Health is concerned with monitoring or mitigating those factors of the natural and built
environment affecting human health and disease. It involves identifying and evaluating
environmental sources and hazardous agents and limiting exposures to hazardous physical,
chemical, and biological agents in the air, water, soil, food, and other environmental media or
settings that may adversely affect human health. The programmes are implemented as per
Regulation 123, Scope of Profession for Environmental Health under the Health Professions Act (Act
No. 56 of 1974 as amended). Also through implementing relevant legislation e.g. Foodstuff,
Cosmetic and Disinfectant Act (Act No. 54 of 1972 as amended) etc.
3.12.1.1 Water quality monitoring
CHDM is responsible for ensuring that the water provided to communities is safe for human
consumption and adequate for domestic use as well as for recreational, industrial, food production
and all other human and animal use. This is facilitated through water sampling and analysis in
compliance with South African National Standards (SANS): 241, and General Authorisation in terms
of section 39 of the National water Act 36 of 1998.
During the period under review, 2101 drinking water samples were tested for compliance,
and of these 7 (0.33%) failed to meet the standard while 99.7% of the samples tested
complied. The Environmental Health Practitioners (EHPs) continue with their monitoring to
ensure that they are able to detect and advice on control measures for prevention of any
diseases that may be water related. This ensures that no communicable diseases or other
water related health outbreaks occurred.
In relation to waste water monitoring, 144 waste water samples were tested during the period
under review. Of these, 94 (65%) complied with General Authorisation in terms of section 39
of National Water Act, due to infrastructural problems in our waste water treatment works.
However, there is an improvement compared to the previous financial year following
interventions that were put in place by the district.

138
3.12.1.1 Health and Food Control
Food Inspections
The district has a responsibility of ensuring food safety in respect of acceptable microbiological,
chemical and hygiene standards. This is implemented by monitoring food premises for compliance
with set standards on a monthly basis to ensure compliance of all food premises and optimal
hygiene control throughout the food supply chain.
During period under review, 560 food premises were monitored, and of these premises
2193 inspections were conducted. Out of the 2193 inspections conducted 948 inspections
met the acceptable standards according to Regulation 638 (formerly known as R692) and
Regulation 1555 respectively. 1245 inspections did not comply due to poor hygiene
practices by Food Handlers. Health and hygiene awareness campaigns and training
programmes were conducted in the affected food premises in an attempt to deal with this
health problem by raising levels of awareness and also promote good health and hygiene
practices. These campaigns are on-going, and the positive impact of these efforts are
yielding results as there are no incidents of food poisoning cases that were reported.
Also during period under review, 40 Operation Gqogqa (Food Blitz) were conducted to all
formal and informal food premises within the CHDM area.
3.12.1.3 Health Surveillance Of Premises
This function is performed to ensure urban and rural land use, planning and practices that are
conducive with sustainable development. This is done through environmental health impact and
other assessments in a manner that ensures the prevention and abatement of any condition on
any premises, which is likely to constitute a health hazard. The following premises were evaluated
during this financial year in line with the standards as set out in prescripts of law:
Food premises: These premises are both formal and informal. Their business set up is therefore
distinct due to their different economic status. Council is paying particular attention to develop the
informal sector so that it can contribute meaningfully to the economy of the district.
Funeral Parlours: The parlours are evaluated in terms of Regulation 363 of 2013 relating to the
Management of Human Remains. Most of these parlours are not meeting the requirements.
Compliance letters were written to all the affected premises. Follow up inspections are conducted
on a regular basis. Funeral Parlours engagements through funeral parlours forum and workshop
added value in compliance with health requirements.

139
Sanitation structures: The Sanitation structures are evaluated in terms of the White Paper on
Basic Household Sanitation of 2001.
Waste Management: The inspections are conducted in LM’s waste site to assist them to come to
compliance to the NEM Waste Act 2008.
The table below stipulates results on inspections undertaken:
Table 48: Inspections taken
CATEGORY OF
PREMISES
NUMBER EVALUATED NUMBER
COMPLIED
NUMBER
FAILED
Food Premises 560 (2193 inspections) 948 (inspections) 1245
(inspections)
Funeral Parlours 68 (286 inspections) 164 inspections 122 inspections
Sanitation Structures 120 120 0
Waste Management 14 waste sites (55
inspections)
3 inspections 52 inspections
Table 49: Health Service Policy Objectives
Health Service Policy Objectives as per IDP
Service
Indicators
Outline
Service
Targets
2017/2018 2018/2019 2019/2020 2020/202
1
2021/202
2
Target Actu
al Target
Actu
al Target
Actu
al
*Previou
s Year
*Previou
s Year
*Curre
nt Year
*Previou
s Year
*Curre
nt Year
*Current
Year
*Followin
g Year
(i) (ii) (iii) (iv) (v) (vi) (vii) (viii) (ix) (x) (xi) (xii)
Service
Objective
Number of
Waste
Water
samples
points
taken for
compliance
144 Waste
Water
samples
points
taken for
compliance
in
144 144 144 36 37 36 144 144 144 144

140
in
accordanc
e with
Regulation
s 991 and
section 39
of National
Water Act
36 of 1998
as
amended
for
compliance
accordanc
e with
Regulation
s 991 and
section 39
of National
Water Act
36 of 1998
as
amended
for
compliance
by 30 June
2020
Number of
Drinking
Water
Samples
points
monitored
in
accordanc
e with
SANS 241
2100
Drinking
Water
Samples
points
monitored
in
accordanc
e with
SANS 241
by 30 June
2020
97% 93% 100% 2220 2200 2220 2100 2101 2100 2100
Number of
Food
premises
monitored
in line with
Food,
Cosmetics
and
Disinfectan
ts Act 54 of
1972 as
Amended
2240 Food
premises
monitored
in line with
Food,
Cosmetics
and
Disinfectan
ts Act 54 of
1972 as
Amended
by 30 June
2020
560 560 560 560 699 560 2240 2193 2240 2240
Number of
funeral
parlours
monitored
for
compliance
272
funeral
parlours
monitored
for
compliance
70 70 68 68 72 68 272 276 272 272

141
through
inspections
through
inspections
by 30 June
2020
Number of
sampled
sanitation
structures
inspected
in line with
White
Paper on
Basic
Household
Sanitation
of 2001
120
sampled
sanitation
structures
inspected
in line with
White
Paper on
Basic
Household
Sanitation
of 2001 by
30 June
2020
120 132 132 120 120 120 120 120 120 120
Table 50: Health Employees
EMPLOYEES HEALTH INSPECTION
2017/2018 2018/2019 2019/2020
Job Level Employees Post Employees Vacancies Vacancy
% Post Employees Vacancies Vacancy %
0-3 0 0 0 0 0% 0 0 0 0%
4-6 0 0 0 0 0% 0 0 0 0%
7-9 4 4 4 0 0% 4 4 0 0%
10-12 30 31 31 0 0% 26 26 0 0%
13-15 5 4 4 0 0% 4 4 0 0%
16-18 2 2 2 0 0% 2 2 0 0%
19-20 0 0 0 0 0% 0 0 0 0%

142
TOTALS 41 41 41 0 0% 36 36 0 0%
Table 51: Financial Performance Health & Community Services
Financial Performance 2019/2020: Health and Community Services
R'000
Details
2018/2019 2019/2020
Actual Original Budget Adjustment Budget
Actual Variance to
Budget
Total Operational Revenue 7 361 098 1 208 000,00 5 734 373,00 5 364 091 77%
Expenditure:
Employees 5 243 729 32 766 084,00 27 289 345,00 28 198 318 -16%
Repairs and Maintenance 13 460 589 608 390,00 11 390,00 - #DIV/0!
Other 18 704 319 14 126 211,00 7 072 341,00 6 167 646 -129%
Total Operational Expenditure 37 408 637,08 47 500 685,00 34 373 076,00 34 365 964 -38%
Net Operational Expenditure 30 047 539,20 46 292 685,00 28 638 703,00 29 001 873 -60%
Net expenditure to be consistent with summary T 5.1.2 in Chapter 5. Variances are calculated by dividing the difference between the Actual and Original Budget by the Actual. T 3.19.5
The above financial performance information includes all units under Health and Community
Services.
3.12.1.4 Health and Hygiene Education And Awareness Programme
Training, Health and hygiene awareness campaigns were conducted to food premises in an attempt
to raise the levels of awareness and also promote good health and hygiene practices especially
under the recent outbreak of Listeriosis in South Africa and mushrooming of informal and formal food
premises. Health and hygiene education is also aimed at preventing environmentally induced
diseases and related communicable diseases. In total 60 health and hygiene programs were
conducted to different stakeholders.
Also waste management awareness campaigns were conducted in each local municipality across
the District. The campaigns were targeting school pupils and communities focusing on waste
management e.g. recycling initiatives and anti-littering programmes. Environmental Health Days

143
were observed i.e. World Environmental Health Day, Hand Washing Day, Toilet Day, Water Week
and National Sanitation Week.
COMPONENT G: FIRE SERVICES AND DISASTER MANAGEMENT
3.13 FIRE SERVICES
3.13.1 Introduction
The Chris Hani District Municipality Fire Services has obligations towards the citizens in the
CHDM area of jurisdiction by rendering firefighting services as prescribed in the Fire Brigade Act
(99 of 1987) “service” means a fire brigade service intended to be employed for which is natural
to a fire services :—
(a) preventing the outbreak or spread of a fire;
(b) fighting or extinguishing a fire;
(c) the protection of life or property against a fire or other threatening danger;
(d) the rescue of life or property from a fire or other danger;
(e) subject to the provisions of the Health Act, 1977 (Act No. 63 of 1977), the rendering of an
ambulance service as an integral part of the fire brigade service; or
(f) The performance of any other function connected with any of the matters referred to in
paragraphs (a) to (e).
The key areas that the Fire Services have to implement are the following:
Planning, coordination and regulation of fire services;
Specialised Fire Fighting Services such as mountain, Veld and chemical fire services;
Co-ordination of the standardisation of infrastructure, vehicles, equipment and procedures;
Training of fire officers.
Fire prevention and fire safety inspections are the core functions of fires services including Fire
awareness programs,
Fire Safety, prevention- and- awareness programs aimed at assisting the communities by
preventing and extinguishing fires when they occur. Due to these programs there is a reduction of
fire incidents and they also reduce the utilisation of resources in an event of a fire.

144
Fire Inspections were conducted for compliance purposes. A total of 32 inspections were
conducted during 2019/2020 financial year. A total of 51 Fire awareness programmes were
conducted during 2019/2020
Table 52: Fire Services Data
Chris Hani District Municipality Fire Services Data
Details 2016/2017 2017/2018 2018/2019 2019/2020
Actual No. Estimate No. Actual No. Estimate No.
1 Total fires attended in the year 60 13 61 106
2 Total of other incidents attended in the year 20 5 5 0
3 Average turnout time - urban areas 10 10 10 10
4 Average turnout time - rural areas 1,5 hour 1,5 hour 1,5 hour 1,5
5 Fire fighters in post at year end 7 7 9 8
6 Total fire appliances at year end 2 2 1 2
7 Average number of appliance off the road during the year 0 0 0 0
Table 53: Fire Services Policy Objectives
Fire Service Policy Objectives IDP
Servic
e
Indica
tors
Outlin
e
Servic
e
Target
s
2017
/201
8
2018
/201
9
2019/2020
2020/
2021
2021/2022
Targ
et
Ac
tua
l
Targ
et
Ac
tua
l
Targ
et
Ac
tua
l
*Pre
vious
Year
*Pre
vious
Year
*Cu
rren
t
Yea
r
*Pre
viou
s
Year
*Cu
rren
t
Yea
r
*Curr
ent
Year
*Following Year
(i) (ii) (iii) (iv) (v) (vi) (vii
)
(viii) (ix) (x) (xi) (xii)
Servic
e

145
Object
ive
Numb
er of
Fire
Servic
es
progra
mmes
imple
mente
d
4 fire
servic
es
progra
mmes
imple
mente
d by
30
June
2020
3 3 3 4 4 4 4 4 4 4
Table 54: Employee Fire Services Employees Fire Services
FIRE SERVICES
2017/2018 2018/2019 2019/2020
Job Level Employees Post Emp
loye
es
Vac
anci
es
Vac
ancy
%
Po
st
Emp
loye
es
Vac
anci
es
Vaca
ncy
%
0-3 0 0 0 0 0% 0 0 0 0%
4-6 0 0 0 0 0% 0 0 0 0%
7-9 8 8 8 0 0% 8 7 1 12.5
%
10-12 0 0 0 0 0% 0 0 0 0%
13-15 0 0 0 0 0% 0 0 0 0%

146
16-18 1 1 1 0 0% 1 1 0 0%
19-20 0 0 0 0 0% 0 0 0 0%
TOTALS 9 9 9 0 0% 9 8 1 11.1
1%
Table 55: Employee Fire Services
SERVICES
2017/2018 2018/2019 2019/2020
Job
Level
Employees Post Employees Vacancies Vacancy
%
Post Employees Vacancies Vacancy %
0-3 0 0 0 0 0% 0 0 0 0%
4-6 0 0 0 0 0% 0 0 0 0%
7-9 8 8 8 0 0% 8 7 0 12,5%
10-12 0 0 0 0 0% 0 0 0 0%
13-15 0 0 0 0 0% 0 0 0 0%
16-18 1 1 1 0 0% 1 1 0 0%
19-20 0 0 0 0 0% 0 0 0 0%
TOTALS 9 9 9 0 0% 9 8 0 11.1%

147
Table: 56 financial performance Fire Services
Financial Performance Year 0: Fire Services
R'000
Details
Year -2018/2019 Year 2019/2020
Actual Original Budget Adjustment Budget
Actual Variance to Budget
Total Operational Revenue 95,00 - - - -
Expenditure:
Fire fighters
Other employees 4 032 714,55 4 502 132,00 4 551 767,00 3 255 343,60 -38%
Repairs and Maintenance 248,00 - 1 500,00 - -
Other 1 585 432,19 1 331 221,00 394 621,00 261 695,61 -409%
Total Operational Expenditure 5 618 394,74 5 833 353,00 4 947 888,00 3 517 039,21 -66%
Net Operational Expenditure 5 618 299,74 5 833 353,00 4 947 888,00 3 517 039,21 -66%
Net expenditure to be consistent with summary T 5.1.2 in Chapter 5. Variances are calculated by dividing the difference between the Actual and Original Budget by the Actual. T 3.21.5
Key performance highlights
Chris Hani Fire &Emergency Services are still committed to render an effective, efficient and
economical Fire services to the Chris Hani District. CHDM worked in partnership with some local
Municipalities to reduce risks of fires by providing specialist fire safety advice, support and
interventions.
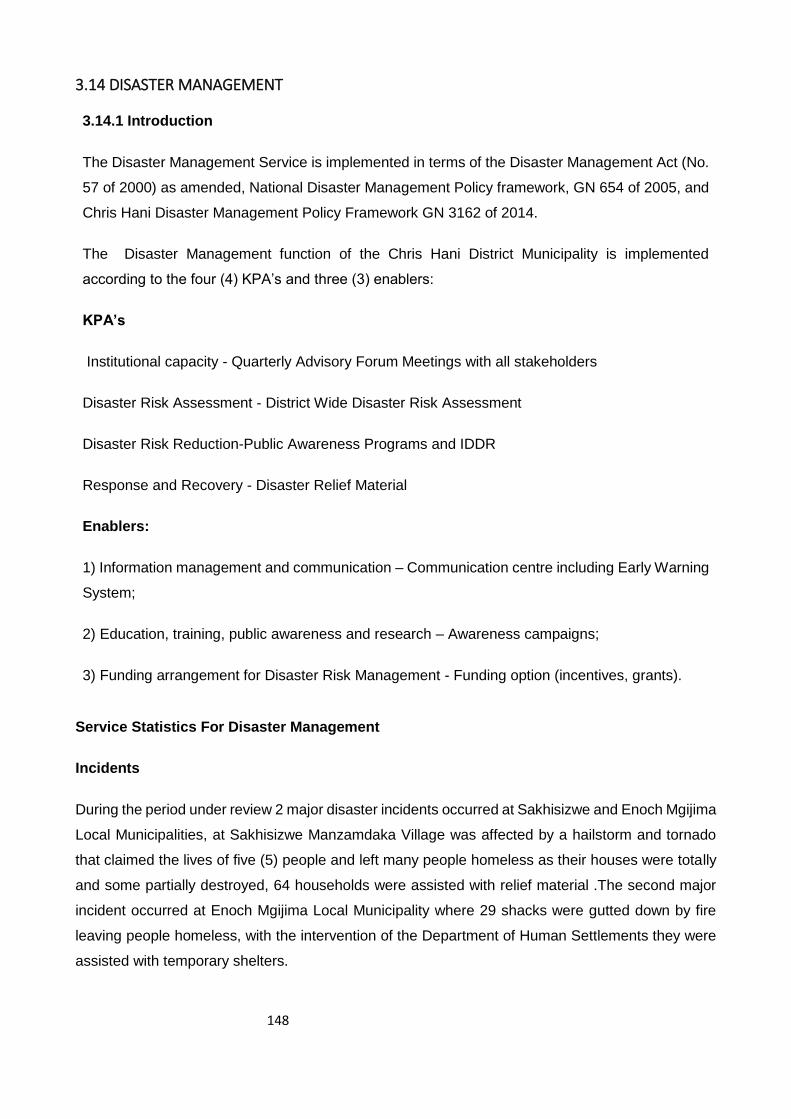
148
3.14 DISASTER MANAGEMENT
3.14.1 Introduction
The Disaster Management Service is implemented in terms of the Disaster Management Act (No.
57 of 2000) as amended, National Disaster Management Policy framework, GN 654 of 2005, and
Chris Hani Disaster Management Policy Framework GN 3162 of 2014.
The Disaster Management function of the Chris Hani District Municipality is implemented
according to the four (4) KPA’s and three (3) enablers:
KPA’s
Institutional capacity - Quarterly Advisory Forum Meetings with all stakeholders
Disaster Risk Assessment - District Wide Disaster Risk Assessment
Disaster Risk Reduction-Public Awareness Programs and IDDR
Response and Recovery - Disaster Relief Material
Enablers:
1) Information management and communication – Communication centre including Early Warning
System;
2) Education, training, public awareness and research – Awareness campaigns;
3) Funding arrangement for Disaster Risk Management - Funding option (incentives, grants).
Service Statistics For Disaster Management
Incidents
During the period under review 2 major disaster incidents occurred at Sakhisizwe and Enoch Mgijima
Local Municipalities, at Sakhisizwe Manzamdaka Village was affected by a hailstorm and tornado
that claimed the lives of five (5) people and left many people homeless as their houses were totally
and some partially destroyed, 64 households were assisted with relief material .The second major
incident occurred at Enoch Mgijima Local Municipality where 29 shacks were gutted down by fire
leaving people homeless, with the intervention of the Department of Human Settlements they were
assisted with temporary shelters.

149
Disaster Relief
Disaster relief material was handed over to 64 beneficiaries at Sakhisizwe Local Municipality.
Disaster Advisory Forum Meetings
Four meetings were held during the financial year.
Public Awareness Programs
A total of four (4) public awareness programs were held in the following local municipalities reaching
the following number of participants, 120 Enoch Mgijima, 105 Enoch Mgijima , 406 Inxuba Yethemba,
128 Emalahleni, 360 Sakhisizwe and 306 at Engcobo reaching a total of 1425 people.
International Day Disaster Reduction
International Day for Disaster Reduction was held at Emalahleni Local Municipality, Khavala Village
where a land rehabilitation program was implemented in the form of Barricade basket’s reaching a
number of 400 participants.
Table 57: Disaster Management Service Policy Objectives
Disaster Management Service Policy Objectives as per IDP
Service
Indicators
Outline
Service
Targets
2017/201
8 2018/2019 2019/2020
2020/202
1
2021/202
2
Target Actu
al Target
Actu
al Target
Actu
al
*Previous
Year
*Previou
s Year
*Curre
nt Year
*Previou
s Year
*Curre
nt Year
*Current
Year
*Followin
g Year
(i) (ii) (iii) (iv) (v) (vi) (vii) (viii) (ix) (x) (xi) (xii)
Service
Objective
Number of
Disaster
Manageme
nt
Programme
s
implemente
d as per
DMP
2 Disaster
Manageme
nt
Programme
s
implemente
d as per
DMP by 30
June 2020
4 4 4 2 2 2 2 2 2 2

150
Table 58: Employees Disaster Management
EMPLOYEES DISASTER MANAGEMENT
2017/2018 2018/2019 2019/2020
Job
Level Employees Post Employees Vacancies
Vacancy
% Post Employees Vacancies
Vacancy
%
0-3 0 0 0 0 0% 0 0 0 0%
4-6 6 6 6 0 0% 6 5 1 0%
7-9 0 0 0 0 0% 0 0 0 0%
10-12 5 5 5 0 0% 5 4 1 20%
13-15 0 0 0 0 0% 0 0 0 0%
16-18 1 1 1 0 0% 1 1 0 0%
19-20 0 0 0 0 0% 0 0 0 0%
TOTALS 12 12 12 0 0% 12 10 2 17%
Table:59 financial performance Disaster Management
Financial Performance Year 0: Disater Management, Animal Licencing and Control, Control of Public Nuisances, Etc
R'000
Details
Year -1 Year 0
Actual Original Budget Adjustment Budget
Actual Variance to Budget
Total Operational Revenue -
Expenditure:
Employees 6 771 282,49 8 623 603,00 7 911 677,00 3 333 047,06 -159%
Repairs and Maintenance 248,00 75 000,00 29 500,00 - -
Other 2 335 365,75 5 115 686,00 3 420 156,00 3 309 771,90 -55%
Total Operational Expenditure 9 106 896,24 13 814 289,00 11 361 333,00 6 642 818,96 -108%
Net Operational Expenditure 9 106 896,24 13 814 289,00 11 361 333,00 6 642 818,96 -108%
Net expenditure to be consistent with summary T 5.1.2 in Chapter 5. Variances are calculated by dividing the difference between the Actual and Original Budget by the Actual. T 3.22.5

151
COMPONENT I: CORPORATE POLICY OFFICES AND OTHER SERVICES
3.15 EXECUTIVE AND COUNCIL
3.15.1 Introduction
The Chris Hani District Municipality as outlined in its Integrated Development Plan set out clearly
defined strategic objectives and targets in line with its powers and functions as guided by the
Constitution of the Republic of South Africa, Act No. 108 of 1996 and relevant legislative
requirements. Its endeavors to deliver sustainable and quality services were supported through the
implementation and monitoring of adopted Council policies in an effort to deliver on its mandate.
During this period, CHDM made great strides in delivering services to its communities. These can
be highlighted as follows:
Key Service delivery highlights:
In terms of water provision, CHDM currently has 28 water treatment plants across the district.
A total of 6295households received sanitation during the 2019/2020 financial year as the
following capital projects were completed:
Completed bulk water projects include Xonxa pump station and Lokshini Villages project,
RS1 phase 2C -Jiphutha makiki project. Noluthando lukavala phase 2, Upper Mnxe project,
Mhlanga water project a total of 697 households were supplied with water across the district.
Table:60 financial performance The Executive and Council
Financial Performance 2019/2020: The Executive and Council
R'000
Details
2018/2019 2019/2020
Actual Original Budget Adjustment Budget
Actual Variance to
Budget
Total Operational Revenue - - 0%
Expenditure:
Employees 17 749 029 13 902 286 10 505 976 12 175 686 -14%
Repairs and Maintenance - 52 500 50 150 - 0%
Other 10 422 484 10 587 275 8 455 482 8 357 388 0%
Total Operational Expenditure 28 171 513 24 542 061 19 011 608 20 533 074 -20%
Net Operational Expenditure 28 171 513 24 542 061 19 011 608 20 533 074 -20%
Net expenditure to be consistent with summary T 5.1.2 in Chapter 5. Variances are calculated by dividing the difference between the Actual and Original Budget by the Actual. T 3.24.5

152
3.16 FINANCIAL SERVICES
3.16.1 Introduction to Financial Services
During the financial year, municipal bills were produced and sent to customers, customer data
cleaned, queries were resolved, and debt collected.
Debt recovery update for 2018/2019 Financial year
Table 61: Debt Recovery
Debt Recovery
R' 000
Details of the
types of account
raised and
recovered
2017/2018 2018/2019 2019/2020
Actual for
accounts
billed in year
Proportion of
accounts
value billed
that were
collected in
the year %
Billed
in
Year
Actual for
accounts billed
in year
Proportion
of accounts
value billed
that were
collected %
Estimated
outturn for
accounts billed in
year
Estimated
Proportion of
accounts
billed that
will be
collected %
Property Rates
Water – B 20343632.00 5.6% 217,498,132.04 10.1% 228,808,034.91 11.5%
Water – C
Sanitation 55969599.00 5.6% 56,531,162.74 10.1% 59,470,783.20 11.5%
Table 62: Financial Service Policy Objectives
Financial Service Policy Objectives as per IDP
Service
Indicators
Outline
Service
Targets
2017/2018 2018/2019 2019/2020 2020/20
21
2021/20
22
Targ
et Actual Target Actual Target
Actual
*Pre
viou
s
Year
*Previ
ous
Year
*Current
Year
*Previ
ous
Year
*Current
Year
*Current
Year
*Followi
ng Year
(i) (ii) (iii) (iv) (v) (vi) (vii) (viii) (ix) (x) (xi) (xii)
Service
Objective
Number of
Credible
budgets and
financial
reports
compiled
4 Credible
budgets
and 16
Financial
reports
compiled
4 4 4 4 4 4 4
Credible
budgets
and 16
Financial
reports
4
Credible
budgets
and 16
Financial
reports
4
Credible
budgets
and 16
Financial
4
Credible
budgets
and 16
Financia

153
and
approved
and
approved
30 June
2020
approve
d
compiled
and
approve
d
reports
approve
d
l reports
approve
d
Number of
Revenue
Enhanceme
nt
programmes
implemented
03
Revenue
Enhancem
ent
programm
es
implement
ed by 30
June 2020
5 4 5 4 0 4 03
Revenue
Enhance
ment
program
mes
impleme
nted
0
Revenue
Enhance
ment
program
mes
impleme
nted
03
Revenue
Enhance
ment
program
mes
impleme
nted
03
Revenu
e
Enhance
ment
program
mes
impleme
nted
Number of
SCM
programmes
implemented
07 SCM
programm
es
implement
ed by 30
June 2020
6 6 6 7 7 7 7 2 6 6
100% of
suppliers
paid within
30 days
100%
payment of
suppliers
within 30
days by 30
June 2020
50% 50% 50% 100% 97% 100% 100% 0% 100% 100%
%
adherence to
payment of
salaries by
the due date.
100%
adherence
to payment
of salaries
by the due
date by 30
June 2020
100
%
100% 100% 100% 100% 100% 100% 100% 100% 100%
Number of
GRAP
compliant
Fixed Asset
Registers
and
Inventory
Managemen
t
programmes
implemented
1GRAP
compliant
Fixed
Asset
Registers
and
Inventory
Manageme
nt
programm
es
implement
Ass
et
Regi
ster
Com
plete
d
Asset
Regist
er
Compl
eted
Asset
Regist
er
Compl
eted
Develop
GRAP
Complia
nt Asset
Register
. Two
Inventor
y
program
mes
implem
ented
Develop
GRAP
Complia
nt Asset
Register
. One
Inventor
y
program
mes
implem
ented
Devel
op
GRAP
Compl
iant
Asset
Regist
er
1 GRAP
complian
t Fixed
Asset
Register
s and
Inventor
y
Manage
ment
program
mes
0 Develop
GRAP
Complia
nt Asset
Register
Develop
GRAP
Complia
nt Asset
Register

154
ed by 30
June 2020
impleme
nted
Number of
GRAP
Compliant
AFS
compiled
04 GRAP
Compliant
AFS
compiled
by 30 June
2020
04
AFS
com
piled
04
AFS
compil
ed
04
AFS
compil
ed
04 AFS
compile
d
04 AFS
compile
d
04
AFS
compil
ed
04 AFS
compiled
04 AFS
compiled
04 AFS
compiled
04 AFS
compile
d
Number of
GRAP and
MSCOA
Compliant
Financial
Managemen
t Systems
programmes
implemented
03 GRAP
and
MSCOA
Compliant
Financial
Manageme
nt Systems
programm
es
implement
ed by 30
June 2020
100
%
97% 100% 03
GRAP
and
MSCOA
Complia
nt
Financi
al
Manage
ment
System
s
program
mes
implem
ented
0 GRAP
and
MSCOA
Complia
nt
Financi
al
Manage
ment
System
s
program
mes
implem
ented
03
GRAP
and
MSCO
A
Compl
iant
Financ
ial
Mana
geme
nt
Syste
ms
progra
mmes
imple
mente
d
03 2 03 03
Table 63: Employees Financial Services
EMPLOYEES FINANCIAL SERVICES
2017/2018 2018/2019 2019/2020
Job
Level Employees Post Employees Vacancies
Vacancy
% Post Employees Vacancies
Vacancy
%
0-3 0 0 0 0 0% 0 0 0 0%
4-6 73 79 77 2 4% 82 76 4 5%
7-9 14 16 12 4 12% 13 13 0 0%
10-12 22 26 19 7 15% 29 23 4 14%
13-15 9 12 11 1 11% 14 14 0 0%
16-18 7 7 6 1 0% 8 8 0 0%
19-20 0 0 0 0 0% 0 0 0 0%
TOTALS 125 140 125 15 10% 146 134 8 6%

155
Table 64: Financial Performance 2019/2020: Financial Services
Financial Performance 2019/2020: Financial Services
R'000
Details
2018/2019 2019/2020
Actual Original Budget
Adjustment Budget
Actual Variance to Budget
Total Operational Revenue 583 568 767
614 645 278,00
697 305 953,00
545 503 824 -13%
Expenditure:
Employees 40 801 719
35 507 958,00
34 275 533,00
41 951 591 15%
Repairs and Maintenance -
-
-
- 0%
Other 39 470 485
30 737 013,00
29 141 465,00
31 443 825 2%
Total Operational Expenditure 80 272 203,97
66 244 971,00
63 416 998,00
73 395 416 10%
Net Operational Expenditure -503 296 562,83
-548 400 307,00
-633 888 955,00
(472 108 408) -16%
Net expenditure to be consistent with summary T 5.1.2 in Chapter 5. Variances are calculated by dividing the difference between the Actual and Original Budget by the Actual.
T 3.25.5
3.17 HUMAN RESOURCE SERVICES
3.17.1 Introduction
Workforce management is part of the broader organisational management strategy which seeks to
amongst others ensure that there is a defined process of accountability as well as adequate
procedures to deal with administrative matters. To this end, the municipal Council has approved a
number of policies and procedures aimed at improving management and administration affairs within
the municipality
SERVICE STATISTICS FOR HUMAN RESOURCES
The Chris Hani District Municipality has a staff complement of 839 and 42 Councillors.

156
Table 65: Human Resources Service Policy Objectives
Human Resources Service Policy Objectives as per IDP
Service
Objectives
Outline
Service
Targets
2017/201
8 2018/2019 2019/2020
2020/202
1
2021/202
2
Target
Actu
al Target
Actu
al Target
Actu
al
Service
Indicators
*Previous
Year
*Previou
s Year
*Curre
nt Year
*Previou
s Year
*Curre
nt Year
*Current
Year
*Followin
g Year
(i) (ii) (iii) (iv) (v) (vi) (vii) (viii) (ix) (x) (xi) (xii)
Service
Objective
Number of
IHRM
Programme
s
implemente
d
7 IHRM
Programme
s
implemente
d by 30
June 2020
9 7 10 9 7 9 7 4 7 7
Number of
Integrated
Health,
Wellness,
and Safety
Programme
s
implemente
d
4
Integrated
Health,
Wellness,
Safety
programme
s
implemente
d by 30
June 2020
28 27 28 4 4 4 6 4 6 6
Table 66: Employees Human Resources
EMPLOYEES HUMAN RESOURCES
2017/2018 2018/2019 2019/2020
Job Level Employees Post Employees Vacancies Vacancy
% Post Employees Vacancies
Vacancy
%
0-3 0 0 0 0 0% 0 0 0 0%
4-6 1 1 1 0 0% 1 1 0 0%
7-9 0 0 0 0 0% 0 0 0 0%
10-12 13 15 13 2 13% 13 11 2 15%
13-15 0 0 0 0 0% 0 0 0 0%
16-18 3 3 3 0 0% 3 3 0 0%
19-20 0 0 0 0 0% 0 0 0 0%
TOTALS 17 19 17 2 13% 17 15 2 11%

157
Table 67: Financial Performance Human Resource Services
Financial Performance 2017/2018: Human Resource Services
R'000
Details
2017/2018 2018/2019
Actual Original Budget Adjustment Budget
Actual Variance to Budget
Total Operational Revenue 1 689 380,00 6 481 522,00 3 911 760
0,57
Expenditure:
Employees 29 289 101 29 987 961,00 26 883 175,00 30 148 452 0,01
Repairs and Maintenance 16 940 472 28 376 251,00 9 274 546,00 47 355 978
0,40
Other 97 019 775 81 206 844,00 95 039 975,00 44 988 878 -0,81
Total Operational Expenditure 143 249 348,29 139 571 056,00 131 197 696,00 122 493 308 -0,14
Net Operational Expenditure 143 249 348,29 137 881 676,00 124 716 174,00 118 581 547 -0,16
Net expenditure to be consistent with summary T 5.1.2 in Chapter 5. Variances are calculated by dividing the difference between the Actual and Original Budget by the Actual. T 3.26.5
3.18 INFORMATION AND COMMUNICATION TECHNOLOGY (ICT) SERVICES
3.18.1 Introduction
The mandate of the Information Communication Technology (ICT) unit is to Provide ICT services
and support to the District Municipality and to provide secure, reliable and consistent platform for
information accessibility.
SERVICE STATISTICS FOR ICT SERVICES
Information Communication Technology Governance
The King 3 report on IT governance states the importance of establishment of IT Governance
Framework. The IT Governance Framework supports effective and efficient management and
decision making around the utilisation of IT resources to facilitate the achievement of the municipal
objectives and the management of IT-related risks. It includes a charter, decision-making structures,
accountability framework, IT reporting and an IT internal control framework.
CHDM has an approved ICT Governance Framework which is based on the principles of Cobit 5.
Council established ICT Governance committees as per the adopted ICT Governance Framework.
There are three ICT governance structures in existence, the ICT Steering Committee, ICT

158
Architecture Forum and the Information Systems Security Forum. The latter two were combined into
one forum, which is called the ICT Architecture and Information Security Forum.
CHDM has an approved ICT Strategy Plan, which states the importance of integration of systems.
A service provider was appointed to conduct the work-study on integration of systems. The role of
the service provider is to assist in improving business integration, and enhancing ICT technology, to
provide an organized, sensible, accountable and workable ICT systems environment thus
eliminating redundant information and dormant ICT systems. The main objective of the engagement
is to draft a roadmap to attain an ideal ICT operating model, which the municipality can use to plan
and operate its ICT systems and infrastructure going forward.
The project had seven phases namely:
Phase 0: Initiation and Planning – definition and approval of project schedule, project charter, project
plan and establishment of the overall project protocols and communication channels.
Phase 1: Blueprinting-: “As-Is” Municipal situation (assessing business process). Engaging internal
stakeholders to gain understanding of municipal environment and to get the understanding of key
personnel on their expectations of the project.
Phase 2: Blueprinting- “As-Is” ICT Situation (assessing ICT infrastructure). Understanding the
purpose of existing ICT applications, current ICT infrastructure (hardware, network, databases etc)
assess ICT policies, procedures and practices, IT spend, resources, skills.
Phase 3: Business - IT Alignment Assessment (identification of current infrastructure, ICT function
and integration gaps). Identifying gaps between the municipal requirements and the current ICT
capabilities and reconciling municipal objectives and requirements.
Phase 4: Determine “To – Be” municipal needs. Reviewing and understanding of the municipal IDP
and understanding the role that ICT should play in enabling and supporting the municipality’s plans.
Phase 5: Perform a Technical Gap Analysis. Analysis of output of the municipal ICT analysis to
determine gaps in enterprise and identify major ICT risks.
Phase 6: Develop Work – Study for business integration and technology enablement (solution to
integration gaps). Drafting and proposing the ideal service delivery model for the ICT unit to support
the municipality and the following:
The ideal ICT organogram for the ICT unit.
Ideal governance model for the ICT unit to support the municipality.

159
The ideal application landscape for the ICT unit to support the municipality
The ideal budgeting framework for the ICT unit to support the municipality
The ideal performance measurement framework for the ICT unit to support the municipality.
ICT infrastructure model (limited to recommendations only)
Draft, finalize business integration and technology enablement roadmap.
Phase 7: Project Closure. Finalize, quality check and sign-off all deliverables from previous phases.
Capture lessons learnt and future steps coming from these deliverables. Close-out meeting with all
key stakeholders to handover all deliverables.
All seven phases of the project were completed, and the document is a living document that the
municipality is using to plan a way forward for the ICT unit. The document has a clear road map
which is a guide regarding what is to be undertaken to ensure that ICT unit of CHDM reaches at
least a level 4 in terms of ICT governance maturity, and to assist in the planning of ICT projects.
Network Infrastructure Upgrade
The unit has a responsibility to provide connectivity to all CHDM remote sites. In addition to the local
sites in Queenstown, there are remote sites in various local municipal towns with Water services
offices including WSP and billing offices. CHDM has an Service Level Agreement (SLA) with Telkom.
Most of CHDM satellite offices are connected to the main in Queenstown via Telkom’s Multiprotocol
Label Switching Virtual Private Network.
ICT network infrastructure was upgraded at Engcobo LM, Intsika Yethu LM, Sakhisizwe LM, Enoch
Mgijima LM (Molteno) by installing Category 6 (CAT6) Local Area Network (LAN) cabling.
ICT unit also facilitated appointment of service provider for e-government programmes (Microsoft
Teams and Online exchange) and the project has been completed successfully. Implementation of
ICT security management and implementation of disaster recovery plan were still outstanding by the
end of 2019/2020 financial year. The outstanding projects will be concluded during 2020/2021
financial year.

160
Table 68: Information Communication Technology Service Policy Objectives
Information Communication Technology Service Policy Objectives as per IDP
Service
Objectives
Outline
Service
Targets
2017/201
8
2018/20
19 2019/2020
2020/20
21
2021/202
2
Target
Actua
l Target
Actua
l Target
Actua
l
Service
Indicators
*Previou
s Year
*Previou
s Year
*Curren
t Year
*Previou
s Year
*Curren
t Year
*Current
Year
*Followin
g Year
(i) (ii) (iii) (iv) (v) (vi) (vii) (viii) (ix) (x) (xi) (xii)
Service
Objective
Number of
ICT
Programm
es
Implement
ed
4 ICT
programme
s
implement
ed by 30
June 2020
2 2 2 4 2 4 4 2 1 1
Table 69: Employees ICT Services
EMPLOYEES ICT SERVICES
2018/2019 2019/2020 2019/2020
Job Level Employees Post Employees Vacancies Vacancy
%
Post Employees Vacancies Vacancy
%
0-3 0 0 0 0 0% 0 0 0 0%
4-6 1 1 1 0 0% 1 1 0 0%
7-9 0 0 0 0 0% 0 0 0 0%
10-12 3 9 7 2 22% 8 7 1 12.5%
13-15 1 2 2 0 0% 1 1 0 0%
16-18 0 0 0 0 0% 0 0 0 0%
19-20 0 0 0 0 0% 0 0 0 0%
TOTALS 5 12 10 2 17% 8 7 1 12.5%

161
3.19 PROPERTY, LEGAL, RISK MANAGEMENT AND PROCUREMENT SERVICES
3.19.1 Introduction
This function is performed to provide sound legal advice to the institution and also manage
administration. In its quest to ensure that the Council complies with legal prescripts, the Unit
advises on issues relating to rule of law, management of information, safeguarding of municipal
assets and the creation of environment that enables Council to perform its oversight function.
Measurable objectives for the period under review were as follows:
To ensure effective administration support and legal services
To ensure effective Management of Municipal assets.
Key performance highlights:
Provision of security management services to assets
The Chris Hani District Municipality values its human resources. Strides are continuously being
taken to ensure that its employees and councillors are safeguarded. Although there are security
breaches in the water treatment works, the municipality continue to use the services of security
companies to ensure that assets and lives of officials are safeguarded.
Though there has been reported incidents of vandalism and theft of assets from the water services
infrastructure premises, the Municipality continues to safeguard its premises. The capacity of the
security companies remains a problem, and this problem has manifested itself in the lack of
responsiveness of the companies during the tendering process. With the above in mind, a tender
for the provision of security services is to be re-advertised, and the intention is to appoint 4 (four)
service providers. The appointed service providers shall make assessments that will culminate in
the development and implementation of 4 (four) clustered sites specific security management
plans.
As at the end of the financial year, subject to needs of user-directorates, the following sites
continue to be guarded:
Table 70: Sites under security management services safeguard
SITE OFFICE TOWN POINT DIRECTORATE
INXUBA
YETHEMBA
Cradock Beeren Street Finance
Cradock Town Pump Station, Scalyn Pump Station, Geelbooi Pump
Station and Michausdal Pump Station and Industrial
Infrastructure
Middleburg Waste Water Treatment Works Infrastructure

162
Middleburg Midros Community Hall Finance
Middleburg Municipal Technical Services Building Finance
Middleburg Pump houses Infrastructure
ENOCH
MGIJIMA
Molteno Dam & Water Treatment Works Infrastructure
Molteno 43 Stuart Street Finance
Sterkstroom 57 John Vorster Drive Finance
Sterkstroom Dam, Waste Water Treatment Works and Water Treatment
Works
Infrastructure
Whittlesea Mtabaso Pump House
Tsolwana Water office in Tarkastad Finance &
Infrastructure
INTSIKA YETHU Cofimvaba Technical Services Yard Infrastructure
Cofimvaba 46 Windhurse Road Finance
Cofimvaba Tsojana Water Treatment Plant, Cofimvaba Water
Treatment Works and Ncora Water Treatment Works
Infrastructure
Tsomo Tsomo Water Treatment Plant, Infrastructure
Tsomo Prefabul at Police Station Infrastructure
ENGCOBO Engcobo Old Mutual Building, Cala Road Finance
Engcobo Engcobo Oxidation Ponds, Engcobo Water Treatment
Works and Nkobongo Treatment Works, Gqaga, Sitholeni
and Torha
Infrastructure
Engcobo Resource Centre and Tree Nursery Environmental Health
SAKHISIZWE Elliot 20 Bank Street Finance
Elliot & Cala Elliot Water Treatment Works
Elliot Waste Water Treatment Works
Cala Water Treatment Works
Cala Package Plant
Xalanga Water Treatment Works
Infrastructure
Elliot Elliot Fire Station Fire Services
Cala Cala Abbatoir IPED
EMALAHLENI Indwe Cnr Xalanga & Tilny Street Finance
Dodrecht 1 Klip Street Finance
Lady Frere 42 McKenzie Street Finance
Dordrecht Dordrecht Water Treatment Works
Dordrecht Waste Treatment water Works
Infrastructure
Lady Frere Macubeni Water Treatment Works Infrastructure
Indwe Indwe Water Treatment Works Infrastructure
MAIN OFFICE Komani 15 Bells Road – Guarding Services Headquarters
Komani 38-42 Cathcart Road Finance
Komani Tylden Street (Disaster Management Centre, IPED & Fleet
Management Services)
MHS, IPED &
Corporate Services
Komani 29 – 31 Prince Alfred Street MHS

163
Komani 63 Prince Alfred Street Internal Audit & Labour
Relations
Komani 21 Emerald Avenue, Top Town Mayoral Residence
Komani Former WSSSA Offices Infrastructure
Komani 42 Cathcart Road -Biometrics Access control system being
installed
Infrastructure
Komani 38 Cathcart Road –
Additional CCTV cameras and gate motor being installed
Finance
Komani 42 Cathcart Road – CCTV and computer equipment being
installed
Infrastructure
Komani Interface and relay to link BTO gate to access system Finance
Komani 42 Cathcart Road – CCTV and computer equipment being
installed
Infrastructure
Legal Services
Legal support is provided to senior management, directorates and Council on the exercise of
powers, functions and decision making. The objective that relate to this function is to ensure
effective administration support and legal services. An assessment of legal risks within the
municipality culminated in the adoption of the Litigation Management Strategy, which enables the
district to manage legal risk.
The strategy has the following 5 (five) Pillars:
a) Proactive Legal Support Services
b) Stakeholder Consultation
c) Litigation Risk Mitigation
d) Capacity Building
e) Co-operative Governance
The sub-unit planned to have 4 (four) programmes for the 2018-19 financial spread over the 4(four)
quarters of the year. Of the four programmes, only the in-house training relating to Drafting of
Contracts was not implemented due to the lack of dates within the institution that are suitable to
the external attorneys.
The Office of the Chief State Law Advisor, attached to the Office of the Premier, continue to assist
in the capacity building of the structures of the Municipality in the following 3 (three) programmes:
a) Promotion of Access to Information Act mainstreaming;
b) Promotion of Administrative Justice Act mainstreaming;
c) Legislative Development

164
Generally, the state of the Municipality’s legal matters has been stable, with all the potential legal
threats having been dealt with as and when they come to the attention of the institution. However,
with more infrastructure projects being advertised for invitation for tenders, there has been an
upward surge in the requests for information in terms of the Promotion of Access to Information
Act, and also tender appeals in terms of Rule 53 of the High Court, in conjunction with the
Promotion of Administrative Justice Act.
The Legal Services Unit has identified the following litigation risks, which shall reflect in the
Litigation Risk Register of the institution:
Public liability arising from sewerage spillages and lack of adequate drinkable water;
Legality of decisions of the municipality’s structures
Lack of review of by-laws
Lack of sustainable debt collection
Vicarious (third party) liability arising from motor vehicles and other transgressions while
both elected and appointed officials while within the course and scope of duty for the
Municipality
Injury on duty
Land right claims
Highlight
No Municipality’s assets have been attached and removed in execution.
Council Support
Council support has an objective of ensuring effective administration support and legal services.
Under this objective there were four programmes that were geared to ensure that there is
compliance with Rules of Order, and also that Council and its committees operate seamlessly.
Support has been provided to Council, Mayoral Committee, standing committees and the Local
Labour Forum, by means of not only taking minutes, but also preparation of resolution registers,
council resolution extracts and monitor the attendance of councillors in meetings. Though most of
the Section 80 meetings were held, they were not held as scheduled in terms of the Council
Calendar, and however there was substantial compliance with the rules and orders of Council
whenever the need to reschedule arose. The Council’s resolution register has been continuously
updated, and reports on the implementation of Council Resolutions were regularly submitted to
Council for noting.

165
Automation of Records and Improved Record Management Processes and Procedures
The municipality’s Records Section is entrusted with the responsibility of ensuring that the
institutional information and heritage is properly managed. Its objective is to ensure proper
document management system in line with the Records Management Policy. Although the
management of records in the municipality is still decentralized, great strides have been made to
ensure that the Records management Policy is implemented.
Records management is not automated yet as the bid for supply and implementation of the
electronic document management system has once again been cancelled due to the non-
responsiveness of tenderers. The Municipality intend to use SharePoint as a vehicle to achieve
the goal.
Though there has been no litigation relating to lack of access to information, the poor record
keeping is likely to be mostly felt when the Auditor General expresses its opinion about limitation
of scope within the Directorate: Finance. There has been awareness campaigns in various
directorates that relate to file management, which is inclusive of file planning, referencing and
disposal.
Safeguarding and Maintenance of Municipal Fleet
CHDM has a total fleet of 190 vehicles of which 55 are allocated for General Use (main pool), Fire
services, Disaster Management, Councillors and Billing Services. The remaining 135 are mainly
dedicated for water services and are reported separately. Pool vehicles are allocated for general
use and serve as relief vehicles to the entire Municipality, especially when specifically, allocated
vehicles break down. 20 of these vehicles have been approved for disposal in the 2nd quarter
2020 and 4 were declared beyond Economic Repair in 20/21 (24 to be disposed).
The Municipality’s vehicles are classified in accordance with their gross vehicle mass. Vehicles
such as sedans, Bakkies and other small to medium utility vehicles with Gross Vehicle Mass
(GVM) of less than 3500 have the lifespan of 5 (five) years, while trucks (mostly performing water
related activities) with Gross Vehicle Mass (GVM) of more than 3500 have a life span of 15 (fifteen)
years. Emergency vehicles less than 3500 (GVM) have a lifespan of 7 seven years as they are
underutilised for a reason, thus they only used to respond in emergencies.
THE FOLLOWING IS THE BREAKDOWN OF POOL VEHICLES AND DESCRIPTION OF
VEHICLES.

166
Table 71: Breakdown of Pool Vehicles and Description of Vehicles
Allocation Description of Vehicles No Condition
W ater Services
provisions- Local
Municipality( East Side)
Bakkies 39 Good
Diesel Tankers 03 Good
Diesel Tanker Truck 01 Fair
Crew Cabs 02 Fair
Water Tankers 16 Good/Fair
Septic Tankers 04 Good/Fair
Environmental Health
Services
Bakkies 05 5 Good condition
W ater Services
provisions- Local
Municipality( West Side)
Bakkies(Tippers/LDV) 50 Good
Diesel Tankers 02 Good
Water Tanker 07 Good
Septic Tankers 04 Good
Tractor 01 Good
Councillors 6 Executive Vehicles
1 Sedan , 4 Ldv Executive
1 Mini Bus (7-Seater)
12 8 Good Condition
4 will be disposed due to the lifespan reached and
replaced. 2 None running.
Pool (Support East,
West)
When need arises
Roll back Trucks 02
NEW
Pool Water Trucks
(Relief) Water Tankers 14000L 06 Good
Pool TLB (Support
East/West) TLB 02 Good
Pool Drop side Trucks, Communication
Truck 02 1 BER (Beyond Economical Repair) Drop side
Pool (Relief and
administration) LDV 14 Good
Pool 22-Seater Bus 1 Good
Pool 7-Seater (Avanza) 1 Good
Pool (Billing ) 7-Seater (Avanza) 4 Good
Fire Services Ldv LDV 6
Good
Fire Services Truck Fire Engine Truck 1
Good
Fire Services Truck Water Tanker 1400L 1 Good

167
Disaster Management
LDV LDV 3
Good
Disaster Management
Bus Bus 1
Good
Total no of Vehicles
190
Summary and Categories Of Water Services Vehicles
Table 72: Categories of Water Services Vehicles
Description LDV Water Diesel
Truck
Diesel
Tankers Tractor Sewer Crew Cab
Environmental
Services TOTAL
East 39 16 1 3 0 4 2 5 70
West 50 7 0 2 1 4 0 1 65
Total 89 23 1 5 1 8 2 6 135
The CHDM is anticipating on procuring additional vehicles, due to the fact that the scope of work
has increased, and more personnel have been hired in the water services department, thus
performing the Municipal functions diligently and effectively.
Table 73: Property, legal Service, Security Management, Council Support, Municipal Fleet and
Documents Management Policies
Property legal risk Service Policy as
per IDP
Service
Indicators
Outline
Service
Targets
2017/201
8
2018/2019 2019/
2020
2020/2021 2021/2022
Target Actual Target Actual Targe
t
Actua
l
*Previous
Year
*Previ
ous
Year
*Curr
ent
Year
*Previ
ous
Year
*Current
Year
*Current Year *Following
Year
(i) (ii) (iii) (iv) (v) (vi) (vii) (viii) (ix) (x) (xi) (xii)
Service
Objective
Number of
Municipal
vehicles
managed
168
Municipal
Vehicles
Managed
21 32 21 99 99 99 46 190 190 190
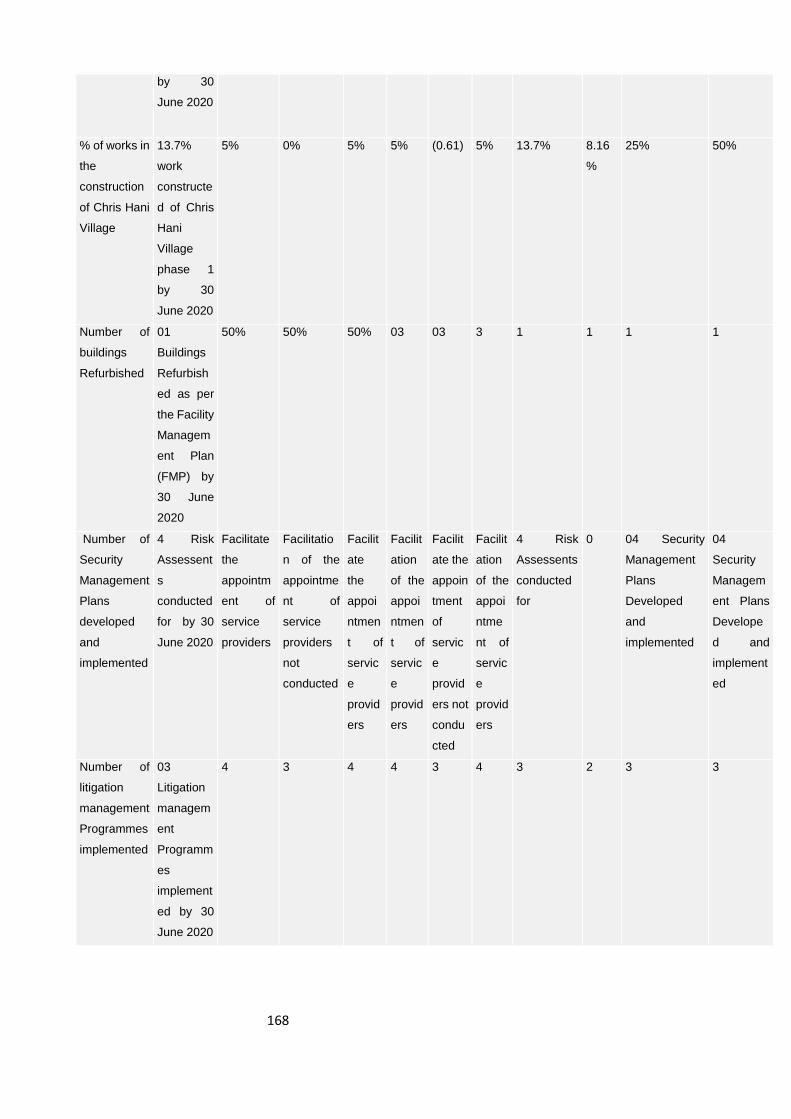
168
by 30
June 2020
% of works in
the
construction
of Chris Hani
Village
13.7%
work
constructe
d of Chris
Hani
Village
phase 1
by 30
June 2020
5% 0% 5% 5% (0.61) 5% 13.7% 8.16
%
25% 50%
Number of
buildings
Refurbished
01
Buildings
Refurbish
ed as per
the Facility
Managem
ent Plan
(FMP) by
30 June
2020
50% 50% 50% 03 03 3 1 1 1 1
Number of
Security
Management
Plans
developed
and
implemented
4 Risk
Assessent
s
conducted
for by 30
June 2020
Facilitate
the
appointm
ent of
service
providers
Facilitatio
n of the
appointme
nt of
service
providers
not
conducted
Facilit
ate
the
appoi
ntmen
t of
servic
e
provid
ers
Facilit
ation
of the
appoi
ntmen
t of
servic
e
provid
ers
Facilit
ate the
appoin
tment
of
servic
e
provid
ers not
condu
cted
Facilit
ation
of the
appoi
ntme
nt of
servic
e
provid
ers
4 Risk
Assessents
conducted
for
0 04 Security
Management
Plans
Developed
and
implemented
04
Security
Managem
ent Plans
Develope
d and
implement
ed
Number of
litigation
management
Programmes
implemented
03
Litigation
managem
ent
Programm
es
implement
ed by 30
June 2020
4 3 4 4 3 4 3 2 3 3

169
Number of
Administratio
n support
programmes
implemented
1
Administra
tion
support
programm
es
implement
ed by 30
June 2020
4 4 4 4 3 4 1 1 1 1
Number of
Record
Management
Programmes
implemented
02 Record
Managem
ent
programm
es
implement
ed by 30
June 2020
30% 0% 30% 3 2 3 2 0 2 2
Table 74: Employees Legal services
EMPLOYEES ICT SERVICES
2017/2018 2018/2019 2019/2020
Job
Level
Employees Post Employees Vacancies Vacancy
%
Post Employees Vacancies Vacancy %
0-3 0 0 0 0 0% 0 0 0 0%
4-6 1 1 1 0 0% 1 1 0 0%
7-9 0 0 0 0 0% 0 0 0 0%
10-12 7 6 4 2 22% 6 5 1 16%
13-15 2 1 1 0 0% 1 1 0 0%
16-18 0 0 0 0 0% 0 0 0 0%
19-20 0 0 0 0 0% 0 0 0 0%
TOTALS 10 8 6 2 17% 8 7 1 12.5%

170
COMPONENT K: ORGANISATION PERFORMANCE SCORECARD
3.20 Annual Performance Report
Component includes: Annual Performance Scorecard Report for the current year
Measurable Objectives
5 YR Outcome
Strategy KPI Indicator Code
2018-2019 Financial Year 2019-2020 Financial year
SnapShot
Variances Remedial Evidence Custodian
Annual Target
Actual Performance
Annual Target Actual Performance
To Attract, Retain and Build a productive workforce Integrated Health, Wellness and Safety
Increased productivity and improved service delivery
Implementation of Integrated Human Resources Management Programs
Number of IHRM programmes implemented
MTOD – 1
09 Integrated Human Resource Management Programmes by 30 June 2019
07 Integrated Human Resource Management Programmes
07 Integrated Human Resource Management Programmes by 30 June 2020
Target achieved 04 Integrated Human Resource Management Programmes
Refer to the indicator MTOD 1.1 to MTOD1. 9 for actual performance
Refer to the indicator MTOD 1.1 to MTOD1. 9 for actual performance
IHRM Programmes reports
Director: Corporate Services
Number of WSP programmes implemented
MTOD-1.1
15 WSP training programmes implemented by 30 June 2019
15 WSP training programmes implemented
10 WSP training programmes implemented by 30 June 2020
Target not achieved 4 WSP training programmes implemented
Stakeholders targeted for the remaining trainings were not available Covid 19 Lockdown.
Consideration in the future WSP and implementation in the 1st and 2nd quarter.
Attendance registers; Training programme & report
Director: Corporate Services

171
Measurable Objectives
5 YR Outcome
Strategy KPI Indicator Code
2018-2019 Financial Year 2019-2020 Financial year
SnapShot
Variances Remedial Evidence Custodian
Annual Target
Actual Performance
Annual Target Actual Performance
Number of Employees undergoing Process Controller Learnership
MTOD-1.2
Facilitated the appointment of service provider for 25 Employees undergoing Process Controller Learnership by 30 June 2019
No
appointment of service provider for 25 Employees undergoing Process Controller Learnership facilitated
Facilitated the appointment of service provider for 25 Employees undergoing Process Controller Learnership by 30 June 2020
Target not achieved Facilitated the appointment of service provider for 25 Employees undergoing Process Controller Learnership on conducted.
Service provider not yet appointed by SCM due to Budget cut
Mobilization of funds and consideration of the programme
Terms of reference, Budget report
Director: Corporate Services
Number of vacant funded positions filled and Employment Equity
MTOD-1.3
20 Vacant funded positions filled and 1 Employment
20 Vacant funded positions filled and 1 Employment Equity Plan
20 Vacant funded positions filled and 1 Employment Equity Plan implement
Target achieved 22 vacant funded positions filled and 1 Employm
Critical positions have to be filled.
N/A Adverts, Appointment Letters, Recruitment report, Employ
Director: Corporate Services

172
Measurable Objectives
5 YR Outcome
Strategy KPI Indicator Code
2018-2019 Financial Year 2019-2020 Financial year
SnapShot
Variances Remedial Evidence Custodian
Annual Target
Actual Performance
Annual Target Actual Performance
Plan implemented
Equity Plan implemented by 30 June 2019
implemented
ed by 30 June 2020
ent Equity Plan implemented
ment Equity Plan, Approved staff establishment, Council resolution
Number of reviewed Staff Establishment
MTOD-1.4
1 reviewed staff establishment and approved by 30 June 2019
1 reviewed staff establishment and approved
1 reviewed staff establishment and approved by 30 June 2020
Target achieved 1 reviewed staff establishment and approved by Council
N/A N/A Attendance register and Report (Directorate& HOD's) & Draft staff establishment Minutes (LLF) & Attendance register Council resolution,
Director: Corporate Services

173
Measurable Objectives
5 YR Outcome
Strategy KPI Indicator Code
2018-2019 Financial Year 2019-2020 Financial year
SnapShot
Variances Remedial Evidence Custodian
Annual Target
Actual Performance
Annual Target Actual Performance
Approved staff establishment.
Number of CHDM Job Descriptions writing facilitate
MTOD-1.5
50 Job descriptions writing facilitated by 30 June 2019
27 Job descriptions writing facilitated
50 Job descriptions writing facilitated by 30 June 2020
Target Not Achieved
The facilitation was conducted however departments did not finalize their Job description.
The indicator will be amended to ensure clear lines of accountability in SDBIP 2020-2021.
Attendance register and JD writing report, Completed JD's ,
Director: Corporate Services
Number of Quarterly Individual Performance Assessments conducted
MTOD-1.5.1
N/A N/A 3 Quarterly Individual Performance Assessments conducted by 30 June 2020
Target not achieved Quarterly Individual Performance Assessments not conducted
Quarterly Individual Performance Assessments were not conducted to none submission of signed Accountability Agreemen
All Signed Accountability Agreements to be submitted in the next to make way for the assessments process
Report on Individual Performance
Director: Strategic Management Services

174
Measurable Objectives
5 YR Outcome
Strategy KPI Indicator Code
2018-2019 Financial Year 2019-2020 Financial year
SnapShot
Variances Remedial Evidence Custodian
Annual Target
Actual Performance
Annual Target Actual Performance
ts by Middle Managers
to take place.
Number of Provisional Outcomes Report submitted to Provincial Audit Committee
MTOD-1.6
4 Provisional Outcomes Report submitted to Provincial Audit Committee by 30 June 2019
2 Provisional Outcomes Report submitted to Provincial Audit Committee
4 Provisional Outcomes Report submitted to Provincial Audit Committee by 30 June 2020
Target achieved 4 Provisional Outcomes Report submitted to Provincial Audit Committee
N/A N/A Provisional Outcomes Report, Confirmation for submission of POR to PAC
Director: Corporate Services
Number of Labour Relations Programme implemented
MTOD-1.7
4 Labour Relations Programme implemented by 30 June 2019
4 Labour Relations Programme implemented
4 Labour Relations Programme implemented by 30 June 2020
Target not achieved 3 Labour Relations Programme implemented
Stakeholders targeted for the remaining trainings were not available Covid 19 Lockdown.
The outstanding programs will be conducted in Quarter 2 of 2020 /2021
Attendance register, Programme outline. Programme report
Director: Corporate Services
Number of Local Labour
MTOD-
4 Local Labour Forum
5 Local Labour Forum
4 Local Labour Forum
Target Achieved
Matters of mutual interests
N/A Attendance register;
Director: Corporat

175
Measurable Objectives
5 YR Outcome
Strategy KPI Indicator Code
2018-2019 Financial Year 2019-2020 Financial year
SnapShot
Variances Remedial Evidence Custodian
Annual Target
Actual Performance
Annual Target Actual Performance
Forum meetings convened
1.7.1
Meetings convened by 30 June 2019
Meetings convened
Meetings convened by 30 June 2020
10 Local Labour Forum Meetings convened
warranted the parties to engage
Minutes of the meeting
e Services
Increased productivity and improved service delivery
Implement Integrated health, wellness and safety programmes
Number of Integrated Health, Wellness, and Safety Programmes implemented
MTOD-2
4 Integrated Health, Wellness and Safety programmes implemented by 30 June 2019
4 Integrated Health, Wellness and Safety programmes implemented
6 Integrated Health, Wellness and Safety programmes implemented by 30 June 2020
Refer to the indicator MTOD 2.1 to MTOD 2.2 for actual performance
Refer to the indicator MTOD 2.1 to MTOD 2.2 for actual performance
Refer to the indicator MTOD 2.1 to MTOD 2.2 for actual performance
Report Integrated Health, Wellness, Mainstreaming and Safety Programmes implemented
Director: Corporate Services
Number of Health and Wellness Programmes implemented
MTOD-2.1
2 Wellness and Health Programmes implemented by 30 June 2019.
2 Wellness and Health Programmes implemented
3 Wellness and Health Programmes implemented by 30 June 2020.
Refer to the indicator MTOD 2.1.1 for actual performance
Refer to the indicator MTOD 2.1.1 for actual performance
Refer to the indicator MTOD 2.1.1 for actual performance
Programme reports and attendance register
Director: Corporate Services

176
Measurable Objectives
5 YR Outcome
Strategy KPI Indicator Code
2018-2019 Financial Year 2019-2020 Financial year
SnapShot
Variances Remedial Evidence Custodian
Annual Target
Actual Performance
Annual Target Actual Performance
Number of Wellness Programmes implemented
MTOD-2.1.1
2 Wellness Programmes implemented by 30 June 2019
2 Wellness Programmes implemented
2 Wellness Programmes implemented by 30 June 2020
Refer to the indicator MTOD 2.1.1.1 to MTOD 2.1.1.3 for actual performance
Refer to the indicator MTOD 2.1.1.1 to MTOD 2.1.1.3 for actual performance
Refer to the indicator MTOD 2.1.1.1 to MTOD 2.1.1.3 for actual performance
Programme reports and attendance register
Director: Corporate Services
Number of counselling and Life coaching programme implemented
MTOD-2.1.1.1
4 Counselling and Life coaching programme implemented by 30 June 2019
4 Counselling and Life coaching programme implemented
4 Counselling and Life coaching programme implemented by 30 June 2020
Target not achieved 3 Counselling and Life coaching programme implemented
Stakeholders targeted for the remaining programme were not available Covid 19 Lockdown.
The outstanding programs will be conducted in Quarter 1 of 2020 /2021
Programme reports, Attendance register
Director: Corporate Services
Number of substance abuse and Addictions
MTOD-2.1.1.2
4 Substance abuse and Addictions program
4 Substance abuse and Addictions programmes
3 Substance abuse and Addictions programmes Implement
Target achieved 3 Substance abuse and Addiction
N/A N/A Attendance register, Programme report
Director: Corporate Services

177
Measurable Objectives
5 YR Outcome
Strategy KPI Indicator Code
2018-2019 Financial Year 2019-2020 Financial year
SnapShot
Variances Remedial Evidence Custodian
Annual Target
Actual Performance
Annual Target Actual Performance
programmes implemented
mes Implemented by 30 June 2019
Implemented
ed by 30 June 2020
s programmes Implemented
Number of Organizational Wellness and Mainstreaming programmes implemented
MTOD-2.1.2
4 Organizational Wellness and Mainstreaming programmes implemented by 30 June 2019
4 Organizational Wellness and Mainstreaming programmes implemented
3 Organizational Wellness and Mainstreaming programmes implemented by 30 June 2020
Target Achieved 3 organizational wellness programmes implemented trough change management, healthy retirement and drafting of will,
N/A N/A Programme report, Attendance registers
Director: Corporate Services
Number of Health Management programmes
MTOD-2.1.3
N/A N/A 4 Health Management Programmes implement
Target not achieved 3 Health Management
Stakeholders targeted for the remaining program
The outstanding programs will be conduct
Reports, attendance registers
Director: Corporate Services

178
Measurable Objectives
5 YR Outcome
Strategy KPI Indicator Code
2018-2019 Financial Year 2019-2020 Financial year
SnapShot
Variances Remedial Evidence Custodian
Annual Target
Actual Performance
Annual Target Actual Performance
implemented
ed by 30 June 2020
Programmes implemented
me were not available Covid 19 Lockdown.
ed in Quarter 1 of 2020 /2021
Number of Occupational Health and Safety Programmes implemented
MTOD-2.2
2 Occupational Health and Safety Programmes implemented by 30 June 2019
2 Occupational Health and Safety Programmes implemented
3 Occupational Health and Safety Programmes implemented by 30 June 2020
Refer to the indicator MTOD 2.2.1 and MTOD 2.2.2 for actual performance
Refer to the indicator MTOD 2.2.1 and MTOD 2.2.2 for actual performance
Refer to the indicator MTOD 2.2.1 and MTOD 2.2.2 for actual performance
Assessment and vaccination reports & registers
Director: Corporate Services
Number of Medical assessments and Vaccination Programme Implemented
MTOD-2.2.1
500 employees medically assessed, vaccinated and 1 health risk assessment conducted by 30 June 2019
Target Exceeded 585 employees medically assessed, vaccinated and 1 health risk assessment conducted (Intsika Yethu)
4 Medical assessments and Vaccination Programme Implemented by 30 June 2020
Target achieved 4 Medical assessments and Vaccination Programme Implemented
N/A N/A Assessment and vaccination reports & registers
Director: Corporate Services

179
Measurable Objectives
5 YR Outcome
Strategy KPI Indicator Code
2018-2019 Financial Year 2019-2020 Financial year
SnapShot
Variances Remedial Evidence Custodian
Annual Target
Actual Performance
Annual Target Actual Performance
Number of Satellite Offices provided with Personal Protective Clothing and hygiene consumables
MTOD-2.2.2
6 Satellite Offices provided with Personal Protective Clothing and hygiene consumables by 30 June 2020
6 Satellite Offices were provided with Personal Protective Clothing and hygiene consumables however overalls and freezer jackets were not provided during end of June.
6 Satellite Offices provided with Personal Protective Clothing and hygiene consumables by 30 June 2020
Target not achieved: 6 Satellite Offices were provided with Personal Protective Clothing and hygiene consumables however overalls and freezer jackets were not provided during end of June.
National lock down caused delays by suppliers to provide overalls and freezer jackets.
Distributions of overalls and freezer jackets will be delivered in quarter 1 of 2020-2021.
Signed distribution register and report
Director: Corporate Services
Number of Occupational
MTOD-
N/A N/A 1 Occupational Health and Safety
Target achieved 1 Occupati
N/A N/A OHS Strategy and Plan,
Director: Corporate Services

180
Measurable Objectives
5 YR Outcome
Strategy KPI Indicator Code
2018-2019 Financial Year 2019-2020 Financial year
SnapShot
Variances Remedial Evidence Custodian
Annual Target
Actual Performance
Annual Target Actual Performance
Health and Safety Strategy approved and implemented
2.2.3
Strategy approved by 30 June 2020
onal Health and Safety Strategy and Plan Adopted by Council on 29/06/2020
Council Approval
To ensure effective Management of Municipal assets.
Sustainable delivery of services
Implementation of Fleet Management Policy
Number of Municipal vehicles managed
MTOD - 3
99 Municipal Vehicles Managed by 30 June 2019
99 Municipal Vehicles Managed
168 Municipal Vehicles Managed by 30 June 2020
Refer to the indicator MTOD 3.1 and MTOD 3.2 for actual performance
Refer to the indicator MTOD 3.1 and MTOD 3.2 for actual performance
Refer to the indicator MTOD 3.1 and MTOD 3.2 for actual performance
Municipal vehicles reports
Director: Corporate Services
Percentage of municipal vehicles serviced/maintained as per dealer
MTOD 3.1
77 Municipal Vehicles Maintained by 30 June 2019
77 municipal vehicles maintained
100% Municipal vehicles serviced/maintained as per dealer specificati
Target achieved 100% Municipal vehicles serviced/maintained as per
N/A N/A Occurrence book, Clearance certificate,
Director: Corporate Services

181
Measurable Objectives
5 YR Outcome
Strategy KPI Indicator Code
2018-2019 Financial Year 2019-2020 Financial year
SnapShot
Variances Remedial Evidence Custodian
Annual Target
Actual Performance
Annual Target Actual Performance
specification and on request by user
on and on request by user by 30 June 2020
dealer specification and on request by user
Number of Municipal Vehicles acquired
MTOD 3.2
22 Municipal Vehicles acquired by 30 June 2019
23 vehicles acquired
4 Municipal Vehicles acquired by 30 June 2020
Target not achieved 2 Municipal Vehicles acquired
Procurement process restarted on the 25th of May 2020 and the Bid Specification Committee considered the bid. The bid is advertised will be closed on 29th July 2020.
The 2 vehicles are out on tender and they will be purchased in the quarter 2 of the financial year.
Orders , Invoices and Delivery Notes
Director: Corporate Services
Implementation of
% of works in the
MTOD - 4
2% work constructed of Chris Hani Village phase 1 by
Target not achieved (0.61) work constructed
13.7% of works in the
Target not Achieved
Covid- 19 lock down had an
Construction on phase
Signed Site minutes
Director: IPED

182
Measurable Objectives
5 YR Outcome
Strategy KPI Indicator Code
2018-2019 Financial Year 2019-2020 Financial year
SnapShot
Variances Remedial Evidence Custodian
Annual Target
Actual Performance
Annual Target Actual Performance
Facility Management Plan
construction of Chris Hani Village phase 1
30 June 2019
on Chris Hani Village phase 1
construction of Chris Hani Village phase 1 by 30 June 2020
8.16% of work constructed of Chris Hani Village
impact on the construction industry
one main site to resume in the first quarter of 2020-2021 financial year.
, Progress reports, Construction Works Programme
Number of buildings Refurbished
MTOD - 5
03 Buildings Refurbished by 30 June 2019
Target Achieved 03 Buildings Refurbished
01 Buildings Refurbished as per the Facility Management Plan (FMP) by 30 June 2020
Target Achieved 01 Buildings Refurbished as per the Facility Management Plan (FMP) at Cradock Offices
N/A N/A Progress reports, Completion certificate
Director: IPED
To ensure effective
Sustainable delivery of
Development and Implementation
Number of Security Management
MTOD - 6
Facilitate the appointment of service providers by 30 June 2019
Target Achieved Facilitated the appointment of service providers
04 Security Risk Assessments
Target Not Achieved
Bid cancelled, and thus no
Bid to be re-advertised after complia
Bid cancellation report
Director: Corporate Services

183
Measurable Objectives
5 YR Outcome
Strategy KPI Indicator Code
2018-2019 Financial Year 2019-2020 Financial year
SnapShot
Variances Remedial Evidence Custodian
Annual Target
Actual Performance
Annual Target Actual Performance
Management of Municipal assets
services
of Security Management Plan
Plans developed and implemented
conducted by 30 June 2020
appointment
nce with prescripts.
Implementation of ICT work study report on business integration technology enablement
Number of ICT Programmes Implemented
MTOD - 7
4 ICT programmes implemented by 30 June 2019
Target not achieved 1 ICT programmes implemented
4 ICT programmes implemented by 30 June 2020
Refer to the indicator MTOD 7.1 to MTOD 7.4 for actual performance
Refer to the indicator MTOD 7.1 to MTOD 7.4 for actual performance
Refer to the indicator MTOD 7.1 to MTOD 7.4 for actual performance
ICT reports
Director: Corporate Services
Number of ICT infrastructure upgrades
MTOD-7.1
3 ICT infrastructure upgrades by 30 June 2019
Target Achieved
4 ICT infrastructure upgrades by 30 June 2020 (Engcobo LM,Intsika Yethu LM, Sakhisizwe LM, Enoch Mgijima LM by 30 June 2020
Target achieved 4 ICT infrastructure upgraded at Engcobo LM,Intsika Yethu LM, Sakhisizwe LM, Enoch
N/A N/A Quarterly report & Completion Certificate
Director: Corporate Services
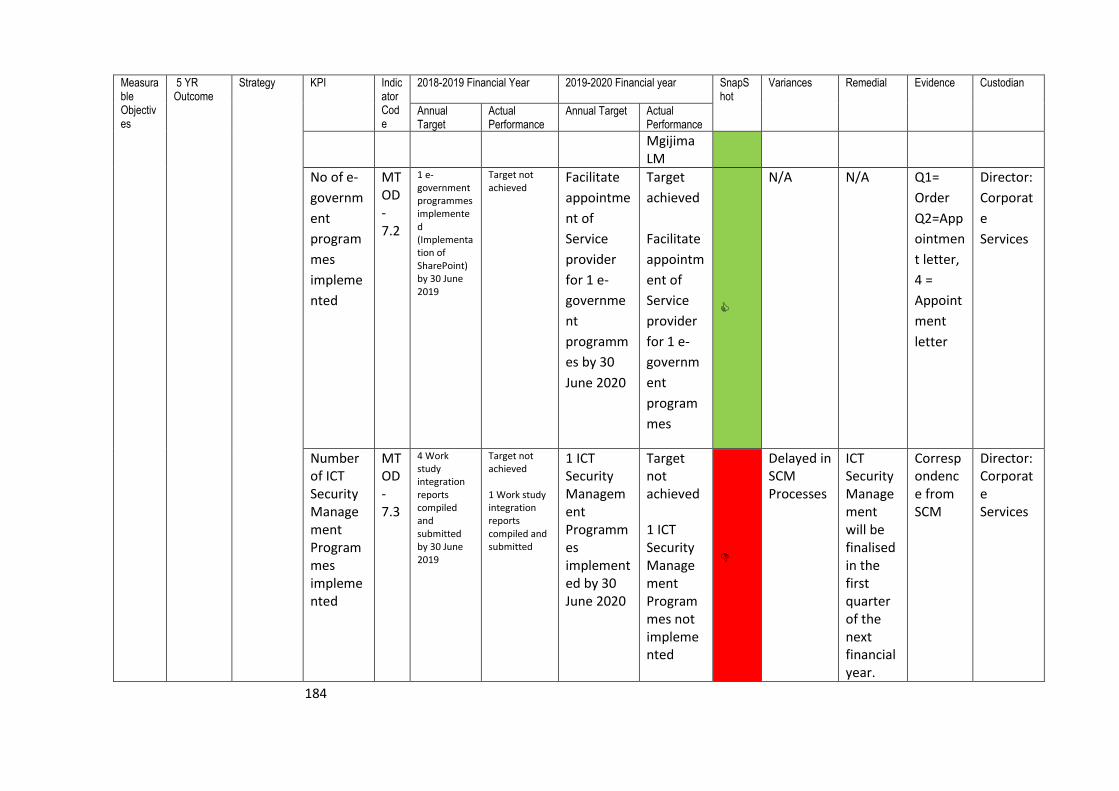
184
Measurable Objectives
5 YR Outcome
Strategy KPI Indicator Code
2018-2019 Financial Year 2019-2020 Financial year
SnapShot
Variances Remedial Evidence Custodian
Annual Target
Actual Performance
Annual Target Actual Performance
Mgijima LM
No of e-
governm
ent
program
mes
impleme
nted
MTOD-7.2
1 e-government programmes implemented (Implementation of SharePoint) by 30 June 2019
Target not achieved
Facilitate
appointme
nt of
Service
provider
for 1 e-
governme
nt
programm
es by 30
June 2020
Target
achieved
Facilitate
appointm
ent of
Service
provider
for 1 e-
governm
ent
program
mes
N/A N/A Q1=
Order
Q2=App
ointmen
t letter,
4 =
Appoint
ment
letter
Director:
Corporat
e
Services
Number of ICT Security Management Programmes implemented
MTOD-7.3
4 Work study integration reports compiled and submitted by 30 June 2019
Target not achieved 1 Work study integration reports compiled and submitted
1 ICT Security Management Programmes implemented by 30 June 2020
Target not achieved 1 ICT Security Management Programmes not implemented
Delayed in SCM Processes
ICT Security Management will be finalised in the first quarter of the next financial year.
Correspondence from SCM
Director: Corporate Services

185
Measurable Objectives
5 YR Outcome
Strategy KPI Indicator Code
2018-2019 Financial Year 2019-2020 Financial year
SnapShot
Variances Remedial Evidence Custodian
Annual Target
Actual Performance
Annual Target Actual Performance
Number of Disaster Recovery Plan implemented
MTOD-7.4
4 Service migration reports compiled and submitted by 30 June 2019
Target not achieved
1 Disaster Recovery Plan implemented by 30 June 2020
Target not Achieved Disaster Recovery Plan not implemented
The assessment of ICT however due to lack of additional resources on Disaster Recovery Plan.
The improvement on ICT Infrastructure shall be implemented during the midterm 2020-2021.
Assessment report
Director: Corporate Services
To ensure effective administration support and legal services To ensure
Effective support to Council and Administration
Implementation of Administration support and Legal services programmes
Number of Administration Support and Legal Services Programmes implemented
MTOD - 8
03 Administration Support and Legal Services Programmes implemented by 30 June 2020
Refer to the indicator MTOD 8.1.1.1 for actual performance
Refer to the indicator MTOD 8.1.1.1 for actual performance
Refer to the indicator MTOD 8.1.1.1 for actual performance
Administration Support and Legal Services Report
Director: Corporate Services
Number of Legal Services Programmes
MTOD - 8.1
N/A N/A 1 Legal Services Programmes implement
Refer to the indicator MTOD 8.1.1.1
Refer to the indicator MTOD 8.1.1.1
Refer to the indicator MTOD 8.1.1.1
Legal Services Report
Director: Corporate Services

186
Measurable Objectives
5 YR Outcome
Strategy KPI Indicator Code
2018-2019 Financial Year 2019-2020 Financial year
SnapShot
Variances Remedial Evidence Custodian
Annual Target
Actual Performance
Annual Target Actual Performance
effective and efficient Records Management
implemented
ed (litigation) by 30 June 2020
for actual performance
for actual performance
for actual performance
Number of Litigation Management Programme
MTOD - 8.1.1
4 Litigation Management Programme implemented by 30 June 2019
3 Litigation Management Programme implemented
3 Litigation Management Programme implemented (1.Litigation Awareness, 2.Response to access for information attended to, 3.Response to all New Litigation Cases defended/opposed/Settled attended
Refer to the indicator MTOD 8.1.1.1 for actual performance
Refer to the indicator MTOD 8.1.1.1 for actual performance
Refer to the indicator MTOD 8.1.1.1 for actual performance
Litigation Management Report
Director: Corporate Services

187
Measurable Objectives
5 YR Outcome
Strategy KPI Indicator Code
2018-2019 Financial Year 2019-2020 Financial year
SnapShot
Variances Remedial Evidence Custodian
Annual Target
Actual Performance
Annual Target Actual Performance
to ) by 30 June 2020
Number of Litigation Awareness conducted
MTOD - 8.1.1.1
N/A N/A 3 Litigation Awareness conducted by 30 June 2020
Target not 2 Litigation Awareness conducted
Stakeholders targeted for the remaining programme were not available due to Covid 19 Lockdown.
The Unit is targeting policy workshops, Unit and Directorate meetings, some of which are virtual, for the purposes of awareness campaigns. A presentation has already been made to the policy workshop that was held on the 20th of
Reports, Attendance registers, Invitations
Director: Corporate Services

188
Measurable Objectives
5 YR Outcome
Strategy KPI Indicator Code
2018-2019 Financial Year 2019-2020 Financial year
SnapShot
Variances Remedial Evidence Custodian
Annual Target
Actual Performance
Annual Target Actual Performance
August 2020.
% Response to access for information attended to
MTOD - 8.1.1.2
N/A N/A 100% Response to access for information attended to by 30 June 2020
Target achieved 100% Response to access for information attended to
N/A N/A PAIA requests register, Form A PAIA request, Response to PAIA request,
Director: Corporate Services
% Response to all New Litigation Cases defended/opposed/Settled attended to
MTOD - 8.1.1.3
N/A N/A 100% Response to all New Litigation Cases defended/opposed/Settled attended to by 30 June 2020
Target achieved 100% Response to all New Litigation Cases defended/opposed/Settled attended to
N/A N/A Contigency liability register, Legal Confirmations from Laws, Litigation Cases register
Director: Corporate Services
Effective administration support
Number of Administrative
MTOD - 8.2
4 Administration support programmes implemente
Target Achieved 3 Administration support
1 Administrative support
Refer to the indicator MTOD
Refer to the indicator MTOD
Refer to the indicator MTOD
Quarterly Reports, Attenda
Director: Corporate Services

189
Measurable Objectives
5 YR Outcome
Strategy KPI Indicator Code
2018-2019 Financial Year 2019-2020 Financial year
SnapShot
Variances Remedial Evidence Custodian
Annual Target
Actual Performance
Annual Target Actual Performance
support programmes implemented
d by 30 June 2019
programmes implemented
programmes implemented by 30 June 2020
8.2.1 for actual performance
8.2.1 for actual performance
8.2.1 for actual performance
nce registers
Number of Secretariat Administration support programmes implemented
MTOD - 8.2.1
N/A N/A 12 (3*4) Secretariat Administration support programmes implemented by 30 June 2020
Target achieved 12 (3*4) Secretariat Administration support programmes implemented by 30 June 2020
N/A N/A Quarterly Reports; Attendance registers, Agendas
Director: Corporate Services
Effective management of Records
Implementation of Records Management Policy
Number of Record Management Programmes implemented
MTOD - 8.3
03 Record Management programmes implemented by 30 June 2019
Target not Achieved 02 Record Management programmes implemented
02 Record Management programmes implemented by 30 June 2020
Refer to the indicator MTOD 8.3.1 to MTOD 8.3.4 for actual performance
Refer to the indicator MTOD 8.3.1 to MTOD 8.3.4 for actual performance
Refer to the indicator MTOD 8.3.1 to MTOD 8.3.4 for actual performance
Quarterly Reports; Attendance registers,
Director: Corporate Services

190
Measurable Objectives
5 YR Outcome
Strategy KPI Indicator Code
2018-2019 Financial Year 2019-2020 Financial year
SnapShot
Variances Remedial Evidence Custodian
Annual Target
Actual Performance
Annual Target Actual Performance
Number of File Plan Awareness campaigns conducted
MTOD - 8.3.1
4 File Plan Awareness campaigns conducted by 30 June 2019
Target achieved 4 File Plan Awareness campaigns conducted
6 File Plan Awareness campaigns conducted by 30 June 2020
Target not achieved 5 File Plan Awareness campaigns conducted
Stakeholders targeted for the remaining programme were not available Covid 19 Lockdown.
The Unit is targeting policy workshops, Unit and Directorate meetings, some of which are virtual, for the purposes of awareness campaigns. A presentation has already been made to the policy workshop that was held on the 20th of August 2020.
Quarterly Reports; Attendance registers,
Director: Corporate Services

191
Measurable Objectives
5 YR Outcome
Strategy KPI Indicator Code
2018-2019 Financial Year 2019-2020 Financial year
SnapShot
Variances Remedial Evidence Custodian
Annual Target
Actual Performance
Annual Target Actual Performance
Number of Records Disposal reports compiled and submitted
MTOD - 8.3.2
4 Records Disposal reports compiled and submitted by 30 June 2019
Target achieved 4 Records Disposal reports compiled and submitted
4 Records Disposal reports compiled and submitted by 30 June 2020
Target not achieved 3 Records Disposal reports compiled and submitted
Stakeholders targeted for the remaining programme were not available due to Covid 19 Lockdown.
The outstanding Records Disposal reports will be conducted in Quarter 1 of 2020 /2021. A disposal Plan has been developed, and disposal shall accordingly be attended to as per plan in consultation with Directorates
Records Disposal Reports; Disposal Authority Certificates, Listing of Records for Disposal
Director: Corporate Services
KPA 2: BASIC SERVICE DELIVERY AND INFRASTRUCTURE DEVELOPMENT
BROAD STRATEGIC OBJECTIVE 2: To ensure BROAD STRATEGIC OBJECTIVE 2: To ensure provision of Municipal Health, Environmental Management and Basic Services in a well-structured, efficient and integrated manner.

192
Measurable Objectives
5 YR Outcome
Strategy KPI Indicator Code
2018-2019 Financial Year 2019-2020 Financial year
SnapShot
Variances Remedial Evidence Custodian
Annual Target
Actual Performance
Annual Target Actual Performance
To ensure Universal coverage of Water and Sanitation by 2022
Quality Drinking Water
Implementation of WSDP
Number of households served with Quality basic water supply
SDI - 1
5195 households served with Quality basic water supply by 30 June 2019
83 households served with Quality basic water
5195 households served with Quality basic water supply by 30 June 2020
Target not achieved 659 households served with Quality basic water
Due to the national lockdown from the 27th March 2020 with new Health regulations for COVID 19 compliance the project was delayed.
Extension of time was granted to the contractor and the project will completed in quarter 1 of the next financial year.
Business Plans and Design Reports confirming households, Households Data base, Community Consent form, Practical Certificates, GIS coordinates
Director: Engineering and Technical Services
SDI - 1.1
N/A N/A 386 households served with Quality basic water supply at
Target Not achieved 0 households served with
Due to the national lockdown from the 27th March 2020 with
1) Gasini B Contractor is back onsite and the project
Business Plans and Design Reports confirming househ
Director: Engineering and Technical Services

193
Measurable Objectives
5 YR Outcome
Strategy KPI Indicator Code
2018-2019 Financial Year 2019-2020 Financial year
SnapShot
Variances Remedial Evidence Custodian
Annual Target
Actual Performance
Annual Target Actual Performance
by 30 June 2020
Quality basic water supply
new Health regulations for COVID 19 compliance the project was delayed.
will be completed in the first quarter of 2020/2021financial year 2) Hewu Phase 7 all extensions and additional works the project will be completed in Quarter 4 of the 2021 financial year
olds, GIS coordinates

194
Measurable Objectives
5 YR Outcome
Strategy KPI Indicator Code
2018-2019 Financial Year 2019-2020 Financial year
SnapShot
Variances Remedial Evidence Custodian
Annual Target
Actual Performance
Annual Target Actual Performance
SDI - 1.2
N/A N/A 579 households served with Quality basic water supply at by 30 June 2020
Target not Achieved 0 households served with Quality basic water supply
Due to the national lockdown from the 27th March 2020 with new Health regulations for COVID 19 compliance and COIDA requirements the project was delayed.
Both Cluster 4 Upper Indwana and Zingquthu contractors are back onsite after the approval of health and safety files and the project will be completed in the first quarter of 2020/2021financial year.
Business Plans and Design Reports confirming households, GIS coordinates
Director: Engineering and Technical Services

195
Measurable Objectives
5 YR Outcome
Strategy KPI Indicator Code
2018-2019 Financial Year 2019-2020 Financial year
SnapShot
Variances Remedial Evidence Custodian
Annual Target
Actual Performance
Annual Target Actual Performance
SDI - 1.3
N/A N/A 2323 households served with Quality basic water supply at by 30 June 2020
Target not achieved 0 households served with Quality basic water supply
1 Upper Mnxe project completed however water is limited in some areas in the villages 2)RS2-1 Cluster 2 Extension project was delayed due to the national lockdown from the 27th 25March 2020 with new Health regulations for COVID 19
Cluster 2 RS2 subcontract agreement of subcontractor to build reservoir on behalf of contractor, water tightness test of reservoir, supplying stand taps with water and sorting minor leaks was set for that project
Business Plans and Design Reports confirming households, GIS coordinates
Director: Engineering and Technical Services

196
Measurable Objectives
5 YR Outcome
Strategy KPI Indicator Code
2018-2019 Financial Year 2019-2020 Financial year
SnapShot
Variances Remedial Evidence Custodian
Annual Target
Actual Performance
Annual Target Actual Performance
compliance.
will be completed in Quarter 3 of the 2020/21 FY
SDI - 1.4
N/A N/A 1308 households served with Quality basic water supply at by 30 June 2020
Target not Achieved 123 households served with Quality basic water supply
Noluthando lukavala phase 2 is completed and 123 households were served. According to the Business plan 580 households were served but the physical assessment that was conducted the
The Social facilitation will conduct a verification of beneficiaries prior to start to of the project. Contractor for Cluster 4 Mthingewu project is on site and the project will be
Business Plans and Design Reports confirming households, GIS coordinates
Director: Engineering and Technical Services

197
Measurable Objectives
5 YR Outcome
Strategy KPI Indicator Code
2018-2019 Financial Year 2019-2020 Financial year
SnapShot
Variances Remedial Evidence Custodian
Annual Target
Actual Performance
Annual Target Actual Performance
social facilitator reflects 127 households served. Cluster 4 Mthingewu project was delayed by national lockdown from the 27th March 2020 with new Health regulations for COVID 19 compliance.
completed in the first quarter of 2020/2021financial year
SDI - 1.5
N/A N/A 371 households served with Quality
Target Achieved 370 househol
RS 1 2c Jiphuta Makhikhi project
N/A Business Plans and Design Reports
Director: Engineering and Technical Services

198
Measurable Objectives
5 YR Outcome
Strategy KPI Indicator Code
2018-2019 Financial Year 2019-2020 Financial year
SnapShot
Variances Remedial Evidence Custodian
Annual Target
Actual Performance
Annual Target Actual Performance
basic water supply at by 30 June 2020
ds served with Quality basic water
completed
confirming households, GIS coordinates
SDI - 1.6
N/A N/A 228 households served with Quality basic water supply at by 30 June 2020
Target not Achieved 166 households served with Quality basic water
Lokshini Villages is completed and 166 households were served. According to the Business plan 228 households were served but the physical assessment that was conducted the social facilitator
The Social facilitation will conducted a verification of beneficiaries prior to start to of the project.
Business Plans and Design Reports confirming households, Households Data base, Community Consent form, Practical Certificates, GIS coordinates
Director: Engineering and Technical Services

199
Measurable Objectives
5 YR Outcome
Strategy KPI Indicator Code
2018-2019 Financial Year 2019-2020 Financial year
SnapShot
Variances Remedial Evidence Custodian
Annual Target
Actual Performance
Annual Target Actual Performance
reflects 163 households served.
Number of Water reticulation projects completed
SDI - 2
6 Water reticulation projects completed by 30 June 2019
0 Water reticulation projects completed
10 Water reticulation projects completed by 30 June 2020
Target not achieved 4 Water reticulation projects completed
Refer to the indicator SDI 2.1 to SDI 2.6 for actual performance
Refer to the indicator SDI 2.1 to SDI 2.6 for actual performance
Practical and Completion Certificate, Site/Technical Meetings, Attendance Registers
Director: Engineering and Technical Services
SDI - 2.1
N/A N/A 2 Water reticulation projects completed by 30 June 2020
Target not achieved 0 Water reticulation projects completed
Due to the national lockdown from the 27th March 2020 with new Health regulation
1) Gasini B Contractor is back onsite and the project will be completed in the
Site/Technical Meetings, Attendance Registers
Director: Engineering and Technical Services

200
Measurable Objectives
5 YR Outcome
Strategy KPI Indicator Code
2018-2019 Financial Year 2019-2020 Financial year
SnapShot
Variances Remedial Evidence Custodian
Annual Target
Actual Performance
Annual Target Actual Performance
s for COVID 19 compliance the project was delayed.
first quarter of 2020/2021financial year 2) Hewu Phase 7 all extensions and additional works the project will be completed in Quarter 4 of the 2021 financial year.
SDI - 2.2
N/A N/A 2 Water reticulation projects completed
Target not Achieved 0 Water
Due to the national lockdown from the
Both Cluster 4 Upper Indwana and
Site/Technical Meetings, Attenda
Director: Engineering and Technical Services

201
Measurable Objectives
5 YR Outcome
Strategy KPI Indicator Code
2018-2019 Financial Year 2019-2020 Financial year
SnapShot
Variances Remedial Evidence Custodian
Annual Target
Actual Performance
Annual Target Actual Performance
by 30 June 2020
reticulation projects completed
27th March 2020 with new Health regulations for COVID 19 compliance and COIDA requirements the project was delayed.
Zingquthu contractors are back onsite after the approval of health and safety files and the project will be completed in the first quarter of 2020/2021financial year.
nce Registers
SDI - 2.3
N/A N/A 2 Water reticulation projects completed by 30 June 2020
Target not achieved 1 Water reticulation
1 Upper Mnxe project completed however
Cluster 2 RS2 subcontract agreement of
Practical and Completion Certificate,
Director: Engineering and Technical Services

202
Measurable Objectives
5 YR Outcome
Strategy KPI Indicator Code
2018-2019 Financial Year 2019-2020 Financial year
SnapShot
Variances Remedial Evidence Custodian
Annual Target
Actual Performance
Annual Target Actual Performance
projects completed
water is limited in some areas in the villages 2)RS2-1 Cluster 2 Extension project was delayed due to the national lockdown from the 27th 25March 2020 with new Health regulations for COVID 19 compliance.
subcontractor to build reservoir on behalf of contractor, water tightness test of reservoir, supplying stand taps with water and sorting minor leaks was set for that project will be completed in Quarter 3 of the 2020/21
Site/Technical Meetings, Attendance Registers

203
Measurable Objectives
5 YR Outcome
Strategy KPI Indicator Code
2018-2019 Financial Year 2019-2020 Financial year
SnapShot
Variances Remedial Evidence Custodian
Annual Target
Actual Performance
Annual Target Actual Performance
financial year.
SDI - 2.4
N/A N/A 2 Water reticulation projects completed by 30 June 2020
Target not achieved 1 Water reticulation projects completed
Noluthando lukavala phase 2 is completed. Cluster 4 Mthingewu was affected by national lockdown from the 27th March 2020 with new Health regulations for COVID 19 compliance the project was delayed.
Cluster 4 Mthingewu contractor is on site and the project will be completed in the first quarter of 2020/2021 financial year.
Practical and Completion Certificate, Site/Technical Meetings, Attendance Registers
Director: Engineering and Technical Services

204
Measurable Objectives
5 YR Outcome
Strategy KPI Indicator Code
2018-2019 Financial Year 2019-2020 Financial year
SnapShot
Variances Remedial Evidence Custodian
Annual Target
Actual Performance
Annual Target Actual Performance
SDI - 2.5
N/A N/A 1 Water reticulation projects completed by 30 June 2020
Target Achieved 1 Water reticulation projects completed
RS1 phase 2C -Jiphutha makiki project completed.
N/A Practical and Completion Certificate
Director: Engineering and Technical Services
SDI - 2.6
N/A N/A 1 Water reticulation projects completed by 30 June 2020
Target achieved 1 Water reticulation projects completed
Lokshini Villages project completed.
N/A Practical and Completion Certificate
Director: Engineering and Technical Services
Number of Bulk water supply projects completed
SDI - 3
3 Bulk water supply projects completed by 30 June 2019
1 Bulk water supply projects completed
1 Bulk water supply projects completed by 30 June 2020
Target achieved 1 Bulk water supply projects completed
Xonxa Bulk water supply project completed.
N/A Practical completion Certificate
Director: Engineering and Technical Services
Number of Full SANS Audit conducted in all
SDI - 4
1 Full SANS Audit conducted in all 28 Water
0 Full SANS Audit conducted, however
1 Full SANS Audit conducted in all 18 Water
Target achieved 1 Full SANS Audit
The Full SANS Audit was conducted at following
N/A Full SANS Audit Report

205
Measurable Objectives
5 YR Outcome
Strategy KPI Indicator Code
2018-2019 Financial Year 2019-2020 Financial year
SnapShot
Variances Remedial Evidence Custodian
Annual Target
Actual Performance
Annual Target Actual Performance
28 Water Treatment Works
Treatment Works s by 30 June 2019
only 8 Water Treatment Works were audited.
Treatment Works s by 30 June 2020
conducted in all 18 Water Treatment Works
Water Treatment Works: 1. SADA 2.Komani 3. Molteno 4. Stertkstroom 5. Tsomo 6. Tsojana 7. Ncora 8. Nkobongo 9. Engcobo 10.Dordrecht 11. Macubeni 12. Indwe 13. Cradock 14. Lubisi 15. Xhalanga 16. Eliot 17. Cala 18. Cala

206
Measurable Objectives
5 YR Outcome
Strategy KPI Indicator Code
2018-2019 Financial Year 2019-2020 Financial year
SnapShot
Variances Remedial Evidence Custodian
Annual Target
Actual Performance
Annual Target Actual Performance
Package Plant
Number of Water Treatment works Completed
SDI - 5
01 Water Treatment works Completed by 30 June 2019
0 Water Treatment works Completed
01 Water Treatment works Completed by 30 June 2020
Target not Achieved 0 Water Treatment works Completed
Tsomo ward 8 Intsika Yethu not completed due to the national lockdown from the 27th March 2020 with new Health regulations for COVID 19 compliance and poor performance of the contractor, project was delayed.
Municipality continues to engage with the contractor to get the project to the stage of completion therefore the contractor will completed in quarter 3 of the next financial year.
Site/Technical Meetings, Attendance Registers

207
Measurable Objectives
5 YR Outcome
Strategy KPI Indicator Code
2018-2019 Financial Year 2019-2020 Financial year
SnapShot
Variances Remedial Evidence Custodian
Annual Target
Actual Performance
Annual Target Actual Performance
Safe Sanitation
Number of households served with safe basic sanitation
SDI - 6
1394 Households served with safe basic sanitation by 30 June 2019
1254 Households served with safe basic sanitation
5839 Households served with safe basic sanitation by 30 June 2020
Target achieved 6295 Households served with safe basic sanitation
Refer to the indicator SDI 6.1 to SDI 6.5 for actual performance
Refer to the indicator SDI 6.1 SDI 6.6 for actual performance
Happy Letters and Sanitation Register
Director: Engineering and Technical Services
SDI - 6.1
N/A N/A 289 Households served with safe basic sanitation by 30 June 2020
Target achieved 602 Households served with safe basic sanitation
602 Households served with safe basic sanitation at Intsika yethu sanitation ward 21(Contract 35). The target is overachieved by 313 due to due to new erected structures
N/A Happy Letters and Sanitation Register
Director: Engineering and Technical Services

208
Measurable Objectives
5 YR Outcome
Strategy KPI Indicator Code
2018-2019 Financial Year 2019-2020 Financial year
SnapShot
Variances Remedial Evidence Custodian
Annual Target
Actual Performance
Annual Target Actual Performance
SDI - 6.2
N/A N/A 390 Households served with safe basic sanitation by 30 June 2020
Target achieved 406 Households served with safe basic sanitation
406 Households served with safe basic sanitation at Intsika yethu sanitation ward 16(Contract 37). The target is overachieved by 16 due to new erected structures.
N/A Happy Letters and Sanitation Register
Director: Engineering and Technical Services
SDI - 6.3
N/A N/A 550 Households served with safe basic sanitation by 30 June 2020
Target achieved 589 Households served with safe basic sanitation
589 Households served with safe basic sanitation at Intsika yethu ward 19(Contra
N/A Happy Letters and Sanitation Register
Director: Engineering and Technical Services

209
Measurable Objectives
5 YR Outcome
Strategy KPI Indicator Code
2018-2019 Financial Year 2019-2020 Financial year
SnapShot
Variances Remedial Evidence Custodian
Annual Target
Actual Performance
Annual Target Actual Performance
ct 36). The target is overachieved by 39 due to due to new erected structures
SDI 6.4
N/A N/A 1380 Households served with safe basic sanitation by 30 June 2020
Target achieved 1460 Households served with safe basic sanitation
1460 Households served with safe basic sanitation at Cofimvaba EU ward 1 and 5(Contract 32). The target is overachieved by 80 due to new erected structures.
N/A Happy Letters and Sanitation Register
Director: Engineering and Technical Services

210
Measurable Objectives
5 YR Outcome
Strategy KPI Indicator Code
2018-2019 Financial Year 2019-2020 Financial year
SnapShot
Variances Remedial Evidence Custodian
Annual Target
Actual Performance
Annual Target Actual Performance
SDI 6.5
N/A N/A 1820 Households served with safe basic sanitation by 30 June 2020
Target achieved 1828 Households served with safe basic sanitation
1828 Households served with safe basic sanitation at Cofimvaba EU ward 7(Contractor 34). The target is overachieved by 7 due to new erected structure.
N/A Happy Letters and Sanitation Register
Director: Engineering and Technical Services
SDI 6.6
N/A N/A 1410 Households served with safe basic sanitation by 30 June 2020
Target achieved 1410 Households served with safe basic sanitation
1410 Households served with safe basic sanitation at Cofimvaba EU ward 2(Contract 33)
N/A Happy Letters and Sanitation Register
Director: Engineering and Technical Services

211
Measurable Objectives
5 YR Outcome
Strategy KPI Indicator Code
2018-2019 Financial Year 2019-2020 Financial year
SnapShot
Variances Remedial Evidence Custodian
Annual Target
Actual Performance
Annual Target Actual Performance
Number of Waste Water Treatment works completed
SDI - 7
1 Waste Water Treatment Works Completed by 30 June 2019
0 Waste Water Treatment Works Completed
1 Waste Water Treatment Works Completed by 30 June 2020
Target achieved 1 Waste Water Treatment Works Completed
Upgrading of Molteno Oxidation Ponds completed
N/A Practical Completion Certificate,
Director: Engineering and Technical Services
Number of Process Audit conducted in all 18 Waste Water Treatment Works
SDI - 8
1 Process Audit conducted in 2 Waste Water Treatment Works by 30 June 2019
0 Process Audit conducted in 2 Waste Water Treatment Works
1 Process Audit conducted in 2 Waste Water Treatment Works by 30 June 2020
Target Achieved 1 Process Audit conducted in 2 Waste Water Treatment Works
The Process Audit was conducted for Eliot and Queenstown Waste Water Treatment Works
N/A Process Audit report
Director: Engineering and Technical Services
Sustained Water Resource
Implementation of Operations and Maintenance Plan
Number of Water Schemes refurbished
SDI-9
2 Water Schemes refurbished by 30 June 2020
1 Water Schemes refurbished by 30 June 2020
05 Water Schemes refurbished by 30 June 2020
Target achieved 05 Water Schemes refurbished
Refer to the indicator SDI 9.1 to SDI 9.5 for actual performance
Refer to the indicator SDI 9.1 to SDI 9.5 for actual performance
Completion Certificates, GPS Coordinates
Director: Engineering and Technical Services

212
Measurable Objectives
5 YR Outcome
Strategy KPI Indicator Code
2018-2019 Financial Year 2019-2020 Financial year
SnapShot
Variances Remedial Evidence Custodian
Annual Target
Actual Performance
Annual Target Actual Performance
SDI-9.1
N/A N/A 1 Water Schemes refurbished by 30 June 2020
Target Achieved 01 Water Schemes refurbished
Middelburg WSS (Ward) completed
N/A Completion Certificates, GPS Coordinates
Director: Engineering and Technical Services
SDI-9.2
N/A N/A 1 Water Schemes refurbished by 30 June 2020
Target Achieved 1 Water Schemes refurbished
Machubeni WSS completed
N/A Completion Certificates, GPS Coordinates
Director: Engineering and Technical Services
SDI-9.3
N/A N/A 1 Water Schemes refurbished by 30 June 2020
Target Achieved 1 Water Schemes refurbished
Tarkastad - Ntabethemba refurbished
N/A Completion Certificates, GPS Coordinates
Director: Engineering and Technical Services
SDI-9.4
N/A N/A 1 Water Schemes refurbished by 30 June 2020
Target Achieved 1 Water Schemes refurbished
Engcobo Rural Scheme - Qumanco (Bodini) refurbished
N/A Completion Certificates, GPS Coordinates
Director: Engineering and Technical Services
SDI-9.5
N/A N/A 1 Water Schemes refurbishe
Target Achieved 1 Water
Cala Town WSS refurbished
N/A Completion Certificates, GPS
Director: Engineering and

213
Measurable Objectives
5 YR Outcome
Strategy KPI Indicator Code
2018-2019 Financial Year 2019-2020 Financial year
SnapShot
Variances Remedial Evidence Custodian
Annual Target
Actual Performance
Annual Target Actual Performance
d by 30 June 2020
Schemes refurbished
Coordinates
Technical Services
Number of Water Conservation and Demand Management Programmes implemented
SDI-10
N/A N/A 2 Water Conservation and Demand Management Programmes implemented by 30 June 2020
Refer to the indicator SDI 10.1 to SDI 10.2 for actual performance
Refer to the indicator SDI 10.1 to SDI 10.2 for actual performance
Refer to the indicator SDI 10.1 to SDI 10.2 for actual performance
Water Conservation and Demand Management reports
Director: Engineering and Technical Services
Number of Consumer and Bulk Water meter Replacement Programmes implemented
SDI-10.1
800 Consumer and 32 Bulk Water Replaced by 30 June 2019
0 Consumer and 0 Bulk Water Replaced
800 Consumer and 32 Bulk Water Replaced by 30 June 2020
Refer to the indicator SDI 10.1.1 to SDI 10.1.2 for actual performance
Refer to the indicator SDI 10.1.1 to SDI 10.1.2 for actual performance
Refer to the indicator SDI 10.1.1 to SDI 10.1.2 for actual performance
RFQ’s, Contractors report
Director: Engineering and Technical Services
Number of Consume
SDI-
N/A N/A 800 Consumer Water
Target not Achieved
Delays in appointment of
To appoint the
Memo Director: Engineering and

214
Measurable Objectives
5 YR Outcome
Strategy KPI Indicator Code
2018-2019 Financial Year 2019-2020 Financial year
SnapShot
Variances Remedial Evidence Custodian
Annual Target
Actual Performance
Annual Target Actual Performance
r Water meter Replaced
10.1.1
meter Replaced by 30 June 2020
0 Consumer Water meter Replaced
services providers
service provider in the first quarter of the 2020-2021 financial year.
Technical Services
Number of Bulk Water meter Replaced
SDI-10.1.2
N/A N/A 32 Bulk Water meter Replaced by 30 June 2020
Target not Achieved 16 Bulk Water meters Replaced
A service provider was appointed however due to the national lockdown from the 27th March 2020 with new Health regulations for COVID 19 compliance the project
The project is to be rolled over to the 2020 - 2021 financial year.
Contractors report
Director: Engineering and Technical Services

215
Measurable Objectives
5 YR Outcome
Strategy KPI Indicator Code
2018-2019 Financial Year 2019-2020 Financial year
SnapShot
Variances Remedial Evidence Custodian
Annual Target
Actual Performance
Annual Target Actual Performance
was delayed.
Number of Household's internal water leaks repaired
SDI-10.2
N/A N/A 800 Household's internal water leaks repaired by 30 June 2020
Target not Achieved 695 Household's internal water leaks repaired
Due to additional scope of work required for each household as per the initial plan.
To outsources funds to complete the project in the next financial year.
Contractors report
Director: Engineering and Technical Services
To ensure maintenance of Roads
Well maintained roads
Implementation of Roads SLA
Number of kilometres of roads maintained
SDI – 11
2148 kilometres and 30 kilometres of roads maintained by 30 June 2019
1051.94 kilometres and 5 kilometres of roads maintained
1603.86 kilometres and 29.3 kilometres of roads maintained by 30 June 2020 ( 360 kilometres bladed and 6 kilometres regravelled
Refer to the indicator SDI 11.1 to SDI 11.2 for actual performance
Refer to the indicator SDI 11.1 to SDI 11.2 for actual performance
Refer to the indicator SDI 11.1 to SDI 11.2 for actual performance
Roads reports
Director: Engineering and Technical Services
SDI -
2148 kilometr
1051.94 kilometre
1603.86 kilometres
Target not
Due to none
The function
Confirmation
Director: Engineeri

216
Measurable Objectives
5 YR Outcome
Strategy KPI Indicator Code
2018-2019 Financial Year 2019-2020 Financial year
SnapShot
Variances Remedial Evidence Custodian
Annual Target
Actual Performance
Annual Target Actual Performance
11.1
es and of roads maintained by 30 June 2019
s of roads maintained
of roads bladed (Tarkstad) maintained by 30 June 2020
achieved 1476.66 kilometres of roads bladed (Tarkstad)
renewal of SLA by department of Roads and Transport, target was not achieved.
has been removed from the institutions responsibilities.
letter from DoRPW, Roads SLA
ng and Technical Services
SDI-11.2
2148 kilometres and 30 kilometres of roads maintained
5 kilometres of roads bladed (Tarkstad) maintained
29.3 kilometres of road regravelled by 30 June 2020
Target achieved 54.1 kilometres of road regravelled
N/A N/A Confirmation letter from DoRPW, Roads SLA
Director: Engineering and Technical Services
To ensure universal coverage of water and sanitation by 2022
Safe Sanitation
Implementation of WSDP
Number of Waste Water Project Completed
SDI-12
2 Waste Water Project completed by 30 June 2019
0 Waste Water Project completed
2 Waste Water Project completed by 30 June 2020
Target achieved 2 Waste Water Project completed
1) Hofmeyer sewer project completed. 2) Molteno project completed
Director: Engineering and Technical Services

217
Measurable Objectives
5 YR Outcome
Strategy KPI Indicator Code
2018-2019 Financial Year 2019-2020 Financial year
SnapShot
Variances Remedial Evidence Custodian
Annual Target
Actual Performance
Annual Target Actual Performance
To facilitate implementation of Human Settlements programmes
Sustainable Livelihoods
Implementation of CHDM Integrated Human Settlement Sector Plan
No of Human Settlements programmes implemented
SDI - 13
2 Human Settlements programmes implemented by 30 June 2019
1 Human Settlements programmes implemented
2 Human Settlements programmes implemented by 30 June 2020
Refer to the indicator SDI 13.1 to SDI 13.2 for actual performance
Refer to the indicator SDI 13.1 to SDI 13.2 for actual performance
Refer to the indicator SDI 13.1 to SDI 13.2 for actual performance
Human Settlements programmes reports
Director: IPED
Number of Emergency houses constructed in all 6 local municipality
SDI - 13.1
29 Emergency houses constructed in all 6 local municipality by 20 June 2019
19 Emergency houses constructed in all 6 local municipality
20 Slabs constructed in all 6 local municipality 30 June 2020
Target not Achieved 0 Slabs constructed in all 6 local municipality
The letter for unblocking the project was received from NHBRC on the 23 June 2020.(Approval of foundation designs)
The project construction will commence in the first quarter of 2020/2021 financial year.
Approval letter
Director: IPED
Number of destitute houses constructed in all
SDI - 13.2
6 destitute houses constructed in all 6 local
8 destitute houses constructed in all 6 local
6 destitute houses constructed in all 6 local municipalit
Target not achieved 0 destitute
1. Delays on appointment of emerging contractor
The 2020-2021 project implementation
SCM confirmations
Director: IPED

218
Measurable Objectives
5 YR Outcome
Strategy KPI Indicator Code
2018-2019 Financial Year 2019-2020 Financial year
SnapShot
Variances Remedial Evidence Custodian
Annual Target
Actual Performance
Annual Target Actual Performance
6 local municipality
municipality by 30 June 2020
municipality
y by 30 June 2020
houses constructed in all 6 local municipality
s for construction of the houses 2. Construction delayed due to Covid 19
of the process will commence in the first quarter of 2020-2021 financial year.
KPA 2: BASIC SERVICE DELIVERY AND INFRASTRUCTURE DEVELOPMENT
KPA 2: BASIC SERVICE DELIVERY AND INFRASTRUCTURE DEVELOPMENT
BROAD STRATEGIC OBJECTIVE 2: To ensure provision of Municipal Health, Environmental Management and Basic Services in a well-structured, efficient and integrated manner.
BROAD STRATEGIC OBJECTIVE 2:To ensure provision of Municipal Health, Environmental Management and Basic Services in a well-structured, efficient and integrated manner.
To provide municipal
Healthy communities
Monitor compliance of waste water
Number of waste water sample points
SDI - 14
36 Waste Water samples taken for complian
Target Achieved 36 Waste Water
144 Waste Water samples points taken for
Target Achieved 144 Waste
N/A N/A Waste Water sample results, Sample
Director: Health and Commun

219
Measurable Objectives
5 YR Outcome
Strategy KPI Indicator Code
2018-2019 Financial Year 2019-2020 Financial year
SnapShot
Variances Remedial Evidence Custodian
Annual Target
Actual Performance
Annual Target Actual Performance
health services in accordance with relevant legislations
quality with relevant legislation
taken for compliance in accordance with Regulations 991 and section 39 of National Water Act 36 of 1998 as amended for compliance
ce in accordance with Regulations 991 and section 39 of National Water Act 36 of 1998 as amended for compliance by 30 June 2019
samples taken compliance in accordance with Regulations 991 and section 39 of National Water Act 36 of 1998 as amended for compliance
compliance in accordance with Regulations 991 and section 39 of National Water Act 36 of 1998 as amended for compliance by 30 June 2020
Water sample points taken compliance in accordance with Regul ations 991 and section 39 of National Water Act 36 of 1998 as amended for compliance
points data base,
ity Services
Monitor compliance of drinking water quality with SANS 241
Number of drinking Water Samples points monitored in accordan
SDI - 15
2200 Drinking Water Samples points monitored in accordance with
2200 Drinking Water Samples points monitored in accordanc
2100 Drinking Water Samples points monitored in accordance with
Target achieved 2101 Drinking Water Sample points monitored in
Reason for over achieving by 1 is due to resampling
N/A Drinking Water sample results, Sample points data base
Director: Health and Community Services

220
Measurable Objectives
5 YR Outcome
Strategy KPI Indicator Code
2018-2019 Financial Year 2019-2020 Financial year
SnapShot
Variances Remedial Evidence Custodian
Annual Target
Actual Performance
Annual Target Actual Performance
ce with SANS 241
SANS 241 by 30 June 2019
e with SANS 241
SANS 241 by 30 June 2020
accordance with SANS 241
Monitor and support food premises in accordance with relevant legislation
Number of food premises monitored in line with Food, Cosmetics and Disinfectant Act 54 of 1972 as Amended
SDI - 16
560 Food premises monitored in line with Food, Cosmetics and Disinfectants Act 54 of 1972 as Amended by 2019
560 Food premises monitored in line with Food, Cosmetics and Disinfectants Act 54 of 1972 as Amended
2240 (560* 4) Food premises monitored in line with Food, Cosmetics and Disinfectants Act 54 of 1972 as Amended by 30 June 2020
Target not achieved 2193 Food premises monitored in line with Food, Cosmetics and Disinfectants Act 54 of 1972 as Amended
Reason for under achieving by 47 was due the closure of some food premises as a result Covid-19 regulations
The monitoring of the closed food premises will depend on the relaxation of the Covid-19 regulations
Compliance notices, Data base for food premises, Compliance check list
Director: Health and Community Services
Monitor and support funeral parlours in accordance with
Number of Funeral parlours monitored for compliance
SDI - 17
68 funeral parlours monitored for compliance through
72 funeral parlours monitored for compliance through inspections
272 (68*4) funeral parlours monitored for compliance through
Target achieved, 276 funeral parlours monitored for complian
Reason for over achieved it was due to opening of new parlours
N/A Compliance notices, Compliance check list, Attenda
Director: Health and Community Services

221
Measurable Objectives
5 YR Outcome
Strategy KPI Indicator Code
2018-2019 Financial Year 2019-2020 Financial year
SnapShot
Variances Remedial Evidence Custodian
Annual Target
Actual Performance
Annual Target Actual Performance
relevant legislation
through inspections
inspections by 30 June 2019
inspections by 30 June 2020
ce through inspections
nce register, Resolution register, Forum Terms of Reference
To provide municipal health services in accordance with relevant legislations
Monitor compliance with White Paper on Basic Household Sanitation of 2001
Number of sampled sanitation structures inspected in line with White Paper on Basic Household Sanitation of 2001
SDI-18
120 sampled sanitation structures inspected in line with White Paper on Basic Household Sanitation of 2001 by 30 June 2019
120 sampled sanitation structures inspected in line with White Paper on Basic Household Sanitation
120 (30*4) sampled sanitation structures inspected in line with White Paper on Basic Household Sanitation of 2001 by 30 June 2020
Target Achieved 120 sampled sanitation structures inspected in line with White Paper on Basic Household Sanitation of 2001
N/A
N/A Report on Sanitation structures inspected, Inspection Check List
Director: Health and Community Services

222
Measurable Objectives
5 YR Outcome
Strategy KPI Indicator Code
2018-2019 Financial Year 2019-2020 Financial year
SnapShot
Variances Remedial Evidence Custodian
Annual Target
Actual Performance
Annual Target Actual Performance
To ensure effects of disaster and fire are prevented or minimised
Reduced Disaster risks
Implementation of Disaster Management Plan
number of disaster management programmes implemented as per DMP
SDI-19
N/A N/A 2 Disaster Management Programmes implemented as per DMP by 30 June 2020
Refer to the indicator SDI 19.1 to SDI 19.4 for actual performance
Refer to the indicator SDI 19.1 to SDI 19.4 for actual performance
Refer to the indicator SDI 19.1 to SDI 19.4 for actual performance
Incident report
Director: Health and Community Services
% Response to disaster management incidents reported
SDI-19.1
100% response to disaster management incidents reported by 30 June 2019
100% response to disaster management incidents reported
100% response to disaster management incidents reported by 30 June 2020
Target Achieved 100% response to disaster management incidents reported
N/A N/A Incident report
Director: Health and Community Services
% of Disaster stricken Households assisted with relief and
SDI-19.2
100 % Disaster Stricken Households assisted with relief and recovery
Target achieved 100 % Disaster Stricken Households assisted with relief
100 % Disaster Stricken Households assisted with relief and recovery material
Target achieved 100 % Disaster Stricken Households assisted with
N/A N/A Incident Report(s),Counter book, Assessment form, Assessment
Director: Health and Community Services

223
Measurable Objectives
5 YR Outcome
Strategy KPI Indicator Code
2018-2019 Financial Year 2019-2020 Financial year
SnapShot
Variances Remedial Evidence Custodian
Annual Target
Actual Performance
Annual Target Actual Performance
recovery material
material by 30 June 2019
and recovery material
by 30 June 2020
relief and recovery material
Report, Distribution List
Number of Disaster Management Early Warning Systems installed
SDI-19.2.1
N/A N/A 1 Disaster Management Early Warning System installed by 30 June 2020
Target Achieved 1 Disaster Management Early Warning System installed
The installation of early warning equipment has been successfully installed
N/A Report on Disaster Management Early Warning System
Director: Health and Community Services
To ensure effects of disaster and fire are prevented or minimized
Reduced fire risks
Implementation of Municipal Structures Act117 of 1998 Sec 84 (1)(j)
Number of Fire Services programmes implemented
SDI-20
4 fire services programmes implemented by 30 June 2019
4 fire services programmes implemented
4 fire services programmes implemented by 30 June 2020
Refer to the indicator SDI 20.1 to SDI 20.4 for actual performance
Refer to the indicator SDI 20.1 to SDI 20.4 for actual performance
Refer to the indicator SDI 20.1 to SDI 20.4 for actual performance
Fire services programmes report
Director: Health and Community Services
Number of fire services trainings implemented
SDI-20.1
3 fire services trainings implemented by 30 June 2020
4 fire services trainings implemented
2 fire services trainings implemented by 30 June 2020
Target achieved 2 fire services training implemented
2 fire services training were implemented for fire
N/A Attendance register, Training report, course outline,
Director: Health and Community Services

224
Measurable Objectives
5 YR Outcome
Strategy KPI Indicator Code
2018-2019 Financial Year 2019-2020 Financial year
SnapShot
Variances Remedial Evidence Custodian
Annual Target
Actual Performance
Annual Target Actual Performance
fighters in the district.
Number of fire services awareness programmes implemented
SDI-20.2
24 Fire Services Awareness programmes implemented by 30 June 2019
61 Fire Services Awareness programmes implemented
40 Fire Services Awareness programmes implemented by 30 June 2020
Target achieved 50 Fire Services Awareness programmes implemented
Overachieved by 10 Fire awareness programmes due to public demand
N/A Attendance register, Report on Fire service awareness programme, schedule of fire awareness programmes
Director: Health and Community Services
Number of fire services Inspections conducted
SDI-20.3
20 fire services Inspections Conducted by 30 June 2019
32 fire services Inspections Conducted
32 fire services Inspections Conducted by 30 June 2020
Target achieved 32 fire services inspections conducted.
N/A
N/A Inspection Report, Inspection Certificate ,Check list
Director: Health and Community Services
% Respons
SDI-
N/A N/A 100% of Response
Target Achieved
N/A N/A Incident
Report, Director: Health

225
Measurable Objectives
5 YR Outcome
Strategy KPI Indicator Code
2018-2019 Financial Year 2019-2020 Financial year
SnapShot
Variances Remedial Evidence Custodian
Annual Target
Actual Performance
Annual Target Actual Performance
e to Fire services incidents reported
20.4
to Fire services incidents reported by 30 June 2020
100% of response to Fire services incidents reported
Quarterly Fire reports,
and Community Services
To promote functional ecosystems and healthy environment for all citizen
Minimised effects of Climate Change
Implementation of District Wide Environmental Management Plan
Number of Environmental Programmes implemented as per District Wide Environmental Plan
SDI-21
3 Environmental Programmes implemented as per District Wide Environmental Management Plan by 30 June 2019
3 Environmental Programmes implemented as per District Wide Environmental Management Plan
3 Environmental Programmes implemented as per District Wide Environmental Management Plan by 30 June 2020
Refer to the indicator SDI 21.1 to SDI 21.3 for actual performance
Refer to the indicator SDI 21.1 to SDI 21.3 for actual performance
Refer to the indicator SDI 21.1 to SDI 21.3 for actual performance
Environmental Programmes implemented as per District Wide Environmental Management Report
Director: Health and Community Services
Number of waste management programme
SDI-21.1
N/A N/A 1 Waste management programme implement
Target Achieved 1 Waste management
The programme was implemented through
N/A Waste management report
Director: Health and Community Services

226
Measurable Objectives
5 YR Outcome
Strategy KPI Indicator Code
2018-2019 Financial Year 2019-2020 Financial year
SnapShot
Variances Remedial Evidence Custodian
Annual Target
Actual Performance
Annual Target Actual Performance
implemented in 2 local municipalities
ed in 2 local municipalities (Enoch Mgijima and Engcobo LM's) by 30 June 2020
programme implemented in 2 local municipalities (Enoch Mgijima and Engcobo LM's)
three component street cleaning at Engcobo LM's and rehabilitation of part of Komani river. And capacity building on waste management through awareness campaigns
Number of climate change programmes implemented
SDI-21.2
1 Climate change programmes implemented by 30 June 2019
1 Climate change programmes implemented
1 Climate change programmes implemented by 30 June 2020
Target Achieved 1 Climate change programmes was implemented
The programme was implemented through installation of 1. Bio gas
N/A Climate change Report
Director: Health and Community Services

227
Measurable Objectives
5 YR Outcome
Strategy KPI Indicator Code
2018-2019 Financial Year 2019-2020 Financial year
SnapShot
Variances Remedial Evidence Custodian
Annual Target
Actual Performance
Annual Target Actual Performance
system (AGAMA Prosix Digesters in Per-schools, repairing of existing Bio gas system school, Installation of Solar geysers, Training of project participants.) 2.. Installation Boreholes
Number of illegal dumping sites cleared and rehabilita
SDI- 21.3
6 illegal dumping sites cleared and rehabilitated in
6 illegal dumping sites cleared and out of the six, only 2
2 illegal dumping sites cleared and rehabilitated in the
Target achieved 2 illegal dumping sites cleared
Enoch Mgijima and Emalahleni Local Municipalities illegal
N/A Rehabilitation Report
Director: Health and Community Services

228
Measurable Objectives
5 YR Outcome
Strategy KPI Indicator Code
2018-2019 Financial Year 2019-2020 Financial year
SnapShot
Variances Remedial Evidence Custodian
Annual Target
Actual Performance
Annual Target Actual Performance
ted in the district
the district by 30 June 2019
sites were completely rehabilitated in the district Ezibeleni and Cala
district by 30 June 2020
and rehabilitated in the district
dumping sites were cleared and rehabilitated.
Number of waste sites inspected
SDI- 21.3.1
14 waste sites inspected by 30 June 2019
14 waste sites inspected
14 waste sites inspected by 30 June 2020
Target Achieved 14 waste sites inspected
N/A N/A Inspection notice, Inspection Checklist, Waste sites data base
Director: Health and Community Services
KPA 3: LOCAL ECONOMIC DEVELOPMENT
BROAD STRATEGIC OBJECTIVE 3: To ensure development and implementation of regional economic strategies and effective Spatial Planning and Land Use Management approaches as drivers for economies of scale and social cohesion.
To ensure provision for the inclusive
Transformed spaces and inclusive land use
Implementation of Spluma
Number of spatial planning programme implemented as per SPLUMA
LED-1
03 Spatial planning programmes implemented as per SPLUMA
03 Spatial planning programmes implemented as per SPLUMA
02 Spatial planning programmes implemented as per SPLUMA by 30 June 2020
Targets Achieved. 02 Spatial planning programmes implemented as
The two Spatial Planning programmes that were achieved are 1. Inxuba
N/A Attendance Register of tribunal, Resolution register, Signed
Director :IPED

229
Measurable Objectives
5 YR Outcome
Strategy KPI Indicator Code
2018-2019 Financial Year 2019-2020 Financial year
SnapShot
Variances Remedial Evidence Custodian
Annual Target
Actual Performance
Annual Target Actual Performance
developmental, equitable and efficient spatial planning by 2030
by 30 June 2019
per SPLUMA
Yethemba SDF and 2. Tribunal Sittings
Minutes, Approval/Rejection Letters by Tribunal, SLA, Proof of transfer, Appointment letters, stakeholder report & attendance register, Quarterly reports
Implementation of small town revitalization
Number of small town revitalization program
LED-2
03 Small Town Revitalization programmes
02 STR’s supported
01 Small Town Revitalization programmes
Targets Achieved. 01 Small Town Revitalization
Lusaka, Calata, Tarkastad Paving projects done.
N/A Implementation Reports
Director :IPED

230
Measurable Objectives
5 YR Outcome
Strategy KPI Indicator Code
2018-2019 Financial Year 2019-2020 Financial year
SnapShot
Variances Remedial Evidence Custodian
Annual Target
Actual Performance
Annual Target Actual Performance
programmes
mes supported
supported by 30 June 2019
supported by 30 June 2020
programmes supported by 30 June 2020
To Contribute economic development and growth in the district as envisaged in the NDP
Improved regional economy
Implementation of CHREDS
Number of Agriculture programmes implemented
LED -3
05 Agriculture Programmes implemented by 30 June 2019
05 Agriculture Programmes implemented
04 Agriculture Programmes implemented by 30 June 2020
Refer to the indicator LED 3.1 to LED 3.5 for actual performance
Refer to the indicator LED 3.1 to LED 3.5 for actual performance
Refer to the indicator LED 3.1 to LED 3.5 for actual performance
Agriculture Programmes reports
Director :IPED
Number of Poverty Alleviation Agricultural Programme Implemented
LED-3.1
1 Poverty Alleviation Agricultural Programme Implemented by 30 June 2019
1 Poverty Alleviation Agricultural Programme Implemented
1 Poverty Alleviation Agricultural Programme Implemented by 30 June 2020
Target achieved 1 Poverty Alleviation Agricultural Programme Implemented on Gomomo at SADA (Enoch Mgijima
N/A N/A Poverty Alleviation Report
Director :IPED

231
Measurable Objectives
5 YR Outcome
Strategy KPI Indicator Code
2018-2019 Financial Year 2019-2020 Financial year
SnapShot
Variances Remedial Evidence Custodian
Annual Target
Actual Performance
Annual Target Actual Performance
local municipality.)
Number of livestock improvement and infrastructure programme implemented in 6 LM's through CHDA
LED-3.2
1 livestock improvement and infrastructure development programme implemented in 6 LM's through CHDA by 30 June 2019
1 livestock improvement and infrastructure development programme implemented in 6 LM's through CHDA
1 livestock improvement and infrastructure development programme implemented in 5 LM's through CHDA by 30 June 2020
Target achieved 1 Livestock improvement and infrastructure development programme implemented on Animal Health programme in 5 LM's through CHDA
N/A N/A Livestock improvement and infrastructure development reports
Director :IPED
Number of Dry land cropping programme
LED-3.3
1 Dry land cropping programme (RAFI)
1 Dry land cropping programme (RAFI) supported in 2 LM’s
1 Dry land cropping programme (RAFI) supported at Intsika
Target not Achieved 0 Dry land
The fencing of the project was not erected
The fencing will be erected in the first
Dry land cropping report
Director :IPED

232
Measurable Objectives
5 YR Outcome
Strategy KPI Indicator Code
2018-2019 Financial Year 2019-2020 Financial year
SnapShot
Variances Remedial Evidence Custodian
Annual Target
Actual Performance
Annual Target Actual Performance
(RAFI) supported and rolled out in all LM's
supported in 2 LM’s by 30 June 2019
Yethu LM by 30 June 2020
cropping programme (RAFI) supported at Intsika Yethu
due to Covid 19 regulations.
quarter of the 2020-2021 financial year.
Number of irrigation schemes supported as per SLA with CHDA
LED-3.4
2 Irrigation schemes supported as per SLA with CHDA by 30 June 2019
2 Irrigation schemes supported as per SLA with CHDA
2 Irrigation schemes supported as per SLA with CHDA by 30 June 2020
Target Achieved 2 Irrigation schemes supported Bilatye Irrigation Scheme-piggery production with batch of 100 piglets and Shiloh Irrigation Scheme-Wine production-
N/A N/A Irrigation schemes report
Director :IPED

233
Measurable Objectives
5 YR Outcome
Strategy KPI Indicator Code
2018-2019 Financial Year 2019-2020 Financial year
SnapShot
Variances Remedial Evidence Custodian
Annual Target
Actual Performance
Annual Target Actual Performance
maintenance of Vineyard
Number of SMME programmes Implemented as per concept document
LED-4
03 SMME programmes implemented as per concept document by 30 June 2019
03 SMME programmes implemented as per concept document
01 SMME programmes implemented as per concept document by 30 June 2020
Target Achieved 01 SMME programmes implemented through a training session with ECDC
N/A N/A SMME Training report, course outline, Attendance register
Director :IPED
% of budget spent on local businesses as per Preferential Procurement regulation
LED-5
30% of budget spent on local businesses as per preferential procurement monitored by 30
30% of budget spent on local businesses as per preferential procurement monitored
30% of budget spent on local businesses as per preferential procurement monitored by 30 June 2020
Target Achieved 30% of budget spent on local businesses as per preferential procurement
N/A N/A Analysis report
Director :IPED

234
Measurable Objectives
5 YR Outcome
Strategy KPI Indicator Code
2018-2019 Financial Year 2019-2020 Financial year
SnapShot
Variances Remedial Evidence Custodian
Annual Target
Actual Performance
Annual Target Actual Performance
monitored
June 2019
monitored
Number of tourism & Heritage programmes implemented
LED-6
06 Tourism and heritage programmes implemented by 30 June 2019
05 Tourism and heritage programmes implemented
06 Tourism and heritage programmes implemented by 30 June 2020
Refer to the indicator LED 6.1 and LED 6.6 for actual performance
Refer to the indicator LED 6.1 and LED 6.6 for actual performance
Refer to the indicator LED 6.1 and LED 6.6 for actual performance
SLA, Business plan attendance register, stall visitors registration
Director :IPED
Number of LTOs supported through CHARTO
LED - 6.1
5 LTOs supported through CHARTO by 30 June 2019
3 LTOs supported through CHARTO
2 LTOs supported through CHARTO by 30 June 2020
Target achieved 2 LTOs supported at Emalahleni LM and Engcobo LM through CHARTO
N/A N/A LTOs report
Director :IPED
Number of Arts & Craft supports
LED - 6.2
2 Arts & Craft supported by 30 June 2019
2 Arts & Craft supported
1 Arts & Craft supported by 30 June 2020
Target achieved 1 Arts & Craft programme
N/A N/A Arts & Craft programme report
Director :IPED

235
Measurable Objectives
5 YR Outcome
Strategy KPI Indicator Code
2018-2019 Financial Year 2019-2020 Financial year
SnapShot
Variances Remedial Evidence Custodian
Annual Target
Actual Performance
Annual Target Actual Performance
supported for Inkcubeko Yethu Art & Craft
Number of Tourism Destination Marketing Programmes attended
LED - 6.3
1 Tourism Destination marketing Programmes attended by 30 June 2019
1 Tourism Destination marketing Programmes attended
1 Tourism Destination marketing Programmes attended by 30 June 2020
Target not achieved 0 Tourism Destination marketing Programmes attended
National department of Tourism cancelled the programme due to Covid 19 regulation.
National department of Tourism will issue a new dates for the programme of 2020-2021 financial year.
Attendance register, orders and pictures. visitors register, report, Registration of stalls, ToR
Director :IPED
Number of Programmes implemented to support Sabalele Multi
LED - 6.4
1 Programme implemented to support Sabalele Multi purpose centre
1 Programme implemented to support Sabalele Multi purpose centre
1 Programme implemented to support Sabalele Multi purpose centre by
Target not achieved, 0 Programme implemented to support Sabalele
The target was not achieved due budget cuts.
The project is budgeted for implementation in the 2020-2021
Sabalele Multi reports
Director :IPED

236
Measurable Objectives
5 YR Outcome
Strategy KPI Indicator Code
2018-2019 Financial Year 2019-2020 Financial year
SnapShot
Variances Remedial Evidence Custodian
Annual Target
Actual Performance
Annual Target Actual Performance
purpose centre
by 30 June 2019
30 June 2020
Multi purpose centre
financial year.
Number of Heritage Month and Chris Hani Month Programmes conducted as per concept documents by 30 June 2020
LED-6.5
1 Chris Hani Month Programmes conducted as per concept documents by 30 June 2019
1 Chris Hani Month Programmes conducted as per concept documents
1 Heritage Month and 1 Chris Hani Month Programmes conducted as per concept documents by 30 June 2020
Target not achieved 1 Heritage Month and 0 Chris Hani Month Programmes conducted as per concept documents
Chris Hani Month Programme was not implemented due to budget cut and Covid 19 regulation.
The project is budgeted for implementation in the 2020-2021 financial year and will be implemented in the fourth quarter of 2020-2021
Heritage Month and Chris Hani month Programmes report
Director :IPED
Number of heritage site preserved for Bathandwa Ndondo
LED-6.6
3 Heritage Programmes conducted as per concept documents by 30
3 Heritage Programmes conducted as per concept documents
01 heritage site preserved for Lesseyton by 30 June 2020
Target Achieved 1 heritage site preserved for Lesseyton through
N/A N/A Heritage site report
Director :IPED

237
Measurable Objectives
5 YR Outcome
Strategy KPI Indicator Code
2018-2019 Financial Year 2019-2020 Financial year
SnapShot
Variances Remedial Evidence Custodian
Annual Target
Actual Performance
Annual Target Actual Performance
June 2019
erection of fencing during Phase 1.
Number of Forestry programmes implemented
LED - 7
03 Forestry Programmes implemented by 30 June 2020
03 Forestry Programmes implemented
02 Forestry Programmes implemented by 30 June 2020
Refer to the indicator LED 7.1 and LED 7.2 for actual performance
Refer to the indicator LED 7.1 and LED 7.2 for actual performance
Refer to the indicator LED 7.1 and LED 7.2 for actual performance
Attendance register,resolution register, Minutes, Completion certificate, orders, quarterly reports, pictures,Delivery notes MOU (IYM LM & CHDM) monitoring report,
Director :IPED

238
Measurable Objectives
5 YR Outcome
Strategy KPI Indicator Code
2018-2019 Financial Year 2019-2020 Financial year
SnapShot
Variances Remedial Evidence Custodian
Annual Target
Actual Performance
Annual Target Actual Performance
Number of Charcoal programmes supported
LED - 7.1
2 Charcoal programme supported by 30 June 2019
1 Charcoal programme supported
1 Charcoal programme supported by 30 June 2020
Target Achieved 1 Charcoal programme supported through purchasing of equipment
N/A N/A Charcoal programme report
Director :IPED
Number of Nursery programmes supported
LED - 7.2
1 Nursery programme supported by 30 June 2019
1 Nursery programme supported by 30 June 2020
1 Nursery programme supported by 30 June 2020
Target Achieved 1 Nursery programme supported through SLA with Intsika Yethu local municipality
N/A N/A Nursery programme supported report
Director :IPED
Improved regional
Implementation of EPWP Policy
Number of jobs created
LED - 8
1500 Jobs Created through
3383 Jobs Created through EPWP
2200 Jobs Created through EPWP by
Target Not Achieved
34 EPWP’s not appointed
Corporate services departm
EPWP Report
Director :IPED

239
Measurable Objectives
5 YR Outcome
Strategy KPI Indicator Code
2018-2019 Financial Year 2019-2020 Financial year
SnapShot
Variances Remedial Evidence Custodian
Annual Target
Actual Performance
Annual Target Actual Performance
economy
through EPWP
EPWP by 30 June 2019
30 June 2020
2199 Jobs created through EPWP at the following departments IPED - 34 achieved SMS - 11 achieved Health & Community services -100 achieved Engineering - 2054 achieved
by Corporate services department due to National lockdown
ent appointment of EPWP in the next financial year.
KPA 4: MUNICIPAL FINANCIAL VIABILITY AND MANAGEMENT Weight : 20%
Broader Objective 4 :To Ensure an Efficient and Co-ordinated Financial Management that Enables CHDM to deliver its Mandate
Ensure sound financial mana
Sound financial Management and compliance with
Compilation of Credible Budgets and financial reports
Number of Credible budgets and financial reports
FMV - 1
4 Credible budgets and 16 Financial reports compiled
4 Credible budgets and 3 Financial reports compiled
4 Credible budgets and 16 Financial reports compiled and
Target achieved 4 Credible budgets and 16
Refer to FMV-1.1 & FMV- 1.2 for actual performance
Refer to FMV-1.1 & FMV- 1.2 for actual performance
Credible budgets Financial reports, Council
Chief Financial Officer

240
Measurable Objectives
5 YR Outcome
Strategy KPI Indicator Code
2018-2019 Financial Year 2019-2020 Financial year
SnapShot
Variances Remedial Evidence Custodian
Annual Target
Actual Performance
Annual Target Actual Performance
gement
legislation
compiled and approved
and approved 30 June 2019
and approved
approved 30 June 2020
Financial reports compiled and approved
Resolution
Number of Credible budgets compiled and approved
FMV - 1.1
4 Credible budgets compiled and approved by 30 June 2019
3 Credible budgets compiled and approved
4 Credible budgets compiled and approved by 30 June 2020
Target Achieved 4 Departmental budget reports contributing towards compilation of institutional credible budgets
N/A N/A Roll over adjustment budget Council Resolution. 2nd Adjustment budget & Draft budget Council Resolution. Final Budget Council Resolution.
Chief Financial Officer
Number of Financial reports
FMV - 1.2
16 Financial reports compiled
16 Financial reports compiled
4 Financial reports compiled and
Target Achieved 16
N/A N/A Acknowledgement of S71
Chief Financial Officer

241
Measurable Objectives
5 YR Outcome
Strategy KPI Indicator Code
2018-2019 Financial Year 2019-2020 Financial year
SnapShot
Variances Remedial Evidence Custodian
Annual Target
Actual Performance
Annual Target Actual Performance
compiled and approved
and approved by 30 June 2019
and approved
approved by 30 June 2020
Financial reports compiled and approved
reports by Executive Mayor & National Treasury
Ensure sound financial management
Sound financial Management and compliance with legislation
Implementation of Revenue Enhancement Strategy
Number of Revenue Enhancement programmes implemented
FMV-2
04 Revenue Enhancement programmes implemented by 30 June 2019
0 Revenue Enhancement programmes implemented
03 Revenue Enhancement programmes implemented by 30 June 2020
Refer to FMV-2.1 to FMV- 2.4 for actual performance
Refer to FMV-2.1 to FMV- 2.4 for actual performance
Refer to FMV-2.1 to FMV- 2.4 for actual performance
Data collection reports. Cost reflective tariffs consultation plan. Consultation report and Attendance registers. Draft Cost reflectiv
Chief Financial Officer

242
Measurable Objectives
5 YR Outcome
Strategy KPI Indicator Code
2018-2019 Financial Year 2019-2020 Financial year
SnapShot
Variances Remedial Evidence Custodian
Annual Target
Actual Performance
Annual Target Actual Performance
e tariffs, Council resolution. Final Cost reflective tariffs and Council resolution. 1. Indigent register review report. 2. Council resolution / noting. 3. Updated Indigent register. Debt

243
Measurable Objectives
5 YR Outcome
Strategy KPI Indicator Code
2018-2019 Financial Year 2019-2020 Financial year
SnapShot
Variances Remedial Evidence Custodian
Annual Target
Actual Performance
Annual Target Actual Performance
collection & Credit control implementation plan Debt collection & Credit control reports
Number of Data collection and capturing process completed in 4 Local Municipalities.
FMV-2.1
1 Data collection completed in 4 Local Municipalities by 30 June 2019
0 Data collection completed in 4 Local Municipalities
1 Data collection completed in 2 Local Municipalities by 30 June 2020
Target Not Achieved 0 Data collection completed in 2 Local Municipalities
1.Due to Covid 19 lockdown 2. Abscondmentof contracted Data collectors
An electronic data logger system will be utilized for data collection and capturing of information and the system
Data collection Reports
Chief Financial Officer

244
Measurable Objectives
5 YR Outcome
Strategy KPI Indicator Code
2018-2019 Financial Year 2019-2020 Financial year
SnapShot
Variances Remedial Evidence Custodian
Annual Target
Actual Performance
Annual Target Actual Performance
will be implemented in quarter 2 of the next financial year
Number of Debt collection and Credit control plans implemented
FMV-2.1.1
1 Debt collection & Credit control plan implemented by 30 June 2019
0 Debt collection & Credit control plan implemented
1 Debt collection & Credit control plan implemented by 30 June 2020
Target not Achieved 0 Debt collection & Credit control plan implemented
Register of reminders not submitted due to lockdown
1 Electronic reminders to be send to consumers in the next quarter of the 2020-2021 financial year. 2. Debt collection & Credit control plan to revised
Debt collection & Credit control reports
Chief Financial Officer

245
Measurable Objectives
5 YR Outcome
Strategy KPI Indicator Code
2018-2019 Financial Year 2019-2020 Financial year
SnapShot
Variances Remedial Evidence Custodian
Annual Target
Actual Performance
Annual Target Actual Performance
in the 2020-2021 financial year.
Number of Cost Reflective tariffs finalised and approved.
FMV-2.2
1 Cost Reflective tariffs developed and approved by 30 June 2019
0 Cost Reflective tariffs developed and approved
1 Cost Reflective tariffs approved by 30 June 2020
Target not achieved. 0 Cost Reflective tariffs approved
The Cost Reflective tariffs not approved due to credibility of the study conducted.
Cost Reflective tariffs to be reviewed to ensure alignment with the budget processes. The revised Cost Reflective tariffs to be approved in quarter 4 of 2020-2021
Cost Reflective tariffs study
Chief Financial Officer

246
Measurable Objectives
5 YR Outcome
Strategy KPI Indicator Code
2018-2019 Financial Year 2019-2020 Financial year
SnapShot
Variances Remedial Evidence Custodian
Annual Target
Actual Performance
Annual Target Actual Performance
financial year.
Number of Indigent register reviewed
FMV-2.3
1 Indigent register reviewed by 30 June 2019
1 Indigent register reviewed
1 Indigent register reviewed by 30 June 2020
Target not Achieved 0 Indigent register reviewed
Delays in appointment of service provider
The service provider will be appointed in quarter 3 of the next financial year
Indigent register review report
Chief Financial Officer
Ensure sound financial management
Sound financial Management and compliance with legislation
Implementation of SCM Policy
Number of SCM programmes implemented
FMV - 3
07 SCM programmes implemented by 30 June 2019
03 SCM programmes implemented
07 SCM programmes implemented by 30 June 2020
Refer to FMV-3.1 to FMV- 3.7 for actual performance
Refer to FMV-3.1 to FMV- 3.7 for actual performance
Refer to FMV-3.1 to FMV- 3.7 for actual performance
SCM Quarterly reports
Chief Financial Officer
Number of Procurement plan developed and implemented.
FMV - 3.1
1 Procurement plan developed and implemented by 30 June 2019
1 Procurement plan developed and but not 100% implemented
1 Procurement plan developed and implemented by 30 June 2020.
Target not Achieved 1 Procurement plan developed and approved
The Procurement plan developed, however the plan could not be fully implemented due to
An indicator for the implementation of the Procurement plan will the
Procurement plan
Chief Financial Officer

247
Measurable Objectives
5 YR Outcome
Strategy KPI Indicator Code
2018-2019 Financial Year 2019-2020 Financial year
SnapShot
Variances Remedial Evidence Custodian
Annual Target
Actual Performance
Annual Target Actual Performance
by Council
budget cuts.
cascaded to all department within the institution to ensure alignment to the budget with the SDBIP.
Number of Deviations reports submitted.
FMV - 3.2
4 Deviation reports submitted by 30 June 2020
Target not achieved. 4 Deviation reports were submitted.
The Procurement plan developed, however the plan could not be fully implemented due to budget cuts.
An indicator for the implementation of the Procurement plan will the cascaded to all department within the institution.
Deviation reports
Chief Financial Officer

248
Measurable Objectives
5 YR Outcome
Strategy KPI Indicator Code
2018-2019 Financial Year 2019-2020 Financial year
SnapShot
Variances Remedial Evidence Custodian
Annual Target
Actual Performance
Annual Target Actual Performance
Number of Irregular expenditure reports submitted.
FMV - 3.3
4 Irregular expenditure reports submitted by 30 June 2020
Target Not Achieved 4 Irregular expenditure reports
Report submitted together with the Supply Chain Annual Report as the component
The department will submit the Deviation report in a separate template and ensure the full compliance to the reports to the definition of the Deviation reports in line with the legislation as from the 1st Quarter 2020/21 Financial Year.
Irregular expenditure reports and the register
Chief Financial Officer
Number of Contract
FMV - 3.4
4 Contract management
Target not Achieved
Irregular expenditure
The irregular expenditu
Updated Contrac
Chief Financial Officer

249
Measurable Objectives
5 YR Outcome
Strategy KPI Indicator Code
2018-2019 Financial Year 2019-2020 Financial year
SnapShot
Variances Remedial Evidence Custodian
Annual Target
Actual Performance
Annual Target Actual Performance
management register and Commitments register reconciled
register and Commitments register reconciled by 30 June 2020
4 Contract management register and Commitments register reconciled
reports not submitted.
re reports will be submitted on a quarterly basis and these will be reviewed by the CFO prior to submission and signoff.
t and Commitment register Reconciliation report
Number of bid committees reports submitted
FMV - 3.5
1 Bid committees reports submitted by 30 June 2020
Target Not Achieved 1 Bid committees reports submitted
The reports not submitted prepared for the period under review.
The reports will be submitted on a quarterly basis and these will be reviewed by the CFO prior to submission and signoff.
Bid committees effectiveness reports
Chief Financial Officer

250
Measurable Objectives
5 YR Outcome
Strategy KPI Indicator Code
2018-2019 Financial Year 2019-2020 Financial year
SnapShot
Variances Remedial Evidence Custodian
Annual Target
Actual Performance
Annual Target Actual Performance
Number of Fruitless and Wasteful Expenditure reports submitted
FMV - 3.6
1 Fruitless and Wasteful Expenditure reports submitted by 30 June 2019
0 Fruitless and Wasteful Expenditure reports submitted
1 Fruitless and Wasteful Expenditure reports submitted by 30 June 2020
Target Not Achieved 1 Fruitless and Wasteful Expenditure reports submitted
The reports not submitted prepared for the period under review.
The reports will be submitted on a quarterly basis and these will be reviewed by the CFO prior to submission and signoff.
Fruitless and Wasteful expenditure reports
Chief Financial Officer
Number of Quarterly SCM reports prepared and submitted
FMV - 3.7
5 Quarterly SCM reports prepared and submitted by 30 June 2019
5 Quarterly SCM reports prepared and submitted
5 Quarterly SCM reports prepared and submitted by 30 June 2020
Target Achieved 5 Quarterly SCM reports prepared and submitted
N/A N/A 1 Consolidated Quarterly SCM reports and Proof of submission to Mayor and Provincial Treasur
Chief Financial Officer

251
Measurable Objectives
5 YR Outcome
Strategy KPI Indicator Code
2018-2019 Financial Year 2019-2020 Financial year
SnapShot
Variances Remedial Evidence Custodian
Annual Target
Actual Performance
Annual Target Actual Performance
y. 2. SCM Annual report
Ensure sound financial management
Sound financial Management and compliance with legislation
Implementation of MFMA Sec 65 and 66
% adherence to 30 days payment of valid invoices and payment of salaries by the due date.
FMV - 4
100% adherence to 30 days payment of valid invoices and payment of salaries by the due date by 30 June 2019
0% adherence to 30 days payment of valid invoices and 100% payment of salaries by the due date
100% adherence to 30 days payment of valid invoices and payment of salaries by the due date by 30 June 2020
Refer to FMV-4.1 to FMV- 4.2for actual performance
Refer to FMV-4.1 to FMV- 4.2for actual performance
Refer to FMV-4.1 to FMV- 4.2for actual performance
30 days monitoring report, Monthly Creditors age analyses report
Chief Financial Officer
% adherence to 30 days payment of valid invoices by the due date.
FMV - 4.1
100% adherence to 30 days payment of valid invoices by the due date by 30
0% adherence to 30 days payment of valid invoices by the due date
100% adherence to 30 days payment of valid invoices by the due date by 30 June 2020
Target Not achieved
All invoices that are over 30days were not paid due to invalid documents.
Follow up with affected departments on outstanding supporting
30 days monitoring report, Monthly Creditors age analyses report, HR994
Chief Financial Officer

252
Measurable Objectives
5 YR Outcome
Strategy KPI Indicator Code
2018-2019 Financial Year 2019-2020 Financial year
SnapShot
Variances Remedial Evidence Custodian
Annual Target
Actual Performance
Annual Target Actual Performance
June 2019
information.
Report from the system
% adherence to payment of salaries by the due date.
FMV - 4.2
100% adherence to payment of salaries by the due date by 30 June 2019
100% adherence to payment of salaries by the due date
100% adherence to payment of salaries by the due date by 30 June 2020
Target Achieved 100% adherence to payment of salaries by the due date
N/A N/A Approved salaries schedule, Report
Chief Financial Officer
Ensure sound financial management
Sound financial Management and compliance with legislation
Compilation of GRAP Compliant Asset Register
Number of GRAP compliant Fixed Asset Registers and Inventory Management programmes implemented
FMV - 5
4 GRAP Fixed Asset Register and 1 Inventory Register by 30 June 2019
2 GRAP Fixed Asset Register/ Inventory Register
1 GRAP Fixed Asset Register and 1 Inventory Register by 30 June 2020
Refer to FMV-5.1 to FMV- 5.3 for actual performance
Refer to FMV-5.1 to FMV- 5.3 for actual performance
Refer to FMV-5.1 to FMV- 5.3 for actual performance
Grap Compliant Asset Register and Inventory reports
Chief Financial Officer

253
Measurable Objectives
5 YR Outcome
Strategy KPI Indicator Code
2018-2019 Financial Year 2019-2020 Financial year
SnapShot
Variances Remedial Evidence Custodian
Annual Target
Actual Performance
Annual Target Actual Performance
Number of Updated GRAP compliant Asset Registers reconciling to the General ledger
FMV - 5.1
1 Updated GRAP compliant Asset Registers reconciling to the General ledger by 30 June 2019
0 Updated GRAP compliant Asset Registers reconciling to the General ledger
1 Updated GRAP compliant Asset Registers reconciling to the General ledger by 30 June 2020
Target Not achieved
The reports not submitted prepared for the period under review.
The reports will be submitted on a quarterly basis and these will be reviewed by the CFO prior to submission and signoff.
1. Annual Asset verification report 2. Grap Compliant Asset Register 3.Quarterly Reconciliations 4. Reconciliations report of WIP, Contracts and Commitment Register
Chief Financial Officer
Number of Inventory Management
FMV - 5.2
1 Inventory Management program
0 Inventory Management programme
1 Inventory Management programme
Target Not achieved
Due to lockdown the inventory stock on hand
The count will be done first
Updated Inventory register, Inventor
Chief Financial Officer

254
Measurable Objectives
5 YR Outcome
Strategy KPI Indicator Code
2018-2019 Financial Year 2019-2020 Financial year
SnapShot
Variances Remedial Evidence Custodian
Annual Target
Actual Performance
Annual Target Actual Performance
programmes implemented
me implemented by 30 June 2019
implemented by 30 June 2020
implemented by 30 June 2020
count was delayed
week of July
y count reports
Number of Inventory management training implemented
FMV - 5.2.1
1 Inventory management Plan developed and implemented by 30 June 2019
1 Inventory management Plan developed and but not 100% implemented
1 Inventory management training Programme implemented by 30 June 2020
Target not Achieved
The training programme had to be postponed due to COVID19
Training on solar is scheduled for the second quarter of the 2020/21 Financial Year as the lockdown level are expected to be relaxed and allow the gathering of people for training, etc.
1. Inventory management Training report 2. Attendance register and 3. Monitoring report
Chief Financial Officer

255
Measurable Objectives
5 YR Outcome
Strategy KPI Indicator Code
2018-2019 Financial Year 2019-2020 Financial year
SnapShot
Variances Remedial Evidence Custodian
Annual Target
Actual Performance
Annual Target Actual Performance
Ensure sound financial management
Sound financial Management and compliance with legislation
Compilation of GRAP Compliant AFS
Number of GRAP Compliant AFS compiled
FMV-6
04 GRAP Compliant AFS compiled by 30 June 2019
04 GRAP Compliant AFS compiled
04 GRAP Compliant AFS compiled by 30 June 2020
Target Achieved 04 GRAP Compliant AFS compiled
N/A N/A Completed set of Financial Statements, Minutes of Council Committee & council resolution a
Chief Financial Officer
Ensure sound financial management
Sound financial Management and compliance with legislation
Implementation of GRAP and MSCOA Compliant Financial Management systems
Number of GRAP and MSCOA Compliant Financial Management Systems programmes implemented
FMV – 7
03 GRAP and MSCOA Compliant Financial Management Systems programmes implemented by 30 June 2019
0 GRAP and MSCOA Compliant Financial Management Systems programmes implemented
03 GRAP and MSCOA Compliant Financial Management Systems programmes implemented by 30 June 2020
Refer to FMV-7.1 to FMV- 7.3 for actual performance
Refer to FMV-7.1 to FMV- 7.3 for actual performance
Refer to FMV-7.1 to FMV- 7.3 for actual performance
GRAP and MSCOA quarterly report,
Chief Financial Officer

256
Measurable Objectives
5 YR Outcome
Strategy KPI Indicator Code
2018-2019 Financial Year 2019-2020 Financial year
SnapShot
Variances Remedial Evidence Custodian
Annual Target
Actual Performance
Annual Target Actual Performance
Number of MSCOA version 6.2 implemented
FMV - 7.1
1 MSCOA version 6.2 implemented by 30 June 2019
0 MSCOA version 6.2 implemented
1 MSCOA version 6.2 implemented by 30 June 2020
Target Achieved 1 MSCOA version 6.2 implemented
N/A N/A Proof for MSCOA Compliant 19/20 budget and Rollover adjustment budget Uploading
Chief Financial Officer
Number of Pay day system upgrades implemented
FMV - 7.2
1 Pay day system upgrade implemented by 30 June 2019
0 Pay day system upgrade implemented
1 Pay day system upgrade implemented by 30 June 2020
Target Achieved 1 Pay day system upgrade implemented
N/A N/A Proof of version upgrade
Chief Financial Officer
Number of Solar modules activated
FMV - 7.3
4 Solar modules activated by 30 June 2019
0 Solar modules activated
1 Solar modules activated by 30 June 2020
Target not achieved 0 Solar modules activated
Training was not done to all user department due to lockdown
The Solar module training will be conducted in the next quarter
Attendance register, Training report, Programme,
Chief Financial Officer

257
Measurable Objectives
5 YR Outcome
Strategy KPI Indicator Code
2018-2019 Financial Year 2019-2020 Financial year
SnapShot
Variances Remedial Evidence Custodian
Annual Target
Actual Performance
Annual Target Actual Performance
of 2020-2021.
KPA NO 5 GOOD GOVERNANCE Weight : 20%
BROAD STRATEGIC OBJECTIVE 5: To create an Efficient, Effective, Accountable and Performance-oriented Administration
To enhance communication, Public Participation, Stakeholder informed Communities
Informed stakeholders
Implementation of Communication Plan
Number of Communication programmes implemented
GGPP - 1
5 Communication Programmes implemented by 30 June 2019
5 Communication Programmes implemented
5 Communication Programmes implemented by 30 June 2020
Refer to the following indicators GGPP 1.1 to GGPP 1.5 for actual performance
Refer to the following indicators GGPP 1.1 to GGPP 1.5 for actual performance
Refer to the following indicators GGPP 1.1 to GGPP 1.5 for actual performance
Reports on Communication Programmes
Director: Strategic Management Services
Number of External communication management programmes implemented
GGPP - 1.1
1 External communication management programme implemented by 30 June 2019
1 External communication management programme implemented
1 External communication management programme implemented by 30 June 2020
Target achieved : Facilitation of media engagement activities done : 22 media briefings; 3 live
N/A N/A External Communication support Report, Invitations, Copies of external newsletter and
Director: Strategic Management Services

258
Measurable Objectives
5 YR Outcome
Strategy KPI Indicator Code
2018-2019 Financial Year 2019-2020 Financial year
SnapShot
Variances Remedial Evidence Custodian
Annual Target
Actual Performance
Annual Target Actual Performance
broadcasts; 26 media releases produced; 33 radio talk shows and 22 adhoc interviews ; 272 radio adverts ; 31 newspaper adverts; 12 media monitoring reports produced ; 46 responses to media enquires done, 17 media
newsflashes,

259
Measurable Objectives
5 YR Outcome
Strategy KPI Indicator Code
2018-2019 Financial Year 2019-2020 Financial year
SnapShot
Variances Remedial Evidence Custodian
Annual Target
Actual Performance
Annual Target Actual Performance
advisories produced.
Number of Media management programmes implemented
GGPP - 1.2
1 Media management programme implemented by 30 June 2019
1 Media management programme implemented
1 Media management programme implemented by 30 June 2020
Target achieved : Facilitation of media engagement activities done : 22 media briefings; 3 live broadcasts; 26 media releases produced; 33 radio talk shows and 22 adhoc interviews ; 272 radio
N/A N/A Report on Engagement activities, Copies of media releases, Media monitoring reports
Director: Strategic Management Services

260
Measurable Objectives
5 YR Outcome
Strategy KPI Indicator Code
2018-2019 Financial Year 2019-2020 Financial year
SnapShot
Variances Remedial Evidence Custodian
Annual Target
Actual Performance
Annual Target Actual Performance
adverts ; 31 newspaper adverts; 12 media monitoring reports produced ; 46 responses to media enquires done, 17 media advisories produced.
Number of Internal communication management programmes
GGPP - 1.3
1 Internal communication management programme impleme
1 Internal communication management programme implemented
1 Internal communication management programme implement
Target Achieved 6 Internal awareness campaigns conducted ; 12
N/A N/A 1 Internal communication management programmes implem
Director: Strategic Management Services

261
Measurable Objectives
5 YR Outcome
Strategy KPI Indicator Code
2018-2019 Financial Year 2019-2020 Financial year
SnapShot
Variances Remedial Evidence Custodian
Annual Target
Actual Performance
Annual Target Actual Performance
implemented
nted by 30 June 2019
ed by 30 June 2020
Internal newsletters produced; 38 weekly diaries produced ; facilitated sharing of 198 information sharing emails ; Facilitation of communication support to 23 internal events done.
ented (1.Internal Awareness campaigns 2. Internal newsletter 3.weekly diary of activities 4. Facilitation of support to Internal events)
Number of Website & social media
GGPP - 1.4
1 Website & social media manage
1 Website & social media management
1 Website & social media management
Target achieved 1 Website & social
N/A N/A Website social media report, Request
Director: Strategic Management Services

262
Measurable Objectives
5 YR Outcome
Strategy KPI Indicator Code
2018-2019 Financial Year 2019-2020 Financial year
SnapShot
Variances Remedial Evidence Custodian
Annual Target
Actual Performance
Annual Target Actual Performance
management programmes implemented
ment programmes implemented by 30 June 2019
programmes implemented
programmes implemented by 30 June 2020
media management programmes implemented
, Monitoring of Website & social media report
Number of Marketing & events management programmes implemented
GGPP - 1.5
1 Marketing & events management programme implemented by 30 June 2019
1 Marketing & events management programme implemented
1 Marketing & events management programme implemented by 30 June 2020
Target achieved 1 Marketing & events management programme implemented
N/A N/A Report on Events management, Invitations, Report on Marketing materials, Order
Director: Strategic Management Services
To enhance communication, Public Participation,
Informed stakeholders
Implementation of Public Participation Strategy
Number of Public programmes implemented
GGPP - 2
N/A N/A 16 Public participation Programmes implemented by 30 June 2020
Refer to the following indicators GGPP 2.1 to GGPP 2.16 for actual performance
Refer to the following indicators GGPP 2.1 to GGPP 2.16 for actual performance
Refer to the following indicators GGPP 2.1 to GGPP 2.16 for actual
Reports on Stakeholder Engagement Programmes
Director :IPED/Strategic Management Services/Health and Commun

263
Measurable Objectives
5 YR Outcome
Strategy KPI Indicator Code
2018-2019 Financial Year 2019-2020 Financial year
SnapShot
Variances Remedial Evidence Custodian
Annual Target
Actual Performance
Annual Target Actual Performance
Stakeholder informed Communities
performance
ity Services
Number of Stakeholder engagement programmes implemented
GGPP - 2.1
7 Stakeholder engagement programmes implemented by 30 June 2019
9 Stakeholder engagement programmes implemented
8 Stakeholder engagement programmes implemented by 30 June 2020
Target Achieved 8 Stakeholder engagement programmes implemented
N/A N/A Attendance register, Report
Director: Strategic Management Services
Number of District Communication Coordination Forums conducted
GGPP - 2.2
32 Stakeholder Forums conducted by 30 June 2019
32 Stakeholder Forums conducted
4 District Communication Coordination Forums conducted by 30 June 2020
Target achieved 4 District Communication Coordination Forums conducted
N/A N/A Resolution register, attendance register, minutes
Director: Strategic Management Services
Number of District Speaker's Forums
GGPP - 2.3
4 District Speaker's Forums conducted by 30 June 2020
Target Achieved. 4 district Speakers Forums
N/A N/A Resolution register, attendance
Director: Strategic Management Services

264
Measurable Objectives
5 YR Outcome
Strategy KPI Indicator Code
2018-2019 Financial Year 2019-2020 Financial year
SnapShot
Variances Remedial Evidence Custodian
Annual Target
Actual Performance
Annual Target Actual Performance
conducted
Conducted.
register, minutes
Number of IGR Forums conducted
GGPP - 2.4
4 IGR Forums conducted by 30 June 2020
Target achieved 4 IGR Forums conducted
N/A N/A Resolution register, attendance register, minutes
Director: Strategic Management Services
Number of DIMAFO Forums conducted
GGPP - 2.5
4 DIMAFO Forums conducted by 30 June 2020
Target achieved. 4 DIMAFO Forums conducted
N/A N/A Resolution register, attendance register, minutes
Director: Strategic Management Services
Number of Disaster advisory forums conducted
GGPP-2.6
4 Disaster advisory forums conducted by 30 June 2020
Target Achieved 4 Disaster advisory forums conducted
N/A N/A Resolution register, attendance register, minutes
Director: Health and Community Services
Number of Environment and climate
GGPP-2.7
4 Environment and climate change forum
Target achieved 4 Environment and
N/A N/A Resolution register, attendance
Director: Health and Community Services

265
Measurable Objectives
5 YR Outcome
Strategy KPI Indicator Code
2018-2019 Financial Year 2019-2020 Financial year
SnapShot
Variances Remedial Evidence Custodian
Annual Target
Actual Performance
Annual Target Actual Performance
change forums conducted
conducted by 30 June 2020
climate change forum conducted
register, minutes
Number of Town Planners forum conducted
GGPP - 2.8
4 Town Planners forum conducted by 30 June 2020
Target achieved 4 Town Planners forum conducted
N/A N/A Resolution register, attendance register, minutes
Director: Health and Community Services
Number of LED forums conducted
GGPP - 2.9
4 LED forums conducted by 30 June 2020
Target achieved 4 LED forums conducted
N/A N/A Resolution register, attendance register, minutes
Director: PED
Number of IDP Rep forums conducted
GGPP - 2.10
4 IDP Rep forums conducted by 30 June 2020
Target achieved 4 IDP Rep forums conducted
N/A N/A Resolution register, attendance register, minutes
Director: PED
Number of Human
GGPP -
4 Human Settlement forums
Target achieved
N/A N/A Resolution register,
Director: PED

266
Measurable Objectives
5 YR Outcome
Strategy KPI Indicator Code
2018-2019 Financial Year 2019-2020 Financial year
SnapShot
Variances Remedial Evidence Custodian
Annual Target
Actual Performance
Annual Target Actual Performance
Settlement forums conducted
2.11
conducted by 30 June 2020
4 Human Settlement forums conducted
attendance register, minutes
Number of MPAC reports compiled and submitted
GGPP - 2.12
4 MPAC meetings convened by 30 June 2019
11 MPAC meetings convened
4 MPAC reports compiled and submitted by 30 June 2020
Target Achieved. 4 reports compiled and submitted to council by June 30 2020.
N/A N/A MPAC Reports, Council Resolution
Director: Strategic Management Services
Number of Women Caucus Programmes implemented
GGPP - 2.13
2 Women caucus programs implemented by 30 June 2019
2 Women caucus programs implemented
2 Women caucus programs implemented by 30 June 2020
Target not Achieved
The seminar was scheduled for March however no meetings were conducted during level 5 & 4 lockdown, due to the
A conferencing session will conducted for Women caucus seminar in the 2020/21 financial year.
Women caucus Plan, Attendance register (Seminar/Workshop, Minutes of Meeting ,report, Resoluti
Director: Strategic Management Services

267
Measurable Objectives
5 YR Outcome
Strategy KPI Indicator Code
2018-2019 Financial Year 2019-2020 Financial year
SnapShot
Variances Remedial Evidence Custodian
Annual Target
Actual Performance
Annual Target Actual Performance
nature of the seminar program, the target group and its objectives
on register
Number of Moral Regeneration programmes implemented
GGPP - 2.14
2 Moral Regeneration Movement programmes implemented by 30 June 2019
2 Moral Regeneration Movement programmes implemented
2 Moral Regeneration Movement programmes implemented by 30 June 2020
Targets Achieved 3 Moral Regeneration Movement programmes implemented. full week MRM closure in July 2019 spending a week at Sakhisizwe visiting schools,
Three program s instead of two were achieved because MRM wanted to reach out to youth in tertiary schools and had targeted WSU Whittle sea campus .
We tried to conduct another youth program through a radio dialogue for all youth at home with SAYC but was cancelled at the list minute.
Moral Regeneration Movement report , Attendance register, Minutes of Meeting, Resolution register, Moral Regeneration
Director: Strategic Management Services

268
Measurable Objectives
5 YR Outcome
Strategy KPI Indicator Code
2018-2019 Financial Year 2019-2020 Financial year
SnapShot
Variances Remedial Evidence Custodian
Annual Target
Actual Performance
Annual Target Actual Performance
churches, communities and traditional councils; Training of all MRM structures by GIZ on civic activism, conflict resolution and leadership; Imbizos with traditional councils in local municipalities for level 3 COVID 19 awareness and GBV fight
We were still able to meet our targets as planned. In future plan properly the number of programs to be implemented.
Movement Plan

269
Measurable Objectives
5 YR Outcome
Strategy KPI Indicator Code
2018-2019 Financial Year 2019-2020 Financial year
SnapShot
Variances Remedial Evidence Custodian
Annual Target
Actual Performance
Annual Target Actual Performance
Number of District Initiation programmes implemented
GGPP - 2.15
2 District Initiation Programmes Implemented by 30 June 2019
2 District Initiation Programmes Implemented
2 District Initiation Programmes Implemented by 30 June 2020
Target Achieved 2 winter and summer initiation awareness campaigns, bush tracking and rescuing efforts were done successfully, saving lives of initiates that would otherwise have been lost.
N/A N/A District Initiation Plan, Attendance register, Minutes of Meeting, Resolution register, Initiation Programme report
Director: Strategic Management Services
Number of Citizen Empowerment program
GGPP - 2.16
5 Citizen Empowerment programmes
5 Citizen Empowerment programmes
6 Citizen Empowerment programmes
Refer to the following indicators GGPP
Refer to the following indicators GGPP
Refer to the following indicator
Citizen Empowerment progra
Director :Strategic Management Services/

270
Measurable Objectives
5 YR Outcome
Strategy KPI Indicator Code
2018-2019 Financial Year 2019-2020 Financial year
SnapShot
Variances Remedial Evidence Custodian
Annual Target
Actual Performance
Annual Target Actual Performance
mes implemented
implemented by 30 June 2019
implemented
implemented by 30 June 2020
2.16.1 to GGPP 2.16.6 for actual performance
2.16.1 to GGPP 2.16.6 for actual performance
s GGPP 2.16.1 to GGPP 2.16.6 for actual performance
mmes report
Health and Community Services
Number of Capacity building programmes implemented
GGPP - 2.16.1
3 Capacity building programmes implemented by 30 June 2020
Target not achieved 3 Capacity building programmes not implemented
1. The classes at Rhodes University were closed due to lockdown. 2. The responses to some petitions were not received as expected and no meeting was called to respond
1. Classes will resume in August online. 2. The petitions facilitation is ongoing and will continue to be perused. 3. A programme to go to the petitioners and
Capacity building Plan, Attendance register (Meeting, Traning,Perticians) Quarterly report (Training, Civic education, Pertician &public )
Director: Strategic Management Services

271
Measurable Objectives
5 YR Outcome
Strategy KPI Indicator Code
2018-2019 Financial Year 2019-2020 Financial year
SnapShot
Variances Remedial Evidence Custodian
Annual Target
Actual Performance
Annual Target Actual Performance
during this time. 3. Civic education changed focus to COVID -19 level 3 awareness campaigns led by the Speaker working with LM Speakers, traditional leaders and MRM and reported in the three programs.
confirm response on the problems solved on the ground has been circulated to start on the 13 to 28 August 2020.
Number of Health and hygiene awarene
GGPP- 2.16.2
60 Health and hygiene awareness programm
Target Achieved 60 Health and
N/A N/A Awareness programmes report,
Director: Health and Commun

272
Measurable Objectives
5 YR Outcome
Strategy KPI Indicator Code
2018-2019 Financial Year 2019-2020 Financial year
SnapShot
Variances Remedial Evidence Custodian
Annual Target
Actual Performance
Annual Target Actual Performance
ss programmes conducted
es conducted by 30 June 2020
hygiene awareness programmes conducted
attendance registers, concept document
ity Services
Number of Awareness programmes provided to food handlers
GGPP- 2.16.3
4 Awareness programmes provided to food handlers by 30 June 2020
Target achieved 4 Awareness programmes provided to food handlers by 30 June 2020
N/A N/A Awareness programmes report, attendance registers, concept document
Director: Health and Community Services
Number of Disaster awareness programmes conducted
GGPP- 2.16.4
4 Disaster awareness programmes conducted by 30 June 2020
Target Achieved 4 Disaster awareness programme conducted
N/A N/A Awareness programmes report, attendance registers, concept
Director: Health and Community Services

273
Measurable Objectives
5 YR Outcome
Strategy KPI Indicator Code
2018-2019 Financial Year 2019-2020 Financial year
SnapShot
Variances Remedial Evidence Custodian
Annual Target
Actual Performance
Annual Target Actual Performance
document
Number of Environmental management awareness programmes conducted
GGPP- 2.16.5
8 Environmental management awareness programmes conducted by 30 June 2020
Target achieved 8 Environmental management awareness programmes conducted
N/A N/A Awareness programmes report, attendance registers, concept document
Director: Health and Community Services
Number of Customer Education and awareness campaigns conducted
GGPP - 2.16.6
28 Customer Education and awareness campaigns implemented by 30 June 2020
Target not achieved 23 Customer Education and awareness campaigns not implemented
5 awareness campaigns could not be conducted. The plan coincided with the National Lockdown due to Covid-19
The approach to awareness campaigns will be amended and these will now be conducted in the
Awareness programmes report, attendance registers, plan
Director: Strategic Management Services

274
Measurable Objectives
5 YR Outcome
Strategy KPI Indicator Code
2018-2019 Financial Year 2019-2020 Financial year
SnapShot
Variances Remedial Evidence Custodian
Annual Target
Actual Performance
Annual Target Actual Performance
pandemic (from 27 of March 2020 until end of financial year), however awareness with customers was done through BULK SMS..
next quarter of 2020-2021 through available multi-media platforms. Concept document for each will be developed.
To enhance communication ,stakeholder Management and custo
Satisfied Customers
Implementation of Customer Care Management Plan
Number of Customer Care Management Programmes implemented
GGPP - 3
02 Customer Care Management Programmes Implemented by 30 June 2019
02 Customer Care Management Programmes Implemented
02 Customer Care Management Programmes Implemented by 30 June 2020
Refer to the following indicators GGPP 3.1 and GGPP 3.1- 3,2 for actual performance
Refer to the following indicators GGPP 3.1 and GGPP 3.1- 3,2 for actual performance
Refer to the following indicators GGPP 3.1 and GGPP 3.1- 3,2 for actual performance
Reports on Customer Care Management Programmes
Director: Strategic Management Services

275
Measurable Objectives
5 YR Outcome
Strategy KPI Indicator Code
2018-2019 Financial Year 2019-2020 Financial year
SnapShot
Variances Remedial Evidence Custodian
Annual Target
Actual Performance
Annual Target Actual Performance
mer care
Number of Customer satisfaction surveys conducted
GGPP-3.1
1 Customer satisfaction survey conducted by 30 June 2019
1 Customer satisfaction survey conducted
1 Customer satisfaction survey conducted by 30 June 2020
Target not achieved Implementation Plan to conduct the survey was readily available but funds were redirected to other institutional projects and this could not be implemented.
Due to funds being redirected to other institutional projects.
Requested funds to be made available in the new financial year.
Workshop report, Attendance registers, Customer satisfaction Survey plan, ,
Director: Strategic Management Services

276
Measurable Objectives
5 YR Outcome
Strategy KPI Indicator Code
2018-2019 Financial Year 2019-2020 Financial year
SnapShot
Variances Remedial Evidence Custodian
Annual Target
Actual Performance
Annual Target Actual Performance
Number customer complaints reports submitted
GGPP-3.2
4 Customer complaints reports submitted by 30 June 2019
4 Customer complaints reports submitted
4 Customer complaints reports submitted by 30 June 2020
Target achieved 100% Customer complaints registered referred to relevant department and submitted 4 reports.
N/A N/A Complaints resolution reports
Director: Strategic Management Services
To ensure clean administration and accountable governance
Good Governance
Development and Implementation of Risk-Based Operational Plan
Number of Risk based Internal Audit Plan developed and Implemented
GGPP - 4
01 Risk based internal audit plan developed and implemented by 30 June 2019
01 Risk based internal audit plan developed and implemented
01 Risk based internal audit plan developed and implemented by 30 June 2020
Target Achieved, 01 Risk based internal audit plan developed and Fully implemented
N/A N/A Internal Audit Quarterly Reports; Approved Risk Based Internal Audit Plan
Director: Strategic Management Services

277
Measurable Objectives
5 YR Outcome
Strategy KPI Indicator Code
2018-2019 Financial Year 2019-2020 Financial year
SnapShot
Variances Remedial Evidence Custodian
Annual Target
Actual Performance
Annual Target Actual Performance
Implementation of Risk Management Framework
Number of Risk Management Programmes implemented
GGPP - 5
03 Risk Management Programmes Implemented by 30 June 2019
03 Risk Management Programmes Implemented
03 Risk Management Programmes Implemented by 30 June 2020
Refer to the following indicators GGPP 5.1 to GGPP 5.3 for actual performance
Refer to the following indicators GGPP 5.1 to GGPP 5.3 for actual performance
Refer to the following indicators GGPP 5.1 to GGPP 5.3 for actual performance
Risk Management Programme reports
Director: Strategic Management Services
Number of Risk Management Monitoring report complied
GGPP - 5.1
4 Risk Management Monitoring report complied by 30 June 2019
4 Risk Management Monitoring report complied
4 Risk Management Monitoring report complied by 30 June 2020
Target achieved Risk Management Monitoring report complied
N/A N/A Attendance registers, Risk Management reports
Director: Strategic Management Services
Number of Anti-fraud and Corruption initiative conducted
GGPP - 5.2
1 Anti-fraud and Corruption initiative conducted by 30
1 Anti-fraud and Corruption initiative conducted
1 Anti-fraud and Corruption initiative conducted by 30 June 2020
Target achieved 1 Anti-fraud and Corruption initiative conducted
N/A N/A Anti-fraud and Corruption risk report and attenda
Director: Strategic Management Services

278
Measurable Objectives
5 YR Outcome
Strategy KPI Indicator Code
2018-2019 Financial Year 2019-2020 Financial year
SnapShot
Variances Remedial Evidence Custodian
Annual Target
Actual Performance
Annual Target Actual Performance
June 2019
nce register
Number of Risk Compliance Audit conducted
GGPP - 5.3
1 Risk Compliance Audit conducted by 30 June 2019
1 Risk Compliance Audit conducted
1 Risk Compliance Audit conducted by 30 June 2020
Target not achieved Risk Compliance Audit was not conducted
Due to the budget cut
The Risk Compliance Audit will be conducted in the financial year.
Compliance Audit report, Risk Management Implementation Plan
Director: Strategic Management Services
Implementation of PMS Framework
Number of PMS Programmes Implemented
GGPP - 6
04 PMS programmes implemented by 30 June 2019
04 PMS programmes implemented
04 PMS programmes implemented by 30 June 2020
Refer to the following indicators GGPP 6.1 to GGPP 6.4 for actual performance
Refer to the following indicators GGPP 6.1 to GGPP 6.4 for actual performance
Refer to the following indicators GGPP 6.1 to GGPP 6.4 for actual performance
Reports PMS programmes
Director: Strategic Management Services
Number of Quarterly Performance
GGPP-6.1
4 Quarterly Performance Reviews
4 Quarterly Performance Reviews
4 Quarterly Performance Reviews conducted
Target achieved 4 Quarterly Performance
N/A N/A Performance review reports
Director: Strategic Management Services

279
Measurable Objectives
5 YR Outcome
Strategy KPI Indicator Code
2018-2019 Financial Year 2019-2020 Financial year
SnapShot
Variances Remedial Evidence Custodian
Annual Target
Actual Performance
Annual Target Actual Performance
Reviews conducted
conducted by 30 June 2019
conducted
by 30 June 2020
Reviews conducted
Number of SDBIP developed and submitted
GGPP-6.2
2 SDBIP developed and submitted by 30 June 2019
2 SDBIP developed and submitted
2 SDBIP developed and submitted by 30 June 2020
Target achieved 2 SDBIP developed and submitted
N/A N/A Q 1= Approved SDBIP, Q 2= Approved adjusted SDBIP
Director: Strategic Management Services
Number of statutory performance reports compiled and submitted
GGPP-6.3
2 statutory performance reports compiled and submitted by 30 June 2019
2 statutory performance reports compiled and submitted
2 statutory performance reports compiled and submitted by 30 June 2020
Target achieved 2 statutory performance reports compiled and submitted
N/A N/A Q1= Draft Annual report, Annual performance report and Council resolution Q 3= final Annual report and Council
Director: Strategic Management Services

280
Measurable Objectives
5 YR Outcome
Strategy KPI Indicator Code
2018-2019 Financial Year 2019-2020 Financial year
SnapShot
Variances Remedial Evidence Custodian
Annual Target
Actual Performance
Annual Target Actual Performance
Resolution
Number of Directors Quarterly Performance Assessments conducted
GGPP-6.4
N/A N/A 3 Directors Quarterly Performance Assessments conducted by 30 June 2020
Target not achieved 1 Directors Quarterly Performance Assessments conducted
A date was schedule for the assessment however it was affected by other engagements
The assessment will be conducted in the next financial year together with the Annual assessments
Directors Quarterly Performance Assessments reports
Director: Strategic Management Services
To facilitate and coordinate integrated Special Programmes
Mainstreamed programmes
Implementation of STI's, TB, HIV, SPU Mainstreaming and Youth Development Plan
Number of Special Programmes implemented
GGPP - 7
03 Special programmes implemented by 30 June 2019
02 Special programmes implemented
03 Special programmes implemented by 30 June 2020
Refer to the following indicators GGPP 7.1 to GGPP 7.3 for actual performance
Refer to the following indicators GGPP 7.1 to GGPP 7.3 for actual performance
Refer to the following indicators GGPP 7.1 to GGPP 7.3 for actual performance
Reports on Special programmes implemented
Director: Strategic Management Services
Number of HIV,TB
GGPP
4 HIV,TB and STI's
4 HIV,TB and STI's
4 HIV,TB and STI's
Target Achieved.
N/A N/A Attenda
nce Director: Strategic

281
Measurable Objectives
5 YR Outcome
Strategy KPI Indicator Code
2018-2019 Financial Year 2019-2020 Financial year
SnapShot
Variances Remedial Evidence Custodian
Annual Target
Actual Performance
Annual Target Actual Performance
and STI's programmes implemented as per SPU calendar and HIV,TB and STI's implementation plan
- 7.1
programme implementation as per SPU calendar and HIV,TB and STI's implementation plan by 30 June 2019
programme implementation as per SPU calendar and HIV,TB and STI's implementation plan by 30 June 2020
programme implementation as per SPU calendar and HIV,TB and STI's implementation plan by 30 June 2020
4 HIV,TB and STI's programme implementation as per SPU calendar and HIV,TB and STI's implementation plan through commemoration of the 16 Days of Activism and District world AIDS Day held at Ncorha in Intsika Yethu Local
registers; SPU calendar of events, Report, HIV,TB and STI's implementation plan
Management Services

282
Measurable Objectives
5 YR Outcome
Strategy KPI Indicator Code
2018-2019 Financial Year 2019-2020 Financial year
SnapShot
Variances Remedial Evidence Custodian
Annual Target
Actual Performance
Annual Target Actual Performance
Municipality; STI and Condom week Activation programme held at Ikhala TVET College; coordination of NPOs participation in the COVID19 intervention programmes.
Develop and implement Special Programmes and Mainstre
Number of Special Programmes Implemented as
GGPP - 7.2
1 Special Programmes Mainstreaming Strategy developed and 4
1 Special Programmes Mainstreaming Strategy developed and 4 SPU
4 Special Programmes implemented as per SPU calendar
Target Achieved. 4 Special Programmes implemented as per SPU
N/A N/A Attendance registers, SPU Programme report, SPU
Director: Strategic Management Services

283
Measurable Objectives
5 YR Outcome
Strategy KPI Indicator Code
2018-2019 Financial Year 2019-2020 Financial year
SnapShot
Variances Remedial Evidence Custodian
Annual Target
Actual Performance
Annual Target Actual Performance
aming Strategy
per SPU calendar
SPU programmes implemented as per SPU calendar by 30 June 2019
programmes implemented as per SPU calendar 4 Special Programmes implemented as per SPU calendar
by 30 June 2020
calendar though Disability rights awareness programme held at Indwe in Emalahleni Local Municipality; participation in the Provincial Gender Machinery programme for Women’s Day intervention and participation in the Provincial Gender
calendar of events

284
Measurable Objectives
5 YR Outcome
Strategy KPI Indicator Code
2018-2019 Financial Year 2019-2020 Financial year
SnapShot
Variances Remedial Evidence Custodian
Annual Target
Actual Performance
Annual Target Actual Performance
Machinery programme for Women’s Day intervention
Develop and implement the District youth implementation plan
Number of Youth development implementation plan developed and Youth development programmes implemented as per SPU calendar
GGPP - 7.3
1 Youth development implementation plan developed and 4 Youth development programmes implemented as per the SPU calendar by 30 June 2019
1 Youth development implementation plan developed and 4 Youth development programmes implemented as per the SPU calendar
4 Youth development programmes implemented as per the SPU calendar by 30 June 2020
Target Achieved. 4 Youth Development programmes implemented as per the SPU calendar through Steve Vukile Tshwete District eliminations held in Komani and
N/A N/A Attendance registers, Consultation Report, Appointment letter, Youth Development Programme report, Draft Youth Development implementation
Director: Strategic Management Services

285
Measurable Objectives
5 YR Outcome
Strategy KPI Indicator Code
2018-2019 Financial Year 2019-2020 Financial year
SnapShot
Variances Remedial Evidence Custodian
Annual Target
Actual Performance
Annual Target Actual Performance
coordination of the OTP youth Legacy programme within the District
plan, Youth Development implementation plan, Minutes of SPU Forum for adorption,SPU calendar of events,
To ensure integrated approach to service delivery To ensure
Improved Service Delivery
Implementation of Integrated Service Delivery Model
Number of Integrated Service Delivery programmes implemented
GGPP - 8
3 Integrated Service Delivery programmes implemented by 30 June 2019
3 Integrated Service Delivery programmes implemented
2 Integrated Service Delivery Model programmes implemented by 30 June 2020
Refer to the following indicators GGPP 8.1 to GGPP 8.2.3 for actual performance
Refer to the following indicators GGPP 8.1 to GGPP 8.2.3 for actual performance
Refer to the following indicators GGPP 8.1 to GGPP 8.2.3 for actual performance
Integrated Service Delivery programme reports,
Director: Strategic Management Services/Engineering and Technical Services
Number of
GGPP
4 Integrate
4 Integrated
4 Integrated
Target achieved
N/A N/A ISDM -
WarooDirector: Strategic

286
Measurable Objectives
5 YR Outcome
Strategy KPI Indicator Code
2018-2019 Financial Year 2019-2020 Financial year
SnapShot
Variances Remedial Evidence Custodian
Annual Target
Actual Performance
Annual Target Actual Performance
integrated approach to service delivery
Integrated Service Delivery Model-Warroom programmes implemented
- 8.1
d Service Delivery Model-Warroom programmes implemented by 30 June 2019
Service Delivery Model-Warroom programmes implemented
Service Delivery Model-Warroom programmes implemented by 30 June 2020
4 Integrated Service Delivery Model-Warroom programmes implemented through war room service delivery day held at ward 30 Enoch Mgijima; Ward 1 in Emalahleni Local Municipality; handing over of Nkobongo Bridge at Engcobo Local
ms reports, Attendance registers, Integrated Service Delivery plan
Management Services

287
Measurable Objectives
5 YR Outcome
Strategy KPI Indicator Code
2018-2019 Financial Year 2019-2020 Financial year
SnapShot
Variances Remedial Evidence Custodian
Annual Target
Actual Performance
Annual Target Actual Performance
Municipality ward 04, on the 07 February 2020
Number of Social facilitation programmes implemented per grant
GGPP - 8.2
2 ISD facilitation programmes implemented per grant by 30 June 2019
2 ISD facilitation programmes implemented per grant
2 ISD facilitation programmes implemented per grant by 30 June 2020
Refer to the following indicators GGPP 8.2.1 TO 8.2.2 for actual performance
Refer to the following indicators GGPP 8.2.1 TO 8.2.2 for actual performance
Refer to the following indicators GGPP 8.2.1 TO 8.2.2 for actual performance
ISD report
Director: Engineering and Technical Services
Number of MIG Social facilitation programmes implemented
GGPP - 8.2.1
1 MIG Social facilitation programmes implemented by 30 June 2019
1 MIG Social facilitation programmes implemented
1 MIG Social facilitation programmes implemented by 30 June 2020
Target Achieved 1 MIG Social facilitation programmes implemented
N/A N/A MIG facilitation progress report, Plan, Expenditure report
Director: Engineering and Technical Services

288
Measurable Objectives
5 YR Outcome
Strategy KPI Indicator Code
2018-2019 Financial Year 2019-2020 Financial year
SnapShot
Variances Remedial Evidence Custodian
Annual Target
Actual Performance
Annual Target Actual Performance
Number of WSIG and RBIG Social facilitation programmes implemented
GGPP - 8.2.2
2 WSIG and RBIG Social facilitation programmes implemented by 30 June 2019
2 WSIG and RBIG Social facilitation programmes implemented
1 WSIG and 1 RBIG Social facilitation programmes implemented by 30 June 2020
Target Achieved 1 WSIG and 1 RBIG Social facilitation programmes implemented
N/A N/A WSIG and RBIG facilitation progress report, Plan, Expenditure report
Director: Engineering and Technical Services
Improved service delivery Improved service delivery Improved Service Delivery Improved Service Delivery Improved
Implementation of Municipal Support Model
Number of Municipal Support programmes implemented
GGPP -9
01 Municipal support programmes implemented by 30 June 2019
01 Municipal support programmes implemented
01 Municipal support programmes implemented by 30 June 2020
Target achieved 01 Municipal support programmes implemented, The Municipality received a request from Enoch Mgijima Local Municipal
N/A N/A Support implementation reports. Attendance register, resolution register
Director: Strategic Management Services

289
Measurable Objectives
5 YR Outcome
Strategy KPI Indicator Code
2018-2019 Financial Year 2019-2020 Financial year
SnapShot
Variances Remedial Evidence Custodian
Annual Target
Actual Performance
Annual Target Actual Performance
Service Delivery Improved Service Delivery Improved Service Delivery Improved Service Delivery
ity and Intsika Yethu Local Municipality. The Municipality supported both requests, the Municipality also assisted and provided rapid support to all LMs which included Grocery vouchers, Water tanks, cleaning materials, fire victims

290
Measurable Objectives
5 YR Outcome
Strategy KPI Indicator Code
2018-2019 Financial Year 2019-2020 Financial year
SnapShot
Variances Remedial Evidence Custodian
Annual Target
Actual Performance
Annual Target Actual Performance
relief material
Implementation of IGR Strategy & IR Framework
Number of IGR &IR Programmes implemented
GGPP-10
02 IGR & IR Programme implemented by 30 June 2019
02 IGR & IR Programme implemented
01 IGR & 01 IR Programme implemented by 30 June 2020
Target achieved 01 IGR & 01 IR Programme implemented , 1 IGR Programme Implemented through : technical IGR which were convened and 1 IR programme Implemented through partnership
N/A NA IGR & IR reports. Attendance register, resolution register
Director: Strategic Management Services

291
Measurable Objectives
5 YR Outcome
Strategy KPI Indicator Code
2018-2019 Financial Year 2019-2020 Financial year
SnapShot
Variances Remedial Evidence Custodian
Annual Target
Actual Performance
Annual Target Actual Performance
between CHDM and an International Institution GIZ to implement a support plan:GIz The Municipality has also made relations and requested Lifen Municipality in Shanxi for relief material which is in process.

292
Measurable Objectives
5 YR Outcome
Strategy KPI Indicator Code
2018-2019 Financial Year 2019-2020 Financial year
SnapShot
Variances Remedial Evidence Custodian
Annual Target
Actual Performance
Annual Target Actual Performance
Development and implementation of Credible Plans aligned to NDP 2030
Development and review of Credible plans
Number of Service delivery plans developed , reviewed and implemented
GGPP-11
11 Service delivery plans developed, reviewed and implemented by 30 June 2019
5 Service delivery plans developed, reviewed and implemented
12 Service delivery plans developed, reviewed and implemented by 30 June 2020
Refer to the following indicators GGPP 11.1 TO 11.12 for actual performance
Refer to the following indicators GGPP 11.1 TO 11.12 for actual performance
Refer to the following indicators GGPP 11.1 TO 11.12 for actual performance
Service delivery plans implemented and reviewed
Director :IPED/Strategic Management Services/Engineering and Technical Services/Health and Community Services
Number CHDM 2019-2020 IDP reviewed and adopted
GGPP-11.1
1 CHDM 2019-2020 IDP reviewed and adopted by 30 June 2019
1 CHDM 2019-2020 IDP reviewed and adopted
1 CHDM 2020-2021 IDP reviewed and adopted by 30 June 2020
Target achieved Adopted 2020-2021 IDP Review
N/A N/A Council Resolution. Final IDP Review
Director :IPED
Number of Water Service Development Plan
GGPP-11.2
1 WSDP reviewed and approved by 30
1 WSDP reviewed and approved
1 WSDP reviewed and approved by 30 June 2020
Target not Achieved 0 WSDP reviewed
Due to the national lockdown from the 27th
Advert for the Consultants will be done in the
Report
Director: Engineering and Technical Services

293
Measurable Objectives
5 YR Outcome
Strategy KPI Indicator Code
2018-2019 Financial Year 2019-2020 Financial year
SnapShot
Variances Remedial Evidence Custodian
Annual Target
Actual Performance
Annual Target Actual Performance
reviewed and approved
June 2019
and approved
March 2020 with new Health regulations for COVID 19 compliance, advertisement was delayed.
first quarter of 20/21 financial year.
Number of Disaster Management Plans developed and implemented
GGPP-11.3
1 Disaster Management plan developed and implemented by 30 June 2019
0 Disaster Management plan developed and implemented
1 Disaster Management plan developed and implemented by 30 June 2020
Target achieved 1 Disaster Management plan developed and implemented
N/A N/A Disaster Management plan, Council Resolution
Director: Health and Community Services
Number of Disaster Management Policy framewo
GGPP-11.4
1 disaster Management policy framework
0 disaster Management policy framework reviewed
1 disaster Management policy framework reviewed by 30 June 2020
Target achieved 1 disaster Management policy framewor
N/A N/A Disaster Management policy framework, Council
Director: Health and Community Services

294
Measurable Objectives
5 YR Outcome
Strategy KPI Indicator Code
2018-2019 Financial Year 2019-2020 Financial year
SnapShot
Variances Remedial Evidence Custodian
Annual Target
Actual Performance
Annual Target Actual Performance
rk reviewed
reviewed by 30 June 2019
k reviewed
Resolution
Number of IGR strategy & hand book developed
GGPP-11.5
1 IGR strategy & 1IGR hand book developed by 30 June 2019
0 IGR strategy & 1IGR hand book developed
1 IGR strategy & 1IGR hand book developed by 30 June 2020
Target achieved 1 IGR strategy & 1IGR hand book developed and Implemented through -IGR Cluster
N/A N/A Attendance register, minutes, Draft IGR strategy & Draft hand book, Council resolution, Final IGR strategy & Final hand book, IGR manager
Director: Strategic Management Services
Number of CHDM Integrated Waste Manage
GGPP - 11.6
1 CHDM Integrated Waste Management
0 CHDM Integrated Waste Managem
1 CHDM Integrated Waste Management Plan
Target achieved 1 CHDM Integrated Waste
N/A N/A Final CHDM Integrated Waste
Director: Health and Commun

295
Measurable Objectives
5 YR Outcome
Strategy KPI Indicator Code
2018-2019 Financial Year 2019-2020 Financial year
SnapShot
Variances Remedial Evidence Custodian
Annual Target
Actual Performance
Annual Target Actual Performance
ment Plan developed
Plan developed by 30 June 2019
ent Plan developed
developed by 30 June 2020
Management Plan developed
Management Plan and Council resolution
ity Services
Number of Integrated Stakeholder Management Plan developed
GGPP - 11.7
01 Integrated Stakeholder Management Plan developed and approved by 30 June 2019
0 Integrated Stakeholder Management Plan developed and approved
01 Integrated Stakeholder Management Plan developed and approved by 30 June 2020
Target not Achieved, 0 Integrated Stakeholder Management Plan was developed
Consultation process could not be completed due to outstanding consultations as some stakeholders did not meet set deadlines
Consultation with stakeholders planned for first quarter of 2020/2021 financial year
Draft Integrated Stakeholder Management Plan
Director: Strategic Management Services
Number of Protocol
GGPP -
1 Protocol and
0 Protocol and Etiquette
1 Protocol and Etiquette
Target not Achieved
Outcomes of consultati
To be finalised in the
Draft Protocol and
Director: Strategic Manage

296
Measurable Objectives
5 YR Outcome
Strategy KPI Indicator Code
2018-2019 Financial Year 2019-2020 Financial year
SnapShot
Variances Remedial Evidence Custodian
Annual Target
Actual Performance
Annual Target Actual Performance
and Etiquette policy and Implementation Plan developed
11.8
Etiquette policy and Implementation Plan developed by 30 June 2019
policy and Implementation Plan developed
policy and Implementation Plan developed by 30 June 2020
Draft Protocol and Etiquette Policy and Implementation Plan in place
ons process dictated that the policy be referred to LLF prior submission to policy workshop.
first quarter of 2020/2021 financial year
Etiquette policy and Implementation Plan
ment Services
Number of PMS Framework reviewed and approved
GGPP - 11.9
1 PMS Framework reviewed and approved by 30 June 2019
1 PMS Framework reviewed and approved
1 PMS Framework reviewed and approved by 30 June 2020
Target achieved 1 PMS Framework reviewed and approved
N/A N/A Council Resolutions, Final PMS Framework
Director: Strategic Management Services
Number of Water Security Plans reviewed and approved
GGPP - 11.10
1 Water Security Plans reviewed and approved by 30 June 2019
1 Water Security Plans reviewed and approved
1 Water Security Plans reviewed and approved by 30 June 2020
Target not Achieved 0 Water Security Plans reviewed and approved
Due to the national lockdown from the 27th March 2020 with new Health
Advert for the Consultants will be done in the first quarter of 20/21
Report Director: Engineering and Technical Services

297
Measurable Objectives
5 YR Outcome
Strategy KPI Indicator Code
2018-2019 Financial Year 2019-2020 Financial year
SnapShot
Variances Remedial Evidence Custodian
Annual Target
Actual Performance
Annual Target Actual Performance
regulations for COVID 19 compliance, advertisement was delayed.
financial year.
Number of Water Conservation Demand Management strategy reviewed
GGPP - 11.11
1 Water Conservation Demand Management strategy reviewed by 30 June 2019
1 Water Conservation Demand Management strategy reviewed
1 Water Conservation Demand Management strategy reviewed by 30 June 2020
Target not Achieved 0 Water Conservation Demand Management strategy reviewed
Due to the national lockdown from the 27th March 2020 with new Health regulations for COVID 19 compliance, advertisement was delayed.
Advert for the Consultants will be done in the first quarter of 20/21 financial year.
Report Director: Engineering and Technical Services
Number of Fire Management
GGPP -
N/A N/A 1 Fire Management Services
Target not achieved
The Department is infusing
Policy will be presented to
Report Director: Health and Commun

298
Measurable Objectives
5 YR Outcome
Strategy KPI Indicator Code
2018-2019 Financial Year 2019-2020 Financial year
SnapShot
Variances Remedial Evidence Custodian
Annual Target
Actual Performance
Annual Target Actual Performance
Services Policy developed and adopted by Council
11.12
Policy developed and adopted by Council by 30 June 2020
The Fire Management Services Policy was developed
all comments made during consultation sessions into the draft. Upon completion, the document will be submitted to the standing committee of October 2020 and later proceed to Council for adoption.
council in the next financial year.
ity Services

299
Snapshot - Legends
= Target achieved
= Target Not achieved

300
CHAPTER 4 – ORGANISATIONAL DEVELOPMENT PERFORMANCE
4.1 PERFORMANCE REPORT PART II
Introduction
Chapter 7 Section 51 of the Municipal Systems Act (MSA) 32 of 2000, mandates the district
to establish and organise its administration in a manner that would enable the municipality to
be responsive to the needs of the local community. Furthermore, Section 67(1) of the MSA
compels the municipality to develop and adopt appropriate systems and procedures to
ensure fair, efficient, effective and transparent personnel administration.
The strategic objective of the directorate is to establish and maintain a skilled, healthy labour
force guided by relevant policies, systems, procedures that are geared towards realising the
needs of the communities. Municipal transformation and organisational development is key
to service delivery, hence much emphasis is on implementation of Batho Pele principles in
all municipal structures, systems, procedures, policies and strategies.
COMPONENT A:
4.2 MUNICIPAL PERSONNEL
Table:75 Employee Totals, Turnover and Vacancies
Employees
Description
2017/2018 2018/2019 2019/2020
Employee
s No.
Approve
d Posts
No.
Employee
s No.
Vacancie
s No.
Vacancie
s %
Approve
d Post Employee
s No.
Vacancie
s No.
Vacancie
s %
Water 163 262 164 98 37% 443 393 50 11%
Waste Water
(Sanitation)
80 144 81 63 63% 73 53 20 27%
Electricity N/A N/A N/A N/A N/A N/A N/A N/A
Waste
Management
N/A N/A N/A N/A N/A N/A N/A N/A
Housing 2 2 2 0 0% 2 2 0 0%
Waste Water
(Storm water
Drainage)
0 0 0 0 0% 0 0 0%
Roads 26 52 17 35 67% 11 11 N/A 0%
Transport 3 3 2 1 33% 3 3 0 0%

301
Planning
(Integrated
Development)
3 3 3 0 0% 3 3 0 0%
Local
Economic
Development
9 9 8 1 11% 9 9 0 0%
Planning
(Strategic &
Regulatory)
3 5 3 2 40% 6 3 3 50%
Community &
Social
Services
5 5 5 0 0% 5 5 0 0%
Environmenta
l Protection
(Municipal
Health &
Environmenta
l
Management)
38 41 39 2 4.9% 42 42 0 0%
Health
(Emergencies
)
20 21 21 0 0% 20 18 2 0
Security &
Safety
6 2 2 0 0% 2 2 0 0
Sport and
Recreation
N/A N/A N/A N/A N/A N/A N/A N/A N/A
Corporate
Policy Offices
and Other
208 335 299 36 10% 307 295 12 4%
Totals 781 1099 861 238 78..34% 926 839 87 9%
T 4.1.1

302
Table 76: Vacancies Rate
Vacancies Rate 2019/2020
Designations
*Total Approved
Posts
*Vacancies (Total
time that
vacancies exist
using fulltime
equivalents) No.
*Vacancies (As a
proportion of total post
in each category) %
Municipal Manager 1 0 0%
CFO 1 0 0%
Other S57 Posts (excluding Finance Post) 5 0 0%
Other S57 Posts (Finance Posts) 0 0 0
Police Officers N/A N/A N/A
Fire Fighters 8 1 12.5%
Senior Management Levels 14 - 17 (excluding
Finance Posts)
50 4 8%
Senior Management Levels 14 - 17 (Finance
Posts)
10 0 0%
Highly Skilled Supervision Levels 9 – 13
(excluding Finance Posts)
245 25 10%
Highly Skilled Supervision Levels 9 -13 (Finance
Posts)
51 4 8%
Totals 371 34 9%
Table 77: Turn Over Rate Tur Turn Over Rate n Over Rate
Turn Over Rate
Details Total Appointments Terminations Turn-over Rate*
2016/2017 65 47 72%
2017/2018 74 49 66%
2018/2019 49 32 65%
2019/2020 22 45 205%
The Chris Hani District Municipality has been successful in filling twenty two (22) vacant prioritised
positions with forty five (45) terminations during the 2019/2020 financial year.

303
COMPONENT B:
4.3 MANAGING THE MUNICIPAL WORKFORCE
4.3.1 Introduction To Municipal Workforce Management
Workforce management is part of the broader organisational management strategy which seeks
to amongst others ensure that there is a defined process of accountability as well as adequate
procedures to deal with administrative matters. To this end, the Municipal Council has approved
a number of policies and procedures aimed at improving management and administration affairs
within the municipality. Tabulated below are the policies that are in place:
4.3.1 Policies / Plans
Table: 78 Policy/ Plan Register
Name of HR Policy / Plan Develop Reviewed Adoption date Comment on non-review
and non-adoption
Attraction and Retention YES NO 25 June 2015 Scheduled for reviewal in
2020/2021
Code of Conduct for employees YES Not
Applicable
Still applicable and
operational until 2023
SALGBC Main Collective
Agreement on Conditions
of Services
3. Delegations, Authorisation &
Responsibility (Supply Chain
Management Policy)
YES Yes 29 June 2020 N/A
4. Disciplinary Code and
Procedures
In place Not
Applicable
Still applicable and
operational until 2023
SALGBC Main Collective
Agreement on Conditions
of Services
5. Essential Services N/A N/A N/A N/A
6. Employee Assistance /
Wellness
In the
process of
review
25 June 2014 Scheduled for reviewal in
2020/2021
7. Employment Equity YES May 2019 Scheduled for reviewal in
2020/2021
8. Exit Management INCORPORATED IN TO THE TERMINATION POLICY
9. Grievance Procedures YES Not
Applicable
Still applicable and
operational until 2023
SALGBC Main Collective
Agreement on Conditions
of Services
10. HIV/Aids Workplace N/A N/A N/A SALGBC Collective
Agreement in place

304
Name of HR Policy / Plan Develop Reviewed Adoption date Comment on non-review
and non-adoption
11. Human Resource and
Development
YES NO 25 June 2015 Scheduled for reviewal in
2020/2021
12. Information Technology YES YES 30 June 2020
ICT Governance
Framework to be adopted
by council by 30 June
2020
13. Job Evaluation Yes No 25 June 2013
14. Leave and Attendance Yes No 25 June 2014 Yes Scheduled for
reviewal in 2020/2021
15. Occupational Health and
Safety
Yes Due for
review
2013 26 Feb 2014
16. Official Housing N/A N/A N/A N/A
17. Subsistence and Travelling Yes Yes 26 Feb 2014 Scheduled for reviewal in
2020/2021
18. Bereavement Yes No 25 June 2014 Scheduled for reviewal in
2020/2021
19. Overtime Yes No 25 June 2015 Scheduled for reviewal in
2020/2021
20. Organisational Rights N/A N/A N/A SALGBC Main Collective
Agreement on conditions
of services
21. Payroll Deductions Governed by the legislative requirements
22. Performance Management
System Framework
Yes 100% 26 June 2019 N/A
23. Recruitment and Selection Yes No 25 June 2015 Scheduled for reviewal in
2020/2021
24. Remuneration Scales and
Allowances
In place N/A Not Applicable South African Local
Government Bargaining
Council
25. Relocation Yes No 25 June 2014 Scheduled for reviewal in
2020/2021
26. Sexual Harassment Yes No 27 May 2009 Scheduled for reviewal in
2020/2021
27. Skills Development and
Training
Yes No 25 June 2015 Scheduled for reviewal in
2020/2021
28. Smoking Yes No 27 May 2009 Scheduled for reviewal in
2020/2021
29. Special Skills N/A N/A N/A N/A
30. Work Organisation N/A N/A N/A N/A
31. Uniforms and Protective
Clothing
Yes N/A Adopted by Council on
the 29 June 2020
To be adopted by Council
by 2020

305
Name of HR Policy / Plan Develop Reviewed Adoption date Comment on non-review
and non-adoption
32. Employee Study Assistance Yes No 25 June 2015 Scheduled for reviewal in
2020/2021
33. Transport allowance Policy Yes No 25 June 2015 Scheduled for reviewal in
2020/2021
34. Placement Yes No 25 March 2018 Scheduled for reviewal in
2020/2021
35. Telephone Yes No 27 May 2009 Scheduled for reviewal in
2020/2021
36. Termination Yes No 25 June 2015 Scheduled for reviewal in
2020/2021
37. Induction Yes No 27 May 2009 Scheduled for reviewal in
2020/2021
38. Experiential Training Yes No 25 June 2013 Scheduled for reviewal in
2020/2021
Table 79: Injuries, Sickness and Suspensions
Number and Cost of Injuries on Duty
Type of injury Injury
Leave
Taken
Employees using
injury leave
Proportion employees
using sick leave
Average Injury Leave
per employee
Total Estimated Cost
Days No. % Days R'000
Required basic medical
attention only
None none none none 0
Temporary total
disablement
none none none none 0
Permanent disablement None none none none 0
Fatal
Total 0 0 0 0 0

306
Table 80: Number of days and Cost of Sick Leave
Number of days and Cost of Sick Leave (excluding injuries on duty)
Salary band
Total
sick
leave
Proportion of
sick leave
without
medical
certification
Employees
using sick
leave
Total
employees
in post*
*Average
sick leave
per
Employees
Estimated
cost
Days % No. No. Days R' 000
Lower skilled (Levels 1-3) 770 3% 78 157 10.12 34 710.00
Skilled (Levels 4-6) 2744 7% 147 362 5.35 77 196.00
Highly skilled production
(levels 7-8) 407
31% 33 33 8.10
27 848.00
Highly skilled supervision
(levels 9-13)
2804 37% 148 220 5.27 196
008.00
Senior management
(Levels 14-17) 480
10% 45 60 9.37
98 067.00
MM and S57 13 0% 3 7 23.07 10 714.00

307
Table 81: Number and Period of suspensions
Number and Period of suspensions
Position Nature of
alleged
misconduct
Date of
Suspension
Date of Internal
Process
Finalisation
Details of disciplinary action taken
or status of case and reasons why
not finalised
Date finalised
2x Senior
Order Clerks
Negligence 03 June 2020 n/a Disciplinary hearing ongoing Pending
1x
Acquisition
Officer
Gross
Negligence
14 May 2020 n/a Disciplinary hearing ongoing Pending
1x Senior
Accountant
Gross
negligence
13 May 2020 n/a Disciplinary hearing ongoing Pending
2x Managers Gross
Negligence /
Gross
dishonesty
13 May 2020 n/a Disciplinary hearing ongoing Pending
Table 82: Disciplinary Action Taken on Cases of Financial Misconduct
Disciplinary Action Taken on Cases of Financial Misconduct
Position Nature of alleged misconduct and rand
value of any loss to the municipality
Disciplinary action taken Date finalised
N/A
4.4. PERFORMANCE REWARDS
The municipality has, as a response to the call by municipal council, set in place a process of
cascading performance management to levels belows Section 57 management. During the year
under review, intensive engagements with all effected stakeholders were undertaken to review the
PMS framework to deal with performance management. The Performance Management System
(PMS) wan then adopted by Council on the 26th June 2019. There were no performance
bonuses/rewards that were awarded for the year under review for lower level employees and also
Section 57 managers.

308
COMPONENT C:
4.5 CAPACITATING THE MUNICIPAL WORKFORCE
Introduction
Work Place Skills Development Plan was adopted by Council for the current financial year and
has been implemented.
The Municipality also implemented a number of skills development-related programmes, which
include:
Implementation of the Workplace Skills Plan 2018/19
Internships Programme
Study Assistance Programme
National Treasury Minimum Competency Requirement
Fifty Four [54] unemployed graduates were engaged on a two year internship programme starting
in September 2017, December 2017 and March 2018. The contracts for internship will end on 30
September 2019, 31 December 2019 and 30 April 2020 respectively. As at end June 2019 only
forty four [44] interns remaining, others were employed internally and externally.
Twenty two [22] students received experiential training for the duration of 18 months as part of
their curriculum.
The municipality has implemented its approved Workplace Skills Plan for 2018/2019 Financial
Year. Two hundred and sixty three [263] employees have received training within this financial
year at a cost of R 1 494 744.00 A total of fifteen [15] training interventions were implemented.
As part of building capacity of the workforce, the District Municipality provides for a Study
Assistance Programme to enable employees who wish to further their studies to do so. The Study
Assistance Programme benefits both the employee and the organization in that the skills of
beneficiaries are enhanced thereby improving the level of performance and productivity. Within
this current financial year fifteen [15] employees have received assistance to further their studies
in the following fields:
Finance
Engineering
Disaster Management
Forestry

309
Administration
Labour Relations
4.5.1 Skills Development and Training
Table 83: Skills Matrix
Skills Matrix
Ma
nag
em
en
t le
ve
l
Ge
nd
er
Employees
in post as at
30 June
Year 0
Number of skilled employees required and actual as at 30 June Year 0
Learnership
Skills
programmes
& other short
courses
Other forms of
training Total
No.
Actu
al:
En
d
of
Ye
ar
-1
Actu
al:
En
d
of
Ye
ar
0
Ye
ar
0
Ta
rge
t
Actu
al:
En
d
of
Ye
ar
-1
Actu
al:
En
d
of
Ye
ar
0
Ye
ar
0
Ta
rge
t A
ctu
al:
En
d
of
Ye
ar
-1
Actu
al:
En
d
of
Ye
ar
0
Ye
ar
0
Ta
rge
t A
ctu
al:
En
d
of
Ye
ar
-1
Actu
al:
En
d
of
Ye
ar
0
Ye
ar
0
Ta
rge
t MM and s57 Female 3 0 0 0 0 1 0 0 0 0 0 1 0
Male 3 0 0 0 0 0 0 0 0 0 0 0 0
Councillors,
senior officials
and managers
Female 29 0 0 0 0 21 15 0 0 0 0 21 15
Male 35 0 0 0 0 16 10 0 0 0 0 16 10
Technicians and
associate
professionals*
Female 32 0 0 0 0 2 0 0 0 0 0 2 0
Male 80 0 0 0 0 7 0 0 0 0 0 7 0
Professionals Female 52 0 0 0 0 31 25 0 0 0 0 31 25
Male 49 0 0 0 0 11 10 0 0 0 0 11 10
Sub total Female 116 0 0 0 0 55 40 0 0 0 0 55 40

310
Male 167 0 0 0 0 34 20 0 0 0 0 34 20
Total 283 0 0 0 0 89 60 0 0 0 0 89 60
Table 84: Financial Competency Development:
Financial Competency Development: Progress Report*
Description A.
Total
number of
officials
employed
by
municipality
(Regulation
14(4)(a) and
(c))
B.
Total
number of
officials
employed
by
municipal
entities
(Regulation
14(4)(a)
and (c)
Consolidated:
Total of A and
B
Consolidated:
Competency
assessments
completed for
A and B
(Regulation
14(4)(b) and
(d))
Consolidated:
Total number
of officials
whose
performance
agreements
comply with
Regulation 16
(Regulation
14(4)(f))
Consolidated:
Total number of
officials that meet
prescribed
competency
levels (Regulation
14(4)(e))
Financial
Officials
Accounting
officer
0 0 0 0 0 0
Chief
financial
officer
1 0 1 1 1 1
Senior
managers
43 0 43 35 5 40
Any other
financial
officials
16 0 16 1 0 1
Supply Chain
Management
Officials
Heads of
supply chain
management
units
3 0 3 2 0 2
Supply chain
management
senior
managers
0 0 0 0 0 0

311
TOTAL 70 0 70 38 6 43
Table 85: Skills Development Expenditure
Skills Development Expenditure
R'000
Managemen
t level
Gende
r
Employee
s as at the
beginning
of the
financial
year
Original Budget and Actual Expenditure on skills development Year 1
Learnerships Skills programmes &
other short courses
Other forms of
training Total
No.
Origin
al
Budget
Actua
l
Original
Budget Actual
Origin
al
Budget
Actua
l
Original
Budget Actual
MM and S57 Femal
e
3 1750000.0
0
2075958.0
0
1750000.0
0
2075958.00
Male 3
Legislators,
senior
officials and
managers
Femal
e
29
Male 35
Professional
s
Femal
e
72
Male 46
Technicians
and
associate
professional
s
Femal
e
19
Male 104
Clerks Femal
e
68
Male 41
Service and
sales
workers
Femal
e
4
Male 4
Plant and
machine
operators
and
assemblers
Femal
e
27
Male 54
Elementary
occupations
Femal
e
43

312
Male 291
Sub total Femal
e
261
Male 578
Total 839 0 0 1750000.0
0
2075958.0
0
0 0 1750000.0
0
2075958.00
1.0%* *R
11651454.55
4.6 EMPLOYEE WELLNESS
4.6.1 Employee Health & Wellness
Integrated health and wellness programmes are aimed at enhancing and maintaining a healthy and
productive workforce for the realisation of IDP objectives guided by relevant legislative framework
and research. The programme entails provision on psycho-spiritual counselling and life coaching
programmes, health management programmes, and organizational wellness and mainstreaming
programmes for employees, councillors and their families. The principle of confidentiality and
promoting human dignity is upheld in implementation of the health and wellness programmes.
Psycho-Spiritual Counselling Services
The services were provided for eighty five employees, councillors, traditional leaders and their
families. The trends and analysis reflects that most challenges emanate from family, work, health
and spiritual areas of the participants. Three (3) life coaching programmes were implemented which
were healthy marriages, parenting & relationships, importance of spirituality, trauma and grief and
100 people participated in the programmes. The intervention have yielded positive outcomes in
building the resilience skills to deal with challenges and improving the well-being of the participants.

313
HEALTH MANAGEMENT AND HEALTHY LIFESTYLE PROGRAMMES
Through partnerships with internal and external stakeholders , integrated Health management and
healthy lifestyle programmes were implemented and have benefitted (500) five hundred participants,
namely; educational session on prevention and management of diabetes, hypertension, Asthma,
cancer, use of herbs, nutrition /exercise in managing illnesses, mental illness management, and
prevention and management of STI’S (Sexually transmitted infections). The programmes have
played a positive role in improvement and management of illnesses and diseases and influenced an
institutional culture of healthy lifestyle.
Organizational Wellness And Mainstreaming Programmes
Organizational Wellness and Mainstreaming programme are institutional programmes aimed at
influencing the organizational culture and atmosphere. Change management programmes are
aimed at equipping the participants with skills on managing personal, organizational and societal
changes in a positive a healthy manner, were implemented for 60 participants. Healthy retirement
programmes and legal wellness were implemented for 150 participants which included education on
implication of SARS on retirement and divorce and drafting of wills to empower participants with
skills.

314
4.7 LABOUR RELATIONS
Labour Relations Unit is mandated to promote sound employer-employee relations in the district
municipality in order to fulfil the primary objectives of the Labour Relations Act, Basic Conditions of
Employment Act, Employment Equity Act and SALGBC Collective Agreements. This is achieved
through implementation of the following Labour Relations programs.
Local Labour Forum
The Local Labour Forum [LLF] is a forum established in terms of SALGBC Main Collective
Agreement to promote employee participation in decision making on matters of mutual concern
between employer and employee pertaining to workplace. It comprises of Councillors, Managers
and Organised labour from both recognised trade unions. The meetings are held quarterly according
to the Council calendar. There were eleven meetings held, three [3] Ordinary LLF meetings and eight
[8] Special LLF meetings. Critical issues engaged were organisational structure, national lockdown,
job evaluation, placement, policies and strategies.
Capacity Building Programs
The following capacity building programmes and educational awareness were implemented to
broaden knowledge and skills of managers and supervisors in order to promote professionalization
and consequence management in the institution as well as to create a conducive working
environment to enhance service delivery.
Workplace discipline
Awareness on Standard of Conduct & Grievance Procedure
Managing absenteeism & Discipline in the workplace.
Consequence Management
Disciplinary Enquiries
There were 30 disciplinary enquiries received from various directorates and facilitated by the
department, some were conducted departmentally with the assistance of Labour Relations. Out of
30 cases, twenty two were finalised with sanction ranging from written warning, final written warning,
suspension without pay and dismissals.
2.3.2 Suspensions

315
There were six [6] suspension effected during the period under review.
Grievances
The department received nine [9] grievances which were resolved, only one grievance was referred
to SALGBC and subsequently withdrawn by the employee.
Appeals
Only one [1] appeal was lodged as a result of disciplinary hearing outcome, which was upheld.
Disputes
There were six [6] disputes handled by the department, one [1] dispute was withdrawn by the
applicant, one [1] settlement agreement reached between Applicant and the Respondent, one [1]
mutual interest dispute unresolved and a certificate of non-resolution was issued.
Two [2] disputes pending due to national lockdown, one [1] dispute was in favour of the applicant
and arbitration award taken under review at Labour Court.
COMPONENT D:
4.8 MANAGING THE WORKFORCE EXPENDITURE
Introduction
The Chris Hani District Municipality has made considerable efforts to ensure that the expenditure on
workforce does not exceed the acceptable norm as determined by the National Treasury. As such,
the expenditure on employees as a percentage of the total budget for the year remains below the
35% threshold. This suggests that the municipality has the ability to maintain the staff complement
it needs whilst not compromising on the expenditure on service delivery.

316
4.8.1 Employee Expenditure
Table 86: Workforce Expenditure
Graph 14: employee expenditure
Upgraded Posts And Those That Are At Variance With The Normal Practice
A process of grading all positions within the municipality was undertaken and consequently, all
positions within the institution are graded.
19,000
20,000
21,000
22,000
23,000
24,000
25,000
26,000
Year -3 Year -2 Year -1 Year 0
Workforce Expenditure Trends (R' 000)

317
CHAPTER 5 FINANCIAL PERFORMANCE
Introduction
This Chapter contains information regarding financial performance and highlights specific
accomplishments. It comprises three components viz:
Component A: Statement of Financial Performance
Component B: Spending against Capital budget and
Component C: Other Financial Matters
COMPONENT A: STATEMENTS OF FINANCIAL PERFORMANCE
Introduction To Financial Statements
This component provides an overview of the financial performance of the municipality and focuses
on the financial health of the municipality.

318
5.1 STATEMENT OF FINANCIAL PERFORMANCE
5.1.1 RECONCILIATION OF TABLE A1 BUDGET SUMMARY
Description 2020 Year -1
R thousands
Original
Budget
Budget Adjustments (i.t.o. s28 and s31 of the MFMA)
Final adjustment
s budget
Shifting of
funds (i.t.o. s31 of
the MFMA)
Virement
(i.t.o. Council approved policy)
Final Budge
t
Actual Outcom
e
Unauthorised
expenditure
Variance
Actual Outcome as % of Final Budget
Actual Outcome as %
of Original Budget
Reported unauthorise
d expenditure
Expenditure
authorised in terms of section 32 of MFMA
Balance to be
recovered
Restated
Audited Outcom
e
1 2 3 4 5 6 7 8 9 10 11 12 13 14 15
Financial Performance
Property rates – – – –
– 0
Service charges 244 461 303 532 303 532
300 505
(300 505)
Investment revenue 34 812 36 036 36 036
78 496
(78 496)
Transfers recognised - operational
633 215 725 120 760 205
1 042 666
(1 042 666)
Other income 1 154 77 985 77 985
2 021
(2 021)
Total Revenue (excluding capital transfers and contributions)
913 642
1 142 673 1 177 759 1 423 688
– (1 423 688)
Employee costs 337 874 344 682 318 607
(350 920)
(350 920)
Remuneration of councillors
13 902 12 427 10 108
(12 226)
12 226

319
Debt impairment 200 000 129 735 129 735
(278 891)
(278 891)
Depreciation & amortisation 140 000 155 000 155 000
(157 838)
(157 838)
Impairment loss/ Reversal of impairments
– – –
(74)
Finance charges – 40 40
(88)
88
Materials and bulk purchases
49 320 43 487 44 870
(16 047)
16 047
Transfers and grants – 31 638 31 638
(123 139)
123 139
Contracted Services 405 549 283 847 349 690
(168 380)
168 380
Other expenditure 202 287 125 492 134 585
(151 753)
(151 753)
Bad debts written off –
–
Total Expenditure 1 351 408 1 126 348 1 174 272
(1 259 355)
1 259 355
Surplus/(Deficit) (403 187) 55 310 42 471
164 333
(164 333)
Transfers recognised - capital
424 611 412 526 380 956
–
Contributions recognised - capital & contributed assets
–
Actuarial gain/loss 8 987
(8 987)
Loss on disposal of asset and liabilities
(313)
313
Surplus/(Deficit) after capital transfers & contributions
21 424
467 836 423 427 173 007
(173 007)
–
Share of surplus/ (deficit) of associate
–
Surplus/(Deficit) for the year 21 424 467 836 423 427
173 007 –
(173 007)
–
Capital expenditure & funds sources

320
Capital expenditure
Transfers recognised - capital 420
411 412 526 382 207
–
Public contributions & donations
–
Borrowing
–
Internally generated funds 34 818 32 428
–
Total sources of capital funds
420 411 447 343 414 635
–
Cash flows
Net cash from (used) operating
117 027 311 633 561 298
326 635
Net cash from (used) investing (352) (458 100)
(601 201)
Net cash from (used) financing
441 (441)
(61 780)
cash and cash @ beginning 322 606 566 550 944 469
377 919
Cash/cash equivalents at the year end
439 721 877 742 1 047 667
42 247
–
T 5.1.1

321
5.1.2 FINANCIAL PERFORMANCE OF OPERATIONAL SERVICES
Financial Performance of Operational Services
R '000
Description
2019 2020 Year 0 Variance
Actual Original Budget
Adjustments Budget
Actual Original Budget
Adjustments Budget
Operating Cost
Water 683,865,138
329,398
300,738
289,933,305
-13.61% -3.73%
Waste Water (Sanitation) 21,907,224
12,512
6,176
4,170,034
-200.05% -48.09%
Electricity - – 0 0
Waste Management - – 0 0
Housing - – 0 0
Component A: sub-total 705,772,362
341,910
306,913
294,103,339
-16.25% -4.36%
Waste Water (Stormwater Drainage) – 0 0
Roads 20,679,101
28,000
28,000
21,918,778
-27.74% -27.74%
Transport – 0 0
Component B: sub-total 20,679,101
21,918,778
100.00% 100.00%
Planning 11,845,198
3,589
8,632
6,862,970
47.70% -25.77%
Local Economic Development 3,546,401
51,327
18,251
3,535,018
-1351.97% -416.30%
Component B: sub-total 15,391,599
54,916,337
26,883,139
10,397,988
-428.14% -158.54%
Planning (Strategic & Regulatary) 0 0
Local Economic Development 0 0
Component C: sub-total 0 0
Community & Social Services
Enviromental Proctection

322
Health 52,133,928
46,293
28,639
44,525,822
-3.97% 35.68%
Security and Safety 0 0
Sport and Recreation 0 0
Corporate Policy Offices and Other 0 0
Component D: sub-total 52,133,928
46,293
28,639
44,525,822
-3.97% 35.68%
Total Expenditure 793,976,990
443,119
362,435
370,945,927
-19.46% 2.29%
In this table operational income is offset agaist operational expenditure leaving a net operational expenditure total for each service as shown in the individual net service expenditure tables in chapter 3. Variances are calculated by dividing the difference between actual and original/adjustments budget by the actual.
T 5.1.2

323
5.1.3 GRANT PERFORMANCEGRANT PERFORMANCE 5.2 GRANT PERFORMANCE
Grant Performance R' 000
Description
2018/2019 2019/2020 Year 0 Variance
Actual Budget Adjustments Budget
Actual Original Budget
(%)
Adjustments Budget
(%)
Operating Transfers and Grants
National Government: 570 866,554 633 214,738 755 302,501
677 019,654
Equitable share 524 527,000 543 689 543 689
543 689,000
Municipal Systems Improvement – –
Department of Water Affairs – –
Levy replacement – –
FMG, EPWP, MIG, Rural Road Asset & Municipal DIS Covid 19 46 339,554
89 526 211 614
133 330,654
Provincial Government: 338 955,130 424 611,262 380 956,330
360 954,796
Health subsidy – –
Housing – –
Ambulance subsidy – 1 250 –
Sports and Recreation – –
Roads subsidy 20 679,101 16 701,091
cogta MIG 151 942,246 234 821 142 616
164 724 721
Water service Infra grant 75 940,025 84 461 131 761
93 714,723

324
RBIG 90 393,758 105 329 105 329
85 814,261
District Municipality:
Other grant providers: 6 869 – 4 903
4 795 564
LG SETA 669,190 776 669 190
Rural Sustainable Grant 6 200 000 4 126 4 126 374
Total Operating Transfers and Grants 916 690 874 1 057 826
1 141 161 1 042 770,014
Variances are calculated by dividing the difference between actual and original/adjustments budget by the actual. Full list of provincial and national grants available from published gazettes. T 5.2.1

325
5.3 ASSET MANAGEMENT
INTRODUCTION TO ASSET MANAGEMENT
The Asset Management Unit is responsible for the development and implementation of the Asset
Management Policy of the Chris Hani District Municipality. It also manages the development,
updating and maintenance of the asset register for the entire CHDM. Financial reporting of assets
in terms of the applicable accounting standards resides within this division. It also facilitates the
development and implementation of the Asset Management and Maintenance Plans for the
different categories of assets.
The asset management functions of the Accounting Officer in terms of Chapter 8 of the MFMA as
well as those of the Chief Financial Officer in terms of Chapter 9 of the MFMA are implemented
by this division. This division also monitors the insurance profile of the municipality and loss of
assets.
5.3.1 REPAIR AND MAINTENANCE EXPENDITURE:
Repair and Maintenance Expenditure: 2019
R' 000
Original Budget
Adjustment Budget
Actual Budget
variance
Repairs and Maintenance Expenditure 163 462
215 609
91 621 592,00 44%
T 5.3.4

326
5.4 FINANCIAL RATIOS BASED ON KEY PERFORMANCE INDICATORS
5.4.1 liquidity ratio
1,2
0,8
1,1
0,7
–
0,2
0,4
0,6
0,8
1,0
1,2
1,4
Year -3 Year -2 Year -1 Current: Year 0
Liquidity Ratio
Liquidity Ratio – Measures the municipality’s ability to pay its bills and is calculated by dividing the monetary assets (due within one year ) by the municipality’s current liabilities. A higher ratio is better.
Data used from MBRR SA8

327
5.4.2 Cost Coverage
5.4.3 Total Outsatnding Services
1,5
1,9
1,4
0,8
–
0,2
0,4
0,6
0,8
1,0
1,2
1,4
1,6
1,8
2,0
Year -3 Year -2 Year -1 Current: Year 0
Cost Coverage
iii. Cost coverage
Cost Coverage– It explains how many months expenditure can be covered by the cash and other liquid assets available to the Municipality excluding utilisation of grants and is calculated
Data used from MBRR SA8

328
5.4.4 Debt Coverage
5.4.5 Creditors System Efficiency
2,1
1,3 1,5
1,2
–
0,5
1,0
1,5
2,0
2,5
Year -3 Year -2 Year -1 Current: Year 0
Debt Coverage
i. Debt coverage
Debt Coverage– The number of times debt payments can be accomodated within Operating revenue (excluding grants) . This in turn represents the ease with which debt payments can be accomodated by the municipality
Data used from MBRR SA8
83,0%87,0%
93,0%
64,0%
0,0%
10,0%
20,0%
30,0%
40,0%
50,0%
60,0%
70,0%
80,0%
90,0%
100,0%
Year -3 Year -2 Year -1 Current: Year 0
Creditors System Efficiency
Creditors System Efficiency
Creditor System Efficiency – The proportion of creditors paid within terms (i.e. 30 days). This ratio is calculated by outstanding trade creditors divided by credit purchases
Data used from MBRR SA8

329
5.4.6 Capital charges to operationg Expenditure
5.4.7 Employee costs
85,0%
73,0%70,0%
64,0%
0,0%
10,0%
20,0%
30,0%
40,0%
50,0%
60,0%
70,0%
80,0%
90,0%
Year -3 Year -2 Year -1 Current: Year 0
Capital Charges to Operating Expenditure
Capital Charges to OperatingExpenditure
Capital Charges to Operating Expenditure ratio is calculated by dividing the sum of capital interest and principle paid by the total operating expenditure.
Data used from MBRR SA8
73,0%
84,0%
53,0%
70,0%
0,0%
10,0%
20,0%
30,0%
40,0%
50,0%
60,0%
70,0%
80,0%
90,0%
Year -3 Year -2 Year -1 Current: Year 0
Employee Costs
Employee costs
Employee cost – Measures what portion of the revenue was spent on paying employee costs. It is calculated by dividing the total employee cost by the difference between total revenue and capital revenue.
Data used from MBRR SA8

330
5.4.8 Repairs & maintenance
89,0%
66,0%
94,0%89,0%
0,0%
10,0%
20,0%
30,0%
40,0%
50,0%
60,0%
70,0%
80,0%
90,0%
100,0%
Year -3 Year -2 Year -1 Current: Year 0
Repairs & Maintenance
Repairs & Maintenance
Repairs and Maintenance – This represents the propotion of operating expenditure spent and is calculated by dividing the total repairs and maintenace.
Data used from MBRR SA8

331
COMPONENT B: SPENDING AGAINST CAPITAL BUDGET
INTRODUCTION TO SPENDING AGAINST CAPITAL BUDGET
Component B deals with capital spending indicating where the funding comes from and whether
Chris Hani District Municipality was able to spend the funding as planned. Capital expenditure is
funded from grants, borrowing, operating expenditure and surpluses.
5.5 CAPITAL EXPENDITURE
Use table below to populate the info for the graph
5.5.1 CAPITAL EXPENDITURE
R million Original Budget Adjustment Budget
Audited Full Year Total
Original Budget variance
Adjusted Budget Variance
Capital Expenditure 420 411
414 635
312 247 25,7% 24,7%
420 411
414 635
312 247 25,7% 24,7%
Operating Expenditure 1 351 408
1 174 272
1 265 281 6,4% -7,8%
1 351 408
1 174 272
1 265 281 6,4% -7,8%
Total expenditure
#DIV/0!
#DIV/0!
–
200 000
400 000
600 000
800 000
1 000 000
1 200 000
1 400 000
R m
illio
n
Capital Expenditure: Year 0
Capital Expenditure
Operating Expenditure

332
Water and sanitation 635 858
638 076
657 815 -3,5% -3,1%
Electricity –
–
–
Housing –
–
–
Roads, Pavements, Bridges and storm water
–
–
–
Other –
–
–
–
–
–
External Loans –
–
–
Internal contributions –
–
–
Grants and subsidies 1 057 826 1 141 161 1 017 037 3,9% 10,9%
Other
–
–
–
External Loans –
–
–
Grants and subsidies –
–
–
Investments Redeemed –
–
–
Statutory Receipts (including VAT) –
–
–
Other Receipts 424 611 412 526 380 369 10,4% 7,8%
Salaries, wages and allowances 337 874 318 607 362 465 -7,3% -13,8%
Cash and creditor payments
Capital payments 420 411 414 635 312 247 25,7% 24,7%
Investments made –
–
–
External loans repaid –
–
–
Statutory Payments (including VAT) –
–
–
Other payments –
–
–
Original Budget Adjustment
Budget Audited Full Year
Total
Original Budget
variance
Adjusted Budget
Variance
Property rates
Service charges 244 461 303 532 300 505 -22,9% 1,0%
Other own revenue 1 154 77 985 79 863 -6817,7% -2,4%
245 616 381 517 380 369 -54,9% 0,3%
Employee related costs 337 874 318 607 362 465 -7,3% -13,8%
Provision for working capital
Repairs and maintenance 92 456 106 801 187 356 -102,6% -75,4%
Bulk purchases 26 139 15 806 16 120 38,3% -2,0%
Other expenditure 202 287 134 585 699 341 -245,7% -419,6%
658 756 575 798 1 265 281 -92,1% -119,7%

333
Service charges: Electricity –
– -
Grants & subsidies: Electricity –
–
–
Other revenue: Electricity –
–
–
Employee related costs: Electricity –
–
–
Provision for working capital: Electricity –
–
–
Repairs and maintenance: Electricity –
–
– %
Bulk purchases: Electricity
Other expenditure: Electricity –
–
–
Service charges: Water 244 461 303 532 241 313 1,3% 20,5%
Grants & subsidies: Water 424 611 380 956 312 247 26,5% 18,0%
Other revenue: Water 7
669 073 684 488 553 566 17,3% 19,1%
Employee related costs: Water 151 651 142 915 100,0% 100,0%
Provision for working capital: Water
Repairs and maintenance: Water 69 188 49 771 100,0% 100,0%
Bulk purchases: Water 26 139 15 806 16 120 38,3% -2,0%
Other expenditure: Water 82 420 92 247 100,0% 100,0%
329 398 300 738 16 120 95,1% 94,6%
T5,5,1
5.6 SOURCES OF FINANCE
5.6.1 Capital Expenditure
Capital Expenditure - Funding Sources: Year -1 to Year 0
R' 000
Details
2017 2018
Actual Original Budget
(OB)
Adjustment Budget
Actual Adjustment to OB
Variance (%)
Actual to OB
Variance (%)
Source of finance
External loans 0 0 0 0 0 0
Public contributions and donations 0 0 0 0 0 0
Grants and subsidies 1,289,453
1,146,290
38,528
1,088,406,807.00 -96.64% -5.05%
Other -
– 0 0 0
Total 1,289,453
1,146,290
38,528
1,088,407 0 0
Percentage of finance

334
External loans 0.0% 0.0% 0.0% 0.0% 0 0
Public contributions and donations 0.0% 0.0% 0.0% 0.0% 0 0
Grants and subsidies 100.0% 100.0% 100.0% 100.0% 0 0
Other 0.0% 0.0% 0.0% 0.0% 0 0
Capital expenditure
Water and sanitation 732,695
514,254
540,260
657,814,830.00 5.06% 27.92%
Electricity 0 0 0 0 0 0
Housing 23,862 0 0 0
Roads and storm water 0 0
– 0 0 0
Other 33,769
42,000
42,000 0 0.00%
-100.00%
Total 790,326
556,254
582,260
657,815 0 0
Percentage of expenditure
Water and sanitation 92.7% 92.4% 92.8% 100.0% 0 0
Electricity 0.0% 0.0% 0.0% 0.0% 0 0
Housing 3.0% 0.0% 0.0% 0.0% 0 0
Roads and storm water 0.0% 0.0% 0.0% 0.0% 0 0
Other 4.3% 7.6% 7.2% 0.0% 0 0
T 5.6.1

335
5.7 CAPITAL SPENDING ON 5 LARGEST PROJECTS
5.7.1 Capital Expenditure of 5 largest projects
Capital Expenditure of 5 largest projects* R' 000
Name of Project
Current: Year 0 Variance: Current Year 0
Original Budget Adjustment
Budget Actual
Expenditure Original
Variance (%) Adjustment variance (%)
A - Mhlanga water supply 23 700 000 15 206 737 15 206 737 36% 36%
B - Tsomo waste water treatment works 17 000 000 16 429 472 15 380 293 10% 3%
C - EU sanitation 74 191 999 76 241 936 74 448 029 0% -3%
D - Intsika yethu sanitation project ward 8 23 364 843 34 098 282 33 007 254 -41% -46%
E - Cluster 9 water treatment works 43 200 000 64 140 387 41 109 460 5% -48%
* Projects with the highest capital expenditure in Year 0
Name of Project - A Mhlanga water supply
Objective of Project Provide water supply to communities
Delays COVID and seven week community protest regarding wanting extra labour employed. Matter was resolve
Future Challenges Water supply from bulk fom dma levels due to drought conditions
Anticipated citizen benefits 1445 households will be served once water comes on line in February 2021
Name of Project - B Tsomo waste water treatment works
Objective of Project Provide waste water treatment plant treat sewerage of Tsomo town
Delays Contractor performance and appointment of smme
Future Challenges None
Anticipated citizen benefits 4943 households to benefit in long term on completion of future developments in town currently there are 2250 existing households
Name of Project - C EU sanitation
Objective of Project Provide rural community households with basic VIP sanitation toilets
Delays None
Future Challenges none
Anticipated citizen benefits 4698 households benefitting
Name of Project - D Intsika yethu sanitation project ward 8
Objective of Project Provide rural community households with basic VIP sanitation toilets
Delays None
Future Challenges none
Anticipated citizen benefits 1597 households benefitting
Name of Project - E Cluster 9 water treatment works
Objective of Project Provide treated quality water to communities to Cluster 9, tsomo town, Cluster 8 ADM cross border villages
Delays Contract performance in terms completing project timeously
Future Challenges Securing additional funds to complete overall project
Anticipated citizen benefits 13013 households on completion of full scope of project
T 5.7.1

336
5.8 BASIC SERVICE AND INFRASTRUCTURE BACKLOGS
5.8.1 INTRODUCTION TO BASIC SERVICE AND INFRASTRUCTURE BACKLOGS
The mandate of Chris Hani District Municipality is to deliver water and sanitation to the district.
5.8.1.1 Service Backlogs 20182019
Service Backlogs as at 30 June Year 2020 Households (HHs)
*Service level above minimun
standard **Service level below minimun standard
No. HHs % HHs No. HHs % HHs
Water 150988 69 67227 31
Sanitation 171478 79 46727 21
Electricity % %
Waste management % %
Housing % %
% HHs are the service above/below minimum starndard as a proportion of total HHs. 'Housing' refrs to * formal and ** informal settlements. T 5.8.2
COMPONENT C: CASH FLOW MANAGEMENT AND INVESTMENTS
INTRODUCTION TO CASH FLOW MANAGEMENT AND INVESTMENTS
Managing the cash resources as Chris Hani District Municipality remains a key requirement to
ensure liquidity of the Municipality in order to meet its financial obligations, both currently and into a
sustainable future.
Cash flow is actively monitored to enable the municipality to meet its obligations as they become
due. Both major revenue (grants, equitable share etc.) and expenditure (purchases and loan
repayments) categories have been identified and accounted for appropriately to ensure that
repayments are made on time and that surplus funds are invested in order to earn a favourable
return on investment.

337
5.9 CASH FLOW
5.9.1 Cash Flow Outcomes
Cash Flow Outcomes R'000
Description
2018/2019 2019/2020
Audited Outcome Original Budget Adjusted Budget
Actual
CASH FLOW FROM OPERATING ACTIVITIES
Receipts 1 311 150 1 128 435 1 450 836 1 141 440
sale of goods and services 172 351 88 100 183 865 299 927
Grants 1 102 944 820 87 314 820 799
Government - operating – 601 554 760 205 –
Government - capital – 403 381 380 956 –
Interest 35 856 34 580 38 495 20 714
Other revenue – – – –
Payments 676 528 1 011 408 889 538 814 805
Employees (350 905) (1 011 408) (857 860) (357 736)
Finance charges (267) – (40) (88)
Suppliers (325 357) – (31 638) (456 981)
other payments –
NET CASH FROM/(USED) OPERATING ACTIVITIES 634 622 019 117 026 790 561 298 070 326 635 024
CASH FLOWS FROM INVESTING ACTIVITIES
Receipts
Proceeds on disposal of PPE – – 160 423 Purchase of property, plant
and equipment (329 066) – – (332 634)
Prior year other movements (188 652) – – (268 990) Decrease (Increase) in non-
current debtors – – – – Decrease (increase) other non-
current receivables – – – – Decrease (increase) in non-
current investments – (352) 1 500 –
Payments – – – –
Capital assets – – (459 760) –
NET CASH FROM/(USED) INVESTING ACTIVITIES -517 718 392 - (458 100) -601 201 208
(517 718) CASH FLOWS FROM FINANCING ACTIVITIES
Receipts – – – –
Short term loans – – – – Borrowing long
term/refinancing – – – – Increase (decrease) in
consumer deposits – 441 – –
Payments – – – –
Repayment of borrowing – – – –
NET CASH FROM/(USED) FINANCING ACTIVITIES – – –

338
NET INCREASE/ (DECREASE) IN CASH HELD 117 073 – – (335 672)
Cash/cash equivalents at the year begin: 260 845 892 322 606 944 469 377 919 326
Cash/cash equivalents at the year end: 377 919 326 877 742 1 047 667 42 247 058
Source: MBRR A7 T 5.9.1
5.12 COMPONENT D: OTHER FINANCIAL MATTERS
SUPPLY CHAIN MANAGEMENT
All Supply Chain Management officials comply with the prescribed levels required for their positions
in terms of the MFMA Competency Regulation Guidelines.
There were adverse remarks in the Auditor General’s Report for the previous financial year regarding
the quality of the Supply Chain Management of Chris Hani District Municipality.
The Chris Hani District Municipality have adopted and implemented the following policies and
practices relating to Supply Chain Management:
Supply Chain Management Policy
Irregular, Wasteful and Fruitless Expenditure Policy
Infrastructure Provision Policy

339
CHAPTER 6 – AUDITOR GENERAL AUDIT FINDINGS
COMPONENT A: AUDITOR GENERAL OPINION OF FINANCIAL STATEMENTS 2019/20
6.1 Auditor General Report 2019/2020

340

341

342

343

344

345

346

347
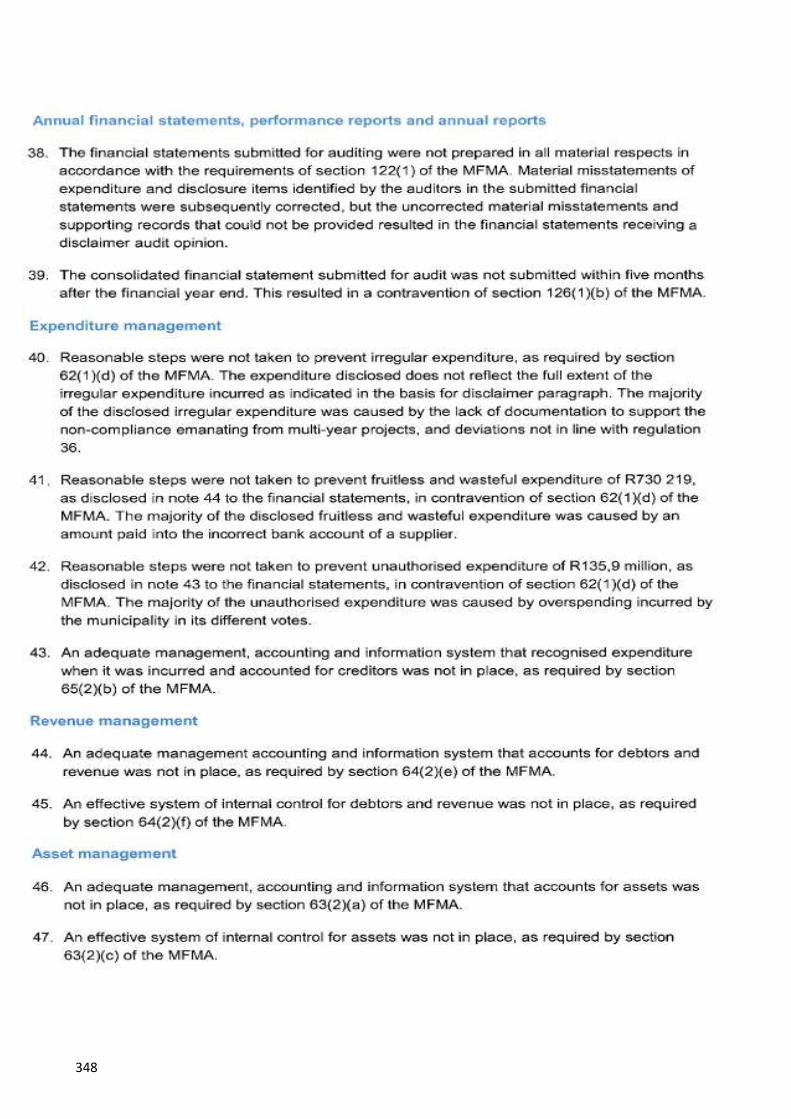
348

349

350

351

352

353

354
AUDITOR GENERALS AUDIT ACTION PLAN FOR 2019/2020 F/Y
COAF No.
No. Process/Department
Repeat Finding
from PY?
Cause/Internal Control System
Lapse (Audit Report &
Management Report)
Root Cause- AG
Root Cause - A G Root Cause- Management
Recommendation by the AG
Completion Date Position Escalation
COAF 1
1 All Departments
Management did not indicate the time frame when will the policy be reviewed or when it was approved.
Lack of accounatbility of department on the approved policies.
30-Jun-2021 All
Directors Municipal Manager
COAF 2
2 Risk Management Unit
This is due to management not implementing the controls in place
1. None prioritization in the institutional policy workshops.
30-Jun-2021 Risk Manager
Director Strategic
COAF 2
3 SCM As per the council minutes, there was no resolution taken that MPAC should investigate the UIFWE that was reported to council.
As per the council minutes, there was no resolution taken that MPAC should investigate the UIFWE that was reported to council.
30-Jun-2021 SCM Manager
CFO

355
COAF 2
4 Risk Management Unit
This is due to a lack of proper oversight by management and those charged with governance to ensure that the internal controls are implemented and monitored at the municipality.
1. None prioritization in the institutional policy workshops.
1. make motivation to the Office of the Speaker for risk related policies to be proritized
30-Jun-2021 Risk Manager
Director Strategic
COAF 2
5 Human Resource
This is due to municipality not having enough budget to fill vacant posts
Non availability of budget within the municipality.
30-Jun-2021 Human Resource Manager
COAF 2
6 Financial Reporting
This is due to management not implementing recommendations from the prior years.
1.Delay in developing the gap analysis report on use of consultant. 2. Delay in development of consultant reduction plan. 3 There is a lack of information or skilss sharing within the Municipality. 4. There iss no sucession plan in place to ensure that institution knowledger does not leave with officials leaving the Municipality.
30-Jun-2021 Asset Manager & AFS Manager
CFO
COAF 2
7 SCM Management is not implementing the AGSA findings and recommendations
SCM Policy is not aligned with the SCM Regulations .
30-Jun-2021 SCM Manager
CFO

356
COAF 2
8 SCM This is due to lack of exercise of management oversight to ensure that all audit findings are followed up on and sufficiently addressed.
Municipality did not comply with SCM Regulations
30-Jun-2021 SCM
Manager CFO
COAF 2
9 Technical Service
1. The meter readings are not consistently taken by the Engcobo area operators. 2. The area manager does not keep an accurate record of the readings which would enable them to compile accurate reports.
1. Management agrees to the finding. 2. Service Provider was appointed for water loss management for a duration of 3 years. 3. Another specification for smart metering was submitted to the Bid Specification Committee on 23/03/2021 for a a 3 year period.
30-Jun-2021 Water Service Manager
Director Technical Service
COAF 2
10 Technical Service
There is a lack of exercise of oversight by management to ensure that all business process are designed in a way to ensure that proper controls are in place
1. Management agrees to the finding. 2. Service Provider was appointed for water loss management for a duration of 3 years. 3. Another specification for smart metering was submitted to the Bid Specification Committee on 23/03/2021 for a a 3 year period.
30-Jun-2021 Water Service Manager
Director Technical Service

357
COAF 3
11 Expenditure The cause for this is due to a lack of controls over record keeping in the municipality
Storeroom controls needed to be modified, i.e storeroom audit did not take place.
30-Jun-2021 Acting Expenditure Manager
Chief Financial Officer
COAF 5
12 Cash and Cash Equivalents
The reconciliation prepared is not properly reviewed and followed up to ensure unreconciled differences are cleared.
Lack of monthly reviews of bank reconciliation
30-Jun-2021 Manager AFS
Chief Financial Officer
COAF 5
13 Inventory The stock count was done during the restriction that applied because of covid 19 pandemic and not all the staff was available at the time M
Inventory listings not signed by the relevent officials
30-Jun-2021 Asset Manager
Chief Financial Officer
COAF 6
14 Financial Reporting
Management did not adjust the financial misstatements of the prior year to take into account the correction of the errors.
Verification of movable assets not adequetly done as a result of Covid 19
30-Jun-2021 AFS Manager
Chief Financial Officer
COAF 6
15 Revenue Management did not adjust the financial misstatements of the prior year to take into account the correction of the errors.
Disagree with the finding 1. 31 May 2021 2. 29 March 2021 3. Ongoing/monthly
Revenue Manager
Chief Financial Officer

358
COAF 6
16 Revenue Management did not adjust the financial misstatements of the prior year to take into account the correction of the errors.
Adjusted FAR submitted This is a multi year process
Revenue Manager
Chief Financial Officer
COAF 6
17 Revenue Management did not adjust the financial misstatements of the prior year to take into account the correction of the errors.
Inventory movement inaccurately recorded
This is a multi year process
Revenue Manager
Chief Financial Officer
COAF 6
18 Revenue Management did not adjust the financial misstatements of the prior year to take into account the correction of the errors.
GIS system not fully implemented
1. 31 May 2021 2. 29 March 2021 3. Ongoing/monthly
Revenue Manager
Chief Financial Officer
COAF 14
19 Payable This is due to a lack of exercise of oversight by management to ensure that there are adequate controls over processing and reconciliation of transactions.
Verification of movable assets not adequetly done as a result of Covid 19
30-Jun-2021 Expenditure Manager
Chief Financial Officer

359
COAF 14
20 Payable This is due to a lack of exercise of oversight by management to ensure that there are adequate controls over processing and reconciliation of transactions.
The aproach and methodology applied for the year 2019/2020 did not yied the expected results
30-Jun-2021 Expenditure Manager
Chief Financial Officer
COAF 15
21 Revenue 1.Inadequate review of the billing report by management as to determine the debtor type and the relevant tariff to be charged. 2.Meterman reading were not done consistently throughout the year resulting in management charging interims which could not be re-performable by the auditors. 3.Reasons provided by the meterman readers, for not reading the meters were prominently and consistently noted throughout the year as follows; i. soil plants - throughout a designated area ii. bees - throughout a
Addition of assets by inspecting of payment voucher and completion certificate without verifying the asset constructed
1. 31 May 2021 2. 29 March 2021 3. Ongoing/monthly
Revenue Manager
Chief Financial Officer

360
designated area iii. dangerous dogs - throughout a designated area iv. other circumstances – which were not described on the meterman v. meter man updated – but no reading was done by the readers.
COAF 16
22 Revenue The cause of the finding is, municipal revenue management services does not have an integrated system to trace if all meters installed are actually billed.
Lack of proper review of the final asset register submitted for audit prposes
1. 31 May 2021 2. 29 March 2021 3. Ongoing/monthly
Revenue Manager
Chief Financial Officer
COAF 19
23 Expenditure The cause of this is due to a lack of controls over the recording and maintenance of financial records.
1.The process plan of processing an invoice from day of receipt was not adequately implemented. 2.There are cases of delays in approval of invoices by HODs
30-Jun-2021 Expenditure Manager
Chief Financial Officer
COAF 21
24 Expenditure There is lack of monitoring and reviewing of transactions entered into the system in order to ensure that they are accurate as per the supplier’s invoice.
There were not adequate reviews of the General Ledger for any errors.
30-Jun-2021 Expenditure Manager
Chief Financial Officer

361
COAF 22
25 Employee cost
This is due to a lack of exercise of oversight by management to ensure that there are adequate controls over processing and reconciliation of transactions.
1. Intergration from Payday to Solar was not fully implemented at some instances. 2. Votes that are currently existing on Payday are intergrating to Solar under Basic salaries which then lead to variances when comparisons are made. 3. HODs currently are on the same Company as the rest of the staff.
30-Jun-2021 Expenditure Manager
Chief Financial Officer
COAF 23
26 Revenue The cause of the finding is municipal revenue management services does not have an integrated system to trace if all meters installed are actually billed.
1. Insufficient action was taken to identify reasons for not billing. 2. There are meters that have not been billed due to various challenges indicated by meter readers when on site. 3. Follow up was not done on identifying reasons for meters that cannot be accessed for readings.
1. 31 May 2021 2. 29 March 2021 3. Ongoing/monthly
Revenue Manager
Chief Financial Officer

362
COAF 26
27 Technical Service
The cause of this is due to a lack of controls over the recording and maintenance of financial records
1. Eskom and municipal kiosks are read only by the vendors of electricity with restricted access by unauthorised personnel. This results into billing being issued only by the electricity provider. Chdm relies on previous consumption readings and consumption patterns. 2. Water consumption is metered and read from the existing meters. Some meters belong to Chdm and some belong to DWS. DWS meters are read only by DWS as they are located at sites like dams owned by DWS with restricted access.
30-Jun-2021 Water Service Manager
Director Technical Service
COAF 28
28 Technical Service
The municipality accounts for the electricity purchases when they are making a payment and record the amount due as opposed to amount billed/incurred for the period
1. Eskom and municipal kiosks are read only by the vendors of electricity with restricted access by unauthorised personnel. This results into billing being issued only by the electricity provider. Chdm relies on previous consumption readings and consumption patterns.
30-Jun-2021 Water Service Manager
Director Technical Service

363
COAF 29
29 Financial Reporting
Lack of oversight responsibility regarding financial and performance reporting and compliance as well as related internal controls
1. Caseware version that was not intergrate the CHDM and CHDA
30-Jun-2021 AFS Manager
Chief Financial Officer
COAF 30
30 Financial Reporting
The cause of the above finding is the lack of appropriate review of disclosures relating to contingent liabilities by management before the annual financial statements are issued.
Lack of fully review of accounting policy
30-Jun-2021 AFS Manager
Chief Financial Officer
COAF 31
31 Receivables from non-exchange transactions ( Expenditure & Cash & Bank)
The cause is due to a lack of controls over the maintenance of financial information
30-Jun-2021

364
COAF 32
32 Employee costs
This is due to a lack of exercise of oversight by management to ensure payroll and the general ledger are properly reconciled and the reconciling items between payroll and general ledger are properly investigated and disclosed
1. Intergration from Payday to Solar was not fully implemented at some instances. 2. Votes that are currently existing on Payday are intergrating to Solar under Basic salaries which then lead to variances when comparisons are made. 3. HODs currently are on the same Company as the rest of the staff.
30-Jun-2021 Expenditure Manager
Chief Financial Officer
COAF 35
33 Procurement and Contract Management
The declarations are submitted by the service providers and the municipality uses the CSD report to verify the accuracy of what has been declared. It has become clear that the information in the CSD report is not always accurate or up to date.
Reliance on CSD in verifying declarations.
30-Jun-2021 SCM Manager
CFO
COAF 36
34 Procurement and Contract Management
This is due to officials of the municipality not declaring that they have interest in other businesses.
This is due to officials of the municipality not declaring that they have interest in other businesses.
30-Jun-2021 Risk Manager
Municipal Manager

365
COAF 39
35 Employee costs
The cause of the above finding is due to inappropriate overtime cut-off controls being implemented by management to ensure that all payments relating to overtime worked during the last month of the financial year is accounted for in the year-end Annual Financial Statements.
1. Communication will be issued through the office of the Chief Financial Officer to remind employees to submit overtime claims before year end.
30-Jun-2021 Expenditure Manager
Chief Financial Officer
COAF 40
36 Cash and cash equivalents
The lack of adequate review of bank reconciliations to ensure that the balance per the cashbook at year-end agrees to the year-end balance per the bank statement.
1.Delay in authorisation of payment on the 30th June.
30-Jun-2021 SCM Manager
Chief Financial Officer
COAF 42
37 Procurement and Contract Management
The municipality reported to the National Treasury about the local content through the s 52 report and assumed that National Treasury in their sitting with the Department of Trade and Industry will report what the municipality has done for local content contract.
The municipality assumed that Treasury reported the successful bidder to the DTI.
30-Jun-2021 SCM Manager
CFO

366
COAF 47
38 Payable The cause of this is due to a lack of controls over the maintenance of financial statements and a lack of proper creditors reconciliations.
Monthly creditors reconciliations were not adequately performed and reviewed.
30-Jun-2021 Expenditure Manager
Chief Financial Officer
COAF 51
39 Payable This was as a result of the municipality not performing creditors reconciliations and not monitoring the recording and payment of invoices.
Monthly creditors reconciliations were not adequately performed and reviewed.
30-Jun-2021 Expenditure Manager
Chief Financial Officer
COAF 53
40 Inventory The cause of the finding is due to lack of controls over daily and monthly processing and reconciling transactions by the asset section.
Inventory movement inaccurately recorded
30-Jun-2021 Asset Manager
Chief Financial Officer
COAF 54
41 Expenditure This occurred due to management running out of time while preparing the financial statements and not able to pass all the required closing journals
There were not adequate revieews of the General Ledger.
30-Jun-2021 Expenditure Manager
Chief Financial Officer
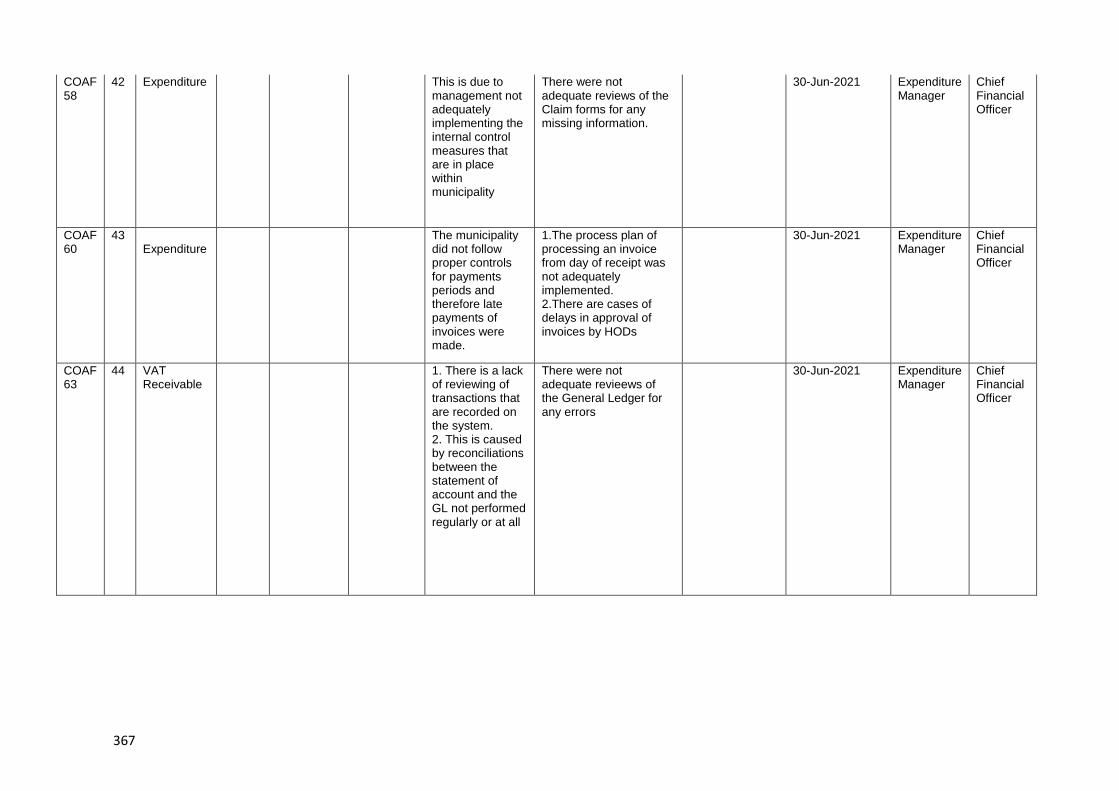
367
COAF 58
42 Expenditure This is due to management not adequately implementing the internal control measures that are in place within municipality
There were not adequate reviews of the Claim forms for any missing information.
30-Jun-2021 Expenditure Manager
Chief Financial Officer
COAF 60
43 Expenditure
The municipality did not follow proper controls for payments periods and therefore late payments of invoices were made.
1.The process plan of processing an invoice from day of receipt was not adequately implemented. 2.There are cases of delays in approval of invoices by HODs
30-Jun-2021 Expenditure Manager
Chief Financial Officer
COAF 63
44 VAT Receivable
1. There is a lack of reviewing of transactions that are recorded on the system. 2. This is caused by reconciliations between the statement of account and the GL not performed regularly or at all
There were not adequate revieews of the General Ledger for any errors
30-Jun-2021 Expenditure Manager
Chief Financial Officer

368
COAF 68
45 Immovable Assets
This is due to lack of controls over the labelling and proper description of the assets in the Fixed Asset register which could be verified in GIS. Management not adequately making use of Municipal systems which were acquired to ensure that the municipality has and maintains a system of internal control of assets
GIS system not fully implemented
30-Jun-2021 Asset Manager
Chief Financial Officer
COAF 69
46 Immovable Assets
This was due to lack of management oversight and lack of proper reviews
lack of quality reviews on the discription and proper verfification of all land buildings on the Asset Register
30-Jun-2021 Asset Manager
Chief Financial Officer
COAF 72
47 Movable assets
This was due to lack of management oversight in reviewing the asset register as to ensure that it is complete.
Verification of movable assets not adequetly done as a result of Covid 19
30-Jun-2021 Asset Manager
Chief Financial Officer
COAF 73
48 SCM This is due to management not reviewing and monitoring compliance with relevant legislation.
The Municipality did not comply with SCM regulations.
30-Jun-2021 MPAC Manager
Municipal Manager

369
COAF 73
49 Expenditure This is due to management not reviewing and monitoring compliance with relevant legislation.
There were inadequate reviews to identify missing signatures
30-Jun-2021 Expenditure Manager
Chief Financial Officer
COAF 80
50 Immovable Assets
This is due to management estimate not being in line with the provision of the reporting framework. Management does not have adequate controls in place over the maintenance, recording of assets
The aproach and methodology applied for the year 2019/2020 did not yied the expected results
30-Jun-2021 Asset Manager
Chief Financial Officer
COAF 82
51 Immovable Assets
This is caused by lack of monitoring and regular review of assets on a regular basis by management. Furthermore, a lack of compliance with standard procedures relating to expenditure management and the Municipal Finance Management Act.
Addition of assets by inspecting of payment voucher and completion certificate without verifying the asset constructed
30-Jun-2021 Asset Manager
Chief Financial Officer

370
COAF 86
52 Immovable Assets
This was due to lack of management oversight and lack of proper reviews of the municipal fixed asset register
Lack of proper review of the final asset register submitted for audit prposes
30-Jun-2021 Asset Manager
Chief Financial Officer
COAF 92
53 Immovable assets
The municipality did not follow proper controls for payments periods and therefore late payments of invoices were made. This is due to lack of internal controls over the authorisation and loading of payments during the period.
1.The process plan of processing an invoice from day of receipt was not adequately implemented. 2.There are cases of delays in approval of invoices by HODs
30-Jun-2021 Asset Manager
Chief Financial Officer

371
Accessibility
indicators
Explore whether the intended beneficiaries are able to access services or
outputs.
Accountability
documents
Documents used by executive authorities to give “full and regular” reports
on the matters under their control to Parliament and provincial legislatures
as prescribed by the Constitution. This includes plans, budgets, in-year
and Annual Reports.
Activities The processes or actions that use a range of inputs to produce the desired
outputs and ultimately outcomes. In essence, activities describe "what we
do".
Adequacy indicators The quantity of input or output relative to the need or demand.
Annual Report A report to be prepared and submitted annually based on the regulations
set out in Section 121 of the Municipal Finance Management Act. Such a
report must include annual financial statements as submitted to and
approved by the Auditor-General.
Approved Budget The annual financial statements of a municipality as audited by the Auditor
General and approved by council or a provincial or national executive.
Baseline Current level of performance that a municipality aims to improve when
setting performance targets. The baseline relates to the level of
performance recorded in a year prior to the planning period.
Basic municipal
service
A municipal service that is necessary to ensure an acceptable and
reasonable quality of life to citizens within that particular area. If not
provided it may endanger the public health and safety or the environment.
Budget year The financial year for which an annual budget is to be approved – means
a year ending on 30 June.

372
Cost indicators The overall cost or expenditure of producing a specified quantity of
outputs.
Distribution
indicators
The distribution of capacity to deliver services.
Financial Statements Includes at least a statement of financial position, statement of financial
performance, cash-flow statement, notes to these statements and any
other statements that may be prescribed.
General Key
performance
indicators
After consultation with MECs for local government, the Minister may
prescribe general key performance indicators that are appropriate and
applicable to local government generally.
Impact The results of achieving specific outcomes, such as reducing poverty and
creating jobs.
Inputs All the resources that contribute to the production and delivery of outputs.
Inputs are "what we use to do the work". They include finances, personnel,
equipment and buildings.
Integrated
Development Plan
(IDP)
Set out municipal goals and development plans.
National Key
performance areas
Service delivery & infrastructure
Economic development
Municipal transformation and institutional development
Financial viability and management
Good governance and community participation

373
Outcomes The medium-term results for specific beneficiaries that are the
consequence of achieving specific outputs. Outcomes should relate
clearly to an institution's strategic goals and objectives set out in its plans.
Outcomes are "what we wish to achieve".
Outputs The final products, or goods and services produced for delivery. Outputs
may be defined as "what we produce or deliver". An output is a concrete
achievement (i.e. a product such as a passport, an action such as a
presentation or immunization, or a service such as processing an
application) that contributes to the achievement of a Key Result Area.
Performance
Indicator
Indicators should be specified to measure performance in relation to input,
activities, outputs, outcomes and impacts. An indicator is a type of
information used to gauge the extent to
which an output has been achieved (policy developed, presentation
delivered, service rendered)
Performance
Information
Generic term for non-financial information about municipal services and
activities. Can also be used interchangeably with performance measure.
Performance
Standards:
The minimum acceptable level of performance or the level of performance
that is generally accepted. Standards are informed by legislative
requirements and service-level agreements. Performance standards are
mutually agreed criteria to describe how well work must be done in terms
of quantity and/or quality and timeliness, to clarify the outputs and related
activities of a job by describing what the required result should be. In this
EPMDS performance standards are divided into indicators and the time
factor.

374
Performance
Targets:
The level of performance that municipalities and its employees strive to
achieve. Performance Targets relate to current baselines and express a
specific level of performance that a municipality aims to achieve within a
given time period.
Service Delivery
Budget
Implementation Plan
Detailed plan approved by the mayor for implementing the municipality’s
delivery of services; including projections of the revenue collected and
operational and capital expenditure by vote for each month. Service
delivery targets and performance indicators must also be included.
Vote: One of the main segments into which a budget of a municipality is divided
for appropriation of money for the different departments or functional areas
of the municipality. The Vote specifies the total amount that is appropriated
for the purpose of a specific department or functional area.
Section 1 of the MFMA defines a “vote” as:
a) one of the main segments into which a budget of a municipality is
divided for the appropriation of money for the different departments or
functional areas of the municipality; and
b) which specifies the total amount that is appropriated for the purposes of
the department or functional area concerned

375
APPENDIX A – COUNCILLORS, COMMITTEE ALLOCATION AND COUNCIL ATTENDANCE
Names of Councillors Percentage Council Meetings Attendance
Percentage Apologies for non-attendance
CLLR M. C. KOYO 100% 0%
CLLR W. GELA 100% 0%
CLLR N. N. SEPTEMBER-CABA 87% 13%
CLLR M. PAPIYANA 80% 20%
CLLR M. JACK 87% 13%
CLLR N. MATIWANE 47% 53%
CLLR L. N. TYALI 100% 0%
CLLR Y. ZICINA 93% 7%
CLLR N. C. GONIWE 67% 33%
CLLR S. MBOTSHANE 100% 0%
CLLR T. W. BIKWANA 73% 27%
CLLR A. S. NXOZI 93% 7%
CLLR S. B. NXAWE 73% 27%
CLLR M. ADONISI 40% 60%
CLLR R. W. VENSKE 87% 13%
CLLR G. E. BOMELA 53% 47%
CLLR C. Z. DELIWE 33% 67%
CLLR Z. R. SHWENI 40% 60%
CLLR M. DESHA 67% 33%
CLLR J. CENGANI 67% 33%
CLLR S. MYATAZA 60% 40%
CLLR Z. QAYIYA 73% 27%
CLLR N. NKOTA 67% 33%
CLLR S. TAME 67% 33%
CLLR N. F. KONI 67% 33%
CLLR N. C. LALI 80% 20%
CLLR N. MTYOBILE 73% 27%
CLLR K. MJEZU 73% 27%
CLLR S. ZANGQA 87% 13%
CLLR K. BIZANA 80% 20%
CLLR M. A. KONDILE 100% 0%
CLLR N. A. N. DAYISI 47% 53%
CLLR B. NTSERE 47% 53%
CLLR S. E. MVANA 93% 7%
CLLR L. E. GUBHULA-MQINGWANA 67% 33%
CLLR Z. N. E. RALANE 93% 7%
CLLR A. N. HENDRICKS 40% 60%
CLLR M. XHELISILO 7% 93%
CLLR Z. N. NJOLI 67% 33%
CLLR M. S. NDLEBE 93% 7%
CLLR B. SIMINA 73% 27%

376
CLLR M. L. MXHONYWA 53% 47%
CLLR. S. MKHUNQE 40% 60%
CLLR T.E BOBO 33% 67%
CLLR. N. P. ZONKE 13% 87%
CLLR. N.N. MGIDI 7% 93%
APPENDIX B – COMMITTEES AND COMMITTEE PURPOSES
Committees (other than Mayoral / Executive Committee) and Purposes of Committees
Municipal Committees Purpose of Committee
Municipal Public Accounts
Committee
Oversight of municipal accounts
Rules and Ethics Committee To establish rules for Council and Committees
Audit Committee Oversight of financial reporting and disclosures
Women’s Caucus
The voice of women to advocate for gender equality and equity
and seeks to ensure women representation in strategic position to
achieve 50/50
Performance Audit committee Oversees performance of the municipality in achieving the KPAs
Fraud and Risk committee Prevention and mitigation of risk
Whippery Oversees political party council relations and cooperation

377
APPENDIX C – THIRD TIER ADMINISTRATIVE STRUCTURE
Third Tier Structure
Directorate Director/Manager (State title and name)
Strategic Manager Dr. B Mthembu
Engineering Services Mr L Govu
Health and Community Services Ms Y Sinyanya
Chief Financial Officer Mr M Dyushu
Corporate Services Ms Y Dakuse
IPED Dr. Z. Shasha
Use as a spill-over schedule if top 3 tiers
cannot be accomodated in chapter 2
(T2.2.2).
T C
APPENDIX D – FUNCTION OF MUNICIPAL ENTITY
Refer to Annexure A – The Annual Report of Chris Hani Dvelopment Agency is attached to this
report.
APPENDIX F – Basic Service Provision
Basic Service Provision
Detail Water Sanitation Electricity Refuse Housing
Households with minimum service delivery
150988 171478
Households without minimum service delivery
67227 46737
Total Households*
Houses completed in year
Shortfall in Housing units
*Including informal settlements T F.2

378
APPENDIX G – AUDIT COMMITTEE REPORT
CHRIS HANI DISTRICT MUNICIPALITY – AUDIT COMMITTEE CHAIRPERSON’S REPORT
FOR THE YEAR ENDED 30 JUNE 2020

379

380

381

382

383

384

385

386

387

388

389

390

391

392
APPENDIX I – MUNICIPAL ENTITY/SERVICE PROVIDER PERFORMANCE SCHEDULE
No. TENDER NO.
CONTRACT DESCRIPTION AWARD LETTER
SERVICE PROVIDER
TENDER AWARD VALUE (incl VAT)
STATUS
1 30/2018-2019/YD(PM)
PROVISION FOR MANAGEMENT, TREATMENT, MONITORING AND REPORTING ON INJURIES ON DUTY, OCCUPATIONAL ILLNESS AND DISEASES FOR CHRIS HANI DISTRICT MUNICIPALITY FOR A PERIOD OF THREE YEARS
15-Jul-19 MINK-LINE CONSULTING
Rate Based Completed
2 28/2018-2019/AM(NF)
PROVISION OF SUPPORT SERVICES FOR THE CHRIS HANI DISTRICT MUNICIPALITY IN THE COMPLILATION OF ANNUAL FINANCIAL STATEMENTS AND THE AUDITING PROCESS FOR A PERIOD OF THREE YEARS
15-Jul-19 SIZWENTSALUBA GOBODO GRANT THORNTON ADVISORY SERVICES
R3 738 599,93 Completed
3 04/2018-2019/YD(ST)
CALL FOR EXPRESSION OF INTEREST TO BE INCLUDED IN THE PANEL OF SERVICE PROVIDERS FOR THE PROVISION OF LEGAL SERVICES FOR A PERIOD OF 3 (THREE) YEARS
15-Jul-19 MC WILLIAMS& ELLIOT INC, AND CLARK LAING INC
Rate Based Completed
4 32/2018-2019/MS(TN)
COFIMVABA EU SANITATION PHASE 5 (WARD2 NTSHINGENI)
4-Nov-19 IZWELETHU CERMFORCE CC
R19 227 028,00 Complete
5 33/2018-2019/MS(TN)
COFIMVABA EU SANITATION PHASE 5 (WARD2) 15-Nov-19 IZWELETHU CERMFORCE CC
R19 642 397,60 Complete
6 34/2018-2019/MS(TN)
COFIMVABA EU SANITATION PHASE 6 (WARD7) 15-Nov-19 IZWELETHU CERMFORCE CC
R25 251 355,49 Complete
7 36/2018-2019/MS(TN)
INTSIKA YETHU SANITATION PROJECT WARD 8: PHASE 2 (WARD 19)
15-Nov-19 IZWELETHU CERMFORCE CC
R7 737 110,04 Complete
8 37/2018-2019/MS(TN)
INTSIKA YETHU SANITATION PROJECT WARD 8: PHASE 2 (WARD 16)
15-Nov-19 IZWELETHU CERMFORCE CC
R5 523 139,27 Complete

393
8 17/2018-2019/MD(TN)
CLUSTER 6: WATERBACKLOG: LOKISHINI PHASE 2 - VILLAGE RETICULATION
17-Feb-20 SEEBO JV AMLO R30 697 444,50 Progress at 10 % in construction
9 03/2019-2020/YD(BF)
SUPPLY AND DELIVERY OF END- USER COMPUTING FOR CHRIS HANI DISTRICT MUNBICIPALITY FOR A PERIOD OF 3 YEARS.
17-Feb-20 ION CONSULTING (PTY) LTD
R613 558,20 Complete
10 17/2019-2020/LG(BN)
CLUSTER 2 : WATER SUPPLY BACKLOG PROJECT: SCHEME 3- 1C CONSTRUCTION OF PUMPING MAINS, BOOSTER PUMP STATIONS & WATER RETICULATION NETWORK FOR KUMQHASHU AND SURROUNDING AREAS
24-Mar-20 SAKWE PROJECTS JV MASHAMPLADUMZA
R18 342 661,33 Progress at 22 % in construction
11 15/2019-2020/LG(BN)
CLUSTER 2 WATER SUPPLY BACKLOG PROJECT: GQEBENYA SCHEME CONSTRUCTION OF A 500KL CONCRETE RESERVOIR, TWO BOREHOLE, PUMPSTATIONS, PUMPINNG MAINS AND WATER RETICULATION NETWORK FOR GQEBENYA SMALL FARMS
20-Mar-20 SAKWE PROJECTS JV MASHAMPLADUMZA
R18 961 563,98 Progress at 20% in construction
12 11/2019-2020/MS(BN)
GUBENXA AND MAXONGOSHOEK VILLAGES RURAL WATER SUPPLY SCHEMES
20-Mar-20 AMLO JV INTELLEC CONSTRUCTION
R17 471 307,79 Progress at 10% construction
14 22/2019-2020/LG(MR)
CHRIS HANI DISTRICT MUNICIPALITY IS LOOKING TO APPOINT THREE(3) SERVICE PROVIDERS FOR SUPPORT SERVICES, SUPPLY AND DELIVERY OF LIQUID FLOCCULANTS AND DISINFECTECTANTS, SPECIALISED HANDLING OF EQUIPMENT AND RELATED TRAINING FOR SAFETY AUDITS, OPTIMIZATION AND HAZMAT RESPONSE FOR ALL WATER PLANTS OF CHDM FOR A PERIOD OF THREE (3) YEARS
12-Jun-20 INDLELA CONSULTANTS (PTY) LTD
RATE BASED Progress at
0%
completion

394
15 22/2019-2020/LG(MR)
CHRIS HANI DISTRICT MUNICIPALITY IS LOOKING TO APPOINT THREE(3) SERVICE PROVIDERS FOR SUPPORT SERVICES, SUPPLY AND DELIVERY OF LIQUID FLOCCULANTS AND DISINFECTANTS, SPECIALISED HANDLING OF EQUIPMENT AND RELATED TRAINING FOR SAFETY AUDITS, OPTIMIZATION AND HAZMAT RESPONSE FOR ALL WATER PLANTS OF CHDM FOR A PERIOD OF THREE (3) YEARS
12-Jun-20 METSI WATER SOLUTIONS (PTY) LTD
RATE BASED Progress at
0%
completion
16 18/2019-2020/LG(AM)
MOLTENO WATER TREAMENT WORKS - PHASE 1 CONTRACT 1B - CONSTRUCTION OF THE NEW 500MM DIAMETER SUPPLY MAIN AND 2,75MI RESERVOIR
12-Jun-20 NORLAND CONSTRUCTION (PTY) LTD
R12 318 943,75 Progress at
0%
construction
17 24/2019-2020/LG(TN)
CLUSTER 6: WATER BACKLOG PROJECT: KUMBEKE VILLAGE RETICULATION WATER SUPPLY SCHEME
12-Jun-20 AST AFRICA TRADING 99 CC t/a CAPE KEI CONSTRUCTION SERVICES
R7 704 561,64 Progress at
10%
construction
18 23/2019-2020/LG(TN)
CLUSTER 6 WATER BACKLOG: SUNDWANA VILLAGE RETICULATION - PHASE 1
12-Jun-20 KAYALIHLE / STARTIME JV
R15 823 728,48 Complete
19 21/2019-2020/LG(BN)
DORDRECHT WATER AND SANITATION SERVICES: UPGRADING OF BULK WATER SUPPLY PHASE 4: CONSTRUCTION OF DAMS, PUMP STATIONS AND PIPELINES
12-Jun-20 MAGNACORP 485 CC JV LIVIERO CIVILS (PTY) LTD
R134 634 736,60 Progress at 0% construction
20 20/2019-2020/LG(BN)
CLUSTER 2 WATER SUPPLY BACKLOG PROJECT: REGIONAL SCHEME 3 PHASE 1: LUTUTU CONSTRUCTION OF A PUMPING MAIN, WATER RETICULATION NETWORK AND CONCRETE RESERVOIR REPAIR FOR LUTUTU VILLAGE
12-Jun-20 TATI GROUP JV R8 304 084,78 Progress at 0% construction

395
21 27/2019-2020/LG(BN)
CALA BULK SANITATION SERVICES: COMPLETION OF CALA WASTEWATER TREATMENT WORKS INCLUDING BULK PUMPSTATIONS AND ASSOCIATED RISING MAINS (PHASE 1)
12-Jun-20 RUWACON (PTY) LTD
R37 950 000,00 Progress at
0%
construction
22 14/2019-2020/LG(BN)
CLUSTER 2 WATER SUPPLY BACKLOG PROJECT REGIONAL SCHEME 3 PHASE 1D - CONSTRUCTION OF BOREHOLE PUMPSTATIONS, STEEL TAMKS, PUMPING MAINS AND WATER RETICULATION NETWORK FOR BUKWANA AND SURROUNDING VILLAGES
12-Jun-20 AST AFRICA TRADING 99 CC t/a CAPE KEI CONSTRUCTION SERVICES
R20 656 783,93 Progress at
0%
construction
23 35/2018-2019/MS(TN)
INTSIKA YETHU SANITATION PROJECT WARD 8: PHASE 2 (WARD 21)
9-Apr-20 IZWELETHU CERMFORCE CC
R20,175,757.29 Progress at
99%
construction

396
APPENDIX J – DISCLOSURES OF FINANCIAL INTEREST
Disclosures of Financial Interests
Period March 2019 to 30 June of Year 2020(Current Year)
Position Name Description of Financial interests* (Nil / Or details)
(Executive) Mayor Cllr Wongamela Gela Having financial interest in Property(Owner)
Deputy Mayor CLLR N. N. SEPTEMBER-CABA
Member of MayCo /
Exco
Cllr M. C. Koyo
Having Financial interest in Trust (1.Tsomo Valley Farmers Primary Co-op) (2.Ikhephu Secondary Co-op)
He a member in Eastern Cape Socia-economic (ECECC)
Having Financial interest in business( Ulapool Farm )
Having financial interest business (DRDAR Assistance to Koyo CPA/Ulapool)
Cllr M. Papiyana
Cllr M. Jack
Nil
Cllr N. Matiwane Having Financial in Property(lessor)
Having close family member who is having business.
Cllr L. N. Tyali
Having financial interest in Property (Owner)
Cllr Y. Zicina
Nil
Cllr N. C. Goniwe
Diseased
Cllr S. Mbotshane
Having relative working in Chris Hani( BTO) whose name is Onela Botshane
Cllr T. W. Bikwana
Nil
Cllr A. S. Nxozi
Nil
Cllr S. B. Nxawe
Receiving pension ( Sentinel Pension fund)
Cllr M. Adonisi
Cllr R. W. Venske
Nil
Cllr G. E. Bomela
Nil
Cllr C. Z. Deliwe
Nil
Cllr Z. R. Shweni
Nil
Cllr M. Desha
Nil
Cllr J. Cengani
Nil
Cllr S. Myataza
Nil

397
Cllr Z. Qayiya
Nil
Cllr. Luleka Elizabath Gubula-Mqiswana
Nil
Cllr N. Nkota
Nil
Cllr M.K Mafani He a member a Member/ Director of the Company ( Owner)
Having financial interest in business(Mafani Strategic Risk and Consulting)
Cllr S. Tame
Nil
Cllr N. F. Koni
Having financial interest in Business (Owner)
Cllr N. C. Lali
Having close family member who is having business (Chilid)
Cllr N. Mtyobile
Cllr K. Mjezu
Nil
Cllr S. Zangqa
Nil
Cllr K. Bizana
Nil
Cllr M. A. Kondile
Nil
Cllr N. A. N. Dayisi
Nil
Cllr B. Ntsere
Nil
Cllr S. E. Mvana
Nil
Cllr L. E. Gubhula-Mqingwana
Nil
Cllr Z. N. E. Ralane
Nil
Cllr A. N. Hendricks
Nil
Cllr M. Xhelisilo
Cllr Z. N. Njoli
Cllr M. S. Ndlebe
Nil
Cllr B. Simina
Nil
Cllr M. L. Mxhonywa
Nil
HODs & MM
Municipal Manager G Mashiyi
Strategic Manager
Dr. B. J Mthembu Nil
Engineering Services
Mr L Govu Nil

398
APPENDIX K (i) – REVENUE COLLECTION PERFORMANCE BY VOTE
Revenue Collection Performance by Vote
R' 000
Vote Description
Year -2018/2019
Current: 2019/2020 Year 0 Variance
Actual Original Budget
Adjusted Budget
Actual Original Budget
Adjustments Budget
Example 1 - Vote 1 305,466,551 244,461,260 303,532,083 300,505,479
Example 2 - Vote 2
Example 3 - Vote 3
Example 4 - Vote 4
Example 5 - Vote 5
Example 6 - Vote 6
Example 7 - Vote 7
Example 8 - Vote 8
Example 9 - Vote 9
Example 10 - Vote 10
Example 11 - Vote 11
Example 12 - Vote 12
Example 13 - Vote 13
Example 14 - Vote 14
Example 15 - Vote 15
Total Revenue by Vote 305,466,551
244,461
303,532
300,505,479 – –
Variances are calculated by dividing the difference between actual and original/adjustments budget by the actual. This table is aligned to MBRR table A3 T K.1
Health and Community
Services
Ms Y Sinyanya Nil
Chief Financial Officer
Mr M Dyushu Having financial interest in Business(Herbalife)
Corporate Services
Ms Y Dakuse Having relative working in Chris Hani( engineering) whose name is Gcobisa Matakane
IPED Dr. Z. Shasha Having financial interest in trust (Shasha family Trust) Having financial interest in Property (Landlord) Having interest in farming on a small scale Having relatives working in Chris Hani(Engineering)
Moses Shasha
Avuyile Shasha
Siyanda Shasha
Nomveliso Shasha
Tobela Nyengane

399
APPENDIX K (ii) – REVENUE COLLECTION PERFORMANCE BY SOURCE
Revenue Collection Performance by Source
R '000
Description
Year -2019 Year 2020 Year 0 Variance
Actual Original Budget
Adjustments Budget
Actual Original Budget
Adjustments Budget
Property rates –
–
–
–
0% 0%
Property rates - penalties & collection charges
–
–
–
–
0% 0%
Service Charges - electricity revenue
–
–
–
–
0% 0%
Service Charges - water revenue
249 329 356
187 503
244 292
241 312 886
22% -1%
Service Charges - sanitation revenue
56 102 484
56 959
59 240
59 185 234
4% 0%
Service Charges - refuse revenue
–
–
–
–
0% 0%
Service Charges - other
34 711
7 359
100% 100%
Rentals of facilities and equipment
–
289
289
–
0% 0%
Interest earned - external investments
34 283 108
34 812
36 036
19 347 805
-80% -86%
Interest earned - Bank
1 572 615
1 366 655
Interest earned - outstanding debtors
38 495 455
34 090
38 495
57 781 150
41% 33%
Dividends received –
–
0% 0%
Fines –
–
0% 0%
Licences and permits –
–
0% 0%
Agency services –
–
0% 0%
Transfers recognised - operational
598 414 845
633 215
760 205
698 411 943
100% -9%
Other revenue 746 616
1 154
77 985
2 020 782
90% -3759%
Gains on disposal of PPE
–
200
200
–
0% 0%
Enviromental Proctection
–
–
0% 0%
Total Revenue (excluding capital transfers and contributions)
978 979 190
948 222
1 216 743
1 078 059 800
12,04% -12,86%
Variances are calculated by dividing the difference between actual and original/adjustments budget by the actual. This table is aligned to MBRR table A4. T K.2

400
APPENDIX N – CAPITAL PROGRAMME BY PROJECT YEAR
Capital Expenditure of 5 largest projects*
R' 000
Name of Project
Current: Year 18/19 Variance: Current Year
18/19
Original
Budget
Adjustment
Budget
Actual
Expenditure
Original
Variance
(%)
Adjustment
variance (%)
Mhlanga water supply 22,000,000
19,500,000.00
19,675,034.71 89% 101%
Tsomo waste water treatment works 41,913,400
45,407,586.00
38,013,340.84 91% 84%
Cluster 2 water backlog RS2 Phase1 15,000,000
16,234,374.00
14,067,556.96 94% 87%
Cluster 4 water backlogLubisi Bulk Pipeline from
Skhungwini to Ndonga/ lady frere –Material supply 8,000,000
9,500,000.00
4,577,725.49 57% 48%
Cluster 9 water treatment works 75,000,000
121,684,323.0
0
50,689,680.95 68% 42%
* Projects with the highest capital expenditure in Year 0
Name of Project - A Mhlanga water supply
Objective of Project Provide water supply to communities
Delays No delays on project
Future Challenges
Water supply from bulk contract to feed this project will only commencing
September 2019 and completion sept 2020
Anticipated citizen benefits 1445 households will be served once water comes on line in September 2020
Name of Project - B Tsomo waste water treatment works
Objective of Project Provide waste water treatment plant treat sewerage of Tsomo town

401
Capital Expenditure of 5 largest projects*
R' 000
Name of Project
Current: Year 18/19 Variance: Current Year
18/19
Original
Budget
Adjustment
Budget
Actual
Expenditure
Original
Variance
(%)
Adjustment
variance (%)
Delays Contractor performance and appointment of smme
Future Challenges None
Anticipated citizen benefits
4943 households to benefit in long term on completion of future developments
in town currently there are 2250 existing households
Name of Project - C Cluster 2 water backlog RS2 Phase1
Objective of Project
Provide water to Eskiqikini, Dlakavu, Mkhonjana, Eqineni Esigxeni villages
with potable water
Delays
Contractor delays is building of reservoir struggled to get sub-contractor,
struggled with earthworks due to terrain
Future Challenges Possible ESKOM delay, application done
Anticipated citizen benefits 1364 households will benefit on completion of full scope of work
Name of Project - D
Cluster 4 water backlogLubisi Bulk Pipeline from Skhungwini to Ndonga/ lady
frere –Material supply
Objective of Project Provide bulk supply material for the civil contract
Delays manufacture and delivery
Future Challenges None project due completion in July 2019
Anticipated citizen benefits n/a
Name of Project - E Cluster 9 water treatment works
Objective of Project
Provide treated quality water to communities to Cluster 9, tsomo town, Cluster
8 ADM cross border villages

402
Capital Expenditure of 5 largest projects*
R' 000
Name of Project
Current: Year 18/19 Variance: Current Year
18/19
Original
Budget
Adjustment
Budget
Actual
Expenditure
Original
Variance
(%)
Adjustment
variance (%)
Delays Contract performance in terms completing project timeously
Future Challenges Securing additional funds to complete overall project
Anticipated citizen benefits 13013 households on completion of full scope of project
T 5.7.1
APPENDIX L – CONDITIONAL GRANTS: EXCLUDING MIG
Conditional Grants: excluding MIG R' 000
Details
Budget Adjustments Budget
Actual Variance Major conditions applied by donor (continue below
if necessary)
Budget
Adjustments
Budget
Neighbourhood Development Partnership Grant
Public Transport Infrastructure and Systems Grant
Department of Roads & Transport
28 000 000,00 28 000 000,00 16 701 091
Rural Road Asset Management
3 421 000,00 3 421 000,00 1 676 935
Other Specify:
Water Services Operating Grant
- - 68 086 172
Finance Management Grant
1 250 000,00 1 250 000,00 1 250 000
E P W P 4 642 000,00 4 642 000,00 4 548 545
Rural Sustainable Village – 4 126 374,00 4 126 374
Municipal DIS Covid - 19 - 3 516 000,00 1 956 681

403
Regional Bulk Infrastructure
105 329 000,00 105 329 000,00 85 814 261
Total 142 642 000,00 150 284 374,00 184 160 059
* This includes Neighbourhood Development Partnership Grant, Public Transport Infrastructure and Systems Grant and any other grant excluding Municipal Infrastructure Grant (MIG) which is dealt with in the main report, see T 5.8.3. Variances are calculated by dividing the difference between actual and original/adjustments budget by the actual. Obtain a list of grants from national and provincial government.
T L

VOLUME II: ANNUAL FINANCIAL STATEMENT
Chris Hani District Municipality
Annual Financial Statements for the year ended June 30, 2020

Chris Hani District Municipality
Annual Financial Statements for the year ended June 30, 2020
1
General Information Legal form of entity District Municipality
DC 13
Nature of business and principal activities
Mayoral committee
Chris Hani District Municipality is a South African Category C Municipal (District Municipality) as defined by the Municipal Structure Act. (Act no 117 of 1998) The Municipality's operations are governed by: - Municipal Finance Management Act 56 of 2003.
- Municipal Structure Act 117 of 1998.
- Municipal Systems Act 32 of 2000 and various other acts and regulations. Division of Revenue Act 2018-19 The Constitution of South Africa
Executive Mayor Cllr: W. Gela
Cllr: N. September-Caba: Deputy Executive Mayor
Cllr: M.C. Koyo: Speaker
Cllr: M. Papiyana: Former Chief Whip - Resigned April 2020
Cllr: T. Bikwana: Chief Whip: From April 2020
Cllr: N. Goniwe: Portfolio Head - Health & Community Services: From July 2019 - Feb 2020
Cllr: T. Bobo: Portfolio Head - Health & Community Services: From March 2020
Cllr: S. Mbotshane: Portfolio Head - Integrated Planning & Economic Development
Cllr: M. Jack: Portfolio Head - Budget & Treasury
Cllr: N. Matiwane: Portfolio Head - Special Programmes Unit: Resigned in March 2020
Cllr: N. Mgidi: Portfolio Head - Special Programmes Unit: From April 2020
Cllr: S. Nxozi: Portfolio Head - Corporate Services
Cllr: L. Bonga - Tyali: Portfolio Head - Engineering

Chris Hani District Municipality
Annual Financial Statements for the year ended June 30, 2020
2
Councillors
Cllr: M. Desha
Cllr: M. Xhelisilo
Cllr: K. Mjezu
Cllr: S. Tame
Cllr: E.G. Bomela
Cllr: B. Ntsere
Cllr: M. Adonisi
Cllr: N. Mtyobile
Cllr: F.A.N. Hendricks
Cllr: E.L. Gubula
Cllr: S.E. Mvana
Cllr: N.A. Dayisi
Cllr: S. Myataza
Cllr: Z. Qayiya
Cllr: Z.N.E. Ralane
Cllr: S.B. Nxawe
Cllr: N.C. Lali
Cllr: J.Cengani
Cllr: Z.R. Shweni
Cllr: M. Kondile
General Information
Cllr: K. Bizana
Cllr: Z. Deliwe
Cllr: R. Venske Cllr: S. Zangqa
Cllr: N. Koni
Cllr: M. Adonis Cllr: Y. Zicina
Cllr: N. Ndlebe Cllr: Z.N. Njoli
Cllr: N. Nkotha
Grading of local authority Grade 5
Accounting Officer Mr. G. Mashiyi
Chief Finance Officer (CFO) Mr. M. Dyushu
Registered office 15 Bells Road
Queenstown
5320
Bankers First National Bank Limited
Auditors Auditor General South Africa
Index
Page
Accounting Officer's Responsibilities and Approval 4
Statement of Financial Position 5
Statement of Financial Performance 6
Statement of Changes in Net Assets 7
Cash Flow Statement 8

Chris Hani District Municipality
Annual Financial Statements for the year ended June 30, 2020
3
Statement of Comparison of Budget and Actual Amounts 9 - 10
Accounting Policies 11 - 40
Notes to the Annual Financial Statements 41 - 81
COID Compensation for Occupational Injuries and Diseases
DBSA Development Bank of Southern Africa
GRAP Generally Recognised Accounting Practice
HDF Housing Development Fund
IAS International Accounting Standards
IPSAS International Public Sector Accounting Standards
ME's Municipal Entities
MEC Member of the Executive Council
MFMA Municipal Finance Management Act
MIG Municipal Infrastructure Grant (Previously CMIP)

Chris Hani District Municipality
Annual Financial Statements for the year ended June 30, 2020
4

Chris Hani District Municipality
Annual Financial Statements for the year ended June 30, 2020
* See Note 43
5
Statement of Financial Position as at June 30, 2020
2020 2019
Restated* Note(s) R R
Assets
Current Assets
Inventories 8 17,063,194 11,790,363 Receivables from non-exchange transactions 9 36,039,262 31,512,864
VAT receivable 10 1,123,365,490 1,117,697,471
Prepayments 7 315,675 2,383,988
Receivable from exchange transactions 11 315,327,009 238,173,251
Cash and cash equivalents 12
Non-Current Assets Property, plant and equipment 3 4,269,162,543 4,094,019,199
Intangible assets 4 728,301 1,489,707
Investments in controlled entities 5
Non-Current Assets 4,271,390,844 4,097,008,906 Current Assets 1,534,357,688 1,779,477,263
Total Assets 5,805,748,532 5,876,486,169
Liabilities
Current Liabilities
Operating lease liability 6 1,291,772 600,219
Payables from exchange transactions 15 321,473,113 314,621,491
VAT payable 1,065,376,241 1,040,477,128
Consumer deposits 14 507,696 441,108
Employee benefit obligation 13 4,174,994 5,294,974
Unspent conditional grants and receipts 16
Non-Current Liabilities Employee benefit obligation 13 63,435,951 65,893,340
Non-Current Liabilities 63,435,951 65,893,340
42,247,058 377,919,326
1,534,357,688 1,779,477,263
1,500,000 1,500,000
4,271,390,844 4,097,008,906
78,635,298 300,501,657
1,471,459,114 1,661,936,577

Chris Hani District Municipality
Annual Financial Statements for the year ended June 30, 2020
* See Note 43
6
Current Liabilities 1,471,459,114 1,661,936,577
Total Liabilities 1,534,895,065 1,727,829,917
Assets 5,805,748,532 5,876,486,169 Liabilities (1,534,895,065) (1,727,829,917)
Net Assets 4,270,853,467 4,148,656,252
Accumulated surplus 17 4,270,853,467 4,148,656,252
Statement of Financial Performance
2020 2019 Restated*
Note(s) R R
Revenue
Revenue from exchange transactions
Service charges 19 300,505,479 305,466,551
Other income 20 2,020,782 746,616
Interest income 21 78,495,610 74,351,178 Total revenue from exchange transactions 381,021,871 380,564,345
Revenue from non-exchange transactions
Transfer revenue
Government grants & subsidies 22 1,042,665,648 916,690,873
381,021,871 380,564,345 1,042,665,648 916,690,873
Total revenue 18 1,423,687,519 1,297,255,218
Expenditure
Employee related costs 23 (350,919,627) (342,135,085)
Remuneration of councillors 24 (12,225,799) (11,665,226)
Depreciation and amortisation 25 (157,838,022) (152,139,918)
Impairment loss/ Reversal of impairments (73,768) -
Finance costs 26 (88,047) (266,610)
Debt Impairment 27 (278,891,121) (173,390,698)
Bulk purchases 28 (16,046,762) (19,156,293)

Chris Hani District Municipality
Annual Financial Statements for the year ended June 30, 2020
* See Note 43
7
134,154,713 134,154,713
4,122,092,986 4,122,092,986
Contracted services 29 (168,379,720) (233,171,306)
Transfers and Subsidies 30 (123,139,041) (44,716,236)
General Expenses 31
Total expenditure
- - Total revenue 1,423,687,519 1,297,255,218
Total expenditure (1,259,354,620) (1,182,599,247)
Operating surplus 164,332,899 114,655,971
Loss on disposal of assets and liabilities (312,667) (155,654)
Actuarial gains / losses 13 8,986,709 (1,632,651) 8,674,042 (1,788,305)
Operating surplus/deficit 8,674,042 (1,788,305) Surplus before taxation 173,006,941 112,867,666
Taxation - -
Surplus for the year 173,006,941 112,867,666
Statement of Changes in Net Assets
Accumulated Total net surplus assets
R R
Balance at 01 July 2018 Restated**
Changes in net assets
3,987,938,273 3,987,938,273
Prior period error 21,287,047 21,287,047 Net income (losses) recognised directly in net assets 21,287,047 21,287,047
Surplus for the year 112,867,666 112,867,666
Total recognised income and expenses for the year 134,154,713 134,154,713
Total changes
Opening balance as previously reported
Adjustments
Prior year adjustments
Restated* Balance at July 1, 2019 as restated*
Changes in net assets Prior year adjustment (50,809,926) (50,809,926) Total prior year adjustment (50,809,926) (50,809,926) Surplus for the year 173,006,941 173,006,941 Total changes
(151,752,713) (205,957,875)
(1,259,354,620) (1,182,599,247)
26,563,266 26,563,266
4,148,656,252 4,148,656,252
173,006,941 173,006,941
4,270,853,467 4,270,853,467

Chris Hani District Municipality
Annual Financial Statements for the year ended June 30, 2020
* See Note 43
8
Balance at June 30, 2020
Note(s)

Chris Hani District Municipality
Annual Financial Statements for the year ended June 30, 2020
* See Note 43
9
Cash Flow Statement
2020 2019 Restated*
Note(s) R R
Cash flows from operating activities
Receipts
Sale of goods and services 299,926,662 172,350,742 Grants 820,799,289 1,102,943,514
Interest income 20,714,310 35,855,723 1,141,440,261 1,311,149,979
Payments Employee costs (357,736,086) (350,904,575)
Suppliers (456,981,104) (325,356,774)
Finance cost (88,047) (266,610) (814,805,237) (676,527,959)
Total receipts 1,141,440,261 1,311,149,979 Total payments (814,805,237) (676,527,959)
Net cash flows from operating activities 33 326,635,024 634,622,020
Cash flows from investing activities
Purchase of property, plant and equipment 3
(332,634,146) (329,066,175) Prior year other movements 3 (268,990,410) (188,652,217)
Proceeds from sale assets 4 423,348 -
Net cash flows from investing activities (601,201,208) (517,718,392)
Cash flows from financing activities
Movement in other financial liabilities (61,780,186) -
Net increase/(decrease) in cash and cash equivalents (335,672,268) 117,073,434
Cash and cash equivalents at the beginning of the year 377,919,326 260,845,892 Cash and cash equivalents at the end of the year 12 42,247,058 377,919,326

Chris Hani District Municipality
Annual Financial Statements for the year ended June 30, 2020
10
Statement of Comparison of Budget and Actual Amounts Budget on Cash Basis
Approved budget Adjustments Final Budget Actual amounts
Difference on comparable between
final basis budget and
actual
Reference
R R R R R
Statement of Financial Performance
Revenue
Revenue from exchange
transactions
Service charges 244,461,000 59,071,000 303,532,000 300,505,479 (3,026,521) Note47 (1)
Other income 1,443,856 76,830,921 78,274,777 2,020,782 (76,253,995) Note 47 (2)
Interest income 68,902,000 5,629,754 74,531,754 78,495,610 3,963,856 Note 47 (3)
Gains on disposal of assets 200,000,000 - 200,000,000 - (200,000,000)

Chris Hani District Municipality
Annual Financial Statements for the year ended June 30, 2020
Accounting Policies
11
Total revenue from exchange
transactions
Revenue from non-exchange
transactions
Transfer revenue
Government grants & subsidies
'Total revenue from exchange
transactions'
'Total revenue from nonexchange
transactions' Total revenue
Expenditure
Employee Related Costs
Remuneration of councillors
Depreciation and amortisation
Debt Impairment
Finance costs
Bulk purchases
Contracted services
Transfer and Subsidies General
Expenses
Total expenditure
Operating surplus
Loss on disposal of assets and
liabilities
Actuarial gain
Surplus before taxation
Deficit before taxation
Taxation
Statement of
Comparison of
Budget and Actual
Amounts Budget on Cash Basis
Approved budget
Adjustments Final Budget Actual amounts
Difference on comparable between
final basis budget and
actual
Reference
R R R R R
514,806,856 141,531,675 656,338,531 381,021,871 (275,316,660)
1,057,826,000 83,335,347 1,141,161,347 1,042,665,648 (98,495,699) Note 47 (4)
514,806,856 141,531,675 656,338,531 381,021,871 (275,316,660)
1,057,826,000 83,335,347 1,141,161,347 1,042,665,648 (98,495,699)
1,572,632,856 224,867,022 1,797,499,878 1,423,687,519 (373,812,359)
(337,874,359) 19,267,612 (318,606,747) (350,919,627) (32,312,880) Note 47 (1)
(13,902,286) 3,793,836 (10,108,450) (12,225,799) (2,117,349) Note 47 (2)
(140,000,000) (15,000,000) (155,000,000) (157,806,203) (2,806,203) Note 47 (3)
(200,000,000) 70,265,000 (129,735,000) (278,891,121) (149,156,121) Note 47 (9)
40,000 - 40,000 (88,047) (128,047) Note 47 (4)
(26,138,516) 10,333,000 (15,805,516) (16,046,762) (241,246) Note 47 (5)
(405,548,948) 55,858,847 (349,690,101) (168,379,720) 181,310,381 Note 47 (6)
31,638,081 - 31,638,081 (123,139,041) (154,777,122) Note 47 (7)
202,287,257 (67,702,621) 134,584,636 (151,752,713) (286,337,349) Note 47 (8)
(889,498,771) 76,815,674 (812,683,097)(1,259,249,033) (446,565,936)
1,572,632,856 224,867,022 1,797,499,878 1,423,687,519 (373,812,359)
(889,498,771) 76,815,674 (812,683,097)(1,259,249,033) (446,565,936)
683,134,085 301,682,696 984,816,781 164,438,486 (820,378,295)
- - - (312,667) (312,667) Note 47
- - - 8,986,709 8,986,709
- - - 8,674,042
683,134,085 301,682,696 984,816,781
164,438,486
- - - 8,674,042 8,674,042
683,134,085 301,682,696 984,816,781 173,112,528 (811,704,253)
683,134,085 301,682,696 984,816,781 173,112,528 (811,704,253)
- - - - -

Chris Hani District Municipality
Annual Financial Statements for the year ended June 30, 2020
Accounting Policies
12
Actual Amount on Comparable Basis as Presented in the Budget and Actual Comparative Statement
683,134,085 301,682,696 984,816,781 173,112,528 (811,704,253)

Chris Hani District Municipality
Annual Financial Statements for the year ended June 30, 2020
Accounting Policies
13
1. Presentation of Annual Financial Statements
The annual financial statements have been prepared in accordance with the Standards of Generally Recognised Accounting
Practice (GRAP), issued by the Accounting Standards Board in accordance with Section 122(3) of the Municipal Finance
Management Act (Act 56 of 2003).
These annual financial statements have been prepared on an accrual basis of accounting and are in accordance with historical
cost convention as the basis of measurement, unless specified otherwise. They are presented in South African Rand.
In the absence of an issued and effective Standard of GRAP, accounting policies for material transactions, events or conditions
were developed in accordance with paragraphs 8, 10 and 11 of GRAP 3 as read with Directive 5.
Assets, liabilities, revenues and expenses were not offset, except where offsetting is either required or permitted by a Standard
of GRAP.
A summary of the significant accounting policies, which have been consistently applied in the preparation of these annual
financial statements, are disclosed below. 1.1 Presentation currency
These annual financial statements are presented in South African Rand, which is the functional currency of the municipality.
All figures have been rounded off to the nearest rand.
1.2 Going concern assumption
These annual financial statements have been prepared based on the expectation that the municipality will continue to operate
as a going concern for at least the next 12 months.
1.3 Comparative figures
Where necessary, comparative figures have been reclassified to conform to changes in presentation in the current year.
Where material accounting errors, which relate to prior periods, have been identified in the current year, the correction is made
retrospectively as far as is practicable and the prior year comparatives are restated accordingly. Where there has been a
change in accounting policy in the current year, the adjustment is made retrospectively as far as is practicable and the prior
year comparatives are restated accordingly.
1.4 Significant judgements and sources of estimation uncertainty
In preparing the annual financial statements, management is required to make estimates and assumptions that affect the
amounts represented in the annual financial statements and related disclosures. Use of available information and the
application of judgement is inherent in the formation of estimates. Actual results in the future could differ from these estimates
which may be material to the annual financial statements. Significant judgements include:
Trade receivables / Held to maturity investments and/or loans and receivables
The municipality assesses its trade receivables, held to maturity investments and loans and receivables for impairment at the
end of each reporting period. In determining whether an impairment loss should be recorded in surplus or deficit, the
management makes judgements as to whether there is observable data indicating a measurable decrease in the estimated
future cash flows from a financial asset.
The impairment for trade receivables, held to maturity investments and loans and receivables is calculated on a portfolio basis,
based on historical loss ratios, adjusted for national and industry-specific economic conditions and other indicators present at
the reporting date that correlate with defaults on the portfolio. These annual loss ratios are applied to loan balances in the
portfolio and scaled to the estimated loss emergence period.
Allowance for slow moving, damaged and obsolete stock
An allowance for stock to write stock down to the lower of cost or net realisable value. Management have made estimates of the
selling price and direct cost to sell on certain inventory items. The write down is included in the operation surplus note.

Chris Hani District Municipality
Annual Financial Statements for the year ended June 30, 2020
Accounting Policies
14
1.4 Significant judgements and sources of estimation uncertainty (continued)
Fair value estimation
The fair value of financial instruments traded in active markets (such as trading and available-for-sale securities) is based on
quoted market prices at the end of the reporting period. The quoted market price used for financial assets held by the
municipality is the current bid price.
The fair value of financial instruments that are not traded in an active market (for example, over-the counter derivatives) is
determined by using valuation techniques. The municipality uses a variety of methods and makes assumptions that are based
on market conditions existing at the end of each reporting period. Quoted market prices or dealer quotes for similar instruments
are used for long-term debt. Other techniques, such as estimated discounted cash flows, are used to determine fair value for the
remaining financial instruments. The fair value of interest rate swaps is calculated as the present value of the estimated future
cash flows. The fair value of forward foreign exchange contracts is determined using quoted forward exchange rates at the end
of the reporting period.
The carrying value less impairment provision of trade receivables and payables are assumed to approximate their fair values.
The fair value of financial liabilities for disclosure purposes is estimated by discounting the future contractual cash flows at the
current market interest rate that is available to the municipality for similar financial instruments.
Impairment testing
The recoverable amounts of cash-generating units and individual assets have been determined based on the higher of valuein-
use calculations and fair values less costs to sell. These calculations require the use of estimates and assumptions. It is
reasonably possible that the assumptions may change which may then impact our estimations and may then require a material
adjustment to the carrying value of property, plant and equipment and tangible assets.
The municipality reviews and tests the carrying value of assets when events or changes in circumstances suggest that the
carrying amount may not be recoverable. In addition, asset is tested on an annual basis for impairment. Assets are grouped at
the lowest level for which identifiable cash flows are largely independent of cash flows of other assets and liabilities. If there are
indications that impairment may have occurred, estimates are prepared of expected future cash flows for each group of assets.
Expected future cash flows used to determine the value in use of property, plant and equipment and tangible assets are
inherently uncertain and could materially change over time.
Provisions
Provisions were raised and management determined an estimate based on the information available. Additional disclosures of
these estimates of provisions are included under the note - Provisions.
Useful lives of waste and water network and other assets
The municipality's management determines the estimated useful lives and related depreciation charges for the waste water and
water networks. This estimate is based on industry norm. Management will increase the depreciation charge where useful lives
are less than previously estimated useful lives.
Post retirement benefits
The present value of the post retirement obligation depends on a number of factors that are determined on an actuarial basis
using a number of assumptions. The assumptions used in determining the net cost (income) include the discount rate. Any
changes in these assumptions will impact on the carrying amount of post retirement obligations.
The municipality determines the appropriate discount rate at the end of each year. This is the interest rate that should be used
to determine the present value of estimated future cash outflows expected to be required to settle the pension obligations. In
determining the appropriate discount rate, the municipality considers the interest rates of high-quality corporate bonds that are
denominated in the currency in which the benefits will be paid, and that have terms to maturity approximating the terms of the
related pension liability.
Other key assumptions for pension obligations are based on current market conditions. Additional information is disclosed in
Note 13.
Effective interest rate

Chris Hani District Municipality
Annual Financial Statements for the year ended June 30, 2020
Accounting Policies
15
The municipality used the prime interest rate to discount future cash flows.
1.4 Significant judgements and sources of estimation uncertainty (continued)
Allowance for doubtful debts
On debtors an impairment loss is recognised in surplus and deficit when there is objective evidence that it is impaired. The
impairment is measured as the difference between the debtors carrying amount and the present value of estimated future cash
flows discounted at the effective interest rate, computed at initial recognition.
1.5 Property, plant and equipment
Property, plant and equipment are tangible non-current assets (including infrastructure assets) that are held for use in the
production or supply of goods or services, rental to others, or for administrative purposes, and are expected to be used during
more than one period.
The cost of an item of property, plant and equipment is recognised as an asset when:
it is probable that future economic benefits or service potential associated with the item will flow to the municipality;
and
the cost of the item can be measured reliably.
Initial Recognition and measurement
Property, plant and equipment is initially measured at cost.
The cost of an item of property, plant and equipment is the purchase price and other costs attributable to bring the asset to the
location and condition necessary for it to be capable of operating in the manner intended by management. Trade discounts and
rebates are deducted in arriving at the cost.
Where an asset is acquired through a non-exchange transaction, its cost is its fair value as at date of acquisition.
Where an item of property, plant and equipment is acquired in exchange for a non-monetary asset or monetary assets, or a
combination of monetary and non-monetary assets, the asset acquired is initially measured at fair value (the cost). If the
acquired item's fair value was not determinable, it's deemed cost is the carrying amount of the asset(s) given up.
When significant components of an item of property, plant and equipment have different useful lives, they are accounted for as
separate items (major components) of property, plant and equipment.
Costs include costs incurred initially to acquire or construct an item of property, plant and equipment and costs incurred
subsequently to add to, replace part of, or service it. If a replacement cost is recognised in the carrying amount of an item of
property, plant and equipment, the carrying amount of the replaced part is derecognised.
The initial estimate of the costs of dismantling and removing the item and restoring the site on which it is located is also included
in the cost of property, plant and equipment, where the entity is obligated to incur such expenditure, and where the obligation
arises as a result of acquiring the asset or using it for purposes other than the production of inventories.
Recognition of costs in the carrying amount of an item of property, plant and equipment ceases when the item is in the location
and condition necessary for it to be capable of operating in the manner intended by management.
Items such as spare parts, standby equipment and servicing equipment are recognised when they meet the definition of
property, plant and equipment.
Major inspection costs which are a condition of continuing use of an item of property, plant and equipment and which meet the
recognition criteria above are included as a replacement in the cost of the item of property, plant and equipment. Any remaining
inspection costs from the previous inspection are derecognised.
Subsequent measurement - Cost model
Property, plant and equipment is subsequently carried at cost less accumulated depreciation and any impairment losses.
Depreciation

Chris Hani District Municipality
Annual Financial Statements for the year ended June 30, 2020
Accounting Policies
16
Property, plant and equipment are depreciated on the straight line basis over their expected useful lives to their estimated
residual value.
1.5 Property, plant and equipment (continued)
The useful lives of items of property, plant and equipment have been assessed as follows:
Infinity
Buildings 5 - 100 years Plant and machinery 2 - 17 years Furniture and fixtures 3 - 18 years Transport assets 4 - 20 years Office equipment 3 - 18 years IT equipment Infrastructure - Water
3 - 13 years
Roads and Paving 3 - 100 years Security measures 7 - 25 years Sewerage 7 - 100 years Water infrastructure Infrastructure - Sanitation
5 - 100 years
Community facilities 5 - 30 years Recreational facilities 10 - 30 years Emergency equipment 3 - 10 years WIP - Sanitation 5 - 15 years The residual value, and the useful life and depreciation method of each asset are reviewed at the end of each reporting date. If
the expectations differ from previous estimates, the change is accounted for as a change in accounting estimate.
Reviewing the useful life of an asset on an annual basis does not require the entity to amend the previous estimate unless
expectations differ from the previous estimate.
Each part of an item of property, plant and equipment with a cost that is significant in relation to the total cost of the item is
depreciated separately.
The depreciation charge for each period is recognised in surplus or deficit unless it is included in the carrying amount of another
asset.
Derecognition
Items of property, plant and equipment are derecognised when the asset is disposed of or when there are no further economic
benefits or service potential expected from the use of the asset.
The gain or loss arising from the derecognition of an item of property, plant and equipment is included in surplus or deficit when
the item is derecognised. The gain or loss arising from the derecognition of an item of property, plant and equipment is
determined as the difference between the net disposal proceeds, if any, and the carrying amount of the item.
Assets which the municipality holds for rentals to others and subsequently routinely sell as part of the ordinary course of
activities, are transferred to inventories when the rentals end and the assets are available-for-sale. Proceeds from sales of these
assets are recognised as revenue. All cash flows on these assets are included in cash flows from operating activities in the
comparatives.
Repairs and Maintenance
The municipality discloses expenditure to repair and maintain property, plant and equipment under contracted services in the
notes to the financial statements.
The municipality discloses relevant information relating to assets under construction or development, in the notes to the financial
statements.
1.6 Intangible assets
Item Depreciation method Average useful life
Land

Chris Hani District Municipality
Annual Financial Statements for the year ended June 30, 2020
Accounting Policies
17
An intangible asset is an identifiable non-monetary asset without physical substance.
An asset is identifiable if it either:
is separable, i.e. is capable of being separated or divided from an entity and sold, transferred, licensed, rented or
exchanged, either individually or together with a related contract, identifiable assets or liability, regardless of whether
the entity intends to do so; or
arises from binding arrangements (including rights from contracts), regardless of whether those rights are
transferable or separable from the municipality or from other rights and obligations.
A binding arrangement describes an arrangement that confers similar rights and obligations on the parties to it as if it were in
the form of a contract.
An intangible asset is recognised when:
it is probable that the expected future economic benefits or service potential that are attributable to the asset will flow
to the municipality; and
the cost or fair value of the asset can be measured reliably.
The municipality assesses the probability of expected future economic benefits or service potential using reasonable and
supportable assumptions that represent management’s best estimate of the set of economic conditions that will exist over the
useful life of the asset.
Initial Recognition
Intangible assets are initially recognised at cost.
Where an intangible asset is acquired through a non-exchange transaction, its initial cost at the date of acquisition is measured
at its fair value as at that date.
Expenditure on research (or on the research phase of an internal project) is recognised as an expense when it is incurred.
An intangible asset arising from development (or from the development phase of an internal project) is recognised when:
it is technically feasible to complete the asset so that it will be available for use or sale.
there is an intention to complete and use or sell it.
there is an ability to use or sell it.
it will generate probable future economic benefits or service potential.
there are available technical, financial and other resources to complete the development and to use or sell the asset.
the expenditure attributable to the asset during its development can be measured reliably. Subsequent
Measurement
Intangible assets are subsequently carried at cost less any accumulated amortisation and any impairment losses.
An intangible asset is regarded as having an indefinite useful life when, based on all relevant factors, there is no foreseeable
limit to the period over which the asset is expected to generate net cash inflows or service potential. Amortisation is not provided
for these intangible assets, but they are tested for impairment annually and whenever there is an indication that the asset may
be impaired. For all other intangible assets amortisation is provided on a straight line basis over their useful life.
The amortisation period and the amortisation method for intangible assets are reviewed at each reporting date.
Reassessing the useful life of an intangible asset with a finite useful life after it was classified as indefinite is an indicator that the
asset may be impaired. As a result the asset is tested for impairment and the remaining carrying amount is amortised over its
useful life.
Internally generated brands, mastheads, publishing titles, customer lists and items similar in substance are not recognised as
intangible assets.
Internally generated goodwill is not recognised as an intangible asset.

Chris Hani District Municipality
Annual Financial Statements for the year ended June 30, 2020
Accounting Policies
18
1.6 Intangible assets (continued)
Amortisation and Impairment
Amortisation is provided to write down the intangible assets, on a straight line basis, to their residual values as follows:
Item Useful life
Licenses and Franchises 2-5 years Computer software, other 2-5 years Derecognition
Intangible assets are derecognised:
on disposal; or
when no future economic benefits or service potential are expected from its use or disposal.
The gain or loss arising from the derecognition of an intangible assets is included in surplus or deficit when the asset is
derecognised (unless the Standard of GRAP on leases requires otherwise on a sale and leaseback). 1.7
Investments in associates
In the municipality's separate financial statements, investments in non-current investments are carried at cost.
The municipality applies the same accounting for each category of investment.
The municipality recognises a dividend or similar distribution in surplus or deficit in its separate annual financial statements
when its right to receive the dividend or similar distribution is established.
Investments in controlled entities that are accounted for in accordance with the accounting policy on Financial instruments in the
consolidated financial statements, are accounted for in the same way in the controlling entity's separate financial statements.
1.8 Financial instruments
A financial instrument is any contract that gives rise to a financial asset of one entity and a financial liability or a residual interest
of another entity.
The amortised cost of a financial asset or financial liability is the amount at which the financial asset or financial liability is
measured at initial recognition minus principal repayments, plus or minus the cumulative amortisation using the effective interest
method of any difference between that initial amount and the maturity amount, and minus any reduction (directly or through the
use of an allowance account) for impairment or uncollectibility.
A concessionary loan is a loan granted to or received by an entity on terms that are not market related.
Credit risk is the risk that one party to a financial instrument will cause a financial loss for the other party by failing to discharge
an obligation.
Currency risk is the risk that the fair value or future cash flows of a financial instrument will fluctuate because of changes in
foreign exchange rates.
Derecognition is the removal of a previously recognised financial asset or financial liability from an entity’s statement of financial
position.
A derivative is a financial instrument or other contract with all three of the following characteristics:
Its value changes in response to the change in a specified interest rate, financial instrument price, commodity price,
foreign exchange rate, index of prices or rates, credit rating or credit index, or other variable, provided in the case
of a non-financial variable that the variable is not specific to a party to the contract (sometimes called the
‘underlying’).
It requires no initial net investment or an initial net investment that is smaller than would be required for other types
of contracts that would be expected to have a similar response to changes in market factors. It is settled at a
future date.

Chris Hani District Municipality
Annual Financial Statements for the year ended June 30, 2020
Accounting Policies
1.8 Financial instruments (continued)
19
The effective interest method is a method of calculating the amortised cost of a financial asset or a financial liability (or group of
financial assets or financial liabilities) and of allocating the interest income or interest expense over the relevant period. The
effective interest rate is the rate that exactly discounts estimated future cash payments or receipts through the expected life of
the financial instrument or, when appropriate, a shorter period to the net carrying amount of the financial asset or financial
liability. When calculating the effective interest rate, an entity shall estimate cash flows considering all contractual terms of the
financial instrument but shall not consider future credit losses. The calculation includes all fees and points paid or received
between parties to the contract that are an integral part of the effective interest rate (see the Standard of GRAP on Revenue
from Exchange Transactions), transaction costs, and all other premiums or discounts. There is a presumption that the cash
flows and the expected life of a group of similar financial instruments can be estimated reliably. However, in those rare cases
when it is not possible to reliably estimate the cash flows or the expected life of a financial instrument (or group of financial
instruments), the entity shall use the contractual cash flows over the full contractual term of the financial instrument (or group of
financial instruments).
Fair value is the amount for which an asset could be exchanged, or a liability settled, between knowledgeable willing parties in
an arm’s length transaction.
A financial asset is:
cash;
a residual interest of another entity; or
a contractual right to:
- receive cash or another financial asset from another entity; or
- exchange financial assets or financial liabilities with another entity under conditions that are potentially
favourable to the entity.
A financial guarantee contract is a contract that requires the issuer to make specified payments to reimburse the holder for a
loss it incurs because a specified debtor fails to make payment when due in accordance with the original or modified terms of a
debt instrument.
A financial liability is any liability that is a contractual obligation to:
deliver cash or another financial asset to another entity; or
exchange financial assets or financial liabilities under conditions that are potentially unfavourable to the entity.
Interest rate risk is the risk that the fair value or future cash flows of a financial instrument will fluctuate because of changes in
market interest rates.
Liquidity risk is the risk encountered by a entity in the event of difficulty in meeting obligations associated with financial liabilities
that are settled by delivering cash or another financial asset.
Loan commitment is a firm commitment to provide credit under pre-specified terms and conditions.
Loans payable are financial liabilities, other than short-term payables on normal credit terms.
Market risk is the risk that the fair value or future cash flows of a financial instrument will fluctuate because of changes in market
prices. Market risk comprises three types of risk: currency risk, interest rate risk and other price risk.
Other price risk is the risk that the fair value or future cash flows of a financial instrument will fluctuate because of changes in
market prices (other than those arising from interest rate risk or currency risk), whether those changes are caused by factors
specific to the individual financial instrument or its issuer, or factors affecting all similar financial instruments traded in the
market.
A financial asset is past due when a counterparty has failed to make a payment when contractually due.
A residual interest is any contract that manifests an interest in the assets of a entity after deducting all of its liabilities. A residual
interest includes contributions from owners, which may be shown as:
equity instruments or similar forms of unitised capital;
a formal designation of a transfer of resources (or a class of such transfers) by the parties to the transaction as
forming part of a entity’s net assets, either before the contribution occurs or at the time of the contribution; or

Chris Hani District Municipality
Annual Financial Statements for the year ended June 30, 2020
Accounting Policies
1.8 Financial instruments (continued)
20
a formal agreement, in relation to the contribution, establishing or increasing an existing financial interest in the net
assets of a entity.
Transaction costs are incremental costs that are directly attributable to the acquisition, issue or disposal of a financial asset or
financial liability. An incremental cost is one that would not have been incurred if the entity had not acquired, issued or disposed
of the financial instrument.
Financial instruments at amortised cost are non-derivative financial assets or non-derivative financial liabilities that have fixed
or determinable payments, excluding those instruments that: the entity designates at fair value at initial recognition; or
are held for trading.
Financial instruments at cost are investments in residual interests that do not have a quoted market price in an active market,
and whose fair value cannot be reliably measured.
Financial instruments at fair value comprise financial assets or financial liabilities that are:
derivatives;
combined instruments that are designated at fair value;
instruments held for trading. A financial instrument is held for trading if:
- it is acquired or incurred principally for the purpose of selling or repurchasing it in the near-term; or
- on initial recognition it is part of a portfolio of identified financial instruments that are managed together and for
which there is evidence of a recent actual pattern of short term profit-taking;
- non-derivative financial assets or financial liabilities with fixed or determinable payments that are designated at
fair value at initial recognition; and
- financial instruments that do not meet the definition of financial instruments at amortised cost or financial
instruments at cost.
Classification
The entity has the following types of financial assets (classes and category) as reflected on the face of the statement of financial
position or in the notes thereto: `
Class Category
Receivables from exchange transactions Financial asset measured at amortised cost Receivables from non-exchange transactions Financial asset measured at amortised cost Investments Financial asset measured at fair value Cash and Cash Equivalents Financial asset measured at fair value The entity has the following types of financial liabilities (classes and category) as reflected on the face of the statement of
financial position or in the notes thereto: `
Class Category
Loan3 Financial liability measured at amortised cost Other receivables1 Financial liability measured at amortised cost Other receivables2 Financial liability measured at amortised cost Other financial liability1 Financial liability measured at fair value Initial recognition
The entity recognises a financial asset or a financial liability in its statement of financial position when the entity becomes a party
to the contractual provisions of the instrument.
The entity recognises financial assets using trade date accounting.
Upon initial recognition the entity classifies financial instruments or their component parts as financial liabilities, financial assets
or residual interests in conformity with the substance of the contractual arrangement and to the extent that the instrument
satisfies the definitions of a financial liability, a financial asset or a residual interest.
Initial measurement of financial assets and financial liabilities

Chris Hani District Municipality
Annual Financial Statements for the year ended June 30, 2020
Accounting Policies
1.8 Financial instruments (continued)
21
The entity measures a financial asset and financial liability initially at its fair value plus transaction costs that are directly
attributable to the acquisition or issue of the financial asset or financial liability.

Chris Hani District Municipality
Annual Financial Statements for the year ended June 30, 2020
Accounting Policies
1.8 Financial instruments (continued)
22
Subsequent measurement of financial assets and financial liabilities
The entity measures all financial assets and financial liabilities after initial recognition using the following categories:
Financial instruments at fair value.
Financial instruments at amortised cost
All financial assets measured at amortised cost, or cost, are subject to an impairment review.
Fair value measurement considerations
The best evidence of fair value is quoted prices in an active market. If the market for a financial instrument is not active, the
entity establishes fair value by using a valuation technique. The objective of using a valuation technique is to establish what the
transaction price would have been on the measurement date in an arm’s length exchange motivated by normal operating
considerations. Valuation techniques include using recent arm’s length market transactions between knowledgeable, willing
parties, if available, reference to the current fair value of another instrument that is substantially the same, discounted cash flow
analysis and option pricing models. If there is a valuation technique commonly used by market participants to price the
instrument and that technique has been demonstrated to provide reliable estimates of prices obtained in actual market
transactions, the entity uses that technique. The chosen valuation technique makes maximum use of market inputs and relies
as little as possible on entity-specific inputs. It incorporates all factors that market participants would consider in setting a price
and is consistent with accepted economic methodologies for pricing financial instruments. Periodically, a municipality calibrates
the valuation technique and tests it for validity using prices from any observable current market transactions in the same
instrument (i.e. without modification or repackaging) or based on any available observable market data.
The fair value of a financial liability with a demand feature (e.g. a demand deposit) is not less than the amount payable on
demand, discounted from the first date that the amount could be required to be paid.
Reclassification
The entity does not reclassify a financial instrument while it is issued or held unless it is:
combined instrument that is required to be measured at fair value; or
an investment in a residual interest that meets the requirements for reclassification.
Gains and losses
A gain or loss arising from a change in the fair value of a financial asset or financial liability measured at fair value is recognised
in surplus or deficit.
For financial assets and financial liabilities measured at amortised cost or cost, a gain or loss is recognised in surplus or deficit
when the financial asset or financial liability is derecognised or impaired, or through the amortisation process.
Impairment and uncollectibility of financial assets
The entity assesses at the end of each reporting period whether there is any objective evidence that a financial asset or group
of financial assets is impaired.
Financial assets measured at amortised cost:
If there is objective evidence that an impairment loss on financial assets measured at amortised cost has been incurred, the
amount of the loss is measured as the difference between the asset’s carrying amount and the present value of estimated future
cash flows (excluding future credit losses that have not been incurred) discounted at the financial asset’s origina l effective
interest rate. The carrying amount of the asset is reduced directly OR through the use of an allowance account. The amount of
the loss is recognised in surplus or deficit.
If, in a subsequent period, the amount of the impairment loss decreases and the decrease can be related objectively to an event
occurring after the impairment was recognised, the previously recognised impairment loss is reversed directly OR by adjusting
an allowance account. The reversal does not result in a carrying amount of the financial asset that exceeds what the amortised
cost would have been had the impairment not been recognised at the date the impairment is reversed. The amount of the
reversal is recognised in surplus or deficit.

Chris Hani District Municipality
Annual Financial Statements for the year ended June 30, 2020
Accounting Policies
1.8 Financial instruments (continued)
23
Financial assets measured at cost:
If there is objective evidence that an impairment loss has been incurred on an investment in a residual interest that is not
measured at fair value because its fair value cannot be measured reliably, the amount of the impairment loss is measured as
the difference between the carrying amount of the financial asset and the present value of estimated future cash flows
discounted at the current market rate of return for a similar financial asset. Such impairment losses are not reversed.
Derecognition
Financial assets
The entity derecognises financial assets using trade date accounting.
The entity derecognises a financial asset only when:
the contractual rights to the cash flows from the financial asset expire, are settled or waived;
the entity transfers to another party substantially all of the risks and rewards of ownership of the financial asset; or
the entity, despite having retained some significant risks and rewards of ownership of the financial asset, has
transferred control of the asset to another party and the other party has the practical ability to sell the asset in its
entirety to an unrelated third party, and is able to exercise that ability unilaterally and without needing to impose
additional restrictions on the transfer. In this case, the entity :
- derecognise the asset; and
- recognise separately any rights and obligations created or retained in the transfer.
If, as a result of a transfer, a financial asset is derecognised in its entirety but the transfer results in the entity obtaining a new
financial asset or assuming a new financial liability, or a servicing liability, the entity recognise the new financial asset, financial
liability or servicing liability at fair value.
On derecognition of a financial asset in its entirety, the difference between the carrying amount and the sum of the consideration
received is recognised in surplus or deficit.
Financial liabilities
The entity removes a financial liability (or a part of a financial liability) from its statement of financial position when it is
extinguished — i.e. when the obligation specified in the contract is discharged, cancelled, expires or waived.
The difference between the carrying amount of a financial liability (or part of a financial liability) extinguished or transferred to
another party and the consideration paid, including any non-cash assets transferred or liabilities assumed, is recognised in
surplus or deficit. Any liabilities that are waived, forgiven or assumed by another entity by way of a non-exchange transaction
are accounted for in accordance with the Standard of GRAP on Revenue from Non-exchange Transactions (Taxes and
Transfers).
Presentation
Interest relating to a financial instrument or a component that is a financial liability is recognised as revenue or expense in
surplus or deficit.
Dividends or similar distributions relating to a financial instrument or a component that is a financial liability is recognised as
revenue or expense in surplus or deficit.
Losses and gains relating to a financial instrument or a component that is a financial liability is recognised as revenue or
expense in surplus or deficit.
Distributions to holders of residual interests are recognised by the entity directly in net assets. Transaction costs incurred on
residual interests are accounted for as a deduction from net assets. Income tax [where applicable] relating to distributions to
holders of residual interests and to transaction costs incurred on residual interests are accounted for in accordance with the
International Accounting Standard on Income Taxes.

Chris Hani District Municipality
Annual Financial Statements for the year ended June 30, 2020
Accounting Policies
1.8 Financial instruments (continued)
24
A financial asset and a financial liability are only offset and the net amount presented in the statement of financial position when
the entity currently has a legally enforceable right to set off the recognised amounts and intends either to settle on a net basis,
or to realise the asset and settle the liability simultaneously.
In accounting for a transfer of a financial asset that does not qualify for derecognition, the entity does not offset the transferred
asset and the associated liability.
Policies relating to specific financial instruments
Trade and other receivables
Trade and other receivables are classified as loans and receivables and are measured at initial recognition at fair value and are
subsequently measured at amortised cost using the effective interest rate method.
All trade and other receivables are assessed at least annually for possible impairment. Impairment adjustments are made
through the use of an allowance account. An estimate is made for doubtful receivables based on a review of all outstanding
amounts at year-end.
Bad debts are written off in the year in which they are identified as irrecoverable. Amounts receivable within 12 months from
reporting date and are classified as current. Interest is charged on overdue accounts.
Trade and other payables
Trade and other payables are initially measured at fair value plus transaction costs that are directly attributable to the acquisition
and are subsequently measured at amortised cost using the effective interest rate method.
Cash and Cash equivalents
Cash includes cash on hand and cash with banks. Cash equivalents are short term highly liquid investments that are held with
registered banking institutions with maturities of three months or less and are subject to an insignificant risk of change in value.
1.9 Leases
A lease is classified as a finance lease if it transfers substantially all the risks and rewards incidental to ownership. A lease is
classified as an operating lease if it does not transfer substantially all the risks and rewards incidental to ownership.
When a lease includes both land and buildings elements, the entity assesses the classification of each element separately.
Finance leases - lessor
The municipality recognises finance lease receivables as assets on the statement of financial position. Such assets are
presented as a receivable at an amount equal to the net investment in the lease.
Finance revenue is recognised based on a pattern reflecting a constant periodic rate of return on the municipality’s net
investment in the finance lease.

Chris Hani District Municipality
Annual Financial Statements for the year ended June 30, 2020
Accounting Policies
25
1.9 Leases (continued)
Operating leases - lessor
Operating lease revenue is recognised as revenue on a straight-line basis over the lease term.
Initial direct costs incurred in negotiating and arranging operating leases are added to the carrying amount of the leased asset
and recognised as an expense over the lease term on the same basis as the lease revenue.
The aggregate cost of incentives is recognised as a reduction of rental revenue over the lease term on a straight-line basis.
The aggregate benefit of incentives is recognised as a reduction of rental expense over the lease term on a straight-line basis.
Income for leases is disclosed under revenue in statement of financial performance.
Operating leases - lessee
Operating lease payments are recognised as an expense on a straight-line basis over the lease term. The difference between
the amounts recognised as an expense and the contractual payments are recognised as an operating lease asset or liability.
1.10 Inventories
Inventories are initially measured at cost except where inventories are acquired through a non-exchange transaction, then their
costs is fair value as at the date of acquisition.
Subsequently inventories are measured at the lower of cost and net realisable value.
Inventories are measured at the lower of cost and current replacement cost where they are held for;
distribution at no charge or for a nominal charge; or
consumption in the production process of goods to be distributed at no charge or for a nominal charge.
Net realisable value is the estimated selling price in the ordinary course of operations less the estimated costs of completion
and the estimated costs necessary to make the sale, exchange or distribution.
Current replacement cost is the cost the municipality incurs to acquire the asset on the reporting date.
The cost of inventories comprises of all costs of purchase, costs of conversion and other costs incurred in bringing the
inventories to their present location and condition.
The cost of inventories of items that are not ordinarily interchangeable and goods or services produced and segregated for
specific projects is assigned using specific identification of the individual costs.
The cost of inventories is assigned using the first-in, first-out (FIFO) formula. The same cost formula is used for all inventories
having a similar nature and use to the municipality.
When inventories are sold, the carrying amounts of those inventories are recognised as an expense in the period in which the
related revenue is recognised. If there is no related revenue, the expenses are recognised when the goods are distributed, or
related services are rendered. The amount of any write-down of inventories to net realisable value or current replacement cost
and all losses of inventories are recognised as an expense in the period the write-down or loss occurs. The amount of any
reversal of any write-down of inventories, arising from an increase in net realisable value or current replacement cost, are
recognised as a reduction in the amount of inventories recognised as an expense in the period in which the reversal occurs.
1.11 Impairment of cash-generating assets
Cash-generating assets are assets used with the objective of generating a commercial return. Commercial return means that
positive cash flows are expected to be significantly higher than the cost of the asset.
Impairment is a loss in the future economic benefits or service potential of an asset, over and above the systematic recognition
of the loss of the asset’s future economic benefits or service potential through depreciation (amortisation).

Chris Hani District Municipality
Annual Financial Statements for the year ended June 30, 2020
Accounting Policies
1.11 Impairment of cash-generating assets (continued)
26
Carrying amount is the amount at which an asset is recognised in the statement of financial position after deducting any
accumulated depreciation and accumulated impairment losses thereon.
A cash-generating unit is the smallest identifiable group of assets used with the objective of generating a commercial return that
generates cash inflows from continuing use that are largely independent of the cash inflows from other assets or groups of
assets.
Costs of disposal are incremental costs directly attributable to the disposal of an asset, excluding finance costs and income tax
expense.
Depreciation (Amortisation) is the systematic allocation of the depreciable amount of an asset over its useful life.
Fair value less costs to sell is the amount obtainable from the sale of an asset in an arm’s length transaction between
knowledgeable, willing parties, less the costs of disposal.
Recoverable amount of an asset or a cash-generating unit is the higher its fair value less costs to sell and its value in use.
Useful life is either:
the period of time over which an asset is expected to be used by the municipality; or
the number of production or similar units expected to be obtained from the asset by the municipality.
Judgements made by management in applying the criteria to designate assets as cash-generating assets or non-
cashgenerating assets, are as follows Identification
When the carrying amount of a cash-generating asset exceeds its recoverable amount, it is impaired.
The municipality assesses at each reporting date whether there is any indication that a cash-generating asset may be impaired.
If any such indication exists, the municipality estimates the recoverable amount of the asset.
Irrespective of whether there is any indication of impairment, the municipality also tests a cash-generating intangible asset with
an indefinite useful life or a cash-generating intangible asset not yet available for use for impairment annually by comparing its
carrying amount with its recoverable amount. This impairment test is performed at the same time every year. If an intangible
asset was initially recognised during the current reporting period, that intangible asset was tested for impairment before the end
of the current reporting period.
Value in use
Value in use of a cash-generating asset is the present value of the estimated future cash flows expected to be derived from the
continuing use of an asset and from its disposal at the end of its useful life.
When estimating the value in use of an asset, the municipality estimates the future cash inflows and outflows to be derived from
continuing use of the asset and from its ultimate disposal and the municipality applies the appropriate discount rate to those
future cash flows.
Recognition and measurement (individual asset)
If the recoverable amount of a cash-generating asset is less than its carrying amount, the carrying amount of the asset is
reduced to its recoverable amount. This reduction is an impairment loss.
An impairment loss is recognised immediately in surplus or deficit.
Any impairment loss of a revalued cash-generating asset is treated as a revaluation decrease.
When the amount estimated for an impairment loss is greater than the carrying amount of the cash-generating asset to which it
relates, the municipality recognises a liability only to the extent that is a requirement in the Standard of GRAP.

Chris Hani District Municipality
Annual Financial Statements for the year ended June 30, 2020
Accounting Policies
1.11 Impairment of cash-generating assets (continued)
27
After the recognition of an impairment loss, the depreciation (amortisation) charge for the cash-generating asset is adjusted in
future periods to allocate the cash-generating asset’s revised carrying amount, less its residual value (if any), on a systematic
basis over its remaining useful life.
Cash-generating units
If there is any indication that an asset may be impaired, the recoverable amount is estimated for the individual asset. If it is not
possible to estimate the recoverable amount of the individual asset, the municipality determines the recoverable amount of the
cash-generating unit to which the asset belongs (the asset's cash-generating unit).
If an active market exists for the output produced by an asset or group of assets, that asset or group of assets is identified as a
cash-generating unit, even if some or all of the output is used internally. If the cash inflows generated by any asset or
cashgenerating unit are affected by internal transfer pricing, the municipality use management's best estimate of future price(s)
that could be achieved in arm's length transactions in estimating:
the future cash inflows used to determine the asset's or cash-generating unit's value in use; and
the future cash outflows used to determine the value in use of any other assets or cash-generating units that are
affected by the internal transfer pricing.
Cash-generating units are identified consistently from period to period for the same asset or types of assets, unless a change is
justified.
The carrying amount of a cash-generating unit is determined on a basis consistent with the way the recoverable amount of the
cash-generating unit is determined.
An impairment loss is recognised for a cash-generating unit if the recoverable amount of the unit is less than the carrying
amount of the unit. The impairment is allocated to reduce the carrying amount of the cash-generating assets of the unit on a pro
rata basis, based on the carrying amount of each asset in the unit. These reductions in carrying amounts are treated as
impairment losses on individual assets.
In allocating an impairment loss, the entity does not reduce the carrying amount of an asset below the highest of:
its fair value less costs to sell (if determinable);
its value in use (if determinable); and
zero.
The amount of the impairment loss that would otherwise have been allocated to the asset is allocated pro rata to the other cash-
generating assets of the unit.
Where a non-cash-generating asset contributes to a cash-generating unit, a proportion of the carrying amount of that noncash-
generating asset is allocated to the carrying amount of the cash-generating unit prior to estimation of the recoverable amount of
the cash-generating unit.
Reversal of impairment loss
The municipality assesses at each reporting date whether there is any indication that an impairment loss recognised in prior
periods for a cash-generating asset may no longer exist or may have decreased. If any such indication exists, the entity
estimates the recoverable amount of that asset.
An impairment loss recognised in prior periods for a cash-generating asset is reversed if there has been a change in the
estimates used to determine the asset’s recoverable amount since the last impairment loss was recognised. The carrying
amount of the asset is increased to its recoverable amount. The increase is a reversal of an impairment loss. The increased
carrying amount of an asset attributable to a reversal of an impairment loss does not exceed the carrying amount that would
have been determined (net of depreciation or amortisation) had no impairment loss been recognised for the asset in prior
periods.
A reversal of an impairment loss for a cash-generating asset is recognised immediately in surplus or deficit.
Any reversal of an impairment loss of a revalued cash-generating asset is treated as a revaluation increase.

Chris Hani District Municipality
Annual Financial Statements for the year ended June 30, 2020
Accounting Policies
1.11 Impairment of cash-generating assets (continued)
28
After a reversal of an impairment loss is recognised, the depreciation (amortisation) charge for the cash-generating asset is
adjusted in future periods to allocate the cash-generating asset’s revised carrying amount, less its residual value (if any), on a
systematic basis over its remaining useful life.
A reversal of an impairment loss for a cash-generating unit is allocated to the cash-generating assets of the unit pro rata with
the carrying amounts of those assets. These increases in carrying amounts are treated as reversals of impairment losses for
individual assets. No part of the amount of such a reversal is allocated to a non-cash-generating asset contributing service
potential to a cash-generating unit.
In allocating a reversal of an impairment loss for a cash-generating unit, the carrying amount of an asset is not increased above
the lower of:
its recoverable amount (if determinable); and
the carrying amount that would have been determined (net of amortisation or depreciation) had no impairment loss
been recognised for the asset in prior periods.
The amount of the reversal of the impairment loss that would otherwise have been allocated to the asset is allocated pro rata to
the other assets of the unit.
Redesignation
The redesignation of assets from a cash-generating asset to a non-cash-generating asset or from a non-cash-generating asset
to a cash-generating asset only occur when there is clear evidence that such a redesignation is appropriate.
1.12 Impairment of non-cash-generating assets
Cash-generating assets are assets used with the objective of generating a commercial return. Commercial return means that
positive cash flows are expected to be significantly higher than the cost of the asset.
Non-cash-generating assets are assets other than cash-generating assets.
Impairment is a loss in the future economic benefits or service potential of an asset, over and above the systematic recognition
of the loss of the asset’s future economic benefits or service potential through depreciation (amortisation).
Carrying amount is the amount at which an asset is recognised in the statement of financial position after deducting any
accumulated depreciation and accumulated impairment losses thereon.
A cash-generating unit is the smallest identifiable group of assets managed with the objective of generating a commercial return
that generates cash inflows from continuing use that are largely independent of the cash inflows from other assets or groups of
assets.
Costs of disposal are incremental costs directly attributable to the disposal of an asset, excluding finance costs and income tax
expense.
Depreciation (Amortisation) is the systematic allocation of the depreciable amount of an asset over its useful life.

Chris Hani District Municipality
Annual Financial Statements for the year ended June 30, 2020
Accounting Policies
29
1.12 Impairment of non-cash-generating assets (continued)
Fair value less costs to sell is the amount obtainable from the sale of an asset in an arm’s length transaction between
knowledgeable, willing parties, less the costs of disposal.
Recoverable service amount is the higher of a non-cash-generating asset’s fair value less costs to sell and its value in use.
Useful life is either:
the period of time over which an asset is expected to be used by the municipality; or
the number of production or similar units expected to be obtained from the asset by the municipality.
Judgements made by management in applying the criteria to designate assets as non-cash-generating assets or
cashgenerating assets, are as follows. Identification
When the carrying amount of a non-cash-generating asset exceeds its recoverable service amount, it is impaired.
The municipality assesses at each reporting date whether there is any indication that a non-cash-generating asset may be
impaired. If any such indication exists, the municipality estimates the recoverable service amount of the asset.
Irrespective of whether there is any indication of impairment, the entity also tests a non-cash-generating intangible asset with
an indefinite useful life or a non-cash-generating intangible asset not yet available for use for impairment annually by
comparing its carrying amount with its recoverable service amount. This impairment test is performed at the same time every
year. If an intangible asset was initially recognised during the current reporting period, that intangible asset was tested for
impairment before the end of the current reporting period. Value in use
Value in use of non-cash-generating assets is the present value of the non-cash-generating assets remaining service potential.
The present value of the remaining service potential of a non-cash-generating assets is determined using the following
approach:
Depreciated replacement cost approach
The present value of the remaining service potential of a non-cash-generating asset is determined as the depreciated
replacement cost of the asset. The replacement cost of an asset is the cost to replace the asset’s gross service potential. This
cost is depreciated to reflect the asset in its used condition. An asset may be replaced either through reproduction (replication)
of the existing asset or through replacement of its gross service potential. The depreciated replacement cost is measured as the
current reproduction or replacement cost of the asset, whichever is lower, less accumulated depreciation calculated on the basis
of such cost, to reflect the already consumed or expired service potential of the asset.
The replacement cost and reproduction cost of an asset is determined on an “optimised” basis. The rationale is that the
municipality would not replace or reproduce the asset with a like asset if the asset to be replaced or reproduced is an
overdesigned or overcapacity asset. Overdesigned assets contain features which are unnecessary for the goods or services the
asset provides. Overcapacity assets are assets that have a greater capacity than is necessary to meet the demand for goods or
services the asset provides. The determination of the replacement cost or reproduction cost of an asset on an optimised basis
thus reflects the service potential required of the asset.
1.12 Impairment of non-cash-generating assets (continued)
Recognition and measurement
If the recoverable service amount of a non-cash-generating asset is less than its carrying amount, the carrying amount of the
asset is reduced to its recoverable service amount. This reduction is an impairment loss.
An impairment loss is recognised immediately in surplus or deficit.
Any impairment loss of a revalued non-cash-generating asset is treated as a revaluation decrease.
When the amount estimated for an impairment loss is greater than the carrying amount of the non-cash-generating asset to
which it relates, the municipality recognises a liability only to the extent that is a requirement in the Standards of GRAP.

Chris Hani District Municipality
Annual Financial Statements for the year ended June 30, 2020
Accounting Policies
30
After the recognition of an impairment loss, the depreciation (amortisation) charge for the non-cash-generating asset is adjusted
in future periods to allocate the non-cash-generating asset’s revised carrying amount, less its residual value (if any), on a
systematic basis over its remaining useful life.
Reversal of an impairment loss
The municipality assesses at each reporting date whether there is any indication that an impairment loss recognised in prior
periods for a non-cash-generating asset may no longer exist or may have decreased. If any such indication exists, the
municipality estimates the recoverable service amount of that asset.
An impairment loss recognised in prior periods for a non-cash-generating asset is reversed if there has been a change in the
estimates used to determine the asset’s recoverable service amount since the last impairment loss was recognised. The
carrying amount of the asset is increased to its recoverable service amount. The increase is a reversal of an impairment loss.
The increased carrying amount of an asset attributable to a reversal of an impairment loss does not exceed the carrying amount
that would have been determined (net of depreciation or amortisation) had no impairment loss been recognised for the asset in
prior periods.
A reversal of an impairment loss for a non-cash-generating asset is recognised immediately in surplus or deficit.
Any reversal of an impairment loss of a revalued non-cash-generating asset is treated as a revaluation increase.
After a reversal of an impairment loss is recognised, the depreciation (amortisation) charge for the non-cash-generating asset is
adjusted in future periods to allocate the non-cash-generating asset’s revised carrying amount, less its residual value (if any), on
a systematic basis over its remaining useful life.
Redesignation
The redesignation of assets from a cash-generating asset to a non-cash-generating asset or from a non-cash-generating asset
to a cash-generating asset only occur when there is clear evidence that such a redesignation is appropriate.
1.13 Employee benefits
Short-term employee benefits
The cost of short-term employee benefits, (those payable within 12 months after the service is rendered, such as paid vacation
leave and sick leave, bonuses, and non-monetary benefits such as medical care), are recognised in the period in which the
service is rendered and are not discounted.
The expected cost of compensated absences is recognised as an expense as the employees render services that increase their
entitlement or, in the case of non-accumulating absences, when the absence occurs.
The expected cost of surplus sharing and bonus payments is recognised as an expense when there is a legal or constructive
obligation to make such payments as a result of past performance.
Leave Pay
The expected cost of compensated absences is recognised as an expense as the employees render services that increase their
entitlement or in the case of non accumulating absences, when the absence occurs. The liability is based on the total amount of
leave days due to the employees at reporting date and on the total cost to the municipality of the employees.
Annual Bonuses
The municipality recognises the expected cost of bonus, incentive and performance, related payments when the municipality
has a present legal or constructive obligation to make such payments as a result of past events and a reliable estimate of the
obligation can be made. The liability relating to anticipated bonuses payable is raised and is based on the total cost to the
municipality.
Long Service Awards

Chris Hani District Municipality
Annual Financial Statements for the year ended June 30, 2020
Accounting Policies
31
The municipality provides long service awards to eligible employees, payable on completion of a certain number of years of
employment ie 5 yrs, 10 yrs, 15 yrs, 20 yrs etc. A liability is raised to account for the expected long service awards due to be
paid in future years.
Defined contribution plans
Payments to defined contribution retirement benefit plans are charged as an expense as they fall due.
Payments made to industry-managed (or state plans) retirement benefit schemes are dealt with as defined contribution plans
where the entity’s obligation under the schemes is equivalent to those arising in a defined contribution retirement benefit plan.
1.13 Employee benefits (continued)
Defined benefit plans
For defined benefit plans the cost of providing the benefits is determined using the projected credit method.
Actuarial valuations are conducted on an annual basis by independent actuaries separately for each plan.
Consideration is given to any event that could impact the funds up to end of the reporting period where the interim valuation is
performed at an earlier date.
Past service costs are recognised immediately to the extent that the benefits are already vested, and are otherwise amortised
on a straight line basis over the average period until the amended benefits become vested.
To the extent that, at the beginning of the financial period, any cumulative unrecognised actuarial gain or loss exceeds ten
percent of the greater of the present value of the projected benefit obligation and the fair value of the plan assets (the corridor),
that portion is recognised in surplus or deficit over the expected average remaining service lives of participating employees.
Actuarial gains or losses within the corridor are not recognised.
Gains or losses on the curtailment or settlement of a defined benefit plan is recognised when the entity is demonstrably
committed to curtailment or settlement.
When it is virtually certain that another party will reimburse some or all of the expenditure required to settle a defined benefit
obligation, the right to reimbursement is recognised as a separate asset. The asset is measured at fair value. In all other
respects, the asset is treated in the same way as plan assets. In surplus or deficit, the expense relating to a defined benefit plan
is presented as the net of the amount recognised for a reimbursement.
The amount recognised in the statement of financial position represents the present value of the defined benefit obligation as
adjusted for unrecognised actuarial gains and losses and unrecognised past service costs, and reduces by the fair value of plan
assets.
Any asset is limited to unrecognised actuarial losses and past service costs, plus the present value of available refunds and
reduction in future contributions to the plan.
1.14 Provisions and contingencies
Provisions are recognised when:
the municipality has a present obligation as a result of a past event;
it is probable that an outflow of resources embodying economic benefits or service potential will be required to settle
the obligation; and
a reliable estimate can be made of the obligation.
The amount of a provision is the best estimate of the expenditure expected to be required to settle the present obligation at the
reporting date.
Where the effect of time value of money is material, the amount of a provision is the present value of the expenditures expected
to be required to settle the obligation.

Chris Hani District Municipality
Annual Financial Statements for the year ended June 30, 2020
Accounting Policies
32
The discount rate is a pre-tax rate that reflects current market assessments of the time value of money and the risks specific to
the liability.
Where some or all of the expenditure required to settle a provision is expected to be reimbursed by another party, the
reimbursement is recognised when, and only when, it is virtually certain that reimbursement will be received if the municipality
settles the obligation. The reimbursement is treated as a separate asset. The amount recognised for the reimbursement does
not exceed the amount of the provision.
Provisions are reviewed at each reporting date and adjusted to reflect the current best estimate. Provisions are reversed if it is
no longer probable that an outflow of resources embodying economic benefits or service potential will be required, to settle the
obligation.
Where discounting is used, the carrying amount of a provision increases in each period to reflect the passage of time. This
increase is recognised as an interest expense.
1.14 Provisions and contingencies (continued)
A provision is used only for expenditures for which the provision was originally recognised.
Provisions are not recognised for future operating deficits.
If the municipality has a contract that is onerous, the present obligation (net of recoveries) under the contract is recognised and
measured as a provision.
Contingent assets and contingent liabilities are not recognised. Contingencies are disclosed in note 35.
A financial guarantee contract is a contract that requires the issuer to make specified payments to reimburse the holder for a
loss incured because a specified debtor fails to make payment when due in accordance with the original or modified terms of a
debt instrument.
Loan commitment is a firm commitment to provide credit under pre-specified terms and conditions.
The municipality recognises a provision for financial guarantees and loan commitments when it is probable that an outflow of
resources embodying economic benefits and service potential will be required to settle the obligation and a reliable estimate of
the obligation can be made.
1.15 Revenue from exchange transactions
Revenue is the gross inflow of economic benefits or service potential during the reporting period when those inflows result in an
increase in net assets, other than increases relating to contributions from owners.
Revenue from exchange transactions refers to revenue that accrued to the municipality directly in return for services
rendered/goods sold, the value of which approximates the consideration received or receivable excluding indirect taxes, rebates
and discounts.
An exchange transaction is one in which the municipality receives assets or services, or has liabilities extinguished, and directly
gives approximately equal value (primarily in the form of goods, services or use of assets) to the other party in exchange.
Fair value is the amount for which an asset could be exchanged, or a liability settled, between knowledgeable, willing parties in
an arm’s length transaction.
Measurement
Revenue is measured at the fair value of the consideration received or receivable, net of trade discounts and volume rebates.
Sale of goods
Revenue from the sale of goods is recognised when all the following conditions have been satisfied:
the municipality has transferred to the purchaser the significant risks and rewards of ownership of the goods;

Chris Hani District Municipality
Annual Financial Statements for the year ended June 30, 2020
Accounting Policies
33
the municipality retains neither continuing managerial involvement to the degree usually associated with ownership
nor effective control over the goods sold;
the amount of revenue can be measured reliably;
it is probable that the economic benefits or service potential associated with the transaction will flow to the
municipality; and
the costs incurred or to be incurred in respect of the transaction can be measured reliably.
1.15 Revenue from exchange transactions (continued)
Rendering of services
When the outcome of a transaction involving the rendering of services can be estimated reliably, revenue associated with
the transaction is recognised by reference to the stage of completion of the transaction at the reporting date. The outcome of
a transaction can be estimated reliably when all the following conditions are satisfied:
the amount of revenue can be measured reliably;
it is probable that the economic benefits or service potential associated with the transaction will flow to the
municipality;
the stage of completion of the transaction at the reporting date can be measured reliably; and
the costs incurred for the transaction and the costs to complete the transaction can be measured reliably.
When services are performed by an indeterminate number of acts over a specified time frame, revenue is recognised on a
straight line basis over the specified time frame unless there is evidence that some other method better represents the stage of
completion. When a specific act is much more significant than any other acts, the recognition of revenue is postponed until the
significant act is executed.
When the outcome of the transaction involving the rendering of services cannot be estimated reliably, revenue is recognised
only to the extent of the expenses recognised that are recoverable.
Service revenue is recognised by reference to the stage of completion of the transaction at the reporting date. Stage of
completion is determined by services performed to date as a percentage of total services to be performed.
Service Charges - Water
Service charges relating to water are based on consumption. Meters are read on a monthly basis and revenue is recognised
providing that the benefits can be measured reliably. Provisional estimates of consumption are made monthly when meter
readings have not been performed for whatever reason. The provisional amounts are recognised as revenue when invoiced.
Adjustments to provisional estimates of consumption are made in the invoicing period in which meters have been read. These
adjustments are recognised as revenue in the invoicing period.
Service Charges - Sewerage and sanitation Charges
Revenue relating to waste water management services are recognised on a monthly basis in arrears by applying the approved
tariff to each property. Tariffs are determined per category of property usage and are levied monthly.
Rental Income
Rental Income is recognised on a straight line basis over the term of the lease agreement.
Interest, royalties and dividends
Revenue arising from the use by others of entity assets yielding interest, royalties and dividends or similar distributions is
recognised when:
It is probable that the economic benefits or service potential associated with the transaction will flow to the
municipality, and
The amount of the revenue can be measured reliably.
Interest is recognised, in surplus or deficit, using the effective interest rate method.
Service fees included in the price of the product are recognised as revenue over the period during which the service is
performed.

Chris Hani District Municipality
Annual Financial Statements for the year ended June 30, 2020
Accounting Policies
34
1.16 Revenue from non-exchange transactions
Revenue comprises gross inflows of economic benefits or service potential received and receivable by a municipality, which
represents an increase in net assets, other than increases relating to contributions from owners.
Conditions on transferred assets are stipulations that specify that the future economic benefits or service potential embodied in
the asset is required to be consumed by the recipient as specified or future economic benefits or service potential must be
returned to the transferor.
1.16 Revenue from non-exchange transactions (continued)
Fines are economic benefits or service potential received or receivable by entities, as determined by a court or other law
enforcement body, as a consequence of the breach of laws or regulations.
Non-exchange transactions are transactions that are not exchange transactions. In a non-exchange transaction, a municipality
either receives value from another municipality without directly giving approximately equal value in exchange, or gives value to
another municipality without directly receiving approximately equal value in exchange.
Restrictions on transferred assets are stipulations that limit or direct the purposes for which a transferred asset may be used,
but do not specify that future economic benefits or service potential is required to be returned to the transferor if not deployed as
specified.
Stipulations on transferred assets are terms in laws or regulation, or a binding arrangement, imposed upon the use of a
transferred asset by entities external to the reporting municipality.
Transfers are inflows of future economic benefits or service potential from non-exchange transactions, other than taxes.
Recognition
An inflow of resources from a non-exchange transaction recognised as an asset is recognised as revenue, except to the extent
that a liability is also recognised in respect of the same inflow.
As the municipality satisfies a present obligation recognised as a liability in respect of an inflow of resources from a
nonexchange transaction recognised as an asset, it reduces the carrying amount of the liability recognised and recognises an
amount of revenue equal to that reduction.
Measurement
Revenue from a non-exchange transaction is measured at the amount of the increase in net assets recognised by the
municipality.
When, as a result of a non-exchange transaction, the municipality recognises an asset, it also recognises revenue equivalent to
the amount of the asset measured at its fair value as at the date of acquisition, unless it is also required to recognise a liability.
Where a liability is required to be recognised it will be measured as the best estimate of the amount required to settle the
obligation at the reporting date, and the amount of the increase in net assets, if any, recognised as revenue. When a liability is
subsequently reduced, because the taxable event occurs or a condition is satisfied, the amount of the reduction in the liability is
recognised as revenue.
Transfers
Apart from Services in kind, which are not recognised, the municipality recognises an asset in respect of transfers when the
transferred resources meet the definition of an asset and satisfy the criteria for recognition as an asset.
The municipality recognises an asset in respect of transfers when the transferred resources meet the definition of an asset and
satisfy the criteria for recognition as an asset.
Transferred assets are measured at their fair value as at the date of acquisition.
Fines

Chris Hani District Municipality
Annual Financial Statements for the year ended June 30, 2020
Accounting Policies
35
Fines are recognised as revenue when the receivable meets the definition of an asset and satisfies the criteria for recognition as
an asset.
Assets arising from fines are measured at the best estimate of the inflow of resources to the municipality.
Where the municipality collects fines in the capacity of an agent, the fine will not be revenue of the collecting entity.
1.16 Revenue from non-exchange transactions (continued)
Gifts and donations, including goods in-kind
Gifts and donations, including goods in kind, are recognised as assets and revenue when it is probable that the future economic
benefits or service potential will flow to the municipality and the fair value of the assets can be measured reliably.
Revenue from public contributions is recognised when all the conditions associated with the contribution have been met or
where the contribution is to finance property, plant and equipment when such items of property, plant and equipment are
brought into use. Where the contributions have been received but the conditions have not been met, a liability is recognised.
1.17 Conditional grants and receipts
Revenue received from conditional grants, donations and funding are recognised as revenue to the extent that the municipality
has complied with any of the criteria, conditions or obligations embodied in the agreement. To the extent that the criteria,
conditions or obligations have not been met a liability is recognised.
Government grants that are received as compensation for expenses or losses incurred or for the purpose of giving immediate
financial support with no future related costs are recognised in the statement of financial performance in the year in which they
have been received.
1.18 Investment income
Investment income is recognised on a time-proportion basis using the effective interest method. 1.19
Borrowing costs
Borrowing costs are interest and other expenses incurred by an entity in connection with the borrowing of funds.
Borrowing costs are recognised as an expense in the period in which they are incurred.
1.20 Internal reserves
Capital replacement reserve (CRR)
In order to finance the provision of infrastructure and other items of property, plant and equipment from internal sources,
amounts are transferred from the accumulated surplus/(deficit) to the CRR in terms of a Council resolution. A corresponding
amount is transferred to a designated CRR bank or investment account. The cash in the designated CRR bank account can
only be utilised to finance items of property, plant and equipment. The CRR is reduced and the accumulated surplus/(deficit) is
credited by a corresponding amount when the amounts in the CRR are utilised.
1.21 Value Added Tax
Revenue, expenses and assets are recognised net of the amounts of value added tax. The net amount of Value Added Tax
recoverable from, or payable to, the South African Revenue Services is included as part of receivables or payables in the
Statement of Financial Position.
1.22 Commitments
Items are classified as commitments when an entity has committed itself to future transactions that will normally result in the
outflow of cash. A commitment is disclosed to the extent that it has not already been recognised elsewhere in the financial
statements.

Chris Hani District Municipality
Annual Financial Statements for the year ended June 30, 2020
Accounting Policies
36
At the end of each financial period the municipality determines commitments in respect of capital expenditure that has been
approved and contracted for which is then disclosed as a note in the annual financial statements.
1.23 Unauthorised expenditure
Unauthorised expenditure means:
overspending of a vote or a main division within a vote; and
expenditure not in accordance with the purpose of a vote or, in the case of a main division, not in accordance with the
purpose of the main division.
1.23 Unauthorised expenditure (continued)
Also included is expenditure that is not in terms of the conditions of an allocation received from another sphere of government,
municipality or organ of state and expenditure in the form of a grant that is not permitted in terms of the Municipal Finance
Management Act (Act No. 56 of 2003)
All expenditure relating to unauthorised expenditure is recognised as an expense in the statement of financial performance in
the year that the expenditure was incurred. The expenditure is classified in accordance with the nature of the expense, and
where recovered, it is subsequently accounted for as revenue in the statement of financial performance.
1.24 Fruitless and wasteful expenditure
Fruitless expenditure means expenditure which was made in vain and would have been avoided had reasonable care been
exercised.
All expenditure relating to fruitless and wasteful expenditure is recognised as an expense in the statement of financial
performance in the year that the expenditure was incurred. The expenditure is classified in accordance with the nature of the
expense, and where recovered, it is subsequently accounted for as revenue in the statement of financial performance.
1.25 Irregular expenditure
Irregular expenditure as defined in section 1 of the MFMA is expenditure other than unauthorised expenditure, incurred in
contravention of or that is not in accordance with a requirement of any applicable legislation, including -
(a) this Act; or
(b) the State Tender Board Act, 1968 (Act No. 86 of 1968), or any regulations made in terms of the Act; or
(c) any provincial legislation providing for procurement procedures in that provincial government.
Irregular expenditure that was incurred and identified during the current financial and which was condoned before year end
and/or before finalisation of the financial statements must also be recorded appropriately in the irregular expenditure register. In
such an instance, no further action is also required with the exception of updating the note to the financial statements.
Irregular expenditure that was incurred and identified during the current financial year and for which condonement is being
awaited at year end must be recorded in the irregular expenditure register. No further action is required with the exception of
updating the note to the financial statements.
Where irregular expenditure was incurred in the previous financial year and is only condoned in the following financial year, the
register and the disclosure note to the financial statements must be updated with the amount condoned.
Irregular expenditure that was incurred and identified during the current financial year and which was not condoned by the
National Treasury or the relevant authority must be recorded appropriately in the irregular expenditure register. If liability for the
irregular expenditure can be attributed to a person, a debt account must be created if such a person is liable in law. Immediate
steps must thereafter be taken to recover the amount from the person concerned. If recovery is not possible, the accounting
officer or accounting authority may write off the amount as debt impairment and disclose such in the relevant note to the
financial statements. The irregular expenditure register must also be updated accordingly. If the irregular expenditure has not
been condoned and no person is liable in law, the expenditure related thereto must remain against the relevant
programme/expenditure item, be disclosed as such in the note to the financial statements and updated accordingly in the
irregular expenditure register.
Irregular expenditure is expenditure that is contrary to the Municipal Finance Management Act (Act No.56 of 2003), the
Municipal Systems Act (Act No.32 of 2000), and the Public Office Bearers Act (Act No. 20 of 1998) or is in contravention of the

Chris Hani District Municipality
Annual Financial Statements for the year ended June 30, 2020
Accounting Policies
37
economic entity’s supply chain management policy. Irregular expenditure excludes unauthorised expenditure. Irregular
expenditure is accounted for as expenditure in the Statement of Financial Performance and where recovered, it is subsequently
accounted for as revenue in the Statement of Financial Performance.
1.26 Use of estimates
The preparation of financial statements in conformity with Standards of GRAP requires the use of certain critical accounting
estimates. It also requires management to exercise its judgement in the process of applying the municipality’s accounting
policies. The areas involving a higher degree of judgement or complexity, or areas where assumptions and estimates are
significant to the financial statements are disclosed in the relevant sections of the financial statements. Although these
estimates are based on management’s best knowledge of current events and actions they may undertake in the future, actual
results ultimately may differ from those estimates.
1.27 Segment information
A segment is an activity of an entity:
that generates economic benefits or service potential (including economic benefits or service potential relating to
transactions between activities of the same entity);
whose results are regularly reviewed by management to make decisions about resources to be allocated to that
activity and in assessing its performance; and
for which separate financial information is available.
Reportable segments are the actual segments which are reported on in the segment report. They are the segments identified
above or alternatively an aggregation of two or more of those segments where the aggregation criteria are met.
1.28 Budget information
Municipality are typically subject to budgetary limits in the form of appropriations or budget authorisations (or equivalent), which
is given effect through authorising legislation, appropriation or similar.
General purpose financial reporting by municipality shall provide information on whether resources were obtained and used in
accordance with the legally adopted budget.
The approved budget is prepared on a cash basis and presented by economic classification linked to performance outcome
objectives.
The approved budget covers the fiscal period from 2019-07-01 to 2020-06-30.
The budget for the economic entity includes all the entities approved budgets under its control.
The annual financial statements and the budget are on the same basis of accounting therefore a comparison with the budgeted
amounts for the reporting period have been included in the Statement of comparison of budget and actual amounts.
The Statement of comparative and actual information has been included in the annual financial statements as the
recommended disclosure when the annual financial statements and the budget are on the same basis of accounting as
determined by National Treasury.
1.29 Related parties
A related party is a person or an entity with the ability to control or jointly control the other party, or exercise significant influence
over the other party, or vice versa, or an entity that is subject to common control, or joint control.
Control is the power to govern the financial and operating policies of an entity so as to obtain benefits from its activities.
Joint control is the agreed sharing of control over an activity by a binding arrangement, and exists only when the strategic
financial and operating decisions relating to the activity require the unanimous consent of the parties sharing control (the
venturers).
Related party transaction is a transfer of resources, services or obligations between the reporting entity and a related party,
regardless of whether a price is charged.

Chris Hani District Municipality
Annual Financial Statements for the year ended June 30, 2020
Accounting Policies
38
Significant influence is the power to participate in the financial and operating policy decisions of an entity, but is not control over
those policies.
Management are those persons responsible for planning, directing and controlling the activities of the municipality, including
those charged with the governance of the municipality in accordance with legislation, in instances where they are required to
perform such functions.
Close members of the family of a person are considered to be those family members who may be expected to influence, or be
influenced by, that management in their dealings with the municipality.
The municipality is exempt from disclosure requirements in relation to related party transactions if that transaction occurs within
normal supplier and/or client/recipient relationships on terms and conditions no more or less favourable than those which it is
reasonable to expect the municipality to have adopted if dealing with that individual entity or person in the same circumstances
and terms and conditions are within the normal operating parameters established by that reporting entity's legal mandate.
1.29 Related parties (continued)
Where the municipality is exempt from the disclosures in accordance with the above, the municipality discloses narrative
information about the nature of the transactions and the related outstanding balances, to enable users of the entity’s financial
statements to understand the effect of related party transactions on its annual financial statements. 1.30 Transfer of
functions between entities under common control
Definitions
An acquirer is the municipality that obtains control of the acquiree or transferor.
Carrying amount of an asset or liability is the amount at which an asset or liability is recognised in the statement of financial
position.
Control is the power to govern the financial and operating policies of another municipality so as to benefit from its activities.
A function is an integrated set of activities that is capable of being conducted and managed for purposes of achieving a
municipality’s objectives, either by providing economic benefits or service potential.
A merger is the establishment of a new combined entity in which none of the former entities obtains control over any other and
no acquirer can be identified.
Transfer date is the date on which the acquirer obtains control of the function and the transferor loses control of that function.
A transfer of functions is the reorganisation and/or the re-allocation of functions between entities by transferring functions
between entities or into another municipality.
A transferor is the municipality that relinquishes control of a function.
Common control - For a transaction or event to occur between entities under common control, the transaction or event needs to
be undertaken between entities within the same sphere of government or between entities that are part of the same economic
entity. Entities that are ultimately controlled by the same entity before and after the transfer of functions are within the same
economic entity.
A function is an integrated set of activities that is capable of being conducted and managed for purposes of achieving a
municipality‘s objectives, either by providing economic benefits or service potential. A function consists of inputs and processes
applied to those inputs that have the ability to create outputs. A function can either be a part or a portion of an entity or can
consist of the whole municipality. Although functions may have outputs, outputs are not required to qualify as a function. The
three elements of a function are defined as follows:
Input: Any resource that creates, or has the ability to create, outputs when one or more processes are applied to it.
Process: Any system, standard, protocol, convention or rule that when applied to an input or inputs, creates or has
the ability to create outputs.
Output: The result of inputs and processes applied to achieve and improve efficiency. This may be in the form of
achieving service delivery objectives, or the delivery of goods and/or services.

Chris Hani District Municipality
Annual Financial Statements for the year ended June 30, 2020
Accounting Policies
39
Identifying the acquirer and transferor
For each transfer of functions between entities under common control an acquirer and transferor are identified. All relevant facts
and circumstances are considered in identifying the acquirer and transferor.
The terms and conditions of a transfer of functions undertaken between entities under common control are set out in a binding
arrangement. The binding arrangement governing the terms and conditions of a transfer of functions may identify which
municipality to the transaction or event is the transferor(s) and which municipality is the acquirer. Where the binding
arrangement does not clearly identify the acquirer or the transferor, the behaviour or actions of the entities may indicate which
municipality is the acquirer and which municipality is the transferor.
Determining the acquirer includes a consideration of, amongst other things, which of the entities involved in the transfer of
functions initiated the transaction or event, the relative size of the entities, as well as whether the assets or revenue of one of
the entities involved in the transaction or event significantly exceed those of the other entities. If no acquirer can be identified,
the transaction or event is accounted for in terms of the Standard of GRAP on Mergers.

Chris Hani District Municipality
Annual Financial Statements for the year ended June 30, 2020
Accounting Policies
1.30 Transfer of functions between entities under common control (continued)
40
Determining the transfer date
The acquirer and the transferor identify the transfer date, which is the date on which the acquirer obtains control and the
transferor loses control of that function.
All relevant facts and circumstances are considered in identifying the transfer date.

Chris Hani District Municipality
Annual Financial Statements for the year ended June 30, 2020
Accounting Policies
1.30 Transfer of functions between entities under common control (continued)
41
Accounting by the entity as acquirer
Initial recognition and measurement
As of the transfer date, the municipality recognises the purchase consideration paid to the transferor and all the assets acquired
and liabilities assumed in a transfer of functions. The assets acquired and liabilities assumed are measured at their carrying
amounts.
If, prior to the transfer of functions, the transferor was not applying the accrual basis of accounting, the transferor changes its
basis of accounting to the accrual basis of accounting prior to the transfer.
The consideration paid by the municipality can be in the form of cash, cash equivalents or other assets. If the consideration paid
is in the form of other assets, the municipality de-recognises such assets on the transfer date at their carrying amounts.
The difference between the carrying amounts of the assets acquired, the liabilities assumed and the consideration paid to the
transferor, is recognised in accumulated surplus or deficit.
Measurement period
If the initial accounting for a transfer of functions is incomplete by the end of the reporting period in which the transfer occurs,
the municipality reports in its annual financial statements provisional amounts for the items for which the accounting is
incomplete. During the measurement period, the municipality retrospectively adjust the provisional amounts recognised at the
transfer date to reflect new information obtained about facts and circumstances that existed as of the transfer date and, if
known, would have affected the measurement of the amounts recognised as of that date. The measurement period ends as
soon as the municipality receives the information it was seeking about facts and circumstances that existed as of the transfer
date or learns that more information is not obtainable. However, the measurement period does not exceed two years from the
transfer date.
The municipality considers all relevant factors in determining whether information obtained after the transfer date should result
in an adjustment to the provisional amounts recognised or whether that information results from events that occurred after the
transfer date.
The municipality recognises an increase (decrease) in the provisional amount recognised for an asset (liability) by means of
decreasing (increasing) the excess of the purchase consideration paid over the carrying amount of the assets acquired and
liabilities assumed previously recognised in accumulated surplus or deficit. However, new information obtained during the
measurement period may sometimes result in an adjustment to the provisional amount of more than one asset or liability.
During the measurement period, the municipality recognises adjustments to the provisional amounts as if the accounting for the
transfer of functions had been completed at the transfer date. Thus, the municipality revises comparative information for prior
periods presented in annual financial statements as needed, including making any change in depreciation, amortisation or other
income effects recognised in completing the initial accounting.
After the measurement period ends, the municipality revises the accounting for a transfer of functions only to correct an error in
accordance with the Standard of GRAP on Accounting Policies, Changes in Accounting Estimates and Errors.
Subsequent measurement
The municipality subsequently measure any assets acquired and any liabilities assumed in a transfer of functions in accordance
with the applicable Standards of GRAP.
At the transfer date, the municipality classifies or designates the assets acquired and liabilities assumed as necessary to apply
other Standards of GRAP subsequently. The municipality makes those classifications or designations on the basis of the terms
of the binding arrangement, economic conditions, its operating or accounting policies and other relevant conditions that exist at
the transfer date. An exception is that the municipality classifies the following contracts on the basis of the contractual terms and
other factors at the inception of the contract (or, if the terms of the contract have been modified in a manner that would change
its classification, at the date of that modification, which might be the transfer date):

Chris Hani District Municipality
Annual Financial Statements for the year ended June 30, 2020
Accounting Policies
1.30 Transfer of functions between entities under common control (continued)
42
classification of a lease contract as either an operating lease or a finance lease in accordance with the Standard of
GRAP on Leases; and
classification of a contract as an insurance contract in accordance with the International Financial Reporting Standard
on Insurance Contracts.
Accounting by the entity as transferor
Derecognition of assets transferred and liabilities relinquished
As of the transfer date, the municipality derecognises from its annual financial statements, all the assets transferred and
liabilities relinquished in a transfer of functions at their carrying amounts.
Until the transfer date, the municipality continues to measure these assets and liabilities in accordance with applicable
Standards of GRAP.
The consideration received from the acquirer can be in the form of cash, cash equivalents or other assets. If the consideration
received is in the form of other assets, the municipality measures such assets at their fair value on the transfer date in
accordance with the applicable Standard of GRAP. The difference between the carrying amounts of the assets transferred, the
liabilities relinquished and the consideration received from the acquirer is recognised in accumulated surplus or deficit.
1.31 Events after reporting date
Events after reporting date are those events, both favourable and unfavourable, that occur between the reporting date and the
date when the financial statements are authorised for issue. Two types of events can be identified:
those that provide evidence of conditions that existed at the reporting date (adjusting events after the reporting date);
and
those that are indicative of conditions that arose after the reporting date (non-adjusting events after the reporting
date).
The municipality will adjust the amount recognised in the financial statements to reflect adjusting events after the reporting date
once the event occurred.
The municipality will disclose the nature of the event and an estimate of its financial effect or a statement that such estimate
cannot be made in respect of all material non-adjusting events, where non-disclosure could influence the economic decisions of
users taken on the basis of the financial statements.
Statutory receivables are receivables that arise from legislation, supporting regulations, or similar means, and require settlement
by another entity in cash or another financial asset.
Carrying amount is the amount at which an asset is recognised in the statement of financial position.
The cost method is the method used to account for statutory receivables that requires such receivables to be measured at their
transaction amount, plus any accrued interest or other charges (where applicable) and, less any accumulated impairment losses
and any amounts derecognised.
Nominal interest rate is the interest rate and/or basis specified in legislation, supporting regulations or similar means.
The transaction amount (for purposes of this Standard) for a statutory receivable means the amount specified in, or calculated,
levied or charged in accordance with, legislation, supporting regulations, or similar means.

Chris Hani District Municipality
Annual Financial Statements for the year ended June 30, 2020
Notes to the Annual Financial Statements
2. New standards and interpretations
43
2.1 Standards and interpretations issued, but not yet effective
The municipality has not applied the following standards and interpretations, which have been published and are mandatory
for the municipality’s accounting periods beginning on or after July 1, 2020 or later periods:
GRAP 35: Consolidated Financial Statements
The objective of this Standard is to establish principles for the presentation and preparation of consolidated financial
statements when an entity controls one or more other entities.
To meet this objective, the Standard:
. requires an entity (the controlling entity) that controls one or more other entities (controlled entities) to present
consolidated financial statements;
. defines the principles of control, and establishes control as the basis for consolidation;
. sets out how to apply the principle of control to identify whether an entity controls another entity and therefore must
consolidate that entity;
. sets out the accounting requirements for the preparation of consolidated financial statements; and . defines an
investment entity and sets out an exception to consolidating particular controlled entities of an investment entity.
It furthermore covers Definitions, Control, Accounting requirements. Investments entities: Fair value requirement,
Transaction provisions and Effective date.
The effective date of the standard is for years beginning on or after 01 April 2020.
The municipality expects to adopt the standard for the first time in the 2020/2021 unaudited separate annual financial
statements.
It is unlikely that the standard will have a material impact on the municipality's unaudited separate annual financial
statements.
GRAP 38: Disclosure of interests in Other Entities
The objective of this Standard is to require an entity to disclose information that enables users of its financial statements to
evaluate:
. the nature of, and risks associated with, its interests in controlled entities, unconsolidated controlled entities, joint
arrangements and associates, and structured entities that are not consolidated; and . the effects of those interests on
its financial position, financial performance and cash flows.
If furthermore covers Definitions, Disclosing information about interests in other entities, Significant judgements and
assumptions, Investment entity status, Interests in controlled entities, Interests in joint arrangements and associates,
Interests in structured entities that are not consolidated, Non-qualitative ownership interests, Controlling interests acquired
with the intention of disposal, Transitional provisions and Effective date.
The effective date of the standard is for years beginning on or after 01 April 2020.
The municipality expects to adopt the standard for the first time in the 2020/2021 unaudited separate annual financial
statements.
It is unlikely that the standard will have a material impact on the municipality's unaudited separate annual financial
statements.
GRAP 36: Investments in Associates and Joint Ventures
The objective of this Standard is to pescribe the accounting for investments in associates and joint ventures and to set out
the requirements for the application of the equity method when accounting for investments in associated and joint ventures.

Chris Hani District Municipality
Annual Financial Statements for the year ended June 30, 2020
Notes to the Annual Financial Statements
2. New standards and interpretations
44
It furthermore covers Definitions, Significant influence, Equity method. Application of the equity method. Separate financial
statements, Transitional provisions and Effective date.
(continued)
The effective date of the standard is for years beginning on or after 01 April 2020.
The municipality expects to adopt the standard for the first time in the 2020/2021 unaudited separate annual financial
statements.
It is unlikely that the standard will have a material impact on the municipality's unaudited separate annual financial
statements.
GRAP 37: Joint arrangements
The objective of this Standard is to establish principles for financial reporting by entities that have an interest in
arrangements that are controlled jointly (i.e. joint arrangements).
To meet this objective, the Standard defines joint control and requires an entity that is a party to a joint arrangement to
determine the type of joint arrangement in which it is involved by assessing its rights and obligations and to account for
those rights and obligations in accordance with that type of joint arrangement.
It futhermore covers Definitions, Joint arrangements, Financial Statements and parties to a joint arrangement, Separate
financial statements, Transitional provisions and Effective date.
The effective date of the standard is for years beginning on or after 01 April 2020.
The municipality expects to adopt the standard for the first time in the 2020/2021 unaudited separate annual financial
statements.
It is unlikely that the standard will have a material impact on the municipality's unaudited separate annual financial
statements.
GRAP 110 (as amemded 2016): Living and Non-living Resources
The objective of this Standard is to prescribe the:
. recognition, measurement, presentation and disclosure requirements for living resources; and .
disclosure requirements for non-living resources.
It furthermore covers Definitions, Recognition, Measurements, Depreciation, Impairment, Compensation for impairment,
Transfers, Derecognition, Disclosure, Transitional provisions and Effective date.
The subsequent amendments to the Standard of GRAP on Living and Non-living Resources resulted from editorial changes
to the original text and inconsistencies in measurement requirements in GRAP 23 and other asset-related Standards of
GRAP in relation to the treatment of transaction costs. Other changes resulted from changes made to IPSAS 17 on
Property, Plant and Equipment (IPSAS 17) as a result of the IPSASB's Improvements to IPSASs 2014 issued in January
2015 and Improvements to IPSASs 2015 issued in March 2016.
The most significant changes to the Standard are:
. General improvements: To clarify the treatment of transaction costs and other costs incurred on assets acquired in
non-exchange transactions to be in line with the principle in GRAP 23; and to clarify the measurement principle when
assets may be acquired in exchange for a non-monetary asset or assets, or a combination of monetary and non-
monetary assets.
. IPSASB amendments: To clarify the revaluation methodology of the carrying amount and accumulated depreciation
when a living resources is revalued; To clarify acceptable methods of depreciating assets; and To define a bearer plant
and include bearer plants within the scope of GRAP 17 or GRAP 110, while the produce growing on bearer plants will
remain within the scope of GRAP 27.

Chris Hani District Municipality
Annual Financial Statements for the year ended June 30, 2020
Notes to the Annual Financial Statements
2. New standards and interpretations
45
The effective date of the standard is for years beginning on or after 01 April 2020.
The municipality expects to adopt the standard for the first time in the 2020/2021 unaudited separate annual financial
statements.
It is unlikely that the standard will have a material impact on the municipality's unaudited separate annual financial
statements.
(continued)
GRAP 34: Separate Financial Statements
The objective of this Standard is to prescribe the accounting and disclosure requirements for investments in controlled
entities, joint ventures and associates when an entity prepares separate financial statements.
It furthermore covers Definitions, Preparation of separate financial statements, Disclosure, Transitional provisions and
Effective date.
The effective date of the standard is for years beginning on or after 01 April 2020.
The municipality expects to adopt the standard for the first time in the 2020/2021 unaudited separate annual financial
statements.
It is unlikely that the standard will have a material impact on the municipality's unaudited separate annual financial
statements.
GRAP 18 (as amended 2016): Segment Reporting
Segments are identified by the way in which information is reported to management, both for purposes of assessing
performance and making decisions about how future resources will be allocated to the various activities undertaken by the
municipality. The major classifications of activities identified in budget documentation will usually reflect the segments for
which an entity reports information to management.
Segment information is either presented based on service or geographical segments. Service segments relate to a
distinguishable component of an entity that provides specific outputs or achieves particular operating objectives that are in
line with the municipality's overall mission. Geographical segments relate to specific outputs generated, or particular
objectives achieved, by an entity within a particular region.
The subsequent amendments to the Standard of GRAP on Segment Reporting resulted from editorial and other changes to
the original text have been made to ensure consistency with other Standards of GRAP..
The most significant changes to the Standard are:
. General improvements: An appendix with illustrative segment disclosures has been deleted from the Standard as the
National Treasury has issued complete examples as part of its implementation guidance.
The effective date of the standard is for years beginning on or after 01 April 2020.
The municipality expects to adopt the standard for the first time in the 2020/2021 unaudited separate annual financial
statements.
The impact of this standard is currently being assessed.

Chris Hani District Municipality
Annual Financial Statements for the year ended June 30, 2020
Notes to the Annual Financial Statements
2020 2019
Restated*
R R
46
3.Property, plant and equipment
Land
Buildings
Machinery and Equipment
Furniture and Office
Equipment
Transport assets
Computer equipment
Infrastructure: Water
Infrastructure: Sanitation
Infrastructure: Roads Work-
in-progress
Total
2020 2019
Cost / Valuation Accumulated depreciation and accumulated impairment
Carrying value Cost / Valuation
Accumulated depreciation and accumulated impairment
Carrying value
30,345,900 - 30,345,900 30,345,900 - 30,345,900
85,739,244 (10,421,553) 75,317,691 57,308,930 (9,096,408) 48,212,522
23,314,712 (10,237,320) 13,077,392 19,587,337 (7,882,930) 11,704,407
24,448,655 (15,416,419) 9,032,236 22,376,404 (13,311,029) 9,065,375
101,535,152 (40,911,604) 60,623,548 101,070,115 (36,472,583) 64,597,532
13,598,248 (11,065,164) 2,533,084 13,256,441 (9,947,347) 3,309,094
3,988,405,746(1,100,267,216)2,888,138,530 3,921,960,471 (971,827,922)2,950,132,549
452,910,867 (174,107,304) 278,803,563 432,703,707 (157,062,976) 275,640,731
13,684,165 (2,844,561) 10,839,604 13,684,165 (2,287,127) 11,397,038

Chris Hani District Municipality
Annual Financial Statements for the ended 30 June 2020
Notes to the Annual Financial Statements Figures in Rand
3. Property, plant and equipment (continued)
Reconciliation of property, plant and equipment - 2020
Opening balance Additions Disposals
Transfers received Transfers Depreciation
Impairment loss Total
Land 30,345,900 - - - - - - 30,345,900
Buildings 48,212,522 - - 28,430,314 - (1,325,145) - 75,317,691
Machinery and Equipment 11,704,407 3,727,375 - - - (2,354,390) - 13,077,392
Furniture and Office Equipment 9,065,375 2,072,762 - - - (2,105,901) - 9,032,236
Transport assets 64,597,532 1,357,009 (727,974) - - (4,603,019) - 60,623,548
Computer equipment 3,309,094 354,375 (8,043) - - (1,122,342) - 2,533,084
Infrastructure: Water 2,950,132,549 16,861,123 - 49,586,470 - (128,441,612) - 2,888,138,530
Infrastructure: Sanitation 275,640,731 - - 20,207,161 - (16,970,560) (73,769) 278,803,563
Other property, plant and equipment - - - - - - - -
Infrastructure: Roads 11,397,038 - - - - (557,434) - 10,839,604
Work-in-progress
Reconciliation of property, plant and equipment - 2019
689,614,051 308,665,288 - - (97,828,344) - 900,450,995
4,094,019,199 333,037,932 (736,017) 98,223,945 (97,828,344)
(73,769)4,269,162,543
Opening balance Additions Disposals
Transfers received Transfers Depreciation
Impairment loss Total
Land 11,495,900 - - 18,850,000 - - - 30,345,900
Buildings 47,140,091 - - 30,578,309 (28,777,364) (728,514) - 48,212,522
Machinery and Equipment 11,782,461 1,975,001 - - - (2,053,055) - 11,704,407
Furniture and office equipment 10,626,517 496,348 - - - (2,057,490) - 9,065,375
Transport assets 51,916,682 18,064,867 (135,440) - - (5,248,577) - 64,597,532
Computer equipment 4,363,535 342,980 (39,915) - - (1,357,506) - 3,309,094
Infrastructure: Water 2,967,765,862 7,151,356 - 98,104,878 - (122,889,547) - 2,950,132,549
Infrastructure: Sanitation 292,381,270 260,203 - - - (16,999,482) (1,260) 275,640,731

Chris Hani District Municipality
Infrastructure: Roads 9,891,127 - - 1,923,327 - (417,416) - 11,397,038
WIP 508,831,883 300,775,420 - - - 689,614,051
3,916,195,328 329,066,175 (175,355) 149,456,514
(1,260)4,094,019,199
45

Chris Hani District Municipality
Annual Financial Statements for the year ended June 30, 2020
Notes to the Annual Financial Statements
49
3. Property, plant and equipment (continued)
Pledged as security
There are no assets that have been pledged as security during the current year.
3.1 Expenditure incurred to repair and maintain property, plant and equipment
Expenditure incurred to repair and maintain property, plant and equipment
included in Statement of Financial Performance
Contracted services: Refer to note 29 91,621,592 108,972,577
The following projects were identified to have taken longer than expected for their completion date. These assets have not been
disclosed as slow-moving assets under construction in the financial statements:
Tender/BID Description Function Date project awarded No. of years WIP register WIP register
Number awarded per contract project running 30 June 2019 30 June 2020
register/award letter (Closing Balance) (Opening
Balance)
51/2014/MD(BL) Cala Bulk Sanitation 18 11 2015 5 R54 209 485.79 R54 209 485.79
Services
Upgrading
Cala WWTW
including Bulk
Pump Station and Associated
Rising Mains Phase 1
33/2015/MD(TN) CHDM Water Water 09 12 2015 5 R166 573 989.85 R166 573 989.85
Supply Backlog
Cluster 9 Tsomo River Abstraction
and WWTW
Construction
20/2015/MD(TN) CHDM Water Water 28 03 2015 5 R488 228.38 R488 228.38
Supply Backlog
Cluster 4 Quick
Wins Phae 2
Gaseni-B Water Supply
37/2010/MD(AM) Refurbishment Sanitation 18 05 2010 10 R4 550 609.25 R4 550 609.25 &
Upgrading of
Water and Sewer
Infrastructure in
Ilinge
A register containing the information required by section 63 of the Municipal Finance Management Act is available for inspection
at the registered office of the municipality.
The municipality applies the Standards of GRAP on Impairment of Cash-generating Assets and Impairment of Non-cash
generating Assets to assess whether items of Property, Plant and Equipment are impaired through a review of the carrying
amounts of assets against the recoverable amounts for each asset. At 30 June 2020, no assets were assessed to be impaired.
2020 2019 Restated*

Chris Hani District Municipality
Annual Financial Statements for the year ended June 30, 2020
Notes to the Annual Financial Statements
50
R R
4. Intangible assets
Computer software, other
2020 2019
Cost / Valuation
Accumulated amortisation and accumulated impairment
Carrying value Cost / Valuation
Accumulated amortisation and accumulated impairment
Carrying value
7,844,616 (7,116,315) 728,301 7,844,616 (6,354,909) 1,489,707
Reconciliation of intangible assets - 2020
Opening Amortisation Total balance
Computer software, other 1,489,707 (761,406) 728,301
Reconciliation of intangible assets - 2019
Opening balance
Additions
Disposals Amortisation Total
Computer software, other 2,165,908 - (23,198) (653,003) 1,489,707
Pledged as security
There are no intangible assets that are pledged as security:
5. Investments in controlled entities
Name of company Held by % holding % holding
2020 2019 Carrying amount 2020
Carrying amount 2019
Chris Hani Development Agency 100.00 % 100.00 % 1,500,000 1,500,000
The carrying amounts of controlled entities are shown net of impairment losses.
Chris Hani Development Agency
The district municipality has a 100% shareholding in Chris Hani Development Agency. The purpose of the municipal entity is to
carry out the promotion and implementation of the local economic development initiatives and investment promotion in Chris
Hani District. The municipal entity was fully operational during the 12 months and all contributions made by the district
municipality were treated as Grants and Subsidies paid, refer to Note 32.
6. Operating lease liability/asset
Current liabilities (1,291,772) (600,219)
Operating Leases are recognised on a straight line basis as per the requirements of GRAP 13. In respect of Non-cancellable
Operating Leases the following liabilities have been recognised:
Balance at the beginning of the year 600,219 63,489 Operating lease expense recorded 691,553 536,730

Chris Hani District Municipality
Annual Financial Statements for the year ended June 30, 2020
Notes to the Annual Financial Statements
51
1,291,772 600,219
7. Prepayments
Prepayments relate to payments made to Eskom for connections. No connections made in 2019/2020. No connections
confirmed as at 30 June 2020 amounting to R315 675 for Engcobo Project and R586 758 for Tsomo Project connections raised
in 2018/2019.
Payments made in advance
Current Assets 315,675 2,383,988
8. Inventories
Inventory stores 16,671,342 11,398,511 Water inventory 391,852 391,852 17,063,194 11,790,363
9. Receivables from non-exchange transactions
Sundry receivables - Roadworks subsidy** 6,427,679 13,102,622 Local Municipalities 11,870,640 4,191,907 Rental and Eskom service deposits 11,262,233 9,846,153 Other Debtors 5,083,960 4,279,262 DHS Emergency Housing 1,023,070 - Operating Lease 371,680 92,920 36,039,262 31,512,864

Chris Hani District Municipality
Annual Financial Statements for the year ended June 30, 2020
Notes to the Annual Financial Statements
2020 2019
Restated*
R R
52
9. Receivables from non-exchange transactions (continued)
**Included in the total of Roads subsidy is an amount of R6.4million which is >3 years old
Local municipalities consists of loans to Enoch Mgijima amounting to R9,870,636.00 and Sakhisizwe Local Municipality
R2,000,000.
Service deposits consists of rental deposits and Eskom service deposits.
Other debtors consists of amounts receivable from bursary loan obligation, Vodacom from previous years, Transfer monies,
Bank Errors and Others.
DHS Emergency has an agreement with the municipality that incur expenditure for Emergrncy houses and claim to the
department. R1,023,070.00 was spent in 2019/20 and invoices submitted to the department.
Gross Balances Receivables from non-exchange
Road work subsidy 6,427,679 13,102,622 Local Municipalities 11,870,640 4,191,907 Rental and Eskom deposits 11,262,233 9,846,153 DHS Emergency Housing 1,023,070 - Other Debtors 5,083,960 4,279,262 Operating Leases 371,680 92,920 Gross Balance 36,039,262 31,512,864
Receivables from non-exchange transactions past due but not impaired
Other receivables from non-exchange transactions which are less than 3 months past due are not considered to be impaired. At
June 30, 2020, and 2019 were past due but not impaired.
The ageing of amounts past due but not impaired is as follows:
3 months past due - - Roads subsidy 6,427,679 13,102,622 - - -Local Municipalities 11,870,640 4,191,907 -Rental and Eskom deposits 11,262,233 9,846,153 -Other Debtors 5,083,960 4,279,262 DHS Emergency Housing 1,023,070 - Operating Leases 371,680 92,920 Total 36,039,262 31,512,864
Receivables from non-exchange transactions impaired
As of June 30, 2020, other receivables from non-exchange transactions of R 35 966 392 were past due but not impaired
None of the financial assets for the period ended 30 June 2020 have been determined individually for impairment
Receivables from non exchange pledged as security
None of the financial assets as disclosed are held as collateral nor have they been used for any other credit enhancements:
10. VAT receivable
VAT Receivables 1,123,365,490 1,117,697,471

Chris Hani District Municipality
Annual Financial Statements for the year ended June 30, 2020
Notes to the Annual Financial Statements
2020 2019
Restated*
R R
53
VAT Payables
11. Receivables from exchange transactions
Gross balances
Water 1,487,843,291 1,184,282,323 Sewerage 524,419,876 472,803,743
Sundry Debtors
Less: Allowance for impairment Water (1,208,165,425) (978,926,762) Sewerage (488,883,745) (440,030,089)
Sundry debtors
Net balance Water 279,677,866 205,355,561 Sewerage 35,536,131 32,773,654 Sundry Debtors 113,012 44,036 315,327,009 238,173,251
Water Current (0 -30 days) 25,621,427 99,255,814 31 - 60 days 26,947,684 40,570,297 61 - 90 days 25,438,467 25,228,548 91 - 120 days 28,626,008 25,455,651 121 - 365 days 273,659,423 238,679,535 > 365 days 1,107,550,281 755,092,477
Sewerage Current (0 -30 days) 7,166,327 17,062,593 31 - 60 days 6,171,553 5,616,182 61 - 90 days 6,121,065 5,533,756 91 - 120 days 6,174,822 5,516,439 121 - 365 days 54,301,815 54,941,947 > 365 days 444,510,161 384,132,825
Sundry Debtors Current (0 -30 days) 102,276 38,805 31 - 60 days - 5,231 61 - 90 days - 2,533 91 - 120 days 2,734 4,903 121 - 365 days 24,551 23,653 > 365 days 2,503,207 2,513,583 (2,519,756) (2,544,672) 113,012 44,036
Reconciliation of allowance for impairment Balance at beginning of the year (1,421,501,524) (1,222,102,221)
(1,065,376,241) (1,040,477,128)
57,989,249 77,220,343
2,632,768 2,588,709
2,014,895,935 1,659,674,775
(2,519,756) (2,544,673)
(1,699,568,926) (1,421,501,524)
(1,208,165,424) (978,926,762)
279,677,866 205,355,560
(488,883,745) (440,030,089)
35,561,998 32,773,653

Chris Hani District Municipality
Annual Financial Statements for the year ended June 30, 2020
Notes to the Annual Financial Statements
2020 2019
Restated*
R R
54
Contributions to allowance (278,067,402) (199,399,303)
11. Receivables from exchange transactions (continued)
(1,699,568,926) (1,421,501,524)
Receivables from non exchange pledged as security
None of the financial assets as disclosed are held as collateral nor have they been used for any other credit enhancements.
Receivables from non exchange past due but not impaired
Consumer debtors that are identified as relating to government institutions have not been impaired as there is a general
expectation that amounts owing will be settled.
Receivables from non exchange impaired
None of the financial assets for the period ended 30 June 2020 have been determined individually for impairment.
12. Cash and cash equivalents
Cash and cash equivalents consist of:
Cash on hand 4,200 4,200 Bank balances 20,599,528 104,191,343 Short-term deposits 21,643,330 273,723,783 42,247,058 377,919,326
Short-term deposits are investments with a maturity period of less than 3 months and earn interest rates varying from 5.50% to
6.70% per annum. Investments are made up of short-term deposits held for unspent conditional grants that are ringfenced until
the conditions are met and utilised.
Credit quality of cash at bank and short term deposits, excluding cash on hand
The credit quality of cash at bank and short term deposits, excluding cash on hand that are neither past due nor impaired can
be assessed by reference to external credit ratings (if available) or historical information about counterparty default rates:
Excess cash is invested with reputable finance institutions with good credit ratings. The municipality had the following
bank accounts ` Account number / description Bank statement balances Cash book balances
June 30, 2020 June 30, 2019 June 30, 2018 June 30, 2020 June 30, 2019 June 30, 2018 First National Bank - Current 62002510693
18,629,607 98,656,166 75,220,724 18,629,607 98,656,166 (13,422,606)
First National Bank - Call Account - 62004499481
894,576 61,252 13,588,735 894,576 61,252 13,588,735
First National Bank - Call Account - 62190652521(CRR)
241,891 212,916,295 242,754,637 241,891 212,916,295 242,754,637
First National Bank - Call Account - 62187939784
624,256 59,048,632 7,506,142 624,256 59,048,632 7,506,142
First National Bank - Call Account - 62187936532(National)
3,632,818 1,297,853 1,166,978 3,632,818 1,297,853 1,166,978
First National Bank - Call Account - 62187938538(Provincial)
16,249,789 399,693 1,027,204 16,249,789 399,693 1,027,204

Chris Hani District Municipality
Annual Financial Statements for the year ended June 30, 2020
Notes to the Annual Financial Statements
2020 2019
Restated*
R R
55
First National Bank - Public Sector - Cheque Account 62610267602
1,969,921 5,535,177 8,220,867 1,969,921 5,535,177 8,220,603
Total 42,242,858 377,915,068 349,485,287 42,242,858 377,915,068 260,841,693
13. Employee benefit obligations
The amounts recognised in the statement of financial position are as follows:
Carrying value
Present value of the defined benefit obligation-wholly unfunded 52,877,247 (56,272,624) Present value of the defined benefit obligation-partly or wholly funded 14,733,698 (14,915,690) 67,610,945 (71,188,314)
Non-current liabilities (63,435,951) (65,893,340) Current liabilities (4,174,994) (5,294,974) (67,610,945) (71,188,314)
Changes in the present value of the Post Medical benefit obligation are as follows:
Opening balance 56,272,624 48,552,148 Benefits paid (2,868,929) (1,338,853) Net expense recognised in the statement of financial performance (526,448) 9,059,329 52,877,247 56,272,624
Net expense recognised in the statement of financial performance
Current service cost 3,408,054 2,715,019 Interest cost 5,494,783 4,711,659 Actuarial (gains) losses (9,429,285) 1,632,651 (526,448) 9,059,329
Calculation of actuarial gains and losses
Actuarial (gains) losses – Obligation (9,429,285) 1,632,651
Key assumptions used
Assumptions used at the reporting date:
Discount rates used 13.04 % 10.02 % Expected rate of return on assets 7.29 % 6.02 % Expected rate of return on reimbursement rights 8.79 % 7.52 % Actual return on reimbursement rights 3.91 % 2.33 % . Long Service Awards Liability
The municipality operates an undefined benefit plan for all its employees under the plan, a long service award is payable after 5
years of continuous service, and every 5 years thereafter, to 45 years of conitnuous service. the provision is an estimate of the
long service based on historical staff turnover.
Reconciliation of long service awards - June 2020
Opening Balance
Additions Utilised during the year
Total
Long Service Awards 14,915,690 2,483,632 (2,665,624) 14,733,698
Reconciliation of long service awards - June 2019
Opening Balance
Additions Utilised during the year
Total

Chris Hani District Municipality
Annual Financial Statements for the year ended June 30, 2020
Notes to the Annual Financial Statements
2020 2019
Restated*
R R
56
. Long Service Awards Liability (continued)
Long Service Awards 13,567,990 2,897,490 (1,549,790) 14,915,690
The most recent acturial valuations of plan assets and the present value of the defined benefit obligation were carried out at 30
June 2020 by One Pangaea Expetise & Solutions. The present value of the defined benefit obligation, and the related current
service cost and past service cost were measured using the Projected Credit Unit Method.
At year end 30 June 2020, 819 (2019: 857) employees were eligible for the Long service awards.
The current service cost for the year ending 30 June 2020 was estimated to be R953 064 whereas the cost of the ensuing year
is estimated to be R1 681 217.
The principle assumtpions used for the purpose of the acturial valuation were as follows:
GRAP25 defines the determination of the investment return assumption to be used as the rate that can be determined by
reference to market yields (at the balance sheet date) on government bonds. The currency and term of the government bonds
should be consistent with the currency and estimated term of the obligation.
The methodology for setting the financial assumptions has been updated to be more duration specific. At the previous valuation
report, 30 June 2019 the duration of liabilities was 5.30 years. At this duration the discount rate determined by using the Bond
Exchange Zero Coupon Yield Curve as at 27 June 2020 is 7.41% per annum, and the yield on inflation-linked bonds of a similar
term was about 4.23% per annum. This implies an underlying expectation of inflation of 2.57% per annum ([1 + 7.41% 0.5%] / [1
+ 4.23%] - 1).
We have assumed that salary inflation would exceed general inflation by 1.00% per annum, i.e. 3.57% per annum. However,
it is the relative levels of the discount rate and salary inflation to one another that is important, rather than the nominal
values. We have thus assumed a net discount factor of 3.71% per annum ([1 + 7.41%] / [1 + 3.57%] - 1).
Discount rate 7.41% 7.94% Consumer price inflation 2.57% 4.28% Normal salary increase 3.57 5.28% Net effective discount rate 3.71% 2.53%
Changes in the present value of the long service awards are as follows:
Opening balance 14,915,690 13,567,990 Current year service cost 953,064 732,152 Interest cost 1,087,992 1,134,748 Benefits paid (2,665,624) (1,549,790) Actuarial losses 442,576 1,030,590 14,733,698 14,915,690
The amount recognised in the statement of financial position are as follows:
Present value of the long service awards wholly unfunded 14,733,698 14,915,690
Next expense recognised in the statement of financial performance
Current service cost 953,064 732,152 Interest cost 1,087,992 1,134,748 Actuarial losses 442,576 1,030,590 2,483,632 2,897,490
- -

Chris Hani District Municipality
Annual Financial Statements for the year ended June 30, 2020
Notes to the Annual Financial Statements
2020 2019
Restated*
R R
57
. Current Employee Benefits for Medical Aid and Long Service Awards
Medical Contribution subsidies 2,127,433 2,868,929 Current Portion of Long Service Awards 2,047,561 2,426,045 4,174,994 5,294,974
14. Consumer deposits
Water 507,696 441,108
15. Payables from exchange transactions
Trade payables 223,852,814 227,152,534 Payments received in advanced 8,198,082 6,192,028 Retentions 37,111,156 34,790,461 Bonus Provisions 9,097,182 7,502,240 Accrued leave pay 15,659,558 13,940,707 Deposits received (held as Surety) 8,335 8,335 Other payables 27,545,986 25,035,186 321,473,113 314,621,491

Chris Hani District Municipality
Annual Financial Statements for the year ended June 30, 2020
Notes to the Annual Financial Statements
2020 2019
Restated*
R R
58
16. Unspent conditional grants and receipts
Unspent conditional grants and receipts comprises of:
Unspent conditional grants and receipts
National: Municipal Infrastructure Grant (MIG) 1 81,589,393 National: EPWP 93,455 - PRV DPT AGEN - PROVINCIAL AIDS COUNCIL - - Municipal Disaster Covid-19 1,559,319 - National: Department of Transport - Rural Road Asset Mgt Grant 1,744,065 3,196,975 Provincial: RBIG 19,514,739 101,046,222 National : WSIG 19,906,277 49,692,137 National : MWIG - 29,159,488 42,817,857 264,684,216
Unspent provincial and national funds Provincial: Department of Economic Affairs and Trade 360,655 360,655 Provincial: Office of the Premier 21,569 21,569 Provincial: Treasury 1,606,965 1,606,965 Provincial: Department of Transport 1,732,096 1,732,096 Provincial: Department of Economic Affairs 14,308,884 14,308,884 Other Spheres of Government 43,478 43,478 Lapesi Project 42,197 42,197 Provincial: Department of Housing, Local Gvt and Traditional Affairs 1,158,656 1,158,656 National: Department of Rural Development and Land Reform 402,614 402,614 National: Sport and Development 16,140,327 16,140,327 35,817,441 35,817,441
Total unspent conditional grants and receipts
Balance at the beginning of the year 300,501,657 114,249,016 Additions during the year 1,042,665,648 916,690,874 Income recognition during the year (1,030,597,007) (730,438,233)
Unspent conditional grant re-payment -
The nature and extent of government grants recognised in the annual financial statements and an indication of other forms of
government assistance from which the municipality has directly benefited; and
Unfulfilled conditions and other contingencies attaching to government assistance that has been recognised.
See note 24 for reconciliation of grants from National/Provincial Government . The operating grants amounting to R42,817,857.
Unspent conditional grant relate to R35 million is not presented in note 24 because there is no movement since 2008/2009
financial year.
These amounts are invested in a ring-fenced investment until utilised.
17. Accumulated surplus
Ring-fenced internal funds and reserves within accumulated surplus - 2020
Accumulated Surplus
Prior year Total adjustment
Opening balance 4,148,656,452 (50,809,926)4,097,846,526 Surplus 173,006,941 - 173,006,941 4,321,663,393 (50,809,926)4,270,853,467
(233,935,000)
78,635,298 300,501,657

Chris Hani District Municipality
Annual Financial Statements for the year ended June 30, 2020
Notes to the Annual Financial Statements
59
274,987
746,616
18. Revenue
Service charges 300,505,479 305,466,551 Other income 2,020,782 746,616 Interest received 78,495,610 74,351,178
Government grants & subsidies
The amount included in revenue arising from exchanges of goods or services are as follows:
Service charges 300,505,479 305,466,551 Other income 2,020,782 746,616 Interest received 78,495,610 74,351,178 381,021,871 380,564,345
Taxation revenue Transfer revenue
Government grants & subsidies 1,042,665,648 916,690,873
19. Service charges
Service charges 7,359 34,711 Sale of water 241,312,886 249,329,356 Sewerage and sanitation charges 59,185,234 56,102,484 300,505,479 305,466,551
20. Other Income
Tender documents 510,700 471,629 VAT on Conditional Grant 1,042,205 - Sundry receipts 467,877
2,020,782
Sundry receipts consists of Handling fees of R307 831.44, VAT on Conditional Grants of R388 979.93 & Inspection fees R160
046.06
21. Interest Income
Interest revenue
Bank 1,366,655 1,572,615 Interest - investments 19,347,805 34,283,108 Interest - debtors 57,781,150 38,495,455
78,495,610 74,351,178
- - 78,495,610 74,351,178
22. Government grants and subsidies
Operating grants
2020 2019 Restated*
R R
17. Accumulated surplus (continued)
Ring-fenced internal funds and reserves within accumulated surplus - 2019
Accumulated Surplus Total
Opening balance 4,035,788,786 4,035,788,786
Surplus 112,867,666 112,867,666
1,042,665,648 916,690,873
1,423,687,519 1,297,255,218

Chris Hani District Municipality
Annual Financial Statements for the year ended June 30, 2020
Notes to the Annual Financial Statements
2020 2019
Restated*
R R
60
-
Equitable share 543,689,000 524,527,000
Finance Management Grant 1,250,000 1,250,000 Municipal Infrastructure Grant Operational 123,898,493 37,348,362 EPWP 4,548,545 6,158,000 DHS Emergency Housing - 1,583,192 LG SETA 564,824 669,190 Rural Sustainable Village 4,126,374 6,200,000 Municipal DIS Covid-19 1,956,681 - Rural Road Asset Management Grant 1,676,935 - Prov: Roads Subsidies 16,701,091 20,679,101 698,411,943 598,414,845
Capital grants Municipal Infrastructure Grant 164,724,721 151,942,246 Water Services Infrastructure Grant 93,714,723 75,940,025 Regional Bulk Infrastructure Grant 85,814,261 90,393,758 344,253,705 318,276,029
698,411,943 598,414,845 344,253,705 318,276,029 1,042,665,648 916,690,874
Equitable Share
In terms of the Constitution, this grant is used to subsidise the provision of basic services to indigent community members. National: Municipal Infrastructure Grant (MIG)
Balance unspent at beginning of year 81,589,393 - Current-year receipts 287,034,000 270,880,000 Conditions met - transferred to revenue (288,623,215) (190,879,822) Re-payment of unspent (80,000,178) 1,589,215
81,589,393
Conditions still to be met - remain liabilities (see note 16).
Rural Sustainable Village
22. Government grants and subsidies (continued)
Current-year receipts 4,126,374 - Conditions met - transferred to revenue (4,126,374) -
-
Municipal Disaster Covid-19
Current-year receipts 3,516,000 - Conditions met - transferred to revenue (1,956,681) - 1,559,319 -
Provincial: Department of Roads
Current-year receipts 16,701,091 32,586,506 Conditions met - transferred to revenue (16,701,091) (20,679,101)
-

Chris Hani District Municipality
Annual Financial Statements for the year ended June 30, 2020
Notes to the Annual Financial Statements
2020 2019
Restated*
R R
61
Other - (18,002,637) - 6,095,232
-
Conditions still to be met - remain liabilities (see note 16).
National: EPWP
Current-year receipts 4,642,000 6,158,000 Conditions met - transferred to revenue (4,548,545) (6,158,000)
93,455
Conditions still to be met - remain liabilities (see note 16).
National: Finance Management Grant
Balance unspent at beginning of year 1 1 Current-year receipts 1,250,000 1,250,000 Conditions met - transferred to revenue (1,250,000) (1,250,000)
Conditions still to be met - remain liabilities (see note 16).
National: DOT - Rural Road Asset Management Grant
Balance unspent at beginning of year 3,196,975 2,680,975 Current-year receipts 3,421,000 3,229,000 Conditions met - transferred to revenue (1,676,935) (2,713,000) Re-payment of unspent (3,196,975) - 1,744,065 3,196,975
Conditions still to be met - remain liabilities (see note 16).
22. Government grants and subsidies (continued)
National: Regional Bulk Infrustructure Grant
Balance unspent at beginning of year 101,046,222 29,439,980 Current-year receipts 105,329,000 162,000,000 Conditions met - transferred to revenue (85,814,261) (90,393,758)
Re-payment of unspent -
Conditions still to be met - remain liabilities (see note 16)
.
Water services Infrastructure Grant (WSIG)
Balance unspent at beginning of year 49,692,137 - Current-year receipts 84,461,000 137,300,000 Conditions met - transferred to revenue (93,714,723) (87,607,863) Re-payment of unspent (49,691,625) - (9,253,211) 49,692,137
-
-
1 1
(101,046,222)
19,514,739 101,046,222

Chris Hani District Municipality
Annual Financial Statements for the year ended June 30, 2020
Notes to the Annual Financial Statements
2020 2019
Restated*
R R
62
Conditions still to be met - remain liabilities (see note 16).
Water Service Infrastructure Grant 2
Balance unspent at beginning of year 29,159,488 32,991,649 Conditions met - transferred to revenue - (3,832,161) 29,159,488 29,159,488
Conditions still to be met - remain liabilities (see note 16).
Grant: Emergency Housing
Current-year receipts - 1,583,192 Conditions met - transferred to revenue (1,023,070) - Debtor raised 1,023,070 -
Re-payment of unspent (1,583,192)
Conditions still to be met - remain liabilities (see note 16)
-
- -

Chris Hani District Municipality
Annual Financial Statements for the year ended June 30, 2020
Notes to the Annual Financial Statements
2020 2019
Restated*
R R
23. Employee related costs
63
Basic 210,918,071 195,335,188 Bonus 15,162,818 15,059,407 Overtime payments 13,872,563 11,791,339 Medical Aid - company contributions 21,757,210 36,575,941 Pension Fund Contributions 33,001,300 30,824,821 Group Life Insurance 1,429,558 1,229,283 UIF 1,723,437 1,561,898 Travel, motor car, accomodation, subsistence & other allowances 31,505,167 25,377,367 Housing benefits & allowances 2,144,076 2,166,271 Leave pay provision charge 5,246,927 7,816,668 Industrial Council Levies 90,126 86,256 Long-service awards 2,041,056 3,031,387 338,892,309 330,855,826
Remuneration of municipal manager - G. Mashiyi
Annual Remuneration 397,481 - Car and other allowances 219,235 - Performance Bonuses 87,803 - Contributions to UIF, Medical and Pension Funds 744 - Other allowances 18,472 - Non Pensionable 97,564 -
821,299
-
During 2018/2019 to Jan 2020, Dr BJ Mtembu was an acting Municipal Manager. Mr G. Mashiyi was appointed from Feb 2020
Remuneration of Acting Municipal Manager - Dr BJ Mthembu
Acting Allowance 144,539 111,862
The Municipal Manager resigned on 13 March 2018 Remuneration of Municipal Manager - M.A. Mene
Performance Bonuses - 635,891
(continued)
Remuneration of Chief Financial Officer - M. Dyushu
Annual Remuneration 697,423 - Car and other allowances 305,617 - Performance Bonuses 88,367 - Contributions to UIF, Medical and Pension Funds 1,190 - Other allowances 65,742 - Non Pensionable 164,243 - 1,322,582 -
From July 2018 to March 2019 Ms N. Fetsha was a Chief Financial Officer. From 18 March 2019 to Dec 2019, Mr. T.
Pambaniso was an acting Chief Financial Officer. Mr. M. Dyushu was appointed from Jan 2020. Remuneration of
Former CFO: N. Fetsha
Annual Remuneration - 1,320,084

Chris Hani District Municipality
Annual Financial Statements for the year ended June 30, 2020
Notes to the Annual Financial Statements
2020 2019
Restated*
R R
23. Employee related costs
64
Car and other allowances - 372,268 Performance Bonuses - 169,833 Contributions to UIF, Medical and Pension Funds - 1,785 Other allowances - 7,615 Other - 83,204
-
Remuneration of Acting CFO: T. Pambaniso Acting Allowances 215,036 131,027
Remuneration of Director: Corporate Services - Y. Matakane-Dakuse
Annual Remuneration 1,075,609 1,069,346 Car and other allowances 415,860 395,837 Performance Bonuses 182,998 169,926 Contributions to UIF, Medical and Pension Funds 242,324 229,777 Other allowances 8,744 - 1,925,535 1,864,886
Remuneration of Director: Health Services - Y. Sinyanya
Annual Remuneration 1,075,609 1,179,763 Car and other allowances 427,960 408,448 Performance Bonuses 182,981 169,967 Contributions to UIF, Medical and Pension Funds 230,051 217,848 Other allowances 8,744 7,720 1,925,345 1,983,746
Remuneration of Director: Integrated Planning and Development - Z. Shasha
Annual Remuneration 1,064,741 1,057,180 Car and other allowances 421,223 406,976 Performance Bonuses 181,544 165,441 Contributions to UIF, Medical and Pension Funds 234,254 213,411 Other allowances 8,656 7,643 1,910,418 1,850,651
(continued)
Remuneration of Director: Strategic Services - B. Mthembu
Annual Remuneration 1,092,524 1,129,020 Car and other allowances 424,577 402,898 Performance Bonuses 270,455 83,204 Contributions to UIF, Medical and Pension Funds 242,324 157,013 Other allowances 112 105 2,029,992 1,772,240
Acting allowance for Director: Strategic Service is disclosed separately from the Annual remuneration. Remuneration
of Director: Technical Services - L. Govu
Annual Remuneration 957,240 - Car and other allowances 389,045 -
1,954,789

Chris Hani District Municipality
Annual Financial Statements for the year ended June 30, 2020
Notes to the Annual Financial Statements
2020 2019
Restated*
R R
23. Employee related costs
65
Performance Bonuses 160,785 - Contributions to UIF, Medical and Pension Funds 177,708 - Other 26,857 - 1,711,635 -
Mr M. Dungu's contract expired in October 2018. From October 2018 to July 2019 Mr M. Shasha was acting. Mr L. Govu was
appointed in August 2019. The acting allowance disclosed below is already included in the Municipal staff.
Remuneration of Acting Director: Technical Services - M. Shasha
Acting Allowance 20,937 198,803
Remuneration of Director: Technical Services: M. Dungu Annual Remuneration - 525,230 Car and other allowances - 146,242 Performance Bonuses - 80,021 Contributions to UIF, Medical and Pension Funds - 20,767 Other allowances - 3,105
-
775,365
24. Remuneration of councillors
Executive Mayor 1,087,797 1,215,547 Deputy Executive Mayor 878,397 277,865 Mayoral Committee Members 4,840,124 5,141,791 Speaker 878,397 843,697 Councillors 2,833,296 3,420,208 Chief Whip 826,011 766,117 Sec 79 Chair 881,777 - 12,225,799 11,665,225
25. Depreciation and amortisation
Property, plant and equipment 157,076,616 151,486,915 Intangible assets 761,406 653,003 157,838,022 152,139,918

Chris Hani District Municipality
Annual Financial Statements for the year ended June 30, 2020
Notes to the Annual Financial Statements
2020 2019
Restated*
R R
66
26. Finance cost
Interest cost 88,047 266,610

Chris Hani District Municipality
Annual Financial Statements for the year ended June 30, 2020
Notes to the Annual Financial Statements
2020 2019
Restated*
R R
67
27. Debt impairment
Debt impairment 278,891,121 173,390,698
28. Bulk purchases
Water 16,046,762 19,156,293
29. Contracted services
Presented previously
Outsourced services 65,714,252 98,039,043 Consultants and professional fees 11,043,876 26,159,686 Other contractors / Repairs and Maintenance 91,621,592 108,972,577 168,379,720 233,171,306
Presented previously 168,379,720 233,171,306
30. Transfers and subsidies
Other subsidies
VIP Toilets 89,100,961 15,377,111 Chris Hani Development Agency 34,038,080 29,339,125 123,139,041 44,716,236
Grants paid to ME's - - Other subsidies 123,139,041 44,716,236 123,139,041 44,716,236
31. General expenses
Advertising 2,013,367 4,095,553 Auditors' remuneration 8,441,686 6,840,434 Bank charges 1,590,321 1,495,684 Computer expenses 12,294,128 9,085,722 Consumables 12,207,385 6,293,981 Entertainment 1,627,443 2,652,423 Hire 195,714 1,032,631 Insurance 2,148,916 1,779,440 Education & Marketing 830,122 985,845 Motor vehicle expenses 978,434 1,959,738 Fuel and oil 26,612,834 26,051,612 Postage and Courier 6,885 304,820 Printing and stationery 4,266,901 8,269,235 Protective clothing 1,548,506 2,052,387 Staff welfare 2,158,649 17,823,539 Subscription and membership fees 3,805,208 11,569,039 Telephone and fax 3,565,691 3,655,933 Travel - local 11,214,218 19,632,322 Assets Expensed 2,956,134 3,358,910 Electricity 22,886,470 36,178,439 Rates 121,921 401,595 Water Sampling 2,465 146,696 Refuse 40,629 78,174 Sewerage 156 269

Chris Hani District Municipality
Annual Financial Statements for the year ended June 30, 2020
Notes to the Annual Financial Statements
2020 2019
Restated*
R R
68
12,825,714
1,114,990,408
Public events and Imbizo 59,500 1,078,097 Study assistance reimbursements 191,361 157,042 Communication 879,710 1,266,435 31. General expenses (continued)
Penalties - 9,351,124 Indingent Subsidy 8,948,469 11,350,853 Chemicals 10,596,260 8,651,931 Skills Development Levy 2,958,380 2,824,134 Operating Leases 6,604,850 5,533,838 151,752,713 205,957,875
32. Auditors' remuneration
Fees 8,441,686 6,840,434
33. Cash generated from operations
Surplus Adjustments for:
173,006,941 112,867,666
Depreciation and amortisation 157,838,022 152,139,918 Loss on sale of assets and liabilities 312,667 155,654 Impairment deficit 73,768 - Debt impairment 278,891,121 173,390,698 Non-cashflow movements in employee cost 5,409,340 - Actuarial gain / (losses) Changes in working capital:
(8,986,709) 1,632,651
Inventories (5,272,831) 4,551,851 Receivables from exchange transactions (77,153,758) (122,425,992) Other receivables from non-exchange transactions (4,526,398) 18,906,936 Prepayments 2,068,313 8,381,519 VAT Payable movement - (5,384,303) Payables from exchange transactions 6,851,822 177,828,736 VAT 19,230,944 (77,220,343) Unspent conditional grants and receipts (221,866,359) 186,252,641 Consumer deposits 66,588 111,922 Non-cash Flow movement in Employee cost - 2,895,736 Movement operating lease liability 691,553 536,730 326,635,024 634,622,020
34. Commitments
Authorised capital expenditure
Already contracted for but not provided for
Infrastructure 860,219,206 625,591,235 Buildings 183,954,807 188,181,242 Other 57,990,681 55,241,311 Community 3,684,641
872,698,429
Total capital commitments Already contracted for but not provided for 1,114,990,408 872,698,429

Chris Hani District Municipality
Annual Financial Statements for the year ended June 30, 2020
Notes to the Annual Financial Statements
2020 2019
Restated*
R R
69
This committed expenditure relates to plant and equipment and will mainly be financed by Infrastructure Grants (Municipal Infrastructure Grant, Regional Bulk Grant and Municipal Water Infrastructure Grant) as well as available bank facilities, accumulated surplus.

Chris Hani District Municipality
Annual Financial Statements for the year ended June 30, 2020
Notes to the Annual Financial Statements
2020 2019
Restated*
R R
70
34. Commitments (continued)
Operating leases - as lessee (Buildings)
Minimum lease payments due
- within one year 1,874,294 1,897,977 - in second to fifth year inclusive - 103,170 1,874,294 2,001,147
Operating leases - as lessee (Other Equipment)
Minimum lease payments due
- within one year 2,229,469 2,228,812 - in second to fifth year inclusive 1,300,524 3,714,686 3,529,993 5,943,498
Certain of the municipality's equipment is held to generate rental income. Rental of equipment is expected to generate rental
yields of -% on an ongoing basis. Lease agreements are non-cancellable and have terms from 3 to 6 years. There are no
contingent rents receivable.
Dividends or similar distributions proposed, but not authorised for distribution
35. Contingencies
Contingent liabilities
The municipality is party to the following litigation matters
Litigations
6,077,585 7,841,475
The Municipality as the 1st Defendant in the matter relating to a motor vehicle accident that occurred between a CHDM employee and the Plaintiff. The Plea has been filed and we have filed our Rule 23 Notices. Plaintiff has filed a Rule 24(9)(a) and (b) Notice.
74,000 -
Claim by Civil and General Construction CC. Application to interdict and restrain CHDM from continuing with tender process and are awarding tender to Urban Africa Services pending hearing of main Application which is for the review and setting aside of the decision to award the bid to Urban Africa Services. Opposed Main Application enrolled for hearing on 4 August 2016. Matter decided in the municipality’s favour, but the Applicant has applied for leave to appeal the decision of the Court. Application for Leave to Appeal granted. Appellant has prosecuted Appeal. Appeal heard, and granted in favour of the Appellant.
Municipality has filed Leave to Appeal to the SCA. Leave to Appeal dismissed with costs.
Costs of Appeal have yet to be taxed, and it is the responsibility of the successful party to tax costs, and Civil & General have yet taxed the costs.
500,000 500,000
Claim by City Square Trading 204 (Pty) Ltd against CHDM and one other for goods supplied and service rendered. CHDM is the 2nd Defendant in the matter. Action defended and was set down for the 26th of August 2020. We filed a Request for Trial Particulars and await a response thereto. We have finalised the Rule 37 Minute
8,500,000 8,500,000
Plaintiff, Total Laboratory Technologies, issued summons against the Municipality for goods allegedly, supplied and delivered. Judgement was granted by default. The municipality partially disputes the claim and hence is in the process of applying for the rescission of judgement. Matter withdrawn
- 125,000
35. Contingencies (continued)

Chris Hani District Municipality
Annual Financial Statements for the year ended June 30, 2020
Notes to the Annual Financial Statements
2020 2019
Restated*
R R
71
Plaintiff, Arise and Shine Security & Cleansing Services, brought a claim for service rendered and outstanding claims against the Municipality. Matter has been defended and the Municipality is in the process of filling a counterclaim for a lost generator. Matter withdrawn.
- 400,000
The Municipality defends a claim that was brought against it for damages allegedly caused by blasting while the Municipality implemented an infrastructure project. The Municipality has defended the action. A plea was served via email to the Plaintiff and that we are awaiting proof of filing from C/O attorney to proceed with discovery
400,000 500,000
The Municipality has defended action for damages allegedly caused by the Municipality’s employees while performing operations and maintenance duties. Telkom’s claim still needs to be fully substantiated.
100,000 100,000
Applicant (Mopo Mene) making an application to set the decision of Council to rescing his appointment aside. Matter has been opposed, and papers in opposition have been filed. No replying affidavit has been filed. Matter is still pending. The liability will be limited to the remuneration amount for the remainder of the contract of employment. Financial exposure is too remote for the matter to be considered a contingent liability.
- 200,000
Claim by A.M. Putter and 4 others regarding obligation of CHDM to pay medical aid contributions to surviving spouse of deceased employee / retired employee. Awaiting judgement and amount is indeterminable. . Matter was referred to oral evidence and heard at High Court before Judge Makaula in 2016. He reserved judgment, and he has not delivered same for the past 4 (four) years.,
300,000 300,000
Rumdel Construction brought an action for an alleged non-payment of Certificate No. 21 arising out of a project for construction of a pipeline and a Water Treatment Works at Tora in the Ngcobo Area. Though the matter is not disputed by the Engineering Services Directorate, it appears that the reason for non-payment is the fact that the amount due arises out of variation order that was agreed to despite the contract already had reached a threshold of 20 percent for variation orders (and without approaching Council). Council has not been approached despite the fact that this matter has been within the knowledge of the directorate for a period of more than 6 (six) months. The matter was been defended purely on technical grounds in order to allow the directorate time to deal with the matter, and also to avoid judgment and eventual attachment of municipal assets. Capital amount (interest waived) have been paid, and the only thing left is legal costs that shall be settled.
30,000 -
Truda Foods (Pty) Ltd brought an application against the Municipality and others to declare failure to give them permits unlawful, and also restrain the Municipality from closing its business premises. Matter has been argued at Court on the 3rd of September 2020, and judgment has been reserved.
200,000 -
Arbitrator at SALGBC awarded in favour of Dr AM Sambumbu to be re-instated at work with effect from 2019. A further order is that he should be paid an amount of R 512, 017.40, which represents an equivalent of monthly salary of R 56, 890.83 for a period of 9 months. The Municipality has approached the Labour Court in view to review the decision. Matter is ongoing.
1,300,000 -
Directors have performance agreements which were signed in the beginning of the year. Performance reviews are done and sumitted to council for approval after which the director will receive a bonus. At year end, performance reviews were not done. Once reviews are done and directors have met their performance targets, the council will have the final approval for the payment of the bonus. Depending on the approval of by council, the municipality might be liable to pay R992 952 as performance bonus to the directors who has met their targets.
- 992,952
11,404,000 11,617,952
36. Related parties `

Chris Hani District Municipality
Annual Financial Statements for the year ended June 30, 2020
Notes to the Annual Financial Statements
2020 2019
Restated*
R R
72
Relationships Associates Refer to note - KEY MANAGEMENT OF THE MUNICIPALITY HAVE
RELATIONSHIPS WITH BUSINESSES AS INDICATED BELOW
Mashiyi Gcobani Member in Iziphumo Consulting Solutions; Member in Technical Cross Holdings; Member in Latitoez Food Enterprise; Member in Ikhwezi Lomso Trading and Projects
Somkoko Mvuyeleni Member of Jange and Mlungu Civils; Spouse is a member of Kuvala 205 Trading Enterprise Member of Delubom Transport, L Delubom Trading and MTN Zakhane Shares; Spouse is a member of Lulwazi Trading Enterprise and MTN Zakhane Shares
Mfecane Anita Member in Anitaza Trading Delubom Lindile Member of Delubom Transport, L Delubom Trading
and MTN Zakhane Shares; Spouse is a member of Lulwazi Trading Enterprise and MTN Zakhane Shares
Memani Thobela Headwell Child is a Member of Vunoleo Building & Civil Youth Construction
Makonza Asanda 100% Membership in Seasons Find 1260 CC; Member of Funumbona Construction &Projects
Shasha Mzwamadoda Moses 100% Membership in Safika Rural Development Consultants
Mapatwana Ntombizanele Member of Brainwave Project 205 Gqodo Zixolisile Member of GZ Civil Engineering and Member of FC
Builders &Construction Katsere Tendai 35% Membership of Mazvita Trading; 100%
Membership of Jekeso Communications; Member of Relilite Investments; Spouse is a member of Umzali Trading Enterprise
Gobeni Nonelela Director of Hi-Lite Development Agency; Member of Ulutho Funerals
Makwabe Thandisizwe 50% Membership in Mokoti Construction Tito Sibongile Director of Smith Tabata Lucando Bulelani 33% membership in El Shaddai Civil and Building
Contractors Petela Neziwe Member of Kumbu &Lam Trading Enterprise; Member
of Kei Recyclers; Spouse is a member of Cool Ideas 1413 Director in BS Holdings
Dlova Zingisile Gidion Director in Zinbar Enterprise Madikane Thozama 50% Membership in Secreets Trading; 50%
Membership in Koelro No 106; 100% Membership In Silkyline Hair Studio
Nqwemeshe Nomvuyo Spouse is a member of Liso Security Services&Trading
COUNCILLORS REFER TO LIST OF COUNCILLORS DISCLOSED UNDER GENERAL INFORMATION. COUNCILLORS OF THE MUNICIPALITY HAVE RELATIONSHIPS WITH BUSINESSES AS INDICATED BELOW:
Cengani Jongumzi 25% Membership in Four of us Construction & Development; 50% Membership in Manga-Manga Trading Enterprise; 100% Membership in Ntandoyam Trading 44; 33% Membership in CMZ Tours
Mbali Xolela 25% Membership in Amabandla Construction

Chris Hani District Municipality
Annual Financial Statements for the year ended June 30, 2020
Notes to the Annual Financial Statements
2020 2019
Restated*
R R
36. Related parties (continued)
73
Dyantyi Sinethemba Reginald Director and Founding Member of Happy ValleyAbattoir Co-operative Limited; Director of Sanelisa Services; Director of Tlholo Entrepreneur Support Centre
Gela Wongama Director of Ithemba Liyaphilisa Financial Services; Director of Sesinethemba Construction; 10% Membership in Silver Solutions 2978; 20% Membership in Sikhuselu'Iuntu Protection and Training Services; 20% Membership in The Best Mining and Transportation Services; 20% Membership in Urafile Trading
Goniwe Nyameka 33,33% Membership in Karoo Furniture Manufacturers; 33,33% Membership in Umehluko Developments; 33,34% Membership in Imvelo Agencies; 50% Membership in Balisa Sivelise Productions
Koyo Mxolisi Clifford Director of Tsomo Valley Farmers; 100% Membershipin MBK Consulting Services; Spouse Has membership in Buyie's Catering Service, Liwalama Trading Enterprise and Qamata Agric Service
Nkwentsha-Gunuza Lindiwe Member in Lembede Investments Holdings; Member in Lembede Strategic Investments; Sangolekhaya Funeral Services; Tando-Luzuko Trading and Projects; Sunrise Coach Services
Nyukwana Nomveliso 30% Membership in Liqhakazi Construction and Projects
Myataza Saziso Member of Hluthamhlali Multi-purpose Trading Vimbayo Kholiswa Member in Border Rural Committee Radzilani NR Member of Forecast Traders Roskruge N 0% Membership in Liqhakazi Construction and
Projects; 100% Membership in Amilile Trading Enterprise
Shweni ZR Spouse is a member of Shweni Trading, Ngxongounathi security, Bomi investment Holdings, Bomi investment Holdings, Eand So civil engineering and construction, Hlumisa Travelling Agency, Ezomso training and conference centre, Lilitha vehicle hire, Manzana Mancoba and Shweni Heavy Duty Transportation Olona Trading and Project
Bula Mzwandile Nelson Founding member of Mthunziwethu Trading Cooperative , Polonius Investments, Bendis Investments, Zinkamba Trading 1002, Gobashe Trading Enterprise
Deliwe Zanemvula Director in Beyond 2030 Consulting Services; Member in Top Town Farmers Agric Co-op
Mdwayingana William Member in Mdwamtwa Construction & facilitation; Member in Mpoza-mpoza Business Solutions; Member in Masichume Fattening Agriculture Bring About
Twani Sylvia Director in Qamata Tembisile Hani Intergrated Energy Centre Co-operative Limited; 25% Maq no Security & Cleaning Services

Chris Hani District Municipality
Annual Financial Statements for the year ended June 30, 2020
Notes to the Annual Financial Statements
2020 2019
Restated*
R R
74
Nquma Nombuyiselo Patricia 33.4% Membership in Fenas and Nquma Civils and Property Developers
Mfundisi Nomalizo 33% Membership in Hewu Farming Project Ntakana Siyavuma Member in Abahlobo Benene Trading & Projects;
Ntakana Brothers Transport & Construction MUNICIPAL EMPLOYEES EMPLOYEES OF THE MUNICIPALITY HAVE
RELATIONSHIPS WITH BUSINESSES AS INDICATED BELOW:
Hlahla Mtibe NNV Spouse is a member of Yovo Trading Enterprise MR MM SHASHA- SENIOR MANAGER WSA Spouse/Partner/Associate NOMALIZO MONICA
DAMOYI has an interest in BITLINE SA 1060CC MR MT MAVUNDHLA- WSP: O & M TECHN (INKWANCA
Related party transactions
Interest paid to (received from) related parties
Spouse/Partner/Associate AGNES MAKAZI MATROSS has an interest in MAMA TROSKIE
TRADING ENTERPRISE
Wezi Gqiza - 9,450 Keith Ngesi Media (Pty) Ltd 86,500 211,250 Ian S Development Services 28,320 55,770 Vodacom (Pty) Ltd 1,657,741 834,164 Mesilane Projects 13,950 - Rumdel Construction 2,401,441 5,050,548 Buyile No. 88 Construction and Catering 22,500 15,200 Izaphetha Trading and Projects - 9,900 Chris Hani Development Agency 42,712,842 38,661,185 Mduba General Trading 17,000 7,500 Guard Risk Life Limited (Medway) - 3,000 Ubomi Civils Construction Services - 717,568 Chris Hani Choral Music Association
37. Unauthorised expenditure
297,000 249,600
Opening balance 616,684,082 616,684,082 Current year expenditure 135,640,341 - 752,324,423 616,684,082
During 2018/19 financial year, the municipality tabled the adjusted budget for 2018/19 to council in addressing unauthorised
expenditure for the 2016/17 financial year in terms of section 28(2)(g) of the MFMA read together with regulation 23(6)(b) of
the MBRR. An adjustment budget contemplated in section 28(2)(g) of the Act may only authorise unauthorised expenditure as
anticipated by section 32(2)(a)(i) of the Act.
The unauthorized expenditure amounting to R5 231 582 was caused by the Department of Roads which had a budgeted
amount of R29 000 000 and actual expenditure amounting to R27 149 252, however the municipality received R21 917 670
from the Department of Roads.
The current year unauthoriesd expenditure will be tabled to council with the audit report in terms of section 28(2)(g) of the
MFMA read together with regulation 23(6)(b) of the MBRR. This will include the total amount of unauthorised expenditute that
will be investigated by MPAC as per the Council resolution,however, MPAC started phase one investigating irregular expenditure. After that the investigation will focus on unauthorised and fruitless and wasteful expenditure. 38.
Fruitless and wasteful expenditure
Opening Balance 14,057,743 3,854,654 Fruitless & Wasteful - Current year 88,047 267,617 Penalty and Interest from Dept of Labour - 9,351,124

Chris Hani District Municipality
Annual Financial Statements for the year ended June 30, 2020
Notes to the Annual Financial Statements
2020 2019
Restated*
R R
75
1,382,073,473
1,465,761,217
Advance payment for services not received - 584,348 Amount paid to incorrect account 554,683 - Asset not paid by the insurance 41,068 - 14,741,541 14,057,743
38. Fruitless and wasteful expenditure (continued)
The opening balance is still under MPAC investigation as well as the current year balance. R554 683 , management has
conducted disciplinary hearing for three employees from Budget and Treasury Office. Two employees are still on suspension
since March 2020 and one is dimissed during December 2020. The process is not yet finalised. R41 068, was claimed from
insurance but was not paid and the municipality paid.
39. Irregular expenditure
Opening balance 1,465,761,217 1,382,073,473 Add: Irregular Expenditure - current year 25,196,606 83,687,744
Less: Amount written off by Council
Analysis of expenditure awaiting condonation per age classification
Current year 25,196,606 83,687,744 Prior years 392,224,746
417,421,352
Details of irregular expenditure – current year
1. Inherited from LM - No documentation could be found as the appointment was made before SCM came into effect
6,559,395
2. No documentation could be found as the appointment was made before SCM came into effect
12,545,958
3. Deviation not in line with regulation 36 and SCM Policy
2,126,194
4. Service provider appointed to identify municipal buildings and land. It was raised
-
5. CHDM does not have its own truck & TLB 3,965,059 25,196,606
Details of irregular expenditure - Prior year
1. Proof that the bidder has no undisputed commitments for municipal services for which payment is overdue for more than 90 days, could not be obtained; No proof of registration with CIBD; Original or certified copy of BEE Certificate could not be obtained; Company registration documents not attached.
35,463,838
2. Inherited from LM - No documentation could be found as the appointment was made before SCM came into effect
91,559
3. No documentation could be found as the appointment was made before SCM came into effect.
11,457,377
(1,073,536,471) -
417,421,352 1,465,761,217

Chris Hani District Municipality
Annual Financial Statements for the year ended June 30, 2020
Notes to the Annual Financial Statements
2020 2019
Restated*
R R
76
4. Incorrect PPPFA Points used in the advert, specification, evaluation and adjudication, as the project was advertised after 01 April 2017 using the old regulation after the implementation of the revised PPPFA
20,096,618

Chris Hani District Municipality
Annual Financial Statements for the year ended June 30, 2020
Notes to the Annual Financial Statements
2020 2019
Restated*
R R
77
39. Irregular expenditure (continued)
5. No declaration made by winning bidders regarding past 5 years; No evidence of risk assessment being conducted by CHDM for the awarded bidder.
10,467,628
6. The tender was advertised for less than the required number of days as per the SCM regulations (i.e <30 days)
186,300
7. Procurement process not followed (Operating) 5,924,425 83,687,745
The municipality had R1,4 billion as disclosed in note 39. This is a cumulative from 2010 financial year. Management tabled to
Council during 2017/2018 for condonation, however, Council resolved that MPAC should conduct an investigation. During
2019/2020 a service provider (LUNIKA INCORPORATE) was appointed to assist the MPAC investigation. LUNIKA
INCORPORATE conducted an investigation and the report was submitted to MPAC recommending that an amount of R530m
be written off by Council and that it was made as such. The second phase of conducting an investigation was concluded by
LUNIKA INCORPORATE amounting to R543m and tabled to Council for write off, that made a total of R1,073 billion and left the
council with the Irregular expenditure balance of R417m. The investigation report does not state any irregularities or money that
can be recovered from any staff member.
40. Additional disclosure in terms of Municipal Finance Management Act
SALGA
Opening balance - - Current year subscription / fee - 3,140,930 Amount paid - current year - (3,140,930)
-
Audit fees
Opening balance - - Current year subscription / fee 8,441,686 7,809,441 Amount paid - current year (8,441,686) (7,809,441)
PAYE and UIF
Opening balance - - Current year subscription / fee 53,449,851 35,751,375 Amount paid - current year (53,449,851) (35,751,375)
Pension and Medical Aid Deductions
Opening balance - - Current year subscription / fee 49,111,677 45,751,375 Amount paid - current year (49,111,677) (45,751,375)
41. Deviation from supply chain management regulations
Paragraph 12(1)(d)(i) of Government gazette No. 27636 issued on 30 May 2005 states that a supply chain management policy
must provide for the procurement of goods and services by way of a competitive bidding process.
-
- -
- -
- -

Chris Hani District Municipality
Annual Financial Statements for the year ended June 30, 2020
Notes to the Annual Financial Statements
2020 2019
Restated*
R R
78
41. Deviation from supply chain management regulations (continued)
Paragraph 36 of the same gazette states that the accounting officer may dispense with the official procurement process in
certain circumstances, provided that he records the reasons for any deviations and reports them to the next meeting of the
accounting officer and includes a note to the annual financial statements.
Deviations - 30 June 2020 Budget and Treasury Office
Technical Services
Corporate services and health services
Total
Acquisition of a jetting Machine - 2,961,835 - 2,961,835 Approval of RFQs could not be done on time and extension of scope was granted
256,554 - - 256,554
Emergency situation - 870,704 1,526 872,230 NG Municipal Disaster Covid-19 - - 2,250,183 2,250,183 256,554 3,832,539 2,251,709 6,340,802
42. Water Distribution Losses
Water losses
Water Distribution loss 182,114,933 8,408,804
The Municiplaity incurred water distribution losses in the current year estimated at 68.28% amounting to R182 114 933.
The Municiplaity incurred water distribution losses in the previous year estimated at 15% amounting to R8 408 804
Statement of Financial Position
1. Receivables from non-exchange transactions
The restatement of receivables from non-exchange transactions was due to the following reasons:
. The Inxuba Yethemba Municipality debtor raised in 2017/18. The district municipality loan the municipality with the
R12,000,000.00 and have an agreement that the payment wil be settled with invoices sent to the municipality on electricity; and
. During 2018/19 the outstanding amount was R9,103,108.00 and the reconciliation between the two municipalities was done
however the process on the system was not done up until the Annual Financial Statements for 2018/19 submitted and audited
by Auditor General. The error is corrected in 2019/20.
2. VAT Receivables
. The VAT receivable increase because of accruals that was not yet raised in 2018/19
. The prepayment was recognised as the connection was done in 2014.
. Operating leases that was overstated in 2018/19.
. Prepayment that was raised in 2018/19 though it was already connected in April 2019
3. Prepayments
Prepayment was restated due to the following reasons:
. An amount of R10,489,293 was paid to Eskom for connection during 2010/11 for Xonxa Dam. During 2018/19 Auditor General
raised the finding that the prepayment is having more years while there is no connection. An investigation was made to Eskom
for all prepayments raised amounting to R10 489 293, R315,675 that was raised in 2016/17 and R586,758 raised in 2018/19. .
The municipality received the confirmation from Eskom that Xonxa was connected in 2015 and the 2 projects were connected in
2019/20 and 1 project Jojweni was connected in April.

Chris Hani District Municipality
Annual Financial Statements for the year ended June 30, 2020
Notes to the Annual Financial Statements
2020 2019
Restated*
R R
79
. 1 Project is not yet confirmed by Eskom as it was stopped and the money was transferred to another account and investigation
is still in progress by the Engineering Department; and
. Upon the information received from Eskom and the municipality, technician confirmed that the connection was made for 2
projects in 2018/19.
4. Receivables from exchange transactions
During the drafting of 2019/20, it was identified that there is a misallocation of votes for vat receivable and receivable from
exchange transaction. The reason of misallocation was that in 2017/18 vote 15407687010ZZZZZZZWD and description was
written Output Vat Prov Doubtful Debt Impairment, however in 2018/19 vote was 15407687010ZZZZZZZWD and the description
was Prov D/Ful Debt Imp CHDM Opening balance.
5. Property, Plant and Equipment
The Property, Plant and Equipment were restated due to the below transactions:
. Correction of retention balance that was understated amounting to R664,428.09
. Project completed in 2018/19 but not transferred to PPE amounting to R31,666,886.52
. Payment not recognised in previous year as accrual amounting to R312,420.76
. Alignment of WIP register to Trial Balance amounting to R1,328,856.46
. The prepayment amounting to R150,019.00 for Jojweni Booster was recognised as prepayment during preparation of 2018/19
financials although it was already connected in April 2019.
. 2 Infrastructure: We received the asset registers for moveable assets and the following corrections were made:
a) Project number 33/2013/MD(BL) was completed in 2015/16 however only R51,709,081.45 was capitalised and not
the wholetotal project amounting to R65,815,391.50. When the error was corrected in the previous year, a debit was passed
on retained earnings instead of capitalisation to infrastrucute asset.
b) Project number 18/2011/MD(LM) was completed in 2016/17, however it was not capitalised. When the error was
correctedin the previous year, a debit was passed on retained earnings instead of capitalisation to infrastructure asset. .
Reversal of 2010/2011 prepayment connected in 2015 for project . Project completed in 2018/2019 not transferred to PPE.
. During the correction of the prepayment it was noted that the opening balance of R10,765,506.95 was understated by
R39,461.05.
. Casting error

Chris Hani District Municipality
Annual Financial Statements for the year ended June 30, 2020
Notes to the Annual Financial Statements
2020 2019
Restated*
R R
43. Prior period errors
80
(continued)
. We reviewed the asset register for moveable assets and the following corrections were made:
- Casting errors were corrected.
- Formular errors on the spreadsheet were corrected.
- Recalculated depreciation amounts.
- Recalculated accumulated depreciation.
- Corrected carrying values with negative amounts.
- Checked and corrected duplicated assets.
- Corrected misclassification of assets.
- The effect of the differences will be processed as adjustments to the general ledger as per reconciliation.
- Duplication was caused by the journal passed during 2018/19 from repairsand maintenance.
6. Payables from exchange
The payables from exchange were restated due to accruals that were understated;
a) Accruals, the following necessitated the restatement of accruals;
. There were invoices paid during 2019/20 relating to 2018/19 though they were not raised as accruals. The investigation of
payment voucher was done to all population and we found that only R3,704,250.36 invoices relating to previous years.
7. Employee benefit obligation
The reclassification of bonus provision from employee benefit obligation was made of an amount of R7,502,240.37 that was
moved to Payables from exchange transactions. 8. Unspent conditional grant
. The municipality was disclosing unspent conditional grant amounting to R42,936,412 since 2007/2008 up until 2018/19.
During the 2018/19 audit, the finding was raised and the investigation was not completed up until the audit report issued. . The
municipality continue with the investigation, the letters were sent to all affected departments relating to unspent conditional
grant and only the municipality succeed to receive as response from Development Bank of Southern Africa (DBSA) for the
amount of R7,118,971 that was confirmed by the DBSA that it was a loan not a conditional grant and the loan was fully paid by
the municipality.
. An error was corrected against the accumulated surplus; and
. The municipality is still waiting for Provincial Treasury intervention to departments for response of the unspent conditional
grant amounting to R35,817,441.
During 2017/2018 Management raised a debtor of R1,589,215.00 against MIG as it was an overspending. During 2018/2019
management recovered the debtor of R1 589,215.00 from MIG allocation and the recovered amount was audited and the
finding was raised in 2018/2019 that the municipality does not have a contractual agreement with MIG in order to recover the
overspending in the next allocation.
9. Operating Leases
Process followed to restate Operating Leases
. The municipality identify that the service provider that lease the photocopy machines started in 2018/19 financial year was
overbilling the municipality by R23,230.00 per month for other software that was not in the service level agreement. The matter
was discussed with the service provider (XEROX) and the acknowledgement of error was signed by the company.
. The municipality then raised the debtor for the fourth month of 2018/19 an amount of R92,920.00 and the agreement will be,
the credit note will be done in the October 2020 invoice.
10. Irregular Expenditure

Chris Hani District Municipality
Annual Financial Statements for the year ended June 30, 2020
Notes to the Annual Financial Statements
81
The prior year irregular register was reviwed to assess completeness of irregular payments and there were some payments
identified that were not previously disclosed. There were some other previously reported as irregular that were subsequently
found not to be irregular expenditure. Statement of Financial Performance
1. Government grants and subsidies
Government grants and subsidies has been restated for the reason below;
(continued)
. The municipality incurred expenditure for DHS Emergency housing during 2018/19 and the debtor was not raised. The
municipality is having an agreement with the department that they will incur expenditure and invoice the department. The
invoices were sent to the department and payment was recived for the invoices.
2. Contracted services
The contracted services were restated due to accruals that were restated.
3. General Expenses
The general expenses were restated due to accruals that were restated.
Statement of financial position As Previously Prior Period Reclassification Restated as at 30 June 2019 reported error s
1 &9 - Receivables from non-exchange transactions
40,523,052 (9,010,188) - 31,512,864
- - 2. VAT Receivables 168,712,503 1,871,357 (93,363,517) 77,220,343 3. Prepayment 13,006,341 (10,622,354) - 2,383,987 - - 4. Receivables from exchange transactions 238,173,251 - 91,416,403 329,589,654 5. Property Plant and Equipment 4,042,285,655 48,808,638 - 4,091,094,293 - - 6. Payables from exchange transactions (303,183,703) (4,368,678) (7,547,649) (315,100,030) 7. Employee Benefit Obligation 12,797,214 - (7,502,240) 5,294,974 8. Unspent conditional grant (307,614,605) 7,112,948 - (300,501,657) - - - - - - - - - - - -
-
-
Statement of Financial Performance As Previously reported
Prior Period error
Reclassification s
Restated as at 30 June 2019
1. Government grants & subsidies 915,107,681 1,583,192 - 916,690,873 - - - 2. Contracted Services 247,570,691 977,725 - 248,548,416 - - - 3. General Expenses 205,380,888 576,987 205,957,875
-
Cash Flow Statement Previously Reported
Prior Year Error Correction
Reclassificatio Movement Restated Amount ns
Sale of goods and services 183,787,174 - - (11,436,432) 172,350,742 Grants 1,121,969,887 - - (19,026,373) 1,102,943,514 Employee cost (353,800,311) - - 2,895,735 (350,904,576)
- -
3,904,699,708 33,791,723 (16,997,003) 3,921,494,428
- - -
1,368,059,260 3,137,904 - 1,371,197,164

Chris Hani District Municipality
Annual Financial Statements for the year ended June 30, 2020
Notes to the Annual Financial Statements
82
Suppliers (499,669,922) - - 174,313,148 (325,356,774) Property, Plant & Equipment (328,126,401) - - (939,774) (329,066,175) Other movement -
PYA - - -
124,160,427 - -
2020 2019 Restated*
R R
43. Prior period errors (continued)
1. Proof that the bidder has no undisputed commitments for municipal services for which payment is overdue for more than 90 days, could not be obtained; No proof of registration with CIBD; Original or certified copy of BEE Certificate could not be obtained; Company registration documents not attached.
Prevously Reported
Prior Period Error
Reclassificatio Restated as at n 30 June 2020
35,463,838 - - 35,463,838
2. Inherited from LM - No documentation could be found as the appointment was made before SCM came into effect
91,559 - - 91,559
3. No documentation could be found as the appointment was made before SCM came into effect.
11,457,377 - - 11,457,377
4. Incorrect PPPFA Points used in the advert, specification, evaluation and adjudication, as the project was advertised after 01 April 2017 using the old regulation after the implementation of the revised PPPFA
19,763,080 333,538 - 20,096,618
5. No declaration made by winning bidders regarding past 5 years; No evidence of risk assessment being conducted by CHDM for the awarded bidder.
10,071,904 395,724 - 10,467,628
6. The tender was advertised for less than the required number of days as per the SCM regulations (i.e <30 days)
186,300 - - 186,300
7. Procurement process not followed (Operating)
Subtotal
17,725,656 (11,801,231) - 5,924,425
94,759,714 (11,071,969) - 83,687,745
94,759,714 (11,071,969) - 83,687,745
Above adjustments of commitments register and update with new constracts identified.
NOTES TO THE FINANCIAL STATEMENT
Note 45 Financial Instruments [
The municipality is correcting the error of incomplete disclosure of Financial instrument where the prepayment was not included
amounting to R2 383 988.
(154,422,701) (154,422,701)
(8,616,397) 115,544,030

Chris Hani District Municipality
Annual Financial Statements for the year ended June 30, 2020
Notes to the Annual Financial Statements
83
44. Risk management
Financial risk management
The municipality’s activities expose it to a variety of financial risks: market risk (including interest rate risk, cash flow
interest rate risk ), credit risk and liquidity risk.
The Accounting Officer has overall responsibility for the establishment and oversight of the municipality's risk
management framework. The municipality's risk management policies are established to identify and analyse the risks
faced by the municipality, to set appropriate risk limits and controls and to monitor risks and adherence to limits.
The Directorate: Financial Services monitors and manages the financial risks relating to the operations through internal
policies and procedures. These risks include interest rate risk, credit risk and liquidity risk. Compliance with policies and
procedures is reviewed by the internal auditors on a continuous basis, and annually by external auditors. The
municipality does not enter into or trade financial instruments for speculative purposes.
Internal audit, responsible for initiating a control framework and monitoring and responding to potential risk, reports
periodically to the municipality’s audit committee, an independent body that monitors the effectiveness of the internal
audit function.
Liquidity risk
Liquidity risk is the risk that the municipality will encounter difficulty in meeting the obligations associated with its financial
liabilities that are settles by delivering cash or another financial asset.
Prudent liquidity risk management implies maintaining sufficient cash and marketable securities, the availability of
funding through an adequate amount of committed credit facilities and the ability to close out market positions. Due to the
dynamic nature of the underlying businesses, municipality treasury maintains flexibility in funding by maintaining
availability under committed credit lines.
The municipality’s risk to liquidity is a result of the funds available to cover future commitments. The municipality
manages liquidity risk by maintaining adequate reserves and banking facilities. The budget and treasury office monitors
the cashflow requirements on a regular basis.
The municipality's cashflows consist of short term deposits and current accounts with notice periods of 30 days or less.
Due to the short term nature of the portfolio a maturity analysis is not required.
Credit risk
Credit risk refers to the risk that a counter party will default on its contractual obligations resulting in financial loss to the
municipality. Due to the nature of the municipality's operations, the municipality has an obligation to provide services to
all qualifying people in its area. As such , the municipality is not able to select only credit worthy counterparts
Credit risk consists mainly of cash deposits, cash equivalents, investments and trade debtors.
The municipality only deposits cash with major banks with high quality credit standing and limits exposure to any one
counterparty.
Trade receivables comprise a widespread customer base. Management evaluates credit risk relating to customers on an
ongoing basis. Risk control assesses the credit quality of the customer, taking into account its financial position, past
experience and other factors. The existing trade receivables portfolio has historically been significantly impaired as a
result of a number of contributing factors . Trade receivables are thus presented net of an allowance for impairment
Except for trade and other receivables which have already been impaired, the following financial assets are exposed to
limited credit risk at year end:

Chris Hani District Municipality
Annual Financial Statements for the year ended June 30, 2020
Notes to the Annual Financial Statements
84
` Financial instrument 2020 2019 Interest rate swap 42,247,058 377,919,326 45. Financial instruments disclosure
Categories of financial instruments
2020
Financial assets
At fair value At amortised cost
At cost Total
Trade and other receivables from exchange transactions
- 315,327,009 - 315,327,009
Other receivables from non-exchange transactions
- 36,039,262 - 36,039,262
Cash and cash equivalents 42,242,858 - - 42,242,858 42,242,858393,609,129
Financial liabilities
At fair valueTotal
Trade and other payables from exchange -321,473,113
transactions
351,366,271 -
At amortised cost At cost
321,473,113 -
At amortised cost At cost
238,173,251 -
31,512,864 -
- -
- -
269,686,115 -
At amortised cost At cost
314,621,291 -

Chris Hani District Municipality
Annual Financial Statements for the year ended June 30, 2020
Notes to the Annual Financial Statements
85
2019
Financial assets
At fair valueTotal
Trade and other receivables from exchange -238,173,251 transactions
Other receivables from non-exchange -31,512,864 transactions
Consumer debtors --
Cash and cash equivalents 377,915,068377,915,068
377,915,068647,601,183
Financial liabilities
At fair valueTotal
Trade and other payables from exchange -314,621,291
transactions
46. Events after the reporting date
Coronavirus Disease of 2019 (COVID-19) Global Pandemic
The President of the Republic, Mr C Ramaphosa, on 15 March 2020, declared the COVID-19 pandemic a disaster in
terms of the Disaster Management Act (Act 57 of 2002). On midnight 26 March 2020, a national hard lockdown was
implemented.
The lockdown only allowed essential services. The Water Services, Health & Community Services, Customer Care, part
of the Budget and Treasury section and Human Resource formed part of these services. The lockdown and economic
depression have placed a material downward effect on the municipality revenue generating capacity.
46. Events after the reporting date (continued)
In June 2020 the Council approved an adjustment budget for the 2019/20 Financial to reflect the additional fund named
as Municipal Disaster Fund COVID 19 amounting to R3, 516,000 from National and incurred R1,956,681. The budget
was also re prioritized to meet COVID-19 Occupational Health and Safety.
In addition to the national disaster fund the municipality made a provision during the adjustment budget , the budget of
R1,887,500.00 and the expenditure incurred is R1,346,252.50 .The municipality incurred expenditure for masks, sanitizer
and appoint the service provider for disinfection where there is a reported case. The municipality does not have asset
bought for COVID 19 and there is a litigation occurred during the COVID 19 that affected the municipality.
During the hard lockdown the company called Truda Foods (PTY) Ltd brought an application for an interdict against
Chris Hani District Municipality together with the members of the South African Police Services closed their light foods
manufacturing and distribution premises at Queen Industrial, Ezibeleni, the company sought an order declaring that the
Municipality had no authority in terms of the Disaster Management Regulations to issue essential services permits for
their employee.( See note 37 Contingencies for further details)
The municipality has considered the COVID-19 pandemic in determining its Going Concern considerations. After taking
account current circumstances, future funding and projections the entity still considers the current Going Concern
standing as appropriate.
During July 2020
Municipal Council resolved a write-off all of the Debt that is irrecoverable for Joe Slovo Informal Settlement in the Intsika
Yethu
Local Municipality area. These RDP houses are currently registered under the Intsika Yethu Local Municipality's name
and the Municipality is in the process of transferring these houses to the individual owner's, however these households
has a combined debt on Water & Sanitation Accounts due to CHDM to the value of R8,386,811.46.
The Chris Hani District Municipality has in the past been unable to enhance its revenue to acceptable proportions which
would allow the municipality to discharge its fundamental mandate optimally. the municipality through its newly appointed
established working groups has taken a decision that the implementation of the revenue enhancement activity plan to
increase liquidity of the municipality.

Chris Hani District Municipality
Annual Financial Statements for the year ended June 30, 2020
Notes to the Annual Financial Statements
86
The outstanding debt owed by the customers of the CHDM has increased at a rapid rate since 2014. The current
outstanding balance as at the end of June 2020 stands at R2,015 with the collection rate averaging 8% for the 12 months
ended 30th June 2020. In order to encourage payment of outstanding debt on the customers, management is proposing
to introduce a once off debt payment incentive scheme. The proposed debt payment incentive or discount scheme will
require customers to pay a percentage of their debt which will result in a correspong percentage being written off from
their debt. This means that all payments received from qualifying customers towards the debt outstanding as at 30 June
2020 while the scheme is in process will count towards the discount provided that the current balance is settles in full
every month during the currency of the scheme. This was tabled and approved by Council on the 31st July 2020.
The following categories of customers: .
Domestic (Residential) customer's 50% discount . Non-profit organisations
(churches & NGO's) 50% discount
. Indigent households who have exceeded the 10kl consumption to be afforded a once off 100% discount.
During July 2020, Council approved disposal of assets for the period anding 30 June 2020. Management has identified
and placed all obsolete or assets that are obsolete and with poor condition from all Chris District Municipality offices to a
central storage. These assets are motor vehicles and office furniture that could not be individually identifiable due to their
worst / scrapped conditon and some of these assets have zero carrying value because they have surpassed their
allocated useful lives as per management policy.
47. Budget differences
Material differences between budget and actual amounts
Revenue:
1. Service charges: The decrease is caused by the billing estimation made during COVID 19.
2. Other Income:1)The municipality was planned to increase the revenue on rental for facilities however there was no
revenue genereated during 2020..
.
3. Interest Income : 1. The municipality budget the interest on debtors based on the previous year actual, however
because of the COVID 19 the estimation on billing cause the reduce on interest on debtors.
2.The municipality invest less during 2019/20 hence there is a decrease on investment interest..
4. Gains on disposal of asset: The municiaplity did not dispose any asset during the year hence there is no actual
amount because of the COVID 19.
5. Government Grants and subsidies: 1) The municipality recognised less expenditure and the budget was based on
that the municipality will fully recognise grants however because of the COVID 19 the spending did not move.
Expenditure
1. Employee related : The final placement of the WSSA staff made the increase on employee related costs.
2. Remunerationn of Councillors: The increase was caused by the resolution that paid Section 79 Councillors.
3. Depreciation and armotization: 1) The budget was based on the actual 2018/19 depreciation however there were
changes in the asset register that made decrease.
4. Finance cost: The budget was based on the actual 2018/19 and the municipality was putting the moniotring of late
payment by developing an invoice register and developing the SOP but the result did not have improved impact
5. Bulk Purchase: During the adjustment budget the municipality was having unfunded budget and this force the
municipality to cut the budget.
6. Contracted services: During the adjustment budget the municipality was having unfunded budget and this force the
municipality to cut the budget. Maintaining the cost contaiment also contributed.
7. Transfers and subsidies: The difference is already included in the operational cost as the Chris hani development
corporate .
8. General expenses: During the adjustment budget the municipality was having unfunded budget and this force the
municipality to cut the budget.

Chris Hani District Municipality
Annual Financial Statements for the year ended June 30, 2020
Notes to the Annual Financial Statements
87
9. Debt Impairment: The budget was based on the actual 2018/19 debt impairment because there measure in place to
improve rvenue collection like revenue enhancement strategy however the debt book increase because of the
COVID19.
Differences between budget and actual amounts basis of preparation and presentation
Changes from the approved budget to the final budget
The changes between the final and adjusted budget are consequence of changes in the municipal performance and
additional funding receipts from states institutions. For details on these changes please refer to the annual report

Chris Hani District Municipality
Annual Financial Statements for the year ended June 30, 2020
Notes to the Annual Financial Statements
88

Chris Hani District Municipality
Annual Financial Statements for the year ended June 30, 2020
Notes to the Annual Financial Statements
89

Chris Hani District Municipality
Annual Financial Statements for the year ended June 30, 2020
Notes to the Annual Financial Statements
90

91