Fifth Progress Report April 2019 – March 2020
44
International Cooperation and Development Food and Nutrition Security / Sustainable Agriculture Action on Plan Nutrition Fiſth Progress Report April 2019 – March 2020
-
Upload
khangminh22 -
Category
Documents
-
view
6 -
download
0
Transcript of Fifth Progress Report April 2019 – March 2020

InternationalCooperation andDevelopment
Food and Nutrition Security /Sustainable Agriculture
Actionon
PlanNutritionFifth Progress ReportApril 2019 – March 2020

European CommissionDirectorate-General for International Cooperation and DevelopmentRue de la Loi 41 – B-1049 BrusselsE-mail: [email protected]
Internethttp://ec.europa.eu/europeaid
Cover: Mother and daughter at food market.© iStockphoto. Credit: Tiago Fernandez
A C T I O N P L A N O N N U T R I T I O N : F I F T H P R O G R E S S R E P O R T1

Table of Contents Acronyms _________________________________________________________________________ 3
Key Messages _____________________________________________________________________ 4
Section 1. Introduction ______________________________________________________________________ 6
Background ________________________________________________________________________ 6
Scope of the fifth progress report _______________________________________________________ 8
Section 2. Progress in supporting partner countries to reduce the number of children stunted ______ 9
Stunting trends _____________________________________________________________________ 9
Factors associated with stunting reduction ______________________________________________ 12
Section 3. Progress in ensuring the allocation of EUR 3.5 billion to improve nutrition ______________13
Financial commitments to nutrition in 2018 _____________________________________________ 13
Financial commitments to nutrition since 2014 __________________________________________ 14
Nutrition disbursements, 2014-2018 ___________________________________________________ 15
Geographical distribution of development cooperation nutrition commitments _________________ 16
Budget support for nutrition __________________________________________________________ 17
Partnerships for nutrition ____________________________________________________________ 18
Section 4. Improvements in the lives of women and children – from resources to results __________20
AGPII: Harnessing agricultural investments to improve the diets of women and children in Ethiopia ______21
IRRIGAR: Homestead irrigation improves diets in Mali for women and children __________________ 23
Suchana: Ending the cycle of undernutrition in Bangladesh _________________________________ 25
The MDG1c programme: building resilience for better diets in Mozambique ____________________ 27
National Information Platforms for Nutrition: Using data to accelerate change in people’s lives ______29
Section 5. Conclusions ______________________________________________________________________31
Progress towards the EU’s commitments ________________________________________________ 31
Key insights from progress ___________________________________________________________ 31
Ongoing and emerging challenges _____________________________________________________ 32
Looking forward ____________________________________________________________________ 33
Annex 1: Stunting in children under 5 in the 42 countries prioritising nutrition __________________________ 34
Annex 2: Country dashboard of nutrition-relevant indicators ________________________________________ 35
A C T I O N P L A N O N N U T R I T I O N : F I F T H P R O G R E S S R E P O R T2

Acronyms2FAS Food Fortification Advisory ServiceAARR Average Annual Rate of ReductionAGPII Second Agricultural Growth ProgrammeAPN Action Plan on NutritionC4N Capacity for NutritionCSA Climate Smart AgricultureDAC Development Assistance Committee of the OECDDEVCO Directorate-General for International Cooperation and DevelopmentDFID UK Department for International DevelopmentDHS Demographic and Health SurveyDRC Democratic Republic of CongoECHO Directorate-General for European Civil Protection and Humanitarian Aid OperationsECOWAS Economic Community of West African StatesEU European UnionEUR EuroFAO Food and Agriculture Organization (United Nations)GII Gender Inequality IndexGIZ Gesellschaft für Internationale ZusammenarbeitGDP Gross Domestic ProductHANCI Hunger and Nutrition Commitment IndexIFAD International Fund for Agricultural DevelopmentIRRIGAR Initiative de Renforcement de la Résilience par l’Irrigation et la Gestion Appropriée des RessourcesJME Joint Malnutrition Estimates (UNICEF, WHO, World Bank Group)JRC Directorate-General Joint Research CentreIFPRI International Food Policy Research InstituteKfW German Development BankMDG1c Millennium Development Goal 1cMPI Global Multi-Poverty IndexNCDs Non-Communicable DiseasesNGOs Non-governmental OrganizationsNIPs National Indicative PlansNIPN National Information Platforms for NutritionNRF Nutrition Research FacilityOECD Organization for Economic Cooperation and DevelopmentSNNPR Southern Nations, Nationalities, and Peoples’ Region (Ethiopia)SRCT Stunting Reduction Calculation ToolSDGs Sustainable Development GoalsSETSAN Secretariat for Food and Nutrition Security (Mozambique)SUN Scaling Up NutritionWASH Water, Sanitation and HygieneWHA World Health AssemblyWHO World Health Organization (United Nations)WFP World Food ProgrammeUN United NationsUNICEF United Nations Children’s FundUNECA United Nations Economic Commission for AfricaUSAID United States Agency for International Development
A C T I O N P L A N O N N U T R I T I O N : F I F T H P R O G R E S S R E P O R T3

Key MessagesThis fifth progress report provides an update on achievements with respect to the European Union’s (EU) two ambitious commitments on nutrition: to support partner countries to reduce the number of stunted children under the age of five by at least 7 million by 2025; and to allocate EUR 3.5 billion to nutrition between 2014 and 2020.
The annual resource-tracking exercise presented here confirms that by 20191, the EUR 3.5 billion global pledge for nutrition had already been achieved – one year ahead of schedule. In 2018, the latest year for which officially reported data is available, 41 new EU interventions approved had nutrition-relevant components amounting to EUR 546 million. Of this sum, EUR 80 million has been programmed through budget support, more than double the amount committed via budget support in 2017 and confirming partner governments as the largest category of recipients of the EU development funding for nutrition.
With respect to the pledge for stunting reduction, latest estimates indicate that, compared to 2012 when there were 77 million stunted children in the 40 countries prioritising nutrition, in 2019 this number had fallen to 75.4 million. This is due to a reduction in the prevalence of stunting in most of the countries (37 out of 42). If this trend continues, the number of stunted children will fall to 72.3 million by 2025, bringing the number of children averted from stunting since 2012 to 4.7 million. The challenge over the next 5 years will therefore be to accelerate significantly the annual rate of stunting reduction (from 1.35% to 1.82%) so that the 7 million target is achieved.
A degree of caution is required with such projections, since data quality remains a concern in a number of countries with significant implications for the calculation of trends, and with adjustments often made following ongoing scrutiny and the application of internationally agreed standards. An additional challenge is presented by the increasing population and therefore growing number of children in countries prioritising nutrition despite the clear progress being made with reducing stunting prevalence. In African countries prioritising nutrition alone, the under-five population is expected to increase by 34.5 million2 between 2012 and 2025 compared to an increase of 2.7 million in Asian and Latin American countries prioritising nutrition. Therefore, in order to reach the target of 7 million children averted from stunting the Commission will need to continue investing in effective multi-sectoral nutrition-related actions at country level, supporting partner countries to address the diet, care and health-related problems that cause malnutrition.
This year, the progress report also presents concrete examples showing that investments in nutrition are delivering tangible improvements in the lives of women and children. New insights from multi-sectoral programmes supported by the EU clearly illustrate the changes taking place on the ground. In the case studies (from Ethiopia, Mali, Mozambique and Bangladesh), it is clear that financial resources are being converted into results – whether in terms of breastfeeding, quality of diet, people’s resilience or stunting reduction. An additional case study from Guatemala highlights the focus on strengthening country leadership – in particular by ensuring accountability for delivering real change – via support to national information systems for food and nutrition security. Together, these case studies underscore the importance of mainstreaming gender equality in the design and implementation of nutrition-related programmes, as well as the requirement for gender-disaggregated data to ensure evidence based and accountable gender-transformative policies and programmes. Progress with nutrition and the empowerment of women are mutually reinforcing. The Council Conclusions3 on last year’s progress report provided strategic direction for future priorities. These include ensuring an evidence-based theory of change as a precondition for effective programme design; strengthening the links between nutrition and gender pathways; and supporting communities to build resilience to unforeseen and volatile situations. The latter gains particular relevance given the recent COVID-19 pandemic, which poses additional risks to the lives and livelihoods of the most vulnerable across the globe, in particular women and children. Further to the public health challenges, the associated socio-economic crisis demonstrates the fragility of the food systems with severe consequences for access to healthy diets and good nutrition.
1 Data for 2019 is preliminary. Final data will be officially available when reported to the OECD DAC in December 2020.
2 Extracted from the Commission’s ‘stunting reduction calculation tool’ (SRCT) using data from the 2019 revision of the World Population Prospects.
3 Council Conclusions on the Fourth Progress Report on the Action Plan on Nutrition (14457/19).
A C T I O N P L A N O N N U T R I T I O N : F I F T H P R O G R E S S R E P O R T4

Marion wants to be a doctor when she grows up. She goes to an EU funded school at the plantation where her parents work in Cameroun.© EU. Credit: Ellie Tomassi
5A C T I O N P L A N O N N U T R I T I O N : F I F T H P R O G R E S S R E P O R T

Section 1.
Introduction
Background
Commissioner Jutta Urpilainen has underlined the role of the EU in accelerating implementation of the 2030 Agenda for Sustainable Development4. This will be achieved by stronger strategic collegial coordination and by continuing to build international partnerships to ensure the integration of the United Nations (UN) 2030 Agenda for Sustainable and its Sustainable Development Goals (SDGs) across EU policies. The European Green Deal is explicitly anchored in the 2030 Agenda and the SDGs by providing a roadmap to a sustainable and inclusive growth strategy to boost the economy, improve people’s health and quality of life and care for environment. Likewise, the EU’s Farm to Fork Strategy, unveiled in May 2020 makes the case for a long term vision underpinned by a comprehensive and coherent approach to ensure that food systems are fair, healthy and environmentally friendly. The strategy seeks to heighten awareness of the interrelations between nutrition, healthy diets, ecosystems, supply chains, consumption patterns and planetary boundaries. However, about 135 million people faced food crisis or worse in 2019, the highest in 4 years5, and the world is off course to meet international nutrition targets6. With the onset of the COVID-19 pandemic and as a result of the far reaching socio-economic impacts associated with this crisis, the requirement for a transformative agenda is ever more pressing, underscoring the urgent need for effective investment to end hunger and malnutrition in all its forms. Enhancing sustainability, resilience and capacities at every level in order to provide healthy and nutritious diets for all will be a key condition for achieving a more stable and equitable world.
The fifth progress report demonstrates the Commission’s commitment to deliver tangible results for people’s lives and accelerate progress towards ending malnutrition, in line with SDG 27. Building on the four previous progress reports8, this report emphasises again on the two key commitments that underpin the strategic and operational focus of the Commission’s work on nutrition within the context of development cooperation and international partnerships: (i) the 2012 commitment to support partner countries to reduce the number of stunted children under the age of five by at least 7 million by 20259; and (ii) the 2013 commitment to ensure the allocation of EUR 3.5 billion between 2014 and 2020 to improve nutrition in partner countries10.
4 https://ec.europa.eu/commission/sites/beta-political/files/mission-letter-jutta-urpilainen_en.pdf
5 Global Report on Food Crisis 2020.
6 Joint Child Malnutrition Estimates (2020).
7 SDG 2: End hunger, achieve food security and improved nutrition and promote sustainable agriculture.
8 Previous annual reports can be found at: https://ec.europa.eu/knowledge4policy/global-food-nutrition-security/action-plan-nutrition_en
9 http://europa.eu/rapid/press-release_SPEECH-12-575_en.htm
10 Announced at the Nutrition for Growth event in 2013. This commitment is monitored annually on the basis of the resource tracking methodology agreed by the SUN Donor Network.
Woman tapping water, Ghana. © EU
A C T I O N P L A N O N N U T R I T I O N : F I F T H P R O G R E S S R E P O R T6

These two commitments are enshrined in the EU’s policy framework on nutrition, which consists of the 2013 Commission Communication on “enhancing maternal and child nutrition in external assistance: an EU policy framework”11, and the 2014 Action Plan on Nutrition (APN)12. Four sets of Council Conclusions have been adopted on the basis of each of the four previous progress reports. Meanwhile, in November 2014 the European Parliament adopted a Resolution on child undernutrition in developing countries13, calling for nutrition to be prioritised as a development goal by the Commission and EU Member States.
The APN is guided by three mutually-reinforcing strategic priorities for its implementation, which operate at global, regional and country levels. Strategic Priority One relates to the strengthening of political commitment and governance for nutrition. Examples under this priority include support to the Scaling Up Nutrition (SUN) Movement and budget support to national governments to establish and reinforce multi-sectoral nutrition coordination mechanisms. From 2019 onwards, the Capacity for Nutrition (C4N) initiative provides an extensive network of international nutrition advisors well placed to respond to demands from EU Delegations and partner countries to strengthen nutrition governance and the performance of national coordination mechanisms for nutrition at various levels. Strategic Priority Two boosts actions for nutrition across a range of sectors in countries that have prioritised nutrition in their national and multi-annual indicative plans. In addition to ensuring a clear focus on nutrition across key sectors of programming – including agriculture, social protection, education, health and water, sanitation and hygiene (WASH), expertise is also available to EU delegations, governments and other stakeholders on specific technical issues. The Food Fortification Advisory Service (2FAS) is one example, providing demand-driven support on food fortification within the framework of countries’ broader multi-sectoral nutrition strategies to address micronutrient deficiencies. Strategic Priority Three focuses on strengthening expertise and the knowledge-base on nutrition as exemplified by the ongoing implementation of the National Information Platforms for Nutrition (NIPN) initiative and the evidence for policy-making provided by the Joint Research Centre (JRC). In addition, the more recently launched Nutrition Research Facility (NRF) will provide specific support to the Commission, EU Member States and partner countries to build and implement robust monitoring and evaluation systems as well as improved knowledge for better programme design. Together with NIPN, the NRF will help to ensure that programmatic evidence, on both emerging nutrition challenges and conditions of success, is generated and translated through active dialogue into policy related decision-making processes.
11 http://ec.europa.eu/europeaid/documents/enhancing_maternal-child_nutrition_in_external_assistance_en.pdf
12 Action Plan on Nutrition – Reducing the number of stunted children under five by 7 million by 2025.
13 European Parliament resolution of 27 November (2014/2853(RSP)).
Women working in the field, Côte d’Ivoire. © EU
7A C T I O N P L A N O N N U T R I T I O N : F I F T H P R O G R E S S R E P O R T

Since their inception, the 2013 Communication and the APN have guided the Commission’s action on nutrition both with specific country partners and internationally. They are strongly aligned with the Agenda 2030 for Sustainable Development (2015) and the new European consensus on development (2017)14. Recent Council Conclusions15 confirm the EU’s commitment to addressing all forms of malnutrition while ensuring the sustainable and more equitable transformation of food systems.
Scope of the fifth progress report
The focus of the fifth progress report is on a clear and concise analysis of recent advances regarding the Commission’s two international pledges on nutrition. The report includes an in-depth look at selected programmes and how they are transforming resources into results to inform discussions on future nutrition interventions. Section 2 of the report provides an updated overview and analysis of progress on reducing stunting, while Section 3 offers an updated overview of progress with regard to annual financial commitments and disbursements. Section 4 presents evidence from diverse countries and contexts, demonstrating that EU investments in nutrition are making a measurable difference to people’s lives – particularly women and children, with a focus on infants, children under five and adolescent girls. These insights are particularly timely for informing policy directions, given the new multi-annual financial programming phase 2021-2027.
Implementation of the APN continues in countries that have prioritised nutrition in their national and multi-annual indicative plans. Forty countries were initially included, with two more added in 2016 at the request of EU Delegations, namely Sudan and Djibouti.
Figure 1: Partner countries that prioritised nutrition in their cooperation with the EU
Benin
Burkina Faso
Côye d’Ivoire
Gambia
Guinea-Bissau
Mali
Mauritania
NigerSenegal
Sierra Leone
BurundiCameroon
Chad
AngolaMadagascar
Malawi
Mozambique
Zambia Zimbabwe
Afghanistan
BangladeshNepal
Myanmar
Cambodia
Lao
Pakistan
Sri Lanka
YemenHaïtiGuatemala
Honduras UgandaEthiopia
Sudan
KenyaSomalia
Djibouti
Tanzania
RwandaDRCongoNigeria
Timor Leste
14 https://www.consilium.europa.eu/media/24004/european-consensus-on-development-2-june-2017-clean_final.pdf
15 Council Conclusions on the Fourth Progress Report on the Action Plan on Nutrition (14457/19).
A C T I O N P L A N O N N U T R I T I O N : F I F T H P R O G R E S S R E P O R T8

Section 2.
Progress in supporting partner countries to reduce the number of children stuntedStunting is the result of chronic undernutrition in-utero and early childhood. Children suffering from stunting may never reach their full potential height or cognitive abilities. Later in life, they are also more likely to be at risk of overweight and obesity than children of normal height, and in turn, may be more susceptible to the negative implications of these conditions on their overall health and well-being16. Furthermore, there is increasing evidence on the linkage between stunting and wasting which together are implicated in the deaths of almost two million children each year17. If a stunted child goes on to become moderately wasted, the risk of death can be as great as that faced by a severely wasted child, while children who survive repeated episodes of wasting are more likely to become stunted18,19.
This section presents an analysis of data from the Commission’s ‘stunting reduction calculation tool’ (SRCT)20, developed in 2014-15 in collaboration with the World Health Or ganization (WHO)21,22.
Stunting trends
Since the first progress report, analysis of results on stunting has focused on the original group of 40 countries that prioritised nutrition in their cooperation with the EU (Figure 1)23. Based on current trends, the latest estimates indicate that the projected number of children averted from stunting from 2012 to 2025 will be 4.7 million in these 40 countries. This means that 4.7 million children who would otherwise have suffered from stunting over the period will have achieved normal growth. This estimate is lower than the 4.9 million reported last year mainly as a result of retrospective adjustments to country survey data on the basis of international standards24. However, population growth continues to present a major challenge for reducing the absolute number of stunted children. Indeed, the positive trend of stunting prevalence is being offset by the growing number of children (estimated increase of 34.5 million in African countries prioritising nutrition alone).
16 https://data.unicef.org/topic/nutrition/child-nutrition/
17 https://archpublichealth.biomedcentral.com/articles/10.1186/s13690-018-0277-1
18 https://www.ncbi.nlm.nih.gov/pmc/articles/PMC6669055/ and https://www.ennonline.net/resources/wastmetaanalysis
19 https://bmjopen.bmj.com/content/bmjopen/10/2/e033148.full.pdf
20 The methodology for this tool can be found here: https://ec.europa.eu/international-partnerships/system/files/ec-srct-method-300319_en.pdf
21 This collaboration was the basis for the WHO tool that is available online at: https://www.who.int/nutrition/trackingtool/en/
22 The SRCT uses a longer time horizon than the tool currently used by the WHO. This Progress Report continues to use the SRCT to ensure consistency across reporting years.
23 The two additional countries that were added from 2016 onwards are not included in this section’s analysis to facilitate comparison of trends and changes over time, but are included in the analyses presented in other sections.
24 While the number is in fact slightly lower, this is not because the situation has worsened (indeed the AARR has increased) but is rather due to a recently undertaken, and as yet incomplete, recalculation by the JME on the basis of the retrospective quality checking and standardisation of national surveys which has involved 21 changes in 16 countries; and 1 survey being removed.
9A C T I O N P L A N O N N U T R I T I O N : F I F T H P R O G R E S S R E P O R T

Figure 2: Stunting progress in partner countries prioritising nutrition, showing projected trends to reach World Health Assembly25 and Commission targets by 2025
The annual average rate of reduction (AARR) stands at 1.35% as compared to 1.32% last year. The key conclusion of the trend analysis remains that the pace of reduction will need to increase significantly (to 1.82% across the 40 countries) to achieve the target of 7 million children averted from stunting by 2025. The fastest rate of stunting reduction was found in Mauritania (3.2%) and the slowest in Chad (0%) and Sudan (0.02%). More investment in data quality and national information systems at country level is needed to better analyse causes underlying child stunting and to understand why it is that some countries are performing better than others.
Considered as a group, the 40 countries remain off track to achieve the World Health Assembly (WHA) 40% stunting reduction target. This outcome reflects the global situation: the world as a whole is not yet on track to achieve this global target for stunting26. Figure 2 shows a breakdown by country of the gap between the pace of stunting reduction and that needed to achieve the target, based on the SRCT.
25 The World Health Assembly is the decision-making body of WHO.
26 Global Nutrition Report 2018.
Num
ber
stun
ted
child
ren
(mill
ion)
4.7 2.3
0
10
20
30
40
50
60
70
80
90
2012
2013
2014
2015
2016
2017
2018
2019
2020
2021
2022
2023
2024
2025
Estimated number of stunted children
Projected number of stunted children averted
Estimated number of stunted children that still need to be averted
Estimated number of stunted children that still need to be avertedto reach WHA target
Trend needed to meet WHA target
Baseline in stunting reduction(average annual rate of reduction for the period 1990-2012)
Baseline in stunting reduction(average annual rate of reduction for the period 1990-2019)
Trend needed to meet the 7 million target
77.0 75.4 46.2
26.1
Annual Average Rate of Reduction (AARR) 2012 = 1.11% Anticipated AARR 2019 = 1.35%
AARR required to reach the 7 millionreduction target = 1.82%
AARR required 2012 to 2025to reach the WHA target = 5.27%
Anoona holding her baby, Zimbabwe. © EU. Credit: Ellie Tomassi
10A C T I O N P L A N O N N U T R I T I O N : F I F T H P R O G R E S S R E P O R T

Figure 3: The difference between the current rate of stunting reduction and that required to meet the WHA target by 2025 (AARR%) using SRCT criteria27
The only country on track to achieve the WHA stunting target is Afghanistan. On the basis of the agreed methodology for assessing progress towards stunting reduction28, all other countries (with data) are off-track. Of these, 35 have made some progress since the 2012 baseline while 3 (Yemen, Timor Leste and Sudan) have made no progress or are worsening. A stunting profile for all 42 countries is given in Annex 129.
A closer look at the regional level provides valuable insights. The prevalence of stunting continues to fall since the 2012 baseline in every region. The most significant decline – 6.1 percentage points – is in Asia. As there has been a relatively low increase in the population of children under five in countries prioritising nutrition in Asia (the population of under five children is even decreasing in 5 out of the 10 Asian countries prioritising nutrition30), the number of stunted children in this region alone has fallen by around 2.8 million since 2012. However, in countries prioritising nutrition in Africa, the reduction of stunting prevalence since the 2012 baseline – by 3.6 percentage points – has been somewhat masked by the notable increase in the population of children under five since the 2012 baseline (an increase of 18.6 million31). As a result, and despite the reduction of stunting prevalence, the number of stunted children in countries prioritising nutrition has risen by 1.8 million between 2012 and 2019. As Figure 3 shows, of the top 10 countries closest to potentially meeting the WHA target (according to current data), only two are African namely Zimbabwe and Kenya.
27 For all 42 countries prioritising nutrition in their cooperation with the EU.
28 WHO & UNICEF 2017.
29 Annex 1 provides data for all 42 countries as opposed to the 40 original countries prioritising nutrition. Individual country graphs are available online at: https://ec.europa.eu/international-partnerships/topics/fostering-better-nutrition_en
30 Extracted from the Commission’s ‘stunting reduction calculation tool’ (SRCT) using data from the 2019 revision of the World Population Prospects.
31 Between 2019 and 2025 the population of children under five in Africa is expected to rise by another 16.5 million.
* Countries with no data aster 2012 (differences between baseline AARR and required AARR)
AngolaNiger
SudanBenin
Somalia*Chad
BurundiDRC
Djibouti*Nigeria
MozambiqueMadagascar
PakistanTimor-Leste
CameroonMali
YemenTanzania
GuatemalaRwandaSenegalUganda
Côte d’IvoireMauritania
EthiopiaMalawiZambiaGambia
Burkina FasoSierra Leone
Guinea-BissauKenya
HaitiZimbabwe
Lao PDRSri LankaMyanmar
Honduras*Cambodia
NepalBangladeshAfghanistan
-2% 0% 2% 4% 6% 8% 10% 12% 14% 16%
A C T I O N P L A N O N N U T R I T I O N : F I F T H P R O G R E S S R E P O R T11

While average stunting prevalence remains slightly higher in countries in Asia (36%), than in Africa (34.5%) or Latin America (32.3%), it varies considerably across the 42 countries, ranging from 54% in Burundi to 14% in Sri Lanka. National figures can also mask significant inequalities within countries. The prevalence of stunting among children in vulnerable groups, for example among the chronically poor or in indigenous communities where many families struggle to afford a healthy diet and to ensure adequate care for infants and young children, is generally much higher than in the country as a whole. This highlights the extent to which child stunting is largely driven by structural inequalities relating to factors including income, gender and access to safe drinking water and basic health facilities. Addressing the cause of these inequalities is key to accelerating the rate of stunting reduction.
While overall the pace of stunting reduction across all 40 countries remains slower than expected, evidence from EU-supported programmes demonstrates that they are improving nutrition, with tangible positive impacts on the lives of women and children. Insights into these impacts, such as improved quality of diets as well as enhanced childcare practices, are presented in Section 4.
Factors associated with stunting reduction
The third progress report introduced a dashboard (see Annex 2) for all 42 partner countries that have prioritised nutrition, with 17 indicators to track progress32. The dashboard shows the evolution of national-level data from a 2012 baseline. The dashboard, which is updated annually, is designed to present data on child stunting trends based on multiple factors in countries prioritising nutrition and aims to inform country level analysis and policy dialogue. It adopts a traffic light (dot) system to show improvement (green), no change (yellow) or deterioration (red), while the colour of cells categorises the position of each country relative to others. Associations between indicators cannot be used to infer causality in a given context. In addition, it is important to distinguish between the direction of trends compared to the baseline for a given country33. This year’s dashboard reveals the following:
• Stunting prevalence has declined in all countries except for Angola, Sudan, Benin and Djibouti, where it has increased, and Chad, where there has been no change.
• Ten countries affected by conflict34 have seen both a lower reduction in stunting and a slower rate of improvement regarding stunting compared to countries not affected by conflict. The same countries also show a poorer performance in terms of income inequality.
• The prevalence of wasting35 has increased in four countries (Yemen, Sudan, Mauritania and Lao PDR)36. Of these, Sudan has also seen an increase in prevalence of stunting.
• Rates of exclusive breast feeding37 have improved in 26 countries and worsened in 8 countries, with Chad and Yemen seeing the worst performance.
• 80% of countries38 have seen an improvement in the following indicators: delivery in a health facility; Gender Inequality Index39; Global Multi-dimensional Poverty Index40; and improved drinking water.
• Less than half of the countries have seen an improvement with respect to the Hunger and Nutrition Commitment Index41 (HANCI); and income inequality.
• For most of the countries where there has been no decline in either multi-dimensional poverty or income inequality, the rate of stunting has also not declined.
• The two countries where access to health care has deteriorated have also performed poorly in the rate of stunting reduction (Benin and Nigeria).
32 Individual country dashboards are available online at: https://ec.europa.eu/international-partnerships/topics/fostering-better-nutrition_en
33 For example, while data from Zambia indicates a deterioration in exclusive breastfeeding compared to the 2012 baseline, the country is among the top three performing countries for this indicator, with a rate of almost 70%.
34 Afghanistan, Burundi, Chad, Democratic Republic of Congo (DRC), Mali, Myanmar, Nigeria, Somalia, Sudan and Yemen.
35 Wasting is a life-threatening condition attributable to poor nutrient intake and/or disease. Characterised by a rapid deterioration in nutritional status over a short period of time, children suffering from wasting have weakened immunity, increasing their risk of death due to greater frequency and severity of common infection, particularly when severe.
36 Data trends for child wasting must be interpreted with caution as there can be significant fluctuations in wasting by season and year to year.
37 Feeding infants nothing but breastmilk for the first six months of life, exclusive breastfeeding, is the safest and healthiest option for children everywhere and has great potential to save lives.
38 Countries with data: delivery in a health facility (n=38); Gender Inequality Index (n=34); Global Multi-dimensional Poverty Index (n=35); and, improved drinking water (n=27).
39 http://hdr.undp.org/en/content/gender-inequality-index
40 https://ophi.org.uk/multidimensional-poverty-index/
41 http://www.hancindex.org/
A C T I O N P L A N O N N U T R I T I O N : F I F T H P R O G R E S S R E P O R T12

Section 3.
Progress in ensuring the allocation of EUR 3.5 billion to improve nutrition
‘One year ahead of schedule, the European Union has already achieved its EUR 3.5 billion global pledge for nutrition’
Financial commitments to nutrition in 2018
In 201842, 41 new EU nutrition-related financing decisions43 were approved. The total amount committed44 to nutrition was EUR 546.4 million45, of which EUR 100.6 million was nutrition-specific and EUR 445.7 million was nutrition-sensitive; EUR 320.2 million was financed by development aid instruments and EUR 226.2 by humanitarian aid instruments46.
42 2018 is the latest year for which official data is available on the OECD DAC Creditor Reporting System. Preliminary data for 2019, not yet reported to OECD DAC, is included to calculate total Commission commitment for the period 2014-2019.
43 Comprising 25 development aid decisions, 10 humanitarian aid decisions and 6 EU trust fund decisions.
44 The Commission defines a commitment as a ‘legal obligation to spend money that is signed in a given financial year’ while ‘the amounts are not necessarily paid out in the same year but may be spent over several financial years’.
45 Nutrition commitments the previous year totalled EUR 566.6 million.
46 The Commission applies the methodology of the SUN Donor Network for nutrition resource tracking. For development aid, nutrition-specific actions address the symptoms and immediate determinants of malnutrition (coded 12240 Basic Nutrition under Health in the OECD DAC reporting system) and 100% of the amount of such actions is recorded as a nutrition commitment. Nutrition-sensitive actions generally address more underlying determinants and basic causes meeting three criteria (intention to improve nutrition for women or adolescent girls or children; having a significant nutrition objective or indicator; and contributing to explicit nutrition-sensitive outcomes and expected results), and either 100% or 25% of the amount of the action is recorded as a nutrition commitment depending on whether the full project or part of the project has been identified as nutrition sensitive according to the above criteria. Note: since all humanitarian aid has a separate DAC code, it cannot therefore be classified as nutrition specific by the SUN methodology, but the methodology is nevertheless applied to determine whether nutrition is ‘dominant’ or ‘partial’ in a given action.
Cattle feeding in Madagascar. © GCCA-EU 2020 Credit: Rafalia Henitsoa
13A C T I O N P L A N O N N U T R I T I O N : F I F T H P R O G R E S S R E P O R T

Financial commitments to nutrition since 2014
Taking into account the 2018 data on nutrition commitments together with a preliminary analysis of 2019 nutrition commitments (EUR 594.3 million), total nutrition commitments in the period 2014 to 2019 currently amount to almost EUR 3.8 billion (see Table 1). This means that the Commission’s pledge of committing EUR 3.5 billion towards nutrition in the period 2014-2020 has achieved one year ahead of schedule.
Table 1: Nutrition commitments 2014-2019 by category and funding source (million EUR)
Between 2014 and 2019, nutrition-specific commitments amounted to EUR 633.9 million, while nutrition-sensitive commitments exceeded EUR 3.1 billion.
Efforts in the current funding cycle (2014-2020) to boost nutrition programming in EU international cooperation and development resulted in an upward trend in nutrition commitments compared to the previous programming period (2007-2013) (see Figure 4). Based on data available for 2008-2019, the average nutrition commitment in the previous funding period was EUR 388.1 million per year, compared with EUR 628.4 million per year in the current funding period. This represents an increase of 62%.
Figure 4: Nutrition commitments by funding source 2008-2019 (million EUR)
Development aid instruments Humanitarian aid instruments Total EU
Nutrition- specific
Nutrition-sensitiveSubtotal
Nutrition-sensitiveSubtotal
Dominant Partial Dominant Partial
2014 33.9 25.0 171.0 229.9 91.5 133.2 224.7 454.6
2015 53.0 18.1 238.6 309.6 87.5 149.5 237.0 546.6
2016 167.5 244.5 481.0 893 0.0 168.6 168.6 1061.6
2017 60.0 0.0 316.3 376.3 0.0 190.3 190.3 566.6
2018 100.6 0.0 219.5 320.2 0.0 226.2 226.2 546.4
2019* 218.9 38.5 126.7 384.1 0.0 210.1 210.1 594.3
Total 633.9 326.0 1,553.2 2,513.0 179.0 1,077.9 1,256.9 3,770.0
* Data for 2019 is preliminary. It will be reported to the OECD DAC in December 2020.
0
200
400
600
800
1,000
1,200
2007 2008 2009 2010 2011 2012 2013 2014 2015 2016 2017 2018 2019
279
448.2372.2
321.2
441.9 466.2 454.6546.6
1,061.6
566.6
546.4
Development aid Humanitarian aid Total
594.3
A C T I O N P L A N O N N U T R I T I O N : F I F T H P R O G R E S S R E P O R T14

Nutrition disbursements, 2014-2018
While nutrition commitments constitute the legal decision to fund an action, nutrition disbursements are the actual expenditures related to previous commitments. Disbursements thus give a more accurate representation of implementation. In 2018, Commission nutrition disbursements totalled EUR 477.6 million (see Table 2). Of this, EUR 45.3 million was nutrition-specific and EUR 432.3 million was nutrition-sensitive. The sum was disbursed via both EU development cooperation and humanitarian aid instruments: EUR 290.6 million was disbursed through development cooperation instruments and just under EUR 187 million through humanitarian instruments. Total nutrition disbursements in 2014-2018 were EUR 2 371.7 million.
Table 2: Nutrition disbursements, 2014-2018 (million EUR)
As expected, annual nutrition disbursements are less than commitments over the last 5 years, reflecting the time-lag between commitment and implementation during which disbursements can be spread out over a period of several years as well as due to time taken in the contracting, mobilisation and inception process (see Figure 5).
Figure 5: Nutrition commitments and disbursements by year (million EUR)
Development aid instruments Humanitarian aid instruments Total EU
Nutrition- specific
Nutrition-sensitiveSubtotal
Nutrition-sensitiveSubtotal
Dominant Partial Dominant Partial
2014 33.7 26.6 103.3 163.6 130.3 170.1 300.4 464.0
2015 43.5 14.6 114.3 172.4 119.5 133.8 253.3 425.7
2016 26.9 15.1 226.2 268.2 30.1 177.8 207.8 476.0
2017 50.7 36.4 242.9 329.9 2.8 195.8 198.6 528.5
2018 45.3 28.8 216.5 290.6 0.1 186.9 187.0 477.6
Total 200.1 121.5 903.1 1,224.7 282.8 864.2 1,147.1 2,371.7
0
200
400
600
800
1,000
1,200
454.6 464.0
2014
546.6
425.7
2015
1,061.6
476.0
2016
566.6528.5
2017
546.4477.6
2018
Total commitments Total disbursements
A C T I O N P L A N O N N U T R I T I O N : F I F T H P R O G R E S S R E P O R T15
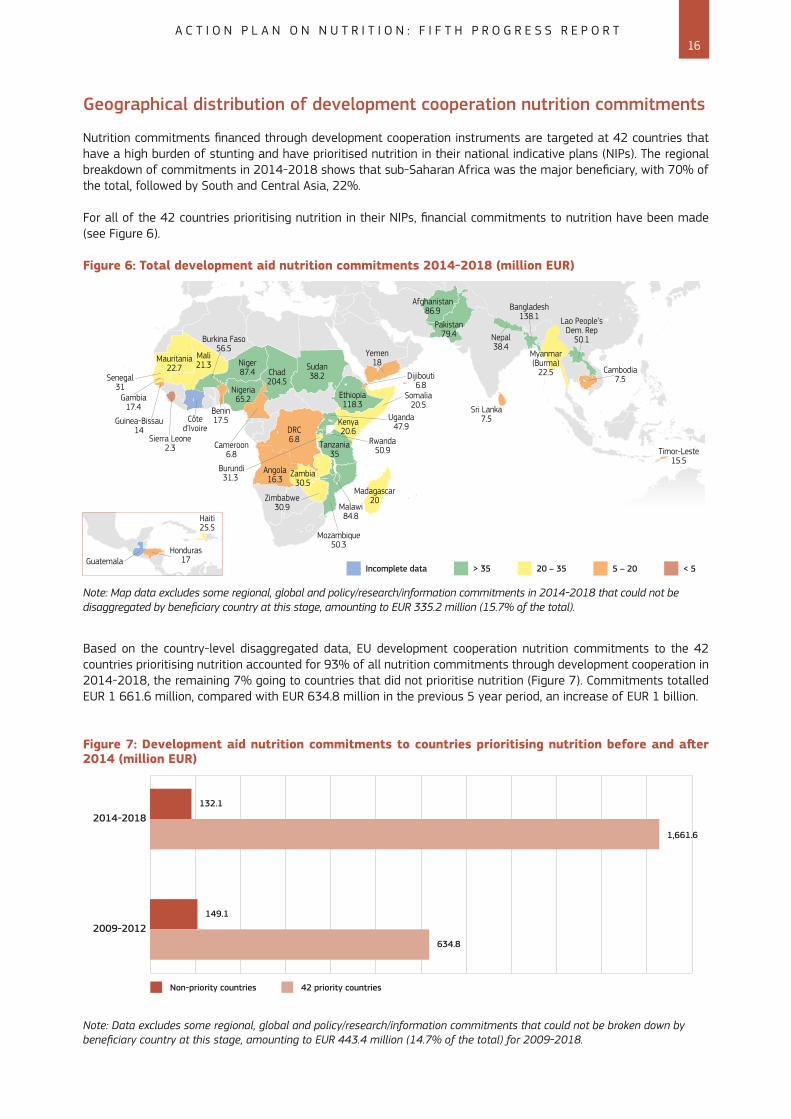
Geographical distribution of development cooperation nutrition commitments
Nutrition commitments financed through development cooperation instruments are targeted at 42 countries that have a high burden of stunting and have prioritised nutrition in their national indicative plans (NIPs). The regional breakdown of commitments in 2014-2018 shows that sub-Saharan Africa was the major beneficiary, with 70% of the total, followed by South and Central Asia, 22%.
For all of the 42 countries prioritising nutrition in their NIPs, financial commitments to nutrition have been made (see Figure 6).
Figure 6: Total development aid nutrition commitments 2014-2018 (million EUR)
Rwanda50.9
Burundi31.3
DRC6.8
Angola16.3
Mali21.3
Somalia20.5 Sri Lanka
7.5
Timor-Leste15.5
Cambodia7.5Dijibouti
6.8
Yemen18Mauritania
22.7 Niger87.4 Chad
204.5
Sudan38.2
Ethiopia118.3
Afghanistan86.9
Pakistan79.4 Nepal
38.4Myanmar(Burma)
22.5
Bangladesh138.1 Lao People’s
Dem. Rep50.1
Uganda47.9Kenya
20.6Tanzania
35
Malawi84.8
Mozambique50.3
Madagascar20
Zambia30.5
Zimbabwe30.9
Nigeria65.2
Côted’Ivoire
Cameroon6.8
Burkina Faso56.5
Senegal31
Gambia17.4
Guinea-Bissau14
Sierra Leone2.3
Benin17.5
> 35 20 – 35 5 – 20 < 5Incomplete data
Note: Map data excludes some regional, global and policy/research/information commitments in 2014-2018 that could not be disaggregated by beneficiary country at this stage, amounting to EUR 335.2 million (15.7% of the total).
Based on the country-level disaggregated data, EU development cooperation nutrition commitments to the 42 countries prioritising nutrition accounted for 93% of all nutrition commitments through development cooperation in 2014-2018, the remaining 7% going to countries that did not prioritise nutrition (Figure 7). Commitments totalled EUR 1 661.6 million, compared with EUR 634.8 million in the previous 5 year period, an increase of EUR 1 billion.
Figure 7: Development aid nutrition commitments to countries prioritising nutrition before and after 2014 (million EUR)
Note: Data excludes some regional, global and policy/research/information commitments that could not be broken down by beneficiary country at this stage, amounting to EUR 443.4 million (14.7% of the total) for 2009-2018.
Non-priority countries
2014-2018
2009-2012
42 priority countries
132.1
1,661.6
149.1
634.8
GuatemalaHonduras
17
Haiti25.5
A C T I O N P L A N O N N U T R I T I O N : F I F T H P R O G R E S S R E P O R T16

Budget support for nutrition
Since 2014, the Commission has acknowledged that budget support can offer an efficient means to scale up nutrition support, by promoting a government-led, accountable and inclusive approach to service delivery across multiple sectors.
Budget support assists a government in delivering on its multi-sectorial nutrition policy or plans, which most EU partner countries already have, or to enhance nutrition-related outcomes of sectoral policies, for example agriculture, social protection, education, health and governance, among others, while also improving public financial management.
New budget support actions were approved in 201847 for Bangladesh, Niger, Senegal, Tanzania and Timor Leste, with nutrition components totalling EUR 80.3 million, up from EUR 36.7 million in 2017 (see Figure 8). From 2014 to 2018, the EU invested a total of EUR 330.2 million in budget support for nutrition-related actions in 15 countries.
Figure 8: Nutrition commitments through budget support, 2014-2018 (million EUR)
47 Analysis of nutrition commitments for 2019 is not available because data is still preliminary.
2014 2015 2016
182.1
2017
36.7
2018
80.3
0
100
50
150
200
31.1
Promoting sustainable agriculture, Burkina Faso. © GIZ. Credit: Aude Rossignol
17A C T I O N P L A N O N N U T R I T I O N : F I F T H P R O G R E S S R E P O R T
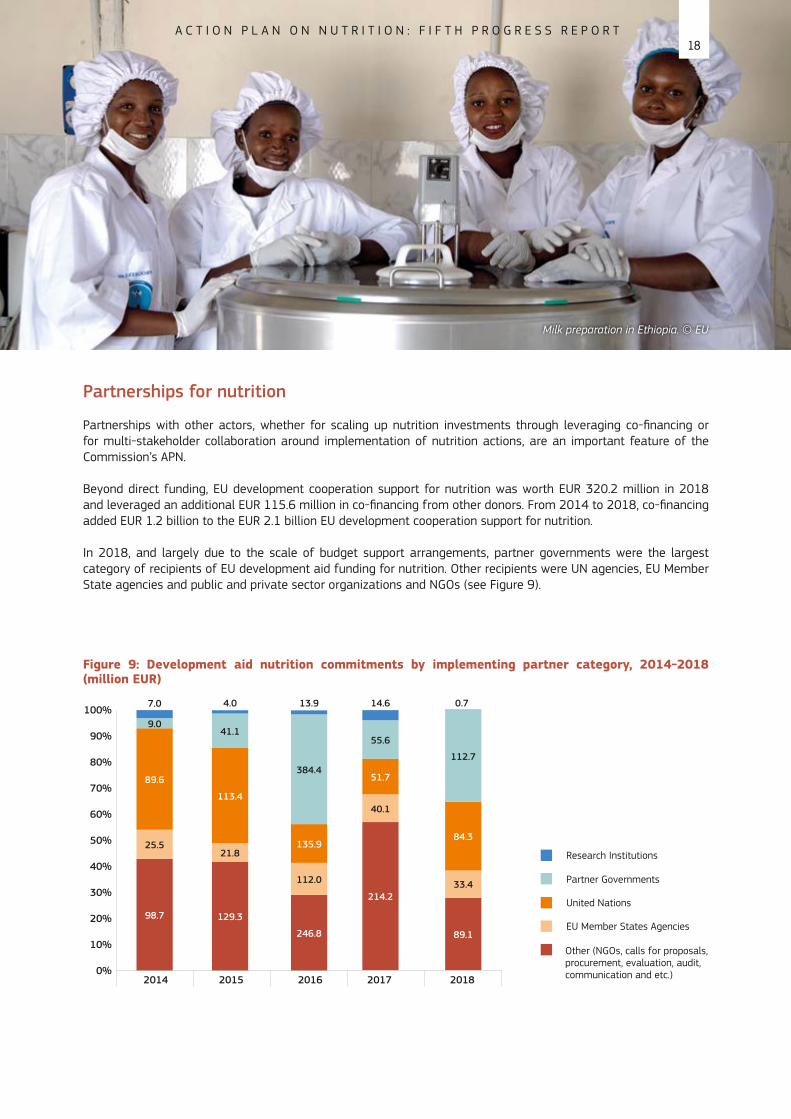
Partnerships for nutrition
Partnerships with other actors, whether for scaling up nutrition investments through leveraging co-financing or for multi-stakeholder collaboration around implementation of nutrition actions, are an important feature of the Commission’s APN.
Beyond direct funding, EU development cooperation support for nutrition was worth EUR 320.2 million in 2018 and leveraged an additional EUR 115.6 million in co-financing from other donors. From 2014 to 2018, co-financing added EUR 1.2 billion to the EUR 2.1 billion EU development cooperation support for nutrition.
In 2018, and largely due to the scale of budget support arrangements, partner governments were the largest category of recipients of EU development aid funding for nutrition. Other recipients were UN agencies, EU Member State agencies and public and private sector organizations and NGOs (see Figure 9).
Figure 9: Development aid nutrition commitments by implementing partner category, 2014-2018 (million EUR)
100%
90%
80%
70%
60%
50%
40%
30%
20%
10%
0%2014
98.7
25.5
89.6
9.0
7.0
129.3
21.8
113.4
41.1
4.0
246.8
112.0
135.9
384.4
13.9
214.2
40.1
51.7
55.6
14.6
89.1
33.4
84.3
112.7
0.7
2015 2016 2017 2018
Research Institutions
Partner Governments
United Nations
EU Member States Agencies
Other (NGOs, calls for proposals,procurement, evaluation, audit,communication and etc.)
Milk preparation in Ethiopia. © EU
A C T I O N P L A N O N N U T R I T I O N : F I F T H P R O G R E S S R E P O R T18

Adolescent girl, Bangladesh. © EU Credit: Ellie Tomassi
19A C T I O N P L A N O N N U T R I T I O N : F I F T H P R O G R E S S R E P O R T

Section 4.
Improvements in the lives of women and children – from resources to results
The APN considers the first 1 000 days of life critical to preventing malnutrition and its consequences. The Commission therefore focuses on improving the nutrition of women and children, including adolescent girls and infants, in addition to fostering growth from the earliest stage of life by addressing maternal malnutrition.
This section of the report presents the growing body of evidence showing improvements to the lives of women and children as a result of EU support for nutrition.
Tackling malnutrition effectively requires many sectors to be mobilised. This can be challenging to implement at scale, as sustained progress depends on the strengthening of national coordination mechanisms and capacity development at all levels. Additionally, it can take several years for progress – whether in terms of women’s empowerment, increased incomes, improvement in basic services or adequate basic hygiene – to deliver lasting and sufficient shifts in the quality of diets and nutritional outcomes.
The Commission’s commitment to support partner countries to accelerate the reduction of child stunting has been accompanied by efforts to boost accountability mechanisms in the design of programmes. Monitoring and evaluation systems have been reinforced to understand and measure the results obtained.
The case studies presented in this section, from Ethiopia, Mali, Mozambique and Bangladesh, represent a range of country contexts to show how resources are being transformed into results. They demonstrate measurable improvements in the lives of women and children, whether in terms of breastfeeding, dietary quality, household resilience, food security or stunting reduction. An additional case study from Guatemala highlights the Commission’s focus on strengthening country ownership – in particular by ensuring accountability for delivering real change – via support to the effective management of national information systems.
Figure 10: From resources to results – evidence from 5 illustrative programmes
NIPN in GuatemalaHarnessing datato change lives
EUR 2.18 millionNational study drives
evidence-basedadvocacy for
nutrition aheadof 2019 elections
Irrigar in MaliHomestead
irrigation forimproved diet
EUR 27.7 million19.6% of womenhave improveddiets between2015-2019
MDG1c Programmein Mozambique Building
resilience for better dietsEUR 87 million
Stunting prevalence falls by5% between 2013 and 2018
AGPII in EthiopiaInvesting in agriculturefor improved nutrition
EUR 45 millionProportion of young
children with an acceptablediet increases by 4%
between 2017 and 2019
Suchana in BangladeshEnding the cycle of undernutrition
EUR 60 millionProportion of children being
exclusively breastfed increases byover 20% between 2017 and 2019
20A C T I O N P L A N O N N U T R I T I O N : F I F T H P R O G R E S S R E P O R T

AGPII: Harnessing agricultural investments to improve the diets of women and children in Ethiopia
Malnutrition in Ethiopia
Ethiopia has set ambitious targets to reduce malnutrition and has made considerable progress on reducing stunting among children under five. However, stunting is still very common (38%): over 6 million children are affected by stunting and 1 in 10 suffer from wasting. Only 7% of children aged 6 to 23 months get a minimum acceptable diet48. One in 4 adult women are anaemic. At the same time the number of overweight and obese children and adults continues to rise. Malnutrition continues to undermine national development efforts: the cost of undernutrition has been estimated at 16.5% of annual GDP49.
Second agricultural growth programme (2015-2020)
AGPII is a EUR 418 million flagship programme implemented by the Ethiopian government within the framework of its second national nutrition programme (NNPII). AGPII is supported by multiple donors50 including the EU (EUR 45 m) along with Member States, Spain and the Netherlands. The goal of AGPII is to contribute to sustainable agricultural transformation while improving the food and nutrition security situation of vulnerable groups. The programme focuses on areas of considerable agricultural potential in seven regional states51 with high stunting prevalence. More than 20 million smallholder farmers are expected to benefit from the intervention while 1.6 million smallholders (40% of them women) are direct beneficiaries. The programme components include public support services for agriculture, agricultural research, small-scale irrigation, agriculture marketing and value chain promotion. EU support includes a EUR 5 million complementary action designed to accelerate the provision of nutrition training and promotion of nutrition-sensitive technologies to farmers. This component also develops nutrition-related capacities for the delivery of public services across agriculture, education and health sectors. Overall, AGPII reinforces the focus of the NNPII on tackling the underlying causes of malnutrition via a multi-sectoral approach52.
48 Ethiopia Demographic and Health Survey 2016.
49 The Social and Economic Impact of Child Undernutrition in Ethiopia, UNECA/WFP 2013.
50 The principal donor is the World Bank (USD 350 million), along with the EU, USAID, Canada, Spain and the Netherlands.
51 Amhara, Oromia, SNNPR, Tigray, Benshangul-Gumuz, Gambella and Harar as well as Dire Dawa city administration.
52 This follows a narrower focus during the first phase to address the more immediate causes and treatment of malnutrition.
Boys playing, Ethiopia. © EU
21A C T I O N P L A N O N N U T R I T I O N : F I F T H P R O G R E S S R E P O R T

Tangible results in the lives of women and children
AGPII closely monitors the links between agriculture and nutrition outcomes along the dietary pathways of women and children. Improving complementary feeding of children aged 6 to 23 months has been identified as a crucial pathway to prevent stunting in Ethiopia53. While very few Ethiopian children get a minimum acceptable diet and the diet of most mothers is inadequate, the programme has already led to significant changes between 2017 and 2019. Children in the regions of intervention are now consuming more pulses, grains, roots, tubers, fruits, vegetables and animal and milk products than previously54. Data from the outset of the programme showed that in female-headed households surveyed no young children were getting an acceptable diet. As a result of AGPII this is beginning to change.
Outcomes55 2017 2019
Children’s diet in male-headed households 5.4% 9.3%
Children’s diet in female-headed households 0% 6.7%
Women’s diet 17.9% 30%
Household diet 65% 84%
Realising human potential
Ethiopia’s NNPII adopts the lifecycle approach with a particular emphasis on the crucial period of pregnancy and the first 2 years of life (first 1 000 days) during which good nutrition and healthy growth deliver lasting benefits throughout life. AGPII is playing a fundamental role in raising awareness of the contribution that nutrition-sensitive agriculture and food systems play in achieving this goal. However, addressing the overlapping inequalities of wealth and gender remains a challenge. AGPII therefore focuses on rural households with access to limited resources and specifically ensures the inclusion of women farmers. Support is explicitly provided to build the capacity, representation and financing of women in agriculture through a transformative approach. Attention is given to ensuring that the workload of women is not exacerbated through access to relevant information, labour-saving technologies and regular gender impact evaluations.
Tackling climate and environmental challenges
Ethiopia is especially vulnerable to climate change. AGPII is therefore committed to mainstreaming climate smart agriculture (CSA) approaches across the entire programme, thereby providing an important contribution to Ethiopia’s climate resilient green economy strategy. The programme also includes the establishment of a climate advisory service across the agricultural extension system to promote CSA technologies while supporting improved conservation and management of the natural resources upon which farmers and pastoralists depend.
53 Baye, Kaleab et al, Irrigation and women’s diet in Ethiopia: A longitudinal study. IFPRI Discussion Paper 1864, 2019.
54 Kuma, T., Changes in household and children’s dietary diversity in AGP intervention areas, Policy Studies Institute, December 2019.
55 The Policy Studies Institute AGPII Impact Evaluation Report, May 2019, has applied internationally recognised indicators: for children’s diet, the Minimum Acceptable Diet 6-23 months; for women’s diet, the Dietary Diversity Score for pregnant women; for household diet, the Household Dietary Diversity Score.
22A C T I O N P L A N O N N U T R I T I O N : F I F T H P R O G R E S S R E P O R T

Women trashing and winnowing rice in village Banankoro, Mali. © GIZ Credit: Joerg Boethling
IRRIGAR: Homestead irrigation improves diets in Mali for women and children
Malnutrition in Mali
One million children under five are affected by stunting in Mali (more than one in four)56 and the number of stunted children is not expected to fall in the coming years. Mali is therefore currently not on track to meet the international target for stunting57. At the same time, other forms of malnutrition also persist. More than one in eight children suffer from wasting. Only 9% of children aged 6-23 months old eat even a minimally acceptable diet. In recent years, the prevalence of overweight and obesity in women has almost doubled58, while half of women have anaemia. The double burden of malnutrition59 results from many factors, often rooted in widespread multi-dimensional poverty. The economic cost of undernutrition in Mali is estimated to be 4% of GDP60. National efforts to tackle malnutrition have largely focused on strengthening health services, but it is increasingly recognised that a multi-pronged approach with a strong focus on agriculture is required.
IRRIGAR61 (2014-2019)
IRRIGAR was a EUR 27.7 million programme funded by the EU62, and implemented by GIZ, KfW and decentralised state services. The programme aimed to contribute to improving food security and nutrition by increasing and diversifying agricultural production. Located in several regions63, the focus was on establishing small-scale irrigation and pond structures for fish farming. Poor farmers (both women and men) received support to use this infrastructure efficiently, for both household consumption and sales through local markets. To maximise the impact on people’s nutrition, educational materials were developed and disseminated in collaboration with local health actors. As a result, people have become more aware of the risks associated with malnutrition and the importance of ensuring a more diverse and healthy diet and food hygiene. A community dynamic has emerged through the creation of local level nutrition action groups. Both the second phase of IRRIGAR, jointly funded by the EU and Germany, and an anticipated third phase, will ensure continued progress in the two regions of Sikasso and Koulikoro.
56 Stunting prevalence is 27% (Mali DHS, 2018).
57 World Health Assembly target to reduce the number of stunted children by 40% by 2025.
58 Prevalence of overweight and obesity in women 15-49 years: DHS-2001: 15%, DHS-2018: 28%.
59 The double burden of malnutrition is characterised by the coexistence of undernutrition (including micronutrient deficiencies) and overweight and obesity.
60 Cost of Hunger in Mali, 2018.
61 IRRIGAR: Initiative de Renforcement de la Résilience par l’Irrigation et la Gestion Appropriée des Ressources.
62 IRRIGAR is a subcomponent of a larger programme, PASSIP (Programme d’Appui au Sous-Secteur de l’Irrigation de Proximité), co-funded by the EU and the Department of Global Affairs Canada, which supports the National Small Scale Irrigation Programme.
63 Inner delta of Niger, the Dogon country and regions of Koulikoro and Sikasso.
23A C T I O N P L A N O N N U T R I T I O N : F I F T H P R O G R E S S R E P O R T

Tangible results in the lives of women and children
IRRIGAR set up a robust monitoring and evaluation system to ensure that the situation at the end of the programme could be compared with that at the start. Data collected in 2019 now confirms a marked improvement in the dietary diversity of both mothers and young children as well as in household food security compared to the baseline situation of 2015. Sales of agricultural and market garden products had increased while household expenditure on health is more regular. There has also been an improvement in mothers’ attendance at ante-natal check-ups, an increase in exclusive breastfeeding and a more frequent preparation of nutritious recipes for children than was previously the case.
Outcomes64 2015 2019
Household food security 53.6% 93%
Mothers’ diet 2.3% 21.9%
Children’s diet:
6-23 months
24-59 months
10.4%
11.4%
17%
23.9%
Exclusive breastfeeding 33.8% 39.9%
Realising human potential
In Mali, the poorest children are three times more likely to be affected by stunting as those from better-off families. Nutrition inequalities can have short- and long-term consequences, such as poor health, delays in early child development and underperformance at school. The IRRIGAR programme ensured support for disadvantaged women and men in the creation of mechanisms for local community engagement in rural areas: 121 food and nutrition security community action groups with the involvement of local mayors. Gender considerations were central to the programme, which promoted the participation of men as well as women, facilitated women’s access to irrigated land and ensured gender disaggregated data in the design of monitoring and evaluation systems. Working with local radio stations to produce and broadcast informational programmes also helped raise to public awareness of nutrition and food hygiene as well as ensuring dissemination of messages in four local languages for maximum outreach.
Tackling climate and environmental challenges
Already subject to frequent droughts, Mali is highly vulnerable to climate change, which is expected to increase local temperatures, rainfall variability and the magnitude of extreme weather events. Climate-related changes are already being felt and are leading to a steady, southwards shift of agricultural activities to areas where population density is higher and the risk of conflict greater. The investments in small scale infrastructure associated with IRRIGAR play a key role in helping to mitigate drought risks and create new income opportunities. Reduced levels of outward migration have also been reported in the areas covered. Sensitivity to conflict with respect to the management of scarce water resources to preserve social cohesion has been central to IRRIGAR’s effectiveness.
64 Evaluation finale du volet sécurité alimentaire et nutritionnelle du PASSIP dans les régions de Koulikoro, Sikasso, Mopti et Tombouctou. The evaluation applied internationally recognised indicators: for household food security, the Food Consumption Score; for mother’s diet, the Dietary Diversity Score for Women; for children’s diet, the Minimum Dietary Diversity.
24A C T I O N P L A N O N N U T R I T I O N : F I F T H P R O G R E S S R E P O R T

Suchana: Ending the cycle of undernutrition in Bangladesh
Malnutrition in Bangladesh
While Bangladesh could potentially still meet the global target, child stunting remains highly prevalent (31%) and its decline is slowing down65. One in 10 of the poorest children also suffer from wasting – associated with weakened immunity and increased risk of death. At the same time, and with 40% of adult women anaemic, overweight and obesity continue to rise at national level. Undernutrition comes with high social and economic costs, which disproportionately affect the poorest households. Globally, nutrition-related factors are estimated to contribute to about 45% of deaths in children under-5 years of age66. Undernutrition has lifelong consequences: by undermining a child’s physical and cognitive development, it can lead to long-term reduction in productivity and a greater risk of chronic diseases later in life. The economic cost of undernutrition is estimated to exceed USD 1 billion per year in Bangladesh67.
Suchana (2016-2022)
Suchana is a EUR 53.8 million programme jointly supported by the EU and the UK Department for International Development (DFID). It aims to significantly reduce the incidence of stunting in children under two in two districts of Sylhet Division (which has the highest stunting and wasting prevalence, as well as the worst levels of gender inequality in Bangladesh). The programme’s multi-sectoral approach focuses on tackling undernutrition within the critical 1 000 days from conception until children reach their second birthday. This involves working closely with seven ministries to strengthen delivery systems and improve people’s access to key nutrition-related services as well as directly empowering women and men through support to income-generating activities, homestead gardening and awareness about health and nutrition. At the same time, Suchana is harnessing evidence of progress to catalyse support from government and other stakeholders to scale up a multi-sectoral approach and improve nutrition governance across the country. Core programme targets include:
• Livelihood diversification and increased income for 1.3 million people;
• Empowering 68 000 adolescent girls from poor households to extend school attendance and so to delay marriage;
• Delivering improved nutrition services through the health system to a quarter of a million rural families.
To ensure that nutritionally vulnerable households and individuals are better able to absorb climatic, health and economic shocks, a key component of the programme focuses on increasing access to government social protection schemes, including maternity allowance68. Suchana is implemented by a consortium of national and international NGOs led by Save the Children.
65 Bangladesh Demographic Health Survey (2018).
66 WHO (2019); https://www.who.int/news-room/fact-sheets/detail/children-reducing-mortality
67 Howlader, S.R. et al. 2012. Investing in Nutrition Now: A Smart Start for Our Children, Our Future.
68 The EU also supports the Government of Bangladesh (via budget support) to scale up national coverage of maternity allowance and child benefit. A programme reorientation is enabling the provision of income support to garment workers who have lost their livelihoods as a result of the Covid-19 outbreak in the country.
Women coming back from the field, Dhaka Hills, Sreemongal, Bangladesh. © EU
25A C T I O N P L A N O N N U T R I T I O N : F I F T H P R O G R E S S R E P O R T

Tangible results in the lives of women and children
Suchana has been designed to boost knowledge and evidence and so promote commitment and momentum for change. Halfway through implementation, annual surveys confirm significant improvement compared to the baseline. Household food insecurity has more than halved, while women’s dietary diversity has almost doubled. There has been a substantial increase in the number of children aged 6-23 months getting a minimally acceptable diet. Furthermore, the rate of exclusive breastfeeding has increased by almost 20%.
Outcomes69 2017 2018 2019
Food insecurity 85.9% 59.4% 38%
Women’s diet 26.7% 42% 52%
Children’s diet 10.4% 13.5% 17%
Exclusive breastfeeding 63.9% 75.6% 83%
Women’s empowerment 17.3% 57.9% 67%
Realising human potential
Access to adequate nutritious food is a fundamental human right and provides the foundation for healthy individuals and societies. Suchana reinforces Bangladesh’s national plan of action for nutrition by demonstrating that efforts to improve the nutrition of women and children should be understood as an investment in realising human potential, rather than a cost. Using a rights-based and gender-transformative strategy, Suchana positions women’s political, social and economic empowerment centre-stage: for example, by supporting women to establish village savings and loan groups to strengthen their decision-making in the household, while at the same time ensuring men’s participation in education and counselling sessions on maternal and child nutrition.
Tackling climate and environmental challenges
Bangladesh is uniquely vulnerable to climate change, with two-thirds of the country less than five metres above sea level. In 2017, severe flooding was experienced across the intervention area. Suchana has taken concrete steps to support beneficiaries to adopt climate-resilient livelihoods and disaster preparedness practices to increase resilience to shocks and stresses. Interventions include production diversification, eco-friendly cropping patterns and climate-smart cultivation techniques. Early warning systems have been introduced to help beneficiaries to get information and knowledge on short-term/rapid climatic hazards (such as cyclones, floods and storms), as well as long-term/slow hazards (such as drought and long-term climate change).
69 Internationally recognised indicators used: for food insecurity, the Household Food Insecurity Access Scale; for women’s diet, the Minimum Dietary Diversity for Women; for children’s diet, the Minimum Acceptable Diet; for women’s empowerment, a composite indicator for intra-household decision-making.
26A C T I O N P L A N O N N U T R I T I O N : F I F T H P R O G R E S S R E P O R T

The MDG1c programme: building resilience for better diets in Mozambique
Malnutrition in Mozambique
Mozambique’s strong economic performance has not been accompanied by a significant reduction in malnutrition. At 43%, the national prevalence of child stunting remains very high70. With more than 2 million stunted children, Mozambique is off-track to meet global nutrition targets on stunting, and children from the poorest households are disproportionately affected. At the same time anaemia affects almost 7 out of 10 children and more than half of women, while overweight and obesity is increasing across all groups. The causes of malnutrition are multi-faceted and include poor diets, inadequate childcare, inability to access a quality education and health services, unsafe water and sanitation, gender inequalities and persistent multi-dimensional poverty. Malnutrition – in all its forms – comes with unacceptably high, yet preventable, human, social and economic costs. Mozambique loses over 10.9% GDP each year to child stunting alone, equivalent to USD 1.6 billion71.
Accelerate progress towards MDG1c in Mozambique (2013-2019)
This EUR 87 million72 programme was funded under the EU MDG1c initiative to reduce hunger and undernutrition in areas with high agricultural potential but poor nutrition73. Adopting a holistic approach, the programme’s aims included improving agricultural and fisheries production to increase access to food and improving the nutrition status of vulnerable groups and low income households, with a focus on women and young children. Interventions included strengthening value chains in the agricultural and fisheries sectors, farmer field schools, e-vouchers, home gardens, food fortification, strengthening market information systems and nutrition education (including social behaviour change). Covering six ministries, the action was designed to reinforce existing national programmes and implementation brought together three UN agencies: IFAD, FAO and WFP. Crucially, programme coordination and monitoring were in the hands of the government’s technical secretariat for food and nutrition security (SETSAN). As identified by a 2015 midterm review, achieving a multi-sectoral approach to address nutrition at scale can be challenging. Key lessons learned have included the importance of adapting the programme to local contexts, strengthening nutrition governance and developing nutrition-related capacities of service providers at every level.
70 Mozambique DHS 2011; SETSAN Baseline Study 2013.
71 The Cost of Hunger in Africa (COHA) Mozambique study 2017.
72 EU support EUR 77.3 million including EUR 10 million top-up following El Niño emergency in 2016.
73 The programme’s geographical focus is on the Beira and Nacala corridors (76 districts in 10 provinces).
Children involved in the project Sesame and Honey Mozambique. © EU. Credit: Ellie Tomassi
27A C T I O N P L A N O N N U T R I T I O N : F I F T H P R O G R E S S R E P O R T

Tangible results in the lives of women and children
An evaluation of the MDG1c programme confirmed a measurable improvement in the food security, diet and nutritional status of children as compared to control groups who did not benefit from the programme74. In particular, the share of food-insecure households was halved, thereby increasing resilience to shocks; the diversity of children’s diets improved, as did the diets of women and adolescent girls75, and the prevalence of child stunting fell by 5 percentage points at district level. A particularly important finding was that the gains in food and nutrition security were much higher for households reached by the greatest range of interventions.
Outcomes76 2013 2018
Stunting 45% 40%
Food insecurity 31% 16%
Coping strategy index 45% 20%
Exclusive breastfeeding 27% 54%
Children’s diet 30% 35%
Realising human potential
Malnutrition on the scale found in Mozambique has long term negative consequences in terms of poor health, low levels of child development and reduced productivity leading to lower incomes. Social and economic inequalities between men and women can exacerbate poor nutrition while good nutrition and gender equality are mutually reinforcing. The programme set out to address gender inequalities with a number of interventions (such as farmer field schools for women and men, mothers’ care groups, and women’s savings groups) to ensure positive effects on women’s empowerment. One women’s savings group in Barue (Beira corridor) saw women start up successful businesses with the additional income allowing families to improve or build a new house or afford a better education for their children. As a result, the programme has contributed directly to breaking the cycle of deprivation connected to maternal disadvantage and malnutrition.
Tackling climate and environmental challenges
Mozambique is one of the countries most vulnerable to natural disasters and climate change and in recent years has faced repeated emergencies. The severe El Niño drought in 2016, followed by two cyclones in 2019, caused widespread damage to already vulnerable livelihoods and further deterioration of food insecurity. During the humanitarian and early recovery response period, e-vouchers developed and institutionalised by the MDG1c programme worked effectively to distribute assets to affected populations. Communities were able to become more resilient by having better knowledge on how to prevent disease, improved crop production during the lean season and periods of crisis, and the building of community assets such as irrigation schemes, water harvesting systems and roads.
74 SETSAN (2018) Endline Study (district level) and Impact Evaluation (community level) of MDG1c programme in Mozambique. Note: limitations of the Endline Study do not allow to attribute impact only to MDG1c while there is a greater level of confidence with the Impact Evaluation.
75 Evaluation of IFAD/PROMER agricultural marketing interventions showed the Minimum Dietary Diversity for Women indicator improved both for women (from 28% to 40%) and adolescent girls (from 55% to 68%) between 2017 and 2018.
76 Internationally recognised indicators used: for food insecurity, the Food Consumption Score; for coping strategy index, the Reduced Coping Strategy Index; for children’s diet, the Minimum Dietary Diversity.
28A C T I O N P L A N O N N U T R I T I O N : F I F T H P R O G R E S S R E P O R T

Coffee berry picking, Guatemala. © EU. Credit: Ana Valeria Meija
National Information Platforms for Nutrition: Using data to accelerate change in people’s lives
Malnutrition in Guatemala
With almost half of all children under five stunted77, Guatemala is not on track to reduce the number of stunted children by 40% in line with the international target for 2025. Among indigenous communities, more than 7 out of 10 children are stunted, highlighting the persistence of serious inequalities. At the same time, Guatemala also faces a rapid rise in adult obesity with rates among women doubling in two decades – and tripled among indigenous women – leading to an acceleration of non-communicable diseases (NCDs). These different forms of malnutrition often coexist in individuals, households and populations and the existence of households with a stunted child and an overweight mother is a growing problem in the country. Evidence shows undernutrition in early stages of life is an important risk factor for obesity and NCD in adulthood78. The generally worsening quality of diets coupled with persistent barriers in access to basic services and gender inequalities are key contributors to this double burden of malnutrition. Recurrent natural disasters exacerbate vulnerabilities and destabilise rural livelihoods. Undernutrition alone has been estimated to cost Guatemala at least 11% of its GDP79.
Guatemala’s information platform on nutrition
A Commission global initiative80 to support countries committed to tackling malnutrition, NIPN aims to strengthen the management of national nutrition information systems and improve the analysis of data to better inform inclusive policies and planning. NIPN thus inspires a shift from policy to implementation. In Guatemala, the NIPN81 was launched in 2017 and is hosted by the Secretariat of Food and Nutrition Security82. A key focus has been on accelerating progress with implementing the multi-sectoral national strategy for the prevention of chronic malnutrition (2016-2020).
Results of NIPN Guatemala
The NIPN in Guatemala conducted a national study to analyse the country’s progress on the basis of four multi-sectoral nutrition strategies from 2006 to 2020 and ahead of the 2019 elections. The study confirmed that stunting is declining far too slowly: on current trends almost 2 out of every 5 children will still be stunted by 2030. The study analysed in detail budget allocations and expenditures across priority sectors and over time in order to identify potential issues. A number of key insights were established:
77 Guatemala DHS 2014/15; Global Nutrition Report 2018.
78 Maternal and child nutrition, Lancet 2013.
79 ECLAC/WFP 2004.
80 Also supported by DFID and the Bill & Melinda Gates Foundation.
81 Supported by the EU with a budget of € 2.75 million for 3.5 years.
82 Technical assistance is being provided by the Research and Higher Education Centre for Tropical Agronomy (CATIE).
29A C T I O N P L A N O N N U T R I T I O N : F I F T H P R O G R E S S R E P O R T

1. Over the years, the strategies have progressively narrowed in terms of targeting fewer areas, more restricted age groups and a smaller of number of interventions.
2. Funding and human resources have often not matched the ambitious commitments made. Public investments in food and nutrition security were found to have actually decreased since 2012, meaning that coverage targets could not be met.
Figure 11: Government of Guatemala annual operational plans for national investments in food and nutrition security (2009-2018)
3. There has been a greater focus on and budget allocation towards addressing immediate causes via nutrition-specific interventions, falling mostly in the remit of health, as compared to addressing more basic structural causes such as multi-dimensional poverty and gender inequality.
4. Beyond the health sector, capacities to actually make effective use of resources were very limited, particularly at more local levels, and monitoring systems were weak.
Overall, this unprecedented national exercise concluded that more needed to be done in order to transform the multi-sectoral approach from policy into practice. Accordingly, NIPN was integrated within a municipal information system and is now operational as a pilot initiative83. Local authorities are already employing the tool to support better planning and monitoring of municipal interventions for vulnerable households.
Realising human potential
Stunting is associated with poor cognitive and educational outcomes while a stunted child is also at risk of developing obesity and NCDs later in life. The elimination of child stunting is therefore crucial to realise the basic rights of all children and catalyse national development. Seizing the opportunity of the 2019 elections, NIPN contributed to high-level advocacy efforts to maintain nutrition as a top political priority. Guatemala must address the structural drivers of malnutrition with adequate investment and service provision in order to unlock the human potential of disadvantaged populations, especially indigenous communities. To this end, the new government has recently approved its new strategy, the ‘great national crusade for nutrition’ (2020-2024).
Tackling climate and environmental challenges
Guatemala is among the nations deemed most vulnerable to the effects of climate change. Recent studies show a clear link between climate variability, food and nutrition insecurity and migration, increasingly perceived by poor people as their only option. The establishment of NIPN in Guatemala supports national stakeholders to gear up to address such challenges, by ensuring better information systems and strong data analysis that speaks to the most pressing of policy priorities.
83 Municipality of Momostenango in the Department of Totonicapán.
0
200
400
600
800
1,000
0%
1%
2%
3%
4%
2009 2010 2011 2012 2013 2014 2015 2016 2017 2018
Disbursed (millions, USD) Budgeted (millions, USD) Food and Nutritions Security investments as % of GDP
30A C T I O N P L A N O N N U T R I T I O N : F I F T H P R O G R E S S R E P O R T

Progress towards the EU’s commitments
The report confirms that the Commission’s 2013 financial pledge of EUR 3.5 billion for nutrition-related programmes in the period 2014-2019 has already been achieved a year ahead of schedule.
The prevalence of stunting has declined in 37 countries prioritising nutrition. On current predicted trends, the number of children who will have been averted from stunting in 40 partner countries between 2012 and 2025 is 4.7 million. To achieve the target of averting 7 million children from stunting, the average annual rate of reduction in these countries will need to increase from 1.35% to 1.82%. In order to further accelerate the reduction of stunting, the EU will need to continue directly engaging with governments in partner countries to scale up nutrition related investments. This becomes even more urgent given the economic fallout of COVID-19. Although the medium-longer impact of the pandemic is still a major unknown, it could especially threaten people suffering from hunger or malnourishment, in particular undernourished children.
While the ongoing reduction in stunting prevalence cannot be attributed entirely to the EU’s investments, the financial achievements coupled with the strong evidence of results in the lives of women and children through nutrition related programmes testify to the importance of the EU’s contribution in tackling malnutrition and underscores the continued relevance of the pledge to meet the 2025 target84.
Key insights from progress
Seven years since its publication, the APN’s core strategic objectives continue to be highly relevant. Detailed insights at programme level confirm that strengthening governance, scaling up actions through national systems and investing in knowledge for nutrition can bring real change at multiple levels. The increasing use of budget support modalities for nutrition is potentially accelerating the efficiency of investments in national capacities and systems. Building on this experience, opportunities exist to ensure multi-sectoral nutrition outcomes from all budget support operations. In the education sector for instance, this may involve agreeing national targets for the provision of safe drinking water, good sanitation and hygiene in schools as well as integrating nutrition awareness into teacher training and curriculum development.
The case studies presented in this report highlight the message that a rights-based, multi-sectoral and locally adapted approach to nutrition can have a profound impact on people’s lives. By increasing income, improving access to basic services and supporting the transformation of gender relations, concrete changes are manifested in more diverse and nutritious diets, improved care practices, women’s empowerment and ultimately, better nutritional status – including stunting reduction.
84 Child stunting is linked to other forms of malnutrition. For instance, the evidence shows that undernutrition early in life can increase the risk of overweight and noncommunicable diseases such as diabetes and heart disease later in life. https://www.who.int/nutrition/double-burden-malnutrition/en/
Conclusions
Section 5.
31A C T I O N P L A N O N N U T R I T I O N : F I F T H P R O G R E S S R E P O R T

Ongoing and emerging challenges
The global outbreak of COVID-19 is disrupting food systems — including humanitarian supply chains — around the world, often with unduly negative impacts, in particular for women, adolescent girls and children. This pandemic, reinforces the growing recognition that good nutrition and healthy diets are crucial to build and maintain a strong immune system, thereby ensuring that people are better able to fight disease.
It has been estimated that the economic fallout from the global pandemic could increase global poverty by half a billion people, or 8% of the total human population85. Those regions and countries of the world having the highest numbers of poor people are precisely those with the majority of the world’s stunted children. Even within countries, socio-economic inequalities continue to present a daunting challenge for policies focused on tackling malnutrition. This is reflected in the disproportionately high incidence of stunting among children from the poorest and most excluded segments of society.
Moreover, the climate crisis — with rising carbon emissions propelling a dangerous increase in global temperatures, greater climate variability and more frequent extreme weather events — continues to pose a potentially even more daunting range of threats to economies and the prospect of reducing inequalities, ensuring sustainable food systems and healthy diets and improving people’s health.
Pressure from demographic growth — particularly in Sub-Saharan Africa — also means that improvements in stunting prevalence do not immediately translate into a reduction in the number of stunted children. Additionally, in a quarter of the countries prioritising nutrition in their cooperation with the EU, protracted conflict is associated with lower improvement in stunting prevalence. This underlines the need to create stronger synergies between humanitarian assistance and longer-term development efforts for nutrition.
The multiple and reinforcing socio-economic impacts of such crises and the resulting disruption of food systems place, invariably, the greatest burden on fragile developing countries, where the interaction of hunger, malnutrition and infectious diseases already constitutes a leading cause of morbidity and mortality. At the same time the global obesity epidemic continues to accelerate86.
Against this backdrop of heightened vulnerability it is clear that the protection and promotion of good nutrition — especially for the poor and most vulnerable, and with increased attention to the territorial differences across regions in terms of how challenges evolve and impact — is at the core of a policy driven approach to EU cooperation. Ending malnutrition is fundamental to achieving sustainable planetary well-being87.
85 The UNU/WIDER Working Paper (April 2020) estimates an outcome of a 400-600 million persons increase in global poverty given a scenario in which per capita consumption contracts by 20%. The study also estimates poverty increases for mitigated contractions of 10% and 5% and shows the impacts on poverty by region, as well as globally. https://www.wider.unu.edu/news/press-release-covid-19-fallout-could-push-half-billion-people-poverty-developing-countries
86 In low and middle income countries the prevalence of overweight and obesity now appears to be increasing at the same rate or faster in rural areas than in cities. https://www.nature.com/articles/s41586-019-1171-x
87 https://www.thelancet.com/commissions/global-syndemic
32A C T I O N P L A N O N N U T R I T I O N : F I F T H P R O G R E S S R E P O R T

Looking forward
The Commission continues to make use of up-to-date and publicly-available nutrition country profiles to support EU Delegations to work with national stakeholders in better understanding and prioritising the specific challenges currently experienced and anticipated at national and local levels. The profiles identify country-specific opportunities for nutrition mainstreaming across sectors and ensure that fresh data and analysis are available to inform ongoing policy dialogue with the EU.
The Commission’s strategic engagement with international initiatives also continues to add value — including support to NIPN and the SUN Movement, in addition to ongoing participation in the Committee on World Food Security88 — in particular regarding the development of the Voluntary Guidelines for Food Systems and Nutrition. Such engagement is expected to contribute to rendering food systems more sustainable and nutrition-sensitive, and to promoting secure access to safe, diverse and healthy diets for all.
In the face of daunting global challenges, including COVID-19, people and environment must remain at the core of food systems transformation. At the same time, these challenges may provide new and more resilient ways to tackle hunger and malnutrition. Supporting efforts to better understand the actual impact of COVID-19 on nutrition outcomes in diverse contexts and on different vulnerable populations, thereby anchoring policymaking in evidence on the ground, undoubtedly presents an immediate priority at country level.
This pandemic has strikingly brought to light the need to transform unsustainable food systems. It underlines the relevance for the Commission’s Green Deal, and Farm to Fork Strategy in particular, to actively contribute to the realisation of a greener future, in which sustainable and resilient food systems play an essential role.
Understanding that malnutrition represents the tangible manifestation of inequalities is key to ensuring a systematic approach to mainstream the reduction of inequalities across EU development cooperation. Maintaining a strong focus on nutrition outcomes by following a multi-sectoral approach will be essential to accelerate stunting reduction and the overarching commitment to eradicate poverty and achieve sustainable development by 2030. Good nutrition matters more than ever before.
88 The Committee on World Food Security is an international and intergovernmental platform for stakeholders to work towards ensuring food security and good nutrition for all. The Committee reports to the UN General Assembly through the Economic and Social Council and to FAO Conference.
33A C T I O N P L A N O N N U T R I T I O N : F I F T H P R O G R E S S R E P O R T

ANNEX 1:Stunting in children under 5 in the 42 countries prioritising nutrition
42 countries by region
Baseline % children stunted, 2012 (2020 estimate)
Baseline number of children stunted in 2012, millions (2020 estimate)
% stunted, 2019 (2020 estimate)
Number stunted, 2019, millions (2020 estimate)
Estimated no. of children averted from stunting 2012-2019 (millions)
Estimatedno. of children who will be stunted if WHA target is met by 2025 (m)
Estimated no. of children who will be averted from stunting if WHA target is met by 2025 (2019-2025) (millions)
Total 39.2% 78.833 34.9% 77.692 1.141 47.300 30.392
Africa 38.1% 51.637 34.5% 53.444 -1.807 30.982 22.462
Angola 20.9% 1.002 29.3% 1.660 -0.658 0.601 1.059
Benin 30.5% 0.499 32.2% 0.604 -0.105 0.299 0.305
Burkina Faso 34.9% 1.042 26.0% 0.887 0.155 0.625 0.262
Burundi 55.5% 0.945 54.1% 1.092 -0.147 0.567 0.525
Cameroon 35.7% 1.292 31.5% 1.277 0.015 0.775 0.502
Chad 38.9% 0.955 38.4% 1.103 -0.148 0.573 0.530
Côte d'Ivoire 35.3% 1.220 26.8% 1.084 0.136 0.732 0.352
DRC 42.6% 5.524 40.3% 6.253 -0.729 3.314 2.938
Djibouti 32.1% 0.030 33.3% 0.033 -0.004 0.018 0.015
Ethiopia 43.5% 6.383 36.5% 6.037 0.346 3.830 2.207
Gambia 21.7% 0.073 17.1% 0.069 0.005 0.044 0.024
Guinea-Bissau 37.1% 0.100 28.0% 0.084 0.015 0.060 0.025
Kenya 35.7% 2.505 27.8% 1.951 0.554 1.503 0.448
Madagascar 48.7% 1.717 43.7% 1.757 -0.040 1.030 0.727
Malawi 48.5% 1.325 39.4% 1.132 0.193 0.795 0.337
Mali 29.4% 0.909 26.6% 0.940 -0.031 0.545 0.395
Mauritania 24.4% 0.143 21.0% 0.143 0.000 0.086 0.057
Mozambique 41.1% 1.786 38.3% 1.934 -0.148 1.071 0.862
Niger 45.1% 1.663 42.7% 1.984 -0.322 0.998 0.987
Nigeria 37.2% 10.828 35.1% 11.742 -0.914 6.497 5.245
Rwanda 46.0% 0.751 39.1% 0.723 0.028 0.451 0.272
Senegal 19.0% 0.435 16.9% 0.436 -0.001 0.261 0.175
Sierra Leone 41.5% 0.449 32.5% 0.373 0.076 0.269 0.104
Somalia 30.4% 0.719 29.3% 0.806 -0.086 0.432 0.374
Sudan 32.2% 1.831 36.8% 2.296 -0.465 1.099 1.198
Tanzania 34.3% 2.251 29.2% 2.247 0.004 1.350 0.896
Uganda 39.1% 3.231 33.0% 3.142 0.089 1.938 1.204
Zambia 49.4% 1.278 37.0% 1.073 0.205 0.767 0.306
Zimbabwe 35.3% 0.754 27.3% 0.584 0.170 0.453 0.131
Asia 42.1% 25.678 36.0% 22.847 2.831 15.407 7.440
Afghanistan 67.1% 3.631 38.1% 2.148 1.483 2.178 -0.030
Bangladesh 39.4% 5.878 31.7% 4.565 1.313 3.527 1.038
Cambodia 36.0% 0.631 28.6% 0.509 0.122 0.378 0.131
Lao PDR 43.8% 0.349 34.5% 0.274 0.075 0.209 0.065
Myanmar 32.5% 1.536 26.9% 1.213 0.323 0.922 0.291
Nepal 39.9% 1.170 32.4% 0.876 0.294 0.702 0.174
Pakistan 41.1% 10.168 39.6% 10.958 -0.790 6.101 4.857
Sri Lanka 15.2% 0.268 13.9% 0.233 0.035 0.161 0.072
Timor-Leste 58.7% 0.091 52.7% 0.092 -0.001 0.055 0.037
Yemen 52.0% 1.957 48.3% 1.979 -0.022 1.174 0.805
Latin America 35.9% 1.517 32.3% 1.401 0.116 0.910 0.490
Guatemala 50.8% 0.983 46.5% 0.955 0.028 0.590 0.365
Haiti 23.0% 0.292 20.1% 0.255 0.037 0.175 0.080
Honduras 23.7% 0.242 18.8% 0.190 0.051 0.145 0.883
A C T I O N P L A N O N N U T R I T I O N : F I F T H P R O G R E S S R E P O R T34

ANNEX 2:Country dashboard of nutrition-relevant indicators
COUNTRY
INPUTS "PROCESS/ACTIVITIES" OUTPUTS OUTCOMES OUTCOMES IMPACT
DEVCO Nutrition Commitments 2014-2018
(EUR millions)
DEVCO Nutrition Disbursements
2014-2018 (EUR millions)
Number of women + children benefiting from
DEVCOnutrition assistance
(2016-2018)
Global Food Security Index Exclusive breastfeeding of infants < 6 months (%)
Wasting Prevalence in children under 5 years of age (%)
Stunting Prevalence in children under 5 years of age (%) Rate of stunting reduction (%)
2012 2019 Change since 2012 baseline
Data of the closest year to the 2012
baseline
Most recent data
Change since 2012
baseline
Data of the closest year to the 2012
baseline
Most recent data
Change since 2012
baseline
2012 baseline
(as estimated in 2019)
2019 Estimate
Change since 2012
baseline
2012 baseline (as estimated in 2019)
Estimated in 2019)
Change since 2012
baseline
Afghanistan 86.88 70.93 - 43.1 57.5 9.5 5.1 67.1 38.1 -1.6 1.9
Angola 16.25 4.27 - 35.8 45.5 37.4 8.2 4.9 20.9 29.3 6.5 2.6
Bangladesh 138.06 36.70 35,451 42.6 53.2 55.9 55.3 15.7 8.4 39.4 31.7 2.8 2.9
Benin 17.50 5.91 - 36.0 51.0 32.5 41.4 9.0 5.0 30.5 32.2 1.5 0.8
Burkina Faso 56.50 53.54 57,623 33.2 50.1 38.2 47.8 10.7 8.4 34.9 26.0 1.0 2.3
Burundi 31.25 12.11 - 29.1 34.3 69.3 82.3 6.0 5.1 55.5 54.1 1.0 0.7
Cambodia 7.50 2.12 6,405 38.4 49.4 72.8 65.2 11.0 9.7 36.0 28.6 2.8 3.0
Cameroon 6.75 6.15 - 40.2 49.9 19.9 28.0 5.7 4.3 35.7 31.5 -0.2 0.5
Chad 204.50 48.46 51,754 30.9 36.9 3.2 0.1 16.3 13.3 38.9 38.4 0.7 0.5
Côte d'Ivoire - 0.51 - 42.0 52.3 11.8 23.1 7.6 6.1 35.3 26.8 -0.1 1.4
D. R. of the Congo 6.75 13.88 - 26.5 35.7 36.4 47.3 8.5 8.1 42.6 40.3 0.9 0.8
Djibouti 6.75 1.73 - 12.4 21.5 32.1 33.3 -0.5 -0.5
Ethiopia 118.33 94.20 46,196 39.4 49.2 52.0 56.5 9.8 7.2 43.5 36.5 2.2 2.3
Gambia 17.39 15.23 43,821 33.1 46.8 9.5 6.1 21.7 17.1 2.5 2.9
Guatemala - 2.18 3,186,235 49.1 60.6 49.6 53.2 1.0 0.8 50.8 46.5 0.4 0.7
Guinea-Bissau 14.00 12.69 - 38.3 52.5 5.9 6.0 37.1 28.0 0.1 1.8
Haiti 25.49 20.02 - 31.0 43.3 39.3 39.9 5.1 3.7 23.0 20.1 2.5 2.3
Honduras 17.00 9.17 11,210 49.7 58.0 30.7 1.4 23.7 18.8 3.2 3.2
Kenya 20.59 16.75 534,566 43.7 50.7 31.9 61.4 6.9 4.2 35.7 27.8 0.7 1.6
Lao People's D. R. 50.12 14.31 1,142 37.3 49.1 39.7 44.4 5.9 9.0 43.8 34.5 1.0 1.8
Madagascar 20.00 5.36 - 33.6 37.9 50.1 41.9 7.5 6.4 48.7 43.7 0.9 1.1
Malawi 84.75 25.69 3,117 33.5 42.4 69.0 59.4 4.0 1.3 48.5 39.4 0.9 1.6
Mali 21.27 57.02 184,712 40.6 54.4 20.2 40.4 8.9 9.0 29.4 26.6 2.4 2.0
Mauritania 22.70 12.76 3,282 26.7 40.3 11.6 14.8 24.4 21.0 3.8 3.2
Mozambique 50.25 27.60 - 34.2 41.4 40.0 41.0 6.1 4.4 41.1 38.3 1.7 1.5
Myanmar 22.50 28.22 146,938 39.3 57.0 23.6 51.2 7.9 6.6 32.5 26.9 2.8 2.7
Nepal 38.43 18.27 12,216 42.0 56.4 69.6 65.2 11.2 9.6 39.9 32.4 3.1 3.0
Niger 87.37 82.79 1,560,520 33.0 49.6 23.3 18.2 10.1 45.1 42.7 0.6 0.7
Nigeria 65.18 39.03 3,640,460 37.7 48.4 14.7 28.7 10.2 6.8 37.2 35.1 1.1 1.0
Pakistan 79.37 35.06 89,634 46.6 56.8 37.7 47.5 14.8 7.1 41.1 39.6 0.7 0.7
Rwanda 50.92 54.34 - 37.4 48.2 83.8 86.9 2.4 2.1 46.0 39.1 0.6 1.2
Senegal 31.03 29.26 939,494 35.8 54.5 37.5 42.1 8.7 8.1 19.0 16.9 2.6 2.3
Sierra Leone 2.25 4.17 43,672 34.4 39.0 31.4 47.2 8.5 5.4 41.5 32.5 -0.3 1.1
Somalia 20.50 17.70 230 5.3 14.3 30.4 29.3 0.5 0.5
Sri Lanka 7.50 3.60 1,210 53.5 60.8 75.8 82.0 21.3 15.1 15.2 13.9 3.1 2.4
Sudan 38.22 20.40 102 34.4 45.7 41.0 54.6 15.4 16.3 32.2 36.8 2.9 0.0
Timor-Leste 15.50 9.86 - 62.3 50.2 18.9 9.9 58.7 52.7 -0.6 0.4
Uganda 47.85 15.01 - 41.8 46.2 62.3 65.5 4.2 3.5 34.3 29.2 1.9 2.0
U. R. of Tanzania 35.00 2.98 - 37.1 47.6 48.7 59.0 6.2 3.5 39.1 33.0 1.4 1.7
Yemen 18.00 26.28 231,383 36.1 35.6 11.5 9.7 13.3 16.4 52.0 48.3 0.1 0.4
Zambia 30.50 14.75 - 34.1 44.4 72.0 69.9 6.2 4.2 49.4 37.0 0.3 1.5
Zimbabwe 30.88 36.02 6,600 31.3 47.1 3.2 2.9 35.3 27.3 -0.8 0.9
Note: Data excludes some regional, global and policy/research/information commitments during 2014-2018 that could not be disaggregated by beneficiary country at this stage, amounting to EUR 335.2 million (15.7% of the total). Data excludes some regional, global and policy/research/information disbursements during 2014-2018 that could not be disaggregated by beneficiary country at this stage, amounting to EUR 121.7 million (9.9% of the total).
A C T I O N P L A N O N N U T R I T I O N : F I F T H P R O G R E S S R E P O R T35

COUNTRY
INPUTS "PROCESS/ACTIVITIES" OUTPUTS OUTCOMES OUTCOMES IMPACT
DEVCO Nutrition Commitments 2014-2018
(EUR millions)
DEVCO Nutrition Disbursements
2014-2018 (EUR millions)
Number of women + children benefiting from
DEVCOnutrition assistance
(2016-2018)
Global Food Security Index Exclusive breastfeeding of infants < 6 months (%)
Wasting Prevalence in children under 5 years of age (%)
Stunting Prevalence in children under 5 years of age (%) Rate of stunting reduction (%)
2012 2019 Change since 2012 baseline
Data of the closest year to the 2012
baseline
Most recent data
Change since 2012
baseline
Data of the closest year to the 2012
baseline
Most recent data
Change since 2012
baseline
2012 baseline
(as estimated in 2019)
2019 Estimate
Change since 2012
baseline
2012 baseline (as estimated in 2019)
Estimated in 2019)
Change since 2012
baseline
Afghanistan 86.88 70.93 - 43.1 57.5 9.5 5.1 67.1 38.1 -1.6 1.9
Angola 16.25 4.27 - 35.8 45.5 37.4 8.2 4.9 20.9 29.3 6.5 2.6
Bangladesh 138.06 36.70 35,451 42.6 53.2 55.9 55.3 15.7 8.4 39.4 31.7 2.8 2.9
Benin 17.50 5.91 - 36.0 51.0 32.5 41.4 9.0 5.0 30.5 32.2 1.5 0.8
Burkina Faso 56.50 53.54 57,623 33.2 50.1 38.2 47.8 10.7 8.4 34.9 26.0 1.0 2.3
Burundi 31.25 12.11 - 29.1 34.3 69.3 82.3 6.0 5.1 55.5 54.1 1.0 0.7
Cambodia 7.50 2.12 6,405 38.4 49.4 72.8 65.2 11.0 9.7 36.0 28.6 2.8 3.0
Cameroon 6.75 6.15 - 40.2 49.9 19.9 28.0 5.7 4.3 35.7 31.5 -0.2 0.5
Chad 204.50 48.46 51,754 30.9 36.9 3.2 0.1 16.3 13.3 38.9 38.4 0.7 0.5
Côte d'Ivoire - 0.51 - 42.0 52.3 11.8 23.1 7.6 6.1 35.3 26.8 -0.1 1.4
D. R. of the Congo 6.75 13.88 - 26.5 35.7 36.4 47.3 8.5 8.1 42.6 40.3 0.9 0.8
Djibouti 6.75 1.73 - 12.4 21.5 32.1 33.3 -0.5 -0.5
Ethiopia 118.33 94.20 46,196 39.4 49.2 52.0 56.5 9.8 7.2 43.5 36.5 2.2 2.3
Gambia 17.39 15.23 43,821 33.1 46.8 9.5 6.1 21.7 17.1 2.5 2.9
Guatemala - 2.18 3,186,235 49.1 60.6 49.6 53.2 1.0 0.8 50.8 46.5 0.4 0.7
Guinea-Bissau 14.00 12.69 - 38.3 52.5 5.9 6.0 37.1 28.0 0.1 1.8
Haiti 25.49 20.02 - 31.0 43.3 39.3 39.9 5.1 3.7 23.0 20.1 2.5 2.3
Honduras 17.00 9.17 11,210 49.7 58.0 30.7 1.4 23.7 18.8 3.2 3.2
Kenya 20.59 16.75 534,566 43.7 50.7 31.9 61.4 6.9 4.2 35.7 27.8 0.7 1.6
Lao People's D. R. 50.12 14.31 1,142 37.3 49.1 39.7 44.4 5.9 9.0 43.8 34.5 1.0 1.8
Madagascar 20.00 5.36 - 33.6 37.9 50.1 41.9 7.5 6.4 48.7 43.7 0.9 1.1
Malawi 84.75 25.69 3,117 33.5 42.4 69.0 59.4 4.0 1.3 48.5 39.4 0.9 1.6
Mali 21.27 57.02 184,712 40.6 54.4 20.2 40.4 8.9 9.0 29.4 26.6 2.4 2.0
Mauritania 22.70 12.76 3,282 26.7 40.3 11.6 14.8 24.4 21.0 3.8 3.2
Mozambique 50.25 27.60 - 34.2 41.4 40.0 41.0 6.1 4.4 41.1 38.3 1.7 1.5
Myanmar 22.50 28.22 146,938 39.3 57.0 23.6 51.2 7.9 6.6 32.5 26.9 2.8 2.7
Nepal 38.43 18.27 12,216 42.0 56.4 69.6 65.2 11.2 9.6 39.9 32.4 3.1 3.0
Niger 87.37 82.79 1,560,520 33.0 49.6 23.3 18.2 10.1 45.1 42.7 0.6 0.7
Nigeria 65.18 39.03 3,640,460 37.7 48.4 14.7 28.7 10.2 6.8 37.2 35.1 1.1 1.0
Pakistan 79.37 35.06 89,634 46.6 56.8 37.7 47.5 14.8 7.1 41.1 39.6 0.7 0.7
Rwanda 50.92 54.34 - 37.4 48.2 83.8 86.9 2.4 2.1 46.0 39.1 0.6 1.2
Senegal 31.03 29.26 939,494 35.8 54.5 37.5 42.1 8.7 8.1 19.0 16.9 2.6 2.3
Sierra Leone 2.25 4.17 43,672 34.4 39.0 31.4 47.2 8.5 5.4 41.5 32.5 -0.3 1.1
Somalia 20.50 17.70 230 5.3 14.3 30.4 29.3 0.5 0.5
Sri Lanka 7.50 3.60 1,210 53.5 60.8 75.8 82.0 21.3 15.1 15.2 13.9 3.1 2.4
Sudan 38.22 20.40 102 34.4 45.7 41.0 54.6 15.4 16.3 32.2 36.8 2.9 0.0
Timor-Leste 15.50 9.86 - 62.3 50.2 18.9 9.9 58.7 52.7 -0.6 0.4
Uganda 47.85 15.01 - 41.8 46.2 62.3 65.5 4.2 3.5 34.3 29.2 1.9 2.0
U. R. of Tanzania 35.00 2.98 - 37.1 47.6 48.7 59.0 6.2 3.5 39.1 33.0 1.4 1.7
Yemen 18.00 26.28 231,383 36.1 35.6 11.5 9.7 13.3 16.4 52.0 48.3 0.1 0.4
Zambia 30.50 14.75 - 34.1 44.4 72.0 69.9 6.2 4.2 49.4 37.0 0.3 1.5
Zimbabwe 30.88 36.02 6,600 31.3 47.1 3.2 2.9 35.3 27.3 -0.8 0.9
A C T I O N P L A N O N N U T R I T I O N : F I F T H P R O G R E S S R E P O R T36

COUNTRY
CONTEXT CONTEXT
Delivery in health facility (%) HANCI Score Population Growth(millions)
Gender Inequality Index (Range 0 to 1)
Global multi-poverty index(Range 0 to 1)
2012 baseline
Most recent data Change since 2012 baseline
2012 baseline "Most recent data (2017)"
Change since 2012 baseline
2012 baseline
"Most recent data (2018)"
Change since 2012 baseline
2012 baseline
"Most recent data (2018)"
Change since 2012 baseline
Data of the closest year to the
2012 baseline
Most recent data
Change since 2012 baseline
Afghanistan 35.8 48.1 104 81 3.41 2.38 0.644 0.575 0.353 0.272
Angola 45.8 45.6 80 103 3.60 3.28 0.578 0.452 0.282
Bangladesh 31.0 37.4 189 158 1.15 1.05 0.569 0.536 0.253 0.198
Benin 86.9 83.9 147 136 2.80 2.73 0.626 0.613 0.307 0.368
Burkina Faso 66.3 82.2 198 175 3.00 2.87 0.609 0.612 0.519
Burundi 78.2 83.9 86 142 3.16 3.17 0.539 0.520 0.454 0.403
Cambodia 61.4 83.2 175 148 1.63 1.49 0.484 0.474 0.212 0.170
Cameroon 61.2 61.3 122 136 2.73 2.61 0.616 0.566 0.248 0.243
Chad 15.8 21.7 105 3.37 3.02 0.701 0.554 0.533
Côte d'Ivoire 57.4 69.8 132 150 2.44 2.55 0.667 0.657 0.310 0.236
D. R. of the Congo 74.9 79.9 76 128 3.34 3.23 0.674 0.655 0.392 0.389
Djibouti 86.7 1.68 1.56 0.170
Ethiopia 9.9 26.2 160 135 2.83 2.62 0.569 0.508 0.564 0.489
Gambia 55.7 62.6 201 199 3.03 2.95 0.657 0.620 0.324 0.286
Guatemala 63.1 65.0 240 245 2.13 1.95 0.517 0.492 0.127 0.134
Guinea-Bissau 41.4 44.0 74 78 2.65 2.49 0.462 0.372
Haiti 35.9 39.4 1.48 1.27 0.621 0.620 0.231 0.200
Honduras 82.7 1.87 1.67 0.513 0.479 0.159 0.090
Kenya 42.6 61.2 114 185 2.66 2.31 0.606 0.545 0.229 0.178
Lao People's D. R. 37.5 64.5 1.52 1.55 0.495 0.463 0.211 0.108
Madagascar 35.3 37.9 213 203 2.73 2.67 0.453
Malawi 73.2 91.0 222 213 2.86 2.64 0.615 0.615 0.334 0.243
Mali 55.5 66.8 177 174 2.95 3.01 0.674 0.676 0.457 0.457
Mauritania 64.5 69.3 101 144 2.95 2.78 0.647 0.620 0.285 0.261
Mozambique 54.8 186 121 2.75 2.91 0.590 0.569 0.411
Myanmar 36.2 37.1 89 115 0.83 0.61 0.507 0.459 0.154 0.176
Nepal 35.3 57.4 175 216 -0.19 1.65 0.516 0.476 0.217 0.148
Niger 29.8 58.8 162 163 3.90 3.82 0.679 0.647 0.590
Nigeria 45.1 39.4 135 103 2.68 2.59 0.240 0.291
Pakistan 41.0 66.2 147 187 2.13 2.06 0.563 0.547 0.228 0.198
Rwanda 68.9 90.7 179 185 2.46 2.64 0.435 0.412 0.350 0.259
Senegal 71.0 78.2 172 169 2.79 2.78 0.550 0.523 0.332 0.288
Sierra Leone 50.1 76.7 147 121 2.25 2.14 0.660 0.644 0.388 0.297
Somalia 9.4 2.70 2.83 0.514
Sri Lanka 98.2 99.5 0.13 1.05 0.400 0.380 0.021
Sudan 20.5 27.7 92 119 2.36 2.39 0.612 0.560 0.321 0.279
Timor-Leste 22.1 49.0 1.77 1.97 0.360 0.210
Uganda 57.4 73.4 173 149 3.18 3.72 0.552 0.531 0.367 0.269
U. R. of Tanzania 50.2 62.6 201 191 2.97 2.98 0.558 0.539 0.332 0.273
Yemen 23.5 29.8 97 81 2.76 2.36 0.826 0.834 0.283 0.241
Zambia 45.0 67.4 176 144 3.10 2.91 0.588 0.540 0.328 0.261
Zimbabwe 65.1 77.0 150 1.70 1.41 0.567 0.525 0.172 0.137
ANNEX 2:Country dashboard of nutrition-relevant indicators
A C T I O N P L A N O N N U T R I T I O N : F I F T H P R O G R E S S R E P O R T37

COUNTRY
CONTEXT CONTEXT
Delivery in health facility (%) HANCI Score Population Growth(millions)
Gender Inequality Index (Range 0 to 1)
Global multi-poverty index(Range 0 to 1)
2012 baseline
Most recent data Change since 2012 baseline
2012 baseline "Most recent data (2017)"
Change since 2012 baseline
2012 baseline
"Most recent data (2018)"
Change since 2012 baseline
2012 baseline
"Most recent data (2018)"
Change since 2012 baseline
Data of the closest year to the
2012 baseline
Most recent data
Change since 2012 baseline
Afghanistan 35.8 48.1 104 81 3.41 2.38 0.644 0.575 0.353 0.272
Angola 45.8 45.6 80 103 3.60 3.28 0.578 0.452 0.282
Bangladesh 31.0 37.4 189 158 1.15 1.05 0.569 0.536 0.253 0.198
Benin 86.9 83.9 147 136 2.80 2.73 0.626 0.613 0.307 0.368
Burkina Faso 66.3 82.2 198 175 3.00 2.87 0.609 0.612 0.519
Burundi 78.2 83.9 86 142 3.16 3.17 0.539 0.520 0.454 0.403
Cambodia 61.4 83.2 175 148 1.63 1.49 0.484 0.474 0.212 0.170
Cameroon 61.2 61.3 122 136 2.73 2.61 0.616 0.566 0.248 0.243
Chad 15.8 21.7 105 3.37 3.02 0.701 0.554 0.533
Côte d'Ivoire 57.4 69.8 132 150 2.44 2.55 0.667 0.657 0.310 0.236
D. R. of the Congo 74.9 79.9 76 128 3.34 3.23 0.674 0.655 0.392 0.389
Djibouti 86.7 1.68 1.56 0.170
Ethiopia 9.9 26.2 160 135 2.83 2.62 0.569 0.508 0.564 0.489
Gambia 55.7 62.6 201 199 3.03 2.95 0.657 0.620 0.324 0.286
Guatemala 63.1 65.0 240 245 2.13 1.95 0.517 0.492 0.127 0.134
Guinea-Bissau 41.4 44.0 74 78 2.65 2.49 0.462 0.372
Haiti 35.9 39.4 1.48 1.27 0.621 0.620 0.231 0.200
Honduras 82.7 1.87 1.67 0.513 0.479 0.159 0.090
Kenya 42.6 61.2 114 185 2.66 2.31 0.606 0.545 0.229 0.178
Lao People's D. R. 37.5 64.5 1.52 1.55 0.495 0.463 0.211 0.108
Madagascar 35.3 37.9 213 203 2.73 2.67 0.453
Malawi 73.2 91.0 222 213 2.86 2.64 0.615 0.615 0.334 0.243
Mali 55.5 66.8 177 174 2.95 3.01 0.674 0.676 0.457 0.457
Mauritania 64.5 69.3 101 144 2.95 2.78 0.647 0.620 0.285 0.261
Mozambique 54.8 186 121 2.75 2.91 0.590 0.569 0.411
Myanmar 36.2 37.1 89 115 0.83 0.61 0.507 0.459 0.154 0.176
Nepal 35.3 57.4 175 216 -0.19 1.65 0.516 0.476 0.217 0.148
Niger 29.8 58.8 162 163 3.90 3.82 0.679 0.647 0.590
Nigeria 45.1 39.4 135 103 2.68 2.59 0.240 0.291
Pakistan 41.0 66.2 147 187 2.13 2.06 0.563 0.547 0.228 0.198
Rwanda 68.9 90.7 179 185 2.46 2.64 0.435 0.412 0.350 0.259
Senegal 71.0 78.2 172 169 2.79 2.78 0.550 0.523 0.332 0.288
Sierra Leone 50.1 76.7 147 121 2.25 2.14 0.660 0.644 0.388 0.297
Somalia 9.4 2.70 2.83 0.514
Sri Lanka 98.2 99.5 0.13 1.05 0.400 0.380 0.021
Sudan 20.5 27.7 92 119 2.36 2.39 0.612 0.560 0.321 0.279
Timor-Leste 22.1 49.0 1.77 1.97 0.360 0.210
Uganda 57.4 73.4 173 149 3.18 3.72 0.552 0.531 0.367 0.269
U. R. of Tanzania 50.2 62.6 201 191 2.97 2.98 0.558 0.539 0.332 0.273
Yemen 23.5 29.8 97 81 2.76 2.36 0.826 0.834 0.283 0.241
Zambia 45.0 67.4 176 144 3.10 2.91 0.588 0.540 0.328 0.261
Zimbabwe 65.1 77.0 150 1.70 1.41 0.567 0.525 0.172 0.137
A C T I O N P L A N O N N U T R I T I O N : F I F T H P R O G R E S S R E P O R T38

COUNTRY
CONTEXT CONTEXT
Urbanisation (%) DPT3 coverage (%) Gini coefficient Access to Improved drinking water (%) Primary education (% women)
2012 baseline "Most recent data (2019)"
Change since 2012 baseline
2012 baseline "Most recent data (2018)"
Change since 2012 baseline
Data of the closest year to the 2012
baseline
Most recent data
Change since 2012 baseline
Data of the closest year to the 2012
baseline
Most recent data
Change since 2012 baseline
Data of the closest year to the 2012
baseline
Most recent data
Change since 2012 baseline
Afghanistan 24.16 25.75 67.0 66.0 65.3 2.0
Angola 61.27 66.18 52.0 59.0 42.7 48.7 52.3 2.8 6.0
Bangladesh 31.99 37.41 94.0 98.0 32.1 32.4 98.5 97.6 11.6 11.1
Benin 44.13 47.86 80.0 76.0 43.4 47.8 78.4 71.2 4.1 1.6
Burkina Faso 25.77 29.98 90.0 91.0 39.8 35.3 77.0 80.7 3.4 3.6
Burundi 11.19 13.37 96.0 90.0 33.4 38.6 79.2 82.9 13.9 13.5
Cambodia 21.04 23.81 90.0 92.0 32.5 65.2 8.1 8.0
Cameroon 52.77 56.97 85.0 79.0 42.8 46.6 70.8 14.4
Chad 22.14 23.28 40.0 41.0 43.3 35.8 55.3 1.8 4.9
Côte d'Ivoire 48.17 51.24 82.0 82.0 43.2 41.5 78.3 9.0
D. R. of the Congo 41.08 45.05 75.0 81.0 42.1 46.2 48.7 7.1 8.4
Djibouti 77.14 77.92 81.0 84.0 45.1 41.6
Ethiopia 18.16 21.23 62.0 72.0 33.2 35.0 53.7 64.8 4.0 3.2
Gambia 57.11 61.93 98.0 93.0 43.6 35.9 91.0 5.5
Guatemala 49.00 51.44 96.0 86.0 54.6 48.3 85.5 57.3 14.5 17.3
Guinea-Bissau 40.91 43.78 87.0 88.0 50.7
Haiti 49.48 56.19 66.0 64.0 41.1 64.8 74.0 4.6 8.8
Honduras 53.20 57.73 98.0 90.0 56.1 50.5 89.8 27.1
Kenya 24.38 27.51 94.0 92.0 48.5 40.8 63.5 75.1 26.9 33.6
Lao People's D. R. 31.26 35.65 79.0 68.0 36.4
Madagascar 33.23 37.86 70.0 75.0 42.6 37.2 43.8 10.0 12.9
Malawi 15.81 17.17 96.0 92.0 45.5 44.7 80.7 86.2 10.7 10.5
Mali 37.60 43.14 65.0 71.0 33.0 66.0 68.7 2.2 3.8
Mauritania 48.40 54.51 80.0 81.0 35.7 32.6 63.1 8.6
Mozambique 32.85 36.53 76.0 80.0 45.6 54.0 51.0 63.8 7.3 8.3
Myanmar 29.27 30.85 84.0 91.0 38.1 80.2 18.0
Nepal 17.46 20.15 90.0 91.0 32.8 91.6 94.6 5.5 5.5
Niger 16.21 16.52 71.0 79.0 31.5 34.3 67.0 1.6
Nigeria 45.25 51.16 42.0 57.0 43.0 53.6 63.0 12.1 10.1
Pakistan 35.41 36.91 64.0 75.0 30.9 33.5 93.4 94.6 10.0 11.1
Rwanda 16.94 17.31 98.0 97.0 47.2 43.7 73.8 78.5 13.9 17.9
Senegal 44.60 47.65 91.0 81.0 40.3 76.0 81.0 3.7 2.6
Sierra Leone 39.64 42.48 91.0 90.0 34.0 60.6 70.1 3.4 2.8
Somalia 41.56 45.55 42.0 42.0
Sri Lanka 18.20 18.59 99.0 99.0 39.2 39.8
Sudan 33.35 34.94 92.0 93.0 35.4
Timor-Leste 28.43 30.95 83.0 83.0 27.8 28.7 63.3 78.6 8.9 6.5
Uganda 20.42 24.36 83.0 93.0 41.0 42.8 70.3 78.3 11.3 12.8
U. R. of Tanzania 29.49 34.50 92.0 98.0 37.8 58.7 63.3 52.1 47.4
Yemen 32.96 37.27 67.0 65.0 34.7 36.7 58.8
Zambia 40.35 44.07 78.0 90.0 55.6 57.1 41.1 64.5 19.0 16.1
Zimbabwe 32.83 32.21 95.0 89.0 43.2 78.7 78.1 16.6 14.5
ANNEX 2:Country dashboard of nutrition-relevant indicators
A C T I O N P L A N O N N U T R I T I O N : F I F T H P R O G R E S S R E P O R T39

COUNTRY
CONTEXT CONTEXT
Urbanisation (%) DPT3 coverage (%) Gini coefficient Access to Improved drinking water (%) Primary education (% women)
2012 baseline "Most recent data (2019)"
Change since 2012 baseline
2012 baseline "Most recent data (2018)"
Change since 2012 baseline
Data of the closest year to the 2012
baseline
Most recent data
Change since 2012 baseline
Data of the closest year to the 2012
baseline
Most recent data
Change since 2012 baseline
Data of the closest year to the 2012
baseline
Most recent data
Change since 2012 baseline
Afghanistan 24.16 25.75 67.0 66.0 65.3 2.0
Angola 61.27 66.18 52.0 59.0 42.7 48.7 52.3 2.8 6.0
Bangladesh 31.99 37.41 94.0 98.0 32.1 32.4 98.5 97.6 11.6 11.1
Benin 44.13 47.86 80.0 76.0 43.4 47.8 78.4 71.2 4.1 1.6
Burkina Faso 25.77 29.98 90.0 91.0 39.8 35.3 77.0 80.7 3.4 3.6
Burundi 11.19 13.37 96.0 90.0 33.4 38.6 79.2 82.9 13.9 13.5
Cambodia 21.04 23.81 90.0 92.0 32.5 65.2 8.1 8.0
Cameroon 52.77 56.97 85.0 79.0 42.8 46.6 70.8 14.4
Chad 22.14 23.28 40.0 41.0 43.3 35.8 55.3 1.8 4.9
Côte d'Ivoire 48.17 51.24 82.0 82.0 43.2 41.5 78.3 9.0
D. R. of the Congo 41.08 45.05 75.0 81.0 42.1 46.2 48.7 7.1 8.4
Djibouti 77.14 77.92 81.0 84.0 45.1 41.6
Ethiopia 18.16 21.23 62.0 72.0 33.2 35.0 53.7 64.8 4.0 3.2
Gambia 57.11 61.93 98.0 93.0 43.6 35.9 91.0 5.5
Guatemala 49.00 51.44 96.0 86.0 54.6 48.3 85.5 57.3 14.5 17.3
Guinea-Bissau 40.91 43.78 87.0 88.0 50.7
Haiti 49.48 56.19 66.0 64.0 41.1 64.8 74.0 4.6 8.8
Honduras 53.20 57.73 98.0 90.0 56.1 50.5 89.8 27.1
Kenya 24.38 27.51 94.0 92.0 48.5 40.8 63.5 75.1 26.9 33.6
Lao People's D. R. 31.26 35.65 79.0 68.0 36.4
Madagascar 33.23 37.86 70.0 75.0 42.6 37.2 43.8 10.0 12.9
Malawi 15.81 17.17 96.0 92.0 45.5 44.7 80.7 86.2 10.7 10.5
Mali 37.60 43.14 65.0 71.0 33.0 66.0 68.7 2.2 3.8
Mauritania 48.40 54.51 80.0 81.0 35.7 32.6 63.1 8.6
Mozambique 32.85 36.53 76.0 80.0 45.6 54.0 51.0 63.8 7.3 8.3
Myanmar 29.27 30.85 84.0 91.0 38.1 80.2 18.0
Nepal 17.46 20.15 90.0 91.0 32.8 91.6 94.6 5.5 5.5
Niger 16.21 16.52 71.0 79.0 31.5 34.3 67.0 1.6
Nigeria 45.25 51.16 42.0 57.0 43.0 53.6 63.0 12.1 10.1
Pakistan 35.41 36.91 64.0 75.0 30.9 33.5 93.4 94.6 10.0 11.1
Rwanda 16.94 17.31 98.0 97.0 47.2 43.7 73.8 78.5 13.9 17.9
Senegal 44.60 47.65 91.0 81.0 40.3 76.0 81.0 3.7 2.6
Sierra Leone 39.64 42.48 91.0 90.0 34.0 60.6 70.1 3.4 2.8
Somalia 41.56 45.55 42.0 42.0
Sri Lanka 18.20 18.59 99.0 99.0 39.2 39.8
Sudan 33.35 34.94 92.0 93.0 35.4
Timor-Leste 28.43 30.95 83.0 83.0 27.8 28.7 63.3 78.6 8.9 6.5
Uganda 20.42 24.36 83.0 93.0 41.0 42.8 70.3 78.3 11.3 12.8
U. R. of Tanzania 29.49 34.50 92.0 98.0 37.8 58.7 63.3 52.1 47.4
Yemen 32.96 37.27 67.0 65.0 34.7 36.7 58.8
Zambia 40.35 44.07 78.0 90.0 55.6 57.1 41.1 64.5 19.0 16.1
Zimbabwe 32.83 32.21 95.0 89.0 43.2 78.7 78.1 16.6 14.5
A C T I O N P L A N O N N U T R I T I O N : F I F T H P R O G R E S S R E P O R T40

41
Dashboard legendFor the 18 outcome/impact/context indicators in the dashboard, two colour-coded analyses of progress are presented:
• Firstly, cell colours show how the latest data fits according to the thresholds established for the 2012 baselines for each indicator. These baseline thresholds divided the countries into three groups of equal size, so that for all indicators, 33% of countries fell into the ‘best’ green category; 33% were in the ‘middle’ amber category; and 33% in the ‘worst’ red category. The latest data was then compared to these baseline thresholds to assess progress (described as ‘shifts’ in the analysis below).
• Secondly, a circular traffic light is used to show whether the indicator has improved (green), worsened (red), or remains unchanged (amber), compared to its baseline value.
Thresholds were defined for each indicator for the baseline year, which divided the countries up into 3 groups of equal size. These same thresholds have been applied to the relevant indicator to assess the status of the most recent data:
Green: data falls within the top of the 2012 groups There has been an improvement since the baseline
Orange: data falls within the middle of the 2012 groups There has been no or limited improvement since the baseline
Red: data falls within the bottom of the 2012 groups There has been a deterioration since the baseline
In addition, the change in each indicator since the 2012 baseline is illustrated by a separate traffic light signal. The amber signal denotes no or limited change, calculated by subtracting the minimum value from the maximum value for each indicator, and then dividing by the number of countries. This provides a range around zero for each indicator.
Indicator Source Comments
DEVCO Nutrition Commitments 2014-2018
DEVCO Unit C1; Nutrition Advisory Service Resource Tracking Team
DEVCO figures, as reported to the OECD DAC up to December 2018
DEVCO Nutrition Disbursements 2014-2018
DEVCO Unit C1; Nutrition Advisory Service Resource Tracking Team
DEVCO figures, as reported to the OECD DAC up to December 2018
Number of women and children benefiting from DEVCO nutrition assistance
DEVCO Unit 05 (Results and Business Processes)
EU corporate result indicator for nutrition. It includes EU-funded interventions that either ended between July 2013 and June 2018 or were ongoing at time of project selection (June 2018)
Global Food Security Index
The Economist Intelligence Unit
The 2019 Global Food Security Index provides a worldwide perspective on which countries are most and least vulnerable to food insecurity and how resource risks increase vulnerability. The index considers affordability, availability and quality & safety. The scale is normalised from 1-100 where 100 = most favourable. denotes 0 ± 0.37
Exclusive breastfeeding of infants under 6 months
UNICEF: https://data.unicef.org/topic/nutrition/infant-and-young-child-feeding/
Baseline is the data available for 2012 or the closest year before 2012.The latest available data varies between countries, from 2013 to 2018.
denotes 0 ± 1.12%
Wasting prevalencechildren < 5 years
Joint malnutrition estimates (JME 2020)
denotes 0 ± 0.31%
Estimated stunting prevalencechildren < 5 years
DEVCO Unit C1 Nutrition Advisory Service, applying the ‘stunting reduction calculation tool’ developed with WHO (linear estimates)
denotes 0 ± 0.89%
41A C T I O N P L A N O N N U T R I T I O N : F I F T H P R O G R E S S R E P O R T
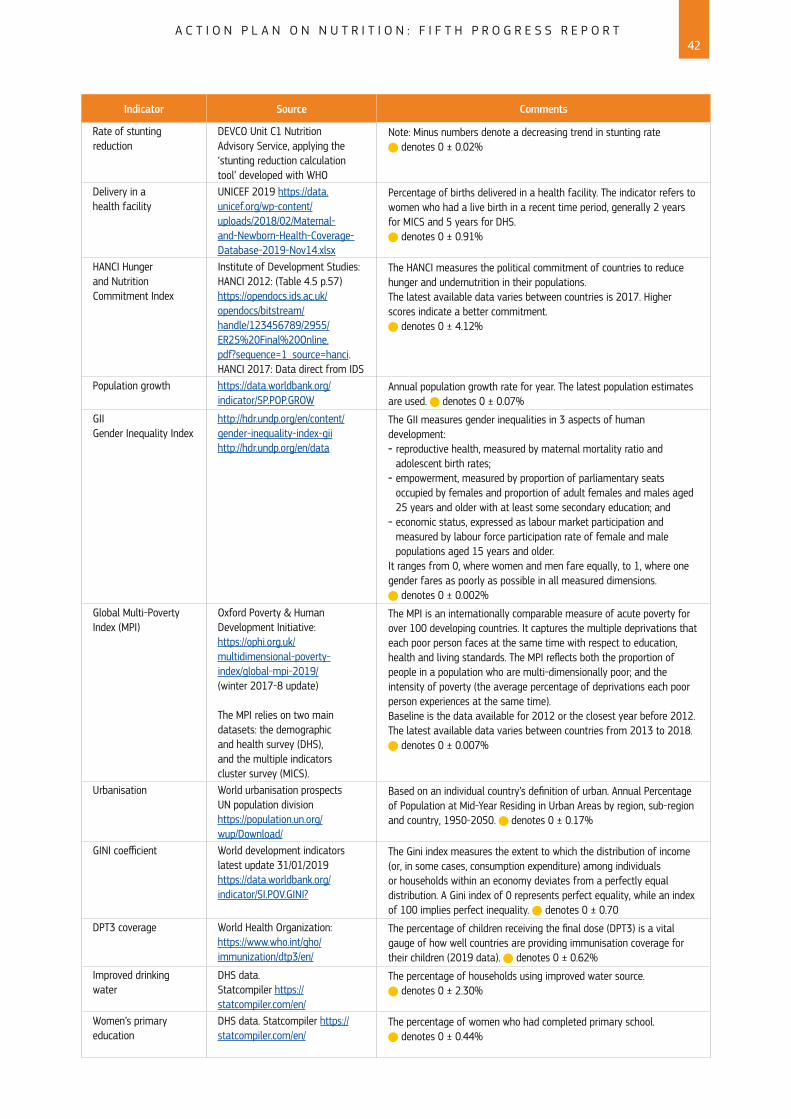
Indicator Source Comments
Rate of stunting reduction
DEVCO Unit C1 Nutrition Advisory Service, applying the ‘stunting reduction calculation tool’ developed with WHO
Note: Minus numbers denote a decreasing trend in stunting rate denotes 0 ± 0.02%
Delivery in a health facility
UNICEF 2019 https://data.unicef.org/wp-content/uploads/2018/02/Maternal-and-Newborn-Health-Coverage-Database-2019-Nov14.xlsx
Percentage of births delivered in a health facility. The indicator refers to women who had a live birth in a recent time period, generally 2 years for MICS and 5 years for DHS.
denotes 0 ± 0.91%
HANCI Hunger and Nutrition Commitment Index
Institute of Development Studies: HANCI 2012: (Table 4.5 p.57)https://opendocs.ids.ac.uk/opendocs/bitstream/handle/123456789/2955/ER25%20Final%20Online.pdf?sequence=1_source=hanci. HANCI 2017: Data direct from IDS
The HANCI measures the political commitment of countries to reduce hunger and undernutrition in their populations.The latest available data varies between countries is 2017. Higher scores indicate a better commitment.
denotes 0 ± 4.12%
Population growth https://data.worldbank.org/indicator/SP.POP.GROW
Annual population growth rate for year. The latest population estimates are used. denotes 0 ± 0.07%
GIIGender Inequality Index
http://hdr.undp.org/en/content/gender-inequality-index-giihttp://hdr.undp.org/en/data
The GII measures gender inequalities in 3 aspects of human development: - reproductive health, measured by maternal mortality ratio and adolescent birth rates;
- empowerment, measured by proportion of parliamentary seats occupied by females and proportion of adult females and males aged 25 years and older with at least some secondary education; and
- economic status, expressed as labour market participation and measured by labour force participation rate of female and male populations aged 15 years and older.
It ranges from 0, where women and men fare equally, to 1, where one gender fares as poorly as possible in all measured dimensions.
denotes 0 ± 0.002%
Global Multi-Poverty Index (MPI)
Oxford Poverty & Human Development Initiative: https://ophi.org.uk/multidimensional-poverty-index/global-mpi-2019/ (winter 2017-8 update)
The MPI relies on two main datasets: the demographic and health survey (DHS), and the multiple indicators cluster survey (MICS).
The MPI is an internationally comparable measure of acute poverty for over 100 developing countries. It captures the multiple deprivations that each poor person faces at the same time with respect to education, health and living standards. The MPI reflects both the proportion of people in a population who are multi-dimensionally poor; and the intensity of poverty (the average percentage of deprivations each poor person experiences at the same time).Baseline is the data available for 2012 or the closest year before 2012.The latest available data varies between countries from 2013 to 2018.
denotes 0 ± 0.007%
Urbanisation World urbanisation prospects UN population division https://population.un.org/wup/Download/
Based on an individual country’s definition of urban. Annual Percentage of Population at Mid-Year Residing in Urban Areas by region, sub-region and country, 1950-2050. denotes 0 ± 0.17%
GINI coefficient World development indicators latest update 31/01/2019https://data.worldbank.org/indicator/SI.POV.GINI?
The Gini index measures the extent to which the distribution of income (or, in some cases, consumption expenditure) among individuals or households within an economy deviates from a perfectly equal distribution. A Gini index of 0 represents perfect equality, while an index of 100 implies perfect inequality. denotes 0 ± 0.70
DPT3 coverage World Health Organization: https://www.who.int/gho/immunization/dtp3/en/
The percentage of children receiving the final dose (DPT3) is a vital gauge of how well countries are providing immunisation coverage for their children (2019 data). denotes 0 ± 0.62%
Improved drinking water
DHS data. Statcompiler https://statcompiler.com/en/
The percentage of households using improved water source. denotes 0 ± 2.30%
Women’s primary education
DHS data. Statcompiler https://statcompiler.com/en/
The percentage of women who had completed primary school. denotes 0 ± 0.44%
A C T I O N P L A N O N N U T R I T I O N : F I F T H P R O G R E S S R E P O R T42

MN
-01-20-494-EN-N
© European Union 2020
Published by Directorate-General International Cooperation and DevelopmentDirectorate Planet and Prosperity, September 2020
The contents of this publication do not necessarily represent the official position oropinion of the European Commission. Neither the European Commission nor any
person acting on behalf of the Commission is responsible for the use which mightbe made of information in this publication.
Directorate General International Cooperation and DevelopmentRue de la Loi 41 – B-1049 Brussels
E-mail: [email protected] further information:
http://ec.europa.eu/europeaid
DOI 10.2841/820