Field Studies in tite SociologY of Edoeation
366
Field Studies in tite SociologY of Edoeation THE REPORT ON MYSORE p“ ‘-. * ••'Cfc*: -SA97 3 7 0 - 0 3 VEN-F ^^mOSAh COUNCIt OF EDUCATIONAL RESEARCH AND TRAXFONG
-
Upload
khangminh22 -
Category
Documents
-
view
2 -
download
0
Transcript of Field Studies in tite SociologY of Edoeation

Field S tu d ies
in tite
S ocio logY of E d oeation
THE REPORT ON MYSORE
p“ ‘-. * ••'Cfc*:
-SA97 3 7 0 - 0 3
VEN-F^^m O SA h COUNCIt OF EDUCATIONAL RESEARCH AND TRAXFONG

THE REPORT ON MYSORE

Members of the Coordinating Committee
Convener: M . S. G ore
DirectorTata Institute of Social SciencesGhemburBombay
Members: I. P. DEsAlCentre for Regional Development Studies Surat
S. C . D ube
Dept, of Anthropology and Sociology University of Saugar Saugar (M.P.)
Sh ib K . M itra
National Council of Educational Research and Training 16, Ring Road, Indraprastha Estate New Delhi
V. E. M orey
National Council of Educational Research and Training 16, Ring Road, Indraprastha Estate New Delhi
S. N. M ukherjee
National Council of Educational Research and Training 16, Ring Road, Indraprastha Estate New Delhi
R. K. M ukherjee Indian Statistical Institute 203, Barrackpore Trunk Road Calcutta
L eslie P almier U n r isd
Palais Des Nations 1211 Geneva Switzerland
A . N. P a n d e y a
Indian Institute of TechnologyNew Delhi
M , Pr a sa d Dept, of Sociology University of Patna, Patna Bihar
The institutional affiliations mentioned against the names o f the members are the affiliations as reported at the time o f the seminar.

Sociology of Educatmi 5
Field Studies in the
Sociology of Education
THE REPOftt ON RtlfSORE
K . N . V e n k a t a r a y a ppa
NATIONAL COUNCIL O f EDUCATIONAL RlSSEAltCH AND TRAINING
NIEPA - DC

October 1975
Bhadra 1896
P.D, 2 T
^ National Council of Educational Research un4 Tminin$ 1975
System s U n it, Kaiior ? I s-; „ . rr[„cationaIFlanniii^ r f rn-W ^ .S r iA , -r .DOC, I'u. 'Due.........
Rs. 22.00 £ 2.00 $ 4.50
PUBLISHED a t THE PUBLICATION DEPARTMENT BV SECRETARY, NATIONAL COUNCIL OF BDUCATIONAL RESEARCH AND TRAINING, SRI AUROBINDO MARG, NEW DELHI, AND PRINXEP AT HOOGHLY PRINTING COMPANY LIMITED, 41 CHQWRINGHEE ROAD, CALCUTTA 700 016.

P R E F A C E
A chance meetimg with Mr. J. P. Naik, Secretary, National Commission on Education, in tihe summer o f 1964 led to a discussion o f the need to interest sociologists in the f ie ld o f education and o f the desirability o f convening a seminar to see what help sociologists could give in the deliberations o f the Commission.. The idea was a good one and it was tentatively agreed that i f sociologists responded to the idea a seminar entitled Sociology o f
Bducation in a Modernising Society should be convened under the auspices of the Tata Institute of Social Sciences. The seminar would be sportsored by the Education Commission who would also meet the travelling expenss« o f the participants.. The University Grants Commission would make a grant to meet otheir incidental expenses.
The idea of comvening a seminar was later discussed with friends and particularly with Pirofessor I. P. Desai. He insisted that if a seminar was to be convened at all it should only be as a preliminary to some concrete project of work thsat tfw seminarians would subsequently take up. This was welcome insistence and much after the heart of the Convener himself and in consonance with the policy of the Education Commission.
So, the Seminar was called and met between 11th and 13th December, 1964. Distinguishetd sociologists from twelve different universities responded to the invitatians. Three of the members of the Education Commission also participated in the discussions. No formal papers Imd been invited but the thenne of the seminar was systematically divided into different sessions and individual scholars were assigned responsibilities for initiating discussions on diflferent facets of the theme The deliberations of the seminar were directesd toward developing concrete proposals for study which would stimulate sociological interest in the problems of education and feed some data to the many subgroups of the Education Commission. Two such proposal# emerged.
One of these was the preparation and publication of papers by sociologists on different aspects of the challenge education faced in a modernising society. These papers have already been published under the title PAPERS IN THE SOCIOLOGY OF EDUCATION IN INDIA. Fourteen scholars have contributed to this volume published by the National Council of Educational Research and Training in July 1967.
The other propo*sal was for undertaking an extensive field study of the social background, the social values, the occupational aspirations and satiilfactions of the major participants in the system education. The

details of the project were left to be finalised by a Coordinating Committee, elected for the purpose, and the Committee was also entrusted with the work of inviting and editing the papers referred to above. The Convener of the Seminar was also asked to work as the Convener of the Co-ordinating Committee.
One of the first tasks of the Coordinating Committee was to piepare project outlines and find funds for the two projects. Simultaneously the Committee had to decide upon the scholars who would be invited to write for the Volume of collected papers and to find others who would be willing to undertake responsibility for directing field work for the survey in each of their regions. This work was completed by the Committee in its first two meetings. The different scholars who were approached for co-operation acceded to the request without any hesitation or delay.
The names of the members of the Coordinating Committee, the participants of three seminars, the contributors to the volume of Papers and the regional directors of field studies are given at the end of the Preface.
The work on neither of the two projects, however, could even have begun without assurance of funds. Here Mr. Chandrakant, Joint Director, National Council of Educational Research and Training came to the help of the Coordinating Committee. He agreed to have the request for funds examined by the Council and later communicated the approval of the Council to support both the projects. The Coordinating Committee have every reason to feel grateful to the Council for this assistance.
Once the projects were initiated the Coordinating Committee and the Convener have had to ask for help and favours for many things at nearly every step. In the framing of the questionnaire and the designing of the sample Dr. Ramakrishna Mukherjee and his two colleagues from the Indian Statistical Institute—Messrs Suraj Bandopadhyay and K. Chattopadhyay— were of invaluable help. Dr. Mukherjee was. of course, a member of the Coordinating Committee,, but his two other colleagues had no such linkage with the project until much later when they both helped in the field work in West Bengal. They carefully scrutinized the questionnaires, made several useful suggestions and helped Dr. Mukherjee in working out the elaborate sampling design for this study. Another membr of the Coordinating Committee who gave special help at this stage was Mr. A. N. Pandeya, He gave a great deal of thought to the framing of questions relating to social values. He had planned originally to use a part of the Inkeles Inventory of questions for the questionnaire of this study. This could not be done because of the need to limit the length of the questionnaire. He spent considerable time—despite ill health—to finalise the twelve questions that now appear in the questionnaire.
Actually, six different questionnaires had to be prepared for the study and two of them had to be translated into seven different languages. The
yi

work of preparing draftf and. redrafts, of pretesting of questionnaires, of getting them translated and printed in all the languages—and in literally thousands of copies—and, finally, of despatdiing them to all the field centres could not have been done without the willing and often spontaneous help given by many friendis, students and staff at the Tata Institute of Social Sciences. It is difficult to record their names and certainly impossible to thank them adequately. Some idea of the amount of work involved can tte gained from the fact that the whole process of framing, finalising, printing and despatching six different questionnaires in several languages had to be completed in six weeks. A total of 38,500 copies had to be prepared. The work was distributed in five preMes; some of the questionnaires had to be cyclostyled at the Institute.
The tmmber of favours and obligatiom that the Regional Directors must have had to ask and accept are not even known to the Convenor. But it is not difficult to imagine what the work of contacting scores of institutions in as many different towns and cities must have meant for the Directors and their staff. AH the Directors worked in an entirely honorary capacity and had to carry this load with their normal academic responsibilities. Fortunately their respective university administrations agreed to accept the responsibility for handling fUnds and maintaining books so that the Directors were atleast spared that part of the organizational responsibility.
The eight Regional Directors have not only supervised fieldwork but have each written complete reports on the data relating to their State. The reports form independent volumes in this series as follows:
Volume I General Report
Vol. II Andhra —
Vol. Ill W. Bengal ~
Vol. IV Gujarat —
Vol. V Maharashtra —
Vol. VI Mysore —
Vol.Vn Orissa
Vol. VIII Punjab —
Voh IX Rajasthan —
Hon. Director
Dr. M. S. Gore
Dr. I. P. Desai
Mrs. Suma Chitnis
Dr. M. V. Moorthy
Dr. R. K. Mukherjee
Dr. B. V. Shah
Dr, Y. B. Damle
Dr. K. N. Venkatarayappa
Dr. R. Rath
Prin S. N. Ranade
Dr. S. K. Srivastava

As the data from all the eight States were being receivecj in the olffice of the Coordinating Committee arrangements had to be made ftor thie punching and tabulation of djta. If these o|ii©rations were to te enfcrussteid to a commercsial orginisation the budget which had been originally apprrovejd for the entire study would have been lound insufficient for the worli:;„ 'th e poasibilitiei of getting the work done at a concessional cost or entirely #®e of cost had therefore to be explored. Several organisations weire approached. At one time it looked as if the project would get hieldi wp indefinitely at this stage. Two organisations came to the rescuie—-tltie Indian Institute of Technology and the Data Processing Unit in Bioimbay of the Tata Iron and Steel Company. There is no way in which tlkese organisations can be adequately thanked. Each of them had to provide between thiee to m months of theit time to finish qw work;. The TISCO unit helped in the punching and verification of cards and ini the preparation of frequency tables. The I.I.T. helped in the programmiing; amd computation of data for obtaining cross-tabl^ for all the eight states. TJie scope and size of th,§ operation c%np^ judged by the fact that alt(og&thter data for 23,440 individual respondents to be preceded and a toital number of 4,864 frequency tables and 17,368 cross-tables had to be prupiared. Mr. Yashpal Sahni of the TISCO Data Processing Unit and pr. HI. K. Mahabala of the I.i.T. at JCanpur gave a great deal of their time ftor consultations and supervision of the processing work for which the Co-^ordi- nating Committee owes them a special debit of gratitude. Similarly Mir. B. V. Chitnis of the Tata Hydro-electric Company, Bombay spent almoast Iiis whole vacation helping to prepare a tentative computer programme s® t&at our requirements could be clearly indicated to the agency which woudd finally agree to process the data of the study.
Even after the tabulation work was over—and, in fact, even as the ttables were being received—a good deal of copying, abstracting and percentiaging had to be done. In this work many of the students of the Tata Insttitiute? off Social Sciences and even the younger members of the families of stalff hadl to give a helping hand. Mr, R. D. Naik who was then supervising mrost off this work had to use all his tact and resourcefulness to keep the work, nnoving at tne pace required by the oft-revised, and yet rather tight, time-scl^uile.
The Coordinating Committee is grateful to all the persons and ag^endes who have helped in the work of this project at various stages, and partioularly to the Directors who organised the data collection in their respective areas and finally prepared the State reports.
The Convener would like to record his special debt of obligations to three persons—Dr, I. P. Desai, Mrs. S. Chitnis and Mr. P. Ramacha;ndran who have been colleagues in this project. Dr. Desai has been afsso*ciated in the project from its very conception. He has shared in the tliinkintg and discussion at all stages and participated in the preparation of this, piroject.
Viii

Mras. Chitnis worked initially as the sole professional member of the Co- ordiinatin^ Unit staff, later she worlad in an honorary capacity. In both r<oIe»s fiter contribution has bwn substantial and her interest unflagging. She has also partidpated effectively in the preparation of thss report and appears as a oo-author. Mr. Ham^chandran’s help has been crucial at all points whejre the project needed methodologioal and statistical advice. He helped actively in the drawing of the sample, preparation of ihe questionnaire, in worlkiBig out card designs, tabutetion frames and the Itter statistical-aaaly- ticall Work of the project. He has written part of the chapter on the Study
Without the active involvement of these titree colleagues, the could never have bedn complied.
Mm ConvemT wtsaM tiki to Ws appr«ci&tion of ih© fttsis- tanae he has received from the Hogitrttmiid t B staff of the Tata Imtitiite of So<ial Sdences in the admiiiiitratioft of Ihe project. Thanks #rt i^o due to tlhe staff of the Centre for H«giott4l Devtlopment Studies for helling in typimg, stencilling and duplicating work.
M. S. GoRB Convener
Bomibay26th October 1967

Directors of the Field Studies in the States
1. Andhra
2. West Bengal
3 Gujarat
5. Mysore
6. Orissa
7. Punjab
8. Rajasthan
-H r . M, V. M oorthy Department of Sociology and Social Woric Andhra University Waltair, (Andhra Pradesh)
-D r . R . K . M uicheriee Indian Statistieal Institute Calcutta
-Dr. B. V. Shah Department of ^o<?iolog^Vailabh Vjdyi^thAm adt
4 M 0aM ttra — D r. Y . B. Bmsm Uidvefik^ of Deccan College Poona
-D r . K . N . V en k ataraya^ p a Department of Post-gradoate Studies and Research
in Sociology University of Mysore Maharaja’s College Mysore
-D r . R . R ath Department of Psychology Utkal University Bhubaneshwar (Orissa)
-Shrt S= N, R a n a d e Delhi School of Social Work Delhi University Delhi
- D r . s . K . Srivastava Department of Sociology Banaras Hindu University Varanasi
The instimtionaf affiliations mentioned against the names o f the Directors are the affiliations as reported at the time these studies were undertaken.

C O N T E N T S
M embers of th e C o o r d in a t in g C ommittee »
P r e f a c e ^
D irectdrs o f F ie ld S t u d ie s *
I In t r o d u c t io n 1
II St u d y D esign 19
in E d u c a tio n a l F acilities in M ysore 56
IV T he P rim ary Sta g e 77
V T he Sec o n d a r y St a g e 128
VI T he N o n -P ro fessional C ollege 187
VII T he P rofessional C ollege 254
A ppen d ic es
(i) Questionnaires 278
(ii) A N o te on Sample Design 346

CHAPTER I
INTRODUCTION
S e c t io n I—T h e S o c ia l C o n t e x t o f E d u c a t io n
1. BACKGROUND
Th e s e m i n a r on the Somology of Education in a Moderniiii^
Society which met in Bombay in 1964 had two major objectives—(i) to define the scope of the sociologist’s interest in the area of education, and (ii) to discuss the role of education in bringing about desired social change. The discussion of the first topic was expected to provide the direction along which a sociologist could usefully contribute to an understanding of the role of education in society and in bringing about social change.
The sociologist looks upon education as one of the many sub-systems of society. His interest lies in analysing the processes of interaction within the sub-system and the conditions of its stability on the one hand and ia examining the nature of the inter-dependence of this sub-system with the lar|er social system on the other. This latter inter^t of the sonologist was particularly relevant to the discussion of the substantive theme of the seminar, in what way is education influenced by or influences the value framework and the behavioural patterns of the members of a society in areas of life other than education ? How do political, familial, religious and social stratificatory institutions affect education and in what way are they dependent on education ? Obviously, if inculcating “appropriate” attitudes and values and imparting “appropriate” skills and knowledge is the central function of education in a society it could not but play an important role in ensuring stability as well as in ushering in change in a society. However, on the basis of available knowledge, it cannot be said what exactly this role is and how effectively education can be utilisied to achieve a specific change in society. It is not even clear what type of studies are needed to be undertaken to yield data which would answer questions at this level of generality.
2. THE GOALS OF CHANGE
A beginning can, however, be made by specifying the nature of the social change that is being sought. Once this is known a somewhat indirect line of inquiry can be adopted. We can ask—Where and in whal segments of oux society is this change being attained and to what degree ?

Do different levels of education reflect different levels of identification with the new values and behaviour patterns? Do differences in social backgrounds of students as well as teachers make any difference in the acceptance of these values? To what extent are teachers a^ re of the implications of ao»pting these new values and how far are they equipped or inclined to practise them? Are the different types of institutional sponsorships—governmental, municipal, voluntary, religious—differentially suited to the inculcation of these values?
What are the new values and social arrangements sought to be developed in India? In the multiplicity of political philosophies and platforms that prevail in the country it will be difficult to And an agreement on any programme of immediate objectives. Even socially different segments and strata of the population are likely to differ in their perspective and priorities. Howevca’, the Indian Constitution with its statements of Fundamental Rights, Directive Principles and the Preamble can be said to represent one broad consensus on the type of society which Indians wish to create. The other indication of agreed objectives comes from the general approval given to the idea of rapid industrialisation and economic development of the country. The criticism of the Five-year Plans that is often voiced does not relate to the goal of economic development, it relates rather to the method and the pace of development aimed at.
The goals placed before the people by the Constitution are those of a democratic society which recognizes the dignity and the basic rights of the individual and holds the promise of an order in which social, political and economic justice and equality will prevail. It is possible to trace these ideas mainly to the liberal philosophy of nineteenth century Britain which had influenced the educated sections of our society including the makers of our Constitution.
The younger of the political and social leaders probably received these ideas through Indian teachers, writers and reformers but their main source—at least so far as the modern period of Indian history is concerned—lay in the British liberal philosophy of the nineteenth century. The nuances of “social justice” and “social equality” are the ones added by the later twentieth century influence of socialist thought and by the post- World War II expansion of a network of social and welfare services in the countries of Western Europe and North America.
The other main contributory influence in thft formulation of India’s social goals as stated in the Five-year Plans has been the acceptance of ttie model of economic reconstruction based upon modern technology andt ipeciflcally, large-scale modern industry. The political and social values ind institutions within which modern economic development has takes place have been very different in various parts of the world. To divide

them into dichotomies such as capitalist and socialist or democratic and totalitarian is to over-simplify the issues. In India the phrase democratic socialism has gained currency, but political leaders have been shy of clearly defining the content of this value framework. So far as the Constitution is concerned the clearly discernible impact of this diverse philosophies seems to have been the insistence on the goals of equality—social, political and economic, and of justice—again social, political and ^onomic. In this categorical emphasis on social and economic equality and on social and economic justice the Indian Constitution goes a little beyond what was implied in the broadly liberal goal of political equality.
Whatever the poUtico^conomic franvewoik within which industrialization is achieved it seems always to lead to certain social and psychological consequences in all societies which are described by the use of the term modernization. It is argued that these social and psychological characteristics associated with industrialization are not only its consequences^ but also its functional pre-requisites. Economists, sociologists and educators in India have not fully spelt out these social and psychological correlates of industrialization.
However, since education is supposed to equip the younger generation with ideas, skills and attitudes which would enable them to help in achieving an industrial, liberal society it may be useful for us to see what the fuller socio-psychological implications of this largely political and economic goal may be,
3. INFLUENCE OF LIBERAL VALUES
The discussion in this sub-section will be limited to three major attributes of the liberal philosophy—v/z., (a) Parliamentary Democracy, (b) Rationality and (c) Equality.(a) The Goal o f a Parliamentary Democracy: Liberalism emerged In nineteenth century Britain as the philosophy of the new middle class which was seeking social and political equality with the nobility of birth. The concepts of the dignity and equality of men, of adult franchise, of extension of education to a wider section of the population were largely limited, Initially, to the nuddle classes and were extended gradually only to the urban and rural working classes.
Politically this philosophy found expression in the strong support of democratic values, of a system of government based upon the consent of the people as expressed through free elections. The right to vote was, therefore, an important aspect of the liberal programme.
A democratic society, however, does not depend only on the smooth functioning of an elective machinery, though this is one of its vital tests.

It dq)ends really on the active and informed participation of its members in the discussion of all important issues, on the existence of agencies for systematic education of public opinion and on the opportunity it provides for orderly dissent.
The question before the educator is whether our system of education has helped in the inculcation of democratic values, created this interest in social issues and developed the confidence to debate them.
A relatively small number of Indians who passed through the colleges and imiversities in India in the late nineteenth and early twentieth century fed their minds avidly on this liberal political philosophy. The ideal of a parliamentary democracy was firmly etched on their minds and d]«y succe^ed in establishing a political structure which has so far generally conformed to the best traditions of an elective democracy.
The generation of Indimi leaders who framed the Constitution were bom in the last decade of the nineteenth century and completed their education in the first and second decade of the twentieth century. With some exceptions they are no longer at the helm of authority or in positions of leadership. Those now in positions of leadership were educated in the third decade when the nationalist movement was strong and liberal political thought still held sway. The situation changed in the ’forties and particularly at the end of the Second World War when the philosophy of the ‘working class* as different from the philosophy of the ‘middle class* gained strength. It found expression in the concept of ‘social justice* in the well-established western democracies. Indian leaders were influenced by it, but their basic faith lay in a political structure based on civil liberties.
Recent events within, as well as outside, educational institutions have raised some doubts whether education still continues to inculcate and strength the faith in democracy and in the rule of law generally. It is, of course, true that educational agencies cannot by themselves inculcate or reinforce democratic values, but they must serve as one major channel through which democratic values and practices reach young minds. Does our system of education succeed in this task?
Since the entire political framework as defined in the constitution is based on democratic values it becomes necessary for the educational policy maker to seek to find an answer to this question.(b) Rationalism—Secularism : Another of the important facets of liberalism, and one which has great relevance for India to-day, is rationalism. Rationalism has different social, philosophical and theological connotations, but essentially it refers to the practice of accepting reason as the basis for action and judgement. What is considered “reasonable” may tary from time to time and culture to culture. In the modern world the

'reasonableness*’ of action is sought to be establisl^ largely by whether it is based on available, scientific knowledge. In social life acceptance of rationality means rejection of prejudice against individuals or groups and of superstition of all kinds. Rationalism in this sense is somewhat diffisr- ent from a belief in science and a willingness to use and benefit by scientific technology. Religious bigotry, racial or caste prejudice and regional pride are inconsistent with a rational attitude of mind. The need for rationality in social life in this sense can hardly be overemphasized. Any hope of achieving integration among the people of many religions, castes and languages of India can only be based upon the acceptance of rational social norms by its people.
It is possible to argue that even during the most active period of soetal reform in the country—at the end of the nineteenth century—rationality as a norm was accepted only by a handful of people. This part of liberal message had not found the same ready r^ponse as the messaid of democratic political institutions among the high-caste, white>coUared gentry that had benefltted by the new education. They lived largely by two different sets of norms—one that governed their pubUc and occupational life and the other that governed domestic and social life. The norm of rationality was applied with greater readiness and ease in the former area, it was not considered relevant or applicable in the latter.
It may be argued too that the inspiration for social reform eame initially from somewhat sentimental or humanistic considerations rather than rational cK>nsiderations. Later, with the growth of the nationalist movement the programmes for removal of caste disabilities and removal of untouchability also appeared as political necessities for forging a strong, united front against the foreign ruler.
While this is true and while no one can seriously argue that rationalism had found deep roots in the Indian educated elite of the nineteenth and early twentieth century, it is equally true that the roots of such rational-secular norms as we find in our national life to-day are to be found in the emphasis placed upon rationalism by the liberal philosophy of the nineteenth century. The question is whether our system of education to-day continues to nurture and strengthen ^ e rational approach to life among students who pass through our schools and colleges. If it does not then secularism will mean at best a tolerance of other people and their ways of living. It will lead to an ability for mutual sufferance based on intellectual lethargy not to mutual appreciation and interaction between groups.
At an earlier period of Indian history religion and caste seemed to have provided a social structure in which diverse ethnic elements could live side by side in mutual economic dependence. But the partial synthe

sis which was offered earlier by the caste system in which groups with differ^t mode of living could live side by side in mutual dependence will not be of much avail to*day because essentially that synthesis was based on the premise of inequality and hereditary status distbictions. The need for a secular outlook in public life has again and again been empha- daed by public men and finds an expression in the non-theocratic charac> ter of die Indian State ; but the sustaining relationship between rationalism in individual life and secularism m public life is not always perceived or emphasized.
Another facet of the rationalist approach to lifb is the total rejection of the efficacy of magic and ritual. The rationalist believes in liis own efforte and in the operation of forces that are amenable to intell^tual analysis. He does not believe in fate and destiny and looks upon human adtion as the cause for much that he sees around him. Within the limits of his own abilities and the limitations imposed by the social situation he believes in the Importance of his own efforts to achieve his goals. He is in this an activist and also an optimist.
The rejection of the fatalist attitudes and the development of an acdvist philosophy have been linked up in the West with the growth of I^otestanism and this philosophy has been strengthened by the expanding opportunity for the common man and the extension of man’s domain over the forces of nature. To-day it has become a part of the ‘modem’ man’s personality and has been mainly responsible for the release of his creative energies.(c) Concept of Equality: The third aspect of the liberal philosophy wkch influenced the minds of students who were taught in the British spomored system of education in India was the idea of equality. To begin with this meant only equality before law. Even in England the concept of equality had not gained a very much broader significance in the nine* teentii century. The idea of equality in voting rights came later—Shaving been extended first to the new middle class and much later to the common man. Women earned the right to vote only in the twentieth century.
To-day the idea of equality has gained a much wider significance. Minimally it means equality of opportunity and in this concept of equal opportunity, the opportunity for education has a central place. Since the S ^ n d World W’ar the concept of equality has gained a new meaning by the development of the concept of ‘social justice’— which recognizes the right of the underprivileged to help and assistance. The Indian Constitution has taken special cognizance of this principle of ‘social justice* and has enjoined upon the government to provide special facilities to the backward classes whereby they can be helped to overcome their social, political and economic disabilities.

The discussion of the value framework of liberalism has identified three major areas which are central to liberal thought and which find an important place in the Constitution of India. The challenge before the educationist is to see that the structure of education as well as the content of ideas that it presents help in the development of a liberal personality. The relationship between education and this value framework and the role that education can play in the promotion of these values will be discussed in the next section.
4. THE PROCESS OF MODERNIZATION
The other major influence in the determination of educational obJec> tives is the national goal of rapid economic development. SuperficiAlty this may appear to be mainly a problem of increased ‘material inptits and outputs”. In actuality even economists do not accept this simple notion of economic development. There is minimally the additional requirement of technically qualified manpower, (and this is directly linked to opportunities for vocational education), but there is the equally important factor of the attitudes, values and social institutional arrangements which are conducive to economic development and are regarded as a part of the process of modernization.
Modernization is a complex social process which in the long run influences nearly all aspects of human life. In a way there is a continuity between the idea complex of liberalism and modernism—particularly in tlw emphasis on rationality and science. But democratic values are not neces- Mrily a part of the modernization process. There are modern nations which are totalitarian as there are others which are democratic. The central characteristic of the process of modernization is the growing linkage between the technology of modem economic life and the discoveries and inventions of science. This refers not only to the technology of manufacture but also to agriculture, oommer< , bureaucracy and the organization of service. Every aspect of economic life is affected by the technological developments and changes that take place.
Modem society demands a much greater degree of mobihty on the part of an individual. This, in its turn, calls for an increasing measure of freedom from the restraints of caste and kin. The individual becomes the unit of economic organization and socially the small, unitary family comes into greater prominence. Individuals are valued for what they achieve rather than for the status of their parental family. Opportunities for jobs and education are related to objective, universalistic criteria than the criteria of kin or caste membership.
The rapid changes in social and technological environment impose a

heavy strain on the individual. Hiey demand a much greater flexibility of temperament and occupational skills and a potential for re-education. The freedom from the restrictions of the family and the community is also accompanied by greater social isolation and a loss of the sense of security that comes from conformity to well-defined traditional norms, community approval and community support.
Education must equip the individual with a spirit of independence and a sense of adventure. It must also give a greater capacity for discrimination and judgement whereby he can make his own choice between conflicting norms and values of the pluralistic society in which he will be called upon to live. Even in the world of knowledge the emphasis in education iuis to be not merely on the mastery of extant knowledge but on the acqui- sitidn of a capacity to tl^nk, to assess facts and arrive at one’s own conclusions. All knowledge is being continually added to and much of what is known stiinds in danger of becoming obsolescent.
In the advanced countries of the world the fact of rapid change in knowledge and in social and technological environment has led to a revolution in the methods of teaching and in the concept of the teacher’s role. There is an emphasis on strengthening the autonomy of the student as a person and on developing his independence as a scholar.
5. LIBERAUSM AND MODERNIZATION IN INDIA
In the discussion so far liberalism and modernization have been treated as two separate sources of influence. They are not necessarily perceived as such in India. It must also be said that neither of these two sets of ideas has always exerted a direct influence on Indians. They are often seen as ideas of Mahatma Gandhi or Jawaharlal Nehru or one of the other Indian leaders and men of thought. Undoubtedly each of them added his own particular emphasis. Mahatma Gandhi’s spiritual and moral ideas few instance, cannot be traced to liberalism per se though they were consistent with it. He traced them to the Geeta, the Bible and the influence of Tolstoy, Thoreau and Ruskin. Nehru’s own thinking—particularly in the economic field— was influenced by socialism. His deep liberal sympathies, his commitment to democratic methods and his egalitarian ideas sought to find expression in democratic socialism. Mahatma Gandhi himself subscribed to the ideas of equality and equal opportunity but distrusted the godlessness and the spirit of violence associated with socialist movements in Europe. However, Gandhi and Nehru were unquestionably ‘liberal’ in their political thought and in their emphasis upon respect for the individual. Nehru, besides, was a rationalist and a major inspiration for the growth of modem science in India.

The reason for presenting liberalism and modernization as two separate sources of influence is to underline a fact which is often lost sight of in Indian thinking viz. that modernization does not necessarily occur only in the context of democratic, liberal values and if we cherish democratic goals they need to be cherished as such and cannot be taken for granted or assumed to be progressively achieved with increasing industrialization and modernization. This imposes on Indian leadership in all fields and at all levels the responsibility for choosing ideas carefully from either or both the sources. The educator, particularly, has to be conscious of this choice and beware of using generalised labels to identify his group of ideas.
Another reason for differentiating between the influences of libtral- ism and modernization is that while modernization—whether in the economic or the socio-psychological sense— has come to India fairly recently the liberalist influence reached here as early as the latter part of the nineteenth century. It, therefore, becomes pertinent to ask whether at least the more accepted of the liberal ideas have found roots in the educational system.
Sectio n II— E d u c a t io n as a n Instru m en t of Social C hang e
The educational system of a country is often expected to perform two simultaneous and somewhat contradictory social functions—that of ensuring continuity of tradition and of initiating change. This is the case with the system of education in India to-day. Since social life at any time has both elements of the new and the old and since no social change involves a complete break with the immediate past the expectation that education should help to ensure continuity and yet usher in change is not necessarily an unreasonable one. But when edu(^tion is sought to be used as an instrument of policy it is incumbent upon the policy maker to say which elements of the social, cultural life he wishes to have retained and which ones to be changed and substituted. This is not easy to do. Hie policy maker like everyone else is subject to his own ambivalances and as a man of the world he may find it exp^ient at a particular moment not to verbalise his intentions in clear terms for fear that he may raise dead ghosts. There is also no certainty that the policy maker will achieve his particular goals even if he perceived and stated them clearly. On the other hand he can have nothing approximating a policy unless he knows his goals and he cannot expect to persuade others to co-operate with him in their attainment—not at least in a democratic policy—except in so far as he states them clearly.
The previous section described at some length the social context within

which the Indian educational system functions. It also identified some of the goals and values that are cherished and sought to be attained in Indian social life. Does education have any role to play in facilitating the achievement of these goals? How best can it do so?
One way of approaching this question might be to see what implications the acceptan(» of these goals and values may have for the system of education in India. If we accept the goal of a rational, secular, demo- dratic society iKised upon modem technology then rationalism, secularism, and equality must find a place in the substantive content of ideas communicated in the process of education. Minimally these ideas must find exprts^n and support in text-books and other reading materials that is ^ e n to i^ldren at the primary and secondary stages of education. At lat^ stages these ideas may be examined more critically and even challenged. In a liberal approach to education there can be scope for dissent even on what are considered essential ideas. But, if any ideas are considered essential they must at least be discussed, they cannot be neglected or taken for granted.
However, the need for direct communication of certain values through the content of text-books and other reading materials is only the first— and not necessarily the most far-reaching—implication of the acceptance of a framework of values and goals. If the liberal-demo(^atic framework on the one hand and the scientific-technological framework on the other are to serve as two major sources of values in the larger social system then the educational system itself must reflect these values in practice and procedure. Some of these implications will be discussed in this section.
The acceptance of the goal of a scientifically-oriented society must express itself in the educational system in several ways. To begin with it must lead to a selective allocation of resources at all levels of education but particularly at the primary and secondary school levels. A superstructure of scientific and technological institutes at the college level cannot be supported except to the extent that it can be fed by pupils who have been taught in schools which are themselves scientifically and technologically oriented. Schools which are notoriously short of science teachers, laboratories and scientific equipment cannot provide this orientation. More science teachers and better qualified teachers at the school level are necessary if the objective of giving a scientific basis to education is to be attained. If schools cannot give this orientation the colleges, universities and institutes have to begin on this task and spend a good deal of time in giving students the grounding that they should have acquired in secondary school.
The strengthening of the science stream at the school level is, therefore, important for the development of science and technology in the

country. However, this is by itself not adequate. Rapid technological development requires not only scientific knowledge, but a scientific outlook pervading different aspects of life. Scientific knowledge and a scientific outlook are not the same, though one would normally expect that the acquisition of scientific knowledge would promote a scientific outlook.
A scientific outlook is a characteristic of the inquiring mind which is free from bias and is willing to learn from systematic observation. In a technologically advanced society such an outlook must characterize not only the scientist but a large section of the general population. It must became the dominating ethos of society. This is likely to happen not so much by increasing the number of science courses, but by tea d i^ science as well as other sul^ects with an emphasis on facts, on objectivity, on systematic observation and on the development of a capacity for independent judgement.
This requires a teacher who has a different perception of his role than as a conveyor of available knowledge to the younger generation. Such a teacher will not cx)noentrate only on the student’s ability to learn and memorise specific facts, though this is important, but give attention to developing in him proper habits of thought. He will encourage doubt and discussion on the part of the student. He will help him to gain a mastery of concepts basic to his subject. Knowledge is fast being added to and new knowledge sometimes makes earlier knowledge obsolete. The student who has developed a scientific approach and has mastered the tools of his science can make the adjustments called for by the shifting and advancing frontiers of knowledge.
The raipid growth of knowledge affects the teacher’s own con<^t of himself. He is no longer an all-knowing person inspite of all the degrees he may have accumulated. He must continue to be actively in touch with and, if possible, involved in the process of developing new knowledge in his field. This is particularly true to the college teacher but applies also to a school teacher and this need for keeping abreast of newer developments arises in the case of teachers of subjects other than science as well.
The distinction between scientific knowledge and a scientific outlook IS important from another point of view. Scientific knowledge, particularly in the physical sciences, can exist side by side with a good deal of rituAl and superstition in other aspects of life not only in society generally but even within the same individual. This, by definition, cannot happen where the individual has developed a scientific outlook-—i.e., has seen the relevance of the scientific approach and method to other non-laboratory as- p^^ of life as well. If education is to promote a secular, non-sectarian attitude to life it must attempt consciously to inculcate a scientific outlook among the students. This result is not likely to be attained only by a

Spread of the knowledge of physical sdenoes.The relationship between secularism and rationalism has been briefly
touched upon in the preceding section. The secular point of view receives support both from the value attached to sdence and the value attached to rational conduct in social life. In a somewhat limited sense—signifying non-discrimination on grounds of religion—secularism is also a matter of wise policy for the State to follow in a complex and multi-ethnic society that India is. This is a value that must find support and expression in the country’s system of education.
If secularism is acc^ted as a sodal value it oaonot be easily ie o o fi(^ with the continued organization of educational In ititutions on reli|l6lis and sectarian lines. And, least of all, can it be reconciled with allocation of educational opportunity based on such grounds? In individual institutions secularism would express itself in the attitudes of students and teachers to members of other religious and social groups. While the school is only one of the many places in society where individuals of differ&at religious persuasion are brought together it is among the most important of such places since the experiences gained in schools are likely to last long in the minds of the young scholars. If these experiences validate the verbal claims to secularism the student’s own attitude is likely to be strengthened in that direction. If the experiences negate these claims he will cynically r e ^ d secularism as one of the areas where public utterances and private attitudes need not necessarily concur.
Apart from a scientific outlook and secularism, a faith in democracy is among the other values sought to be achieved in Indian social life. Democracy as a way of life has many implications for the educational system. While the process of education is basically predicated on the assumption that the student knows less than the teacher and there is thus a certain lack of equality in their respective statuses. There is a great deal that (an be done to organize education in a manner that is conducive to the learning of democratic attitudes and procedures in the school environment.
It was mentioned above that the rapid growth of knowledge makes the teacher less dogmatic and more aware of the limitations of his own knowledge as an individual. This attitude of mind on the part of the teacher is conducive to the creation of an atmosphere in the class-room wherein students can leam by discussion and exploration. A process of education which allows discussion and participation by the student lays the foundation for the development of an open-minded approach to all issues and also for the development of a certain measure of self-confidence among students in their ability to judge issues and arrive at reasonable solutions. An open-minded approach and an ability to judge issues for oneself are important attributes of a democratic personality.

Outside the class>room organization recreational and extra>mural opportunities provide even greater scope for inculcating democratic values in students. The practice of working through committees, the willingness to express freely one’s views and to allow the same freedom to others, and the procedure of arriving at decisions by a majority which once taken become binding on all are aspects of democratic functioning which students can learn and master through participation in student government.
At the level of institutional organization acceptance of democratic values has a direct implication for teacher-administrator relationships. While no administration can be organized unless the members of an institution abide by basic rules of discipline, the democratic administrator will seek to make these rules representative of the common will of the body of teachers. So far as over-all institutional policies relating to personnel are concerned they are often outside the scope of discussion and decision making at the level of teachers ; but in academic matters and in matters of student development generally the teaching staff can be effectively involved in policy making and implementation.
Another of the values which forms part of the liberal-democratic complex spelt out in the Indian Constitution is the value of ensuring equality of opportunity to individuals from all strata of society. In modern societies the opportunity for education is among the most important of all opportunities for betterment in life and most nations to-day attempt to provide free education to deserving students upto the highest levels. In India improvement of opportunity is sought to ensured at least in the case of the specially disadvantaged social groups such as the scheduled castes and scheduled tribes. Special efforts in promoting education among women have also been undertaken. The acceptance of the concept of ‘social justice’ has given a deeper meaning to the concept of equality and equal opportunity. In recent years some doubt has been expressed about education being really crucial in the promotion of equality. But it is generally recognized that while educational opportunity is not all that matters in ensuring equality it is certainly a minimal condition for ensuring any type of equality in opportunities. To the extent that equal opportunity in education exists in a society the composition of the student body should tend to reflect it by the proportion of representation that different groups have in it.
This section has sought to spell out the implications of accepting a liberal-modern framework of social values for the system of education. To the extent these implications are realized education can be used consciously as a tool for the inculcation, promotion and stabilization of these values in society.
The study of student and teacher backgrounds and their attitudes

which is reported upon here seeks to find out the extent to which the larger value framework accepted in our Constitution has penetrated the ^ucational system. The extent to which such penetration could be said to have taken place could also simultaneously serve as a measure of the usefulness of the educational system in bringing about the desired social change.
S e c t io n III—S co p e o f T h e S tu d y
1. SOCUh VALVES A m SOCIAL BACKQROVm AS TWO FOCI OF INTEREST
The field study based on the discussions of the seminar selected two major points of interest—viz., the social values and the social background of the major participants in the system of education. The study does not try to find out how modernization and equality can be attained through education, but whether education has succeeded in developing a *modern* outlook and in providing an equality of opportunities. It was felt that a field study of the survey type could not possibly succeed in discovering ways by which education could help to achieve these goals. On the other hand since the Constitution had explicitly stated some of the liberal values and emphasized the goal of equal opportunity It was Important to assess how widely these Ideas had been accepted by those who participated in the system of education and how far equality of opportunity had in fact been attained. In such a study if major differences In the attainment of these values and goals were Identified and if these differences could be seen to be related to certain tangible factors such as institutional sponsorship, institutional management, the teacher’s own Identification with these values, the variation In rural-urban location of institutions, the degree of economic modernization achieved In a community, the length of the educational tradition in that community, etc., such relationships could indicate ways of devising changes In the educational system which would more effectively help to achieve the goals of ‘modernization’ In outlook and equality in educational opportunity.
The over-all strategy of the study is to describe the social backgroimd and the social values of the participants in the system of education, iden* tify variations and seek, wherever possible, to relate these variations to various other differences characterizing the population.
2. STUDY OF SOCIAL VALUES
The list of characteristics, values and attitudes which have beoi identi*

fled in sociological lito-ature as making up the liberal-modern complex is a long one. Even in the brief treatment of the subject, in the earlier part of the chapter, a number of traits have been mentioned—(i) respect for the individual, (ii) equality, (iii) rationality, (iv) secularism, (v) commit* ment to science, (vi) democracy, (vii) activism, (viii) achievement orientation, (ix) flexibility, (x) individualism, etc. etc.
For the present study of social values only certain elements of the modern-liberal complex were chosen. They have been studied exclusively through the use of verbal attitudes and opinions of individuals. They have been referred to somewhat loosely as being characteristics of ‘moderniza- tioiv’ thoitgh they may have been incorporated into the Indian tradition either as a result of the impact of earlier liberal thought or the more recent process of modernization associated with the technological revolution in the West.
The value elements chosen were the following :i) Secularismii) Activist approach to lifeiii) OptimismIv) Achievement Orientationv) Acceptance of citizenship responsibilityMany more elements could have been incorporated, and were in fkct
iuggested at the outset, but had to be eliminated for reasons for economy and feasibility.
As it is the questionnaire contains twelve questions on social attitudes and values and the nimiber would haw had to be larger if more elements of the modern-liberal complex were to be incorporated. As mentioned in the Preference an effect was made to adapt a whole section of the question* aaire which had been developed by Prof. Alex Inkeles for his international study of the spread of modern values. But this effort had to be abandoned.
3. STUDY OF EQUALITY IN EDUCATIONAL OPPORTUNITY
The study of equality of opportunity in education has been made primarily through a study of the social background of the teachers and students. What are the groups from which they are primarily drawn ? Do they tend to be drawn more from one group than another ? Which are the groups that tend to be over-represented or under-represented 1 Are there any differences hi their distribution from one section of the Mmple to another?
The major social background characteristics selected for the study were—father’s education, occupation, caste, religion and rural-urban resi

dence. Information on family income was not asked because of the general unreliability of such data except where they are collected through checks and counter-checks.
The analysis seeks to find out whether student samples from different states or different community clusters vary significantly in their composition. Do different caste or religious groups have differential access to education? Do children from middle-class, white-collared homes enrol in larger proportions than children from other occupational groups?
One major drawback of the present study which limits the value of its findings— particularly in the area of social background analysis—is the fact that though the sample is in a sense a widely dispersed sample it is not in a strict sense a random sample. The implications of this limitation are dealt with in greater detail in the next chapter.
The handling of a multiplicity of questions bearing on the same area — as in the case of the study of social values— also posed another serious problem. The questions included did not make up a systematically tested scale. How were the responses to be combined to yield a single value? This problem is also discussed at length in the next chapter.
4. ARTICULATION OF ^HYPOTHESES ^
Because of the exploratory nature of the study there were no clear hypotheses that were formulated, but there were certain expectations. For example, it was expected that since educational institutions had been established earlier in some parts of the country than in others there would be regional difierences in the impact of education as reflected in social attitudes. If education was one of the major channels for the spread of modern ideas then regions which had a longer tradition of education and had more widespread educational facilities would be characterized by a greater percentage of individuals displaying the modern attitudes than other regions with less educational facilities.
Similarly, since educational facilities have been more intensively pro- fided and for a longer time in the urban areas we would expect to find urban respondents displaying modem attitudes in larger percentages than rural respondents.
Also, persons from educated homes would be more likely to show modern attitudes than persons from homes with no education.
Men, since they have had greater opportunities for education, would have a greater percentage of the ‘modern’ individuals than women.
Finally, more educated persons would be more likely to give the modem responses than persons with less education.
These are certainly not precise hypotheses that can be ‘tested’ and

they are not intended to be such. This broad statement of one set of expectations does not take into account the influence of factors other than education and any rigorous statement of hypotheses would have to provide for isolation of groups representing the play of only one independent variable at a time.
A similar set of statements about the social background of students and teachers can also be made. We would expect for instance, students to be drawn more from the white-collar occupational groups than from other occupational groups, more from educated homes than homes with no educational tradition, more from urban groups than rural groups, more from the upper castes than from the backward castes. If t h ^ statements are substantiated and to the extent they are substantiated, they would suggest that educational opportunities are either differentially available or are differentially used by the different social groups.
5. ADDITIONAL AREAS OF STUDY :
Apart from describing the social composition of student and teacher populations and identifying their attitudes the study also provides for a comparison of attitudes between respondents. Such comparisons provide the basis for examining the kind of statements listed above. But the comparison has also another value—especially in the instance of a comparison of attitudes and backgrounds between students and teachers in the same sample group. The extent of convergence or divergence in the attitudes and backgrounds of these two groups would have implications for their mutual relationships and for the process of education.
While the study mainly focusses on the social background and the social attitudes of "the participants in education, it also presents other data of interest to educational planners and sociologists. Three of these additional areas are the following :
i) the attitudes of students and teachers in the areas of education,ii) the occupational aspirations of students, andiii) the occupational satisfactions and adjustment of the teacher.
The attitudes of students and teachers in the areas of education add to the value of the inter-respondent comparison of these two groups. A knowledge of the attitudes of students and teachers to education and their expectations from it can be expected to help our understanding of the phenomenon of strikes and demonstrations in our educational institutions.
Information on whether teachers are generally satisfied in their occupation or whether they would like to change to some other occupation and other information on the teacher’s participation in professional activities can serve as indices of the teacher’s commitment to this profession.

A high or a low level of commitment among teachers could have an influence on student’s morale as well.
The data on the occupational aspirations of students as related to their parental occupational backgrounds can give an idea of the direction of mobility and inter-change between occupations. It will also indirectly tell us about which occupations rank high in the esteem of students and which occupations rank low.
Simultaneously with the data on students and teachers a part of the study was also devoted to collecting data about parents, their attitudes to education and their social values. The intention was to obtain the community’s point of view on education so that it would serve as a coQlexl for examining the views of those who are directly involved in the educational system.
This chapter has explained the conceptual interest, the broad scope and the particular strategy of this study. The problems of determining the universe of study, of choosing the sample, organizing field work and planning for the tabulation and analysis of data have been left undiscussed. These subjects will now be taken up in the next chapter.

CHAPTER II
STUDY DESIGN
S ec tio n I — In t r o d u c t io n
'T 'H E PREVIOUS chapter has outlined the broad interests as alsothe specific questions that were upper-most in the minds of the
collaborators in this study. At the stage of designing the field study two alternatives were open. The answers to the questions raised in the course of seminar discussions could have been sought through one or more relatively limited studies undertaken in one State, or in one type of educational institution, or relating to one type of respondent group. Obviously, the system of education is so complex even in terms of its levels of organization and types of institutions that a study of a representative sample of teachers, students, administrators and parents hivolved in all varied types of institutions at all the different academic stages was well- nigh impossible. Neither time nor the financial resources that were likely to be available could have permitted such an undertaking. Even so, a comprehensive and wide-spread study of a survey type—extensive, but not necessarily representative—was still possible. Such a study would not allow the testing of precise hypothetical formulations and would in all probability suffer because of a certain flabiness of size, unequal nature of the data collected and the consequendy untidy tabulations that would result from it. Despite these fears the collaborators decided to opt for this type of study. There were several reasons for this—some of them were verbalised, some n o t; some of them were methodologically relevant, some purely circumstantial.
First, there was the fact that the group of scholars had been brought together under the auspices of the Education Commission. A project which would yield dnything useful to a national commission, it was felt, had to be broad-based in subject interest and wide in area coverage.
No previous studies had been undertaken which provided data regarding socio-psychological variables of participants in the educational system on a national scale. Local studies undertaken by individual scholars dealing primarily with the social background of students and socioeconomic conditions of teachers had t^en reported upon. There were also national statistics about the total number of students, teachers and their distribution by states, types of institutions and subjects—^published by the Ministry of Education. But no extensive studies covering the

attitudes, opinions, values and aspirations of the participants in the educational system had been undertaken. Such data, it was felt, would add new insights to the process of planning and policy making in the field of education.
It was also expected that once some base-line data on the socio- psychological aspects became available on a national scale it would widen the scope for more meaningful studies with local samples. Such a study would provide the background and the necessary impetus for the growth of the sub-discipline of educational sociology in India. At the end of the study there would be at least a dozen scholars who would have gained valuable experience and increased their commitment to this subject.
Also from the point of view of retaining the interest and involvement of a maximum number of the members of the seminar group this choice seemed a good strategy. A large project farmed out in different states would keep many scholars engaged and interested in the work and the co-ordinating group would have to make fewer negative decisions.
A decision was, therefore, taken in favour of a research design which, depending on the availability of resources, would enable the co-ordinating committee to undertake simultaneous studies in several states. The larger the number of states covered the greater the usefulness of the data for gaining a national perspective.
S e c t io n II — T h e O rganization o f W ork
The organization of a field study spanning eight states and involving interviews conducted in nine different languages presented many problems. The pattern of organization as well as the problems encountered at various points are likely to be of interest to the methodologist in social research and this section describes the organization of the study. The responsibility for the project was shared between the Co-ordinating Committee, the Field Centres in the eight states and the Co-ordinating Unit.
1. DIVISION OF RESPONSIBILITY :
(a) Co-ordinating Committee : As stated in the Preface, the Seminar inthe Sociology of Education which met at the Tata Institute of Social Sciences in December 1964 appointed a Co-ordinating Committee to draw up a research scheme and to work out the details of the Thematic papers that were planned to be published.
The Committee met twice between December 1964 and March 1965. After the preliminary meeting in December the Committee formulated a research scheme and submitted it to the NCERT for approval.

(b) Co-ordinating Unit: The Co-ordinating Unit for the project consisted of the Convener of the Co-ordinating Committee assisted by a Research Officer and a clerk-cum-typist. Later, during the processing of the data the Co-ordinating Unit had the additional help of a research assistant. This Unit was to prepare the research tools, draw the sample, receive the completed schedules from each centre, get the data tabulated, dispatch the tables to the centres and finally prepare an all India report based upon the reports of individual centres. The Unit was to keep in touch regularly with the several centres at which the study was to be undertaken, give detailed instructions regarding the field work, answer their queries, and generally co-ordmate the activities of the different centres. The co-ordinating office was responsible for disbursing the grant to each of the eight field centres and for obtaining from them certified accounts as required by the grant giving agency. It was responsible to the NCERT for all the funds allocated.
It has been mentioned earlier that the field study was only one part of the research projects in the Sociology of Education. The other parts of this project consisted in the publication of a set of fourteen thematic papers on various themes on the subject.* These papers in fact were to provide the theoretical framework for the interpretation of the data collected in the course of the field work. The Co-ordinating Unit was also responsible for all the co-ordinating and editing work in connection with the publication of the papers. This consisted of preparing broad outlines for each paper, going through the drafts with a view to avoiding overlapping of material in different papers, and editing the papers generally. It also involved organizing two meetings at which the papers were discussed. Although the members of the Co-ordinating Committee were available to the Convener for consultations at various points the responsibility, for the co-ordination of the project and the administration of the co-ordinating unit was vested in the Convener. As already mentioned in the preface two members of the Co-ordinating Committee proved of particular help and gave consultative assistance at all stages apart from the deliberations during the meetings of the Co-ordinating Committee itself. One of them has worked jointly with the Convener and helped in thinking, planning and administering the project and in editing the report.(c) The Field Centres : In each of the eight centres a senior universityteacher or researcher was appointed Honorary Field Director of the project. The Field Director was entrusted with the overall responsibility for the project in his state. He was to be assisted by two supervisors and ten
* M. S. Gore, I. P. Desai and Suma Chitnis (edrs.) Papers in the Sociology of Education in India. New Delhi : National Council of Educational Research and Training (1967).

investigators. This research team was to be divided into three field work units. Two of the three units were to be supervised by the Field Director. The ten investigators and one of the two supervisors were to be appointed for a period of four months only as this was the etsimated period for field work. The second supervisor, however, was to be appointed for a period of nine months, as he was to be retained after the field work was completed to assist the Field Director in the writing of the report for the research project for his state. The Co-ordinating Unit was mainly responsible for drawing the sample but since the information required for drawing the sample of the village communities from which primary school teachers and parents of primary school children were to be canvassed in each state was not available to the Co-ordinating Unit, the Field Director for each state was made responsible for drawing the rural sample. He was also responsible for contacting the heads of the educational institutions from which the respondents were to be canvassed and for obtaining permission to conduct the study in the institutions. He was expected to supervise the field work in his state and to ensure that the instructions given by the Co-ordinating Unit were being followed closely. This was important for maintaining a uniformity in the field work. Moreover local conditions in a state were likely to present special problems which the Co-ordinating Unit might not have anticipated while formulating the instructions. The Field Director was expected to identify local peculiarities that were likely to affect the uniformity of the study and refer them to the Co-ordinating Unit for fresh instructions. The Field Directors were also responsible for the funds allocated to their centres. This not only meant maintaining accounts according to the instructions of the co-ordinating ofiice but strictly adhering to expenditure as permitted by the budget allocations of the NCERT. Whenever any adjustments were necessary the Field Directors were to secure the permission of the Convener for re-allocation. Finally, at the termination of the project the Field Directors were to write a report on the basis of the data obtained for the state sample.
2. CO-ORDINATION AND UNIFORMITY :
The co-ordination of the activities of eight different centres and the maintaining of a uniform pattern in research at the various centres were the principal challenges to the organization of this project.
Having chosen to cover eight states in the study the Co-ordinating Committee could have planned for eight commonly conceived but independently directed studies undertaken separately in each of the states. Organized in this manner the project would have been considerably easier for the co-ordinators to handle. But it was felt that inspite of the effort

to maintain a uniformity between eight such studies, the data for the eight different states would not be strictly comparable. It was therefore decided that the study should be organized centrally.
Broadly, this meant that the sample for each state had to be drawn by the Co-ordinating Unit on the basis of a uniform sample design, the questionnaires had to be prepared centrally, the data at the termination of the field work at each centre had to be received and processed centrally and, finally, the co-ordinating unit had to provide a common framework to each of the centres for preparation of the report. Central direction for the project also vraplied that it was necessary for the Field Directors to meet periodically and discuss the project.
Only two such meetings of the Field Directors could take place. One was held in October 1965 and the second in January 1967, after the data were tabulated and the tables were in hand. At one stage the coordinating body was considering the idea of inviting the eight Field Directors to the Tata Institute of Social Sciences for six weeks of report writing. This meeting it was believed, by giving the Field Directors a chance to discuss and compare their data with those of the other states, would bring to each state report the broad perspective of the country-wide study. Moreover, it was felt that the coming together and exchange of several view points would enrich the interpretation of the data. Due to non-availability of funds this idea had to be given up. The limited number of meetings between the Field Directors was a major shortcoming in the organization of the project.
3. THE TIME SCHEDULE :
The grant for this project was sanctioned in July, 1965. One of the conditions governing the grant was that the project should be completed within a year of the sanction of the grant. Many factors interfered with the completion of the project on time— floods in Orissa and disturbed conditions in Rajasthan and Punjab due to the Indo-Pakistani war among them. But the principal factor responsible for the delay was our inability to get the data processed in time. While planning the project co-ordinators had allowed six weeks for the preparation of the questionnaire and the drawing of the sample, four months for data collection and six and a half months for the processing of the data and for report writing. According to this time-budget the field work was to commence in the first week of September, 1965 and completed by the first week of January, 1966. The data were to be processed by the end of March and the report-writing completed between April and July, 1966. However, while drawing up the time schedule for the project the co-ordinators had counted upon the

availability of certain facilities for the processing of the data. They had estimated these facilities to cost about Rs. 35,000. But, the NCERT were not in a position to sanction the sum required and the project had to depend upon the voluntary co-operation of organizations willing to help in the processing of the data. This not only meant a considerable delay in terms of the time spent in exploring the possibilities of getting the data processed free of charge, but also implied that the project had to adapt its time-schedule according to the availability of the facilities for the processing of the data.
The tabulation work was completed only in the first week of December 1966. The delay in the tabulation upset the time schedule of this project completely. Field Directors had made other commitments and found it extremely difficult to do the report writing during a period in which they had not planned for it.
From the organizational point of view some experiences with respect to the time-schedule on this project are relevant. The survey was to be conducted in schools and colleges and in planning the programme for work the co-ordinators had to take into account the vacations of these institutions. The fact that schedules for vacations vary from one state to another also complicated the organization of work. Another experience in this connection was that even a short delay at some stage or the other often upset the time schedule completely. It has been mentioned earlier, that the co-ordinators were hesitant about the interviewing of college teachers. They finally decided to include college teachers in the study even before the NCERT had sanctioned an additional grant for the purpose. But, inevitably a couple of weeks were lost in making the decision. This delay had far reaching effects on the plan to get most of the field work completed before the Puja and Diwali holidays and consequently led to a series of further delays. Another factor, again unavoidable, that interfered with the time schedule was the fact that decisions on the re-allocation of any part of the grant had to be made at two levels. Re-allocations were often required. For a re-allocation of a budget item the Centres had to refer to the co-ordinating unit. The co-ordinating unit in turn had to consult the NCERT, This was perhaps necessary for effective administration and uniformity but it was a requirement that made for delays.
S ec t io n III — S a m p l in g D esig n
1. THE CHOICE OF STATES :
The state was to be regarded as the unit for the organization of the study. Minimally the study was proposed to be undertaken in four states

and preferably in eight. Since education had progressed at different paces in different parts of the country and since it appeared that the geographical divisions of the Eastern, Western, Northern and Southern zones of the country offered as good a chance of covering these variations as any other, it was decided to select the states for the study equally from each of these zones. The field work in each of the states was to be supervised by a scholar attached to one of the universities in the state. The choice of the particular state or states in each zone was, therefore, contingent upon the availability of a scholar who had the experience and the interest necessary for undertaking extensive field work in the sociology of education. Thus the states were not chosen randomly within each zone.
The following were the states where the study was undertaken:East zone : Orissa and West BengalNorth zone : Punjab and Rajasthan
(Punjab included Haryana)South Zone : Andhra Pradesh and MysoreWest Zone : Gujarat and Maharashtra
2. RESPONDENT GROUPS :
The respondents who were to serve as the primary source of data collection for this study were mainly four:
(a) Students(b) Teachers(c) Heads of Institutions and(d) Parents of students
But even these respondent categories were not all homogeneous. They differed in the stage of education and type of educational institutions to which they were related. It was felt that both these factors would make a material difference in the type of answers respondents would give to any question. The universe of respondents was in this sense a stratified universe even within each respondent category. The number of strata could be many and varied and some choice had to be made. It was decided to restrict the study to three stages of education, viz,, the primary, the high school and the undergraduate college. At the college stage there were again several possible types of institutions—the liberal arts colleges, the conMnerce colleges, the professional colleges of law, medicine, engineering, architecture, pharmacy, fine arts etc., and the post-high school but non-degree training programmes such as those in the polytechnics. Not all the types of institutions could possibly be covered by the study.
It was, therefore, decided to restrict the study to primary schools, high schools, arts and science colleges and colleges of medicine, engineering and the polytechnics. The decision was based on the consideration that

between them these institutions covered the main stream of education in the country and that the contrast between the liberal arts and science college on the one hand and the professional college on the other would highlight the difference between two important categories of persons— those pursuing a definite career and those still largely uncertain about it, those exposed to close contact with modern technology and those not in such close contact.
Putting these stages and types of institutions together with the different categories of respondents we obtain the following 24 respondent groups.
(a) Students :1. Primary School students2. High School students3. Liberal Arts, Science and Commerce College students4. Medical College students5. Engineering College students6. Polytechnic students
(b) Teachers:7. Primary School teachers8. High School teachers9. Teachers of Liberal Arts, Science and Commerce Colleges
10. Teachers of Colleges of Medicine11. Teachers of Colleges of Engineering12. Teachers of Polytechnics
(c) 13 to 18. Heads of Institutions listed under (b)
(d) Parents :19. Parents of Primary School students20. Parents of Secondary School students21. Parents of students of CoUeges of Arts, Science, etc.22. Parents of students of Medical Colleges23. Parents of students of Engineering Colleges24. Parents of students of Polytechnics
Of these respondent groups some could not have been studied and some it was decided not to study. For example, it would not have beenpossible to study primary school students with the use of a formalquestionnaire. The group was considered too young for purposes of the study. Similarly, since many of the primary schools are single teacher schools, the distinction between teacher and head of the institution could not have been consistently maintained. It was, therefore, decided to eliminate the separate category of ‘Heads of Primary Schools’.

It was also difficulf to distinguish consistently between parents of children in primary schools and in secondary schools. The two groups were, therefore, treated as one. It was also decided for lack of time not to extend the study to parents of college students. As a result, the six groupings under the heading “Parents” were taken together as one category though the parents were contacted as in relation to a particular child in the primary or the secondary school sample.
Thus the 24 potential respondent groups were reduced to 18 respondent grou{^. These 18 respondent groups were studied with the help of six different questionnaires:—
1. Students2. Primary and Secondary School Teachers3. College Teachers4. Heads of Secondary Schools5. Heads of Colleges6. Parents
3. CLUSTERS, COMMUNITIES AND INSTITUTIONS :
Having decided on the respondent groups to be studied it would probably have been methodologically more satisfactory to choose by the simple random method the individual respondents from a complete listing of all individuals in each respondent group. Such listings, however, could not possibly have been available nor easily prepared. A multi-stage sampling design had therefore to be adopted where respondents were chosen as members of particular classes in particular institutions which were themselves chosen through a process of randomization.
The institutions— at least the secondary schools and colleges of all types—could have been directly selected from a complete listing of each type of institution in every state.
Here certain theoretical considerations intei-vened in favour of a more indirect mode of choosing institutions. It was felt that institutions even of the same type—say a college or secondary school—difleted a great deal in their atmosphere and impact on the student depending on where they were located—cities, towns or villages—and also upon their sponsorship^—governmental, voluntary secular or voluntary religious. Some way had to be found to provide for these differences in the sample design.
This meant that it was not only the stage of education at which the institution was located but also the type of community in which it was located and the type of its sponsorship that would serve as differentiators in the attitudes of students, teachers, etc. It was soon realised that not all the factors could be accepted as classificatory factors and built into the

very design of the sample. The type of institutional sponsorship was, therefore, eliminated from the list of classificatory factors. The type of community in which the institution was located was, however, considered a sufficiently important factor to be taken note of.
Here several possibilities existed. Communities could be distinguished from one another by demographic size, by degree of industrialization or by the varied types of educational institutions that were located in the community. It was decided to differentiate them in terms of the varied types of institutions that were located in them. At one end of the scale would be communities in which there were only primary school?. At the other were communities which supported the whole complex of educational institutions—^primary schools, secondary schools and colleges of all types. It was expected that this differentiation would be found to run parallel to the rural-urban differentiation of communities—since it was expected that the larger the community the greater was the likelihood of its supporting a more varied set of educational institutions. Even if this were not to be the case, it was argued, the differentiation of communities based on combinations of types of institutions was more relevant for the study than the mere size of the community.
Four types of institutions were chosen whose presence in various combinations would differentiate between one community and another. These institutions were;
i) a secondary school for boys or a co-educational schoolii) a secondary school for girls onlyiii) a liberal arts or science or commerce college for boys or a
co-educational collegeiv) a liberal arts or science or commerce college for girls only.
Logically these four types of institutions would combine in sixteen different ways, but it was expected that many of the combinations would not be found to exist in reality. This expectation was based on two assumptions:—
i) that any community with a college was bound to have a secondary school and
ii) that any community with an institution for girls was bound to have an institution for boys as well.
On these assumptions it was expected that only the following five combinations would exist :—
i) Communities with only a boys’ or co-educational secondary schoolii) Communities with a boys’ and a girls’ secondary schooliii) Communities with a boys’ or co-educational secondary school
and a boys’ or co-educational collegeiv) Communities with a boys’ or co-educational secondary school

and a girls’ secondary school and a boys’ or co-educational collegev) Communities with a boys’ or co-educational secondary school,
a girls’ secondary school, a boys’ or co-educational college and a girls’ college.
This expectation was found to be correct in six states. In two states, however,—Punjab and Bengal—there were communities with only a girls’ secondary school. The total number of community types which had to be provided for in the study was thus six and not five.
All the communities in the states were grouped into “clusters”, each cluster representing a particular combination of educational institutions. Additionally, the capital of each state was regarded as in a cluster by itself and at the other end communities with only primary schools were regarded a separate cluster. Thus in each state seven or eight clusters of communities were identified.
This division of communities into clusters required information on the types of institutions and their locations. Much of the validity of the sample depended upon the correctness of this information. The procedures followed to obtain the information and to group the communities is given in the next sub-section.
From each cluster of communities in each state two communities were chosen by following a process of randomization either through the use of random numbers, through the use of dice, or the drawing of lots as explained later. There were thus 10-12 communities chosen in each state apart from the capital city and the communities with only primary schools.
The choice of the communities-with-only-a-primary-school was made in relation to the other communities already in the sample for each of the clusters as explained above. The “primary-school-only” communities were chosen at the field level by the supervisors after preparing a list of all such communities within 4 to 6 miles of the “urban” community— one with at least a secondary school—which was already part of the sample. This ensured a wide distribution of the communities with only primary schools—at least as wide a regional distribution as was achieved in the choice of the “secondary-school-at-least” type of communities.
Having chosen the communities the choice of institutions was again randomized for each type of institution. One institution of each type that existed in the community was chosen for study. In the capital city, however, two institutions of each type were chosen.
Nothing has been said so far about the colleges of medicine and engineering and the polytechnics. These three were regarded as special types of institutions which could not be found in many communities. A decision was, therefore, taken to study two institutions of each of these diree types in every slate ; one of the two institutions in each case would

be chosen from the capital city and the other randomly from among the rest of the institutions in the state.
The total number of institutions—of each type and in each cluster— that were to be studied in every state is given on the attached sheet. The number of respondents of each category interviewed in each state have also been indicated. (Tables II-1 and II'2)
In each of the institutions—except in primary schools—students in one of the divisions of the final year class were studied. Additionally, the heads of secondary schools and colleges and the parents of fifty per- c©ftt of the students in the sample from primary and secondary schools were interviewed. The number of individuals who were studied in this way in each state is given below for each category of respondents.
TABLE 11-2
T h e N u m b e r o f R e s p o n d e n t s o f E ach C ategory S tu d ie d in E ach Sta t e
School*andCollegeStudents
SchoolTeachers
Heads of Schools
College Heads of Teachers Colleges Parents Total
Andhra 1430 518 44 343 16 570 2921W. Bengal 1342 396 57 240 15 639 2689Gujarat 1573 542 52 194 18 951 3310Maharashtra 1485 491 49 217 16 913 3171Mysore 1912 307 49 116 14 839 3227Orissa 1240 343 38 160 6 1077 2864Punjab 1297 363 42 195 13 757 2667Rajasthan 1352 446 46 181 13 520 2558
4. SAMPLE VARIATIO N S:
(a) From the outset the following inter-state variations were presentin the sample.
1. Andhra2. West Bengal3. Gujarat4. Maharashtra5. Mysore6. Orissa
Clusters III and VI were missing All clusters were present Cluster VI was missing Cluster VI was missing Cluster VI was missing All professional institutions in cluster O were missing and the whole of cluster VI was missing.
A further break-down of these figures between High School Students, College Students and Professional College Students is given in Chapter III.

7. Punjab Medical College in cluster O was missing8. Rajasthan Engineering College and Polytechnic in cluster
O was missing and cluster VI was missing.(b) Subsequently (i) because of the disturbances during the Indo-
Pakistan conflict the following communities had to be dropped from the sample in Punjab viz. Community A & B of cluster III, Community A of cluster IV, and Community B of cluster V.
ii) In Maharashtra Community 2 (village attached to Community A) in cluster IV was not canvassed.
iii) In Rajasthan the teachers in the Medical College in the capital city co\ild not be canvassed, as they refused to co-operate. In fact reports from the centres indicate that a number of Field Directors faced a problem in obtaining co-operation from the medical colleges.
5. THE LIMITATIONS AND POTENTIALITIES OF THE SAM PLE:The sample design described above is a multi-stage, stratified sample,
the major strata being based on the stage of education and type of educational institutions as well as on the type of community in which the institution is located. Each of the bases used for the stratification also serves as a stage in the identification of the respondent group which was finally studied. A detailed methodological note prepared by Dr. Ramkrishna Mukerjee and Mr. Suraj Bandopadhyaya, who helped in formulating the sample design, is appended to this report.
The sampling design adopted for this study has one major limitation. It cannot serve as a basis for making reliable estimates for the distribution of characteristics and responses in the entire population of students, teachers and parents even within a state. It certainly cannot be used for making all-India estimates by putting together the data from different states. But once this limitation is accepted the design provides for many built-in potentialities for comparisons between the different strata of the sample. For example, if ‘modernization’, ‘equality of opportunity’ and direction of social and occupational mobility are some of the generalized foci of interest in this study, as was argued in the previous chapter, the sampling design aodpted for the study permits comparisons on each of these characteristics between different major respondent groups—viz. teachers, students, parents etc. and within each of the groups as between respondents from different levels of education or in different types of educational institutions. A comparison of distributions of responses from one cluster to another may give insights into the relationships between degrees of urbanization and the particular attribute under study. Moreover, since the students and teachers were chosen with reference to particular institutions

it is possible to u^ertake an analysis of responses by “sets” of res- pond^ts who are in d^hed and known relationships to each other as administrator and staff or teachers and studeilte, parents and children etc. Due to limitations of time and resources it has not been possible to exploit all the potentialities of this sampUng design.
The sample design had provided for the grouping of communities by the types of mstitutions that they si|pported. 5 t was initially believed that this would also help to d^^rentiate them along the rural-urfean axis. This expectation w<(s not entimly borne out- The communitifs with only primary schools in each of the clusters in all the states could be uniformly dassifted as rural areas even according to the cemus Buta regrou{Aig oi the *‘secondary-school-at-least’ comirttinitie® in the clusters was necessary to make the original grouping of communities by types of educational institutions reflect the. rural-urban differential according to the census criteria. After this regrouping it was found that while some clusters in eaejfe state continued to be urban according to the census criteria, others rural and yet others were “ftiixed”. The position in respect of each state is given teow.
Uffian Mixed Rural
Andhra Cluster 0,1 & 2 __ ■ Cluster 4 & 5West Bengal O artw iJ, 1,2 & 3 Cluster 4 Cluster 5 & 6^ } a f a t Cluster 0, 1, 2 & 3 Cluster 4 Cluster 5Maharashtra Cluster 0 ,1 ,2 ,3 &4 — ClustersMysore Cluster 0 ,1 ,2 , 3 &4 Cluster 5Orissa Cluster 0,1 & 2 Cluster 3 Cluster 4 & 5Punjab Clpater 0 ,1 , 2, 3 & 4 Cluster 5 & 6Rajasthan Cluster 0 , 1 ^ 2 Cluster 3 & 4 cluster 5
6. THE PRdCEDVRE ADOPTED IN DRAWING THE SAMPLE:
(a) The Responsibility for Drawing the Sample : The sample, asfar as the communities, institutions and major divisions (i.e. Arts, Science or Commerce) of the institutions werfe concerned, was (Jrawn by the Coordinating Unit. The Co-ordinating Unit, however, did not have adequate data on subject departments within institutions and, therefore, the Field Directors were made responsible for drawing the sample In instances where it became necessary to choose between different subj^t departments. The field centres were provided with detailed instructions on the procedure to be adopted to ensure that the method of randomization was uniform between the eight states. The field centreis were also responsible for drawing the sample for the village communities to be studied in each state.
In drawing the over-all sample for the study the first step consisted of classifying all the communities (towns, cities and villages) relevant for the

S tu d y into the different clusters. For this the Co-ordinating Unit required up-to-date and accurate information on the distribution of educational institutions in each of the states in which the study was to be undertaken.(b) The Sources of Basic Information : Since the research design suggested that the Directors of Public Instruction in each state could serve as a uniform source of information the Co-ordinating Unit initially wrote to the D.P.l’s, concerned for the school and college lists. It was felt, however, that the D.P.l’s, office was not likely, generally, to have complete information on the colleges in each state. Therefore, it was decided to write to the authorities of all the universities in each of the eight states for this information. Towards this purpose, a Bst of the universities in each state was made on the basis of information available in the Times of India Directory 1965-66. While this was done the latest copy of the Directory of Institutions for Higher Learning 1963, published by the Mlttlstry of Education was also obtained. The Co-ordinating Unit then wrote to the universities concerned.(c) The Methods used for Drawing the Sample : After the classificationinto clusters was complete the sample was drawn.
(i) First two communities in each cluster from among all the communities listed under each cluster were randomly chosen.
(ii) After the communities were chosen aU the educational institutions in each of the communities chosen were lifted viz. Boys’/Co-educational Colleges, d irk ’ Colleges, Boys’/Coeducational Secondary Schools, and Girls’ Secondary Schools. From among each of these types of institutions in each of the two communities within a cluster one was randomly chosen as the institution to be studied. Primary schools in the sample were selected by the Field Directors in each state.
(iii) In each state the Medical and Engineering Colleges and Polytechnics in the Capital City were also listed. From among these one Medical College, one Engineering College and one Polytechnic were chosen for study.
(iv) For the choice of the special sample (viz. the Medical and Engineering Colleges and Polytechnic located outside the Capital City) the institutions were separately listed and one institution of each type was picked in each state.
In choosing a community or institution randomly in (b) and (c) above the following methods were used :
(1) A coin was tossed when only two aUematives were available.(2) A die was thrown when more than 2 and less than 6 alternatives
were available.(3) A pair of dice or folded slips of paper were used when more

than 6 and less than 12 alternative choices were available.(4) Random Numbers were used when the alternatives exceeded 12.
(d) The Choice of Villages : The sample for the villages to be studiedwas to be drawn locally at each of the eight field centres. To ensure uniformity between the procedure adopted for drawing the sample in each state the field centres were given detailed instructions to be followed at each point. They were asked to list all the villages (i.e. communities with primary schools only), within a radius of between 4 miles and 6 miles of each of the ‘urban’ communities (i.e. communities with at least a secondary school) in the sample. A separate list was to be prepared for each of the two communities in a cluster. From each list two villages were to be jraiidomly chosen. Each cluster was thus made up of two communities with at least a secondary school and four communities with only primafy schools.
7. POSSIBLE ERRORS IN SAMPLINGIn some of the states information was not available from the D.P.I’s
office and the Co-ordinating Unit had to refer to an alternate source viz. the lists maintained by the Secondary School Examination Boards. This introduced a variation in the sampling procedure.
It had been decided to draw the sample centrally in order to obtain the maximum uniformity in the study in the eight states. The following inter-state variations in the organization of education are likely to have affected the uniformity of the sample between the eight states.
(a) The inter-state variation in the length of the education period upto the end of the secondary school period.
(b) The inter-state variation in the number of years assigned respectively to the primary and the secondary stage.
Apart from variations in the methods of listing followed in each state the Co-ordinating Unit was faced with another problem. The lists were defective in their grouping of institutions by divisions, or municipal limits. Wherever the Co-ordinating Unit noticed discrepancies corrections were made.
It has been mentioned above that in some of the states the D.P.I.’s. office could not provide the lists. Quite apart from finding alternative sources for the information, the difficulties in obtaining these lists were many. It may be useful to consider two or three examples. The list for Rajasthan and partly the list for Maharashtra were transcribed by hand by friends who obtained them from the office where only one master list was available. The lists for Andhra and Mysore were also copied out and typed by friends from master copies in the offices concerned. In the process of transcription of the lists by hand errors are likely to have occured.

Among the errors in sampling due to defective listing, the most important was the one relating to the West Bengal sample. Because of defective postal addresses in the original list of secondary schools and colleges the sample drawn for West Bengal has turned out to be more urban than for other states and the grouping of communities into clusters has turned out to be erroneous. In Punjab, respondents in some of the clusters could not be studied at all. There was no way of correcting these errors except by drawing the attention of the reader to these short-comings and their possible consequences.
S e c t io n IV — T he Q u e st io n n a ir e
In designing the tools for this study two points had to be borne in mind—first the size of the study and second the need to maintain uniformity in data collection at each centre. In consideration of the large number of respondents and the need for quick mechanical processing of data it was decided to use the pre-coded questionnaire as the tool best suited for canvassing data for this study.
1. THE QVESTIONNAIRE DESIGN
Since the social backgrounds, social values and attitudes to education were the three principal foci of the study the questionnaires were primarily designed for obtaining information on these three issues. Separate questionnaires were prepared for students, school teachers, school heads, college teachers, heads of colleges and parents. In order to obtain data that would lend themselves to comparison between the different groups of respondents an effort was made to provide, wherever possible, identical questions in the different questionnaires. Of course in some cases the questions in the different questionnaires had to be complementary to each other, rather than identical. A small detail that was overlooked during the designing of the questionnaire was the numbering of identical or complementary questions. During the tabulation of the data it was realized that the tabulation work would have been considerably lighter if identical or related questions in the different questionnaires had borne identical code numbers.
The size of the study made it necessary to plan for machine tabulation of the data. For this the first requirement was that the alternate responses provided to each question did not exceed a number that could be conveniently accommodated on a punch card. As far as possiWe, the number of alternatives was kept down to six or less. However, in questions

concerning occupation they ran up to the maximum number permissible (twelve).
Multiple response generally poses a problem to machine tabulation. To avoid multiple responses the questionnaire carried instructions to say that the respondent was to choose only one from among the several alternative responses provided to a question. The investigators were also asked to make sure that none of the respondents marked more than one response to a question. However, an additional precaution should have been taken, viz. to provide responses that were mutually exclusive. Most of the questions had alternative responses that excluded each other but each of the questionnaires carried some questions with alternatives that were not necessarily mutually exclusive. As it happened, multiple response to some questions was heavy. Not only did this present problems for computing the data into cross tables but in some cases the data on these questions could not be used at all.
For efficiency in transferring the data from the schedules to punch cards it was essential that the format of the schedules used in the eight states be uniform. Equally important from the point of view of ensuring comparability of the data from the eight states was the requirement for uniformity in the substantive content of the questions. This problem became specially pertinent as the questionnaire originally prepared in English had to be translated into eight different languages—^Telugu, Bengali, Gujarati, Marathi, Kannada, Oriya, Hindi and Urdu.
To ensure uniformity in the format of the questionnaires it was decided to get all of them printed in Bombay. Where the number of regional language questionnaires required was small the schedules were cyclostyled. The others were printed. This meant dealing with several printing presses. Even in a cosmopolitan city like Bombay it was not possible to find a press that undertook to print in more than three languages. In fact it was not possible to get the questionnaires in Oriya printed in Bombay at all. One or two presses that offered to undertake the job quoted a printing rate per letter printed—and the rate was exorbitant. TTie schedules in Oriya were ultimately printed in Cuttack. Stencils for the cyclostyling of questionnaires had to be cut by, hand as typewriters in the regional languages were not easily available. Moreover the commercial rates for typing in the regional languages were very high. Fortunately the Coordinating Unit found willing helpers for this work.
2. TRANSLATION OF THE QUESTIONNAIRES
Getting questionnaires translated commercially was out of question. The expense would have been prohibitive. The Co-ordinating Unit had

StUbY bESIGN : ^7
to depend entirely on the help of students of the Institute and friends outside. The Research Officer sat with the persons who helped in translation and discussed the meaning of each of the question in detail. After a questionnaire was translated another person knowing the language sat with the Research Officer, in the absence of the translator and retranslated the draft from the regional language into English without looking at the original English draft. At a third session the two persons together with the Research Officer sat together and worked out the nuances of meaning. On the basis of these discussions the draft was revised and a copy sent to the Field Director concerned. On the basis of the suggestioas offered by him—if they reached the Co-ordinating Unit in tiftie—the translation was finally revised.
In sphe of all the precautions taken there may still be differences in the nuances of meanings of questions asked in different languages. And the question remains whether the inter-language differences in associations of words or ideas are not large enough to lead to Inter-state variations in responses. In one case at least the difference was significant. In the Bengali version of the questionnaire the term often used to designate the scheduled caste is one that denotes a particular group from among the scheduled castes. This has undoubtedly affected the response to this question among those who answered the questionnaire in Bengali.
3. THE ADMINISTRATION OF THE QUESTIONNAIRE
Since the majority of the respondents to be canvassed belonged to schools or colleges it was decided to administer the questionnaire to teachers, heads and students in the educational institutions during school hours. The Field Director in each state was to request the school and college authorities, if necessary through the education department of the state, for permission to conduct the study during the school or college hours. The investigators were to distribute the questionnaires to the students in the class room, and collect them at the end of the hour. Heads of schools and teachers were allowed more time on their questionnaires.
The parents of all the school students were not interviewed. Investigators were required to pick from the secondary school register the name and address of every alternate student interviewed. Additionally 50 per cent of the parents of students in the last year of the primary school from which primary school teachers were canvassed were to be interviewed. Parents of primary school children were selected on the same principle— every alternate name in the list was taken. Parents had to be interviewed at their homes. Since it was felt that it may in some cases be difficult to get the mother of a student to respond to an interview of this nature, only

male parents were interviewed. Again, since some of the parents were likely to be illiterate it was decided that the investigators would individually interview parents and not distribute the questionnaires for self-administration by the respondent.
The instructions at the beginning of each questionnaire specified that the respondent was to tick ( -y/ ) the response with which he agreed most. The tick mark was to be placed in the space provided for it against each alternate response. The investigators were instructed to ensure that this mark was neatly made in the appropriate place. Unfortunately various lOackl were \ised» They were not always entered in the correct place. In a few cases the supervisors, in checking through the schedules had superimposed their own marks on those entered by the respondents. This made considerable confusion when the data were tabulated. The Co-ordinating Unit had not originally planned on checking the completed schedules, but after the data came in it was found to be necessary.
S e c t io n V — T a b u l a t io n o f D ata
Social scientists have adopted many statistical tools beginning with simple percentages and going to the most complicated factoral analysis for handling data. The size and the varied quality of the data that had to be handled for this study made it apparent that the simplest tools were likely to yield the most useful results. A decision was therefore taken to rely largely on simple frequency tables for analysing and presenting the data of the study. A few cross-tabulations were also obtained to assess the existence of relationships between some of the more important social background characteristics of individuals and their attitudes, values and opinions. In one case an effort was initially made—only to be later abandoned—to compute a cumulative index based upon several responses to help characterize individuals as more or less ‘modem’.
1. SIMPLE FREQUENCY TABLES
A decision taken at an early stage in the preparation of the tabulation design was that all data would be separately analysed for men and women respondents. Though sex had not been used as a classificatory factor in the choice of respondents it was felt that there would be important differences in the characteristics and responses of men and women in every respondent group which would otherwise be lost if separate tables were not available for the two sexes on every question. It was, therefore, decided to obtain separate tables for men and women on all questions.
The cards for each of the two sex groups and each of the following

fifteen respondent groups were then arranged in such a way that frequency distributions would be available separately for the capital city for each of the six clusters excluding the villages in the cluster and for the ‘rural’ communities as a whole. The terms village and rural are here used to refer to those communities which had only a primary school.
Respondent Groups1.2 .3.
4.
5.
6 . 7.
High School Student College Student Professional College Student—
Medical Professional CoUege Student—
Engineering Professional College Student—
Polytechnic Primary School Teacher Secondary School Teacher CoUege Teacher
9. Professional College Teacher— Medical
10. Professional College Teacher— Engineering
11. Professional College Teacher— Polyteehnic
12. Heads of Secondary Schools13. Heads of Colleges14. Parents from non-village
communities15. Parents from ‘rural’ communi
ties.There were fifteen separate respondent groups. For each of them two
tables—one for men and one for women—were separately obtained for each question they answered. Assuming that there were fifty questions on an average in each questionnaire a total of 15 x 2 x 50 = 1500 tables were obtained for each state. The total number of simple frequency tables for all the eight states was approximately 1500 x 8 = 12000.
Each of these tables gave a break-down of responses by the community groupings and the number of alternative answers provided in the question.
The tabulation design for simple frequency tables as outlined below made the following comparisons of percentage distributions possible.
1. Inter-state comparisons for the same respondent group2. Inter-sex comparisons for the same respondent group3. Inter-cluster comparison for the same respondent group4. Rural-urban comparison for the same respondent group
(after a slight re-grouping of data)5. Tnter-respondent comparison :
(i) to yield data on variations between teachers, students and parents.(ii) to yield data on variations between students at different levels of
education and teachers at different levels of education.The major part of this report is based on simple frequency distribu
tions and their comparisons. The all India report has used tables showing inter-state, inter-sex and inter-respondent comparisons. The state reports have used inter-sex, inter-respondent and inter-cluster comparisons.

The tabulation design outlined above sacrificed data on one type of variation which the sampling design had provided for, viz. data on variations between two communities in the same cluster group. Obtaining distributions separately for each community would have increased the tabu- altion work and also required more time to be spent on grouping together of frequencies for purposes of discussion. Besides, the number in each of the cells would have been too small to permit analysis.
Later, when it was discovered that two communities in one cluster— particularly in clusters 4, 5 and 6—did not always represent the same degree of urbanization, though they supported the same complex of institutions, the non-availability of data by individual communitiles posed a problem. The discussion of rural-urban variations could not now be based entirely on cluster differences.
L o c a t io n o f D if f e r e n t R e s p o n d e n t G r o u p s i n D if f e r e n t C i u s t e r s
List of Respondent GroupsCapital
City I 2 3
Clusters
4 5 6
RuralCommunity
1. High School Student V V V V V V V X
2. College Student V V V V X X X X3. Prof. College Student
Medical V ? ? ? X X X X4. Prof. College Student
Engineering V ? ? ? X X X X
5. Prof. College Student Polytechnic V ? ? ? X X X X
6. Primary School Teacher V V V V V V V V7. Secondary School Teacher V V V V V V V X8. College Teacher V V V V X X X X9. Prof. College Teacher
Medical V ■? ? ? X X X X10. Prof. College Teacher
Engineerhig V ? ? ? X X X X
11. Prof. College Teacher Polytechnic V ? ? ? X X X X
12. Heads of Secondary Schools V V V V V V V X
13. Heads of Colleges V V V V X X X X
14. Parents from ‘urban’ communities V V V V V V V X
15. Parents form ‘rural’ communities X X X X X X X V
V = Group present x — Group absent ? = Presence uncertainNote : The term ‘rural’ describes communities with only primary schools.
The rest are referred to as ‘urban’ communities.

2. CROSS-TABLES
Whereas the frequency distributions were obtained for 15 diflEerent respondent groups as mentioned earlier, the cross-tables were obtained for only the following seven groups :
(1) High School Students(2) College Students(3) Professional College Students(4) Primary School Teachers(5) Secondary School Teachers(6) College Teachere(7) Parents
The three categories of professional college students, one category of parent and one category each of high school and coUege heads were not separately tabulated. They were merged with the nearest related categories.
The cross-tables gave data not separately for each cluster nor separately for each sex but for all respondents of a particular category in a state.
All the cross-tables obtained for the study are two-way tables. Higher order cross-tabulations were not obtained because of financial as well as technical reasons. Since computor facilities were not available at the headquarters of the study the programme for cross-tabulations had to be prepared even before the data from frequency tables had become available in full. It did not seem wise to undertake higher-order cross-tabulations on the mere chance that they might reveal significant relationships. As it turned out later the decision was proved right also because the nonresponse and multiple response on a few of the important questions would in any case have nullified the value of any cross-tabulations that would have been obtained.
Even in cross-tabulations involving only two questions it was found that some of the tables could not be used because the cumulative total of non-response and multiple response on the two questions exceeded 5% of the total number of respondents on those questions.
The major independent variables for which cross-tabulations were obtained were age, sex, caste, rural-urban residence, occupational background, educational bg^ck^ound, and institutional sponsorship. Apart from these tables additional special cross-tables were obtained for each respondent category wherever necessary.
S e c t io n VI— A n a l y sis o f D ata
Since frequency distributions and two-way cross-tables are the major forms of tabulation used in the study the analysis has been done primarily

by the use of percentages, comparisons of percentages, and use of tests of significance of difference. It has not been possible to apply chi-square tests or compute ‘r’ values for data presented in cross-tables.
The state reports have used the cross-tables. It would have been incorrect and somewhat misleading to prepare all India cross-tables by pooling data for the eight states together. The state sample was chosen by a process of multi-stage randomisation; but the states themselves were not randomly chosen. If the all India report were to utilize cross-tables on all questions it would have been necessary to present the data of eight separate tables on each of them. This would hardly have helped in clarity of discussions. The all India report primarily uses frequency percentages and tests of significance of differences in percentages.
1. TEST OF SIGNIFICANCE OF DIFFERENCE
The test of significance of difference used in the study is the one given
by the formula Z , where pj is the proportion in Sample I
reporting a given response, p^ is the proportion in Sample II reporting
on the same response and ^D p = p„*qa Pu being the
weighted average of the two proportions obtained as follows:
and q is equal to 1 — p„.N1+ N 2
The formula is useful for drawing inferences from nominally scaled data. The formula helps in testing the null hypothesis that the difference between two proportions is not significant and that the two samples to which the proportions relate could have been drawn from the same population.
The formula can be applied to sociological data subject to two conditions : (i) that the two proportions relate to two independent samplesand (ii) that sample chosen has a normal distribution.
The first of the two conditions is easily fulfilled where data relating to two different state samples are bemg compared. The state samples are each an independent unit. As mentioned earlier they are not just parts of one all India sample. Even at the level of intra-state comparisons between two respondent groups, it can be argued that the high school, college and professional college samples are independent of each other and that they fulfil the first condition laid down above. The only difficulty may be in respect of inter-sex comparisons since boys and girls were often drawn from the same institution.

The second condition is hard to fulfil. However, since the communities and institutions were randomly chosen—though through a multi-stage sample design—there is reason to assume that the sample fulfills the conditions of normality as well. This was tested out by plotting the graph for age in the different samples on the normal probability paper. The straight line fit for the observed data was good. To the extent, therefore, that the distribution of the sample on just one variable can adequately establish normality of distribution, there is reason to believe that the samples are normally distributed.
The significance of percentage difference was tested by the application of the above formula for different N values and for different percentage differences. It was found th a t:—
(a) in the case of the student sample a percentage difference of 8 between any two states or student respondent groups was significant at the 5% level.
(b) in the case of the school teachers’ sample a percentage difference of 8 between any two states or teachers respondent groups was significant at the 5% level.
(c) in the case of the college teachers’ sample a percentage difference of 23 between any two states or college teacher fEspondent groups was significant at the 5% level.
(d) in the case of the parents’ sample a percentage difference of 8 between any two states or parent respondent groups was significant at the 5% level. In cases where the sample size was over 500, the percentage difference of 2 between any two states was also significant at the same level.
2. ANALYSIS OF VALUE QUESTIONS
One major problem that had to be faced in the analysis of data arose out of the need to handle a multiplicity of questions bearing on a common theme. The value questions at the end of each questionnaire presented this problem in the most acute form. There were twelve questions which between them were expected to give some idea of the modernity or traditionalism of the individual. The questions were not, however, strictly part of a validated scale. Some kind of a cumulative index could have been attempted but here again no preliminary work could be undertaken to assess the measure of internal consistency between the several questions. The effort to utilize the data on the several questions in some unified way was almost given up at one stage. It was only in the process of discussion of the data on each question that a way suggested itself for partially retrieving the data for use in the study. This part of the analytical procedure is explained in the next section.

Se c t io n V II— T h e M o d e r n -T r a d it io n l So cial V a l u e s : A n a l y t ic a l P r o c e d u r e s
1. INTRODUCTION:
As mentioned in the last chapter, one of the aims of this study was to ascertain the social values of respondents, and to relate these to their social background characteristics. The study sought to ascertain the verbalised attitudes and opinions of respondents through thek responses to specific questions and to judge from them the extent of their ‘modernity’ or ‘troditionality’ in attitudes. It was not possible to undertake a comprehensive study of all the known components of this tradition-modern complex. Only a few of these elements were selected for study. These were: an activist approach to life (two questions) ; optimism (four questions) ; achievement orientation (one question) ; acceptance of citizenship responsibility (two questions), and secularism (three questions). The actual number of questions as also the number of value elements covered by them was not the same for different respondent groups.
Although the individual questions in this group of questions were pre-tested along with all other questions included in the questionnaires, no special effort was made to ensure that these questions would collectively help to differentiate the respondents in terms of their social values. It was generally assumed that each of these questions had a dichotomy of responses, one which could be identified as reflecting the modem-liberal attitude, and the other a traditional outlook. In the case of questions which provided more than two responses, it was also assumed that these multiple response categories could be regrouped to provide a dichotomy to fit into the notions of modernization. As a corollary it was assumed that any respondent who recorded a modern response to one question would also record modem responses to all the remaining questions in this group.
These assumptions were, however, tested after the data were collected. Preliminary cross-tabulations were made with a small group of heads of colleges to find out whether there was significant correlation in the manner in which these individual respondents answered the successive questions. The results did not reveal any such correlation.
The next step was, therefore, to ascertain whether the respondents would be consistent in their responses with each sub-group of questions, e.g. one who recorded a modem response to one of the questions pertaining to optimism would also record a modem response to the other three questions pertaining to optimism. Unfortunately, cross4abulations with the same group of heads of colleges again revealed no statistically significant correlation among the responses pertaining to this or for that matter any other element of the soci^ values.

In the light of these findings, it was tentatively decided to generally discuss each of the questions as separate entities and then dwell upon the general pattern of responses emerging from an analysis of all these questions.
But even this decision was not without its problems. The handling of a multiplicity of questions bearing on the same area of social values and pertaining to eight different states, with each having as many as six major respondent groups^ and each major group having a number of subgroups of respondents^ proved a serious problem. That the eight states had to be kept separate and distinct from each other was a natural corollary to the fact that the state was the unit of study. The problem regarding the major respondent groups was also overcome by the fact that they were not intended to be compared at every point In the report. The problem was, therefore, most acute with regard to the sub-group of respondents. For example, in a given state, each sub-group of students responded to the 12 questions which form the social value set of questions. Thus a total of 480 categories of responses (12 questions multiplied by five subgroups multiplied by eight states) had to be separately processed and analysed.
2. THE RANK ORDER
After weighing the relative advantages of different approaches to this problem, the one approach which seemed most meaningful was the rank order analysis. It was felt that, since the intention was to find out if
(a) one state had a higher percentage of modem responses on a given question compared to another state,
(b) within a given state, one question drew a higher percentage of modem response than another question, and
(c) one respondent group had a higher percentage of modern responses on a given question compared to another respondent group,
a simple way of deteraiining this would be to rank the states or respondent groups on each question, in a descending order according to the percentage of respondents recording a modem response.
The outcome of this decision in terms of the ranking of the states on each of the 12 questions is illustrated below with reference to the data for high school boys.
1. The six groups were the heads of colleges, the heads of primary and secondary schools, college teachers, primary and secondary school teachers, students and parents.
2. For example, the five sub-groups in the major group of students were the high school boys, the high school girls, the college boys, the college girls, and professional college boys. The sixth sub-group of professional college girls was excluded from the analysis because they formed a very small number in each state.

State Question Numbers40 41 53 63 64 61 54 59 52 55 58 56
Andhra 7 1 8 8 7 6 2 2 5 7 5 8
West Bengal 1 4 5 1 5 7 1 5 3 3 2 6
Gujarat 6 8 2 ’ l 8 4 5 6 5 8 3 2
Maharashtra 5 3 4 6 3 5 3 7 1 4 7 4
Mysore 2 6 7 5 6 8 6 7 7 4 4 5
Ori ssa 3 2 5 7 4 3 6 4 8 6 1 7
Punjab 4 5 1 4 1 1 4 3 2 1 8 1
Rajasthan 8 7 3 1 2 2 6 1 4 2 6 3
A preliminary review of the ranking revealed that four of the states (Maharashtra, Punjab, Rajasthan and West Bengal) were located in the upper half of the rank positions and the other four in the lower half. The gross cumulation of the rank positions of each of the states on all the 12 questions provided further insight into the overall rank positions. The states tended to achieve the following positions :
No. of questions in which state was in rank positions
Rank States \ to 4
1. Punjab 102. Rajasthan 84! Maharashtra 1 n3. West Bengal j /
5. Orissa 66. Gujarat 5
7. Mysore 1 %8. Andhra j J
A similar analysis, with respect to the other sub-respondents of students was also undertaken to find out if the rank order of states tended to remain more or less the same in each of the sub-groups. The relative rank order positions of the eight states in respect of each sub-respondent group of students is given below. The last column in this table provides the overall rank order for all the five sub-respondent groups taken together. This overall rank order was obtained by the gross cumulation of the rank positions of each state on all twelve questions for all the five sub-respond- ents of students.

High School Professional High SchoolBoys College Boys College Boys Girls
Rank (HSB) (CB) (PCD) (HSG)
College All Girls Sub-groups
(CG) iOverall-OR]
1. Punjab W. Bengal Punjab Punjab2. W. Bengal Orissa Orissa W. Bengal3. Rajasthan Punjab Andhra Rajasthan4. Maharashtra Maharashtra W. Bengal Gujarat5. Orissa Rajasthan Rajasthan Orissa6. Andhra Gujarat Maharashtra Maharashtra7. Gujarat Andhra Mysore Andhra8. Mysore Mysore Gujarat Mysore
OrissaW. BengalRajasthanPunjabAndhraGujaratMysore
PunjabW. BengalOrissaRajasthanGujaratAndhraMaharashtra
Maharashtra Mysore
Rho : HSB, OR ::r: .76 Rho : HSG, OR ~ .91
Rho : CB, OR .82 Rho : PCG, OR — .83
Rho : PCB, OR .64
It will be seen from the Rho values that the over-all rank qrder of states is highly correlated with their rank in the different sub-groups, even though there are slight variations in the rank order positions from one subgroup of respondents to another.'*
3. WEIGHTED SCORES
A second major observation was that the rank order of states in the present form placed each state just one uniform step below the preceding state. These unit differences tended to totally ignore the quantitative
State Q. 40%
Successivedifference State Q. 54
%
Successivedifference
W. Bengal 80 — W. Bengal 55 — __Mysore 77 - :r 3 Andhra 37 rr: 18Orissa 73 r:: 4 Maharashtra 20 17Punjab 70 — 3 Punjab 18 zz: 2Maharashtra 61 — 9 Gujarat 17 = 1Gujarat 54 — 7 Mysore 15 — 20Andhra 51 3 Orissa 15 ~ 0Rajasthan 45 = : 6 Rajasthan 15 — 0
Range 35 9 40 20
The statistical analysis for the major group of college teachers, however, revealed that there was an inverse rank order correlation between the college men and the women teachers, and between the college women teachers and professional college men teachers. In the case of college men teachers and professional college men teachers, the correlation was insignificant. Hence, the procedure discussed in this section pertains only to the major group of students.
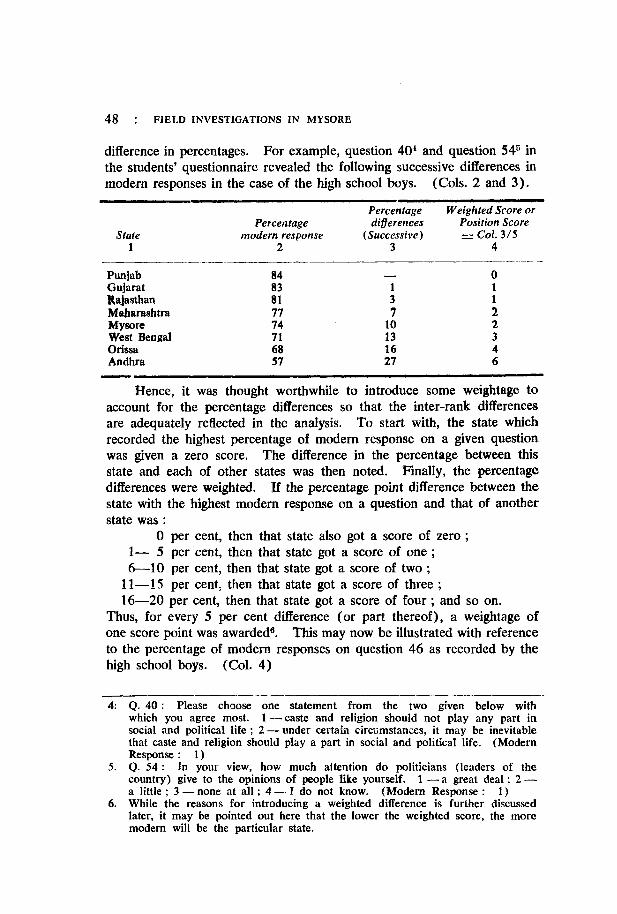
3 4
. 01 13 17 2
10 213 316 427 6
difference in percentages. For example, question 40 and question 54 in the students’ questionnaire revealed the following successive differences in modem responses in the case of the high school boys. (Cols. 2 and 3).
Percentage Weighted Score or Percentage differences Position Score
State modern response {Successive) — Col. 3/51 2
Punjab 84Gujarat 83Rajasthan 81Maharashtra 77Mysore 74West Bengal 71Orissa 68Andhra 57
Hence, it was thought worthwhile to introduce some weightage to account for the percentage differences so that the inter-rank differencesare adequately reflected in the analysis. To start with, the state whichrecorded the highest percentage of modem response on a given question was given a zero score. The difference in the percentage between thisstate and each of other states was then noted. Finally, the percentagedifferences were weighted. If the percentage point difference between the state with the highest modern response on a question and that of another state was :
0 per cent, then that state also got a score of zero ;1— 5 per cent, then that state got a score of one;6—10 per cent, then that state got a score of two ;
11— 15 per cent, then that state got a score of three ;16—20 per cent, then that state got a score of four ; and so on.
Thus, for every 5 per cent difference (or part thereof), a weightage of one score point was awarded®. This may now be illustrated with reference to the percentage of modem responses on question 46 as recorded by the high school boys. (Col. 4)
4: Q. 40 : Please choose one statement from the two given below withwhich you agree most. 1 — caste and religion should not play any part insocial and political life ; 2 — under certain circumstances, it may be inevitablethat caste and religion should play a part in social and political life. (Modern Response : 1)
5. Q. 54 : In your view, how much attention do politicians (leaders of thecountry) give to the opinions of people like yourself. 1 — a great d ea l; 2 — a little ; 3 — none at a l l ; 4 — I do not know. (Modem Response : 1)
6. While the reasons for introducing a weighted difference is further discussed later, it may be pointed out here that the lower the weighted score, the more modem will be Ae particular state.

The basic rank order of states does not change as a result of the introduction of the weighted position scores.
4. POSITION SCORES AND TOTAL POSITION SCORES
Having computed the weighted scores, the next step was to consolidate the answers of the respondents to all the 12 questions by cumulatively adding up these essentially cardinal numbers to arrive at the overall weighted position scores. This was done and is illustrated below for question 61, for all the five sub-respondent groups.
States
HSB CB
Position Scores
PCB HSC CG
Total Position Scores
OverallRank
Andhra 6 3 2 6 4 21 6W. Bengal 6 4 3 5 6 24 7Gujarat 4 3 2 3 3 15 4Maharashtra 5 4 2 5 3 19 5
Mysore 8 5 3 8 7 31 8Orissa 3 2 2 3 4 14 3Punjab 0 0 0 0 2 2 IRajasthan 1 2 1 3 0 7 2
Applying this procedure to all the 12 questions the following Gross Position Scores were obtained for each state on all the questions and all the respondent groups.
T o ta l P o sit io n Sc o r e s o n Q u e s t io n s
States
40 41 53 63 64
Question Numbers
46 61 54 59 52 58 55S § 8O
g 44 « § o ft;
Andhra 19 8 18 13 23 29 21 22 16 14 14 15 212 6W. Bengal 7 5 20 2 11 11 24 2 19 5 3 5 114 1Gujarat 27 29 15 3 30 5 15 31 17 11 9 16 208 5Maharashtra 19 21 20 5 23 13 19 31 26 12 18 9 216 7Mysore 5 16 25 9 23 17 31 34 21 21 24 10 236 8Orissa 8 5 12 8 11 16 14 27 11 23 4 11 150 3Punjab 11 9 11 5 8 7 2 31 15 2 21 4 126 2Rajasthan 30 23 16 9 11 4 7 33 6 9 16 2 166 4

A question that may arise at this point is does the fact of cumulating the position scores on each question to arrive at a consolidated score tend to significantly change the rank order of the states. To answer this question the rankings of the states on all questions were compared with then: rankings based on the individual questions and the following rank order correlations were derived.
Q.No. Rho. Correlation Q .N o. Rho. Correlation
40 55 61 4641 63
0.090,410.450.450.460.50
5954585253 64
0.500.540.580.600.610.64
If the minimum level of acceptance is set at a rho value of 0.40, as is usually done in sociological research, then it will be seen that the rank order of states is seriously disturbed only in respect of question 40. Hence, this question was excluded from the further analysis of the group of questions.
5. IMPLICATIONS OF SCORES
A question that needs to be answered at this point is : What are the implications of the low and high scores and the differences in scores ? Ideally, the weighted score of the most modem group of respondents should be zero, because it would have scored 100 per cent on each of thequestions. The traditional end of the spectrum would consist of thegroup that scored zero per cent on the questions and, therefore, obtained a cumulative weighted score of 1200. In this particular study, one has to remember that the scoring was based on the highest percentage obtained by a state on a given question. Thus, if a given state was placed highest on the rank order by virtue of having obtained the highest percentage forall the questions, then its gross position score would be zero. On theother hand, a state which was consistently at the bottom of the ranking could, theoretically, have scored zero percentage on each question. Applying this to all the 12 questions the theoretical gross position score of the lowest ranked state would be 715. As it turned out, while the hypothetical range of cumulative weighted scores could be over 700, in actuality it was only 110 score points.
In practice, a low score would imply a tendency towards modernization, and a high score would imply a tendency to be less modem, rather than more traditional. This distinction must be made because the state which has the highest score of 236 is located at the one-third position of

the modern-traditional spectrum (0 to 715). Hence, it would be improper to classify this state as being traditional. At the same time, the state with the lowest score of 120 is at the 17th percentage point of the spectrum.
It follows from the preceding discussion that it would not be correct to conclude that the eighth ranked state is quantitatively half as modern as the first ranked state. (236 versus 120, and 33rd position versus 17th position on the spectmm). Such an inference is untenable for two reasons. Firstly, the basic idea of this weighted score is not to convert the ranking into quantitative measures. Secondly, at best, it provides a rough quantitative measure with the additional intention to differentiate among the qualitative ‘small’, ‘medium’, ‘large’, ‘very large’ differences. The weight- age was introduced only to reduce the bias in deciding what was ‘large’, or ‘small’ and not to decide the exact quantitative differences between these concepts. Therefore, the differences should be qualitatively Interpreted. One can only say that Mysore is further away from the ‘modern extremity’ than Bengal. To be more exact, one may say that the final scores entitle one to conclude that the students in different states can be classified into the following sub-divisions (A, B, C & D) on the basis of data for that respondent group. (Ref. Chapter 111)A. Bengal, PunjabB. Orissa and RajasthanC. Gujarat, Andhra and MaharashtraD. Mysore
For reasons explained earlier at footnote 3 of this chapter no such ranking was attempted in the case of respondent groups other than students.
6. THE SCALE
These facts regarding the gross position scores and the rank order gave rise to the problem of reconciling two seemingly inconsistent findings. At the individual level, there is a lack of consistency between the responses to one question and the responses to other complementary questions. On the other hand, there is a high degree of consistency in the rank order of states in terms of the collective answers of respondents to the different questions. Thus, one has to reconcile the individual inter-question inconsistency with consistency in the rank order of the states.
Since the individual questions did not help to divide the respondents consistently into traditional and modem, one had to consider the possibility that the individual questions did not have the equal value in determining modernism, but represented different degrees of it. If this were so, then the modem respondents would be those who recorded modem responses to all the 11 questions (question 40 being excluded) and

the most traditional would be those who did not record modem responses to any of the 11 questions. In between, would be those who were relatively more or less modem, depending on the number of questions which were answered with modem responses. If this conjecture is correct, then the questions would have to be arranged in a certain sequence and each of the respondents would have to be compared with this sequence to determine his or her position in the modern traditional spectmm.
In fact a pemsal of the responses to the different questions did reveal that the questions could be ordered according to the percentage giving the modem response to the different questions. This is best illustrated by the data pertaining to the percentage of high school boys recording modem responses to each of the 11 questions.
Q .N oPercentage of
Modern Responses Q .No.Percentage o f
Modern Responses
55 90 41 5163 84 53 5152 78 61 2946 75 59 2458 69 54 2264 60
Except for slight differences in the percentage values, the trend given above remained/almost the same for the other four sub-groups of students as well.
In order to test the contention that the questions did in fact operate to differentiate the respondents at different points in the modem-traditional spectrum, the responses of each of the Punjab high school boys was scrutinised for successivc questions in the sequence (or stream) given above.
The outcome of this is given below ;Q .No. Raw Percentage Percentage in stream Percentage difference
1 2 3 4
55 98 97 163 85 82 352 89 73 3646 84 38 4658 42 30 1264 75 26 4941 52 12 4053 72 9 6361 49 7 4259 31 3 2854 18 3 15

According to the above table, the findings are contrary to expectations. The number of respondents who flowed back into the stream (after leaving it at an earlier question) was quite large. One explanation for this would be that the questions have very different rank order positions for the same group of sub-respondents in the different states. This is, however, not entirely true (rho rank order between all high school boys and Punjab high school boys is 0.91). Yet, a perusal of column 2 above reveals that questions 58 and 41 in particular are not in the correct sequence.
The possible explanation tor this irregularity would be that the questions, as a group, cannot really discriminate at the level of the individual respondents but can differentiate at the macro-level of groups of respondents. Our study undertakes only the latter type of analysis and therefore the irregularity noticed above does not invalidate our analysis.
7. SOME ISSUES
It would now be useful to consider a few major issues related to the analytical procedures described above.(a) Why weighted position scores : Basically, ranks are ordinal numbers. When the rank orders, based on a series of questions, are manipulated we deal with them as cardinals of ordinary arithmetic, and these individual rank order positions can be cumulatively added together. The numerical processes associated with ranking are essentially those of counting, not of measurement, i.e., they measure qualitative and not quantitative differences. Thus, while the quantitative point by point differences are not actually measured, one may still be interested in retaining to a degree a partial quantitative component by means of weighted scores, which in turn get converted into ranks. The unweighted rank is a less accurate way of ordering relations between the variables. It is less accurate because it does not reveal how close the various categories (states in this case) are on the spectrum. The introduction of weighted scores improves this situation to a large degree though it is still not accurate. Although the weighted score does not attain the status of a quantitative measure, it provides some indication of the quantitative differences and functions as a possible substitute for measurement. This saves time and obviates the problems of setting up an objective scale of the various quantitative measures.
A supplementary question here is : would it make any difference to the results if the weightage was based on a percentage difference larger or smaller than 5 per cent. The answer is obviously in the negative. No doubt, a smaller percentage differential weightage will yield a higher consolidated cumulative score. But it will not change the relative positions

of the states on the spectrum. However, in arriving at this weightage it would be useful to bear in mind th a t:
(i) in nearly all sociological research the information collected is not totally accurate. Hence, in the selection of the weightage, one should not attempt to be more exact than the data. For example, using difference of 0.5 per cent or even one per cent as the unit would tend to invest the data with an artificial accuracy of findings ;(ii) if the range of percentage differences for the vast majority of the questions in a group is very small, then it may not be necessary to have weighted scores. However, if at least half the questions reveal ranges around half the highest value, then it would be worthwhile having weighted scores.
(b) Preconditions: The most obvious precondition of the procedure isthat each question in the group of questions should have only a dichoto- mous response. Alternately, if there are more than two responses, these must be capable of being re-grouped to yield a dichotomy. For the purpose of proceeding with the rank ordering, only one of the two responses should be selected and the responses so selected should measure the same aspects of the area being explored. To illustrate, two questions put to the students were regarding the educational and occupational background of the respondents’ fathers. The responses on education could be classified as low education level, medium and high education level. Similarly, the occupations can be classified as low, medium and high. In attempting to combine these two questions it would first be necessary to consider only one response to each question. Equally important they must measure one aspect of the background. Thus, low education and low occupation categories or high education and high occupation categories may be selected and combined.
The second precondition is that the questions, which are pooled together, explore a common area. Though, in an arbitrary way any questions in a given questionnaire can be brought together to compute a weighted cumulative score, the final scores would not be amenable to interpretation if the different questions refer to different unrelated variables.
Thirdly, the number of respondents who form the sample of the study should not be small. Since the stability of the percentage is highly influenced by the total number of respondents on which it is based, one should be careful about this. It is also for this reason that this procedure has not been utilised in analysing the data pertaining to college teachers, and heads of institutions.(c) Merits and demerits: The main advantage of the weighted cumulative position scores is that it is fairly easy to compute and is amenable to rank ordering. This would be particularly so in situations where the
analyst is interested, not in inter-respondent, but in the inter-group differentials.
A furttier advantage of this procedure is that it can be most effectively applied to data which cannot be cross tabulated. The procedure as enumerated has the same effect as that of cross tabulation and it lends itself to quite sophisticated statistical analysis, particularly correlations.
Its major limitation, as briefly pointed out earlier, is that it cannot be effectively used in studies with small sample sizes. The reasons for this are not very different from the reasons applicable to the computation of percentages based on small base numbers (say 50 or less). A second major shortcoming of this procedure is that it is useful only in dealing with the nominal responses. If the responses are initially in the form of ordinal or interval scales, then this procedure has no special utility. It would be far better to use other modes of the statistical analysis.(d) Extension of the procedure : So far we have focussed attention only on the methodology for a particular group of questions. It would be useful to discuss the applicability of this procedure to other interview questions which, in the initial stages of the study, are not intended to form a composite group of questions to measure the same variable. Basically, one can see no reason why the procedure cannot be applied to other questions. The only precondition here is that it must be theoretically valid to group together diverse questions. For example, in trying to measure a respondent’s socio-economic background it is usual, in sociological studies, to determine the educational, occupational and economic level of the respondent’s father and his grandfather and compare these levels with his own situation. Since each of these items measure the same variable, viz. the socio-eeono- mic background, one could conveniently group responses to the questions to develop cumulative socio-economic position scores for respondent groups.

EDUCATIONAL FACILITIES IN MYSORE
S e c t io n I— E a r ly E d u c a t io n Sy s t e m s
1. THE BRAHMANIC SYSTEM
To start with, the early system of educatioa in Mysore, as elsewhere in India, is believed to have been the Brahmanic system of education. This system was closely connected with religion and ritualism. Special schools of vedic learning were started to train young brahmins. The te^hing was entirely oral. The course of studies was not confined only to reli^on. In addition to the Vedas, grammar, mathematics, logic, ethics, etymology^ warfare, astronomy etc. were taught. Further, dancing, singing, playing and other fine arts were also part of the curriculum.
Education which was confined to the brahmins extended to two other classes, viz., the kshatriyas and the vaishyas. They too came into the fold of the “twice-bom.” But they were given training in their respective vocations in life. The system of teaching was individual, each pupil being taught separately.
The education of kshatriyas appears to have been somewhat different from that of brahmins. It was one suited to their future vocation. Still some knowledge of the Veda and Upanishads was considered necessary. Gautama, for instance, states that the king shall be “fully instructed in the three-fold sacred science and in logic”. He adds that the administration of justice shall be by the Veda, the dharmasastras, the six angas, and the purana. This shows that the chief aims of education in the case of kshatriyas in early times were the study of Vedas, military skill and high moral conduct. Even in Arthashastra the development of education of the kshatriyas during the Mauryan times is pointed out. The author of Arthashastra has amply spoken about the greater attention paid to the equipping of royal princes for their onerous duties. According to Kautilya the kshatriya education included Sankhya, Yoga and Lokayata philosophy, the triple Vedas, vrata i.e. agriculture, cattle breeding and trade, and Dandaniti (Science of Government). Kautilya says that “Science shall be studied, and their precepts strictly observed under the authority of specialist teachers”. Theory was not dispensed with, practice and the realities of actual life were not forgotten.
The education of the vaishyas was not neglected in the brahmanic system. As in the case of the kshatriyas, so in that of the vaishyas the

vedic course was less exacting, since a greater emphasis was laid on their learning for their future vocations. The education of the vatshyas apart from the veda, was more domestic than otherwise. In later days, special trade schools came to exist at different centres, towards the maintenance of which the trades of each locality contributed from their profits.
Originally, the caste-system with its many disadvantages helped to keep up the standard of work, and the dexterity and skill of each particular trade was handed down from father to son. The system of education then was only a domestic one, entirely vocational. The literary side was defective, and though religious education was not altogether neglected, his knowledge was scrappy.
Women’s education in Mysore State was entirely domestic and vocational Although women are said to have enjoyed a higher status in earlier times, by the time of Manu they had lost their high position. The daughters of kings and wealthy persons might have received some education from their fathers or family priests, as some of the evidence shows. In the 10th century A.D. the Kannada poet Nagavarma addresses verses of his Eppandombudhi, a work on prosody, to his wife. An ancient inscription in the Kolar District records the death of the learned Savinemma, daughter of Nagarajannayya.
2. THE JAINA SYSTEM
Mysore State being one of the chief centres of Jainism in India it is necessary to make a passing reference to the educational system of the Jains. Their system is entirely based on the brahmanic model. Learning is given an exalted position in this system. Religious instructions as a necessity demanded particular attention. But the Jains pursued the secular pursuits and popularised the secular education to a large extent. Their literature bears ample evidence for this view. That apart, the Jaina Sutras lay down that religious instruction is of the requisites to reach beatitude.
3. THE BUDDHIST SYSTEM
The Buddhist system, like the Jain, was largely an adaptation of the brahmanic. The need for education was keenly felt among Buddhists as they had to provide for the training of novices. The monasteries that came to exist in course of time took up their training and from it a system of secular instruction also developed. An education that fostered the idea of employment in “practical government” should have been secular to some extent. Moreover, in those days, the division of secular and religious education was not apparently so weU marked as in modem days.

All education was up to a degree religious and then it branched off into secular channels.
4. MUSLIM EDUCATION
During the reign of Muslim kings in Mysore during 1761-1799, education received considerable attention, specially at the hands of Tippu Sultan. Hyder Ali, father of Tippu could not write his own name, but he had an excellent memory. Tippu built a mosque in every town, and appointed a meryzin, a moula and a kazi to each, and promoted the education and learning of the muslims to the utmost extent of his power. But Tippu was a mere pedant and an innovator and not a true reformer.
Education was imparted to Muslim women as among the Hindus also. Seclusion did not always prove a bar to girls attending schools. Some of the ladies of the higher classes were educated in Persian and Arabic.
The education imparted in the ‘madresahs’ was not uniform, and varied from place to place. The ordinary courses included grammar, logic and law, external observances and fundamental doctrines of Islam, astronomy and metaphysics.
5. THE MODERN SYSTEM
Modern education in Mysore can be said to have begun from 1830 onwards. In 1833 Krishnaraja Vodeyar III, the Maharaja of the state, established a free English School at Mysore at his own cost. The goverimient were also aiding missionary bodies in establishing schools. There v/ere two schools at Bangalore of a special character supported by the government.
The part played by the European missionaries was great. Between 1840 and 1854, the Wesleyan mission established schools at some of the district headquarters with the aid of government. One such institution was established in 1851 at Bangalore.
Until the famous Halifax Despatch of 1854 was framed, there was no organized “system” of education in the State although the Maharaja Krishnaraja Vodeyar II had established a school at his own cost, and the government were aiding missionary bodies in establishing schools, as already mentioned.
When the provisions of the Despatch of 1854 had to be applied to Mysore, Mr. Devereux, Judicial Commissioner, drew up a scheme of education for Mysore and Coorg jointly. In it he provided for an establishment of officers to man the scheme. According to Devereux scheme, there were to be a Director of Public Instruction, two Inspectors, four

Deputy Inspectors, and twenty Sub-Deputy Inspectors, having on an average four taluks and the higher officers in proportion. Provision was made in the scheme about the number of schools to be established and the funds to be made available, etc. Thereafter the Indian Educational Institution of the Wesleyan Mission was at first aided with a large grant as filling the place of a central institution, but soon after the scheme was sanctioned, it ceased to be the central institution.
In 1858, the government established a High School in Bangalore, affiliated to the Madras University. In 1861, a normal school was established at Bangalore and the next year saw the opening of an Engineering school. Between 1859 and 1865 about eighteen Kannada government schools and thirty grant-in-aid schools were opened. They cost a sum of 1.25 lakh rupees, which was mentioned by the government of India for annual expenditure on education in the State.
The year 1868 was significant in the history of education in Mysore. The scheme for the establishment of Hobli schools proposed by Mr. Rice was sanctioned to bring education within the reach of the mass of people. According to this scheme, a school was to be sanctioned for every Hobli where the people desired to have a school and in earnest of their desire agreed to provide a school-house. The cost was to be met from a nominal cess levied on the land revenue, and education was to be free. The schools were governed by the committees of the local people.
The situation at the end of 1871-72 was very satisfactory. All the hoblis except 39, had schools. Each taluk had a superior vernacular school. There were eleven district schools and five high schools. The grant-in-aid schools showed an increase of 14 in one year, there being90 such schools. On the whole, the total number of institutions in this period was 693 and of students 24,201. The total expenditure on education during the year was Rs. 3,27,621—more than double the amount provided in the previous scheme of Mr. Devereux. The departmental report of the Director of Public Instruction runs as follows :—-“On comparing the progress of education since this department was established with what has been done in other parts of India, it will, I think, be admitted that Mysore has not been behind hand in contributing to the general improvement throughout the empire, and that, while, in the higher cultivation of English, she has attamed an honourable position, the promotion of instruction in the vernaculars has received particular notice and attention.” Yet taking all the institutions together, the percentage at school was 1 in 99 of the population.
The history of education from 1873 to 1881, is a record of steady progress. The Bangalore High School was called the Central College from 1875 and affiliated to the Madras University as a first college. The Raja’s School at Mysore and the Shimoga District School were made

“High Schools.” Besides, four schools were training students for the University Entrance standard.
In 1875, a School of Engineering and Natural Science, afflhated to the University and preparing candidates for its degrees was established, but it was reduced to a lower grade in 1880. The famine of 1877 hindered the progress, and almost all the aided schools were abolished.
The state of education at the time of the restoration of the hereditary dynasty showed appreciable progress. There were 2,087 schools,—899 government, 188 aided and 1000 un-aided.
The number of government and aided schools classified according to grade, is shown below :
Grade No. of SchoolsUniversity grade Secondary grade Primary grade Special
Total
4166907
___10
1,087
The total expenditure was Rs. 3,91,028, of which only Rs. 1,58,423 was met from State revenues, the remainder being defrayed from several sources like local and municipal funds, school fees and private sources.
S e c t io n II—D e v e l o p m e n t o f E d u c a t io n a t D if f e r e n t L e v e l s
1. PRIMARY EDUCATION
At the end of 1881, the State had roughly 907 primary schools and 38,296 pupils in them. Since then, there has been a steady rise in the number of institutions and the strength of the students.
During the year 1913, the Mysore Elementary Education Regulation V of 1913 for the introduction of compulsory education in selected centres of the State was passed. Compulsion was restricted to the ages between 7 and 11 years.
The tendency towards increase in the number of schools, both government and aided, increased from 4,512 in 1915-16 to 8,966 at the close of 1918-19. But at the close of 1921-22 there was an appreciable reduction in the total number of schools,—in 1916-17 there were 6,827 schools in 1921-22 there were 6,712.

This fall was chiefly due to the closure of a large number of aided and unaided schools, for want of financial resources, affected by adverse seasonal conditions and the economic depression due to the world war. The high cost of living due to economic depression compelled the parents to withdraw their children from schools to attend to their immediate wants at home.
In addition to elementary schools, government implemented a scheme to open Adult Schools intended for the education of artisans and labourers. Liberal grants from government led to the increase in the number of adult schools from 130 in 1914-15 to 2,671 at the end of 1918-19. But the schools were in a languishing condition and 50 per cent of them were closed in 1920-21. There were only 1,259 schools in 1921-22, as against 2,671 in 1918-19.
The spread of primary education among the people was largely taken up by grant-in-aid schools. In 1914 about 1,800 new aided schools were sanctioned. They were supervised by the School Committees in the villages, the Taluk Progress Committees and the District Committees of the Economic Conference. Besides grant-in-aid schools, indigenous schools also imparted elementary education with or without following the departmental curriculum.
2. SECONDARY EDUCATION
The term Secondary Education means teaching given in all classes above the primary grade. It terminates with the Secondary School Leaving Certificate (S.S.L.C.) Examination and as such includes all schools above the primary grade.
A large part of the secondary education in the State as well as education at other levels was carried on at the cost of government. A certain part was managed by Christian Missions and other private bodies.
The total number of high schools for boys at the close of 1921-22 was 18 of which 11 were government, 6 aided and 1 unaided. At the close of 1915-16, there were 6 Kannada high schools with a strength of 168. These schools were created to popularise modern knowledge through Kannada and to provide higher courses of instruction for the lower secondaiy Kannada students. But due to lack of a demand for the graduates from these schools, the schools were gradually abolished.
5. COLLEGIATE EDUCATION
Collegiate education was a distinctive feature in the State. In 1916- 17 the University of Mysore was inaugurated. The University first comprised of the Maharaja’s College at Mysore and the Central College at

Bangalore. In 1928-29 there were five constituent colleges—the Maharaja’s College and the Maharani’s College for Arts at Mysore • the Medical College at Mysore; Central College for Science, and the Engineering College at Bangalore.
The University was state-supported. It had also an income from fees and endowments.
4. SPECIAL SCHOOLS FOR BLIND, DEAF, ETC
Before Independence, there were two government institutions for the handicapped—one at Mysore and another at Hubli. There has been no increase in the number of these institutions although their enrolment has slightly increased from 120 in 1947-48 to 200 in 1959-60. The school at Mysore has its own Braile Press where printing is done by the blind boys.
5. INSTITUTIONS FOR TRIBALS, SCHEDULED CASTES ANDWOMEN
The State Government has a separate Directorate of Social Welfare which is entrusted with the work of safeguarding the interests of socially down-trodden sections of the community. With the object of promoting better life among tribals, scheduled castes and women, the government have started various types of institutions through the Department of Social Welfare.
During the Third Five Year Plan period about 177 hostels were started for the benefit of boys belonging to Backward Classes. Eighteen hostels were started for “Denotified Tribes” in seven districts in. the State— five at Dharwar, four at Belgaum, three at Bijapur, one at Gul- barga, two at Raichur, nine at Bidar and one at North Kanara. Thirteen hostels were opened for ‘Other Backward Classes’ in ten districts—three in Mysore, one each in Bangalore, Bidar, Bijapur, South Kanara, Raichur, Mandya, Shimoga and Dharwar districts, and two in Kolar district. There were four government hostels for backward class boys—one each in Mysore and South Kanara Districts and two in Coorg district.
Further, to provide accommodation for the scheduled caste students studying in technical courses the Government opened 10 hostels in ten important educational centres—Bangalore, Bellary, Belgaum, Bidar, Chikkamagalur, Davangere, Gulbarga, Hubli, Mysore and Tumkur.
For the welfare of needy women the State has opened about 285 welfare centres. In these centres women are trained in various crafts including tailoring, embroidery, etc. Thus, Bangalore District (including urban and rural) has twenty-nine such welfare centres ; Mysore thirty ;

Mandya thirteen ; Bellary twelve ; Kolar twenty-two ; Tumkur nineteen ; Shimoga thirteen ; ChikJcamagalur eleven ; Chitradurga sixteen ; Hassan thirteen ; Coorg six ; South Kanara thirteen, Bidar eleven ; Raichur ten ; Gulbarga thirteen ; Dharwar fourteen ; Belgaum fourteen ; Bijapur fifteen ; North Kanara ten.
Besides these 285 welfare centres for women there were eighteen other centres specially meant for women of scheduled tribes, and seven for the benefit of nomadic tribes.
Besides running hostels, and welfare centres for students of scheduled castes and for women, the government ot Mysore has also opened ashrams or residential schools for scheduled castes and scheduled tribes children in the age group of 6-11 years. The children are taught and fed in the hostels attached to the schools. There are 107 schools with over 4,375 students studying in these schools. This would enable the children of scheduled castes to pursue their studies without depending upon the financial support from their families.
6. COLLEGES— TECHNICAL AND NON-TECHNICAL
In 1947-48, there were 23 colleges in the State under the controlof the Mysore University. In 1960-61 there were 58. Besides, thenumber of students studying in the college rose from 8,312 in 1947-48 to 33,121 in 1959-60.
After State reorganization, the Karnatak University came to theMysore State. It was started in 1949 and had only 12 colleges to startwith. In 1961 it had 30 affiliated and 2 constituent colleges. The strength of students in affiliated colleges rose from about 3,000 in 1949 to 12,547 in 1960.
Besides, these two Universities, the State has established two more universities recently—Bangalore University and the Agricultural Science University. With a view to make the Universities free from the responsibilities of administration of under-graduate colleges and able to concentrate on research, the Government of Mysore has transferred the control of colleges to a separate Directorate for Collegiate Education.
The Government of Mysore had started a number of technical institutions in the pre-independence period. A separate Directorate of Technical Education was set up in 1959. Before 1947, there were only 3 engineering colleges and 2 polytechnics. In 1956 there were 6 engineering colleges and 14 polytechnics. In 1960-61 the number of engineering colleges rose to 10 and that of polytechnics to 29, including two for women. The all-India target of having at least one polytechnic in each district has already been achieved in Mysore.

7. TECHNICAL AND PROFESSIONAL EDUCATION
The development of technical and professional education has made commendable progress. Out of the 148 colleges, 19.54 per cent or 25 are technical and professional colleges. The number of engineering colleges has increased from 10 to 15 during the five years from 1960 to 1965. The opening of Mahiad College of Engmeering at Hassan, the Regional College of Engineering at Suratkal in South Kanara, Jayachamarajendra College of Engineering at Mysore, Siddaganga College of En^eering at Tumkur, and the En^aeering College at Gulbarga during the course of 5 years has given an added impetus to the growth of technical education in the state.
On the other hand the opening of new Medical Colleges in the State is quite commendable. During 1960-65 remarkable progress was achieved, for instance, by opening a Dental College at Bangalore, besides one college each at Belgaum, Gulbarga and Bangalore.
As the number of technical and professional colleges is increasing, facilities are also provided for higher training and research in engineering and medicine. Post-graduate courses are offered at the Indian Institute of Science, Bangalore, for technical graduates ; and for the medical graduates at Mysore and Bangalore Medical Colleges.
To provide opportunities for technical education at the lower level, the state has established about thirty-one polytechnics and engineering schools. The opening of the Women’s Polytechnic at Bangalore and Hubli, the two industrial centres in the state, is a novelty in the education of women. Most students desire admission into engineering and medical courses. Of the total number of college-going students about 13.18 per cent are studying in the engineering colleges. The number of students is 7.933, including 20 girls, and the number of teachers is 655. On the other hand the percentage of pupils in the medical colleges is 7.56 of the total college-going students-—4,549 students—boys 3,807, girls 742. The number of teachers is 474.
The need for special education in Fine Arts and Music was also felt by the State Government. The idea to open institutions for the above purpose was mooted in 1962 and materialized during 1964-65 with the opening of the School of Arts and Crafts at Davangere and a College of Music and Dance at Mysore.
Further, to provide educational facilities at the college level to many aspirants working in various offices, evening colleges have been started from this year, one at Bangalore and two at Mysore. Courses in Arts and Commerce have been introduced at pre-university and degree levels in these colleges.

S e c t io n 111 — O t h e r E d u c a t io n a i, F a c ilities in t h e St a t e
1. INSTITUTIONS IN THE STATE FOR TRAINING TEACHERS
The need for trained teachers to teach at primary and secondary school stages has been given priority in the education system. The period of training for the teachers is one year during which they are given intensive training. Recently the government has mooted the idea of extending the duration of training from one year to two years.
During 1964-65 there were 75 teachers' training institutions. Out of these 47 were of the basic type and 28 were non-basic. The total number of primary teachers trained during 1964-65 were 41,148 men and 10,914 women as against 29,075 men and 5,745 women untrained teachers. Thus of the total 86,882 primary teachers 52,062 or 59.92 per cent were trained and 34,820 or 40.08 per cent were untrained.
In the primary schools, the teacher-student ratio is 1 : 40.In the secondary schools also, the teachers are deputed to undergo
training of one year. In 1964-65 there were 15 teachers’ training colleges in the state. The newly started Regional College of Education gives intensive training in the methods of teaching. Of the fifteen colleges the Regional College of Education is sponsored by the Central Government. The four government colleges are in Mysore, Mangalore, Gulbarga and Belgaum. The University College of Education is in Dharwar. Seven colleges are aided : Teachers’ College, Bangalore, M.E.S. Teachers’ College, Bangalore, Vijaya Teachers’ College, Bangalore, Institute of Education, Mysore, St. Ann’s Training College, Mangalore, Regional Institute of English, Bangalore. Three colleges are unaided : National College of Education, Shimoga, Sharada Vilas Teachers’ College, Mysore, and Kothurswamy College of Education in Bellary.
The number of teachers trained in the training colleges were 8,796 during 1964-65. Out of this 6,783 were men and 2,013 were women. The total number of teachers in secondary schools is 14,845. Out of this, 8,796 or 59.26 per cent were trained and 6,049 or 40.74 per cent were untrained. The teacher-student ratio in the secondary school is 1 : 27.
2. RESIDENTIAL FACILITIES AVAILABLE FOR STUDENTS
In order to pjjpvide facilities for boarding and lodging to students from outside the places of their education several educational institutions have opened hostels for needy students. Among the secondary schools very few had hostel accommodation. Only 93 schools on the whole had this facility. They are distributed in about 15 districts in the state. In Bangalore district four schools had hostel facilities, in Tumkur three,

in Mysore thirteen, in Mandya one, Coorg had six, South Kanara had thirteen, Chitradurga three, Bidar three, Bellary seven, Gulbarga eight, Raichur five, Bijapur seven, Belgaum five, Dharwar six, and North Kanara had eight schools having residential accommodation for students. Compared to the total number of 1,331 secondary schools, the number of schools having hostels is very small. But the need for such facilities is not very great as schools are now established in the interior parts of the state. As a result students in the nearby areas can manage to go to school daily and return to their place by evening.
On the other hand the hostel facilities are necessary in colleges, since students come from distant places for higher studies. In the colleges under the Mysore University jurisdiction about 37 colleges had hostel facilities during 1961-62. The number of colleges having hostel facilities at present are 44. In all there were thirty-five hostels meant for boys and nine for girls. The number of boys and girls residing in college hostels was 3,542 and 764 respectively. In addition to the two college hostelsj (one at Mysore and the other at Bangalore) the Mysore University also maintained two hostels for depressed class students, one in Mysore and the other in Bangalore. The University spent Rs. 31,027 for the maintenance of these depressed class hostels, the expenditure being in the form of a boarding grant of Rs. 12 per month per boarder, establishment charges and rent for the building. Doctors are also appointed on a part-time basis to look after the health of the boarders.
In addition, seven colleges have opened free canteens where mid-day tiffin is served to needy students. The Mysore University had spent a sum of Rs. 12,500 by way of grants for running free canteens.
Axmong the colleges having hostel accommodation all the medical colleges had hostel facilities. Nine engineering colleges and fourteen polytechnics had hostel facilities besides other colleges. The idea of having residential institutions needs consideration.
In the colleges affiliated to Karnataka University out of fifty-three colleges thirty-seven colleges have residential facilities. Most of the colleges which have been recently started do not have hostel facilities and students stay in rented rooms.
S e c t io n IV — M e d iu m o f In s t r u c t io n
Although Kannada is the principal language and flie mother tongue of a majority of the population in Mysore state it is spoken by only 62 per cent of the total population. Besides there are about sixteen other languages viz., Telugu, Tamil, Marathi, Urdu, Tulu, Konkani etc., spoken by minor groups who form a total of 38 per cent. The privileges of the

minorities are safeguarded in the field of education also. With a view to giving them scope to learn in their respective mother tongues, the state government has made a provision to introduce different media of instruction according to the needs of the minorities all over the state. In the Bombay-Kamataka area where Marathi is widely spoken, Marathi has been the medium of instruction in some schools. Similarly with Tamil, Telugu and Urdu,
Thus, in addition to Kannada and English, there are several schools in the state having other languages as the media of instruction in primary aud secondary schools such as Urdu, Tamil, Gujarati, Telugu, Malayalam, Hindi and Marathi.
Urdu is the medium of instruction in the largest number of non- Kannada schools. As the Muslims form 8 per cent of the population in the state, their requirements matter. On the whole, Urdu was the medium of instruction in 2,436 primary schools and 140 secondary schools. Needless to say, a separate Inspectorate is in charge of Urdu schools, in districts where Urdu schools are in large number.
The next place in the number of non-Kannada schools goes to Marathi. As a result of re-organization of states in 1956 the border areas where Marathi was mainly spoken were merged with the old Mysore state. And to maintain their ‘status quo’ Marathi continues to be the medium of instruction. Presently, in 850 primary and 307 secondary schools Marathi is the medium of instruction.
Tamil schools have also increased in number in the border areas of Madras and Bangalore and even in the interior as a result of the larger number of Tamil immigrants. In 228 primary schools and one secondary school, Tamil is the medium of instruction.
Telugu is widely spoken in the districts of Kolar and Bellary. It is the medium of instruction in 83 primary and 27 secondary schools.
Malayalam has been introduced as the medium of instruction in the coastal areas and some parts of Coorg. It is the medium of instruction in nine primary schools.
Gujarati has been introduced as the medium of instruction at the primary level only. It is the medium of instruction in five primary schools, most of them in Bangalore.
English is the medium of instruction in thirty-nine primary schools. At the secondary stage it is a complementary medium.
Hindi is also introduced as the medium of instruction in fourteen primary schools and eleven secondary schools. Hindi is ako being taught as one of the languages in all schools at both primary and secondary stages.

2436 140850 307228 1
83 279 —5 —
14 11
TABLE III—1
S t a t e m e n t Sh o w in g t h e N u m b e r o f P r im a r y and S econdary
S c h o o l s h a v in g D if f e r e n t M edia o f I n s t r u c t io n o t h e r th a n
K annada and E n g l is h
Language Primary School Secondary School
Urdu Marathi Tamil Telugu Malayalam Gujarati Hindi
Though in primary and secondary schools various languages are being introduced as media to impart education, it has not been possible to implement the same policy in colleges also. English is the medium of instrution in all the colleges. Yet efforts were made to introduce Kannada, the mother tongue of the majority as the medium of instruction. It was introduced at the pre-university level to start with in several colleges in the state viz., Maharaja’s College, Mysore, Maharani’s College, Mysore, Yuvaraja’s College, Mysore, Government College, Mandya and Tumkur. But owing to lack of text-books in the regional language, and lack of eligible staff the programme has not registered much advance. However, there is a strong demand to make Kannada the medium of instruction in colleges too.
S e c t io n V — P o p u l a t io n D ist r ib u t io n a n d E d u c a t io n a l In s t it u t io n s
The population of the state has gradually increased from 1901 to 1961. In 1961 it was 2,35,47,081 with a density of 318 persons per square mile. About 22 per cent of the state’s population lives in about 288 cities/towns. The remaining 78 per cent live in villages which number 25,880. Hindus are the major community and comprise 90 per cent of the total population. The Muslims form about 8 per cent. Christians, Jains and others form 2 per cent. Among the Hindus, the Lingayats and the Vokkaligas are the dominant groups. The Scheduled Castes form 13 per cent of the total population, while the Scheduled Tribes form 0.8 per cent. The decade 1951 to 1961 has shown an increase of 21 per cent. Mysore state has 5 per cent of the total population and 6 per cent of the total area of India, and ranks sixth in area.

Kannada is the principal language and the mother tongue of 62 percent of the total population. It is the principal language in all districtsexcept Kolar where it is second to Telugu. There are about 16 other languages—Telugu, Tamil, Marathi, Urdu, Tulu, Konkani etc.,—spoken by minor groups making up a total of 38 per cent.
S e c tio n VI — D ist r ib u t io n o f E d u c a t io n a l In s t it u t io n s
The historical review of the growth of education has revealed how education gained rapid momentum after the state leoiganisation in 1956. The number of primary schools during the decade rose from 20,999 in 1956 to 30,539 at present (1967), marking an increase by one thousand every year. Of the total number of primary schools about 25,716 schools are in rural parts. This indicates the importance attached to the educational needs of people in the neglected rural areas. About 21,021 schools are managed by the government and the remaining 9,518 are managed by private bodies. However, in the districts of North Kanara, BeUary and former Bombay-Karnataka area, the non-government schools are mostly under board management.
The number of children in primary schools has also increased rapidly every year. In 1961-62 there were 33,28,118 and in 1964-65 their number had risen upto 35,40,328. From 1961-62 to 1964-65 there was an increase of 70,736 children every year.
In secondary education also the same tempo has been kept up. At the end of 1959-60 there were 707 schools with 2,18,200 pupils. In 1961-62 the number of schools rose upto 775 and that o pupils upto 2,54,256. During 1964-65 the number of schools was 1,331 with 403,031 pupils. The rise of secondary schools in rural areas has been significant as is revealed in the two-fold increase in the number of schools and pupils in the course of five years. The initiative taken by the Taluka Boards, which are autonomous bobies, is commendable. Of the 1,331 secondary schools, 600 schools are in rural areas and this shows that rural areas are not lagging behind in educational facilities.
TABLE I I l~ 2
St a t e m e n t S h o w in g t h e N u m b e r o f S eco n d a ry Sc h o o l s UNDER D if f e r e n t M a n a g em en ts in M ysore St a t e (1 9 6 4 -6 5 )
Government . . ,. 164Taluka Board/Distt, Board . 153Municipal . . . . 104Private Aided by public authority 586Un-aided . . . . 324
Total . . i;33i

In secondary education importance is also given to girls’ education. There were 180 schools meant exclusively for girls.
Besides opening secondary schools in important rural areas, government are also keen on converting secondary schools into higher secondary schools, and multipurpose schools. Though efforts are not lacking it has not been possible to evolve a uniform change-over. At present there are 50 (or 4 per cent) higher secondary schools and 61 (or 5 per cent) multipurpose high schools.
One remarkable aspect of the field of secondary education is that the state government has, in-spite of a heavy burden on its exchequer, resolved to give “free” secondary education to all children from the year 1967.
In the field of higher education many local bodies are showing considerable enthusiasm in setting up colleges. In 1960-61 there were fifty-eight colleges with more than thirty-three thousand students. And now the number of colleges has increased almost three-fold i.e. 148 colleges with 63,139 students.
The rapid increase in the number of colleges is due to the enthusiasm of educationists who form organisations for the cause of education. Mention may be made of a few such organisations in the state—^K.L.E. Society, with its headquarters at Belgaum, was started in 1906 by some young graduates inspired by the ideology of Bala Gangadhar Tilak. The Manipal Academy of Education with its headquarters at Manipal in South Kanara took its birth after independence. It has been a milestone in the history of education in Mysore in general, and South Kanara in particular. It has got about thirteen colleges which are spread over South Kanara District and Shimoga District. The following section shows the number and type of colleges managed by government and private organisations.
S e c t io n VII — T h e S p o n so r sh ip o f E d u c a t io n a l In s t it u t io n s
In T h e St a t e
The 148 colleges in the state managed by the government and private bodies are as follows :
1. General colleges (Arts and Science) 71— 15 Government and56 private
2. University colleges 53. Medical colleges 10—6 government and 4 private4. Engineering colleges 15—2 government and 13 private5. Commerce colleges 7—2 government and 5 private6. Law colleges 11— 1 government and 10 private

7. Veterinary college 1—government8. Agriculture colleges 2—government9. Education 16—5 government and 11 private
10. Physical education 1—government11. College of Technology 1—government12. Oriental vStudies for Sanskrit 6—2 government and 4 private13. Engineering schools 2— 1 government and 1 privateIn previous pages while describing the development of education in
Mysore state mention has been made of the role played by the government, municipal boards and Christian missionaries. The role of religious sects in former days and caste groups in recent days, however, needs to be mentioned.
The Jaina and Saiva centres of education grew up in the Bastis and Maths, spread all over Mysore. They devoted themselves more to popularise the religious centre in South India as a whole used to maintain a Sanskrit Pathashala. Notably, the Brahmins and Lingayats were in the forefront in opening and organising such institutions. This function was a mere continuation of the work done in the Buddhist tradition of the Lokutisa Kalamukh Sanskarite Monasteries. This tradition reached its zenith during the 14th century, when Veerasaiva literature flourished under the leadership of the heads of the monasteries. After the death of Basava and the civU war at Kalyana, the Lingayats migrated to various parts of Karnataka. Many centres of Veerasaiva activity were established after the establishment of Vijayanagara. One was established at Vidya- nagara under the patronage of some generals like Jakkanaraya and Lakkanna Dandesha. Another was near Kunigal, on the banks of Nagini river. Both these centres exerted powerful influence on the Veerasaiva community. Both undertook to train men and send them to other places to spread religion.
The Veerasaiva math not only trained men to spread the tenets of Veerasaivism, but it was also a place of learning, where the literature of the community was preserved. Mention is made below of a few notable maths which give the picture of the educational movement by the Linga- yat community.
In the Murugha math of Chitradurga the major portion of the money that is donated by the Swamiji (Head of the Math) is used for the cause of spreading education among poorer Lingayat students. A portion of the math’s income comes from the members of the Lingayat community. Although a larger portion of the amount is spent on the Lingayat community, the Swamiji has donated money to Adikamataka (Harijan) hostels, Muslim institutions and to the Pathological Laboratory attached to the Medical college at Mysore. His catholicity was highly praised by Sir Mirza Ismail, the ex-Dewan of Mysore.

Besides, some of the philanthropic work done by the Swamiji benefits members of various other communities. A primary school building was built at a cost of three thousand rupees at Chitradurga. A sum of Rs. 5,000/- was given to the District Library at Chitradyrga. A sura of one thousand rupees was given for the Adikarnataka hostel at Chitradurga. A sum of .fifteen thousand rupees was given to the First Grade College, Chitradurga to build a sports stadium. A sum of five thousand rupees was given to Dharwar Karnataka College. The Adhikamataka School at Haveri was given a sum of three thousand rupees. The High School at Mayakonda was given twenty thousand rupees and the Bagalkot Basave- swara College was given twenty-five thousand rupees. Recently the Swamiji gave 10 lakh rupees to the Medical College at Davangere, which is named after him.
Sri Siddaganga High School at Tumkur was started on 16th May, 1944. In order to help the needy students to pursue their studies Sri Siddaganga Training College was started in June, 1956. The strength of the college, to start with, was 130 which rose to 198 during 1957-58 and to 388 during 1958-59. In the year 1950 Sri Siddalingeswara Industrial School was started with twenty-five students and only a carpentry section. The strength increased to 60 during 1957-58. Sri Siddalingeswara Middle school was started during the year 1954 with the strength of 167 students. During 1958-59 the strength of the school was 228. In 1955 March, the Residential High school was started with 192 students. In 1958-59 it was 731. Out of them 634 students were residing in the Anathalaya. The students belonged to various castes and creeds. The Lingayats were 358, the Vokkaligas 177, three Adhikamatakas and eight Adidravida students, six Muslim students and two Lambani students.
The Siddalingeswara Sanskrit College and Veda Patashala which was started in 1917 was reorganised as a college from 1938. The Veda Patashala was amalgamated with the college from 1939. The Siddaganga Orphanage was started during the year 1918. It is the parent institution which fosters the various educational institutions of the Math. Free boarding and lodging are provided for all communities.
With the growing desire to spread secular education, the Lingayats founded the Karnataka Liberal Education society. Today the society is running 25 educational institutions, right from the nursery stage to the post-graduate level. The society’s institutions are also functioning in Bangalore and Maharashtra. It is needless to say that the society is organised by a religious sect (caste) which is dominant in Mysore state.
Like the Lingayats, the Brahmins also have sponsored various educational institutions to impart secular education. The Manipal Academy of Education in South Kanara is the pioneer organ to expedite the spread of education in that area. It was started in 1949 by a group of Saraswaty

Brahmins, who are big bankers. Today, the Academy has to its credit nearly 15 institutions. The Mahatma Gandhi Memorial College at Udipi, started in 1949 is the parent institution. It has got Science, Arts and Commerce courses both at P.U.C. and Degree levels. A fine library is maintained, and separate hostels for boys and girls are situated in the college premises. This college has been credited with a natural science museum, opened very recently. Similar colleges have been opened at Mulki, Karkala, Conndapur, Mudibidire and at Sringeri in Shimoga District. This college was opened in collaboration with the Sringeri Shankara Math. Apart from these general colleges, the Manipal Academy has a medical college, which has a very high reputation. The college is situated on the hilly area in Manipal and a new township has sprung up there. Added to this, the engineering college is also situated there. The government do not give any grant to this engineering college. The management levies the capitation fee on the students desirious of joining the college. Even seats are reserved well in advance for many years.
The Manipal Academy also runs a law college at Udipi and the college of education at Udipi. It is intended to open post-graduate courses so as to enable the students to execute their higher studies there itself.
While the Brahmins and Lingayats in their religious zeal propogated the spread of education from the early period, no reference is made to such work by the Vokkaligas the other dominant caste group in the state. In Mysore city a college of education is functioning at present. At Mandya an Engineering college was started about four years ago. More than education, the Vokkaligas are mainly confined to agriculture, government service, administration and political activities.
Thus, the dominant castes like Brahmins and Lingayats have showed much enthusiasm in the cause of education. The educational institutions started and managed by them are not at all restricted to their own caste group. They show universal catholicity by allowing others also to share the fruits of their effort in common.
S ec tio n V III — In d u st r ia l isa t io n A n d E d u c a t io n —T h e C a se O f B an g a lo re
Mysore state being geographically well situated is also richly endowed with geological wealth. The rich minerals, the natural resources which have been converted into energy to turn the wheels in the factory have given impetus to the growth of industries at a rapid pace, since independence.
For instance, in the year 1957-58 the total number of industries in the state was 1,670, out of which 195 were engineering factories, 326 textile factories and 133 chemical factories. During 1964-65, the total

number of factories rose to 1,837 out of which 215 were engineering factories as against 195 in 1957-58 ; 331 textile factories as against 326 in 1957-58 ; and 138 chemical factories as against 133 in 1957-58.
In the process of industrialisation the more specific problem is the recruitment and training of labour for industrial employment in agricultural countries like ours. The need for literacy and for various levels of technical skills in the course of industrialisation leads to a great emphasis on schools and other agencies of education.
Our study reveals that educational institutions are rapidly coming up in highly industrialised areas in the state. The starting a new factory in a place uninhabited before, creates a new township, where all the workers of the new factory live. The education of their children which is one of the welfare activities of the management makes it necessary for them to provide educational facilities through schools. And the process of industrialisation necessitates the spread of education, which in turn becomes a prerequisite for training for industrial recruitment at a later stage.
For instance, Bangalore city has been the centre of industrial development in Mysore since a very long time. It has various industrial satellites around, and the industrial tempo has been kept up in that particular district as well. Out of 19 districts in the state, Bangalore has about 524 factories and stands first. A majority of the big engineering factories are situated in Bangalore city only. This includes both private and public enterprises. The speedy growth of industrialisation has also given an impetus to the spread of educational institutions, which are necessary to meet the needs of the immigrants, who migrate from villages to seek “marginal jobs” in the factories.
In order to facilitate the growing number of members seeking education, there has been a rapid growth of educational institutions in Bangalore city. Out of the 30,539 primary schools. Bangalore city itself has 549 i.e. nearly 11 per cent primary schools. Of the 1,331 secondary schools, 118 are in Bangalore city. In the field of higher education also Bangalore city is again at the top with 44 colleges out of 175 colleges in the state.
Being a highly industrialised area, the need for training technical personnel has given rise to the establishment of institutions where technical education is imparted. Out of the 15 engineering colleges in the state, Bangalore city has got five engineering colleges. Besides, it has got a College of Technology, where textile technology is imparted. Further, Bangalore city has got four polytechnics and one Research Institute. The development of industries has given much scope for the development of educational institutions, where the young persons are trained and are recruited to put the theory into practice.

S e c t io n IX — Size O f T he S t u d e n t B ody
The size of the student body has considerably increased with the increase of educational institutions. In the year 1957-58 the number of students was 23,98,755, thus comprising about 11 per cent of the estimated population. In the year 1964-65 the number of students rose upto 40,25,666 showing an increase of 7 per cent during the course of seven years e.g. from 1957-58 to 1964-65. The percentage of the total student population from primary stage to the college stage is 17 in relation to the total population of the state. Eighty-dght per cent students weie in the primary schools, 10 per cent were in the secondary schools, 2 per cent were in college and 0.22 per cent were in the polytechnics.
Although the percentage of students in secondary, college and polytechnic stages is very meagre, there has been a considerable increase in the number of students in those stages. In 1961-62 the students in the secondary schools were 2,54,256 as against 4,03,031 in 1964-65. There has been an increase of about fifty thousand students every year during 1961-62 to 1964-65. Again in the colleges in 1961-62 there were 53,776 while in 1964-65 as we have already seen there was 73,139 which indicates an increase of nearly seven thousand students every year from 1961-62 to 1964-65.
The percentage of students in relation to the school and college age group has also considerably increased. At the end of the Second Plan period about 65 per cent of the children in the age group 6-11 were in schools. At the end of the Third Plan the percentage rose upto 82. The significant rise indicates the success of compulsory education at primary stage. The entke student body is 42 per cent of the school and college going age (i.e. between 6-24 years) in the population of the state.
S ec t io n X — T h e Sa m p l e
For purposes of investigation, 119 primary school teachers, 180 secondary school teachers, 94 non-professional college teachers and 31 professional college teachers were contacted. In addition the following persons were also contacted 28, 21, 11 and 6 heads respectively of primary, secondary school, non-professional and professional colleges, 189 parents of children studying in primary schools and 579 parents of children studying in secondary schools, 896 students studying in secondary schools, 639 in non-professional colleges and 362 students in professional colleges. The following table represents the number of persons contacted for purpose of investigation.
In all 1,897 students out of which 1200 are boys and 697 are girls, 424 teachers and 66 heads of institutions from 66 institutions (schools

and colleges) were contacted throughout the state. Students were asked 64 questions, parents 39 questions, college teachers 23 questions, school teachers 64 questions and heads of colleges 30 questions.
TABLE III—3Sh o w in g t h e N u m b e r o f P e r so n s C o n t a c t e d f o r P u r p o s e o f I n v est ig a tio n
1. Primary School2. Secondary School3. Non-professional
colleges4. Professional
collegesTotal
Students Parents TeachersHeads of Institutions
189 U 9 1%896 579 180 21639 — 94 11
362 — 31 6
1897 768 424 66
The questions referred to age, sex, religion, caste, mother tongue, education and occupational background, living conditions, income etc.
The general objective of this study is to ascertain the respective attitudes of the students, their parents, and their teachers to education. The study further seeks to ascertain the aspirations for the future of the students and the teachers in reference to their expectations from the education of the students, the teachers’ image of students and the students’ image of teachers.
In this sample stated above, there are three types of respondents. The first group is the student. They are divided into three sub-groups (i) the first comprises the students in the last year of the secondary schools (i.e. Xth or Xlth standard as the case may be) ; (ii) students in the last year class of the undergraduate colleges of Arts/Science/Commerce ; (iii) and students in the last year class of the specialised institutions like the medical college, engineering college and polytechnics. The second group is the teacher. Teachers are made up of those of the selected primary and secondary schools ; the teachers allotted to the final year classes of undergraduate colleges and those of the specialised institutions selected. The third group comprises of parents. Parents of the last year class students in the primary and secondary schools were selected.
The study seeks to learn about the attitudes and backgrounds of these three major respondent groups and the several sub-groups. A comparison is also attempted by providing tables based on the attributes of sex and rural-urban location. Cross-tables for the entire sample of each respondent group in the state were also obtained for various characteristics such as age, sex, social background, religion, language etc.
The details of the sampling and design are given in Chapter II.

PRIMARY STAGE
S e c t io n I— In t r o d u c t io n
ri^H E ENTIRE superstructure of education is built on primary education.The importance of studying the primary school can therefore be hardly
exaggerated. This chapter gives some data on the teachers who teach at the primary school level and the parents of primary school children in rural areas. The primary school student though an important participant in education is too young to be interviewed and no data are therefore available regarding this participant. The data presented in this chapter relate to 25 schools.
Of the schools contacted 4 are sponsored by the private organisations, 13 by the government and 8 are aided by the government. The schools started by the government are financed directly by the state and the remaining are aided by the state. Those that are aided by the state government get their financial assistance from charitable organisations and also from philanthrophists. The government-aided institutions and the private schools are managed by boards consisting of four to five persons. In all there are 119 teachers and 28 heads of schools, in all these schools, to teach nearly 820 pupils. One hundred and eighty-nine parents of the children studying in these 25 primary schools were also contacted.
S ec t io n II — T ea ch er s o f P rim a r y Sch o o ls
1. THE DESCRIPTION OF THEIR SOCIAL BACKGROUND
The teachers were requested to give information regarding their age, sex, caste, religion, mother tongue, educational and occupational background etc., to understand their social background.
(i) Distribution of the Teachers by Sex
Out of 119 primary school teachers contacted, 61 are male and 58 are female teachers. Five per cent male and 13 per cent female teachers are in the age group of 20 years and below. Sixteen per cent male and 26 per cent female teachers are in the age group of 21 to 25 years.

Twenty-one per cent male and 21 per cent of the female teachers are in the age group of 26 to 30 years ; 26 per cent male and 10 per cent female teachers are in the age group of 31 to 35 years. Ten per cent male and 7 per cent female teachers are in the age group of 36 to 40 years. Ten per cent male and 17 per cent female teachers are in the age group of 41 to 45 years. Seven per cent male and 5 per cent female teachers are in the age group of 46 to 50 years. Five per cent of the male teachers are in the age group of 56 years and above. It is seen that male teachers belong to a higher age group than female teachers.
(li) Caste of the Teachers
About their caste, 7 per cent of the male and 10 per cent of the female teachers belong to scheduled castes ; 47 per cent of the male and19 per cent of the female teachers belong to other backward classes ; 31 per cent of the male and 35 per cent of the female teachers belong to other castes ; 8 per cent of the male and 32 per cent of the female teachers have said that the question is not applicable to them and the rest have not responded. It can be seen that the percentage of scheduled and backward class male teachers is larger by 25 per cent than the male teachers of other castes. The percentage of teachers of other castes is larger by 7.
(iii) Religion of the Teachers
When the teachers were asked to state their religion, 93 per cent of the male and 74 per cent of the female teachers said that they were Hindus ; 3 per cent of the male and 26 per cent of the female teachers said that they were Christians ; 2 per cent of the male teachers were Muslims, 2 per cent of the male teachers were Jains. Only a few of the male teachers belong to religions other than the Hindu religion ; among women, however, Christian teachers make up a substantial proportion.
(iv) Mother tongue of the Teachers
The mother tongue of 2 per cent of the male and 2 per cent of the female teachers is Hindi; that of 70 per cent of the men and 48 per cent of the women teachers is Kannada ; that of 2 per cent of the male and 21 per cent of the female teachers is Tamil; that of 5 per cent of the male and 2 per cent of the female teachers is Telugu ; that of 2 per cent of the female teachers is Urdu, 7 per cent of the male and 12 per cent of the female teachers have not responded to the question. A majority of the male teachers speak Kannada but among women teachers the majority is

made up of non-Kannada groups. However, Konkani and Tulu which account for 35 per cent of the women teachers are closely akin to Kannada.
(v) The Occupational Backgrounds of the Teachers
(a) The occupation of the grandfathers of the teachers : The teacherswere asked about the main source of livelihood of their grandfathers and fathers. The answers are as follows ; The grandfathers of 26 per cent male and 26 per cent female teachers are in the occupational group 1, namely owners of farm, fishery, dairy, land etc. Those of 16 per cent of the male and 19 per cent of the female teachers are in the occupational group 2, namely tenant cultivator, peasant, proprietor, independent fisherman etc.. The grandfathers of 7 per cent of the male and 3 per cent of the female teachers are in the occupational group 3, namely manual labourer in agriculture, dairy etc., while those of four per cent of the male teachers are in the occupational group 4, namely proprietor, director, managing agent of big industrial concern, mine etc. big businessman, wholesale merchant, proprietor of transport, commission agent etc. Thirteen per cent of the male and 9 per cent of the female teachers have grandfathers in group 5, namely owner of small business, retail shop, handicraftsman, independent businessman, tailor, banker, pedlar, priest, country medicineman, etc., 10 per cent of the male and 5 per cent of the female teachers had grandfathers in the occupational group 7, namely ordinary administrative staff, clerk, stenographer, cashier, record keeper, school teacher, retail shop employee etc. ; the grandfathers of 2 per cent of the male teachers were In the occupational group 8, namely skilled manual worker, foreman, machine man, miner, factory worker, craftsman working as employee of a concern, while those of 3 per cent of the male and 2 per cent of the female teachers were in the occupational group 9, namely, unskilled staff, peon, darwan, coolie, non-agricultural day labourer, etc. and of 5 per cent of the male teachers are in the occupational group O, namely armed forces personnel. Sixteen per cent of the male and 24 per cent of the female teachers have not responded to the question. The occupation of grandfathers of a large number of teachers is the ownership of farm, dairy etc.
(b) Occupation of fathers of the teachers : The fathers of 23 per centof the male and 12 per cent of the female teachers are in the occupational group 1, namely owner of farm, fishery, dairy, land etc., 13 per cent of the male and 16 per cent of the female teachers in the occupational group2, namely tenant cultivator, independent fisherman etc., 5 per cent of the male and 2 per cent of the female teachers in the occupational group 3, namely, manual labourer in agriculture, dairy etc., 2 per cent fathers of

the male and 2 per cent of the female teachers are in the occupational group 4, namely, proprietor, director, managing agent of big industrial concern, mine etc., businessman, wholesale merchant, proprietor of transport, commission agent etc. Fathers of 13 per cent of the male and 19 per cent of the female teachers are in the occupational group 5 namely, owner of small business, retail shop, handicraftsman, independent businessman, tailor, banker, peddlar, priest, country medicineman etc. ; 2 per cent of the male and 7 per cent of the female teachers have fathers in the occupational group 6 namely, executive and scientific/technical person, raanagetj accountant, various types of officers, physicist, analyst, chemist etc., professionals like doctor, lawyer, lecturer, professor, etc., employed by public or private sector as well as working on their own ; 21 per cent of the male and 14 per cent of the female teachers have fathers in the occupational group 7 namely, ordinary administrative staff, clerk, stenographer, cashier, record keeper, school teacher etc. Fathers of 3 per cent of the male and 3 per cent of the female teachers are in the occupational group 9 namely, unskilled staff, peon, darwan, coolie, non-agricultural day labourer etc., and that of 5 per cent of the male teachers in the occupational group O namely, armed forces personnel. Seven per cent of the male and 9 per cent of the female teachers have not responded. It is significant to note that fathers of a large number of male teachers are owners of farm, dairy etc., fathers of a large number of female teachers are owners of small business, tailors etc.
(vi) The Educational Background of the Teachers
(a) Education of the grandfathers of the teachers : In response to thequestion “what was the education of your grandfather"', 49 per cent of the male and 31 per cent of the female teachers indicate that their grandfathers are illiterate or barely literate. Thirty-one per cent of the male and 24 per cent of the female teachers mention that their grandfathers have primary school education. The grandfathers of 13 per cent male and 9 per cent female teachers are educated upto either middle or high school level and 5 per cent of the male and 7 per cent of the female teachers report that their grandfathers are trained in the traditional system of Sanskritic or Persian learning. Eight per cent of the male and 26 per cent of the female teachers are not in a position to say anything regarding the education of their grandfathers. The grandfathers of nearly 50 per cent of the male teachers and 21 per cent of the female teachers are illiterate.
(b) Education of the fathers : Further the teachers were asked to give information regarding the education of their fathers. Thirty per cent of the male and 19 per cent of the female teachers say that their fathers

are either illiterate or barely literate. The fathers of 43 per cent male and 28 per cent female teachers are educated upto the primary school level. The fathers of 23 per cent male and 38 per cent female teachers are educated upto either middle or high school level. The fathers of2 per cent male and 2 per cent female teachers had college education and the fathers of 5 per cent of the male and 3 per cent of the female teachers are trained in the traditional system of Sanskritic learning. It will be seen that while fathers of a large number of male teachers are educated upto primary school, the fathers of the largest group of female teachers are educated upto middle or high school. Women leacheis come slightly better-educated homes.
(vii) The Rural/Urban Background of the Teachers
(a) Whether the teachers grew up mainly in towns and cities, or villages : In order to understand the rural-urban background of the teachers, they were asked to state the place where they mainly grew up. As per the data collected, 67 per cent of the male and 40 per cent of the female teachers grew up in villages. Twenty per cent of the male and 31 per cent of the female teachers grew up in towns ; 5 per cent of the male and 19 per cent of the female teachers grew up in cities. Nine per cent of the male and two per cent of the female teachers point out that they grew up in a mixed environment.
Seventy-one per cent of the male teachers out of 41 who were brought up in a village are working in rural areas and 61 per cent of the female teachers out of 23 who grew up in a village are working in rural areas. Hence it is clear that a greater number of teachers grew up in villages
* and most of them are employed in schools situated in rural areas only.(b) Whether the teachers had schooling at a place smaller than tehsil or
taluka town : On questioning whether they had been to school at asmaller place than a tehsil or taluka town, 67 per cent of the male and 43 per cent of the female teachers answered in the positive ; 30 per cent of the male and 36 per cent of the female teachers answered in the negative and 2 per cent of the male and 12 per cent of the female teachers expressed their inability to say anything. Thus a majority of these teachers were educated at a place smaller than a tehsil or taluka town.
(viii) The Teachers' Position in the Social Ladder
When the teachers were asked to state whether their position was high, low or middle on the social ladder 70 per cent of the male and 97 per cent of the female teachers employed in urban areas, all the male and the female teachers in non-urban areas and 55 per cent of the male and

57 per cent of female teachers in rural areas said that they occupied the middle social position; 14 per cent of the male and 10 per cent of the female teachers in rural areas said that they occupied the higher social poeition. Thirty per cent of the male and 3 per cent of the female teachers in the urban areas and 31 per cent of the male and 10 per cent of the female teachers in the rural areas said that they occupied the lowest social position. A majority of both the male and the female teachers working in urban, rural or non-urban areas indicated their position as the middle position in the society.
Congludit^ rem&tks on the social background of the teachers interviewed: This section on social background shows that the greaternumber of the primary school teachers interviewed in Mysore are Hindus and speak Kannada. The grandfathers and fathers of the majority of these teachers are owners of farm, dairy, etc., or independent businessmen. Most of them have grandfathers and fathers who are illiterate or educated Upto the middle or h i^ school level. Again a majority of the teachers l^ave been educated at a place smaller than a tehsil or taluka town. They have mainly grown up in villages.
2. NUMBER OF YEARS ENGAGED IN TEACHING
To find out the number of years of teaching experience, these teachers have had in various institutions as well as at the institution where they are working at present, the teachers were asked a few questions.
(i) Total Experience
Thirty per cent of the male and 41 per cent of the female teachers explain that they have 5 or less than 5 years of teaching experience. Twenty-three per cent of the male and 21 per cent of the female teachers have 6 to 10 years of experience, 21 per cent of the male and 10 per cent of the female teachers have 11 to 15 years of experience ; 5 per cent of the male and 14 per cent of the female teachers have 16 to 20 years of experience; 11 per cent of the male and 12 per cent of the female teachers have over 20 years of teaching experience. The largest number of teachers have 5 or less than 5 years of teaching experience.
Differences by rural/urban location: To the question “For how many years have you been engaged in teaching ?” 15 per cent of the male and 44 per cent of the female teachers in urban areas, 20 per cent of the male teachers in non-urban areas ; 39 per cent of the male and 38 per cent of the female teachers in rural areas say that they have 5 or less than5 years of experience ; 20 per cent of the male and 22 per cent of the female teachers in urban areas, 40 per cent of the male and 100 per cent

of the female teachers in non-urban areas, 22 per cent of the male and 19 per cent of the female teachers in rural areas say that they have experience of 6 to 10 years. Thirty per cent male and 8 per cent female teachers of the government aided schools have worked in 4 institutions. Seventeen per cent of the government school teachers and 4 per cent of the government aided school teachers have worked in 5 institutions ; 3 per cent of the government school teachers have worked in 6 institutions ; 6 per cent of the teachers in government schools and 4 per cent in government aided schools have worked in 7 institutions. Eight per cent of the teachers in government schools and 8 per cent in government aided schools have worked iu 8 institutions. Eleven per cent of the teachers in government and 4 per cent of them in government aided schools have worked in 9 institutions. Three per cent of the teachers employed in government schools have worked in 10 institutions prior to joining the institutions in which they are working at present. A slightly larger percentage of teachers working in government schools and government aided schools have worked in just one institution prior to joining the institution wherein they are employed at present.
On the whole, the significant points that are clear, with reference to the teacher turn-over m the profession, are that a greater number of teachers in non-urban areas have longer teaching experience. A large percentage of teachers have been working in the same institution where they are working at present and a slightly larger percentage of teachers have worked in just one institution prior to joining the institutions where they are presently employed.
3. ACADEMIC AND PROFESSIONAL QUALIFICATIONS OF THE TEACHERS
(i) Class Obtained at the Highest Examination Passed
Thirty-one per cent of the male and 51 per cent of the female teachers are non-matriculates ; 59 per cent of the male and 48 per cent of the female teachers are matriculates and 8 per cent of the male teachers are non-graduates. In the highest examinations they have passed, 3 per cent of the male and 12 per cent of the female teachers have obtained first class ; 46 per cent of the male and 41 per cent of the female teachers have passed in second class ; 44 per cent of the male and 40 per cent of the female teachers have obtained third class. Five per cent of the male and 3 per cent of the female teachers have not obtained a class at aU.
The following paragraphs give an account of the varied answers given by male and female teachers and those employed in urban, non-

urban and rural areas, concerning their academic and professional achievements.
(ii) Academic Qualifications
Thirty-five per cent of the male and 36 per cent of the female teachers employed in urban areas are non-matriculates ; 45 per cent of the male and 45 per cent of the female teachers are matriculates ; 15 per cent of the male teachers are non-graduates.
Twenty per cent of the male teachers employed in the non-urban areas are non-matriculates; 60 per cent of the male and 100 per cent of the female teachers are matriculates and 20 per cent of the male teachers are non-graduates.
Thirty-one per cent of the male and 48 per cent of the female teachers employed in rural areas are non-matriculates; 67 per cent of the male and 52 per cent of the female teachers are matriculates while 3 per cent of the male teachers are non-graduates. Thus it is clear that a greater number of teachers working in urban, non-urban or rural areas are matriculates.
(iii) Professional Qualifications
As for their professional qualifications, 21 per cent of the male and 31 per cent of the female teachers have no professional qualifications. Fifty-four per cent of the male and 41 per cent of the female teachers have successfully completed the primary teachers’ training certificate ; 16 per cent of the male and 21 per cent of the female teachers have completed the secondary teachers’ training certificate. Two per cent of the male teachers have completed the teachers’ diploma examination. Two per cent of the male teachers have passed the Hindi Sikshak Sanad examination. Three per cent of the male and 5 per cent of the female teachers have mentioned that they have also passed certain other professional examinations. It is seen that a majority of teachers are matriculates and have passed their highest examination in third class and have completed the primary teachers’ training certificate examination.
(a) Differences by rural/urban location : Of the teachers employed inurban areas, 23 per cent of the male and 45 per cent of the female teachers have not attained any professional qualifications. Fifty per cent of the male and thirty-one per cent of the female teachers have passed the primary teachers’ training certificate examination. Five per cent of the male and 17 per cent of the female teachers have completed the secondary teachers’ training certificate.
Twenty-five per cent of the male teachers employed in non-urban

areas do not have any professional qualifications. Twenty-five per cent of the male teachers have passed the primary school teachers’ training certificate. Fifty per cent of the male and all female teachers have passed the secondary teachers’ training certificate.
Nineteen per cent of the male and 10 per cent of the female teachers employed in the rural areas have no professional qualifications. Fifty- seven per cent of the male and 62 per cent of the female teachers have completed the primary teachers’ training certificate. Nineteen per cent of the male and 24 per cent of the female teachers have completed the secondary teachers’ training certificate. Three per cent of the male teachers have completed the teachers’ diploma. Among the teachers employed in urban, non-urban and rural areas, teachers employed in non-urban areas are professionally better qualified than teachers in urban and rural areas.
(b) Differences by type of institution : The professional qualifications of the teachers employed in the government, municipal, government aided and unaided institutions show that 53 per cent of the teachers employed in the government and government aided registered society’s institutions have completed the primary teachers’ training certificate ; and 21 per cent of them have passed the secondary teachers’ training certificate. The remaining 21 per cent have no professional qualifications. Out of the teachers possessing professional qualifications, 62 per cent are employed in the government aided registered society’s institutions. Hence a greater number of teachers employed in government aided registered society’s institutions are professionally better qualified than teachers employed in government or municipal institutions.
4. THE CHOICE OF TEACHING AS A CAREER
In order to understand the teachers’ perspective of the profession and also their keenness in taking to teaching as a careers a few questions were put to them. They were also asked to rate their status with the occupational status of their fathers.
(i) Whether They had Pursued Another Occupation before taking upTeaching
To the question “At any stage of your career have you pursued an occupation other than teaching ?”, 50 per cent of the teachers employedin urban centres, 47 per cent in rural areas and 3 per cent in non-urban areas replied that they had never pursued any other occupation before they took to teaching.
(a) Differences by rural/urban location: A further breakdown

of the data indicate that 70 per cent of the male and 92 per cent of the female teachers employed in urban areas, 80 per cent of the male and 100 per cent of the female teachers in non-urban areas, 81 per cent of the male and 76 per cent of the female teachers in rural areas had never pursued any other occupation before taking to teaching. Fifteen per cent of the male and 8 per cent of the female teachers employed in urban areas and 19 per cent of the male teachers m rural areas had pursued another occupation before taking to teaching. It is thus clear that most of the teachers had not pursued any other occupation before taking to teaching m a career.
(b) Economic circumstances as related to the pursuit of an occupation other than teaching: Eigjity-five per cent of primary school teachers who had been brought up under difficult economic circumstances had never pursued any other occupation before they took to teaching. Twelve per cent had pursued other occupations, while 3 per cent have followed it along with teaching.
(ii) Whether the Teachers had any Desire to Choose Another Occupationbefore taking up Teaching
Forty-two per cent of the teachers employed in urban areas, 51 per cent in rural areas, 6 per cent in non-urban areas state that they had desired to choose some other occupation. Fifty-four per cent teachers employed in urban areas, 42 per cent in rural areas and 4 per cent in non- urban areas state that they had never desned to choose another occupation.
(iii) Total Experience in the Institution in which They were Interviewed
Sixty-six per cent of the male and 72 per cent of the female teachers have been working for 5 or less than 5 years in the institution in which they are working at present. Eighteen per cent of the male and 5 per cent of the female teachers have been doing so for 6 to 10 years. Ten per cent of the male and 5 per cent of the female teachers for 11 to 15 years ;3 per cent of the male and 9 per cent of the female teachers for 16 to 20 years and 2 per cent of the male and 9 per cent of the female teachers since 20 years. Most of these teachers have been working in the same institu- tion where they are employed at present for 5 or less than 5 years.
Differences by rural/urban location: Analysing the urban-ruralgrouping as a variable with reference to the number of years of teachmg experience in particular institutions in which they are working, it is found that 66 per cent of the teachers employed ui urban areas, 83 per cent in non-urban areas and 70 per cent in rural areas have 5 or less than 5 years of experience. Sixteen per cent in non-urban,and 7 per cent in rural

I r iMary stag e ; 87
areas have 6 to 10 years ; 11 per cent in urban areas and 5 per cent in non-urban and 8 per cent in rural areas have over 20 years of teaching experience.
Seventeen per cent of the female teachers in urban areas, 40 per cent of the male teachers in non-urban areas and 14 per cent of male teachers in rural areas have 11 to 15 years of experience.
(iv) The Number of Institutions they Worked in prior to Joining the onein which They were Interviewed
To the question “In how many institutions did you work prior to joining this one ?” 19 per cent of the teachers employed in government schools and 24 per ceM employed in governmerit aided registered society’s institutions said they bad worked in one institution prior to joining the institution where they are working at present. Eight per cent of the government school teachers and 28 per cent of the government aided school teachers had worked in two institutions.
Differences by rural/urban location: When they were asked whether they had any desire to choose some other profession before they took to teaching, 25 per cent of the male and 25 per cent of the female teachers employed in urban areas, 50 per cent of the male and 40 per cent of the female teachers in non-urban areas, 56 per cent of the male and 10 per cent of the female teachers in rural areas answered in the positive. Sixty-five pet- cent of the male and 75 per cent of the female teachers in urban areas, 50 per cent of the male and 60 per cent of the female teachers in non-urban areas and 42 per cent of the male and 52 per cent of the female teachers iti rural areas answered in the negative. Ten per cent of the male teachers in urban areas, 3 per cent of the male teachers and 10 j^ r cent of the female teachers in rural areas Were undecided on the issue. A large number of teachers had not desired to choose any other occupation before they took to teaching.
(v) Their Willingness to Continue in the Profession
In order to understand the extent to which the teachers are willing to continue in the profession, they were asked the following question, “Now that you have been in teaching profession for some time would you like to change if there is an opportunity for some other kind of work with the same emoluments ?” Twenty per cent of the male and 8 per cent of the female teachers in the urban areas, 20 per certt of the male tetlchers in the non-urban areas and 30 per cent of the male and 5 per cent of the female teachers in the rural areas said that they would like to change. Twenty per cent of the male and 11 per cent of the female teachers

in urban areas, 40 per cent of the male teachers in the non-urban areas and 14 per cent of the male teachers in the rural areas felt that it is too late to change. Fifty per cent of the male and 75 per cent of the female teachers in urban areas, 40 per cent of the male and 100 per cent of the female teachers in non-urban areas, 53 per cent ofthe male and 52 per cent of the female teachers in the rural areas wouldnot like to change from the teaching profession. Ten per cent of the male and 5 per cent of the female teachers in urban areas, 3 per cent of the male and 2 per cent of the female teachers in the rural areas have not been able to say anything definite. The majority of the teachers, it is seen, do not like to change from their present profession. It would beinteresting to observe if the sponsorship of the institution, the educationof the teacher or the social background of the teacher (in terms of his economic circumstances and the education of the father) will make any difference.
(a) Differences by type of institution: Teachers employed ingovernment schools do not differ much in outlook from those employed in government aided schools. Sixty per cent of the teachers working in government and government aided institutions do not like to change ; 15 per cent think that it is too late ; and 7 per cent caimot say anything.
(b) Differences by the educational level of the teachers: Sixty-twoper cent of the teachers who are non-graduates would not like to change. Sixteen per cent would like to ; 14 per cent think that it is too late to change while 8 per cent are undecided. Thus a larger percentage of teachers are committed to the profession, irrespective of their academic achievement.
(c) Differences by economic circumstances : Sixty-two per cent ofthe teachers who grew up under “varying” economic circumstances say that they would not like to change. All the teachers who grew up under circumstances which they describe as “well off”, 87 per cent who grew up under varied circumstances, 63 per cent who grew up under stringent circumstances and 57 per cent who grew up under average economic circumstances do not want to change the profession.
Sixty-one per cent of the teachers whose fathers are educated below the college level say that they would like to change the profession. All the teachers whose fathers are college educated or traditionally educated do not like to change the profession of teaching.
(d) Differences by rural/urban location: Sixty-three per cent of the teachers who grew up in village, towns, cities or at mixed places desire no change of profession. Eighty-seven per cent of the teachers who grew up in cities, 62 per cent in mixed places, 60 per cent in villages and 57 per cent in towns say that they would not like to change.
It is significant to note that quite a large percentage of teachers

irrespective of their economic, educational or rural-urban background would not like to change from their present occupation to another offering the same emoluments.
(vi) The Teachers’ Views regarding the Status of Teaching as an Occupation as compared with the Status of the Occupations followed by their Fathers
(a) Differences by rural/urban location and sex differences: Inanswer to the question as to how their occupation compared with the occupation of their fathers, 47 per cent teachers employed in urban areas, 43 per cent in rural areas and 10 per cent in non-urban areas replied that their occupation was higher in status.
Forty-five per cent of the male and 42 per cent of the female teachers employed in urban areas, 100 per cent of the male teachers in non-urban areas and 42 per cent of the male and 33 per cent of the female teachers employed in rural areas rate their occupational status higher than their fathers’. Twenty-five per cent of the male and 17 per cent of the female teachers in urban areas, 100 per cent of the female teachers in non-urban areas, and 25 per cent of the male and 10 per cent of the female teachers in rural areas rate it lower. Ten per cent of the male and 28 per cent of the female in urban areasand 25 per cent of the male and 24 per cent of the female teachei|gin rural areas rate it equal, while 20 per cent of the male and 14per cent of the female teachers in urban areas and 8 per cent of the male and 10 per cent of the female teachers in rural areas are undecided. A large number of teachers rate their present status higher than that of their fathers’, but there is a sex differential. Women teachers are somewhat more likely to regard their occupation as lower than their fathers’.
(b) Age as a variable : It is seen that teachers belon^g to differentage groups state the same opinion. Twenty-four per cent of the teachers belonging to different age groups had wished to choose some other occupation before they took to teaching. Seventy-nine had had no such wish while 6 per cent were not in a position to say anything. When asked how they would rate their occupation in comparison with the occupation of their fathers, 42 per cent of the teachers belonging to different age groups said that their occupation was higher than fathers’ ; 20 per cent said that it was lower ; 24 per cent said it was almost the same level and 13 per cent could not say anything. So a large number of teachers in different age groups rate their occupational status to be higher than that of their fathers.

5. TEACHERS’ CONTACT WITH THE PARENTS OF THE STUDENTS
(i) Frequency of Contacts
Thirty per cent of t6e teachers employed in the urban areas, 17 per cent in the non-urban areas, and 37 per cent in rural areas have regular contact with the parents of their students. Sixty-three per cent of the teachers employed in the urban areas, 33 per cent in the non-urban areas and 47 per cent in the rural areas contact the parents as and when the occasion arkes. Seven per cent o! the teaichers etnployfed in urban areas, §3 per cent in non-urban areas and 14 per cent in rural areas seldom contact the parents of their students. Seventeen per cent of the teachers employed in non-urban areas never have such contacts. A large number of teachers in urban, rural and non-urban areas iliake contacts with the parents of their students as and when the occasion arises.
(a) Differences by rurdjurban location: When the question of the contact of the teachers with the parents of students was asked, 20 per cent of the male and 36 per cent of the female teachers employed in urban areas, 20 per cent of the male teachers employed in non-urban areas, 39 per cent of the male teachers in rural areas said they had regular contacts ; 75 per cent of the male and 55 per cent of the female teachers in urban areas, 40 per cent of the teachers in non-urban areas, and 47 per cent of the male teachers in rural areas make contacts a when the occasion arises. Five per cent of the male and 8 per cent of the female teachers in urban areas, 20 per cent of the male and 100 per cent of the female teachers in non-urban areas, and 14 per cent of the male teachers in rural areas seldom make such contacts. Twenty per cent of the male teachers employed in non-urban areas mention that they have never made such contacts.
(b) Frequency of teacher-parent contact as related to the sponsorshipof institution : About teacher-parent contacts, 51 per cent of the teachersof the government and government aided institutions have such contacts as and when the occasion arises. Thirty-two per cent have regular contacts ; 15 per cent seldom make contacts and 2 per cent of them have never made contact. Fifty-nine per cent of teachers in government schools and44 per cent of teachers in government aided schools make contacts with parents as and when the occasion arises.
(ii) Mode of Contact
With reference to the means adopted to inform the parents of their ward’s progress, 60 per cent of the teachers employed in urban areas, 87 per cent in non-urban areas and 47 per cent in rural areas intimate through

periodic progress report cards ; 40 per cent of the teachers. employed in urban areas, 17 per cent in non-urban areas and 35 per cent in the rural areas intimate through parent-teacher meetings ; 5 per cent of the teachers employed in rural areas do not keep in touch with the parents while 4 per cent of teachers in the rural areas intimate through some other means. A greater number of teachers irrespective of the place where they are employed inform parents about the progress of their children in studies through progress reports.
(a) The sex of the teacher and di^erences in rural/urban location as making for differences in the mode oj conHacting im ents \ Conskieiifll the sex difference with reference to the means adopted to inform th® the parents of the progress of their wards, 45 per cent of the male and 67 per cent of the female teachers employed in non-urban areas,39 per cent of the male and 62 per cent of the female teachers in rural areas say that thek contact is through progress reports. Fifty-five per cent of the male and 33 per cent of the female teachers employed in urban areas, 17 per cent of the male teachers in non-urban areas, 47 per cent of the male and 14 per cent of the female teachers in the rural areas say they have direct teacher-parent contacts. Eight per cent of the male teachers in rural areas do not keep in touch with the parents while 6 per cent of the teachers employed in rural areas inform the parents by other means. Most of the male and female teachers intimate parents of their children’s progress through progress reports.
(b) Type of institution in which the teacher teaches as related tothe manner in which thi parents are informed of the progress of their wards : The progress of the pupils is intimated to the parents by 53 percent of the teachers through progress reports, by forty-two per cent of the teachers through parent-teacher meetings and by 2 per cent through other means. Three per cent of the teachers do not keep the parents informed about their wards’ progress at all. While 37 per cent of the teachers in government aided schools intimate parents through progress reports, 54 per cent of the teachers in government schools intimate them through parent-teacher meetings.
(iii) Teachers’ Impressions regarding Parents’ Interest in the Progress oftheir Children
When the teachers were asked, whether parents take any interest in the progress of their children, 31 per cent of the male and 26 per cent of the female teachers said that most of the parents are “sujficiently” interested in the progress of their cSiildren. Thirty-nine per cent of the male and forty-three per cent of the female teachers said that some are interested ; 24 per cent of the male and 20 per cent of the female teachers

said that few are interested while 3 per cent of the male teachers said that they cannot say anything in the matter. So it is clear, that the larger number of teachers feel that only some parents are interested in the progress of their children in studies.
Differences by rural/urban location: 23 per cent of the teachersemployed in urban areas and 37 per cent in rural areas say that most of the parents take interest in the progress of their children. Fifty per cent of the teachers in urban areas, 66 per cent in non-urban areas, and 30 per cent in rural areas say that parents take some interest. Twenty-one per cent of the teachers in urban areas, 33 per cent in non-urban areas and 23 per cent in rural areas say that few take interest, while 3 per cent of the teachers in urban areas cannot say anything.
6. PROFESSIONAL AND ADMINISTRATIVE RELATIONSHIPS
The teachers were requested to give information regarding the number of staff meetings held in the schools, their sense of freedom to discuss all school matters at such meetings and also the extent to which decisions taken at such meetings were implemented. This will give an idea of the involvement of the teachers with the school and its affairs.
(i) Staff Meetings
(a) Whether meetings are held : When asked whether staff meetingsare held in the institutions, where they work at present, 46 per cent of the male and 43 per cent of the female teachers report that meetings are held regularly. Forty-seven per cent of the male and forty-three per cent of the female teachers say that meetings are held as and when required ; 5 per cent of the male and 5 per cent of the female teachers say that they are held very rarely and 2 per cent of the male teachers say that they are never held. Staff meetings are held “as and when required”, according to the greater number of teachers.
(b) Differences by rural/urban location: Further, 48 per centof the teachers employed in urban areas, 17 per cent of the teachers in non-urban areas and 49 per cent of the teachers in rural areas say that regular meetings are held. Forty-eight per cent of the teachers employed in urban areas, 67 per cent in non-urban areas and 44 per cent in rural areas say that meetings are held as and when required. Four per cent of the teachers employed in urban areas, 17 per cent in non-urban areas and 6 per cent in rural areas say that meetings are held very rarely while 2 per cent of the teachers in rural areas report that meetings are never held in their institutions. While teachers employed in urban and non- urban areas say that staff meetings are held as and when required, teachers in rural areas say that staff meetings are held regularly.

(ii) Frequency of Staff-Meetings
To the question “Are staff meetings held regularly in your institution ?”, 45 per cent of the male and 50 per cent of the femaleteachers in urban areas, 20 per cent of the male teachers in non-urban areas, 50 per cent of the male and 33 per cent of the female teachers in rural areas say that meetings are held regularly ; 55 per cent of the male and 44 per cent of the female teachers in urban areas, 80 per cent of the male and 100 per cent of the female teachers in non-urban areas and 39 per cent of the male and 43 per cetit of the female teachers in rural areas say that they are held as and when required. Five per cent of the female teachers in urban areas and 8 per cent of the male teachers employed in rural areas say that meetings are never held. It is evident that more female teachers in urban areas say that meetings are held regularly while more teachers irrespective of male and female in non-urban areas say they are held as and when required.
Frequency and the type of institution: Thirty-nine per cent of the teachers in government and 56 per cent of the teachers in government aided schools say that meetings are held regularly. Fifty-one per cent of the teachers in government and 40 per cent of the teachers in government aided schools say that meetings are held as and when required. Eight per cent of the teachers in government and 3 per cent of the teachers in government aided schools say that meetings are rarely held while 2 per cent of the teachers employed in government schools say that meetings are never held. While a large percentage of teachers in government aided schools say that staff meetings are held regularly, a large percentage of government school teachers say that staff meetings are held as and when required.
(iii) The Nature of Discussions at Staff Meetings
(a) General: When asked v/hether the teachers would feel freeto discuss all matters relating to the school at these meetings, 51 per cent of the male and 50 per cent of the female teachers said that they did “most often”. Forty-two per cent of the male and 41 per cent of the female teachers said they felt free “sometimes” and 5 per cent of the male teachers said that the question does not apply to them.
The rural-urban breakdown indicates that 45 per cent of the teachers employed in urban areas, 17 per cent in non-urban areas and 65 per cent in rural areas say that they feel free to discuss school matters most often at these meetings. Fifty-two per cent of the teachers employed in urban areas,83 per cent in non-urban areas and 31 per cent in rural areas say that they do so sometimes ; 3 per cent of the teachers employed in urban areas, 83 per cent in non-urban areas and 31 per cent in rural areas say

that they do sometimes ; 3 per cent of the teachers employed in urban areas and 2 per cent in rural areas seldom do so while 2 per cent of theteachers in rural areas say that the question is not applicable. While thegreater number of teachers in urban and non-urban areas feel free to discuss school matters “sometimes” at meetings, more number of teachers in rural areas always feel free to do so.
(b) School matters: To the question “Do you feel free to discuss allmatters relating to school at these meetings ?”, 40 per cent of the male and 47 per cent of the female teachers employed in urban areas, 20 per omt of the male teachers in nou-'urban areas, 61 per cent of the male attd 57 per cent of the female teachers in rural areas say that they discussmost often ; 50 per cent of the male teachers and 53 per cent of thefemale teachers employed in urban areas, 80 per cent of the male and 100 per cent of the female teachers in non-urban areas, 33 per cent of the male and 19 per cent of the female teachers in rural areas discuss sometimes ; 10 per cent of the male teachers in urban areas and 3 per cent of the male teachers in rural areas say that they seldom discuss. Greater number of teachers with the exception of non-urban teachers, discuss school matters most often.
(c) Type of institution as related to discussion at staff meetings: Forty-five per cent of the teachers employed in government schools and 63 per cent of the teachers in government aided schools feel free to discuss most often; 49 per cent of the teachers in government schools and 35 per cent of the teachers in government aided schools feel free to discuss sometimes ; 4 per cent of the teachers in government schools and2 per cent of the teachers in government aided schools seldom feel free to discuss while 2 per cent of the teachers in government schools say that this question is not applicable to them. Again, greater number of teachers in government aided schools feel free to discuss school matters “most often” at meetings, while more number of teachers in government schools feel free to discuss only “sometimes”.
(d) Age as a variable: Teachers belonging to various age groups were asked to express whether they were free to discuss all matters at staff meetings. Fifty per cent of the teachers in the age group of 20 years and below 20 years, 44 per cent between 21 and 25 years, 62 per cent between 26 and 30 years, 50 per cent between 31 and 35 years, 60 per cent between 36 and 40 years, 33 per cent between 41 and 45 years, 80 per cent between 46 and 50 years, 66 per cent between 51 and 55 years discuss most often. Fifty per cent of the teachers in the age group of 20 years and below 20 years, 52 per cent between 21 and 25 years, 35 per cent between 26 and 30 years, 41 per cent between 31 and 35 years, 40 per cent between 36 and 40 years, 67 per cent between 41 and 45 years, 20 per cent between 46 and 5 0 'years and 33 per cent

between 51 and 55 years sometimes discuss; 4 per cent of the teachers in the age group of 26 and 30 years and 9 per cent between 31 and 35 years seldom discuss. Four per cent of the teachers in the age group of 21 and 25 years say that the question is not applicable. While the largest percentage of teachers in the age group of 51 and 55 years feel free to discuss school matters most often, the smallest percentage of teachers in the age group of 41 to 45 feel free to discuss school matters most often. The largest percentage of teachers in the age group of 41 to 45 discuss school matters sometimes only.
(iv) Whether the decisions taken at the staff meetings are implemented
About the implementation of the decisions taken at the meeting, 57 per cent of the male and 59 per cent of the female teachers say that th@y are “always” implemented, 36 per cent of the male and 31 per cent of the female teachers say they are implemented “sometimes”, 3 per cent of the male teachers say that these decisions are seldom implemented;2 per cent of the female teachers say that decisions are never implemented ; while 2 per cent of the male teachers say that question does not apply to them. Thus a large percentage of teachers state that decisions taken at such meetings are always implemented.
(a) Differences by rural/urban location: A breakdown of the databy the rural-urban differential indicates that 71 per cent of the teachers employed in urban areas ; 17 per cent in non-urban areas and 54 per cent in rural areas say that decisions are always implemented ; 25 per cent of the teachers employed in urban areas, 83 per cent in non-urban areas and 40 per cent in rural areas say that they are implemented sometimes ; 2 per cent of the teachers employed in urban areas say that it is never done, while2 per cent of the teachers employed in rural areas say that the question is not applicable. While greater number of teachers in urban and rural areas say that decisions are always implemented, greater number of teachers in non-urban areas say that they are only sometimes implemented.
(b) Differences between men and women teachers: About the implementation of the decisions taken at such meetings, 70 per cent of the male and 72 per cent of the female teachers employed in urban areas, only 20 per cent of the male teachers and none of the women teachers in non-urban areas and 55 per cent of the male and 38 per cent of the female teachers in rural areas say that decisions are always implemented ; 25 per cent of the male and 25 per cent of the female teachers employed in urban areas, 80 per cent of the male and 100 per cent of the female teachers in non- urban areas, 39 per cent of the male and 38 per cent of the female teachers in rural areas say that decisions are sometimes implemented. While 6 per cent of the male teachers employed in rural areas say it is seldom done,

3 per cent of the female teachers in urban areas mention that decisions taken at the meetings are never implemented. Majority of teachers employed in urban and rural areas feel that decisions taken at such staff meetings are always implemented, while most of the teachers employed in non-urban areas do not think so.
(c) Type of institution as related to decisions at staff meetings: Whenquestioned whether decisions taken at staff meetings are implemented, 48 per cent of the teachers employed in government schools and 65 per cent of the teachers in government aided schools say that decisions are always implemented; 46 per cent of the teachers in the government schools and 33 per cent of the teachers in government aided schools say that decisions are sometimes implemented ; 2 per cent of the teachers in government schools and 2 per cent of the teachers in government aided schools say that seldom are decisions implemented ; 2 per cent of the teachers in government schools say that decisions are never implemented while 2 per cent of the government teachers say that the question is not applicable. Large number of teachers employed in government aided schools say that decisions taken at staff meetings are always implemented.
(v) Whether the Teachers are Represented on the Board of Management
With regard to the representation of a teacher on the board of management other than the Principal, 74 per cent of the male and 33 per cent of the female teachers say that they are represented ; 26 per cent of the male and 57 per cent of the female teachers say that they are not represented. Ten per cent of the female teachers have not responded to this question. While a greater number of male teachers say that they are represented on the board of management, the greater number of female teachers say that they are not so represented.
(a) Differences by rural/urban location : About the representation of a teacher on the board of management by a teacher other than the principal, 37 per cent of the teachers employed in urban areas, 50 per cent of the teachers in the non-urban areas, and 77 per cent in rural areas say that they are represented, while 61 per cent of them in urban areas, 50 per cent in non-urban areas and 23 per cent in rural areas say that no such representation is given. It is significant to note that the greater number of teachers employed in rural areas say that they are represented on the board of management while the greater number of teachers employed in urban areas say that they are not so represented.
(b) Differences in statements by men and women teachers: Whenasked about the representation of teachers on the board of management other than the Principal, 35 per cent of the male and 38 per cent of the

female teachers employed in urban areas, 40 per cent of the male and 100 per cent of the female teachers employed in non-urban areas, 100 per cent of the male and 18 per cent of the female teachers in rural areas say that they are represented ; 65 per cent of the male and 58 per cent of the female teachers in urban areas, 60 per cent of the male teachers in non-urban areas and 57 per cent of the female teachers in the rural areas say that no such representation is given. It is significant to note that all female teachers in non-urban areas and all male teachers in rural areas say that they are represented on the board of management, while others do not share the same opinion.
(c) Differences by type of institution : Further, 37 per cent of thegovernment teachers and 40 per cent of the teachers in government-aided schools say that they are represented, while 63 per cent of the teachers in government schools and 60 per cent of the teachers in government- aided schools say that no such representation is given. So it is clear that a large percentage of teachers in both government and government- aided schools say that they are not represented on the board of management.
(vi) Teachers' Participation in the Activities of Professional Organisations
Only 31 per cent of the male and 21 per cent of the female teachers say that they participate “regularly” in these activities ; 18 per cent of the male and 23 per cent of the female teachers say that they do so occasionally and 3 per cent of the male and 2 per cent of the female teachers say that they seldom participate. It is clear that a good number of teachers do not regularly participate in the activities of teachers’ organisations.
7. THE TEACHERS’ VIEWS REGARDING ROLE OF THE STUDENT, THE GOAL OF EDUCATION AND TEACHERS' IMAGE OF STUDENTS
(i) The Role of Student
About the opinion of the teachers regarding the role of student, 20 per cent of the male and 14 per cent of the female teachers say that a student should be concerned with his studies only ; 41 per cent of the male and 45 per cent of the female teachers say that a student should also devote time to household duties ; 39 per cent of the male and 27 per cent of the female teachers say that a student should in addition to this, devote time to welfare work ; 5 per cent of the female teachers say that a student should study, do household work, welfare work and take part in politics.

Two per cent of the female teachers are not in a position to say anything. The percentages of the teachers who desire students to devote time to household duties in addition to study are the largest.
(a) Age as a variable : To the question on what a student shouldbe, teachers belonging to different age groups have answered as follows : 13 per cent of the teachers belonging to different age groups say that a student should be concerned with his studies only ; 44 per cent say that a student should also devote time to household duties ; of these 44 per cent of teachers, 80 per cent of the teachers belong to the age group of 51 and 55 years, and 66 per cent aged over 56 years desire students to devote time to household duties. But 50 per cent of the teachers below 25 years of age want students to devote time to welfare work also. So it is clear that aged teachers believe that students should devote time to household duties also while younger teachers desire students to devote time to welfare work also.
(b) The education of the teachers as related to their views regarding the role of a student: Again these teachers were asked for their idea about what the students should be. Among the respondents, 12 per cent of the teachers who are non-matrics, 11 per cent who are matriculates and 20 per cent who are non-graduates say that a student should be concerned with his studies only ; 54 per cent who are non-matrics, 62 per cent who are matriculates and 20 per cent who are non-graduates say that a student should also devote time to household duties ; 31 per cent who are non-matrics, 32 per cent who are matriculates and 60 per cent who are non-graduates say that a student should also devote time to welfare work ;3 per cent who are non-matrics, and 1 per cent who are matriculates say that a student should also take part in politics while 3 per cent of the teachers who are matriculates are not in a position to say anything. While more number of matric and non-matric teachers desire students to dovote time to household duties, 60 per cent of non-graduate teachers want students to devote time to welfare work also.
(c) Economic circumstances in which the teachers grew up as relatedto their views regarding the role of a student: Further, 19 per cent ofthe teachers who grew up under difficult, 10 per cent under average, and 50 per cent under economic circumstances which they describe as well-oflE say that a student should be concerned with his studies only ; 49 per cent who grew under difficult, 40 per cent under average, and 62 under varied economic circumstances say that a student should also devote time to household duties ; 30 per cent of the teachers who grew up under difficult,45 under average, 50 per cent under well-off and 37 under varied economic circumstances say that a student should also devote time to welfare work. Only 3 per cent of the teachers who grew up under average economic circumstances say that a student should also take part in politics ; 2 per cent

of the teachers who grew up under difficult and 2 per cent under average economic circumstances cannot say anything. It is seen that more number of teachers who grew up under difficult, average and varied economic circumstances desire students to devote time to household duties, whereas50 per cent of the teachers who grew up under well-off economic circumstances desire students to be concerned with studies only ; another 50 per cent of them desire students to devote time to welfare work also.
(d) Parental education of the teachers and views regarding role of student; To the question on the role of students, 11 per cent of the teachers whose fathers are illiterate or barely literate^ 14 per cent educated upto primary school and 11 per cent upto middle or high school want a student to be concerned with his studies only.
Sixty-one per cent of the teachers whose fathers are barely literate or illiterate, 43 per cent educated upto primary school, 37 per cent upto middle or high school, 33 per cent educated traditionally in the sanskritic system and 100 per cent of the teachers who are not aware of the education of their fathers say that a student should also devote time to household duties.
Twenty-nine per cent of the teachers whose fathers are barely literate or illiterate, 41 per cent educated upto primary school, 49 per cent upto middle or high school level, 50 per cent upto college level and 33 per cent educated traditionally in the sanskritic system say that a student should also devote time to welfare work.
Two per cent with fathers educated upto primary school and 3 per cent upto middle or high school level say that a student should also take part in politics ; 50 per cent of the teachers whose fathers are educated upto college level and 33 per cent educated traditionally in the sanskritic system are undecided.
(ii) Caste and Performance of the Student— the Teachers' Views
Teachers observe that the performance of a student in the examination depends upon the caste in which one is bom ; 64 per cent of the male and 48 per cent of the female teachers say that students of upper castes do better in their studies than students of the lower castes ; 11 per cent of the male and 15 per cent of the female teachers are not in a position to say anything.
(a) Differences by rural/urban location : Fifty per cent of theteachers employed in urban areas, 83 per cent of the teachers in non-urban areas and 60 per cent of the teachers in rural areas say that students belonging to upper castes do better in their studies than students of lower castes ; 16 per cent of the teachers in urban areas and 12 per cent of them in rural areas cannot say anything.

(b) Teachers’ education as a variable : According to their differentacademic qualifications, 74 per cent of the teachers who are non-matrics,51 per cent who are matriculates and 100 per cent who are non-graduates say that students of upper castes do better in studies than students of lower castes ; 16 per cent who are non-matrics and 25 per cent who are matriculates say that it is not so ; 10 per cent who are non-matrics and 23 per cent who are matriculates cannot say anything. It is seen that the greater number of teachers, matriculates, non-matriculate as well as graduates, feel that students belonging to upper castes do better than others in studies.
(iii) Religion and Performance of the Student— the Teachers’ Views
About the role of religion in the performance of students, 38 per cent of the male and 40 per cent of the female teachers say that students belonging to certain religious groups have better performance than students belonging to certain other religious groups, while 34 per cent of the male and 29 per cent of the female teachers cannot say anything.
(a) Differences by rural/urban location : Further 39 per cent ofthe teachers employed in urban areas, 50 per cent of them in non-urban areas and 37 per cent of them in rural areas feel that students belonging to certain religious groups do better in their lessons than students belonging to certain other religious groups ; 37 per cent of the teachers in urban areas and 47 per cent of them in rural areas cannot say anything.
(b) Education as a variable : Again 46 per cent who are non-matrics, 41 per cent who are matriculates and 25 per cent who are nongraduates say that students belonging to certain religious groups fare better than students of other religious groups. Twenty-eight per cent who are non-matrics, 35 per cent who are matrics and 75 per cent who are nongraduates cannot say anything. The percentages of teachers who believe that students belonging to certain religious groups do better in studies than others, is larger among the matriculates and non-matriculates than among those educated up to the higher (non-graduate) level.
(iv) Language and Performance of the Student— the Teacher^ Views
Regarding language groups and performance 39 per cent of the male and 40 per cent of the female teachers say that students belonging to some language groups are better than others ; 31 per cent of the male and 33 per cent of the female teachers say it is not so ; 30 per cent of the male and 20 per cent of the female teachers are unable to say anything definite. Though some teachers feel that students belonging to certain religious and linguistic groups do better in studies than others,

the percentage of teachers who say so do not form the bulk among the teachers,
(a) Differences by rural/urban location : About language and performance, 39 per cent of the teachers in urban areas, 67 per cent of the teachers in non-urban areas and 37 per cent in the rural areas say that students of some language groups do better than those of others ; 30 per cent of the teachers in urban areas, 33 per cent of the teachers in non- urban areas and 33 per cent in rural areas say that is not so ; 30 per cent of the teachers in urban areas, and 21 per cent in the rural areas are not in a position to say anything.
(b) Education as a variable ; Again 44 per cent of teachers who are non-matrics, 42 per cent who are matriculates and 20 per cent who are nongraduates say that students belonging to one language group are better than others ; 34 per cent who are non-matrics, 32 per cent who are matrics and 20 per cent who are non-graduates say it is not so ; 20 per cent who are non-matrics, 25 per cent who are matriculates and 60 per cent who are non-graduates cannot say anything. It is clear that while a larger number of matriculate and non-matriculate teachers say that students belonging to certain linguistic groups do better in studies, 60 per cent of non-gradtiate teachers are not in a position to say anything on the issue.
(v) The Goal of Education~as Seen by the Teachers
When questioned about their view regarding the principal goal of education, 10 per cent of the male teachers and 9 per cent of the female teachers say that the goal of education is to provide economic security; 10 per cent of the male and 12 per cent of the female teachers say that it is to achieve higher status in the society ; 16 per cent of the male and19 per cent of the female teachers say that it is to be a cultured person; 59 per cent of the male and 48 per cent of the female teachers say that it is to turn one into a good citizen ; 3 per cent of the male teachers say that it is some thing else, while 2 per cent of the male and 3 per cent of the female teachers are unable to say anything ; 9 per cent of the female teachers have not responded. The greater number of teachers agree that the principal goal of education is to turn one into a good citizen.
(a) Education as a variable : An effort was made to discuss whetherthey had different ideas about the principal goal of education ; 8 per cent of the teachers who are non-matrics and 8 per cent who are matriculates say that it is to provide economic security ; 10 per cent who are non- matrics and 11 per cent who are matrics say that it is to achieve higher status in society ; 23 per cent who are non-matrics and 12 per cent who are matrics say that it is to be a cultured person ; 46 per cent who are non-matric, 62 per cent who are matrics and 100 per cent who are

non-graduates say that it is to turn the student into a good citizen ; 7 per cent who are non-matrics say that it is some other goal and 5 per cent who are non-matric and 1 per cent matriculates cannot say anything. Larger number of teachers who are non-matrics, matriculates and nongraduates say that the principal goal of education is to turn one into a good citizen.
(b) Parental education as influencing teachers’ opinions about the god of education : To the question about the principal goal of education,teachers with different educational backgrounds answered as follows : 10per cent of the teachers whose fathers are barely literate or illiterate, 9 per cent whose fathers are educated upto primary school, 3 per cent upto college standard say that it is to provide economic security.
Twenty-one per cent of the teachers whose fathers are barely literateor illiterate, 16 per cent of the teachers whose fathers are educatedupto primary school and 11 per cent upto middle or high school say that it is to achieve higher status in society.
Twenty-one per cent of the teachers whose fathers are barely literateor illiterate, 23 per cent of the teachers whose fathers are educated uptoprimary school, 11 per cent of the teachers whose fathers are educated upto middle or high school and 33 per cent educated traditionally in the sanskritic system say that it is to be a cultured person.
Fifty-nine per cent of the teachers whose fathers are barely literate or illiterate, 45 per cent educated upto primary school, 71 per cent upto middle or high school, 50 per cent upto college level, 67 per cent educated traditionally in the sanskritic system and 100 per cent of the teachers who do not have any idea of the educational standard of their fathers say that the goal of education is to turn the student into a good citizen.
Three per cent of the teachers whose fathers are barely literate or illiterate, 4 per cent educated upto prhnary school say that it is something else ; 3 per cent of the teachers whose fathers are barely literate or illiterate, 2 per cent educated upto primary school and 3 per cent upto middle or high school cannot say anything. A large number of teachers whose fathers are illiterates, educated upto primary, middle or high school, college educated or educated in the traditional system feel that the goal of education is to turn one into a good citizen. But it may be noted that 50 per cent of the teachers whose fathers are college educated feel that the goal is to provide economic security.
(c) The rural-urban background of the teachers and their views regarding the goal of education ; This paragraph gives an account of the views regarding the principal goal of education of teachers who mainly grew up in a village, town, city or mixed place—9 per cent of the teachers who grew up in a village, 3 per cent in a town, and 13 per

cent in a city think that the goal of education is to provide economic security ; 13 per cent of the teachers who grew in a village, 14 per cent in a town say that it is to achieve higher status in society ; 17 per cent of the teachers who grew in a village, 25 per cent in a town, 13 per cent in a city and 25 per cent in naixed places say that it is to be a cultured person ; 55 per cent who grew up in a village, 50 per cent in a town, 70 per cent in a city and 62 per cent in mixed places say that it is to turn into a good citizen ; 2 per cent who grew in a village, 3 per cent in a town, and 12 per cent m mixed places say that it is something else ; 3 per cent who grew in a vUlage, and 3 per cent in town are not in a position to say anything. Larger number of teachers with different rural- urban backgrounds feel that the goal of education is to make the student a good citizen. Among them large number of teachers who grew up in a city fay that the goal of education is to turn the student into a good citizen.
(vi) Teachers’ Views about the Present System of Education
To the question whether they agree with the statement that the present system of education does not inculcate any sense of values in the younger generation, 34 per cent of the male and 26 per cent of the female teachers say that they agree; 39 per cent of the male and 33 per cent of the female teachers say that the statement is partially true ; 20 per cent of the male and 24 per cent of the female teachers disagree ; 6 per cent of the male and 9 per cent of the female teachers partially agree with this view that the present system of education does not inculcate any sense of values in the younger generation.
(a) Age as a variable : Further 38 per cent of the teachers belongingto different age groups partially agree to the statement that the present system of education does not inculcate any sense of values in the younger generation ; 67 per cent of the teachers aged between 51 and 55 years and 41 per cent of the teachers aged between 30 and 35 years completely agree with the statement; 50 per cent of the teachers aged between 36 and 40 years, and 40 per cent of teachers aged between 46 and 50 years disagree with the statement.
(b) Teaching experience as related to views about the present systemof education : Thirty-three per cent of the teachers who have 5 or lessthan 5 years of teaching experience, 14 per cent of the teachers who have6 to 10 years of experience, 45 per cent of teachers who have 11 to 15 years of experience, 25 per cent of the teachers who have 16 to 20 years and 50 per cent who have more than 20 years of experience agree with the statement that the present system of education does not inculcate any sense of values in the younger generation.

Thirty-nine per cent of the teachers who have 5 or less than 5 years experience, 42 per cent who have 6 to 10 years experience, 20 per cent who have 11 to 15 years, 50 per cent who have 16 to 20 years and 30 per cent who have more than 20 years of experience partially agree with the view ; 21 per cent of teachers who have 6 to 10 years, 25 per cent who have 11 to 15 years, 25 per cent who have 16 to 20 years and 10 per cent who have more than 20 years of experience disagree with the statement; 17 per cent of teachers who have 5 or less than 5 years, 15 per cent who have 6 to 10 years, 10 per cent who have 11 to 15 years and 10 per cent who have more than 20 years of experience are not in a position to say anything. While more number of teachers who have 11 to 15 years and over 20 years of teaching experience agree that the present system of education does not inculcate any sense of values in the younger generation, a large number of teachers with 6 to 10 years,16 to 20 years and 5 or less than 5 years of teaching experience only partially agree with the idea.
(vii) Teachers’ Image of the Students
When the teachers were asked to describe the school student, 80 per cent of the male and 69 per cent of the female teachers say that the students are purposive ; 75 per cent of the male and 74 per cent of the female teachers say that the students are studious ; 64 per cent of the male and 41 per cent of the female teachers say that the students are capable of independent thought and 85 per cent of the male and 65 per cent of the female teachers say that students are disciplined ; 84 per cent of the male and 76 per cent of the female teachers say that students are deferential. Both male and female teachers in large percentage attribute positive qualities to their students.
(a) Age as a variable : It is interesting to observe the image ofstudents as viewed by the teachers belonging to different age groups. Sixty-two per cent of the teachers in the age group of 20 and below 20 years, 83 per cent between 21 and 25 years, 83 per cent between 26 and 30 years, 95 per cent between 31 and 35 years, 90 per cent between 36 to 40 years and 100 per cent between 51 to 55 years say that the students are purposive.
Seventy-eight per cent of the teachers in the age group of 20 and below 20 years, 92 per cent between 21 to 25 years, 74 per cent between 26 to 30 years, 95 per cent between 41 to 45 years, 80 per cent between 46 to 50 years and 67 per cent between 51 and 55 years say that the students are studious.
Twenty-eight per cent of the teachers in the age group of 20 years and and below 20 years, 70 per cent of them between 21 to 25 years, 64 per

cent between 26 to 30 years, 71 per cent between 31 to 35 years, 60 per cent between 36 to 40 years, 40 per cent between 41 to 45 years, 40 per cent between 46 to 50 years, 33 per cent between 51 to 55 years say that the students are capable of independent thought.
Eighty-nine per cent of the teachers in the age group of 20 years and below 20 years, 88 per cent of them between 21 to 25 years, 87 per cent of them between 26 to 30 years, 89 per cent of them between 31 to 35 years, 90 per cent between 36 to 40 years, 57 per cent between 41 to45 years, 80 per cent between 46 to 50 years and 66 per cent between 51 to 55 years say that the studetits are disciplined^
Eighty-seven per cent of the teachers in the age group of 20 years and below 20 years, 96 per cent between 21 to 25 years, 80 per cent between 26 to 30 years, 95 per cent between 31 to 35 years, 90 per cent between 36 to 40 years, 100 per cent between 41 and 45 years, 80 per cent between46 to 50 years and 100 per cent between 51 to 55 years say that the students are deferential.
(b) Parental education and differences in the teachers’ image of the students : 92 per cent of the teachers whose fathers are illiterate orbarely literate, 85 per cent who are educated upto primary school level, 84 per cent who are educated upto middle or high school, 50 per cent who are educated upto college level and 100 per cent who are educated traditionally in the Sanskritic system and 100 per cent of those who do not know the education of their fathers say that students are purposive.
Ninety-six per cent of teachers whose fathers are illiterate or barely literate, 80 per cent who are educated upto primary school, 84 per cent upto middle or high school level, 50 per cent upto college level, 66 per cent educated traditionally in the sanskritic system and 100 per cent of the teachers who do not know the education of their fathers say that the students are studious.
Fifty-nine per cent of the teachers whose fathers are illiterate or barely literate, 67 per cent of the teachers whose fathers are educated upto primary school, 52 per cent upto middle or high school, 67 per cent educated traditionally in the sanskritic system, and 100 per cent of the teachers who do not know the educational standard of their fathers say that students are capable of independent thought.
Eighty-six per cent of the teachers whose fathers are illiterate orbarely literate, 76 per cent whose fathers are educated upto primary school,91 per cent upto middle or high school level, 100 per cent upto college level, 67 per cent educated traditionally in the sanskritic system, and 100 per cent of the teachers who do not have any idea of their fathers education say that students are disciplined.
Ninety-six per cent of the teachers whose fathers are barely literateor illiterate, 86 per cent educated upto primary school, 90 per cent upto

middle or high school level, and all the other teachers whose fathers are college educated or traditionally educated in the sanskritic system and also of those who do not know their fathers’ educational standards, say that the students are deferential.
Greater number of teachers with different educational backgrounds find students purposive, studious, capable of independent thought, disciplined and deferential. Only the teachers whose fathers are college educated say that the students are incapable of independent thought.
(c) The rural-urban background of the teachers as related to their image oj students; Niaely-three per cent of the teachers who grew up in a village, 78 per cent of teachers who grew up in a town, 85 per cent in a city, and 57 per cent in mixed places say that the students are purposive.
Ninety-three per cent who grew up in villages, 64 per cent in a town, 92 per cent ui a city, and 66 per cent in mixed places say that the students are studious.
Sixty-eight per cent of teachers who grew up in a village, 46 per cent in a town, 50 per cent in a city and 33 per cent in mixed places say that the students are capable of independent thought.
Eighty-four per cent who grew up in a village, 83 per cent in a town,84 per cent in a city and 71 per cent in mixed places say that the students are disciplined.
Ninety-two per cent of the teachers who grew up in a village, 91 per cent in a town, 87 per cent in a city and 83 per cent in mixed places say that students are deferential.
Teachers in greater number irrespective of the rural or urban background find students purpasjive, studious, disciplined and deferential. Barring the teachers who grew up in the village the other teachers tried to believe that the student is not capable of independent thought.
8. THE SOCIAL ATTITUDES AND VALUES OF TEACHERS
In the following paragraphs the teachers have recorded their attitudes and values towards the way of living, the mode of life, trait which determines respect, the quality which they admired the most, their status in society etc.
(i) Teachers’ Preference for the Religious or the Materialistic Way of Life
In order to find out whether the teachers preferred the religious or the materialistic way of life they were asked the following question.
There were two sons of a father, both of whom wanted to help their country. The first son set out to be a holy man. He gave up everything in order to show to his countrymen the path of goodness in this life.

and salvation hereafter. The second son set out to establish a big factory, which gave work to hundreds of his countrymen, and which produced inexpensive goods that many people needed.
Which of the two sons do you personally admire most ?1 ------------ pirst son 2 ------------ Second son3 I am not clear about my choiceOnly 15 per cent of the male and 14 per cent of the female teachers
say that they admire the first son and thus indicate their performance for the religious way of life ; 82 per cent of the male and 74 per cent of the female teachers admire the second son and iadicate a preference for a materialistic way of life ; 3 per cent of the male and 3 per cent of the female teachers are not clear about their choice. Most of them prefer the materialistic way of life.
(ii) Whether Teachers Prefer a Person who Accomplishes Things or One who Wishes to be Left Alone
Similarly the teachers were asked to choose between a person who accomplishes things and one who wishes to be left alone, in the following question.
There were two persons talking about how they liked to live. They had different ideas :
One said : I like to accomplish things. 1 like to see results whichare worth working for (1)
The other said : I wish to be left alone to enjoy life aSI go along (2)
Which of the two persons, in your opinion, has the better attitude to life ?
1 ------------------- or 2 ------------------98 per cent of the male and 88 per cent of the female teachers say
that they like to accomplish things to see results worth working fo r ;2 per cent of the male and 3 per cent of the female teachers like to be left alone to see and enjoy life.
Differences By Rural/Urban Location : An analysis of theresponses to this question on the basis of the ruralurban differential indicates that 100 per cent of the male and 97 per cent of the female teachers In urban areas, all male and female teachers in the non-urban areas, 67 per cent of the male and 29 per cent of the female teachers in rural areas prefer the person who accomplishes things ; 2 per cent of the female teachers in urban areas, 2 per cent of the female teachers in non-urban and2 per cent of the female teachers in rural areas prefer the person who likes to be left alone.
Apart from their preference for one or the other way of life the

teachers interviewed were also asked to state what type they consider themselves nearer to. All the male teachers and 97 per cent of the female teachers in urban areas, aU the male and female teachers in non- urban areas, 97 per cent of the male and 67 per cent of the female teachers in the rural areas identify their way of life as that of the accomplishing type. Only 2 per cent of the female teachers in urban areas wish to identify themselves with one who likes to be left alone.
Finally they were asked to state their impression regarding the tpye that most teachers would prefer. Ninety per cent of the male and 86 per cent ot the female teachers in urban areas, 94 per cent of the male and 66 per cent of the female teachers in rural areas think that most of the other teachers would say the accomplishing type had the better way of living; 10 per cent of the male and 14 per cent of the female teachers in urban areas, 6 per cent of the male and 33 per cent of the female teachers in rural areas think that most of the other teachers would prefer to say that the type of person who wished to be left alone to enjoy life as he went along had a better way of living. It is significant to note that most of the teachers in urban areas and non-urban areas prefer the person who accomplishes things and identify themselves with such a person. They also say that most others would also say so. The majority of teachers in urban, rural and non-urban areas say that the former is a better way of living.
(iii) Whether Improvements of One’s Lot in Life Depends on Religion
The question by which an effort was made to gauge the teachers’ secular, or non-secular attitude to life was as follows.
“Whether or not a man strives to improve his lot in life depends upon whether he believes in any religion. Do you agree ?”
Only 17 per cent of the male and 22 per cent of the female teachers say that whether a man strives or not depends “wholly” upon the religious belief he has ; 34 per cent of the male and 22 per cent of the female teachers say that it “partially” depends on religion ; 41 per cent of the male and 29 per cent of the female teachers think that religion has “nothing to do with it” ; 5 per cent of the male and 17 per cent of the female teachers “do not know” what to say in the matter. The greater number of teachers do not think that religion has anything to do with the improvement of one’s lot in life.
(a) Differences By Rural/Urban Location : When the teacherswere asked to give their view regarding the belief that religious faith is responsible for the improvement of one’s lot in life, 15 per cent of the male and 30 per cent of the female teachers employed in urban areas, 20 per cent of the male teachers in non-urban areas believe that one who

has belief in religion will certainly improve his lot in life ; 35 per centof the male teachers and 6 per cent of the female teachers employed inurban areas, 20 per cent of the male teachers in non-urban areas, 36per cent of the male and 48 per cent of the female teachers in the rural areas say that it depends partially on religion. 45 per cent of the male and 35 per cent of the female teachers in urban areas, 60 per cent of the male and 100 per cent of the female teachers in non-urban areas, 36 per cent of the male and 19 per cent of the female teachers in rural areas do not think religion has anything to do with i t ; 5 per cent of the male and28 per cent of the female teachers in urban areas and 25 per cent of the male teachers in rural areas say that they do not know. A large number of male teachers in urban and non-urban areas and all the female teachers in non-urban areas feel that religion has no role to play in the improvement of one’s lot in life.
(iv) Teachers' Views regarding the Qualities that Determine Respectfor an Individual
The teachers were asked to state their views regarding the qualities that determine respect for an individual ; 24 per cent of the male and 15 per cent of the female teachers say that respect is given to those who “come from a well known or distinguished family” ; 5 per cent of the male and 5 per cent of the female teachers say that the quality that determines respect is “a large income” ; 62 per cent of the male and 55 per cent of the female teachers say that respect is given to “one who is highly educated” ; 6 per cent of the male and 15 per cent of the female teachers say that it is some quality other than these two which determines respect, while 2 per cent of the male teachers do not respond to the question at all. The greater number of teachers say that they respect the highly educated.
Differences By Rural/Urban Location : In describing the traitthat determine respectability 20 per cent of the male and 17 per cent of the female teachers in urban areas, 20 per cent of the male teachers in non-urban areas, 28 per cent of the male and 15 per cent of the female teachers in rural areas say that it depends upon a well known or distinguished family; 20 per cent of the male teachers in non-urban areas, 5 per cent of the male and 8 per cent of the female teachers in urban areas and 3 per cent of the male teachers in rural areas feel that it depends upon the large income one gets ; 75 per cent of the male and 56 per cent of the female teachers in urban areas, 60 per cent of the male and 100 per cent of the female teachers in non-urban areas ; 55 per cent of the male and 52 per cent of the female teachers in rural areas feel that it all depends upon higher education ; 19 per cent of the female teachers

in urban areas, 11 per cent of the male and 9 per cent of the female teachers in rural areas think it depends upon “something else”. Only 3 per cent of the male teachers employed in rural areas do not respond. Most of theteachers feel that high education determines respect for an individual.Among them all the female teachers in non-urban areas respect the highly educated.
(v) Teachers’ View on whether Politicians heed their Opinions
Teachers were asked the following question to find out whether they believed the politicians or leaders in the country paid any heed to their opinions.
“In your view, how much attention do politicians (leaders of thecountry) pay to the opinions of people like yourself ?”
1 ------------ A great deal 2 ------------ Only a little3 None at all 4 --------- -— I do not know
20 per cent of the male and 9 per cent of the female teachers say that politicians pay “a great deal of attention” ; 57 per cent of the male and 43 per cent of the female teachers say that they only pay “a little attention” ; 20 per cent of the male and 26 per cent of the female teachers say that politicians “pay attention” to the opinions of people like themselves ;3 per cent of the male and 14 per cent of the female teachers say that they do not know whether or not politicians pay attention to the opinions of persons like themselves. The number of teachers who say that “only a little attention” is being paid by politicians to what they have to say, is generally high.
Differences By Rural/Urban Location : 35 per cent of the maleand 3 per cent of the female teachers employed in urban areas, 14 per cent of the male and 19 per cent of the female teachers employed in non-urban areas, 14 per cent of the male and 19 per cent of the female teachers inrural areas say that a great deal of attention is given ; 45 per cent of themale and 53 per cent of the female teachers in the urban areas, 60 per cent of the male teachers in non-urban areas, 64 per cent of the male and29 per cent of the female teachers in the rural areas say that they pay only a little attention ; 20 per cent of the male and 36 per cent of the female teachers in urban areas, 40 per cent of the male teachers in non-urban areas, 17 per cent of the male and 9 per cent of the female teachers in rural areas say that their opinions are never heard ; 8 per cent of the female teachers in urban areas, 100 per cent of the female teachers in non-urban areas, 25 per cent of the male and 19 per cent of the female teachers inrural areas express that they do not know. Large number of the teachers

in urban and non-urban areas feel that only a little attention is paid by politicians to their words.
(vi) Communication with Government Officials or Political Leaders
When the teachers were asked whether they communicate with political leaders, 8 per cent of the male teachers say that they have written to such persons many a times ; 44 per cent of the male and 27 per cent of the female teachers say that they have written only sometimes ;47 per cent of the male and 43 per cent of the female teachers have never written to such persons. So it is clear that larger number of teachers have never written to political leaders and government officials.
Differences By Rural/Urban Location : 10 per cent of the maleteachers in urban areas, 20 per cent of them in non-urban areas and 6 per cent of them in rural areas say that they have done so “many a times” ; 60 per cent of the male and 31 per cent of the female teachers in urban areas and 42 per cent of the male and 24 per cent of the female teachers in non-urban areas and 42 per cent of the male and 24 per cent of the female teachers in rural areas have done so “sometimes” ; 30 per cent of the male teachers and 69 per cent of the female teachers in urban areas, 80 per cent of the male and 100 per cent of the female teachers in non- urban areas, 53 per cent of the male and 52 per cent of the female teachers in rural areas have “never” done so. A large number of teachers inform that they have never written to political leaders, but the percentages of those who have never written are generally higher in the rural areas than in the urban areas. While 80 per cent of the male teachers in non-urban areas have never written to political leaders, only 40 per cent of male teachers in urban areas say so. As many as 40 per cent of the male teachers in urban areas have at least “sometimes” written to political leaders.
(vii) The Quality the Teachers admire most
When asked about the quality these teachers admire most among people 28 per cent of the male and 26 per cent of the female teachers say that they like a person who does his work well; 8 per cent of the male and 12 per cent of the female teachers say that they like those who are ambitious ; 2 per cent of the male and 7 per cent of the female teachers say that they like those who are generous ; 40 per cent of the male and17 per cent of the female teachers say that they like those who are active in public life ; 5 per cent of the male and 14 per cent of the female teachers state that they like the thrifty ; 2 per cent of the male teachers like one who does not let anyone take advantage of him ; 13 per cent of

the male and 15 per cent of the female teachers like those who are respectful. On the whole, the larger number of male teachers admire the person who is active in social and public hfe, whereas most of the female teachers admire one who does work well.
Differences By Rural/Urban Location : Thirty per cent of themale teachers and 27 per cent of the female teachers in urban areas, 40 per cent of the male and 100 per cent of the female teachers in non-urban areas, 27 per cent of the male and 24 per cent of the female teachers in rural areas admire one who does one’s work well ; 11 per cent of the female teachers in urban areas, 14 per cent of the male and 15 per cent of the female teachers in rural areas admire the ambitious ; 6 per cent of the female teachers, 3 per cent of the male and 9 per cent of the female teachers admire the generous ; 40 per cent of the male and 22 per cent Of the female teachers in urban areas, 40 per cent of the male and 9 per cent of the female teachers in rural areas, admire one who is active in social and public life ; 17 per cent of the female teachers in urban areas,40 per cent of the male teachers in non-urban areas, 3 per cent of the male and 9 per cent of the female teachers in rural areas like the thrifty. Only 3 per cent of the male teachers in rural areas admire those who do not let others take advantage of them; 30 per cent of the male and 19 per cent of the female teachers in urban areas, 20 per cent of the male teachers in non-urban areas, 11 per cent of the male and 9 per cent of the female teachers in rural areas admire those who are respectful.
It is significant to note that a large number of male teachers in urban areas and rural areas admire one who is active in public and social life whereas all the female teachers in non-urban areas and large number of male teachers in non-urban areas prefer one who works well.
(viii) Whether it is Easy or Hard to Move up in Society
When asked whether it is easy or hard to move up in society, 8 per cent of the male and 10 per cent of the female teachers say that it is easy ;92 per cent of the male and 79 per cent of the female teachers say that it is hard ; 10 per cent of the female teachers say that they do not know whether it is easy or hard to move up the social ladder. Most of the teachers believe that it is hard to move up in society.
Differences By Rural/Urban Location : 5 per cent of the male and20 per cent of the female teachers employed in urban areas, and 11 per cent of the male teachers in rural areas think it is easy to move up ; 95 per cent of the male and 72 per cent of the female teachers in urban areas, 100 per cent of the female teachers in non-urban areas, 89 per cent of the male teachers and 67 per cent of the female teachers in rural areas believe that it is hard ; 11 per cent of the female teachers in urban areas, 100 per

cent of the male teachers in non-urban areas and 9 per cent of the female teachers in rural areas say that they do not know. Most of the teachers employed in urban, rural and non-urban areas say that it is hard to move up in society. It is significant to note that none of the male teachers in non-urban areas have responded to the question. All the female teachers in non-urban areas have responded to the question and they find it hard to move up in society.
Section III — H eads of Primary Schools
1. THEIR SOCIAL BACKGROUND
The heads of primary schools were asked to give information regarding their age, caste, mother tongue, religion, regarding the occupation and education of their fathers and grandfathers, and their rural-urban residence, in order to understand their social background. Of the 28 heads of schools contacted, 23 are head masters and 5 are head mistresses.
(i) Age
Two male and 1 female heads of schools are in the age group of 21 and 25 years ; 3 head masters and 1 head mistress are in the age group of 26 to 30 years ; 4 head masters are in the age group of 31 to 35 years ; 2 head masters and 2 head mistresses are in the age group of 36 to 40 years ; 4 head masters are in the age group of 41 to 45 years ; 5 head masters and1 head mistress are in the age group of 46 to 50 years ; 3 head masters are in the age group of 51 to 55 years. It is seen that more number of head masters are in the age group of 46 to 50 years whereas more number of head mistresses are aged between 36 to 40 years.
(ii) Caste
Two head masters belong to the scheduled castes ; 7 head masters belong to the other backward classes ; 9 head masters and 4 head mistresses belong to castes other than the scheduled and backward and 3 head masters and 1 head mistress say that caste is not applicable to them; 2 head masters have not answered the question. The greater number of heads of schools belong to “other castes”.

(iii) Religion
Twenty head masters and 4 head mistresses say that they are Hindus ;2 head masters say that they are Muslims ; one head mistress says that she is a Christian while one other head master has not responded to the query regarding his religion.
(iv) Language
The mother tongue of one head master and one head mistress is English; that of 1 head master is Gujarati; that of 2 head mistresses is Hindi; and that of 15 head masters and 4 head mistresses is Kannada. Most of the heads of schools say that their mother tongue is Kannada.
(v) Economic Circumstances
To the question “How would you describe the economic circumstances in which you grew up ?”, 11 head masters and 2 head mistresses say thatthey grew up under difficult or stringent economic circumstances, 9 head masters and 1 head mistress say that it was average ; 2 head masters say it was well-off while 1 head master says that it varied from time to time ;2 head mistresses have not responded.
(vi) Occupational Background
(a) Grandfather’s Occupation : When asked about their grandfathers’ occupation, 5 head masters and 1 head mistress say that their grandfathers were owners of farm, dairy, land, etc ; 4 head masters say that their grandfathers’ occupations related to group 2, namely, tenant cultivator, peasant proprietor, independent fisherman, etc ; the occupation of the grandfather of one head mistress belongs to group 5, namely, owner of small business, retail shop, independent businessman, tailor, barber, hawker, peddlar, priest, medicinemen etc. ; grandfathers of 2 head masters pursued such occupation as executive and scientific or technical person, various types of officers, professors, lecturers, doctors, lawyers, etc. employed by public or private sector ; the grandfathers of 2 head masters and 2 head mistresses pursued occupation of group 7, such as ordinary administrative staff, clerk, stenographer, cashier, record keeper, school teacher etc. ; the grandfather of one head master pursued such occupation as, skilled manual worker, foreman, machineman, miner, factory worker, etc ; and that of one head master relates to group 9, namely unskilled staff, peon, darwan, cooly, non-agricultural day labourer etc ; while the occupation of grandfathers of large number of head masters is ownership of farm, dairy etc., that of grandfathers of large number of head mistresses is the ordinary administrative staff etc.

(b) Father’s Occupation : About their fathers’ occupation, 4head masters and one head mistress say that their fathers’ occupations were such as owner of farm, dairy, land etc ; that of 4 head masters relates to group 2, namely, tenant cultivator, peasant proprietor, independent fisherman etc. The occupation of father of one head master was of group 6 e.g. executive and scientific or technical person, various types of officers, professors, lecturers, doctors, lawyers etc. The fathers of 2 head masters and 2 head mistresses pursued occupation of group 7 such as ordinary administrative staff, clerk, stenographer, cashier, record keeper, school leacheis elc ; the ialhei of one head master followed an occupation belonging to the group of skilled manual worker, foreman, machineman, miner, factory worker, etc ; and the occupation of the father of one head master relates to group 9, namely unskilled staff, peon, darwan, cooly, non-agricultural day labourer etc.
The larger number of head mistresses say that the occupation of their fathers belonged to group 7, namely ordinary administrative staff while that of the larger number of teachers is ownership of farm or tenant cultivation etc,
(vii) Educational Background
(a) Education Of The Grandfather ; About the education of the grandfathers of these heads of schools, 13 head masters and 1 head mistress say that their grandfathers are barely literate or illiterate ; 7 head masters say that their grandfathers are educated upto the primary school; one head master and one head mistress say that their grandfathers are educated upto middle or high school level; 2 head masters and 2 head mistresses say that their grandfathers are traditionally educated in the sanskritic system ; and one head mistress is unable to say anything. While the grandfathers of the greater number of head masters are illiterate, the grandfathers of the number of head mistresses are educated in the traditional system.
(b) Father’s Education : When asked about the educational background of the fathers of these heads of schools, 8 head masters say that their fathers are either barely literate or illiterate ; 9 head masters say that their fathers are educated up to primary school; 5 head masters and 4 head mistresses say that the education of their fathers is up to middle or high school; one head master and one head mistress say that their fathers are traditionally educated in the sanskritic system. It is seen that fathers of a larger number of head masters are educated up to primary school while fathers of the greater number of head mistresses are educated up to middle or high school.

(viii) Rural/Urban Background
(a) Whether they had schooling at a place smaller than a tehsil ortaluk town : When asked about the place where actually these heads ofschool were schooled, 16 head masters and 3 head mistresses say that they were schooled in a school situated at a place smaller than a tehsil or a taluk town ; 6 head masters and 1 head mistress were educated at a place other than these. Most of the heads of schools were schooled at a place smaller than a tehsil or taluk town.
(b) Where they mainly grew up— in towns, cities or villages : Tothe question “Where did you mainly grow up?”, 12 head masters and1 head mistress say that they grew up mainly in a village ; 7 head masters and 3 head mistresses say that they grew up in a town ; 2 head masters in a city; and 2 head masters and 1 head mistress in a mixed place. While the greater number of head masters grew up in a village, the greater number of head mistress grew up in a town.
2. ACADEMIC AND PROFESSIONAL QUALIFICATIONS
The heads of schools were asked to give information regarding their academic and professional achievements and teaching experience, in order to understand their professional equipment,
(i) Academic QualificationsAmong the heads of schools, 6 head masters and 1 head mistress
say that they are non-matrics ; 14 head masters and 3 head mistresses are matriculates; 2 head masters and 1 head mistress are non-graduates ; one head master is a graduate. In the highest examination they have passed 2 head masters and 1 head mistress have got a first class ; 8 head masters and 2 head mistresses have obtained second class ; 10 head masters and 2 head mistresses have got third class or a pass, and one head master has got no such class. The greater number of heads of schools are matriculates and have passed the highest examination in third class.
(ii) Professional Qualifications
About their professional qualifications—2 head masters and 1 head mistress are not professionally qualified ; 11 head masters and 1 head mistress have passed the primary teachers’ training certificate ; 6 head masters and 2 head mistresses have completed the secondary teachers’ training certificate ; one head master has passed the teachers diploma while another head master holds a teacher’s degree. It is seen that larger number of head mistresses are better qualified than head masters.

3. TEACHING AND PROFESSIONAL EXPERIENCE
(i) Total Experience
To the question “For how many years have you been engaged in teaching ?” the responses are as follows : 2 head masters and 1 headmistress have 5 or less than 5 years of teaching experience ; 3 head masters and 1 head mistress have 6 to 10 years of teaching experience ;4 head masters and 1 head mistress have 11 to 15 years of experience ; 7 head masters and 1 head mistress have 16 to 20 years of experiences ; 7 head masters and 1 head mistress have 20 years or more o£ teaching experience. Larger number of head masters have more teaching experience than head mistresses.
(ii) Total Experience in the Institution in which They were Interviewed
Further, 16 head masters and 3 head mistresses have been serving in the institution where they are engaged at present for 5 or less than 5 years ;4 head masters and 1 head mistress have been engaged from 6 to 10 years ; 3 head masters and 1 head mistress for 16 to 20 years.
(iii) Number of Institutions They have Worked in
The Heads of schools were asked to give information regarding the number of schools in which they were working before they joined the institution wherein they are presently employed. About the number of institutions in which they have worked before they were employed in the institution wherein they are working at present, 2 head masters have worked in one institution, prior to joinkig the kistitution where they are working at present; 4 head masters have worked in 2 institutions ; 2 head masters and 1 head mistress in 3 institutions ; one head mistress in four institutions ; 3 head masters in 5, one head master and one head mistress in 6, one head master in 7, 3 head masters in 8 and 2 head masters have worked in 9 institutions. Large number of heads of schools have been engaged in the institution where they are employed at present for 5 or less than 5 years.
It is seen that greater number of heads of schools are matriculates who have passed their highest examination in III class and that head masters have put in far larger number of years in teaching than head mistresses though the latter are professionally better qualified than the head masters.
4. THE CHOICE OF TEACHING AS A CAREER
In order to know, whether these teachers have taken up teaching

voluntarily or otherwise, and also to understand their willingness to continue in the profession, a few questions were asked of the school heads interviewed.
(i) Whether They had Pursued an Occupation other than Teaching
When asked whether they ever pursued an occupation other than teaching, at any stage of their career, it was found that 18 head masters and 3 head mistresses have “never” pursued any other occupation ; 4 head masters had pursued another occupation before they took to teaching; one head master and 2 head mistresses have been doing it along with teaching.
(ii) Whether They wished to Choose Another Occupation
To the question “Before you took to teaching as a career, did you wish to choose any other occupation ?”, 6 head masters respond by sayingthat they desked to ; 14 head masters and 5 head mistresses say that they never desired to take up another occupation ; 3 head masters are not in a position to say anything. The greater number of heads of schools had no desire to pursue an occupation other than teaching.
(iii) Their Willingness to Continue in the Profession
When asked, whether the heads of schools would like to change their profession, if an opportunity arises, 6 head masters and one head mistress expressed their desire to change ; 6 head masters think that it is too late to change ; 9 head masters and four head mistresses would not like to change.
5. THEIR IMAGE OF THEIR OCCUPATIONAL AND SOCIAL STATUS
(i) Occupational Status
When the heads of schools were asked to compare their present occupational status with that of their fathers, 14 head masters and 1 head mistress feel that their present status is higher than that of their fathers ; 6 head masters and one head mistress feel it is lower ; 3 head masters feel it is same ; 2 head masters and 1 head mistress are not in a position to say anything. Greater number of head masters rate their occupational status higher than that of their fathers.

(ii) Social Status
About their social status, 3 head masters and 1 head mistress identify their status with persons placed in the highest social position ; 16 head masters and 4 head mistresses with those in the middle social position and 4 head masters with those in the lowest social position. Greater number of heads of schools identify their status with the middle social position. It is significant to note that majority of the heads of schools have never pursued another occupation before taking to teaching as a career, and rate their occupational status higher than their fathers ; they also identify their status with the middle social position.
6. PROFESSIONAL AND ADMINISTRATIVE RELATIONSHIPS
(i) Classes Taught
Twenty head masters and 4 head mistresses teach the primary classes ; one head master and one head mistress teach the secondary classes ; one head master teaches both primary and secondary classes. Most of the heads of schools teach the primary classes, with the solitary exception of a head master and mistress who teach the secondary class.
(ii) Relationship with Students
When asked about the number of students who feel free to consult them, 4 head masters say that one to five students go to them in their difficulties on academic and personal matters ; one head master and one head mistress say that 6 to 10 students go to them ; 14 head masters and 3 head mistresses say that more than 10 students go to them ; 4 head masters and 1 head mistress say that no student goes to them. It is seen that the greater number of heads of schools say that more than 10 students go to them in their difficulties.
(iii) Relationship with Teachers
(a) Whether staff meetings are held or not and their frequency : To the question “Are any staff meetings held in your institution?”, 9 head masters and all the head mistresses say that staff meetings are held regularly ; 1 head master says that staff meetings are held as and when required ; one head master says that staff meetings are held rarely ; and2 head masters say that staff meetings are never held. Large number of head masters and all head mistresses say that staff meetings arc held regularly.
(b) Nature of discussions at staff meetings : When asked whetherthey feel free to discuss school matters at these meetings, 14 head masters

and 4 head mistresses feel free to discuss school matters most often at these meetings, while 6 head masters and one head mistress feel free sometimes, to discuss ; one head master seldom discusses while 2 head masters say that this question is not applicable to them. So, most of the heads of schools most often feel free to discuss school matters at these meetings.
(c) Implementation of decisions taken at staff meetings : Whenfurther questioned whether decisions taken at these meetings are implemented, 10 head masters and 3 head mistresses, say that decisions taken at those meetings are always implemented ; 8 head masters and 2 head mistresses say that decisions are sometimes implemented ; 3 head masters say that these decisions are seldom implemented ; 2 head masters feel that this question does not apply to them. The greater number of heads of schools inform that decisions taken at staff meetings are always implemented.
(d) Communication of administrative decisions to staff : As to themeans adopted to communicate the administrative decisions to the members of the staff, 9 head masters and 1 head mistress inform staff members of decisions through circulars ; 9 head masters and 3 head mistresses do so by holding meetings ; 4 head masters and 1 head mistress intimate informally. The relationships between the head and the staff seem to be formal in a large number of cases. But the heads are equally divided in their manner of maintaining the relationship. Half of them meet the staff personally and communicate the decisions informally. The other half communicate their decisions to the staff in a more formal manner.
When the heads of schools were asked whether they get co-operation from the members of staff in administrative matters, 15 head masters and all the head mistresses say that teachers fully co-operate ; 7 head masters say that they co-operate only when requested ; 13 head masters and 5 head mistresses get full co-operation from the members of the staff on academic matters ; 7 head masters get that co-operation only “on request”, one head master says that teachers are non-co-operative. The large number of heads of schools say that their colleagues co-operate with them “fully” on academic and administrative matters.
(iv) Relationships with Parents
(a) Frequency of contacts with parents : To the question regardingthe contact with parents, 7 head masters and 3 head mistresses have regular meetings with parents ; 12 head masters and 2 head mistresses have meetings with parents as and when the occasion arises ; 3 head masters seldom meet parents ; one head master has never met parents.

While majority of head mistresses have regular meetings with parents, a majority of head masters meet parents as and when the occasion arises.
(b) Mode of contact : About the means adopted to inform theparents regarding the progress of their children, 9 head masters and 4 head mistresses intimate through progress reports ; 13 head masters and one head mistress through teacher-parent meetings ; one head master does not keep in touch with them. While the greater number of head mistresses intimate parents of their children’s progress through periodical reports, the greater number of head masters do so through teacher-parent meetings. According to what the heads of schools say, there seems to be better contact between heads and students than there is between the heads and the parents. There is a difference between men and women heads. While the majority number of head mistresses make regular contact with parents, the majority of head masters do so only when the occasion arises.
(v) Relationship with Management
(a) Representation on the Board of Management of teachers otherthan the Heads : The heads of schools were asked to state if the teachersin their institution were represented on the board of management by a teacher other than the Head himself. Eight head masters and one head mistress say that they are represented ; 14 head masters and 4 head mistresses say that they are not represented ; one head master had not responded. It is significant to note that greater number of heads of schools feel that they are not represented on the boards of management.
(b) Nature of the ex-officio members of the Heads on the Board of Management—Are they office bearers ? ; When asked about their membership on the board of management as ex-ofl5cio office bearers, 9 head masters and 4 head mistresses say that they are n o t; 4 head masters do not answer the question. A considerable number of heads of schools are not ex-officio office bearers on the board of management.
(c) Accessibility to the Board of Management; Eight head masters and 3 head mistresses say that members of the board of management are always easily accessible to them ; 5 head masters and 1 head mistress say that they are accessible if necessity arises. One head master and one head mistress say that “it depends” ; 2 head rnasters say. that they are “seldom” accessible ; 3 head masters said they are “never” accessible while 4 head masters have not responded to the question at all. A little over half the head masters and for more than three-fourth of head mistresses interviewed, the accessibility to the members of the board of management does not seem to be a problem.
(d) Satisfaction with support from Management : When asked whether

they are satisfied with the support they get from the management, in organising the institution, 9 head masters and 4 head mistresses say that they are satisfied ; 6 head masters are only partially satisfied ; 4 head masters and one head mistress are not satisfied and 4 head masters have not responded to the question. Generally, heads of schools are satisfied with the support they get from the management in the task of running the school.
(vi) The Heads of Schools and the State Education Department
When asked whether the higher officers in the Government department are easily accessible when their assistance is needed, 7 head masters and 2 head mistresses say that they are always accessible ; 7 head masters and 1 head mistress say this is usually so ; 4 head masters say that it depends ; 2 head masters say that they are seldom accessible ; 2 head masters and 1 head mistress say it is never so ; one head master and 1 head mistress have not answered the question. Fourteen head masters out of 23 and 3 head mistress out of 25 say that the government oflQcers are easily accessible. Only 4 head masters and one head mistress say that the question may not arise.
(vii) Membership of Professiond Bodies
About their membership on professional bodies and participation in such organisations, 10 head masters attend such meetings regularly ; 3 head masters and 2 head mistresses occasionally and one head master seldom attends ; while a large number of head masters attend such meetings regularly, the larger number of head mistresses say that they occasionally attend such meetings.
7. THE VIEWS OF THE HEADS OF SCHOOLS REGARDING THEGOALS OF EDUCATION, THE ROLE OF STUDENTS AND
THEIR IMAGE OF STUDENTS AND PARENTS
The heads of schools were requested to give their views regarding the principal goals of education, the role of the student, their view about the present-day generation of students, and their impressions regarding the influence of caste and religion and language on the performance of the students. They were also asked to give their impressions regarding the extent of the parents’ interest in the education of children.
(i) The Goals of Education
When asked to state their view regarding the principal goal of

education, 4 head masters say that it is to provide economic security ;6 head masters and 2 head mistresses say that it is to achieve higher statusin society ; 2 head masters say that it is to be a cultured person while11 head masters and 3 head mistresses say that it is to turn one into a good citizen. A hirger number of heads of schools think that the goal of education is to make one a good citizen,
(ii) Education and a Sense of Values
When asked whether they agree with the feeling that the present system of education does not inculcate any sense of values in the youaget generation, 6 head masters and 3 head mistresses agree ; 13 head masters partially agree ; 3 head masters and 2 head mistresses disagree and one head master is unable to say anything.
(iii) The Role of the StudentsThe heads of schools were asked to give their idea of what a student
should be concerned with. Five head masters and 2 head mistresses say that a student should be concerned with his studies only ; 7 head masters say that a student should also devote time to household duties ; 9 head masters and 3 head mistresses say that a student should also devote time to welfare work ; 2 head masters say that a student should also take part in politics.
(iv) Their Image oj the Students
(a) The qualities by which they describe students : The studentsare described by the heads of schools with positive qualities excepting for the fact that most of them feel that students are incapable of independent thought. This is pointed out in the table given below. Head mistresses differ from head masters by saying that students are negligent while most of the head masters say that students are studious. Majority of the heads of schools say that students are purposive, incapable of independent thought, disciplined and deferential.
TAB1.E IV— 1Sh o w in g th r n u m b e r o f H eads w h o c o n s id e r St u d e n t s P u r po siv e , Stu d io u s , I n d e p e n d e n t in t h o u g h t , D is c ip l in e d and D e f e r e n t ia l (Q s . 35, 36, 37, 38 & 39)
.•S'S
^ 11 I t I III III t I i I1. Head masters 16 5 15 6 9 12 18 5 18 32. Head mistresses 3 1 1 4 1 3 3 1 3 1
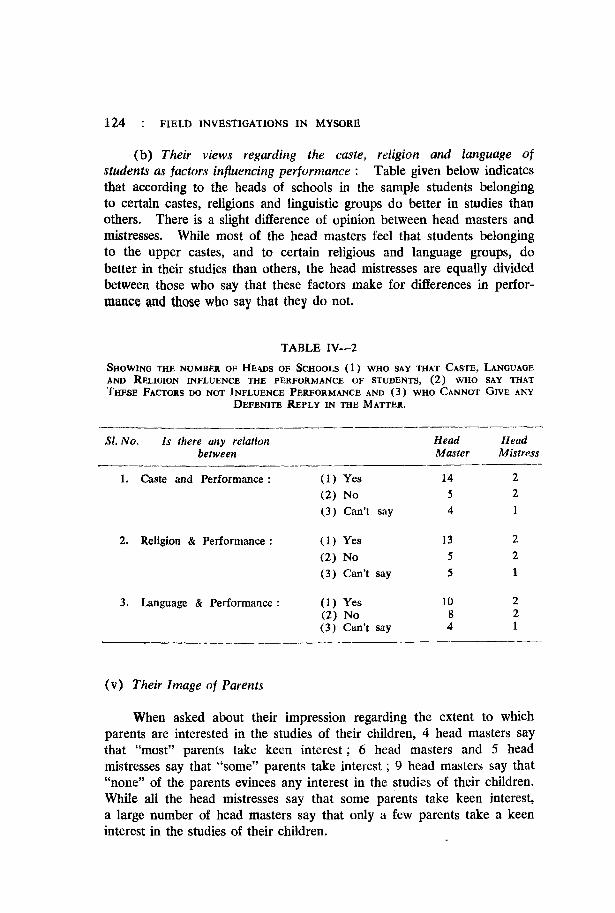
(b) Their views regarding the caste, religion and language of students as factors influencing performance : Table given below indicatesthat according to the heads of schools in the sample students belonging to certain castes, religions and linguistic groups do better in studies than others. There is a slight difference of opinion between head masters and mistresses. While most of the head masters feel that students belonging to the upper castes, and to certain religious and language groups, do better in their studies than others, the head mistresses are equally divided between those who say that these factors make for differences in performance and those who say that they do not.
TABLE IV—2
S h o w in g t h e n u m b e r o f H e a d s o f S c h o o l s ( 1 ) w h o sa y t h a t C a s t e , L a n g u a g e AND RPXIGION i n f l u e n c e THE PERFORMANCE OF STUDENTS, (2 ) WHO SAY THAT T h e s e F a c t o r s d o n o t I n f l u e n c e P e r f o r m a n c e a n d (3 ) w h o C a n n o t G iv e a n y
D e f e n i t e R e p ly i n t h e M a t t e r .
SL No. Is there any relation between
HeadMaster
HeadMistress
1. Caste and Performance : (1) Yes 14 2(2) No 5 2(3) Can’t say 4 1
2. Religion & Performance : (1) Yes 13 2(2) N o 5 2(3) Can’t say 5 1
3. Language & Performance : (1) Yes 10 2(2) N o 8 2(3) Can’t say 4 1
(v) Their Image of Parents
When asked about their impression regarding the extent to which parents are interested in the studies of their children, 4 head masters say that “most” parents take keen interest; 6 head masters and 5 head mistresses say that “some” parents take interest; 9 head masters say that “none” of the parents evinces any interest in the studies of their children. While all the head mistresses say that some parents take keen interest, a large number of head masters say that only a few parents take a keen interest in the studies of their children.

8. THEIR SOCIAL ATTITUDES AND VALVES
The following paragraphs indicate the opinions of the heads of schools with reference to the way of living, mode of life, their impressions regarding the attitude of politicians, the qualities that they admire in people and their views regarding social mobility. The questions put to the heads of schools were identical to the questions put to the school teachers.
The first question is as follows.“There were two sons of a father, both of whom wanted to help
their country. The first son set out to be a holy man. He gave up everything in order to show to his countrymen the path of goodness in this life, and salvation hereafter. The second son set out to establish a big factory, which gave work to hundreds of his countrymen, and which produced inexpensive goods that many people needed.
Which of the two sons do you personally admire most ?1 .— — ----- First son 2 -------------- Second son3 ------------ I am not clear about my choice”
(i) Religious or Materialistic Attitude to Life
Three head masters and 1 liead mistress admire the son who chooses holy path ; 19 head masters and 4 head mistresses admire the son who chooses the materialistic way of life. One head master is not clear about his choice. Thus most of the heads of schools indicate a perference for the materiaHstic way of life.
(ii) The Secular or Non-secular Attitude to Life
The second question was as follows—“whether or not a man strives to improve his lot in life depends upon whether he believes in any religion. Do you agree ?” Seven head masters and 3 head mistresses say that improvement in one’s lot in life wholly depends on religious faith ; 6 head masters partially agree; 9 head masters and 2 head mistresses say that religion has nothing to do with the improvement of one’s lot in life.
Apart from stating their preference for one or the other attitude to life the school heads were asked to state the type to which, in their own opinion, they themselves belonged. Finally they were asked to state their opinion on what they considered most of the other heads of schools to be like.

Most of the heads of schools, as shown in the table below consider themselves to be the accomplishing type.
TABLE TV— 3
S e l f I m ag e o f t h e H eads o f Sc h o o l s (Q s . 57, 58, 59)
SI. No. Attitudes Head Head_____________________ Master Mistress
1. Which of the two persons has Want to accomplish 20 5the better attitude of life ? Want to be left alone 3 —
2. Which of the two do you Want to accomplish 21 5think is nearer to you ? Want to be left alone 2 —
3. Which do you think most of Want to accomplish 18 4the teachers would say had Want to be left alone 5 1the better way of living ?
(iii) Attitude to Politicians
(a) Views on whether politicians heed their opinions : About theviews of the heads of schools regarding the extent to which politicians pay attention to their opinions, 2 head masters and 1 head mistress say that a great deal of attention is paid ; 13 head masters and 4 head mistresses say that no such attention is paid ; one head master says that he does not know. The greater number of heads of schools feel that only a little attention is paid by politicians to what they have to say.
(b) Communication with politicians : When asked whether theyhave ever talked or written to some government official or political leader on some public issue, 4 head masters and 1 head mistress say that they have done so “many a time” ; 9 head masters and one head mistress say that have written “sometimes” ; 10 head masters and 3 head mistresses say that they have never done so. Most of the heads of schools have neither talked nor written to politicians.
(iv) Views regarding the Qualities that determine Respect
When asked about their views regarding the qualities that determine respect for an individual, 3 head masters and 3 head mistresses say that the respect given to a person depends upon the family he comes from ;1 head master attributes respect to having a large income ; 19 head masters and 1 head mistress attribute it to high education while 1 head mistress says that some quality other than these determines respect. While a large majority of head masters believe that the highly educated

are respected, a large number of head mistresses think that respect is given to one who comes from a good family.
(v) llie Quality they admire Most :
To the question about the qualities they admire most in individuals,7 head masters and one head mistress admire the person who does his work well ; 2 head masters and 2 head mistresses like the ambitious ; one head master likes the generous ; 7 head masters and 1 head mistress like one who is active in social and public life. While the greater number of head masters admire either the person who works well or one who is active in public and social life ; half the number of head mistresses admire the ambitious.
(vi) Status and Mobility
When asked about the image of their own status and their views regarding mobility in status, 2 head masters and two head mistresses feel that it is easy to move up in society ; 20 head masters and 2 head mistresses find it hard to move up while 1 head master and 1 head mistress do not know. The larger number of head masters find it hard to move up in society. But half the number of head mistresses interviewed think it is easy to move up.

SECONDARY STAGE
Section I— Introduction
¥ N THE sample of study there are schools for boys and 9 for girls.In these, four schools are managed by government and the remaining are
aided financially by the government. Those institutions which are run under the direct control of the government will be supervised by the department of public institutions, while the Boards of Management look after the administration of the remaining schools. Almost all these schools have final year of the secondary school. In the schools from which the sample of teachers was drawn there are 189 teachers and 892 students ; 519 parents and 121 heads of schools have also been contacted. So this chapter contains information about the secondary school teachers, students and their social background. In addition there is also information about the heads of secondary schools.
Section II—T eachers of Secondary Schools
1. DESCRIPTION OF THEIR SOCIAL BACKGROUND
The secondary school teachers were asked to give information regarding their age, caste, religion, mother tongue, occupational, educational and rural-urban background.
(i) Distribution of Teachers by Sex
Out of 186 teachers 103 are males and 83 are females ; 18 per cent of the male and 28 per cent of the female teachers are in the age group of 21 to 25 years ; 15 per cent of the male and 24 per cent of the female teachers are in the age group of 26 to 30 ; 24 per cent of the male and19 per cent of the female teachers are in the age group of 31 to 35 years, while in the remaining age groups after 36 years of age the number of male and female teachers was on the decrease excepting the case of male teachers in the age group of 36 to 40 years ; 70 per cent of female teachers and 50 per cent of the male teachers are in the age group of below 35 years. There is a larger percentage of men teachers who are in the higher age group than women teachers.

(ii) Caste
About their caste 26 per cent of the male teachers and majority percentage of the female teachers belong to other backward classes ; 35 per cent of the male and 45 per cent of the female teachers belong to other castes ; 3 per cent of the male teachers belong to the scheduled caste ;17 per cent of the teachers have said the question is not applicable to them. The rest have not responded. The fact that there are no scheduled caste female teachers is significant.
(iii) Religion
When teachers were asked to state their religion 91 per cent of the male and 66 per cent of the female teachers said that they were Hindus ;9 per cent of the male and 25 per cent of the female teachers said that they were Christian ; 6 per cent of the male and 5 per cent of the fenjale teachers said that they were Muslims. Only 1 per cent of the male atid one per cent of the female teachers said that they were Jains ; only a few teachers belong to religions other than Hindu religion. Among women, however, Christian teachers make up a substantial proportion.
(iv) Mother Tongue
Mother tongue of 74 per cent of the male teachers and 40 per cent of the female teachers is Kannada ; that of 8 per cent of men and10 per cent of women teachers is Konkani; that of 1 per cent of female teachers is Marathi; that of 2 per cent of male and 4 per cent of female teachers is Malayalam ; that of 5 per cent of male and 16 per cent of female teachers is Telugu ; that of 5 per cent of men and 6 per cent of women teachers is Urdu. The majority of all the male teachers speak Kannada ; but among women teachers the image is made up of non- Kannada group. However, Tamil and Telugu, which account for 30 per cent of women teachers, are closely akin to Kannada.
(v) Occupational Background
(a) Occupations of the grandfathers of the teachers : The teacherswere asked about source of the livelihood of their grandfathers and fathers. Their answers are as follows : Occupation of the grandfathersof 30 per cent of the male and 34 per cent of the female teachers is group no. 1, viz, owner of farm, fishery, dairy, land, etc. ; 11 per cent of the male and 12 per cent of the female teachers is group no. 5, viz,

owners of small business tailor, banker, peddler, country medicine man, etc ; 17 per cent of the male and 17 per cent of the female teachers is group no. 7, viz, ordinary administrative staff, clerk, stenographer, cashier, record keeper, school teacher, retail shop employee, etc. Only a small number of the grandfathers of the male and female teachers had different occupations other than those mentioned above. Ownership of farm#, dairy, fishery, etc. are the just occupational group followed by the grandfathers of tiie male and female teachers.
(b) Occupation of the fathers of th€ teachers ; The fathers of18 per cent of male and 8 per cent of the female teachers are in the occupational group no. 1, viz, owner of farm, fishery, dairy, land, etc ; 20 per cent of the male and 2 per cent of the female teachers in the occupational group no. 2, viz, tenant cultivator, independent fisherman, etc. One per cent of the male are in the occupational group no. 3, viz, labourer in the agriculture, dairy, etc. ; 29 per cent of the male and 3 per cent of the female teachers are in the occupational group no. 4, viz, proprietor, director, managing agent, of big industrial concern, mine etc .; 14 per cent of the male and 7 per cent of feniaie teachers are in the occupational group no. 5, viz, owner of small business, retail shop, handicrafts, land, independent business man, tailor, banker, peddler, priest, country medicine man etc. ; 29 per cent of the male and 36 per cent of the female teachers are in the occupational group no. 8.
Very insignificant percentages of male and female are found in the remaining occupational groups. It is significant to note that large number of fathers of teachers are executive, scientific and technical personnel, etc.
(vi) Educational Background
(a) Education of the grandfathers of the teachers : In response tothe question “What was the education of your grandfathers ?”, 28 per cent of the male and 1 per cent of the female teachers indicate that their grandfathers are illiterate or barely literate ; 32 per cent of the male and15 per cent of the female teachers mention that their grandfathers have primary school education. The grandfathers of 16 per cent male and 38 per cent of female teachers are educated up to either middle or high school level; 8 per cent of the male and 10 pei cent of the female teachers report that their grandfathers are trained in colleges ; 20 per cent of the male and 16 per cent of the female teachers report that their grandfathers are trained in the traditional system of Sanskritic or Persian learning. Only 8 per cent of the male and 33 per cent of the female teachers are not in a position to say anything regarding the education of their grandfathers. It is significant to note that a majority of the grandfathers of male teachers are educated upto primary school whereas a

large percentage of the grandfathers of female teachers are educated iipto middle school.
(b) Education of the fathers : The teachers were further asked togive information regarding the education of their fathers. Eleven per cent of the male and 3 per cent of the female teachers say that their fathers are either illiterate or barely literate. The fathers of 32 per cent of male and 8 per cent of the female teachers are educated upto the primary school level. The fathers of 40 per cent of the male and 41 per cent of the female teachers are educated upto middle or high school level. The fathers of 9 per cent of the male and 42 per cent of the female are educated upto the college level. The percentages of fathers educated in traditional education is significant. It is seen that a majority of the fathers of college teachers are educated upto middle or high school level. Further, it is also noticed that a majority of the fathers of female teachers are educated upto college level.
(vii) Rural-Urban Background
(a) Whether the teachers mainly grew up in towns and cities, orvillages : In order to understand the rural-urban background of theteachers, they were asked to state the place where they mainly grew up. As per the data collected, 37 per cent of the male and 11 per cent of the female teachers grew up in villages. Thirty-eight per cent of the male and 36 per cent of the female teachers grew up in towns ; 11 per cent of the male and 6 per cent of the female teachers grew up in cities ; 13 per cent of the male and 4 per cent of the female teachers grew up in mixed environment. It is noticed here that a majority of the teachers have grown up in towns.
(b) Whether the teachers had schooling at a place smaller than tehsil, taluka, or town ; On questioning whether they had been to School at a smaller place than tehsil, taluka or town, 67 per cent of the male and 16 per cent of the female teachers answered in the positive ; 32 per Cent of the male and 8 per cent of the female teachers answered in the negttive. Only one per cent of the male and female teachers expressed their inability to say anything. Thus a majority of teachers are educated at a place smaller than tehsil, taluka or town.
(viii) Teachers’ Position in the Social Ladder
The teachers were asked to state whether their position was high, low or middle in the social ladder, 8 per cent of the male and 6 per cent of the female teachers say that they belong to higher social position ; 76 per cent of the male and 86 per cent of the female teachers say that they

belong to the middle social position ; 16 per cent of the male and 6 per cent of the female teachers say that they occupy the lowest social position. The majority of both the male and female teachers indicate their position as the middle social position in the society.
2. NUMBER OF YEARS ENGAGED IN TEACHING
To find out the number of years of teaching experience these teachers have had in various institutions as well as the institution where they are working at present, the teachers were asked a few questions.
(i) Total Experience
Forty per cent of the male and 41 per cent of the female teachers explain that they have 5 or less than 5 years of teaching experience ; 15 per cent of the male and 23 per cent of the female teachers have 6 to 10 years of experience ; 9 per cent of the male and 11 per cent of the female teachers have 11 to 15 years of experience ; 20 per cent of the male and8 per cent of the female teachers have 16 to 20 years of experience ; 16 per cent of the male and 5 per cent of the female teachers have over 20 years of teaching experience. The largest number of teachers have 5 or less than 5 years of teaching experience.
(ii) Total Experience in the Institution in which they were Interviewed
Seventy-three per cent of the male and 80 per cent of the female teachers have been working for 5 or less than 5 years in the institution in which they are working at present; 8 per cent of the male and 9 per cent of the female teachers have been doing so far 6 to 10 years ; 5 per cent of the male and 4 per cent of the female teachers for 11 to 15 years ; 9 per cent of the male and 4 per cent of the female teachers for 16 to 20 years ; 5 per cent of the male and 2 per cent of the female teachers since 20 years. Most of these teachers have been working in the same institution where they are employed at present for 5 or less than 5 years.
(iii) The Number of Institutions they Work in Prior to Joining the one in which They were Interviewed
To the question “In how many institutions did you work prior to joining this one ?”, 23 per cent employed in government schoolsand 33 per cent employed in government aided registered society’s institutions have worked in one institution prior to joining the institution where they are working at present. Nineteen per cent of the

government school teachers and 13 per cent of the government-aided school teachers have worked in two institutions ; 12 per cent of the government school teachers and 5 per cent of the government-aided school teachers have worked in three institutions. Five per cent of the government school teachers and 6 per cent of the government-aided school teachers have worked in 4 institutions. Three per cent of the government school teachers have worked in 5 institutions. Two per cent of the teachers employed in government schools have worked in 6 institutions. Four per cent of the teachers employed in government schools have worked in 7 institutions. The percentage of the teachers who have worked in 8, 9, 10 institutions, etc. is negligible.
It is significant here that majority of the teachers in government and government-aided institutions have worked only in one institution prior to joining the institution in which they are working.
3. ACADEMIC AND PROFESSIONAL QUALIFICATIONS OF THE TEACHERS
(i) Class Obtained at the Highest Examination Passed
Four per cent of the male and 2 per cent of the female teachers have obtained the first class in the highest examination they have passed. Twenty-eight per cent of the male and 18 per cent of the female teachers have obtained second class ; 72 per cent of the male and 72 per cent of the female teachers have obtained third class. Only 4 per cent of the female teachers have not obtained any class. A majority of the teachers have obtained third class in the highest examination they have passed.
(ii) Academic Qualifications
Three per cent of the male and two per cent of the female teachers employed in urban areas are non-matriculates ; 13 per cent of the male and 14 per cent of the female teachers are matriculates ; 7 per cent of the male and 1 per cent of the female teachers are non-graduates ; 70 per cent of the male teachers and 75 per cent of the female teachers are graduates. Majority of the teachers are graduates
(iii) Professional Qualifications
As for their professional qualifications, 23 per cent of the male and9 per cent of the female teachers have no professional qualifications, 2 per cent of the male and 2 per cent of the female teachers have obtained primary teachers’ training certificate ; 8 per cent of the male and 13 per

cent of the female teachers have completed the secondary teachers’ training certificate. One per cent of the male teachers have completed teachers’ diploma examination ; 40 per cent of the male and 52 per cent of the female teachers have completed teachers’ degree examination. Three per cent of the male teachers have mentioned that they have passed other professional examination. It is found that the majority of the teachers have completed teachers’ training degrees.
4. THE CHOICE OF TEACHING AS A CAREER
In order to understand the Ifachers' perspective o! the profession and also their keenness in taking to teaching as a career, a few questions were put to them. They were also asked to write their status with the occupation of their fathers.
(I) Whether they had Pursued Another Occupation before taking up Teaching
To the question “At any stage of your career have you pursued an occupation other than teaching?”, 63 per cent of the male and 7 per cent of the female teachers said that they had never pursued any occupation ; 25 per cent of the male and 4 per cent of the female teachers said that they had pursued an occupation before taking up teaching ;7 per cent of the male and 2 per cent of the female teachers said that they had pursued an occupation between two teaching jobs. 8 per cent of the male and 4 per cent of the female teachers pursued an occupation along with the teaching job. It is noticed that the majority of the teachers have not pursued any occupation other than teaching.
(ii) Whether the Teachers had any Desire to Choose Another Occupation before taking up TeachingTwenty-eight per cent of the male and 24 per cent of the female
teachers state that they desire to choose other occupation ; 50 per cent of the male and 59 per cent of the female teachers say that they have no such desire to choose an occupation other than teaching; 12 per cent of the male and 17 per cent of the female teachers say that they have no choice to choose any other occupation. It is significant here to note that the majority of the teachers have no desire to choose any occupation other than teaching.
(Hi) Their Willingness to Continue in the Profession
In order to understand the extent to which the teachers are willing

to continue in the profession, they were asked the following question, “Now that you have been in teaching profession for some time, would you like to change if there is an opportunity for some other kind of work with the same emoluments?” Sixteen per cent of the male and 18 per cent of the female teachers say that they would like to change the profession. Eleven per cent of the male and 7 per cent of the female teachers state that it is too late to change ; 67 per cent of the male and 64 per cent of the female teachers say that they would not like to change from the teaching profession ; 6 per cent of the male and 11 per cent of the female teachers have not been able to say anything definite. A majority of tbe teachers, it is seen, do not to change from their present profession.
(iv) The Teachers’ Views regarding the Status of Teaching as an Occuj^- tion as Compared with the Status of the Occupations followed by their Fathers
In answer to the question as to how their occupation would be compared with the occupation of their fathers, 50 per cent of the male teachers and 22 per cent of the female teachers replied that their occupation was higher in status than that of their fathers. Eleven per cent of the male and 28 per cent of the female teachers said that their occupational status was low ; 27 per cent of the male teachers and 22 per cent of the female teachers said that their occupation was exactly similar ;12 per cent of the male teachers and 22 per cent of the female teachers could not say anything about their status. A large number of teachers say their present status is higher than that of their fathers. Women teachers are more likely to regard their occupation as lower than their fathers’.
5. TEACHERS* CONTACT WITH THE PARENTS OF THE STUDENTS
(i) Frequency of ContactsIn order to understand the teachers’ contact with the parents of the
students a few questions were asked. In response to these questions, 5 per cent of the male and 8 per cent of the female teachers stated that they had regular contact with the parents of their students ; 72 per cent of the male teachers and 63 per cent of the female teachers stated that they had contact “as and when the occasion arises” ; 17 per cent of the male and 19 per cent of the female teachers seldom had any contact;6 per cent of the male and 10 per cent of the female teachers had “never” had such contacts. A large number of teachers make contacts with the parents of their students “as and when the occasion arises”.

(ii) Mode of Contact
With reference to the means adopted to inform the parents of their ward’s progress, 64 per cent of the male and 82 per cent of the female teachers intimate the parents through periodic progress report cards ;20 per cent of the male teachers and 10 per cent of the female teachers intimate the progress of students through parent-teacher meetings ; 6 per cent of the male and 8 per cent of the female teachers do not keep in touch with the parents. Eleven per cent of the male and 4 per cent of the female teachers intimate progress of the students to parents through some other means. It is noticed here that the majority of the teachers intimate the progress of the students to parents through progress reports.
(iii) Teachers’ Impressions regarding Interest in the Progress of theirChildren
When the teachers were asked, whether parents take any interest in the progress of their children, 6 per cent of the male and 8 per cent of the female teachers say that “most” of the parents are seen interested in the progress of their children. 41 per cent of the niale teachers and 55 per cent of the female teachers say that “some” are interested ; 44 per cent of the male and 33 per cent of the female teachers say that “a few” are interested, while 9 per cent of the male and 1 per cent of the female teachers say that “no parents” are interested. One per cent of the male and female teachers are not in a position to say “anything” in this matter. It is clear that a large number of teachers feel that only “some parents” are interested in the progress in studies of their children.
6. PROFESSIONAL AND ADMINISTRATIVE RELATIONSHIPS
The teachers were requested to give information regarding the number of staff meetings held at the schools, their sense of freedom to discuss all school matters at such meetings and also the extent to which decisions taken at such meetings were implemented. This will give an idea of the involvement of the teachers with the school and its affairs.
(i) Staff Meetings
(a) Whether meetings are held : When asked whether staff meetings

are held in the institutions, where they work at present, 25 per cent ofthe male and 21 per cent of the female teachers report that meetings are held “regularly” ; 66 per cent of the male and 72 per cent of the female teachers say that meetings are held “as and when required” ; 9 per cent of the male and 6 per cent of the female teachers say that they are held “very rarely” and 4 per cent of the male and 1 per cent of the female teachers say that they are never held. According to the opinion of the majority of the teachers meetings in the school are held “as and when required”.
(b) Nature of discussions at staff meetings : When asked whetherthe teachers would feel free to discuss all matters relating to the school at these meetings, 33 per cent of the male and 33 per cent of the female teachers said that they did “most often” ; 50 per cent of the male and57 per cent of the female teachers said that they felt free ‘sometimes” ;11 per cent of the male and 7 per cent of the female teachers felt thatthey “seldom” did i t ; 3 per cent of the male and 1 per cent of the female teachers “never” discussed ; 4 per cent of the male and 2 per cent of the female teachers said that the question did not apply to them. A majority of the teachers said that they discussed school matters “sometimes” at the meetings.
(c) Whether the decisions taken at the staff meetings are implemented : About the implementation of the decisions taken at the meetings,36 per cent of the male and 36 per cent of the female teachers say that they are “always” implemented ; 51 per cent of the male and 55 per cent of the female teachers say that they are implemented “sometimes” ; 5 per cent of the male and 4 per cent of the female teachers say that they are “seldom” implemented ; 3 per cent of the male and 1 per cent of the female teachers say that they are “never” implemented ; 5 per cent of the male and 6 per cent of the female teachers say the question does not apply to them. Thus a large percentage of teachers state that decisions taken at such meetings are implemented only “sometimes”.
(ii) Whether the Teachers are Represented on the Board of Management:
With regard to the representation of a teacher on the board of management other than the Principal, 20 per cent of the male and 34 per cent of the female teachers say that they are represented ; 17 per cent of the male and 58 per cent of the female teachers say that they aie not represented ; 2 per cent of the male and 8 per cent of the female teachers have not responded to this question. Thus the majority of the teachers say that they are not represented on the Board of Management.

7. TEACHERS’ VIEWS REGARDING ROLE OF THE STUDENT, THE GOAL OF EDUCATION AND TEACHERS’ IMAGE OF STUDENTS
(i) The Role of StudentAbout the opinion of the teachers regarding the role of student, 21
per cent of the male and 19 per cent of the female teachers say that a student should be concerned with his studies only ; 27 per cent of the male and 41 per cent of the female teachers say that the student should also devote time to household duties ; 49 per cent of the male and 39 pel cent of the female teachers say that student should in addition to this, devote time to welfare work; 2 per cent of the male and 2 per cent of the female teachers say that student should take part in politics ; 3 per cent of the male and 4 per cent of the female teachers are not in a position to say anything. The percentages of the teachers who say that student should devote more time to welfare work also are the largest.
(ii) Caste and Performance of the Student— The Teachers’ Views Teachers observe that the performance of a student in the examination
depends upon the caste in which one is born ; 49 per cent of the male and58 per cent of the female teachers say that the students of upper caste do better in their studies than students of the lower castes ; 27 per cent of the male and 7 per cent of the female teachers say that they do not agree to such a view ; 26 per cent of the male and 23 per cent of the female teachers are not in a position to say anything in this matter. It is noticed that the majority of the teachers agree with the view that students of the upper castes do better in their studies than students of the lower castes.
(iii) Religion and Performance of the Student—The Teachers’ Views
About the role of religion in the performance of students in studies, 53 per cent of the male and 28 per cent of the female teachers say that students belonging to certain religious groups have better performance than students belonging to certain other religious groups ; 34 per cent of the male and 29 per cent of the female teachers do not agree to such a view ; 25 per cent of the male and 43 per cent of the female teachers cannot say anything in this matter. Ihe majority of the teachers state that students belonging to certain religious groups do perform better in their studies, than students of other religious groups.
(iv) Language and Performance of the Student—The Teachers’ Views
Regarding the language group and performance, 36 per cent of the

male and 33 per cent of the female teachers say that students belonging to some language groups do better in their studies than students belonging to certain other language groups ; 39 per cent of male and 25 per cent of female teachers are unable to say anything definite. Thus some teachers feel that students belonging to certain language groups do better in studies than others. The percentages of teachers who say so do not form the bulk among the teachers.
(v) The Goal of Education— as seen by the TeachersWhen questioned about their views regarding the principal goal oi
education, 11 per cent of the male and 8 per cent of the female teachers say that the goal of education is to provide economic security; 16 per cent of the male and 6 per cent of the female teachers say that it is to achieve higher status in the society ; 32 per cent of the male and 29 per cent of the female teachers say that it is to be a cultured person; 39 per cent of the male and 57 per cent of the female teachers say that it is to turn one into a good citizen ; 3 per cent of the female teachers say that it is something else, while 1 per cent of the male and 2 per cent of the female teachers say that they are unable to say anything in this matter. One per cent of the male teachers have not responded to this question. The greater number of teachers agree that the principal goal of education is to turn one into a good citizen.
(vi) Teachers’ Views about the Present System of EducationTo the question whether they agree with the statement that the
present system of education does not inculcate any sense of values in the younger generation, 29 per cent of the male and 16 per cent of the female teachers say that education does not inculcate any sense of value ; 45 per cent of the male and 55 per cent of the female teachers say that it “partially” inculcates sense of values ; 20 per cent of the male and 14 per cent of the female teachers disagree to such a view; 7 per cent of the male and 14 per cent of the female teachers are unable to say anything. The significant factor to be noticed here is that the majority of the teachers state that education “partially” inculcates sense of values among the younger generation.
(vii) Teachers’ Image of the StudentsWhen the teachers were asked to describe the school stvdent, 38 per
cent of male and 34 per cent of female teachers state that the students are “purposive” ; 51 per cent of the male and 52 per cent of the female teachers say that the students are “drifting” ; 29 per cent of the male aod 22 per cent of the female teachers say that the students are “studious” ;

71 per cent of the male and 68 per cent of the female teachers say that students are “negligent” ; 26 per cent of the male and 30 per cent of the female teachers say that the students are “capable of independent thought”, while 65 per cent of male teachers and 59 per cent of female teachers say that the students are “incapable of independent thought”.
Thirty-one per cent of male and 30 per cent of the female teachers say that the students are “disciplined”, while 59 per cent of the male and 65 per cent of the female teachers say that the students are “indisciplined”. 46 per cent of the male and 54 per cent of the female teachers say that the studeats are “deferential”, while 40 per cent of the male and 35 per cent of the female teachers say that the students are “unrespectful”. A majority of the teachers are of the opinion that the students are “drifting”, “negligent”, “incapable of independent thought”, “indisciplined” and “deferential”.
8. THE SOCIAL ATTITUDES AND VALUES OF TEACHERS
In the following paragraphs the teachers have recorded their attitudes and values towards the way of living, the mode of life, trait which determines respect, the quality which they admired most, their status in society, etc.
(i) Teachers’ Preference between the Religious and Materialistic Wayof LifeIn order to find out whether the teachers preferred the “religious”
or the “materialistic way of life” they were asked the following question.“There were two sons of a father, both of whom wanted to help
their country. The first son set out to be a holy man. He gave up everything in order to show to his countrymen the path of goodness in this life, and salvation hereafter. The second son set out to establish a big factory, which gave work to hundreds of his countrymen, and which produced inexpensive goods that many people needed”.
Which of the two sons do you personally admire most ?1 ------------ , .First son 2 - — - Second son3 I am not clear about my choice
Twenty per cent of the male and 6 per cent of the female teacherssay that they admire the first son. This indicates their preference of the“religious way” of life; 72 per cent of the male and 86 per cent of the female teachers admire the second son and indicate a preference for a materialistic way of life. Eight per cent of the male and female teachers are not clear about their choice. It is clear, thus, that most of the teachers prefer the “materialistic way of life”.

(ii) Whether Teachers Prefer a Person who Accomplishes things or onewho wishes to be left alone
Similarly the teachers were asked to choose between a person who accomplishes things and one who wishes to be left alone, in the following question.
“There were two persons talking about how they liked to live. They had different ideas :
One said: I like to accomplish things. 1 like to seeresults which are worth working for (1)
The other said : I wish to be left alone to enjoy life as 1 goalong (2)
1 ---- or 2 ------------ ”
Ninety-one per cent of the male and 90 per cent of the female teachers like to accomplish things to see results worth working for, only negligible percentabe of male and female teachers like to be left alone to see and enjoy life. A majority of the teachers say that they like to accomplish things to see the results worth working for.
(iii) Whether Improvements of One’s Lot in Life Depends on Religion
The question by which an effort was made to gauge the teachers’ secular, or non-secular attitude to life was as follows.
“Whether or not a man strives to improve his lot in life depends upon whether he believes in any religion. Do you agree ?”
Thirteen per cent of the male and 18 per cent of the female teachers say that improvement of one’s lot in life depends upon religion ; 30 per cent of the male and 25 per cent of the female teachers say that it personally depends upon religion ; 51 per cent of the male and 48 per cent of the female teachers think that religion has nothing to do with i t ; 6 per cent of the male and 8 per cent of the female teachers have expressed their inability to answer this question. The greater number of teachers do not think that religion has anything to do with the improvement of one’s lot in life.
(iv) Teachers’ Views Regarding the Qualities that Determine Respectfor an Individual
The teachers were asked to state their views regarding the qualities that determine respect for an individual. Nine per cent of the male and

6 per cent of the female teachers say that respect is given to those who “come from a well known or distinguished family”. Nine per cent of the male and 1 per cent of the female teachers say that the quality that determines respect is “a large income”. One per cent of the female teachers say that “high caste” determines one’s own respect while 62 per cent of the male and 51 per cent of the female teachers say that “high education” determines the respect of the individual. Fourteen per cent of the male and 19 per cent of the female teachers say that it is “some quality other than those mentioned above” which determines the respect of aa individual Majority of the teachers are of the opinion that “higher education” determines the respect of an individual.
(v) Teachers' Opinions on whether Politicians Pay heed to their Opinions
Teachers were asked the following question to find out whether they believed the politicians or leaders in the country paid any heed to their opinions.
“In your view, how much attention do politicians (leaders of the country) pay to the opinions of people like yourself ?”
“ 1 ----------- - A great deal 2 ------------ Only a little3 None at all 4 ------------ I do not know”
Four per cent of the male and 2 per cent of the female teachers say that politicians pay “a great deal of attention”, but 45 per cent of the male and 59 per cent of the female teachers say that they only pay “a little attention”. Thirty per cent of the male and 20 per cent of the female teachers say that “no attention is paid to their opinions by politicians” ; 12 per cent of the male and 17 per cent of the female teachers say that they do not know whether or not politicians pay attention to the opinions of persons like themselves. The number of teachers who say that only “a little attention” is being paid by politicians to what they have to say, is generally high.
(vi) Communication with Government Officials or Political Leaders
When the teachers were asked whether they communicate with political leaders, 8 per cent of the male teachers say that they have written to such persons many a times ; 33 per cent of the male and 19 per cent of the female teachers say that they have written to them only “sometimes” ; 64 per cent of the male and 81 per cent of the female teachers have never written to such persons. So it is clear that larger number of teachers have never written to political leaders and government officials.

(vii) The Quality the Teachers admire most
When asked about the quality these teachers admire most among people, 44 per cent of the male and 37 per cent of the female teachers say that they like a person who does his work well; 8 per cent of the male and 11 per cent of the female teachers say that they like those who are ambitious ; 15 per cent of the male and 15 per cent of the female teachers say that they like those who are generous ; 21 per cent of the male and16 per cent of the female teachers say that they like those who are active in public life ; 1 per cent of the male teachers say that they like those persons who are thrifty; 1 per cent of the male teachers, however, s ta t^ that they like the person who keeps to himself ; 12 per cent of the and 21 per cent of the female teachers like those persons who are nw- pectful, while larger number of teachers admire those who do their work well.
(viii) Whether it is easy or hard to move up in SocietyWhen asked whether it is easy or hard to move up in society, 16 per
cent of the male and 17 per cent of the female teachers say that it is easy to move upward in society ; 17 per cent of the male and 76 per cent of the female teachers say that it is hard to move up in society; 6 per cent of the male and 7 per cent of the female teachers say that they do not know whether it is easy or hard to move upward in society. Most of the teachers believe that it is hard to move upward in society.
Section III— H eads of Secondary Schools
1. THE SOCIAL BACKGROUND
The following paragraphs give an account of the age, caste, religion, mother tongue, occupation etc., of the heads of secondary schools. Out of the 21 heads of secondary schools contacted, 14 are headmasters and 7 are headmistresses. Two headmasters in the non-urban areas and1 headmistress in the urban area are in the age group of 21 to 25 years ;3 headmasters and 1 headmistress are in the age group of 31 to 35 years ;one each in the age group of 36 to 40 years ; one headmistress in the age group of 46 to 50 years ; 4 headmasters and 1 headmistress in the age group of 51 to 55 years and one headmaster is aged over 56 years.While more headmasters are in the age group of 51 to 55 years, moreheadmistresses are in the age group of 46 to 50 years.
When asked about their caste, one headmaster in the non-urban area belongs to the backward classes ; 5 headmasters and 3 headmistresses in the urban area belong to other castes ; 4 headmasters and 3 headmis

tresses in the urban area do not belong to any of these castes. More number of heads of schools belong to other castes.
Ten headmasters and 5 headmistresses are Hindus ; 2 headmasters are Muslims ; 2 headmasters and headmistresses each are Christians.
Two headmasters and one headmistress have Telugu as their mother tongue. The mother tongue of one headmistress is Tulu while that of two headmasters is Urdu.
About the economic circumstances, 3 headmasters and 1 headmistress working in urban area grew up under difficult circumstances;8 headmasters and 6 headmistresses in the urban area grew up uuder average economic circumstances ; both the headmasters in the non-urban area grew up under average economic circumstances ; and 2 headmasters in the urban area grew up under such circumstances which varied from time to time. More number of heads of schools grew up under average economic circumstances.
When asked about their occupational background, 1 headmaster in the non-urban area says that his grandfather and father were owners of farms, dairy, land etc., while the other headmaster says that his gran4father belonged to the ordinary administrative staff while his father belonged to the executives, scientists or doctors profession ; 3 headmasters and 3 headmistresses in the non-urban area say that their grandfathers were owners of farm, dairy, fishery, land etc., while the fathers of 3 headmasters and father of a headmaster in the urban area was a tenant cultivator, peasant proprietor etc., 1 headmaster and 1 headmistress say that their fathers are owners of small business ; the grandfathers of 1 headmaster and 1 headmistress and fathers of 2 headmasters and 3 headmistresses are executives, scientists, professors etc., 2 headmasters and2 headmistresses say that their grandfathers were clerks, stenos, school teachers etc., 1 headmaster says that his father is a skilled manual worker ; the grandfather of 1 headmaster in the urban area is a peon, cooly etc., while the occupation of grandfathers of more number of heads of schools is the ownership of farm etc., the occupation of more number of fathers of headmistresses is executives etc.
When asked about the educational background, the grandfather and father of 1 headmaster in non-urban area are illiterates or barely literates ; that of the grandfather, of a headmaster is educated up to middle or high school while his father upto college class ; the grandfathers of 3 headmasters, 2 headmistresses and fathers of 3 headmasters are educated upto primary school; grandfathers of 2 headmasters and 1 headmistress, fathers of 5 headmasters and 4 headmistresses are educated upto middle or high school; fathers of 2 headmasters and 3 headmistresses are educated upto college level ; grandfathers of 3 headmasters and 1 headmistress, father of 2 headmasters are educated in the traditional sanskritic

system. It will be seen that the fathers of larger number of heads of schools are educated upto middle or high school, while their grandfathers are educated upto primary school.
To the question “Have you ever been at school at a place smaller than a tehsil or taluka town?”, 7 headmasters, 2 headmistresses in the urban area and 2 headmasters in the non-urban areas have been educated at a place smaller than a tehsil or taluka town ; 5 headmasters and 5 headmistresses were not educated so. Large number of heads of schools were not educated at a smaller place than a tehsil or taluka town.
When asked about their rural-urban background, I headmaster and 1 headmistress in the urban area grew up mainly In a village ; 7 headmasters and 2 headmistresses in urban area, in a town ; 3 headmasters, 4 headmistresses in urban area and 1 headmaster working in non-urban area grew up in a city ; and 1 headmaster in urban area and another headmaster in non- urban area grew up in a mixed environment. While a larger number of headmasters mainly grew up in a town, a larger number of headmistresses grew up in a city.
2. THEIR PROFESSIONAL EQUIPMENT
The heads of schools are asked to state their academic and professional achievements. Both the headmasters in the non-urban area are graduates, of whom one had got second class in the highest examination passed while the other has got third class.
Ten headmasters and 6 headmistresses in urban area are graduates ; 1 headmaster and 1 headmistress in urban area are post-graduates ; and one headmaster in the urban area is a non-matric or has passed the vernacular final.
Two headmasters have obtained first class in the highest examination they have passed ; 4 headmasters and 2 headmistresses have obtained second class while 6 headmasters and 5 headmistresses have got third class.
Ten headmasters and 4 headmistresses have completed the teachers’ degree; 1 headmistress has got a diploma or degree in education from abroad ; 1 headmaster has got a diploma in physical education and only 1 headmaster is not professionally qualified. It is seen that most of the heads of schools are graduates ; more number of heads of schools have got third class in the highest examination they have passed and have completed the teachers’ degree.
To the question “For how many years have you been engaged in teaching T \ 3 headmasters and 1 headmistress have 6 to 10 years of experience as teachers ; 1 headmaster has teaching experience between 11 to 15 years ; 1 headmaster and 2 headmistresses have teaching experience between 16 to 20 years ; 7 headmasters and 3 headmistresses over 20

years. Thus a large number of heads of schools have more than 20 years of teaching experience.
Further 8 headmasters and 5 headmistresses have been engaged in the same institution in which they are working at present for less than 5 years ; 3 headmasters from 6 to 10 years ; 1 headmaster and 1 headmistress from 16 to 20 years ; and 2 headmasters and 1 headmistress from over 20 years. More number of heads of schools have been working in the same institution, where they are working at present for 5 or less than 5 years.
Greater number of heads ot schools are aged over 46 years, belong to other castes, are Hindus, speak Kannada, grew up under average economic circumstances, have more than 20 years of experience as teachers, are graduates with teachers’ degree.
3. THEIR COMMITMENT TO THE PROFESSION
Nine headmasters and 6 headmistresses have never pursued any other occupations other than teaching; 2 headmasters had pursued some other occupation before they took to teaching; 1 headmaster and 1 headmistress have done it between two teaching jobs. Large number of heads of schools have never pursued an occupation other than teaching. Two headmasters and 1 headmistress desire to choose some other occupation ;7 headmasters and 5 headmistresses did not want to ; 4 headmasters and1 headmistress are not in a position to say anything. More number of heads of schools did not desire to choose an occupation other than teaching They came straight away to teaching.
When questioned whether they would like to change the profession at present, having been in the profession for sometime, if there is an opportunity for some other kind of work with the same emoluments, 2 headmasters say that they would like to change ; 1 headmaster thinks it too late to change ; whereas 11 headmasters and all the headmistresses would not like to change. Most of the heads of schools do not desire to change from the present profession.
On the whole the majority of the heads of schools, have never pursued and are not desirous of pursuing another occupation, other than teaching, rate their occupational status higher than that of their fathers and identify their status with the middle social position.
4. THEIR INVOLVEMENT IN THE PROFESSION
In order to understand the involvement of the heads of schools in the teaching profession, the student-teacher and the parent-teacher contact established are discussed in the following paragraphs. One headmaster

teaches the primary classes ; 13 headmasters and all headmistresses teach the secondary classes. Most of the heads of schools teach the secondary classes.
To the question whether they are members of professional bodies and whether they participate in such organizations, 6 headmasters and 3 headmistresses participate regularly at such meetings ; 3 headmasters and 3 headmistresses attend and participate occasionally whereas 1 headmaster seldom attends meetings of such organizations. More number of headmasters participate regularly at such meetings than headmistresses.
About the number of students who feel ftee lo consult the heads oi schools on academic and personal matters, 3 headmasters and 3 headmistresses say that one to five students go to them for consultation ; 5 headmasters say 6 to 10 students go to them ; 5 headmasters and 4 headmistresses say that more than 10 students go to them. More number of heads of schools say that more than 10 students go to them for consultation on academic and personal matters.
When asked about the teacher-parent contact, 2 headmasters and 1 headmistress say that they contact parents regularly ; 12 headmasters and5 headmistresses contact parents as and when required ; and 1 headmistress seldom makes such a contact. More number of heads of schools contact parents as and when required.
Further, 9 headmasters and 5 headmistresses keep the parents informed about their children’s progress through periodic reports and 2 headmasters and 1 headmistress through teacher-parent meetings; 3 headmasters and 1 headmistress do not keep in touch with them. Most of the parents are informed about the progress of their children in studies through progress reports.
Majority of the heads of schools who teach the secondary classes say that more than 10 students go to them for consultation in difficulties on personal and academic matters, contact parents as and when required and intimate parents of their children’s progress through progress reports.
.5. THE TURN OVER IN THE PROFESSION
To the question “For how many years have you been teaching?”,3 headmasters and 1 headmistress have five or less than five years of teaching experience ; 3 headmasters have 6 to 10 years ; 1 headmistress has 11 to 15 years ; 1 headmaster and 2 headmistresses have 16 to 20 years ; and 7 headmasters and 3 headmistresses have over 20 years of teaching experience. More number of heads of schools have over 20 years of experience as teachers.

6. OCCUPATIONAL STATUS
When they were asked to compare their occupational status with that of their fathers, 7 headmasters and 4 headmistresses say that their occupational status is higher ; 1 headmaster says it is lower ; 6 headmasters and2 headmistresses say it is about the same. And 1 headmistress cannot say anything. More number of heads of schools feel that their occupational status is higher than that of their fathers.
To the question on social status, 2 headmasters say that they occupy the same status as persons in the upper social position 12 headmasteis and7 headmistresses identify their status with the middle social position. It is seen that greater number of heads of schools identify their status with the middle social position.
7. THEIR PROFESSIONAL RELATIONSHIP
The heads of the schools are asked to state whether any staff meetings are held and whether they feel free to discuss school matters at such meetings. While 10 headmasters and 2 headmistresses say that staff meetings are held regularly, 4 headmasters and 5 headmistresses say that staff meetings are held as and when required. More number of heads of schools say that staff meetings are held as and when required.
When asked whether they feel free to discuss all matters relating to school at these staff meetings, 8 headmasters and 5 headmistresses say that they discuss most often and headmasters and 3 headmistresses say that they discuss most often and 6 headmasters and 3 headmistresses say that they most often discuss school matters at such meetings.
Asked further, whether decisions taken at such meetings are implemented, 10 headmasters and 4 headmistresses say that they are always implemented ; 4 headmasters and 3 headmistresses feel that only sometimes such decisions are implemented. More number of heads of schools say that decisions taken at staff meetings are always implemented.
To the question, whether any representation is given to heads of schools on the board of managements, 4 headmasters and 2 headmistresses say that they are represented ; 9 headmasters and 2 headmistresses say no ; while 1 headmaster and 2 headmistresses have not responded. The majority of headmasters say that they are not represented on the boards of management.
On the whole, majority of heads of schools say that staff meetings are held as and when required, discuss most often school matters at such meetings and further say that decisions taken at such meetings are always implemented.

8= THEIR VIEWS REGARDING THE GOALS OF EDUCATION AND THE ROLE OF STUDENTS AND THEIR IMAGE OF STUDENTS AND PARENTS
The heads of the institutions were requested to give their opinion regarding the present system of education, role of a student, the image of students.
About their feelings with reference to the present system of education and its capacity to inculcate a sense of values in the younger generation, 5 headmasters say that the present system of education inculcates sense of values whereas 9 headmasters and all headmistresses feel that only partially it does so. More number of heads of schools feel that the present system of education only partially inculcates sense of values in the younger generation.
About the role of the student, 3 headmasters feel that a student should devote time only to studies ; 4 headmasters and 3 headmistresses feel that a student should devote time to household duties while 6 headmasters and 3 headmistresses desire that a student devote time to welfare work also. One headmaster and one headmistress have not responded. More number of heads of schools desire students to devote time to welfare work also.
When asked to state about the image of students 3 headmasters and 2 headmistresses say that the students are purposive ; while 11 headmasters and 5 headmistresses feel that they are drifting, 1 headmaster and 1 headmistress say that the students are studious but 11 headmasters atid5 headmistresses say that the students are negligent. Two headmasters and 3 headmistresses think that the students are capable, but 10 headmasters and 4 headmistresses think that the students are incapable of independent thought; 4 headmasters and 3 headmistresses think that the students are disciplined. Eight headmasters and 3 headmistresses say that the students are indisciplined and 6 headmasters and 7 headmistresses say that the students are deferential but 6 headmasters and 2 headmistresses say that the students are unrespectful.
When the heads were asked to say whether in their view the correlation between caste and students of upper caste have better performance, 7 headmasters and 5 headmistresses have found that students of the upper caste do better in their performance than students of lower castes ; 6 headmasters do not think so while 1 headmaster and 2 headmistresses are not in a position to say anything. A larger number of beads of schools feel that students belonging to upper castes do better in their studies than others.
^^ len asked whether parents are interested in the progress of their children in studies, 5 headmasters and 5 headmistresses say that

some parents are interested, whereas 9 headmasters and 2 headmistresses find only few parents interested. While more number of headmasters find only a few parents interested in the studies of their children, more number of headmistresses find only some parents are interested.
9. THEIR ATTITUDES AND VALUES
Heads of schools have in the following paragraphs recorded their views and attitudes on some topics. Choosing between the holy path and the materialistic way of life, only 1 headmaster prefers the holy path while 11 headmasters and 6 headmistresses prefer the materialistic way of life ; 1 headmaster and 1 headmistress are not clear about their choice. Greater number of heads of schools prefer the materialistic way of life.
Questioned about the role of religion in the improvement of one’s lot in life, 3 heads said that it wholly depends on religious belief; 2 headmasters and 7 headmistresses think that it partially depends on religious belief while 9 headmasters think that religion has nothing to do with it. While larger number of headmasters think that religious belief has nothing to do with the improvement of one’s lot in life, a larger number of headmistresses think that religious belief has an important role to play.
All the headmasters and headmistresses would prefer the person who accomplishes things and also think that most other colleagues would also say so ; similarly all the headmasters and all the headmistresses with the exception of one headmistress, even identify themselves with one who accomplishes things. Only one headmistress identifies herself with one who wishes to be left alone. Most of the heads of schools like the person who accomplishes things, and identify themselves with such a person.
When asked to what extent do the politicians pay attention to their words, 1 headmistress says that politicians pay a great deal of attention to their words ; 8 headmasters and 4 headmistresses say that only a little attention is paid ; 5 headmasters say that no attention is paid whereas 1 headmaster and 2 headmistresses do not know. Larger number of heads of schools feel that only a little attention is being paid by politicians to their words.
Further, 4 headmasters and 1 headmistress say that many times they have written to political leaders ; 5 headmasters and 3 headmistresses have sometimes written to them while 5 headmasters and 3 headmistresses have never written to them.
About the qualities that determine respect for an individual, 1 headmaster and 2 headmistresses say that it is the family background ; 4

headmasters and 1 headmistress say that it is large income ; 2 headmasters feel it is the high caste ; 5 headmasters and 4 headmistresses say it is having high education. A large number of heads of schools think that high education is the quality that should determine respectability.
About the qualities that they would admire most in people, 9 headmasters and 4 headmistresses admire one who works well ; 1 headmaster admires the ambitious ; 1 headmistress admires the generous ; 2 headmasters and 2 headmistresses admire one who is active in public and social life. A large number of heads of schools admire the person who does his work weU.
Section III — B
1. THE SCHOOL HEADS AND THEIR RELATIONSHIP WITHTHE MA NA GEMENT
To understand the relationship of the heads of schools with the management a few questions were asked and the responses are recorded below.
Asked whether the headmasters and headmistresses are satisifted with the autonomy in day to day matters, 6 headmasters and 4 headmistresses are satisfied ; 4 headmasters and 2 headmistresses are partially satisfied and 3 headmasters and 1 headmistress are dissatisfied. More number of heads of schools are satisfied with the autonomy in day to day matters.
About the accessibility to the members of the board of management, 6 headmasters say that they are always accessible; 5 headmasters and 5 headmistresses say that they are usually accessible ; 1 headmaster and 1 headmistress say that it depends and 1 headmaster says that they are never accessible. While more number of headmasters feel that members of the board of management are always accessible, more number of headmistresses feel that they are usually accessible.
When asked whether they are ex-oflScio oflftce bearers of the board of management being heads of schools, 6 headmasters and 1 headmistress are such members ; 5 headmasters and 2 headmistresses are ex-offido members of the board of management. Only more number of headmasters are ex-oflBcio members on the boards of management.
Eight headmasters and 2 headmistresses are satisfied with the support they get from the management in the task of running the institution;4 headmasters and 3 headmistresses are partially satisfied and 2 headmasters are not satisfied. While more number of headmasters are satisfied with the support they get from the management, more number of headmistresses are only partially satisfied.

2. THE HEADS OF SCHOOLS AND THE STATE EDUCATIONDEPARTMENT
When questioned about the accessibility to the higher officers in the government department, 2 headmasters say that they are always accessible ; 6 headmasters and 5 headmistresses say that they are usually accessible but 2 other headmasters say that they are never accessible. More number of heads of schools say that higher officers in the government department are usually accessible.
3. THE SCHOOL HEADS AND THEIR RELATIONSHTBS WITHTHE STAFF
About the way the heads o f schools communicate administrative decisions to the members of the staff, 4 headmasters and 1 headmistress do so by circulars ; 7 headmasters and 4 headmistresses by holding meetings ;3 headmasters and 2 headmistresses by holding informal talks. More number of heads of schools communicate administrative decisions to their colleagues by holding meetings.
Asked whether they get, co-operation from teachers in administrative and academic matters, 10 headmasters and 5 headmistresses find teachers fully co-operative ; 4 headmasters and 2 headmistresses are co-operative when requested, in administrative matters. In academic matters, 9 headmasters and all the headmistresses find their teachers fully cooperative whereas 4 headmasters find them co-operative when they are requested to do so. More number of heads of schools find their teachers fully cooperative on administrative and academic matters.
Section IV — The Secondary School Students
1. SOCIAL BACKGROUND
The information about the age, sex, caste, religion, mother tongue, educational and occupational background of the secondary school students is presented below.
Thirty-seven per cent of the boys and 72 per cent of the girls in the age group of 14 and 16 years study in urban secondary schools while only 7 per cent of the boys and 1 per cent of the girls in the same age group study in schools situated in non~urban areas. Only less than one per cent of the age group of 20 and 22 years study in non-urban areas.
Twenty-six per cent of the boys and 32 per cent of the girls studying in urban areas belong to other castes, while more number of boys and girls belong to backward classes in schools in non-urban areas. Forty-

two per cent of the boys and 71 per cent of the girls studying in non-urban schools belong to backward classes. Girl students belonging to other castes outnumber boy students in urban areas. All the boys and girls studying in non-urban areas are Hindus, while Hindu, Muslim, Christian, Jain, Sikh and Zoroastrian students are studying in schools situated in urban areas. But among the urban students, 66 per cent of the boys and 80 per cent of the girls are Hindus. In these urban schools, there are more number of Christian girl students than boys, but there are more Muslim boys than girls in urban areas. Schools situated in urban areas are more cosmopolitan with reference to the student body, than schools in non-urban areas.
There is a greater number of boys and girls in both urban and rural areas whose mother tongue is Kannada. There are 2 per cent of the urban girls whose mother tongue is Gujarati while no boy has Gujarati as his mother tongue. Similarly Oriya is the mother tongue of less than one per cent of the boys in the urban area while no girl speaks Oriya. There are 1 per cent of the boys in the non-urban area who speak Marathi as their mother tongue while no girl from the same area speaks Marathi. The mother tongue of more number of boys and girls is Kannada.
Boys have more experience of rural life than girls; 51 per cent of the boys and 46 per cent of the girls in urban areas have rural experience while 33 per cent of the boys and 52 per cent of the girls have no such experience. All the girl students and all boys excepting one boy have rural experience in non-urban areas. Forty-five to ,50 per cent of boys in urban areas and all boys and girls in non-urban areas have experience of rural life.
>^^en asked about their educational background 37 per cent of the boys and 45 per cent of the girls in urban areas cannot say anything about the education of their grandfathers while 7 per cent of the boys and1 per cent of the girls in non-urban areas also say so. More number of boys than girls in non-urban areas (45 per cent) say that their grandfathers are illiterate ; 7 per cent of the boys in the non-urban areas say that their fathers are illiterate while 43 per cent of the girls in non- urban areas are unable to say anything. More number of boys and girls in urban areas say that their fathers are educated upto middle or high school. It is not so in the case of non-urban areas. More number of boys and girls are not aware of the education of their grandfathers.
When the students were asked whether they hold a free studentship or not nearly 94 per cent of boys and girls in the urban areas and 86 per cent of girls in non-urban areas have not responded to the question. This is true of the answers given by them regarding financial assistance got from their relatives and the government. The response is similar as

regards the adequacy of the assistance and the way of obtaining freeship.When asked with whom they live, 65 per cent of the boys and 85
per cent of the girls in the urban areas live with parents while others live with relatives or at hostels ; 73 per cent of the boys and 85 per cent of the girls in non-urban areas reside with parents. No girls in non-urban areas live with parents ; 49 per cent of the boys and 86 per cent of the girls in non-urban areas live in the same place as their school is situated while 72 per cent of the boys and 84 per cent of the girls in urban areas live in the same place where their school is situated. Most of them stay in the same place where their school is situated. More number of girls than boys stay in the same place where their school is situated.
(i) Age
Out of 903 students, 9 per cent of the boys and 18 per cent of the girls are in the age group of 14 years and below ; 43 per cent of the boys and 73 per cent of the girls are in the age group of 14 to 16 years ; 38 per cent of the boys and 11 per cent of the girls are in the age group of17 and 19 years and 9 per cent of the boys and less than one per cent of the girls are in the age group of 20 to 22 years. There are also 1 per cent of the boys above 23 years of age. Larger percentage of girls than boys are in the age group below 16 years. Ninety-one per cent girls are village group below 16. There are only 11 per cent girls in the age group 17 and above.
(ii) Caste and Religion
Two per cent of the boys and 7 per cent of the girls belong to scheduled castes ; 20 per cent of the boys and 18 per cent of the girls belong to other backward classes ; 30 per cent of the boys and 25 per cent of the girls belong to other castes and 27 per cent of the boys and 35 per cent of the girls have stated that caste does not refer to them while 13 per cent of the boys and 5 per cent of the girls have not responded. It is noteworthy that there are 22 per cent boys and 26 per cent girls of scheduled castes and other backward classes.
(iii) Mother tongue
The mother tongue of 1 per cent of the boys and. 2 per cent of the girls is English ; of 1 per cent of the boys and 1 per cent of the girls is Hindi; of 51 per cent of the boys and 27 per cent of the girls is Kannada ; of 9 per cent of the boys and 11 per cent of the girls is Konkani; of 3

per cent of the boys and 3 per cent of the girls is Marathi and 3 per cent of the boys and 4 per cent of the girls is Malayalam, 2 per cent of the girls’ mother tongue is Gujarati ; of less than one per cent of the girls’ mother tongue is Sindhi while of less than one per cent of the boys’ is Oriya. The percentage of Kannada speaking girls is nearly half of the boys. The Kannada speaking boys are only 50 per cent of the total boys of the student sample.
(iv) Experience of Rural Life
Sixty-four per cent of the boys and 46 per cent of the girls had experience of rural life while the remaining had no such experience. Larger percentage of boys than girls have an experience of rural life.
(v) Educational Background
(a) The grandfathers’ education : The grandfathers of 22 per centof the boys and 16 per cent of the girls are literate or barely literate, the grandfathers of 18 per cent of the boys and 13 per cent of the girls have studied upto primary school ; the grandfathers of 11 per cent of the boys and 13 per cent of the girls have studied upto middle school; the grandfathers of 4 per cent of the boys and 8 per cent of the girls have studied upto college ; the grandfathers of 2 per cent of the boys and 4 per cent of the girls have been trained in traditional education, and the education of the grandfathers of 43 per cent of the boys and 46 per cent of the girls is not known. Majority of the boys and the girls do not know the educational background of their grandfathers.
(b) The fathers education : The fathers of 17 per cent of the boysand 6 per cent of the girls are literate or barely literate ; fathers of 24 per cent of the boys and 14 per cent of the girls have studied upto primary school; the fathers of 31 per cent of the boys and 41 per cent of the girls have studied upto middle school or high school; the fathers of 18 per cent of the boys and 28 per cent of the girls have studied upto college ; the fathers of 1 per cent of the boys and 2 per cent of the girls have training in traditional education while the educational background of the fathers of 7 per cent of the boys and 9 per cent of the girls is not known. The fathers of the larger number of boys and girls are educated upto middle or high school level.
(vi) Occupational Background
(a) Grandfathers’ occupation ; The occupation of the grandfathers of 31 per cent of the boys and 20 per cent of the girls is group 1 namely

owner of farm, fishery etc. ; of 10 per cent of the boys and 10 per cent of the girls it is group 2 namely tenant cultivator etc. ; of 3 per cent of the boys and 8 per cent of the girls it is group 3 namely manual labour in agriculture etc. ; of 7 per cent of the boys and 8 per cent of the girls it is group 4 namely proprietor or director or managing agent etc. ; of 10 per cent of the boys and 11 per cent of the girls it is group 5 namely owner of small business ; of 10 per cent of the boys and 10 per cent of the girls is group 6 namely executive and scientific personnel etc.; of 6 per cent of the boys and 3 per cent of the girls is group 7 namely ordinary administrative staff etc. ; of 4 per cent of the boys and 1 per cent of the girls is group8 namely skilled manual workers of all types. The largest occupation group mentioned as that to which the grandfathers of boys and girls interviewed belong, is ownership of farm, dairy etc.
(b) The fathers' occupation : The occupation of the fathers of18 per cent of boys and 7 per cent of the girls is group 1 namely owners of farms, fishery etc. ; of 7 per cent of the boys and 4 per cent of the girls ?s occupational group no. 2 namely tenant cultivator etc. ; of2 per cent of the boys and 4 per cent of the girls is occupationol group 3 namely manual labour in agriculture etc. ; of 11 per cent of the boys and13 per cent of the girls it is occupational group no. 4 namely proprietor etc. ; of 10 per cent of the boys and 11 per cent of the girls it is occupational group no. 5 namely owner of small business etc. ; of 18 per cent of the boys and 32 per cent of the girls it is occupational group no. 6 namely executive and scientific personnel; of 10 per cent of the boys and 14 per cent of the girls is occupational group no. 7 namely ordinary administrative staff etc. ; of 7 per cent of the boys and 4 per cent of the girls is occupation group no. 8 namely skilled manual workers etc. ; of 2 per cent of the boys and 2 per cent of the girls it is occupational group no. 9 namely unskilled staff, and the remaining occupations of the fathers of students is negligible. The single largest group of occupations of the fathers of boys and girls is group no. 6 namely executives, scientists, doctors etc.
(vii) Economic Circumstances
To the question, regarding whether they would receive financial assistance from their families, 39 per cent of the boys and 48 per cent of the girls state that their families would be in a position to help them ; 15 per cent of the boys and 11 per cent of the girls state that their families will not be able to help them ; 21 per cent of the boys and 13 per cent of the girls think that their families would help them “partially” ; 13 per cent of the boys and 11 per cent of the girls could not say anything in the matter.

The larger number of students are hopeful of getting financial assistance from their families for their further education.
(viii) Residence
To the question “Where do you live ?”, 72 per cent of the boys and 86 per cent of the girls live with their parents ; 14 per cent of the boys and8 per cent of the girls live with their relatives and 16 per cent of the boys and 6 per cent of the girls live in hostel rooms. As regards the places v/here they live; 72 per cent of the boys and 86 per cent of the girls live in the same place where their school is situated ; 13 per cent of the boys and12 per cent of the girls live in the villages within a distance of 5 miles ; 7 per cent of the boys and 1 per cent of the girls live in villages beyond 5 miles only. A very negligible number of students live in other towns or cities. Most of the students live with their parents in the same place where their school is situated.
2. THE INTEREST TAKEN BY THE FAMILY
The students were asked to give information regarding the help given to them by their families in their studies in the form of coaching, finance, etc.
(i) Help in Studies
Asked whether any of the members of their family help them in their studies 41 per cent of the boys and 49 per cent of the girls in the urban areas say yes, while 43 per cent of the boys and 50 per cent of the girls in the urban areas say no ; 22 per cent of the boys and 15 per cent of the girls in the non-urban areas get help from the members of their family in their studies while 80 per cent of the boys and 87 per cent of the girls say no. It is clear from the number mentioned above that members of the family in the urban areas help their children in studies while it is not so in non-urban areas.
(ii) Special Tutor, etc.
When asked whether they have engaged a special tutor and are attending coaching classes, 67 per cent of the boys and 85 per cent of the girls do not have a special tutor while others have ; 77 per cent of the boys and 88 per cent of the girls in the urban areas do not attend coaching classes while others attend. It is significant to note that most of the boys and girls do not have special tutors.

(iii) Financing Education
When asked whether their family will finance for education, 35 per cent of the boys and 47 per cent of the girls in urban areas say yes and 25 per cent of the boys and 26 per cent of the girls from the same area cannot say ; 34 per cent of the boys and 71 per cent of the girls in the non-urban areas say that their family will assist them if they take up further education ; 22 per cent of the students say no and 24 per cent of the students say that partially it is so. More number of girls than boys are hopeful of getting financial help from their families for their further education.
Eighty-four per cent of the students who reside in rooms, hostels, with relatives or parents have no tutors while 17 per cent have engaged tutors. Among them, more number of students (29 per cent), who reside in hostels or rented rooms have engaged tutors than those who live with parents or relatives.
3. THE STUDENTS’ VIEWS REGARDING THE GOAL OF EDUCATION AND ON THE ROLES OF THE TEACHERS AND STUDENTS
The students are asked to give their views on the goals of education, role of the teacher and their own aspirations.
(i) The Goal of Education
Forty-one per cent of the boys in urban areas say that the goal of education is to build good citizens. None of the girls say so. Twenty- one per cent of the boys and 22 per cent of the girls say that it is to make one into a cultured person ; 15 per cent of the boys and 14 per cent of the girls say it is to help an individual achieve higher status ; 7 per cent of the boys and 5 per cent of the girls say that it is to provide economic security. As many as 51 per cent girls state that the goal of education is “some other” than the four alternate goals mentioned in the questionnaire.
(a) Difference by urban—non-urban residence : Among boys andgirls in non-urban areas, 56 per cent of the boys say that the goal is to achieve higher status whereas only 43 per cent of the girls say so ; 57 per cent of the girls say it is something else ; only 4 per cent of the boys say so. While 34 per cent of the boys say that the goal is to be a good citizen, no girl says so in the non-urban areas.
(b) Type of institution and views regarding the goals of education : Fifty-four per cent of the students studying in government schools say that

the goal is to make one a good citizen ; 34 per cent of the students in un-aided schools say it is to achieve higher status in society ; 33 per cent in municipal schools say it is to provide economic security. Large number of students studying in government schools think that the goal of education is to make one a good citizen.
(c) Rural-urban background and views on goals of education : Tothe question on the goals of education, 46 per cent of the students who have a year’s or more than 3 years’ experience of rural life feel that the goal is to make one a good citizen.
(d) Economic circumstances as a variable : About the goals ofeducation 53 per cent of the students who get help financially from their family for higher education say that the goal is to make one a good citizen ; while only 4 per cent from the same group say that the goal is to provide economic security. A large number of students belonging to different economic status think that the goal of education is good citizenship.
(e) Parental education as a factor making for differences in opinion : Further 71 per cent of the students whose parents are educated upto middle or high school level feel that the goal is to make one a good citiien. Forty-three per cent of the students whose fathers are educated in the traditional system of sanskritic education say that it is to make one a cultured person. Only 6 per cent of the students whose fathers are either illiterate or educated upto different standards say that the goal is to provide economic security. A large number of students whose fathers are educated upto middle or high school think that the goal is to make one a good citizen while students whose fathers are educated in the traditional system desire that the goal of education is to make one a cultured person.
(f) Plans for the future making for differences of opinion on thegoals of education : To the question “What do you think is the principalgoal of education” ? 51 per rent of the students who would like to start earning for their livelihood after secondary school education, think that the goal of education is to turn one into a good citizen. Only 5 per cent of the students, who are undecided as to continue or earn after school studies, feel that the goal is to provide economic security. More number of these students who would like to start earning think that the goal of education is good citizenship.
(ii) The Role of the Teacher
The students were asked for their opinion on whether a teacher should act as a second parent or whether the teachers’ responsibility should be restricted to the class room. While 74 per cent of the boys and 91 per cent of the girls in the urban areas say that a teacher should really be

like a second parent, and ensure all round development of the students,11 per cent of the boys and 8 per cent of the girls say that a teacher should primarily be concerned with teaching his subject in the class room and should not worry about the student outside the class room. Similarly 79 per cent of the boys and 77 per cent of the girls in the non-urban areas want teachers to be like second parents ; 21 per cent of the boys and 20 per cent of the girls want them to be subject teachers only. A larger number of boys and girls are desirous of havmg such teachers who look after them like parents ensuring all round development.
(iii) The Role of the Student
When asked to state their opinion on whether the students should concentrate exclusively on study or in addition do household work, and welfare work and indulge in political activities, 22 per cent of the boys want students to be studious only; 28 per cent of the boys and 38 per cent of the girls in the urban areas believe that students should also devote time to household duties. While 18 per cent of the boys and 19 per cent of the girls want students to do welfare work in addition to studies and household work, 13 per cent of the boys and 17 per cent of the girls in urban areas think that not only should students study, do household work and welfare work, but they should also take part in politics. Twenty per cent of the girls were unable to answer the question.
Differences by urban—non-urban location : In the non-urban areas,while 29 per cent boys desire students to study, only 1 per cent of the girls say so ; 31 per cent of the boys say that students should do householdduties while no girls want students to do either. It is significant to notethat more number of girls in non-urban areas desire students to take part in politics.
When asked about the role of a students, 47 per cent of the students who desire to earn their livelihood after secondary school education, desire a student to devote time to household duties, while only 12 per cent of the students who are undecided whether to earn or study further would like a student to take part in politics. The large number of these students who would like to start earning would like to devote time to household duties.
(iv) Chances of Achieving the Goals of Life
(a) Education and the goals of life : About the students’ ideas regarding the present course of education and the possibility of achieving the goals of life through education, 64 per cent of the boys and 70 per cent of the girls in urban areas are hopeful of achieving it but 5 per cent of the boys and 3 pei: cent of the girls are not hopeful and 15 per cent of

the boys and 26 per cent of the girls are unsure. In the non-urban areas, 79 per cent of the boys and 91 per cent of the girls are “hopeful” and 9 per cent of the boys are not and 3 per cent of the boys and 8 per cent of the girls are not in a position to say anything. Generally a large number of boys and girls are hopeful of achieving the goals in life through the present system of education.
fb) Differences by type of institution : When students were askedwhether they think that the present system of education will help in achieving the aim of life, 74 per cent of students studying in different schools say yes, 21 per cent cannot say while 4 per cent say ho. Ninety-thret per cent in unaided schools think that the aim of life can be achieved, 2^ per cent in government schools cannot say. Most of the boys and girls in unaided schools are hopeful of achieving the aims of life, through the present system of elucation.
(c) Students’ plans for further study, as related to their views oneducation and the goals of life: Asked for the students’ views on education as a means of achieving goals in life, of them 80 per cent who desire to earn after studies favour the same opinion. The larger number of studentswho either wish to earn or continue their studies feel that the presentcourse of education will help in achieving the goals of life.
(d) Chances of achieving the goals of life : As for the chances ofachieving the goals of life, 33 per cent of the boys and 42 per cent of the girls in urban areas say that chances are fa ir; 31 per cent of boys and 15 per cent of the girls say that chances are bright; 2 per cent of the boys and 3 per cent of the girls say that chances are poor. In the non- urban areas, large number of girls (57 per cent) say that chances are bright while large number of boys (54 per cent) say that chances are fair. Only 4 per cent of the boys say that chances are bright and 3 percent of the girls say that chances are fair. Large number of boys andgirls in urban areas and boys in non-urban areas find their chances fair in achieving the goals of life.
(e) Differences by type of institution : Seventy-four per cent ofthe students in unaided schools think that the chances are bright while 50 per cent in government schools feel it fair. Only 10 per cent in municipal schools think it to be poor and 34 per cent in aided schools cannot say anything. Large number of students in unaided schools think that chances are bright while those students in government schools think that chances are fair.
(f) Differences by occupational background : Forty-three per centof the students whose fathers belong to occupational group 2 namely, tenant cultivator etc. cannot say anything while 60 per cent of the
students whose fathers belong to armed forces personnel say that chances are fair. Only a small percentage say that chances are poor. A larger

number of students whose fathers belong to armed forces feel that chances are fair in achieving the goals of life, than others.
(g) Preference for rural-urban life and making for differences : When the students were asked to give their views regarding the chances of achieving goals in life, 43 per cent who prefer urban life say that chances are fair while 42 per cent of students who cannot take a decision to choose between rural and urban life cannot say anything about the chances of achieving one’s goals in life. More number of students (30 per cent) who prefer rural life feel that chances are bright than the rest. A slightly more number of students who prefer urban life say that chances are fair in achieving the goals in life.
4. STUDENTS’ PERFORMANCE AND STUDY HABITS
The students are asked to give information regarding the percentage of marks obtained by them, immediately preceeding their being interviewed, in the two examinations.
(i) Performance
When asked about the percentage of marks obtained by the students in the last two examinations, 35 per cent of the boys and 36 per cent of the girls in the urban areas and 4 per cent of the boys and 1 per cent of the girls in the non-urban areas state that they obtained between 40 and 49 per cent marks ; 23 per cent of the boys and 22 per cent of the girls in the urban areas and 22 per cent of the boys and 9 per cent of the girls in the non-urban areas obtained between 50 and 59 per cent marks ;13 per cent of the boys and 16 per cent of the girls in the urban areas and 34 per cent of the boys and 51 per cent of the girls in the non-urban areas got between 30 and 39 per cent marks and 6 per cent of the boys in the non-urban area obtained less than 30 per cent marks.
In the last but one examination 29 per cent of the boys and 29 per cent of the girls in urban areas, 18 per cent of the boys and 52 per cent of the girls in non-urban areas obtained between 50 and 59 per cent while 25 per cent of the boys and 29 per cent of the girls in urban areas and 34 per cent of the boys and 28 per cent of the girls in non-urban areas scored between 40 and 49 per cent marks ; 11 per cent of the boys and 4 per cent of the girls in urban areas, 13 per cent of the boys and 71 per cent of the girls in non-urban areas obtained between 30 and 39 per cent. While 2 per cent of the boys and 3 per cent of the girls in urban areas and 7 per cent of the boys in non-urban areas scored less than 30 per cent marks. In the last but one examination, it is seen that more number of students in the urban areas obtained more percentage of

marks than what they got in the last examination. This is true of non- urban girls also.
(ii) Study Habits
When asked whether they keepup with the lessons taught in the class 75 per cent of the boys and 72 per cent of the girls in the urban area say yes ; 9 per cent of the boys and 23 per cent of the girls say no. while 91 per cent of the boys and 100 per cent of the girls in the non-urban areas say yes and only 11 per cent of the boys say no. The majority of girls and boys seem to be able to keep up their academic work.
(a) Type of institution and regularity of work : Ninety-six percent of the students studying in unaided schools and 73 per cent of students studying in government aided schools keep up their reading with the class. Most of the students in unaided schools keep up the reading habit in the class.
(b) Residence and regularity of work : Eighty-two per cent ofstudents who live with parents, or relatives keep up with the lessons taught in the class and 85 per cent of the students reside in hostels or rented room do so. But 19 per cent of those who live with parents do not keep up with their class. It is significant to note that the number of students who are able to keep up with the class is higher among those staying in hostels than students who live with their parents or relatives.
5. PLANS FOR THE FUTURE
(i) Plans for Education
Asked what they intend to do after their year in school, 59 per cent of the boys and 45 per cent of the girls in urban areas say that they intend to continue their studies while 21 per cent of the boys and 36 per cent of the girls are not in a position to say about the future action but 5 per cent of the boys and 9 per cent of the girls intend working to earn their livelihood.
(a) Type of institution and plans for further education : Sixty-nineper cent of the students studying in municipal schools desire to continue education while 14 per cent studying in unaided institutions desire to earn and 38 in government schools cannot say anything. Though the larger number of students, regardless of the type of institutions they belong

to, desire to continue their studies, the number of students who plan to continue their studies is higher in municipal schools than in other schools.
(b) Rural-urban background of the students and their desire tocontinue studies further : Forty per cent of the boys and 25 per centof the girls studying in schools situated in urban areas are prepared to pursue their studies even if their family cannot finance for their education, while 31 per cent of the boys and 45 per cent of the girls cannot say anything but 10 per cent of the boys and 20 per cent of the girls say that they are not in a position to pursue their studies. In the non-urbanareas, 80 per cent of the boys and 71 per cent of the gjrls are in a position to pursue their studies inspite of no help financially from their families while 2 per cent of the boys and less than 1 per cent of the girls cannot say. While more number of boys in the urban areas are prepared to further their studies inspite of financial assistance from their families, girls are not definite.
(c) Economic dcumstances and the desire to continue studies : Fifty-five per cent of the students, who say that their families are willing to finance for their. further education, desire to continue their studies after their secondary school education ; 31 per cent of the students whose families are not in a position to finance for their further education, desire to start working to earn their livelihood ; 36 per cent of the students who do not know whether their families finance for their further education or not, are undecided as what to do after secondary school education. Thus, it is seen as expected that larger numbers of students whose families are prepared to finance their education are desirous of continuing their studies.
About their willingness to study even when their families do not finance for their further education, it is seen that 49 per cent of the students are determined to study even if their family does not financially help them ; while 53 per cent of students who have given no reply to the question whether they would continue their studies if their family does not finance them, desire to start working to earn their livelihood. It is significant to note that the continuance of studies by students mostly depends upon the financial assistance from their families.
(d) Parental education and the plans for further education : Further, 38 per cent of the students whose fathers are educated upto middle or high school level desire to continue their studies. While 40 per cent cannot say and 29 per cent want to earn their livelihood, but 33 per cent of the students whose fathers are educated upto primary school want to start working to earn their livelihood. More number of students whose fathers are educated upto middle or high schools, are undecided regarding this issue to continue or discontinue their studies.

(ii) The Students’ Occupational Aspirations
The students were asked to give information regarding their occupational aspirations, after the completion of their studies. When the students were asked, what occupation they liked to follow after they complete their studies, 49 per cent of the boys and 46 per cent of the girls in the urban areas preferred group 6, namely executive and scientific personnel, professor, doctor, lawyer etc. while only less than 1 per cent of the boys desire to choose occupational group 2, namely, peasant, proprietor, tenant cultivator etc. No girls desire to choose any of the occwpatiom in the first iour groups. More number of boys and girls in urban area prefer to be executives, scientists, doctors etc.
(a) Urban and non-urban location as a variable : In the non-urban areas, 43 per cent of the boys and 43 per cent of the girls desire to choose occupational group 6, namely executive and scientific personnel, professor, doctor, lawyer etc. One per cent of the girls desire to choose other occupations not listed in the questionnaire. Similar is the case with the students of the non-urban areas who say that they desire to be executives, scientists, etc.
(b) Economic circumstances and choice of occupation : Aboutthe occupation they desire to choose inspite of their families not helping them financially, 67 per cent of the students who would like to continue their studies even if their families did not help them, would like to choose occupational group 6, namely, executive and scientific personnel, professor, doctor, lawyer etc. Nobody would like to choose group 4, namely proprietor, director etc. or group 9 namely, peon, coolie, etc. More number of students who do not get any financial help from their families are desirous of choosing occupational group 6, namely executives, scientists etc.
(c) Education of parents and occupational aspirations : Fifty-eightper cent of the students whose fathers are barely literates or illiterates or educated upto difi’erent standards choose group 6, namely executive and scientific personnel, professor, doctor, lawyer, etc ; 62 per cent of the students whose fathers are educated upto middle or high school favour the same opinion, while none of the students would like to choose group 3, namely manual labourer etc., or group 9, namely unskilled staff, coolie, peon etc. Most of the students irrespective of their educational background desire to be executives, doctors, etc.
Seventy-three per cent of the students whose fathers belonged to occupational group 6, namely executive and scientific personnel etc., would like to choose the same occupation, and nobody in that group would like to take up occupational group 9, namely unskilled staff, peon etc., out of all students contacted who have different occupational back

ground, none desires to be a coolie, peon etc. It is significant to note that no student would like to be peons, or coolie.
6. STVDENT-TEACHER RELATIONSHIPS
(a) Asking the teacher for help in studies : To the question “Doyou ask your teacher for help in your studies” 63 per cent of the students ask their teachers for help in their studies while 22 per cent do n o t; of them 5 per cent find no need lor such help ; 9 per cent hesitate to ask and 7 per cent give some other reason.
(b) The economic circumstances of the students do not seem to makeany difference : A large number of students, whether they get financialassistance from their families or not, go to their teachers for help in their studies.
(c) Rural background and relationship with the teacher : It is seen that 71 per cent of the students who have 3 years or more of experience of rural life go to teachers for help ; 87 per cent of students who have 1 to 3 years of experience of rural life get assistance from teachers regarding studies ;12 per cent of the students who have just a year’s experience of rural life hesitate to go to their teachers for help while 7 per cent of the students who have more than 3 years of experience of rural life have not felt the need for help. Large number of students irrespective of the number of years of rural experience, go to teachers for help in their studies.
(d) Educational background as a variable : Seventy per cent of thestudents whose fathers are illiterates go to teachers for help ; out of the 15 per cent of students who do not go for help, 5 per cent feel no need and 9 per cent of students hesitate to go to the teacher for help. It is again seen that the majority of students irrespective of their educational background go to the teachers for help in their studies.
7. THE SOCIAL ATTITUDES AND VALUES OF THE STUDENTS
(i) Quality that Determines Respect :
Sixty-seven per cent of the students who would like to continue their studies after completing secondary school education say that high education is the determining fact in respecting a person while 1 per cent of the same group say it is high caste. More number of students who would like to continue their studies feel that high education is a trait of respectability.
Asked for their views about the trait which they think determines the respect or prestige a man deserves, 62 per cent of the boys and 49

per cent of the girls in the urban areas say it is high education while in the non-urban areas, there is difference of opinion between boys and girls —80 per cent of the boys say that it is high education and 75 per cent of the girls say that it is large income. While more number of boys and girls in the urban areas respect the highly educated, more number of boys in the non-urban areas say so but more number of girls feel that respectability is in the large income one gets.
To the question on the quality they admire most, 62 per cent of the boys in the urban areas admire the respectful while 23 per cent of the girls admire one who keeps to himself. Only 21 per cent of girls admire the respectful. In the non-urban areas, 30 per cent of the boys admire the person who is active in social and public life while 57 per cent of the girls admire the person who keeps to himself. More number of boys in the urban areas admire the respectful while girls admire one who keeps to himself. Again more number of boys in non-urban areas admire one who is active in social life while more number of girls admire the person who keeps to himself.
Large number of students (61 per cent) who feel that their chances in achieving goals in life are bright, fair or poor etc., respect the person who is highly educated. Out of this number 75 per cent who feel chances are bright favour the same opinion ; 28 per cent who are undecided as regards the achievement of goal feel that it is something else.
Twenty-eight per cent of the students who find their chances bright in achieving their goals in life admire a person who is active in public and social life ; 21 per cent of the students who find their chances fair, admire one who does not allow any one to take advantage of him ; 28 per cent of these students who find their chances poor, admire the respectful. A slightly large number of these students admire the respectful.
(ii) Students’ Social Status in Society
To the question on their social status in society, 79 per cent of the students who think that their chances in achieving goals in life are bright, fair or poor, identify their status with the middle social position, 22 per cent of the students who find their chances poor in achieving their goals in life, identify their status with the upper social position. Nobody in this group identifies with the lowest social position. While 75 per cent of these students who find their chances bright, fair, poor etc., feel that it is hard to move up in society, 33 per cent who find chances poor do not know but 15 per cent of students who find chances bright, find it easy to move up in society. Large number of these students who are bright

identify their status with the middle social position and find it hard to move up in society.
In the non-urban areas, 58 per cent of the boys and 43 per cent of the girls identify their status with the middle social position while 34 per cent of the boys and 43 per cent of the girls with the highest social position. More number of students identify their status with the middle social position ; 64 per cent of the boys and 82 per cent of the girls in the urban areas and 68 per cent of the boys and 91 per cent of the girls in the non-urban areas find it hard to move up in society ; 8 per cent of the boys and 8 per cent of the girls in urban areas and 28 per cent of the boys and 15 per cent of the girls in non-urban areas ftnd it easy to move up in society ; 11 per cent of the boys and 23 per cent of the girls in urban areas do not know. More number of students find it hard to move up in society.
(iii) Whether the Student Believe he can Influence Change in Society
To the question “Do you believe you can influence changes in society”, 72 per cent of the boys and 87 per cent of the girls in the urban areas, and 92 per cent of the boys and 100 per cent of the girls in non- urban areas feel that changes are for the better ; 42 per cent of the boys and 57 per cent of the girls in the urban areas and 72 per cent of the boys and 91 per cent of the girls in non-urban areas feel that they can influence these changes. Only 10 per cent of the boys and 11 per cent of the girls in the urban areas and 6 per cent of the boys in the non-urban areas feel that the changes are for the worse while 15 per cent of the boys and 19 per cent of the girls in urban areas do not think so. Large number of students feel that changes that are taking place in the society are for the better and are hopeful of exerting influence on these changes.
(iv) Students Preference between One who Accomplishes and One who Wishes to be Lejt Alone
Giving their preference between one who accomplishes things and the other who wishes to be left alone, 78 per cent of the boys and 93 per cent of the girls in urban areas prefer and identify themselves with the former while 7 per cent of the boys and 5 per cent of the girls prefer the latter. All boys and girls in non-urban areas prefer one who accomplishes things and even identify with such a person. Similarly, it is true that most of the boys and girls in urban areas (70 per cent of the boys and 87 per cent of the girls) say that most other students would also feel so. In the non-urban areas also, 82 per cent of the boys and 86 per cent of the

girls feel similarly. Most of the students in urban and non-urban areas prefer and identify themselves with a person who accomplishes things.
(v) Students Preference between Holy Path and Materialistic Way of Life
When asked for their preference between the holy path and the materialistic way of life, 57 per cent of the boys and 66 per cent of the girls studying at schools situated in urban areas prefer the materialistic way of life while the rest desire the holy path ; 8 per cent of the boys and15 per cent of the girls are not clear about their choice. In the non- urbau areas, 90 per cent oi the boys prefer the materiaUstie way oi h!e while 100 per cent of the girls in the non-urban areas prefer the holy path. Only 9 per cent of the boys in the non-urban area prefer the holy path.
(a) The students' attitude to caste and religion : When asked fortheir view about the role of caste and religion in social and political life, 68 per cent of the boys and 76 per cent of the girls in the urban areas say that caste and religion “should not play any part in social and political life” while the rest feel that “under certain circumstances it may be inevitable” that caste and religion play a part in social and political life. In the non-urban areas 74 per cent of the boys and 71 per cent of the girls do not want caste and religion to play any part in social and political life while 24 per cent of the boys and 25 per cent of the girls want them under certain circumstances. The majority of students in urban and non-urban areas do not believe that caste and religion should play any role in social and political life.
(i) Type of institution making for differences : Eighty-four percent of the students studying in unaided schools, do not want caste to play any role in social and political life while only 50 per cent of the students in aided schools are of that opinion. Fifty-two per cent of the students studying in government schools and 67 per cent studying in unaided schools feel that caste has no role to play either in political or social life 50 per cent of the students in municipal schools feel that caste has to play its role only in personal hfe. It is seen that although a large number of students studying in unaided as well as aided schools do not want caste to play any role in social or political life the percentage of those who consider caste irrelevant is higher among the students in unaided schools.
(ii) The religion of the students and their attitude to caste andreligion : All students who belong to the Sikh, or Zoroastrian religionsbelieve that caste and religion should not play any role in social and political life. As against this 60 per cent of the students who belong to Jain religion, 51 per cent of the Hindu students, 55 per ceiit of the
Muslims, 56 per cent of Christians and 100 per cent of those who belong to religions other than those listed in the questionnaire want caste to play its role under certain circumstances. The differences between Sikhs and Zoroastrians on the one hand and the other religions groups on the other, are significant.
(iii) The students’ place of residence as a variable : When thestudents residing with parents, relative or in hostels were asked to give their opinion, 92 per cent of students residing in hostels or rented rooms do not want caste to play any role in social and political life; 30 per cent who stay with relatives, want caste to play its role under certain circumstances and 51 per cent of students who are staymg with their parents feel that caste has no place in social and political life. A lthou^ the majority of both groups of students consider caste immaterial it is significant to note that the percentages of those who think so is conspicuously smaller among students staying with parents, relatives than it is among the students staying in hostels.
Among the students with different rural-urban background, 81 per cent of students who stay with relatives say that caste has no role to play in social or political life. Whereas 22 per cent of students who stay with parents want caste to play its role only under certain circumstances, 51 per cent of the students staying with relatives feel that caste has to play its role only in personal life while 52 per cent of the students staying with parents and 52 per cent in hostels or rented rooms want so under certain circumstances. While more number of students staying with parents or in hostels desire caste to play its role only under certain circumstances, more number of students staying with relatives desire caste to play its role only in personal life.
(iv) Economic circumstances as a variable : Eighty-two per centof students whose families are prepared to finance their further education feel that caste should not play any role in social and political Ufe. Fifty-three per cent of the students who say that their families will only partially finance their further education wish that caste should not play any role in social and poUtical life ; 54 per cent of the students whose parents are not prepared to finance their children, 30 per cent who are not sure, that their parents will finance them, and 60 per cent to whom the question regarding parental support for further education is not applicable as they do not intend to study further say that caste and religion should play a part in social and political life under certain circumstances. It is seen that majority of students, both those who expect to get financial assistance from their families and those who do not get such assistance, want caste to play its role in social and poUtical life only under certain circumstances.
(v) Educational background as a variable : Eighty-three per cent

of the students whose fathers are educated upto college level do not want caste to play any role in social and political life. In contrast 50 per cent of the students whose fathers are educated traditionally in the sanskritic system, believe that caste should play a part in social and political life- under certain circumstances.
Seventy-one per cent of the students whose fathers are educated in the traditional system and 60 per cent who do not know what the education of their fathers is say that caste has no place in public or personal life. Fifty-six per cent whose parents are illiterate, 55 per cent whose fathers are educated upto primary school, 51 per cent whose fathers are educated upto middle or high school and 54 per cent whose fathers are college educated desire caste to play its role only in personal life. A large number of students whose kthers are college educated do not want caste to play any role in political or social life but feel that it has an important role, to play in personal life.
(b) Scheduled caste friends : The percentage of students who havescheduled caste friends is not higher among students who believe that caste should not play any part in social and political life than among students who feel that caste has an important role to play only in personal life have no friends who belong to scheduled castes. It is seen that large number of students who say that caste has an important role to play only in personal life have more number of scheduled caste friends than others.
(i) Self image of status and scheduled caste friends : Among thoseconsider themselves to belong to “the middle” social position, 79 per cent of the students do not want caste and religion to play any role m political and social life. But only 32 per cent of the students of this class have more friends who belong to scheduled castes for such students. The attitude to caste (68 per cent) of the students who find it hard to move up in society do not want caste and religion to play any role in social and public life. Only 31 per cent of these students have more friends belonging to scheduled castes and wish that special facilities in education are to be provided for them.
Among those students who admire the person who is active in social and public life, 61 per cent of those students do not want caste to intervene in social or political life and 52 per cent of those students who admire the person who does not allow any body to take advantage of him feel that caste is important only in personal life.
(vi) Religious Faith and Improvement of One’s Lot in Life :
About the belief that religious faith has an important role to play in the improvement of one’s lot in life, 34 per cent of the boys and 31 per cent of the girls in urban areas think that religion has nothing to do with

the improvement of one’s lot in life ; 27 per cent of the boys and 25 per cent of the girls think that it depends partially on religious belief while 8 per cent of the boys and 13 per cent of the girls think that it wholly depends on religious faith. In the non-urban areas 63 per cent of the boys and 100 per cent of the girls feel that religion has nothing to dowith the improvement of one’s lot in life. It is seen that more numberof students in urban and non-urban areas feel that religion has nothingto do with the improvement of one’s lot in life.
About the students’ attitude to caste and religion, students who say that improvement in one’s life depends partially on religious belief, feel that caste and religion have no place in either social or public life. More number of students in the above category do not have friends who belong to scheduled castes while those who say that religious faith has no relation to the improvement of one’s lot in life have more friends belonging to scheduled caste than others, and they also feel that special facilities in education should be provided for students of scheduled castes. Further with reference to the traits that determine respectability more students prefer high education. Among these students who respect the highly educated, 81 per cent of the students feel that caste and religion have no place in social or political life. But students who belong to this category have lesser number of friends who belong to scheduled castes, who even then favour special faciUties in education for them. About 51 per cent of the students who respect the highly educated mention that caste should play an important role only in personal life.
(vii) Students Rural-Urban Background and Friendship with Scheduled Caste/Tribe Students
Among the students who do not belong to scheduled caste, 29 per cent of the boys and 28 per cent of the girls in urban areas have close friends who belong to scheduled castes. Twenty-five per cent of the boys and 36 per cent of the girls do not have and 14 per cent of the boys and16 per cent of the girls cannot say anything. Only 57 per cent of the boys and 49 per cent of the girls in non-urban areas have scheduled caste friends. The others do not have such friends or are not in a position to say anything. Large number of boys in urban and non-urban areas have close friends belonging to scheduled castes.
Thirty-three per cent of the students whose fathers are educated upto different standards or are illiterates have close friends who belong to scheduled castes while 33 per cent do not have ; 45 per cent of the students whose fathers are illiterates have more scheduled caste friends than others while 43 per cent of the students whose fathers are college educated do not have such friends. It is significant to note that more number of

students whose fathers are illiterates have more scheduled caste friends than those students whose fathers are college educated.
Thirty-six per cent of the students who admire various qualities in persons have no close friends belonging to scheduled castes ; 49 per cent of these students prefer only facilities in education to be provided for them. When further asked for their opinion regarding many changes that are taking place in society and their influence on such changes, most of the students who were against the idea of the intervention of caste and religion in social and political life feel that such changes are for the better and do not think they can influence changes. But those students who feel that facilities are to be provided for scheduled caste students feel that influence should be exerted on such changes. It is significant to note that more number of students irrespective of their educational or economic background, their status in society do not want caste and religion to play an important role in social or political life, desire that special facilities in education should be given to students belonging to scheduled castes. It is also seen that more number of students feel that the changes in society are for the better.
(viii) Students Views about the Provisions and Facilities given to Scheduled Caste/Tribe students
When asked for their views about the provisions and facilities given to scheduled caste students and the continuance of such facilities, 45 per cent of the boys and 53 per cent of the girls studying in schools situated in urban areas, feel that special facilities in education should be continued while 24 per cent of the boys and 27 per cent of the girls express no opinion. A very small percentage of boys and girls feel that special facilities in employment, political representation should be given to scheduled castes but 6 per cent of the boys and 4 per cent of the girls in the urban-areas do not want the scheduled caste students to be given any of these facilities. Large number of students in urban areas think that only special facilities in education should be given to scheduled caste students.
Fifty per cent of the students whose fathers are illiterates or educated upto different standards desire the provision of special facilities in education only to be given to scheduled caste students. Eleven per cent desire special facilities in employment opportunity, 4 per cent in political representation, 5 per cent are against any of these facilities. Large number of students irrespective of the educational background of their fathers desire that special facilities in education only should be given to students belonging to scheduled castes.

Fifty-two per cent of the students who feel that caste has no place in social and political life desire that special facilities in education should be provided for scheduled castes whereas 29 per cent of the students do not give any opinion. While 59 per cent of the students who have friends belonging to scheduled castes desire that scheduled caste students should be provided with facilities in education only, 29 per cent who have such friends or not, do not give any opinion. It is seen that more number of these students who say that caste has no place in political and social life feel that only educational facilities should be given to students belonging to scheduled castes.
(ix) Students and Politicians
When asked about the attention paid by politicians to their words,34 per cent of the boys in urban areas feel that no attention is being paid while 39 per cent of the girls feel that a little attention is paid. In the non-urban areas, while 53 per cent of the boys feel that no such attention is paid, 57 per cent of the girls feel that a great deal of attention is paid but 42 per cent of other girls feel that only a little attention is paid. Large number of boys feel that no attention is being paid by politicians to their words while more number of girls feel that a little attention is being paid.
This being the case, 72 per cent of the boys and 91 per cent of the girls in urban areas, have never written to political leaders while 10 per cent of the boys and 7 per cent of the girls have sometimes written. Only2 per cent of the boys and 40 per cent of the girls say that many times they have written to political leaders while more girl students (57 per cent) have sometimes written to them. Large number of boys and girls in urban and non-urban areas have never written to political leaders.
Section V — The Scheduled Caste Student
1. INTRODUCTION
To understand the problems of the scheduled caste people a few questions were asked.
Six per cent of the boys and 7 per cent of the girls belonging to scheduled castes are studying in schools situated in urban areas while 34 per cent of the boys and 14 per cent of the girls belonging to scheduled castes are studying in non-urban areas. More number of students belonging to scheduled castes study in non-urban areas.

2. THEIR INVOLVEMENT, RELATIONSHIP WITH VIEWSREGARDING THEIR TEACHERS
When asked whether they follow the subjects in the class or not, out of the 50 per cent who say yes, 81 per cent hesitate to go to teachers for help ; 7 per cent feel that they have felt no need for such a help and say that teachers do not explain clearly.
Seventy-six per cent of the students who belong to scheduled castes go to teachers for help ; out of the rest, 7 per cent have felt no such need ; 13 per cent hesitate to go to teachers an_d 3 per cent give some other reason. Ninety per cent of those students want teachers to be like parents and should ensure all round development while 10 per cent desire them to be concerned only with teaching the subjects and not be worried about student behaviour outside the classroom. It is seen that more number of scheduled caste students follow lessons in the class, go to teachers for help and would like their teachers to be like parents.
3. THE GOALS OF EDUCATION AND THE ROLE OF THESTUDENT
To the question “What do you think is the principal goal of education ?”, 35 per cent of the scheduled caste students feel that the goal of education should be to turn one into a good citizen ; 30 per cent say that it is to achieve higher status ; 23 per cent say that it is to make one a cultured person and 11 per cent say it is to provide economic security. It is significant to note that more number of scheduled caste students think that the goal of education is good citizenship.
4. THEIR VIEWS REGARDING CASTE
Eighty four per cent of the scheduled caste students say that caste and religion should not play any part in social and political life ; 16 per cent say that under certain circumstances, it may be inevitable that caste and religion should play a part in social and political life. More number of scheduled caste students do not like caste to play any role in social and political life.
Further 42 per cent feel that while caste should not play any role in public life, it has an important role in one’s personal life. More number of scheduled caste students feel that caste has an important role to play in personal life. While 77 per cent prefer the materialistic way of life, 17 per cent prefer the holy path.
Fifteen per cent feel that the improvement of one’s lot in life wholly depends on religion while 13 per cent partially agree ; but 54 per cent

feel that religion has nothing to do with one’s lot in life. It is seen that more number of scheduled caste students prefer the materialistic way of life and feel that religion has nothing to do with the improvement of one’s lot in life.
Forty-four per cent feel that a little attention is paid by politicians to their words while 25 per cent do not feel so ; 15 per cent feel that a great deal of attention is paid.
Ninety-seven per cent prefer the person who accomplishes things while only 3 per cent prefer the person who desires to be left alone and also identify ^emselves with such a person and 79 per cent o! them feel that most of other students would prefer one who accomplishes things while the others prefer the latter. Most of the scheduled caste students prefer one who accomplishes things and even identify themselves with such a person and feel that politicians have not paid attention to their words.
Forty-nine per cent of the scheduled caste students respect the highly educated while none respects a person because he belongs to a high caste. Eighty per cent have never written to political leaders while 19 per cent have sometimes written. While 69 per cent of the students identify their status with the middle social position 22 per cent do so with the lowest social position and 9 per cent with the highest social position. Of them 68 per cent find it hard to move up in society while 19 per cent do not know and 13 per cent feel it easy to move up. Only 31 per cent admire the person who is active in public and social life ; 21 per cent admire one who does not let anyone take advantage of him ; 18 per cent admire the generous ; 12 per cent admire one who works well; 11 per cent admire the respectful.
Ninety per cent feel that the changes that are taking place in society are for the better ; 58 per cent feel that they can have some influence on these changes ; 25 per cent do not know while 17 per cent do not think they can have any influence on these changes. It is seen that more number of scheduled caste students have never written to political leaders, identify their status with the middle social position, find it hard to move up in society, and feel that changes in society are for the better.
Section VI. A. — U rban Parents
1. THE DESCRIPTION OF THE PARENT GROUP IN TERMS OFTHEIR SOCIAL BACKGROUND
The following paragraphs contain the information regarding the age, caste, religion, mother tongue, education, occupational and rural-urban background of the parents.

Out of 579 parents residing in urban areas contacted, 27 per cent of the parents are in the age group of 46 and 50 years ; 11 per cent of them between 31 and 35 years ; 9 per cent of them between 51 and 55 years ; 8 per cent of them between 56 and 60 years ; 5 per cent of them between 25 and 30 years ; 4 per cent of them less than 25 years and3 per cent of them over 61 years of age. More number of parents are in the age group of 41 to 45 years.
Stating their caste, 3 per cent of the parents say that they belong to scheduled castes, 23 per cent of them to other backward classes ; 53 per cent of them to other castes 15 pei cent o! them do not belong to any of these castes. More number of parents belong to other castes.
Eighty-four per cent of the parents belong to Hindu religion ; 5 per cent of them are Muslims ; 6 per cent of them are Christians and 3 per cent of them are Jains. Most of the parents are Hindus.
The mother tongue of 1 per cent of the parents is English ; of 1 per cent is Gujarati; of less than 1 per cent is Hindi; of 52 per cent is Kannada ; of 10 per cent is Konkani; of 3 per cent is Marathi; of 2 per cent is Malayalam ; of 1 per cent is Sindhi; of 7 per cent is Tamil; of 11 per cent is Telugu ; and of 4 per cent is Urdu. More number of parents speak Kannada.
When asked about their education, 10 per cent of the parents are barely literates or illiterates ; 10 per cent of them are educated upto primary school; 49 per cent upto middle or high school; 19 per cent upto college level and 1 per cent of the parents are educated in the traditional system. More number of parents are educated upto middle or high school.
Mentioning their occupations, 5 per cent of the parents are owners of farm, fishery etc., 3 per cent of them are tenant cultivators etc. One per cent of them are manual labourers in agriculture ; 12 per cent of them are proprietors, commission agents, business man etc. ; 17 per cent of them are owners of small business etc. ; 18 per cent of them are executives, scientists, professors etc. ; 16 per cent of them are school teachers, clerks etc. ; 7 per cent of them are peons, coolies etc. Two per cent of them belong to the armed forces personnel, A slightly more number of parents are executives, scientists, doctors etc.
To the question on annual income, 66 per cent of the parents earn Rs. 3000 or less than Rs. 3000 per annum ; 20 per cent between Rs. 3000 and Rs. 6000 ; 6 per cent of them between Rs. 6001 and Rs. 9000 ; 4 per cent of them between Rs. 9001 and Rs. 12000 ; and 3 per cent of them over Rs. 12000. More number of parents earn annually less than Rs. 3000 ,
It is seen that majority of parents are aged between 41 to 45 years,
are Hindus, speak Kannada, belong to others states, are educated upto middle or high school and annually earn less than Rs. 3000/-
2. THEIR CONTACT WITH THEIR CHILDREN’S TEACHERS AND THE WAY IN WHICH THEY KEEP THEMSELVES INFORMED OF THEIR WARD’S PROGRESS
The parents are asked about their relation with teachers of their children and the interest evinced by them in the studies of their children.
Ten per cent of the parents keep regular contacts with the teachers of their children ; 62 per cent of them keep such contact as and when required ; 14 per cent of them seldom make such contacts and 17 per cent of the parents never meet. Most of the parents meet teachers as and when required.
Sixty-eight per cent of the parents are informed of their wards’ progress through periodic reports ; 23 per cent of them through discussions with teachers ; and 6 per cent of the parents are not informed at all. Most of the parents are informed of their children’s progress through progress reports.
Out of the 57 per cent of parents belonging to different age groups who keep contacts with teachers as and when required, more number of parents (70 per cent) are in the age group of 26 to 30 years. A small percentage (nearly 14 per cent) seldom make such contacts. Younger parents keep better contacts with teachers.
Out of 55 per cent of parents belonging to different income groups,71 per cent parents in the income group of Rs. 9001 to Rs. 12000 per annum are informed about their ward’s progress through progress reports. Nearly 8 per cent do not keep themselves informed. More number of parents with higher income meet teachers as and when required.
Out of 57 per cent of parents who are either illiterates or are educated upto different standards, 61 per cent of parents educated upto college level, meet parents as and when required and 63 per cent of parents educated in the traditional system of Sanskritic education, keep themselves informed of their wards’ progress through periodic reports. It is seen that more number of parents who are college educated keep themselves informed of their children’s progress through progress reports.
Sixty-seven per cent of parents belonging to armed forces personnel and 70 per cent who are proprietors, big businessmen etc., meet teachers as and when required and do not keep themselves informed of their ward’s progress, respectively. It is also true of more number of parents who are proprietors or are in the services of the army that they meet parents as and when required. This is similar in the case of parents irrespective of then: age or income.

3. THEIR PLANS FOR THE EDUCATION OF THEIR CHILDREN
When asked about the plans of the parents regarding their children’s education 2 per cent of the parents desire to educate their children upto middle school final ; 23 per cent of them upto matriculation ; 6 per cent of them desire to give technical training after matriculation ; 44 per cent of them upto college graduation and 23 per cent of them to professional courses. More number of parents desire their children to be graduates.
Out of 41 per cent of parents belonging to different age groups, who wish to educate their children upto college level, 52 per cent are in the age group of 31 and 35 years. A very small percentage of them want to educate them upto middle school final.
Sixty-five per cent of parents who are commission agents, businessmen, etc., 64 per cent who earn between Rs. 9001 and Rs. 12000 per annum, and 63 per cent who are educated in the traditional sanskritic system would like to educate their children upto college graduation and matriculation respectively. It is seen that parents who are commission agents, businessmen and with higher income would like their children to be graduates while parents with traditional education want their children to be matriculates.
4. OCCUPATIONAL ASPIRATIONS FOR THEIR WARDS
The parents have given their views regarding the occupation their children should take up after their education.
Fifteen per cent of the parents want their children to be en^neers ; 30 per cent to be teachers; 34 per cent of them say some other occupation other than these and nobody wants their children to be writers. Nearly 30 per cent of the parents desire their children to be teachers.
Out of 37 per cent of parents belonging to different income groups 50 per cent of parents who earn between Rs. 9001 and Rs. 12000 per annum, specify some other occupation other than engineer, teacher, administrator, scientists etc., their second preference is for teachers and next to engineers. It is seen that parents with higher income do not want their children to take up any of the occupations mentioned above.
To the question “What do you think your child should be ?”, 50 per cent of the parents educated in the traditional system of education desire their children to be teachers while 37 per cent of parents educated upto different levels desire their children to choose some occupation other than that mentioned like engineer, scientist, businessman, etc. More number of parents educated in the traditional system want their children to be teachers. It is seen that majority of the parents desire their children to be graduates.

5. VIEWS REGARDING THE DAUGHTER TAKING UP A JOB
To the question “Would you like your daughter to take up a job after completing her studies ?”, 43 per cent of the parents desire their daughters to take up jobs ; 22 per cent of the parents approve of her taking up a job only under certain conditions whereas 6 per cent of the parents do not approve of women working under any conditions. More number of parents have no objection to their daughters taking up jobs.
Out of 51 per cent of parents belonging to different age groups, 80 per c@nt in the age gmup of 61 and above have no objection to daughters taking up jobs whereas 44 per cent of parents aged less than 25 years do not approve of women working under any conditions. Younger parents do not like women taking to jobs, whereas older parents do not have any objection.
Thirty-three per cent of parents who earn less than Rs. 3000 per annum have no objection to daughters taking up jobs while 60 per cent of those who earn more than Rs. 12000 per annum do not approve of women taking up jobs. Again parents having higher income do not like daughters taking up jobs.
Among the literate and illiterate parents, 60 per cent of parents are barely literates or illiterates have no objection to daughter taking up jobs while 50 per cent of parents educated in the traditional sanskritic system do not approve of the idea. More number of parents educated in the traditional system do not like daughters taking up jobs.
Out of 51 per cent of parents belonging to different occupations, more (60 per cent) number of those who are skilled manual workers have no objection to daughters taking up jobs ; whereas 50 per cent of those who are manual labourers or tenant cultivators etc., do not approve of that idea. More number of parents who are skilled manual workers have no objection to their daughters taking up jobs. It is seen that younger parents and parents with high annual income do not like daughters to take up jobs.
6. VIEWS REGARDING EDUCATION
Giving their views on education, 43 per cent of the parents feel that the goal of education is to become a good citizen ; 23 per cent of them say that it is to provide economic security ; 19 per cent of them say that it is to achieve higher status. More number of parents feel that the goal of education is good citizenship.
Fifty-one per cent of the parents desire students to devote time to household work ; 32 per cent of them to studies only ; 17 per cent of them to welfare work and 1 per cent of the parents to politics also. While

56 per cent of the parents are satisfied with the education their children are getting at school, 33 per cent of them are partially satisfied whereas4 per cent of them are dissatisfied ; and 6 per cent of them cannot say anything. More number of parents desire students to devote time to household duties.
It is seen that 55 per cent of the parents who are aged over 61 years say that it is good citizenship ; 41 per cent of parents belonging to different age groups also favour the same opinion. Again 65 per cent in the age group of 61 years and above say that a student should devote time to household duties while more number of parents in the age group of 25 and below want students to study only (37 per cent). Parents irrespective of their age desire students to devote time to household duties with the exception of those under 25 years.
Hundred per cent of parents getting an annual income of Rs. 9001 and Rs. 12000 are satisfied with the education their children are getting at school ; whereas 50 per cent who earn more than Rs. 12000 are partially satisfied ; only a very small percentage of parents are dissatified. More number of parents are satisfied with the education, the children get at school. This is especially true of parents who have higher income of Rs. 9000 to Rs. 12000 per annum.
Fifty-one per cent of parents earning an annual income of Rs. 3001 to Rs. 6000 feel that the principal goal of education is to turn into a good citizen ; 63 per cent of the parents earning between Rs, 3001 and Rs. 6000 per annum desire students to devote time to household duties whereas 70 per cent who earn over Rs. 12000 per annum want students to be concerned only with studies. It is significant to note that parents with high income desire students to be concerned only with studies.
When the teachers were asked to give their view about the education their children get at school, out of 60 per cent of the parents who are either illiterates or educated upto different standards, 88 per cent of those who are educated in the traditional system are satisfied ; 30 per cent of them are partially satisfied ; 31 per cent of parents who are educated upto middle or high school are dissatisfied with the education their children are getting at school whereas, 41 per cent of those who are illiterates or educated upto different standards are not in a position to say anything. More number of parents who are educated in the traditional system are satisfied with the education their children get at school.
Further 82 per cent of parents who are tenant cultivators, 63 per cent who are peons, coolies, etc., and 83 per cent of parents who belong to the armed forces personnel are satisfied with the education their children are getting at school, feel that the goal of education is to provide economic security and want a student to devote time to household duties also, respectively. More number of parents who are tenant cultivators, peons, coolies,

armed forces personnel etc., are satisfied with the education imparted at school.
7. ATTITUDES AND VALUES
The parents were asked to give their impressions about the way of life, traits which determine respectability, etc. Giving their preference between the holy way of life and the materialistic life, 9 per cent of the parents prefer the holy path while 88 per cent of them prefer the materialistic way of life. More number of parents prefer the materialistic way of life.
When the parents were asked whether religious belief plays an important role in the improvement of one’s lot in life, 36 per cent of the parents say that it wholly depends on religious belief; 34 per cent of them say so partially ; 20 per cent of them say that religion has nothing to do with one’s lot in life and 9 per cent of the parents do not know. A slightly more number of parents feel that the improvement of one’s lot in life depends wholly on religious belief.
Stating their preference between one who accomplishes things and one who wishes to be left alone, 91 per cent of the parents prefer the former and 8 per cent the latter ; 90 per cent identify with the former and 9 per cent with the latter and again 79 per cent of them think that most other parents would also prefer the former while 30 per cent of them feel that most other parents would prefer the latter. Most of the parents prefer the person who accomplishes things and even identify themselves with such a person.
When they were asked whether any attention is paid by politicians to their wards, 42 per cent of the parents say that only a little attention is paid ; 28 per cent of them say that no attention is paid ; 7 per cent of them say that a great deal of attention is paid and 89 do not know. Large number of parents say that only a little attention is paid by politicians to their wards.
Asked whether the parents in the sample have ever talked or written to some government official or political leader in connection with some public issue, 70 per cent of the parents have never done so. While 26 per cent of them have sometimes written and only 1 per cent of the parents have written to them many a time. Most of the parents have never written to political leaders.
Giving the views on the qualities that determine respect for an individual, 55 per cent of the parents say that they respect the highly educated, 13 per cent of the pareilts say that they respect those who come

from a distinguished family. Wliile 9 per cent of the parents say that they respect those who have a large income, 3 per cent of the parents say that they respect the high caste.
To the question on the qualities they admire most in individuals 25 per cent of the parents admire one who works well, 7 per cent admire the ambitious, 15 per cent of the parents admire the generous, 14 per cent of them admire the active in public and social life but 2 per cent of them admire the thrifty, 1 per cent of them admire the person who keeps to himself and 17 per cent admire the respectful. A slightly more number of parents admire the person who works well.
When asked about the image of their own status, 57 per cent of them identify their status with the middle social position, 13 per cent of the parents with the lower social position and 5 per cent of them with the higher social position. Again 55 per cent of the parents find it hard to move up in society ; 11 per cent of them find it easy and 8 per cent of them do not know. It is seen that more number of parents identify their status with the middle social position and find it hard to move up in society.
wSECTION VI. B. — A COMPARISON OF SECONDARY SCHOOL TEACHERS WITH URBAN PARENTS
THE AGE GROUP, CASTE, RELIGION, MOTHER TONGUE, AND EDUCATION OF PARENTS AS COMPARED WITH THAT OF TEACHERS
While 22 per cent of the teachers in secondary schools are in the age group of 31 to 35 years, 27 per cent of the parents are in the age group of 41 to 45 years. Parents are older than teachers.
More number of teachers (39 per cent) and parents (53 per cent) belong to other castes ; only 3 teachers and 3 per cent of the parents belong to scheduled castes.
Seventy-six per cent of the teachers and 84 per cent of the parents are Hindus ; 6 per cent of the teachers and 5 per cent of the parents are Muslims ; 13 per cent of the teachers and 6 per cent of the parents are Christians whereas only 1 per cent of the teachers and 2 per cent of the parents are Jains. More parents and teachers are Hindus.
The mother tongue of 55 per cent of the teachers and 62 per cent of the parents is Kannada ; that of 1 per cent of the teachers and 1 per cent of the parents is English ; that of 1 per cent of the teachers and less than

1 per cent of the parents is Hindi; that of 9 per cent of the teachers and10 per cent of the parents is Konkani; of 1 per cent of the teachers and 3 per cent of the parents is Marathi; of 3 per cent of the teachers and two per cent of the parents is Malayalara ; of 10 per cent of the teachers and7 per cent of the parents is Tamil; of 9 per cent of the teachers and 11 per cent of the parents is Telugu ; of 5 per cent of the teachers and 7 per cent of the parents is Tulu ; and of 5 per cent of the teachers and 4 per cent of the parents is Urdu. Most of the parents and teachers speak Kannada.
When asked about the highest examination passed, 70 per cent of the teachers are graduates; 49 per cent of the parents ate educated upto middle or high school; 3 per cent of the teachers are non-matiics ; 10 per cent of the parents are illiterates ; 15 per cent of the teachers are matriculates ; 19 per cent of the parents are educated upto primary school;3 per cent of the teachers are non-graduates ; 19 per cent of the parents are college educated ; 8 per cent of the teachers are post-graduates ; and1 per cent of the parents are educated in the traditional system of education. While more number of parents are educated upto middle or high school, more number of teachers are graduates.
While 67 per cent of the teachers and 62 per cent of the parents meeteach other as and when required, 7 per cent of the teachers and 10 per cent of the parents meet regularly ; 17 per cent of the teachers and 14 per cent of the parents seldom meet; and 8 per cent of the teachers and17 per cent of the parents never meet. More number of parents and teachers meet each other as and when required.
About the principal goals of education, 40 per cent of the teachers and 43 per cent of the parents think that it is to be a good citizen ; 9 per cent of the teachers and 23 per cent of the parents say it is to provide economic security ; 11 per cent of the teachers and 11 per cent of the parents think it is to achieve higher status ; 31 per cent of the teachers and19 per cent of the parents feel that it is to be a cultured person. More number of parents and teachers think that the goal of education is good citizenship.
When asked to give their view on the role of a student, 20 per cent of the teachers and 32 per cent of the parents feel that a student should devote time to studies only ; 33 per cent of the teachers and 51 per cent of the parents v/ant students to devote time to household duties ; 53 per cent of the teachers and 15 per cent of the parents want students to devote time to welfare work whereas less than 1 per cent of the teachers and 1 per cent of the parents want them to devote time to politics also. While more number of parents desire students to devote time to studies only, more number of teachers desire students to do household duties also.
While 75 per cent of the teachers and 88 per cent of the parents

prefer the materialistic way of life, 14 per cent of the teachers and 9 per cent of the parents prefer the holy path. Both teachers and parents in greater number prefer the materialistic way of life.
Sixteen per cent of the teachers and 36 per cent of the patents feel that the improvement of one’s lot in life wholly depends on religious belief; 27 per cent of the teachers and 34 per cent of the parents partially think so while 48 per cent of the teachers and 20 per cent of the parents feel that religion has nothing to do with one’s improvement in life. More number of parents feel that the improvement of one’s lot in life depends wholly on religion while more number of teachers do not think so.
Three per cent of the teachers and 7 per cent of the parents feelthat a great deal of attention is paid by politicians to their wards ; 48per cent of the teachers and 42 per cent of the parents say only a little attention is paid ; 26 per cent of the teachers and 28 per cent of the parents say that no attention is paid ; and 15 per cent of the teachers and15 per cent of the parents do not know. More number of parents and teachers think that only a little attention is paid by politicians to their wards.
Most of the teachers and parents like one who accomplishes things (87 per cent of the teachers and 91 per cent of the parents), identify(88 per cent of the teachers and 90 per cent of the parents) and alsothink that most others (77 per cent of the teachers and 79 per cent of the parents) would like the person who accomplishes things ; whereas teachers and parents like (10 per cent of the teachers and 8 per cent of the parents), identify (9 per cent of the teachers and 9 per cent of the parents), and think that most others (16 per cent of the teachers and 30 per cent of the parents) would prefer the person who wishes to be left alone.
When asked to give their view about the trait which determines respect for a person, more number of teachers (55 per cent) and parents (55 per cent) respect the highly educated ; whereas teachers and parents admire least the person Who comes from high caste (3 per cent). More number of parents and teachers respect the highly educated.
Again more number of teachers (69 per cent) and parents (70 per cent) have never written to political leaders ; only a small number of teachers (1 per cent) and parents (1 per cent) have written many times to political leaders. More number of teachers (78 per cent) and parents (58 per cent) identify status with the middle social position while only 6 per cent of the teachers and 5 per cent of the parents identify with the upper social position. Further 76 per cent of the teachers and 55 per cent of the parents find it hard to move up in society ; only 11 per cent of the teachers and 12 per cent of the parents find it easy to move up in society. Most of the teachers (49 per cent)

and parents (26 per cent) admire one who works well; they prefer the respectful and one who is active in public and social life. It is seen that more number of teachers and parents have never written to political leaders have identified their status with the middle social position and admire one who works well.

THE COLLEGE—NON-PROFESSIONAL
Section I—Introduction
The non-professional colleges are intended to provide guidance in higher learning after secondary school stage to students in various disciplines. There are first grade colleges and University colleges. In the first grade colleges and UniMersity colleges students are admitted to Pre-University classes and after Pre-University classes they are admitted to degree classes. Several colleges are sponsored by the private organisations but are controlled by the University in academic matters. These institutions in turn are financially assisted by the University as well as by the government. There are also colleges started by the government. These institutions are controlled in academic matters by the University. The Director of Collegiate Education is the superior authority in the administration of these institutions next to the Education Minister. There are boards of management to administer the affairs of the colleges started by the private organisations. Various caste groups also have sponsored these non-professional colleges in which the boards of management have superior voice in matters of administration. The membership of the boards of management consist of professionally trained persons, economically sound persons, members of legislature and persons belonging to the castes that started the colleges, etc. For purposes of understanding the aspirations and attitudes of students, teachers and parents 275 girls, 30 teachers and 3 heads in 3 girls colleges, 378 boys, 64 teachers and 8 heads in 8 boys colleges were contacted and matter collected through schedules. These persons under investigation belong to different castes, religions and economic strata ; described in the preceding paragraphs. They receive instruction in different languages, the most important of which are English and Kannada. There is also a movement to introduce Kannada as the medium of instruction. The method of instruction is through lectures and occasionally through discussions and seminars. Tutorial system is introduced in some colleges but is not very popular.
Section II—The College Teachers (N on-Professional)
1. SOCIAL BACKGROUND :
The College teachers teaching in non-professional colleges are asked

to give information regarding their age, caste, religion, mother tongue, education, etc., to have a general view of their social background. About the age of the college teachers contacted, among the males and females respectively, 7 per cent and 30 per cent are in the age group of 20 to 25 years ; 26 per cent and 20 per cent are in the age group of 26 to 30years ; 19 per cent and 20 per cent are in the age group of 31 to 35years ; 27 per cent and 5 per cent in the age group of 36 to 40 years ;11 per cent and 10 per cent in the age group of 41 to 45 years ; 2 percent of the males in the age group of 46 to 50 j'ears ; 6 per cent and 15 per cent in the age group of 51 to 55 years ; and 2 per cent of the males in the age group of 56 years and above. More number of male and female teachers are in the age group of 26 to 40 years.
Among the males and females respectively, 24 per cent and 15 per cent belong to other backward classes ; 50 per cent and 45 per cent to other castes, while 10 per cent have answered “not applicable” and 15 per cent and 45 per cent have not responded. More number of teachers belong to other castes.
When asked about their religion, 92 per cent and 80 per cent have called themselves as Hindus ; 5 per cent and 5 per cent are Muslims ; 11 per cent and 15 per cent are Christians, among the male and female college teachers respectively, while 2 per cent of males are Jains. Most of the teachers are Hindus.
Among the males and females respectively Kannada is the mother tongue for 63 per cent and 45 per cent; Konkani for 3 per cent and 15 per cent; Marathi for 5 per cent and 10 per cent; Malayalam for 5 per cent of males ; Tamil for 5 per cent and 20 per cent; Telugu for 11 per cent of males ; Tulu for 3 per cent and 5 per cent; Urdu for 5 per cent and 5 per cent, while 5 per cent of the females claimed any other language other than those mentioned above as their mother tongue. More number of teachers have Kannada as their mother tongue. The circumstances in which they grew up for 23 per cent of males are stringent; for 55 per cent, 13 per cent and 10 per cent of males and 70 per cent,35 per cent and 10 per cent of females are average, well off and varied respectively. More number of teachers grew under average economic circumstances.
Among the male and female teachers respectively, the occupations of the grandfathers of 39 per cent and 30 per cent belong to group 1, viz., ownership of farm, fishery, dairy, land, etc. ; of 18 per cent and 20 per cent to group 2 viz., tenant cultivation, peasant proprietorship, independent fishery, etc., the same percentage of 5 and 5 belong to groups 3 and 4, viz., manual labour in agriculture, dairy, etc., and proprietorship, directorship, managing agency ; of 8 per cent and 10 per cent to group 5, viz., ownership of small business, independent business ; of

8 per cent and 5 per cent to group 6, viz., executive and scientific technical personnel, various types of officers, profession ; of 5 per cent and 20 per cent to group 7, viz., ordinary administrative staff. The same percentage of 2 of males have mentioned that their grandfathers’ main source of livelihood lies in group 8, viz., skilled manual work ; group O, viz., armed forces personnel and group X, viz., other occupations, while 10 per cent of the males and 5 per cent of the females have not responded. The occupations of the fathers of 27 per cent and 11 per cent of the males belong respectively to groups 1 and 2, viz., ownership of farm, fishery, dairy, land, etc., and tenant cultivation, peasant proprietorship, independent fishery, etc. ; of the same percentage of 3 to groups 3 and 4, viz., manual labour and proprietorship, directorship, managing agency, of 3 per cent,11 per cent, 26 per cent, 2 per cent, 3 per cent, 11 per cent, 26 per cent, 2 per cent, 3 per cent of the males and 15 per cent, 40 per cent, 25 per cent, 5 per cent and 10 per cent of the females belong respectively to groups 5, viz., ownership of business ; 6, viz., executive and scientific, technical personnel; 7, viz., ordinary administrative staff ; 8, viz., skilled manual labour ; and X, viz., other occupations. Eleven per cent of the males have not responded. It is seen that the occupation of the grandfathers of more number of teachers is the ownership of farm, dairy, etc., while the occupation of the fathers of more number of female teachers is group 6, namely executives, scientists, etc., and that of females is ownership of farm, land, etc.
The grandfathers of 18 per cent of the males and 15 per cent of the females are illiterates or barely Uterates ; of 32 per cent and 20 per cent are primary school educated ; 21 per cent and 35 per cent are middle or high school educated ; 8 p>er cent and 20 per cent are college educated ; 27 per cent and 20 per cent are educated in the traditional system. But2 per cent of the males have not responded. The fathers of 17 per cent of males are illiterates or barely literates, while among males and females respectively the lathers of 21 per cent and 15 per cent, 39 per cent and25 per cent, 24 per cent and 50 per cent, and 15 per cent and 10 per cent have had primary school education and traditional education respectively. It is that the education of the grandfathers of more number of male teachers is upto primary school while that of more number of female teachers is upto middle or high school standard. It is also seen that while more number of male teachers’ fathers are middle or high school educated, the fathers of more number of female teachers are college educated.
When asked “Have you been to school at a place smaller than a tehsil or taluka town ?” 48 per cent of the males and 15 per cent of the females have been to school at a place smaller than a tehsil or taluka town, 48 per cent of the males and 13 per cent of the females have not

attended such a school, while 3 per cent of the males and 5 per cent of the females have not responded. Twenty-four per cent of the males are village bred, 35 per cent of the males and 40 per cent of the females, 18 per cent of the males and 50 per cent of the females are respectively town-bred and city-bred while 23 per cent of the males and 5 per cent of the females are brought up in mixed environment. More number of male teachers have not attended a school situated in a smaller place than a tehsil or taluka town. While more number of males are town-bred, more number of females are city-bred.
To the question, “While teaching at a college do you give or have you ever given tuitions or coaching privately to students ?”, 21 per cent of the males and 15 per cent of the females have answered in the affirmative while 77 per cent of the males and 80 per cent of the females, in the negative. About the total salary of the male and female teachers per year, 5 per cent of the females earn upto Rs. 2,400 per annum;16 per cent of the males and 25 per cent of the females earn between Rs. 2,401 and Rs. 3,600 per year; 36 per cent of the males arid 25 per cent of the females earn Rs. 3,601 to Rs. 4,800 per annum; 27 per cent of the males and 20 per cent of the females earn Rs. 4,801 to Rs. 6,000 per year ; 18 per cent of the males and 15 per cent of the females earn Rs. 6,001 to Rs. 8,000 per annum ; 2 per cent of the males and 5 per cent of the females earn Rs. 8,001 to Rs. 10,000 per year ;5 per cent of the females have the total salary of Rs. 10,001 to Rs. 15,000 per annum, 2 per cent of the males have not responded. Most of the teachers do not give private tuitions. More number of teachers earn between Rs. 3,601 and Rs. 4,800 per annum.
When asked whether they have any other source of income besides their salary, 69 per cent of the males and 80 per cent of the females answered in the negative ; while 3 per cent of the males said that their income from other source besides their salary is approximately upto Rs. 500 per annum. Sixteen per cent of the males and 10 per cent of the females earn Rs. 501 to Rs. 1,000 per annum ; 6 per cent of the males earn Rs. 1,001 to Rs. 1,500 per annum and 5 per cent of the males and 10 per cent of the females earn Rs. 1,501 per annum and over. More number of teachers do not have extra income from sources other than their monthly salary.
Out of the 142 college teachers contacted 82 per cent are males and18 per cent are females. The notable points are that the number of males belonging to the age group of 31 to 35 years is greater than that of'the females of the same group, the percentage being 82 and 18 respectively and that the age groups of 46 to 50 years, and of 56 years and above have no female members.
Stating their educational background, the fathers of 7 per cent of

teachers are illiterates or barely literates. The fathers of 18, 33 and 37 per cent have had primary, middle or high school and college education respectively, while the fathers of 5 per cent are educated in the traditional system. The important point to be noted is that the variation in the fathers’ education of the teachers is not much pronounced. And the percentage of college educated fathers is higher, being 37 per cent and of fathers educated in the traditional system is lower being 5 per cent
To the question “Where did you mainly grow up?” 19 per cent of the teachers have grown up mainly in villages, 29 per cent in towns, 34 per cent in cities, and 19 per cent in mixed areas. The significant points are that the percentage of town-bred teachers belonging to the age group of 31 to 35 years is greater being 31 per cent, while none of the teachers belonging to the agp group of 46 to 50 years is village-bred and no one belonging to the age groups of 41 to 45 and 51 to 55 years has grown up in mixed areas. And the percentage of the teachers grown up in the village and in mixed areas in the same, being 19 per cent.
When asked about the economic circumstances, for 11 per cent of teachers the economic circumstances in which they have grown up were difficult or stringent, for 55 per cent average, for 15 per cent well-off, and for 9 per cent varied from time to time. The notable features are that the economic circumstances in which the teachers belonging to the age groups of 26 to 30 and 31 to 35 years have grown up are average, the percentage being 67 per cent and 53 per cent respectively. No one belonging to the age groups of 41 to 45 and 46 to 50 years have grown up in varied economic circumstances, and none belonging to the age groups of 46 to 50 and 56 years and above have grown up in stringent or difficult, and well of economic circumstances respectively. On the whole it is significant to note that among the teachers contacted, male teachers outnumber female teachers, that more number of teachers who are town-bred are in the age-group of 31 to 35 years and more number of teachers have grown up under average economic circumstances.
2. THE PROFESSIONAL EQUIPMENT OF THE COLLEGE TEACHERS
The following paragraphs give an account of the educational qualifications, their interest in research, and publications, etc. of the teachers employed in non-professional colleges. Among the male and female teachers respectively 19 per cent and 30 per cent hold bachelor’s degree, 76 per cent and 95 per cent master’s degree and 2 per cent and 15 per cent degree or diploma of a foreign university. Among the males and females, for 65 per cent of each the papers they teach are in the area in which they studied for the Master’s or Doctor’s degree, for 29 per cent

and 40 per cent some of the papers, and for 3 per cent of males none of the papers belong to the area in which they studied, while 3 per cent of the males and 5 per cent of the females have not responded. Most of the teachers are Master’s degree holders and teach the papers they studied during their career as students.
In actual practice, 4 per cent of the males and 60 per cent of thefemales spend time mostly in teaching, 8 per cent of the males and 5per cent of the females mostly in advancement of knowledge (writing, research etc.), 47 per cent of the males and 20 per cent of the females equally in both, while 5 per cent of the males and 10 per cent of thefemales have not responded. While more number of female teachersspend their time mostly in teaching, more number of male teachers spend their time both in teaching and research.
Among the males and females who have contributed or published books in their subjects, respectively 34 per cent and 35 per cent have only contributed articles ; the same percentage of the males (11 per cent) have published books and also have both contributed articles and published books. But 4 per cent of the males and 60 per cent of the females have not responded. More number of females have not responded to the questions.
The published books of 11 per cent of the male teachers, belong to the category of text-books, of 11 per cent of the males and 15 per cent of the females, to that of treatises and research reports, of 3 per cent of the males, belong to both the categories, while 74 per cent of the males and 85 per cent of the females have not responded. More number of teachers have not responded when asked if they have any publications to their credit.
To the question “Have you delivered any papers at the meetings of any professional or academic societies ?” 11 per cent of the males and17 per cent of the females have delivered papers at the meetings of professional or academic societies, while 87 per cent of males and 85 per cent of the females have not. More number of teachers have not delivered papers at meetings of professional or academic societies.
When the teachers were asked whether they have served as professional consultants to industry to any organisation, or to the State or Central Government, among the males and females respectively 5 per cent and 9 per cent have answered in the affirmative, 92 per cent and 60 per cent in the negative while 3 per cent and 5 per cent have not replied. More number of teachers have not served as professional consultants to any industry. State or Central Government.
To the question “What is your total experience as a College Teacher ?” among the males and females, 40 per cent and 40 per cent respectively have put in 5 and less than 5 years of service, 23 per cent and 25 per cent

6 to 10 years, 8 per cent and 10 per cent 11 to 15 years, 23 and 10 per cent 16 to 20 years and 8 per cent and 15 per cent 21 years and above. In the Institution visited, the total experience, as a college teacher, of 60 per cent of males and 2 per cent and 10 per cent 21 years and above. More number of teachers have 5 or less than 5 years of teaching experience and also have been working as teacher in the institution where they are presently employed for 5 or less than 5 years.
Of the 132 teachers, 44 per cent spend their time mostly in teaching7 per cent mostly in advancement of knowledge (writing, research etc.) and 49 per cent equally in both. The points to be noted are that 71 per cent of the teachers belonging to the age group of 31 to 35 years spend their time equally in teaching and in advancement of knowledge, while none belonging to the age groups of 31 and 35, 51 to 55 and 56 years and above, devotes time only for the advancement of knowledge. Only a very low percentage of teachers viz. 7 per cent spend their time in advancement of knowledge.
When asked about their publications, 83 per cent of the teachers have only contributed articles, 72 per cent have only published books and 10 per cent have both contributed articles and published books. The significant point is that 91 per cent of the teachers belonging to the ? ge group of 31 to 35 years have contributed articles in their subject. No bne belonging to the age-groups of 20 to 25, 31 to 35, 46 to 50 and 56 years and above has published books, and not a single teacher in the age groups of 20 to 25, 36 to 40 and 56 years and above has contributed articles or published books in his or her subjects. The teachers have contributed more articles than published books, the percentage being 83.
To the question “If you have published books, please state which of the following categories they belong to ?, textbooks, treatises and research reports, both”, 27 per cent of the books published by the teachers are textbooks, 65 per cent are treatises and research reports, and 8 per cent belong to both the categories. The number of treatises and research reports is greater, the percentage being 65. But the variation is not pronounced. It is seen that teachers have published more number of treatises or research reports than textbooks.
When asked about the teachers’ active participation in the meetings of academic societies, 27 per cent of the teachers have read papers at meetings while 73 per cent of the teachers have not delivered any papers at the meetings of any professional or academic societies. The percentage of teachers belonging to the age groups of 26 to 30 and 31 to 35 years who have not delivered any papers at the meetings of any professional or academic societies, is greater than that of teachers of the same groups who have delivered papers ; the percentage is 92 and 73 respectively.

The percentage of teachers belonging to the age group of 26 to 30 years who have delivered papers is very low, being 15 per cent.
Further, 16 per cent of the teachers have served as professional consultants to industry etc., and 84 per cent have not served as professional consultants to industry, to any organisation or to the State or Central Governments. The important points are that no one belonging to the age groups of 20 to 25 and 26 to 30 years has served as professional consultant and that in other age groups also the number of teachers who acted as professional consultants is surprisingly lower than that of the teachers who have not served as consultants.
When the teachers with different educational achievements were asked to inform about the way the time is spent, of the 97 teachers who hold Bachelor’s, Master’s, Doctorate Degrees and also a degree or diploma of a foreign university, 43 per cent in actual practice, devote their time mostly to teaching, 7 per cent to the advancement of knowledge and 49 per cent equally to both. Out of the 33 Bachelor degree holders only 39 per cent spend their time equally in teaching and in improving their knowledge. Out of the 62 master degree holders 48 per cent devote their time mostly to teaching, and 7 out of the 9 foreign degree holders, devote their time equally to both. The striking point is that none of the Doctorate degree holders spends time mostly for the advancement of knowledge. Among other degree holders too, the number of persons spending their time mostly in advancement of knowledge is astonishingly small.
When asked about their publications, out of the 55 teachers 78 per cent of the teachers have contributed articles in their subjects, 9 per cent of the teachers have published books and 6 per cent of the teachers have both contributed articles and published books. The strange feature is that none of the Bachelor, Master and Foreign degree holders has published books or has both contributed articles and published books. Among the Master degree holders, the number of teachers who have contributed articles in satisfactory, the percentage being 68. Of the published books40 per cent belong to the category of textbooks, 53 per cent to that of treatises and research reports and 7 per cent to both the categories. Among the books published by the Master degree and foreign degree holders, 50 per cent and 100 per cent respectively are treatises and research reports.
It is seen that 16 per cent of the teachers have delivered papers at the meetings of the professional or academic societies and 84 per cent of the teachers have not. Among the Bachelor degree holders none has delivered papers and 88 per cent of the Master degree holders have not delivered papers. Among the Doctorate degree and foreign degree holders the same percentage of 67 per cent have delivered papers. The points to be noted are that only very few Master degree holders

have taken part in such meetings and the participation of the Doctorate degree and Master degree holders in delivering papers, at the meetings of professional or academic societies is really considerable.
When the teachers were asked whether they have served as professional consultants, 10 per cent of the teachers have served as professional consultants to any industry, organisation, or to the State or Central Governments and 90 per cent of the teachers have not. The points to be noted are that none of the Bachelor degree holders has served as professional consultant; and among the Master degree holders 97 per cent have not served as professional consultants; of the I>octorate degfte and foreign degree holders only respective percentages of 33 per cent and 56 per cent have served as professional consultants. The number of Master degree holders who have served as professional consultants is very low, the percentage being 61 per cent; even the participation of Doctorate degree and foreign degree holders is not satisfactory as the percentage of those who have not served as professional consultants is 67 per cent and 44 per cent respectively.
Out of the teachers grown up in village, town, city and mixed areas,24 per cent have Bachelor’s degree, 65 per cent Master’s degree, 3 per cent Doctorate and 9 per cent foreign degrees. Among the teachers grown up in village, town, city and mixed areas. Master degree holders are greater in number, the percentage being 71, 74, 50 and 68 respectively among the village-bred and the town-bred teachers, than among others. Among the teachers grown up in village, town, city and mixed areas, 24 per cent have Bachelor’s degree, 65 per cent Master’s degree, 3 per cent Doctorate and 9 per cent foreign degrees. Among the teachers grown up In village, town, city and mixed areas, Master degree holders are greater in number, the percentage being 71, 74, 50 and 68 respectively. Among the village-bred and the town-bred teachers none has a foreign degree and a Doctorate degree respectively. The number of Master degree holders is greater among the town-bred teachers than among others. Among the teachers grown up in village, town, city and mixed areas, 83 per cent of the teachers have contributed articles in their subjects ; 7 per cent of the teachers have published books and10 per cent of the teachers have done both. Out of the teachers grown lip mainly in village, town, city and mixed areas, respectively 85, 43, 71 and 87 per cent have only contributed articles. None of the Bachelor degree holders has published books. Among these teachers brou^t up mainly in village, town, city and mixed areas, only 27 per cent of the teachers have read papers at the meetings of any professional or academic societies and 73 per cent of the teachers have not and only 8 per cent of the teachers have served as professional consultants and 84 per cent

of the teachers have not. Of these teachers grown up in village, town, city and mixed areas respectively, 81 per cent, 75 per cent, 60 per cent and 84 per cent have not delivered any papers, and 79 per cent, 92 per cent, 80 per cent and 76 per cent have not served as professional consultants. The significant point is that the majority of the teachers grown lip in village, town, city and mixed areas do not participate in the meetings Or as professional consultants.
While 44 per cent teachers spend their time mostly in teaching, 7 per cent mostly in advancement of knowledge, and 49 per cent equally in both. Of these teachers who have put in 5 and less than 5 years of service, and 6 to 10 years of service, 49 per cent and 60 per cent of the teachers spend their time equally in both; of those teachers whose total experience is 11 to 15 and 16 to 20 years, 61 per cent and 60 per cent spend their time mostly in teaching; out of the teachers who h&ve served for 21 years and above, 60 per cent and 43 per cent spend their time mostly in teaching, and also equally in both. The significant point is that none among the teachers who have ptit in 11 to 15 and 16 to . 20 years of service devotes much time for the advancement of knowledge. Of these teachers 83 per cent have contributed articles ; 72 per cent of the teachers have published books of which 27 per cent and 65 per cent belong to the categories of textbooks, and treatises and research reports ; and 8 per cent to both the categories, and 10 per cent of the teachers have both contributed articles and published the books. Of the teachers who have put in 5 and less than 5 years, 6 to 10, 11 to 15,16 to 20 and more than 21 years of service, 83 per cent, 88 per cent, 100 per cent, 63 per cent and 80 per cent of the teachers respectively have contributed articles. No one among those who have gained 11 to 15 years of experience has published books or done both. Among the small number of books published by the teachers who have put in 5 and less than 5 years, 6 to 10, 11 to 15, 16 to 20 and more than 21 years of service, 80 per cent, 38 per cent, 100 per cent, 67 per cent and 50 per cent respectively have written treatises and research reports. The important point is that none of the books published by teachers whose total experience is 5 and less than 5 years, 11 to 15 aijd 16 to 20 years belongs to both the categories of textbooks and treatises and research reports. Not one of the published books of the teachers who have put in, 11 to 15 and more than 21 years of service is a textbook, and treatise and research report respectively.
It is significant to note that most of the teachers are Master’s degree holders who aiie teaching the papers they had studied during thek student days, have 5 or less than 5 years of teaching experience, do not spend their time in the advancement of knowledge, have published treatises

or research reports, do not participate in meetings of professional bodies or acted as consultants to industry, State or Central Government.
3. HOW TEACHERS COME TO THE PROFESSION AND HOW THEY VIEW THEIR PRESENT STATUS
The following paragraphs contain the information about the teachers’ desire to continue or to discontinue in the profession, and compare their occupational status with that of their fathers.
To the question “At any stage of your career have you pursued an occupation other than teaching ?”, 66 per cent of the mdes and 85 per cent of the females have never pursued an occupation other than teaching at any stage in their career; 23 per cent of the males have pursued one before for a period between two teaching jobs, while 6 per cent of the males and 15 per cent of the females have taken to an occupation along with teaching. More number of teachers have not pursued an occupation other than teaching before they took to the profession.
When asked whether they wished to choose any other occupation before they took to teaching, 29 per cent of the males and 10 per cent of the females have given an aflSrmative answer, 56 per cent of the males and 65 per cent of the females have given a negative answer while 19 per cent of the males and 20 per cent of the females have no specific choice. More number of teachers say that they never wished to choose another occupation before they took to teaching.
To the question “How does your occupation compare with that of your father ?”, 68 per cent of the males and 55 per cent of the females, say that their occupational status is higher than that of their fathers, 6 per cent of the males and 15 per cent of the females say that it is lower than their fathers, while the occupation of 26 per cent of the males and 30 per cent of the females say that it is about the same in status as the occupations of their fathers. More number of teachers rate their present occupational status higher than that of their fathers.
Further 51 per cent of the teachers have never pursued an occupation other than teaching at any stage in their career ; 27 per cent of the teachers have pursued one before they took to teaching, 4 per cent of the teachers have taken an cccupation for a period between two teaching jobs and 18 per cent of the teachers have done it or have been doing it along with teaching. Of them, 26 per cent of the teachers wished to choose any other occupation before they took to teaching; 57 per cent of the teachers did not wish to choose any other occupation before taking to teaching as a career and 18 per cent of the teachers either were uncertain about their choice or had no specific choice. The point to be noted is that no one belonging to the age groups of 31 to 35, 41 to 45

and 56 years and above, pursued any occupation for a period between two teaching jobs, has done it or is doing it along with teaching, took any occupation for a period between two teaching jobs respectively. No one in the age group of 20 to 25 years has taken to any occupation, between two teaching jobs and has pursued one, or pursuing one along with teaching. Hardly a teacher belonging to the age group of 46 to 50 years has pursued any occupation other than teaching and has taken one between two teaching jobs. And among the teachers belonging to the age group of 26 to 30 years, 74 per cent of teachers have never pursued any occupation other than teaching at any stage in their career. Of teachers belonging to the age group of 31 to 35 yeara, the percentage who did not wish to choose any other occupation before taking to teaching is greater than in other groups, it being 62 per cent. Only 7 per cent of the teachers of the age group of 20 to 25 years, 8 per cent of that of 41 to45 and 11 per cent of that of 56 years and above, were not specific about their choice or expressive about tiieir wish to choose any other occupation before taking to teaching. Only 11 per cent and 9 per cent of the age groups of 46 to 50 and 51 to 55 years respectively, did wish to choose any occupation before they took to teaching as a career. The significant point is that the majority of the teachers did not wish to choose any other occupation before taking to teaching.
Out of 132 teachers consulted, 52 per cent have never pursued an occupation other than teaching at any stage in their career ; 27 per cent of the teachers have pursued one before they took to teaching ; 30 per cent of the teachers have pursued one for a period between two teaching jobs and 19 per cent of the teachers have done it or have been doing it along with teaching. No one among the teachers whose fathers are illiterates or barely literates and are educated in the traditional system, has pursued an occupation other than teaching at any stage in their career, and has done it or has been doing it along with teaching. Among the teachers whose fathers have had primary school, middle or high school, college and traditional education, 68 per cent, 52 per cent, 44 per cent and 57 per cent respectively have never pursued an occupation other than teaching at any stage in their career. The important point is that the greater number of teachers whose fathers are educated upto middle or high school, college level prefer teaching jobs—the percentage being 60 and 51 respectively.
Among the 131 teachers, 27 per cent of the teachers have wished to choose another occupation before they took to teaching as a career, whereas 55 per cent of the teachers have not wished so ; and 18 per cent could not say or had no specific choice. Among the teachers whose father are illiterates or barely literates, have had primary school, middle/high school, college and traditional education, 78 per cent, 44 per

cent, 56 per cent, 58 per cent and 33 per cent respectively, have not wished to choose any occupation before taking to teaching as a career. The significant point is that none of the teachers whose fathers are illiterates or barely literates has given a negative answer or a doubtful reply. The greater percentage of teachers whose fathers are college educated had no liking to choose any occupation before taking to teaching as a career, the percentage being 58, which is decidedly greater than the percentages of teachers whose fathers are not college educated.
Among the teachers who have grown up in village, town, city and mixed areas, 51 per cent of the teachers have never pursued an occupation other than teaching at any stage in their career, 27 per cent of the teachers have pursued one before taking to teaching; 37 per cent of the teachers have taken to one for a period between two teaching jobs and19 per cent of the teachers have done it or have been doing it along with teaching. Among the teachers who have grown up mainly in village, town, city and mixed areas, 54 per cent, 58 per cent, 46 per cent and 85 per cent respectively, have never pursued an occupation other than teaching at any stage in their career. No one among the teachers who have grown up mainly in the village and mixed areas, has taken to an occupation for a period between two teaching jobs. The significant point is that the number of teachers grown up mainly in village, town, city and mixed areas who pursued an occupation for a period of two teaching jobs, is surprisingly very low ; and the teachers who have never pursued an occupation other than teaching at any stage in their career, is astonishingly great, despite the fact that they have been grown up in different places, like the village, town, city and mixed areas.
Out of the 135 teachers who have grown up mainly in village, town, city and mixed areas, 27 per cent of the teachers have wished to choose any other occupation before taking to teaching as a career while 55 per cent of the teachers have not wished so ; and 15 per cent could not say anything or had no specific choice. Of the teachers who have grown up mainly in village, town, city and mixed areas, respectively 50 per cent, 65 per cent, 59 per cent and 38 per cent did not wish to choose any other occupation before they took to teaching as a career.
The significant point is that the majority of the teachers had no wish to take to any other occupation before choosing teaching as a career, and that the number of teachers who wished to choose an occupation before taking to teaching as a career and also who neither had a definite choice nor could give an exact reply is astonishingly smaller than that of teachers who had no wish to choose any occupation before accepting teaching as a career, the percentage being 27, 15 and 55 respectively.
When the teachers who have grown up under difficult economic

circumstances were asked about their pursuing another career before taking to teaching, 52 per cent of the teachers have never pursued any occupation other than teaching at any stage in their career; 27 per cent of the teachers took up one before they accepted the teaching jo b ;4 per cent of the teachers have embraced one for a period between two teaching jobs; while 18 per cent of the teachers have pursued one, or have been doing it along with teaching. Of these teachers who have grown up under stringent, average, weU-off and varied economic circumstances, respectively 48 per cent, 61 per cent, 35 per cent and 38 per cent have never taken an occupation other than teaching at any stage in their career. The imiK>rtant point to note is that no one who had grown up in mixed areas had taken up an occupation other than teaching for a period between two teaching jobs. A negll^ble number of teachers who had grown up in village, town and city had pursued a different occupation in between two teaching jobs, the percentage being 4, 1 and 13 respectively.
Further among these teachers grown up in different environment 56 per cent of the teachers were for and 12 per cent of the teachers were against choosing any other occupation before taking to teaching as a career, while 18 per cent of the teachers could not say anything or had no specific choice. Of these teachers who were brought up in village, town and city, the number of teachers who were against choosing any occupation is greater than that of the teachers who were for choosing other occupations and who were not definite about their choice or expression, the percentage being 60, 57, 69, 63, 63 respectively. But among the tcachers grown up in mixed areas the number of them who wished to take up an occupation before accepting teaching as a career, is considerably greater — the percentage being 46. With regard to the percentage of teachers who were for choosing any occupation and who had no definite view or choice, the variation is not much pronounced. The remarkable point is that the teachers who are not in favour of choosing any occupation before taking to teaching as a career are in the majority, the percentage being 56. On the whole, it is seen that majority of teachers do not wish to change from the present profession irrespective of their educational or urban-rural background.
(Hi) Would the Teachers Like to Remain in the Profession or Change it ?
In order to understand the extent to which these teachers are committed to the profession, they are asked about their desire to change from the profession if an opportunity arise with the same emoluments. Of the college teachers 14 per cent of the males and 25 per cent of the females like to change their teaching profession, if there is an opportunity

for some other kind of work (with the same emoluments), 14 per cent of the males consider it too late to change now, while 71 per cent of the males do not like to change, while 75 per cent of the females do not like to change it. It is seen that most of the male and female teachers are not desirous of changing from their present profession.
Among the teachers holding bachelor’s, master’s, doctor’s and foreign university degrees, 14 per cent of the teachers would like to change and 75 per cent of the teachers would not like to change their teaching profession for some kind of work with the same emoluments. Eleven per cent of the teachers think it too late to change at present; among the teachers possessing Bachelor’s, Master’s and foreign University degrees, the majority would not like to change their teaching profession, the percentages being 68, 75, and 89 respectively. All the Doctorate degree holders say that they do not like to change. The important point to note is that none among the doctorate and foreign degree holders would like to change their teaching profession. Among these teachers, holding the above mentioned degrees, the percentage of teachers who would like to change and who consider it too late to change at present is surprisingly low, respectively being 27, and 4 among the bachelor degree holders, 12 and 13 among masters degree holders, 10 and 11 among foreign university degree holders. Among these teachers whose fathers’ education ranges from bare literacy to college education and traditional education, 14 per cent Vr'ould like to change and 77 would not like to change their teaching profession for some other kind of work and 8 per cent consider it too late to change now. Out of these teachers whose fathers are illiterates or barely literates, primary school educated, middle or high school educated, college educated and educated in the traditional system the majority would not like to change, the respective percentages being 66, 80, 76, 84 and 18. The significant point to note is that none of the teachers whose fathers are college educated and educated in the traditional system would consider it too late to change at present the teaching profession. But among the teachers whose fathers are educated in the traditional system the number of teachers who would like to change their teaching profession is greater than those who would not like to change, the percentages being 57 and18 respectively.
(ii) Economic Circumstances and the Change of Profession
Among the teachers grown up in difficult or stringent, average, well- off and varied economic circumstances, 13 per cent of the teachers would and 78 per cent of the teachers would not like to change their teaching profession for some other kind of work with the same emoluments ; while 9 per cent of the teachers think it too late to change at present.

Among these teachers who had difficult or stringent, average, well-oflE and varied economic circumstances, the greater number would not like to change their teaching profession, the respective percentages being 72, 76, 92, 84 and 85. The important points to be noted are that none of the teachers grown up in economic circumstances which varied from time to time, thinks it too late to change it at present, and that of the teachers ^own up in diflferent economic circumsances, the greater number of teachers who would like to change their teaching profession, had grown up in average economic circumstances, the percentage being 17. But the variations with regard to the teachers who have grown up in different economic circumstances and who would like to change their teaching profession and consider it too late to change, are inconspicuous.
Out of these teachers whose total salary per year ranges from Rs. 2,400/- and over, 14 per cent of the teachers would and 78 per cent of the teachers would not like to change their teaching profession for some other kind of work with the same emoluments, while 9 per cent of the teachers consider it too late to change at present. The points to be noted are that none among the teachers whose total salary per year is Rs. 8,001/- to Rs. 10,000/- per annum and Rs. 15,001/- per annum and over, would like to change, and think it too late to change respectively, and that no one among the teachers whose total salary per year is upto Rs. 2,400/- considers it too late to change now. The number of teachers whose total salary per year is between Rs. 3,601/- and Rs. 4,800/- and who would not like to dhange their teaching profession is greater than those who have varying total salary per year, the percentage being 76. And the variation with regard to the teachers having varying total salary per year, who would like to change their teaching profession and who consider it too late to change at present, is not at all pronounced.
(iii) Pursuit of Other Occupation and the Change of Occupation
Of these teachers who have never pursued an occupation other than teaching at any stage in their career, who have pursued one before they took to teaching and for a period between two teaching jobs, and who have done it or have been doing it along with teaching, 14 per cent of the teachers would and 78 per cent of the teachers would not like to change their teaching profession for some other kind of work with the same emoluments if there is an opportunity ; 9 per cent of the teachers think it too late to change at present. Among these teachers who never pursued an occupation other than teaching, who followed one before they took to teaching, who embraced one for a period between two teaching jobs, and who have done or have been doing it along with teaching, the

majority would not like to change their teaching profession, the respective percentages being 75, 76, 80 and 88.
The notable points are that, no one among the teachers who have pursued an occupation other than teaching for a period between two teaching jobs would like to change their teaching profession and that the percentage of teachers who would not like to change their teaching profession is greater among those who have followed an occupation or are pursuing one along with teaching, than among others who have never embraced one or followed one for a temporary period, the higher percentage being 88 and that the variation among the teachers who have never pursued an occupation other than teaching or pursued one temporarily is not prominent.
Among the teachers who wished or did not wish to choose any other occupation before they took to teaching and who could not say or had no specific choice, 13 per cent of the teachers would and 78 per cent wouW not like to change their teaching profession for some other kind of work with the same emoluments ; 9 per cent of the teachers consider it too late to change at present. Among these teachers who wished, dl^ not wish to choose any other occupation, and who could not say or hi^ no specific choice, the majority would not like to change their teaching profession, the respective percentages being 61, 85 and 80.
The significant points to be noted are that among the teachers who were not desirous of choosing any other occupation before they took to teaching, and who could not say or had no specific choice, the variations with regard to those who consider it too late to change at present are not much pronounced, but that among these teachers, those who would like to change their teaching profession are in greater number among them who wished to choose any other occupation before they took to teaching than among those who did not wish and who could not say or had no specific choice, the respective percentages being 28, 8 and 8.
4. THEIR INVOLVEMENT IN THE PROFESSION ANDPROFESSIONAL ACHIEVEMENTS
In the following paragraphs the teachers give an account of the classes they teach and their membership of any national or international academic bodies. To the question “what classes do you teach at present?”, 94 per cent of the male and 100 per cent of the female teachers teach the under-graduate classes ; and 6 per cent of the male and 5 per cent of the female teachers handle both under-graduate and post-graduate classes. While 8 per cent of the males and 10 per cent of the females have 5 to 8 hours of teaching per week ; 26 per cent of

the male and 10 per cent of the female teachers have 9 to 12 hours ; 45 per cent of the male and 40 per cent of the female have 13 to 16 hours ;11 per cent of the male and 35 per cent of the female teachers work for17 to 20 hours, and 10 per cent of the male and 5 per cent of the female work for more than 20 hours per week. Most of the teachers teach the undergraduate classes and work for 13 to 16 hours per week.
To the question, whether they are the members of any of the academic organisations in their subjects, such as the Indian Science Congress, Indian Economic Conference, etc., 90 per cent of the male teachers and 90 per qent of the female teachers give a negative reply. Only 5 per cent of the males are members of the organisations at State level and 6 per cent of the males and 10 per cent of the females of the organisations at international level. Most of the teachers are not members of academic organisations like the Indian Science Congress or Indian Economic Conference,
Only 1 per cent, 18 per cent and 3 per cent of the teachers are members of the organisations at State, national and international levels respectively. The significant points to be recorded are that of the teachers who are not paying members of any organisations, the number of teachers belbnging toUhe age group of 26 to 30 years is greater than that of teachers of other age groups—the percentage being 96 ; and that none belonging to the different age groups is a member of the local organisations ; that only 14 per cent of the teachers belonging to the age group of46 to 50 years are members of the organisations at the State level; and that the greater number of teachers are paying members to the organisations at the national level and belong to the age group of 31 to 35 years. Local organisations have no paying members from among the teachers. No one belonging to the age groups of 26 to 30, 36 to 40, 41 to 45, 46 to 50 years is on the membership of organisations at the international level.
The followmg is an account of teachers with different educational achievements, about their membership of academic societies. Of the 98 teachers who hold Bachelor’s, Master’s, Doctorate and foreign degrees 82 per cent of the teachers are not paying members of any of the academic organisations in their subject such as the Indian Science Congress, Indian Economic Conference, etc ; and only 1 per cent, 14 per cent and 3 per cent of teachers are members of the organisations at the State, national and international levels respectively. 21 per cent of the Bachelor’s degree holders and 9 per cent of the Master degree holders are members of the organisations at the national level. Among the doctorate degree and foreign degree holders 50 per cent and 38 per cent respectively are members of the organisations at the national and international levels. None of these degree holders is on the membership of local organisations. The peculiar point is that, among the Bachelor, Master and Doctorate

degree holders no one is a member of the international organisations ; among the Master degree holders, only the negligible percentage of 2, are members of the State organisation ; and that among Doctorate degree holders 50 per cent are not paying members of any organisations and 50 per cent are members of only national organisations. Among the teachers who are not paying members of any organisations, the percentage is surprisingly greater among the Master degree holders than among others, it being 89.
Eighty-three per cent of the teachers have only contributed articles ;7 per cent of the teachers have only published books. Of the published work 27 per cent and 65 per cent belong respectively to the categories of textbooks, and treatises and research reports and 8 per cent to both the categories; 10 per cent of the teachers have both contributed articles and published books. Among the teachers only 27 per cent have delivered papers at the meetings of professional or academic societies, while 73 per cent of the teachers have not. The significant points to be noted are that the teachers who have 9 to 12 hours of teaching per week have contributed articles more th?in others who have varied hours of teaching work per week, the percentage being 88 ; and that the published books of teachers who have 13 to 16 hours per week belonging to the category of treatises and research reports are greater than those of other teachers who have varying hours of teaching per week, the percentage being 58. Of these teachers who have different teaching hours per week, the greater number of teachers having 13 to 16 hours of teaching per week have not delivered papers at any meetings of the professional or academic societies, the percentage being 77.
Among the books published by the teachers with the total salary per year ranging from Rs. 2,400/- to Rs. 15,001/- and over, 27 per cent of the publications belong to the category of textbooks, 65 per cent to that of treatises and research reports and 8 to both the categories. Of these teachers whose total salary per year ranges from Rs. 2,400/- to Rs. 15,001/- and over, 27 per cent of them have delivered papers at the meetings of any professional or academic societies while 73 per cent of the teachers have n o t; and 16 per cent of the teachers have served as professional consultants to industry, to any organisation, or to the State or Central Government. The points to be noted are that none of the teachers whose total salary per year is upto Rs. 2,400/- has published books and delivered papers at the meetings ; no one among the teachers drawing the total salary of Rs. 15,001/- and over per atinum, has ptib- lished any books, but all of them have delivered papers and also acted as professional consultants. Among the teachers whose total salary per year is upto Rs. 2,400, Rs, 2,401/- to Rs. 3,600/~, Rs. 3,601/- to Rs. 4,800/-, Rs. 4,801 to Rs. 6,000/- artd Rs. ’6000/- to Rs. 8000 the numbet

of teachers who have not participated in delivering papers and as professional consultants is greater than that of those who have, the percentages being 100, 92, 94, 88 and S3 and also 83, 96, 100, 96 and 94 respectively. But more teachers having the total salary per year, from Rs. 10,001 to Rs. 15,000 and Rs. 15,001 and over, have delivered papers and served as professional consultants, the percentages being 89 and 100, 56 and 100 respectively. But among the teachers drawing Rs. 8001 to Rs. 10,000 the number of teachers who have delivered papers is greater than that of those who have not, the percentage being 63 ; the number of teachers who have served as professional consultants is lesser than that of those who have served so, the percentage being 75.
When the teachers were asked about the way they spend their time,43 per cent of the teachers spend their time, in actual practice, mostly in teaching; 6 per cent of the teachers mostly in advancement of knowledge ; and 50 per cent equally in both. Of the teachers who would and would not like to change their teaching profession for some other kind of work, the majority devote their time equally to teaching and advancement of knowledge, the percentages being 50 and 50 respectively. But among the teachers who consider it too late to change now, 55 per cent spend their time mostly in teaching and no one devotes his or her time in the advancement of knowledge. The significant point to note is that among the teachers who would or would not like to change, only a minority spend their time mostiy in advancement of knowledge, the percentages being 6 and 8 respectively.
i. The Objectives of Classroom Teaching
Hereunder, the teachers have given their opinion regarding the purposes of undergraduate teaching, either to simplify the ideas in the subject, to introduce the students to methods of analysing, understanding or to give the student the maximum information in the subject possible ; further they are also asked to give information regarding the medium of instruction. When asked about purposes of undergraduate teaching, 42 per cent, 44 per cent and 13 per cent of the teachers have given I priority,45 per cent, 32 per cent and 23 per cent of the teachers II priority and12 per cent, 24 per cent and 64 per cent of the teachers III priority respectively to the three purposes, viz. to simplify the ideas in the subject in order to help the student to understand better, to introduce the student to methods of analysing, understanding, and integrating information, and to give the student the maximum information in the subject possible.
The important points to be noted are that, none of the teachers belonging to the age groujps of 41 to 45, 51 to 55 and 56 years and above

has given I priority to give the student the maximum information in the subject possible, that the majority of the teachers who have given I priority to the second purpose belong to the age groups of 31 to 35, 36 to 40 years, the respective percentages being 48 and 56 ; and the variations are not very much pronounced.
Regarding the teachers who have given II priority to the purpose also, the variation is not very conspicuous and the greater number of teachers who have given II priority to the first purpose belong to the age groups of 31 to 35 and 36 to 40 years, the respective percentages being 52 and 59.
With regard to the teachers who have given III priority to the purposes also, the variation is not very important, none of the teachers belonging to the age group of 56 years and above have given III priority to the second purpose and the majority of the teachers who have givenIII priority to the third purpose belong to the age group of 31 to 35 years. And the same percentage of 48 of teachers belonging to the age group of 26 to 30 years have given III priority to the second and thirt purposes.
About giving of priority to the utilisation of more or less of time by the college teacher to classroom teaching or advancement of knowing in the subject, I priority has been given to the classroom teaching and advancement of knowing in the subject respectively by 26 per cent and72 per cent of teachers ; and II priority to the two respectively by 72 per cent and 26 per cent of teachers. The points to note are that the variations regarding giving I priority and II priority by the teachers belonging to the different age groups are not significant and that the majority of teachers who have given I priority to advancement of knowing in the subject and II priority to classroom teaching, belong to the age group of 31 to 35 years.
When asked about giving priority to the distribution of time by the college teacher between three alternatives, v iz; mostly in teaching, mostly in advancement of knowledge and equally in both, I priority has been given by 24 per cent, 26 per cent, and 48 per cent of the teachers, II priority, by 32 per cent, 37 per cent of the teachers, and 25 per cent, III priori.ty, by 73 per cent, 28 per cent and 27 per cent of the teachers respectively to the three alternatives mentioned above.
The points to be noted are that the variations regarding the giving of I, II and III priorities to the three alternatives by the teachers belonging to various age groups are not very much pronounced : the greater number of teachers who have given I priority to the third alternative, II priority to the second alternative and III priority to the first alternative and IH priority to the first alternative mentioned above, belong to the same age

group of 31 to 35 years the respective percentages being 53, 53 and 48. None of the teachers belonging to the age groups of 56 years and above has given I priority to the I and II alternatives and II, and III priority to the III alternative and that the same percentages of 41 and 36 have givenI priority respectively to the second and third alternatives, belong to the age groups of 26 to 30 and 41 to 45 years. Again, the same percentages of 27 who have given II priority to the I and III alternatives, and of 36 who have given III priority to the I and III alternatives, belong respectively to the age groups of 41 to 45 and 51 to 55 years.
(ii) Medium of Instruction
To the question “What according to you should be the medium of instruction in your college ?”, 12 per cent, 10 per cent and 85 per cent of the teachers respectively desire that regional language, Hindi and English should be the media of instruction. The notable points are that the teachers who are for English are in the majority ; that none of the teachers belonging to the age groups of 20 to 25, 26 to 30, 46 to 50, 51 to 56 and 56 years and alx)ve is for H indi; and no one belonging to the age-groups of 46 to 50 and 56 years and above wants regional language to be the medium of instruction. Further, the greater number of teachers who wish English to be the medium of instruction belong to the age group of 31 to 35 years, the percentage being 79 per cent.
If the medium of instruction were to be changed to Hindi or to any other language, among the teachers belonging to various age groups, 22 per cent of the teachers think and 35 per cent of the teachers do not think that they would be able to teach with some effort and 12 per cent of the teachers are uncertain. The variations are not veiy much pronounced. The points to be noted are that, none of the teachers belonging to the age groups of 46 to 50. and 56 years and above respectively is certain about his or her ability to teach, and thinks that he or she would be able to teach, and the number of teachers who think that they would be able to teach with some effort are greater in number and belong to the age group of 31 to 35 years, the percentage being 41.
Among these teachers, 13 per cent of the teachers think and 26 per cent of the teachers do not think, that the difficulty regarding textbooks in making the regional language the medium of instruction can be solved, while 47 per cent of the teachers opine that it can be possible if an effort is made and 13 per cent of the teachers cannot state definitely. The slignificant points are that none of the teachers belonging to the age group's of 36 to 40, 41 to 45 and 56 years and above is certain about s61>Hng the difficulty ; no one belonging to the age groups of 45 to 50 and 56 years and above thinks, respectively, it is possible, and not possible to

solve the difficulty, that the variation is not very conspicuous and that the number of teachers who think that the difficulty can be solved if an effort is made are in the majority and belong to the age group of 31 to 35 years, the percentage being 70.
(iii) Teachers’ Image of the Student
When asked to describe the present generation of students, 43 per cent of the teachers describe students as purposive, 57 per cent as drifting,34 per cent as studious, 66 per cent as negligent, 46 per cent as capable of independent thought and 55 per cent as incapable of independetit thought, 44 per cent as disciplined, 56 per cent as indisciplined, 65 per cent as deferential, and 35 per cent as unrespectful. The important point is that the variations in all these are not at all pronounced. Another significant point is that the number of teachers who describe the present generation of students as drifting, negligent, incapable of independent thought and indisciplined are greater in number, the respective percentages being 65, 69, 66 and 72. None of the teachers belonging to the age group of 46 to 50 years has described the students as disciplined. The same percentage of 50, belonging to the age group of 20 to 25 years, have applied both the adjectives of studiousness and negligence, and again the same percentage of 50 belonging to the age group of 41 to 45 years have described as both disciplined and indisciplined. But the teachers who apply the adjective of deference to the present generation of students are greater in number, the percentage being 73 per cent and they belong to the age group of 36 to 40 years. The striking point is that the majority of teachers have applied only negative adjectives in describing the present generation of students.
(iv) Teachers’ Observation Regarding the Students’ Performance and theRole of Caste, Religion and Language
To the three questions namely, that the students of the upper castes do better in their studies than students of lower castes, that students belonging to certain religious groups do better in their lessons than students belonging to certain other religious groups, and that among certain Hinguistic groups the academic performance of one language group is better than that of another, respectively 44 per cent, 22 per cent, and13 per cent have given an affirmative answer; 24 per cent, 33 per cent 38 per cent, a negative reply while 31 per cent, 45 per cent and 50 per cent cannot give a definite answer. The significant points are that the variations are not very conspicuous, and that none of the teachers belonging to the age group of 56 years and above respectively has not given a

negative reply and an affirmative answer to the question whether the students belonging to certain religious groups do better and that none of the teachers belonging to the age groups of 36 to 40 and 41 to 45 years, has answered in the alFirmative, the question whether the academic performance of the one language group is better than that of another. The same percentage of 52 which is h i^er of teachers belonging to the age groups of 26 to 30 and 36 to 40 years have observed that the students of the upper castes do better in their studies ^ an students of lower castes. Ai3 the number of teachers who cannot «ay whether or not the students belonging to certain re li^us groups do better, whether or not the Madietuok; {^rformance of cme lan^age group is better, are in greater mtmber, and diey belong to the same age ^ u p of 36 to 40 years.
(v) Goals of Education
When asked “What is the principal god of education?”, according to 15 per cent, 3 per cent, 32 per cent, 47 per cent, and 1 per cent of teachm the principal goals of education are respectively to provide an o m ic security, to achieve higher status in society, to be a cultured person, to turn into a good citizen and any other, while 1 per cent of teachers cannot say anything definitely. The significant points are that none of the teachers belonging to the age-groups of 20 to 25, 41 to 45,46 to 50, 51 to 55 and 56 years and above, thinks that the principal goal of education is to achieve higher status in society. Again, no one in the
groups of 41 to 45 years and 56 years and above thinks that the goal of education is to become a cultured person. Only unsatisfactory percentages of 4 and 3 of tcachcrs belonging respectively to the age groups of26 to 30 and 31 to 35 years state some other goals other than those mentioned above as the fHrincipal goals of education. The teachers who also state that the principal goal of education is to turn one into a good citizen are greater in number, the percentage being 44 and they belong to the age group of 31 to 35 years.
About the goal of education, 47 per cent of the teachers say that the goal is good citizenship. Out of this number 62 per cent teachers belong to science college where boys and girls study together. Stating the role of the student, 73 per cent of teachers employed in sctence colleges for women desire students to do household duties. 58 per cent of the teachers employed in dilferent institutions favour the same opinicm. It is seen that more number of teachers employed in co-educational science colleges feel that the goal of educaticxi good dltizsnship and more number of teachers employed in science colleges for women desire students to household duties.

(vi) Role of the Students
Stating their views on the role of a student, 35 per cent, 26 per cent,36 per cent and 1 per cent uphold respectively, the statements, that a student should be concerned with this studies only, that a student should also devote time to houtehdid duties, that a student should also devote to welfare work, and that a student should also take part in politics, whereas 1 per cent cannot state definitely. The significant points to be noted are that the 7 per cent and 4 per cent of teachers belonging to thiP age groups of 20 to 25 and 26 to 30 years respectively are uoaWe to state definitely to which of tKe statements m©Btioned above they Afpii that only 6 per cent of teachers bel<Mipng to the age group of 31 to 35 years support that the students should also take part in politics that the number of teachers who stote that the student should also devote tim® to welfare work is greater, the percentage being 42 and they belong to the age group of 31 to 35 years and that here also the variation is not very striking.
(vii) Whether the Present System of Education Inculcate Sense of Values
To the question “There is a feeling that the present system of education does not inculcate any sense of values in the younger generation. Do you agree with this ?”, 26 per cent agree, 59 per cent partially agree and 13 per cent do not agree Aat the present system of education does not inculcate any sense of valves in the younger generation, whereas2 per cent cannot say aflythlgg definitely. The important points are, that none of the teachers bekingiog to Ihe age groups of 20 to 25, 36 to 40,41 to 45, 51 to 55 years and above has stated that he or she cannot j^ve a dMnite reply, that oo one iadoapng to the age group of 56 yi^ars and above has agreed that the present sptem of education does not inculcate any sense of valu^ in the youager gmefatioo, that h^e aj^ia, t ^ variations are not very conspicuous and that the number of teachgf^ wl^ partially agree that the j»€«ent system of education does not k ^ ^ t e any sense of values in the younger generation is greater, the j^rcentagf 29 and they belong to lK>th the age groups of 26 to 30 and 36 to 40 ymim-
(viii) Variables Such as EducsMon Rural-Urbm Background, TeemingExperience etc. and the Objectives of Classroom Teaching
Taking into cMsidef^ioo the views of teachers about their prqlers to ways (rf teayehing, goad of education etc., 78 per cent of the teachers with foreign degrees or diplomas give the first priority to the introduction of the student to method of analysing, understanding and integrating

information and their second priority is simplification of idea; 100 per cent of the doctorate degree holders and 78 per cent of the teachers with foreign degrees or diplomas give first priority to advancement of knowing in the subject and their second priority is to class-room teaching.
Again, among the teachers with different rural-urban background, 56 per cent of the teachers who grew up in a village give first preference to the simplification of ideas in the subjects in order to help the student to understand better. Fifty per cent of the teachers who grew up in cities l^ve second priority to it, 72 per cent of the teachers who grew up in mixed environment give first priority to advancement of knowledge like wrftiijg, research etc., they give second priority to class-room teaching.
About their teaching experience and their view about the purposes of undergraduate teaching, 60 per cent of the teachers with 16 to 20 years of teaching experience and 75 per cent of the teachers with more than 21 years of teaching experience give first priority to simplification of ideas in the subjects in order to help the student to understand better. But teachers with lesser number of years of teaching experience give it the second priority and their first priority is for the introduction of the student to methods of analysing, understanding and integrating information. It is seen that teachers with more number of years of teaching experience give first priority to the simplification of ideas while teachers with lesser number of years of teaching experience give first priority to the method of understanding and analysis.
Further, 58 per cent of the teachers brought up in varied economic circumstances give first priority to simplification of ideas whereas teachers who grew up in difficult, average or well-off economic circumstances desire to introduce the student to methods of analysis, understanding and integrating information. Seventy-five per cent of the teachers whose economic background was well off give first priority to the advancement of knowing in the subject whereas 58 per cent of the teachers who grew up under varied economic circumstances give first priority to class-room teachmg.
Teachers employed in arts, commerce, science and co-educational institutions indicate their views about the purposes of undergraduate teaching. It is seen that 78 per cent of the teachers employed in coeducational science colleges give first priority to the introduction of the student to methods of analysing, understanding and integrating information whereas teachers in arts colleges give first priority to the simplification of ideas in the subject; 80 per cent of the teachers employed in science colleges for women give first priority to the advancement of knowing in the subject in their leisure hours. Sixty-seven per cent of these teachers spend most of their time in teaching, 93 per cent of the teachers employed in science colleges for women prefer English as the media of instruc

tion ; 83 per cent of the teachers employed in different institutions say that students follow the lessons taught in English, out of this number 100 per cent of them are teachers employed in arts colleges for women. Nearly 35 per cent of the teachers employed in different institutions feel that they will not be in a position to teach in Hindi or some other language, if that is made as the medium of instruction. It is significant to note that while more number of teachers in science colleges prefer the method of analysis, more number of teachers in arts colleges for women prefer the simplification of ideas in the subject to make students understand better. Again majority of the teachers desire English to continue as the medium of instruction.
(ij^) Professional Relationships
In the following paragraphs the information about the staff meetings held in their institutions etc., is given. While 14 per cent of the male and 10 per cent of the female college teachers say that staff meetings are held regularly, 74 per cent and 85 per cent say that staff meetings are held as and when required according to more number of teachers. At these meetings 43 per cent of the male and 20 per cent of the female teachers most often feel free to discuss all matters relating to the college, 27 per cent of the male and 60 per cent of the female teachers sometimes feel free to discuss, while 6 per cent of the male and 10 per cent of the female teachers and 3 per cent of the male and 5 per cent of the female teachers respectively seldom or never feel free to discuss, but 17 per cent of the male and5 per cent of female teachers sometimes feel free to discuss.
About freedom to discuss all matters relating to the college at the meetings, 43 per cent of the teachers belonging to various age groups most often, 33 per cent teachers sometimes, 6 per cent of the teachers seldom and 3 per cent of the teachers never feel free to discuss and for 13 per cent of the teachers the question is not applicable. The important points to be noted are that none of he teachers belonging to the age groups of20 to 25 years and above seldom feels free to discuss ; no one of the teachers belonging to the age group of 26 to 30, 31 to 35, 41 to 45, 46 to 50, 51 to 55 and 56 years and above never feel free to discuss all matters relating to the college at the meetings ; the variations are not very much pronounced and that among the teachers who most often feel free to discuss all matters relating to the college at the meetings ; the variations are not very much pronounced and that among the teachers who most often feel free to discuss, the majority belongs to the age group of 31 to35 years, the percentage being 47.
When asked about the staff meetings, more number of teachers in the arts college for women only (93 per cent) say that staff meetings are

held as and when required and 53 per cent of them say that sometimes they discuss matters relating to college at staff meetings. Hundred per cent of the teachers belonging to various institutions say that staff meetings are held in thek colleges. It is significant to note that staff meetings ane held as and when required and there is better student teacher contact. It is also seen that more number of teachers who are neither very young nor old, most often discuss matters relating to the college at the staff meetings.
(x) The College Teacher's Educational Outlook — MsAe-FemakDifferentialThe teachers have expressed their views regafdiog the principid
goal of education and also the statement that the present system of education does not inculcate any sense of values in the younger generation. The principal goals of education are to provide economic security for6 per cent of the male and 10 per cent of the female teachers respectively, to achieve higher status in society for 2 per cent of the male and 5 per cent of the female teachers ; to be a cultured person for 40 per cent of the male and 55 per cent of female teachers and to turn into a good citizen for 50 per cent of the male and 35 per cent of the teachers. For3 per cent of the male teachers the goal of education is any other excluding those mentioned above, while 2 per cent of the males have not responded. Large number of teachers feel that the principal goal of education is good citizenship. And out of the teachers contacted, among the males and females, respectively 19 per cent and 10 per cent agree, 61 per cent and 80 per cent partially agree and 16 per cent and 10 per cent did not agree that the present system of education does not inculcate any sense of values in the younger generation, while 3 per cent of males do not give a specific opinion. Majority of the teachers partially agree with the statement that the present system of education does not inculcate any sense of values in the younger generation.
Among the teachers 26 per cent agree, 57 per cent partially agree, 14 per cent do not agree and 2 per cent cannot say anything on the statement, that the present system of education does not inculcate any sense of values in the younger generation. The important points are that none of the teachers who regard providing economic security, achieving higher status in society, and any other as the chief goal of education and also who cannot give a definite opinion, has made clear his or her agreement or disagreement to the feeling that the present system of education does not inculcate any sense of values in the younger generation, and that none of the teachers who think that to achieve higher status in society as the main goal of education, and who specify something else

other than those mentioned above as the principal goal of education has respectively agreed, partially agreed, that the present system of education is defective with regard to inculcating any sense of values in the younger generation. Among those teachers who rcgaril becoming a cultured person turning one into a good citizen as principal goal of education, the greater number partially agree to the feeling than those who agree fully, the respective percentages being 59 and 61, 23 and 28. Another significant point to note is that among the teachers who cannot specify the principal goal of education, cent per cent partially agree to the feeling that the present system of education does not inculcate any sense of values in the younger generation. vttrtattons regard to the teachers stathig different principal goals of educatioa and to their opinion in respect to the feeling about the merit and demerit of the present sy s t^ of education are not very conspicuous.
Out of the male and female teachers contacted, respectively 34 per cent and 15 per cent uphold that a student should be concerned with his studies only, 34 per cent and 45 per cent state that a student should also devote time to household studies, 34 per cent and 30 per cent are for the statement that a student should also devote time to welfare work. Among the female teachers, the same percentage of 5 think that a student also takes part in politics and also have not responded, while 3 per cent of the males have not definitely specified their opinion with regard to the role of the students. While more number of male teachers desire students to devote time to welfare work more number of female teachers desire students to devote time to household duties.
To the three purposes of undergraduate teaching, viz ; (i) to simplify the ideas in the subject in order to help the student to understand better,(ii) to introduce the student to methods of analysing, understanding, and integrating information, and (iii) to give the student the maximum information in the subject possible, amoiig male and female teachers respectively 39 per cent and 40 per cent have given I priority to the first purpose, 45 per cent and 45 per cent, I pricMrity to the second purpose and 15 per cent and 15 per cent, I priority to the third purpose ; 44 ^ r cent and 45 per cent, 61 per cent and 30 per cent, and 22 per cent and25 per cent have given II priority to the first, second and third purposes respectively, v/hile 16 per cent and 15 per cent, 21 per cent and 30 per cent and 60 per cent and 55 per cent respectively have given III priority to the first, second and third purposes, while the same percentage of 3 of the males have not stated the I, II and III priorities.
When asked about the way the time is utilized by the college teachers between class-room teaching and advancement of knowledge in the subject, among male and female teachers, respectively, 32 per cent and 30 per cent, 65 per cent and 70 per cent of them respectively have given I priority

to class-room teaching and advancement of knowledge in the subject while 65 per cent and 70 per cent, 32 per cent and 30 per cent have respectively ^ven II priority to class-room teaching and advancement of knowing in the siibject. In both th^ cases the same percentage of 3 of males have not responded. It is seen that more number of teachers utilize their time mostly in class-room teaching.
Out of the male and female teachers consulted, respectively 40 per cent and 60 per cent spend their time mostly in teaching, 8 per cent and 5 per cent mostly in advancement of knowledge (writing, research etc.),47 per cent and 20 per cent, equally in both, while 5 per cent and 15 pel cent have not replied. About the three alternatives mentioned above, 97 per cent of the males and 30 per cent of the females have ^ven I priority to the first alternative, viz : mostly in teaching, 27 per cent and 25 per cent have given the I priority to the second alternative, viz. mostly in advancement of knowledge, 44 per cent and 40 per cent have pven the I priority to the third alternative, viz. equally in both, while2 per cent of the males have not responded. Again, 29 per cent of the males and 15 per cent of the females, 44 per cent of the males and 50 per cent of the females and 14 per cent of the males and 30 per cent of the females have given II priority respectively to the three alternatives mentioned above while 3 per cent of the m^es have not answered. While 40 per cent of the males and 50 per cent of the females, 26 per cent of the males and 20 per cent of the females, 29 per cent of the males and20 per cent of the females have given III priority respectively to the three alternatives, 3 per cent of the males and 5 per cent of the females have not responded. It is again seen that most of the teachers have given first priority to teaching.
To the question whether the introduction of tutorials, etc., has brought the teacher and student closer to each other, among the males and females, respectively 26 per cent and 25 per cent have given an affirmative answer, while 61 per cent and 10 per cent, a negative reply. While 61 per cent and 60 per cent think that to some extent it has helped to bring the teacher and student closer to each other, 2 per cent and 5 per cent have not answered. More number of teachers think that the introduction of the tutorial system has brought the student and the teachers closer to an extent.
(xi) Teachers Belonging to Various Types of Institutions
When asked for their ideas about the medium of instruction in colleges out of 84 per cent of the teachers belonging to various types of institutions who favour English and say that most of the students understand lessons taught in English, 100 per cent of the teachers in arts college for women only say so ; 67 per cent of the teachers working in science

colleges say that only some students understand the language of instruction. While all the teachers in arts college for women say that the English medium by which instruction is given is understood by all students, larger number of teachers in science colleges feel that only few students understand it so.
According to 26 per cent and 2 per cent of the males, respectively regional language and Hindi should be the medium of instruction at the college level, while 73 per cent of the males and cent per cent of the females want English to be the medium of instruction at the college level. It is seen that most of the teachers desire English to be the medium of instruction. Further 67 per cent of the males and 95 per cent of the females think that most of their students understand the English languap, which is used as the medium of instruction ; 32 per cent of the males and5 per cent of the females opine that only some of their students understand the language, while 2 per cent of the males say that hardly any of the students understands the language. Again more number of teachers feel that students understand lessons in the English medium of instruction. To the question that if it was decided to change the medium of instruction to Hindi or to any other language, would they be able to teach in that language, 37 per cent of the males and 28 per cent of the females have answered in the affirmative, and 16 per cent of the males and 35 per cent of the females in the negative. While 34 per cent of the male and 35 per cent of the female teachers think that they can teach wfith some leflort, fifteen per cent and 5 per cent cannot give a definite answer. While more number of male teachers feel that they can teach in Hindi or some other language, more number of female teachers either answer in the negative or say that they can teach, with some effort. Among the male and female teachers, respectively 23 per cent and 5 per cent, 15 per cent and 30 per cent do not think that the difficulty regarding textbooks in making the regional language the medium of instruction, could be solved while 57 per cent and 30 per cent opine that the difficulty can be solved if the effort is made and 6 per cent and 35 per cent cannot state definitely. More nunaber of male teachers feel that the difficulty regarding textbooks in making the regional language the medium of instruction, could be solved with some effort while more number of female teachers cannot give a definite answer.
Among the teachers who want regional language, Hindi or English to be the media of instruction at the college level, 22 per cent of the teachers think and 35 per cent of the teachers do not think that they are able to teach in Hindi or any other language if they were made the media of instruction, while 31 per cent of the teachers think that they will be able to teach with some effort and 12 per cent of the teachers are doubtful. If it is decided to change the medium of instruction to Hindi or to any

other language, among the teachers who want respectively regional language and Hindi to be the medium of instruction at the college, the respective percentages of 53 and 50, think that they will be able to teach in Hindi or any other language with some effort, while among the teachers who are for English as the medium of instruction, 40 per cent do not think that they would be able to teach in Hindi or any other language if they are made the media of instruction. The important point to note is that none of the teachers who want regional language and Hindi to be media of instruction has said that he/she cannot give a definite answer as to the ability of teaching in Hindi or any other language if they were to be made the media of instruction.
No one among the teachers who are for regional language has given a negative reply to the ability to teach in Hindi or any other language other than English. Among the teachers those who want English to be the medium of instruction at the college level are greater in number than those who are for regional language or Hindi, the respective percentages being 85, 12 and 3. With regard to the ability of teaching in Hindi or any other language if they were made the media of instruction the same percentage of 50 among those who wish Hindi to be the medium of instruction at the college level, have given an affirmative as well as a negative answer.
Among these teachers who wish regional language, Hindi or English to be the media of instruction at the college level, 14 per cent of the teachers and 26 per cent of the teachers respectively do not think that the difficulty regarding textbooks in making the regional language the medium of instruction can be solved, while 47 per cent of the teachers are of the opinion that the difficulty can be solved if the effort is made and 14 per cent of the teachers cannot give a definite reply. Among these teachers who are for regional language, Hindi or English, respective, 53 per cent, 75 per cent and 56 per cent of the teachers opine that the difficulty can be solved if the effort is made.
The significant points to be noted are, that none of the teachers who are for regional language and Hindi, has given a negative reply regarding the solving of the difficulty of textbooks through making the regional language the medium of instruction ; that no one of the teachers who support Hindi has given a definite answer to the question, and that among the teachers who are for English, the number of teachers who think that the difficulty can be solved if the effort is made are greater in number than those who do not think so, the respective percentages being 56 and 31.
Out of the male and female teachers contacted, respectively 32 per cent and 55 per cent describe the present generation of students as purposive, 65 per cent and 45 per cent as drifting, and 3 per cent of the

males have not answered ; 26 per cent and 50 per cent delineate as studious, 69 per cent and 45 per cent as negligent, and 5 per cent and 45 per cent describe it as capable of independent thought, 65 per cent and 50 per cent as incapable of independent thought, and 8 per cent and 5 per cent have not responded ; again, 34 per cent and 60 per cent delineate it as disciplined, 58 per cent and 35 per cent as indisciplined, and 8 per cent and 5 per cent have not described ; and 48 per cent and 70 per cent speak about it as deferential, 45 per cent and 25 per cent as unrespectful, while 6 per cent and 5 per cent have not delineated. It is seen that more number of male teachers say that students are drifting, negjiigeatt indisciplined while more number of female teachers do not think so.
When asked whether the students of the upper castes, the students belonging to certain religious groups do better in their lessons, than others, 48 per cent of the males and 30 per cent of the females, 24 per cent of the males and 5 per cent of the females have given the affirmative answer, 18 per cent and 40 per cent and 50 per cent of the males have given the negative reply to the question, while 31 per cent and 30 per cent, 44 per cent and 45 per cent of the females cannot give a definite reply to the question respectively and the same percentage of 3 per cent of the males have not responded to both the questions. More number of male teachers feel that students belonging to upper castes do better in studies than others while more number of female teachers are undecided.
To the question whether, among certain linguistic groups the academic performance of one language group is better than that of another, 10 per cent of the males and 25 per cent of the females have answered in the affirmative, 34 per cent of the females and 35 per cent of the females in the negative, while 56 per cent of the males and 40 per cent of the females cannot state definitely. On the whole it is significant to note that mc^e number of teachers, feel that the principal goal of education is good citizenship, partially agree with the view that the present system of education does not inculcate any sense of values in the younger generation ; it is also seen that more number of male teachers desire students to devote time to welfare work while more number of female teachers desire students to devote time to household duties ; majority of the teachers desire English to be the medium of instruction and feel that with some effort the problem of textbooks, if regional language is made the medium of instruction, could be solved ; further more number of male teachers feel students drifting, negligent and incapable of independent thought.
Section III — H eads of Colleges
1 A DESCRIPTION OF THEIR SOCIAL BACKGROUNDT his section gives inform ation about their age, caste, religion,

education, occupation, income and also their rural-urban background.Among the 15 heads of colleges contacted, 1 principal is in the age
group of 36 to 40 years ; 4 principals are in the age group of 41 to 45 years ; 4 more between 46 and 50 years ; 3 between 51 and 55 years and3 more aged over 56 years. It is seen that more number of heads of colleges are in the age group of 41 to 50 years.
Of the total number of principals, 10 are males and 5 are females. Male heads of colleges have outnumbered female heads of colleges.
About their caste, 10 principals belong to other castes ; 2 belong to backward classes and m m belongs to scheduled castes. More number of heads of colleges belong to other castes.
Thirteen principals are Hindus while the remaining two are Christians. Most of the heads of colleges are Hindus.
The mother tongue of 7 principals is Kannada ; of 2 is Konkani; of3 is Tamil ; of one is Telugu and of 2 is Tulu. More number of heads of colleges have Kannada as their mother tongue.
When asked about their economic background, 3 principals say that they grew up under difficult or stringent economic circumstances ; 8 principals say that they grew under well-off and 2 under varied circumstances. It is seen that more number of heads of colleges have grown under average economic circumstances.
About their grandfathers’ and fathers’ occupations, the grandfathers of 2 principals and father of one principal are owners of farm, dairy, e tc ; the occupation of 5 grandfathers and 1 father is tenant cultivation, independent fishery etc. that of one grandfather is manual labour; that of 3 grandfathers and 3 fathers is ownership of small business etc ; that of 2 grandfathers and 7 fathers is group 6, namely executives, scientists etc ; that of the fathers of 2 principals is the ordinary administrative staff like clerks, school teachers, stenos etc. It is significant to note that the occupation of grandfathers of more number of principals is ownership of farm, etc., while the occupation of fathers of more number of principals is group 6, namely executives, scientists, doctors, professors etc.
When asked about their educational background it is seen that grandfathers of 3 principals and father of a principal are barely literates ; grandfathers of 6 principals and fathers of 2 are educated upto primary school; grandfather of a principal and father of 6 principals are educated upto middle or high school; grandfather of a principal and fathers of 5 principals are college educated and grandfathers of 3 principals and father of a principal are educated in the traditional sanskritic system. While grandfathers of more number of principals are primary school educated, fathers of more number of principals are middle or high school educated.
About their rural-urban background, 5 principals were schooled at

a smaller place than a tehsil; whereas 10 principals were not schooled at such places. More number of principals were schooled at a bigger place than a tehsil.
We asked whether the principals have private tuitions, 13 principals do not give private tuitions ; while 2 principals give private tuitions. More number of principals do not give private tuitions.
To the question “What is your total salary per year ?”, 3 principals earri between Rs. 6000 and Rs. 8000 ; 4 principals earn between Rs. 8000 and Rs. 10000 whereas 8 principals earn between Rs. 10000 and Rs. 15000. More number of principals have an annual income ranging between Rs. 10000 and Rs. 15000.
When questioned about having other sources of income, 4 principals do liot have any source of income other than their salary ; 7 principals earn between Rs. 501 and Rs. 1000 over and above their salary per annum ; 1 principal earns between Rs, 1000 and Rs. 1500 per annum whereas 3 principals earn over Rs. 1501 extra per year. More number of principals have an extra earning of Rs. 501 to Rs. 1000 per year. It is seen that more number of principals are in the age group of 41 to 50 years are Hindus, speak Kannada, do not give private tuitions, earn an annual income of Rs. 10000 and Rs. 15000.
2. PROFESSIONAL EQUIPMENT OF COLLEGE HEADS
The heads of colleges were requested to give information regarding their educational and professional achievements, the utilization of their time etc.
When asked about their educational qualifications, 3 principals are bachelor degree holders ; 9 principals are master degree holders ; 1 principal is a doctorate degree holder and 2 principals have a foreign degree or diploma. More number of principals are master degree holders.
Eleven principals teach papers which they studied in thojr master’s degree while 2 principals teach only some papers which they studied at their master’s degree and 1 principal teacher none of those. Most of the principals teach the subjects which they studied during their master’s or doctorate degrees.
To the question “In actual practice how is your time distributed between teaching, research or both ?”, 4 principals spend their time mostly in teaching ; 1 principal in research or writing ; and 8 principals equally in both. More number of heads of colleges spend their time equally in teaching and research.
When asked about their contribution of articles or writing books in their subjects, 5 principals have contributed articles while 3 other principals have written both articles and books. More number of teachers have

not responded to the question. Among those who have responded, more number of principals have contributed artides.
About their publications, one principal has published reports whereas 2 principals have published both repcM'ts and textbooks. Further 7 principals have read papers at meetinp of professional or academic societies ; while 8 principals have not dc»ie so. Again 5 principals have served as professional consultants to industfy or some organization or to state or central government. It Is seen that more number of principals have not published reports, textbooks or delivered papers at meetings or btve acted as professional consuHante to Industry, etc.
To the question “What is your totd experience as a college teai^MF^*,2 pflncipals have 6 to 10 years of tegefaiiif experience ; 1 principal has between 11 to 15 years; 4 principals have 16 to 20 years of experience while 7 priflctpals have put in more than 21 years service, Five principals have been serving in the institution in which they are employed for 5 or less than 5 years; 3 {nrindpals from 6 to 10 years ; 2 principals from 11 to 15 years ; 3 principals from 16 to 20 years and 2 over 21 years. It is seen that moie number of principals have more than 21 years of teaching experience, and have been working in the institution where they are presently employed for 5 or less than 5 years.
Majority of the heads of schools are master degree holders, are teaching the subjects which they studied in their master’s degree, have not published articles or books and have more than 21 years of teaching experience.
3. HOW DID THEY COME TO THE PROFESSION AND HOWDO THEY VIEW THE PROFESSION
The principals have given information regarding their desire to choose another occupation or otherwise, their social status and also compare their occupational status with that of their fathers.
To the question “Have you pursued any other occupation other than teaching T \ 8 principals have never ^rsued an occupation other than teaching; a principal has done so between two teaching jobs; 4 principals had pursued another occupation before they took to teaching ; and 2 principals have been doing or have done it along with teaching. More number of principals have never pursued an occupation other than teaching.
To the question “Before you took to teaching as a career, did you wish to choose any other occupation?”, 5 principals wished to choose some other occupation before they took to teaching; 5 others did not whereas 5 principals had no specific choice.
When they were asked to compare their present occupational status

with that of their fathers, 11 principals say it is higher while 2 principals say that it is about the same. More number of principals rate their occupational status higher than that of their fathers.
About their participation in the formulation of courses for their subjects, 14 principals say that they have a sense of participation in the formulation of courses for their subjects, whereas only one principal does not say so. Most of the principals have a sense of participation in the formulation of courses for their subjects.
When asked about their im a^ of their own social status, 8 principals identify their status with the middle social position ; 4 principals with tl» upper social position and a principal with the lower social position. Of them 12 principals find it hard to move up in society ; and 2 principals do not know. One principal has not responded. More number of principals identify their status with the middle social position and find it hard to move up in society.
It is significant to note that more number of principals have never pursued another occupation, rate their occupational status higher than that of their fathers, identify their status with the middle social position and find it hard to move up in society.
4. THEIR INVOLVEMENT IN THE PROFESSION AND THEIRMEMBERSHIP OF PROFESSIONAL BODIES
Principals were asked to give information about the classes they handle and their membership of academic bodies and societies.
When asked about the classes they teach and the number of hours per week they work, 14 principals teach undergraduate classes and 1 principal handles both undergraduate and post-graduate classes. Two principals have 5 or less than 5 hours per week ; and 11 principals have 5 to 8 hours per week. Most of the principals teach the under graduate classes and more number of principals work for 5 to 8 hours per week.
When asked about their membership of academic bodies in their subjects, like the Indian Science Congress, Indian Economic Conference etc., 10 principals are not members of such bodies ; whereas 4 principals •re members of national bodies. More number of principals are not m«»ibers of national bodies. More number of principals are not members d academic bodies or societies.
It is seen that more number of principals teach the undergraduate classes and are not members of academic societies.
5. THEIR COMMITMENT TO THE PROFESSIONIlie principals were asked to give informa^n about their willingness
or unwillingness to continue in the teaching profession.
Asked whether the principals would like to change their professions, if an opportunity were to arise, with the same emoluments, one principal would like to change ; 4 principals think that it is too late to change and8 principals do not want to change. More number of principals do not want to change from their present profession.
6. THEIR PROFESSIONAL RELATIONSHIPS
The principals, in the following paragraphs have given information about the staff meetings and the student-teacher contact.
To the question “Are any staff meetings held in your institution?"2 principals say that staff meetings are held regularly; 12 principals say that staff meetinp are held as and when required ; and 1 principal says that no such meetings are held . Further 12 principals most often feel free to discuss at those meetings whereas 2 principals discuss sometimes only. It is seen that staff meetinp are held as and when required and more number of principals most often discuss college matters at such meetings.
When asked about the number of students who feel free to consult them in difficulties on academic and personal matters, 3 principals say 1 to4 students go to them for consultation ; 4 principals say 6 to 10 students go to them while 6 principals say that more than 10 students go to them. Only one principal says that none goes to him. A slightly more number of principals say that more than 10 students go to them for consultation, in their difficulties on personal and academic matters.
It is seen that more number of principals most often feel free to discuss college matters at meetings which are held as and when required and have established better teacher-student contacts.
7. THE PRINCIPALS' EDUCATIONAL OUTLOOK
The heads of colleges give information about the goal of education, the system of present day education, the role of the teacher, the medium of instruction and the image of the student.
To the question “What do you think is the principal goal of education ?”, 3 principals think that it is to provide economic security ; 1 principal says that it is to achieve higher status in society; 5 principals say that it is to be a cultured person and 5 others say it is to be a good citizen. One principal is not in a position to say anything. More number of principals feel that the goal of education is to be a cultured person or good citizenship.
Again 3 principals agree with the idea that the present system of education will not inculcate any sense of values in the younger generation

while 11 principals only partially agree with the idea. It is seen that more number of principals only partially agree with the idea that the present system of education does not inculcate any sense of values in the younger generation.
About the role of the student, 4 principals feel that a student should be concerned with studies only ; 3 principals like students to devote time also to household duties ; whereas 8 principals think that students must devote time to welfare work also. More number of principals desire students to devote time to welfare work also.
To the question on the lote o! the teacher in being nseful to Ms students, 6 principals want teachers to simplify the ideas in the subject, in order to help the student to understand better; 8 principals want to introduce the student to methods of analysing, understanding, and integrating information ; further, it is felt that the college head faces a dilemma in the utilization of his time ; 5 principals give the class room teaching the first priority and 9 principals give the advancement in knowing the second priority ; whereas 9 principals give class room teaching the second priority while only 5 give advancement of knowing in the subject, the second priority. It is seen that more number of principals want to introduce students to the methods of analysis etc., and give first priority to the advancement of knowing in the subject.
Again 4 principals spend their time mostly in teaching ; 1 principal in the advancement of knowledge and 8 principals in both. While 6 principals give first priority to both teaching and advancement of knowledge, 6 principals give second priority to teaching and 6 principals give the third priority to advancement of knowledge. Again, it is seen that more number of principals spend their time in both teaching and research and also give first priority to teaching and advancement of knowledge.
When asked about the efficacy of tutorials in bringing the student and the teacher closer, 6 principals think that the tutorial system has brought the teacher and student closer to each other; while9 principals feel it has served the purpose to some extent. More number of principals feel that the introduction of the tutorial system has served the purpose of bringing the student and the teacher closer to an extent.
To the question “What according to you, should be the medium of instruction at the college ?”, 12 principals say that it should be English at the college level, while only 3 principals prefer the regional language. Further, 10 principals say that most of the students follow English while4 principals say only some students follow. Asked whether they would be able to teach, if the medium of instruction is switched over to Hindi or any other language, 8 principals say that they cannot teach ; 4 principals can do it with some effort whereas only 3 principals say yes. It is

seen that more number of principals want English to be the medium of instruction and feel difficult to teach if the medium of instruction is changed from English to Hindi or any other language.
When asked for their views on the difficulty regarding text books in making the regional language the medium of instruction, 6 principals say that it would be difficult to solve the issue while 4 other principals say that it is not so.
To the question about the image of the students, 12, 8, 8, 8 and 8 principals find students, drifting, negligent, incapable of independent thoiighl, indisciplined and deferential respectively ; whereas 2, 6, 5, 4 and5 principals find students purposive, studious, capable of independent thought, disciplined, and unrespectful respectively. It is seen that more number of principals find students drifting, negligent, indisciplined, incapable of independent thought and deferential.
Seven, 5 and 3 principals say that students belonging to upper castes, certain religious groups and certain linguistic groups do better in their studies respectively; while 2, 4 and 5 principals do not think so respectively. Further it is seen that more number of principals feel that students belonging to upper castes do better in their studies than others.
On the whole, majority of the heads feel that the goal of education is good citizenship or to be a cultured person, partially agree with the view that the present course of education does not inculcate any sense of values in the younger generation, desire students to devote time to welfare work, want to introduce students to the method of analysis and understanding, feel that the introduction of the tutorial system has brought the student and the teacher closer to an extent and want English to be the medium of instruction.
8. THE HEADS OF COLLEGES AND THEIR RELATIONSHIPWITH THE MANAGEMENTTo the question about their membership as ex-officio office bearers
of the boards of management, 8 principals say that they are represented on the board, while 3 others say that they are not. It is seen that more number of principals are represented on the boards of management.
When asked whether they are satisfied with the support from the inanagement in the task of running the institution, 9 principals are satisfied whereas 5 principals are partially satisfied. More number of principals are satisfied with the support they are getting from the management in running the institution.
About the accessibility to the members of the board of management9 principals say that they are always accessible; 3 other principals say that they are usually accessible. More number of principals say that members of the board of management are jdways accessible.

It is seen that majority of the principals are represented on the boards of management, are satisfied with the support of the board and feel that members of the board are always accessible,
9. THE HEADS OF COLLEGES AND THE STATE EDUCATIONDEPARTMENT
The principals have hereunder given information regarding their accessibility to the higher officer in the government and their view about the autonomy in day to day matters.
When asked about the accessibility to the higher officers in the government department, 5 principals say that they usually are ; 3 principals say that it depends and 2 principals say that they are seldom accessible. It is seen that more number of principals say that higher officera in the government are always or usually accessible.
Asked whether they are satisfied with the autonomy in day to day matters, 8 principals are satisfied ; 6 principals are usually satisfied, whereas one principal is dissatisfied. More number of principals are satisfied with the autonomy in day to day matters.
10. THE HEADS OF COLLEGES AND THEIR RELATIONSHIPWITH THE STAFF
The principals are asked to give information about the means adopted to communicate decisions on administrative and academic matters.
To the question about the means adopted to communicate decisions regarding the administrative matters, 9 principals communicate decisions to their colleagues by circulars whereas 5 principals do it by holding meetings. More number of principals communicate decisions to their colleagues on administrative matters, by circulars.
About the co-operation from the members of the staff with reference to administrative matters, 4 principals say that their colleagues fully co-operate ; 10 principals say that they co-operate on request; one principal is indifferent. More number of principals say that thdir colleagues co-operate on request, as far as administrative matters are concerned.
In academic matters, 9 principals say that their colleagues are fully co-operative ; whereas 6 principals say that they co-operate only on request. On academic matters more number of principals say that theix colleagues fully co-operate.
It is significant to note that decisions taken at meetings are communicated to the staff members by the principals by circulars and find staff members fully cooperative on academic matters. But they say that on administrative matters they co-operate only on request.

Section IV. A. — N on-Professional College Student
1. SOCIAL BACKGROUND
This section deals with the age, caste, religion, educational, occupational and rural-urban background of the non-professional college student.
(i) Age Group of Students
Stating their age, 37 per cent of the boys and 67 per cent of the girls are in the age group of 17 and 19 years; 50 per cent of the boys and 29 per cent pf the ^rls are in the age group of 20 and 22 years ; 1 per cent of the boys and 1 per cent of the girls are in the age group of14 and 16 years whUe 11 per cent of the boys and 1 per cent of the ^ I s are in the age group of 23 and 25 years, 1 per cent of the boys and none of the girls are above 26 years of age. While more number of girls are in the age group of 17 and 19 years, more number of boys are in the age group of 20 and 22 years.
(ii) Caste
About their caste, 43 per cent of the boys and 23 per cent of the girls belong to other castes ; 31 per cent of the boys and 11 per cent of the girls belong to backward classes ; 2 per cent of the boys and 2 per cent of the girls to scheduled castes and 11 per cent of the boys and 16 per cent of the girls do not belong to any of these castes. More number of students belong to other castes.
(iii) Mother Tongue
The mother tongue of 65 per cent of the boys and 39 per cent of the girls is Kannada ; that of 1 per cent of the girls is English ; 1 per cent of the boys and 0 per cent of the girls is Gujarati; of 8 per cent of the boys and 18 per cent of the girls is Konkani; of 2 per cent of the boys and 2 per cent of the girls is Marathi; of 2 per cent of the boys and 2 per cent of the gills is Malayalam ; of 1 per cent of the gjrls is Punjabi; of 1 per cent of the girls is Sindhi; of 4 per cent of the boys and 17 per cent of the girls is Tam il; of 9 per cent of the boys and 11 per cent of the girls is Telugu ; of 6 per cent of the boys and 3 per cent of the girls is Tulu ; of 5 per cent of the boys and 5 per cent of the girls is Urdu ; and of 1 per cent of the boys and 1 per cent of the girls is other than these. More number of students have K^nnad t ^ their mother tongue.

(iv) ReligionMentioning their religion, 91 per cent of the boys and 76 per cent of
the girls are Hindus ; 4 per cent of the boys and 5 per cent of the girls are Muslims ; 2 per cent of the boys and 15 per cent of the gjrls are Christians, 1 per cent of the boys and 0 per cent of the girls are Jains and 0 per cent of the girls are Sikhs. Most of the students arei Hindus.
(v) Rural-urban BackgroundFurther, 76 per cent of the boys and 53 per cent of the girls have
experience of village life ; 23 per cent of the boys and 46 per cent of the girls do not have such an experience ; and 1 per cent of the boys and 1 per cent of the girls have not responded. More number of students have experience of rural life.
(vi) Education of GrandfathersTo the question about the education of their grandfathers, 28 per
cent of the boys and 12 per cent of the girls say that they were barely literate or illiterate ; 26 per cent of the boys and 13 per cent of the girls say that they were educated upto primary school; 21 per cent of the boys and 22 per cent of the girls say that they were educated upto middle or high school; 4 per cent of the boys and 13 per cent of the girls say that they were educated upto college level; 8 per cent of the boys and 5 per cent of the girls say that they were educated in the traditional sanskritlc system; 14 per cent of the boys and 34 per cent of the girls cannot say anything ; and 1 per cent of the boys and 1 per cent of the girls have not responded to the question.
Regarding their fathers’ education, 11 per cent of the boys and 1 per cent of the girls say that they are illiterates ; 22 per cent of the boys and5 per cent of the girls say that they are educated upto primary school;44 per cent of the boys and 31 per cent of the girls say that they are educated upto middle or high school; 19 per cent of the boys and 51 per cent of the girls say that they are educated upto college level; 4 per cent of the boys and 1 per cent of the girls say that they are educated traditionally in the sanskritlc system; and 1 per cent of the boys and 3 per cent of the girls are not in a position to say anything. It is seen that while more number of boys say that their grandfathers were illiterates, more number of girls are not aware of the education of their grandfathers. While fathers of more number of boys are educated upto middle or high school, fathers of more number of girls are educated upto college level.
(vii) Occupational BackgroundWhen asked about their occupational background, grandfathers of 37

per cent of the boys and 44 per cent of the girls, fathers of 25 per cent of the boys and 11 per cent of the girls belong to group 1, namely owner of farni, fishery etc.,; of 10 per cent of the boys and 3 per cent of the girls and of 7 per cent of the boys and 1 per cent of the girls respectively belong to group 2 namely tenant cultivator, peasant, proprietor etc .; of 12 per cent of the boys and 1 per cent of the girls and 26 per cent of the boys and 0 per cent of the girls respectively belong to group 3, namely manual labourer in agriculture etc. ; of 2 per cent of the boys and 3 per cent of the girls and of 7 per cent of the boys and 3 per cent of the girls respectively belong to group 4, namely proprietor, durector, managing agent etc ; of 2 per cent of the boys and 6 per cent of the ^rls and of 7 per cent of the boys and 12 per cent of the girls respectively belong to group 5, namely owner of small business, retail shop etc .; of 9 per cent of the boys and 18 per cent of the ^ I s and of 13 per cent of the boys and 44 per cent of the girls respectively belong to executive and scientific personnel etc. ; of 8 per cent of the boys, and 9 per cent of the gurls and of 18 per cent of the boys and 15 per cent of the girls respectively belong to the ordinary admhiistrative staff ; of 1 per cent of the boys and of 3 per cent of the boys and 2 per cent of the girls respectively belong to the skilled manual labour group etc. ; of 2 per cent of the boys and 0 per cent of the girls and of 1 per cent of the boys and 0 per cent of the girls respectively belong to the unskilled staff ; of 1 per cent of the boys and 3 per cent of the girls and of 2 per cent of the boys and 2 per cent of the gkls respectively belong to the armed forces personnel; and of 2 per cent of the boys and 1 per cent of the girls and of 1 per cent of the boys and 1 per cent of the girls respectively belong to some other occupation. The occupation of the grandfathers and fathers of more number of boys is the ownership of farm, dairy etc., whereas that of girls’ fathers is group 6 namely executives, scientists etc.
To the question about the family undertaking responsibility to finance their education, 27 per cent of the boys and 47 per cent of the gn:ls say that their families are prepared to finance for their further education ; 25 per cent of the boys and 14 per cent of the gkls say it is not so in their case ; 24 per cent of the boys and 18 per cent of the girls say it is so partially ; 21 per cent of the boys and 17 per cent of the girls are not in a position to say anything. More number of students say that their families are prepared to finance for their further education.
To the question “With whom do you live ?”, 47 per cent of the boys and 43 per cent of the girls live with their parents ; 13 per cent of the boys and 9 per cent of the girls with their relatives ; 41 per cent of the boys and 11 per cent of the girls in hostels or rented rooms. More number of students stay with parents.
To the question “Where do you live ?”, 72 per cent of the boys and

89 per cent of the girls stay in the same place where the college is situated ; 8 per cent of the boys and 6 per cent of the girls within a distance of 5 miles from the colleges ; 6 per cent of the boys and 1 per cent of the girls beyond 5 miles ; 5 per cent of the boys and 2 per cent of the girls in another town or city ; most of the students stay in the same place where the college is situated.
It is seen that more number of students are Hindus who speak Kannada, belong to other castes, have experience of village life, stay with parents in the same place where the college is situated.
2. THE STVDY A T HOME
The students give information about attending the coaching classes, taking private tuitions, and about the help from someone in the family.
To the question “Does any one of your family help you in your studies ?”, 53 per cent of the boys and 80 per cent of the girls inform that no member of their family helps them m their studies like homp assignments etc., 46 per cent of the boys and 19 per cent of the girls say that they are helped. More number of students do not get any help in their studies from members of their family.
When asked about engaging private tutors for help, 68 per cent of the boys and 98 per cent of the girls have not engaged any private tutors while 4 per cent of the boys and 1 per cent of the girls have engaged a private tutor; 89 per cent of the boys and 98 per cent ofthe gkls do not attend any coaching classes ; 8 per cent of the boysand 2 per cent of the girls attend coaching classes. Large number of students have not engaged special tutors and do not attend coachiog classes.
Seventy-nine per cent of the students who live with parents, 16 per cent bf the students who stay with relatives and 61 per cent of thestudents who stay in hostels or rented rooms have not engaged specialtutors while only 1 per cent of the students who live with parents, 2 per cent of the students who stay in the hostels have private tutors. It is seen that more number of students have not engaged tutors. Among them, most of the students who stay with parents have not engaged special tutors. Large number of students do not get any help from their family in their studies have not engaged special tutors and do not attend coaching classes.
(i) Students’ views regarding Education—Male-Female Differential
The students have hereunder given their views regarding the

principal goal of education, roles of teacher and of student and their aspirations after the present course of education.
When asked for the students’ view regarding the principal goal of education, 13 per cent of the boys desire good citizenship while 40 per cent of the girls desire one to be a cultured person ; 8 per cent of the boys and 4 per cent of the girls feel that the goal is to provide economic security ; and 14 per cent of the boys and 8 per cent of the girls say it is to achieve higher status. While 26 per cent of the boys say it is to be a cultured person, 49 per cent of the girls feel that it is something else other than all these. More number of boys say that the goal of education is to be cultured person than those mentioned above.
(ii) Whether the Present System of Education Helps to Achieve theAim of Life
To the question “Do you think the present course of your education will help you in achieving your aim of life, 51 per cent of the boys and 67 per cent of the girls thmk that the present course of education will help them in achieving their aim of life. Nineteen per cent of the boys and 6 per cent of the girls do not think so, while 28 per cent of the boys and 26 per cent of the girls are not in a position to say anything. Large number of students feel that the present course of education wiU help them in achieving their aim of life.
When asked about the achievement of goal in life, 62 per cent of the students studying in government and government-aided colleges feel that the present course of education wUl help in achieving the goals of life. Among these, 61 per cent of the students studying in government colleges favour this opinion. It is seen that more number of students studying in government colleges feel that the present course of education will help them in achieving the goals of life.
When asked about the chances of achieving these goals, 44 per cent of the students in government aided colleges and 45 per cent in government colleges feel that chances are fair. Nearly 20 per cent of these students feel that chances are bright. It is seen that about 44 per cent of the students from both government and government aided colleges find their chances fair, in achieving the goals of life.
Students with different educational backgrounds giving their views on the goals of education, their achievement etc., state that 70 per cent of the students who are not aware of the education of their fathers feel that the goal of education is to make one a good citizen ; 49 per cent of the students whose parents are illiterate also think so. While only 6 per cent of the students with different educational background think that it is to provide economic security.

Further, 66 per cent of the students whose fathers are college educated feel that the present course of education will help in achieving the goals in life while 22 per cent of the students who are not aware of their fathers’ education do not think so. Similarly 30 per cent of the students whose fathers are college educated think that chances are bright to achieve the goals in life. But nearly 40 per cent of the students with different educational background feel that chances of achieving goals in life are fair. Again more number of students whose fathers are college educated feel that the present course of education will help in achieving the goals of life.
Giving their views on the achievement of life’s ambition with the present course of education, 10 per cent of the students whose fathere are peon, coolies, etc., feel that the present course of education will help in achieving the aims of life while 27 per cent of the students whose fathers are tenant cultivators, independent fisherman etc., do not think so. Further, 44 per cent of the students who have different occupational background feel that chances are fair in achieving the goals of life and 57 per cent of students whose fathers are coolies, peons etc., favour the same opinion. It is significant to note that most of the students whose fathers are peons, coolies etc., feel that the present course of education will help in achieving the aims of life and also think that the chances are fair for its achievement.
Sixty-one per cent of the students who would like to take up different occupations feel that the present course of education will help in the achievement of the aims of life. While 63 per cent of the students who would like to be executives, professors, doctors, lawyers etc., favour the same opinion, 24 per cent of the students who would like to choose some other occupation specified by them do not feel so. Large number of students who would like to be executives, scientists, etc., also think that the present course of education will help in the achievement of the aims of life.
To the question on the achievement of the aim of life through the present course of education, 69 per cent of the students who would Uke to continue their studies feel that the present course of education will help to achieve goals in life. Sixty per cent who are undecided about further study, do not think so. On the whole 62 per cent of the students feel that the goal in life could be achieved. More number of students who would like to continue their studies feel that the present course of education will help in achieving the aims of life.
(iii) Role of Teachers
When asked for their views about what their teachers should be,

82 per cent of the boys and 90 per cent of the girls desire teachers to be second parents and ensure all-round development; 18 per cent of the boys and 9 per cent of the girls feel that a teacher should primarily be concerned with teaching his subject in the classroom and should not wori7 about students behaviour outside classroom. Most of the students desire teachers to be like parents ensuring all-round development.
Eighty-one per cent of the students belonging to government and government-aided colleges desire teachers to be like second parents. Among them 80 per cent of the students studying in government-aided colleges say so. It is seen that most of the students in government- aided colleges desire teachers to be like parents ensuring all-round development.
\\^en students with different occupational background were asked about the role of the teacher, 81 per cent desire their teachers to be like parents among them 86 per cent of the students whose fathers belonged to unskilled staff like peon or cooUe favour the same opinion but 32 per cent of the students whose fathers are tenant cultivators, independent fishermen etc., do not desire so. It is seen that most of the students whose fathers are peons, coolies etc., desire their teachers to be like parents ensuring all-round development.
(iv) Role of Student
To the question about the role of the student, 19 per cent of the boys and 12 per cent of the girls desire that a student should be concerned with his studies only, 21 per cent of the boys and 44 per cent of the girls desire that a student should also devote time to household duties but 42 per cent of the boys and 27 per cent of the girls desire that a student should devote time to welfare work also. About 8 per cent of the boys and 5 per cent of the girls desire that a student should take interest in politics while 11 per cent of the boys and 14 per cent of the girls are not in a position to say anything. While more number of boys want students to devote time to welfare work, more number of girls want students to devote time to household duties also.
When asked about the role of the student, 33 per cent of the students who would like to continue their studies after college education feel that a student should devote time to welfare work also. While 33 per cent of the students who would like to work also think so, 8 per cent of the students who want to earn, want students to take part in politics. It is seen that more number of students who would like to continue their studies or earn their livelihood by starting to work desire students to devote time to welfare work.

(v) Students’ Performance and Involvement in Studies
The students in the following paragraphs have given information regarding their percentage of marks in the previous two examinations, their reading habits and their capability of following lessons in the class.
To the question about their performance in the last two annual examinations, 50 per cent of the boys and 42 per cent of the girls have obtained marks between 40 and 49 per cent; 24 per cent of the boys and 37 per cent of the girls have obtained between 50 and 59 per cent. Four per cent of the boys and 9 per cent of the girls have got above 60 per cent,20 pei cent of the boys and 10 per cent of the girts have got between 30 and 39 per cent and 2 per cent of the boys and less than 1 per cent of the giris have got less than 30 per cent in the last examination. More number of students have scored marks between 40 and 49 per cent in the last examination.
In the last but one examination, 1 per cent of the boys have got less than 30 per cent; 14 per cent of boys and 9 per cent of the girls have got between 30 and 39 per cent; 40 per cent of the boys and 41 per cent of the girls have got between 40 and 49 per cent. Thirty per cent of the boys and 37 per cent of the girls have got between 50 and 59 per cent and 11 per cent of the boys and 12 per cent of the girls have obtained above 60 per cent. Again in the last but one examination also, they have got between 40 and 49 per cent of marks.
(vi) Reading Habits of the Students
To the question “Do you keep up your reading with the lessons taught in your class ?”, 5 per cent of the boys and 60 per cent of the girls do so ;21 per cent of the boys and 33 per cent of the girls do not do so and 4 per cent of the girls have not responded. It is seen that more number of students have kept up the reading habit of lessons taught in the class.
Asked about their reading habits, 64 per cent of the students studymg in government and government-aided institutions keep up the reading habit of the lessons taught in the class; of them 66 per cent of the students studying in government colleges favour the same opinion. But 36 per cent of the students studying in government-aided colleges do not say so. Large number of students studying in government colleges keep up the reading habit of lessons taught in the class.
Seventy-five per cent of the students studying with relatives keep up the reading habit, 36 per cent of the students staying at hostels do not keep up the reading habit. It is seen that more number of students staying with relatives keep up the reading habit.
When asked whether they follow the subjects taught in the class 69 per cent of the boys and 80 per cent of the girls say yes. Three per cent

of the boys and 2 per cent of the girls find difficulty in understanding the language instruction ; 11 per cent of the boys and 5 per cent of the girls say that teachers do not explain clearly ; 14 per cent of the boys and12 per cent of the girls find subjects as such, difficult to understand. Most of the students follow lessons taught in the class. A very small percentage of students find difficulty in understanding the language of instruction.
(vii) Students’ Occupational Aspirations
The students were asked to ^ve mformatiou about aspirations aad intentions after completing their stodies.
To the question “What occupation would you like to follow after you aotnplete your studies” ? 5 per cent of the boys and 1 per cent of the girls desire to be owners of farm, fishery, dairy, land etc., 2 per cent of the boys desire to be tenant cultivators, peasant proprietors etc., 1 per cent of the boys wish to be manual labourer in agripulture, dairy etc., 9 per cent of the boys and 1 per cent of the girls wish to be proprietor, director, managing agent etc., 2 per cent of the boys and 2 per cent of the girls wish to be owner of retail shop, small business etc., 54 per cent of the boys and 51 per cent of the girls wish to be executives, scientists, professors, doctors, lawyers, etc., 9 per cent of the boys and 25 per cent of the girls desire to be clerks, stenos, school teachers, cashier etc., 1 per cent of the boys desire to be skilled manual workers ; 6 per cent of the boys and 1 per cent of the girls wish to join the armed forces and 5 per cent of the girls wish to choose some other occupation other than these. Large number of students desire to be executives, scientists, professors, doctors etc.
Seventy per cent of the students with different educational background would like to choose group 6 as their occupation, namely executives, scientists, professors, doctors etc., of them 72 per cent of the students whose fathers are college educated also desire so. None of them desire to be a coolie or a peon. Most of the students whose fathers are college educated desire to be executives, scientists, doctors etc.
Further, 66 per cent of the students with different educational background would prefer group 6 namely, executive, scientists, professors, doctors, etc. while only 5 per cent of the students desire to be manual labourer in agriculture etc. and none desire to be a peon or coolie whereas 76 per cent of the students whose fathers are executives, scientists, doctors etc., also desire to be so. Again most of the students whose fathers are executives, scientists etc., desire to be executives, scientists and doctors.
(viii) Students’ Intentions after Completing their Degrees
When asked what they intend to do after college education, 47 per

cent of the boys and 36 per cent of the girls want to continue theireducation, 23 per cent of the boys and 15 per cent of the girls want towork to earn their livelihood but 29 per cent of the boys and 47 per centof the girls do not know what they would do. While more number of boys desire to continue their studies further, more number of girls are undecided on the issue.
Out of the students who desire to continue their studies after their college education, 40 per cent of them are studying in government colleges while 46 per cent are studying in government-aided colleges, 24 per cent of the students studying in government colleges desire to start working to earn their livelihood. Large number of students studying in government- aided colleges desire to continue their studies further.
Further, 34 per cent of the students who desire to start earning or continue their studies feel that their families will financially assist them in their further education and 41 per cent of the students who are hopeful of getting financial assistance from their families are desirous of continuing their studies.
Sixty-six per cent of the students who say that their families are prepared to financially help them for their further education desire to be executives, scientists, professors, doctors etc., on the whole 67 per cent wish to prefer their occupation to others. More number of students who are confident of getting financial assistance from their families desire to be executives, scientists, doctors etc.
When asked what the students desire to do even when their families are unable to help them in their studies financially, 46 per cent of the students would like to continue their studies while 3 per cent of the students who are undecided desire to work. On the whole 34 per cent of the students who wish either to work or continue their studies say that partially their families will help them. It is seen that quite a good number of students are desirous of continuing their studies inspite of getting no help financially from their families.
When those students who either say that they would like or not to continue their studies if no financial help is given by the families were asked about the occupations they would like to choose, 75 per cent of those students who would like to continue their studies inspite of no help financially from their families prefer to be executives, professors, doctors etc. On the whole also 67 per cent of the students would desire so. No students desires to be a peon, coolie or manual labourer in agriculture, but 11 per cent of them would like to *be school teachers, stenos, clerks etc. Most of the students who would like to continue their studies inspite of no help financially from their families desire to be executives, scientists, doctors etc.
While 38 per cent of the students whose fathers are educated upto

middle school are unable to decide to continue or discontinue their studies ;35 per cent of the students whose fathers are college educated would like to continue their studies even after they complete college education and 1 per cent of the students whose fathers are educated in the traditional system would like to earn their livelihood after college education. It is seen that 35 per cent of the students whose fathers are college educated desire to study further.
When further questioned about their preparedness to further their studies inspite of no help from their family, 33 per cent of the boys and 17 per cent of the girls say yes ; 20 per cent of the boys and 34 per cent of ^ e girls say n o ; 35 per cent of the boys and 28 per cent of the girl§ cannot say anything; 3 per cent of the boys and 4 per cent of the girls give no reply. While more number of the boys are not in a {XDsition to say anything, on the question of furthering their studies even when no financial help is given by their families, more number of girls feel that in such a case, they cannot prosecute their studies further.
(ix) Students’ Choice between the Two Persons
When asked for their preference between one who accomplishes things and one who desires to be left alone, 85 per cent of the students prefer and even identify themselves with one who accomplishes things and 86 per cent of the students who desire to be executives, scientists, doctors etc., favour the same opinion. None of the students who would like to be peons, coolies has responded. Further 69 per cent of the students feel that most other students would also say so. Large number of the students who desire to be executives, scientists, etc., like the person who accomplishes things and even identify themselves with such a person.
(x) Status in Society
When asked about their status in society, 82 per cent of the students who desire to earn or continue their studies identify their status with the middle social position ; of them 83 per cent who wish to earn after college education also favour the same opinion. Only11 per cent of the students who wish to continue their education further identify their status with the upper social position more than others. Large number of students who want to earn after college education identify their status with the middle social position.
To the question about identifying their status 100 per cent of the students who desire to be manual labourers in agricultures, 94 per cent of the students who wish to be skilled manual workers and 81 per cent of the students who want to choose different occupations identify their status with the middle social position.

Eighty-seven per cent of the students who find their chances fair in achieving goals in life identify their status with the middle social position. Only 5 per cent of the students who find their chances poor identify their status with the lower social position. Large number of students who find their chances fair in achieving the goals of life identify their status with middle social position.
Similarly 70 per cent of the students, who desire to earn feel it hard to move up in society while 20 per cent of the students who desire to further their studies after college education find it easy to move up in society. It is significant to note that more number of studente who wish to earn after college education find it hard to move up in society while 20 per cent of the students who wish to continue their studies find it easy to move up.
Sixty-nine per cent of the students who wish to be executives, scientists, professors and doctors etc., find it hard to move up in society. Sixty per cent of the students who desire to be manual labourers in agriculture etc., feel it easy to move up in society. It is strange to note that while more number of students who wish to be executives find it hard to move up in society, more number of students who wish to be manual labours find it easy to move up in society.
Further, 71 per cent of the students who find their chances fair feel it hard to move up in society while 19 per cent of the students who find their chances poor feel it easy to move up in society. Again more number of students find their chances fair in achieving the aims of life, find it hard to move up in society.
3. THE STUDENTS’ ATTITUDES TO CASTE AND RELIGION
The students were asked to give information about their views on caste and religion and their impact on the social and public life.
When asked about the attitude and views of college students with references to caste and religion, 72 per cent of the boys and 75 per cent of the girls feel that caste and religion should not play any part in social and public life; 26 per cent of the boys and 60 per cent of the girls feel that they should play their role under certain circumstances. Most of the students do not like caste and religion to play any rde in social or public life.
Further, 55 per cent of the boys and 61 per cent of the girls say that while caste should not play any part in public life, they think that it has an important role to play in one’s personal life; 44 per cent of the boys and 38 per cent of the girls say that caste has no role to play either in public or personal life. Again more number of boys and girls feel that caste has an important role to play in personal life only.

To the question “Have you any close friends belonging to scheduled castes ?”, 45 per cent of the boys and 34 per cent of the girls who do not belong to scheduled castes, have close friends who belong to scheduled cast^ ; 25 per cent of the boys and 42 per cent of girls do not have such friends ; 19 per cent of the boys and 16 per cent of the girls cannot say anything. While more number of boys, belonging to castes other than scheduled castes have scheduled caste friends, more number of such girls do not have close friends belonging to scheduled castes.
When asked whether special facilities provided for scheduled caste studente should be continued, 51 per cent of the boys and 52 per cent of the ^rls feel that special facilities in education only should be provided;13 per cent of the boys and 12 per cent of the girls feel that special facilities in employment opportunity should be given ; 6 per cent of the boys and 5 per cent of the girls want special facilities to be provided regarding political representation while 16 per cent of the boys and 25 per cent of the girls do not give any opinion. More number of students want special facilities in education to be provided for students of scheduled castes.
About the question on caste and religion and their role in society, 82 per cent of the students studying in government colleges feel that caste and religion should not play any part in social and political life while 29 per cent of the students studying in government-aided colleges feel that they should play their role only under certain circumstances. More number of students studying in government colleges want caste and religion, not to play any role in public or social life.
While 52 per cent of the students studying in government colleges do not want caste to play any role either in public or personal life, 52 per cent of the students studying in government-aided colleges feel that it has an important role to play in personal life only though not in public life. More number of students in government-aided colleges feel that caste has an important role to play only in personal life.
About the views of students belonging to different religions on the part played by caste and religion in social and public life 78 per cent of the students feel that caste and religion should not play any role in social or political life ; 100 per cent of Jains say so, while 50 per cent of the Sikhs feel that it must play its role under certain circumstances. Though majority of the students belonging to different religions feel that caste and religion should not play any role in social and public life, all Jain students favour the same opinion.
While 53 per cent of Hindus, 50 per cent of Jains and 100 per cent of Sikhs want caste to play its role only in personal life, 50 per cent of Jains, 47 per cent of Hindus desire that caste should not play its role either in puWic or personal life. More number of Hindu and Sikh

students feel that caste has an important role to play only in personal life.
Fifty-seven per cent of the students staying with parents desire caste to play its role only in personal life and not in political life while 50 per cent residing in hostels desire that caste has no place either in political or personal life. More number of students staying with parents feel that caste has an important role to play in personal life while 50 per cent of those who live in hostels do not think so.
Seventy-nine per cent of the students staying with parents or relatives desire that caste and religion should not play any role in social and political life ; 23 per cent of the students staying in hostels feel that they must play their role only under certain circumstances. Again most of the students staying with parents and relatives feel that caste and religion have no role to play in social or public life.
More number of students with at least a year’s experience of rural life (77 per cent) feel that caste and religion should not play any role in social and public life ; of them, who say so, 78 per cent of the students have one to three years of rural experience ; only 23 per cent of students with some rural experience feel that they have roles to play only under certain circumstances. More number of students with 1 to 3 years of experience of rural life feel that caste and religion have no role to play in public or social life.
Further, 55 per cent of the students who have rural experience feel that while caste has no place in public life, it has an important role to play in personal life, while 45 per cent of the students think that caste has no place either in public or social life ; 53 per cent of the students who have one to 3 years of rural experience feel that caste has an important role to play only in personal life While 47 per cent of such students think that caste has no role to play either in public or personal life. More number of students who have 1 to 3 years of experience of village life think that caste has an important role to play only In personal life.
When asked about their economic status and their views with reference to caste and religion, 78 per cent of the students who get help or not for their further education from their families, feel that caste and religion should not play any part in social and political life; 86 per cent of the students who say that their families will not finance for their further education favour the same opinion while 14 per cent of such students think that caste and religion have roles to play only under certain circumstances, in political and social life. More number of students who do not get any help financially from their families for their education feel that caste and religion have no roles to play in public or social life.
To the question about their educational background and their attitude to caste and religion together, 78 per cent of the students with different

educational background, find that caste and religion have no role to play in public and social life ; 75 per cent of the students whose fathers are barely literate or illiterate favour the same opinion while 30 per cent of the students whose fathers are educated in the traditional sanskritic system, find caste and religion to play their roles only under certain circumstances. Sixty-one per cent of the students whose fathers are educated in the traditional sanskritic system feel that caste has an important role to play only in personal life while 45 per cent of the students whose fathers are educated upto college level, do not think so ; they say that caste has no role to play either in public or social life. It is significant to note that more number of students whose fattiers are illiterate feel that caste and religion do not have any roles to play in public or social life, but more number of students whose fathers are educated in the traditional system feel that caste has an important role to play in personal life only.
To the question about the number of scteduled caste friends they have, 53 per cent of the students whose fathers are illiterate have close friends belonging to scheduled castes ; 31 per cent of students whose fathers are educated upto middle or high school have no such friends. Most of the students whose fathers are illiterates, have close friends belonging to scheduled castes.
Further, 56 per cent of the students with different educational backgrounds feel that special facilities in education only, should be provided to scheduled caste students ; while 40 per cent of the students whose fathers are educated in the traditional system of education feel that none of the facilities like employment opportunity, political representation, etc., should be provided for scheduled castes. More number of students with different educational background desire that special facilities in education should be provided to scheduled caste students.
Again it is seen that 52 per cent of the students who have scheduled caste friends feel that caste has a role to play neither in public nor in personal life ; while 34 per cent of the students who do not have close friends belonging to scheduled castes say that caste has an important role to play only in personal life. More number of students who have scheduled caste friends feel that caste has no role to play either in public or personal life.
When asked about the provision of special facilities to scheduled caste students 52 per cent of the students, who feel that caste and religion have no place in social and public life, say that special facilities in education for scheduled caste students be provided while 20 per cent of the students who either do not want caste and religion to play any role in public or social life or to play their role under certain circumstances, do not like any of the facilities, like employment, political representation etc., to be provided to scheduled castes. More number of students

who say that caste and religion have no roles to play in public or sociftl life want special facilities in education to be provided to scheduled caste students.
Fifty-five per cent of the students, who do not want caste to play any role either in public or personal life, want special facilities in education only, to be provided to scheduled castes while 20 per cent who feel that caste has an important role to play only in personal affairs, do not want any special facilities to be provided to scheduled castes. Again more number of students who do not want caste to play any role in public or personal life, desire that special facilities in education should be provided to scheduled caste students.
Further, 54 per cent of the students who have scheduled caste friends want special facilities in education to be provided for scheduled caste students ; on the whole 18 per cent of the students who have or do not have close friends belonging to scheduled castes do not like any of the special facilities to be given to scheduled castes. Further, more number of students who have close friends belonging to scheduled castes also desire that special facilities in education should be provided to scheduled caste students.
Forty-nine per cent of the students who feel that caste and religion have no place in social and public life, 56 per cent of the students who feel that caste has no role to play even in personal life, 62 per cent of the students who have close friends belonging to scheduled castes, and49 per cent of the students who desire that only special facilities in education should be provided for scheduled castes say that religion has nothing to do In the impfovement of one’s lot in life, while others say that it depends either wholly or partly on religious belief. More number of students who are against caste playing its role in public or personal life feel that religion has nothing to do with the improvement of one’s lot in life.
Sixty per cent of the students who feel that caste and religion have no place in social and public life, 62 per cent of the students who feel that caste has no role to play even in personal lifCj 63 per cent of the students who have close friends belonging to scheduled castes, and 67 per cent of the students who desire that special facilities in education should be provided for scheduled caste students say that persons having good family background and large income are respected. A small percentage (nearly 4 per cent) also respect persons belonging to high castes. More number of students who are against caste playing any role in social or personal life respect the person who comes from a good family, or one who has a large income.
Further, 82 per cent of the students who do not want caste and religion to play any role in public and social life, 84 per cent of those

who like caste to play its role only in personal life, 79 per cent of those who have scheduled caste friends and 79 per cent of the students who feel that special facilities in education should be given to scheduled castes, identify their status with the middle social position. More so, they also feel it hard to move up in society.
Most of the students prefer and identify their own status with the middle social position and find it hard to move up in society, irrespective of their belief in caste, religion, friendship with scheduled caste members etc.
Twenty per cent of the students who feel that caste and religion have no place in social and public life, 20 per cent of those who say that caste has an important role only in personal life, 20 per cent of the students who have friends belonging to scheduled castes and 22 per cent of the students who feel that special facilities in education should be provided for students belonging to scheduled castes, admire those who work well. Their second preference is for those who are active in public and social life, the respectful and the generous in that order. More number of students who are against caste playing its role in public or social life, and who want special facDities in education to be provided to scheduled caste students admire the person who works well.
When asked about the social changes and the students’ capability of exerting pressure on such changes, 81 per cent of the students who do not like caste and religion to play any role in society, 83 per cent of the students who want caste to play its role only in personal life, 84 per cent of the students who have scheduled caste friends, and 84 per cent of the students who want that special facilities in education should be provided for scheduled caste students, feel that changes that are taking place in society are for the better, while nearly 20 per cent of the students with the above said views feel that changes are for the worse. Further 72 per cent of the students who feel that caste and reli^on have no role to play in social and public life ; 58 per cent of those who feel that caste has an important role to play in personal life ; 58 per cent of those who have scheduled caste friends and 58 per cent of those who want special facilities in education to be provided for scheduled caste students feel that they can exert influence on such changes for the better. It is seen that more number of students who are against caste playing any role in public or social life, who want special facilities in education to be provided for scheduled caste students, think that changes that are taking place in society are for the better and are hopeful of exerting pressure on such changes.
On the whole it is seen that majority of the students do not like caste and religion to play any role in public or social life, irrespective

of their rural experience and their friendship with scheduled caste students.
fi) What Determines Respect for Individual
To the question on the view of students who desire to earn or continue their studies after college education about the trait which determines the prestige of a man, 61 per cent of the students respect the highly educated ; 64 per cent of the students who desire to continue their studies favour the same opinion and only 7 per cent of the students who wish to earn after their college education respect persons coming from a high caste. Large number of students who are desirous of continuing their studies feel that high education is a trait which makes for respectability.
To the question about their chances in the achievement of goals in life by the present course of education and their ideas about the traits that determine respect, 62 per cent of the students who feel that their chances are bright in achieving the goals of life respect the highly educated, while only 8 per cent of the students who find their chances are poor respect the person belonging to the high caste. Large number of students who feel that their chances are bright in achieving the goals of life respect the highly educated.
(ii) The Quality the Students Admire Most
Though the college students are equally divided with regard to the qualities they admire most in people, 20 per cent of the students who wish to earn or read further, like the person who does his work well; 19 per cent of the students who desire to continue their studies after college education also say so ; but only 1 i>er cent of the students who are desirous of taking up jobs to earn for their livelihood admire the thrifty. A slightly more number of students who wish to earn or continue their studies admire the person who does his work well.
Seventy-five per cent of the students who desire to be tenant cultivators etc., admire the person who is active in public and social life. Only 1 per cent of the students desirous of taking up different occupations excepting to be peons, coolies etc., admire the thrifty. Large number of students who desire to be tenant cultivators admire the person who is active in social and public life.
(iii) Preference between the Holy Path and Materidistic Way of Life
When asked to choose between the holy path and the materialistic

way of life, 72 per cent of the boys and 73 per cent of the girls prefer the materialistic way of life. While 16 per cent of the boys and 13 per cent of the girls prefer the holy path and 11 per cent of the boys and 14 per cent of the girls are not clear about their choice. Large number of the students prefer the materialistic way of life.
(iv) Religious Faith and Improvement of One’s lx)t in Life
To the question about the belief that religion would help a man to improve his lot in life or not, 12 per cent of the boys and 11 per cent of the girls feel that it wholly depends on religious faith. While 31 per cent of the boys and 33 per cent of the ^ I s feel it partially depends and 41 per cent of the boys and 34 per cent of the girls feel that religion has nothing to do with the improvement of one’s lot in life Ixit 12 per cent of the boys and 22 per cent of the girls do not know. More number of students feel that religious belief has nothing to do with the improvement of one’s lot in life.
To the question about the way of living, 81 per cent of the boys and89 per cent of the girls like to accomplish thmgs, 18 per cent of the boys and 10 per cent of the girls like to be alone and less than 1 per cent of the boys and less than 1 per cent of the girls did not respond. Further they think that 44 per cent of the boys and 36 per cent of the girls feel themselves nearer to the one who accomplishes things while 14 per cent of the boys and 7 per cent of the girls identify themselves with the person who wishes to be left alone ; 73 per cent of the boys and 76 per cent of the girls also think that most other friends would prefer the former but 31 per cent of the boys and 22 per cent of the girls feel that other friends would prefer the latter. Most of the students like the person who accomplishes things and also identify themselves with such a person.
(v) Politicians and the Students
When asked about the attention paid by politicians to the words of the students, 44 per cent of the Ijoys and 41 per cent of the girls say that only a little attention is being paid by them to their words. I ’en per cent of the boys and 8 per cent of the girls say that great deal of attention is being paid and 30 per cent of the boys and 26 per cent of the girls feel that no attention is paid. Large number of students say that only a little attention is being paid to their words by politicians.
Further, 68 per cent of the boys and 90 per cent of the girls have never written to government officials or political leaders ; 29 per cent of the boys and 5 per cent of the girls have sometimes written to them and only 3 per cent of the boys have written to them many times. So it is seen that most of the students have never written to political leaders.

Further, 81 per cent of the students who desire to be executives, scientists, have never written to political leaders regarding their problems while 60 per cent of the students who desire to be tenant cultivators, peasant proprietors etc., have sometimes written. While more number of students who desire to be executives etc., have never written to political leaders, more number of students who wish to be peasant proprietors etc., have sometimes written to them.
When asked about the attitudes and values of students with reference to the rural-urban background, 77 per cent of the students with more than 3 years of rural experience admire most one who works well. Their next preference is for the person who is active in public and social life.
On the whole it is seen that most of the students prefer the materialistic way of life, feel fhat religious belief has nothing to do with the improvement of one’s lot in life, find that only a little attention is being paid to their words by politicians and hence never written to them.
Section IV.B—T he Scheduled Caste Student in the College
1. THEIR INVOLVEMENT, RELATIONSHIP WITH AND VIEWSREGARDING THEIR TEACHERS
Tlie sclieduled caste students were asked to give information, whether they can follow lessons in the class and the role of the students.
When these students were asked whether they are in a position to follow subjects in the class, 77 per cent of the students belonging to sfcheduled castes follow tessons in the class: 8 per cent of them feel difficulty in understanding the language of instruction ; 3 per cent inform that teachers do not explain clearly ; 11 per cent feel that the subjects, as such are difficult to understand and 2 per cent give some other reasons. Most of the scheduled caste students understand the lessons taught in the elass.
When asked further whether these students go to teachers fer help, 57 per cent of the scheduled caste students go to teachers for h d p ; 16 per cent of them have felt no such need ; 25 per cent of thesi hesitate to go to teachers ; and 2 per cent of them specify some other reason. More number of scheduled caste students go to teachers for help in their studies.
When asked about the role of a teacher, 78 per cent of the scheduled caste students say that a teacher should really be like a parent and ensure their all round development while 22 per cent of these students feel that a teacher should primarily be concerned with teachmg his subject in the class room and should not worry about the student behaviour outside the

class room. More number of these students desire teachers to be like parents ensuring all-round development. It is significant to note that majority of the students understand the lessons taught in the class, go to teachers for help in their studies and desire teachers to be like parents.
2. THE GOALS OF EDUCA TION AND THE ROLE OF STUDENTS
When they were asked about their idea of the goals of education, 50 per cent of the scheduled caste students, say that the goal is to turn one into a good citizen; 25 per cent of them say that it is to achieve higher status in society ; 6 per cent of them say that it is to provide economic security while 6 per cent of them say that it is something else other than these. More number of students think that the goal of education is good citizenship.
3. THEIR VIEWS REGARDING CASTE, THEIR ATTITUDESAND VALUES
Scheduled caste students have hereunder given their views about caste, mode of life, way of living, etc. About caste, 74 per cent of the scheduled caste students do not want caste and religion to play any part in public and social life while 27 per cent of them want them to play their role under certain circumstances» More number of these students do not want caste and religion to play any role in public and social life.
Further, 64 per cent of the scheduled caste students feel that caste has no role to play either in public or personal life while 36 per cent of these students feel that caste has an important role to play only in personal life. Again more number of these students do not want caste to play any role in public or personal life.
When asked about the attitude of these students towards mode of life, way of living, etc., 81 per cent of them prefer the materialistic way of life to the holy path ; 58 per cent of these students feel that religion has no place in the improvement of one’s lot in life ; 41 per cent of them feel that politicians do not pay any attention to their words ; 77 per cent of these students want to accomplish things and 77 per cent of the students identify themselves with such a person ; 75 per cent of the students feel that most other friends would also think so ; 56 per cent of these students respect the highly educated ; 77 per cent of the scheduled caste students have never written to politicians and government officials regarding their problems ; 64 per cent of them identify their status with the middle social position ; 67 per cent of them find it hard to move up in society ; 74 per cent of them admire the person who is active in public

and social life ; 84 per cent of them feel that the changes that are taking place in society are for the better as a whole, and 56 per cent of them feel that they can exert influence on these changes. There are of course few exceptions where the percentage of deviations is negligible. It is seen, on the whole that more number of these students do not want caste and religion to play any role in political or social life, prefer the materialistic way of life, have never written to political leaders, admire the person who is active in public and social life, feel that changes that are taking place in society are for the better and are optimistic that they can influence such changes.
Section V — The College Student A nd The College Teacher — A Comparison
1. SOCIAL BACKGROUND
The teachers and students were asked several questions regarding their caste, religion, occupation, etc., and the following is an account of the responses.
Out of 854 college students and 85 college teachers contacted, only 3 per cent of the students belong to scheduled castes but no teacher belongs to scheduled castes ; 23 per cent of the students and 21 per cent of the teachers belong to other backward classes; 33 per cent of the students and 44 per cent of the teachers belong to other castes. More number of teachers and students belong to other castes.
When asked about their religion, 85 per cent of the students and79 per cent of the teachers belong to Hindu religion ; 4 per cent of the students and 5 per cent of the teachers belong to Muslim religion and 7 per cent of the students and 13 per cent of the teachers belong to Christian religion ; less than 1 per cent of the students and 1 per cent of the teachers belong to Jain religion. Most of the students and the teachers are Hindus.
The mother tongue of 54 per cent of the students and 49 per cent of the teachers is Kannada ; of 12 per cent of the students and 6 per cent of the teachers is Konkani; of 2 per cent of the students and 5 per cent of the teachers is M arathi; of 2 per cent of the students and 5 per cent of the teachers is Malayalam ; of 10 per cent of the students and 15 per cent of the teachers is Tamil; of 10 per cent of the students and 8 per cent of the teachers is Telugu ; of 5 per cent of the students and 4 per cent of the teachers is Tulu ; and of 5 per cent of the teachers and 5 per cent of the students is Urdu. The mother tongue of more number of teachers and the students is Kannada.

Further, 67 per cent of the students and 18 per cent of the teachers who grew up mainly in villages have rural experience, while 58 per cent of the students and 44 per cent of the teachers who have not grown upin villages do not have such an experience. While more nuniber ofstudents have experience of rural life, more number of teachers do not have such an experience.
2. VIEWS AND ATTITUDES REGARDING EDUCATION
When asked whether they go to teachers for help in their studies,68 per cent of the students go to teachers for help in their difficulties ;About student-teacher contact 40 per cent of the teachers say that more than 10 students go to Uiem for consultation on personal and academic matters.
To the question about the role of a student, 16 per cent of the students and 28 per cent of the teachers say that students should be concerned only with studies ; 22 per cent of the students and 35 per cent of the teachers say that students should devote time to household duties ;36 per cent of the students and 33 per cent of the teachers say that students should devote time to welfare work also ; 7 per cent of the students and only 2 per cent of the teachers desire students to take part in politics also. More number of students and teachers desire students to devote time to household duties.
Further, 6 per cent of the students and 7 per cent of the teachers say that the goal of education is to provide economic security ; 10 per cent of the students and 2 per cent of the teachers say that it is to achieve higher status; 31 per cent of the students and 42 per cent of the teachers say that it is to be a cultured person ; 52 per cent of the students and 45 per cent of the teachers say that it is to be a good citizen. More number of students and teachers say that the goal of education is to be a good citizen.
3. ATTITUDES AND VALUES IN GENERAL
To the question on their preference between the holy path and the materialistic way of life, 15 per cent of the students and 18 per cent of the teachers prefer the holy way of life whereas 73 per cent of the students and 56 per cent of the teachers prefer the materialistic way of life. More number of students and teachers prefer the materialistic way of lie.
When asked whether religious belief plays an important role in the improvement of one’s lot in life, 12 per cent of the students and 18 per cent of the teachers say that it wholly depends on religious faith ; 32 per

cent of the students and 22 per cent of the teachers say that it partially depends on religion whereas 37 per cent of the students and 48 per cent of the teachers say that religion has nothing to do with the improvement of one’s lot in life. More number of students and teachers feel that religious belief has nothing to do with the improvement of one’s lot in life.
To the question about the attention paid by politicians to theu: words,9 per cent of the students and 5 per cent of the teachers say that a great deal of attention is given by politieiana to their words ; 11 per cent of the students and 44 per cent of the teachers say that only a little attention is given whereas 30 per cent of the students and 33 per cent of the teachers say that no attention is given. Mere number of teachers and students feel that only a little attention is §^ven to their words, by pQliticians.
Further, 84 per cent of the students and 91 per cent of the teachers like to accomplish things while 15 p«r cent of the students and 6 per cent of the teachers wish to be left alone; 44 per cent of the students and 85 per cent of the teachers identify themselves with one who accomplishes things while most of the rest have not responded ; 71 per cent of the students and 76 per cent of the teachers feel that most others would also say so. Most of the teachers and the students like the person who accomplishes things and even identify themselves with such a person.
When asked about the trait that determines respect, 69 per cent of the students and 67 per cent of the teachers respect the highly educated, whUe 17 per cent of the students and 9 per cent of the teachers respect persons who have a good family background. More number of teachers and the students respect the highly educated.
Again, 78 per cent of the students and 67 per c^nt of the tsachers have never written to political leaders while 19 per cent of tl^ s t i n t s and 24 per cent of the teachers have sometimes written to theip ; 2 per cent of the teachers and 1 per cent of the students have written mway times to them. Most of the teachers and the ^udents have never writleqt to political leaders.
When asked about their own status in sofiety, 82 per cejit the students and 80 per cent of the teachers identify their static with middle social position ; 9 per cent of the students and 8 per cent of t ^ teachers identify their social position with the upfier social position; 70 per cent of the students and 61 per cent of the teachers find it hard to move up in society ; 16 per cent of the students and 14 per cent oi the teachers find it easy while 14 per cent of the sti«imts and 14 per cent ©1 the teachers are not in a position to say anything. Mo»t of tte teaebeis and students identify their status with the middle social position in society and find it hard to move up in society.
To the question about the qualities admired most in people, 20 per

cent of the studejits and 5 per cent of the teachers admire one who is active in public and social life ; 19 per cent of the students and 69 per cent of the teachers admire one who does his work well; 17 per cent of the students and 4 per cent of the teachers admire the ambitious ; and 16 per cent of the students and 9 per cent of the teachers admire the respectful. While more number of teachers admire one who works well, more number of students admire one who is active in public and social life.
4. COLLEGE STUDENTS AND SECONPARY STUDENTS —A COMPARISON
Greater number of secondary school students are in the age group of 14 to 16 years, whereas in the colleges more girls are in the age group of 17 and 19, and more boys are in the age group of 20 and 25 years. Majority of the students in both colleges and secondary schools belong to other castes, whereas 16 per cent of the college students and 20 per cent of the high school students belong to backward classes. Majority of them both in colleges and high schools are Hindus, have rural experience, do not know the education of their grandfathers, and their fathers are educated upto middle or high schools with the exception of college girls whose fathers are educated upto college. The occupational background of the majority of urban students in secondary schools is executives, scientists, professors etc., whereas those of non-urban students in secondary schools and majority of the college students is ownership of farms, fishery, dairy etc.
Kinship affiliations are stronger among students of both the institutions since majority of them live either with parents or relatives.
Majority of the students of both high schools and colleges do not get much help for their studies from the members of their families, they do not encourage private coaching classes and do not engage tutors. The goal of education for college and secondary school boys is good citizenship whereas for girls of colleges and secondary schools it is to become a cultiired person and to provide economic security. In case of further studies of students majority of the parents of both college and secondary schools are prepared to finance for their education. Greater number of students of both college and secondary schools expect that their teachers should be like parents ensuring them of all round development. Majority of the secondary school students and college girls feel that students should devote time to household duties, whereas college boys want them to devote time for welfare work. Again they think that the present course of education will help them in achieving their aims of life and also think that chances are favourable for achieving those objectives.
About the reading habits majority of students of colleges and high

schools keep up their habits of reading at home. With reference to the medium of instruction, more number of students in colleges feel that the language of instruction is difficult to follow, but more number of high school students say that the subjects as such are difficult to follow. Regarding occupational pursuits both college and secondary school students feel that they should become executives, scientists, doctors, etc.. Their second preference is to become stenos, clerks, school teachers, etc.
Parents of secondary school students who are educated upto primary school want their children to start working and earning after their education, whereas the parents who are educated upto middle or high school want their children to continue their studies. In the colleges parents students who are educated upto middle or high schools want their children to earn after their education but parents who are educated upto college want their children to continue for further studies. Both college and high school students who want to earn, identify their status with the middle social position, but those who want to continue their studies identify their status with the upper social position. Both college and high school students respect the highly educated and feel that only little attention is paid to their words by politicians. Most of them feel that caste and religion have no role to play in social and public life, with the exception of those who stay with their parents who say that caste has an important role to play only in personal life. Greater number of students in colleges and schools admire those who are active in public and social life and feel that the changes taking place in society are for the better and that they could exert their influence on such changes.

THE PROFESSIONAL COLLEGE
Section 1— Introduction
?«iHE PROFESSIONAL colleges are meant to give technical education to * tite students. They play an important role in the development of the
The economic improvement of the society depends much on the type of instruction received by the students in these colleges. They toi^ist cA engineering colleges, medical colleges and polytechnics. Majority d ^em are sponsored by the Government with the exception of a few which are sponsored by the private organizations. Just as in the non-professional colleges, the University controls the academic matters of Aeie institutions except in the polytechnics which are controlled by the IMrector of Technical Education in the state. Instruction in medicine and tecdinology is imparted in these professional cdleges leading to degrees in medicine and engineering respectively, whereas in the polytechnics, instruction is given in various subjects of technological interest such as electroplating, sheet metal work, draughtsmanship, bleaching, dyeing, etc.
Instruction in these institutions is given in English and the students and teachers from various castes, religion and economic strata have taken advantages of these institutions for learning and in turn have contributed to the development of the country. For purposes of understanding their attitudes and aspirations students and teachers from 2 engineering colleges, 2 medical colleges and 2 polytechnics are selected. Out of these 130 students, 9 teachers and 2 heads are from engineering colleges, 95 students, 12 teachers and 2 heads are from the polytechnics and 131 students, 10 teachers and 2 heads are from the medical colleges. There are several facilities for the study of several technical subjects in the laboratories. Teaching is followed by demonstration and experiment methods.
Section II—Professional College Teacher
1. THEIR SOCIAL BACKGROUND
The professional college teachers were asked to give Information regarding their age, caste, religion, occupation etc. Out of the 31 pro

fessional college teachers contacted, 4 teachers are in the age group of 20 and 25 years; 1 in the age group of 26 and 30 years ; 9 in the age group of 31 to 35 years ; 4 in the age group of 36 to 40 years; 3 in the age group of 41 to 45 years ; 2 between 46 to 50 years; 2 between 51 and 55 years ; and 6 aged over 56 years; 1 lady is between 36 and 40 years while 2 are between 51 and 55 years ; more number of teachers are in the age group of 31 and 35 years.
When asked about their caste, 3 teachers say that they belong to other backward classes; 16 to other castes ; 4 do not belong to either of these castes or scheduled castes. More number of teachers belong to other castes.
All the professional college teachers are Hindus. One lady teacher is a Christian.
The mother tongue of 13 teachers is Kannada ; of 2 is Konkani; of1 is Marathi; of 1 is Malayalam ; of 10 is Tamil; and of 4 is Telugu. More number of teachers speak Kannada.
Mentioning the economic circumstances under which the teachers grew up, 5 teachers grew up under stringent circumstances ; 16 male and2 female teachers under average economic circumstances; 7 male and 1 female teachers under well-of! circumstances. More number of teachers have grown up under average economic circumstances. About the occupational background, the grandfathers of 9 male and 1 female teachers are owners of farm, etc ; of 5 teachers relates to group 2, namely tenant cultivator, peasant proprietor etc ; of 1 teacher is group 3, namely manual labourer in agriculture etc ; of 2 male and 1 female teachers is group 5, namely owner of small business etc ; of 3 male and 1 female teachers is group 6, namely executives, scientists etc ; of 6 teachers is group 7, namely ordinary administrative staff etc ; and of 4 teachers is group X, namely other occupations. The fathers’ occupation of 6 male and 1 female teacher is group 1, namely owner of farms, dairy, etc ; of 2 teachers is group 2, namely tenant cultivator etc ; of 1 teacher is group 4, namely proprietor, director, managing agent etc ; of 1 teacher is group 5, namely, owner of small business etc ; of 14 male and 1 female teachers is group 6, namely executives scientists etc ; of 6 male and 1 female teachers is group 7, namely ordinary administrative staff and of 2 teachers is group X, namely other occupations. The occupation of more number of grandfathers of these teachers is ownership of farm, dairy, etc., whereas that of fathers of more number of teachers is group 6, namely executives, scientists etc.
When asked about tiieii educational background, the grandfathers of 6 teachers are barely Hterates ; grandfathers of 4 teachers are educated upto primary school; grandfathers of 9 male and 2 female teachers are educated upto middle or high school; grandfathers of 3 male and 1

female teachers are college educated, and grandfathers of 9 teachers are educated in the traditional sanskritic system. The grandfathers of more number of teachers are educated upto middle or high school or educated in the traditional system.
The fathers of 3 teachers are barely literate ; fathers of 4 teachers fire educated upto primary school; fathers of 12 male and 1 female teachers are educated upto middle or high school; and fathers of 12 male and 2 female teachers are college educated. The fathers of more number of teachers are educated upto college level.
About rural-urban background, 11 teachers were schooled at a smaller place than a tehsil; and 16 male and 3 female teachers were schooled at a bigger place. Further 5 teachers mainly grew up in a village ; 6 in a town ; 13 male and 3 female teachers in a city and 8 teachers in a city and 8 teachers in a mixed environment. More number of teachers were schooled at a bigger place than a tehsil or taluka town.
When questioned about their income from various sources, 4 teachers earn by giving private tuitions ; 26 male and 3 female teachers say that they do not give private tuitions ; 5 teachers earn a salary upto Rs. 2,400/- per annum; 3 teachers earn between Rs. 2,401/- and Rs. 3,600/-1 6 teachers earn between Rs. 3,601/- and Rs. 4,800/-, 6 teachers earn between Rs. 4,801/- and Rs. 6,000/- per annum ; 3 teachers earn between Rs. 6,001/- and Rs. 8,000/- ; 2 teachers earn between Rs. 8,001/- and Rs. 10,000/- 4 male and 3 female teachers earn between Rs. 10,000/- and Rs. 15,000/-; 2 teachers earn over Rs. 15,000/- per annum. Further, 18 teachers do not have any other source of income ; 2 teachers earn upto Rs. 5,00/- per month apart from the salary ; 2 teachers earn between Rs. 500/- and Rs. 1,000/- per month ; 1 teacher earns between Rs. 1,001/- and Rs. 1,500A ; 8 male and 3 female teachers earn over Rs. 1,501/- per month. It is seen that more number of teachers do not give private tuitions; more number of teachers earn between Rs. 10,000/- and Rs. 15,000/- per annum ; and also earn over Rs. 1,501/- per month from other sources. It is seen that more number of teachers teaching at professional colleges are in the age group of 31 to 35 years, belong to other castes, are Hindus, speak Kannada and have grown up under average economic circumstances.
2. THE PROFESSIONAL EQUIPMENT OF THE COLLEGETEACHERS
The teachers were asked to give information about their academic and professional achievements.
When asked about their academic qualifications, 17 teachers are bachelor’s degree holders ; 5 are master’s degree holders ; 2 male and 1

female teachers are doctorate degree holders ; and 8 male and 2 female teachers have got a degree or diploma of a foreign University. Again, 14 male and 2 female teachers teach all the subjects they studied ; 6 teachers teach only some, 2 male and 1 female teachers do not teach any subject they studied. It is significant to note that more number of teachers are bachelor degree holders and teach all subjects they studied. To the question on the way the time is spent by these teachers, 10 male and2 female teachers teach mostly ; 1 teacher engages himself in research ;21 male and 1 female teachers spend time in both research and teaching. More number of teachers spend theit time iiv both lesearch and teaching.
About their publications of articles, 16 male and 3 female teachers have contributed articles; and others have not responded to the question. More number of teachers have contributed articles.
Treatises and research papers have been published by 3 teachers whereas others have not responded to the question. More number of teachers have not answered, when asked whether they have published any research papers or treatises.
Six male and 3 female teachers have read papers at professional and academic bodies ; 22 teachers have not done so and 3 teachere have not responded. More number of teachers have not read papers at professional and academic bodies.
To the question “Have you served as professional consultant to industry or any organlza,tion or the state or Central Government” ?13 male and 2 female teachers say that they have acted as consultants to industry, state or Central Government; while 16 male and 1 female teachers have not been so. More number of teachers have not acted as consultants to industries etc.
Eleven male and 1 female teachers have 5 or less than 5 years of teaching experience ; 12 teachers have 6 to 10 years of teaching experience ; 12 teachers have 6 to 10 years of teaching experience ; 3 male and 2 female teachers have put in 11 to 15 years of service as teachers;3 teachers have 16 to 20 years of teaching experience and 2 teachers have more than 21 years of teaching experience. More number of teachers have less than 10 years of teaching experience.
It is significant to note that greater number of teachers are bachelor degree holders, spend their time in research and teaching, have contributed articles and have less than 10 years of teaching experience.
3. HOW DID THEY COME TO THE PROFESSION AND HOW DO THEY VIEW THEIR PRESENT STATUS
The following paragraphs give an account of the teachers’ intention

of taking to teaching only as their career of their occupational status, etc "I
Nine teachers have not pursued any occupation other than teaching at any time of their career ; 13 teachers had pursued some other occupation betoie they took to teaching; 2 teachers had pursued some other occupation between two teachhig jobs ; 7 male and 3 female teachers have been doini it or have done it, along with teachiiig. More number of teadiers have pursued some occupation other than teaching before they took to this profession.
To the question “Before you took to teaching as a caieei, did you wish to choose any other occupation ?”, 11 male and 1 feriiale teachers desired to choose some other occupation; 13 male and 2 female teachers did not like to choose another occupation, and 7 teachers are not in a position to say anything. More number of teachers say that they did not like to choose any other occupation, other than teaching.
When they were asked to compare their present occupational status with that of their fathers, 17 male and 2 female teachers feel their status W ^er than that of their fathers ; 4 teachers feel their status lower than fheir fathers and 10 male and 1 female teachers feel it similar. More number of teachers rate their occupational status higher than that of their fathers. While 16 male and 2 female teachers say that they have a sense of participation in the formulation of courses ; 14 male and 1 female teachers say no ; whereas one teacher has not responded. More number of teachers say that they have a sense of participation in the formulation of courses.
About their own status in society, 3 teachers identify their status with the upper social position ; 24 male and 3 female teachers identify their Status with the middle social position and 2 with the lower social position ; further, 5 teachers find it easy to move up in society ; 22 male and 2 female teachers find it diflBcult or hard to move up in society. More number of teachers identify their status with the middle social position and find it hard to move up in society. It is significant to note that more number of teachers had pursued another occupation before they took to teaching, rate their occupational status h i^ e r than that of their fathers and identffy
status with the middle social position.
4. THEIR INVOLVEMENT IN THE PROFESSION AND PROFESSIONAL ACHIEVEMENTS
The teachers here ^ve flie number of hours they teach in a week, the classes they handle, and tlieir participation in national and International Academic Societies.
To the question “What classes do you teach at present?”, 19 male

and 3 female teachers teach the undergraduate classes ; 2 teach ttie post-graduate classes ; 11 teachers teach both the undergraduate and the postgraduate classes. About the hours of work these teachers have, S teachers have less than 5 hours per week ; 6 teachers work for 5 to ^ hours per week; 14 male and 1 female teachers work for 9 to 12 hours per week; 1 male and 1 female teacher have 13 to 16 hours per weejf;4 male and 1 female teachers have 17 to 20 hours per week and 10 teachers have more than 20 hours per week. Majority of the teachers teach the undergraduate classes and work for 9 to 12 hours per week.
When asked about their membeiship o! academic organiiations, 16 male and 1 female teachers af© not menibers of suc^ bodies; 4 lechers are members of state organiiations; 8 male and 2 female teachcis ^ members of national academic organizations; and 4 teachers 8#e members of international organizations. More number of teachers are not members of organizations like the Indian Science Congress or Indian Economic Conference. It is seen that more number of teachers teach Ae undergraduate classes, work for 9 to 12 hours per week and are not members of national academic bodies or societies. To understand the teachers involvemeiit in the firofession they were asked about their #swe to change their profession.
When asked whether they desired to change their present profession,5 teachers said yes; 3 teachers think it is too late to change ; and 33 male and 3 female teachers say that they do not want to change. Majority ef the teachers are not desirous of changing their present profession,
3. f^ m r^ ss iO N A L m L A n o N m w s
teachefs have given mformation about the staff meetings, their pfroceedings, etc., in thek institution.
About the holding of staff meetings, 7 teachers say that staff msfltfcyfs are held regularly; 17 male and 2 female teachers say that meetw^^ mp heM as and when required; and 7 male and 1 -female teachers Jiiiit no such meetings are held. More number of teachers say th it meetings are held as and when required.
Further, 12 male and 1 female teachers feel free to discuss jssist often at these meetings ; 10 male and 1 female teachers sometimes discuss school matters at these meetings ; 1 teacher seldom discusses whereas 1 m^e and 1 female teachers never discuss school matters at these meetings. Again more number of teachers feel free to discuss most often, school matters, at the^ staft meetings.
When asked about teaeher-student contact, 8 male and 1 female teachers say that 1 to 5 students go to Aem for consultation ; 3 male and 1 female teachers say that ^ to 10 students go to them for consultation;

whereas 20 male and 2 female teachers say that more than 10 students go to them for consultation in times of difficulty on academic and personal matters. More number of teachers have established better student-teacher contact than others. It is significant to note that staff meetings are held as and when required, and more number of teachers feel free to discuss most often, these school matters at staff meetings and have established better student-teacher contacts.
6. THE COLLEGE TEACHERS’ EDUCATIONAL OUTLOOK
In the following paragraphs the teachers have recorded their views regarding the goal of education, role of a student, the introduction of the tutorial system etc.
The goal of education according to 9 male and 3 female teachers is to provide economic security; 2 teachers feel that it is to achieve higher status ; 5 teachers feel that it is to be a cultured person ; and 17 teachers feel that it is to be a good citizen. Eight male and 1 female teachers are of the opinion that the present course of education will not inculcate any sense of values in the younger generation; 18 male and 2 female teachers only partially agree with this statement whereas 4 teachers completely disagree ; 1 teacher is not in a position to say anything. More number of teachers feel that the goal of education is good citizenship, and partially agree with the view that the present system of education does not inculcate any sense of values in the younger generation.
About the role of a student, 12 male and 1 female teachers desire that students should be concerned only with studies ; 7 male and 1 female teachers desire students to devote time to household duties: 13 teachers want students to take interest in politics also. More number of teachers desire students to devote time to studies only or welfare work. Stating the purpose of undergraduate study, 12 male and 1 female teachers give first priority to simplify the ideas in the subject in order to help the student to understand better; 13 male and 2 female teachers mention that they try to introduce the student to methods of analysing, understanding, and integrating information; 4 teachers try to give the student the maximum information in the subject possible. Second priority is given by most of the teachers, (14 male and 1 female) to simplify the ideas in the subject matter and the III priority, to give more information (20 male teachers and 1 female teacher). It is significant to note that more number of teachers give first priority to introduce the student to the methods of analysing, understanding and integrating information. Their second preference is for the simplification of ideas in the subject matter.
When asked about the utilization of time by the college teacher, first priority is given by most teachers (19 male and 1 female) to

research and advancement of knowledge ; 19 male and 1 female teachers give their second priority to class-room teaching; 10 male and 2 female teachers spend their time mostly in teaching ; 1 teacher in research ; 21 male and 1 female teacher in teaching and research. They give first priority to both research and teaching (17 male and 2 female) ; their second priority is for research only (13 male and 2 female) and the third priority to teaching (16 male and 1 female teachers). It is significant to note that most of the teachers give first priority to research and advancement of knowledge and spend their time in research and teaching.
Meutioaiag the benefits of the introduction of the tutorial system in bringing student and teacher closer, 16 male and 3 female teachers think that tutorials have brought the teacher and the taught, closer. Twelve teachers feel that it has served the purpose to an extent whereas 3 teachers do not think so. More number of teachers feel that the introduction of the tutorial system has brought the teacher and the student closer.
Stating then: idea about the medium of instruction in college classes, no teacher wants the regional language to be the medium of instruction ; only one teacher wants Hindi while 30 male and all female teachers want English only to be the medium of instruction. Further most of the teachers (30 male and all female) say that most of the students follow English—the medium of instruction ; only one teacher says some understand it. When asked whether they would be able to teach in Hindi or some other language other than English, 18 male and 1 female teachers say that they can’t teach in any language otiier than Engjish; 9 male and 1 female teachers say that it is possible with some effort; only 3 teachers feel it possible to teach in languages other than English ; 11 male and 1 female teachers think that the difficulty regarding text books in making the regional language the medium of instruction can be solved if the effort is made ; 9 male and 1 female teachers do not think so ; only3 teachers are confident that the problem could be solved. Majority of the teachers want E n^sh to continue as the medium of instruction and find it very difficult to teach in some language other than English.
It is significant to note that more number of teachers feel that goal of education is good citizenship, spend most of their time in research and teaching, feel that the introduction of the tutorial system has brought the teacher and student closer and want English only to be the medium of instruction in Colleges. About the image of students, more number of teachers feel students drifting (17 male and 2 female), negligent (18 male and 2 female), capable of independent thought (19 male and 2 female), indisciplined (15 male and 2 female) and deferential (23 male and 1 female teachers) whereas the rest find them purposive, studious,

iOG&pable of independent thought, disciplined and unrespectful. More nUBil^r of teachers attribute only negative qualities to the students.
When asked about caste and performance, 13 male and 1 female tfiHheis feel that students belonging to upper castes do better in their ItlMiies; 7 teachers do not think so. Ten male and 2 female teachers Sfly that it is not the case with certain religious groups ; only 4 male and 1 teachers say that students belonging to certain religioi^ groupsdo b ^ e r in studies than others, while 13 male and 1 female teachers Wi*l say anything; further 14 male and 2 female teachers say that it is not true that certain linguistic groups do better in their studies than othsrs; only 4 teachers say that students belonging to certain linjguistic groups do better than others, in studies and 13 male and 1 female teschsrs are not in a position to say anything. It is seen that more number of teachers feel that students belonging to certain upper castes do better in studies than others; but they do not share the same opinion with reference to certain religious and linguistic groups. It is significant to note that more number of teachers partially agree with the view that the present course of education does not inculcate any sense of values in the younger generation, desire to introduce students to methods of analysing and understanding information, and want English to continue as the medium of instruction.
Professional College Students
1. THEIR SOCIAL BACKGROUND
The students are asked to give information regarding their age, sex, caste, occupational and educational background, their kinship relationship etc., in order to understand the students attitude towards education and life.
Out of 356 professional college students, 77 per cent of the engineering students and 3.19 per cent of the polytechnic male students are in the age group of 14 and 16 years ; 5.38% of the engineering, 53.19% of the polytechnic male students and 100% of the polytechnic lady students are in the age group of 17 and 19 years ; 30.4% of the male and 73.08% of the female medical students, 50% of the engineering students, and 38.3% of the polytechnic students are in the age group of 20 and 22 years; 52.3% of the boys, and 23.08% of the girls studying in medical coUege, 32.2% of the engineering students and 4.2% of the polytechnic students are in the age group of 23 and 25 years; 10.4% ©f the boys and 3.8% of the girls studying in medical coltege, and 8.4% of the engineering boys are aged between 26 and 28 years; 4.7% of the aiedical boys and 77% of the engineering boys are in the age group of

29 years and above. Greater number of students are in the age grQ\ > of 20 and 22 years.
Stating their caste, 10.1% of students belonging to the professioosl colleges are scheduled caste students ; of them 13% of the engio^i;]^ students are scheduled caste male students ; 15.3% of the girls sti|(iyiiig in medical college are also scheduled caste students. While 37.1% of the male and 7.6% of the female medical students, 22.3% of the engineeriog students, 25.63% of the male and 100% of the girl polytechnic students belong to other backward classes, 31.4% of the male and 50% of the female medical students, 36.9% of the engineering students, and 59.5% of the polytechnic st\idents belong to other castes. It is seen that fflCMre number of professional college students belong to other castes.
The mother tongue of all lady students studying in polytechnic is Bengali; that of 1% of the polytechnic and 3.8% of the lady students is English ; of 1% of the polytechnic and 4.6% of the engineeyiim students is Gujarati; of 1% of the male and 3.8% of the female medical students, 3% of the engineering students and 1% of the polyteclittic. students is H indi; of 47.5% of the male and 30.7% of the female medical students, 45.3% of the engineering students, and 64.8% of polytechnic students is Kannada, of 8.5% of the male and 11.5% of th© female medical students, 3% of the engineering students and 3.1% of the polytechnic students is Konkani; of 2.8% of the male and 3.8% of the female medical students, 7.6% of the engineering and 3.1% of the polytechnic students is Marathi; of 3.8% of the male and 7.6% of the female medical students, 4.6% of the engineering and 1% of the polytechnic students is Malayalam; of 2.3% of the engineering students is Punjabi; of 2.3% of the engineering students and 3.8% of the k4y medical students is Sindhi; of 10.4% of the male and 15.3% of the female medical students, 12.3% of the engineering and 13.8% of the polytechnic students is Tam il; of 12.3% of the male and 3.8% of the female medical students, 12.3% of the engineering and 12.7% of the polytechnic student is Telugu; of 6.6% of the male and 11.5% of the female medical students, and 2.1% of the polytechnic students is Tulu; qf 4.7% of tbe male and 3.8% of the female students, 2.3% of the engineering and 3.1% of the polytechnic students is U rdu; of 1.9% of the medical, 1.5% of the engineering and 2.1% of the polytechnic students is !|onie lanpage other than those mentioned. Majority of the professional college students speak Kannada.
To the question “Have you had any experience of rural life?” 77.1% of the male and 69.2% of the female medical students, 75.3% of the engineering and 67.2% of the polytechnic students say that the^ have rural experience; 21.9% of the male and 30.7% of the female medical students, 23.8% of the engineering and 31.9% of the polytechnic

students say that they do not have any rural experience; 19% of the medical, 7% of the engineering and 1.96% of the polytechnic students have not responded to the question. Greater number of students have experience of village life.
The grandfathers of 34.2% of the male and 23% of the female medical students, 23% of the engineering and 23.4% of the polytechnic students are illiterates or barely literates ; grandfathers of 20.9% of the male and11.5% of the female medical students, 23.8% of the engineering and 19.1% of the polytechnic students are educated upto primary school; the grandfathers of 21.9% of the male and 11.5% of the female medical students, 16.9% of the engineering and 22.3% of the polytechnic students are educated upto middle or high school; grandfathers of 7.6% of the male and 15.3% of the female medical students, 17.6% of the engineering and 14.8% of the polytechnic students are college educated while grandfathers of 6.6% of the male and 11.5% of the female medical students, of 6.9% of the engineering and 8.5% of the polytechnic students are educated in the traditional sanskritic system; and 100% of the female polytechnic students say that their grandfathers are college educated. More number of professional college students say that their grandfathers are illiterates. The only lady student studying in polytechnic says her grandfather is college educated.
When the students were asked about the education of their fathers, 12.3% of the male students in medical college, 10.7% of the engineering and 5.3% of the polytechnic students said that their fathers are illiterates or barely literate ; 16.1% of the male and 7.6% of the female students in medical college, 13.8% of the engineering and 10.6% of the polytechnic students say that their fathers are educated upto primary school; 36.1% of the male and 34.6% of the female medical students, 25.3% of the engineering and 42.5% of the polytechnic students say that their fathers are educated upto middle or high school; 31.4% of the male and 50% of the female medical students, 44.6% of the engineering and 34.04% of the polytechnic students say that their fathers are educated in the traditional system of education. While the grandfathers of greater number of students are illiterates, the fathers of these greater number of students are educated in the traditional system of education or educated upto middle or high school.
The occupation of the grandfathers of 38.1% of the male and 42.3% of the female medical students, 40% of the engineering and 35.3% of the polytechnic students is ownership of farm, dairy, fishery, etc. ; of 2.8% of the male and 3.8% of the female medical students, 6.9% of the engineering and 4.2% of the polytechnic students is group 2, namely tenant cultivator, independent fisherman, etc., of 16.1% of the male and 3.8% of the female medical students, 3.8% of the engineering and 4.2%

of the polytechnic students is group 3, namely manual labourer in agriculture, dairy etc., of 4.7% of the male and 7.6% of the female medical students, 6.1% of the engineering and 4.2% of the polytechnic students is group 4, namely, proprietor, director, big businessman, etc., of 13.3% of the male and 7.6% of the female medical students, 8.4% of the engineering and 8.5% of the polytechnic students is group 5, namely owner of small business etc., of 7.6% of the male and 7.6% of the female students of medical college, 16.1% of the engineering and 10.6% of the polytechnic students is group 6, namely executive, scientists, professors, etc., of 6,6% of the male and 11.5% of the female medical students, 6.15% of the engineering and 10.6% of the polytechnic students is group 7, namely ordinary admbiistrative staflf etc., of 1.9% of the male and 3.8% of the female medical students, .77% of the engineering and 1.08% of the polytechnic students is group 8 namely, skilled manual workers etc., and of .77% of the engineering student is group 9, namely peon, cooly, etc. The grandfathers of more number of professional college students are owners of farm, dairy, land etc.
The occupation of the fathers of 24.7% of the male and 7.6% of the female medical students, 20% of the engineering and 18.09% of the polytechnic students is ownership of farm, dairy, fishery etc., of 3.8% of the medical, 3.8% of the engineering and 4.2% of the polytechnic boys is group 2, namely tenant cultivator, etc., of 7.6% of the medical boys, 2.3% of the engineering and 3.1% of the polytechnic students is group 3, namely manual labourer in agriculture, dairy etc., of 8.5% of the male and 15.3% of the female medical students, 12.3% of the engineering, 6.3% of the male and 100% of the female polytechnic students is group 4, namely proprietor, big businessman etc., of 13.3% of the male and 3.8% of the female medical students, 5.3% of the engineering and 8.5% of the polytechnic students is group 5, namely owner of small business, etc., of 23.8% of the male and 46.1% of the female medical students, 39.2% of the engineering and 34% of the polytechnic students is group 6, namely executives, scientists etc., of 8.5% of the male and 11.5% of the female students in medical cdllege, of 8.4% of the engineering, and 13.8% of the polytechnic students is.' group 7, namely ordinary, administrative staff, etc., of 4,7% of the male and 7,6% of the female medical students is group 8 namely, skilled manual workers etc., and of 1.06% of the polj^echnic students is group 9, namely cooly, peon etc. It is seen that while grandfathers of greater number of students are owners of farm, dairy, fishery etc., the fatters of more number of students are excutives, scientists etc.
When the students were asked whether their families would financially help them for their further education, 32.3% of the male and 26.9% of the female medical students, 36.9% of the engineering, 23.4% of the

male and 100% of the female students of polytechnic said that their families will finance for their further education; 32.3% of the male and 19.2% of the female medical students, 32.3% of the engineering and 40.4% of the polytechnic students answer in the negative ; 22.8% of the male and 30.7% of the female medical students, 14.6% of the engineering and 19.15% of the polytechnic students say that their families would partially finance for their further education ; 10.4% of the male and 15.3% of the female medical students, 6.9% of the engineering college students, and 17% of the polytechnic students are not in a position to say anything. A slightly greater number of students inform that their families are not in a position to finance for their furtfeir educatiOB.
The students were asked to inform, whether they were in receipt of any fee concessions; 9.5% of the male and 15.3% of the medical students, 16.9% of the en^neering and 2% of the polytechiuc students say that they receive freeships; 1.5% of the engineering 3.1% of the polytechnic students say that they tried for fee concessions but did not get i t ; 2.1% of the polytechnic students did not even try though they were in need of it, and 1.5% of the engineering college students are not in need of any fee concessions but 90% of the medical students, 8.03% of the engineering and 92.5% of the polytechnic students have not responded to the question. Further 7.6% of the male and 16.3% of the female medical students receive monetary help from relatives ; 13% of the engineering and 4.2% of the polytechnic students also receive such help; 3.8% of the male and 3.8% of the female medical students, 6.9% of tiie engineering wid 3.1% of the polytechnic students receive no such help. Most of these students have not responded.
To the question “Do you receive any financial assistance from Government?” 5 per cent of the male and 12 per cent of the female medical students, 9 per cent of the engineering and 1 per cent of tbei polytechnic students receive such a help; 7 per cent of the polytechnic students do not receive any such help.
Again 89 per cent of the medical, 80 per cent of the engineering, and 87 per cent of the polytechnic students have not responded.
Further, 4 per cent of the male and 4 per cent of the female medipal students, 7 per cent of tlie engineering and 3 per cent of the polytechnic students find the assistance adequate; 2 per cent of the male and 4 per cent of the female medical students, 5 per cent of the engineering aod 1 per cent of the polytechnic students find it partially so, whereas 4 per cent of the lady medical students and 3 per cent of the male medical students, 3 per cent of the engineering students feel it inadequate. While 91 per cent of the medical, 85 per cent of the engineeruig and 93 per cent of the polytechnic students have not responded ; 3 per cent of the nuile and 4 per cent of the female medical students, 8 per cent of the en^-

neering and 2 per cent of the polytechnic students feel it difficult to obtain freeships ; 9 per cent of the male and 12 per cent of the female students in medical college, 9 per cent of the engineering and 4 per cent of the- polytechnic students do not find any difficulty in obtaining freeships. Again 89 per cent of the medical, 82 per cent of the engineering and 94 per cent of the polytechnic students have not responded. It is significant to note that most of the professional college students have not answered questions on financial assistance.
When asked “With whom do you live ?” 31 per cent of the mdeand 58 per cent of the female medical students, 28 per cent of the engineering and 57 per cent o! the male and 100 per cent of the polytechnic students say that they live with their parents ; 8 per cent erf the male and 8% of the female medical students, 4 per cent of the engineer- ii^ and 21 per cent of the polytechnic students say that they live with thek relatives ; 61 per cent of the male and 35 per cent of the female medicdi students, 68 per cent of the engineering and 22 per cent of the polytechnic students say that they live in hostels. It is clear that while more number of medical and engineering students stay in hostels, more number of polytechnic students stay with their parents.
Further, 91 per cent of the male and 88 per cent of the female medical students, 85 per cent of the engineering, 74 per cent of the male and 100 per cent of the female polytechnic students live in the same place where their college is situated ; 1 per cent of the medkai, 5 per cent of the engineering and 16 per cent of the polytechnic studente stay within 5 miles from the place where the college is situated; 2 per cent of the medical, 3 per cent of the engineering and 2 per cent ^ polytechnic students say that they stay 5 miles beyond from the place where their college is situated ; 5 per cent of the male and 12 per cent of the female medical students, 5 per cent of the engineering and 7 per cent of the polytechnic students stay in some town or city other thatft the place where their college is situated. Most of the students stay in the same place, where their college and polytechnics are situated.
2. THE INTEREST TAKEN BY THEIR FAMILIES
To understand the extent to which the members of the family take interest in the studies of their children, by helpng them academically, by sending them to coaching classes or engaging a special tutor for them, a few questions are asked. In answer to the question “Does any one of your family help you in your studies T \ 43 per cent of the male and 23 per cent of the female medical students, 32 per cent of the engmeering and 53 per cent of the polytechnic students say that their families help theagn in their studies ; 57 per cent of the male and 77 per cent of the female medical

students, 67 per cent of the engineering and 53 per cent of the male polytechnic and 100 per cent of the female polytechnic students say that members of their family do not help them in their studies. To the question of having a special tutor, 2 per cent of the engineering and 1 per cent of the polytechnic students have special tutor. All male and female medical students, 96 per cent of the engineering and 98 per cent of the male and 100 per cent of the female polytechnic students do not have special tutors ; Further 9 per cent of the male and 12 per cent of the female medical students, 4 per cent of the engineering students, and 16 per cent of the polytechnic students attend coaching classes;90 per cent of the male and 88 per cent of the female medical students, 93 per cent of the engineering and 82 per cent of the male and all lady polytechnic students, do not attend such coaching classes. It is seen that good number of students do not get any help from the members of their families in studies and also that most of these students neither attend coaching classes nor have engaged special tutors.
3. THE STUDENTS’ VIEWS REGARDING EDUCATION
Hereunder are recorded the views and attitudes of students towards the goal of education, the role of a student, their idea about the present system of education and their intention after completing the present course of education.
When the students were asked about the principal goal of education,4 per cent of the male and 15 per cent of the female medical students, 12 per cent of the engineering and 9 per cent of the polytechnic studentssay that it is to provide economic security, 16 per cent of the maleand 4 per cent of the female medical students, 18 per cent of theengineering and 15 per cent of polytechnic students say that it is toachieve higher status in society ; 29 per cent of the male and 38 per cent of the female medical college students, 34 per cent of the engineering and 34 per cent of the polytechnic students think that it is to be cultured persons, whereas 39 per cent of the male medical students, 35 per cent of the engineering college students, 45 per cent of the polytechnic students think that it is good citizenship ; 35 per cent of the lady students studying in medical college, and 100 per cent of the lady students studying in polytechnics say that the goal of education is something other than all those mentioned. Greater number of students feel that good citizenship is the goal of education.
When asked how their teachers should be, 77 per cent of the male and 67 per cent of the female medical students, 68 per cent of the engmeering and 82 per cent of the male and 100 per cent of the female polytechnic students desire teachers to be like parents ensuring all-round

development; 23 per cent of the male and 34 per cent of the female medical students, 32 per cent of the engineerinfi and 17 per cent of the polytechnic students want teachers to be subject teachers only not being perturbed about other activities of the students. Majority of the students desire their teachers to be like parents evincing keen interest not only in academic but also in extra-curricular and co-curricular activities.
The students were asked to give their idea about the role of a student;30 per cent of the male and 8 per cent of the female medical college students, and 21 per cent of the students studying in polytechnics, desire that students should be concerned only with the studies only; 22 per cent of the male and 38 per cent of the female students studying in medical college, and 34 per cent of the male and 100 per cent of the female students in polytechnic, desire students to devote time to household duties also ; 37 per cent of the male and 31 per cent of the female students in medical college, and 11 per cent of the students in polytechnics desire students to devote time to welfare work also ; only 8 per cent of the male medical students and 18 per cent of the polytechnic students like students to devote time to politics also. Membership of students desire that, a student must devote time to household and welfare duties also, along with his studies.
To the question concerning the achievement of aims in life with the present system of education, 73 per cent of the male and 69 per cent of the female medical students, 64 per cent of the engineering students, and 48 per cent of the polytechnic students feel that the present course of education will help them in achieving their aim of life ; 14 per cent of the male and 8 per cent of the female medical students, 20 per cent of the engineering and 26 per cent of the polytechnic students, do not think so ;12 per cent of the male and 23 per cent of the female medical students, 16 per cent of the engineering and 27 per cent of the polytechnic students are not in a position to say anything. Greater number of students studying in professional colleges are hopeful of achieving the aim of life through the present course of education.
Fuftheir, 36 per cent of the male and 27 per cent of the female medical students, 39 per cent of the engineering and 22 per cent of the polytechnic students find their chances bright in achieving their goals in life ; 47 per cent of the male and 54 per cent of the female medical students, 42 per cent,of the engineering and 46 per cent of the polytechnic students find their chances fair ; 9 per cent of the male and 4 per cent of the female medical students, 4 per cent of the engineering and 5 per cent of the polytechnic students feel that their chances are poor ; and 16 per cent of the male and 15 per cent of the female medical students, 15 per cent of the engineering and 27 per cent of the polytechnic students are not in a

position to say anything. Majority of students are optimistic about achieving their aims of life through the present course of education. They feel that their chances are fair in achieving them.
A,question was asked to know their intentions, after they complete the jM'esent course of education. The students gave the following answers : 2® per cent of the male and 27 per cent of the female medical students,37 per cent of the engineering and 21 per cent of the polytechnic stud^ts wish to start working to e»ra their livelihood; 51 per cent of the male mil 15 per cent of the female medical students, 35 per cent of the
^Ofpneering and 47 per cent of the polytechnic students '^sh to conti^e ^ # if studies furtibef; 28 p ^ c®iwt of the male and 38 per c®it of tite lenUiE» medic^ students, 26 pef cent of the engineering and 32 per cent of fQlj^chnic s t u d ^ cannot say what Aey wDuld like to do. Greater
of students, it is seen are keen on continuing their studies.
4. r m i R PERFORMANCE AND INVOLVEMENT
The students have given an account of their academic achievement, their reading habit, the help they get from their teachers in studies and -their capability or incapability of pursuing their studies without any help from their families. About the percentage of marks obtained in the last two examinations, 1 per cent of the polytechnic students have got less than 30 per cent; 1 per cent of the engmeering students between 30 and 39 per cent, 8 per cent of the medical boys, 28 per cent of the engineering :«nd 25 per cent of the polytechnic students between 40 and 49 per cent; 61 per cent of the male and 61 per cent of the medical students, 59 per of the engineering students, and 41 per cent of the polytechnic students have got between 50 and 59 per cent, and 21 per cent of the male and31 per cent of the female medical students, 3 per cent of the engineering and 32 of the male and 100 per cent of the female polytechnic students have scored more than 60 per cent in the last but one examination.
Further, 1 per cent of the medical and 1 per cent of the en^neering students have obtained between 30 and 39 per cent, 3 per cent of the Jtiedical, 28 per cent of the engineering and 24 per cent of the polytechnic feDys have got between 40 and 49 per cent; 15 per cent of the medical boys and 48 per cent of the medical girls, 59 per cent of the engineering, 55 per cent of the polytechnic students have got between 50 and 59 per ceiit; 23 per cent of the mdle and 48 per cent of the female medical students, 7 per cent of the engineering and 18 per cent of the polytechnic stadents have got more than 60 per cent in the last examination. Majority »of the students have obtained marks between 50 and 59 per cent in the previous two examinations.
'When asked about their reading habits, 43 per cent of the male

and 62 per cent of the female medical students, 46 per cent of the engineering and 74 per cent of the polytechnic students keep up their reading with the lessons taught in the class ; 54 per cent of the mrie and 35 per cent of the female medical students, 52 per cent of the engifffiermg and 21 per cent of the polytechnic students do not do so. While lady stodents studying in medical colleges and students in polytechnics taaep
regular reading habits, medical boys and engineering students do «©t do so.
Asked further, whether they could follow all the subjects in ttie class,70 per cent of the male and 85 per cent of the female students, ^ |i«r cent of the engineering and 79 per cent of the polytechnic stud(Mts loltew subjects in the class ; 1 per cent of the medical, 2 per cent oi tke etljltaPH:- ing and 2 per cent of the polytechnic students find difficulty in understanding the medium of instruction and so do not follow lessons in class ; 19 per cent of the male and 15 per cent of the female medical college students, 28 per cent of the engineering and 9 per cent of the polytechnic students say that teachers do not explain clearly in the dass ; 5 per cent of the medical, 17 per cent of the engineering and 5 per cent of the polytechnic students find the subjects as such difficult. Most of the students Inform that they follow all the subjects in the class.
To the question “Do you ask your teachers for help in your studies ?”, 61 per cent of the male and 68 per cent of the female medical studiiits, 55 per cent of the engineering and 80 per cent of the polytechnic studeiits and 100 per cent of the female polytechnic students go to teachers for help in their studies ; 20 per cent of the male and 15 per cent of the female medical students, 26 per cent of the engineering and 10 per cent of the polytechnic students have not felt the need ; 15 per cent of the engineering and 6 per cent of the polytechnic students hesitate to go to their teachers. Most of the students go to teachers for help in their studies.
When they were asked, whether they would be in a position to pursue their studies even if their families do not finance, 45 per cent of the male and 31 per cent of the female medical students, 22 per cent of the en^n^r- ing and 27 per cent of the polytechnic students say that they would contiiiue further education ; 20 per cent of the male and 12 per cent of the f@mide medical students, 26 per cent of the engineering and 19 per cent of the technic students cannot further their studies; 27 per cent of the mate and f 0 per cent of the female medical students, 25 per cent of the engineering and 48 per cent of the polytechnic students are not in a position to say anytbkg. It is seen that while more number of medical boys would like to coilfijiue their studies without help from their families, more number of girls awd polytechnic students are not in a position to say anything. More (26 per cent) of engineering students feel that they cannot ftir^er #i6ir studies under such circumstances.

5. STUDENTS’ OCCUPATIONAL ASPIRATIONS
Students have recorded as follows their intention of choosing different occupations after the completion of their studies; 84 per cent of the male and 92 per cent of the female medical students, 83 per cent of the engineer- ir^ students, 71 per cent of the male and all female polytechnic students desire to choose to become executives, scientists, doctors, etc ; 10 per cent of the male and 4 per cent of the female medical students, 4 per cent of the engineering and 2 per cent of the polytechnic students desire to be owners of small business, independent businessmen, etc ; and few desire to be teachers also. Most of the students desire to become executives, doetare, scientists etc.
6. STUDENTS’ ATTITUDE TO CASTE AND RELIGION
The students were asked to respond to questions involving caste and religion, to understand their views towards them.
About the role of caste and religion in social and public life, 84 per cent of the male and 88 per cent of the female medical students, 81 per cent of the engineering and 88 per cent of the male and 100 per cent of the female polytechnic students, feel that caste and religion should not play any role in either social or political life ; 17 per cent of the male and 12 per cent of the female medical students, 18 per cent of the engineering end 30 per cent of the polytechnic students want caste and religion to play their role only under certain circumstances. Further 45 per cent of the male and 38 per cent of the femEile medical students, 55 per cent of the engineering and 51 per cent of the polytechnic students desire that caste should not play its role in public life but has an important role to play in personal life only ; 55 per cent of the male and 62 per cent of the female medical students, 44 per cent of the engineering, 43 per cent of the male and 100 per cent of the female polytechnic students feel that caste has no role to play either in public or personal life. While more number of medical students are emphatic on the point that caste and religion have no roles to play either in public, social or personal life, engineering and polytechnic students feel that caste has an important role to play in personal life.
In response to the question on their close friendship with those belonging to scheduled castes, 60 per cent of the male and 35 per cent of the female medical students, 60 per cent of the engineering and 50 per
: cent of the polytechnic students have close friends belonging to scheduled castes. 21 per cent of the male and 35 per cent of the female medical students, 14 per cent of the engineering and 15 per cent of the male and 100 per cent of the female polytechnic students do not have such friends ;

5 per cent of the male and 12 per cent of the female medical students,14 per cent of the engineering and 31 per cent of the polytechnic students are not in a position to say anything. More number of students have close friends who belong to scheduled castes.
Out of the 53 scheduled caste students studying in various professional colleges, 14 per cent of the male and 15 per cent of the female medical college students, 18 per cent of the engineering and 3 per cent of the polytechnic students have close friends belonging to upper Hindu castes; 1 per cent of the medical and 2 per cent of the engineering and 1 per cent of the polytechnic students who belong to scheduled castes do not have such friends and 3 per cent of the polytechnic students ate not in a position to say anything. A slightly larger number of professional college students have close friends belonging to upper Hindu castes.
About their feeling on the continuance of special facilities for scheduled oastes, 60 per cent of the male and 38 per cent of the female medical students, 53 per cent of the engineering, 54 per cent of the male and 1(K) |» r cent of the femab polytechnic students deaire that special facilities in education should be given to scheduled caste students; 5 per cent of the male and 23 per cent of the female medical students, 11 per cent of the engineering and 12 per cent of the polytechnic students want special employment opportunities to be given to the scheduled caste students; 1 per cent of the male and 4 per cent of the female medical students, 5 per cent of the engineering and 2 per cent of the polytechnic students advocate special facilities in political te- presentation; whereas 28 per cent of the polytechnic students do not want any of such facilities to 1% provided for scheduled caste students. Greater number of students feel that special facilities in education should be provided for scheduled caste students.
7. THE STUDENTS' ATTITUDES AND VALUES
Here is an account of the answers given by students regarding the way of life, the mode of living, their attitude towards politicians, traits that determine respect, and also their own image in society.
When students were asked to give their preference between the holy way of life and materialistic living, 84 per cent of the male and 77 per cent of the female medical students, 89 per cent of the engineering, 78 per cent of the male and 100 per cent of the female i»lytechnic students prefer the materialistic way of life; while 6 per cent of the male and 12 per cent of the female medical students, 5 per cent of the engineering and 7 per cent of the polytechnic students prefer the holy way of life; 9 per c«nt of the male and 12 per €*wtt of the female medical students, 5 per cent of the engineering and 14 per cent

of the polytechnic students axe not clear about their choice. Most of the students prefer the materialistic way of life.
To the question on the role played by religion in the improvement of one’s lot in life, 6 per cent of the male and 12 per cent of the female meaical students, 17 per cent of the engineering and 11 per cent of the polytechnic students think that the improvement of one’s lot in life wholly depends on religious belief; 30 per cent of the male and 27 per cent of the female medicaj students, 15 per cent of the engineering and 13 per cent of the polytechnic students think that religious belief partially improves one’s lot in life whereas 55 per cent of the male and 42 per cent of the female medical students, 58 per cent of the engiBeemg and 52 per cent of the polytechnic students do not thiok that religion has anything to do with the improvement of one's lot in life. Hence it is clear that more number of students are of the opinion that religfeus belief has nothing to do with the improvement of one’s lot in life.
About the way the students would like to live, 100 per cent of the male and 95 per cent of the female medical students, 88 per cent of the engineering and 77 per cent of the polytechnic male and all female students desire to accomplish things ; 10 per cent of the male and 15 j^ r cent of the female medical students, 10 per cent of the engineering and 22 per cent of the polytechnic students wish to be left alone for themselves. Again 94 per cent of the nkale and 81 per cent of the female medicd students, 86 per cent of the engineering, 77 per cent of the male and all female polytechnic students identify themselves with such a person who accomplishes things while 16 per cent of the male and 15 per cent of the female medical students, 12 per cent of the engineering and 21 per cent of the polytechnic students identify themselves to be nearer to one who wishes to be left alone.
Further 69 per cent of the male and 46 per cent of the female medical students, 72 per cent of the engineering, 71 per cent of the male and 100 per cent of the female polytechnic students feel that most other friends would also approve the person who accomplishes things; while 31 per cent of the male and 46 per cent of the female medical students, 24 per cent of the engineering and 24 per cent of the polytechnic students feel that most other friends would approve of one who desires to be left alone. Most of the students would like to accomplish things. They further identify themselves with one who accomplishes things and also feel that other students would say so.
When the students were asked whether any attention is paid to their words by politicians, 4 per cent of the miile and 4 per cent of the female medical students, 5 per c»nt of the engineering and 9 per cent of the polytechnic students think that a great deal of attention is paid; 30 per cent of the male and 15 per cent of the female medical college students, 33 per cent of the engineering, 24 per cent of the male and 100 jier cent of the female polytechnic students feel that only a little attention is paid by politicians to their words; 51 per cent of the male and 58 per cent of the female medical students,

50 per cent of the engineering and 51 per cent of the polytechnic students fiwl that no attention is paid. Thus, greater number of students feel that no attention is paid to their words by politicians.
In answer to the question, whether they have written to politioil leaders,80 per cent of the male and 81 per cent of th« female medical students, 80 per ccnt of the engineering 72 per cent of the male and all female polytechnic students have never written to political leaders; 17 per cent of the male and 19 per cent of the female medical students, 12 per cent of the engineering and 26 per cent of the polytechnic students have sometimes written to poUtidans whereas 3 per cent of the medical, 1 per cent of the engineering and 2 per cent of the pblytechmc stYjdents hav© many a times wi^tten to politidans. Most of the students have not written to poUtidans.
To the question “What carries the greatest weight in determining the respect a man desen^s ?”, 67 per cent of the male and 73 per cent of the itoate medical students, 55 per cent of the engineering and 50 per cent of the polytechnic students respect the highly educated; 8 per cent of the medical, 11 per cent of the engineering and 14 iMn* cent of the male and 100 per cent of the Ibmale polytechnio students respect the person who comes fl’om a good fkmily; 5 per cent of the medical, 14 per cent of the engineering and 21 per cent of the polytechnic students respect one who has a large income; only I per o^nt of the engineering and 2 per cent of the polytechnic students respect th«t peofde belonging to high castes. More numW of students respect the highly educated.
The students were asked to state the quaUty they admire most in people. As per their answers, 25 per cent of the male and 26 per cent of the female medical students, 27 per cent of the engineering and 17 per cent of the polytechnic students admire the person who does his work Well; 16 per cent of the male and 11 per cent of the female medical students, 20 per oent of the engineering and 7 per cent of the poletechnic students admire one who is ambitious; 10 per cent of the male and 4 per cent of the female medical students,14 per cent of the engineering and 17 per cent of the polytechnic students admire one who is generous; 12 per cent of the medical, 12 per c©nt of the engineering and 24 per cent of the polytechnic students admire one who is active in public and social life; 11 per cent of the male and 12 per cent of the female medical students, 8 per cent of the engineering and 10 per cent of the polytechnic students admire one who minds his own business; 10 per (»nt of the male and 8 per cent of the female medical students, 11 per cent of the engineering and 18 per cent of the polytechnic students adimre one who keeps to himself; 16 per cent of the male and 38 per cent of the female medical students, 18 per cent of the engineering and 10 per cent of the polytechnic students admire the respectftil whereas only 2 per cent of the ®n|p” neering and 2 per ( ^ t of the polytechnic students admire the thrifty. Mo*e nimiber of students, it is seen, admire one who does his work well.

When the students were asked to place themselves in the social ladder in society, 10 per cent of the male and 8 per cent of the female medical students,13 per cent of the engineering, and 1 per cent of the polytechnic students identify their status with the upper social position; 83 per cent of the male and 88 per cent of the female medical students, 75 per cent of the engineering and 84 per cent of the male and 100 per cent of the female polytechnic students id^tify their status with the middle social position; 7 per cent of the male and 4 per cent of the female medical students, 9 per cent of the engineering and 9 per cent of the polytechnic students identify their status with the lower socaal position. Further, 65 per cent of the male and 69 per cent of the female in®d!cal stitdenta, 65 per cent of the engitteerifig and 70 per cent of the poly- te c ^ c students find it difficult or hard to move up in society; 30 per cent of ttie lode and 15 per cent of the female medial students, 17 per cent of the tBtiglfieering and 23 per cent of the polytechmc students find it easy to move up in society. Greater number of students identify thmr status with the i^ddle sodal position and find it hard to move up in society.
About their attitude to changes that are taking place in society and their views regarding their own ability to influence change, 86 j»r cent of the male and 69 per cent of the female medical students, 82 per cent of the ^gineering and 77 per cent of the polytechnic students feel these social changes are for the better; 14 per cent of the male and 26 per cent of the female mescal students feel that t h ^ changes are for the worse. A lady student studying in a polytechnic feels that changes taking place in society are for the better. Further,71 -p&t cent of the male and 50 per cent of the female medical students, 59 per cent of the engineering, 41 per cent of the male and 100 per cent of the female polytechnic students are hopeful of exerting influ6nce on these changes; 12 per c»nt of the male and 35 per cent of the female medical students, 21 per cent of the engineering and 29 per cent of the polytechnic students do not think so;15 per cent of the male and 15 per cent of the female medical students, 19 per cent of the engineering and 28 per cent of the ploytechnio students do not know whether they would be able to exert influence on such changes or not. Most of thse students find the changes that are taking place in society are for the better and are optimistic that they could exert their pressure on such changes.
Section III—Students of Professional an£> N on-Professional Colleges
—A Comparison
Grreater nimiber of non-professional college students are in the age group of 14 and 16 years while students of professional colleges are in the age group of 20 and 22 years. Most of these students belong to other castes, are Hindus, have experience of rural life and speak Kannada. The grand

fathers of most of the professional college students are illiterate or barely literate while the non-professional college students are not aware of the education of their grandfathers. Further, the fatheis of most of the boys of these colleges are educated upto middle or high school while fathers of girls of these colleges are college educated.
Kinship affiliations are stronger among students both sdnce they live with parents, with the exception of more number of professional college students (medical and engineering boys only) who reside in hostels.
Though a majority of non-professional college students prefer English as the medium of instruction, 50 per cent of them feel difficulty to follow lessons taught in EngUsh, whereas most of the sttidents of p^ofdssloaal colleges prefer English as the medium of instruction and find it easy to follow the lessons taught in the class. Regarding the goal of education boys of both professional and non-professional colleges think that the goal is to become good citizens while girls in both these institutions say that it is to become a good citizen. More students belonging to professional and non>professional colleges feel that the present course of education will help to achieve the goals of life, find their chances bright, wish to be execaitives, scientists, doctors, lawyers and prefer the materialistic way of life.
Students of both categories identify their status with the middle social position, find it hard to move up in society, do not communicate with political leaders, and say that special facilities in education should be pro\dded for scheduled caste students. There is a small percentage of studettts who are against the provision of any special facilities to schedided caste students.
While more number of students of non-professional colleges admite the one who is active in pubUc and social life, more number of students of professional college admire the oim who works weU.

Self-Administered
QUESTIONNAIRE No. 1
AN APPEAL*Respondent: Student
So much is being said and written these days about what is ri|Sit and wrong with our system of education. Yet in this discussion there is little inatefial on what teachers, students and parents themselves think about education or what their own particular experience and approaches are. One object of undertaking this series of sta les is to provide essentially such material so that the discussions among planners and policy m al^s are fftcdtitated. The study will be carried out simultaneously in eight States in the country. You are one of the individuals bdng requested to help in this process. You can help us by giving candid answers to the questions asked of you in this questionnaire. The questionnaire seeks to understand your opinions and aspirations regarding education, occupation, ete. This is not a test, and there are no right or wrong answers. Your answers will be treated as confidential.♦Issued by:The Convenor,Office of the Co-ordinating Committee,Tata Institute of Social Sciences,Chembur, Bombay 71,AS
This Section is to be filled in by the Investigator (Please read the Instructions Sheet before filling in the Section)Name of Investigator ........ . . . Serial No. ......,,..,.,..... .(1) Centre : Name.......................................................
REGIONAL DIRECTOR
No.
2) Cluster No.
(3)
1
0
2 3 4 5 6 7 8
1 2 3 4 5 6
Community: (State the name of the Community and mark its appropriate number. In the case of villages carefully mark whether village is attached to Community A or B)1..........OOMMUNITY A (Specify Name............................. )2..,......First village attached to Community A (Specify Name...... 3........Second village attached to Community A (Specify Name....... 4........COMMUNITY B (Specify Name........................ ............... 5........First village attached to Community B (Specify Name....... 6....... Second village attached to Community B (Specify Name.. . .

(4) Institution sponaolship : 1............. ...............Government Institution 2.................. .Municipal Institution 3......................Oovernment-aidedRegistered Society’s Institution 4.....................Unaided, RegisteredSociety’s Institution
(5) Type of Institution: 1................. Primary School2.. . .............Secondary School (for Men or Co-educational) 3...............Secondary School (for Girls only) 4....................ArtsCollege (for Men or Co-educational) 5................. Arts College (forWomen only) 6................. Commerce College (for Men or Co-educational) 7................. Commeree College (for Women only) 8...............Science College (for Men or Co-edu«itional) 9...............Science College (for Women only) 0............... MedicalCollege X...................En^neering College Y ...............PolytechnicDate................. Signature of Investigator..................Supervisor..........
Instruction:—Read the Questionnaire (arefUlly. Alternate answers have been provided for several qu^tions. Kindly tick the relevant answer in the space provided between the appropriate response number and the re^onse as shown here:
1..............Yes 2...... ............No Please answer all the questions(10) Age (in years completed) 1.Below 14 years 2...................... 14-16
years 3. . . . . . ...17-19 years 4......... .20-22 years 5............23-25 years6.......... 26-28 years 7...... ...29 years and above
(11) State the name of your caste.................................................................If you are Hindu, Sikh, Jain or Buddhist, please mark the category to which your caste belong.1..........The Scheduled Castes 2.......... The Other Backward Classes3........ .Other Castes 4..........Question not applicable
(12) Sex: 1.........Male 2.......... Female(13) Religion: 1...... Hindu 2.......Muslim 3.......Christian 4.... .Jain
5...... Sikh 6.......Neo-Buddhist 7.......Zoroastrian 8......Anyother 9...... None
(14&15) Mother Tongue: 01...... Assamese 02......Bengali 03......English0 4.... Gujarati 05...... Hindi 06......Kannada 07...... Konkani08......Marathi 09......Malayalam 10... ..Oriya 11 .....Punjabi12......51.dhi 13...... Tamil 14....,.Telugu 15.....Tulu 16 .....Urdu17......Any other
(16) Where do your parents live ?1...... Same place as my gehool/college 2.......Nei^bouiing vi}la|^within 5 miles 3...... A village beyond 5 miles 4..... .Any other townor city

(17) Where do you live?1...... Same place as my school/coliege 2.......Neighbouring village^ithin 5 miles 3...... A village beyond 5 miles 4.......Any other townor city
(18) With whom do you live?1...... Parents; 2.......Relatives; 3......Others (in a hostel, rentedroom, etc.)
(19) Do you prefer urban to rural life?1...... 1 prefer urban life 2.......1 prefer rural life 3.......1 cannotsay
(20) Have you had any experience of rural life ?1...... Yes 2.........No
(21) If YES specify 1......Less than one year 2.............One to three years3...... More than three years
(22) Do you keep up your reading with the lessons taught in your class ?1...... Yes 2.........No
(23) What percentage of marks did you obtain in the last two of your annual examinations?Examination : Less than 30% 30%-39% 40%-49% 50%-59% 60% and aboveLast Examination 1.......... 2............ 3.......... 4 ............ 5..........Last but one 6.......... 7.......... 8.......... 9......... 0..........
(24) Do you have a special tutor ? 1...........Yes 2...........No(25) Do you attend any coaching classes? 1..........Yes 2.......... No(26) Does any one of your family help you in your studies ?
1.......... Yes 2........... No(27) After your school or college education what do you intend to do?
1.......... Start working to earn my livelihood 2.......... Continue mystudies further 3............1 cannot say what I will do
(28) If you intend to undertake further education, will your family finance your education ?1.......... Yes 2.......... No 3.......... Partially 4.........I cannot say5..........Not applicable
(29) Will you pursue your studies even if your family cannot finance your education?1.......... Yes 2........... No 3.........1 cannot say 4..No reply5........ .Not applicable
(30) What was your grandfathier’s (father’s father) education ?1.......... Illiterate or barely literate 2.......... Primary school educated3..........Middle/High School educated 4...........College educated

5.........Educated in the traditional system, either Sanskritic or Persian 6... ....I cannot say
(31) What was your father’s education?1.......... Illiterate or barely literate 2.......... Primary school educated3.......... Middle/High School educated 4...........College educated5.......... Educated in the traditional system, either Sanskritic or Persian6. .......I cannot say
OCCUPATIONS (Before answering questions 32, 33, 34 r e ^ the classification of occupations given below and then indicate the appropriate mpon8es)
Group 1 Owner of farm, fishery, dairy, land etc.Group 2 Tenant cultivator, peasant proprietor, independent fisherman
etc.Ghx)up 3 Manual labourer in agriculture, dairy etc.Group 4 Proprietor/Director/Managing Agent, etc. of big industrial
concern, mine etc.; big businessman, wholesale merchant, proprietor of transport, commission agent.
Group 5 Owner of small business, retail shop (grocery, tailoring shop, haircutting saloon); handicraftsman; independent businessman employed by none and employing none, like tailor, banker, hawker, peddlar, priest, country medicine man etc.
Group 6 Executive and scientific/technical personnel (degree holder or equivalent): like manager, accountant; various tyi^s of officers; physicist, analyst, chemist etc.; professional like doctor, lawyer, lecturer, professor, etc. employed by public or private sector or working on his own.
Group 7 Ordinary administrative staff: clerk, stenographer, cashier, recordkeeper, school teacher, retail shop employee, etc.
Group 8 Skilled manual workers of all types: foreman, machineman, miner, factory worker, craftsman, working as an employee of a concern etc.
Group 9 Unskilled staff: peon, darwan, cooly, non-agricuhural day labourer, etc.
Group 0 Armed for(%s personnel Group X Other occupations.
(32) What is/was your grandfather’s (father’s father) main source of livelihood?(a) Specify the occupation........... ................................................(b) Mention the Group from among the Groups above: Group
No...... .................................. ............. .

(33) What is/was your father’s main source of livelihood?(a) Specify the occupation......................................................................(b) Mention the Group from among the Groups above: Group
No..........................................................(34) What occupation would you like to follow after you complete your
studies ?(a) Specify the occupation..................................................................(b) ^ n t io n the Group from among the Groups above; Group
No...........................................................
(35) Do you ask your teachers for help in your studies? 1...... Y es .......... NoIf no please mark the relevant reason below:2..........1 have not felt the need for help 3...........1 hesitate to go tomy teacher for help 4..........Any other reason (please specify)
(36) (a) Can you follow all the subjects in the class ? 1...... Yes 2.......No(b) What subjects can you not follow? ................................. .............(c) If you cannot follow any subject, what is the reason ? (Mark below)
2.............. Difficulty in understanding the language of instruction 3 .............. Teachers do not explain clearly 4.............. Subject as such, is difficuU to understand 5.............. Any other reason (please specify) 6.............. Question not applicable
(37) Of the two following statements, mark the one with which you agree. 1.........A teacher should really be like a second parent to his students
and should ensure their all-round development 2........A teacher should primarily be concerned with teaching his
subject in the class-room and should not worry about student behaviour outside the class-room
(38) What do you think is the principal goal of education ? 1........To provide economic security 2.......To achieve higher status in society 3.......To be cultured person 4...........To turn into a good citizen5.........Any other (specify)
(39) Of the following statements with which do you agree most ? 1........A student should be concerned with his studies only 2.......A student should also devote time to household duties 3..... . .A student should also devote time to welfare work 4....... A student should also take part in politics 5....... 1 cannot say
(40) Plc£lse choose on^ statement from the two given below with which you agree most.

1....... .Caste and religion should not play any part in social and politiccallife
2 Under certain circumstances, it may be inevitable that casteand religion should play a part in social and political life.
(41) Please choose one statement from the two given below with which you agree. 1............While caste should not play any part in public life, I think it
has an important role in one’s personal life 2........ Caste has no role to play either in public or in personal life
(42) If you do not belong to the Scheduled Casies, ptoate itate if you have any scheduled castes students among your close friends.1.......... Yes 2.......... No ...S.......... I cannot say 4.......... Question
not applicable(43) If you belong to the Scheduled Castes, please state if you have upper
caste Hindus among your dose friends.1..........Yes 2.......... No 3.......... 1 cannot say 4.......... Question not
applicable.(44) As you know, members of Scheduled Castes are given three types of
special facilities:(a) Special facilities in education (b) Special facilities in employment
opportunity; and(c) Special facilities in political representation such as reservation of
seats in the legislatures and other political bodies.Which of the these special facilities do you think should be continued
for the Scheduled Castes ? 1.......Special facilities in education 2.......Special facilities in employment opportunity 3.......Special facilities in political representation 4........None of these special facilities5 ....... I have no opinion
(45) Do you think the present course of your ^ucation will help you in achieving your aim of life?1. ...............................................................Yes 2....No 3.. I carmot say
(46) Taking everything into account how do you consider the chances for achieving the goals you have set yourseif (especially with re j^ d to occupation)?1.........Bright 2.........Fair 3..........Poor 4............ 1 cannot say
Qns. 47 to 51 should be answered only by students bebnging to Scheduled Castes. All others will kindly proceed to Q. 52.(47) Do you hold a freeship at present ?
1.........Yes, I receive a freeship

2....... 1 need a freeship, and I tried for one but I did not get it 3....... 1 need a freeship, but I have not tried for one 4....... 1 do not need a freeship, I have not tried for it, and do not
receive it.(48) Does your father, brother* or any other relation give you monetary
expenses, for the purchase of books, etc. ?1. .......Yes 2..........No
(49) Apart from a freeship, do you receive any financial assistance from the CJovernment to pursue your studies?1..........Yes 2......... No
( ^ ) If yes, do you fiind this assistance adequate ?1.......... Yes 2..........Partially 3........... No 4.......... 1 cannot say
(51) Did you have any difl&culty in obtaining the freeship or the other financial assistance mentioned above ?1.......... Yes 2..........NoState difficulties if any.
(52) There were two sons of a father, both of whom wanted to help their country. The first one set out to be a holy man. He gave up everything in order to show to his countrymen the path of goodness in this life, and salvation hereafter. The second son set out to establish a big factory, which ^ v e work to hundreds of his countrymen, and which produced inexpensive goods that many people needed.Which of the two sons do you personally admire most ?1......... First son 2...........Second son 3......... I am not clear aboutmy choice.
(53) Whether or not a man strives to improve his lot in life depends upoPx whether he believes in any religion. Do you agree ?1..........Yes, it wholly depends upon whether he has a religion2.. .......Yes, it partially depends on religion 3........No, I do not think religion has anything to do with it 4....... 1 don’t know
(54) In your view, how much attention do politicians (leaders of the country)pay to the opinions of people like yourself?1......... A great deal 2.............................................Only a little 3.........None at all4......... 1 do not know.
(55) There were two persons talking about how they liked to live. ’Fhey had different ideas.1. One said: I like to accomplish things. I like to see results which
are worth working for.

2. The other said; 1 have no particular objectives. I wish to be left alone to enjoy life as I go along.Which of the two persons, in your opinion, has the better attitude to life ?
1........... or 2.....(56) Which of the two do you think yourself nearer to ?
1........... or 2.....(57) Which do you think most students will approve of?
1........... or 2.....(58) In your view, which of the following should carry the greatest weight
in determining the respect (prestige, honour) a man deserves? 1.... Coming from a well known or distinguished family 2.........Having a large income 3 ........ Coming from a high caste 4 ...........Having high education5.......... Any other 6.......... 1 do not know.
(59) Have you ever talked to or written to some government official or IK>litica] leader to tell him your opinion on some public issue, such as what the government should do about education?1..........Many times 2.......... Sometimes 3..........Never
(60) Here is the drawing of a ladder. Imagine that this ladder represents the social positions of all the people in the country. This means that in the upper part of the ladder are placed persons who have the highest social position, in the middle of the ladder are persons who have middle social position, and in the lower part of the ladder are those persons who have lower social position.Now, kindly mark in the ladder given below, the position of the people who have the same social position as yours.
1
2
1.......... 2......... 3.........Is it easy or hard for a man to increase his prestige and change hisposition to move upwards on this ladder ?1..........Easy 2.......... Hard 3...........1 do not knowAll of us have ideas about wlxat people should be like. Here is a list of characteristics you might find in people. Could you select the quality you admire most ?

1..........Does his work well 2.......... Ambitious 3...........Generous4.........Active in public and social ajSairs 5......... Thrifty6..........Minds his own business 7...........Lets no one take advantageof him 8...... . Respectful
(63) Many things are changing in our daily life and in the society in whichwe live.1. Some people think that these changes are, on the whole, for the better.2. Others think that these changes are, on the whole, for the worse.What is your opinion in the matter ? 1.......... 2.........
(64) Do you believe that you can have some influence on these changes ?1.........Yes 2........... No 3.............1 don’t know
Name(You need not write your name if
you do not desire to)

Self-Administered
QUESTIONNAIRE NO. 2
Respondent: School Teacher
AN APPEAL*
So much is being said and written these days about what is right and wrong with our system of education. Yet in this discussion there is little mteTial on v^hat teacheis, stvidents and patentf tbenisolvei think about education or what their own particular experience and approaot»s are. One object of undertaking this series of studies is to provide essentially such material, so that the discussions among planners and policy makirs are facilitated. The study will be carried out simultan^usly in eight States in the country. You are one of the individuals being requested to help in this process. You can help us by giving candid answers to the questions a s ^ of you in this questioruiaire. The questionnaire seeks to understand your opinions and aspirations regarding education, occupation, etc. This is not a test, and there are no right or wrong answer. Your answer will be treated as confidential.
*Issuwi by :The Convener,Office of the Co-ordinating Committee, Tata Institute of Social Sciences, Chembur, Bombay 71 AS.
REGIONAL DIRECTOR
This Section is to be filled in by the Investigator (Please read the Instructions Sheet before filling in Secton)
Name of the Investigator....................... ...........................Serial No.
(1) Centre: Name................. ....................................
No. j 1 2 3 4 5 6 7 8
(2) Cluster No, 0 1 2 3 4 5 6
(3) Community: (State the name of the Cx>mmunity and mark its appropriate number. In the case of villages carefully mark whether village is attached to Community A or B. }

1.......COMMUNITY A (Specify Name.......................................) 2....... First village attached to Community A
(Specify Name......................................................................) 3....... Second village attahed to Community A
(Specify Name.............................................................. •••) 4.......COMMUNITY B (Specify Name...................................... ) 5.......First village attached to Community B
(Specify name.................................................................. ) 6.......Second village attached to Community B
(Sp&dify Name....................................................................)4) Institution sponsorship: 1..........Government Institution
2........Municipal Institution 3.......Government-aided Registered Society’s Institution 4.......Unaided Registered Society’s Institution
(5) Type of Institution: 1........ Primary School 2.......Secondary School (for Men or Co-educational) 3........Secondary School 4.........Arts College (for Men or Co-
(for Girls only) educational) 5........Arts College 6.........Commerce College (for Men or
(for Women only) Co-educational)
7....... Commerce College 8 .........Science College (for Men or(for Women only) Co-educational)
9......... Science College 0.........Medical College(for Women only)
X..........Engineering College Y.......... Polytechnic
Date:............................ Signature of Investigator.........................................
Supervisor........................................
Instructions:
Read the Questionnaire carefully. Alternate answers have been provided for several questions. Kindly tick the relevant answer, in the space between the appropriate response num;ber and the responses as shown here:
1........, Yes 2...... ............No Please answer all the questions.

1 , 2 ....... 21 to 25 years3.... 45, 6 ,7 ... 8.,9 .1 .....Male 2.. ■Female(U) Sex:
(12) Caste; State the name of your caste...................................If you are? Hindu, Sikh, Jain or Buddhist, please mark the category to which your caste belongs.1..........Ttie Scheduled Castes 2 .The Other Backward Classes3..........Other Castes 4.......................... Not applicable
(13) Religion:1 , .Muslim 3....... 4 ....... Jai5 .....Silch 6... .Buddhist 7...... . ..Zoroastrian8 .....Any other
(14 & 15) Mother Tongue:01 02 .........BengaU 03 .EngUsh04.......... Gujarati 05 Hindi 06 , .Kannada07, ........ JConkani 08 09...... .Malayalam10 , 11, 12 , .Sind hi13 ......Tamil , 14 15 ., .Tulu16 XTrdu 17 ...... Any other (Specify....
(16) Qualifications: (Highest academic qualification attained) 1...... ..Vernacular School Final or Middle School Passed or Non-
Matric 2........ Matriculate 3........ Non-Graduate (Intermediate etc.)4 .. ...... Graduate (B.AB.Sc., etc.)5. ...... Post Graduate (M.A., M.Sc., Ph.D., etc.)
(17) Class or Division obtained in the above examination:1.........First 2......,..Second 3.........Third/Pass 4...........None
(18) Professional qualifications (attained, actual or equivalent)1..........Nil2.........Primary Teachers’ Training Certificate 3........Secondary Teachers’ Training Certificate (S.T.C.) 4........Teachers’ Diploma (T.D. Indian) 5........Teachers’ Degree (B.T, or B.Ed.)6. Post-Graduate Teacheis’ Qualification (M. Ed., etc.) 7........A Foreign Degiee or Diploma in Education. 8 ........Diploma in Physical Education (D.P. Ed.)

9.........Drawing Teachers’ Examination (D.T.) 0 ......Hindi Siksha Sanad (H.S.S.)X.........Examination for Arts’ & Crafts’ TeachersY..........Any other (Specify.............................)
(19) For how many years have you been engaged in teaching? 1.......Five & less than five years 2............. Six to ten years3..........11 to 15 years 4.......... 16 to 20 years 5 ...........Over 20 years
(20) For how many years have you been engaged in this institution ?1..........Five & less than five years 2............Six to ten years 3........11 to 15 years 4............... 16 to 20 years5......... Over 20 years
(21) In how many institutions did you work prior to joining here ?................(22) What classes do you teach at present ?
1..........Primary 2.......... Secondary 3.......... Both(23) How would you describe the economic circumstances in which you
grew up?1.........Difficult or stringent 2........... Average 3..........Well-off 4.......Varied from time to time
OCCUPATIONS: (Before answering questions 24 and 25 kindly read the classification of occupations listed below:)
Group 1 Owner of farm, fishery, dairy, land, etc.Group 2 Tenant cultivator, peasant proprietor, independent fisherman etc.Group 3 Manual labourer in agriculture, dairy, etc.Group 4 Proprietor/Director/Managing Agent of big industrial concern,
mine etc.; big businessman, wholesale merchant, proprietor of transport; commission agent, etc.
Group 5 Owner of small business, retail shop (groceries, tailoring shop, haircutting saloon etc.); handicraftsman, independent businessman employed by none and employing none, like tailor, banker, hawker, peddlar, priest, country medicineman, etc.
Group 6 Executive and Scientific/Technical person (degree holder or equivalent); manager, accountant; various types of officers; physicist, analyst, chemist, etc.; professional like doctor, lawyer, lecturer, professor, etc. employed by public or private sector as well as working on his own.
Group 7 Ordinary administrative staff: clerk, stenographer, cashier, record-keeper, school teacher, retail shop employee, etc.
Group 8 Skilled manual worker (of all types): foreman, machineman, miner, factory worker, craftsman working as employee of concern, etc.

Group 9 Unskilled staff: peon, darwan, cooly, non-agricultural day labourer, etc.
Group O Armed forces personnelGroup X Other occupations.
(24) What is/was the main source of livelihood of your grandfather (father’s father)?(a) Specify the occupation....................................(b) Mention the Group to which he belongs from among the Groups
given above ,* Group No..................... .(25) What is/was the main source of livelihood of your fhther ?
(a) Specify the occupation....................................^ ) Mention the Group to which he belongs from among the Oroupi
given above; Group No...... ..............................(26) What was the education of your grandfather (father’s father) ?
Maria the relevant answer.1 ..... Illiterate or barely 2......... Primary school
literate educat^ 3......... Middle/High School 4......... College educated
educated 5.........Educated traditionally in the Sanskritic or Persian system. 6....... 1 cannot say.
(27) What was the education of your father ?1......... Illiterate or 2..........Primary school 3.........Middle/Hifh
barely literate educated school eduoated 4 .......College 5.......... Educated tradi- 6.........1 cannot say.
educated tionally in theSanskritic or Persian system.
(28) Have you ever been to school at a place smaller than a tehsil or taluka/ town?1.......... Yes 2......... No 3.......... 1 cannot say.
(29) Where did you mainly grow up?l......,..Village 2.........Town 3....... .City 4....... ..Mixed
(30) At any stage in your career have you pursued an occupation other than teaching? (Private tuitions and coaching are regarded as part of your teaching (»reer.)1.......... Never 2..... Yes, before I took to teaching 3........Yes, for a period between two teaching jobs. 4..........Yes, I have done it/am doing it along with teaching.

(31) Before you took to teaching as a career did you wish to choose any other occupation?1..... Yes 2.......... No 3................ 1 canmot say/J had no specificchoice.
(32) Now that you have been in the teaching profession for some time would you libe to change if there is an opportunity for some othei kind of work (with the same emoluments)?1......... Yes, I would like to change 2........... It is too late to change
now3.........No, 1 woTild not like to A...........1 cannot say.
change(33) How docs your occupation compare with tkat of your father?
1.......................It is higher in status than the occufffl.tion of my father* 2..........................It is lower in status than the occupation of my father. 3......... It is about the same in status as the occupation of my father. 4......... 1 cannot say.
(34) (a) Are you a member of any of the teachers’ organisations at thelocal, state or national level?
1............ No ............. :.................................................... Yes.(b) If yes, please state how often you participate in their activities. 2......... Regularly 3...........Owasionally 4 ...........Seldom
Choose one adjective from each of the following pairs of adjectives, by which you would describe the present generation of students:(35) 1.... or 2..........Drifting(36) 1.... or 2..... ... .Negligent(37) 1.... or 2.......... Incapable of indepen=
dent thought dent thought(38) 1.... or 2..... .....Indisciplined(39) 1.... or 2..........Unrespectful(40) In your observations have you found that students of the upper castes
do better in tbeir studies than students of lower castes ?1............Yes 2...........No 3............1 cannot say.
(41) Do students belonging to certain religious groups do better in their lessons than students belonging to oertaia other religious groups?i ............Yes 2...........No 3...,.......I cannot say
(42) Can it also be said of certain linguistic groups that the academic performance of students of one language group is better than that of another?1............Yes 2...........No 3............1 cannot say

(43) What do you think is the principal goal of education ?1......... To provide economic 2..........To achieve higher status
security in society3......... To be a cultured person 4..........To turn into a good citizen5......... Any other (specify) 6 ... ... .1 cannot say
(44) Of the following statements with which do you agree most?1.. .......A student sho*uld be concerned with his studies only.2...... ..A student should also devote time to houshold duties. 3..........A student should also devote time to welfare work. 4......... A student should also take part in politics. 5.......1 t^nnol say.
(45) There is a feeling that the present system of education does not inculcate any sense of valunes in the younger generation. Do you agree with this?1 ..........Yes 2...........Partially 3.......... No4......... 1 cannot say
(46) Generally, how many of your students feel free to consult you in their difficulties, personal o»r academic?1..........One to five 2.......... Six to ten 3..... ....More than ten 4........None
(47) Do you find parents sufficiently interested in the progress of their children?1......... Most 2........................................................... Some 3..Few 4..............None 5......... 1 cannot say
(48) How often is your contact with the parents of your students ? 1..........Regular 2 .......... As and when occasion arises3......... Seldom 4...........Never
(49) How do you keep the parents of your students informed of the progress of their wards?1... ......Primarily through periodic report cards 2..........Primarily through parent-teacher meetings 3........1 do not keep in touch with them 4........Any other (specify....................... ... ....... ......... )
(50) Are any staff meetings held in your institution ?1........ .Held regularly 2........ Held as and when required 3........Very rarely 4...Never
(51) Do you feel free to discuss all matters relating to the school at thesemeetings ?1..........Most often 2....... ...Sometimes 3..........Seldom 4........Never 5..........Question not applicable

(52) Are decisions taken at these meetings implemented ?1..........Always 2.......... Sometimes 3...........Seldom4..........Never 5.......... Question not applicable
(53) 111 your institution are the teachers represented on the Board of Management by a teacher other than the Principal ?1..........Yes 2.......... No
(54) There were two sons of a father, both of whom wanted to help theircoimtry. The first son set out to be a holy man. He gave up everything in order to show to his countrymen the path of goodness in thisliibi aad salvation hereafter. The second son set out to establish a big&(^ory» whidi gave work to himdreds of his countrymen, and which produced inexpensive goods that many people needed. Which of the two sons do you personally admire most?1..........First son 2.......... Second son3 ...I am not clear about my choice.
(55) Whether or not a man strives to improve Ws lot in life depends upon whether he believes in any religion. Do you agree ? 1........Yes, it wholly depends upon whether he has a reli^on 2....... Yes, it partially depends on religion 3....... No, I don’t think reli^on has anything to do with it 4....... 1 don’t know
(56) In your view, how much attention do politicians (leaders of the country) pay to the opinions of people like yourself?1..........A ^eat deal 2 ..........Only a little 3.......... None at all4.........1 do not knowThere were two persons talking about how they liked to Uve. They had different ideas:
One said: I like to accomplish things. I like to see results which are worth working for (1)
The other said: I wish to be left alone to eiy oy life as I go along (2)
(57) Which of the two persons, in your opinion, has the better attitude to life?1.......... or 2...........
(58) Winch of the two do you think is nearer to you ?1.......... or 2 ...........
(59) Which do you think mc«t other teachers would say had the better way of living?1.......... or 2...........

(61)
(62)
In your view, which of the following should carry the greatest weight in determining the respect (prestige, honour) a man deserves? 1.......Coming from a well known or distinguished family. 2.......Having a large income 3.... .Coming from a high caste4 ....... .Having high education5..........Any other 6.........1 do not knowHave you ever talked to, or written to some government official or political leader to tell him your opinion on some public issue, auch as what the government should do about education?I, ......Matiy timss 2..........Sometimea 3 . ,NevetHere is a drawing of a ladder. Imagine that this ladder repreients the Social positions of all the people in the country. This means that in the upper part of the ladder are placed persons who have the highest social position; in the middle of the ladder aie those persons who have a middle sodal position; and in the lower part of the ladder are those persons who have the lowest social position.Now kindly mark in the ladder given below, the position of the people who have the same social position as yours.
1
(63) Is it easy or hard for a man to increase his prestige and changs his position to move upwards on this ladder?1... ........ or 2..........................................................
(64) All of us have ideas about what people should be like. Here is a list of characteristics you might find in people. Could you select the quaUty you admire most ?1 Does his work well 2...................... Ambitious3........ .Generous 4........... Active in public and social affairs5..........Thrifty 6.......... Keeps to himself7.........Lets no one take advantage of him. 8 . . . .....Respectful
Name(Your need not write your name
if you do not wish to)

QUESTIONNAIRE NO. 3
Self Administered Respondent: Head of School
AN APPEAL*
So much is being said and written these days about what is right and wron with our system of education. Yet in this discussion there is little material on what teachers, students and parents themselves think about education or what their own particular experience and approaches are. One object of undertaking this series of studies is to provide essentially such material, so that the discussions among planners and policy makers are facilitated. The study will be carried out simultaneously in eight States in the country. You are one of the individuals being requested to help in this process. You can help us by giving, candid answers to the questions asked of you in this questionnaire. The questionnaire seeks to understand your opinions and aspirations regarding education, occupation, etc. This is not a test, and there are no right or wrong answers. Your answers will be treated as confidential.
REGIONAL DIRECTOR*Issued by:The Convener,Office of the Co-ordinating Committee, Tata Institute of Social Sciences, Chembur, Bombay 71, AS.
This Section is to be filled in by the Investigator. (Please read the Instructions Sheet before filling in Section)
Name of the Investigator........................................... Serial No.
(1) Centre: Name............... ................... ........ ..................
No. 1
(2) Cluster No.
2 3 4 5 6 7 8
0t
1 21
3!
4f
5 6
(3) Community: (State the name of the Community and mark its appropriate number. In the case of villages carefully mark whether village is attached to Community A or B.

1................COMMUNITY A (Specify Name.................. ) 2........... First village attached to Community A
(Specify Name..................................) 3...........Second village attached to Community
A(Specify Name..................... ............ )
4 ..... COMMUNITY B (Specify Name.................. ) 5... ... First village attached to Community B
(Specify Name..................................) 6.Second village attached to Community
B(Specify Name......... ........................ )
(4) Institution sponsorship: 1............ Government Institution2............. Municipal Institution 3..............Gtovernment-aided
Registered Society’s Institution
4............ Unaided, RegisteredSociety’s Institution
(5) Type of Institution: 1.,... Primary School 2............ Secondary School (for Men or Co-educational) 3............Secondary School 4...............Arts College (for Men
(for Girls only) or Co-educational) 5............Arts College 6...............Commerce College (for
(for Women only) Men or Co-educational)7............. Commerce College 8...............Science College (for
(for Women only) Men or Co-educational)9............ Science College 0 ............ Medical College
(for Women only)X...... .... .Engineering College Y.............Polytechnic College
Date:...... .............. Signature of Investigator ....................................Supervisor .......................... .........
Instructions:
Read the Questionnaire carefully, Alternate answers have been provided for several questions. Kindly tick the relevant answer, in the space between the appropriate response number and the responses as shown here:
1 Yes 2.....V...No Please answer all the questions.

(10) Age: 1..........20 & below 20 years3......... 26 to 30 years5......... 36 to 40 years7......... 46 to 50 years9......... 56 years and above
2 21 to 25 years4 31 to 35 years6 41 to 45 years8 51 5o 55 years
(11) Sex: 1..........Male 2.
(12) Caste: State the name of your caste ...
.Female
If you are Hmdu, Sikh, Jain or Buddhist, please mark the category to which your caste belongs1.........The Scheduled CaiJtes 2............The Other Backward
Classes3.........Other Castes 4....................... Not applicable
(13) ReHgion:1,,, 2 3....... . .Christian4. ......Jain 5 .....Sikh 6 ..Neo-Buddhist7 8..........Any other 9 ....... ..None15) Mother Tongue01. 02... .....Bengali 03........ ..English04 .........Gujarati 05.... .....Hindi 06........ ..Kannada07 .........Konkani 08.... 09 ..Malayalam10 11.... 12 .... ..Sindhi13 .........Tamil 14, , 15 ..Tulu16 .........Urdu 17.... ...............)
(16) Qualifications: (Highest academic qualification attained)
1..........Vernacular School Final or 2.......... MatriculateMiddle School Passed or Non-Matric
3......... Non-Graduate(Intermediate, etc.)
5......... Post Graduate)(M.A., M.Sc., Ph.D., etc.)
4..........Graduate (B.A., B.Sc.,etc.)
(17) Class or Division obtained in the above examination:
1..........First 2.......... Second 3.......... Third/Pass 4..........None

(18) Professional qualifications (attained, actual or equivalent)
1........Nil 2........Primary Teachers’ Training Certificate3..... .. .Secondary Teachers’ Training Certificate (S.T.C.) 4........Teachers’ Diploma (T.D. Indian)5........ .Teachers’ Degree (B.T. or B.Ed.) 6......... Post Graduate Teachers’ Qualification (M.Ed,, etc.) 7......... A Foreign Degree or Diploma in Education. 8....... Diploma in Physical Education (D.P. Ed.) 9....... Drawing Teachers’ Examination (D.T.) 0 ....... Hindi Siksha Sanad (H.S.S.)X......... Examination for Arts’ & Crafts’ TeachersY.........Any other (Specify...... .... )
(19) For how many years have you been engaged in teaching ?
1....... Five & less than five years 2............ Six to ten years3.........11.to 15 years 4..........16 to 20 years 5.......Over :H) years
(20) For how many years have you been engaged in this institution?
1 . .Five & less than five years 2.......... Six to ten years 3....... 11 to 15 years 4.............16 to 20 years5......... Over 20 years
(21) In how many institutions did you work prior to joining here?........... .
(22) What classes do you teach at present: 1..........Primary2..........Secondary 3.........Both
(23) How would you describe the economic circumstances in which you grew up?
1. ..... Difficult or stringent 2...... ....Average 3.......... Well-off4..........Varied from time to time.

OCCUPATIONS: (Before answering questions 24 and 25 kindly read the classification of occupations listed below:)
Group 1 Owner of farm, fishery, dairy, land, etc.
Group 2 Tenant cultivator, peasant proprietor, independent fisherman, etc.
Group 3 Manual labourer in agriculture, dairy, etc.
Group 4 Proprietor/Director/Managing Agent, of big industrial concern,miue etc.; big busiaessraau, wholesale merchant, proprietor of transport; commission agent, etc.
Group 5 Owner of small business, retail shop (groceries, tailoring shop,haircutting saloon etc.); handicral'tsman, independent businessman employed by none and employing none, like tailor, banker, hawker, peddlar, priest, country medicineman, etc.
Group 6 Executive and Scientific/Technical person (degree holder orequivalent); manager, accountant; various types of officers, physicist, analyst, chemist etc.; professional like doctor, lavkryer, lecturer, professor, etc. employed by public or private sector as well as working on his own.
Group 7 Ordinary administrative staflf: clerk, stenographer, cashier,record-keeper, school teacher, retail shop employee, etc.
Group 8 Skilled manual worker (of all types): foreman, machineman,miuer, factory worker, craftsman working as employee of a concern, etc.
Group 9 Unskilled staff: peon, darwan, cooly, non-agricultural daylabourer, etc.
Group 0 Armed forces personnel
Group X Other occupations
(24) What is/was the main source of livelihood of your grandfather (father’s father)?(a) Specify the o ccupatio n ............................ ......... ............(b) Mention the Group to which he belongs from among the Groups
given above; Group No.............................

(25) What is/was the inahi source of livelihood of your fatherf?(a) Specify the occupation...........................................(b) Mention the Group to which he belongs from among the Groups
given above; Group No.....................................
(26) What was the education of your grandfather (father’s father) ?Mark the relevant item.
1...... .. .Illiterate or barely literate 2......... Primary School Educated3.........Middle/High School Educated 4.........College Educated 5.........Educated traditionally in the Sanskritic or Persian system. 6........ 1 cannot say.
(27) What was the education of your father?
1.......... Illiterate or barely literate 2.......... Primary School Educated 3......... Middle/High School Educated 4.......... CollegeEducated 5.........Educated traditionally in the Sanskritic orPersian system 6..........1 cannot say,
(28) Have you ever been to school at a place smaller tlian a tehsil or taluka town?
I ..........Yes 2..........No 3..............1 cannot say
(29) Where did you mainly grow up ?
1.. . ......................................................................................Village 2...........Town 3........ City 4...........Mixed
(30) At any stage in your career have you pursued an occupation other than teaching? (Private tuitions and coaching are regarded as part of your teaching career.)
1...... ...Never 2...........Yes, before I took to teaching.3 ....Yes, for a period between two teaching jobs.4........ .Yes, I have done it /am doing it along with teaching.
(31) Before you took to teaching as a career did you wish to choose any other occupation?
1..........Yes 2......... No 3...........1 cannot say/I had no specificchoice.

(32) Now that you have been in the teaching profession for some time would you likiB to change if there is an opportunity for some other kind of Work (with the same emoluments) ?
1......... Yes, I would like to change 2............It is too late to changenow 3.......... No, I would not like to change 4.......... 1 cannot say
(33) How does your occupation compare with that of your father ?
1........ It is higher in status than the occupation of my father. 2....... It is lower in status than the oooupation of my father. 3........It is about the same in status as the occupation of my father. 4....... 1 cannot say.
(34) (a) Are you a member of any of the teachers’ organisations at thelocal, state or national level?1......................................No 2............. Yes
(b) If yes, please state how often you participate in their activities.3..........Regularly 4...........Occasionally 5...........Seldom
Ohoose one adjective from each of the following pairs of adjectives, by which you would describe the present generation of students;
(35) 1........ Purposive or 2..........Drifting
(36) 1........ Studious or 2..........Negligent
(37) 1........ Capable of independent or 2..........Incapable of indethought pendent thought
(38) 1........ Disciplined or 2..........Indisciplined
(39) 1........ Deferential or 2..........Unrespectful
(40) In your observations have you found that students of the upper castes do better in their studies than students of lower castes ?1..........Yes 2.......... No 3...,......I cannot say
(41) Do students belonging to certain religious groups do better in their lessons than students belonging to certain other religious groups ?1.......... Yes 2.......... No 3.......... 1 cannot say

(42) Can it also be said ot certain linguistic gioups that the academic per* formance of students of one language group is better than that of another?
1....... ..Yes 2.,.........No 3.......... 1 cannot say
(43) What do you thinb is the principal goal of education ?
1.......... To provide economic security 2.......... To achieve higherstatus in society
3.......... To be a cuHnred pexson 4.......... To turn into a goodcitizen
5........ .Any other (Specify) 6.......... 1 cannot say
(44 ) Of the following statements with which do you agree most ?
1........ A student should be concerned with his studies only. 2........A student should also devote time to household duties. 3........A student should also devote time to welfare work.4.. ..A student should also take part in politics.5..........1 cannot say
(45) There is a feeling'that the piesent system of education does not inculcate any sense of values in the younger generation. Do you agree withthis?
1.........yes 2.......... Partially 3.......... No 4........1 cannot say
(46) Generally, how many of your students feel free to consult you in their difficulties, personal or academic?1......... One to five 2 ...,......Six. to ten 3— . ..More than ten 4........None
(47) Do you find parents sufficiently interested in the progress of their children?1.........Most 2.,........Some 3..........Few 4...........None 5........1 cannot say
(48) How often is yout contact with the parents of your students?1..........Regular 2 .........As and when occasion arises3... ......Seldom 4.........Never

(49) How do you keep the parents of your students informed of the progress of their wards ?
1........ Primarily through periodic report cards 2........Primarily through parent-teacher meetings 3........1 do not keep in touch with them 4........Any other (specify.............................................. )
(50) Are any staff meetings held in your institution ?1..........Held regularly 2.Held as and when required3......... Very rarely 4............. Never
(51) Do you feel free to discuss all matters relating to the school at these meetings?1..........Most often 2...........Sometimes 3...........Seldom4..........Never 5.......... Question not applicable
(52) Are decisions taken at these meetings implemented ?1..........Always 2.......... Sometimes 3.......... Seldom4..........Never 5.......... Question not applicable
(53) In your institution are the teachers represented on the Board of Management by a teacher other than the Principal ?1..........Yes 2.......... No
(54) There were two sons of a father, both of whom wanted to help their country. The first son set out to be a holy man. He gave up everything in order to show to his countrymen the path of goodness in this life, and salvation hereafter. The second son set out to establish a big factory, which gave work to hundreds of his countrymen, and which produced inexpensive goods that many people needed. Which of the two sons do you personally admire most ?
1..........First son 2.......... Second son 3.......... 1 am not clearabout my choice
(55) Whether or not a man strives to improve his lot in life depends upon whether he believes in any religion. Do you agree ?
1........Yes, it wholly depends upon whether he has a religion 2....... Yes, it partially depends on religion 3....... No, I don’t think religion has anything to do with it 4....... 1 don’t know

(56) In your view, how much attention do politicians (leaders of the country) pay to the opinions of people like yourself?
1......... A great deal 2 ........ Only a little 3...........None at all 4..........1 do not know
There were two persons talking about how they liked to live. They had different ideas:
One said: I like to accomplish things, I like to see results which are worth working for (1)
The other said: T wish to be left alone to enjoy life as I go along (2)
(57) Which of the two persons, in your opinion, has the better attitude to life?
1..........or 2......... .
(58) Which of the two do you think is nearer to you?
1......... or 2..........
(59) Which do you think most other teachers would say had the better way of living ?
1... ................ or 2.
(60) In your view, which of the following should carry the greatest weight in determining the respect (prestige, honour) a man deserves?
1..........Coming from a well known or 2..........Having a large incomedistinguished family.
3..........Coming from a high caste 4.........Having high education 5..........Any other 6.........1 do not know
(61) Have you ever talked to, or written to some government official or political leader to tell him your opinion on some pubhc issue, such as what the government should do about education ?
1. Many times 2........... Sometimes 3...........Never
20

(62) Here is a drawing of a ladder. Imagine that this ladder represents the Social positions of all the people in the country. This means that in the upper part of the ladder are placed persons who have the highest social position; in the middle of the ladder are those persons who have a middle social position; and in tlie lower pait of the ladder are those persons who have the lowest sodal position.
Now kindly mark in the ladder given below, the position of the people who have the same social position as yours
1
2
3 1
(63) Is it easy or hard for a man to increase his prestige and change his position to move upwards on this ladder?
1..........Easy 2.......... Hard 3...........1 do not know
(64) AH of us have ideas about what people should be like. Here is a list of characteristics you might find in people. Could you select the quality you admire most ?
1.......... Does his work well 2.......... Ambitious3......... Generous 4..........Active in public and social affairs5..........Thrifty 6.......... Keeps to himself7..........Lets no one take advantage of him 8...........Respectful
(65) As head of the institution are you an ex-officio office bearer of the Board of Management ?
1........ Yes ...........No
If not are you an ex-officio member of the Board of Management ?
2......... Yes 3.......... No
(66) Are you satisfied with the support from your management in the task of running the institution?
1......... 1 am satisfied 2........... 1 am partially satisfied 3....... 1 am not satisfied

(67) Are the members of the Board of Management easily accessible in case you need their assistance?
1.........Always 2...........Usually 3......... It depends4 Seldom 5...........Never
(68) Are the higher officers in the Government Department easily accessible when you need their assistance?
L . A l w a y s 2.,.-.....Usually depends4 Seldom 5....... ...Never
(69) Are you satisfied with autonomy in day to day matters?
1..........Satisfied 2...........Partially satisfied 3...........Dissatisfied
(70) How are your administrative decisions communicated to members of the Staff?
1..........By circulars 2...........By meetings 3......... Informally4.........Decisions are not always communicated.
(71) How co-operative are your teachers in administrative matters?
1..........Fully co-operative 2...........Co-operative when requested3..........Indifferent 4...........Never co-operative
(72) How do they co-operate in academic matters ?
1...... ..They co-operate fully 2..........They co-operate whenrequested to do so
3..........They are indifferent 4...........They are non-co-operative
Name
(You need not write your name if you do not wish to)

AN APPEAL*
So much is being said and written these days about what is right and wrong with our system of education. Yet in this discussion there is little material on what teachers, students and parents themselves think about education or what their own particular experience and approaches are. One object of undertaking this series of studies is to provide essentially such material, so that the discussions among planners and policy-makers are facilitated. The study will be carried out simultaneously in eight States in the country. You are one of the individuals being requested to help in this process. You can help us by giving candid answers to the questions asked of you in this questionnaire. The questionnaire seeks to understand your opinions and aspirations regarding education, occupation, etc. This is not a test, and there are no right or wrong answers. Your answers will be treated as confidential.
♦Issued by;The Convener,Office of the Co-ordinating Committee, Tata Institute of Social Sciences, Chembur, Bombay 71 AS.
REGIONAL DIRECTOR
This Section is to be filled in by the Investigator (Please read the Instructions Sheet before filling in Section)
Name of the Investigator....................................Serial No.
(1) Centre: Name............................................................
No. 1
(2) Cluster No.
(3) Community: (State the name of the Community and mark its appropriate number. In the case of villages carefully mark whether village is attached to Community A or B.)

1................COMMUNITY A(Specify Name............................................ )
2................First village attached to Community A(Specify Name............................................. )
3................Second village attached to Community A(Specify Name.............................................)
4........ ......COMMUNITY B(Specify Name.............................................)
5............... First village attached to Community B(Specify Name.............................................)
6............... Second village attached to Community B(Specify Name............................................ )
(4) Institution sponsorship:
1............... Government Institution 2............... Municipal Instituion 3............... Government-aided Registered Society’s Institution 4...............Unaided, Registered Society’s Institution
(5) Type of Institution;
1........... .....Primary School2....... . .....Secondary School (for Men or Co-educational)3...... . .....Secondary School (for Girls only)4........... .....Arts College (for Men or Co-educational)5........... .....Arts College (for Women only)6........ . .....Commerce College (for Men or Co-educational)7........... .....Commerce College (for Women only)8........... .....Science College (for Men or Co-educational)9........... ......Science College (for Women only)0........... .....Medical CollegeX.......... ...... Engineering Collegey .......... ...... Polytechnic
Date:............Siipei’visor.......
Name of Parent/Guardian......... .....................Student.

(10) Section in which the student is studying
1..........Primary 2.......... Secondary
(11) Relationship with the student
1......... Father3......... Father’s Brother5.........Any other
2..........Mother’s Brother4..........Elder Brother
(12) Address: Place.....................Taluka......................District..................
Specify; 1..............Rural 2..................Town ..................City
(13) Age:1..........25 years and below 2.......... 26-30 years 3...........31-35 years4...........36-40 years7...........51-55 years
5 41-45 years 6............... 46-50 years8 56-60 years 9............... 61 years &
above
& 15) Mother Tongue: 01.... 02...,03... 04.,,. 05..........Hindi06... 07,.., 08..........Marathi09... ...... Malayalam 10..........Oriya 11 .....Punjabi12 ,, ...... Sindhi 13.... 14.,. .....Telugu15 ....... Tulu 16.... 17 ,,, — Any other
OCCUPATIONS; (To answer questions on occupation, that follow, kindly refer to the classification of occupations listed below;)
Group 1 Owner of farm, fishery, dairy, land, etc.
Group 2 Tenant cultivator, peasant proprietor, independent fisherman, etc.
Group 3 Manual labourer in agriculture, dairy, etc.
Group 4 Proprietor/Director/Managing Agent, etc, of big industrial concern, mine etc.; big businessman, wholesale merchant, proprietor of transport, commission agent.

Group 5 Owner of small business, retail shop (grocery, tailoring shop, haircutting saloon); handicraftsman; independent businessman employed by none and employing none, like tailor, banker, hawker, peddlar; priest, country medicineman, etc.
Group 6 Executive and scientific/technical personnel (degree holder or equivalent): like manager, accountant; various types of officers; physicist, analyst, chemist etc.; professional like doctor, lawyer, lecturer, professor, etc. employed by public or private sector or working on his own.
Group 7 Ordinary administrative staff: clerk, stenographer, cashier, recordkeeper, school teacher, retail shop employee, etc.
Group 8 Skilled manual workers of all types: foreman, machineman, miner, factory worker, craftsman working as an employee of a concern, etc.
Group 9 Unskilled staff: peon, darwan, cooly, non-agricultural day labourer, etc.
Group O Armed forces personnel
Group X Other occupations
(16) (a) Kindly specify your occupation.......... ........................................
(b) Mark the group from among the Groups above. Group No..........
(17) Income (^Annual): I ...........Rs. 3,000 and below
2........,.Rs. 3,001 to 6,000
3..........Rs. 6,001 to 9,000
4..........Rs. 9,001 to 12,000
5....... .-Above Rs. 12,000
(18) Religion: 1.........Hindu 2...... ....Muslim 3 . . . . . . . . .Christian
4 Jaiii 5........... Sikh 6.........Buddhist
7...... Zoroastrian 8.......... Any other 9.......... ............. ............. ............. None
(19) Caste: (a) The name of the Caste...................... ....................

(b) If the respondent is Hindu, Sikh, Jain or Buddhist, please mark the category into which, according to him, his caste belongs. 1....... The Scheduled Castes 2....... The Other Backward Classes 3....... Other Castes 4....... Not applicable
(20) Education:
1........Illiterate or barely literate 2....... Primary School educated 3....... Middle/High School educated 4....... College educated 5....... Educated traditionally in the Sanskritic or Persian system
(21) How often do you contact your children’s teachers?
1......... Regularly 2..........As and when occasion arises3......... Seldom 4..........Never
(22) In what way do you keep yourself informed of your children’s progress in school ?
1........Periodic school reports 2........Discussions with the child 3........Discussions with teachers 4....... 1 do not keep myself informed,
(23) Are you satisfied with the education your child receives at his/her school?
1......... Satisfied 2........ Partially satisfied 3.............Dissatisfied4......... 1 cannot say 5.......... Any other
(24) How far do you plan to educate your son/daughter ? Mark below:
1........Vernacular, School Final or Middle School. 2........Matriculation, S.S.C. or I.S.C. etc. 3........Technical Training after Matriculation. 4........College Graduation (B.A., B.Sc., M.A., M.Sc., Ph.D., etc) 5........M.B.B.S., L.L.B., B.E., B.Sc. Tech., B.Sc. Nursing,
B.Sc. Home Science, etc.

(25) What do you think is the principal goal of education?
1........ To provide economic security 2....... To achieve higher status in society3. .......To be a cultured person4..........To turn into a good citizen5 . . .Any other (specify)
(26) What do you think your child should be ?
1..........Engineer 2.......... Administrator 3......... Professor4..........Teacher 5.......... Scientist 6......... Writer7..........Businessman 8.......... Others (specify)
(27) Of the following, with which do you agree most ?
1........ A student should be concerned with his studies only 2........ A student should also devote time to household duties 3........ A student should also devote time to welfare work 4........A student should also take part in politics
(28) Would you like your daughter to take up a job after completing her studies ? Mark one of the following.
1....... Yes, I will have no objection. She is free to do as she chooses
2....... 1 would approve of her taking up a job only under certainconditions (e.g. economic necessity)
5........1 do not approve of women working under any conditions.
(29) There were two sons of a father, both of whom wanted to help their country—the first son set out to be a holy man. He gave up everything in order to show to his countrymen the path of goodness in this life, and salvation hereafter. The second son set out to establish a big factory, which gave work to hundreds of his countrymen, and which produced inexpensive goods that many people needed.
Which of the two sons do you personally admire most ?
1. ........ First son 2..........Second Son 3....... 1 am not clear about my choice.

(30) Whether or not a man strives to improve his lot in life depends upon whether he believes in any religion. Do you agree ?
1........Yes, it wholly depends upon whether he has a religion 2........Yes, it partially depends on religion 3........No, I don’t think religion has anything to do with it 4....... 1 don’t know
(31) In your view, how much attention do politicians (leaders of the country) pay to the opinions of people like yourself?
1.........A great deal 2.......... Only a little 3...........None at all4......... 1 do not know
There were two persons talking about how they liked to live. They had different ideas:
One said: I like to accomplish things. I like to see results which are worth working for (1)
The other said; I wish to be left alone to enjoy life as I go along (2)
(32) Which of the two persons, in your opinion, has the better attitude to life?
1......... 2.........
(33) Which of the two do you think is nearer to you ?
1................... 2..;......
(34) Which do you think most other parents would say has the better attitude to life ?
1......... 2.........
(35) In your view, which of the following should carry the greatest weight in determining the respect (prestige, honour) a man deserves ?
1. Coming from a well known or distinguished family 2........Having a large income 3......... Coming from a high caste4..........Having high education 5......... Any other6..........1 do not know.

(36) Have you ever talked to or written to some government official or political leader to tell him your opinion on some public issue, such as what the government should do about education ?1 ...Many times 2...........Sometimes 3...........Never
(37) Here is a drawing of a ladder. Imagine that this ladder represents the social positions of all the people in the country. This means that in the upper part of the ladder are placed persons who have the highest social position; in the middle of the ladder are those persons who have a middle social position; and in the lower part of the ladder are those petsons who ha>?e the lowest social position.
Now kindly mark in the ladder given below, the position of the people who have the same social position as yours.
1
2
3 1
(38) Is it easy or hard for a man to increase his prestige and change his position to move upwards on this ladder ?
1..........Easy 2.......... Hard 3...........1 do not know
(39) All of us have ideas about what people should be like. Here is a list of characteristics you might find in people. Could you select the quality you admire most?
1....... . .Does his work well 2.........Ambitious3..........Generous 4......... Active in public and social affairs5..........Thrifty 6..........Keeps to himself7..........Lets no one take advantage of him.8.........Respectful
Name
(You need not write your name if you do not wish to)

Self Administered Respondent College Teacher
AN APPEAL*
So much is being said and written these days about what is right and wrong with our system of ed.ucation. Yet in this discussion there is little material on what teachers, students and parents themselves think about education or what their own particular experience and approaches are. One object of utidertakiag this series of studies is to provide essentially such material, so that the discussions among planners and policy makers are facilitated. The study will be carried out simultaneously in eight States in the country. You are one of the individuals being requested to help in this process. You can help us by giving candid answers to the questions asked of you in this questionnaire. The questionnaire seeks to understand your opinions and aspirations regarding education, occupation, etc. This Is not a test, and there are no right or wrong answers. Your answers will be treated as confidential.
♦Issued by: REGIONAL DIRECTORThe Convener,Office of the Co-ordinating Committee,Tata Institute of Social Sciences,Chembur, Bombay 71, AS.
This Section is to be filled in by the Investigator (Please read the Instruction Sheet before filling in Section)
Name of the Investigator.................................... Serial No.
(1) Centre; Name.................................... No.
(2) Cluster No,
(3) Community: (State the name of the Community and mark its appropriate number. In the case of villages carefully mark whether village is attached to Community A or B.)

1............ ...COMMUNITY A(Specify Name.................... .........................)
2................. First village attached to Community A(Specify Name..............................................)
3...............Second village attached to Community A(Specify Name...... ......................................)
4...............COMMUNITY B(Specify Name............................................. )
5...............First village attached to Community B(Specify Name-..-.......... .............................)
6...............Second village attached to Commumty B(Specify Name............................................ )
(4) Institution sponsorship:
1........Government Institution 2........Municipal Institution 3........Government-aided Registered Society’s Institution 4........Unaided Registeied Society’s Institution
(5) Type of Institution:
1..........2..........Secondary School (for Men or Co-educational) 3........Secondary School (for Girls only) 4........Arts College (for Men or Co-educational) 5........Arts College (for Women only) 6........Commerce College (for Men or Co-educational) 7........Commerce College (for Women only)8.........Science College (for Men or Co-educational)9..........Science College (for Women only)0. ...Medical CollegeX..........Engineering College Y.......... Polytechnic
D ate:................. Signature of; Investigator.............. ..........................
Supervisor ........................................Instructions:—
Read the Questionnaire carefully. Alternate answers have been provided for several questions. Kindly tick the relevant answer, in the space between the appropriate response number and the responses as shown here:
1..........Yes ...... No Please answer all the qiiestions.

(10) 1 .....20 to 25 years 23 ,, 45 .....41 to 45 years 67,.., 8
1..........Male 2... Female
.56 years and above.
(12) Caste: State the name of your caste.
If you are Hindu, Sikh, Jain or Buddhist, please mark the category to which your caste belongs1..........The Scheduled Castes 2............The Other Backward Classes3..........Other Castes 4..................................Not applicable
(13) Religion:
l... .....Hindu 2..... ....Muslim 3...... ...Christian4 .....Jain 5 ,, ....Sikh 6......7,,. 8 ,,,, ... .Any other 9......
(14 & 15) Mother Tongue:
01,,, 02 .....Bengali 03.... .....English04,,. 05.... .....Hindi 06,,..07 08..,. .....Marathi 09,,.. .....Malayalam10,.. ...... Oriya 11... 12 ,,, .....Sindhi13... ...... Tamil 14,.., .....Telugu 15 ,, ,,, Tulu16,,, ...... Urdu 17 .....Any other (specify... ..................... )
(16) Education:
1 Bachelor’s Degree3 Doctorate
2..........Master’s Degree4..........Degree or Diploma
Foreign University.of a
(17) What was your grandfather’s (father’s father)) education?
1.......... Illiterate or barely literate 2.......... Primary School educated3..........Middle/High School educated 4............College educated5..........Educated in the traditional Sanskritic or Persian system.

(18) What was your father’s education?
1.......... Illiterate or barely literate 2.......... Primary School educated3..........Middle/High School educated 4............College educated5..........Educated in the traditional Sanskritic or Persian system.
(19) Have you been to school at a place smaller than a tehsil or taluka town ?
1..........Yes 2 .......... No 3...........1 cannot say
(20) 'Where did you mainly grow up?
1..........Village 2...........Town 3..... ....City 4..........Mixed
(21) What classes do you teach at present ?
1..........Undergraduate 2.......... Post-graduate 3...........Both
(22) What is your total experience as a college teacher?
1..........5 and less than 5 years 2....... .6-10 years3..........11-15 years 4.........16-20 years5......... 21 years and over
(23) What is your total experience as a college teacher in this institution ?
1......... 5 and less than 5 years 2...........6-10 years3......... 11-15 years 4..........16-20 years5......... 21 years and above
(24) Is the subject you teach from among the subjects that you studied for your Master’s or Doctor’s degree ?
Mark the relevant answer:
I .........The papers which I teach are in the area in which I studiedfor the Master’s/Doctor’s degree.
2.........Some of the papers I teach are in the area in which I studiedfor the Master’s/Doctor’s degree, while others are not.
3 ........None of the papers I teach belong to the area in wluch 1studied.

(25) What is the actual number of class hours you teach per week?
1..........Less than 5 hours per week 2.5-8 hours per week
3..........9-12 hours per week 4.....13-16 hours per week
5..........17-20 hours per week 6.More than 20 hours perweek.
OCCUPATIONS (Before answering questions 26, 27 read the classification of occupations given below and then indicate the appropriate responses)
Group 1 Owner of farm, fishery, dairy, land etc.
Group 2 Tenant cultivator, peasant proprietor, independent fisherman etc.
Group 3 Manual labourer in agriculture, dairy etc.
Group 4 Proprietor/Director/Managing Agent, of big industrial concern, mine etc.; big businessman, wholesale merchant, proprietor of transport; commission agent etc.
Group 5 Owner of small business, retail shop (groceries, tailoring shop, haircutting saloon etc.); handicraftsman; independent businessman employed by none and employing none, like tailor, banker, hawker, peddlar, priest, country medicineman, etc.
Group 6 Executive and scientific/technical personnel (degree holder or equivalent), manager, accountant; various types of officers; physicist, analyst, chemist etc.; professional like doctor, lawyer, lecturer, professor, etc. employed by public or private sector as well as working on his own.
Group 7 Ordinary administrative staff: clerk, stenographer, cashier, record-keeper, school teacher, retail shop employee, etc.
Group 8 Skilled manual workers (of all types): foreman, machineman, miner, factory worker, craftsman working as employee of a concern etc.
Croup 9 Unskilled staff: peon, darwan, cooly, non-agricultural day labourer, etc.

Group O Armed forces personnel-
Group X Other occupations.
(26) What is/was the main source of livelihood of your grandfather (father’s father) ?
(a) Specify the occupation^------------- --------(b) Mention the Group to which it belongs from among the Groups
given above. Group No..................................
(27) What is/was the main source of livelihood of your father ?
(a) Specify the occupation....................................(b) Mention the Group to which it belongs from among the Groups
given above. Group No..............................
(28) How would you describe the economic circumstances in which you grew up?
I ......... Difficult or stringent 2......... Average3......... Well-off 4......... Varied from time to time.
(29) How does your occupation compare with that of your father ?
1........ It is higher in status than the occupation of my father. 2........It is lower in status than the occupation of my father. 3........It is about the same in status as the occupation of my father.
(30) At any stage in your career have you pursued an occupation other than teaching ?
1....... ...Never2.........Yes, before I took to teaching. 3........ Yes, for a period between two teaching jobs. 4........ Yes, I have done it/am doing it along with teaching.
(31) Before you took to teaching as a career did you wish to choose any other occupation?
1 Yes. 2........... No3..........1 cannot say/I had no specific choice.
21

(32) While teaching at a College do you give/or have you ever given tuitions, or coaching, privately to students ?
1 ...Yes. 2 ........ ,No.
What is your total salary per year?
1 ,, . .Upto Rs. 2,400 per annum 2........ ..Rs. 2,401 to Rs. 3,600per annum
3...... ...3,601 to Rs. 4,800 per annum 4....... ..Rs. 4,801 to Rs. 6,000per autrnm
5 .. .6,001 to Rs. 8,000 per annum 6........ ..Rs. 8,001 to Rs. 10,000per annum
7 ...10,001 to Rs. 15,000 8........ ..Rs. 15,001 per annumper annum and over.
Do you have any other source of income besides your salary?
1 ...Yes 2....... ..No.
If yes, approximately how much per year?
3 ...Upto Rs. 500 p.a. 4....... ..Rs. 501 to Rs. 1,000 p.a.5 ...1,001 to Rs. 1,500 p.a. 6....... ..Rs. 1,501 p.a. and over.
(35) Now that you have been in the teaching profession for some time would you like to change it if there is an opportunity for some other kind of work (with the same emoluments) ?
1........Yes, I would Mke to change. 2 ....... It is too late to change now. 3.......No, I would not like to change.
Of the many purposes of undergraduate leaching 3 are listed below. Mark them in the order of priority that you give them in your teaching. (In the space provided below put 1,2, 3 in the order of priority, you would give them).
1 To simplify the ideas in the subject in order to help the student to understand better.
2 To introduce the student to methods of analysing, understanding, and integrating information.
3 To give the student the maximum information in the subject possible.

(36) I Priority................ .......................
(37) II Priority........................................
(38) III Priority....... ............................. .
The College teacher faces a dilemma in the utilization of his time. He can give more or less of it to,
1 Classroom teachingor
2 Advancement of knowledge in the subject.
What according to you should be the relative emphasis given to each?
In the space provided below mark the priority you would give to (1) and (2).
Order of Priority:
(39) I Priority........................................
(40) II Priority..................... .................
(41) In actual practice how is your time distributed between the following three alternatives. Tick the relevant.
1..........Mostly in teaching 2 ...........Mostly in advancement ofknowledge (writing, research
3........... Equally in both etc.)
What priority do you give each of the three alternatives 1, 2 & 3 mentioned in Q. 41,
(42) I Priority........................................
(43) II Priority.......... ....................... .
(44) III Priority........................................
(45) What according to you, should be the medium of instruction at the college level?
1..........Regional Language 2...........Hindi 3..... .. English

(46) What is the medium of instruction in your College ?
(a) State the medium here....................................(b) If it is English do you think that your students understand the
language ?1..........Most 2 .......... Some 3.......... Hardly any.
(47) If it was decided to change the medium of instruction to Hindi or to any other language, would you be able to teach in that language?
1..........Yes 2.......... Yes, with some effort 3.......... No 4....,,...Icannot say.
(48) Do you think that the difficulty regarding textbooks in making the regional language the medium of instruction can be solved?
1..........Yes 2..........Yes if the effort is made3..........No 4..........1 cannot say.
(49) Do you think that the introduction of tutorials etc., has brought the teacher and student closer to each other ?
1..........Yes 2 ...........To some extent 3........... No.
(^ ) Are there any staff meetings in your institution ?
1.........Yes, staff meetings are held regularly. 2........Staff meetings are held as and when required. 3........No staff meetings are held.
(51) Do you feel free to discuss all matters relating to the College at thesemeetings ?
1..........Most often 2.......... Someti mes 3..... Seld om 4........Never 5.......... Question not applicable.
(52) Are decisions taken at these meetings implemented ?
1..........Always 2..........Sometimes 3.......... Seldom4..........Never 5.......... Question not applicable.
(53) In your institution are the teachers represented on the Board of Management by a teacher other than the Principal ?
1..........Yes 2.......... No.

(54) Do you have a sense of participation in the formulation of courses for your subject ?
1..........Yes 2.......... No
(55) Are you generally satisfied with the courses in your subject as they are formulated ?
1..........Yes 2...........No
(56) Are you an individual paying member of any of the academic organisations in your subject such as the Indian Science Congress, Indian Economic Conference, etc. ?
1.........Yes ..........No.If yes, state whether the organizations are at Local/State/National/or International level. 2........ Local 3.......... State 4...........National 5.......... International
(57) Have you contributed any articles or published any books in your subject ?
1........ 1 have only contributed articles. 2....... 1 have only published books. 3....... 1 have contributed articles and published books.
(58) If you have published books please state which of the following categories they belong to
1.........Textbooks 2........ Treatises and Research Reports 3.......Both.
(59) Have you delivered any papers at the meetings of any professional or academic societies ?
1.........Yes 2............No.
(60) Have you served as Professional Consultant to Industry, to any Organization, or to the State or Central Government ?
1...........Yes ......... No.Choose an adjective from each of the following pairs of adjectives, by which you would describe the piesent generation of students:

(61) 1 .....Purposive or 2..... ....Drifting
(62) 1 or 2 ....Negligent
(63) 1 .....Capable of independentthought
or 2 ... .Incapable of independent thought
(64) 1 , or 2...
(65) 1 or 2 ......Unrespectful
(66) la your observations have you found that students of the upper castes do better in their studies than students of lower castes ?
1..........Yes 2.......... No 3............1 cannot say.
(67) Do students belonging to certain religious groups do better in their lessons than students belonging to certain other religious groups ?
1..........Yes 2 ...........No 3........... 1 cannot say.
(68) Can it also be said of certain linguistic groups that the academic performance of one language group is better than that of another?
1..........Yes 2..........No 3.......... 1 cannot say
(69) What do you think is the principal goal of education ?
1......... To provide economic 2......... To achieve higher statussecurity in society
3......... To be a cultured person 4.......... To turn into a goodcitizen
5......... Any other (specify) 6......... 1 cannot say.
(70) Of the following statements with which do you agree most ?
1........A student should be concerned with his studies only. 2....... A student should also devote time to household duties. 3.......A student should also devote time to welfare work. 4....... A student should also take part in politics. 5....... 1 cannot say.

(71) There is a feeling that the present system of education does not inculcate any sense of values in the younger generation. Do you agree with this ?
1.........Yes 2............................ Partially 3..........No4.........1 cannot say.
(72) Generally, how many of your students feel free to consult you in their difficulties, personal or academic?
1..........One to five 2.......... Six to ten 3.......... More than ten4..........None.
(10) There were two sons of a father, both of whom wanted to help their country. The first son set out to be a holy man. He gave up everything in order to show to his countrymen the path of goodness in this life, and salvation hereafter. The second son set out to establish a big factory, which gave work to hundreds of his countrymen and which produced inexpensive goods that many people needed.
Which of the two sons do you personally admire most?
1..........First son 2........Second son 3............ 1 am not clearabout my choice.
(11) Whether or not a man strives to improve his lot in life depends upon whether he believes in any religion. Do you agree?
1.........Yes, it wholly depends upon whether he has a religion. 2.........................Yes, it partially depends on religion3.. .......No, I don’t think religion has anything to do with it.4 ..I don’t know.
(12) In your view, how much attention do politicians (leaders of thecountry) pay to the opinions of people like yourself ?
1.........A great deal 2 ..... ....Only a little 3.,........ None at all4 1 do not know.
There were two persons talking about how they liked to live. Theyhad dilferent ideas:
I One said: I like to accomplish things. I like to see results which are worth working for.2. The other said: I have no particular objectives. I wish to be left alone to enjoy life as I go along.

(13) Which of the two persons, in your opinion, has the better attitude to life ?
1.
(14) Which of the two do you think yourself nearer to ?
1............................................... 2.................
(15) Which do you think most other college teachers will approve of?
1.................................................... 2............................................
(16) In your view, which of the following should carry the greatest weight in determitting the respect (prestige, honour) a man deserves ?
1.........Coming from a well known or distinguished family
2............Having a large income 3.......... Coming from a high caste
4 Having high education 5.......... Any other
6.........1 do not know.
(17) Have you ever talked to or written to some government ojBicial or political leader to tell him your opinion on some public issue, such as what the government should do about education?
1.........Many times 2..................................Sometimes 3........ Never.
(18) Here is the drawing of a ladder. Imagine that this laddar represents the social positions of all the people in the country. This means that in the upper part of the ladder are placed persons who have the highest social position, in the middle of the ladder are persons who have middle social position and in the lower part of the ladder are those persons who have a lower social position.
Now, kindly mark in the ladder given below, the position of the people who have the same social position as yours.

1 1
2 2
3 3
(19) Is it easy or hard for a man to increase his prestige and change his position to move upwards on this ladder ?
I •Easy •Hatd .1 do not know
(20) All of us have ideas about what people should be like. Here is a list of characteristics you might find in people. Could you select the quality you admire most?
1..........Does his work (duty) well 2.......... Ambitious3..........Generous 4 .Active in public and social affairs*5..........Thrifty 6........... Keeps to himself7..........Lets no one take advance of him 8...........Respectful
(21) Many things are changing in our daily life and in the society in whichwe live.
1. Some people think that these changes are, on the whole, for the better.
2. Others think that these changes are, on the whole, for the worse.
What is your opinion in the matter ? 1.......... 2.......
(22) Do you believe that you can have some influence on these changes ?
1.......... Yes 2...........No 3..........I don’t know
Name(You need not write your name if
you do not wish to)

QUESTIONNAIRE No.6
Self Administered Respondent :Head of a college
AN APPEAL*
So much is being said and written these days about what is right and wrong with our system of education. Yet in this discussion there is little material on what teachers, students and parents themselves think about education or what their owa particular exprerience m X approaches are. One object of undertaking this series of studies is to provide essentially such material) so that the discussions among planners and policy makers are facilitated. The study will be carried out simultaneously in eight States in the country. You are one of the individuals being requested to help in this process. You can help us by giving candid answers to the questions asked of you in this questionnaire. The questionnaire seeks to understand your opinions and aspirations regarding education, occupation, etc. This is not a test, and there are no right or wrong answers. Your answer will be treated as confidential.
*Issued by:
The Convener,Office of the Co-ordinating Committee, Tata Institute of Social Sciences, Chembur, Bombay 71, AS.
REGIONAL DIRECTOR
This Section is to be filled in by the Investigator (Please read the Instructions Sheet before Billing in Section)
Name of the Investigator....................................Serial No.
(1) Centre; Name............................................No.
(2) Cluster No.
1 2 3
6 7 8
4 5 6

(3) Community; (State the name of the Community and mark its appropriate number. In the case of villages carefully mark whether village is attached to Community A or B.) 1...............COMMUNITY A
(Specify Name.......................................... 2...............First village attached to Community A
(Specify Name.......................................... 3...............Second village attached to Community A
(Specify Name..........................................4. ... ........ COMMUNITY B
(Specify Name.......................................... 5...............First village attached to Community B
(Specify Name.......................................... 6...............Second village attached to Community B
(Specify Name..........................................
(4) Institution sponsorship: 1................Government Institution 2............... Municipal Institution 3............... Government-aided Registered Society’s Institution4................Unaided, Registered Society’s Institution
(5) Type of Institution: 1............... Primary School 2...............Secondary School (for Men or Co-educational) 3............... Secondary School (for Girls only) 4............. .....Arts College (for Men or Co-educational) 5.....................................Arts College (for Women only) 6.... .......... Commerce College (for Men or Co-educational) 7............... Commerce College (for Women only) 8............... Science College (for Men or Co-ecducational) 9............... Science College (for Women only)0 ...............Medical CollegeX.............. .. .Engineering CollegeY..................Poly technic
Date:..................Signature of: Investigator.........................................Supervisor ........................................

Instructions:—
Read the Questionnaire carefully. Alternate answers have been provided for several questions. Kindly tick the relevant answer, in the space between the appropriate response number and the responses as shown here:
1..........Yes 2..V---NO Please answer all the questions.
(10) Age: 1........ . .20 to 25 years 2..........26 to 30 years3...... ..31 to 35 years 4..........36 to ^ years5,,., . .41 to 45 years 6..........46 to 50 years7 ,, ..51 to 55 years
(H) Sex: 1...... ..Male 2.. ........Female
(12) Caste: State the name of your caste...........................................
If you are Hindu, Sikh, Jain or Buddhist, please mark the category to which your caste belongs
1.........The Scheduled Caste 2.......... The Other BackwardClasses
3.........Other Castes 4........................Not applicable
(13) Religion:
1..........Hindu 2 ....Muslim 3 ..Christian4 , Jain 5 ,,, ....Sikh 6 ..Buddhist7 ...Zoroastrian 8 ....Any other 9 , , ..None
(14 & 15)
01
Mother Tongue:
... .Assamese 02 ,.....Bengali 03 ....English04 ....Gujarati 05 Hindi 06..... ....Kannada07 08 09, ....Malayalam10 . .. 11 , 12,..13 , . Tamil 14 ......Telugu 15 . ...Tulu16 Urdu 17 .....Any other (Specify.. .................. )
(16) Education:
1..........Bachelor’s Degree 2...........Master’s Degree 3.4..........Degree or diploma of a Foreign University.
.Doctorate

(17) What was your grandfather’s (father’s father) education?
1......... Illiterate or barely literate 2....... Primary School educated3..........Middle/High School 4.......... College educated
educated5......... Educated in the Traditional Sanskritic or Persian system.
(18) What was your father’s education?
1..........Illiterate or barely hterate 2............ Primary School educated 3..........Middle/High School 4......................... College educated
educated5..........Educated in the traditional Sanskritic or Persian system.
(19) Have you been to school at a place smaller than a tehsil or taluka town ?
1........-Yes 2..........No 3...........1 cannot say.
(20) Where did you mainly grow up ?
1..........Village 2...........Town 3.......... City 4.......... Mixed
(21) What classes do you teach at present ?
1..........Undergraduate 2...........Post-graduate 3.......... Both
(22) What is your total experience as a college teacher ?
1.........5 and less than 5 years 2................................ 6-10 years 3........ 11-15years
4........ 16-20 years 5 ..........21 years and over
(23) What is youi total experience as a college teacher in this institution?
1.........5 and less than 5 years 2.........6-10 years3..........11-15 years 4,........16-20 years5. ........21 years and above
(24) Is the subject you teach fronji among the subjects that you studied for your Master’s or Doctor’s degree?

Mark the relevant answer:
1........The papers which I teach are in the area in which I studied forthe Master’s/Doctor’s degree.
2....... Some of the papers I teach are in the area in which I studied forthe Master’s/Doctor’s degree, while others are not.
3....... None of the papers I teach belong to the area in which 1studied.
(25) What is the actual number of class hours you teach per week ?
1..........Less than 5 hours per week 2..........5-8 hours per week3..........9-12 hours per week 4..........13-16 hours per week5..........17-20 hours per week 6..........More than 20 hours
per week
OCCUPATIONS (Before answering questions 26,27, read the classification of occupations given below and then indicate the appropriate responses)
Group 1 Owner of farm, fishery, dairly, land, etc.
Group 2 Tenant cultivator, peasant proprietor, independent fisherman, etc.
Group 3 Manual labouier in agriculture, dairy, etc.
Group 4 Proprietor/Director/Managing Agent of big industrial concern, mine etc.; big businessman, wholesale merchant, proprietor of transport; commission agent, etc.
Group 5 Owner of small business, retail shop (groceries, tailoring shop, haircutting saloon etc.); handicraftsman; independent businessman employed by none and employing none, like tailor, banker, hawker, peddlar, priest, country medicineman, etc.
Group 6 Executive and scientific/technical personnel (degree holder or equivalent), manager, accountant; various types of officers; physicist, analyst, chemist etc,; professional like doctor, lawyer, lecturer, professor, etc. employed by public or private sector as well as working on his own.

Group 7 • Ordinary administrative staff; clerk, stenographer, cashier,record-keeper, school teacher, retail shop employee, etc.
Group 8 Skilled manual workers (of all types): foreman, machineman, miner, factory worker, craftsman working as employee of a concern, etc.
Group 9 Unskilled staff: peon, darwan, cooly, non-agricultural daylabourer, etc.
Group D Armed forces personnel
Group X Other occupations.
(26) What is/was the main source of livelihood of your grandfather (father’s fkther) ?
(a) Specify the occupation...................... .....................
(b) Mention the Group to which it belongs from among the Groupsgiven above. Group No.............................................
(27) Wat is/was the main source of livelihood of your father ?
(a) Specify the occupation............................................
(b) Mention the Group to which it belongs from among the Groupsgiven above. Group No.............................................
(28) How would you describe the economic circumstances in which you grew up?
1......... Difficult or stringent 2........... Average3......... Well-off 4........ .Varied from time to time.
(29) How does your occupation compare with that of your father ?
1 .........It is higher in status than the occupation of my father. 2...................... It is lower in status than the occupation of my father. 3....... .It is about the same in status as the occupation of my father.
(30) At any stage in your career have you pursued an occupation other than teaching ?
1........ Never 2.......Yes, before I took to teaching. 3....... Yes, for a period between two teaching jobs. 4.......Yes, I have done it/am doing it along with teaching.
(31) Before you took to teaching as a career did you wish to choose any other occupation ?
1..........Yes 2............ No3.........1 cannot say/I had no specific choice.
(32) While teaching at a College do you give/or have you ever given tuitions, or coaching privately, to students ?
1..........Yes 2............ No
(33) What is your total salary per year ?
1....... Upto Rs. 2,400 per annum 2....... Rs. 2,041 to Rs, 3,600 per annum 3....... 3,601 to R&. 4,800 per annum 4....... Rs. 4,801 to Rs, 6,000 per annum 5....... Rs. 6,001 to Rs. 8,000 per annum 6....... Rs. 8,001 to Rs. 10,000 per annum 7....... Rs. 10,001 to Rs. 15,000 per annum 8....... Rs. 15,001 per annum and over
(34) Do you have any other source of income besides your salary?
1.......... Yes 2............ No
If yes, approximately how much per year ?
3.........Upto Rs. 500 p.a. 4...........Rs. 501 to Rs. 1,000 p.a.5......... Rs. 1,001 to Rs. 1,500 p.a. 6........... Rs. 1,501 p.a. and bver

(35) Now that you have been in the teaching profession for some time would you like to change it if there is an opportunity for some other kind of work (with the same emoluments) ?
1.......Yes, I would like to change 2.......It is too late to change now 3.......No, I would not like to change.
Of the many purposes of undergraduate teaching 3 are listed below. Mark them in the order of priority that you give them in your teaching. (In the provided below put 1,2, 3 in the order of priority, you wouldgive them).
1 To simplify the ideas in the subject in order to help the student to understand better
2 To introduce the student to methods of analysing, understanding, and integrating information.
3 To give the student the maximum information in the subject possible.
(36) I Priority....... .....................
(37) II Priority............................
(38) III Priority.............................
The College teacher faces a dilemma in the utilization of his time. He can give more or less of it to,
1 Classroom teachingor
2 Advancement of knowledge in the subject
What according to you should be the relative emphasis given to each?
In the space provided below mark the priority you would give to(l)and(2)
Order of Priority:
(39) I Priority................ ............
\(40) II Priority................................\2 2

(41) In actual practice how is your time distributed between the followingthree alternatives. Tick the relevent.
1..........Mostly in teaching 2......... Mostly in advancement of knowledge (writing, research etc.) 3........ Equally in both
What priority do you give each of the three alternatives 1, 2 & 3 mentioned in Q.41.
(42) I Priority..............................
(43) n Priority.............................
(44) III Priority.............................
(45) What according to you, should be the medium of instruction at the college level?
1..........Regional Language 2...........Hindi 3...........English
(46) What is the medium of instruction in your College ?
(a) State the medium here.............................
(b) If it is English do you think that your students understand the language ?
1..........Most 2.......... Some 3.......... Hardly any
(47) If it was decided t o change the medium of instruction to Hindi or to any other language, would you be able to teach in that language ?
1..........Yes 2.......... Yes with some effort 3.......... No4......... 1 cannot say
(48) Do you think that the diflSculty regarding textbooks in making the regional language the medium of instruction can be solved ?
1......... Yes 2..........Yes if the effort is made3......... No 4......... 1 cannot say

(49) Do you think that the introduction of tutorials, etc., has brought the teacher and student closer to each other?
1...... ...Yes 2....... ...To some extent 3........... No
(50) Are there any staff meeting in your institution ?
1.........Yes, staff meetings are held regularly 2........Staff meetings are held as and when required 3........No staff meetings are held
(51) Do you feel free to discuss all matters relating to the College at these meetings ?
1..........Most often 2......... .Sontetimea 3...........Seldom 4........Never 5...........Question not applicable
(52) Are decisions taken at these meetings implemented ?
1..........Always 2.......... Sometimes 3...........Seldom4..........Never 5...........Question not applicable
(53) In your institution are the teachers represented on the Board of Manager ment by a teacher other than the Principal?
1..........Yes 2...........No
(54) Do you have a sense of participation in the formulation of courses for your subject ?
1..........Yes 2..... ....No
(55) Are you generally satisfied with the courses in your subject as they are formulated ?
1...... ....Yes 2 .........No
(56) Are you an individual paying member of any of the academic organisations in your subject such as the Indian Science Congress, Indian Economic Conference, etc. ?
....... Yes 1........... No

If yes, state whether the organizations are at Local/State/National/or International level.
2... ..... Local 3...........State 4...........National5......... International
(57) Have you contributed any articles or published any books in your subject ?
1......... 1 have only contributed articleshave only published books
3... ,... I have contributed articles and published books.
(58) If you have published books please state which of the following categories they belong to
1........ Textbooks 2....... Treatises and Research Reports 3....... Both
(59) Have you delivered any papers at the meetings of any professional or academic societies ?
1......... Yes 2...........No
(60) Have you served as Professional Consultant to Industry, to any Organization, or to the State or Central Government ?
1......... Yes 2............No
Choose an adjective from each of the following pairs of adjectives, by which you would describe the present generation of students:
(61) 1..........Purposive or 2.......... Drifting
(62) 1.........Studious or 2..........Negligent
(63) 1........Capable of independent or 2..........Incapable of indepen-thought pendent thought
(64) 1........Disciplined or 2...........Indisciplined
(65) 1........ Deferential or 2..........Unrespectful

(66) In your observations have you found that students of the upper castes do better in their studies than students of lower castes ?
1..........Yes 2...........No 3.......... 1 cannot say
(67) Do students belonging to certain religious groups do better in their lessons than students belonging to certain other religious groups.
1..........Yes 2........... No 3...........1 cannot say
(68) Can it also be said of certain linguistic groups that the acadeii^c performance of one language group is better than that of another ?
1......... Yes 2........... No 3...........1 cannot say
(69) What do you think is the principal goal of education?
1..............To provide economic 2.............To achieve highersecurity status in society
3..............To be a cultured person 4.............To turn into a goodcitizen
5. . ........... Any other (specify) 6.............1 cannot say
(70) Of the following statements with which do you agree most?
1............A student should be concerned with his studies only. 2............A student should also devote time to household duties. 3............A student should also devote time to welfare work. 4............A student should also take part in politics. 5......... ..I cannot say
(71) There is a feeling that the present system of education does not inculcate any sense of values in the younger generation. Do you agree with this ?
1..........Yes 2...........Partially 3...........No4 1 cannot say
(72) Generally, how many of your students feel free to consult you in their difficulties, personal or academic ?
1... One to five 2 .......... Six to ten 3...........More than ten4. ...None

(10) There were two sons of a father, both of whom wanted to help their country. The first son set out to be a holy man. He gave up everything in order to show to his countrymen the path of goodness in this life, and salvation hereafter. The second son set out to establish a big factory, which gave work to hundreds of his countrymen, and which produced inexpensive goods that many people needed.
Which of the two sons do you personally admire most ?
1.........First son 2........ Second son3..........1 am not clear about my choice.
(11) Whether or not a man strives to improve his lot in life depends upon whether he believes in any religion. Do you agree ?
1........Yes, it wholly depends upon whether he has a religion 2....... Yes, it partially depends on religion 3....... No, I don’t think religion has anything to do with it 4....... 1 don’t know
(12) In your view, how much attention do politicians (leaders of the country) pay to the opinions of people like yourself?
1..........A great deal 2...........Only a little 3.......... None at all4.........1 do not know
There were two persons talking about how they liked to live. They had different ideas:
1. One said; I like to accomplish things. I like to see results whichare worth working for.
2. The other said: I have no particular objectives. I wish to be leftalone to enjoy life as I go along.
(13) WWch of the two persons, in your opinion, has the better attitude to life?
1............................... 2..............................
(14) Which of the two do you think yourself nearer to ?
1................................. 2................................

(15) Which do you think most other college teachers will approve of?
1...................................................................... .. 2 . . ........................................................................
(16) In your view, which of the following should carry the greatest weight in determining the respect (prestige, honour) a man deserves ?
1..... ...Coming from a well known or distinguished family 2........Having a large income 3.........Coming from a high caste4......... Having high education 5.........Any otlidr6.........1 do not know
(17) Have you ever talked to or written to some government ofhcial or political leader to tell him your opinion on some public issue, such as what the government should do about education?
(18)
1..........Many times 2.......... Sometimes •Never
Here is the drawing of a ladder. Imagine that this ladder represents the social positions of all the people in the country. This means that in the upper part of the ladder are placed persons who have the highest social position, in the middle of the ladder are persons who have middle social position and in the lower part of the ladder are those persons who have a lower social position.
Now, kindly mark in the ladder given below, the position of the people who have the same social position as yours.
1
2
1.
2 .
3.
(19) Is it easy or hard for a man to increase his prestige and change his position to move upwards on tliis ladder ?
1 .Easy Hard 3.......... 1 do not know

(20) All of US have ideas about what people should be like. Here is a list of characteristics you might find in people. Could you select the quality you admire most ?
1..........Does his work (duty) well 2...........Ambitious3......... Generous 4...........Active in public and social affairs5......... Thrifty 6...................................... Keeps to himself7..........Lets no one take advantage of him 8...........Respectful
(21) Many things are changing in our daily life and in the society in which we live.
1. Some people think that these changes are, on the whole, for the better.
2, Others think that these changes are, on the whole, for the worse.
What is your opinion in the matter? 1.......... 2..........
(22) Do you believe that you can have some influence on these changes ?
1.........Yes 2.........No 3.....1 don’t know
(23) As head of the institution are you an ex-officio office bearer of the Board of Management ?
1........Yes ........... No
If not are you an ex-offico member of the Board of Management ?
2.........Yes 3.........No
(24) Are you satisfied with the support from your management in the task of running the institution ?
1.........1 am satisfied 2............ 1 am partially satisfied 3....... 1 am not satisfied
(25) Are the members of the Board of Management easily accessible in case you need their assistance ?
1..........Always 2.........Usually 3...........It depends 4..........Seldom 5.........Never

(26) Are the higher officers in the Government Department easily accessible when you need their assistance?
1..........Always 2......... Usually 3.It depends4......... Seldom 5......... Never
(27) Are you satisfied with autonomy in day to days matters ?
1..........Satisfied 2...........Partially satisfied 3.......... Dissatisfied.
(28) How are your administrative decisions communicated to members of the staff?
I ..........By circulars 2 ...........By meetings 3...........Informally4..........Decisions are not always communicated.
(29) How co-operative are your teachers in administrative matters ?
1 ......Fully co-operative 2.........Co-operative when requested3.........Indifferent 4.........Never co-operative
(30) How do they co-operate in academic matters ?
1..........They co-operate fully 2.......... They co-operate when requested to do so
3..........They are indifferent 4.......... They are non-co-operative
Name(You need not write your name if
you do not wish to)

NOTE ON SAMPLE DESIGN
A. Sampling at the Headquarters, Bombay.
1. The object of the present project is to study the sociology of education in three dimensions; (1) attitude to education per se, (2) aspirations for the future with reference to educational attainments, and (3) image of those engaged in imparting education to those receiving education and vice versa.
2. The project will have 3 types of subjects as “reference groups” . They are enumerated as follows:
(i) The students of the following 3 categories, viz, (a) those in the last year (^Standard X or Standard XI as the case may be) of the Secondary Schools (excluding those run by the Christian Missionaries or declared as Public Schools, since the process of education in these institutions has been assumed to be different from that in the common run of secondary schools); (b) those in the last year class of the Undergraduate Colleges of Arts/Science/Commerce; (c) those in the last year class of specialized institutions like the Medical College, Engineering College and Polytechnics.
(The reason behind restricting the scope of the project to only the last year students of the respective courses is to provide them with the opportunity of maximum exposure under each educational denomination. It should also be mentioned that in consideration of their age and ability as respondents, the students of the primary schools have been excluded from the scope of the project. Furthermore, in view of the time and money available for the study, the middle school students or teachers have been excluded from the survey).
(ii) All the teachers of the Primary and Secondary Schools selected, and the teachers allotted to the final year classes of the Undergraduate Colleges and the specialized institutions selected.
(As diverse subjects are taught with various emphases in the Undergraduate Colleges or the institutions of specialization, they are likely to contain large numbers of teachers).
All of them, therefore, could not be surveyed due to the restrictions of cost and time for the survey. On the other hand, since the teachers in the final year classes would be directly connected with the final year students, it was decided to include only the teachers for the final year in colleges and institutions of specifilization within the scope of the project.)
(iii) The parents of the last year class students in the Primary and the Secondary Schools selected, for their attitude to education per se and

their aspirations for the future vis-a-vis educational attainments of their wards would be relevant to the present study.
Since in our society the male parents generally take more initiative regarding the education of their wards, the present project would refer to them only in view of the available time and money. Also for the same reason, the parents of the students to be surveyed in the colleges and the institutions of specialization would be excluded from the scope of the present enquiry, for they are more likely to be residing in places other than where these institutions are situated.)
3. For the present, the project will be conducted in 8 States, representing broadly the eastern, western, northern and the southern regions of India. Two contiguous States have been selected from those within each of these four regions, so that the variations in the social and cultural attributes of the peoples of India (as possibly associated with the theme of the study) may be brought to light to the extent possible. Accordingly, the following States have been selected; (a) West Bengal and Orissa in the eastern region,(b) Gujarat and Maharashtra in the western region (c) Punjab and Rajasthan in the northern region, and (d) Mysore and Andhra in the southern region.
4. Within each of these eight States, all the territorial units (i.e. cities, towns and villages) have been treated as distinct “communities” for this survey. These communities have been classified accordingly as they contain:(1) an Undergraduate College of the type mentioned earlier but for the girls only —GC, (2) the same for the boys only or co-educational = BC, (3) a secondary school of the type mentioned above but for the girls only = GS,(4) the same for the boys only or co-educational = BS. In this way, “clusters” of communities have been distinguished and identified for each of the 8 States according as a cluster contains all the above 4 categories, particular combinations of 3 or 2 out of the total 4 categories, or only 1 particular category. The capital city of a State, however, has been treated always as one cluster (containing only one community obviously) in view of the fact that this community deserves special attention as the main seat of learning in the State.
5. These clusters of communities for each State have been identified at the Headquarters of the Coordinating Committee of the Studies in the Sociology of Education (Bombay) with the help of the latest available lists of recognized high/higher secondary schools and colleges. Next, two communities have been selected at random from all the communities in each cluster in a State. The procedure, of course, was redundant for the capital city since it is equated to a single community. The State-wise distribution of clusters and the numbers of selected communities are given in Table 1 below.

TABLE 1
Cluster Number of coraraunities selected at random in a State
I I I 1§ IK(1) (2) (3) (4) (5) (6) (7) (8) (9) (10) (11)
Capital of StateOther communities comprisingBS, GS, BC & GCBS, GS, BCBS& BCBS &GSBSGS
0
1II
IIIIV V
VI
1 1 1 1 1 1 1 1
16161416164
No. of communities to be surveyed in a State.
13 11 11 11 11 13 11 90
6. After the selection of the communities, the Headquarters of the Co-ordinating Committee (Bombay) have also selected the educational institutions (GC/BC/GS/BS) to be surveyed in a community. For the cluster representing the capital city of the State, 2 GC, 2 BC, 2 GiS and2 BS have been chosen at random. For each of the communities in the remaining clusters, 1 GS and/or 1 BC and/or 1 GS and/or 1 BS have been selected at random, depending upon the existence of GC, BC, GS and BS in the respective communities. Additionally, the Headquarters of the Coordinating Committee (Bombay) have specified the “branch” of the selected GC and BC which should be surveyed by the respective Centres in case there exists more than one branch in the selected colleges.
7. The Headquarters at Bombay have also selected at random one Medical College (MC), one Engineering College (EC) and one Polytechnic (PT) from (a) the cluster representing the capital city of the State, and (b) the remaining clusters considered together, respectively. The distribution of the numbers of such institutions to be surveyed in the respective States along with that of the Undergraduate Colleges and Secondary Schools of the “general” categories mentioned in para 6 is given in Table 2.

TABLE 2
No. of institutions (other than the PrimaryState Schools) selected randomly in a State____________
_________________ GC ~ BC GS BS MC EC PT Total(1)_________ (2) (3) (4) (5) (6) (7) (8) (9)
Andhra 4 6 8 10 2 2 2 34West Bengal 4 8 10 12 2 2 2 40Gujarat 4 8 8 12 2 2 2 38Maharashtra 4 8 8 1 2 2 2 2 38Mysore 4 8 8 12 2 2 2 38Orissa 4 8 8 12 2 2 2 38Punjab 4 8 10 12 2 2 2 40R a ja s th a n _________4 8 8 12 2 2 2_______ ^8 States combined 62_____ 62_____ 68_____ 94_____ 16_____ 16_____ lj5______ 304
8. The total list of samples for the survey, thus obtained, has been sent to all the Centres. However, if there is any doubt or query about the formation of the clusters, the selection of the communities, and that of the sampled institutions therein, the Centres are requested to inform the Headquarters of the Coordinating Committee (Bombay) immediately.
B. Sampling at the Regional Centres
9. Given the list of the selected communities in the States' as well as the community-wise identification of the selected institutions specified as GS, BC, GC, BC, MC, EC, and PT, it remains for the respective Centres to select: (a) the primary schools (PS) to be covered in the course of the present enquiry, and (bj the appropriate respondents from each type of the selected educational institutions.
10. So far as the Primary Schools are concerned, every Centre should proceed in two stages. In the first stage, the Centre is to prepare for each of the communities selected a list of all those schools which are designated as Primary Schools as well as those Middle, High and Higher Secondary Schools which have their own “primary departments” . From this list (except that for the capital city of the State) one institution (the “primary department” of a Middle, High or Higher Secondary School also representing, thereby, an “institution” for the present purpose) is to be selected at random. For the capital city, two such institutions are to be randomly selected from the relevant list.
11. In the second stage, the Centre is to prepare separate lists of all the communities (territorial units) within walking distance of 4-6 miles from

each of the communities sampled by the Headquarters for the respective State (excluding its capital city), where there is at least one Primary School or a Middle School with a “primary department” . These lists must exclude any community which possesses at least one Secondary School; for such communities have been taken into account when choosing the already selected communities at the Headquarters (Bombay). Instead: (a) the presently-listed “peripheral” communities will not be too near the already selected communities to be influenced directly by them, and (b) they would give some representation of all those communities in a State which have no Secondary School but possess the Primary School or the “primary department” in Xhsb Middle &hool.
12. From each of these lists of “peripheral” communities, two communities are to be selected at random. Thereafter, if there exists more than one Primary School (as well as Middle School with the “primary department”) in any one of the “peripheral” communities thus selected, only one primtary school or primary department is to b@ chosen randomly. Otherwise, the single Mmary* School or primary d ^ rtm e n t will be automatically selected. The State-wise distribution of the Primary Schools to be selected by a Centre is given in Table 3.
TABLE 3
No. of primary schools to be surveyed
StateCommunities selected at
the Headquarters
‘Peripheral’ Communities selected by the Centres
Total
(1) (2) (3) (4)Andhra 10 16 26West Bengal 14 24 38Gujarat 12 20 32Maharashtra 12 20 32Mysore 12 20 32Orissa 12 20 32Punjab 14 24 38Rajasthan 12 20 32
8 States combined 98 164 262
13. Who should be the “subjects” of our enquiry (i.e. the respondents of this survey) has been already specified in para 2 of this Note. However with respect to some of them, the sampling procedure may have

to be undertaken at the Regional Centres or in tlie respective communities in a State during the course of investigation. This, therefore, is explained below.
14. Since all the full-time teachers of the selected Primary and Secondary Schools are to be our “subjects” , the school teachers as respondents do not require any sampling. However, when listing the Secondary School teachers in one such institution sampled, care must be taken to avoid including also the teachers for the “primary departments” in the list. Similarly, when the “primary department” of a Secondary School has been sampled to represent the Primary School in a community, the appropriate list of teachers must exclude those who teach in the “secondary department” .
15. As regards the sample of college teachers, with respect to the particular branch of a sampled college as given in the sample list sent from the Headquarters (Bombay), only those full-time teachers should be the respondents who teach in the final year classes of that particular branch in the sampled college. Similarly, for the specialized institutions like the Engineering or Medical College and the Polytechnics, all full-time teachers in the final year classes of the sampled institutions are to be our respondents.
16. The principals of all the colleges sampled (specialized institutions or not) would be the respondents for a particular set of questionnaires (as supplied to the Regional Centres), and the same would refer to the heads of the polytechnics as well as of the Secondary and Primary Schools.
17. As regards the selection of students as respondents, the following points are to be noted in the case of thp students of the sampled Undergraduate Colleges; the particular branch to be covered in each of them has already been mentioned in the sample list sent from the Headquarters. This specific branch has been selected at random at the Headquarters where two or more branches exist in one sampled college; otherwise the single branch in the sampled college has been chosen automatically. Now, if all the final year students of a branch (thus selected) attend their classes together, then all of them are to be our respondents. Also where the students concerned are divided under various subject-wise groupings but all of them together attend the classes for any common subjects, then all these final year students attending the common class are to be considered as our respondents. In any other situation, however, two or more subject-wise groupings of the final year students are to be chosen by randomisation until the sample size just exceeds 100 in a college in the capital city of the State or 50 in any college elsewhere.

18. In respect of the student-respondents of the specialized institutions, however, the sampling procedure to be adopted by the Regional Centres would have to be a little more elaborate because the Headquarters has supplied to the Centres only the names of the specialized institutions to be surveyed, while the number of students for the final year classes may be very many since these institutions may have various subjects for specialization (e.g. in an Engineering College). An institution of Polytechnics also would have various subjects in its curriculum, while subject-wise branching may or may not be possible in the case of a Medical College. For the Engineering Colleges and the Polytechnics (and, wherever possible, for the Medical Colleges), therefore, one or more branches (as equal to the subjects of specialization) would have to be sampled at random until the sample size of the final year students in the sampled “branches” just exceeds 100 for that particular Engineering College or the Polytechnics in the capital city, and the corresponding sample size just exceeds 50 in the similar institutions sampled elsewhere in the State. These students, thus w’ould be our respondents. For the Medical College, however, they may refer to all those present in any final year class, if it is not possible to make any subgect-wise grouping of the final year students therein.
19. In a High or Higher Secondary School sampled, all the students in the final year class are to be considered as our respondents where all of them are grouped together. However, due to the admission of a large number of students or the existence of various subject-wise groupings of the students, the final year class of a sampled Secondary School may be sub-divided into different sections, and each of these sections may follow its own routine. In such a situation, one of the sections is to be drawn at random, and only the students of that section are to be our respondents. But, if a final year class in that institution is being held jointly for the students of all these sections for any common subject, then all the students attending the common class are to be our respondents.
20. As mentioned in para 2 of this Note the students of the Primary Schools are not to be considered as our “subjects” of enquiry. But, with reference to the sampled Primary Schools in the “peripheral” communities, the parents of all the students registered in the final class of the Primary Schools or the “primary departments” (usually class IV) of the sampled Middle Schools are to be our respondents. On the other hand, with respect to the Primary Schools or the “primary departments” sampled in the communities recorded in the sample list sent from the Headquarters, only the parents of half thm total number of students registered in the final class are to be surveyed. The procedure for this selection should be to contact the “parents” of every alternate student in the list.
21. The procedure of selection of the “alternate” students should be

as follows. With reference to 2 “peripheral” communities (= 2 Primary Schools or “primary departments”) in respect of a community sampled at the Headquarters, as well as with reference to 2 communities (= 2 Primary Schools or “primary departments”) in one cluster as identified at the Headquarters and indicated in the sample list sent therefrom, the alternate numbers should be the even numbers as 2, 4, 6, . . . for the Primary School or the “primary department” of one community and the odd numbers as 1, 3, 5, . . . for the Primary School or the “primary department” in the other community in the same cluster.
22. As regards the parents of the Secondary School students as our respondents, only half the total number of the sampled students in each sampled institution is to be considered. The procedure of selection by odd and even numbers for the corresponding institutions in two communities belonging to the same cluster should be as detailed for the parents of the Primary School students in para 21.
The Principle to be Followed
23. It will be observed that at every stage of selection the principle of randomization has been followed by the Headquarters and suggested to the Centres. The idea is to introduce an element of standardization and avoid any subjective bias in the selection procedure. At the same lime, of necessity, the selection procedure to be followed by a Centre is to be very sim le indeed, so that it may be applied even by a field worker without any formal statistical training. Therefore, some of the very simple but well-known devices of random selection have been illustrated in the book of “Instructions” prepared at the Headquarters in Bombay and supplied to every Centre. The Headquarters expect the Centres to adhere strictly to the technique of random selection as and when necessary.
24. The Headquarters also consider that the importance of this technique, though it may appeal to be a very elementary one, cannot be overestimated in any way, for sufficient background information is not available about the field for the present study. To quote Professor P. G. Mahalanobis in this context: “When the frame consists of only a list of units and nothing else whatsoever is known about the field, the problem of sample design reduces to the simple case of selecting for investigation a suitable number, n, of elementary units in a random manner so that valid inferences may be drawn from the sample by appopriate methods. It is only when some previous information (which may be only approximate in nature) is available about the field that the problem of the sample design becomes important.” [P. C. Mahalnobis—“Some aspects of the design of sample surveys”, Sankhya: The Indian Journal o f Statistics, 12, (1 & 2), 1952,3-4].23 N IE P A -D C

Sub. Natirnr:! Systems Unit, N&liofi-1 o f FdTcationalPlanning n;.-! A m i ■ istiJtion 17-B,SfiAui-fc;ic. - rev.rdM -n0016DOC. Ko....................................
.................... ..........