Field Guide - i-Tree
57
Eco Field Guide 10.06.2021 v6.0
-
Upload
khangminh22 -
Category
Documents
-
view
6 -
download
0
Transcript of Field Guide - i-Tree

Eco
Field Guide
10.06.2021 v6.0

i-Tree is a cooperative initiative

i
i-Tree is a state-of-the-art, peer-reviewed software suite from the USDA Forest Service that provides urban and community forestry analysis and benefits assessment tools. The i-Tree tools help communities of all sizes to strengthen their urban forest management and advocacy efforts by quantifying the environmental services that trees provide and assessing the structure of the urban forest. i-Tree has been used by communities, non-profit organizations, consultants, volunteers, and students to report on the urban forest at all scales from individual trees to parcels, neighborhoods, cities, and entire states. By understanding the local, tangible ecosystem services that trees provide, i-Tree users can link urban forest management activities with environmental quality and community livability. Whether your interest is a single tree or an entire forest, i-Tree provides baseline data that you can use to demonstrate value and set priorities for more effective decision-making. Developed by USDA Forest Service and numerous cooperators, i-Tree software is in the public domain and available by request through the i-Tree website (itreetools.org). The Forest Service, Davey Tree Expert Company, Arbor Day Foundation, Society of Municipal Arborists, International Society of Arboriculture, Casey Trees, and State University of New York College of Environmental Science and Forestry have entered into a cooperative partnership to further develop, disseminate, and provide technical support for the suite.
The use of trade, firm, or corporation names in this publication is solely for the information and convenience of the reader. Such use does not constitute an official endorsement or approval by the U.S. Department of Agriculture or the Forest Service of any product or service to the exclusion of others that may be suitable. The software distributed under the label “i-Tree 2019 Suite” is provided without warranty of any kind. Its use is governed by the End User License Agreement (EULA) to which the user agrees before installation.
The i-Tree Development Team actively seeks feedback on any component of the project: the software suite itself, the manuals, or the process of development, dissemination, support, and refinement. Please send comments through any of the means listed on the i-Tree support page: itreetools.org/support/.
About i-Tree
Disclaimer
Feedback

ii
The 2019 i-Tree software suite includes the following urban forest analysis tools and utility programs:
i-Tree Eco provides a broad picture of the urban forest or trees in your study area. It is designed to use field data from complete inventories of trees or randomly located plots throughout a community along with local hourly air pollution and meteorological data to quantify urban forest structure, environmental effects, and value to communities. i-Tree Hydro is the first vegetation-specific urban hydrology model. It is designed to model the effects of changes in urban tree cover and impervious surfaces on hourly stream flows and water quality at the watershed level. i-Tree Vue (legacy) allows you to make use of the freely available National Land Cover Database (NLCD) satellite-based imagery to assess your community’s land cover, including tree canopy, and some of the ecosystem services provided by your current urban forest. The effects of planting scenarios on future benefits can also be modeled.
i-Tree Landscape is an online tool that allows you to explore geospatial data for an area of interest. It makes use of datasets, such as land cover and U.S. Census data, to provide local information, tree benefits, and planting prioritization by designated management boundaries. i-Tree Design is a simple online tool that provides a platform for assessments of individual trees at the parcel level. This tool links to Google Maps and allows you to see how tree selection, tree size, and placement around a building affects energy use and other benefits. This tool not only estimates tree benefits for the current year, but also projects benefits over time to a user-specified year in the future. i-Tree Canopy offers a quick and easy way to produce a statistically valid estimate of land cover types (e.g., tree cover) using aerial images available in Google Maps. The data can be used by urban forest managers to estimate tree canopy cover, set canopy goals, and track success; and to estimate inputs for use in i-Tree Hydro and elsewhere where land cover data are needed. Canopy also estimates tree benefits based on the amount of tree cover in your study area.
i-Tree Products
Desktop Applications
Web Applications

iii
i-Tree Species is designed to help users select the most appropriate tree species based on the species potential environmental services and geographic area. Users select and rank the importance (0-10) of each environmental service desired from trees. The program then calculated the best tree species based on the user-provided weighting of environmental benefits of tree species at maturity. i-Tree MyTree is a quick and easy mobile tool allowing you to explore the benefits provided by the trees near you. i-Tree Database is an online system designed for international users outside of the United States, Canada, Mexico, South Korea, Colombia, many countries in Europe, and Australia to submit properly formatted international pollution and weather data, location information, new species information, and other requirements needed for the i-Tree Eco model to process in a new, previously unsupported study area. The submitted information will be vetted by the U.S. Forest Service and integrated into the Eco model as a new international location that would be available for automated processing in future updates of Eco. i-Tree Storm (legacy) helps you to assess widespread community damage in a simple, credible, and efficient manner immediately after a severe storm. It is adaptable to various community types and sizes and provides information on the time and funds needed to mitigate storm damage. i-Tree Planting Calculator is designed to help estimate long-term environmental benefits from a tree planting project. The focus is greenhouse gases, but many co-benefits are included. i-Tree County allows users to assess benefits of trees within a county.

iv
Components of the i-Tree software suite have been developed over the last few decades by the U.S. Forest Service and numerous cooperators. Support for the development and release of the 2017 i-Tree software suite has come from USDA Forest Service Research, State and Private Forestry, and their cooperators through the i-Tree Cooperative Partnership of the Davey Tree Expert Company, Arbor Day Foundation, Society of Municipal Arborists, International Society of Arboriculture, Casey Trees, and State University of New York College of Environmental Science and Forestry.
i-Tree Eco i-Tree Eco is an adaptation of the Urban Forest Effects (UFORE) model, which was cooperatively developed by the U.S. Forest Service Northern Research Station (NRS), USDA State and Private Forestry's Urban and Community Forestry Program and Northeastern Area, Davey Tree Expert Company, and SUNY College of Environmental Science and Forestry. The UFORE model was conceived and developed by David J. Nowak and Daniel E. Crane (USFS, NRS), and Patrick McHale (SUNY-ESF). The UFORE software was designed and developed by Daniel E. Crane and its graphical user interface (GUI) by Lianghu Tian and Mike Binkley (The Davey Institute). Many individuals contributed to the design and development process of the UFORE application including Mike Binkley (The Davey Institute), Jaewon Choi (SUNY-ESF), Daniel E. Crane (NRS), Greg Ina (The Davey Institute), Robert E. Hoehn (NRS), Jerry Bond and Christopher J. Luley (Urban Forestry LLC), Patrick McHale (SUNY-ESF), David J. Nowak (NRS), Jack C. Stevens (NRS), Lianghu Tian (The Davey Institute), Jeffrey T. Walton (Paul Smiths College), and Robert Sacks (Bluejay Software). New modeling functions, desktop processing capabilities, and updates for i-Tree Eco versions were developed and integrated by members of the USFS-NRS and The Davey Institute based on newly available research from NRS and feedback from i-Tree users. i-Tree Eco Development Team members and contributors include Satoshi Hirabayashi, Alexis Ellis, Daniel Crane, Lianghu Tian, Megan Kerr, David Ellingsworth, Allison Bodine, Daniel Vicarel, Mike Binkley, Al Zelaya, Jason Henning, Scott Maco, Heidi Siciliano, Michael Leff, Emmanuel Ong, Vidmantas Steponavicius, Robert Coville, Arielle Conti, and Erika Teach.
International Support Many people have contributed to the development of i-Tree Eco to make the application functional for users in Australia, Canada, Mexico, Colombia, South Korea and most countries in Europe. Data for the Australian enhancements were provided, in part, by Craig Hallam and
Acknowledgements

v
Chris Spencer (ENSPEC Environment and Risk) and with funding from Arboriculture Australia. Andy Kenney (University of Toronto) helped facilitate data acquisition for Canada. Kenton Rogers, Keith Sacre (Treeconomics), Kieron Doick (Forest Research) assisted with project coordination, data acquisition, funding, and development of the United Kingdom Eco model adaptation. Naomi Zurcher, Johan Ostberg and Tim Aevermann assisted with project coordination, data acquisition, funding, and development of Eco model adaptation for most countries in Europe. María del Pilar Arroyave Maya and Camille McCarthy assisted with project coordination, data acquisition, funding, and development of Eco model adaptation for Colombia.

vi
About i-Tree ........................................................................................................................... i Disclaimer.............................................................................................................................................. i
Feedback ............................................................................................................................................... i
i-Tree Products ..................................................................................................................... ii Desktop Applications ........................................................................................................................... ii
Web Applications ................................................................................................................................. ii
Acknowledgements ............................................................................................................ iv
i-Tree Eco ........................................................................................................................................ iv
International Support ...................................................................................................................... iv
Table of Contents ................................................................................................................ vi About .................................................................................................................................... 1
i-Tree Eco ............................................................................................................................................. 1
The Field Guide .................................................................................................................................... 1
Data Recording Tips ............................................................................................................ 3
Using the Mobile Data Collector .......................................................................................................... 3
Getting Started ................................................................................................................................. 4
Options Menu .................................................................................................................................. 4
Main Window ................................................................................................................................... 5
Survey Information .............................................................................................................. 6
Survey Date .......................................................................................................................................... 6
Crew ..................................................................................................................................................... 6
Plot Information ................................................................................................................... 7
Plot Establishment ............................................................................................................................... 7
Adding a Replacement Plot .............................................................................................................. 7
Plot ID ................................................................................................................................................... 9
Plot Address ......................................................................................................................................... 9
Stake ..................................................................................................................................................... 9
Table of Contents

vii
Plot Center Coordinates ....................................................................................................................... 9
Photo ID ............................................................................................................................................. 10
Plot Sketch ......................................................................................................................................... 10
Plot Contact Info ................................................................................................................................ 10
Percent Measured .............................................................................................................................. 11
Tree Cover .......................................................................................................................................... 11
Shrub Cover ........................................................................................................................................ 12
Plantable Space .................................................................................................................................. 12
Reference Objects .............................................................................................................................. 13
Land Use ............................................................................................................................................. 14
Ground Cover ..................................................................................................................................... 17
Shrub Details ...................................................................................................................................... 20
Tree Information ................................................................................................................. 22
What Is a Tree? .................................................................................................................................. 22
Collecting Tree Data for a Plot-Based Sample ............................................................................... 22
Tree ID ................................................................................................................................................ 23
User Tree ID ....................................................................................................................................... 23
Direction from Plot Center ................................................................................................................. 23
Distance from Plot Center .................................................................................................................. 24
Land Use ............................................................................................................................................. 24
Species ............................................................................................................................................... 25
Street Tree/Non-Street Tree .............................................................................................................. 26
Public/Private ..................................................................................................................................... 26
Status ................................................................................................................................................. 26
Dead ................................................................................................................................................... 27
Total Tree Height ............................................................................................................................... 28
Crown Size .......................................................................................................................................... 28
Live Tree Height ............................................................................................................................. 28
Height to Live Crown Base ............................................................................................................. 29
Live Crown Width ........................................................................................................................... 30
Percent Crown Missing .................................................................................................................. 30
Crown Health ..................................................................................................................................... 33

viii
Crown Light Exposure ........................................................................................................................ 35
DBH .................................................................................................................................................... 36
DBH Measurement Height ............................................................................................................. 37
DBH Measured ............................................................................................................................... 38
Cover Under Canopy .......................................................................................................................... 38
Percent Impervious ........................................................................................................................ 38
Percent Shrub ................................................................................................................................. 38
Energy ................................................................................................................................................ 39
Direction to Building ...................................................................................................................... 39
Distance to Building ....................................................................................................................... 40
Tree Location Coordinates ................................................................................................................. 40
Management Information................................................................................................... 41
Maintenance Recommended ............................................................................................................. 41
Maintenance Task .............................................................................................................................. 41
Sidewalk Conflict ................................................................................................................................ 42
Utility Conflict .................................................................................................................................... 42
Custom Fields ..................................................................................................................................... 43
Pests (IPED) ........................................................................................................................................ 43
Finishing Data Collection .................................................................................................. 44
Quality Assurance Plan ...................................................................................................................... 44
Definitions ...................................................................................................................................... 45
QA Timing ....................................................................................................................................... 45
Variables to Remeasure ................................................................................................................. 45
QA Forms........................................................................................................................................ 47
Manual Revision History ................................................................................................... 47

1
i-Tree Eco is a software application designed to use field data from complete inventories of trees or randomly located plots throughout a community along with local hourly air pollution and meteorological data to quantify urban forest structure, environmental effects, and value to communities. Baseline data can be used by managers and researchers for making effective resource management decisions, developing policy, and setting priorities. From project start to finish, Eco is a complete package that provides users with the following components:
• Detailed, statistically based sampling and data collection protocols. These protocols allow for estimation of totals and variation related to urban forest structure and population effects.
• A mobile data collector for web-enabled smartphones, tablets, or similar devices that can be used for field data collection.
• A central computing engine that makes scientifically sound estimates of the effects of urban forests based on peer-reviewed scientific equations to predict environmental and economic benefits.
• Summary reports that include charts, tables, and a written report.
The i-Tree Eco Field Guide describes how to collect and record the data variables needed for your Eco project. The methodologies described in this guide are meant to provide all users with standardized protocols for collecting their data. At this point, you should have already:
• Determined what data collection variables you will be collecting in the field • Decided how you will be recording your data in the field • Designed and created your plot sample (for plot-based sample projects only) • Prepared your field data collection materials to go out into the field
About
i-Tree Eco
The Field Guide
To prepare for data collection, use the Eco User’s Manual to help you design and set up your project.
Tip

2
Methodologies for collecting data are described here for all of the required and optional data variables that can be collected for an Eco project. The data variables can apply to (A) plot-based sample inventory projects only, (B) complete inventory projects only, or (C) both plot-based sample and complete inventory projects. Use the information from the Eco User’s Manual to make sure you collect the data variables that are appropriate for your project. The Field Guide is divided into four categories of data variables:
• Survey Information • Plot Information • Tree Information • Management Information
Each data variable is described in detail along with information on how to enter the data on the paper forms provided in Eco or using Eco’s mobile data collector.
The i-Tree Pest Detection protocol is a supplemental analysis that can be included in your Eco project. If you have decided to document the signs and symptoms of tree pests and diseases as part of the pest protocol, you will need to record information related to tree health in the field. As this is an intensive process, there is a separate manual to guide you. Visit itreetools.org/iped/index.php to access the i-Tree Pest Field Manual.
Tip
3
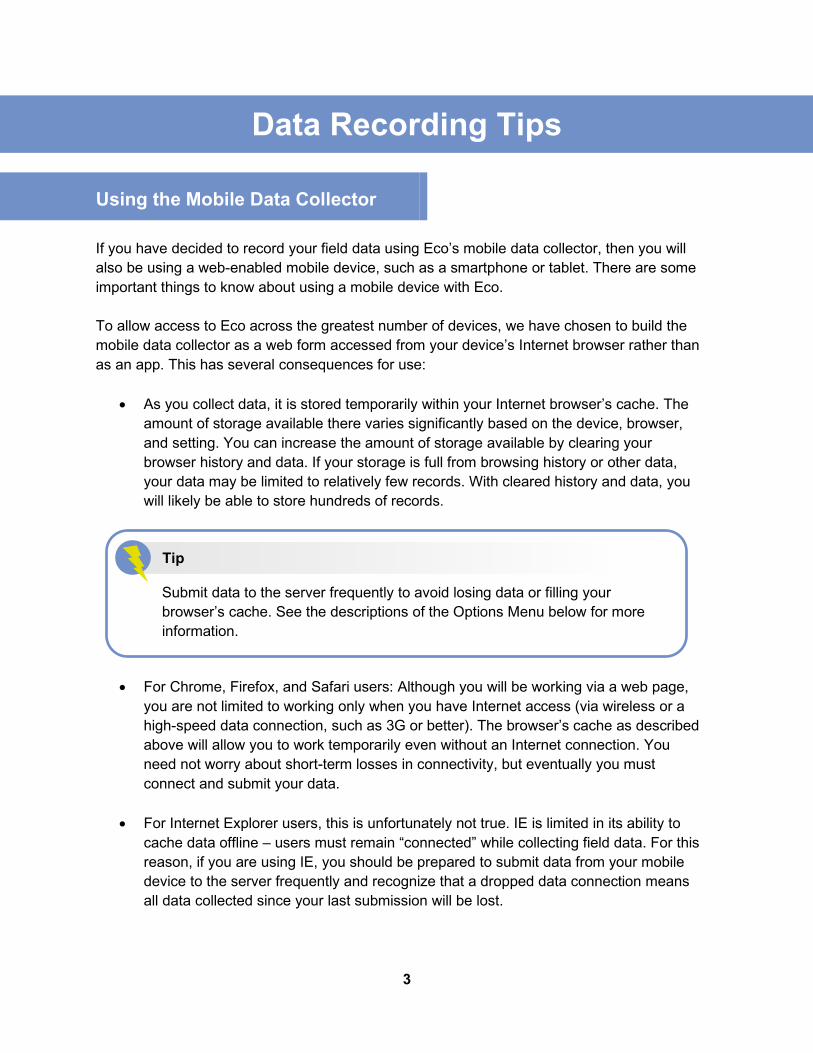
If you have decided to record your field data using Eco’s mobile data collector, then you will also be using a web-enabled mobile device, such as a smartphone or tablet. There are some important things to know about using a mobile device with Eco. To allow access to Eco across the greatest number of devices, we have chosen to build the mobile data collector as a web form accessed from your device’s Internet browser rather than as an app. This has several consequences for use:
• As you collect data, it is stored temporarily within your Internet browser’s cache. The amount of storage available there varies significantly based on the device, browser, and setting. You can increase the amount of storage available by clearing your browser history and data. If your storage is full from browsing history or other data, your data may be limited to relatively few records. With cleared history and data, you will likely be able to store hundreds of records.
• For Chrome, Firefox, and Safari users: Although you will be working via a web page,
you are not limited to working only when you have Internet access (via wireless or a high-speed data connection, such as 3G or better). The browser’s cache as described above will allow you to work temporarily even without an Internet connection. You need not worry about short-term losses in connectivity, but eventually you must connect and submit your data.
• For Internet Explorer users, this is unfortunately not true. IE is limited in its ability to
cache data offline – users must remain “connected” while collecting field data. For this reason, if you are using IE, you should be prepared to submit data from your mobile device to the server frequently and recognize that a dropped data connection means all data collected since your last submission will be lost.
Data Recording Tips
Using the Mobile Data Collector
Submit data to the server frequently to avoid losing data or filling your browser’s cache. See the descriptions of the Options Menu below for more information.
Tip

4
• When your cache’s memory is getting full, you will receive a warning message
suggesting that you clear your browser’s cache and history. Warning: You must submit your data before doing so or it will be lost!
For more information regarding using the mobile data collector view the four videos on the video learning page of the i-Tree website.
Getting Started The mobile data collector for Eco isn’t an app – it’s an Internet-accessible web form designed specifically for your project. To access this web form and begin collecting data:
1 Open your smartphone or tablet’s email application.
2 Open the email with the link to your project’s custom web form.
3 A new window will open in your device’s web browser. To begin, enter the user’s name in the Surveyor box and click Login.
Options Menu The gear wheel in the top left allows you to access the Options menu, where you can perform higher level operations such as submitting data and reloading the project configuration as well as adjusting the number of entries viewed per page.
Settings: In the Settings tab, you can adjust the number of plots and species that appear per page (10 is the default) and whether the species lists appear as common names, scientific names, or species codes.
Submit data: It is critical to submit your data to the web server often! In the Submit Data window, verify the number of plots to be submitted at the top of the page, and click the Submit button.
Reload project: If aspects of the project configuration change after you have begun to collect data, you will need to reload the project to incorporate those changes. Changes to your project configuration must be made in the i-Tree Eco application and submitted from
If you find you are having issues working with your mobile device’s Internet browser, check out your device’s app store. There you can download the Internet browser that works best for you.
Tip

5
the Data tab. After the project has been submitted, you can click the Reload Project button in the mobile data collector and you will be up to date.
Main Window For sample inventory projects with preloaded plots, the main window shows a numerical list of all plots. Click the appropriate plot number to begin collecting data. For complete inventory projects, data collection begins when you click the plus sign (+) in the top right corner to add the first tree.

6
Description: Date of data collection. How to record:
• Paper (for sample and complete): Enter under DATE on the first page. • Mobile Data Collector (for sample and complete): Date recorded automatically at the
beginning of data collection session during Login.
Description: Name or number of crew conducting inventory. How to record:
• Paper (for sample): Enter under CREW on the first page. • Paper (for complete): Enter under CREW/DATA COLLECTOR at the top of the page. • Mobile Data Collector (for sample and complete): Name is entered under Surveyor at
the beginning of data collection session during Login.
Survey Information
Survey Date
Crew

7
Sample inventorying begins with plot establishment. If you’re conducting a complete inventory you can skip to the next section of the Field Guide, Tree Information. If you will be doing a plot-based sample inventory, be sure to get permission to access the property if necessary (from residents or property owner).
First, locate the plot center and plot boundaries. If you mapped your field plots as described in the Eco User’s Manual (see “Preparing for the Field > Mapping Field Plots”), you can use the aerial photographs and/or maps you created then to help guide the plot establishment process. If the plot is sloped, measure slope with clinometer and adjust plot width accordingly. Adjusted plot radius can be read from the following table:
Slope % 5 10 12 15 17 20 22 25 27 30
Slope angle 2.9 5.7 6.8 8.5 9.7 11.3 12.4 14.0 15.1 16.7
Adj. radius (1/10 acre plot) 37.3 37.3 37.4 37.4 37.5 37.6 37.7 37.8 37.9 38.0
Adj. radius (1/6 acre plot) 48.1 48.2 48.2 48.3 48.4 48.5 48.6 48.8 48.9 49.1
In some cases, the plot center may fall in an inaccessible location, such as the middle of a building or highway. In this case, do not choose an alternate plot, but instead follow the instructions for Inaccessible Plot Centers (see box below) to select a Tree Measurement Point (TMP) to use for subsequent data collection.
Adding a Replacement Plot If you are completely unable to access the plot or to collect data from afar, select an alternate plot. If you have a list of alternate plots, select the first plot from the list for that land use. For
Plot Information
Plot Establishment
Examples of access notification letters and access response cards have been created by other Eco users. These and many other resources are available on the i-Tree Eco Project Planning and Management Resources web page.
Tip

8
grid sampling schemes, the plot should be located in the same grid and land use as the non-accessible plot. Do not skip around the alternate list; go in sequence. If you did not create extra plots during project configuration, you can manually add a new plot to the database when you are back at your desk by going to the Plots function of the Data tab in the Eco application. The Actions group will appear in the ribbon bar. Use the New function to manually add a new plot to the plot table in the action panel. With the plot center, plot boundaries, and, if necessary, a TMP determined, you are ready to begin collecting plot data. Inaccessible Plot Centers In some cases, your plot center might fall in a location that is inaccessible, such as within a building or in the middle of a highway. The following describes how to determine plot boundaries and location of trees when plot centers are inaccessible (Fig. 1). (Note that the numbers in the example apply only to 0.1-acre plots.) Determine ‘a’ by estimating the approximate location of the true plot center from the aerial photo or map. Calculate ‘b’ by subtracting ‘a’ from the plot radius (e.g., 37.2 ft for a 0.1-acre plot). Then ‘b’ is the distance from the plot boundary to the building wall. To outline the general plot boundary, walk parallel to the building for 26.2 ft (y1), then perpendicular to the building for 11 ft (x1). This would represent a point along the boundary approximately 45˚ from the start. If you then walk 11 ft (y2) parallel to the building’s edge, and 26.2 ft (x2) perpendicular, the next plot boundary would be reached; representing a point 90˚ along a circle from your starting point. To more easily locate the trees that are in-plot, the crew should first determine the plot boundaries as described above, and then pick a point from which distance and direction can easily be measured to serve as the Tree Measurement Point (TMP). In the figure, a corner of the building has been chosen as the TMP. (Record the TMP in the notes – e.g., northwest corner of building.) Remember to record only those trees that are within the radius of the true plot center. Trees c, d, and f are all within the true plot boundary and must be inventoried. Tree e, on the other hand, is within 37.2 ft of the TMP, but not of the actual plot center. Therefore, it lies outside the plot boundary and is not tallied.
Figure 1—Determining a Tree Measurement Point and plot boundaries

9
Description: ID number of plot (must be a unique identifier). How to record:
• Paper: Enter a unique number under PLOT ID near the top of the first page. • Mobile Data Collector: In the main window, select the Plot ID from the list of all
generated plots.
Description: Street address of plot and any notes for locating plots in areas without street addresses. This variable is especially helpful for revisiting plots or establishing permanent plots. How to record:
• Paper: Enter under Plot address on the first page. • Mobile Data Collector: Enter under Plot Info > Address.
Description: Indicate whether the location of permanent plots has been marked by a permanent identifier (Y/N). How to record:
• Paper: Enter yes (Y) or no (N) under Permanent stake used on the first page. • Mobile Data Collector: Toggle the button to indicate yes or no under Plot Info > Stake.
Description: Longitude and latitude of plot center. This variable is especially helpful for revisiting plots or establishing permanent plots. See the Eco Guide to Capturing Coordinate Data for detailed information. How to record:
• Paper: Record latitude and longitude under GPS Coordinates on the first page.
Plot ID
Plot Address
Stake
Plot Center Coordinates
10
• Mobile Data Collector: Enter under Map Coordinates there are three options for capturing coordinate data. Type in coordinates, use device GPS, or tap a location on the map.
Description: ID number of photo(s) associated with plot. Use this to keep track of photo and memory card number if photos are taken.
How to record:
• Paper: Record under Photo ID(s) on the first page. • Mobile Data Collector: Record under Plot Info > Photo.
Description: Sketch of plot depicting distance and direction of plot center to reference objects and/or location of fixed objects in relation to plot center. How to record:
• Paper: Sketch in Plot Sketch Area on the bottom of the second page. • Mobile Data Collector: N/A
Description: Name and phone number of plot contact person. Record this contact information if available. For residential land uses, do not ask for this information, but if name is on mailbox, record it. Owner vs. renter status is useful if it comes up in conversation. How to record:
• Paper: Record name and phone number under Plot Contact Name and Phone # on the first page.
• Mobile Data Collector: Record under Plot Info > Contact Info.
Photo ID
Plot Sketch
Plot Contact Info

11
Description: (Note: This variable is required for all plot-based sample projects.) The amount of the plot that the field crew is able to access and measure, either directly or by estimation. This allows for data collection for a partial plot. For example, if 10% of the plot is obscured from view behind a building or a tall stockade fence on land that you could not get permission to access, you would record 90%. (Safety concerns may also be a factor in accessing portions of the plot.) However, if you were able to look over a fence and estimate tree cover as well as species, DBH, and other measurements for trees present on plot behind the fence, you would record 100%. How to record:
• Paper: Record under Per. of Plot Measured (%) on the first page. • Mobile Data Collector: Record under Plot Info > % Measured.
Percent Measured
Tree Cover
For stratified projects, this category can serve an additional purpose in the unusual case that your plot falls across more than one of your designated strata. The plot center may be located within the appropriate land use while the plot boundaries may extend into a different land use with very different vegetation characteristics. In this case, you can collect data only on the portion of the plot that is within the designated land use and use the “Percent measured” field to document the adjustment. For example: If a plot center in the commercial land use strata has a plot boundary that includes some forested land, you can specify the percent measured for vegetation within the commercial area of the plot and avoid having trees from the forest land use factored in the commercial land use.
Tip
Aerial images used as plot maps can be very helpful for determining tree cover percentages.
Tip

12
Description: (Note: This variable is required for all plot-based sample projects.) The amount of the plot covered by tree canopy (in percent). You can envision this as the area of the plot that would be shaded by trees when the sun is directly overhead, ranging from 0 to 100%. Tree cover can come from trees located outside the plot, so plots not containing trees may nevertheless have tree cover.
How to record: Record tree cover as 0%, 100%, or mid-points of 5% intervals (3, 8, 13, 18, etc.).
• Paper: Enter under Plot Tree Cover (%) on the first page. • Mobile Data Collector: Enter under Plot Info > % Tree cover.
Description: The amount of the plot covered by shrub canopy (in percent). You can envision this as the area of the plot that would be shaded by shrubs when the sun is directly overhead, ranging from 0 to 100%. Don’t double-count multiple layers of shrubs. How to record: Record shrub cover as 0%, 100%, or mid-points of 5% intervals (3, 8, 13, 18, etc.).
• Paper: Enter under Shrub Cover (%) on the first page. • Mobile Data Collector: Enter under Plot Info > % Shrub cover.
Description: The amount of the plot area that is plantable for trees (i.e., plantable soil that is not under tree canopy or other overhead restrictions and where tree planting/establishment would not be prohibited due to land use, such as footpath, baseball field, etc.). Planting underneath utility wires is permitted.
Shrub Cover
Plantable Space
For an Eco project, shrubs are typically defined as woody material with a diameter at breast height (DBH) less than 2.54 cm (1 in), whereas trees have a DBH greater than or equal to 2.54 cm (1 in). Woody plants that are not 30.5 cm (12 in) in height (e.g., seedlings) are considered herbaceous cover.
Tip

13
How to record: Record percent plantable space as 0%, 100%, or mid-points of 5% intervals (3, 8, 13, 18, etc.).
• Paper: Enter under Plantable Space (%) on the first page. • Mobile Data Collector: Enter under Plot Info > % Plantable.
Descriptions: Identify at least one landmark visible when standing at plot center. Permanent plots require two, and three are recommended in all cases where the plot center is difficult to locate or identify. Reference objects do not have to be located within the plot. The following data are necessary to describe your reference objects:
• Object type – visible landmark(s), such as a stop sign or permanent structure, which are seen when standing at plot center.
• Direction – from the plot center to the reference object. • Distance – from the plot center to the reference object. • DBH – stem diameter measured at breast height (DBH) if the reference object is a tree.
How to record: Try to use objects that are likely to be present 5 to 15 years from now (e.g., stop signs, telephone poles, permanent structures, sidewalks/driveways). If the plot falls in a forested area and there are no permanent objects (constructed or natural) within sight, select two unique or “witness” trees (striking species or large DBH) that you expect will be present on the plot in the future. Photos of reference objects are helpful. Describe each reference object very specifically (e.g., telephone pole 5 ft from left edge of driveway when facing the house). Measure the distance and direction (1°-360°) to each reference object from the plot center.
• Paper: Record the description, direction, and distance for one or two reference objects on the first page.
Reference Objects
A more accurate measurement can be obtained by using the sum of the following ground covers (collected below) as a starting point to evaluate plantable space: soil, duff/mulch, herb/ivy, maintained grass, and unmaintained grass.
Tip
As the definition for plantable space is somewhat subjective, project managers should make an effort to clearly define what counts as plantable space during crew training.
Caution !

14
• Mobile Data Collector: From the Reference Objects window, click the plus sign (+) at the top right corner and select an object type from the drop-down list. Enter a distance and direction and click the arrow at the top right corner. Repeat if necessary for a second object. To edit a reference object, click on the entry in the Reference Objects window. When you are finished entering reference objects, click the left arrow on the main Reference Objects window to return to the main menu.
Descriptions: Land use should be determined by the inventory team based on impressions during field data collection (i.e., not from land use maps). This data variable describes how the land is being used, which is not necessarily the same as the ownership of the land. Eco has 14 default land use classes for users to choose from. Alternatively, users may create custom land use classes within the i-Tree Eco software. User-defined land use classes must be mapped back to one of the default classes. The following data is necessary to describe your land uses:
• Actual land use – land use type(s) seen in the field • Percent of plot – the proportion of the total plot area covered by each land use
Land Use
Select one of your reference points to serve as TMP if the plot center was inaccessible. • For paper data collection, enter a check next to the object used as
your TMP in the Reference Objects. • For mobile data collector, enter TMP in the Notes field of the object
serving as TMP. Refer to Inaccessible Plot Centers for more information.
Tip
During Tree Information data collection, you can enter the land use in which each tree is located. For sample inventories, if you collected land cover data for the plot here, you must also estimate land cover for the tree. See the Land Use descriptions in the Tree Information section of this guide for more information.
Caution !

15
The following default land use types are included:
• Agriculture (A): Cropland, pasture, orchards, vineyards, nurseries, farmsteads and related buildings, feed lots, rangeland, and timberland/plantations that show evidence of management activity for a specific crop or tree production.
• Cemetery (E): Includes any small unmaintained areas within cemetery grounds.
• Commercial/Industrial (C): Land being used for commercial activities, including retail,
services, and professional business. Also includes standard industrial land uses, such as manufacturing or processing, and outdoor storage/staging areas as well as parking lots in downtown areas that are not connected with an institutional or residential use.
• Golf course (G): Includes entire grounds, whether maintained or not.
• Forest (F): Land surrounding plot must have at least 10% canopy cover and not be
subject to use(s) that prevent normal tree regeneration and succession, such as regular mowing, intensive grazing, or recreation activities. In some cases, areas with less than 10% canopy cover may qualify as Forest if trees were harvested, died, or were otherwise removed but the land is expected to naturally regenerate to at least 10% cover. The forest land use only applies when there is no other active land use (i.e. all land uses excluding “Vacant”). For example, a forest patch within a golf course would be classified as the “Golf Course” land use even it if meets all other criteria for the “Forest” land use.
• Institutional (I): Schools, hospitals/medical complexes, colleges, religious buildings,
government buildings, etc. (Note: If a parcel contains large unmaintained areas, possibly for expansion or other reasons, treat the area as Vacant. However, small forested islands in a maintained landscape would be considered Institutional.)
• Multi-family residential (M): Structures containing more than four residential units.
(Note: A block of attached one- to four-family structures would be considered multi-family residential. A residential complex consisting of many separate one- to four-family structures and related greenspace would be also considered multi-family residential.)
Eco uses these values to make adjustments to the model based on the differences in tree growth and valuation characteristics associated with predefined actual land uses. For example, a tree located in a Transportation plot will grow at a different rate than a similar tree that is located within a Golf Course or Residential plot. Because of this, any custom land use categories must be mapped to Eco’s default classes.
Tip

16
• Park (P): Includes parks in undeveloped (unmaintained) areas as well as developed areas. (Note: Trees or plots in forested stands are best categorized as being on the Vacant land use.)
• Residential (R): Freestanding structures serving one to four families.
• Transportation (T): Includes limited access roadways and related greenspaces (such
as interstate highways with on and off ramps, sometimes fenced), as well as railroad stations, tracks and yards, shipyards, airports, etc. (Note: If plot falls on any other type of road, or associated median strip, classify according to nearest adjacent land use.)
• Utility (U): Includes power-generating facilities, sewage treatment facilities, covered and
uncovered reservoirs, and empty stormwater runoff retention areas, flood control channels, and conduction.
• Vacant (V): Includes land with no clear intended use. (Note: Abandoned buildings and
vacant structures should be classified based on their original intended use.)
• Water/wetland (W): Streams, rivers, lakes, and other water bodies, natural or constructed. (Note: Small swimming pools and fountains should be classified based on the adjacent land use.)
• Other (O): Land uses that do not fall into one of the categories listed. (Note: This
designation should be used sparingly as it provides little useful information for the model.) Clarify with comments in Notes.
(Note: For mixed-use buildings, land use is based on the dominant use, i.e., the use that receives the majority of the foot traffic. It might not always occupy the majority of space in the building. For example, a building with commercial use of the first floor and apartments on upper floors would be classified as Commercial/industrial.) How to record:
• Actual land use o Paper: Enter land use types under Actual Land Use on the second page. o Mobile Data Collector: In the Land Uses window, click the plus sign (+) in the
top right corner and select a land use from the drop-down menu. Enter a percentage as described below.
• Percent of plot: For plots that include only one land use, this value is 100%. For plots that include two or more land uses, estimate what percentage of the plot each land use occupies. For example, a plot that falls on the property line between a house and a convenience store might be 40% residential and 60% commercial/industrial. Land use differences must be clearly identifiable on the plot with a clear change in human use of the land, not just its cover or ownership.
o Paper: Enter the percent for each land use type under Percent of plot. o Mobile Data Collector: From the Land Uses window, click the plus sign (+) at
the top right corner and select a land use type from the drop-down list. Enter a percentage in Percent of Plot. Click Save to continue. Add additional land uses

17
until the Total % = 100. Then click the left arrow from the main Land Uses window to return to the main menu for that plot.
Description: Within the plot, various materials will cover the ground. Eco has 11 default ground cover classes for users to choose from. Alternatively, users may create custom ground cover classes within the i-Tree Eco software. User-defined ground cover classes must be mapped back to one of the default classes. Grass, unmaintained grass, and herbs factor in to pollution modeling for U.S. projects. Pollution results will be affected if new fields are mapped to these ground cover designations.
The following data are necessary to describe your ground covers:
• Ground cover – ground cover type(s) seen in the field
• Percent of plot – the proportion of the total plot area covered by each ground cover The following default ground cover classes are included:
• Bare soil (Soil): Includes naturally occurring sand.
• Building (Bldg.): Includes buildings with green roofs.
• Cement
Ground Cover
Trees and shrubs are considered separately from the ground cover types described here. Please see the Tree Cover and Shrub Cover sections for more information on those cover types. Tree stems as a ground cover are ignored in this variable.
Tip
Percent building cover is used in energy and avian habitat modeling. Users interested in those analyses should either keep the default building class or include a custom class that is mapped to the default building class.
Tip

18
• Tar: Blacktop/asphalt • Rock: Pervious rock surfaces such as gravel, brick, or flagstone walkways or patios
(without mortar), as well as sand in playgrounds or added as topping to existing soil. (Note: Large solid rock outcrops should be categorized as other impervious.)
• Duff/mulch: Loose organic material, leaf litter.
• Grass (Main. Grass)
• Unmaintained grass (Unmain. Grass)
• Herbs (Herb/Ivy): Herbaceous ground cover, other than grass, including agricultural
crops.
• Other impervious: Impervious surfaces, other than buildings, cement, and tar, including
large solid rock outcrops, swimming pools, man-hole covers, utility boxes, headstones, artificial turf, etc. (Note: Artificial turf should be categorized as rock if the underlying material is pervious.)
• Water: Natural water bodies and rivers, excluding temporary standing water.
How to record: Estimate the percentage of each ground cover type to the nearest 5% unless cover is minimal. If trace amounts are present, you can just enter 1, 2, 3%, etc. The sum of the proportions must add to 100% per plot. Use the following chart as a guide when estimating 1 and 5% increments of cover. (Some examples for comparison: a queen size mattress covers 35 sq ft; a full-size SUV covers 90 sq ft).
Percent maintained grass cover is used in avian habitat modeling. Users interested in that analysis should either keep the default grass class or include a custom class that is mapped to the default grass class.
Tip
Grass, unmaintained grass, and herbs factor in to pollution modeling for U.S. projects. Pollution results will be affected by how these ground covers are categorized in the field or if new fields are mapped to these ground cover designations.
Tip

19
Percent of 0.1 acre site Area (sq ft) Diameter of circle (ft)
1% 44 7.5 5% 218 16.5 10% 437 23.6 25% 1,091 37.3 50% 2,183 52.7 75% 3,274 64.6 100% 4,365 74.5
• Paper: Enter the percentage of each ground cover under the appropriate category
(shown in parentheses above) on the second page. • Mobile Data Collector: In the Ground Covers window, click the plus sign (+) in the top
right corner and select a cover type from the drop-down menu. Enter a percentage in the Percent Covered field and click Save to continue. Continue adding ground covers until Total % = 100. Then click the left arrow from the main Ground Covers window to return to the main menu for that plot.

20
Description: For inventory purposes, shrubs should be grouped into masses of the same species and approximate height. For instance, if your plot includes five azaleas of similar heights in different areas, you can group them together and enter them as a single group. A woody plant with DBH < 1 inch is considered a shrub. The following data is necessary for each shrub group:
• Species – name of shrub species • Height – average height of a shrub group (i.e., mass of shrubs of the same species) • Percent of area – the amount of the shrub area in the plot covered by each shrub group • Percent missing – the percent of the shrub group volume that is missing (i.e., not
occupied by leaves) How to record: Record a maximum of 12 shrub groups. If there are more than 12, record measurements for the first 11, then lump the remaining shrubs into the twelfth group.
o Paper: For each shrub group, enter data for the four fields below under the Shrubs heading on the second page.
o Mobile Data Collector: In the Shrubs window, click the plus sign (+) to add a new shrub group and complete the four fields below.
• Species: Identify the shrub species. If this is not possible, the plant must be identified by
its genus at a minimum; if genus is not known, then collect a sample for identification. o Paper: Enter species name or species code under Shrubs > Species. Click
here to download tree and shrub species list. o Mobile Data Collector: Select a species from the drop-down menu. Click the Next
button at the bottom of each page to view more species. You can switch among scientific name, common name, and species code using the button at the top right. You can also search by typing in the Search box.
• Height: Measure the height of the shrub group to the nearest 0.1 ft or m. Height of shrub
Shrub Details
For sample inventories, during Plot Information data collection, you can enter the percentage of the plot that was covered by shrubs. This phase focuses just on that area. If you collect shrub data here, you must also estimate shrub cover. See the Shrub Cover section of this guide for more information.
Caution !

21
groups of a particular species will likely differ across the plot. An average height may be used and different shrub masses grouped together where variation in height is relatively small.
o Paper: Enter under Shrubs > Height. o Mobile Data Collector: In the Shrubs window, enter under Height.
• Percent of area: Measure the percent of the total shrub area (i.e., not the total plot area)
represented by this species/height combination. The total for all the shrub groups recorded on the plot must equal 100%. Where there are two or more layers of different shrub species, record the percent area of the entire tallest shrub mass, but only the area of the shorter shrub mass that is not shaded (overtopped) by the taller shrub – i.e., visualize the area of the shrub masses from a birds-eye view, and report the percent of the shrub masses as seen from above.
o Paper: Enter under Shrubs > % of shrub area. o Mobile Data Collector: In the Shrubs window, enter under Percent of Shrub
Area.
• Percent missing: Visualize the shrub mass of this species height group as a volume (height by ground area) and record the percent of the volume that is missing, i.e., not occupied by leaves. The shrub mass leaves are assumed to start at the ground. The intent of this variable is to adjust height and area measurements to reveal actual volume of leaves and to allow you to account for voids in vegetation and inaccuracies in simple height-by-area estimates (e.g., height of mass might not be uniform). Allow for natural arrangement or spacing of leaves; however, you should investigate the interior of the shrub mass to better estimate the missing portions. In the past, crews have underestimated the mass missing by not accounting for the interior. Percent missing should be recorded as 0% or as mid-points of 5% intervals (3, 8, 13, etc.).
o Paper: Enter under Shrubs > % Missing. o Mobile Data Collector: In the Shrubs window, enter under Percent missing.
Click Save to save that shrub group, and click the plus sign (+) to continue adding shrub groups until the Total = 100%. When you’re finished, click the left arrow on the main Shrubs window to return to the main menu for that plot.

22
At different stages of its life, a tree can be classified as ground cover, shrub, or tree in the Eco model. The following information is adapted from the journal article “A Ground-Based Method of Assessing Urban Forest Structure and Ecosystem Services” (available at itreetools.org under Resources) and may help Eco users distinguish between available options.
That journal article defines trees and shrubs as follow, shrubs are woody material with a diameter at breast height (DBH) less than 1.0 cm, whereas trees have a DBH greater than or equal to 1.0 cm. Woody plants that are not 30.5 cm in height (e.g., seedlings) are considered herbaceous cover. Trees and shrubs can also be differentiated by species (i.e., certain species are always trees or always shrubs) or with a different DBH minimum threshold. For example, in densely forested areas, increasing the minimum DBH to 12.7 cm can reduce the field work required by decreasing the number of trees measured, but less information on trees will be attained. You can choose to use these definitions or not depending on the goals of your project and resources available.
Collecting Tree Data for a Plot-Based Sample Data collection for living and dead trees starts with the tree closest to north and proceeds in a clockwise direction. If two trees are located in the same direction from plot center, field crews should measure the tree closest in distance. If your plot center is inaccessible and you have designated a Tree Measurement Point (see Inaccessible Plot Centers for more information), use the TMP for measuring distance and direction, but remember that the plot itself does not shift to make the TMP the center – measure trees only within the true plot boundaries based on the true plot center. All trees should be recorded so long as at least half of their trunk lies within the plot.
Tree Information
What Is a Tree?
Starting in 2021, i-Tree Eco accepts trees that are greater than or equal to 1.0 cm DBH.
Tip

23
Description: ID number of tree. For complete inventory, must be a unique identifier. For plot-based sample, must be a unique identifier within a plot. How to record:
• Paper (for sample and complete): Enter under TREE ID. Begin with 1 and assign sequentially.
• Mobile Data Collector (for sample and complete): From the Trees window, click the plus sign (+) in the top right corner. A Tree ID is generated automatically and you now have access to up to six additional windows depending on your project configuration: General, Details, Stems, Building Interactions, Management Info, and Pests. Each will be explained below.
Description: User Tree ID for complete inventory and plot-based sample.
• Paper (for sample and complete): Enter under USER TREE ID. • Mobile Data Collector (for sample and complete): From the Trees window, click the plus
sign (+) in the top right corner. In the General Info window enter under User Tree Id.
Description: (Note: This optional variable is collected for plot-based sample projects only.) Direction from plot center to the tree in compass degrees/azimuths (e.g., north = 360°; east = 90°; south = 180°; west = 270°).
Tree ID
User Tree ID
Direction from Plot Center
Flagging or chalking each tree as it is measured will help keep track of trees and prevent missing or double-entering a tree. Do not leave permanent marks (paint or scribe marks) on trees.
Tip

24
How to record: If plot center is inaccessible, measure direction from Tree Measurement Point. Make sure that TMP info is recorded in Reference Object sections of paper forms or with mobile data collector.
• Paper (for sample): Enter azimuth in degrees under DIR. • Mobile Data Collector (for sample): In the General window, enter the azimuth in degrees
under Direction.
Description: (Note: This optional variable is collected for plot-based sample projects only.) Shortest distance (in feet or meter) from plot center to edge of trunk at DBH, measured parallel to the ground. In heavily wooded plots, accuracy is critical for trees to be found in the future. How to record: If plot center is inaccessible, measure distance from Tree Measurement Point. Make sure that TMP info is recorded in Reference Object section of paper forms or with mobile data collector.
• Paper (for sample): Enter shortest distance to tree under DIST. • Mobile Data Collector (for sample): In the General window, enter under Distance.
Description: Land use type in which tree is located. Eco has 14 default land use classes for users to choose from. Alternatively, users may create custom land use classes within the i-Tree Eco software. User-defined land use classes must be mapped back to one of the default classes. Default land uses are defined in the Plot Information section. How to record: Record the land use in which the tree is located.
• Paper (for sample and complete): Use land use codes defined above and enter under LAND USE.
• Mobile Data Collector (for sample): In the General window, select the land use from the
Distance from Plot Center
Land Use
During Plot Information data collection, you can enter the land use composition of your plot for plot-based sample inventories. If you collected land cover data for the tree here, you must also estimate land cover for the plot. See the Land Use descriptions in the Plot Information section of this guide for more information.
Caution !

25
drop-down list. Only land uses you identified for the specific plot will be included. • Mobile Data Collector (for complete): In the General window, select the land use from
the drop-down list.
Description: (Note: This variable is required for all projects.) Species and genus of tree. Read Identifying Tree Species for suggested guidelines to follow in specific scenarios. How to record: Paper (for sample and complete): Enter under TREE SPECIES. If you wish to use species codes, download the species code list.
• Mobile Data Collector (for sample and complete): In the General window, select a species from the list. Click the Next button at the bottom of the page to move through the species list. You can switch among scientific name, common name, and species code using the button at the top right. You can also search by typing in the Search box.
Identifying Tree Species Read the suggested guidelines for the following scenarios that may be encountered in the field:
• Species cannot be identified: If the species cannot be identified, take a sample, and number and record it in your notebook as Plot # XXX unknown #1, etc. Each time that same unknown is encountered on the plot, it should be recorded with the same number. Sequentially number unknowns in notebook and attempt to identify later. After samples have been identified at the office, go back and enter correct species code on paper form or with mobile data collector. If after all references guides have been checked and identification of individual species is still difficult (e.g., due to hybridization), then record genus if possible.
• Tree is dead: Only standing or leaning dead trees are to be inventoried. Genus or species should be
identified where possible. When species identification is extremely difficult, as may be the case with dead trees, one of the following taxonomic classes may be used: Magnoliopsida, Pinopsida, Ginkgoopsida, Liliopsida, Filicopsida, or Cycadopsida. These classes should be used sparingly when identifying species of live trees. These classes can be used to represent more generic classifications as their common names suggest. However, these classes are not necessarily all inclusive of the generic classification described by their common name.
Scientific Name Species Code Common Name Cycadopsida CYCLASS Palm class Filicopsida FICLASS Fern class Ginkgoopsida GICLASS Gingko class Liliopsida LICLASS Lily class Magnoliopsida MACLASS Hardwood Pinopsida PICLASS Softwood
Species

26
Description: Record whether tree is a street tree or not. How to record:
• Paper (for sample and complete): Enter yes (Y) or no (N) under STREET TREE/NON-ST S/N.
• Mobile Data Collector (for sample and complete): In the General window, toggle the button to indicate yes or no under Street Tree.
Description: Record if tree is being managed by the city (i.e., public) or not (i.e., private). How to record:
• Paper (for sample and complete): Enter under PUBLIC or PRIV. • Mobile Data Collector (for sample and complete): In the General window, toggle the
button to indicate yes or no under Public Tree.
Descriptions: Status of tree as planted or self-seeded. The three possible status of a tree are shown below. In an initial inventory of a project area, all trees will be identified as Planted (P), Ingrowth (I), or Unknown (U). In future inventories of the same plot, only new trees will be identified as P, I, or
Street Tree/Non-Street Tree
Public/Private
Status
Taxonomic classes (i.e., Magnoliopsida, Pinopsida, Ginkgoopsida, Liliopsida, Filicopsida, Cycadopsida) should be used sparingly when identifying the species of live trees. These classes can be used to represent the more generic classifications. However, species data is important to the calculation of ecosystem services – more specific species identification provides better model estimates.
Caution !

27
U. During initial inventories or when inventorying new trees in subsequent inventories, please make a concerted effort to determine whether trees have been planted [Planted (P)] or have self-seeded [Ingrowth (I)] as that information will be more valuable for future reporting and enhancements of the Eco model. Although it is to be avoided if possible, you can choose Unknown (U) if you are unable to establish whether a tree was planted or self-seeded.
Planted (P): The tree was planted intentionally
Ingrowth (I): The tree self-seeded
Unknown (U): Planted vs. ingrowth cannot be determined How to record:
• Paper (for sample and complete): Enter the status code under STAT. • Mobile Data Collector (for sample and complete): In the General window, select the
Status from the drop-down menu.
Description: Indicate that tree is dead. How to record:
• Paper (for sample and complete): Manually input “default” options for dead trees by entering the following data:
o Total tree height: (Take actual measurement.) Enter under TOT TREE HEIGHT. o Live Tree Height: Enter -1 under LIVE TREE HEIGHT. o Height to crown base: Enter -1 under CROWN BASE HEIGHT. o Crown width: Enter -1 under CROWN WIDTH > N-S and E-W. o Percent crown missing: Enter 100% under CROWN % MISS. o Condition & percent dieback: Enter 100% under CROWN COND. o Crown light exposure: Enter -1 under CLE. o DBH: (Take actual measurement.) Enter under DBH.
• Mobile Data Collector (for sample and complete): In the Details window, check the box next to Dead. Checking this box will fill in all default options for dead trees automatically.
Dead

28
Description: Height from the ground to the top of the tree (alive or dead). How to record: Measure the height to top of tree (to nearest foot or meter). For standing dead trees, downed living trees, or severely leaning trees, height is considered the distance along the main stem from ground to tree top. (Do not include dead trees that are lying on the ground.)
• Paper (for sample and complete): Enter tree height under TOT TREE HEIGHT. • Mobile Data Collector (for sample and complete): In the Details window, enter under
Height.
Live Tree Height Description: Height from the ground to the live top of the tree. This height will be the same as Total Tree Height unless the tree is alive but the top of the crown is dead.
Total Tree Height
Crown Size
Only standing or leaning dead trees are to be inventoried. Genus or species should be identified where possible. When this is not feasible, record as one of the following taxonomic classes: Magnoliopsida, Pinopsida, Ginkgoopsida, Liliopsida, Filicopsida, or Cycadopsida. When using the mobile data collector, default values for dead trees are automatically entered where appropriate. For entries without default values (such as tree height and DBH), actual measurements should still be taken.
Tip
Live Tree Height cannot be greater than Total Tree Height.
Caution !

29
How to record: Measure the height from the ground to the live top of tree. Record to the nearest foot or meter.
• Paper (for sample and complete): Enter under LIVE TREE HEIGHT. • Mobile Data Collector (for sample and complete): In the Details window, enter under
Live Tree Height.
Height to Live Crown Base Description: Height from the ground to the base of the live crown. The live crown base is the point on the main trunk perpendicular to the lowest live foliage on the last branch that is included in the live crown. Note that the live crown base is determined by the live foliage and not by the point where a branch intersects with the main bole. Therefore, if the crown base touches the ground, zero is an acceptable value. See Fig. 2 for tips on viewing the tree crown.
Figure 2—How to position yourself to measure the crown.

30
How to record: Measure height to base of live crown (to nearest foot or meter). If recording on paper, record dead trees as -1. If recording with mobile data collector, default value of -1 will fill in automatically if “Dead” box was checked.
• Paper (for sample and complete): Enter under CROWN BASE HEIGHT. • Mobile Data Collector (for sample and complete): In the Details window, enter under
Crown Base Height.
Live Crown Width Description: The live width of the crown in two directions: north-south and east-west. How to record: Measure live crown width (to nearest foot or meter) in two directions: north-south and east-west (or as close to those compass points as safety considerations or physical obstructions allow). If tree is downed or leaning, take width measurements perpendicular to the tree bole. If recording on paper, record dead trees as -1. If recording with mobile data collector, default value of -1 will fill in automatically if “Dead” box was checked.
• Paper (for sample and complete): Enter under CROWN WIDTH > N-S and E-W. • Mobile Data Collector (for sample and complete): In the Details window, enter under
Crown NS Width and Crown EW Width.
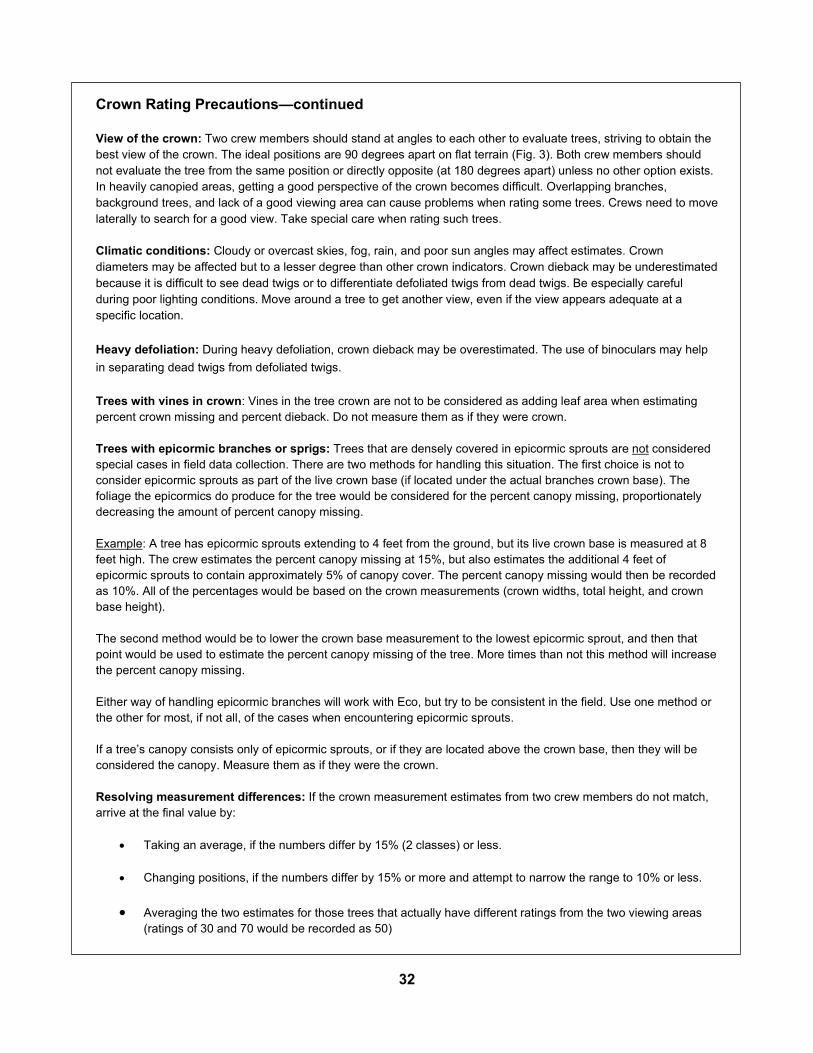
Percent Crown Missing Description: Percent of the crown volume that is not occupied by branches and leaves. How to record: Missing canopy should be measured by two people standing at perpendicular angles to the tree (Fig. 2). Visualize the expected “typical crown outline” as a silhouette created by the live crown width, total height, and height to base of live crown measurements. Imagine this silhouette as a symmetrical crown formed around the center point of the measured width of the tree and filled with leaves as if it were a healthy tree in excellent condition. Now estimate the percent foliage that is absent due to pruning, dieback, defoliation, uneven crown, or dwarf or sparse leaves. Do not include normal interior crown voids due to leaf shading. Take into account the natural crown shape for the particular species. (Fig. 3) Be sure to estimate the percentage missing based on the existing crown that you have already measured. A third of the crown may have been removed for power line clearance or the canopy could be very lopsided due to presence of a neighboring tree. However, the crown that remains

31
could have a 0% missing value, if the existing crown is full. If the two observers disagree in their estimates, follow the guidelines listed below under Crown Rating Precautions. Record percent canopy missing as 0%, 100%, or mid-points of 5% intervals (3, 8, 13, 18, etc.). If recording on paper, record dead trees as 100%. If recording with mobile data collector, the default value of 100% will fill in automatically if “Dead” box was checked.
• Paper (for sample and complete): Enter under CROWN %MISS. • Mobile Data Collector (for sample and complete): In the Details window, select a value
from the drop-down menu for Crown Percent Missing.
Figure 3—Illustration of how to measure height to crown base and percent canopy missing Crown Rating Precautions To ensure accuracy, crews must be especially careful when making evaluations under certain conditions and follow the procedures below. Distance from the tree: Attempt to stay at least one-half to a full tree length from the tree being evaluated. Some ratings change with proximity to the tree. In some situations, it is impossible to satisfy this step, but do the best you can in each case. All evaluations are made at grade (same elevation as base of the tree) or up slope from the tree. This may not be possible in all cases, but never get in the habit of evaluating trees from the down slope side.
32
Crown Rating Precautions—continued View of the crown: Two crew members should stand at angles to each other to evaluate trees, striving to obtain the best view of the crown. The ideal positions are 90 degrees apart on flat terrain (Fig. 3). Both crew members should not evaluate the tree from the same position or directly opposite (at 180 degrees apart) unless no other option exists. In heavily canopied areas, getting a good perspective of the crown becomes difficult. Overlapping branches, background trees, and lack of a good viewing area can cause problems when rating some trees. Crews need to move laterally to search for a good view. Take special care when rating such trees. Climatic conditions: Cloudy or overcast skies, fog, rain, and poor sun angles may affect estimates. Crown diameters may be affected but to a lesser degree than other crown indicators. Crown dieback may be underestimated because it is difficult to see dead twigs or to differentiate defoliated twigs from dead twigs. Be especially careful during poor lighting conditions. Move around a tree to get another view, even if the view appears adequate at a specific location. Heavy defoliation: During heavy defoliation, crown dieback may be overestimated. The use of binoculars may help in separating dead twigs from defoliated twigs. Trees with vines in crown: Vines in the tree crown are not to be considered as adding leaf area when estimating percent crown missing and percent dieback. Do not measure them as if they were crown. Trees with epicormic branches or sprigs: Trees that are densely covered in epicormic sprouts are not considered special cases in field data collection. There are two methods for handling this situation. The first choice is not to consider epicormic sprouts as part of the live crown base (if located under the actual branches crown base). The foliage the epicormics do produce for the tree would be considered for the percent canopy missing, proportionately decreasing the amount of percent canopy missing. Example: A tree has epicormic sprouts extending to 4 feet from the ground, but its live crown base is measured at 8 feet high. The crew estimates the percent canopy missing at 15%, but also estimates the additional 4 feet of epicormic sprouts to contain approximately 5% of canopy cover. The percent canopy missing would then be recorded as 10%. All of the percentages would be based on the crown measurements (crown widths, total height, and crown base height). The second method would be to lower the crown base measurement to the lowest epicormic sprout, and then that point would be used to estimate the percent canopy missing of the tree. More times than not this method will increase the percent canopy missing. Either way of handling epicormic branches will work with Eco, but try to be consistent in the field. Use one method or the other for most, if not all, of the cases when encountering epicormic sprouts. If a tree’s canopy consists only of epicormic sprouts, or if they are located above the crown base, then they will be considered the canopy. Measure them as if they were the crown. Resolving measurement differences: If the crown measurement estimates from two crew members do not match, arrive at the final value by:
• Taking an average, if the numbers differ by 15% (2 classes) or less.
• Changing positions, if the numbers differ by 15% or more and attempt to narrow the range to 10% or less.
• Averaging the two estimates for those trees that actually have different ratings from the two viewing areas (ratings of 30 and 70 would be recorded as 50)

33
Description: Crown health is based on a visual assessment of the amount of dead branches (i.e., dieback) in a tree’s crown and can be estimated as dieback or condition. To record dieback, users will enter the percent of the crown that is composed of dead branches. To record condition, users will enter the inverse of percent dieback (i.e., 100 - percent dieback). Eco has 22 default dieback or condition classes for users to choose from. For additional help, read about Estimating Percent Dieback.
Alternatively, users may create custom crown health classes within the i-Tree Eco software. User-defined crown health classes must have an associated percent condition or dieback for model processing and should be created before going out in the field. How to record: If working with Eco’s default classes, record as 0%, 100%, or mid-points of 5% intervals (3, 8, 13, 18, etc.). If recording on paper, record dead trees as 0% condition or 100% dieback. If recording with the mobile data collector, default value of 0% condition or 100% dieback will fill in automatically if “Dead” box was checked. If working with user-defined classes, record crown health based on the classes defined within the i-Tree Eco software.
• Paper (for sample and complete): Enter under CROWN HEALTH. • Mobile Data Collector (for sample and complete): In the Details window, select a value
from the drop-down menu for Condition or Dieback. Estimating Percent Dieback Percent dieback does not include normal, natural branch dieback, i.e., self-pruning due to crown competition or shading in the lower portion of the crown. However, branch dieback on side(s) and top of crown area due to shading from a building or another tree would be included. For more information, see the Forest Inventory and Analysis National Core Field Guide.
Crown Health
For users creating a new project, it is highly recommended that you work with Eco’s default crown health classes. Working with the default classes fosters more precise data collection in the field and standardization in reporting.
Tip

34
Estimating Percent Dieback—continued Assume the perimeter of the crown is a two-dimensional outline from branch tip to branch tip, excluding snag branches and large holes or gaps in the crown (Fig. 4). Crown dieback is obtained by two people (Fig. 2) using binoculars. You should be aware of lighting conditions and how light affects the day’s observations, taking extra time under limited-light conditions. Each individual should mentally draw a two-dimensional crown outline, block in the dieback, and estimate the dieback area. If the two observers disagree in their estimates, follow the guidelines listed above under Crown Rating Precautions.
Figure 4—Dieback rating examples.

35
Description: Number of sides of the tree’s crown receiving light from above or the side (maximum of five). How to record: Top of tree is counted as one side. Four other sides are determined by dividing the crown vertically into four quadrants around the stem. Count the number of sides (0-5) that would receive light (i.e., light is not obstructed by nearby objects) (Fig. 5). For each of the five sides, if any part of an adjacent tree crown or building is:
a) overtopping any part of that crown side, or b) within one average crown width away from the measured tree’s stem and the object is at least as tall as the measured tree, then that side of the tree is not counted as receiving direct light.
Use the following codes:
• Dead tree: not entered • 0: The tree receives no direct light because it is shaded by trees, vines, or other
vegetation/objects. • 1: The tree receives direct light from 1 of 5 sides. • 2: The tree receives direct light from 2 of 5 sides • 3: The tree receives direct light from 3 of 5 sides • 4: The tree receives direct light from 4 of 5 sides. • 5: The tree receives direct light from all 5 sides (open-grown tree)
Paper (for sample and complete): Enter under CLE. Mobile Data Collector (for sample and complete): In the Details window, enter under Crown Light Exposure.
Figure 5. Schematic illustration of the 5 sides (4 sides and top).
Crown Light Exposure
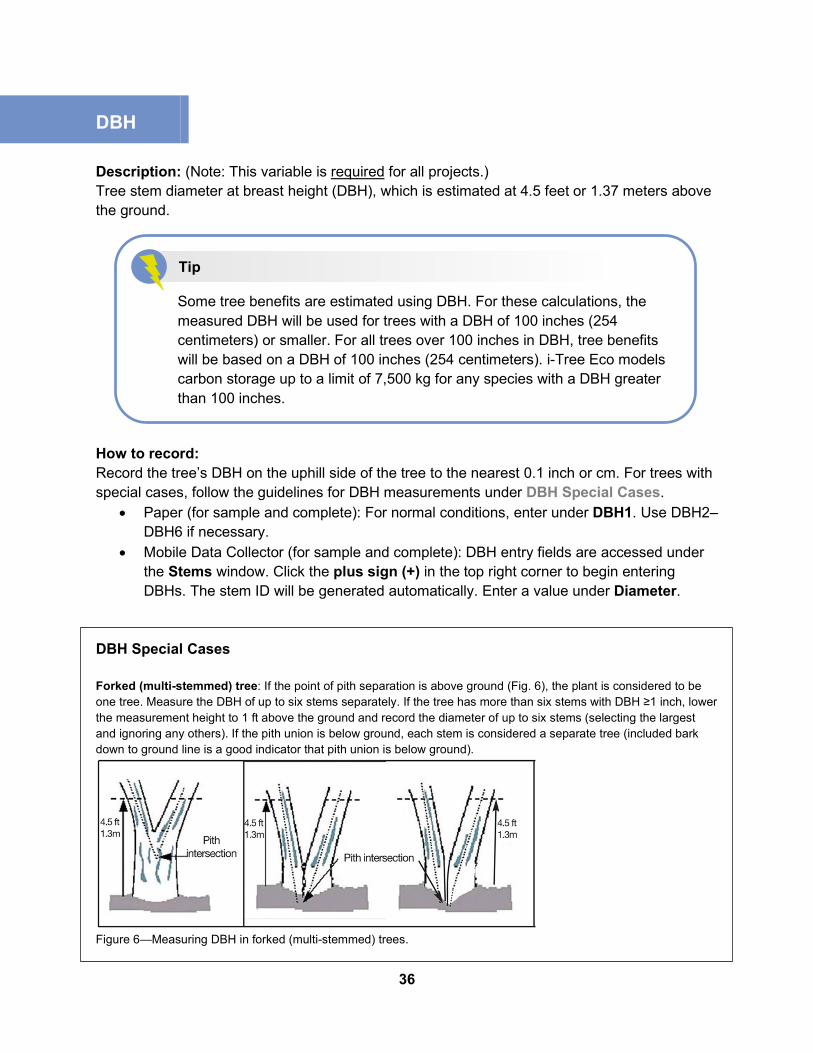
36
Description: (Note: This variable is required for all projects.) Tree stem diameter at breast height (DBH), which is estimated at 4.5 feet or 1.37 meters above the ground.
How to record: Record the tree’s DBH on the uphill side of the tree to the nearest 0.1 inch or cm. For trees with special cases, follow the guidelines for DBH measurements under DBH Special Cases.
• Paper (for sample and complete): For normal conditions, enter under DBH1. Use DBH2–DBH6 if necessary.
• Mobile Data Collector (for sample and complete): DBH entry fields are accessed under the Stems window. Click the plus sign (+) in the top right corner to begin entering DBHs. The stem ID will be generated automatically. Enter a value under Diameter.
DBH Special Cases Forked (multi-stemmed) tree: If the point of pith separation is above ground (Fig. 6), the plant is considered to be one tree. Measure the DBH of up to six stems separately. If the tree has more than six stems with DBH ≥1 inch, lower the measurement height to 1 ft above the ground and record the diameter of up to six stems (selecting the largest and ignoring any others). If the pith union is below ground, each stem is considered a separate tree (included bark down to ground line is a good indicator that pith union is below ground).
Figure 6—Measuring DBH in forked (multi-stemmed) trees.
DBH
Some tree benefits are estimated using DBH. For these calculations, the measured DBH will be used for trees with a DBH of 100 inches (254 centimeters) or smaller. For all trees over 100 inches in DBH, tree benefits will be based on a DBH of 100 inches (254 centimeters). i-Tree Eco models carbon storage up to a limit of 7,500 kg for any species with a DBH greater than 100 inches.
Tip

37
DBH Special Cases—continued Root sprouts: Any root sprouts with DBH ≥1 inch should be measured as separate trees. Root sprouts with DBH < 1 inch can be ignored. Tree with butt-swell or bottleneck: Measure these trees 1.5 ft above the end of the swell or bottleneck if the swell or bottleneck extends 3.0 ft or more above the ground. Tree with irregularities at DBH: On trees with swellings, bumps, depressions, or branches at DBH height, diameter will be measured immediately above the irregularity at the place it ceases to affect normal stem form. Tree on slope: Measure diameter at 4.5 ft from the ground along the bole on the uphill side of the tree. Leaning tree: Measure diameter at 4.5 ft from the ground along the bole. The 4.5 ft distance is measured along the underside face of the bole. Live windthrown tree: Measure from the top of the root collar along the length to 4.5 ft.
Figure 7—Measuring DBH in trees with irregularities.
DBH Measurement Height Description: Height at which DBH measurement was taken if not measured at 4.5 feet (1.37 meters) above the ground. How to record: If DBH was not measured at 4.5 ft (1.4 m), record the height where DBH was taken.

38
• Paper (for sample and complete): Enter under HT DBH. • Mobile Data Collector (for sample and complete): In the Stems window, a value of 4.5 ft
(1.4 m) is generated automatically. Correct if necessary.
DBH Measured Description: Whenever possible DBH should actually be measured, but if necessary it can be estimated visually. How to record: Record whether DBH was actually measured or not.
• Paper (for sample and complete): N/A • Mobile Data Collector (for sample and complete): In the Stems window, if direct
measurements were made, check the box next to Measured. Once all information has been entered for a given stem, click Save to continue. When all stems have been entered, click the left arrow on the main Stems page to return to that tree’s main menu.
Percent Impervious Description: (Note: This optional variable is collected for plot-based sample projects only.) The percent of the area beneath the drip line of the tree that is impervious. How to record: If the tree crown crosses out of the plot boundary, the entire area beneath the tree is still considered. Record 0%, 100%, or mid-points of 5% intervals (3, 8, 13, 18, etc.).
• Paper (sample): Enter under UNDER CANOPY > % IMPER. • Mobile Data Collector (sample): In the Details window, select a value from the drop-
down menu for Percent Impervious.
Percent Shrub Description: (Note: This optional variable is collected for plot-based sample projects only.) The percent of the area beneath the drip line that is occupied by shrubs. How to record: If the tree crown crosses out of the plot boundary, the entire area beneath the tree is still considered. Record 0%, 100%, or mid-points of 5% intervals (3, 8, 13, 18, etc.).
Cover Under Canopy

39
• Paper (for sample): Enter under UNDER CANOPY > % SHRUB. • Mobile Data Collector (for sample): In the Details window, select a value from the drop-
down menu for Percent Shrub.
If you decided to collect information related to energy effects, both of these fields (i.e., direction and distance) are required. Tree and Building Parameters Currently there are two minimum height parameters within Eco related to estimating energy effects. For complete inventory projects users can input distance and direction (see below) for trees with heights 10 feet and taller. For plot sample projects users can also input distance and direction for trees with heights greater than 10 feet, but the energy reports that apply to the entire study area will only be reporting on trees that are 20 feet and taller. Within a plot sample project, energy effects of individual trees report will use the greater than 10 foot minimum. Regardless of height, trees need to be located within 60 ft of space-conditioned residential buildings that are three stories or fewer in height (e.g., two stories and an attic). For multi-family dwellings, treat all the units in the building as a single building. For plot-based sample projects, the building itself does not have to be located on the plot. Up to three buildings can be recorded using the paper forms or mobile device. Standing dead trees that meet the above conditions should be included.
Direction to Building Description: Direction from tree to the closest part of the building, for trees that meet the above conditions. How to record: Record the direction (azimuth in degrees) from the tree to the closest part of the building.
• Paper (for sample and complete): Enter the direction from each of up to four closest buildings under TREES NEAR BUILDINGS > BLDG DIST 1/BLDG DIST 2/BLDG DIST 3/ BLDG DIST 4.
• Mobile Data Collector (for sample and complete): Building-related fields are accessed under the Building Interactions window. Click the plus sign (+) in the top right to add the first building. Enter a value under Direction.
Energy
40
Distance to Building Description: Shortest distance from tree to the closest part of the building, for trees that meet the above conditions. How to record: Measure the shortest distance from the tree to the closest part of the building (in feet or meters).
• Paper (for sample and complete): Enter the distance from each of up to four closest buildings under TREES NEAR BUILDINGS > BLDG DIR 1/BLDG DIR 2/BLDG DIR 3/ BLDG DIR 4.
• Mobile Data Collector (for sample and complete): In the Building Interactions window, add a value under Distance and click Save to continue. Click the plus sign (+) in the top right to add another building. When all buildings have been entered, click the left arrow on the main Building Interactions page to return to that tree’s main menu.
Description: Longitude and latitude of tree location. For detailed information see the Eco Guide to Capturing Coordinate Data. How to record:
• Paper (for sample and complete): Record the latitude and longitude under TREE GPS > LAT COORD Y and LONG COORD X.
• Mobile Data Collector (for sample and complete): Enter under Trees > Map Coordinates, there are three options for capturing coordinate data. Type in coordinates, use device GPS, or tap a location on the map.
Tree Location Coordinates

41
Description: Necessity of routine or immediate maintenance for the tree. Eco provides 6 default classes to choose from. Alternatively, users can create custom classes within the i-Tree Eco software that are more relevant to their project goals. These custom classes should be created prior to going out in the field. The following maintenance recommendations are default options:
None Small tree (routine) Small tree (immediate) Large tree (routine) Large tree (immediate) Critical concern (public safety)
How to record:
• Paper (for sample and complete): Enter under MANAGEMENT FIELDS > MAINT RECOM.
• Mobile Data Collector (for sample and complete): Management-related fields are accessed under the Management Info window. Select a description from the drop-down menu for Maintenance Recommendation.
Description: Necessity of specific priority tasks for the tree. Eco provides 7 default classes to choose from. Alternatively, users can create custom classes within the i-Tree Eco software that are more relevant to their project goals. These custom classes should be created prior to going out in the field. The following maintenance tasks are default options:
None Formative pruning (correct structural defects in young trees) Crown cleaning (selective pruning to remove one or more of the following: dead,
diseased, infested, rubbing, declining, detached and/or broken branches) Crown raising (pruning of branches to provide vertical clearance below the crown) Crown reduction (decrease branch length, or plant height and/or spread)
Management Information
Maintenance Recommended
Maintenance Task

42
Crown clearing (clearance area: specified area from which vegetation is to be removed)
Remove Treat pests/disease
How to record:
• Paper (for sample and complete): Enter under MANAGEMENT FIELDS > MAINT TASK.
• Mobile Data Collector (for sample and complete): Management-related fields are accessed under the Management Info window. Select a description from the drop-down menu for Priority Task.
Description: Extent of conflict between the tree’s buttress area/first order roots and surrounding hardscape/sidewalk. Eco provides 3 default classes to choose from. Alternatively, users can create custom classes within the i-Tree Eco software that are more relevant to their project goals. These custom classes should be created prior to going out in the field. The amount the tree has heaved the sidewalk is measured by the following default options:
0 to ¾ inches ¾ to 1 ½ inches 1 ½ inches
How to record:
• Paper (for sample and complete): Enter under MANAGEMENT FIELDS > SIDEWALK CONFL.
• Mobile Data Collector (for sample and complete): Management-related fields are accessed under the Management Info window. Select a description from the drop-down menu for Sidewalk Conflict.
Description: Potential or existing conflicts between tree branches and overhead utility lines. Eco provides 3 default classes to choose from. Alternatively, users can create custom classes within the i-Tree Eco software that are more relevant to their project goals. These custom classes should be created prior to going out in the field. The following utility conflicts are default options:
No lines Present and no potential conflict Present and conflicting
Sidewalk Conflict
Utility Conflict

43
How to record: • Paper (for sample and complete): Enter under MANAGEMENT FIELDS > UTILITY
CONFL. • Mobile Data Collector (for sample and complete): Management-related fields are
accessed under the Management Info window. Select a description from the drop-down menu for Utility Conflict.
Description: Users may define up to three additional custom fields to describe assessed trees in even more detail. Categories associated with custom fields are defined by the user during project configuration. How to record:
• Paper (for sample and complete): Enter under Custom Fields > 1, 2, or 3 • Mobile Data Collector (for sample and complete): Management-related fields are
accessed under the Management Info window. Select a description from the drop-down menu for the custom field that you defined.
In the mobile data collector, pest-related fields are accessed under the Pests window. The initial pest detection window asks you to note whether the overall tree, foliage/twigs, or branches/bole show indications of pest or disease. If you answer “yes” to any of these three categories, an additional window appears asking you to further characterize the damage. For each category where you identified any signs or symptoms, you will need to select a Primary Pest if known. If you are unsure, select Unknown as the protocol is not meant to be a diagnostic tool but rather a systematic method to evaluate and document pest and disease sign and symptoms. If no signs or symptoms of pest or disease presence were identified, select None.
Custom Fields
Pests (IPED)

44
For complete inventories, continue entering trees until all trees on the site have been inventoried. Check thoroughly to be sure all required fields are complete and all entries are reasonable. For sample inventories, continue entering trees until all trees on a plot have been accounted for. It is the responsibility of each crew to complete all variables before leaving the sample plot. Check thoroughly to be sure all required fields are complete and all entries are reasonable. For mobile data collector users, once all trees have been entered, click the left arrow to return to the Plot main menu. Click Mark Plot as Completed. You’re ready to move on to the next plot.
This Quality Assurance (QA) Plan was designed specifically for i-Tree Eco data collection using either volunteer or professionally trained field crews. Although originally intended for sample inventories, it can be modified for complete inventories. It is important to implement QA procedures to ensure accurate data. By setting standards and monitoring fieldwork, one can prevent or at least detect and correct errors and eliminate the repetition of most errors. Quality assurance procedures used in data collection should be documented for future project management reference, especially if you plan to repeat your project in the future. Although Quality Assurance information and procedures are not included in the Eco reporting, it is an essential part of a project to ensure consistency of collected data and model results for your project. After the initial training period, periodic inspections should be made of every crew’s fieldwork. Inspections are the most important mechanism for assuring quality data. The number of errors detected will influence the frequency of inspections.
Finishing Data Collection
Quality Assurance Plan
Remember, with the mobile data collector your data isn’t sent to the server automatically – it’s only saved in the browser cache! To save your data to the server, you MUST submit it as described in the Data Recording Tips section of this guide. Submit early and often!
Caution !
45
Definitions Quality Assurance (QA): A procedure to ensure that field data are collected accurately. QA involves a series of “hot” and “cold” checks of the field plots. Hot Check: Trainer works with the crew in the field as they conduct measurements on the plot to ensure that they have mastered the measurement techniques. Hot checks are normally done as part of the training process. Trainer observes crews during data collection and checks their measurements while the crew is at the plot. Hot checks are informal, allowing for one-on-one interaction between the trainer and the trainee. Errors encountered during hot checks are corrected. Cold Check: At regular intervals throughout the field season, an inspector or alternate crew member revisits a plot after it has been completed. The original crew is not present, and critical measurements are checked. Plots should be selected at random so field crews do not know which plots will have a cold check. Errors encountered during cold checks are corrected.
QA Timing After the initial field training, a series of hot and cold checks should be completed on approximately 5% of the plots, with more cold than hot checks (e.g., 70% cold and 30% hot). Every crew should be hot- and cold-checked. It is important to perform several QA checks early in the data collection process, but occasional checks should be performed throughout the field season. Weeks 1–2: Hot checks are conducted on a variety of plot types (wooded, residential, etc.). Weeks 3–7: Cold checks are conducted on a variety of plot types (e.g., plots with low/no tree cover, plots with a few trees, and plots with high number of trees). For plots with 5 trees or fewer, verify that all trees on the plot were measured, verify species identification is correct, remeasure DBH and total height, and verify building interaction for all trees. For plots with more than 5 trees, verify that all trees on the plot were measured and verify species identification for all trees. Then select 5 trees at random and remeasure DBH and total height, and verify building interaction. If certain variables were not collected initially, they do not need to be remeasured.
Variables to Remeasure The variables in the table below should be remeasured and recorded on a QA tree data form. (See below for data collection suggestions.) If certain variables were not collected initially, they do not need to be remeasured. Measurement Quality Objectives (MQOs) are also listed. MQOs are objective, quantitative statements describing the tolerable level of error (deviation between true and measured value) for a given measurement. They are the objective standards against

46
which data quality is measured. An MQO for a measurement generally consists of a maximum acceptable error size and the proportion of measurements that must not exceed that maximum error. When measurements can be repeated with uniform results by several individuals, it is proper to set close tolerance limits that define acceptable data. For variables that require subjective evaluation, tolerance limits should reflect the degree of subjectivity. Attributes with greater subjectivity should have broader tolerance limits.
Variable Measurement unit MQO
Land use Land use No errors, 99% of the time
Plot tree cover 5% classes Within two 5% classes, 95% of the time
Tree count
< 25 trees on plot Presence/absence No errors, 90% of the time
≥ 25 trees on plot Presence/absence Within 3% of total, 99% of the time
Tree species (or genus if species cannot be determined) Species No errors, 95% of the time
DBH
Tree with 1–10 inch DBH 0.1 in Within 0.1 in, 95% of the time
Tree with > 10 inch DBH 0.1 in Within 3%, 95% of the time
Tree total height 1 ft Within 10%, 95% of the time
Building interaction Numbers of buildings No errors, 95% of the time
For all other measurements at the plot and tree level, make sure all items have been measured/recorded by the crew and that values are reasonable. There is no need to re-measure anything else unless a problem is obvious. Highlight any measurements where tolerances have been exceeded. Keep notes on accuracy of the other data collected. If major problems are encountered, be sure to document what you did to fix them (e.g., if one species is consistently being identified incorrectly, state that you retrained the crew, went back to previously completed plots, and fixed them). Note: For any stray errors, talk with the crew to determine why those errors occurred. Determine if these few errors are symptomatic of a larger problem. If you recognize a trend and the problems are consistent from plot to plot, corrective action needs to take place: retrain the crews, fix the data sheets, and/or go back to the affected plots and remeasure the necessary items. The most important items to focus on are species identification and number of trees on the plot. Trends in diameter measurement errors are also important to note. (Is the crew consistently measuring too high or too low?)

47
QA Forms There is not a specific data sheet designed for QA purposes, as each project will have its own needs. You can create a form to use or another system for checking measurements. One option is to use the basic Eco data collection sheets. You can also save existing plot data in “.csv” (comma-separated values) format. To do that, select Plots from the Data tab of Eco. The CSV function will appear in ribbon bar. Click on it, navigate to the folder where you would like to save your file, and click Save. CSV files containing plot or tree data can be printed and used for QA purposes. Mobile device users can send plot data (for sample inventory projects) and tree data (for complete inventory projects) back to their devices to use during QA checks by selecting records to be transferred from the desktop to the mobile device so you know which trees or plots to return to. This option can be used with mobile devices for sample and complete inventory projects. To do that, select Submit to Mobile from the Data tab of Eco. Click the boxes next to the plots or trees you want to revisit. Enter your email address and password and click Submit Project.
Version Date Revision Description Manual
Page(s) Editor
Changed “Crown Live Top” to “Live Tree Height”
Many (use find
and replace)
ET
7.15.2020 Energy effect tree height guidance changed from 20ft/6m to 10ft/3m tall 39-40 ET
7.22.2020 Energy effect Tree/Bldg. interactions changed from 3 to 4 39-40 ET
7.23.2020 Energy effect tree height changed from 10ft or taller to greater than 10ft 39 ET
9.2.2021 Changed ‘provides 13 default land use classes’ to ‘provides 14 default land use classes’ 14 and 24 ET
9.2.2021 Added Forest land use definition 15 ET 10.6.2021 Changed tree and shrub definition section 22 ET
Manual Revision History