
Fertility Traanistion and Adverse Sx Ratio in districts of India
20
Journal of Biosocial Science http://journals.cambridge.org/JBS Additional services for Journal of Biosocial Science: Email alerts: Click here Subscriptions: Click here Commercial reprints: Click here Terms of use : Click here FERTILITY TRANSITION AND ADVERSE CHILD SEX RATIO IN DISTRICTS OF INDIA SANJAY K. MOHANTY and MAMTA RAJBHAR Journal of Biosocial Science / FirstView Article / October 2013, pp 1 - 19 DOI: 10.1017/S0021932013000588, Published online: 22 October 2013 Link to this article: http://journals.cambridge.org/abstract_S0021932013000588 How to cite this article: SANJAY K. MOHANTY and MAMTA RAJBHAR FERTILITY TRANSITION AND ADVERSE CHILD SEX RATIO IN DISTRICTS OF INDIA. Journal of Biosocial Science, Available on CJO 2013 doi:10.1017/S0021932013000588 Request Permissions : Click here Downloaded from http://journals.cambridge.org/JBS, IP address: 14.139.125.162 on 23 Oct 2013
Transcript of Fertility Traanistion and Adverse Sx Ratio in districts of India
Journal of Biosocial Sciencehttp://journals.cambridge.org/JBS
Additional services for Journal of Biosocial Science:
Email alerts: Click hereSubscriptions: Click hereCommercial reprints: Click hereTerms of use : Click here
FERTILITY TRANSITION AND ADVERSE CHILD SEX RATIOIN DISTRICTS OF INDIA
SANJAY K. MOHANTY and MAMTA RAJBHAR
Journal of Biosocial Science / FirstView Article / October 2013, pp 1 - 19DOI: 10.1017/S0021932013000588, Published online: 22 October 2013
Link to this article: http://journals.cambridge.org/abstract_S0021932013000588
How to cite this article:SANJAY K. MOHANTY and MAMTA RAJBHAR FERTILITY TRANSITION AND ADVERSE CHILDSEX RATIO IN DISTRICTS OF INDIA. Journal of Biosocial Science, Available on CJO 2013doi:10.1017/S0021932013000588
Request Permissions : Click here
Downloaded from http://journals.cambridge.org/JBS, IP address: 14.139.125.162 on 23 Oct 2013
J. Biosoc. Sci., page 1 of 19, 6 Cambridge University Press, 2013doi:10.1017/S0021932013000588
FERTILITY TRANSITION AND ADVERSECHILD SEX RATIO IN DISTRICTS OF INDIA
SANJAY K. MOHANTY1and MAMTA RAJBHAR
Department of Fertility Studies, International Institute for Population Sciences,
Mumbai, India
Summary. Demographic research in India over the last two decades has focused
extensively on fertility change and gender bias at the micro-level, and less has
been done at the district level. Using data from the Census of India 1991–2011
and other sources, this paper shows the broad pattern of fertility transition andtrends in the child sex ratio in India, and examines the determinants of the child
sex ratio at the district level. During 1991–2011, while the Total Fertility Rate
(TFR) declined by 1.2 children per woman, the child sex ratio fell by 30 points
in the districts of India. However, the reduction in fertility was slower in the
high-fertility compared with the low-fertility districts. The gender differential
in under-five mortality increased in many districts of India over the study period.
The decline in the child sex ratio was higher in the transitional compared with
the low-fertility districts. The transitional districts are at higher risk of a lowchild sex ratio due to an increased gender differential in mortality and increase
in the practice of sex-selective abortions. The sex ratio at birth and gender
differential in mortality explains one-third of the variation, while region alone
explains a quarter of the variation in the child sex ratio in the districts of India.
Introduction
Over the last two decades, fertility transition and a decline in the child sex ratio (numberof girls per 1000 boys in the 0–6 year age group) are concomitant in all the states of India.
Fertility transition in India began in the early 1970s, intensified in the 1990s and is now
taking place across all socioeconomic groups. The Total fertility Rate (TFR) in the
country has declined by 34% over the last two decades, from 3.8 in 1990 to 2.5 in
2011, and the recent decline in fertility is largely contributed by poor and uneducated
women (Bhat, 2002b; McNay et al., 2003; Arokiasamy, 2009; Mohanty & Ram, 2011).
Despite this progress, it is uncertain when India will achieve replacement level of fertility.
The population stabilization in India is now contingent on the future fertility scenario inthe states of Bihar and Uttar Pradesh, which have shown little reduction in their fertility
levels (Das & Mohanty, 2012). On the other hand, the fertility decline over the last two
decades has intensified gender discrimination before birth, leading to a sharp decline in
1
1 Corresponding author. Email: [email protected]
the child sex ratio. The child sex ratio in India has deepened over time: from 962 in
1981 to 945 in 1991, 927 in 2001 and 914 by 2011 (Office of the Registrar General,
2012). The reduction in the child sex ratio has been found to be spread over all regionsof the country (Kuzhiparambil & Rajani, 2012).
Conventionally, the child sex ratio is measured as the number of girls per 1000
boys, and the sex ratio at birth is measured as the number of male births per 100
female births. Here, the definitions are retained for the benefit of reader. The child sex
ratio is directly affected by three factors: gender differentials in under-five mortality,
gender differentials in under-enumeration and increased sex ratio at birth (number of
male births per 100 female births). Although under-five mortality in India has declined
over the last two decades, it has been unfavourable to females. For example, the under-five mortality among females in 2010 was 64 per 1000 live births compared with 55 per
1000 live births among males (RGI, 2012). Also, the data quality in the Indian census
has improved over time and there is now no significant gender differential in under-
enumeration for children under 10 years of age. In 2011, 260 districts with low sex
ratio were given special attention to improve census coverage and data quality (RGI,
2011a). While the imbalance in the child sex ratio until the 1990s was largely attributed
to excess under-five mortality and the undercounting of females, in recent years demo-
graphers have attributed it to parity, intensification and technological effects (DasGupta, 1987; Das Gupta & Bhat, 1997; Das Gupta & Shuzhuo, 1999). Studies have
established that sex-selective abortion is more common among socially and economically
better-off groups and in more developed regions of India, leading to a skewed child sex
ratio (Arnold et al., 2002; Jha et al., 2006, 2011; Arnold & Parasuraman, 2009; Roy &
Chattopodhyay, 2012).
Despite the non-availability of birth statistics, complexity in deriving indirect esti-
mates, lack of data on various socioeconomic indicators and increase in number of
districts, there have been some notable attempts to study the variations and change infertility in the districts of India. The first systematic attempt was made by the Registrar
General of India (RGI) who published indirect estimates of fertility from the 1981 Census
for all districts of India (RGI, 1989a). These estimates were subsequently revised and
updated (RGI, 1989b, 1997). Dreze & Murthi (2001) used these fertility estimates and
other socioeconomic variables to examine the determinants of fertility change in the
districts of India. Bhat (1996) used data for the 0–6 year age group from the 1981 and
1991 Censuses to estimate the crude birth rate and TFR for 362 districts of India.
He found large variations in the pace of fertility decline in different districts and a slowfertility decline in the districts with high fertility (TFR between 5 and 6). While the
variables joint family, proportion of Muslim population, proportion of scheduled tribes,
child mortality and unmet need for contraception were found to be positively related to
fertility, female literacy, media exposure and population density tended to be negatively
related to fertility. Guilmoto & Rajan (2001) examined the spatial pattern of the fertility
transition over a period of 40 years (1951–91) in the districts of India based on the
child–woman index and concluded that fertility decline was independent of other
factors. Subsequently, they estimated TFR using data from the 0–6 year age groupfrom the 2001 Census for all the districts of India (Guilmoto & Rajan, 2002). Ram et
al. (2005) estimated the TFR for selected district of India using birth order statistics
from the District Level Household Survey of 2002–04. Kumar & Sathyanarayana
S. K. Mohanty and M. Rajbhar2
(2012) estimated the CBR for 2001 and 2011 for the districts of India. Das & Mohanty
(2012), using data for the 0–6 year age group in the 2011 Census, estimated the fertility
level in the districts of two high-fertility states (Uttar Pradesh and Bihar) and foundstalling fertility in most of the districts of Bihar and small changes in the districts of
Uttar Pradesh.
Prior to publication of the provisional results of the 2001 Census, most research on
fertility change and gender bias in India was in the context of son preference, gender
discrimination and excess gender differentials in childhood mortality (Das Gupta,
1987; Murthi et al., 1995; Das Gupta & Bhat, 1997; Dreze & Murthi, 2001). Das
Gupta & Bhat (1997) outlined two opposing effects of fertility decline on gender bias:
namely, the parity effect and intensification effect. When fertility declines, the parityeffect decreases because of fewer births at higher parity, whereas the intensification
effect becomes larger. The intensification effect becomes more pronounced at lower
levels of fertility in the form of unreported female infanticide or sex-selective abortion.
Accessibility to sonography (also labelled as a technological effect) outweighs the
parity effect. After publication of age 0–6 data in the 2001 Census, researchers attributed
the decline in the child sex ratio to the increasing practice of sex-selective abortion and
excess child mortality (Jha et al., 2006, 2011; Navaneethan & Dharamlingam, 2011;
Kulkarni, 2012).Technological developments and the increased gender imbalance over the last two
decades warrants the investigation of fertility decline and the deepening child sex ratio
in India, both at micro- and macro-levels. While micro-level studies have documented
the increasing sex ratio at birth among socioeconomic groups leading to a skewed sex
ratio, there has been no attempt to understand the link between fertility reduction and
the declining child sex ratio at the district level in India. The aim of the paper was to (i)
depict the pattern of fertility transition and decline in child sex ratio in the districts of
India, and (ii) examine the determinants of the child sex ratio using a multivariateframework.
The paper has been conceptualized with the following rationale. First, both fertility
reduction and the decline in child sex ratio are concomitant in Indian districts and the
outcome of ‘diffusion’ processes. While fertility decline results from the diffusion of
contraception, the diffusion of amniocentesis and ultrasonography technology allows
sex detection and an increase in sex-selective abortion. Elimination of female fetuses
is leading to an increasing sex ratio at birth and decline in child sex ratio (Dreze &
Murthi, 2001; Bhat, 2002a; Guilmoto, 2008, 2009; Kuzhiparambil & Rajani, 2012).Second, there is considerable variation in the fertility level and gender bias within and
across the districts of India. The number of districts (640 as per the 2011 Census of
India) is quite large and heterogeneous in level of socioeconomic development, and
provide an opportunity to explore the links between fertility reduction and gender
bias at the sub-national level. The notion that sex-selective abortion is limited to
developed regions of India is not true. Third, the district-level analysis can help to
capture the social dimension of fertility change and gender bias (the social norm and
diffusion effect), whereas household analysis misses the influence of other women onwomen’s fertility behaviour and sex preference (Dreze & Murthi 2001). Also, the
district as the administrative unit has been key to many development programmes in
India.
Fertility transition and child sex ratio in India 3

Data and Methods
Data were obtained from multiple sources: the Census of India 1991, 2001 and 2011,
the Sample Registration System (SRS) annual reports, the Annual Health Survey
(AHS 2011), the National Sample Surveys (NSS 2004–05 and 2009–10) and the District
Level Household Surveys (DLHS 2002–04, 2007–08). The district is the unit of analysis,
and available estimates were compiled/derived at the district level from various sourcesand a master data file prepared. The Child Sex Ratio (CSR) was the dependent variable.
The level and decline in CSR was linked to a set of socioeconomic and demographic
variables. The population in the 0–6 year age group for the 1991, 2001 and 2011 Censuses
was used to estimate the Crude Birth Rate (CBR). The Total Fertility Rate (TFR) was
derived from the estimated CBR. Information on literacy rate, urbanization, caste com-
position and under-five mortality was compiled from the Census of India publications.
The state-level estimates of TFR, CBR and the abridged life-tables from the Sample
Registration System were also used. The estimated under-five mortality rates for 1991and 2001 for each district were used from the Census of India publication (RGI, 1997,
2009c). For 2011, the under-five mortality rate for 274 districts was taken from the
estimates of the Annual Health Survey 2011 (RGI, 2011b). For the remaining districts
it was assumed that the declines in mortality in 2001 and 2011 were similar to that
observed at the state level. Similar assumptions were made by Bhat et al. (1997) in
arriving at the fertility estimates for 1981 and 1991. However, the gender differential in
mortality (ratio of female to male under-five mortality rate) for 2001 was used for 2011
in other analyses. The Sex Ratio at Birth (SRB) and other reproductive and child healthindicators were computed from the unit data of the District Level Household Survey
(DLHS). It has been found that, with the exception of a few districts, the SRB was in
the acceptable range. The SRBs for the district of Balanagir in Odisha, West Kameng in
Arunachal Pradesh, Mandya and Hassan in Karnataka, Khammam in Andhra Pradesh
and South Garo Hills in Meghalaya in 2002–04 have been kept at their respective state
averages. Similarly, the SRBs of Kathua and Kupwara districts in Jammu & Kashmir,
West Garo Hills in Meghalaya, Dibang Valley and Lower Dibang Valley in Arunachal
Pradesh, Kodarma and Purbi Singhbhumi in Jharkhand and Pudukkothai in TamilNadu have been kept at their respective state averages. The monthly per capita con-
sumption expenditure (MPCE) was computed from the National Sample Survey,
2004–05 and 2009–10, for each district. The MPCEs of Poonch, Kargil and Leh dis-
tricts in Jammu & Kashmir have been kept at their respective state averages, while for
Mumbai districts the MPCEs were kept as that of Greater Bombay as the MPCEs were
not available for these districts.
Note that the number of districts in India increased from 466 in 1991 to 593 in
2001, and to 640 in 2011. The estimates for the new districts were kept the same asthose of the parent district from which it was carved out. The sample consisted of
618 districts in 1991, and 640 districts each in 2001 and 2011. The estimates were
not available in the districts of Jammu and Kashmir for 1991 as the census was not
conducted in this state in that year. Similarly, the DLHS-3 was not carried out in
Nagaland and so these districts were not used in the analyses. The variables used, the
data source, base year, final year, base year values and final year values are shown in
Table 1.
S. K. Mohanty and M. Rajbhar4
The methods used in this paper are broadly of two types: estimates of CBR using
the reverse survival method (RSM) and multivariate analyses (multiple regression and
panel data regression). The RSM is a widely used indirect method of providing esti-mates of birth rate at the district level in India (Bhat, 1996; Guilmoto & Rajan, 2002;
Das & Mohanty, 2012). The advantages of using the RSM and the use of the 0–6 year
population to estimate the CBR have been discussed elsewhere (Bhat, 1996). The basic
inputs used for RSM were population in the 0–6 age group, the mid-year population
and the survival ratio. The population in the 0–6 age group was obtained from the
census and those of mid-year population were computed using the inter-censal growth
rate for each districts. To obtain the survival ratio of the 0–6 population, the under-five
mortality and survival ratio were regressed at the state level for 2001 and 2008 usingSRS data and it was found that the coefficient was stable over time. The survival ratio
in the 0–6 age group (SR0–6) was obtained from:
SR0–6 ¼ 0.9969� 0.0008�U5MR,
where U5MR is the under-five mortality, and the same was used at the district level.
The CBR with TFR were regressed at the state level for a period of 10 years (2000–
2010) and the coefficients were used to arrive at the distinct-level estimates. While Bhat
(1996) used a log-linear regression of TFR and CBR for seventeen states, we found
that the regression without intercept fitted better. The estimated coefficient varied in
the range of 0.10–0.14 with an R2 value of 99. The estimated CBR and TFR derived
by RSM refer to the mid-period of the census years (1988, 1998 and 2008) as the under
0–6 age group are survivors of births within 6 years of the census. Although indirectestimates of TFR for 1991 and 2001 were available from other sources, it was preferred
to estimate the same to maintain the uniformity of the analyses.
A set of multiple regression equations (cross-sectional) and panel regression were
used in the analyses. The fixed-effect model (within district) and random-effect (between
districts) model on the pooled data were used to examine the district-specific effect on
CSR. The covariates used were: gender differential in under-five mortality and sex ratio
at birth, a set of developmental variables (female literacy, percentage urban, MPCE),
programme variables (percentage of women sterilized with one or two sons only, per-centage of institutional deliveries) and the region. The institutional delivery variable is
conceived as a proxy for access to amniocentesis and ultrasound sonography as districts
with higher institutional delivery coverage are likely to have higher access to these tech-
nologies to identify the sex of the baby. Similarly, districts with a higher proportion
of women sterilized with one or two sons only are likely to practise the stopping rule
and reduce the sex ratio of children. Region was kept as a domain to capture the socio-
cultural aspect within the country.
The Indian districts were classified into seven regions: South, North, East, West,Central, North-East and undivided Uttar Pradesh (UP) and Bihar. The south region
included the districts in the states of Andhra Pradesh, Karnataka, Kerala, Tamil
Nadu, Pudicherry, Lakshadweep and Andman and Nicobar; the East region included
Odisha and West Bengal; the West region included Goa, Gujarat, Maharashtra, Dadra
Nagar Haveli, Daman and Diu; the North region included Delhi, Haryana, Himachal
Fertility transition and child sex ratio in India 5
Pradesh, Jammu & Kashmir, Punjab, Chandigarh, Rajasthan; the Central region
included Madhya Pradesh and Chhattisgarh; and the Districts of Uttar Pradesh and
Bihar and the North-East states were placed in separate groups owing to their highfertility and low level of development.
In the first model, the CSR was regressed against a set of predictor variables to
understand the role of each factor in explaining variation in CSR. In the second regres-
sion model, the CSR was first regressed against the explanatory variables for each time
period and then a pooled regression were carried out. The fixed-effect model allows the
relationship to be studied between changing condition and CSR, and the slope coeffi-
cient of the fixed-effect model explains the change in CSR holding the district-specific
effect constant.The panel regression equation used was in the form of:
CSRdt ¼ adþ bXdtþYtþ edt ,
where CSRdt is the child sex ratio in district d at time t; Xdt is the vector of explanatory
variables; Yt is a time dummy variable and edt is the error term. The estimated TFR,
SRB and CSR values are presented using Arc Map 10.
The validity and reliability of the estimates were checked by comparing the district
and state estimates with published sources. For 2001, the correlation coefficient of our
estimates with those of Guilmoto & Rajan (2001) for the districts of India was 0.94.
Similarly, for 1991, the correlation coefficient of our estimates with those of the RGIwas 0.83. For 2006–11, at the national level, our estimated TFR was 2.5 compared
with 2.6 in 2010. The state-level estimates varied in the range of 10% from the SRS
indicating that our estimates were reliable. The state-level correlation coefficient of the
estimated TFR and that from the SRS was 0.98 for 2008.
Results
Table 1 presents the data sources, base years and final year for which data wereavailable and the mean and standard deviation of the variables used in the analyses.
The mean district population size in India has increased from 1.32 million in 1991 to
1.89 million in 2011. The mean TFR declined from 3.87 in 1988 to 2.66 in 2008, while
the child sex ratio declined by 30 points over the 20-year period 1991–2011. Though
the under-five morality declined from 106 per 1000 live births in 1991 to 68 in 2011,
the gender differentials in under-five mortality seemed to have widened. The social
composition of the population with respect to caste groups remains similar in the
districts of India. Female literacy, MPCE and urbanization have increased over time,indicating progress in social and economic development in the districts of India. Both
the programme variables of institutional delivery and percentage of sterilized couples
with one or two son has increased over time. The average sex ratio at birth in all dis-
tricts of India was close to that of the SRS. During 1991–2011, the share of population
in the districts belonging to the southern states declined from 23.3% to 20.9%, while
that of undivided Uttar Pradesh and Bihar increased from 26.6% to 28.6%.
S. K. Mohanty and M. Rajbhar6
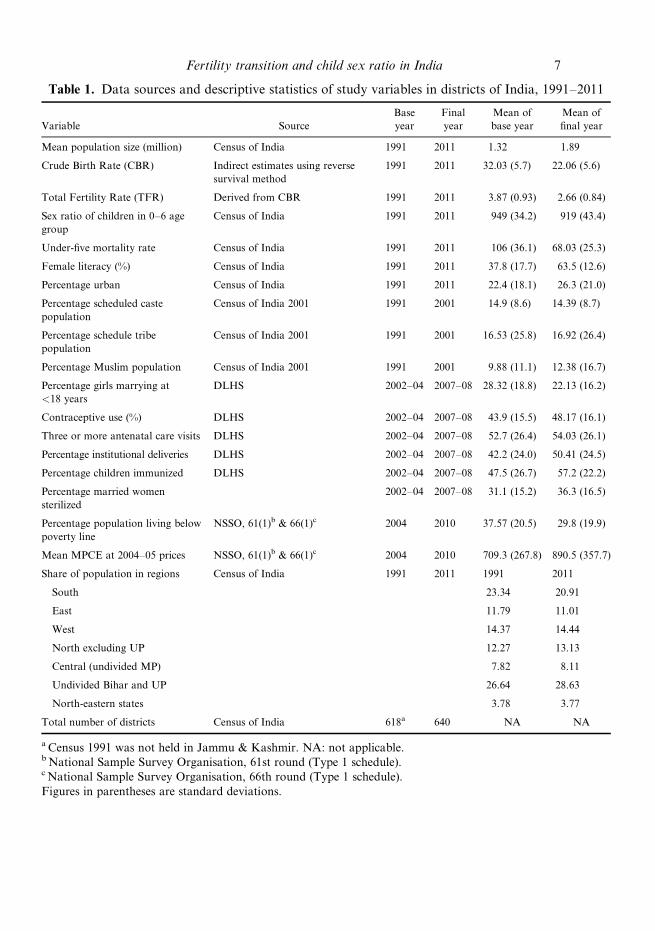
Table 1. Data sources and descriptive statistics of study variables in districts of India, 1991–2011
Variable Source
Base
year
Final
year
Mean of
base year
Mean of
final year
Mean population size (million) Census of India 1991 2011 1.32 1.89
Crude Birth Rate (CBR) Indirect estimates using reverse
survival method
1991 2011 32.03 (5.7) 22.06 (5.6)
Total Fertility Rate (TFR) Derived from CBR 1991 2011 3.87 (0.93) 2.66 (0.84)
Sex ratio of children in 0–6 age
group
Census of India 1991 2011 949 (34.2) 919 (43.4)
Under-five mortality rate Census of India 1991 2011 106 (36.1) 68.03 (25.3)
Female literacy (%) Census of India 1991 2011 37.8 (17.7) 63.5 (12.6)
Percentage urban Census of India 1991 2011 22.4 (18.1) 26.3 (21.0)
Percentage scheduled caste
population
Census of India 2001 1991 2001 14.9 (8.6) 14.39 (8.7)
Percentage schedule tribe
population
Census of India 2001 1991 2001 16.53 (25.8) 16.92 (26.4)
Percentage Muslim population Census of India 2001 1991 2001 9.88 (11.1) 12.38 (16.7)
Percentage girls marrying at
<18 years
DLHS 2002–04 2007–08 28.32 (18.8) 22.13 (16.2)
Contraceptive use (%) DLHS 2002–04 2007–08 43.9 (15.5) 48.17 (16.1)
Three or more antenatal care visits DLHS 2002–04 2007–08 52.7 (26.4) 54.03 (26.1)
Percentage institutional deliveries DLHS 2002–04 2007–08 42.2 (24.0) 50.41 (24.5)
Percentage children immunized DLHS 2002–04 2007–08 47.5 (26.7) 57.2 (22.2)
Percentage married women
sterilized
2002–04 2007–08 31.1 (15.2) 36.3 (16.5)
Percentage population living below
poverty line
NSSO, 61(1)b & 66(1)c 2004 2010 37.57 (20.5) 29.8 (19.9)
Mean MPCE at 2004–05 prices NSSO, 61(1)b & 66(1)c 2004 2010 709.3 (267.8) 890.5 (357.7)
Share of population in regions Census of India 1991 2011 1991 2011
South 23.34 20.91
East 11.79 11.01
West 14.37 14.44
North excluding UP 12.27 13.13
Central (undivided MP) 7.82 8.11
Undivided Bihar and UP 26.64 28.63
North-eastern states 3.78 3.77
Total number of districts Census of India 618a 640 NA NA
a Census 1991 was not held in Jammu & Kashmir. NA: not applicable.b National Sample Survey Organisation, 61st round (Type 1 schedule).c National Sample Survey Organisation, 66th round (Type 1 schedule).
Figures in parentheses are standard deviations.
Fertility transition and child sex ratio in India 7
Fertility transition and child sex ratio in districts of India
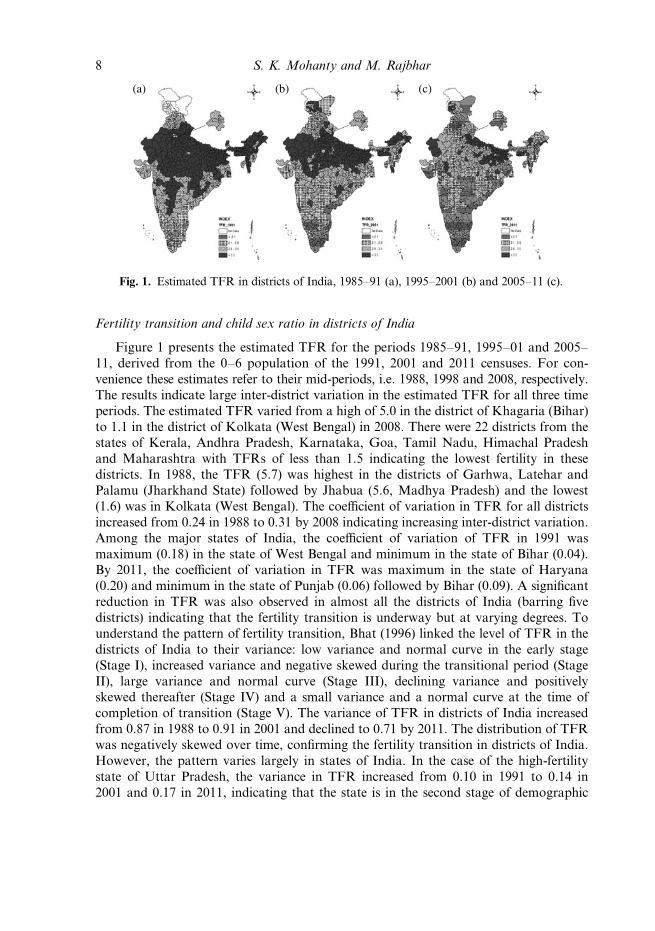
Figure 1 presents the estimated TFR for the periods 1985–91, 1995–01 and 2005–
11, derived from the 0–6 population of the 1991, 2001 and 2011 censuses. For con-
venience these estimates refer to their mid-periods, i.e. 1988, 1998 and 2008, respectively.
The results indicate large inter-district variation in the estimated TFR for all three time
periods. The estimated TFR varied from a high of 5.0 in the district of Khagaria (Bihar)
to 1.1 in the district of Kolkata (West Bengal) in 2008. There were 22 districts from thestates of Kerala, Andhra Pradesh, Karnataka, Goa, Tamil Nadu, Himachal Pradesh
and Maharashtra with TFRs of less than 1.5 indicating the lowest fertility in these
districts. In 1988, the TFR (5.7) was highest in the districts of Garhwa, Latehar and
Palamu (Jharkhand State) followed by Jhabua (5.6, Madhya Pradesh) and the lowest
(1.6) was in Kolkata (West Bengal). The coefficient of variation in TFR for all districts
increased from 0.24 in 1988 to 0.31 by 2008 indicating increasing inter-district variation.
Among the major states of India, the coefficient of variation of TFR in 1991 was
maximum (0.18) in the state of West Bengal and minimum in the state of Bihar (0.04).By 2011, the coefficient of variation in TFR was maximum in the state of Haryana
(0.20) and minimum in the state of Punjab (0.06) followed by Bihar (0.09). A significant
reduction in TFR was also observed in almost all the districts of India (barring five
districts) indicating that the fertility transition is underway but at varying degrees. To
understand the pattern of fertility transition, Bhat (1996) linked the level of TFR in the
districts of India to their variance: low variance and normal curve in the early stage
(Stage I), increased variance and negative skewed during the transitional period (Stage
II), large variance and normal curve (Stage III), declining variance and positivelyskewed thereafter (Stage IV) and a small variance and a normal curve at the time of
completion of transition (Stage V). The variance of TFR in districts of India increased
from 0.87 in 1988 to 0.91 in 2001 and declined to 0.71 by 2011. The distribution of TFR
was negatively skewed over time, confirming the fertility transition in districts of India.
However, the pattern varies largely in states of India. In the case of the high-fertility
state of Uttar Pradesh, the variance in TFR increased from 0.10 in 1991 to 0.14 in
2001 and 0.17 in 2011, indicating that the state is in the second stage of demographic
(a) (b) (c)
Fig. 1. Estimated TFR in districts of India, 1985–91 (a), 1995–2001 (b) and 2005–11 (c).
S. K. Mohanty and M. Rajbhar8
transition. In the case of Bihar, the variance in TFR increased from 0.05 in 1991 to 0.09
in 2001 and 0.15 in 2011. In the case of Maharashtra, the variance in TFR declined
from a high level of 0.24 in 1991 to 0.11 in 2011, indicating the transition in districts of
Maharashtra. On the other hand, the variance of TFR in Tamil Nadu (a low-fertility
state) declined from 0.068 in 1991 to 0.025 in 2001 and 0.018 by 2011. The distribution
of TFR indicates the varying stage of fertility transition in the districts of India. Thehigh fertility in Indian districts (TFR of more than 3.5) in 2011 was confined to just a
few states: Bihar, Uttar Pradesh, Jharkhand and Madhya Pradesh.
The child sex ratio was also analysed in the districts of India for 1991–2011. Like
TFR, the CSR varies largely among the districts of India over all the period. It has
declined in many districts and worsened over time. In 1991, the CSR varied from
1036 in the district of East Kameng (Arunachal Pradesh) to 849 in the districts of
Salem and Namakkal (Tamil Nadu). By 2011, the lowest CSR was observed in the
Jhajjar district of Haryana (774) and the highest in Lahul and Spiti (1013) in HimachalPradesh. Many of the districts with CSRs of less than 850 were in the states of Uttar
Pradesh, Haryana, Punjab, Maharashtra and Jammu & Kashmir. During 1991–2011,
the maximum decline in CSR was observed in the districts of Salem (68 points)
followed by Namakkal (64) in Tamil Nadu. Earlier studies also reported high female
feticide and infanticide in the Salem district of Tamil Nadu (George, 1997). The variance
in CSR in the districts of India increased from 1171 in 1991 to 2368 in 2001 and declined
to 1880 by 2011. On examining the state pattern in CSR it was found that while the
variance in CSR remained similar in that in Kerala at a low level during 1991–2011, itincreased from 94 in 1991 to 254 in 2001 and 328 in 2011 in the state of Punjab. Even in
high-fertility states the variance in CSR remained higher than in the state of Punjab.
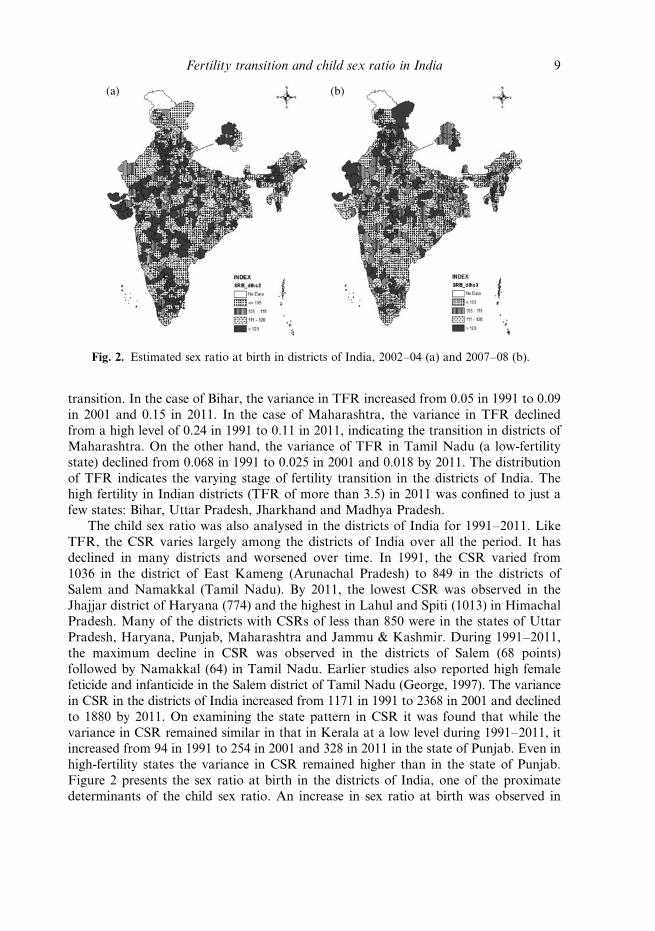
Figure 2 presents the sex ratio at birth in the districts of India, one of the proximate
determinants of the child sex ratio. An increase in sex ratio at birth was observed in
(a) (b)
Fig. 2. Estimated sex ratio at birth in districts of India, 2002–04 (a) and 2007–08 (b).
Fertility transition and child sex ratio in India 9
almost every state of India during 2002–04 and 2007–08, indicating a possible increase
in sex-selective abortion in every part of the country.
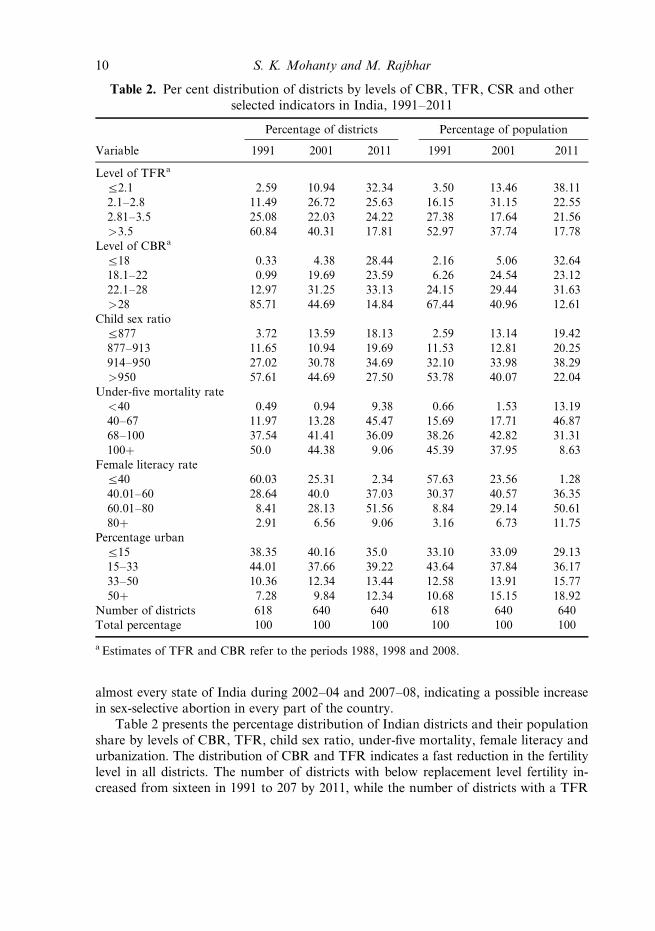
Table 2 presents the percentage distribution of Indian districts and their population
share by levels of CBR, TFR, child sex ratio, under-five mortality, female literacy and
urbanization. The distribution of CBR and TFR indicates a fast reduction in the fertility
level in all districts. The number of districts with below replacement level fertility in-
creased from sixteen in 1991 to 207 by 2011, while the number of districts with a TFR
Table 2. Per cent distribution of districts by levels of CBR, TFR, CSR and other
selected indicators in India, 1991–2011
Percentage of districts Percentage of population
Variable 1991 2001 2011 1991 2001 2011
Level of TFRa
a2.1 2.59 10.94 32.34 3.50 13.46 38.11
2.1–2.8 11.49 26.72 25.63 16.15 31.15 22.55
2.81–3.5 25.08 22.03 24.22 27.38 17.64 21.56
>3.5 60.84 40.31 17.81 52.97 37.74 17.78
Level of CBRa
a18 0.33 4.38 28.44 2.16 5.06 32.64
18.1–22 0.99 19.69 23.59 6.26 24.54 23.12
22.1–28 12.97 31.25 33.13 24.15 29.44 31.63
>28 85.71 44.69 14.84 67.44 40.96 12.61
Child sex ratio
a877 3.72 13.59 18.13 2.59 13.14 19.42
877–913 11.65 10.94 19.69 11.53 12.81 20.25
914–950 27.02 30.78 34.69 32.10 33.98 38.29
>950 57.61 44.69 27.50 53.78 40.07 22.04
Under-five mortality rate
<40 0.49 0.94 9.38 0.66 1.53 13.19
40–67 11.97 13.28 45.47 15.69 17.71 46.87
68–100 37.54 41.41 36.09 38.26 42.82 31.31
100þ 50.0 44.38 9.06 45.39 37.95 8.63
Female literacy rate
a40 60.03 25.31 2.34 57.63 23.56 1.28
40.01–60 28.64 40.0 37.03 30.37 40.57 36.35
60.01–80 8.41 28.13 51.56 8.84 29.14 50.61
80þ 2.91 6.56 9.06 3.16 6.73 11.75
Percentage urban
a15 38.35 40.16 35.0 33.10 33.09 29.13
15–33 44.01 37.66 39.22 43.64 37.84 36.17
33–50 10.36 12.34 13.44 12.58 13.91 15.77
50þ 7.28 9.84 12.34 10.68 15.15 18.92
Number of districts 618 640 640 618 640 640
Total percentage 100 100 100 100 100 100
a Estimates of TFR and CBR refer to the periods 1988, 1998 and 2008.
S. K. Mohanty and M. Rajbhar10

of more than 3.5 declined from 376 to 114 over the same time period. The share of
population in districts with below replacement level fertility increased from 3.5% in
1991 to 38% by 2011. On the other hand, districts with high fertility (TFR > 3.5) stillaccounted for 17.8% of India’s population in 2011. The high-fertility districts were
mostly in the states of Uttar Pradesh, Bihar, Madhya Pradesh, Rajasthan, Chhattisgarh
and Jammu & Kashmir, which have low contraceptive prevalence. The trend in child
sex ratio was similar to that of TFR. The number of districts with a child sex ratio of
less than 877 increased from 23 in 1991 to 116 by 2011, while the number with more
than 950 declined from 356 to 176 over the same period. Both mortality and female
literacy have improved over time. The distribution of the under-five mortality rate
showed a significant change by district: the percentage of districts with an under-fivemortality rate of 100 or more declined from about 50% in 1991 to less than 10%
by 2011. In 2011 there were few districts where the level of female literacy was less
than 40% and the variance in female literacy has declined over time. Similarly, the
percentage of districts with an urban population of more than 50% increased from
7.28% in 1991 to 12.34% by 2011.
Table 3 presents the decline in CSR by current level of TFR and absolute change
in TFR by district. Of districts with below replacement level of fertility in 2011, 16%
experienced no decline, 42% experienced a 1–25 point decline, 27% experienced a 26–50 point decline and 15% experienced a more than 50 point decline in CSR during
1991–2011. On the other hand, among districts with high fertility (TFR > 3.5), 16%
of districts did not experience any decline, 45% experienced a 1–25 point decline, 30%
experienced a 26–50 point decline and 9% experienced a more than 50 point decline in
the child sex ratio. The reduction in CSR was higher in the transitional districts (TFR
between 2.1 and 3.5). Of the 161 districts that had a TFR in the range of 2.1–2.8,
about two-thirds experienced a reduction in CSR of more than 25 points. The decline
in CSR was equally high during 1991–2001 and 2001–11. On linking the change inCSR and TFR (absolute) in the districts of India (lower panel of Table 3), it was found
that of the 174 districts with a decline in TFR of more than 1.5 during 1991–2011,
5.2% recorded no decline, 47.1% recorded a 1–25 point decline, 28.7% recorded a 26–
50 point decline and 19% recorded a more than 50 point decline in CSR. On the other
hand, of the 150 districts with a decline in TFR in a small range (between 0.5 and 1) in
last two decades, 22.6% of districts had no decline, 43% had a 1–25 point decline, 25%
had a 26–50 point decline and 8.7% had a more than 50% decline in CSR.
Table 4 presents the pace of fertility reduction and decline in CSR in Indian dis-tricts by the level of CSR and TFR class in 1991. The results indicate that districts in
the high-TFR class (TFR of more than 5) showed a 27% reduction in TFR compared
with 35% among districts with a TFR of 3–4, and 32% among districts with a TFR of
less than 3. On the other hand, the reduction in CSR was visible in all districts and, in
fact, more so in districts with a better CSR. The average decline in CSR was 20 points
among districts with a CSR of less than 878, 31 points among districts that had a CSR
in the range of 878–913, 30 points among those with a CSR in the range of 914–950
and 28 points in those with a CSR of more than 950.
Fertility transition and child sex ratio in India 11
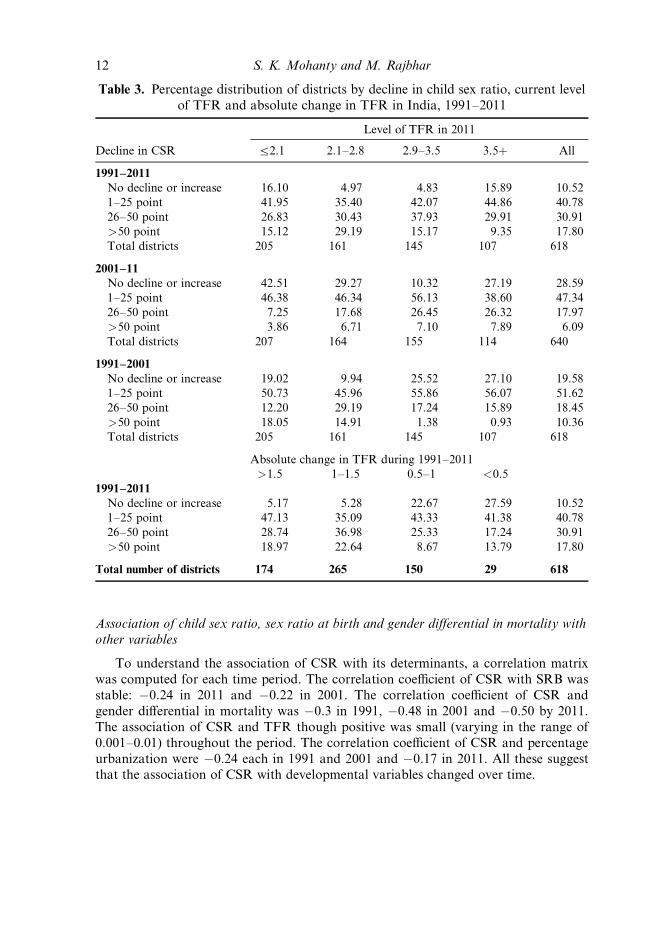
Association of child sex ratio, sex ratio at birth and gender differential in mortality with
other variables
To understand the association of CSR with its determinants, a correlation matrix
was computed for each time period. The correlation coefficient of CSR with SRB was
stable: �0.24 in 2011 and �0.22 in 2001. The correlation coefficient of CSR and
gender differential in mortality was �0.3 in 1991, �0.48 in 2001 and �0.50 by 2011.
The association of CSR and TFR though positive was small (varying in the range of
0.001–0.01) throughout the period. The correlation coefficient of CSR and percentage
urbanization were �0.24 each in 1991 and 2001 and �0.17 in 2011. All these suggestthat the association of CSR with developmental variables changed over time.
Table 3. Percentage distribution of districts by decline in child sex ratio, current level
of TFR and absolute change in TFR in India, 1991–2011
Decline in CSR
Level of TFR in 2011
a2.1 2.1–2.8 2.9–3.5 3.5þ All
1991–2011
No decline or increase 16.10 4.97 4.83 15.89 10.52
1–25 point 41.95 35.40 42.07 44.86 40.78
26–50 point 26.83 30.43 37.93 29.91 30.91
>50 point 15.12 29.19 15.17 9.35 17.80
Total districts 205 161 145 107 618
2001–11
No decline or increase 42.51 29.27 10.32 27.19 28.59
1–25 point 46.38 46.34 56.13 38.60 47.34
26–50 point 7.25 17.68 26.45 26.32 17.97
>50 point 3.86 6.71 7.10 7.89 6.09
Total districts 207 164 155 114 640
1991–2001
No decline or increase 19.02 9.94 25.52 27.10 19.58
1–25 point 50.73 45.96 55.86 56.07 51.62
26–50 point 12.20 29.19 17.24 15.89 18.45
>50 point 18.05 14.91 1.38 0.93 10.36
Total districts 205 161 145 107 618
Absolute change in TFR during 1991–2011
>1.5 1–1.5 0.5–1 <0.5
1991–2011
No decline or increase 5.17 5.28 22.67 27.59 10.52
1–25 point 47.13 35.09 43.33 41.38 40.78
26–50 point 28.74 36.98 25.33 17.24 30.91
>50 point 18.97 22.64 8.67 13.79 17.80
Total number of districts 174 265 150 29 618
S. K. Mohanty and M. Rajbhar12

Determinants of the child sex ratio in the districts of India
To understand the determinants of CSR, a set of regression models were run. In the
first set, the CSR was regressed with its determinants for 2011 and 2001. The selection
of independent variables was guided by the literature and the availability of data to
measure the variable. Table 5 shows the results of four different models to understandthe variation in CSR in 2011 (columns 2–5). In Model 1, two proximate determinants
of CSR were used, namely sex ratio at birth and gender differentials in mortality. These
two variables, along with gender differentials in enumeration, are often given as causes
of declining CSR. It was observed that both these variables explained 29% of variation
in CSR and was significant in the model. In Model 2, the developmental and demo-
graphic variables were introduced: percentage urban, female literacy, MPCE, TFR
along with the variables in Model 1. An interaction term of female literacy and per-
centage urban population was also included. The inclusion of these four variablesincreased the predictive ability of the model from 29% to 38%. All these variables
were statistically significant. In Model 3, programme variables were introduced to
understand whether the percentage of mothers sterilized with one or two child and
percentage of institutional deliveries affects the CSR. Institutional delivery is used as a
proxy for access to ultrasound sonography. On the other hand, stopping behaviour
(sterilization with one or two sons) might have resulted in a decline in CSR. Both
these variables increased the R2 value by 1% only. In Model 4, the regional dummies
were included, along with all the variables in Model 3. The inclusion of region as anexplanatory variable increases the R2 value by 25% indicating that region is a significant
Table 4. Average declines in child sex ratio and TFR during 1991–2011 in
districts of India
Number
of districts
in 1991
Unweighted average of CSR and TFRAbsolute
decline
Percentage
decline1991 2001 2011
CSR in 1991
<878 24 864 809 844 20 2.3
878–913 71 893 859 862 31 3.5
914–950 167 934 918 904 30 3.2
>950 356 972 958 944 28 2.9
Alla 618 948 930 920 28 3.0
TFR class in 1984–90
5þ 71 5.2 4.6 3.8 1.4 26.9
4–5 227 4.5 4 3.2 1.3 28.9
3–4 197 3.4 2.8 2.2 1.2 35.3
a3 123 2.5 2.1 1.7 0.8 32.0
Alla 618 3.9 3.3 2.7 1.2 30.8
a Excludes the districts of Jammu & Kashmir.
Fertility estimates refer to 6-year average prior to census year.
Fertility transition and child sex ratio in India 13

Table 5. Results of Ordinary Least Squares (OLS) analysis on factors affecting child
sex ratio in districts of India, 2001–2011
2011 2001
Model 1 Model 2 Model 3 Model 4 Model 5
Constant 1172***
(72.83)
1240***
(58.04)
1234***
(55.28)
1203***
(63.64)
1136***
(54.09)
Sex ratio at birth �0.471
(5.8)
�0.360***
(4.72)
�0.355***
(4.65)
�0.274***
(4.61)
�0.133
(1.42)
Gender differential in mortality �0.166***
(14.3)
�0.153***
(12.99)
�0.158***
(13.31)
�0.119***
(11.24)
�0.147***
(11.87)
Developmental variables
TFR �3.44
(1.55)
�0.834
(0.28)
2.47
(0.95)
14.91***
(5.57)
Female literacy �0.814***
(3.81)
�0.868***
(4.05)
�0.894***
(4.82)
�0.139
(1.09)
Percentage urban �3.64***
(7.61)
�3.597***
(7.57)
�2.90***
(7.79)
�0.914**
(3.42)
MPCE �0.037***
(6.57)
�0.038***
(6.80)
�0.007
(1.50)
�0.002
(0.23)
Programme variables
Percentage women sterilized with 1
or 2 sons
�0.707
(1.40)
�0.177
(0.40)
�1.068*
(1.74)
Percentage institutional deliveries 0.30**
(3.25)
�0.157*
(1.77)
0.022
(0.38)
Regional dummies
South (Ref.)
East �33.74***
(6.00)
�28.87***
(4.39)
West �53.11
(11.38)
�44.65***
(8.13)
North excluding UP �78.999***
(16.60)
�84.89***
(14.34)
Central (undivided MP) �38.42***
(6.88)
�44.71**
(6.59)
Undivided Bihar and UP �44.02***
(6.78)
�52.33***
(6.95)
North-East states �17.41**
(2.74)
�25.48**
(3.46)
Interaction (urbanization� female
literacy)
– 0.051***
(8.1)
0.049***
(7.85)
0.0392***
(7.98)
0.011**
(2.87)
F 127.71 56.67 45.91 75.51 47.84
Adjusted R2 28.78 38.33 39.20 64.06 52.45
N 628 628 628 628 638
Figures in parentheses are t-statistics.
*p < 0.001; **p < 0.05; ***p < 0.10.
2001 level of gender differential in mortality kept for 2011.
S. K. Mohanty and M. Rajbhar14
predictor of skewed sex ratio in India. It was observed that all regions had experienced
a significant decline in CSR compared with the southern region. To understand the
nature of the relationship over time the explanatory variables for 2001 were used aswell (Model 5). The gender differential in mortality, percentage urban, TFR, percentage
of women sterilized with one or two son and region were statistically significant in 2001.
The sex ratio at birth was not significant in 2001 but significant in 2011, while the level
of TFR was significant in 2001 but not in 2011. The predictive ability of the model (R2)
increased during 2001 and 2011 by including the set of additional variables.
The CSR was also regressed against the predictor for 1991, 2001 and 2011 by pool-
ing the data for 1991–2011. In the pooled data the fixed-effect and random-effect models
were estimated to understand the district-specific effect (Table 6). The models were runon the panel data for 1991–2011 and 2001–11. The fixed-effect models for 1991–2011
and 2001–11 were also used because more variables were available in 2001 and 2011.
In the random-effect model of 1991–2011, the gender differential in mortality, TFR,
female literacy, percentage urban and region were statistically significant. In the fixed-
effect model the gender differential in mortality, TFR, female literacy, region and time
were significant predictors. This indicates that the cross-sectional results also hold true
in the fixed-effect model. On adding more variables and estimating the random effect
model for 2001–11 it was found that sex ratio at birth, gender differential in under-fivemortality, female literacy, TFR, percentage urban, region and time were significant
predictors of CSR. When the district effect was fixed, TFR, percentage urban, MPCE,
percentage of women sterilized with one or two son and time were significant in the
model. The gender differential in mortality was dropped because the level in 2001 was
used for 2011. Of all the variables, the effect of region was large in all the models.
Discussion
The decline in the child sex ratio in India over the last two decades is a matter of grave
concern for planners, policymakers and civil society. While several measures by national
and state government and international organizations have helped to reduce infant and
child mortality, it has been offset by an increase in sex-selective abortion. Amniocentesis
and ultrasonography have been available in India from around the early 1980s to iden-
tify pregnancy complications and save the lives of mothers and children, but they have
been misused for sex determination and the elimination of female fetuses. While the use
of ultrasound is inevitable for the improvement of maternal and child health (Banerjee& Mohanty, 2012), the misuse of the technology is alarming. Despite concerted efforts
by the central government, state governments and non-governmental organizations to
prohibit sex determination tests and sex-selective abortion, these have spread from
highly developed regions to poorly developed regions and are now prevalent all over
the country. The decline in the child sex ratio is linked to fertility changes because of
the inherent gender bias and son-preference across socioeconomic groups in India.
Though the desire for a large family is disappearing in India, son preference persists
and demographers have termed it the ‘parity intensification effect’. The pattern of in-creasing sex ratio at birth and reduction in fertility in India is similar to that in other
Asian countries. While the fertility transition is irreversible, researchers are optimistic
Fertility transition and child sex ratio in India 15
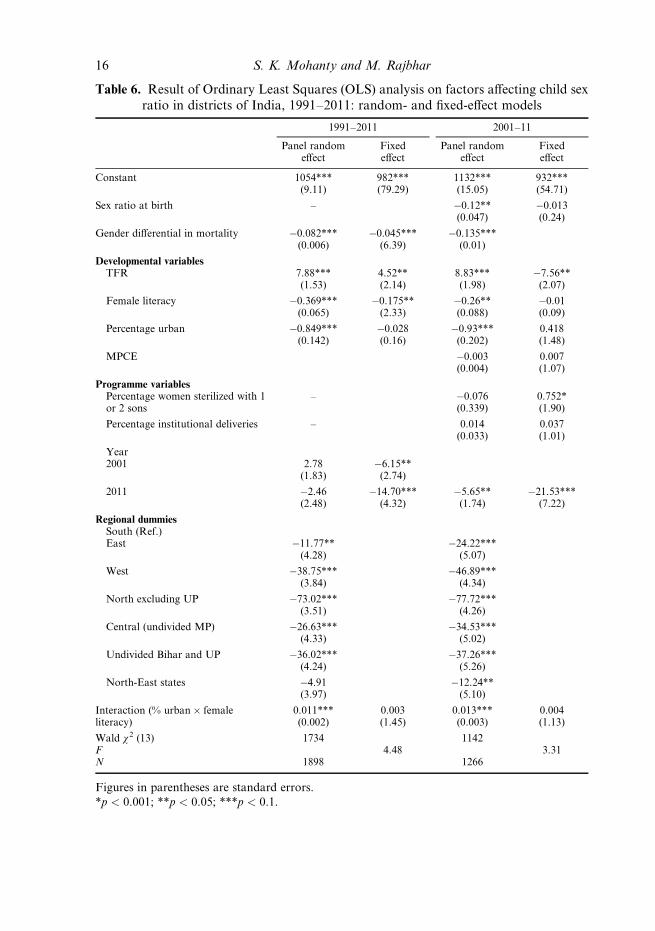
Table 6. Result of Ordinary Least Squares (OLS) analysis on factors affecting child sex
ratio in districts of India, 1991–2011: random- and fixed-effect models
1991–2011 2001–11
Panel randomeffect
Fixedeffect
Panel randomeffect
Fixedeffect
Constant 1054***(9.11)
982***(79.29)
1132***(15.05)
932***(54.71)
Sex ratio at birth – �0.12**(0.047)
�0.013(0.24)
Gender differential in mortality �0.082***(0.006)
�0.045***(6.39)
�0.135***(0.01)
Developmental variablesTFR 7.88***
(1.53)4.52**(2.14)
8.83***(1.98)
�7.56**(2.07)
Female literacy �0.369***(0.065)
�0.175**(2.33)
�0.26**(0.088)
�0.01(0.09)
Percentage urban �0.849***(0.142)
�0.028(0.16)
�0.93***(0.202)
0.418(1.48)
MPCE �0.003(0.004)
0.007(1.07)
Programme variablesPercentage women sterilized with 1or 2 sons
– �0.076(0.339)
0.752*(1.90)
Percentage institutional deliveries – 0.014(0.033)
0.037(1.01)
Year2001 2.78
(1.83)�6.15**
(2.74)
2011 �2.46(2.48)
�14.70***(4.32)
�5.65**(1.74)
�21.53***(7.22)
Regional dummiesSouth (Ref.)East �11.77**
(4.28)�24.22***
(5.07)
West �38.75***(3.84)
�46.89***(4.34)
North excluding UP �73.02***(3.51)
�77.72***(4.26)
Central (undivided MP) �26.63***(4.33)
�34.53***(5.02)
Undivided Bihar and UP �36.02***(4.24)
�37.26***(5.26)
North-East states �4.91(3.97)
�12.24**(5.10)
Interaction (% urban� femaleliteracy)
0.011***(0.002)
0.003(1.45)
0.013***(0.003)
0.004(1.13)
Wald w2 (13) 1734 1142F 4.48 3.31N 1898 1266
Figures in parentheses are standard errors.
*p < 0.001; **p < 0.05; ***p < 0.1.
S. K. Mohanty and M. Rajbhar16
about bringing normalcy to the sex ratio at birth. Guilmoto (2009) described the transi-
tion in the sex ratio at birth in China and South Korea as having two phases: an in-
crease in the first phase and reversal to normalcy in the second phase. The transition ofthe SRB is said to have completed in South Korea, and was made possible by concerted
public action.
Though fertility reduction and gender bias have been dealt with extensively in the
demographic literature, there have been only a limited number of studies focusing on
India at the district level. This is perhaps due to the non-availability of direct fertility
estimates and developmental indicators and the complexity involved in district-level
analyses in India. The compilation or derivation of district-specific indicators for three
periods of time is a daunting task. In this study, data were compiled from various sourcesand there are methodological and data constraints in deriving these estimates. A con-
certed attempt was made to sort out these issues by making reasonable assumptions.
The aim of this paper was to depict the broad pattern of fertility change and examine
its linkage with the child sex ratio in the districts of India. Using a uniform method-
ology and data from three consecutive censuses (1991, 2001 and 2011), estimates of
CBR and TFR were derived for all the districts in India. These estimates were com-
pared with earlier estimates and found to be reliable. Along with the census estimates,
programme indicators from the DLHS and estimates from the MPCE from NSS wereincluded. While earlier studies used a limited number of variables, this study used a
relatively large number of variables in the multivariate framework and covered almost
all the districts in India.
In conclusion, this study has made the following findings. Indian districts with
low fertility have recorded a decline in CSR but the reduction is larger in high-fertility
districts. In fact, the transitional districts are experiencing excess female mortality and
increased sex-selective abortion and are at higher risk of a deepening sex ratio in the
future. The results confirm the findings of micro-level studies on the linkages of declin-ing fertility and child sex ratio in India. Second, though the reproductive and child
health programme has been successful in reducing under-five mortality, the gender
differentials in under-five mortality seem to have widened during 1991–2011. Third,
along with increased sex ratio at birth and the gender differential in mortality, region
is central in explaining the variation in CSR in India. While one-third of the variation
in the CSR can be explained by the sex ratio at birth and the gender differential in mor-
tality, region explained about a quarter of the variation in CSR. Fourth, programme
variables such as increased emphasis on sterilization are significant in explaining thevariation in the child sex ratio within a district. Fifth, though the fertility transition is
universal in Indian districts, the fertility reduction has been lowest in the districts with
highest fertility.
Based on these findings it is suggested that there is a need to evolve a comprehen-
sive strategy to reduce the gender differential in child mortality in India, and curb sex-
selective abortion so as to improve the child sex ratio. Targeted interventions will help
to reduce the fertility level in high-fertility districts and strict implementation of the
existing law on sex-selective abortion throughout the country will be helpful to improvethe child sex ratio.
Fertility transition and child sex ratio in India 17
Acknowledgments
This publication is the outcome of a research project entitled ‘Understanding the path-
ways of poverty reduction and fertility transition in districts of India’, funded by the
International Institute for Population Science (IIPS), Mumbai. An earlier version of
the paper was presented at the 34th Annual Conference of the Indian Association of
Population Studies (IASP), held at the Gokhale Institute of Politics and Economics,Pune, during 13–15th December 2012. The authors thank Professor F. Ram, Professor
P. M. Kulkarni and Dr K. M. Sathyanarayana for their valuable suggestions.
References
Arnold, F., Kishor, S. & Roy, T. K. (2002) Sex selective abortions in India. Population and Develop-
ment Review 28(4), 759–785.
Arnold, F. & Parasuraman, S. (2009) The effect of ultrasound testing during pregnancy on
pregnancy termination and the sex ratio at birth in India. Paper presented at the XXVI Inter-
national Population Conference, IUSSP, Marrakech, Morocco, 27th September–2nd October.
Arokiasamy, P. (2009) Fertility decline in India: contributions by uneducated women using con-
traception. Economic and Political Weekly XLIV(30), 55–64.
Banerjee, S. K. & Mohanty, S. K. (2012) Understanding the role of ultrasound (USG) in improv-
ing maternal care in India. Ipas, 10th January 2012.
Bhat, P. N. M. (1996) Contours of fertility decline in India. In Srinivasan, K. (ed.) Population
Policy and Reproductive Health. Hindustan Publishing Corporation (India), New Delhi.
Bhat, P. N. M. (2002a) On the trail of missing Indian females II: Illusion and reality. Economic
and Political Weekly 37(52), 5244–5263.
Bhat, P. N. M. (2002b) Returning a favor: reciprocity between female education and fertility in
India. World Development 30(10), 1791–1803.
Das, M. & Mohanty, S. K. (2012) Spatial pattern of fertility transition in Uttar Pradesh and
Bihar: a district level analysis. Genus 68(2), 81–106.
Das Gupta, M. (1987) Selective discrimination against female children in rural Punjab, India.
Population and Development Review 13(1), 77–100.
Das Gupta, M. & Bhat, P. N. M. (1997) Fertility decline and increased manifestation of sex bias
in India. Population Studies 51(3), 307–315.
Das Gupta, M. & Shuzhuo, L. (1999) Gender bias in China, South Korea and India 1920–1990:
effect of war, famine and fertility decline. Development and Change 30(3), 619–652.
Dreze, J. & Murthi, M. (2001) Fertility, education and development: evidence from India. Popu-
lation and Development Review 27(1), 33–63.
George, S. M. (1997) Female infanticide in Tamil Nadu, India: from recognition back to denial?
Reproductive Health Matters 5(10), 124–132.
Guilmoto, C. Z. (2009) The sex ratio transition in Asia. Population and Development Review
35(3), 519–549.
Guilmoto, C. Z. & Rajan, S. I. (2001) Spatial pattern of fertility transition in Indian districts.
Population and Development Review 27(4), 713–738.
Guilmoto, C. Z. & Rajan, S. I. (2002) District level estimates of fertility from India’s 2001 Census.
Economic and Political Weekly 37(7), 665–672.
IIPS (2006) District Level Household Survey–II (2002–04). International Institute for Population
Sciences, Ministry of Health and Family Welfare, Government of India, Mumbai.
IIPS (2010) District Level Household and Facility Survey–III (2008–09). International Institute
for Population Sciences, Ministry of Health and Family Welfare, Government of India, Mumbai.
S. K. Mohanty and M. Rajbhar18
Jha, P., Kesler, M. A., Kumar, R., Ram, F. & Ram, U. (2011) Trends in selective abortions of
girls in India: analysis of nationally representative birth histories from 1990 to 2005 and census
data from 1991 to 2011. The Lancet 377, 1921–1928.
Jha, P., Kumar, R. & Vyas P. (2006) Low male-to-female sex ratio of children born in India:
national survey of 1.1 million households. The Lancet 367, 211–218.
Kulkarni, P. M. (2012) Recent trends in sex composition of the population of Gujarat. Paper
presented at Making Sense of Census 2011 for Gujarat conference organized by the Gujarat
Institute of Development Research, Ahmadabad, 28th December 2012.
Kumar, S. & Sathyanaraynana, K. M. (2012) District level estimates of fertility and implied sex
ratio at birth in India. Economic and Political Weekly 47(33), 66–72.
Kuzhiparambil, A. & Rajani B. M. (2012) Epicentres of missing daughters geo-spatial dimensions
of the child sex ratio in India. Asian Population Studies 3(8), 265–280.
McNay, K., Arokiasamy, P. & Cassen R. H. (2003) Why are uneducated women in India using
contraception? A multilevel analysis. Population Studies 57(1), 21–40.
Mohanty, S. K. & Ram, F. (2011) Spatial pattern of poverty reduction and fertility transition in
India. Population Review 50(1), 62–78.
Murthi, M., Guio, A. C. & Dreze, J. (1995) Mortality, fertility and gender bias in India: a dis-
trict-level analysis. Population and Development Review 21(4), 745–782.
Navaneetham, A. & Dharamalingam, A. (2011) Demography and development: preliminary inter-
pretation of the 2011 census. Economic and Political Weekly 46(16), 13–17.
Ram, F., Shekhar, C. & Mohanty, S. K. (2005) Human Development: Strengthening District
Level Vital Statistics in India. International Institute for Population Sciences, Mumbai.
Roy, T. K. & Chattopodhyay, A. (2012) Daughter discrimination and future sex ratio at birth in
India. Asian Population Studies 8(3), 281–99.
RGI (1988) Child Mortality Estimates of India, Census of India 1981. Occasional Paper No. 5.
Office of the Registrar General, India, New Delhi.
RGI (1989a) Child Mortality, Age at Marriage and Fertility in India, Census of India 1981. Occa-
sional Paper No. 2. Office of the Registrar General, India, New Delhi.
RGI (1989b) Fertility in India: An Analysis of 1981 Census Data. Occasional Paper No. 13 of
1988. Office of the Registrar General, India, New Delhi.
RGI (1994) Report on Post Enumeration Check. Paper 1 of 1994, Series 1. India. Registrar
General and Census Commissioner, Office of the Registrar General, India, New Delhi.
RGI (1997) District Level Estimates of Fertility and Child Mortality for 1991 and their Interrela-
tions with Other Variables. Occasional Paper No. 1 of 1997. Office of the Registrar General,
India, New Delhi.
RGI (2009a) District Level Estimates of Child Mortality in India Based on the 2001 Census Data.
Registrar General and Census Commissioner, Office of the Registrar General, India, New
Delhi.
RGI (2009b) District Level Estimates of Child Mortality in India Based on 2001 Census Data.
Office of the Registrar General, India, New Delhi.
RGI (2011a) Provisional Population Total. Paper 1 of 2011. India Series 1, Census of India 2011.
Office of the Registrar General and Census Commissioner, Government of India.
RGI (2011b) Annual Health Survey Bulletins 2010–11. Office of the Registrar General and
Census Commissioner, Government of India. URL: http://censusindia.gov.in/2011-common/
AHSurvey.html
RGI (2012) Sample Registration System Statistical Report 2012. Report No. 1 of 2012. Office of
the Registrar General, Government of India, New Delhi.
Fertility transition and child sex ratio in India 19