Ferrous oxalate, maghemite and hematite nanorods as efficient adsorbents for decontamination of...
12
ORIGINAL PAPER Ferrous oxalate, maghemite and hematite nanorods as efficient adsorbents for decontamination of Congo red dye from aqueous system J. P. Dhal • B. G. Mishra • G. Hota Received: 25 January 2013 / Revised: 10 November 2013 / Accepted: 17 February 2014 / Published online: 15 March 2014 Ó Islamic Azad University (IAU) 2014 Abstract In this present study, we have synthesized ferrous oxalate nanorods by a modified co-precipitation methods. The obtained nanomaterial (ferrous oxalate nanorod) was calcined at higher temperatures to form both maghemite and hematite nanorods. The morphology, size, crystalline phases, forma- tion and surface area of the nanorods were characterized by scanning electron microscope, transmission electron micro- scope, X-ray diffraction, Fourier transform infrared spectro- scope, ultraviolet–visible diffuse reflectance spectroscope and Brunauer–Emmett–Teller surface area analytical techniques. The results showed that high-yield aligned nanorods with a typical diameter of 100–200 nm and length up to micrometers were formed. The obtained rod-shaped nanomaterials (i.e., ferrous oxalate, maghemite and hematite) were used as adsorbents and were applied to remove Congo red (CR) dye molecules, which was used as a model of organic pollutants in aqueous solution. The adsorption isotherms and kinetics of removal of CR were studied. It was found that the adsorption capacity of maghemite nanorod is highest among the three adsorbents and can be regarded as an effective adsorbent for removal of CR from aqueous solution. Keywords Co-precipitation method Nanomaterials Nanorod Congo red (CR) Adsorption Introduction Water pollution is a major global problem which is the leading worldwide cause of deaths and diseases. Many synthetic chemicals are extremely resistant to biodegradation by native microorganisms and are major water pollutants, such as pesticides, organochlorines, polychlorinated biphenyls, polycyclic aromatic hydrocar- bons, wood preservatives, synthetic polymers and synthetic dyes. Synthetic dyes are extensively used in different industries, including paper, plastic, leather, pharmaceutical, food, cosmetic, dyestuff and textile industries (Ge et al. 2012; Haider et al. 2011). Dyeing is a fundamental oper- ation during the textile fiber processing. This operation causes the production of more or less colored waste waters, depending on the degree of fixation of the dyes on the substrates, which varies with the nature of the substances, the desired intensity of coloration and the application method (Wawrzkiewicz 2012). According to a recent study, approximately 700,000 tons of different dyes are produced annually in the world, and more than 60 % of the world dye production is consumed by textile industries (Hu et al. 2010a, b). Due to the presence of hazardous wastes and toxic pollutants in the effluents from the textile industry, they are highly problematic to environment. Among them, organic dyes are one of the major groups of pollutants in waste waters. These toxic dyes have signifi- cant impact on the human health and the aquatic life. The used dyes may cause an eco-toxic hazard and induce the potential danger of bioaccumulation (Toor and Jin 2012; Wang et al. 2012a, b; Kumar and Bansal 2012). The toxic nature of dye is that on decomposition it gives hazardous products such as carbon dioxide, carbon mon- oxide, nitrogen oxide and hydrogen chloride. These pro- ducts are toxic and causes severe health problem to living beings (Irama et al. 2010). Congo red [1-naphthalene sul- fonic acid, 3, 30-(4, 40-biphenylenebis(azo))bis(4-amino-) disodium salt] an anionic dye has been known to cause an allergic reaction and to be metabolised to benzidine, a human carcinogen. Congo red (CR) mainly occurs in the J. P. Dhal B. G. Mishra G. Hota (&) Department of Chemistry, N.I.T. Rourkela, Rourkela, Odisha, India e-mail: [email protected] 123 Int. J. Environ. Sci. Technol. (2015) 12:1845–1856 DOI 10.1007/s13762-014-0535-x
Transcript of Ferrous oxalate, maghemite and hematite nanorods as efficient adsorbents for decontamination of...
ORIGINAL PAPER
Ferrous oxalate, maghemite and hematite nanorods as efficientadsorbents for decontamination of Congo red dye from aqueoussystem
J. P. Dhal • B. G. Mishra • G. Hota
Received: 25 January 2013 / Revised: 10 November 2013 / Accepted: 17 February 2014 / Published online: 15 March 2014
� Islamic Azad University (IAU) 2014
Abstract In this present study, we have synthesized ferrous
oxalate nanorods by a modified co-precipitation methods. The
obtained nanomaterial (ferrous oxalate nanorod) was calcined
at higher temperatures to form both maghemite and hematite
nanorods. The morphology, size, crystalline phases, forma-
tion and surface area of the nanorods were characterized by
scanning electron microscope, transmission electron micro-
scope, X-ray diffraction, Fourier transform infrared spectro-
scope, ultraviolet–visible diffuse reflectance spectroscope and
Brunauer–Emmett–Teller surface area analytical techniques.
The results showed that high-yield aligned nanorods with a
typical diameter of 100–200 nm and length up to micrometers
were formed. The obtained rod-shaped nanomaterials (i.e.,
ferrous oxalate, maghemite and hematite) were used as
adsorbents and were applied to remove Congo red (CR) dye
molecules, which was used as a model of organic pollutants in
aqueous solution. The adsorption isotherms and kinetics of
removal of CR were studied. It was found that the adsorption
capacity of maghemite nanorod is highest among the three
adsorbents and can be regarded as an effective adsorbent for
removal of CR from aqueous solution.
Keywords Co-precipitation method � Nanomaterials �Nanorod � Congo red (CR) � Adsorption
Introduction
Water pollution is a major global problem which is the
leading worldwide cause of deaths and diseases. Many
synthetic chemicals are extremely resistant to
biodegradation by native microorganisms and are major
water pollutants, such as pesticides, organochlorines,
polychlorinated biphenyls, polycyclic aromatic hydrocar-
bons, wood preservatives, synthetic polymers and synthetic
dyes. Synthetic dyes are extensively used in different
industries, including paper, plastic, leather, pharmaceutical,
food, cosmetic, dyestuff and textile industries (Ge et al.
2012; Haider et al. 2011). Dyeing is a fundamental oper-
ation during the textile fiber processing. This operation
causes the production of more or less colored waste waters,
depending on the degree of fixation of the dyes on the
substrates, which varies with the nature of the substances,
the desired intensity of coloration and the application
method (Wawrzkiewicz 2012). According to a recent
study, approximately 700,000 tons of different dyes are
produced annually in the world, and more than 60 % of the
world dye production is consumed by textile industries (Hu
et al. 2010a, b). Due to the presence of hazardous wastes
and toxic pollutants in the effluents from the textile
industry, they are highly problematic to environment.
Among them, organic dyes are one of the major groups of
pollutants in waste waters. These toxic dyes have signifi-
cant impact on the human health and the aquatic life. The
used dyes may cause an eco-toxic hazard and induce the
potential danger of bioaccumulation (Toor and Jin 2012;
Wang et al. 2012a, b; Kumar and Bansal 2012).
The toxic nature of dye is that on decomposition it gives
hazardous products such as carbon dioxide, carbon mon-
oxide, nitrogen oxide and hydrogen chloride. These pro-
ducts are toxic and causes severe health problem to living
beings (Irama et al. 2010). Congo red [1-naphthalene sul-
fonic acid, 3, 30-(4, 40-biphenylenebis(azo))bis(4-amino-)
disodium salt] an anionic dye has been known to cause an
allergic reaction and to be metabolised to benzidine, a
human carcinogen. Congo red (CR) mainly occurs in the
J. P. Dhal � B. G. Mishra � G. Hota (&)
Department of Chemistry, N.I.T. Rourkela, Rourkela, Odisha,
India
e-mail: [email protected]
123
Int. J. Environ. Sci. Technol. (2015) 12:1845–1856
DOI 10.1007/s13762-014-0535-x

effluents discharged from textile, paper, printing, leather
industries, etc. Its molecular formula is C32H22N6Na2O6S2
(Yosef and Avnir 2011; Chatterjee et al. 2010).
There are several methods for removal of organic dyes
from aqueous solution such as coagulation (Marechal et al.
1997), nanofiltration (Chakraborty et al. 2003), ozonation
(Khadhraoui et al. 2009), ultrasound irradiation (Song et al.
2009), ion exchange (Wawrzkiewicz and Hubicki 2010),
activated carbon filter (Chan et al. 2009), oxidation (Lucas
and Peres 2006), membrane processes (Sachdeva and
Kumar 2009), micellar-enhanced ultrafiltration (Purkait
et al. 2004) and adsorption (Wang et al. 2012a, b). Among all
the processes, adsorption is a very effective separation
technique and now it is considered as superior to other
techniques for water treatment in terms of effectiveness,
initial cost, simplicity of design, and ease of operation and
insensitive to toxic substances and its environmentally
friendly reasons. Similarly, this technique can handle fairly
large flow rates, producing a high-quality effluent that does
not result in the formation of harmful substances, such as
ozone and free radicals. In this process, the dye species are
transferred from the water effluent to a solid phase that leads
to decrease the effluent volume (Dawood and Sen 2012;
Toor and Jin 2012; Wang et al. 2012a, b; Zhu et al. 2012a, b).
Many researchers used various adsorbent for removal of
CR from aqueous solution such as fly ash (Dizge et al.
2008), bentonite (Lian et al. 2009), montmorillonite (Wang
and Wang 2008), chitosan (Chatterjee et al. 2009), organo-
attapulgite (Chen and Zhao 2009), activated carbon (Lo-
renc-Grabowska and Gryglewicz 2007; Namasivayam and
Kavitha 2002; Purkait et al. 2007), bottom ash and deoiled
soya (Mittal et al. 2009), Azadirachta indica leaf powder
(Bhattacharyya and Sharma 2004), Trametes versicolor
(Binupriya et al. 2008), jute stick powder (Panda et al.
2009), Aspergillus niger (Fu and Viraraghavan 2002), cat-
tail root (Hu et al. 2010a, b), anilinepropylsilica xerogel
(Pavan et al. 2008), perlite (Vijayakumar et al. 2009),
sawdust (Jain and Sikarwar 2008), rice husk ash (Chow-
dhury et al. 2009), mesoporous hematite (a-Fe2O3) (Yu
et al. 2008) and CNTs/b-FeOOH (Song et al. 2012). How-
ever, some of these adsorbents do not have good adsorption
capacities for anionic dyes. Nowadays, research focused on
the use of nanotechnology for environmental clean-up/
remediation. Arising out of their ultrafine size, large surface
area and interface-dominated properties, nano-sized mate-
rials can be used to decontaminate the toxic organic and
inorganic chemical from the environments. Recently, Af-
khami and Moosavi (2010) used maghemite nanoparticle,
prepared by co-precipitation method, for removal of CR
from aqueous solution.
In the present investigation, by using a modified wet
chemical method, we have prepared different 1-dimen-
sional nano-adsorbents such as ferrous oxalate
(FeC2O4�2H2O) nanorod, hematite (a-Fe2O3) nanorod and
maghemite (c-Fe2O3) nanorod. The prepared adsorbents
were employed for removal of CR, and a comparative
study was carried out by evaluating equilibrium isotherms
and kinetic data for selection of the most effective adsor-
bent among them. The advantages of using iron oxide
nanomaterials as adsorbents are as follows: They are most
stable material under ambient conditions and have a great
scientific and technological importance because of their
n-type semiconducting properties with their narrow band
gap around 2 eV, chemical stability and nontoxicity.
This research work was carried out in Rourkela, India,
during the period of March 2012 to November 2012.
Materials and methods
Materials
Congo red (CR, molecular formula C32H22N6Na2O6S2,
molecular weight 696.66 g mol-1, kmax = 498 nm), an
anionic azo dye, obtained from Merck (India) was selected as
dye.
Synthesis of adsorbent
All chemicals used in the investigation such as Ferrous
sulfate heptahydrate, oxalic acid dihydrate, CTAB and
ethanol were of analytical grade and were used without
further purification. The chemicals were obtained from
Merck (India).
Ferrous sulfate heptahydrate (FeSO4�7H2O) was dis-
solved in 10 mL of double-distilled water with intensive
stirring to form solution-A. Oxalic acid dihydrate
(H2C2O4�2H2O) and CTAB (Cetyl trimethylammonium
bromide) were dissolved in 25 mL of ethanol with intensive
stirring to form solution-B. Then, solution-A was added to
solution-B with intensive stirring to form a yellow colored
homogeneous solution. After addition, the stirring was car-
ried out for another 5 h. Then, the yellow colored precipitate
obtained was centrifuged, washed thoroughly by ethanol and
double-distilled water and dried at 80 �C for 2 h to form
FeC2O4�2H2O nanorod. A part of this nanopowder was
heated at 300 �C in moist condition to obtained c-Fe2O3
nanorod and heated at 550 �C to obtained a-Fe2O3 nanorod.
Characterization of adsorbent
Various characterization techniques were used to charac-
terize the 1-D nanoadsorbents. The crystalline phases were
identified by mean of X-ray diffraction (XRD) by a PANa-
lytical X-ray diffractometer with Cu Ka radiation (k)
1.54156 A at a scan rate of 2�/min. The surface morphology
1846 Int. J. Environ. Sci. Technol. (2015) 12:1845–1856
123

of the prepared adsorbent materials was characterized by a
JEOL JSM-5300 scanning electron microscope (SEM)
operated at an acceleration voltage of 15 and 20.0 kV. The
size of the particle and selected area electron diffraction
(SAED) pattern of the dried c-Fe2O3 powder were observed
using a high-resolution transmission electron microscope
(TEM) (JEM-2100 HRTEM, Make-JEOL, Japan) with an
acceleration voltage of 200 kV. Fourier transform infrared
spectroscopy (FTIR) results were recorded using Perkin-
Elmer FTIR (Spectrum RX-I) spectrophotometer. The
ultraviolet–visible diffuse reflectance spectra (UV–Vis
DRS) of the sample were recorded using Shimadzu spec-
trometer (model 2450) with BaSO4 coated integration
sphere in the range of 200–800 nm. Specific surface area and
pore size distribution (PSD) were determined by the Bru-
nauer–Emmett–Teller (BET) and Barrett–Joyner–Halenda
(BJH) methods, respectively, by N2 adsorption–desorption
technique by automated surface area and porosity analyser
(COULTER SA 3100 Series Surface Area and Pore Ana-
lyzers). Prior to the analysis, sample was degassed under a
vacuum (1 9 10-5 Torr) at 150 �C for 1.5 h.
Adsorption experiment
For the removal of CR dye from water, the adsorption
experiments were carried out using the three prepared
adsorbents: FeC2O4�2H2O, a-Fe2O3 and c-Fe2O3 nanorods.
A stock solution of CR (1 g L-1) was prepared in double-
distilled water, and desired concentrations of the dye were
obtained by diluting the same with double-distilled water.
The calibration curve of CR was prepared by measuring the
absorbance of different concentrations of the samples at
kmax = 498 nm using UV–vis spectrophotometer, as CR
has a maximum absorbance at wavelength 498 nm on a
UV–vis spectrophotometer.
Figure 1 shows the UV–vis spectra of CR solutions of
concentration 100 mg L-1 before and after adsorption
using 0.05 g of different adsorbents, such as FeC2O4�2H2O
nanorod, c-Fe2O3 nanorod and a-Fe2O3 nanorod with
reaction time 30 min. At a c-Fe2O3 dosage of 0.05 g-1, the
colloidal suspension is able to adsorb almost 100 % of CR
(Fig. 1), and the photograph of before and after adsorption
also confirms the removal of the CR at this dosage of c-
Fe2O3 (Fig. 1, inset).
The amount of adsorption qe is calculated by equation
(Nethaji et al. 2012):
qe ¼C0 � Ce
wV ð1Þ
where qe is the amount of adsorption at equilibrium in mg g-1,
C0 and Ce are the initial and equilibrium concentration of the
dye in mg L-1, V is the volume of the dye solution taken in
liter and w is the weight of the nanorod (adsorbent) in gram.
Results and discussion
Surface morphology
Figure 2 shows the SEM micrographs of as synthesized
FeC2O4�2H2O nanorod, c-Fe2O3 nanorod and a-Fe2O3
nanorod. Figure 2a SEM micrograph suggests that the
obtained FeC2O4�2H2O nanostructure exhibits the mor-
phology of the nanorod with the diameter of about
100–200 nm and the length up to micrometers. Moreover,
the surface of the FeC2O4�2H2O nanorods seems smooth,
and no defects can be observed. When the FeC2O4�2H2O
nanorods were annealed in air at 300 �C in moist condition,
c-Fe2O3 nanorods were fabricated. Figure 2b shows the
SEM image of the as-synthesized c-Fe2O3 nanorods. It can
be seen that the as-synthesized c-Fe2O3 nanorods retain the
morphology of the FeC2O4�2H2O nanorods. Similarly,
when the FeC2O4�2H2O nanorods were annealed in air at
550 �C, a-Fe2O3 nanorods were fabricated. Figure 2c
shows the SEM image of the as-synthesized a-Fe2O3
nanorods. It can also be seen that the as-synthesized a-
Fe2O3 nanorods retain the morphology of the
FeC2O4�2H2O nanorods. Figure 2d shows the EDX ana-
lysis of as-synthesized c-Fe2O3 nanorods, in which pre-
sence of Fe and O is indicated.
A typical profile of TEM images of c-Fe2O3 is shown in
Figure 3a and b, which gives further evidence of the for-
mation of high-yield aligned nanorods. A typical TEM
image of a single c-Fe2O3 nanorod is given in Fig. 3c,
which gives the average diameter of the rod is around
100 nm. The SAED pattern taken from the same single
nanorod (given in Fig. 3d) shows sharp bright rings which
indicates it is the polycrystalline spinel structure.
Fig. 1 UV–vis absorption spectra of (a) initial CR with a concen-
tration of 100 mg L-1 and solutions (20 mL) after treated with 0.05 g
of (b) FeC2O4�2H2O, (c) c-Fe2O3 and (d) a-Fe2O3 for 30 min
Int. J. Environ. Sci. Technol. (2015) 12:1845–1856 1847
123

Fig. 2 SEM micrographs of
a FeC2O4�2H2O nanorod, b c-
Fe2O3 nanorod, c a-Fe2O3 and
d EDX of c-Fe2O3 nanorod
Fig. 3 a–c TEM images and
d SAED pattern of c-Fe2O3
nanorod
1848 Int. J. Environ. Sci. Technol. (2015) 12:1845–1856
123
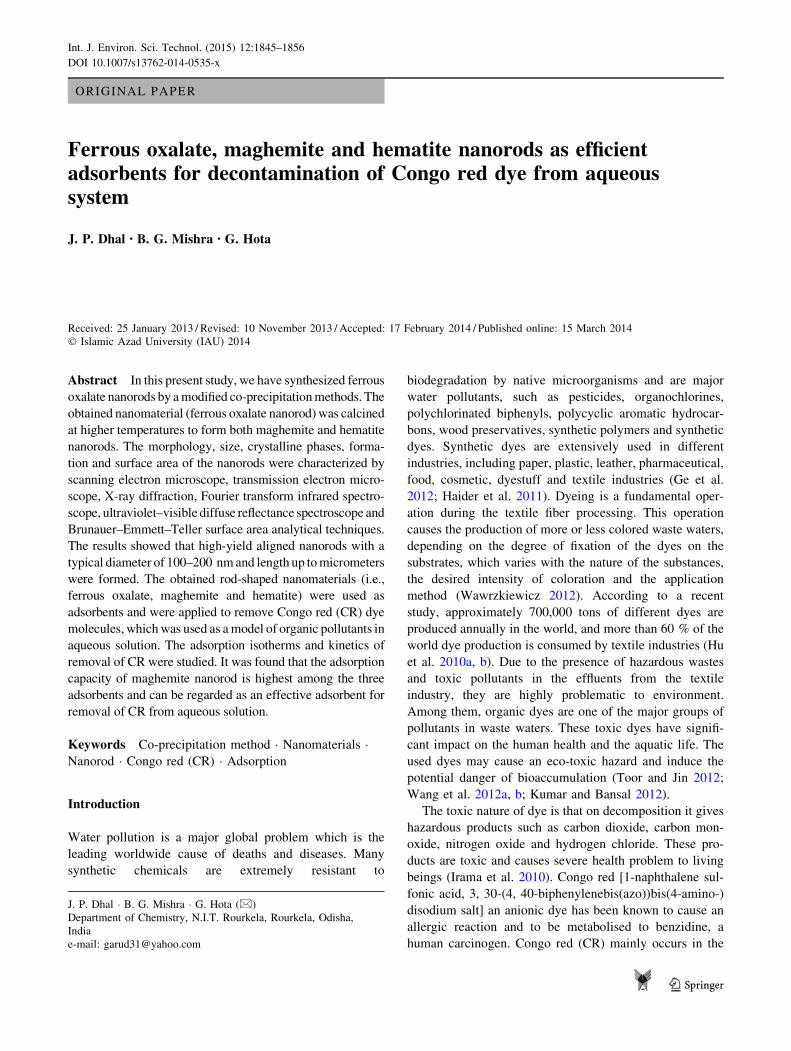
X-ray diffraction analysis
The formation and phase analysis of the prepared
nanomaterials was studied by XRD using Cu Ka radia-
tion. Figure 4 shows the XRD patterns of as synthesised
FeC2O4�2H2O nanorod, c-Fe2O3 nanorod and a-Fe2O3
nanorod. Figure 4a is the XRD pattern of FeC2O4�2H2O
and contains the characteristics peaks and can be index to
orthorhombic crystal structure according to JCPDS No:
22-0635. Figure 4b contains the characteristics peaks of
c-Fe2O3 and can be index to cubic crystal structure
according to JCPDS No: 39-1346. The XRD pattern of
Fig. 4c contains the characteristics peaks of a-Fe2O3 and
can be index to rhombohedral according to JCPDS No:
79-0007. In Fig. 4b, it is observed that along with peaks
of c-Fe2O3, some additional peaks are present (star
marked). These are due to presence of small amount of a-
Fe2O3 in the sample. The X-ray diffractograms reveal the
well crystalline nature of the compounds. The broadening
of the peaks also indicates the decrease in the diameter
and an increase in the surface-to-volume ratio of the
compounds. Crystallite size and the lattice strain of the
prepared samples are calculated from the X-ray diffrac-
tograms. From the well-known Scherrer formula, the
average crystallite size, L, is:
L ¼ Kkb cos h
ð2Þ
where k is the X-ray wavelength, h is the diffraction angle, bis the line broadening at half the maximum intensity
(FWHM) in radians resulting from small crystallite size and
K is a constant approximately equal to unity and related to
crystallite shape. The crystallite size and lattice strain of
ferrous oxalate were found to be 22.6 nm and 1.196 %,
respectively. When it is heated to 300 �C form c-Fe2O3, its
crystallite size increased to 29.4 nm while lattice strain
decreased to 0.5. Similarly, when the sample further heated
to higher temperature to form a-Fe2O3, its crystallite size still
increases and lattice strain decreases. This phenomenon is
also observed in the XRD patterns that for ferrous oxalate
consists broadened peaks and c-Fe2O3 consists less broad-
ened peaks while a-Fe2O3 contains comparatively sharp
peaks. As the lattice strain of a-Fe2O3 is least, it is the most
stable form among the three samples. The unit-cell dimen-
sion of the synthesized samples was measured to determine
the crystal structure and given in Table 1.
FTIR study
To further confirm the formation and transformation from
FeC2O4�2H2O to c-Fe2O3 and a-Fe2O3, FTIR analysis was
performed. In Fig. 5a pattern, the peaks at 3,358, 1,631,
1,315 and 496 cm-1 are attributed to O–H, C=O, C–O and
Fe–O functional groups, respectively, indicating the for-
mation of FeC2O4�2H2O. In Fig. 5b pattern, the peak at
632 cm-1 is due to Fe–O, which is characteristic peak of
maghemite and at 1,637 cm-1 is due to presence of water
of crystallization in the sample. In Fig. 5c pattern, the
peaks at 617 cm-1 is due to longitudinal adsorption (Au)
and at 572 and 490 cm-1 are due to transverse adsorption
(Eu) of Fe–O vibrational mode of hematite.
UV–vis diffuse reflectance spectra
The optical characterization of the prepared nanomaterials
such as electronic transition and band energy gap was done
by UV–visible absorbance spectra. The spectral absorption
coefficient, a, is defined as,Fig. 4 XRD patterns of (a) FeC2O4�2H2O nanorod, (b) c-Fe2O3
nanorod and (c) a-Fe2O3 nanorod
Table 1 Crystallographic information of the prepared nanorods
Sample Crystal structure Lattice parameters (�A) Crystallite size (nm) Lattice strain (%)
FeC2O4�2H2O Orthorhombic a = 12.26, b = 5.57, c = 15.48 22.6 1.196
c-Fe2O3 Cubic a = 8.3515 29.4 0.5
a-Fe2O3 Rhombohedral a = b=5.0285, c = 13.736 39.1 0.433
Int. J. Environ. Sci. Technol. (2015) 12:1845–1856 1849
123

a kð Þ ¼ 4pkðkÞk
ð3Þ
where (k) is the spectral extinction coefficient obtained from
the absorption curve and k is the wavelength. Figure 6 shows
the visible and near-UV diffuse reflectance spectra of the
ferrous oxalate and the two iron oxides. From the spectrum of
ferrous oxalate, it is observed that there is an intense band
around 210 nm and an asymmetric band at 400 nm. The
intense band corresponds to the charge transfer band and the
less intense band arises due to 5T2g ? 5Eg. In case of c-Fe2O3
spectrum, it is observed that absorption peaks at 302, 357 and
421 nm correspond to 6A1 ? 4T1, 6A1 ? 4E and
2(6A1) ? 2(4T1) ligand-free transition of Fe?3, respectively,
while the peak at 512 nm corresponds to finger print region of
the band edge of maghemite (Sherman and Waite 1985). From
the spectrum of a-Fe2O3, it is observed that absorption peaks
at 339, 355, 484 and 537 nm. The peaks at 355 and 484 nm
correspond to 6A1 ? 4E and 2(6A1) ? 2(4T1) ligand field
transition of Fe3?, respectively. Again, the peak at 537 nm
corresponds to finger print region of the band edge of hematite.
This experiment further confirms the formation of pure a-
Fe2O3 (Zhu et al. 2012a, b).The optical band gap Eg can be
experimentally obtained from absorption coefficient
measurements using Tauc’s formula (Miller et al. 2004):
ahmð Þ ¼ Aðhm� EgÞn ð4Þ
where a is the absorption coefficient, A is a constant and
n is equal to 1/2 for allowed direct transitions and 2 for
allowed indirect transitions. The band gap value, Eg, of the
prepared nanorods was evaluated by extrapolating the lin-
ear portion of the curve. It is found that the energy band
gaps of FeC2O4�2H2O, c-Fe2O3 and a-Fe2O3 are 2.24, 1.95
and 2.04 eV, respectively. So, it may be considered that all
the prepared nanorods possess semiconducting properties
with narrow band gap.
N2 adsorption–desorption isotherm
The surface area and porosity nature of the prepared nanorods
was carried out by N2 adsorption–desorption isothermFig. 5 FTIR spectra of (a) FeC2O4�2H2O nanorod, (b) c-Fe2O3
nanorod and (c) a-Fe2O3 nanorod
Fig. 6 a Visible and near-
ultraviolet absorption spectra of
FeC2O4�2H2O, c-Fe2O3 and a-
Fe2O3 and Tauc plots of
b FeC2O4�2H2O, c c-Fe2O3 and
d a-Fe2O3
1850 Int. J. Environ. Sci. Technol. (2015) 12:1845–1856
123

technique. The adsorption–desorption isotherm and pore size
distribution are shown in Fig. 7. From Fig. 7a, it is observed
that the BET and Langmuir surface areas of the prepared fer-
rous oxalate were found to be 27.550 and 24.945 m2 g-1. From
the BJH graph, the pore volume and average pore diameter
were found to be 0.0857 mL g and 7 nm, respectively. From
Fig. 7b, the BET and Langmuir surface areas of c-Fe2O3 were
found to be 129.74 and 107.35 m2 g-1, and from the BJH
graph, the pore volume and average pore diameter were found
to be 0.1744 mL g-1 and 6 nm, respectively. Similarly, from
Fig. 7c, the BET and Langmuir surface areas of a-Fe2O3 were
found to be 22.785 and 20.575 m2 g-1, and from the BJH
graph, the pore volume and average pore diameter were found
to be 0.03445 mL g-1 and 9 nm, respectively. From the above
discussion, it is observed that the surface area of c-Fe2O3 is
highest among the prepared nanorods.
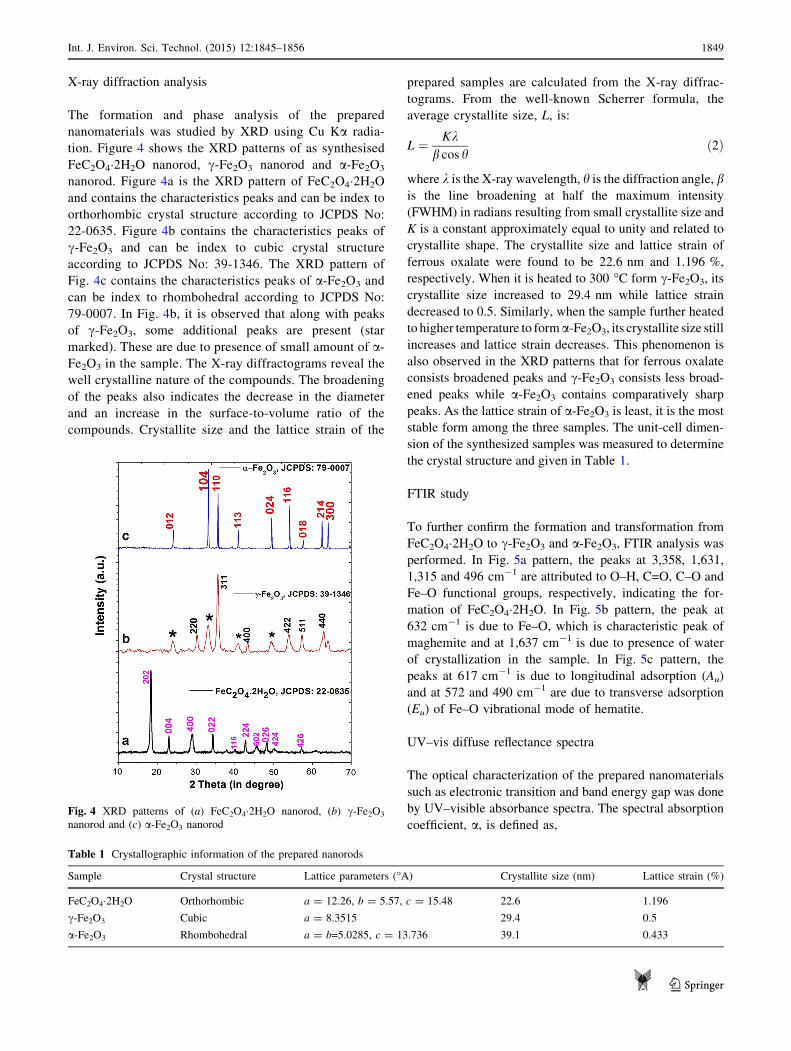
Effect of operational factors on adsorption
Effect of adsorbent dose
Adsorbent dosage is one of the most important parameter
that has been considered to determine the optimum condition
for the performance of adsorption. Essentially, insufficient
dosage or overdosing would result in the poor performance in
adsorption. Therefore, it is significant to determine the
optimum dosage in order to minimize the dosing cost and
sludge formation and also to obtain the optimum
performance in treatment. The effect of adsorbent doses on
the removal of CR using FeC2O4�2H2O, a-Fe2O3 and c-
Fe2O3 nanorods maintaining pH 7.6 (pH at normal condition)
for 20 mL of 100 mg L-1 CR solution and 30 min contact
time is represented in Fig. 8a. It is observed there is a con-
tinuous removal of CR with increase in adsorbent dose up to
0.05 g. This may be due to an increase in number of active
sites of the adsorbent material with increasing amount of the
adsorbent. Further increase in the amount of the adsorbent
does not bring any considerable change in the adsorption,
i.e., approximately straight line after 0.05 g thus 0.05 g was
chosen as the optimum amount for all studies of the adsor-
bents. The highest percentage of removal obtained for c-
Fe2O3 nanorod among the three adsorbents.
Effect of contact time
The time of contact of adsorption is another parameter for
adsorption. It is helpful in understanding the amount of dye
adsorbed at various time intervals by a fixed amount of the
adsorbent. In this section, 0.05 g of each adsorbents used in
20 mL 100 mg L-1 of CR solution maintaining pH 7.6, with
varying time from 0 to 60 min. From Fig. 8b, it is found that
there is a consistent increase in percentage of removal up to
30 min and the adsorption equilibrium is attained after 30 min
of contact time. This is due to the rate of adsorption decreased,
and a saturation stage was attained due to the accumulation of
the adsorption sites by the dye ions. The highest removal of
Fig. 7 BET isotherm and BJH
isotherm (inset) of a ferrous
oxalate, b c-Fe2O3 and c a-
Fe2O3 nanorods
Int. J. Environ. Sci. Technol. (2015) 12:1845–1856 1851
123
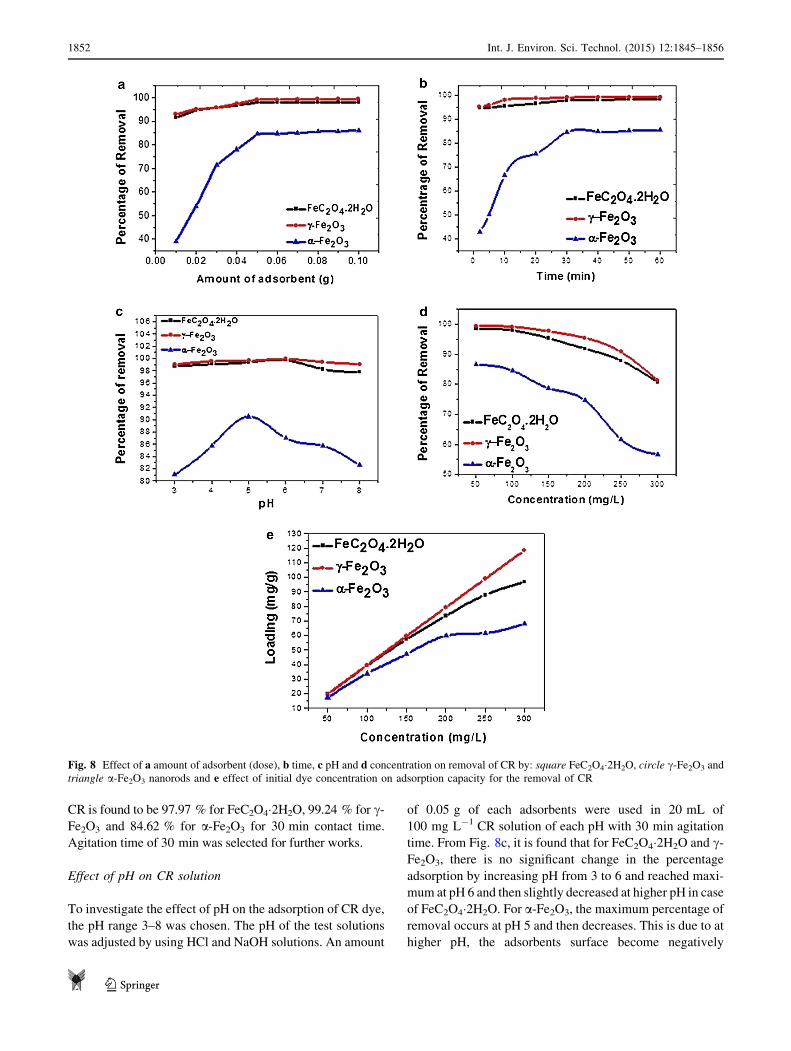
CR is found to be 97.97 % for FeC2O4�2H2O, 99.24 % for c-
Fe2O3 and 84.62 % for a-Fe2O3 for 30 min contact time.
Agitation time of 30 min was selected for further works.
Effect of pH on CR solution
To investigate the effect of pH on the adsorption of CR dye,
the pH range 3–8 was chosen. The pH of the test solutions
was adjusted by using HCl and NaOH solutions. An amount
of 0.05 g of each adsorbents were used in 20 mL of
100 mg L-1 CR solution of each pH with 30 min agitation
time. From Fig. 8c, it is found that for FeC2O4�2H2O and c-
Fe2O3, there is no significant change in the percentage
adsorption by increasing pH from 3 to 6 and reached maxi-
mum at pH 6 and then slightly decreased at higher pH in case
of FeC2O4�2H2O. For a-Fe2O3, the maximum percentage of
removal occurs at pH 5 and then decreases. This is due to at
higher pH, the adsorbents surface become negatively
Fig. 8 Effect of a amount of adsorbent (dose), b time, c pH and d concentration on removal of CR by: square FeC2O4�2H2O, circle c-Fe2O3 and
triangle a-Fe2O3 nanorods and e effect of initial dye concentration on adsorption capacity for the removal of CR
1852 Int. J. Environ. Sci. Technol. (2015) 12:1845–1856
123

charged. Therefore the adsorbents did not favour the
adsorption of negatively charged CR dye due to electrostatic
repulsion (Afkhami and Moosavi 2010).
Effect of initial dye concentration on adsorption
The adsorption is greatly influenced by the concentration of
the solution, as the adsorptive reactions are directly pro-
portional to the concentration of the solute (Mittal et al.
2009). It this section, 0.05 g of each adsorbent used each
20 mL of CR solution (natural pH) with concentration
ranging from 50 to 300 mg L-1 and the agitation time was
kept 30 min. It is found that with the increase in initial dye
concentration, percentage adsorption decreases (Fig. 8d)
while the equilibrium adsorption capacity of the adsorbent
for CR increases with increasing initial dye concentration,
i.e., the more concentrated the dye solution, the higher the
adsorption capacity (Fig. 8e). This is probably due to a high
driving force for mass transfer in high dye concentration.
Adsorption isotherm
To determine equilibrium relationship of amount adsorbed by
a unit weight of adsorbent (qe) with the concentration of
adsorbent remaining in the medium at equilibrium (Ce), studies
of various adsorption isotherm models are required. There is
various type of adsorption models developed such as Freund-
lich, Langmuir, Tempkin and D–R isothermal models. (Mittal
et al. 2009). The most common models such as Freundlich and
Langmuir equations are used to investigation of this study.
Langmuir isotherm
The Langmuir isotherm model assumes monolayer cover-
age of adsorbate on a homogeneous adsorbent surface. This
model does not consider surface heterogeneity of the sor-
bent. It assumes adsorption will take place only at specific
site on the adsorbent (Chatterjee et al. 2009). The Lang-
muir equation is given as:
qeaL
KL
¼ KLCe
ð1þ KLCeÞð5Þ
The linear form of the Langmuir isotherm is:
Ce
qe
¼ 1
KLqmax
þ Ce=qmax ð6Þ
where aL (L mg-1) and KL (L g-1) are the Langmuir
constants, qmax(=KL/aL) is the maximum adsorption
capacity corresponding to complete monolayer coverage
(mg g-1), which depends upon the number of adsorption
sites (Rahimi et al. 2011). The values of qmax and KL are
calculated from the slopes and intercepts of the straight
lines of plot of Ce/qe versus Ce.
Freundlich isotherm
The Freundlich isotherm model is an empirical equation
that describes the surface heterogeneity of the sorbent. It
considers multilayer adsorption with a heterogeneous
energetic distribution of active sites, accompanied by
interactions between adsorbed molecules (Namasivayam
and Kavitha 2002). The Freundlich isotherm equation is
given as:
qe ¼ KFC1=ne ð7Þ
The linear form of the Freundlich isotherm is:
ln qe ¼ ln KF þ 1=n ln Ce ð8Þ
where Ce is the equilibrium concentration (mg L-1), qe is
the amount adsorbed at equilibrium (mg g-1) and KF and
n are Freundlich constants, related to the extent of the
adsorption and the degree of nonlinearity between solu-
tion concentration and adsorption, respectively. KF and (1/
n) can be determined from the linear plot of ln qe versus
ln Ce.
The essential characteristics of Langmuir isotherm
can be expressed by a dimensionless constant called
equilibrium parameter (RL) that is defined by the fol-
lowing equation (Chatterjee et al. 2009; Afkhami et al.
2009):
RL ¼1
1þ aLC0
ð9Þ
where aL and C0 are the parameters as defined previously.
The value of RL calculated from the above expression. The
nature of the adsorption process to be either unfavorable
(RL [ 1), linear (RL = 1), favorable (0 \ RL \ 1) or irre-
versible (RL = 0) (Lian et al. 2009). Here, RL values
obtained are listed in Table 2. The linear Langmuir and
Freundlich plots for the adsorption of CR onto the three
Table 2 Adsorption isotherm constants for adsorption of CR
Adsorbent aL
(L mg-1)
KL
(L g-1)
qmax
(mg g-1)
rL2 RL
Langmuir
FeC2O4�2H2O 0.0022 0.224 103.09 0.996 0.82
c-Fe2O3 0.0012 0.267 232.56 0.998 0.89
a-Fe2O3 0.00064 0.048 78.13 0.995 0.999
Adsorbent KF 1/n rF2
Freundlich
FeC2O4�2H2O 26.5 0.3493 0.957
c-Fe2O3 46.42 0.7434 0.993
a-Fe2O3 8.99 0.442 0.914
Int. J. Environ. Sci. Technol. (2015) 12:1845–1856 1853
123

nanorod adsorbents are obtained by plotting Ce/qe versus
Ce and ln qe versus ln Ce, respectively (given in Fig. 9).
The isotherm constants and correlation coefficients were
calculated and listed in Table 2. By comparing the corre-
lation coefficients rL2, it can be deduced that the experi-
mental equilibrium adsorption data are well described by
both the Langmuir and Freundlich models, but the Lang-
muir model is more suitable. The maximum adsorption
capacity of 103.09, 232.56 and 78.13 mg g-1 was found
for FeC2O4�2H2O, c-Fe2O3 and a-Fe2O3, respectively. For
Freundlich isotherm model, the n value between 1 and 10
indicates beneficial adsorption (Chen and Zhao 2009).
Comparing the qmax values of the different adsorbents, it is
observed that c-Fe2O3 nanorod has higher adsorption
capacity than FeC2O4�2H2O and a-Fe2O3 nanorods.
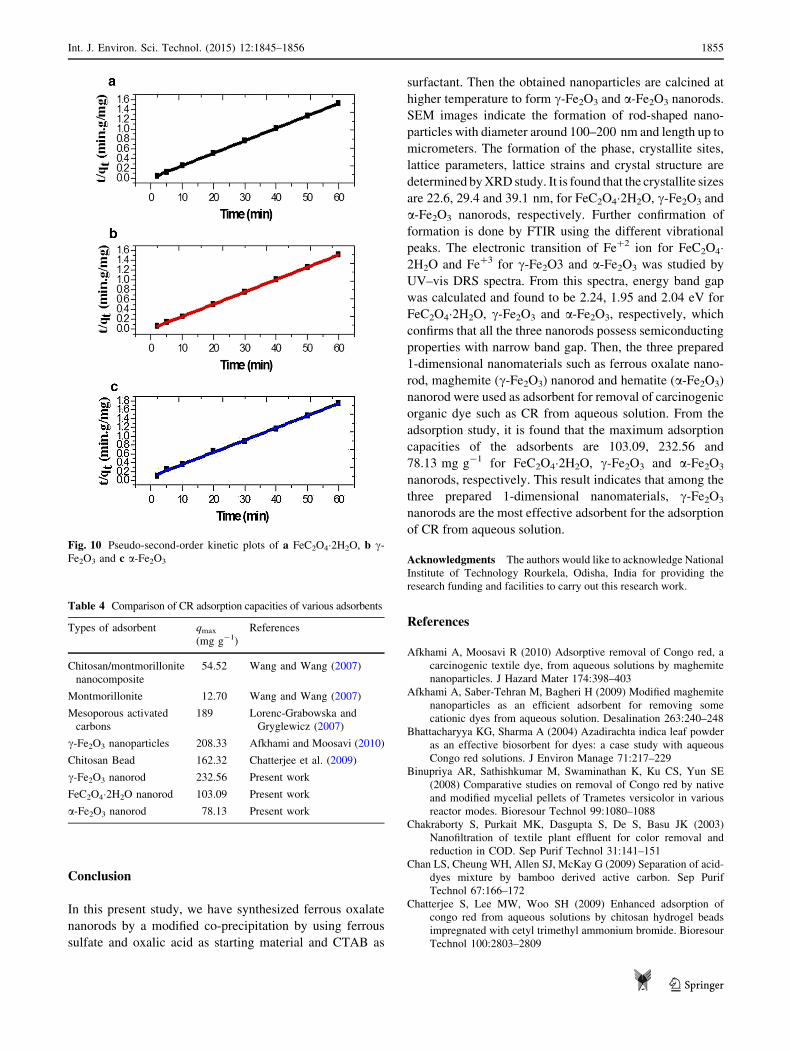
Adsorption kinetics
In order to investigate the adsorption processes of CR on
the adsorbents, pseudo-second-order kinetic is used. The
pseudo-second-order model is represented as (Ho and
McKay 1999):
t
q¼ 1
k2q2e
þ t
qe
ð10Þ
And the initial adsorption rate, h (mg g-1 min-1), as
t ? 0 can be defined as:
h ¼ k2q2e ð11Þ
The initial adsorption rate (h), the equilibrium
adsorption capacity (qe) and the second-order constants k2
(g-1 mg min) can be determined experimentally from the
slope and intercept of plot of t/q versus t. The best-fit values
of h, qe and k2 along with correlation coefficients of the
pseudo-second-order model for the three adsorbents are
shown in Table 3, and the pseudo-second-order plots of
FeC2O4�2H2O, c-Fe2O3 and a-Fe2O3 are given in Fig. 10.
The values of predicted equilibrium adsorption capacities
(qe) showed good agreement with the experimental
equilibrium uptake values. Similarly, correlation coefficients
are always greater than 0.99, which also explains the good fit
of the model.
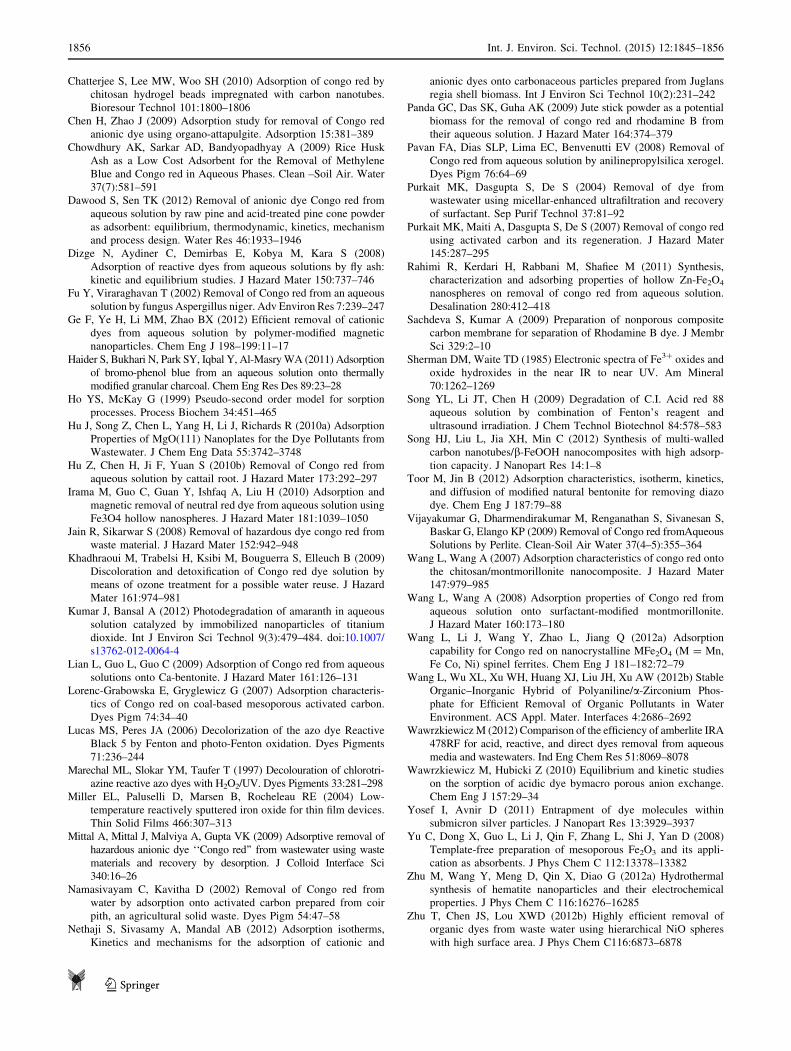
The maximum adsorption capacity (qmax) for the
adsorption of CR on c-Fe2O3 nanorod compared to other
adsorbents is listed in Table 4. It is observed that the pre-
pared c-Fe2O3 nanorod is an efficient adsorbent for
adsorption of CR from aqueous solution.
Fig. 9 Linearization of
Langmuir plots of
a FeC2O4�2H2O, b c-Fe2O3 and
c a-Fe2O3 and Freundlich plots
of d FeC2O4�2H2O, e c-Fe2O3
and f a-Fe2O3 for the adsorption
of CR
Table 3 Second-order kinetic parameters for the removal of CR
Adsorbents K2 (g mg-1
min-1)
qe
(mg g-1)
qe (mg g-1)
(experimental)
r2
FeC2O4�2H2O 0.0999 39.53 39.19 1
c-Fe2O3 0.0933 40 39.7 1
a-Fe2O3 0.00891 36.23 34.23 0.9986
1854 Int. J. Environ. Sci. Technol. (2015) 12:1845–1856
123
Conclusion
In this present study, we have synthesized ferrous oxalate
nanorods by a modified co-precipitation by using ferrous
sulfate and oxalic acid as starting material and CTAB as
surfactant. Then the obtained nanoparticles are calcined at
higher temperature to form c-Fe2O3 and a-Fe2O3 nanorods.
SEM images indicate the formation of rod-shaped nano-
particles with diameter around 100–200 nm and length up to
micrometers. The formation of the phase, crystallite sites,
lattice parameters, lattice strains and crystal structure are
determined by XRD study. It is found that the crystallite sizes
are 22.6, 29.4 and 39.1 nm, for FeC2O4�2H2O, c-Fe2O3 and
a-Fe2O3 nanorods, respectively. Further confirmation of
formation is done by FTIR using the different vibrational
peaks. The electronic transition of Fe?2 ion for FeC2O4�2H2O and Fe?3 for c-Fe2O3 and a-Fe2O3 was studied by
UV–vis DRS spectra. From this spectra, energy band gap
was calculated and found to be 2.24, 1.95 and 2.04 eV for
FeC2O4�2H2O, c-Fe2O3 and a-Fe2O3, respectively, which
confirms that all the three nanorods possess semiconducting
properties with narrow band gap. Then, the three prepared
1-dimensional nanomaterials such as ferrous oxalate nano-
rod, maghemite (c-Fe2O3) nanorod and hematite (a-Fe2O3)
nanorod were used as adsorbent for removal of carcinogenic
organic dye such as CR from aqueous solution. From the
adsorption study, it is found that the maximum adsorption
capacities of the adsorbents are 103.09, 232.56 and
78.13 mg g-1 for FeC2O4�2H2O, c-Fe2O3 and a-Fe2O3
nanorods, respectively. This result indicates that among the
three prepared 1-dimensional nanomaterials, c-Fe2O3
nanorods are the most effective adsorbent for the adsorption
of CR from aqueous solution.
Acknowledgments The authors would like to acknowledge National
Institute of Technology Rourkela, Odisha, India for providing the
research funding and facilities to carry out this research work.
References
Afkhami A, Moosavi R (2010) Adsorptive removal of Congo red, a
carcinogenic textile dye, from aqueous solutions by maghemite
nanoparticles. J Hazard Mater 174:398–403
Afkhami A, Saber-Tehran M, Bagheri H (2009) Modified maghemite
nanoparticles as an efficient adsorbent for removing some
cationic dyes from aqueous solution. Desalination 263:240–248
Bhattacharyya KG, Sharma A (2004) Azadirachta indica leaf powder
as an effective biosorbent for dyes: a case study with aqueous
Congo red solutions. J Environ Manage 71:217–229
Binupriya AR, Sathishkumar M, Swaminathan K, Ku CS, Yun SE
(2008) Comparative studies on removal of Congo red by native
and modified mycelial pellets of Trametes versicolor in various
reactor modes. Bioresour Technol 99:1080–1088
Chakraborty S, Purkait MK, Dasgupta S, De S, Basu JK (2003)
Nanofiltration of textile plant effluent for color removal and
reduction in COD. Sep Purif Technol 31:141–151
Chan LS, Cheung WH, Allen SJ, McKay G (2009) Separation of acid-
dyes mixture by bamboo derived active carbon. Sep Purif
Technol 67:166–172
Chatterjee S, Lee MW, Woo SH (2009) Enhanced adsorption of
congo red from aqueous solutions by chitosan hydrogel beads
impregnated with cetyl trimethyl ammonium bromide. Bioresour
Technol 100:2803–2809
Table 4 Comparison of CR adsorption capacities of various adsorbents
Types of adsorbent qmax
(mg g-1)
References
Chitosan/montmorillonite
nanocomposite
54.52 Wang and Wang (2007)
Montmorillonite 12.70 Wang and Wang (2007)
Mesoporous activated
carbons
189 Lorenc-Grabowska and
Gryglewicz (2007)
c-Fe2O3 nanoparticles 208.33 Afkhami and Moosavi (2010)
Chitosan Bead 162.32 Chatterjee et al. (2009)
c-Fe2O3 nanorod 232.56 Present work
FeC2O4�2H2O nanorod 103.09 Present work
a-Fe2O3 nanorod 78.13 Present work
Fig. 10 Pseudo-second-order kinetic plots of a FeC2O4�2H2O, b c-
Fe2O3 and c a-Fe2O3
Int. J. Environ. Sci. Technol. (2015) 12:1845–1856 1855
123
Chatterjee S, Lee MW, Woo SH (2010) Adsorption of congo red by
chitosan hydrogel beads impregnated with carbon nanotubes.
Bioresour Technol 101:1800–1806
Chen H, Zhao J (2009) Adsorption study for removal of Congo red
anionic dye using organo-attapulgite. Adsorption 15:381–389
Chowdhury AK, Sarkar AD, Bandyopadhyay A (2009) Rice Husk
Ash as a Low Cost Adsorbent for the Removal of Methylene
Blue and Congo red in Aqueous Phases. Clean –Soil Air. Water
37(7):581–591
Dawood S, Sen TK (2012) Removal of anionic dye Congo red from
aqueous solution by raw pine and acid-treated pine cone powder
as adsorbent: equilibrium, thermodynamic, kinetics, mechanism
and process design. Water Res 46:1933–1946
Dizge N, Aydiner C, Demirbas E, Kobya M, Kara S (2008)
Adsorption of reactive dyes from aqueous solutions by fly ash:
kinetic and equilibrium studies. J Hazard Mater 150:737–746
Fu Y, Viraraghavan T (2002) Removal of Congo red from an aqueous
solution by fungus Aspergillus niger. Adv Environ Res 7:239–247
Ge F, Ye H, Li MM, Zhao BX (2012) Efficient removal of cationic
dyes from aqueous solution by polymer-modified magnetic
nanoparticles. Chem Eng J 198–199:11–17
Haider S, Bukhari N, Park SY, Iqbal Y, Al-Masry WA (2011) Adsorption
of bromo-phenol blue from an aqueous solution onto thermally
modified granular charcoal. Chem Eng Res Des 89:23–28
Ho YS, McKay G (1999) Pseudo-second order model for sorption
processes. Process Biochem 34:451–465
Hu J, Song Z, Chen L, Yang H, Li J, Richards R (2010a) Adsorption
Properties of MgO(111) Nanoplates for the Dye Pollutants from
Wastewater. J Chem Eng Data 55:3742–3748
Hu Z, Chen H, Ji F, Yuan S (2010b) Removal of Congo red from
aqueous solution by cattail root. J Hazard Mater 173:292–297
Irama M, Guo C, Guan Y, Ishfaq A, Liu H (2010) Adsorption and
magnetic removal of neutral red dye from aqueous solution using
Fe3O4 hollow nanospheres. J Hazard Mater 181:1039–1050
Jain R, Sikarwar S (2008) Removal of hazardous dye congo red from
waste material. J Hazard Mater 152:942–948
Khadhraoui M, Trabelsi H, Ksibi M, Bouguerra S, Elleuch B (2009)
Discoloration and detoxification of Congo red dye solution by
means of ozone treatment for a possible water reuse. J Hazard
Mater 161:974–981
Kumar J, Bansal A (2012) Photodegradation of amaranth in aqueous
solution catalyzed by immobilized nanoparticles of titanium
dioxide. Int J Environ Sci Technol 9(3):479–484. doi:10.1007/
s13762-012-0064-4
Lian L, Guo L, Guo C (2009) Adsorption of Congo red from aqueous
solutions onto Ca-bentonite. J Hazard Mater 161:126–131
Lorenc-Grabowska E, Gryglewicz G (2007) Adsorption characteris-
tics of Congo red on coal-based mesoporous activated carbon.
Dyes Pigm 74:34–40
Lucas MS, Peres JA (2006) Decolorization of the azo dye Reactive
Black 5 by Fenton and photo-Fenton oxidation. Dyes Pigments
71:236–244
Marechal ML, Slokar YM, Taufer T (1997) Decolouration of chlorotri-
azine reactive azo dyes with H2O2/UV. Dyes Pigments 33:281–298
Miller EL, Paluselli D, Marsen B, Rocheleau RE (2004) Low-
temperature reactively sputtered iron oxide for thin film devices.
Thin Solid Films 466:307–313
Mittal A, Mittal J, Malviya A, Gupta VK (2009) Adsorptive removal of
hazardous anionic dye ‘‘Congo red’’ from wastewater using waste
materials and recovery by desorption. J Colloid Interface Sci
340:16–26
Namasivayam C, Kavitha D (2002) Removal of Congo red from
water by adsorption onto activated carbon prepared from coir
pith, an agricultural solid waste. Dyes Pigm 54:47–58
Nethaji S, Sivasamy A, Mandal AB (2012) Adsorption isotherms,
Kinetics and mechanisms for the adsorption of cationic and
anionic dyes onto carbonaceous particles prepared from Juglans
regia shell biomass. Int J Environ Sci Technol 10(2):231–242
Panda GC, Das SK, Guha AK (2009) Jute stick powder as a potential
biomass for the removal of congo red and rhodamine B from
their aqueous solution. J Hazard Mater 164:374–379
Pavan FA, Dias SLP, Lima EC, Benvenutti EV (2008) Removal of
Congo red from aqueous solution by anilinepropylsilica xerogel.
Dyes Pigm 76:64–69
Purkait MK, Dasgupta S, De S (2004) Removal of dye from
wastewater using micellar-enhanced ultrafiltration and recovery
of surfactant. Sep Purif Technol 37:81–92
Purkait MK, Maiti A, Dasgupta S, De S (2007) Removal of congo red
using activated carbon and its regeneration. J Hazard Mater
145:287–295
Rahimi R, Kerdari H, Rabbani M, Shafiee M (2011) Synthesis,
characterization and adsorbing properties of hollow Zn-Fe2O4
nanospheres on removal of congo red from aqueous solution.
Desalination 280:412–418
Sachdeva S, Kumar A (2009) Preparation of nonporous composite
carbon membrane for separation of Rhodamine B dye. J Membr
Sci 329:2–10
Sherman DM, Waite TD (1985) Electronic spectra of Fe3? oxides and
oxide hydroxides in the near IR to near UV. Am Mineral
70:1262–1269
Song YL, Li JT, Chen H (2009) Degradation of C.I. Acid red 88
aqueous solution by combination of Fenton’s reagent and
ultrasound irradiation. J Chem Technol Biotechnol 84:578–583
Song HJ, Liu L, Jia XH, Min C (2012) Synthesis of multi-walled
carbon nanotubes/b-FeOOH nanocomposites with high adsorp-
tion capacity. J Nanopart Res 14:1–8
Toor M, Jin B (2012) Adsorption characteristics, isotherm, kinetics,
and diffusion of modified natural bentonite for removing diazo
dye. Chem Eng J 187:79–88
Vijayakumar G, Dharmendirakumar M, Renganathan S, Sivanesan S,
Baskar G, Elango KP (2009) Removal of Congo red fromAqueous
Solutions by Perlite. Clean-Soil Air Water 37(4–5):355–364
Wang L, Wang A (2007) Adsorption characteristics of congo red onto
the chitosan/montmorillonite nanocomposite. J Hazard Mater
147:979–985
Wang L, Wang A (2008) Adsorption properties of Congo red from
aqueous solution onto surfactant-modified montmorillonite.
J Hazard Mater 160:173–180
Wang L, Li J, Wang Y, Zhao L, Jiang Q (2012a) Adsorption
capability for Congo red on nanocrystalline MFe2O4 (M = Mn,
Fe Co, Ni) spinel ferrites. Chem Eng J 181–182:72–79
Wang L, Wu XL, Xu WH, Huang XJ, Liu JH, Xu AW (2012b) Stable
Organic–Inorganic Hybrid of Polyaniline/a-Zirconium Phos-
phate for Efficient Removal of Organic Pollutants in Water
Environment. ACS Appl. Mater. Interfaces 4:2686–2692
Wawrzkiewicz M (2012) Comparison of the efficiency of amberlite IRA
478RF for acid, reactive, and direct dyes removal from aqueous
media and wastewaters. Ind Eng Chem Res 51:8069–8078
Wawrzkiewicz M, Hubicki Z (2010) Equilibrium and kinetic studies
on the sorption of acidic dye bymacro porous anion exchange.
Chem Eng J 157:29–34
Yosef I, Avnir D (2011) Entrapment of dye molecules within
submicron silver particles. J Nanopart Res 13:3929–3937
Yu C, Dong X, Guo L, Li J, Qin F, Zhang L, Shi J, Yan D (2008)
Template-free preparation of mesoporous Fe2O3 and its appli-
cation as absorbents. J Phys Chem C 112:13378–13382
Zhu M, Wang Y, Meng D, Qin X, Diao G (2012a) Hydrothermal
synthesis of hematite nanoparticles and their electrochemical
properties. J Phys Chem C 116:16276–16285
Zhu T, Chen JS, Lou XWD (2012b) Highly efficient removal of
organic dyes from waste water using hierarchical NiO spheres
with high surface area. J Phys Chem C116:6873–6878
1856 Int. J. Environ. Sci. Technol. (2015) 12:1845–1856
123