Fermentative Production Of 1,3-Propanediol From Industrial ...
253
University of Connecticut OpenCommons@UConn Doctoral Dissertations University of Connecticut Graduate School 2-15-2015 Fermentative Production Of 1,3-Propanediol From Industrial Glycerol And Its Pervaporative Enrichment From Aqueous Mixture Baishali Kanjilal University of Connecticut - Storrs, [email protected] Follow this and additional works at: hps://opencommons.uconn.edu/dissertations Recommended Citation Kanjilal, Baishali, "Fermentative Production Of 1,3-Propanediol From Industrial Glycerol And Its Pervaporative Enrichment From Aqueous Mixture" (2015). Doctoral Dissertations. 672. hps://opencommons.uconn.edu/dissertations/672
-
Upload
khangminh22 -
Category
Documents
-
view
1 -
download
0
Transcript of Fermentative Production Of 1,3-Propanediol From Industrial ...

University of ConnecticutOpenCommons@UConn
Doctoral Dissertations University of Connecticut Graduate School
2-15-2015
Fermentative Production Of 1,3-Propanediol FromIndustrial Glycerol And Its PervaporativeEnrichment From Aqueous MixtureBaishali KanjilalUniversity of Connecticut - Storrs, [email protected]
Follow this and additional works at: https://opencommons.uconn.edu/dissertations
Recommended CitationKanjilal, Baishali, "Fermentative Production Of 1,3-Propanediol From Industrial Glycerol And Its Pervaporative Enrichment FromAqueous Mixture" (2015). Doctoral Dissertations. 672.https://opencommons.uconn.edu/dissertations/672

i
Fermentative Production Of 1,3-Propanediol From Industrial Glycerol And Its
Pervaporative Enrichment From Aqueous Mixtures
Baishali Kanjilal, PhD
University of Connecticut, [2015]
Abstract
A paradigm shift towards renewable feedstocks has given rise to a fast growing global market for
biorenewable chemicals, of which, glycerin is a major platform chemical. Industrial glycerol
production as a byproduct of the biodiesel and other industries has led to an over capacity with
issues related to its disposal. Fermentation of this crude glycerol to 1,3-propanediol as a value
added product may provide a recourse to capitalizing on the current over capacity. This thesis
explores the fermentative production of 1,3-propanediol from industrial glycerol using a soil based
bacterial inoculum and the development of several families of polymers as pervaporation
membranes for enriching 1,3-propanediol from dilute aqueous broths.
The first part of the thesis studies and optimizes the yield of 1,3-propanediol from industrial
glycerol using an organic soil based inoculum with various process parameters. The optimized
parameters are used to run CSTR experiments wherein the specific 1,3-propanediol productivity
is shown to increase with dilution rate.
In addition to substrate, the real process bottleneck in fermentative 1,3-propanediol production lies
in high energy costs of concentration enrichment. While pervaporation is energetically
advantageous, the proximity of the solubility parameters of 1,3-propanediol with those of water
preclude the usage of conventional membrane materials for enrichment from dilute aqueous broths.
The second part of the thesis concerns development of three polymer families– cyclohexylamine
functionalized siloxanes, cyclohexylamine based methacrylates and imidazolium
dibutylphosphate ionic liquid based methacrylates - with progressively increasing separation
factors and good price–performance trade off. The final part of the thesis explores their
performance with batch and continuous pervaporation to enrich 1,3-propanediol from simulated
broths of compositions replicated from the CSTR fermentations. The imidazolium ionic liquid
based methacrylates not only enrich 1,3-propanediol from water with highest efficiency, but also
from other broth components while striking the best possible cost – performance balance. The
development and fine tuning of such materials present themselves as steps towards possible
membrane module fabrication for continuous pervaporation and hence establishment of
commercially viable and energy efficient alternatives to conventional purification processes.
Baishali Kanjilal-University of Connecticut, [2015]

ii
Fermentative Production Of 1,3-Propanediol From Industrial Glycerol And
Its Pervaporative Enrichment From Aqueous Mixtures
Baishali Kanjilal
B.Sc., University of Calcutta, [1998]
B.Tech., University of Cacutta, [2001]
A Dissertation
Submitted in Partial Fulfillment of the
Requirements for the Degree of
Doctor of Philosophy
at the
University of Connecticut
[2015]

iii
Copyright by
Baishali Kanjilal
[2015]
iv
APPROVAL PAGE
Doctor of Philosophy Dissertation
Fermentative Production Of 1,3-Propanediol From Industrial Glycerol And Its
Pervaporative Enrichment From Aqueous Mixtures
Presented by:
Baishali Kanjilal, B.Sc., B.Tech.
Major Advisor __________________________
Richard Parnas
Associate Advisor __________________________
Alexandru Asandei
Associate Advisor __________________________
Ranjan Srivastava
Associate Advisor __________________________
Jeffrey McCutcheon
Associate Advisor __________________________
Douglas Adamson
University of Connecticut
[2015]

v
Acknowledgements
I thank my advisory committee – Major Advisor, Prof. Richard Parnas, Associate Advisors Prof.
Alex Asandei, Prof. Ranjan Srivastava, Prof. Jeff McCutcheon and Prof. Douglas Adamson for
their valuable advice and support throughout the course of graduate studies. Special thanks are due
to my associate advisors for their generosity in providing lab space and facilities for a large part
of my experimental work.
I am very to grateful Prof. James Stuart, Emeritus Professor, Dept. of Chemistry for his support
throughout my PhD in chromatography and to Prof. Monty Shaw, Emeritus Professor, Polymer
Program, IMS, for great insights into the thermodynamic aspects of my computations. An
enormous value and understanding has been added to me by virtue of discussions and experimental
sessions with these stalwarts.
I am grateful to Prof. Steven Suib for moral and fiscal support. Mrs. Young Hee Chudy deserves
special mention for her moral support and I shall always remember her with utmost love and
respect. I am also thankful to Dr. Laura Pinatti, Dr. Marcus Giotto, Dr. Mark Dudley, Dr. Roger
Ristau, Dr. Lichun Zhang and Dr. Jeff Roth for their support and mentorship.
I developed a wonderful working camaraderie with my colleagues, especially Dr. Iman Noshadi
and Dr. Eddy Bautista to whom I owe gratitude for their help and scientific insights. I am thankful
to Cheng, Dipendra, Dr. Sudsiri Hemsri and Dr. Si Yu Li for their support. I am very grateful to
Prof. Asandei’s group - Joon Sung, Olu, Chris and Vignesh – and to Tahereh of Prof. Suib’s group
for their support of my research activities. I have made wonderful friends especially Hyun-sook,
Zhenhua, Aindrila, Debanjan, Bhargab, Anamica, amongst others. My roommates, Swarnali,
Koyel and later, Reza made my life cheerful with their wonderful company, friendship and
unadulterated fun.
Special thanks are due to Prof. Nitis & Mrs. Mahua Mukhopadhyay, Prof. Ashish and Mrs. Ruma
Basu, Prof. Chandra and Mrs. Minati Roychoudhury, Dr. Sanjay & Mrs.Krishna Banerjee, Drs.
Saumitra and Seema Banerjee and Prof. Nitya and Mrs. Soma Chakraborty for providing an
extended family away from home. I am very grateful to Prof. Mukhopadhyay and Mahua Mashi
for being like parents in a foreign country, their love and encouragement in cultural activities.
I am truly indebted to my father’s friends Dr. Apurba & Mrs. Krishna Roy and to Dr. Sumanta
Sanyal and his family for their moral support and love. I owe my gratitude to Prof. Haimanti
Chakraborty and Prof. Priyabrata Sarkar and their students at University of Calcutta, Prof. Ajit
Banthia of IIT Kharagpur, Dr. Swapan Dhara, Advanced Petrochemicals and Raj Datta, Haldia
Petrochemicals for their mentorship. I am grateful to my alma mater, University of Calcutta for
their travel endowment scholarship, which funded my travel to USA to join the PhD program. I
am grateful to my uncle Mr. Subhamay Kanjilal for his advice, support and love.
I owe all that I have achieved to my parents and their enormous respect for the quest of knowledge.
My parents Dr. Chinmay and Mrs. Subhadra Kanjilal and my brother Jishnu are my greatest
inspiration and role models. I am very proud of them and to merely be grateful for their love and
faith in me, under all circumstances, would be inadequate. I dedicate my thesis to my family.

vi
TABLE OF CONTENTS
Table of contents
Chapter 1. Introduction And Thesis Organization 1
References 6
Chapter 2. Batch, Design Optimization and DNA Sequencing Study for
Continuous 1,3-propanediol Production from Waste Glycerol by a Soil Based
Inoculum
12
Abstract 12
Introduction
Material and Methods
14
16
Stock Culture Preparation 16
Section Description Page No.
Approval Page iv
Acknowledgements v
Table of Contents vii
List of Tables xv
List of Figures xvi

vii
Feed Media Composition: Batch, DOE and CSTR 17
Batches without pH control 18
Batches with pH control 18
16S rDNA sequencing for identification and characterization of consortia 18
Design of Experiment Batches 19
CSTR Fermentations 19
Analytical Methods 20
Results 21
Analysis and treatment of Industrial Glycerol 21
Batch Fermentations 21
Effect of feed nutrient composition of 1,3-PD selectivity 22
Comparison of pure and industrial glycerol with and without pH control 23
Effect of pH control on product yield 23
16S r-DNA sequencing 23
Design of Experiments and Analysis of Variance 24
Continuous Production of 1,3-propanediol 26
Discussion 28

viii
Batch Fermentations 28
16S rDNA sequencing 29
Statistical DOE- Influence of experimental parameters on the final 1,3-PD
concentration
30
CSTR 31
Acknowledgements 33
References 33
Chapter 3. Introduction: Development of Materials for Pervaporation
enrichment of 1,3-propanediol from dilute aqueous mixtures
54
References 59
Chapter 4. Allylcycohexylamine functionalized siloxane polymer and its phase
separated blend as pervaporation membranes for 1,3-propanediol enrichment
from binary aqueous mixtures
67
Abstract 67
Introduction 69
Experimental 72
Materials 72
PHMS Functionalization by Hydrosilylation 72
Styrene Butyl Acrylate Emulsion Polymerization 73
Membrane Fabrication and Pervaporation Feed 73
ix
Analytical Methods 73
Partition Coefficient Measurements 74
Synthesis, purification and characterization of ACA functionalized PHMS 75
Synthesis, purification and characterization of Styrene-Butylacrylate copolymer 75
Membrane fabrication and characterization 76
Scheme 1 76
Scheme 2 77
Pervaporation Experiments 77
Results and discussions 78
Partition Coefficient in Amine 78
Functionalization of PHMS by hydrosilylation – Monitoring of reaction and
Polymer characterization
78
Styrene Butyl acrylate copolymer characterization 80
Membrane characterization 80
Pervaporation results on 1,3-propanediol – water binary feed mixtures 83
The effect of amine loading in membrane 83
Effect of process parameters: Feed Temperature, Feed Composition, Cross
Flow Velocity
83
Mass transport analysis 84
Overall Mass Transfer Coefficient and Permeability 84
Boundary Layer Mass Transfer Coefficient 86
Concentration Polarization Modulus 87

x
Computation of the material mass transport property of the membrane
material
89
Solubility Parameters 91
Comparative Performance Analysis 94
Conclusions 97
Acknowledgements 97
References 97
Chapter 5. Poly(3-((3-(cyclohexylamino)propyl)thio)propyl methacrylate Based
Membranes for Improved Pervaporative 1,3-Propanediol Enrichment From
Aqueous Mixtures
113
Abstract 113
Introduction 115
Experimental 117
Materials 117
Analytical Methods 118
Partition Coefficient Measurement 119
Synthesis, purification and characterization of 3-((3-(cyclohexylamino)
propyl)thio)propyl methacrylate (CHAPTPMA) monomer
119
Synthesis, purification and characterization of polymers 120
Membrane Fabrication 121
Pervaporation Experiments 122
Results and Discussion 123

xi
Partition Coefficient in Amine 123
Synthesis, purification and characterization of monomer 123
Characterization of polymers 124
Pervaporation results on 1,3-propanediol – water binary feed mixtures 127
Effect of Copolymer Composition 127
Effect of Temperature 128
Effect of Feed 1,3-propanediol concentration 128
Analysis of Hansen Solubility Parameters 129
Comparative Analysis of Performance 131
Conclusion 133
Acknowledgements 134
References 134
Chapter 6. Imidazolium Dibutylphosphate Ionic Liquid Based Methacrylate
Polymer Membranes For Efficient Pervaporative Enrichment of 1,3-propanediol
From Binary Aqueous Mixtures
147
Abstract 147
Introduction 148
Experimental 151
Materials 151
Analytical Methods 152
Partition Coefficient Measurement 152
Synthesis, purification and characterization of methacrylate monomer 153

xii
Synthesis, purification and characterization of polymers 154
Membrane Fabrication and Pervaporation experiments 155
Results and Discussions 157
Partition Coefficient in Amine 157
Synthesis, purification and characterization of methacrylate monomer 157
Characterization of polymers 161
Pervaporation results on 1,3-propanediol – water binary feed mixtures 163
Effect of Copolymerization 163
Effect of Temperature 164
Effect of 1,3-PD feed concentration 164
Discussions 164
Conclusion 170
References 170
Chapter 7. Pervaporative enrichment of 1,3-propanediol from model
fermentation broths by hydrophobic specialty polymers
186
Abstract 186
Introduction 187

xiii
Experimental 190
Materials 190
Polymer Synthesis and Membrane Fabrication 191
Allylcyclohexylamine functionalized Siloxane polymer and phase-separated
blend
191
Allylcyclohexylamine based methacrylate polymer and copolymers 193
Imidazolium alkylphosphate ionic liquid based methacrylate polymer and
copolymer
194
Feed Compositions 195
Analytical Methods 196
Partition Coefficient Measurement 196
Pervaporation experiments 197
Continuous Pervaporation 197
Batch Pervaporation 198
Results and Discussions 198
Partition Coefficient 198

xiv
Individual Component Mass Uptakes 199
Pervaporation results on multicomponent feed mixtures 201
The difference between the three polymer systems 201
Pervaporation results: The effect of temperature 204
Pervaporation results: The Effect of Feed Glycerol Concentration 205
Pervaporation results: Coupling Effect Vs Temperature 206
Robeson’s Upper Bound 210
Hansen Solubility Parameters 212
Price Performance Trade Off 215
Conclusion 217
References 218
Chapter 8. Thesis Summary and Way Forward 233
xv
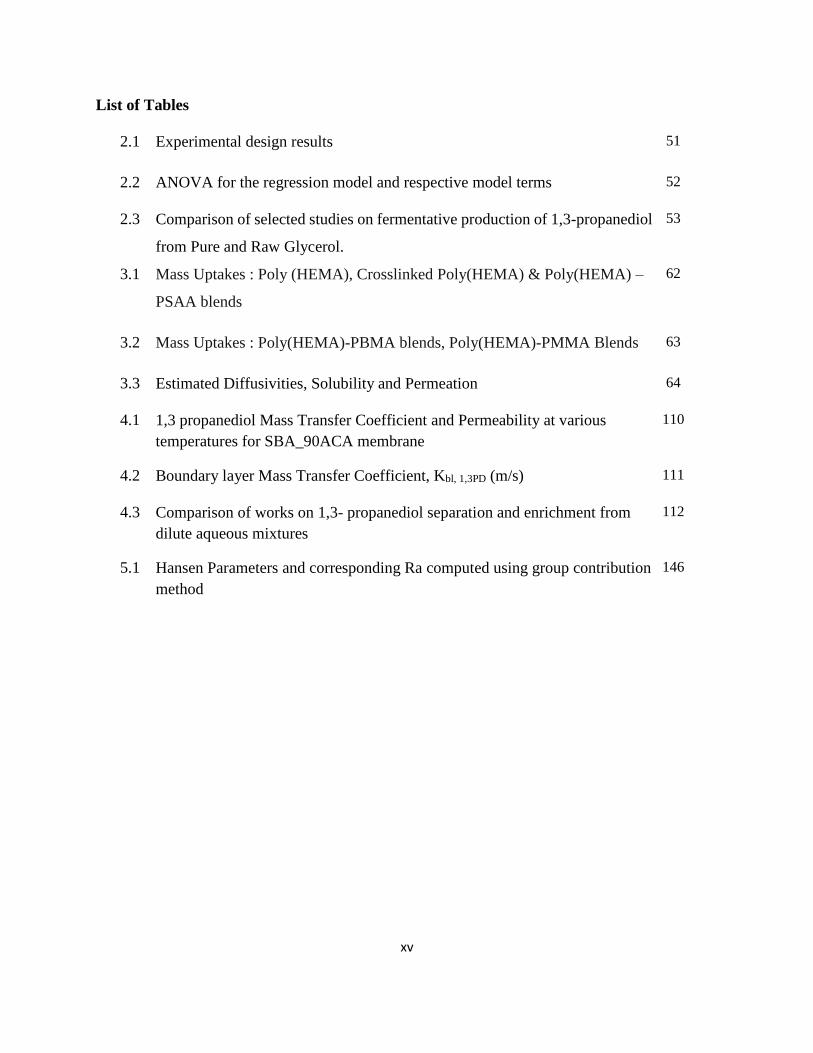
List of Tables
2.1 Experimental design results 51
2.2 ANOVA for the regression model and respective model terms 52
2.3 Comparison of selected studies on fermentative production of 1,3-propanediol
from Pure and Raw Glycerol.
53
3.1 Mass Uptakes : Poly (HEMA), Crosslinked Poly(HEMA) & Poly(HEMA) –
PSAA blends
62
3.2 Mass Uptakes : Poly(HEMA)-PBMA blends, Poly(HEMA)-PMMA Blends 63
3.3 Estimated Diffusivities, Solubility and Permeation 64
4.1 1,3 propanediol Mass Transfer Coefficient and Permeability at various
temperatures for SBA_90ACA membrane
110
4.2 Boundary layer Mass Transfer Coefficient, Kbl, 1,3PD (m/s) 111
4.3 Comparison of works on 1,3- propanediol separation and enrichment from
dilute aqueous mixtures
112
5.1 Hansen Parameters and corresponding Ra computed using group contribution
method
146

xvi
List of Tables
Figure 2.1: Summary of Batch fermentations 39
Figure 2.2: Summary of 16S r-DNA sequencing results 40
Figure 2.3: Summary of Design of Experiments 41
Figure 2.4: Continuous fermentation profiles, Run #1 42
Figure 2.5. Productivities, Glycerol Consumption and Molar yield 43
Figure 2.6. Specific Productivity and Specific Glycerol Consumption 44
Figure 2.7: Steady state profiles on expanded time scale for CSTR run #1 D = 0.11h-
1
45
Figure 2.8: Steady state profiles on expanded time scale for CSTR run #1 D = 0.19h-
1
46
Figure 2.9: Continuous fermentation profiles, Run #2 47
Figure 2.10: Steady state profiles on expanded time scale for CSTR run #2 D =
0.04h-1.
48
Figure 2.11: Steady state profiles on expanded time scale for CSTR run #2 D =
0.13h-1
49
Figure 2.12: Steady state profiles on expanded time scale for CSTR run #2 D =
0.18h-1
50
Figure 3.1: Picture of a 500µm PHEMA-PSAA 90:10 blend membrane 66
Figure 4.1: (a) Hydrosilylation Reaction Scheme (b) Representative H1 NMR for
hydrosilylation (c) Representative FTIR for hydrosilylation (d) Glass transition
temperature at various levels of functionalization (e) Molecular weight at various
levels of functionalization
104
Figure 4.2: (a) Crosslinking reaction Scheme-1 (b) Crosslinking reaction Scheme-2
(c) FESEM of composite membrane structure with FESEM of porous PE sheet as
inset (d) Glass transition temperature of membrane forming recipes (e) Schematic
representation of microphase segregated blend formed by scheme 2
105

xvii
Figure 4.3: (a) Water contact angle on membrane forming recipes (b) Mass uptake
results of membrane forming recipes (c) Tensile break stresses of membrane forming
recipes.
106
Figure 4.4: Variation of steady state component flux and separation factors with
increasing ACA functionalization (a) Water Flux (b) 1,3-PD flux (c) Separation
Factor
107
Figure 4.5: (a) Effect of feed 1,3-PD concentration and Feed Temperature (b) Effect
of cross flow rate on water flux (c) Effect of cross flow rate on 1,3-PD flux and
separation factors.
108
Figure 4.6: (a) Variation of Concentration Polarization modulus with cross flow rate
and temperature at feed 1,3-PD concentration of 10g/l (b) Schematic of composite
membrane structure showing the three layers. Permeation pathway is shown with red
arrows and red dotted line (c) TEAS graph of the percentage contribution by the
partial solubility parameters for each component.
109
Figure 5.1: Monomer Synthesis Scheme 138
Figure 5.2: NMR (a) ACA (b) Click adduct (c) Methacrylate monomer
CHAPTPMA
139
Figure 5.3: Characterization of Thiol-ene click adduct and methacrylate (a) FTIR, of
click adduct and monomer (b) TGA
140
Figure 5.4: NMR Spectroscopic Characterization of polymers. a. P(Acryl), b.
P(Acryl_BuA Copolymer, (c). P(Acryl_DVB copolymer)
141
Figure 5.5 : Polymer characterization (a) DSC overlay demonstrating the thermal
transition temperatures (b)Water and 1,3-PD contact angle (c) Water and 1,3-PD
mass uptake
142
Figure 5.6 : Plug Membrane (a) Schematic (b)Photograph (c) Section FESEM 143
Figure 5.7 : Batch Pervaporation – Variation with temperature (a) Component Flux
(b)1,3-PD separation factor
144
Figure 5.8 : Batch Pervaporation – Variation with 1,3-PD feed concentration (a)
Component Flux (b)1,3-PD separation factor
145
Figure 6.1: Monomer Synthesis Scheme
176

xviii
Figure 6.2: NMR of the monomer synthesis scheme (a) Vinylimidazole 1H NMR, (b)
Thiol – ene click adduct 1H NMR, (c) Imidzolium ionic liquid 1H NMR, Insets
showing the proton shifts for the butyl group attached to Imidazolium nitrogen and
the dibutyl phosphate counter anion
177
Figure 6.3: NMR of the monomer synthesis scheme (a) Methacrylate monomer 1H
NMR, (b) Methacrylate Monomer 13C NMR, Insets showing the carbon shifts for the
butyl group attached to Imidazolium nitrogen and the dibutyl phosphate counter
anion
178
Figure 6.4: Monomer Characterization (a) FTIR, (b) TGA 179
Figure 6.5: Photographs of monomer solubility (a) In water, arrow indicating the
insoluble droplet of monomer in water (b) In 1,3-propanediol, arrow indicating the
insoluble droplet of monomer in water
180
Figure 6.6: NMR of the polymers (a) PVIM - Homopolymer 1H NMR , (b)
PVIM_BuA Copolymer 1H NMR, (c) PVIM_DVB Copolymer 13C NMR
181
Figure 6.7: Polymer Characterization (a) DSC (b) Contact Angle 182
Figure 6.8: Polymer Characterization and Plug Membrane Fabrication (a) Mass
Uptake, (b) FESEM of membrane plug section.
183
Figure 6.9: Component flux and separation factors with varying temperatures (a)
Water Flux (b) 1,3-PD (c) Separation factors
184
Figure 6.10: Component flux and separation factors with varying feed 1,3-PD
concentrations (a) Water Flux (b) 1,3-PD (c) Separation factors
185
Figure 7.1 : Polymer structures (a) Functionalized Siloxanes (b) ACA based
methacrylate polymers (c) Imidazolium alkylphosphate ionic liquid based
methacrylate polymers
224
Figure 7.2 : Partition coefficient 225
Figure 7.3: Component mass uptakes by membrane materials 226
Figure 7.4: Flux and Separation factors for Feed composition M1, Temperature 300C 227

xix
Figure7.5 : (a) Variation of 1,3-PD Separation factor with temperature (b) Variation
of 1,3-PD enrichment over glycerol with temperature (c) Variation of 1,3PD flux
with temperature
228
Figure 7.6 (a) Variation of 1,3-PD Separation factor with feed glycerol concentration
(b) Variation of 1,3-PD separation factor with feed glycerol concentration (c)
Variation of 1,3-PD flux with feed glycerol concentration
229
Figure 7.7: Variation of coupling effect with temperature (a) Functionalized
Siloxanes (b) ACA based methacrylate polymers (c) Imidazolium alkylphosphate
ionic liquid based methacrylate polymers
230
Figure 7.8: Log-Log plot of 1,3-PD permeability versus separation factor to arrive at
a Robeson’s upper bound
231
Figure7.9 : TEAS graph of the percentage contribution by the partial solubility
parameters for each component.
232

1
Chapter1. Introduction and Thesis Organization
Given the imminent depletion of fossil fuels, the impact that current petroleum based
processes have on the environment and driven by the idea of sustainability, the chemical
industry has begun to envision a paradigm shift to renewable feedstock’s and a
carbohydrate rather than a hydrocarbon economy[1]. This has led to an estimated $2.4
billion global market for biorenewable chemicals with a projected compounded average
growth rate (CAGR) of 14.8%. The bio renewable chemicals industry is expected to reach
$6.8Bn by 2016 and a CAGR of 22.8% as it awaits the advent of bioethylene. Currently,
glycerin and lactic acid account for the bulk (79%) of the biorenewables as the platform
chemicals. Among biorenewable chemicals, the market for intermediates such as 1,3-
propanediol (1,3-PD) is still nascent and accounts for $575 million worldwide [2]. The ever
increasing demand for fuel has made the biodiesel industry an attractive alternative energy
source. The current world Biodiesel production is led by EU at ~12 MT and with rapid
expansion in capacity and usage being declared in developing countries, the Global market
is estimated to touch 37 Billion gallons by 2016 with a growth rate of 42% [3]. However
this leads, simultaneously, to a huge production of glycerol, which though not hazardous
per se, has been described as the wastebasket of the biodiesel process. Crude glycerol, with
many impurities and little value has caused market disruptions due to the problems
associated in its disposal [3]. The production of 5 – 10 gallons of crude glycerol for every
100 gallons of biodiesel has led to a current glycerol production of ~2Bn pounds by the US
biodiesel industry, in addition to ~560 MT pounds of glycerol emanating annually from
non biodiesel sources [4]. The bio-fermentation of crude glycerol to 1,3-PD as a value
added product gives a recourse to capitalizing on the current over capacity of glycerol. The

2
differential in the price between glycerol and 1,3-PD makes this an attractive economic
production proposition for 1,3 propanediol as it does to improve the economic viability of
biodiesel production.
1,3-PD is a large volume commodity chemical with a world market of over 100 million
pounds per year spanning a plethora of applications. It is used as a valuable monomer in
poly (trimethylene terephthalate), commercialized by Shell as Corterra [5]. Additionally it
is applied in the production of polyethers, and polyurethanes. DuPont manufactures a
polymer named Sorona, based on bio 1,3 PD, manufactured from corn sugar in their
Decatur, Illinois plant. 1,3 PD is used to make transparent ballistic polymers, used as
impact resistant eyeglasses. Additionally, 1,3 PD also finds applications as a minor
tranquilizer of the family of Merprobamate, as a low cost biocide (PCT 3015), its
derivatives have been applied as an antifouling agent in water cooling towers, air
conditioners etc. It is also used as an anti freeze thawing agent and can improve properties
for solvents, adhesives, laminates, resins, detergents and cosmetics [6]. It is also used in
the preservation of consumer, household and institutional products [6]. Though the
fermentative production of 1,3-PD has been known for long, petroleum based processes
have dominated the production of 1,3-PD. It is produced primarily from acrolein (Degussa
– DuPont) and Ethylene Oxide (Shell) [7,8]. The yields for the two processes are around
40% and 80% respectively. The hydroformylation and hydrogenation steps use high
temperature and expensive catalysts and release toxic intermediates. Given these
constraints and the impetus towards environment protection, precedence has been given to
its microbial production [8 – 14] . DuPont along with Genencor have undertaken an
extensive effort to develop a biocatalyst for the fermentative production of 1,3-PD. DuPont
3
and Tate-Lyle have been jointly developing the commercial manufacturing process for
fermentation-based 1,3-PD drawing on their respective expertise in biocatalyst engineering
commercial fermentation and carbohydrate processing (Genencor International and
DuPont Expand R&D collaboration, 2001).
A lifecycle analysis of 1,3-PD based on Fossils Vs Biomass was carried out by Urban et
al. for understanding the broader implications of technological alternatives and the results
indicated that bio-based 1,3-PD is more attractive than fossil-based 1,3-PD because of less
nonrenewable resource consumption and greenhouse gas emissions [15]. However, it was
also stated that producing 1,3-PD alone from corn may have a negligible impact in terms
of emissions and resource use [15]. Developing an economically feasible integrated
process based on fermentative production and purification of 1,3-PD using industrial waste
glycerol as the feedstock is thus a sustainable and holistic method in terms of resource
utilization. A number of fermentative pathways to make glycerol based on sugars [9]are
known but the same microorganisms cannot ferment glycerol to 1,3-PD [16]. New
metabolic pathways to ferment sugar to glycerol and the glycerol subsequently to 1,3-PD
have been studied [17]. The natural producers of 1,3-PD from glycerol are of genera
Klebsiella, Clostridia, Citrobacter, Enterobacter and Lactobacilli [18 – 22]. Although
facultative anaerobes such as the Klebsiella Pneumoniae and Citrobacter freundii are
suitable, their classification as opportunistic pathogens complicates their usage with strict
bio safety legislations. The use of Genetically modified E.Coli which is employed in the
current production of Bio 1,3-PD by DuPont is also substantially mired in legislation
besides being an expensive organism to obtain. Non pathogenic Clostridium butyricum and
C. pasteurianum have been noted to grow on glycerol and form 1,3-PD [23 - 25] .
4
Besides the cost of the substrate, the separation of 1,3-PD amounts to almost 50 – 70% of
the total production cost. 1,3-PD can be easily separated from the other by products of
bacterial metabolism. However, that said, the concentration of 1,3-PD in the broth amounts
to ~1.5%. The hydrophilicity of 1,3-PD compounds the complexity of purification. So far
all the separation techniques tried out: evaporation, distillation, membrane filtration,
pervaporation, ion exchange chromatography, liquid–liquid extraction, and reactive
extraction have had their limitations in terms of cost and energy consumption and hence
applicability. The process of evaporation and distillation suffer from the major issue of
large energy consumption, given that the 1,3-PD needs to be concentrated from a very
dilute starting solution, the process turns out to be rather economically unattractive.
Additionally, desalination and deproteinization need to be carried out prior to distillation
[26, 27]. Electrodialysis, used for desalination suffers from low product yield due to loss
of 1,3-PD and serious membrane fouling and has been applied as an upstream method to
evaporation [28,29]. Pervaporation using Na-ZSM-5 and X-type zeolite have been used on
aqueous mixtures and model fermentation broths. Their performance has not been verified
on real time fermentation broths in addition to the disadvantage of the usage of expensive
materials [30, 31]. Although chromatographic separation of 1,3-PD resulted in high purity
product, the final solution obtained was extremely dilute consequentially leading to energy
consumptions as high as evaporation [32]. Similar results were observed with the
adsorption of 1,3-PD on hydrophobic zeolites or active charcoal. The chromatographic
matrix had to be regenerated frequently. A preparative silica gel liquid has also been
reported by groups as recently as 2011[33]. The high hydrophilicity of 1,3-PD has been the
major impediment in using a method as simple as solvent extraction. It is only partly

5
partitioned into a hydrophobic solvent phase and the method only works when a large
amount of solvent is added to a rather concentrated solution of 1,3-PD making it unfeasible
[34]. An alternative to solvent extraction would be to convert 1,3-PD into a hydrophobic
compound, extract it and then convert it back to 1,3-PD. The complications of a number of
unit operations in reactive extraction notwithstanding the process suffers from side reacting
with other broth components and loss at each stage [35].
This thesis explores the production and purification of 1,3-PD from waste industrial
glycerol and its concentration enrichment from dilute aqueous binary mixtures and model
fermentation broths. The thesis is organized into two parts – the first explores the
fermentative production of 1,3-PD from waste industrial glycerol using a soil based
bacterial inoculum, while the second part focuses on the development of polymeric
materials for pervaporative enrichment of 1,3-PD from dilute aqueous mixtures. In the
first part, which explores fermentative production, 1,3-PD was produced with a robust
fermentation process using waste glycerol feedstock from biodiesel production and a soil
based bacterial inoculum developed using an iterative inoculation method. Advantages of
mixed inocula include lower expenses in inocula generation and maintenance, more
robustness against phage infections which may obliterate the entire population in a single
species culture, the ability to metabolize a wider range of carbon sources, providing a
cheaper and safer alternative to genetically engineered strains, and possible optimization
of 1,3-PD with simultaneous conversion of alternative metabolites to biohydrogen [36, 37]
The selectivity and yield in batch fermentations was optimized by appropriate nutrient
compositions. 16S rDNA sequencing results were used to show a systematic selective
enrichment of 1,3-PD producing bacteria with subsequent process control. A statistical

6
design of experiments was carried out on industrial glycerol batches to optimize conditions,
which were used to run 2 CSTR experiments over a period of >500 hours each. 1,3-PD
productivity, specific productivity and yields obtained at a dilution rate of 0.1 hr-1 are
bettered only by pure strains in pure glycerin feeds.
The second part of the thesis focuses on the development of three polymer families to
address the process bottleneck of 1,3-PD enrichment from dilute aqueous mixtures [6, 7,
14]. The complexity of separation is compounded by its high water affinity [38]. Although
pervaporation is an energetically advantageous process. However, 1,3-PD cannot be
enriched by materials conventionally used for pervaporation, such as siloxane polymers
[39].High separation factors have been reported with an ionic liquid based supported liquid
membrane (SLM), but the ionic liquid is extremely extensive [40]. However, a highly
functional material needs to be designed into a system for industrial application to get
adequate financial return on process investment. This portion of the thesis illustrates the
development and application of three novel polymer systems – (i) functionalized siloxane,
(ii) Allylcyclohexylamine based methacrylate polymers and (iii) Vinylimidazolium
alkylphosphate ionic liquid based methacrylate polymers. The synthesis, characterization
and pervaporative application of these materials is explored in part 2 of the thesis with
binary as well as simulated fermentation broth compositions that closely mimic the
compositions obtained with the CSTR run in the first part of this thesis. The polymer
membrane were shown to exhibit a balance of cost and performance. The development of
novel materials with a good cost performance balance forms a crux to the establishment of
industrial separation procedures for 1,3-PD enrichment from fermentation broths. The
removal of this main process bottleneck may underscore the advantages of using waste

7
industrial glycerol as a sustainable resource for biotechnologically producing 1,3-PD as a
biorenewable alternative to chemicals from a petroleum platform.
References:
1. Ragauskas AJ, Williams CK, Davison BH, Britovsek G, Cairney J, Eckert CA, et
al. The path forward for biofuels and biomaterial. Science 2006;311:484–9.
2. Biorenewable Chemicals World Market – Review, December 1, 2010, 162 Pages -
Pub ID: SB2747396
3. Zhang, X, et al, Fermentation of Glycerol to Succinate by Metabolically
Engineered Strains of Escherichia coli , Applied and Environmental Microbiology,
April 2010, p. 2397-2401, Vol. 76, No. 8
4. Papanikolou, S., Aggelis, G., Biotechnological valorization of biodiesel derived
glycerol waste through production of single cell oil and citric acid by Yarrowia
lipolytica, Lipid Technology, Volume 21, 4, 83 – 87, 2009
5. Dangseeyun, N., et al, Thermal, crystallization, and rheological characteristics of
poly(trimethylene terephthalate)/poly(butylene terephthalate) blends, Polymer
Testing 23 (2004) 187–194
6. Zeng AP, Biebl H. Bulk chemicals from biotechnology: the case of 1,3-propanediol
production and the new trends. Advances in biochemical engineering and
biotechnology, vol. 74. Heidelberg: Springer Berlin; 2002. p. 239–59
7. Saxena, R., et al, Microbial production of 1,3-propanediol: Recent developments
and emerging opportunities Biotechnology Advances 27 (2009) 895–913
8. Deckwer WD. Microbial conversion of glycerol to 1,3-propanediol. FEMS

8
Microbiol Rev, 1995;16:143–9.
9. Biebl H, Menzel K, Zeng AP, Deckwer WD. Microbial production of 1,3-
propanediol, Appl Microbiol Biotechnol 1999;52:289–97.
10. Hartlep M, Hussman W, Prayitno N, Meynial-Salles I, Zeng AP. Study of two-
stage processes for the microbial production of 1,3-propanediol from glycerol. Appl
Microbiol Biotechnol 2002;60:60–6
11. Nakamura CE, Whited GM. Metabolic engineering for the microbial production of
1,3-propanediol. Curr Opin Biotechnol 2003;14:454–9
12. Mu Y, Teng H, Zhang D-J, Wang W, Xiu Z-L. Microbial production of 1,3-
propanediol by Klebsiella pneumoniae using crude glycerol from biodiesel
preparation. Biotechnol Lett 2006;28:1755–9
13. Cheng KK, Zhang JA, Liu DH, Sun Y, Liu HJ, Yang MD, et al. Pilot-scale
production of 1,3-propanediol using Klebsiella neumoniae. Process Biochem
2007;42:740–4.
14. Xiu ZL, Chen X, Sun YQ, Zhang DJ. Stoichiometric analysis and experimental
investigation of glycerol–glucose cofermentation in Klebsiella pneumoniae under
microaerobic conditions. Biochem Eng J 2007;33:42–52.
15. Urban, R., Bakshi, B., 1,3-Propanediol from Fossils versus Biomass: A Life Cycle
Evaluation of Emissions and Ecological Resources, Ind. Eng. Chem. Res. 2009,
48, 8068–8082
16. Cameron DC, Altaras NE, Hoffman ML, Straw AJ. Metabolic engineering of
propanediol pathways. Biotechnol Prog 1998;14:116–25.
17. Tong LT, Cameron DC. Enhancement of 1,3-propanediol production by co-

9
fermentation in Escherichia coli expressing genes from Klebsiella pneumoniae dha
regulon genes, Appl Biochem Biotechnol 1992;34\35:149–59.
18. Yang G, Tian J, Li J. Fermentation of 1,3-propanediol by a lactate deficient mutant
of Klebsiella oxytoca under microaerobic conditions. Appl Microbiol Biotechnol
2007;73:1017–24.
19. Raynaud C, Sarcabal P, Meynial-Salles I, Croux C, Soucaille P. Molecular
characterization of the 1,3-propanediol production of Clostridium butyricum. Proc
Natl Acad Sci, USA, 2003;100:5010–5.
20. Seifert C, Bowien S, Gottschalk G, Daniel R. Identification and expression of the
genes and purification and characterization of the genes products involved in
reactivation of coenzyme B12-dependent glycerol dehydratase of Citrobacter
freundii. Eur J Biochem 2001;268:2369–78.
21. Zhu MM, Lawman PD, Cameron DC. Improving 1, 3-propanediol production from
glycerol in a metabolically engineered Escherichia coli by reducing accumulation
of sn-glycerol-3-phosphate. Biotechnol Prog 2002;18:694–9.
22. Schutz H, Radler F. Anaerobic reduction of glycerol to 1,3-propanediol by
Lactobacillus brevis and Lactobacillus buchneri. Syst Appl Microbiol 1984;5:169–
78.
23. Papanikolaou S, Fick M, Aggelis G. The effect of raw glycerol concentration on
the production of 1,3-propanediol by Clostridium butyricum. J Chem Technol
Biotechnol, 2004;79:1189–96.
24. Biebl H. Fermentation of glycerol by Clostridium pasteurianum—batch and
continuous culture studies. J Ind Microbiol Biotechnol 2001;27:18–26

10
25. Saint-Amans, S. et al, Regulation of Carbon and Electron Flow in Clostridium
butyricum VPI 3266 Grown on Glucose-Glycerol Mixtures JOURNAL OF
BACTERIOLOGY,Mar. 2001, p. 1748–1754 Vol. 183, No. 5
26. Ames TT (2002) Process for the isolation of 1,3-propanediol from fermentation
broth. US Patent 6. 361. 983 B1
27. Sanz MT, Blanco B, Beltran S, Cabezas JI (2001) Vapor liquid equilibria of binary
and ternary systems with water, 1,3-propanediol, and glycerol. J Chem Eng Data
46:635–639
28. Gong Y, Tong Y, Wang XL, Liu DH (2004) The possibility of the desalination of
actual 1,3-propanediol fermentation broth by electrodialysis. Desalination
161:169–178
29. Hao J, Liu DH (2005) Desalination of fermented broth containing 1,3- propanediol
by electrodialysis. Chinese J Proc Eng 5:36–39
30. Li S, Tuan VA, Falconer JL, Noble RD (2001a) Separation of 1,3- propanediol
from glycerol and glucose using a ZSM-5 zeolite membrane. J Membr Sci 191:53–
59
31. Li S, Tuan VA, Falconer JL, Noble RD (2001b) Separation of 1,3- propanediol
from aqueous solutions using pervaporation through an X-type zeolite membrane.
Ind Eng Chem Res 40(8):1952– 1959
32. Cho M-H, Joen SI, Pyo S-H, Mun S, Kim J-H (2006) A novel separation and
purification process for 1,3-propanediol. Process Biochem 41(3):739–744
33. Anand, P. et al, A novel downstream process for 1,3-propanediol from glycerol-
based fermentation, Appl. Microbiol. Biotechnol, 2011, 90(4), 1267 – 76
11
34. Malinowski JJ (1999) Evaluation of liquid extraction potentials for downstream
separation of 1,3-propanediol. Biotechnol Tech 13:127–130
35. Hao J, Xu F, Liu H, Liu D (2006) Downstream processing of 1,3- propanediol
fermentation broth. J Chem Technol Biotechnol 81:102–108
36. F. M. Driessen, 1981. Protocooperation of yogurt bacteria in continuous culture.
Pp. 99-120 in: Mixed Culture Fermentations.
37. M. E. Bushell and J. H. Slater, Eds. London: Academic Press, Harrison, D. E.
F.1978. Mixed cultures in industrial fermentation processes. Advances in Applied
Microbiology 24:129-164).
38. Triguero, R. Blanco, H. Machado, M. Rodríguez, Evaluation of liquid extraction
potentials for downstream separation of 1,3-propanediol, Biotechnology
Techniques. 13 (1999) 127–130.
39. P. Shao, R.Y.M. Huang, Polymeric membrane pervaporation, Journal of Membrane
Science. 287 (2007) 162-179.
40. P.Izák, M. Köckerling, U. Kragl, Stability and selectivity of a multiphase
membrane, consisting of dimethylpolysiloxane on an ionic liquid, used in the
separation of solutes from aqueous mixtures by pervaporation, Green Chem. 8
(2006) 947–948.

12
Chapter 2. Batch, Design Optimization and DNA Sequencing Study for Continuous
1,3-propanediol Production from Waste Glycerol by a Soil Based Inoculum*
Abstract
1,3-propanediol (1,3-PD) was produced with a robust fermentation process using waste
glycerol feedstock from biodiesel production and a soil based bacterial inoculum. An
iterative inoculation method was developed to achieve independence from soil and
selectively breed bacterial populations capable of glycerol metabolism to 1,3-PD. The
inoculum showed high resistance to impurities in the feedstock. 1,3-PD selectivity and
yield in batch fermentations was optimized by appropriate nutrient compositions and pH
control. The batch yield of 1,3-PD was maximized to ~0.7 mol/mol for industrial glycerol
which was higher than with pure glycerin. 16S rDNA sequencing results show a systematic
selective enrichment of 1,3-PD producing bacteria with iterative inoculation and
subsequent process control. A statistical design of experiments was carried out on industrial
glycerol batches to optimize conditions, which were used to run 2 CSTR experiments over
a period of >500 hours each. A detailed analysis of steady states at three dilution rates is
presented. Enhanced specific 1,3-PD productivity was observed with faster dilution rates
due to lower levels of solvent degeneration. 1,3-PD productivity, specific productivity and
yield of 1.1g/l.hr, 1.5 g/g.hr and 0.6 mol/mol of glycerol were obtained at a dilution rate of
0.1 hr-1which is bettered only by pure strains in pure glycerin feeds.
Keywords: 1,3-propanediol, mixed bacterial inoculum, CSTR, batch fermentation,
Design of experiment, 16S sequencing

13
*Published as: Batch, Design Optimization and DNA Sequencing Study for
Continuous 1,3-propanediol Production from Waste Glycerol by a Soil Based
Inoculum
B. Kanjilal, I. Noshadi, E. J. Bautista, R. Srivastava, R. S. Parnas, Applied Microbiology
and Biotechnology, 2014 (In Press)

14
Introduction
A paradigm shift in fuels and chemicals towards renewables has led to a growing market
for bio-renewable chemicals such as 1,3-propanediol (1,3-PD) with a plethora of
applications (Ragauskas et al 2006; Nikolau et al 2008). The production of biodiesel, an
attractive renewable fuel, (Noshadi et al 2012; Jaliliannosrati et al 2013), albeit, leads to
excess glycerol byproduct (Haas et al 2006). Fermentation of crude glycerol to 1,3-PD
provides a sustainable and value added recourse to waste utilization (Cheng et al 2007).
Naturally occurring glycerol to 1,3-PD convertors of genera Klebsiella, Clostridia,
Citrobacter, Enterobacter and Lactobacilli were studied by Urban and Bakshi (2009),
Yang et al (2007), Pakanikolau (2004) and Biebl (2001). Bio 1,3-PD from sugars is being
commercialized by DuPont, Genencor and Tate and Lyle using a genetically modified E.
coli with a 51 wt% yield (Saxena et al 2009). However, with the current glut and
decreasing value, glycerol will likely gain preference as a sustainable feedstock platform
for biorenewables (Johnson and Taconi 2007). Recent works utilize mixed bacterial
consortia for fermenting industrial glycerol. These directly use heat shocked and pretreated
soil or sludge and report 1,3-PD yields from 0.41 to 0.65 mol/ mol of glycerol (Selembo et
al 2009, Rossi et al 2012, Misturini et al 2012, Liu et al 2013). While Liu et al (2013) do
not use pH control in batch fermentation, Dietz and Zheng (2013) do so for fed batch
fermentation using activated sludge. A caveat is offered by the latter on the high yield by
assuming presence of additional unknown carbon sources in the sludge contributing to
metabolite production.

15
The present work established an iterative reinoculation procedure for preparing the starting
culture. The selectivity and productivity were optimized by media and process variations.
16S rDNA sequencing was used to study bacterial population statistics in batches. A
statistical Design of Experiment (DOE) was used to optimize batch production of 1,3-PD.
The DOE results were used to run CSTR fermentations for over 500 hours.
The iterative reinoculation eliminated soil particles from the culture to minimize variations
due to changes in soil quality over storage and allowed easy optical density measurement.
For future intended industrial application, soil elimination may reduce maintenance and
ease pipeline flow. The effect of two nutrient compositions on selectivity is presented in
this paper. The performance of pure glycerin (PG) and industrial glycerol (IG) feeds was
compared. pH control resulted in a 0.7 mol/mol conversion with IG which is one of the
highest reported in literature so far with mixed inocula. 16S rDNA sequencing results, a
powerful tool for eliciting phylogenetic relationships, are reported on the starting inoculum
and several batches. The DNA sequencing was carried out to obtain preliminary
information about the composition of the inoculum and to briefly look at the effect of
certain experimental parameters on the relative populations of species present. Sequencing
on several fermentation batches are reported to underscore the fermentation results. This
work also reports results of a statistical DOE with IG feed and concludes with analysis of
two CSTR runs. The DOE, carried out with three variables, optimized conditions for 1,3-
PD production in an attempt to integrate and reconcile the stochasticity inherent in two
non-standard inputs - the inoculum and the industrial glycerol - with their spread of species
and impurities, respectively. Response Surface Methodology (RSM) was utilized to model
and optimize conditions for maximum 1,3-PD output, which was used to run two CSTR

16
experiments for 500 hours each. Steady states were analyzed for productivities and molar
yields. This appears to be the first systematic study of a mixed bacterial inoculum for
fermenting industrial waste glycerol to 1,3-PD.
Mixed inocula offer advantages with cheaper inocula generation and maintenance,
robustness against phage infections and the ability to metabolize a wider range of carbon
sources. They provide a cheaper and safer alternative to genetically engineered strains
(Driessen 1981; Harrison 1978). Additionally, mixed cultures offer more flexibility for
optimization of multiple product yields such as 1,3-PD and biohydrogen (Liu et al 2013).
While Papanikolau et al (2004) and Chatzifragkou et al (2011) continuously ferment IG to
1,3-PD using pure C. Butyricum strains, this work used a mixed bacterial inoculum with
more than 100 species. The molar 1,3-PD yield ~0.66 at dilution rate of 0.04h-1 equaled
Chatzifragkou’s results. This is the first time, in a well-controlled CSTR fermentation with
mixed inocula, that yields of 1,3-PD have been obtained comparable to those with pure
cultures.
Materials and Methods
Stock culture preparation
Bacterial cultures were grown from a University of Connecticut organic farm soil. 5 g of
the soil were soaked in 10 ml of freshly prepared and autoclaved DifcoTM Reinforced
Clostridial Medium (RCM) from Beckton Dickinson, Maryland, USA (38 g/l) and glycerol
from Sigma Aldrich, USA (10 g/l), and purged with high purity nitrogen for 10 minutes.
The method to check for the absence of dissolved oxygen is as per Li et al (2011). The test

17
tubes containing the soil in the growth medium were anaerobically heat shocked at 80C for
10 minutes, cooled for 2 minutes and incubated at 37C and 100 RPM (Li et al 2011) for 7
days. The resultant supernatant medium was used for reinoculation under similar
conditions. This procedure was iterated 4 times resulting in a thick inoculum as a seed
culture for further bacterial inoculations and fermentation.
Feed media composition: Batch, DOE and CSTR
Feed compositions F1 and F2 with 3 g/l of pure glycerol (PG) were used to illustrate the
effect of nutrient composition on selectivity. Compositions F2 and F3, with 20 g/l of PG
and IG respectively, were used to compare their respective performances, with and without
pH control. The IG was obtained as a byproduct from converting waste cooking oil to
biodiesel (Pomykala et al 2013). Glycerol, yeast extract, potassium phosphates and
ammonium sulfate solutions were autoclaved separately at 121C. Other nutrients and
micronutrient solutions were sterile filtered by 0.22 μm syringe filter and stabilized under
refrigeration at acidic pH.
F1,Composition per liter – Pure Glycerol-3g, (NH4)2CO3 2g, KH2PO4 1g, MgSO4.7H2O
0.1g, NaCl 0.01g, MnSO4.7H2O 0.015g, CaCl2.2H2O 0.01g, Na2MoO4.2H2O 0.01g,
FeCl2.4H2O 2.75 mg, Feed buffered with 0.05 M 2-N morpholino ethane sulfonic acid
monohydrate. Initial pH ~ 5.5 – 5.7 (Liu et al 2013)
F2, Composition per liter - Pure Glycerol (PG) 3g or 20 g, Yeast Extract 1g, (NH4)2SO4
2g, KH2PO4 0.5g, K2HPO4 1g, MgSO4.7H2O 0.2g, CaCl2.2H2O 15 mg, FeSO4 5mg,
Micronutrients : Na2MoO4.2H2O 0.0072 mg, FeCl2.4H2O 0.3 mg, CoCl2. 4H2O 0.38 mg,
18
MnCl2.4H2O 0.2 mg, ZnCl2 0.014 mg, H3BO3 0.012mg, NiCl2.6H2O 0.0048 mg,
CuCl2.2H2O 0.0034mg
F3, Composition per liter – Industrial Glycerol (IG) 20g, Yeast Extract 1g, (NH4)2SO4
2g, Micronutrient composition same as F2.
All commercially available salts and chemicals were obtained from Sigma Aldrich, USA
and used without any further purification.
For the DOE, the concentrations of IG and yeast extract were varied over selected ranges.
The CSTR experiments used the optimized concentrations of IG and yeast extract from the
DOE. The (NH4)2SO4 and micronutrient composition was kept the identical to F3 for both
DOE and CSTR.
Batches without pH control
Anaerobic, 150ml batch fermentations were carried out in serum bottles. The pH was
adjusted to 6.8 – 6.9 prior to inoculum injection. The media were purged with nitrogen
and the serum bottles incubated at 37C and 100 rpm. The absence of dissolved oxygen was
checked as per Li et al (2011). The inoculum transferred to the batches was either ~3% or
7% of the batch volume. All batches were repeated in triplicate and the results averaged.
Batches with pH control
Fermentations were carried out in a BioFlo 3000 Bioreactor from New Brunswick
Scientific. The pH was maintained by 2N NaOH and 1N HCl and the batch volume was
300 ± 10 ml. The temperature and agitator were kept at 37C and 100 rpm respectively and
19
nitrogen was purged through the headspace. The initial nitrogen flow rate of 250 mL/min,
for 1.5 hours, was decreased to 120 mL/min for rest of the experiment (Li et al 2011).
Inoculum transferred was 7% of batch volume and each batch was repeated in triplicate.
16s rDNA sequencing for identification and characterization of consortia
The genomic DNA was isolated, amplified, sequenced and analyzed. Sequences of the V4
hypervariable region of the DNA were analyzed to identify bacterial classification and
relative abundances. An average of 68490 gene sequences were analyzed per sample. The
experimental details are delineated in Nelson et al (2014). Sequencing was done on the
stock culture (initial inoculum) and final samples of several batch fermentations. Average
of triplicate results are presented for 6 samples: Feed F1 (3g/l PG)-no pH control, F2 (3
g/l PG)-no pH control, F2 (20g/l PG)-pH 5.5, F2(20g/l PG)-pH 6.5, F3(20g/l IG)-pH 5.5,
F3(20g/l IG )-pH 6.5. The results of the 16s rDNA sequencing were submitted to the NCBI
SRA database with an accession number of SRP047483.
Design of Experiment batches
A statistical DOE was performed on anaerobic batches with three process variables – pH,
IG concentration, and yeast extract concentration. RSM was utilized to model and optimize
the final 1,3-PD concentration as a response variable. The mineral nutrient compositions
were identical to composition F3. The pH, IG and yeast extract concentrations were varied
from 4.8 to 7.2, 15 to 35 g/l and 0.5 to 4g/l, respectively. Experimental details are as per
section 2.4.

20
CSTR Fermentations
Two CSTR runs were carried out, based on conditions computed from the RSM
optimization, in a BioFlo 3000 Bioreactor. The anaerobic fermentation was run in the batch
mode until an exponential growth was initiated, at which point fresh medium was fed into
the fermentor. The CSTR medium was a replica of the RSM optimized composition. The
pH was maintained at the optimized value. The other experimental details are mentioned
in section 2.4. The fermentation volume was kept constant while being run at various
dilution rates. The dilution rate (D) is defined as the reciprocal of feed and cellular
residence time in the absence of cell retention (Li et al 2011).
Analytical methods
The IG feedstock was analyzed by Thermogravimetric analysis (TGA) on a TA
Instruments TG Analyzer, using 50ml/min nitrogen flow and 10C/min temperature ramp
to 800C. Cell density was measured at 540 nm using a BioMate™ spectrophotometer
(Thermo Spectronic, USA). Aliquot samples of known volume were centrifuged and the
biomass weight measured after washing with PBS media and drying to constant weight.
The estimated biomass in g/l was numerically correlated to corresponding optical density.
The glycerol and metabolite concentrations were analyzed on 0.22m syringe filtered
samples by gas chromatography (GC) using a DB-FFAP capillary column with an MS
detector and a 1L injection volume. GC injector and detector temperatures were kept at
240C and 270C respectively. For the analysis of the 16S rDNA sequencing data, QIIME
versions 1.6 and 1.7 were used (Nelson et al 2014) – a software package for statistically
processing and analyzing sequencing data of microbial communities (Caporaso et al 2010).

21
Results
Analysis and Treatment of Industrial Glycerol
The industrial glycerol from the biodiesel run contained KOH transesterification catalyst,
miscellaneous impurities and remnant methanol. Prior to methanol distillation, KOH was
partly precipitated as KH2PO4 and K2HPO4 using H3PO4. The resultant IG had ~ 75 mass%
glycerin, ~ 20 mass% methanol, and ~5 mass% inorganic residue after the TGA reached
800C which was likely remnant phosphates.
Batch Fermentation
Effect of feed nutrient composition on 1,3-PD selectivity
The effect of media composition is illustrated by comparing feed F1 and F2 (Figure 2.1A,
Bars 1 and 2) in batches without pH control using a PG concentration of 3 g/l. The inoculum
was 3% of batch volume. The major metabolite in F1 was acetate (0.718 mol/mol gly) and
with F2, the major metabolite was 1,3-PD (0.197 mol/mol gly). F2 yielded a better molar
conversion to 1,3-PD. 1,3-PD:Acid molar ratios were 0.19 with F1 and 1.01 with F2, which
made F2 much more selective towards 1,3-PD. Although the 16S r-DNA sequencing
results, in a later section, show little difference between bacterial populations, feed F2
encouraged metabolism in favor of 1,3-PD.
Comparison of pure and industrial glycerol without pH control
The performances of PG and IG were compared with feeds F2 and F3, respectively. The
product yields are shown in Figure 2.1A (Bars 3 and 6). Total molar liquid metabolite
22
yields of 27% and 22% were obtained with PG and IG, respectively. 1,3-PD yields of 0.247
and 0.204 mol/mol of glycerol were achieved with PG and IG feeds, respectively. During
the experiment, the pH dropped from ~ 6.9 to ~4.5 with a concomitant decrease in bacterial
growth resulting in limited glycerol utilization. The acid production was higher with PG
while the solvent production was similar with both feeds (Fig2.1A). The 1,3-PD:Total acids
molar ratio was at 8.2 and 12.0 for PG and IG respectively. Comparing bars 2 and 3, the
selectivity in favor of 1,3-PD was enhanced when the glycerol feed concentration was
increased from 3 to 20 g/l and the inocculum volume was increased from 3 to 7% of the
batch volume. Semi-log biomass profiles are shown in Figures 2.1B and 2.1C. The liquid
metabolite production was delayed with IG feed. The semi-log Biomass-time plots for IG
batch had a biphasic behavior (Fig.2.1C) but those with PG (Fig.2.1B) were not as clearly
delineated. The IG feedstock with ~ 5 mass% phosphates and other impurities may have
suppressed metabolic processes with the resultant initial lag. The metabolite profiles
indicated the probable existence of C. butyricum as the most dominant species.
The effect of pH control on product yield
Batches with PG and IG feeds (F2 and F3, 20 g/l glycerol) were carried out at pH 5.5 and
6.5. Figure 2.1A (Bars 4,5 and 7,8) summarizes the yields. At pH 5.5 (Bars 4 and 7), the
total metabolite molar yield of 77% was nearly identical for the two feeds. At pH 6.5 the
total metabolite molar yields were ~83% and ~ 85.7%, with PG and IG respectively, which
are indistinguishable. For both feeds the acid production increased marginally with pH,
and the acetate production was slightly higher with PG than with IG. With PG, pH had
little effect on the 1,3-PD molar yield. At pH 5.5 the molar 1,3-PD yield for PG and IG

23
respectively, was 56 and 63%. The same changed to 52 and 71% at pH 6.5. The molar 1,3-
PD yield was higher with IG and increased with pH. This increased yield was at the
expense of selectivity as the 1,3PD:Acids ratio dropped to ~2.5 and ~4.9 for PG and IG
respectively. The limit of glycerol utilization here had much to do with toxic intermediate
buildup.
At pH 5.5, exponential growth is seen with both feeds with no identifiable lag phase (Figs.
2.1D and 2.1E). The growth was faster in PG. At pH 6.5, both feeds exhibited a poor fit to
an exponential pattern unless a lag phase was included (Figs. 2.1D and 2.1E). Fits to
biphasic growth patterns at pH 6.5 (Fig 2.1D and 2.1E) indicate a ~10hour lag phase for
both PG and IG feeds.
Batch results at pH 6.5 with PG and IG feeds of 30 g/l showed a drop in 1,3-PD yield by
8% for PG and ~19% for IG compared to batches with 20g/l glycerol concentration. The
initial lag time increased from ~10 hours to ~15 hours but maximum biomass levels were
unchanged. With even higher IG concentration of 42 g/l initial growth lag times increased
from ~15 to ~24 hours, and a stunted biomass growth, inefficient glycerol utilization and
even lower 1,3-PD yields were observed (0.27mol/mol). With 58g/l IG, the biomass did
not reach an exponential growth stage.
16s r-DNA sequencing
The DNA sequencing yielded information on the relative populations of species and genera
comprising the inoculum. A total of 160 bacterial species were identified in the initial
inoculum, which decreased to 133 and 146 respectively with fermentation in feeds F1 and

24
F2 (with 3g/l glycerol, 3% inoculum) without pH control. pH control with a PG feed
caused further reduction, especially at pH 6.5. The reduction in the number of species or
the effect of pH was less evident with IG feeds. The results are shown in Figure 2.2(a).
Figure 2.2(b) shows Shannon Index and Simpson’s index of diversity. The Shannon index
(SI) increases with richness and evenness of the community. The Simpson’s index of
diversity (SID), a measure of dominance also increases with diversity (Tumisto 2012). The
reduction in SI and SID in F1 and F2 from the starting inoculum reflected reduced diversity,
rise of the dominance of specific genera and the obliteration of some classes. The indices
further dropped with pH control underscoring population unevenness and dominance by
the Clostridia genus. In the initial inoculum Clostridia and Enterobacter were the most
populous genera comprising 45% and 30% of the population followed by unidentifiable
genera from Clostridiaceae and Enterobacteriaceae families at 15 and 9% respectively. 35
identified minor members and a host of unidentified classes were grouped together and
these comprised rest of the population in the initial inoculum. The results are presented in
Figure 2.2C. The average populations of Clostridia and Enterobacter genera were
preserved in F1 and F2 batches without pH control.
Design of Experiments and Analysis of Variance
Response Surface methodology (RSM) was employed to optimize IG fermentation with 17
batch fermentations and final 1,3-PD concentration as the response variable. Three
experimental factors, pH (A), feed IG concentration (B) and yeast extract concentration
(C) as independent variables, were put in a box-behnken design and used at 3 levels
between minima and maxima (Montgomery 1996). The ranges of the pH, IG concentration

25
and yeast extract concentration were 4.8 – 7.2, 15 – 35 g/l, 0.5 – 4 g/l, respectively. The
design center experiment was repeated 5 times to estimate the error. The regression and
test factor coding is detailed in Noshadi et al (2012). Table 1 provides the 1,3-PD
concentration at the end of each batch. Biomass and metabolite profiles were noted for
each experiment as a quality control check, but those details are not necessary for this
discussion. The lag time for initial bacterial growth increased with glycerol feed
concentration. The final metabolite concentrations were estimated by GC from samples
taken once the inoculum had entered a stationary phase. The experimental response was
related to independent variables by an optimization model (Eqn. 1).
𝜂 = 𝛽0 + ∑ 𝛽𝑗𝑘𝑗=1 𝑥𝑗 + ∑ 𝛽𝑗𝑗
𝑘𝑗=1 𝑥𝑗
2 + ∑ ∑ 𝛽𝑖𝑗𝑥𝑖𝑥𝑗𝑘<𝑗=2𝑖 + 𝑒𝑖 (1)
𝜂 is the final 1,3PD concentration, 𝑥𝑖 and 𝑥𝑗 the independent factors of pH, glycerol
concentration and yeast concentration, 𝛽0 the constant coefficient, 𝛽𝑗, 𝛽𝑗𝑗 and 𝛽𝑖𝑗 the
coefficients for linear, quadratic and interaction effects, and 𝑒𝑖 is the error. Coefficients of
determination 𝑅2 and 𝑅𝑎𝑑𝑗2 were used to indicate the quality of fit. Statistical significance
was checked with F-value, p-value and estimates detailed in Myers and Montgomery
(2000) and Noshadi et al (2012). Experimental response and independent variables were
correlated by Eq.(2). Least squares regression was used to obtain a best fit model.
𝜂= +8.35426 + 2.70258*A - 1.30514*B + 0.15521*A*B + 0.013780*B2 +
0.61289*C2 (2)
Table 2 shows the ANOVA evaluations of this model. Appropriateness of fit was measured
by F-value, R2, p-value, and lack of fit (Myers and Montgomery 2000). Large F-values and

26
low p values indicate significance of linear terms for pH (A) and IG concentration (B) and
underscores strong correlations of the quadratic terms for the glycerol concentration (B)
and yeast concentration (C) with the response. Coefficient of term AB indicates significant
coupling effect of pH with IG concentration on 1,3-PD concentration. Low p-values
<0.0001 indicate that the chance of the model F value arising due to experimental noise is
negligible. The lack of fit F-value of 3.29 indicated its insignificance relative to pure error.
The regression equation and coefficient of determination were evaluated to test the fit of
model. Randomly scattered studentized residuals vs responses (Figure 2.3A) indicate that
variation in original observations is not related to response value. The experimental vs
computed 1,3-PD concentration, from Eq. 2, are plotted in Figure 2.3B. A high adjusted
determination coefficient underscores significance of the model (Myers and Montgomery
2000, Noshadi et al 2012). Numerical optimization was used to find the experimental
factors expected to give the highest 1,3-PD concentration. Optimum conditions of 34.9 g/l
glycerol, pH 7.2 and yeast extract 3.4 g/l were determined.
Continuous production of 1,3-propanediol
Continuous fermentation (CSTR) of IG to 1,3-PD was conducted with RSM optimized
conditions at progressively increasing dilution rates, and steady states were identified. The
fermentation was switched to CSTR once an exponential bacterial growth initiated. This
corresponded with acidogenesis as the PID control system responded by switching on the
base supply to maintain the pH. Two individual runs, each lasting > 500 hours, were carried
out. The biomass, feed and remnant glycerol, and metabolite concentration profiles are
presented in Figures 2.4A, 2.4B and 2.4C, for the first run. Three steady states at dilution

27
rates (D) of 0.04hr-1, 0.11 hr-1 and 0.19 hr-1 were achieved for the first CSTR run. The
details of the second CSTR run and the steady states of the first run at D = 0.11 hr-1 and D
= 0.19 hr-1 are presented in Figures 2.7 – 2.10. Figures 2.4D, 4E, 4F and 4G show CSTR
profiles on expanded time scales at D = 0.04 hr-1 for the first CSTR run. After 480 hours,
when the system returned to D 0.04hr-1, the metabolite profiles did not recover to earlier
levels, even though the biomass recovered. This indicated solvent degeneration, typical in
Clostridial fermentations (Li et al 2011).
The steady state volumetric and specific glycerol consumption rates, molar yields and
productivities were computed. The 1,3-PD productivity (Figure 2.5 A) went through a
maximum of 1.2 g/l.hr and yield of 0.6 mol/mol of glycerol at D = 0.11hr-1. This trend was
replicated by all metabolites. The volumetric glycerol consumption rate (Figure 2.5B)
increases with dilution rate. 1,3-PD molar yield decreased from 0.65 to 0.50 mol/mol gly
with increase in dilution from 0.04 to 0.19 hr-1 (Figure 2.5C). A similar trend in molar
yields of other metabolites was observed. The solvent to acid ratio increased sharply at D
= 0.19 hr-1 for both runs, plausibly due to a protracted or late acidogenesis of a species in
the consortium. Despite increased specific glycerol consumption, molar yield decreased
with dilution rate (Fig 2.5C) as the time allowed for residence and fermentative conversion
decreased.
The specific metabolite productivity of 1,3-PD, specific glycerol consumption rates
(Figures 2.6A and 2.6B) increased with dilution rate with the former reaching a maximum
of 1.5g/g of biomss.hr. The specific ethanol, acetate and butyrate productivities went
through a maximum at D =0.11 hr-1 (Fig 2.6A). The 1,3-PD productivities and specific

28
productivities were comparable to CSTR results of C. Butyricum VPI 3266 on raw and
pure glycerol at D=0.11 hr-1 (Gonzalez et al 2004). Productivities and yields higher than
those reported here were found in studies based on pure strains using pure glycerin feed
(Kaur et al 2012). Table 3 lists a comparison between select glycerol to 1,3-PD
fermentations with a variety of cultures and feeds.
The volumetric productivity and specific productivity follow dissimilar trends with
increasing dilution rate, and this apparent contradiction is discussed below.
Discussion
Batch fermentations
The 1,3-PD production appeared growth rate dependent in pH controlled batch
experiments. Solventogenesis slowed bacterial growth and efficiency due to 3-
hydroxypropionaldehyde build up - a toxic intermediate (Beibl 2001). Although pH is not
a solventogenesis trigger, it is a key factor in clostridial fermentations, such as ABE
processes, where low pH is conducive to solventogenesis and detrimental to growth (Jones
and Woods 1986). However, in the experiments reported here, a higher pH enhanced
bacterial growth and 1,3-PD yield. Although, the course of growth and metabolism is
dynamically influenced by acid concentrations in clostridial fermentation (Colin et al
2001), in these experiments, acids and 1,3-PD were produced simultaneously. 1,3-PD was
the dominant product in all batches followed by butyrate, acetate and ethanol. Remarkably,
1,3-PD molar yield at pH 6.5 was enhanced with IG feed, relative to PG, despite slower
biomass growth. At pH 5.5, 1,3-PD production was delayed with IG. Clearly, both pH and

29
nutrient conditions play a strong role in determining performance but conditions were
found that were very favorable for 1,3-PD production.
Inhibition was observed at glycerol feed concentrations of 30 g/l and higher. While the
reduction of 1,3-PD yield was only 8% with PG, it was 19% with IG at feed concentration
of 30 g/l. This may indicate glycerin inhibition in the case of PG (Biebl 1991), and glycerin
and phosphate inhibition in the case of IG. The inhibition becomes greater as IG feed
concentration increases until biomass growth is completely inhibited at 58 g/l. Phosphates
may enhance metabolic performance of bacterial cultures, but may be toxic at higher
concentrations (Stewart 1975; Qureshi et al 2001). Each strain in the 160 species of the
mixed inoculum used in this work may have individual phosphate responses. It is most
probable that the phosphates in our IG feed improved fermentation performance at lower
IG feed concentrations, compared to PG, but became toxic beyond a limit.
16S rDNA sequencing
The DNA sequencing results underscored the presence of 1,3-PD producing genera in the
initial inoculum. With fermentations, even without pH control, the diversity of the bacterial
population decreased. While the feed composition had little effect on the relative species’
populations, feed F2 made it conducive for the production of 1,3-PD for the predominant
species even without pH control. For batches without pH control, a drop in pH during the
first 20 hours of the experiments (exponential growth) and concomitant stunted biomass
growth allowed little time for disparities between the populations of different species to
develop. However, the 16S rDNA sequencing of bacterial population at the end of the
batches revealed a significant effect of pH on growth and obliteration of specific genera.

30
Control of pH allowed a marked growth of Clostridia genus to 80-95% of the population
while nearly obliterating the Enterobacter genus. With pH control, the bacterial population
diversity dropped further with rising dominance of specific genera and the obliteration of
some classes.
DNA sequencing results are consistent with the metabolite profiles from the fermentations.
While Clostridium is anaerobic, Enterobacter is facultatively aerobic. The main
byproducts with Clostridial glycerol fermentation are acetate and butyrate and that with
Enterobacter are ethanol and acetate (Barbarito et al 1995). With Enterobacter, pyruvate
is cleaved to acetyl-CoA or condensed to α-acetolactate with subsequent transformation to
acetoin and 2,3-butanediol. Very little ethanol was produced in the fermentations while the
major secondary products were acetate and butyrate, consistent with the dominance of
Clostridial species.
Statistical DOE - Influence of experimental parameters on the final 1,3-PD
concentration
The regression results in Eq. 2 indicate that pH had the strongest effect on the final 1,3-PD
concentration (Figures 2.3B ad 2.3C). The 1,3-PD concentration was an increasing function
of both pH and IG concentration, but went through a minimum at ~ 2.5 g/l of yeast extract
concentration. High final metabolite concentrations are a natural outcome of enhanced
concentration of carbon source in feed and hence underscoring the significance may seem
redundant. However, it may be stressed that batch experiments with > 35 g/l glycerol failed
to give appreciable bacterial growth even after > 24 hours of lag time and hence the feed

31
IG had to be limited to a maximum of 35 g/l for the DOE. As with earlier batches, growth
suppression may be linked to remnant phosphates and impurities in IG.
CSTR
It may be recalled that in pH controlled batches, solventogenesis was apparently
independent of acid concentration and 1,3-PD was concomitantly produced with the acids.
Increased dilution rates in CSTR, counterintuitively, enhanced the Solvent to Acid ratios
(Figure 2.5C). This is in contrast to biphasic (eg; ABE glucose) fermentations, where
solventogenesis is subsequent to acidogenesis, high dilution rates keep the inoculum in
acidogenesis and low dilution rates allow time for solventogenesis and molecular
reassimilation (Jones and Woods 1986). In ABE fermentation, butanol and butyrate are
formed via butyryl CoA whose conversion to either metabolite allows for molecular
reassimilation. Here 16S sequencing results prove Clostridial domination at controlled pH.
In Clostridial glycerol fermentation, butyric acid and 1,3-PD are on competitive, not
complimentary routes. The acids and 1,3-PD form via respective intermediates -
dihydroxyacetone (DHA) and 3-hydroxypropionaldehyde (3HPA) (Ragauskas et al 2006).
Simple molecular reassimilation pathway between acids and 1,3-PD is absent. The
butyrate competes with 1,3-PD for re-generating NADH2 equivalents. The oxidative
branch converts glycerol to DHA by NAD+ dependent glycerol dehydrogenase and
phosphorylates it to enter glycolysis, resulting in acids. The remaining glycerol is
dehydrated to 3HPA by a dehydratase and reduced to 1,3-PD by an NAD+-dependent
oxidoreductase. The reductive branch regenerates NAD+ via butyrate synthesis from
32
acetyl-CoA. This needs two NADH2-oxidizing steps per butyrate molecule and is
antagonistic to 1,3-PD production (Papanikolaou, et al 2004).
At lower D, the average age of cells is higher with longer toxic intermediate exposure,
which may increase the propensity for solvent degeneration. In a CSTR, cells are washed
away and replaced via cellular multiplication. At steady state, the rate of biomass
production by cellular multiplication is matched by the rate at which the cells are washed
out of the fermenter. The rate of biomass production is therefore given by Dmm p
][][ ,
where [m] is the steady state biomass concentration and D is the dilution rate. The
computed steady state values of
[m]
p, in (g.dry wt.)/l-hr, were 0.046, 0.117 and 0.174 at
respective D = 0.04, 0.11 and 0.19 hr-1. Thus, mass balance reveals that bacteria multiplied
faster at higher dilution rates (Figure 2.4A). Younger cells, with lower toxic intermediate
exposure, are more efficient 1,3-PD producers leading to increased specific 1,3-PD
productivity.
Over the course of the CSTR experiment, the bacterial population and its distribution may
have undergone a significant statistical evolution with the obliteration and preservation of
specific species. In addition to this statistical population evolution, genetic or mutative
evolutions may also be at play determining the CSTR profiles, a detailed study of which is
beyond the scope of this work. Drawing from the fermentation results and the DNA
sequencing experiments, both of these evolutionary changes can contribute to shifts in
metabolic propensities. The CSTR study of a multispecies culture thus presents future
opportunities for evaluation of a directed evolution phenomena of bacterial population

33
statistics – a combination of systematic screening and mutative evolutions over generations
of bacterial growth.
Studies on batch, 16S rDNA sequencing, statistical DOE and CSTR production of 1,3-PD
from waste glycerol with a soil based inoculum was presented. The iteratively inoculated
starting culture, feed composition and pH control enhanced 1,3-PD selectivity, productivity
and selectively bred 1,3-PD producing bacteria as shown by 16S rDNA sequencing. The
DOE was used to optimize conditions for CSTR, in which 1,3-PD molar yield decreased
but selectivity and specific productivity increased with dilution rate due to faster bacterial
growth and reduced solvent degeneration. 13-PD productivity and molar yields obtained
were comparable to studies with pure strains using pure glycerin feed.
Acknowledgements
The authors gratefully acknowledge Prof. Joerg Graf and Department of Molecular and
Cell Biology, University of Connecticut, for their assistance in the 16S rDNA sequencing
experiments. Portions of this work were supported by DOE Grant DE-EE0003116.
References
Barbarito F, Camarassia-Claret C, Grivet JP, Bories A (1995) Glycerol fermentation by a
new 1,3-propanediol-producing microorganism: Enterobacter Agglomerans. Appl.
Microbiol Biotechnol 43: 786-793.
Biebl H (1991) Glycerol fermentation of 1,3-propanediol by Clostridium Butyricum.
Measurement of product inhibition by use of a pH-auxostat. Appl Micro Bio Biotechnol
35: 701–705.
34
Biebl H (2001) Fermentation of glycerol by Clostridium pasteurianum—batch and
continuous culture studies. J Ind Microbiol Biotechnol 27:18–26.
Caporaso JG, Kuczynski J, Stombaugh J, Bittinger, Bushman FD, Costello EK, Fierer N,
Gonzalez Peña A, Goodrich JK, Gordon JI, Huttley GA, Kelley ST, Knights D, Koenig,
JE, Ley RE, LozuponeCA, Mcdonald D, Muegge BD, Pirrung M, Reeder J, Sevinsky JR,
Turnbaugh, PJ, Walters WA, Widmann J, Yatsunenko T, Zaneveld J, Knight R (2010)
QIIME allows analysis of high-throughput community sequencing data. Nature Methods
7(5):335-336.
Chatzifragkou A, Papanikolaou S, Dietz D, Doulgeraki AI, Nychas GE, Zeng AP (2011)
Production of 1,3-propanediol by Clostridium butyricum growing on biodiesel-derived
crude glycerol through a non-sterilized fermentation process. Appl Microbiol Biotechnol
91:101–112.
Cheng KK, Zhang JA, Liu DH, Sun Y, Liu HJ, Yang MD, Xu JM (2007) Pilot-scale
production of 1, 3-propanediol using Klebsiella pneumonia. Process Biochem 42: 740–4.
Colin T, Bories A, Lavigne C, Moulin G (2001) Effects of acetate and butyrate during
glycerol fermentation by Clostridium butyricum. Current Microbiology 43:238 – 243.
Dietz D, Zheng AP (2014) Efficient production of 1,3-propanediol from fermentation of
crude glycerol with mixed cultures in a simple medium. Bioprocess Biosyst. Eng 37: 225
– 233.
Driessen FM (1981) Protocooperation of yogurt bacteria in continuous culture. In: Bushell,
ME and Slater JH (ed) Mixed culture fermentation, Academic Press, London, pp. 99-120.

35
Gallarso R, Faria C, Rodrigues LR, Pereira MA, Alves MM (2014) Anaerobic granular
sludge as a biocatalyst for 1,3-propanediol production from glycerol in continuous
bioreactors. Bioresource Technology 155: 28 – 33.
Gonzalez-Pajuelo M, Andrade JC, Vasconcelos EI (2004) Production of 1,3-propanediol
by Clostridium butyricum VPI 3266 using a synthetic medium and raw glycerol. J Ind
Microbiol Biotechnol 31: 442–446.
Haas MJ (2006) A process model to estimate biodiesel production costs. Bioresource
Technology 97: 671–678.
Harrison DEF (1978) Mixed cultures in industrial fermentation processes. Advances
in Applied Microbiology. 24:129-164.
Jaliliannosrati H, Amin NAS, Talebian-Kiakalaieh A, Noshadi I (2013) Microwave
assisted biodiesel production from Jatropha curcas L. seed by two-step in situ process:
Optimization using response surface methodology. Bioresource Technology 136:565–573.
Johnson DT, Taconi, KA (2007) The Glycerin Glut: Options for the Value-Added
Conversion of Crude Glycerol Resulting from Biodiesel Production. Environmental
Progress 26: 338–348.
Jones DT, Woods D (1986) Acetone-Butanol Fermentation Revisited. Microbiological
Reviews 50:4:484-524.
Kaur G, Srivastava AK, Chand S (2012) Advances in biotechnological production of 1,3-
propanediol. Biochemical Engineering Journal 64:106 – 118.
36
Li SY, Srivastava R, Suib SL, Li Y, Parnas RS (2011) Performance of batch, fed-batch,
and continuous A–B–E fermentation with pH-control. Bioresource Technology 102: 4241–
4250.
Liu B, Christiansen K, Parnas RS, Xu Z, Li B (2013) Optimizing the production
of hydrogen and 1, 3-propanediol in anaerobic fermentation of biodiesel glycerol. Int. J. of
Hydrogen Energy 38: 3196 – 3205.
Menzel K, Zeng AP, Deckwer WD (1997) High concentration and productivity of 1,3-
propanediol from continuous fermentation of glycerol by Klebsiella pneumonia. Enzyme
Microb. Technol 20(2):82–6.
Metsoviti M, Paraskeyajdi K, Koutinas A, Zeng AP, Papanikolaou S (2012) Production of
1,3-propanediol, 2,3-butanediol and ethanol by a newly isolated Klebsiella oxytoca strain
growing on biodiesel-derived glycerol based media. Proc Biochem 47:1872–1882.
Montgomery DC (1996) Design and analysis of experiments. John Wiley & Sons, USA
Morandi A, Zhaxybayeva O, Gogarten JP, Graf J (2005) Evolutionary and Diagnostic
Implications of Intragenomic Heterogeneity in the 16S rRNA gene in Aeromonas Strains.
Journal of Bacteriology 187: 6561-6564.
Myers RH, Montgomery DC (2000) Response surface methodology: process and product
optimization using designed experiments 2nd Edition. John Wiley & Sons, USA
Nelson MC, Morrison HG, Benjamino J, Grim SL, Graf J (2014) Analysis, Optimization
and Verification of Illumina-Generated 16S rRNA Gene Amplicon Surveys. PLoS ONE
9(4): e94249.

37
Nikolau BJ, Perera MA, Brachova L, Shanks B (2014) Biorenewable Platform
biochemicals for a biorenewable chemical industry. The Plant Journal 54: 536–545.
Noshadi I, Amin NAS, Parnas RS (2012) Continuous production of biodiesel from waste
cooking oil in a reactive distillation column catalyzed by solid heteropolyacid:
Optimization using response surface methodology (RSM). Fuel 94: 156-164.
Papanikolaou S, Fick M, Aggelis G (2004) The effect of raw glycerol concentration on the
production of 1,3-propanediol by Clostridium butyricum. J Chem Technol Biotechnol 79:
1189–96.
Pomykala M, Stuart JD, Noshadi I, Parnas RS (2013) The interplay of phase equilibria and
chemical kinetics in a liquid/liquid multiphase biodiesel reactor. Fuel 107, 623–632.
Qureshi N, Lolas A, Blaschek HP (2001) Soy molasses as fermentation substrate for
production of butanol using Clostridium beijerinckii BA101. Journal of Industrial
Microbiology and Biotechnology 26: 290–295.
Ragauskas AJ, Williams CK, Davison BH, Britovsek G, Cairney J, Eckert CA, Frederick
WJ, Hallett JP, Leak DJ, Liotta CL, Mielenz JR, Murphy R, Templer R, Tschaplinski T
(2006) The path forward for biofuels and biomaterials. Science 311:484–9.
Rossi DA, Da Costa JB, De Souza EA, Ruaro Peralba MC, Ayub MAZ (2012)
Bioconversion of residual glycerol from biodiesel synthesis into 1,3-propanediol and
ethanol by isolated bacteria from environmental consortia. Renewable Energy 39 : 223 –
227.

38
Saint-Amans S, Perlot P, Goma G, Soucaille P (1994) High production of 1,3-propanediol
from glycerol by Clostridium butyricum VPI 3266 in a simply controlled fed-batch system.
Biotechnol Lett 16:832–6.
Saxena RK, Anand P, Saran S, Isar J (2009) Microbial production of 1,3-propanediol:
recent developments and emerging opportunities. Biotechnology Advances 27: 895–913.
Selembo PA, Perez JM, Lloyd WA, Logan BE (2009) Enhanced Hydrogen and 1,3-
Propanediol Production From Glycerol by Fermentation Using Mixed Cultures. Biotech
and Bioengineering 104:1098 -1106.
Stewart CS (1975) Some Effects of Phosphate and Volatile Fatty Acid Salts on the Growth
of Rumen Bacteria. Journal of General Microbiology 89: 319–326.
Tuomisto H (2012) An updated consumer’s guide to evenness and related indices. Oikos
121:1203-1218.
Urban R, Bakshi B (2009) 1,3-Propanediol from fossils versus biomass: A life cycle
evaluation of emissions and ecological resources. Ind. Eng. Chem. Res 48: 8068–8082.
Yang G, Tian J, Li J (2007) Fermentation of 1, 3-propanediol by a lactate deficient mutant
of Klebsiella oxytoca under microaerobic conditions. Appl Microbiol Biotechnol 73:1017–
24.
Zheng ZM, Xu YZ, Liu HJ, Guo NN, Cai ZZ, Liu DH (2008) Physiological mechanism of
sequential products synthesis in 1,3-propanediol fed-batch fermentation by Klebsiella
pneumoniae. Biotechnol Bioeng 100(5):923–32.

39
Figure 2.1: Summary of Batch fermentations, A: Metabolite molar yield comparing
batches at various conditions, 1B – E : Semi log plots ln(biomass in g dry wt./l) Vs time
(h) for batches with 20g/l glycerol and 7% inculum. (B): Feed F2, no pH control, (C):
Feed F3, no pH control, (D): Feed F2, with pH control, (E): Feed F3, with pH control

40
Figure 2.2: Summary of 16S r-DNA sequencing results, A: Average observed number of
species, B: Shannon Index and Simpson’s index of diversity, C: Population
Distribution:1- phylum_ Firmicutes; class_Clostridia; order_Clostridiales;
family_Clostridiaceae; genus_Clostridium,
2 - p_Proteobacteria; c_Gammaproteobacteria; o_Enterobacteriales;
f_Enterobacteriaceae; g_Enterobacter,
3 - p_Firmicutes; c_Clostridia; o_Closridiales; f_Clostridiaceae; Other ,
4 - p_Proteobacteria; c_Gammaproteobacteria; o_Enterobacteriales;
f_Enterobacteriaceae; Other,
5 - Miscellaneous Strains
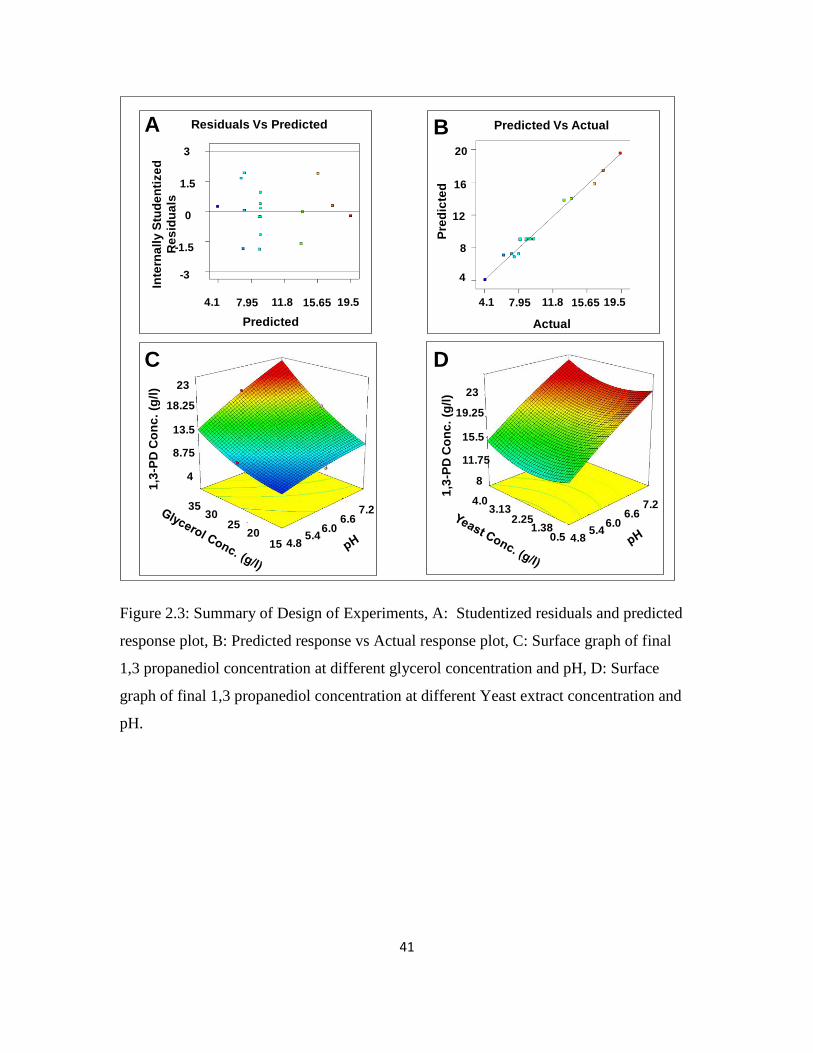
41
Figure 2.3: Summary of Design of Experiments, A: Studentized residuals and predicted
response plot, B: Predicted response vs Actual response plot, C: Surface graph of final
1,3 propanediol concentration at different glycerol concentration and pH, D: Surface
graph of final 1,3 propanediol concentration at different Yeast extract concentration and
pH.
Residuals Vs Predicted
Predicted
Inte
rna
lly S
tud
en
tize
d
Re
sid
ua
ls
-3
-1.5
0
1.5
3
4.1 7.95 11.8 15.65 19.5
Predicted Vs Actual
Pre
dic
ted
Actual
4
8
16
12
20
4.1 7.95 11.8 15.65 19.5
1520
2530
35
4.85.4
6.06.6
7.2
1,3
-PD
Co
nc
. (g
/l)
4
8.75
13.5
18.25
23
0.51.38
2.253.13
4.0
4.85.4
6.06.6
7.2
1,3
-PD
Co
nc
. (g
/l)
8
11.75
15.5
19.25
23
A B
C D

42
Figure 2.4: Continuous fermentation profiles, Run #1 (A) Biomass and glycerol
concentrations (B) Solvent concentrations; (C) Acid concentrations, Dilution rates are
indicated between vertical dotted lines and bold dilution rates are those for which well
developed steady states were attained. (D–G): Steady state profiles on expanded time
scale between 77 – 127 h, D = 0.04h-1. (D) Glycerol concentration, (E): Solvent
concentration, (F): Acid concentration, (G): Biomass concentration.

43
Figure 2.5. Productivities, Glycerol Consumption and Molar yield (A): Metabolite
Productivities (g/l-h) vs Dilution rate (h-1), (B): Volumetric Glycerol consumption rate
(g/l-h) Vs Dilution rate (h-1), (C): Molar yields of liquid metabolites (mol/mol of
glycerol)

44
Figure 2.6. Specific Productivity and Specific Glycerol Consumption (A): Steady State
Specific Metabolite productivity (g/g of biomass-h) , (B): Specific Glycerol Consumption
rate (g/g of biomass-h).

45
Figure 2.7: Steady state profiles on expanded time scale for CSTR run #1 D = 0.11h-1.
(A): Biomass concentration (g dry wt./l), (B) Glycerol concentration, (C): Solvent
concentration, (D): Acid concentration

46
Figure 2.8: Steady state profiles on expanded time scale for CSTR run #1 D = 0.19h-1.
(A): Biomass concentration (g dry wt./l), (B) Glycerol concentration, (C): Solvent
concentration, (D): Acid concentration

47
Figure 2.9: Continuous fermentation profiles, Run #2 (A) Biomass (g dry wt./l), Glycerol
concentration, (B) Solvent concentrations; (C) Acid concentrations, Dilution rates are
indicated between vertical dotted lines

48
Figure 2.10: Steady state profiles on expanded time scale for CSTR run #2 D = 0.04h-1.
(A): Biomass concentration (g dry wt./l), (B) Glycerol concentration, (C): Solvent
concentration, (D): Acid concentration

49
Figure 2.11: Steady state profiles on expanded time scale for CSTR run #2 D = 0.13h-1.
(A): Biomass concentration (g dry wt./l), (B) Glycerol concentration, (C): Solvent
concentration, (D): Acid concentration
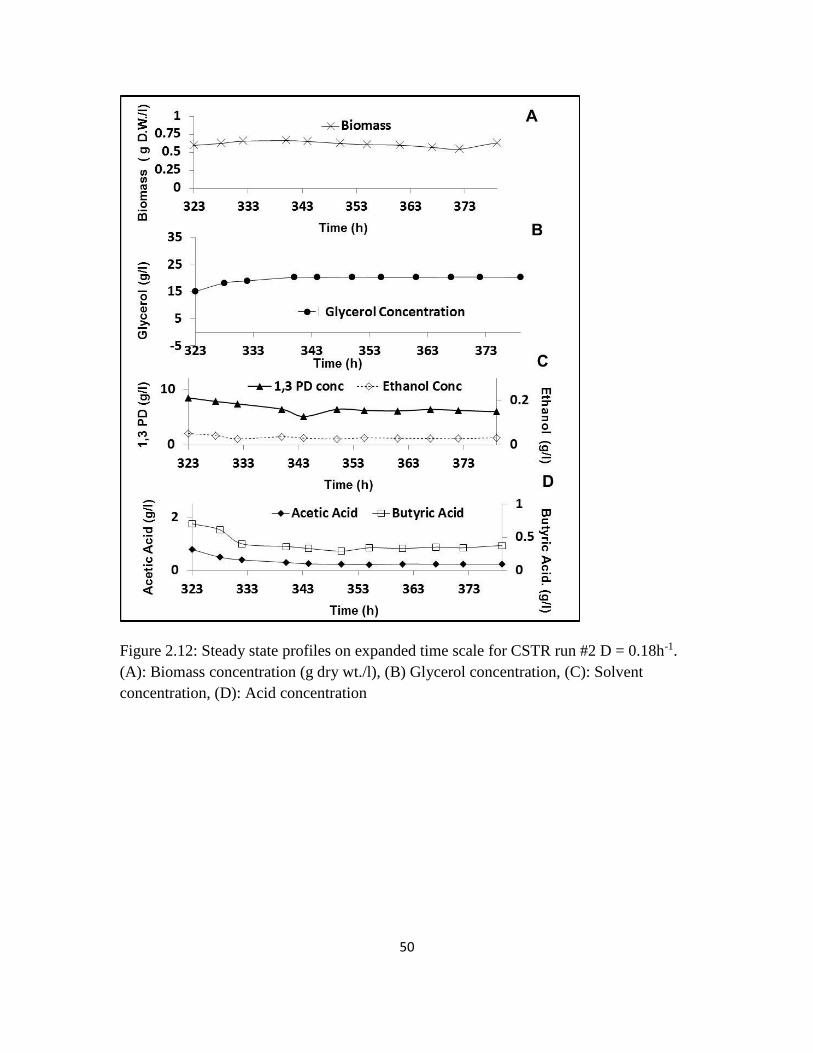
50
Figure 2.12: Steady state profiles on expanded time scale for CSTR run #2 D = 0.18h-1.
(A): Biomass concentration (g dry wt./l), (B) Glycerol concentration, (C): Solvent
concentration, (D): Acid concentration

51
Table 2.1: Experimental design results
Expt.
No. pH Glycerol Feed Conc. (g/l) Yeast extract Conc. (g/l) 1,3-PD Conc. (g/l)
1 7.2 15 2.25 7.98
2 6 25 2.25 9.14
3 6 35 4 17.50
4 4.8 25 0.5 7.22
5 4.8 25 4 7.50
6 4.8 15 2.25 4.20
7 6 25 2.25 9.71
8 6 25 2.25 9.29
9 6 15 0.5 8.82
10 4.8 35 2.25 8.16
11 6 35 0.5 16.50
12 6 15 4 6.30
13 7.2 35 2.25 19.40
14 7.2 25 4 13.92
15 6 25 2.25 8.16
16 6 25 2.25 8.82
17 7.2 25 0.5 13.10
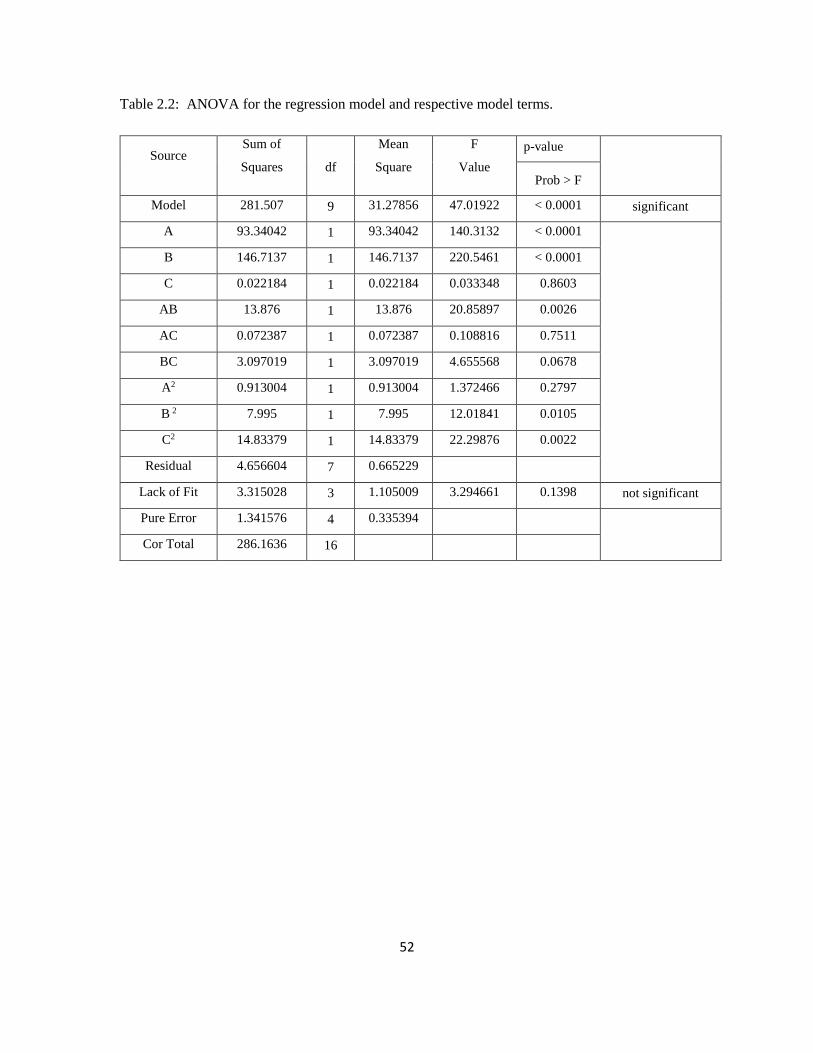
52
Table 2.2: ANOVA for the regression model and respective model terms.
Source Sum of
Squares df
Mean
Square
F
Value
p-value
Prob > F
Model 281.507 9 31.27856 47.01922 < 0.0001 significant
A 93.34042 1 93.34042 140.3132 < 0.0001
B 146.7137 1 146.7137 220.5461 < 0.0001
C 0.022184 1 0.022184 0.033348 0.8603
AB 13.876 1 13.876 20.85897 0.0026
AC 0.072387 1 0.072387 0.108816 0.7511
BC 3.097019 1 3.097019 4.655568 0.0678
A2 0.913004 1 0.913004 1.372466 0.2797
2 B 7.995 1 7.995 12.01841 0.0105
C2 14.83379 1 14.83379 22.29876 0.0022
Residual 4.656604 7 0.665229
Lack of Fit 3.315028 3 1.105009 3.294661 0.1398 not significant
Pure Error 1.341576 4 0.335394
Cor Total 286.1636 16

53
Table 2.3: Comparison of selected studies on fermentative production of 1,3-propanediol
from Pure and Raw Glycerol.
Inoculum Process Yield
(mol/mol gly.)
Reference
Feed: Pure Glycerol
C.Butyricum (VPI 3266) Batch
Fed Batch
0.65
0.69
Saint-Amans et al
(1994)
K. Pneumonae M5al
K. Pneumonae AC15
K. Pneumonae DSM 2016
Batch
Fed Batch
Continuous
0.53
0.64
0.61
Cheng et al 2007
Zheng et al 2008
Menzel et al (1997)
Enetrobacter Agglomerans Batch 0.51-0.61 Barbarito et al (1995)
Organic Soil: Iterative re-
inoculation
Batch 0.56 This Work
Feed: Raw Glycerol
C.Butyricum (VP 1718)* Batch
Fed Batch
Continuous
0.63
0.66
0.63 (0.02hr-1),
0.64 (0.04hr-1),
0.60 (0.06hr-1),
0.62 (0.08hr-1),
0.64 (0.1hr-1),
Chatzifragkou et al
(2011)
K. Oxytoca FMCC-197`* Batch
Fed Batch
0.56
0.24
Metsoviti et al (2012)
Sludge bacterial culture Batch
Fed Batch
0.51 – 0.76
0.52 – 0.56
Dietz & Zheng, 2014
Organic soil, heat treated Batch 0.65 Liu et al, 2013
Tomato Soil, heat treated Batch 0.69 Selembo at el, 2009
Treated Granular Sludge* Continuous (EGSB
reactors)
0.52 (0.08hr-1) Gallardo et al, 2014
Organic Soil:
Inoculum prepared by Iterative re-
inoculation procedure
Batch, DOE, RSM
optimization
CSTR
0.71 (Batch)
0.658- 0.664 (0.04-0.045hr-1)
0.586-0.583 (0.11-0.13hr-1)
0.506-0.517 (0.183-0.19hr-1)
This Work
* Mass yields reported were converted to molar yields

54
Chapter 3. Introduction: Development of Materials for Pervaporation enrichment
of 1,3-propanediol from dilute aqueous mixtures
While 1,3 PD can be easily separated from the other by products of bacterial metabolism,
the real challenge lies in enriching it from dilute concentrations in aqueous mixtures
which amounts to almost 50 – 70% of the total production cost in fermentative 1,3-PD
production. The hydrophilic character of 1,3 PD compounds the difficulty of
purification. Conventional and reported separation techniques have had their limitations
in due cost and energy consumption and hence applicability [1-9]
Membrane separation processes offer a cheap and energy efficient method of upgrading
the value of specific components typically produced in dilute mixtures. Although
pervaporation is an energetically advantageous process [10]. 1,3-PD cannot be enriched by
materials conventionally used for pervaporation. The development of novel materials with
a good cost performance balance is essential for the establishment of industrial separation
procedures for 1,3-PD enrichment from dilute broths.
Separation processes involving phase changes are typically energy intensive, but
pervaporation can be energy efficient as it removes only the minor components [10]. The
membrane chemistry and structure should be chosen in such a way so as to effect selective
enrichment of the minor components [10]. Zeolite membranes have been used for
pervaporative separation of 1,3-PD from other minor fermentation products but the
membranes were also selective towards water[11, 12]. Supported liquid membrane based
on cyanoborate ionic liquid has been reported with high separation factors and moderate
1,3-PD fluxes [13] but supported liquid membranes suffer from stability issues and are
55
difficult to scale-up. This is in addition to high material costs associated with hydrolytically
stable ionic liquids [14].
For separation processes, the development of materials needs to be done with a view
towards possible engineering retrofitting into a system for sustainable industrial application
with a cost – performance balance. Additionally, process design considerations are
important to get adequate financial return on investment.
Pervaporation is driven by a chemical potential difference across the membrane in which
the feed remains in the liquid phase while the permeate is in vapor phase. The Membrane
Performance is calculated based on the selectivity and flux. The selectivity or enrichment
factor is an indication of the purity of the product obtained which, in this research shall be
on the permeate side. The primary crux of pervaporation lies in a combination of the
solubility and diffusivity of the respective components in the membrane. The higher the
affinity of a component for a membrane, the more likely it will be absorbed into the
polymer matrix. The higher the mobility the higher would be its diffusivity. However the
overall efficacy of separation and the relative fluxes depend as much on the diffusivity as
they do on the solubility. The overall permeation, a product of diffusivity and solubility in
effect determines the relative fluxes and the effective separation of components.
The development of materials for this part of the thesis started off in 2011 with proposed
flat sheet membrane structures based on Poly (hydroxyethyl methacrylate) and its blends
with Poly (Styrene-co-Allyl alcohol). A preliminary study carried out on the 1,3 PD and
water mass uptake by sheets cast from Poly(Hydroxyethylmethacrylate) {Poly(HEMA)},
Cross linked Poly(HEMA) and its blends with Poly(Styrene Allyl alcohol) [PSAA],

56
Poly(Methyl methacrylate) [PMMA] and Poly(Butyl Methacrylate) [PBMA]. A radical
initiator was used for the polymerization of HEMA monomer and Gluteraldehyde was
employed as the cross linker. The blending was carried out with a view to reducing the
hydrophilicity of Poly(HEMA) without adversely affecting its affinity towards 1,3 PD. The
blends were made by polymerising HEMA monomer in a solution of the respective
polymers (PSAA, PMMA and PBMA) in THF and casting this mixture as sheets. The
polymer sheets were immersed in water & 1,3 PD and the increase in weight, over time,
was measured. The equilibrium uptake of 1,3 PD by both uncrosslinked & cross linked
Poly(HEMA) was seen to be at least 3 – 4 times greater than that of water. Crosslinking
slowed down the initial rate of 1,3 PD uptake while having no significant impact of the
equilibrium uptake. A major disadvantage with the uncrosslinked membrane was the lack
of mechanical integrity when exposed for a prolonged period to pure 1,3 PD. This was
mitigated by crosslinking with the membrane retaining structural integrity even at
equilibrium swelling levels in 1,3 P.D. Similar results were obtained with the blends
containing 90% and 80% by weight of Poly(HEMA). The results were not as encouraging
with the PMMA and PBMA blends as those with Poly(HEMA), crosslinked Poly(HEMA)
and the Poly(HEMA)-PSAA blend. The results assimilated in Table 1 and Table 2.
The swelling data on Poly(HEMA), Crosslinked Poly(HEMA) and its blends, for all
compositions, led to the inference that the equilibrium uptake of 1,3 PD by the polymer is
higher than that of water but the “initial rate” of water uptake is higher.
Based on Crank’s seminal work[15], a classical Fickian diffusion model links the diffusant
mass with time and membrane thickness from where the diffusion coefficient can be
57
essentially approximated from the initial slope of Mt / M∞ Vs t1/2/L based on the following
equation :
𝑀𝑡
𝑀∞=
4
√
𝐷.𝑡
𝐿2 ----------(1)
The equation holds true for short time spans. The symbols, respectively, in their order of
appearance represent: Mass at time t, Mass at equilibrium swelling, Diffusion Coeff, time,
Avg initial thickness of the sample. However, given the complex nature of sorption
kinetics, the permeation of an analyte through a polymer matrix may be non Fickian in
nature. Additionally a concentration dependence of diffusion coefficients has been
empirically postulated and described Frisch [16].
From the preliminary data on mass uptake, the graphs of Mt / M∞ Vs t1/2/L were seen to
deviate substantially after sometime from Fickian behavior. Once the membranes are
swollen, the permeation and absorption changes may be thought to change. The value of
Diffusion coefficient of water, estimated from the initial slope of the mass uptake graphs,
is greater than that of 1,3 PD. A measure of permeation is calculated from the following
equation [10].
𝑃 = 𝐷. 𝑆--------(2)
Where P is the permeability, D is the diffusivity and S is the equilibrium swelling is taken
as a measure of solubility. The computed results for some polymers are summarized in
Table 2. It was hypothesized that the ratio of the permeability computed from the mass

58
uptake results would roughly indicate the separation factor of 1,3-PD over water for that
given membrane.
Based on the significant difference in the mass uptake of 1,3 PD vis-à-vis water, the
permeability of 1,3 PD was expected to be higher than that of water. This hypothesis was
assimilated in Table 3. This hypothesis was verified by actual permeation experiments on
flat sheet membranes made from Poly(HEMA) – PSAA blends. A sample picture of the
membrane is shown in Figure 1. The pervaporation set up has been detailed in an earlier
work by Li et al 2011 [17]. The pervaporation results for the 2 membranes are shown in
Table 4.
While the flux of both 1,3-PD and water is fairly high, the separation factor fall short of
expectations from the mass uptake experiments. A hydrophilic membrane as the ones
evaluated, would suffer from the twin disadvantage of allowing a lot of water through in
the first place owing to significant water uptake. Additionally, the very high uptake of 1,3-
PD would mean that the membranes may swell and lead to further diffusion of water as
well as 1,3-PD causing a reduction in selectivity. Thus, in a hydrophilic membrane, the
advantage proffered by the very high mass uptake of 1,3-PD is countered by the diffusional
advantage of water which has a lower kinetic diameter compared to 1,3-PD and this called
for the need to develop materials from a hydrophobic platform which would conclusively
reject water while maintaining allowing 1,3-PD. The affinity in favor of 1,3-PD would still
be measured by the sorption or mass uptake of 1,3-PD. But the material needs to reject
water while being inclined towards 1,3-PD which is again a challenge since the solubility
parameters of 1,3-PD are very close to those of water.

59
This section of the thesis, in the ensuing chapters, explores the development of three
families of hydrophobic yet “1,3-PD philic” polymeric materials with progressively
increasing separation efficacy and their application in separating 1,3-PD from binary
aqueous mixtures and model broth compositions.
References:
1. Ames TT (2002) Process for the isolation of 1,3-propanediol from fermentation
broth. US Patent 6. 361. 983 B1
2. Sanz MT, Blanco B, Beltran S, Cabezas JI (2001) Vapor liquid equilibria of binary
and ternary systems with water, 1,3-propanediol, and glycerol. J Chem Eng Data
46:635–639
3. Gong Y, Tong Y, Wang XL, Liu DH (2004) The possibility of the desalination of
actual 1,3-propanediol fermentation broth by electrodialysis. Desalination
161:169–178
4. Hao J, Liu DH (2005) Desalination of fermented broth containing 1,3- propanediol
by electrodialysis. Chinese J Proc Eng 5:36–39
5. Cho M-H, Joen SI, Pyo S-H, Mun S, Kim J-H (2006) A novel separation and
purification process for 1,3-propanediol. Process Biochem 41(3):739–744
6. Anad, P. et al, A novel downstream process for 1,3-propanediol from glycerol-
based fermentation, Appl. Microbiol. Biotechnol, 2011, 90(4), 1267 – 76
7. Malinowski JJ (1999) Evaluation of liquid extraction potentials for downstream
separation of 1,3-propanediol. Biotechnol Tech 13:127–130

60
8. Hao J, Xu F, Liu H, Liu D (2006) Downstream processing of 1,3- propanediol
fermentation broth. J Chem Technol Biotechnol 81:102–108
9. Quereshi, N., et al, Acetone butanol ethanol (ABE) recovery by pervaporation
using silicalite–silicone composite membrane from fed-batch reactor
of Clostridium acetobutylicum, Journal of Membrane Science, 1-2, 2001, 93 – 102
10. P. Shao, R.Y.M. Huang, Polymeric membrane pervaporation, Journal of Membrane
Science. 287 (2007) 162-179.
11. S. Li, V.A. Tuan, J.L. Falconer, R.D, Noble, Separation of 1,3- propanediol from
glycerol and glucose using a ZSM-5 zeolite membrane, J. Membr Sci. 191 (2001a)
53–59.
12. S. Li, V.A. Tuan, J.L. Falconer, R.D. Noble, Separation of 1,3- propanediol from
aqueous solutions using pervaporation through an X-type zeolite membrane, Ind
Eng Chem Res 40 (2001b) 1952– 1959.
13. P.Izák, M. Köckerling, U. Kragl, Stability and selectivity of a multiphase
membrane, consisting of dimethylpolysiloxane on an ionic liquid, used in the
separation of solutes from aqueous mixtures by pervaporation, Green Chem. 8
(2006) 947–948.
14. N.M. Kocherginsky, Q. Yang, L. Seelam, Recent advances in supported liquid
membrane technology. Separation and Purification Technology, Separation and
Purification Technology 53 (2007) 171–177.
15. Crank, J.; Park, G. S. Methods of measurement. In The Mathematics of Diffusion;
Oxford University Press: London, 1975; pp 1-39.
16. Frisch, H. L. The time lag in diffusion. J. Phys. Chem. 1957, 61, 93-95.

61
17. Li, S.Y., Srivastava, R., Panas, R.S., Separation of 1-butanol by pervaporation
using a novel tri-layer PDMS composite membrane, Journal of Membrane Science,
363, 1-2, 2010, Pg 287 – 294

62
Table 3.1: Mass Uptakes : Poly (HEMA), Crosslinked Poly(HEMA) & Poly(HEMA) –
PSAA blends
System
Poly
(HEMA)
Xlinked
Poly
(HEMA)
Poly(HEMA):
PSAA
(blend90:10)
Poly(HEMA):
PSAA
(blend80:20)
Equilbrium
Water uptake
(%) 52 50 46 73
Equilibrium
1,3Propanediol
uptake (%) 174 169 259 235

63
Table 3.2: Mass Uptakes : Poly(HEMA)-PBMA blends, Poly(HEMA)-PMMA Blends
System
Poly(HEMA):
PBMA
(blend90:10)
Poly(HEMA):
PBMA(blend
80:20)
Poly(HEMA):
PMMA
(blend90:10)
Poly(HEMA):
PMMA
(blend80:20)
Equilbrium
Water uptake
(%) 49 41 49 45
Equilibrium
1,3Propanediol
uptake (%) 162 98 124 85
.

64
Table 3.3. Estimated Diffusivities, Solubility and Permeation
System
Diffusion Coefficient
(mm2/hr)
Solubility α
Equilibrium
swelling (%)
P’ = D X S
Dwater D1,3PD Swater S1,3PD Pwater P1,3PD
Poly(HEMA) 0.4084 0.2107 52 174 21.64 36.65
X LinkedPoly(HEMA) 0.4037 0.1859 50 169 20.18 31.43
PHEMA:PSAA(90:10) 0.34068 0.1237 46 235 15.62 32.03
PHEMA:PSAA(80:20) 0.3309 0.2579 73 235 24.15 60.62

65
Table 3.4. Pervaporation Results
Membrane
Feed 1,3-PD concentration 30 g/l, Temperature 30 0C, Cross
Flow Rate 32 l/h
Water Flux
(kg/m2h)
1,3-PD Flux
(kg/m2h) Separation factor
PHEMA-PSAA(90:10) 0.69±0.05 0.033±0.003 1.43±0.02
PHEMA-PSAA(80:20)) 0.37±0.04 0.021±0.005 1.64±0.16
Temperature 30 0C, Cross Flow Rate 32 l/h
PHEMA-PSAA(90:10),
Feed 1,3-PD conc. 20 g/l 0.89±0.04 0.037±0.004 2.04±0.26
PHEMA-PSAA(90:10),
Feed 1,3-PD conc. 50 g/l 0.25±0.06 0.017±0.003 1.42±0.09

66
Figure 3.1: Picture of a 500µm PHEMA-PSAA 90:10 blend membrane

67
Chapter 4. Allylcycohexylamine functionalized siloxane polymer and its phase
separated blend as pervaporation membranes for 1,3-propanediol enrichment from
binary aqueous mixtures*
Abstract
This work reports the synthesis of a novel allylcyclohexylamine functionalized siloxane
and its phase separated blend with styrene-butyl acrylate copolymer and their application
for pervaporative enrichment of 1,3-propanediol from dilute aqueous solutions. The phase
separated blend allowed for the recovery of mechanical strength lost due to
functionalization without loss in separation performance. Separation factors of 9 – 15 were
achieved with functionalization levels of 50-90%, while 1,3-propanediol flux was 5.5 -
5.8g/m2h. Separation efficiency increased with functionalization and decreased with
increasing temperature and feed concentration. Solution diffusion model was used to
compute the overall mass transfer coefficients, concentration polarization and intrinsic
material mass transport properties. The overall mass transfer coefficient for 1,3-
propanediol was between 1.0.10-7 – 3.0.10-7 m/s while the boundary layer mass transfer
coefficient ranged from 12.9.10-7 m/s to 40.10-7 m/s indicating the dominance of the
membrane on the transport resistance. A computation of Hansens solubility parameters by
a group contribution method was carried out to underscore the results. The membrane, with
its good cost/performance tradeoff and excellent mechanical integrity, offers the possibility
of fabrication into modules and scale up.

68
Keywords: Allylcyclohexylamine Siloxanes, Pervaporation, 1,3-propanediol, Solution-
Diffusion
*Allylcycohexylamine functionalized siloxane polymer and its phase separated blend as
pervaporation membranes for 1,3-propanediol enrichment from binary aqueous mixtures,
B. Kanjilal, I. Noshadi, J. R. McCutcheon, A. D. Asande, R.S. Parnas, Journal of
Membrane Science (Submitted)

69
1. Introduction
The fermentation of crude glycerol to 1,3-propanediol (1,3-PD) provides value to
the current over capacity of waste industrial glycerol [1]. The separation of 1,3-PD
accounts for a major portion of the total production cost and is a process bottleneck [2].
The separation bottleneck is the enrichment of 1,3-PD concentration from dilute starting
concentration in the aqueous mixture [2 – 4]. The complexity of separation is compounded
by its high water affinity [2, 5]. Several separation techniques have been reported which
attempted to enrich 1,3-PD concentrations from aqueous mixtures and broths with
concomitant energy, cost and applicability limitations [5 – 18]. For instance, high
separation factors have been reported with an ionic liquid based supported liquid
membrane (SLM), but the ionic liquid is extremely extensive [18]. However, a highly
functional material needs to be designed into a system for industrial application to get
adequate financial return on process investment. This paper illustrates the development and
application of a novel siloxane based polymer membrane with a balance of cost and
performance. Additionally, siloxane based polymers are relatively fouling resistant and
appropriate for use with fermentative processes [19, 20]
Amongst separation processes explored for 1,3-PD enrichment from dilute aqueous
mixtures and broths, distillation consumes large amounts of energy given the large excess
of water [6–8]. Solvent extraction with sequential steps using simple solvents to complex
methanol-phosphate blends has been investigated [5,9,10]. However, 1,3-PD is only partly
partitioned into a hydrophobic solvent phase rendering the methods unfeasible [5].

70
Chromatography, while achieving excellent separation from other metabolites, results in
an extremely dilute final concentration [11–13]. Reactive extraction converts 1,3-PD to a
less water soluble compound which is first extracted and then converted back but suffers
from complications of multiple unit operations, side reactions and yield losses [14, 15].
Studies of pervaporative enrichment of 1,3-PD have been less numerous than other
techniques [16–18]. Works with Na-ZSM-5 and X-type zeolite membrane pervaporations
have only reported selectivity over broth components other than water [16,17]. A supported
ionic liquid membrane has been used in a ceramic nanofiltration module coated with a
PDMS layer exhibiting high 1,3-PD selectivity with aqueous mixtures in batch
pervaporation [18]. While pervaporation, like distillation, involves a liquid to vapor phase
change, it deals with the minor component using selective membranes. These features
reduce energy consumption and make pervaporation the most efficient 1,3-PD separating
technology [21]. To the best of our knowledge no reports exist on synthesized polymeric
structures with continuous pervaporative enrichment of 1,3-PD and with a potential for
scale up.
Poly(Dimethylsiloxane) (PDMS) is an appropriate material for membrane pervaporation
due to its hydrophobic character, good thermal, chemical and mechanical stability, low
base material cost and ease of fabrication [22] . However, PDMS has very little affinity for
1,3-PD and hence needs to be modified or functionalized to improve selectivity. Studies
on PDMS membranes functionalized with a variety of organofunctional side chains have
been carried out for pervaporative separation of volatile organics such as phenol and cresol
from water [23–25].

71
This paper reports a novel membrane structure for continuous pervaporative enrichment of
1,3-PD from binary aqueous feed solutions. The structure is based on
Allylcylcohexylamine (ACA) functionalized Poly(hydromethylsiloxane) (PHMS). The
hydrosilylated PHMS is fabricated into a membrane structure on a porous Polyethylene
support using two methods. In one, it is cross-linked with a high molecular weight hydroxyl
terminated PDMS while the other method entails the formation of a microphase separated
semi interpenetrating polymeric network (SIPN) blend with a high molecular weight
Styrene-Butyl acrylate copolymer. The properties of functionalized PHMS and the
membrane forming materials are characterized. The membranes are applied for the
continuous pervaporative enrichment of 1,3-PD from dilute binary aqueous mixtures. The
performance of the system is analyzed with respect to levels of functionalization,
membrane fabrication method and various process parameters. The overall mass transfer
coefficients, concentration polarization and other transport properties were analyzed using
the solution diffusion model. In the absence of significant concentration polarization, the
intrinsic mass transfer coefficients of the membrane materials were computed. Reasonable
fluxes and separation factors were achieved for the membranes in addition to good
mechanical stability. These structures may be viable alternatives to conventional
purification processes as well as to supported liquid membranes offering a balance between
separation performance and material cost in addition to mechanical integrity. The
mechanical integrity also makes it possible to fabricate pervaporation modules, including
its application in multilayer membranes, for use in continuous processes with concomitant
reduction of the energy cost bottleneck pertaining to 1,3-PD concentration enrichment.

72
2. Experimental
2.1 Materials:
2.1.1 PHMS Functionalization by Hydrosilylation:
For the hydrosilylation reactions on PHMS, Poly(methylhydrosiloxane) (PHMS) of degree
of polymerization ~ 35 to 40 , Allylcyclohexyl amine (ACA) and Bone dry toluene (<30
ppm water) were purchased from Sigma Aldrich and dried prior to use. The chloroplatinic
acid and Dibutyl Tin dilaurate catalysts were purchased from Sigma Aldrich and used
without modification.
Hydroxyterminated Poly Dimethylsiloxane (HPDMS) and Tetraethyl orthosilicate (TEOS)
were purchased from Sigma Aldrich. These components were passed through a drying
column prior to use.
2.1.2 Styrene Butyl Acrylate Emulsion Polymerization:
For the Styrene Butyl Acrylate Emulsion Polymerization, Styrene and Butyl Acrylate were
purchased from SigmaAldrich and passed through a column of inhibitor remover prior to
emulsion polymerization. Potassium persulphate, tert-Butyl perbenzoate, Sodium
bicarbonate and Sodium dodecylbenzenesulfonate were purchased from Sigma Aldrich
and used without modification.
2.2 Membrane Fabrication and Pervaporation Feed:
73
Porous polyethylene sheets were obtained from Interstate Specialty Products for use as the
support sheet for membrane fabrication. The nominal thickness reported was 500 microns
with pore diameters of 75 -110 microns and a porosity of 48%.
1,3 propanediol (1,3-PD), 98% purity was purchased from Sigma Aldrich and used for the
partition coefficient measurements and for preparation of binary mixtures with distilled
water as feed solutions for pervaporation experiments.
2.3 Analytical Methods:
1H NMR was carried out to monitor the extent of functionalization of PHMS in the
hydrosilylation reaction and to characterize the emulsion polymerized Styrene – Butyl
acrylate copolymer on a Brucker DMX-500 MHz spectrometer. IR spectra were taken on
samples with a Nicolet Magna-IR 560 spectrometer, with KBr powder being used as
background. The molecular weight of the functionalized PHMS was determined by GPC
with an Agilent 1260 Infinity system using toluene as eluent and narrow molecular weight
PDMS from Sigma Aldrich as calibration standards. The molecular weight of the Styrene-
Butyl acrylate copolymer was determined by GPC using toluene as the eluent and PMMA
calibration standards. Thermo-gravimetric analysis was carried out on all the polymers in
a TA Instruments Hi-Res 2950 TGA instrument at a ramp of 200C/min in nitrogen up to a
temperature of 8000C. The thermal transitions of the polymer were determined in TA
Instruments Q100 and DSC 2920 instruments under liquid nitrogen cooling. Contact angle
measurements were carried out on an Olympus TGHM goniometer. Tensile testing was
carried out on rectangular samples of width 10mm and thickness 200µ on an Instron
Universal Testing Machine (UTM). A gage length of 25.4 mm and a cross head speed of

74
50mm/min was employed to obtain break stress and strain values. Field Emission scanning
electron microscopy (FESEM) images of the porous PE and composite membrane
structures were obtained with a JEOL 6335F field emission scanning electron microscope.
The feed and permeate compositions from the pervaporation experiments were analyzed
using 0.22μm syringe filtered fermentation samples by gas chromatography (GC) using a
DB-FFAP capillary column and an MS detector and a 1μL injection volume. GC injector,
detector and initial over temperatures were kept at 2400C, 2700C, and 400C for 2 minutes
respectively.
2.4 Partition Coefficient Measurement:
The partition coefficient of 1,3-PD between water and ACA was determined at 300C. 1 ml
of a 10 g/l 1,3-PD solution was shaken in a vortex mixer with 1ml of ACA for 15 minutes
and left for separation between the water and ACA phases. The 1,3-PD partitioned between
the two phases and its concentration in the two phases was computed from GC results of
the aqueous phase before and after partitioning. The partition coefficient was calculated
based on equation 1:
𝐾𝑝 =𝐶𝐴𝐶𝐴
𝐶𝑤𝑎𝑡𝑒𝑟 ------------------(1)
2.5 Synthesis, purification and characterization of ACA functionalized PHMS:
The PHMS was functionalized with ACA by hydrosilylation using the Chloroplatinic acid
catalyst solution [23–25]. The reaction was carried out in a clean and dry glass pressure
tube flushed with high purity argon on a schlenk line. A 25mg/ml chloroplatinic acid
catalyst solution in isopropanol was prepared. A typical run consisted of 1.5 g PHMS with

75
varying quantities of ACA, depending upon the targeted extents of substitution, and 1 ml
of toluene as solvent. The catalyst solution was added to the extent of 5 l/ml of reaction
volume. The reaction temperature was controlled at 70 ±20C. Given the sensitivity of the
reaction to moisture and temperature, with hydride elimination occurring at high
temperatures and in the presence of moisture, all reagents were thoroughly dried prior to
use [23–25]. The reaction was monitored by 1H NMR in CDCl3 and FTIR. The polymer
solution was cooled by immersing the pressure tube in a dry ice and acetone mixture, with
a small amount of liquid nitrogen, to facilitate the separation of the functionalized polymer
from the solvent and remaining catalyst and unreacted volatiles. The functionalized PHMS
was re-dissolved in toluene, the procedure repeated thrice and the remnant toluene solvent
removed by rotary evaporation. The polymer was finally washed with ethanol and vacuum
dried again. The functionalized polymer was characterized for glass transition temperature
and molecular weight by DSC and GPC, respectively. The reaction scheme is depicted in
Figure 4.1(a). The NMR and FTIR are depicted in Figure 4.1(b) and 4.1(c). The glass
transition temperatures and molecular weights are shown in Figures 4.1(d) and 1(e).
2.6 Synthesis, purification and characterization of Styrene-Butylacrylate copolymer:
A high molecular weight Styrene-Butyl acrylate copolymer (SBA) was synthesized by
emulsion polymerization modified from an earlier patented process on pressure sensitive
adhesive latex production [26]. The reaction was carried out at 800C in a 250 ml two necked
round bottom flask fitted with a reflux condenser with the system being constantly purged
with nitrogen. A typical batch consisted of 50 g deionized water, 0.5g Potassium
Persulphate, 0.25g Sodium Bicarbonate, 1g Sodium dodecylbenzenesulfonate 0.25g tert-

76
Butyl perbenzoate, 50g Butyl acrylate and 50g Styrene. While Sodium Bicarbonate and
Sodium dodecylbenzenesulfonate were added beforehand, the monomer mixture was
added dropwise over a period of 15 minutes through the second neck. After the monomer
addition, the temperature was reduced to 650C and the Potassium Persulphate and tert-
Butyl perbenzoate added and the reaction was allowed to run for 2 hours. A silicone rubber
tube fitted with a needle was used to blanket the surface of the reaction mixture with
nitrogen throughout the 2h course of the reaction. At the end of the reaction, the emulsion
was flocculated by Sodium Chloride, the flocculated polymer washed thoroughly and
repeatedly, centrifuged and dried at room temperature. The purified polymer was analyzed
for composition, thermal transitions and molecular weight by NMR, DSC and GPC
respectively.
2.7 Membrane fabrication and characterization:
2.7.1 Scheme 1:
The ACA functionalized PHMS (AP) was blended with the high molecular weight silanol
terminated PDMS (HPDMS) and TEOS [23, 24]. The HPDMS and TEOS were kept at
10% and 2% of the total weight of the mixture respectively. Undiluted Dibutyl Tin
Dilaurate catalyst was added to this mixture at 0.1% by weight of the mixture. A small
amount of toluene was added to this mixture to lower its viscosity. A piece of porous
Polyethylene sheet was soaked in measured quantities of this mixture and the solvent was
allowed to evaporate at room temperature over a period of ~ 24 hours. The membrane was
then allowed to cure at 600C for 4 days to ensure completion of crosslinking and cut to the
required shape. Membranes were fabricated using 50%, 70% and 90% ACA functionalized

77
PHMS and were given the nomenclature PDMS_50ACA, PDMS_70ACA and
PDMS_90ACA respectively.
2.7.2 Scheme 2:
In a separate scheme the ACA functionalized PHMS (AP) was blended with the emulsion
polymerized Styrene-Butylacrylae polymer (SBA) and TEOS. The SBA and TEOS were
kept at 10% and 2% of the total weight while the Dibutyl Tin Dilaurate catalyst was kept
at 0.1% by weight of the mixture. The methods of membrane fabrication and evaluation
are the same as above. The nomenclature used membrane fabricated with this scheme,
employing 90%ACA functionalized PHMS was SBA_90ACA.
All membranes were evaluated for thickness, viewed under FESEM and used for
pervaporation experiments. The membrane forming recipes were separately cast, without
the porous support, on a Kapton sheet into 100 micron thick sheets for tensile tests. Pieces
of these sheets were used for mass uptake experiments [22] and DSC measurements. The
recipes were also cast as a thin layer on clean glass slides for evaluation of water contact
angle.
2.8 Pervaporation experiments:
Pervaporation was carried out in a custom made membrane holder providing a
pervaporation area of 43 cm2. It was fabricated at the Technical Services Facility at
University of Connecticut. The feed solutions consisting of 1,3-PD-water binary mixtures
were maintained at various temperatures. The feed solutions were recirculated over the
membrane on a perforated brass support in the membrane holder by a peristaltic pump,

78
providing varying cross flow rates. The permeate was collected in two parallel cold traps,
cooled in a dry ice – acetone bath. A vacuum pump was employed to maintain the permeate
side pressure at less than 1 mm Hg. Permeate samples were collected at regular time
intervals until steady state was reached. The permeate compositions were analyzed by Gas
Chromatography. The pervaporation equipment used and its schematic are detailed in an
earlier work by Li et al 2010 [22]. As in a typical pervaporation runs, the slope of the total
accumulated permeate mass vs time increased and reached a plateau after steady state was
reached by that particular run. Pervaporation experiments were carried out with varying
membrane recipes, different temperatures, cross flow rates and feed compositions. The
average bulk concentration is essential to determine the overall mass transfer coefficient.
The pervaporation experiments entailed a broth volume of 1000 ml, ~ 0.4-0.5 ml of the
collected permeate was used for chromatographic analysis. The remaining permeate
collected was weighed and returned to the system to maintain the feed concentration at as
constant a level as possible. The feed composition was also evaluated from time to time to
verify the concentrations of the components. The feed composition was taken to be the
average of the initial and final feed compositions as the feed composition changed by less
than 2% of the initial composition for each component. The key performance indicators of
the pervaporation experiment were defined by the component fluxes and the separation
factor defined as:
=𝐽𝑝
𝐽𝑤.
𝑥𝑤
𝑥𝑝 ------(2)
Where Jp and Jw represent the 1,3-PD and water fluxes and xp and xw represent the feed
mass fractions of 1,3-PD and water, respectively.
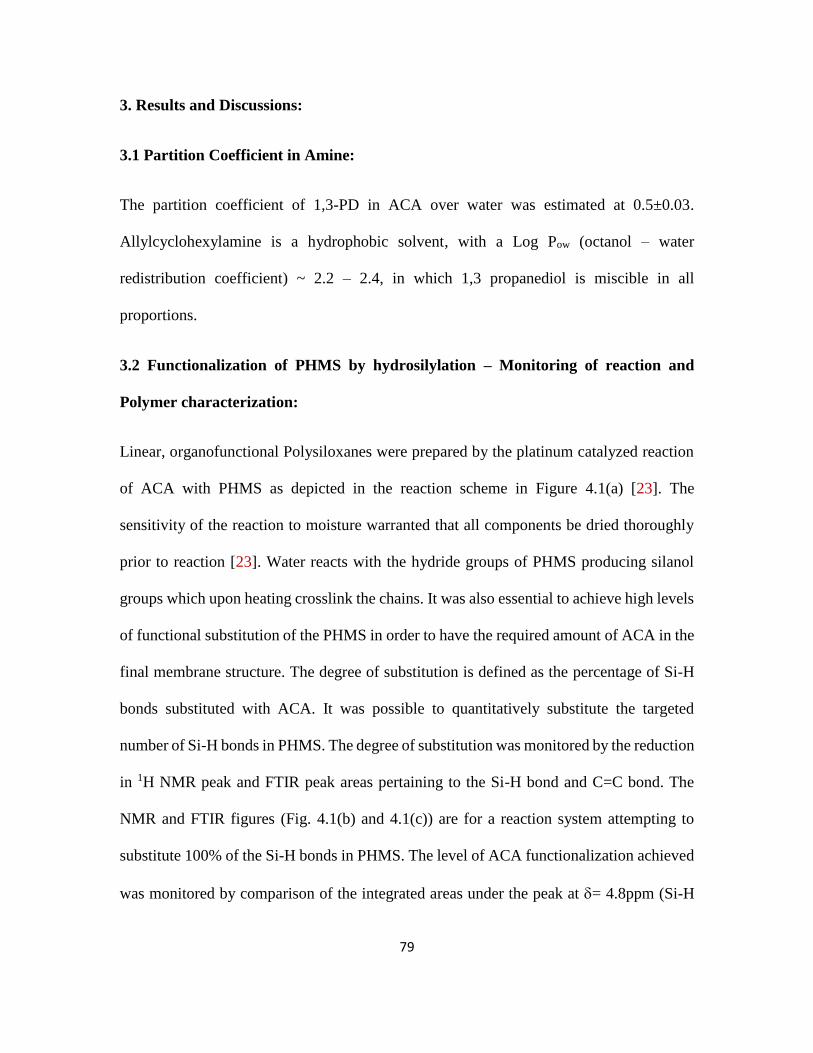
79
3. Results and Discussions:
3.1 Partition Coefficient in Amine:
The partition coefficient of 1,3-PD in ACA over water was estimated at 0.5±0.03.
Allylcyclohexylamine is a hydrophobic solvent, with a Log Pow (octanol – water
redistribution coefficient) ~ 2.2 – 2.4, in which 1,3 propanediol is miscible in all
proportions.
3.2 Functionalization of PHMS by hydrosilylation – Monitoring of reaction and
Polymer characterization:
Linear, organofunctional Polysiloxanes were prepared by the platinum catalyzed reaction
of ACA with PHMS as depicted in the reaction scheme in Figure 4.1(a) [23]. The
sensitivity of the reaction to moisture warranted that all components be dried thoroughly
prior to reaction [23]. Water reacts with the hydride groups of PHMS producing silanol
groups which upon heating crosslink the chains. It was also essential to achieve high levels
of functional substitution of the PHMS in order to have the required amount of ACA in the
final membrane structure. The degree of substitution is defined as the percentage of Si-H
bonds substituted with ACA. It was possible to quantitatively substitute the targeted
number of Si-H bonds in PHMS. The degree of substitution was monitored by the reduction
in 1H NMR peak and FTIR peak areas pertaining to the Si-H bond and C=C bond. The
NMR and FTIR figures (Fig. 4.1(b) and 4.1(c)) are for a reaction system attempting to
substitute 100% of the Si-H bonds in PHMS. The level of ACA functionalization achieved
was monitored by comparison of the integrated areas under the peak at = 4.8ppm (Si-H
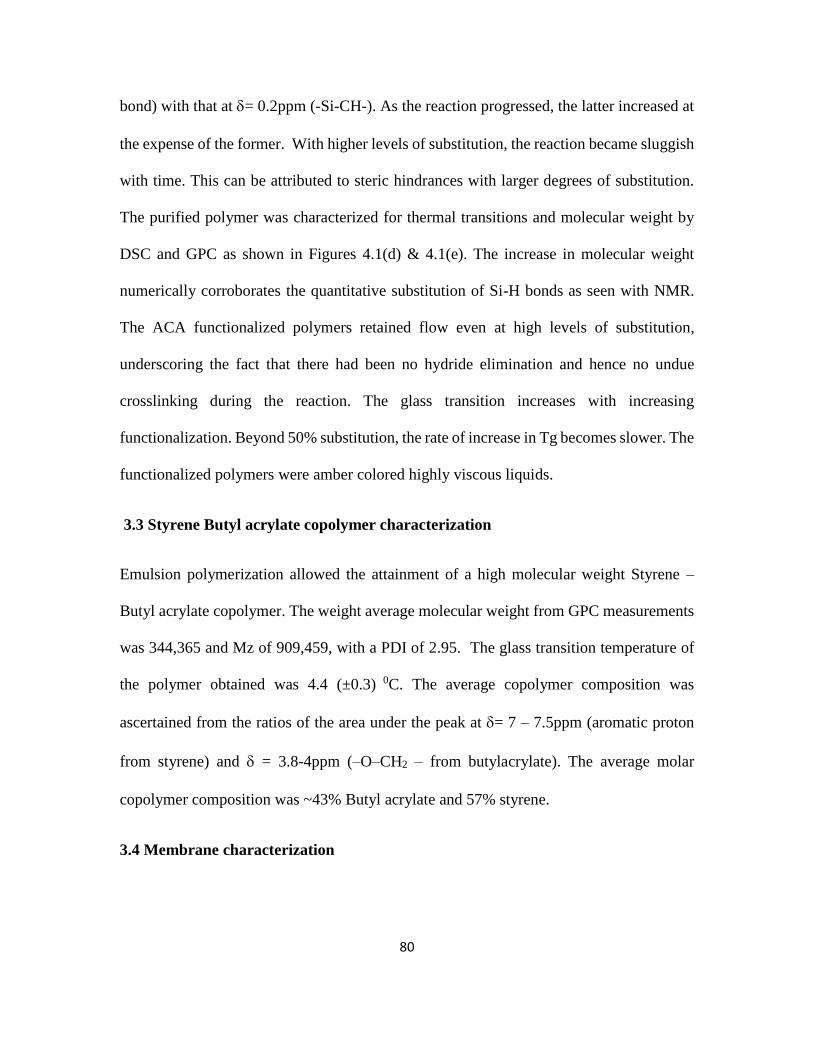
80
bond) with that at = 0.2ppm (-Si-CH-). As the reaction progressed, the latter increased at
the expense of the former. With higher levels of substitution, the reaction became sluggish
with time. This can be attributed to steric hindrances with larger degrees of substitution.
The purified polymer was characterized for thermal transitions and molecular weight by
DSC and GPC as shown in Figures 4.1(d) & 4.1(e). The increase in molecular weight
numerically corroborates the quantitative substitution of Si-H bonds as seen with NMR.
The ACA functionalized polymers retained flow even at high levels of substitution,
underscoring the fact that there had been no hydride elimination and hence no undue
crosslinking during the reaction. The glass transition increases with increasing
functionalization. Beyond 50% substitution, the rate of increase in Tg becomes slower. The
functionalized polymers were amber colored highly viscous liquids.
3.3 Styrene Butyl acrylate copolymer characterization
Emulsion polymerization allowed the attainment of a high molecular weight Styrene –
Butyl acrylate copolymer. The weight average molecular weight from GPC measurements
was 344,365 and Mz of 909,459, with a PDI of 2.95. The glass transition temperature of
the polymer obtained was 4.4 (±0.3) 0C. The average copolymer composition was
ascertained from the ratios of the area under the peak at = 7 – 7.5ppm (aromatic proton
from styrene) and = 3.8-4ppm (–O–CH2 – from butylacrylate). The average molar
copolymer composition was ~43% Butyl acrylate and 57% styrene.
3.4 Membrane characterization

81
The reaction mechanisms of membrane formation for both scheme 1 and scheme 2 are
depicted in Figure 4.2(a) and 4.2(b). All membranes were evaluated for thickness, viewed
under FESEM and used for pervaporation experiments. A representative FESEM, along
with an FESEM of the porous PE support sheet, as the inset, is shown in Figure 4.2(c). The
membrane forming recipes, as described in the sections above, wet and fill the pores of the
500micron porous polyethylene support sheet while forming a dense 100 micron top layer.
The Tg of the membrane forming recipes (Fig 4.2d.), as per scheme 1, with hydroxyl
terminated PDMS reflected the Tg trends obtained with increasing ACA functionalization
of the PHMS as shown in an earlier figure (Fig 4.1d.). In scheme 2, which blended the
ACA functionalized PHMS with the high molecular weight styrene butyl acrylate polymer
followed by crosslinking the former with TEOS, the existence of a microphase segregation
between the Siloxane and SBA domains was underscored by the presence of two distinct
Tg inflexion regions. The membranes formed using scheme 2 were opaque in appearance
versus the translucent appearance of those formed using scheme 1. The membrane material
formed as per scheme 2, at the molecular level can be thought of as a semi interpenetrating
polymeric network, wherein the TEOS mediated crosslinked ACA functionalized PHMS
is interspersed and networked in between the thermoplastic chains of the SBA copolymer.
At the same time, the microphase separation means that there exist segregated domains of
the two major components in the matrix. This is schematically represented in Fig. 4.2e.
The membrane forming recipes were cast as a thin layer on clean glass slides for water
contact angle measurements. All membranes were fairly hydrophobic, with water contact
angles varying between 99.50 and 1060 (Fig. 4.3a.). There appeared to be no correlation to

82
the level of ACA functionalization of the PHMS and the ensuing water contact angle in the
membrane recipe. However, the membrane recipe SBA_90ACA, formed with 90% ACA
substituted PHMS blended with styrene-butyl acrylate emulsion polymer exhibited a
higher water contact angle than other recipes. Super-hydrophobic electrospun non-woven
fibrous mats from Block copolymers of poly (styrene-b-dimethylsiloxane) have been
shown to exhibit water contact angles up to 163°, wherein the superhydrophobicity was
attributed to a microphase separation resulting in differential surface enrichment by the
siloxanes [27]. Additionally, superhydrophobic surfaces mimicking lotus leaf properties
have been reported on cotton fibers treated with poly (butylacrylate)-modified CNT [28].
The results of water and 1,3-PD mass uptake experiments are shown in Figure 4.3b. While
there is a slight decrease in water uptake with increasing ACA functionalization of PHMS,
the 1,3-PD uptake increases rapidly with increasing ACA loading.
The results of tensile testing are shown in Figure 4.3c. For the materials made per scheme
1, ACA functionalization adversely affected the break stress and strain. The poor
mechanical integrity of these materials precluded their prolonged application in
pervaporation studies with varying process conditions. A marked enhancement in tensile
strength is obtained by blending the functionalized PHMS with the High Molecular weight
SBA copolymer (Scheme 2) and allowed for its prolonged usage in pervaporation under
varying experimental conditions. The scheme 1 membrane material using
unfunctionalized PHMS is an elastomer with a tensile break stress and a tensile break strain
of 0.54 MPa and ~640 % respectively. With the inclusion of ACA functionalized PHMS,
the stress and strain at break reduced significantly. The break stresses and strains reduce to

83
0.13MPa, 0.098MPa and 0.051MPa and 413%, 128% and 43% with 50%, 70% and 90%
functionalization of PHMS. By blending the 90% ACA substituted PHMS with SBA, the
break stress levels recovered to earlier levels at 0.68MPa and break strain increased to
760%. The stress in the phase separated SIPN material is shared by the two networks.
Even as the substituted PHMS network fails, the high molecular weight SBA matrix with
its entanglements allows the system further plastic deformation and possible stress induced
orientation to re-attain better break stress and strain levels [29].
3.5 Pervaporation results on 1,3-propanediol – water binary feed mixtures
3.5.1 The effect of amine loading in membrane
Figure 4.4 illustrates the variation of steady state component fluxes and separation factors
with increasing ACA functionalization. A decrease in steady state water flux, due to
decreasing water affinity, was seen with increasing ACA functionalization in the
membrane. The steep initial rise in the affinity of the membrane towards 1,3 PD plateaued
with increasing ACA functionalization. A slight decrease in 1,3 PD flux with greater ACA
loading may be attributed to increase of Tg and hence loss of chain flexibility impeding
the diffusion of 1,3-PD molecules.
3.5.2 Effect of process parameters: Feed Temperature, Feed Composition, Cross Flow
Velocity
The effect of process parameters was studied on the membrane structure SBA_90ACA,
which allowed for long-term experiments on account of its better mechanical integrity.
Figure 4.5a illustrates the effect of temperature on pervaporation performance. A slight

84
increase in water and 1,3-PD flux is seen with temperature. The membrane selectivity
reduces with temperature as seen from the separation factor. Increase in temperature
enhances the diffusion of both components and to some extent offsets the predominance of
the solubility of 1,3-PD over water controlling the overall permeability.
Figure 4.5a also illustrates the effect of 1,3-PD feed concentration at constant temperature
and cross flow rate. While the water flux decreased and the 1,3-PD flux increased, the
separation factor decreases with increase in the feed 1,3-PD concentration. The reduced
selectivity may be attributed to plasticization and swelling of the membrane with
increasing1,3-PD concentration in the feed which allowed for a greater amount of both
components to diffuse through and resulted in lower selectivity.
Figures 4.5b and 4.5c examine the effect of cross flow rate at three temperatures on the
flux and separation factors. The feed 1,3-PD concentration was 10g/l. Increase in the
cross flow rate increased the components fluxes as well as the separation factors. The effect
on selectivity enhancement with cross flow rate was more significant at 30 0C than it was
at 50 0C. Cross flow velocity is associated with concentration polarization. For permeating
components that are enriched, the concentration polarization assumes values <1 and for
components with high levels of enrichment it becomes the deciding factor in pervaporation
performance. In these experiments, the enrichment achieved was fair and hence the
concentration polarization and the transport coefficients of the static layer were not
decisive in determining selectivity and component fluxes.
3.6 Mass transport analysis:

85
3.6.1 Overall Mass Transfer Coefficient and Permeability:
Pervaporation mass transport in nonporous dense membranes is often described by the
solution diffusion mechanism where the diffusion is typically described by Fick’s first law
[30,31]. The driving force is the difference in activity or fugacity of the ith species given
by Equation 3.
𝑓𝑖 = 𝑥𝑖∗
𝑖𝑃𝑖
𝑠𝑎𝑡-------(3)
where f is the fugacity, 𝑥𝑖∗is the mole fraction of the ith component in the feed at the
interface, γi is the activity coefficient, 𝑃𝑖𝑠𝑎𝑡 is the saturation pressure. The flux of the solute
(ith species) across the pervaporation membrane may be expressed as follows (Equation 4):
𝐽𝑖 =𝑃𝑖
𝑙(𝑥𝑖
∗ 𝑖
𝑃𝑖𝑠𝑎𝑡 − 𝑦𝑖
∗𝑃𝑝)-------(4)
Where 𝐽𝑖 and 𝑃𝑖 are the flux and membrane permeability of the ith species, l is membrane
thickness, y is mole fraction of the vapor and 𝑃𝑝 is the total pressure at the permeate side.
The steady state flux can be expressed alternatively, as per Equation 5, in terms of
concentration in bulk solution [22, 25].
𝐽𝑖 = 𝑝𝑖,𝑜𝑣
𝑙 (𝑥𝑖 𝑖
𝑝𝑖𝑠𝑎𝑡 − 𝑦𝑖𝑃𝑝) --------(5)
where 𝑃𝑖,𝑜𝑣 is the overall permeability. The partial pressure on the permeate side, 𝑦𝑖𝑃𝑝,
upon application of vacuum, is neglected and thus the equation above becomes:
𝐽𝑖 =𝑝𝑖,𝑜𝑣
𝑙 𝑥𝑖𝑖
𝑝𝑖𝑠𝑎𝑡 = 𝐾𝑖,𝑜𝑣𝐶𝑖 ------(6)

86
where 𝐾𝑖,𝑜𝑣 is the overall mass coefficient of solute i and Ci is the molar concentration in
kg mole/m3. 𝐾𝑖,𝑜𝑣 can be expressed as 𝑃𝑖,𝑜𝑣 𝑖
𝑃𝑖𝑠𝑎𝑡
𝑙𝐶𝑇 where 𝐶𝑇is the total molar
concentration of the feed solution, and 𝐶𝑖 = 𝑥𝑖𝐶𝑇 relates the species flux to the
concentration of the respective species in the feed. Thus the component flux could be used
to compute the overall mass transfer coefficient and overall permeability of 1,3-PD.
Activity coefficients of the feed concentrations were computed by the Wilson equation and
saturation vapor pressure by the Antoine equation [30]. The 1,3-PD mass transfer
coefficients and permeability are shown in Table 1. All computed data shown is based on
experiments with a feed 1,3-PD concentration of 10 g/l. The data for the membranes shown
are those for the SBA_90ACA membrane. Data for other membranes was also generated
at a volumetric cross flow rate of 31.9L/h. The variations with temperature follow the same
pattern as reported for SBA_90CA in Table 1.
3.6.2 Boundary Layer Mass Transfer Coefficient:
Concentration polarization adversely affects the separation performance due to the build
up a liquid side boundary layer whose resistance adds to the intrinsic membrane resistance.
In severe cases, measured separation factors can be as low as 10% of the intrinsic separation
factors [32]. The mass transfer coefficient of 1,3-PD through the liquid boundary layer in
a circular cell membrane channel with two parallel plates can be obtained by the semi-
empirical correlation [33,34]
𝑆ℎ = 0.3𝑅𝑒1
2𝑆𝑐1
3------- (7)

87
Where Sh is the Sherwood number. It is equal to 𝐾1,3−𝑃𝐷,𝑙𝑑𝐻
𝐷 . This correlation is used to
compute 𝐾1,3−𝑃𝐷,𝑙, the mass transfer coefficient of 1,3-PD through the liquid layer in m/s.
The diffusivity, D (m2/s), of 1,3-PD in water was computed from the Wilke – Chang
equation [34] Re is the Reynolds number and is equal to 𝑑ℎv
, where 𝑑ℎ(m) is the
characteristic length of the membrane channel given by 2𝑊ℎ
(𝑊+ℎ), W and h being the width
and height of the channel, v is the mean linear velocity on m/s and , the kinematic viscosity
in m2/s at the respective temperature [32, 35,36]. Sc is the Schmidt number and is equal to
𝐷. The mass transfer resistance on the downstream vapor side boundary layer is negligible
and is ignored. The overall mass transfer coefficients and boundary layer mass transfer
coefficient are shown in Table 2.
3.6.3 Concentration Polarization Modulus:
Pervaporation membranes are much more permeable to dissolved organics than water and
so the edge of the boundary layer adjacent to the membrane surface becomes depleted in
the organic concentration [32]. Convective mixing is absent in this layer. Mass transfer can
be described as a combination of diffusion across concentration gradients formed in the
boundary layer and convective flow of fluid through the membrane. Assuming that no
mixing occurs in the boundary layer adjacent to the membrane, the convective flux is given
by 𝐽𝑣𝑐𝑖′ , where 𝐽𝑣 is the convective velocity towards the membrane and 𝑐𝑖
′ , the concentration
of solute in the well mixed bulk. The convective flow is counterbalanced by diffusive flow
perpendicular to the membrane surface given by the x coordinate. At steady state the two,
balancing each other out, may be expressed as
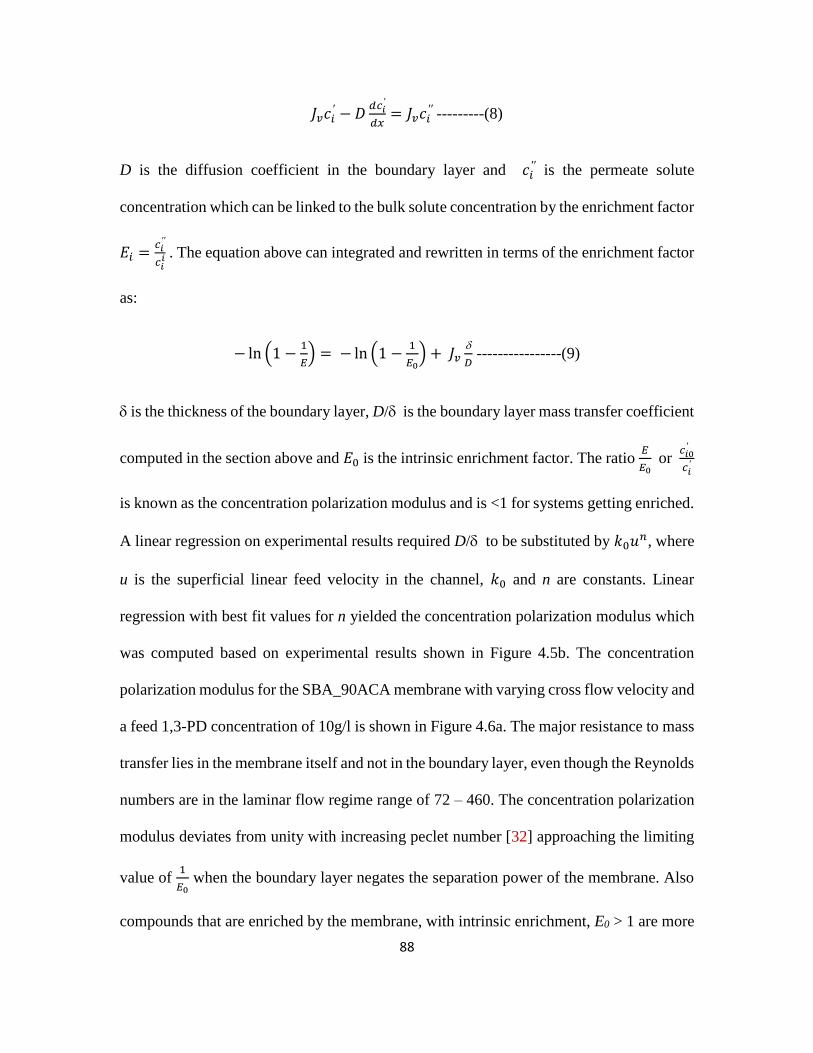
88
𝐽𝑣𝑐𝑖′ − 𝐷
𝑑𝑐𝑖′
𝑑𝑥= 𝐽𝑣𝑐𝑖
′′ ---------(8)
D is the diffusion coefficient in the boundary layer and 𝑐𝑖′′ is the permeate solute
concentration which can be linked to the bulk solute concentration by the enrichment factor
𝐸𝑖 =𝑐𝑖′′
𝑐𝑖𝑖 . The equation above can integrated and rewritten in terms of the enrichment factor
as:
− ln (1 −1
𝐸) = − ln (1 −
1
𝐸0) + 𝐽𝑣
𝐷 ----------------(9)
is the thickness of the boundary layer, D/ is the boundary layer mass transfer coefficient
computed in the section above and 𝐸0 is the intrinsic enrichment factor. The ratio 𝐸
𝐸0 or
𝑐𝑖0′
𝑐𝑖′
is known as the concentration polarization modulus and is <1 for systems getting enriched.
A linear regression on experimental results required D/ to be substituted by 𝑘0𝑢𝑛, where
u is the superficial linear feed velocity in the channel, 𝑘0 and n are constants. Linear
regression with best fit values for n yielded the concentration polarization modulus which
was computed based on experimental results shown in Figure 4.5b. The concentration
polarization modulus for the SBA_90ACA membrane with varying cross flow velocity and
a feed 1,3-PD concentration of 10g/l is shown in Figure 4.6a. The major resistance to mass
transfer lies in the membrane itself and not in the boundary layer, even though the Reynolds
numbers are in the laminar flow regime range of 72 – 460. The concentration polarization
modulus deviates from unity with increasing peclet number [32] approaching the limiting
value of 1
𝐸0 when the boundary layer negates the separation power of the membrane. Also
compounds that are enriched by the membrane, with intrinsic enrichment, E0 > 1 are more
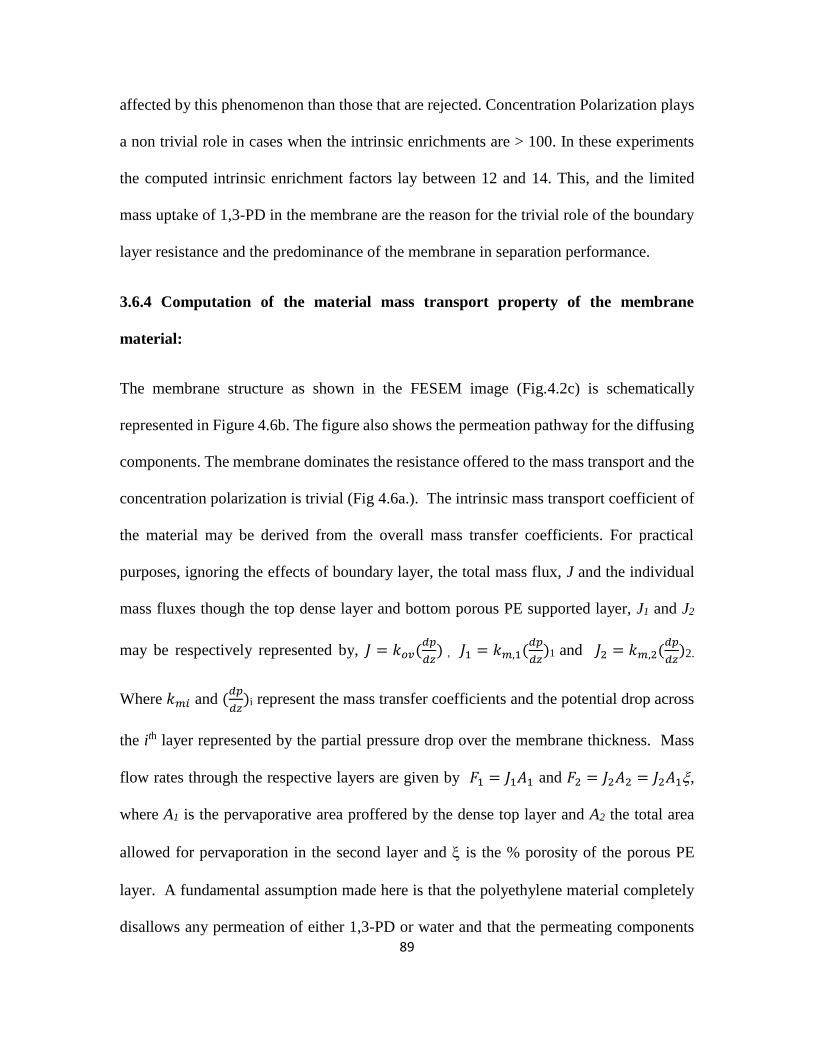
89
affected by this phenomenon than those that are rejected. Concentration Polarization plays
a non trivial role in cases when the intrinsic enrichments are > 100. In these experiments
the computed intrinsic enrichment factors lay between 12 and 14. This, and the limited
mass uptake of 1,3-PD in the membrane are the reason for the trivial role of the boundary
layer resistance and the predominance of the membrane in separation performance.
3.6.4 Computation of the material mass transport property of the membrane
material:
The membrane structure as shown in the FESEM image (Fig.4.2c) is schematically
represented in Figure 4.6b. The figure also shows the permeation pathway for the diffusing
components. The membrane dominates the resistance offered to the mass transport and the
concentration polarization is trivial (Fig 4.6a.). The intrinsic mass transport coefficient of
the material may be derived from the overall mass transfer coefficients. For practical
purposes, ignoring the effects of boundary layer, the total mass flux, J and the individual
mass fluxes though the top dense layer and bottom porous PE supported layer, J1 and J2
may be respectively represented by, 𝐽 = 𝑘𝑜𝑣(𝑑𝑝
𝑑𝑧) , 𝐽1 = 𝑘𝑚,1(
𝑑𝑝
𝑑𝑧)1 and 𝐽2 = 𝑘𝑚,2(
𝑑𝑝
𝑑𝑧)2.
Where 𝑘𝑚𝑖 and (𝑑𝑝
𝑑𝑧)i represent the mass transfer coefficients and the potential drop across
the ith layer represented by the partial pressure drop over the membrane thickness. Mass
flow rates through the respective layers are given by 𝐹1 = 𝐽1𝐴1 and 𝐹2 = 𝐽2𝐴2 = 𝐽2𝐴1,
where A1 is the pervaporative area proffered by the dense top layer and A2 the total area
allowed for pervaporation in the second layer and is the % porosity of the porous PE
layer. A fundamental assumption made here is that the polyethylene material completely
disallows any permeation of either 1,3-PD or water and that the permeating components

90
travel only through the siloxane based material that fills in the pores. Thus, 𝑘𝑚1 = 𝑘𝑚2.
At steady state, the flow rates through the two layers equal each other. F1=F2 and hence
𝐽1 = 𝐽2 and (𝑑𝑝
𝑑𝑧)1 = (
𝑑𝑝
𝑑𝑧)2. The partial pressures at the interface of layer 1 and layer 2
and at the layer 2 – downstream vapor interface can be expressed as:
𝑃1 = 𝑃0 + 𝑧1(𝑑𝑝
𝑑𝑧)1 -----------(10)
𝑃2 = 𝑃1 + (𝑧2 − 𝑧1)(𝑑𝑝
𝑑𝑧)2 = 𝑃0 + [𝑧1 +
1
(𝑧2 − 𝑧1)](
𝑑𝑝
𝑑𝑧)1.-----------(11)
Where z1 and z2 are the thicknesses of the top and bottom layers respectively and P0, P1 and
P2 represent the partial pressures of 1,3-PD at the feed side of the membrane, at the layer1-
layer2 interface and at the vapor permeate side. . These expressions can be used to yield an
expression in terms of the intrinsic mass transfer coefficient for the membrane material,
sans the porous support. Drawing from section on overall mass transfer coefficient, the
partial pressures were substituted by the experimentally determined concentrations of 1,3-
PD on the feed and permeate sides and the equation rewritten :
𝑘𝑚′ =
𝐹
𝐴1[𝐶𝑝𝑒𝑟𝑚𝑒𝑎𝑡𝑒−𝐶𝑓𝑒𝑒𝑑
𝑧1+1
(𝑧2−𝑧1)] -----------(12)
Where 𝑘𝑚′ is the representative mass transfer coefficient of the membrane material and
represents a material property. The computed material mass transfer coefficients at various
temperatures for the membrane SBA_90ACA based on experiments with a feed 1,3-PD
concentration of 10 g/l were : 1.07 X 10⁻¹¹ m2/s (30 0C), 1.22 X 10⁻¹¹ m2/s (40 0C) and 1.43
X 10-11 m2/s (50 0C).

91
3.7 Solubility Parameters
Permeation may be defined as 𝑃 = 𝐷. 𝑆 where D is the diffusion coefficient and S is the
solubility for components into the membrane from the feed. The relative enrichment of
components in a pervaporation feed occurs by virtue of their higher affinity for the
membrane material or greater diffusivity or both [37]. The membrane- component affinity
is described by the Hansen solubility parameter comprising hydrogen bonding interaction
(H), polar interaction (P) and dispersion interaction (D) [21,37]. For a binary system, the
Hansen’s solubility parameter distance Ra is a measure of the dissimilarity between two
components [38].
𝑅𝑎 = √4(𝑑1 − 𝑑2)2 + (𝑝1
− 𝑝2)2 + (𝐻1
− 𝐻2)2 -----------------(13)
The chemistry of the membrane and its interaction with permeating components affects Ra
and the separation performance [39, 40]. Water has the highest P, closely followed by
glycols, such as 1,3-PD [21]. Water also possesses the highest H also closely followed by
glycols [21]. Large differences between H for water and organic solvents makes their
pervaporative dehydration feasible and efficient [21, 40]. Additionally, the diffusive
efficacy of components through a membrane depends upon their kinetic diameter (dk)
which considers the molecular size and shape [21, 39]. Given that the dk of water is
significantly lower than that of 1,3-PD, it diffuses faster. Hence the onus of pervaporative
enrichment in favor of 1,3-PD lies on preferential sorption of 1,3-PD into the membrane
and the concomitant rejection of water [21]. The proximity of the solubility parameters of
water and 1,3-PD compounds the difficulty of separation using conventional membrane

92
materials such as PDMS and hence calls for its functionalization. The chemistry of
functionalization, while enhancing the affinity for 1,3-PD must also make the membrane
more hydrophobic and this is reflected in the partial solubility parameters.
The partial solubility parameters of water and 1,3-PD were obtained from literature [40–
42]. The H for PDMS were obtained from literature while P and D computed from the
refractive index and dipole moments respectively [41–43]. Those of ACA were computed
using a group contribution method [44], employing two kinds of characteristic groups:
first-order groups that describe the basic molecular structure of compounds and second-
order groups based on the conjugation theory to improve the accuracy of predictions. The
contribution towards H, P and D were computed from literature values provided for the
participating groups and identifiable conjugates in ACA [44]. In the absence of the
availability of reliable H, P and D group contribution for Si-O, Si-H and Si-CH3 the
partial solubility parameters for the ACA modified siloxane materials could not be
computed. TEAS parameters or fractional parameters, were computed from the partial
interaction parameters and indicate a fractional contribution of each partial parameter to
the whole solubility parameters. They are defined as
fD=D
D+H+P …………….(14)
fH=H
D+H+P …………….(15)
fP=P
D+H+P …………….(16)

93
The TEAS parameters are illustrated Fig 4.6 (c). The distance of separation between 1,3-
PD and water is similar to that between 1,3-PD and ACA. Thus 1,3-PD can be only partly
partitioned into ACA, while the hydrophobic character of ACA is underscored by its large
separation distance from water, due primarily to the disparities in H and P. While two
materials may end up with the same solubility parameters, computed arithmetically, the
individual contributions that make up this value may be different with ramifications on
their mutual affinity [45]. The behavior of unfunctionalized siloxane PDMS is dominated
by dispersion forces with very little polar and hydrogen bonding based affinity for 1,3-PD
as well as water [21]. The distances of separation from water for both ACA and siloxanes
are comparable. When the siloxane is functionalized with ACA, which is the major
component in the membrane matrix fabricated by either scheme, the affinity for 1,3-PD
increases while that for water remains practically unchanged.
Permeant transport through membranes with strong membrane-species interactions has
been visualized to occur either by random walk or by jumps from one interactive site to
another [46]. Unfunctionalized PDMS has very little affinity for either water or 1,3-PD.
When functionalized, all its interaction parameters with 1,3-PD are superior to those with
water. In light of the transport theory, the movement of 1,3-PD through the membrane may
be thought of as a random walk supported by a balance between polar interactions and
dispersion interactions with functional groups on ACA and siloxane chains. In an
alternative theory, the permeants are thought to cluster around given functional groups [32,
37]. With a binary feed, when one permeant molecule jumps from one cluster, the vacancy
left behind may be filled up by a permeant molecule of either species [46]. In this system,

94
the filling of this vacancy may be selective, pertinent to the interaction parameters allowing
for a greater absorption and permeation of 1,3-PD than water.
The classical solution diffusion model used here is valid only for non-swollen membranes.
In cases where appreciable swelling occurs, the partition and diffusion coefficients become
concentration dependent and the theory must be modified to adapt to these changes and
also to define the effect of coupled transport in multicomponent pervaporations with model
fermentation broths [37].
3.8 Comparative Performance Analysis
Table 3 provides an overview of the comparative performance of systems that have been
employed to enrich 1,3-PD from aqueous mixtures and broth compositions. This includes
earlier pervaporation experiments on zeolite membranes, which were successful in
separating 1,3-PD from broth components other than water. While the pervaporative zeolite
membranes achieved separation of 1,3-PD from other broth components, the membranes
were not selective for 1,3-PD over water [16, 17]. The ionic liquid SLM reported separation
factors greater than 100 for 1,3-PD in batch pervaporation in a nano-porous module of
~1000 µ thickness. While a stability of 9 months was claimed in this particular work [18],
SLM s typically suffer from intrinsic long term stability issues on account of leaching.
Additional limitations include fabrication of membrane modules and scale up.
Hydrolytic instability of many ionic liquids limit their applications to anhydrous conditions
[47]. The requirement for hydrolytically stable ionic liquids has resulted in several
developments, yet their technical applications are limited by the high price of the anions

95
[47]. A brief comparison of the price of materials developed in this work versus that used
for the cyanoborate ionic liquid based membrane [18] was carried out with current retail
price data from Sigma Alridch (www.signmaaldrich.com), Oakwood Chemicals Inc.
(http://www.oakwoodchemical.com) and Fluorochem Ltd.
(http://www.fluorochem.co.uk). A simple stoichiometric computation based on the
molecular weights and the prices of the individual moieties making up the compound
reveals that the cyanoborate ionic liquid costs $36,004/mole, while the ACA functionalized
PHMS materials cost $1133/mol, $892/mol and $655/mol for the 90%, 70% and 50%
functionalized materials, respectively. The cost per unit weight of the ionic liquid is $120/g,
while those of the ACA functionalized siloxanes are $6/g, $5.6/g and $4.9/g for 90%, 70%
and 50%, respectively. Price/performance trade off estimates can be generated using either
the molar prices or the mass prices in terms of the separation factors. The 1,3-PD flux
obtained in this work is also 1.5 times higher than that reported with the cyanoborate ionic
liquid.
A preliminary estimation was made of the total volume of membrane material required to
enrich a flow of 100g/h of feed with 1 mass% 1,3-PD to a final 1,3-PD concentration of
>90%. The separation factor and flux of 1,3-PD was assumed constant in each enrichment
stage. This assumption is an oversimplification but quite adequate for a rough comparison.
The average separation factor for the SBA_90ACA membrane was taken as 14 at an
average 1,3-PD flux of 5.89 g/m2h. The computation indicated that 3 enrichment steps with
a total membrane area of 4650cm2 are required. The membrane volume was estimated by
taking into consideration that the 550m thick porous polyethylene support has a porosity

96
of 48% and the dense layer thickness is 100 m. Thus, the required volume is 169cm3.
Also assuming an approximate density of 1g/cm3, the cost of the material required to
achieve the aforementioned enrichment level is ~$1015.
The same computation was carried out for the cyanoborate ionic liquid membrane
stabilized in a nanoporous ceramic module. The flux of 1,3-PD (3.86 g/m2h) and separation
factor (177) reported [18] were assumed constant for the computation. The same
enrichment levels from a starting composition of 1% 1,3-PD was calculated to require 2
enrichment steps with a total area of 4660cm2. The thickness of the module reported in
their work [48] is 3 mm (with a 7mm inner diameter and 10 mm outer diameter). The
nanoporous module reported in their work has a porosity of 30% [18, 48]. Thus, the total
cyanoborate ionic liquid requirement is 419 cm3. Assuming a density of 1g/cm3, the cost
of material required to achieve the same enrichment level is ~$50,328.
The work reported here reacts a 1,3-PD solvent, ACA, into a Siloxane backbone. The
membrane, with its mechanical integrity, allows the flexibility of fabrication into structures
and modules. While fair separation was achieved for the structure reported in this paper,
the structure provides a pathway for scale up with design flexibility to optimize the
cost/performance tradeoff. Membrane structures can be envisioned wherein a thin surface
layer of highly ACA functionalized membrane is followed by support layers with enhanced
flux while making no adverse contribution towards the separation efficacy.
97
4. Conclusions
The paper reports an ACA functionalized siloxane membrane for the pervaporative
enrichment of 1,3-PD concentration from binary aqueous. The functionalized siloxane
materials were crosslinked by two mechanisms with superior mechanical stability being
obtained with the phase separated blend. The separation factors increased with increasing
functionalization. The feed concentration and temperature also played an important role in
determining separation efficacy. A minimal amount of concentration polarization was
observed as is the norm for such systems with fair separation factors, with the resistance to
permeation being dominated by the membrane. The solution diffusion model was used to
compute the overall mass transfer coefficient of the membrane and the intrinsic mass
transfer of the functionalized material. An analysis of the Hansen’s solubility parameters
was carried out to explain the results obtained.
5. Acknowledgements
The authors acknowledge the advice of Prof. M.T. Shaw, (Professor Emeritus, University
of Connecticut) in thermodynamic computations. Portions of this work were supported by
DOE Grant DE-EE0003116.
6. References
1. A.J. Ragauskas, C.K. Williams, B.H. Davison, G. Britovsek, J. Cairney, C.A.
Eckert, W.J. Frederick Jr., J.P. Hallett, D.J. Leak, C.L. Liotta, J.R. Mielenz, R.
Murphy, R. Templer, T. Tschaplinski, The path forward for biofuels and
biomaterial, Science. 311 (2010) 484–489.

98
2. Z.L. Xiu, A.P.Zeng, Present state and perspective of downstream processing of
biologically produced 1,3-propanediol and 2,3-butanediol, Appl Microbiol
Biotechnol. 78 (2008) 917–926.
3. R.K. Saxena, P. Anand, S. Saran, J. Isar, Microbial production of 1,3-propanediol:
Recent developments and emerging opportunities, Biotechnology Advances. 27
(2009) 895–913.
4. A.P. Zeng, H. Biebl, Bulk chemicals from biotechnology: the case of 1,3-
propanediol production and the new trends, in: T. Scheper, K. Schugerl, A.P. Zeng
(Eds.), Advances in biochemical engineering and biotechnology, Vol. 74, Springer-
Verlag, Berlin, Heidelberg, New York, 2002, pp239–59.
5. A. Triguero, R. Blanco, H. Machado, M. Rodríguez, Evaluation of liquid extraction
potentials for downstream separation of 1,3-propanediol, Biotechnology
Techniques. 13 (1999) 127–130.
6. T.T. Ames, Process for the isolation of 1,3-propanediol from fermentation broth. US
Patent 6361983 B1 (2002).
7. Y. Gong, Y. Tong, X.L. Wang, D.H. Liu, The possibility of the desalination of actual
1,3-propanediol fermentation broth by electrodialysis, Desalination. 161 (2004)
169–178.
8. J. Hao, D.H. Liu, Desalination of fermented broth containing 1,3-propanediol by
electrodialysis, Chinese J Proc Eng. 5 (2005) 36–39.
9. Z. Li, B. Jiang, D. Zhang, Z. Xiu, Aqueous two-phase extraction of 1,3-propanediol
from glycerol-based fermentation broths, Separation and Purification Technology.
66 (2009) 472–478.
99
10. A. Baiada, A. Vitner, R.P. Jansen, A.M. Baniel, Process for producing 1, 3-
propanediol. US Patent 7056439 B2 (2006).
11. A.K. Hilaly, T.P. Binder, Method of recovering 1,3-propanediol from fermentation
broth. US Patent 6479716 B2 (2002)
12. M.H. Cho, S.I. Joen, S.H. Pyo, S. Mun, J.H. Kim, A novel separation and
purification process for 1,3-propanediol, Process Biochem. 41 (2006) 739–744.
13. P. Anand, R.K. Saxena, R.G. Marwah, A novel downstream process for 1,3-
propanediol from glycerol-based fermentation, Appl. Microbiol. Biotechnol. 90
(2011) 1267–1276.
14. J. Hao, F. Xu, H. Liu, D. Liu, Downstream processing of 1,3-propanediol
fermentation broth, Journal of Chemical Technology and Biotechnology.81(2006)
102–108.
15. J.J. Malinowski, Reactive Extraction for Downstream Separation of 1,3-
Propanediol, Biotechnology Progress. 16 (2000) 76–79.
16. S. Li, V.A. Tuan, J.L. Falconer, R.D, Noble, Separation of 1,3- propanediol from
glycerol and glucose using a ZSM-5 zeolite membrane, J. Membr Sci. 191 (2001a)
53–59.
17. S. Li, V.A. Tuan, J.L. Falconer, R.D. Noble, Separation of 1,3- propanediol from
aqueous solutions using pervaporation through an X-type zeolite membrane, Ind
Eng Chem Res 40 (2001b) 1952– 1959.
18. P.Izák, M. Köckerling, U. Kragl, Stability and selectivity of a multiphase membrane,
consisting of dimethylpolysiloxane on an ionic liquid, used in the separation of
solutes from aqueous mixtures by pervaporation, Green Chem. 8 (2006) 947–948.

100
19. S.Y. Li, R. Srivastava, R.S. Parnas, Study of in situ 1-Butanol Pervaporation from
A-B-E Fermentation Using a PDMS Composite Membrane: Validity of Solution-
Diffusion Model for Pervaporative A-B-E Fermentation, Biotechnol. Prog. 27
(2011) 111–120.
20. S. Krishnan, C.J. Weinman, C.K. Ober, Advances in polymers for anti-fouling
surfaces, J. Mater.Chem. 18 (2008) 3405 – 3413.
21. P. Shao, R.Y.M. Huang, Polymeric membrane pervaporation, Journal of Membrane
Science. 287 (2007) 162-179.
22. S. Li, R. Srivastava, R.S. Parnas, Separation of 1-butanol by pervaporation using a
novel tri-layer PDMS composite membrane, J. Membr. Sci. 363 (2010) 287–294.
23. P.Wu, R.W.Field, R.England, B.J.Brisdon, Performance of PDMS and
organofunctionalised PDMS membranes for the pervaporative recovery of organics
from aqueous streams, J. Membr. Sci. 137 (1997) 63–88.
24. P.Wu, R.W.Field, R.Englanda, B.J. Brisdon, A fundamental study of
organofunctionalised PDMS membranes for the pervaporative recovery of phenolic
compounds from aqueous streams, J. Membr. Sci. 190 (2001) 147–157.
25. P. Wu, B.J. Brisdon, R. England, R.W. Field, Preparation of modified difunctional
PDMS membranes and a comparative evaluation of their performance for the
pervaporative recovery of p-cresol from aqueous solution, J. Membr. Sci. 206
(2002) 265–275.
26. C.B. Mallon, B.Mead, Surfactant free process for production of pressure sensitive
adhesive latexes. US Patent 4316830 (1982).

101
27. M. Ma, R.M. Hill, J.L. Lowery, S.V. Fridrikh, G.C. Rutledge, Electrospun
Poly(Styrene-block-dimethylsiloxane) Block Copolymer Fibers Exhibiting
Superhydrophobicity, Langmuir. 21 (2005) 5549–5554.
28. P. Roach, N.J. Shirtcliffe, M.I. Newton, Progress in superhydrophobic surface
development, Soft Matter. 4 (2008) 224–240.
29. J. Sun, X. Zhao, W. R. K. Illeperuma, O. Chaudhuri, K.H.Oh, D.J. Mooney, J.J.
Vlassak, Z. Suo, Highly stretchable and tough hydrogels, Nature. 489 (2012) 133–
136.
30. J.G. Wijmans, R.W.Baker, The solution Diffusion model: a review, J. Membr.Sci.
107 (1995) 1–21.
31. S.J. Lue, W.W. Chen, S.Y. Wu, L.D. Wang, Vapor permeation modeling of
multicomponent systems using a poly(dimethylsiloxane) membrane, J. Membr. Sci.
311 (2008) 380–389.
32. R.W. Baker, J.G. Wijmans, A.L. Athayde, R. Daniels, J.H. Ly. M. Le, The effect of
concentration polarization on the separation of volatile organic compounds from
water by pervaporation, J. Membr. Sci. 137 (1997) 159–172.
33. C. Lipski, P. Côté, The use of pervaporation for the removal of organic contaminants
from water, Environmental Progress. 9 (1990) 254–261.
34. C.R. Wilke, P. Chang, Correlation of diffusion coefficients in dilute solutions
AICHE Journal. 1, (1955) 264–270.
35. M.T. Sanz, B. Blanco, S. Beltran, J.I. Cabezas, Vapor liquid equilibria of binary and
ternary systems with water, 1,3-propanediol and glycerol, J Chem Eng Data. 46
(2001) 635–639.

102
36. D.M. Bajić, G.R. I.Zoran, P. Visak, E.M. Živković, S.P. Šerbanović, M.L.
Kijevčanin. Densities, viscosities, and refractive indices of the binary systems
(PEG200 + 1,2-propanediol, +1,3-propanediol) and (PEG400 + 1,2-propanediol,
+1,3-propanediol) at (288.15 to 333.15) K and atmospheric pressure: Measurements
and modeling, J. Chem Thermodynamics. 57 (2013) 510–529.
37. M. Mulder, T. Franken, C.A. Smolders, Preferential sorption versus preferential
permeability in pervaporation, J. Membr. Sci. 22 (1985) 155–173.
38. D.J. Benedict, S.J. Parulekar, S.P. Tsai, Pervaporation assisted esterification of lactic
and succinic acids with downstream ester recovery, J. Membr. Sci. 281 (2006) 435–
445.
39. W.J.Koros, Membranes: Learning a lesson from nature, Chem Eng. Prog. 91 (1995)
68–81.
40. C.M. Hansen, Hansen solubility parameter: A users handbook, second ed., CRC
press Taylor and Francis group, Boca Raton, London, New York, 2007.
41. M. Alizadeh, F. Abbassi, M. Farahi, K. Jalili, Silicone based hydrogels prepared by
interpenetrating polymeric network synthesis: Swelling properties and confinements
effects on the formation kinetics, J appl Poly Sci. 124 (2012) 985–992.
42. J.N. Lee, C. Park, G.M. Whitesides, Solvent Compatibility of
Poly(dimethylsiloxane)-Based Microfluidic Devices, Anal Chem. 75 (2003) 6544–
6554.
43. N.A.Diachun, A.H. Marcus, D.M. Hussey, M.D.Fayer, Dynamics in
Polydimethylsiloxane: The Effect of Solute Polarity, JACS. 116 (1994) 1027–1032.
103
44. E. Stefanis. C. Panayiotou, Prediction of Hansen Solubility Parameters with a New
Group-Contribution Method, Int J. Thermophys. 29 (2008) 568–585.
45. M. Oshikawa, N. Ogata, T. Shimidzu, Polymer membrane as a reaction field. III:
Effect of membranes polarity on selective separation of water-ethanol binary
mixtures through synthetic polymer membranes, J. Membr. Sci. 26 (1986) 107–113.
46. R.Y.M. Huang, P. Shao, X. Feng, C.M. Burns, Pervaporation separation of water /
isopropanol mixture using sulfonated poly(ether ether ketone) (SPEEK)
membranes: transport mechanism and separation performance, J. Membr. Sci. 192
(2001) 115–127.
47. E. Kuhlman, S. Himmler, H. Giebelhaus, P. Wasserscheid, Imidazolium
dialkylphosphates – a class of versatile, halogen-free and hydrolytically stable ionic
liquids, Green Chem. 9 (2007) 233 – 242.
48. P. Izak, M. Köckerling, U. Kragl, Mehrphasen–Membran. German Patent
DE102006024397 B3 (2007).

104
Figure 4.1: (a) Hydrosilylation Reaction Scheme (b) Representative H1 NMR for
hydrosilylation (c) Representative FTIR for hydrosilylation (d) Glass transition
temperature at various levels of functionalization (e) Molecular weight at various levels
of functionalization
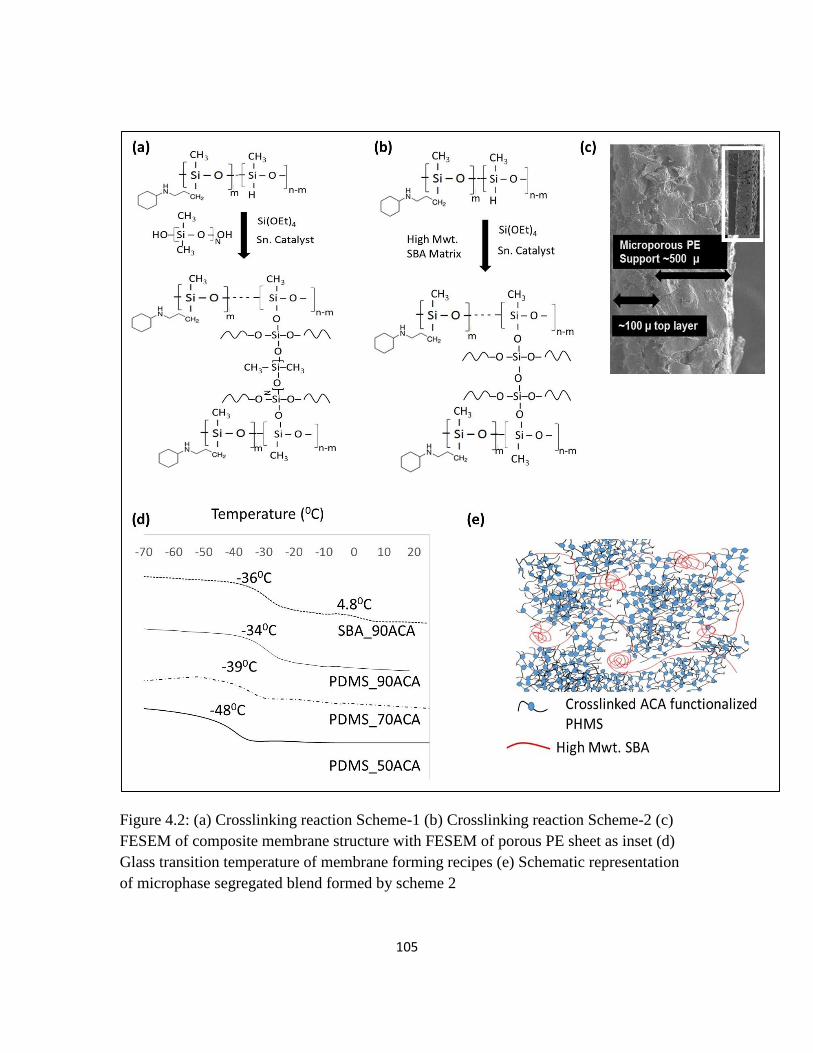
105
Figure 4.2: (a) Crosslinking reaction Scheme-1 (b) Crosslinking reaction Scheme-2 (c)
FESEM of composite membrane structure with FESEM of porous PE sheet as inset (d)
Glass transition temperature of membrane forming recipes (e) Schematic representation
of microphase segregated blend formed by scheme 2
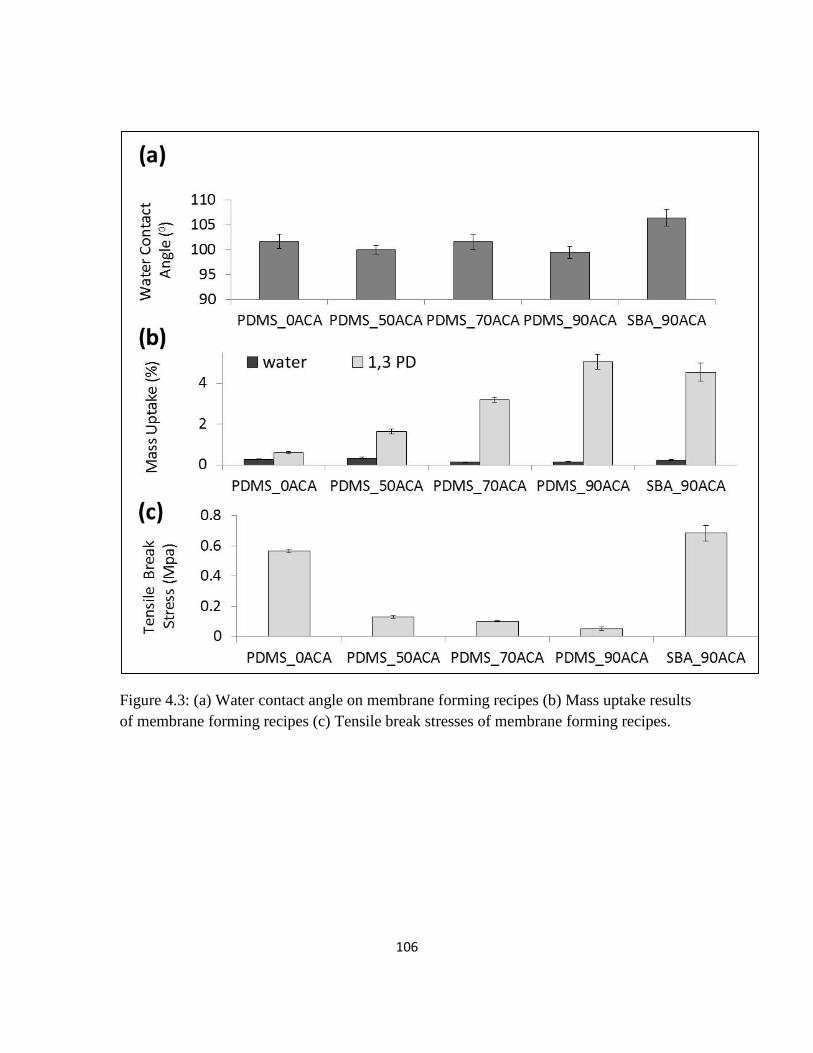
106
Figure 4.3: (a) Water contact angle on membrane forming recipes (b) Mass uptake results
of membrane forming recipes (c) Tensile break stresses of membrane forming recipes.

107
Figure 4.4: Variation of steady state component flux and separation factors with
increasing ACA functionalization (a) Water Flux (b) 1,3-PD flux (c) Separation Factor

108
Figure 4.5: (a) Effect of feed 1,3-PD concentration and Feed Temperature (b) Effect of
cross flow rate on water flux (c) Effect of cross flow rate on 1,3-PD flux and separation
factors.

109
Figure 4.6: (a) Variation of Concentration Polarization modulus with cross flow rate and
temperature at feed 1,3-PD concentration of 10g/l (b) Schematic of composite membrane
structure showing the three layers. Permeation pathway is shown with red arrows and red
dotted line (c) TEAS graph of the percentage contribution by the partial solubility
parameters for each component.

110
Table 4.1: 1,3 propanediol Mass Transfer Coefficient and Permeability at various
temperatures for SBA_90ACA membrane
Cross Flow,
L/h 10 16.3 31.9 54.5
Reynolds
number 72 121 273 460
Temperature
(C)
Kov Pov Kov Pov Kov Pov Kov Pov
X10-7,
m/s
X10-14, X10-7,
m/s
X10-14, X10-7,
m/s
X10-14, X10-7,
m/s
X10-14,
kmol/m/Pa/s kmol/m/Pa/s kmol/m/Pa/s kmol/m/Pa/s
30 1.01 2.19 1.1 2.38 1.29 2.82 1.32 2.87
40 1.18 2.55 1.25 2.72 1.31 2.9 1.4 3.03
50 1.16 2.53 1.26 2.74 1.34 2.91 1.37 2.97
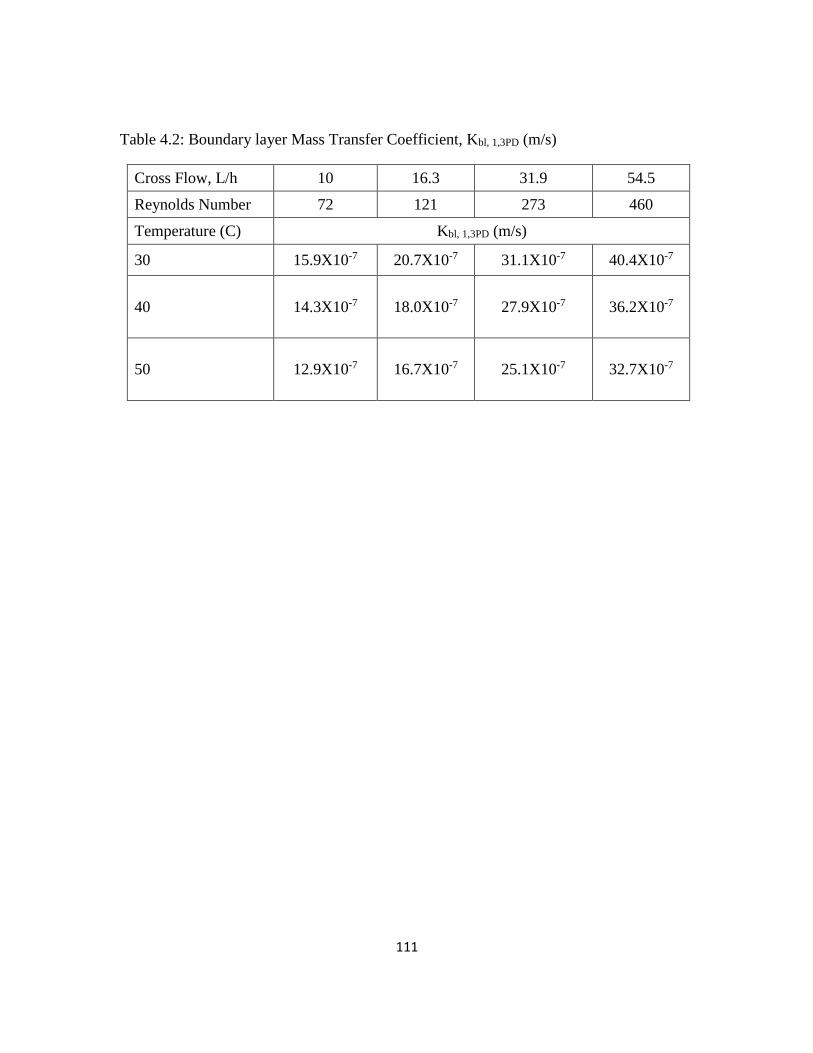
111
Table 4.2: Boundary layer Mass Transfer Coefficient, Kbl, 1,3PD (m/s)
Cross Flow, L/h 10 16.3 31.9 54.5
Reynolds Number 72 121 273 460
Temperature (C) Kbl, 1,3PD (m/s)
30 15.9X10⁻⁷ 20.7X10⁻⁷ 31.1X10⁻⁷ 40.4X10⁻⁷
40 14.3X10⁻⁷ 18.0X10⁻⁷ 27.9X10⁻⁷ 36.2X10⁻⁷
50 12.9X10⁻⁷ 16.7X10⁻⁷ 25.1X10⁻⁷ 32.7X10⁻⁷

112
Table 4.3: Comparison of works on 1,3 propanediol separation and enrichment from
dilute aqueous mixtures
Process Remarks References
Distillation,
Electrodialysis
High Energy Consumption
Low Yield
6 - 8
Chromatography High Purity final product free from other fermentation products
and broth components except water
Very dilute 1,3-PD concentration in final product
11 – 13
Solvent Extraction Limited partitioning due to highly hydrophilic character of 1,3-PD 5, 9, 10
Reactive Extraction Complicated process, multiple unit operations required
Possible side reactions
Low Yield
14, 15
Pervaporation-
Zeolite membranes
Membrane non selective towards 1,3-PD w.r.t water 16, 17
Pervaporation –
Supported ionic
liquid membrane
High separation factor in batch pervaporation
Limitation of scale up and continuous operation
Ionic liquid is expensive
Possible membrane instability over long term
18
Pervaporation –
ACA
Functionalized
Polysiloxane
Fair separation factors and flux with Continuous pervaporation
Scale up possible
Membrane offers flexibility for tailoring intrinsic membrane
properties and membrane module design
Mechanical Integrity
Superior cost – performance trade off
This work
113
Chapter 5. Poly(3-((3-(cyclohexylamino)propyl)thio)propyl methacrylate Based
Membranes for Improved Pervaporative 1,3-Propanediol Enrichment From
Aqueous Mixtures*
Abstract
Towards improving the pervaporation performance of 1,3-propanediol-water mixtures
and providing inexpensive polymeric membrane materials, and taking advantage of the
affinity of cyclohexyl amine towards 1,3-PD, a novel methacrylate monomer was
synthesized by the thiol-ene coupling of allylcyclohexyl amine with mercaptoethanol
followed by the esterification with methacryloyl chloride. Plug membranes based on such
homo and random copolymers with butyl acrylate and divinyl benzene exhibited high
separation factors (65 - 80) and fair (2.3 and 3.4 g/m2h) 1,3-PD fluxes. The butyl acrylate
copolymers gave the highest separation factors with a slight reduction in component fluxes.
Increase in temperature and 1,3-propanediol feed concentrations caused a reduction in
separation factors. Hansens solubility parameters were computed based on group
contribution method to underscore the balance between water and 1,3-propanediol affinity.
The integration of a hydrophobic solvent into a polymeric structure with good cost –
performance trade off makes this an attractive candidate for possible industrial applications
in multilayer modules.
Keywords: Allylcyclohexylamine, thiol-ene click, pervaporation, 1,3-propanediol

114
* Poly(3-((3-(cyclohexylamino)propyl)thio)propyl methacrylate Based Membranes for
Improved Pervaporative 1,3-Propanediol Enrichment From Aqueous Mixtures, B. Kanjilal,
I.Noshadi, J. R. McCutcheon, A.D. Asandei, R. S. Parnas, Polymer (Submitted)

115
1. Introduction
The primary process bottleneck for the production of hydrophilic organic molecules by
fermentation is the downstream concentration enrichment of the product [1]. For highly
hydrophilic molecules such as 1,3-propanediol (1,3-PD), the difficulty lies not so much in
its separation from other fermentation products as it does in separating it from water [2].
The main factors are thermodynamic, and lie in the proximity of the 1,3-PD solubility
parameter with that of water [3]. Additionally, given the smaller molar volume and kinetic
diameter of water, the diffusivity of 1,3-PD is sluggish under comparable conditions [3,4].
The highly hydrophilic character of 1,3-PD also limits the applicability and efficacy of
solvent extraction [2]. Other processes employed for separation include evaporation,
chromatography and reactive extraction with concomitant high-energy usage and process
complications [5-17]. Pervaporation is an energetically advantageous process [3].
However, 1,3-PD cannot be enriched by materials conventionally used for pervaporation,
such as siloxane polymers. Thus, the development of novel materials with a good
cost/performance balance is central to the establishment of industrial separation procedures
for 1,3-PD enrichment from fermentation broths. The removal of this process bottleneck
may increase the feasibility of using waste industrial glycerol as a sustainable resource for
producing 1,3-PD as a biorenewable alternative to a petroleum platform.
Although separation processes that include phase changes are typically energy
intensive, pervaporation can be energy efficient as it removes only the minor components
[3]. Additionally, the membrane chemistry and structure may be tailored for affinity
towards and selective enrichment of the minor components [3]. Zeolite membranes have

116
been used for pervaporative separation of 1,3-PD from other minor fermentation products,
but the membranes were also selective towards water [15, 16]. A supported liquid
membrane based on cyanoborate ionic liquid has been reported with high separation factors
and moderate 1,3-PD flux [17]. However, supported liquid membranes suffer from
stability issues and difficulty in scale-up, in addition to high cost associated with
hydrolytically stable ionic liquids [18]. For membrane processes, the development of new
polymers is constrained by the necessity of using them in an engineered module suitable
for sustainable industrial application with adequate cost/ performance balance.
This paper presents the synthesis of a novel acrylate monomer (3-((3-
(cyclohexylamine)propyl)thio)propyl methacrylate) containing a cyclohexylamine
fragment, derived from allylcyclohexylamine (ACA), The membrane prepared from the
resulting polymer is used in the pervaporative separation of 1,3-PD from water. The choice
of ACA was prompted by its balance of hydrophobic character and its high affinity for 1,3-
PD. While the partitioning of 1,3-PD into ACA is not high enough for solvent extraction
[2], its incorporation into a polymerized structure was shown to successfully separate 1,3-
PD from water with high selectivity. Conversely, while the allyl functionality allows for a
wide variety of reactions, radical homopolymerization of the allyl group does not occur
[19].
The conversion of ACA into an acrylate monomer via a thiol-ene click chemistry
route was explored to enable simple radical chemistry and copolymerization with
conventional vinyl and acrylate monomers. A straightforward and economical route to a
polymer with high separation factor for 1,3-PD enrichment from dilute aqueous solutions
was developed. The ACA-based acrylate monomer was homopolymerized and
117
copolymerized with butyl acrylate and divinyl benzene. The monomer and polymers were
synthesized and characterized. The polymers were fabricated into supported plug
membranes and used for batch pervaporation and enrichment of 1,3-propanediol from
binary aqueous mixtures at various temperatures and feed 1,3-PD concentrations. The
polymers demonstrate separation factors in the range 65 to 80. The 1,3-PD fluxes vary
between 1.9 g/m2h to 3.4 g/m2h, while the water fluxes range between 3.5 g/m2h to 5g/m2h.
While cyanoborate based ionic liquid membranes in a TiO2 ceramic nanofiltration module
reported high separation factors [17], ionic liquids are quite expensive. The polymers
developed in this work achieved good cost/performance trade-off, in addition to the ability
to be fabricated into modules for commercial scale-up. As a comparison, tetrapropyl
ammonium cyanoborate ionic liquid [17] costs $36,004/mole, while the methacrylate
monomer developed in this work costs $1,326/mol. Additional details about cost
comparison for 1,3-PD separation are provided in the discussion.
2. Experimental
2.1 Materials
For the synthetic scheme involving monomer preparation and polymerization, all
chemicals were purchased from Sigma Aldrich. Allylcyclohexyl amine (ACA) was dried
prior to use. Mercaptoethanol and Triethyl amine were used without modification. The
solvents Toluene, Chloroform, Dioxane and Hexane were dried prior to use. Methacryloyl
chloride, Divinyl benzene (DVB) and Butyl acrylate monomer (BuA) were dried prior to
use. Azobisisobutyronitrile (AIBN) radical initiator was used without modification.

118
For the fabrication of the plug membranes, 0.65 cm inner diameter glass pipettes from
Fischer were used. Cotton wool was used to act as the porous support base and was
purchased from the local market.
1,3 propanediol (1,3-PD), 98% purity was purchased from Sigma Aldrich and used for
the partition coefficient and preparation of binary mixtures with distilled water as feed
solutions for pervaporation experiments.
2.2 Analytical Methods
NMR spectroscopy was carried out on a Brucker DMX-500 MHz and Brucker Ascend
400 WB spectrometers. IR spectra were taken on samples with a Nicolet Magna-IR 560
spectrometer, with KBr powder being used as background. The molecular weight of the
polymer samples were determined by GPC in an Agilent 1260 Infinity system using N,N-
Dimethylacetamide as eluent and narrow molecular weight PMMA from Sigma Aldrich as
calibration standard. For Thermo-gravimetric analysis (TGA), a TA Instruments Hi-Res
2950 TGA instrument was used. A temperature ramp of 20C/min in nitrogen up to a
temperature of 800C was employed. Differential Scanning Calorimetry was carried out in
TA Instruments Q100. Contact angle was measured on an Olympus TGHM goniometer.
Field Emission scanning electron microscopy (FESEM) images of the membrane structure
were obtained with a JEOL 6335F field emission scanning electron microscope. The feed
and permeate compositions from the pervaporation experiments were analyzed using
0.22μm syringe filtered samples by gas chromatography (GC) using a DB-FFAP capillary

119
column and an MS detector and a 1μL injection volume. GC injector, detector and initial
oven temperatures were 240C, 270C, and 40C, respectively.
2.3 Partition Coefficient Measurement
The partition coefficient of 1,3-PD between water and ACA was determined at
30°C. 1 ml of a 10 g/l 1,3-PD solution was mixed in a vortex mixer with 1ml of ACA for
15 minutes and the layers allowed to separate. The concentration of 1,3-PD, in the aqueous
phase, determined by GC, before and after partition, was used to compute the partition
coefficient based on equation 1:
𝐾𝑝 =𝐶𝐴𝐶𝐴
𝐶𝑤𝑎𝑡𝑒𝑟 (1)
2.4 Synthesis, purification and characterization of 3-((3-
(cyclohexylamino)propyl)thio)propyl methacrylate (CHAPTPMA) monomer
The monomer synthesis scheme is depicted in Figure 5.1. The thiol-ene click
chemistry adduct was synthesized by AIBN mediated addition of mercaptoethanol to the
allyl double bond of the ACA [20]. The reaction was carried out in a pressure tube, in bulk,
and in the presence of UV light at 60°C. The pressure tube was degassed with dry Ar in a
Schlenk line and the reactants were kept under argon [20]. The reactants were weighed out
in nearly stoichiometric amount, with the ACA being in slight excess. The progress of the
reaction was checked after 24 hours by 1H NMR. The product was purified by vacuum
removal of the excess ACA, which is the lower boiling component. The purified click

120
adduct was characterized by FTIR and NMR, and its vaporization temperature was
estimated by TGA.
The click adduct was esterified using methacryloyl chloride and triethyl amine as
the catalyst to form the methacrylate monomer [21]. The click adduct was dissolved in dry
toluene and a stoichiometric amount of methacryloyl chloride and triethylamine were
added, and the mixture was refluxed at 70°C for 12 hours [21]. The toluene was evaporated
off from the system at 40°C overnight. The resultant mixture of the methacrylate monomer
and triethyamine hydrochloride was added to hexane. The triethyamine hydrochloride
being hexane insoluble separated, and the supernatant fluid containing the methacrylate
monomer was filtered and the hexane evaporated overnight in a vacuum oven at 40 °C.
The final purified methacrylate monomer product was characterized by 1H NMR and FTIR
and TGA. The NMR spectra for the monomer synthesis are shown in Figure 5.2(a) – (c) .
The FTIR and TGA results are shown in Figure 5.3 (a) and 3 (b).
2.5 Synthesis and characterization of polymers
The homopolymerization of CHAPTPMA and its copolymerizations with 5 mol% BuA or
5mol% DVB were initiated by AIBN in dioxane at 70 °C in a 250 ml two necked round
bottom flask fitted with a reflux condenser with the system being constantly purged with
nitrogen. The resultant polymers are referred to below as P(Acryl), P(Acryl)_BuA and
P(Acryl)_DVB, respectively. Prior to polymerization, the dioxane solutions of the
monomer(s) were passed through an inhibitor removal column For a typical run, a 25 mL
dioxane batch contained ~5 g of the methacrylate monomer. The stoichiometric molar ratio

121
of the methacrylate monomer to AIBN was kept at 100:1 in all batches. A silicone rubber
tube fitted with a needle was used to blanket the surface of the reaction mixture with
nitrogen throughout the 4-hour course of each polymerization. At the end of each
polymerization, a portion of the batch was dried by evaporation at 100 °C and then further
dried to constant weight at 80 °C under vacuum. The thermal transitions of the solid
polymers were estimated by DSC. The reaction mixtures were used to cast films of the
polymers and copolymers on clean glass substrates for evaluation of the contact angle
[22,23]. Films were similarly cast on a Kapton surface and peeled off for evaluation of
solvent uptake [22, 23]. The NMR spectra of the polymers are shown in Figure 5.4(a)-(c).
The results for water and 1,3-PD contact angles, mass uptake and DSC thermal transitions
are shown in Figure 5.5 (a), (b) and (c). The non-crosslinked polymers (i.e. those not
employing DVB in their composition) were evaluated by GPC.
2.6 Membrane fabrication
Plug membranes were fabricated inside 0.6 cm inner diameter glass pipettes. The
glass pipettes were weighed and stuffed with a known weight of dry cotton wool. A small,
but known weight of dry cotton wool was soaked with the polymer solution and the solvent
allowed to evaporate slowly at 40 °C over a period of 3-4 days. When the solvent had
nearly all evaporated, the polymer solution soaked cotton wool was lightly pressed with a
flat surface to set the membrane on top of the cotton wool base inside the glass pipettes,
and the weight of the plug noted. The solvent was allowed to further evaporate over a
period of 1 week at room temperature till the plug attained a constant weight. The slow
solvent evaporation was carried out to prevent the formation of pinholes and to allow the
plug membrane to adhere to the inner wall of the glass pipettes. This process gave rise to a
122
fiber supported membrane structure. The volume inside the glass pipette above the
membrane was used to hold ~1.5-1.7 ml of pervaporation feed solution. Plug membrane
structures are schematically depicted in Figure 5.6(a) along with a picture of the actual
membrane plug in Figure 5.6(b). Figure 5.6(c) is an FESEM image of the membrane.
2.7 Pervaporation experiments
Batch Pervaporation experiments were carried out on the fabricated plug membranes. The
plug membrane structures were affixed in an upright position in a water bath maintained at
30 °C, 40 °C or 50 °C. The membranes were monitored for leakage by checking for
abnormally high flux. The plug membranes had a pervaporation area of 4.91 mm2. Each
batch pervaporation experiment was allowed to run for a period of 20 hours. The permeate
was collected in a cold trap, cooled in a dry ice – acetone bath. A vacuum pump was
employed to maintain the permeate side pressure at less than 1 mm Hg. The permeate
collected was weighed and analyzed for 1,3-PD concentration by GC [24]. The key
performance indicators of the pervaporation experiment were defined by the component
fluxes and the separation factor defined as:
=𝐽𝑝
𝐽𝑤.
𝑥𝑤
𝑥𝑝 (2)
Where Jp and Jw represent the 1,3-PD and water fluxes and xp an xw represent the initial
feed mass fractions of 1,3-PD and water, respectively [24]. The respective fluxes of water
and 1,3-PD and the separation factor of 1,3-PD over water were computed. Batch
pervaporation experiments do not achieve a true steady state. In these experiments the total

123
permeation of water and 1,3-PD changed the feed composition by less than 5% over the
course of the entire pervaporation experiment.
3. Results and discussion
3.1 Partition Coefficient in Amine
The partition coefficient of 1,3-PD between ACA and water was estimated at 0.5±0.03
from 3 independent experiments. Allylcyclohexylamine is a hydrophobic solvent, with a
Log Pow (Octanol – water redistribution coefficient) ~ 2.2 – 2.4, in which 1,3-PD is miscible
in all proportions.
3.2 Synthesis, purification and characterization of monomer
The scheme for methacrylate monomer synthesis is shown in Figure 5.1. Thiol-ene
click chemistry was employed to react ACA with mercaptoethanol [20]. Figure 5.2(a)-(c)
shows NMR spectra to illustrate the monomer synthesis. The allyl protons labeled 1, 1’
and 2 in the ACA NMR appear at roughly of 5 and 6 ppm as seen in Fig 5.2(a).
In the NMR of the thiol-ene click adduct there is a significant reduction of the allyl proton
signal due to the reaction between ACA and mercaptoethanol (Fig 5.2(b)). In these
experiments, a slight excess of ACA was used, which is the reason residual allyl proton
signal is still seen in the thiol-ene click adduct NMR. The hydroxyl proton is labeled ‘a’ in
the thio-ene click adduct NMR and appears at ~ 3.7 ppm.
A subsequent conversion of the thiol-ene click adduct to the methacrylate monomer was
carried out [21]. The 1H NMR of the methacrylate monomer is shown in Figure 5.2 (c).
The reduction of the hydroxyl proton signal at ~ 3.7ppm is evident. The NMR of the

124
methacrylate monomer also shows the appearance of the protons of the double bond,
labeled , ’, with signals at ~ 5.5 to 6.5 ppm. In the methacrylate monomer NMR, the
O=C–O–CH2– protons are labeled as and they appear at ~4.2 ppm.
Figure 5.3(a) shows the FTIR of the purified click adduct and the methacrylate monomer.
The disappearance of the C-O stretch in primary alcohol and the appearance of the C–O
and C=O stretch in the methacrylate ester monomer are delineated.
The vaporization temperatures of the thiol-ene click adduct and the subsequent
methacrylate monomer were also estimated using TGA shown in Figure 5.3(b). Both the
thiol-ene click adduct and the methacrylate monomer were viscous amber colored fluids
with high boiling points. In an alcohol (thiol-ene adduct) some molecular association can
be attributed to the presence of hydrogen bonding. Corresponding esters are usually lower
boiling compared to alcohols. In this case, the loss of the hydrogen bonding due to
conversion of the primary hydroxyl in the click adduct was offset by an increase of the
molecular weight of the moiety leading to a modest increase in the boiling point by nearly
350C.
3.3 Characterization of polymers
The NMR traces of the final polymer solutions are shown in Fig 5.4 (a) – (c). The NMR
traces were utilized to estimate copolymer composition by comparing the integrated peak
areas of the N – H proton from the methacrylate monomer at ~ 2.4ppm, with those at =
7.8ppm (aromatic proton from DVB) or = 3.8 ppm (–O–CH2– from BuA). Figure 5.4 (a)
is the NMR of the homopolymer. Polymerization occurs with a reduction in the relative
125
abundance of acrylate double bonds. Figure 5.4(b) is the NMR of the copolymer with Butyl
acrylate. An expanded view of the position of the –O–CH2– protons is shown as an inset.
Both the methacrylate monomer and the BuA co-monomer exhibit chemical shifts at ~
3.8 ppm due to –O–CH2– protons. The difference between the –O–CH2– signals in the
copolymer and the homopolymer, divided by the N-H signal at ~2.4 ppm, was used to
estimate the BuA composition in the copolymer. Figure 5.4(c) is the NMR of the
copolymer with DVB. The position of the aromatic protons is shown in an expanded view
as an inset. The average molar copolymer composition was seen to nearly replicate the feed
composition for the copolymerization batches.
It is worthwhile to note that the rather small presence of DVB (5 mol%) results in limited
degree of crosslinking. Since the DVB copolymer is very lightly crosslinked it does not
spontaneously separate out of the reaction mixture [22, 23]. However, unlike the two
uncrosslinked polymer compositions, once dried it cannot be redissolved into any solvent.
GPC molecular weight measurements were made for the homopolymer and the copolymer
with butyl acrylate. The weight average molecular weight of the homopolymer and butyl
acrylate copolymer were 74,320 and 61,262 with a PDI of 4.1 and 4.3, respectively.
All polymers were evaluated for thermal transition by DSC. The results are presented in
Fig 5.5(a), where the homopolymer Tg is approximately 105 °C, the BuA copolymer Tg is
approximately 98 °C, and the lightly crosslinked DVB copolymer Tg is approximately 107
°C. While the thermal transitions of acrylate polymers are also dependent on the molecular
weight, they are known to follow a pattern of decreasing glass transition temperature with
increasing length of the alkyl side chain [25]. This is particularly true for linear alkyl side

126
chains in acrylate polymers. Thus while poly(methyl methacrylate) has a Tg of 110 °C,
poly(n-octyl methacrylate) exhibits a Tg of 10 °C. This is attributed to an internal
plasticization effect by the increasing length of the side chain [25]. However, the large side
chain of the methacrylate polymers reported here is more complicated, with a secondary
amine and a bulky, stiff cyclohexyl ring. Additionally, a carbon-sulfur bond also exists,
which along with the amine, may play a part in enhancing polar interactions, explaining
the high glass transitions obtained with the polymers. The effect of cross linking with DVB
is minimal. The effect of incorporation of ~ 5% BuA is as expected with a ~7C reduction
in the glass transition temperature.
Thin films of the polymers cast on glass substrates were evaluated for water and
1,3-PD contact angle. The water contact angle is shown in Figure 5.5(b). The high water
contact angles confirm polymer hydrophobicity. The acute 1,3-PD contact angles, on the
other hand, indicate the wettability of the surfaces of all three polymers by 1,3-PD [26].
No significant differences between the contact angles were noted for the three polymers.
Polymer films cast on Kapton, and then peeled off from the kapton surface, were used for
estimating the water and 1,3-PD mass uptake, and the results are shown in Figure 5.5(c).
The water mass uptake is lower than 1% for all the polymers, while that of 1,3-PD is
between 15 – 18%. As with the contact angles, no significant differences between the mass
uptakes were noted for the three polymers. The much larger mass uptake of 1,3-PD
compared to water, combined with the differences in wettability, are evidence that these
three polymers have much greater affinity for 1,3-PD compared to water [24].

127
3.4 Pervaporation results on 1,3-propanediol – water binary feed mixtures
The pervaporation set up and membrane fabrication have been described in earlier
sections and depicted in Figures 5.6(a) to (c). Figure 5.7(a), 5.7(b), 5.8(a) and 5.8(b)
illustrate the component flux and separation factors for the three polymers with varying
membrane composition, feed temperature and 1,3-PD feed concentration. The polymers
demonstrate separation factors in the range 65 to 80. The 1,3-PD fluxes vary between 1.9
g/m2h and 3.4 g/m2h, while the water fluxes range between 3.5 g/m2h to 5g/m2h.
3.4.1 Effect of Copolymer Composition
A comparison of the separation performance at 30 °C shows that the butyl acrylate
copolymer exhibited the highest separation factor compared to the other two membranes.
The findings are replicated at 40 °C and with varying 1,3-PD feed concentrations. At higher
temperature or feed 1,3-PD concentrations, the disparity between the separation factors of
the three membranes reduces. The incorporation of a small percentage of butyl acrylate
into the polymer composition may have enhanced its hydrophobic character while making
little difference to the 1,3-PD affinity. A comparable phenomenon is seen in the mass
uptake, where the incorporation of butyl acrylate reduced the water uptake while keeping
the 1,3-PD uptake at the same level (Fig 5.5c). While the incorporation of butyl acrylate
depressed the glass transition temperature, the effect of an increase in free volume was
negligible as the fluxes of both components decreased to some extent despite the apparent
plasticization by the butyl acrylate fraction.
128
3.4.2 Effect of Temperature
The polymers were evaluated for pervaporative performance with binary 1,3-PD –
water mixtures at three different temperatures and the results are shown in Figure 5.7(a)
and 5.7(b). An increase in temperature, predictably reduced the separation efficacy by
enhancing the flux of both permeating components. For the homopolymer, P(Acryl) and
the lightly crosslinked DVBcopolymer, P(Acryl)_DVB, the effect of temperature on
separation factor was less pronounced than it was on P(Acryl)_BuA. The BuA fraction
causes some plasticization as evident in the reduction in glass transition. With increase in
temperature, the chain mobility increases more in the BuA copolymer allowing a higher
flux of both components causing a reduction in selectivity. The sensitivity of the
P(Acryl)_BuA to increased temperature reduced the separation factor so that at 50 °C all
three polymers had nearly identical separation factors.
3.4.3 Effect of Feed 1,3-propanediol concentration
The polymers were evaluated for pervaporative performance with varying 1,3-PD
feed concentrations. The results are shown in Figure 5.8(a) and 5.8(b). With an increase
in the feed 1,3-PD concentration, the separation factor reduces for all three polymers. The
reduction in separation factor with increasing 1,3-PD feed concentration is the steepest for
the BuA copolymer. The high affinity of the polymers towards 1,3-PD causes swelling and
subsequently higher flux of both water and 1,3-PD, which may contribute to the observed
reduction in the separation factor. In the lightly crosslinked DVB copolymer, these changes
in flux and separation factor were less significant than in the homopolymer or the BuA

129
copolymer, perhaps due to the crosslinking. A contributing factor to the reduction in
separation factor may be coupling between the transport of 1,3-PD and water. Higher
concentrations of 1,3-PD in the membrane, at higher 1,3-PD feed concentrations, are
expected to increase the concentration of water in the membrane as well due to swelling
and the high miscibility of water in 1,3-PD.
3.5 Analysis of Hansen Solubility Parameters
Permeation may be defined as 𝑃 = 𝐷 𝑥 𝑆, where D is the diffusion coefficient and
S is the solubility of components of the feed in the membrane [3]. Thus, the components
of the feed must dissolve into the membrane polymer and then diffuse downstream through
the membrane. The membrane polymer can therefore be considered a solvent phase for the
feed components.
The relative enrichment during pervaporation occurs by virtue of the higher
solubility or greater diffusivity in the membrane material of one component compared to
the other [3,4, 27]. The membrane-component affinity may be described by the Hansen
solubility parameters, comprising hydrogen bonding interactions (H), polar interactions
(P) and dispersion interactions (D) [3]. The interactions of the membrane material with
each permeating component can be expressed by a single number, Ra, which combines the
Hansen solubility parameters and indicates the distance between the membrane and each
component in Hansen space [3].
𝑅𝑎 = √4(𝑑1 − 𝑑2)2 + (𝑝1
− 𝑝2)2 + (𝐻1
− 𝐻2)2 (3)

130
The Hansen parameters were computed for water, 1,3-PD and the methacrylate monomeric
unit using a group contribution method [28] employing two kinds of characteristic groups:
first-order groups that describe the basic molecular structure of compounds and second-
order groups based on the conjugation theory to improve the accuracy of predictions. The
contribution towards H, P and D were computed from values provided for the
participating groups and identifiable conjugates in the monomeric structure [29]. The free
volume of the polymer was not accounted for in these calculations, and the contributions
of the BuA and DVB co-monomers were also ignored. The Hansen parameters for water,
1,3-PD and the methacrylate monomer synthesized in this work are shown in Table 5.1,
along with the computed Ra between all components. The computed values of Hansen
parameters for water and 1,3-PD closely match literature values [29, 30], but there are no
literature values for the polymeric membrane material for comparison purposes.
Table 5.1 indicates that the methacrylate monomeric unit has a much higher affinity
for 1,3-PD than for water as Ra for the interaction of 1,3-PD and the monomeric unit is
much smaller than Ra for the interaction of water and the monomeric unit. This difference
is largely due to the differences in polar interactions. The higher affinity of the monomeric
unit for 1,3-PD over water is consistent with the results for contact angle and mass uptake
from Figures 5.4b and 5.4c. Thus, the affinity calculations with the monomeric unit provide
some guidance for the affinity of the membrane polymer towards the permeating
components.
The diffusion rate of the feed components through the membrane depends upon
their kinetic diameter (dk), which considers the molecular size and shape [27]. Given that

131
the dk of water is significantly lower than that of 1,3-PD, water diffuses faster. Hence the
onus of pervaporative enrichment in favor of 1,3-PD lies on preferential sorption of 1,3-
PD into the membrane and the concomitant rejection of water [3,27]. The proximity of the
solubility parameters of water and 1,3-PD compounds the difficulty of separation using
conventional membrane materials. If 1,3-PD and water were equally soluble in the
membrane, the preferentially permeating component would be water since water diffuses
faster. However, given the hydrophobic character of the membrane material and its affinity
for 1,3-PD, the preferentially permeating component is 1,3-PD, as shown in Figure 5.6.
3.6 Comparative Analysis of Performance
This work can be directly compared to one investigation on pervaporative
separation of 1,3-PD from water. Thus, Izak et al (2007) achieved a separation factor of
177 and flux of 3.86 g/m2h at 22 °C for 1,3-PD in a binary mixture with water [17] and
using a supported liquid membrane (SLM) based on cyanoborate ionic liquid, while
claiming 9 month membrane stability. The work reported herein achieved separation
factors of 60 - 80 with 1,3-PD fluxes between 2.3 and 3.4 g/m2h. However, the polymers
developed in this work can be produced as flat sheets that can be fabricated into modules
and scaled-up for commercial separations.
Pervaporation of aqueous broths require that the membrane materials be
hydrolytically stable. Ionic liquids have shown great promise in various applications but
their technical applications are limited by either hydrolytic instability or high price of the
anions for hydrolytically stable ionic liquids [18, 31]. A brief comparison of the material

132
price developed in this work versus that used for the cyanoborate SLM [17, 32] was carried
out with retail price data from Sigma Alridch (http://www.sigmaaldrich.com), Oakwood
Chemicals Inc (http://www.oakwoodchemical.com/) and Fluorochem Ltd.
(http://www.fluorochem.co.uk). The computation was based on molecular structures and
prices of the individual chemicals making up the compound. The tetrapropyl ammonium
cyanoborate ionic liquid costs $36,004/mole, while the methacrylate monomer developed
in this work costs $1326/mol. The cost per unit weight of the ionic liquid is $120/g, while
that of the methacrylate monomer is $ 4.65/g.
A price/performance trade off estimate was generated using the experimental results
detailed here and reported in the work on the cyanoborate SLM. A rough estimation was
made of the total volume of membrane material required to reach a final 1,3-PD
concentration of >90%, from a starting composition of 1% 1,3-PD for a feed flow of 100
g/h. The computation assumes that separation factor and flux of 1,3-PD remained constant
after each enrichment stage. This assumption was made because separation factor and flux
data for high 1,3-PD feed concentrations were not available. The average separation factor
for the homopolymer, P(Acryl), membrane was taken as 72 with an average 1,3-PD flux
of 3.1g/m2h. The computation yielded a requirement of 3 enrichment steps requiring a total
pervaporation area of 6000 cm2. The volume required using a 400 micron thick membrane
was computed as 240 cm3. Assuming an approximate density of 1g/cm3, the cost of the
material required to achieve the aforementioned enrichment level is ~$1116.
The same computation was carried out for the cyanoborate ionic liquid membrane
stabilized in a nanoporous ceramic module. The flux of 1,3-PD (3.86 g/m2h) and the

133
separation factor (177) reported in their work [17, 32] were used as constants for the
computation. The same enrichment level from a starting composition of 1% 1,3-PD was
calculated to require 2 enrichment steps with a total area of 4660m2. The thickness of the
module reported [32] is 3 mm (with a 7mm inner diameter and 10 mm outer diameter). The
nano porous module reported in their work has a porosity of 30% [17, 32]. Thus the total
cyanoborate ionic liquid requirement is 419 cm3. Assuming a rough density of 1g/cm3, the
cost of material required to achieve the same enrichment level is ~$50,328.
The high intrinsic enrichment factors may lead to concentration polarization with a
concomitant reduction in separation efficacy. Membrane module designs and multilayer
membrane structures may be used in the case of a polymer membrane to optimize
separation performance and impart mechanical robustness to membrane structures.
This work used established routes of chemistry to covalently bond a 1,3-PD solvent
functionality into a polymeric structure, which mitigates the stability issues faced by SLM,
while enhancing affinity in favor of 1,3-PD. At the same time, the hydrophobic character
of the membrane is significantly enhanced to achieve a large difference in preferential
sorption, which is critical for separating 1,3-PD from water.
4. Conclusion
Towards improving the pervaporation performance of 1,3-propanediol-water mixtures
and providing inexpensive polymeric membrane materials, and taking advantage of the
affinity of cyclohexyl amine towards 1,3-PD, a novel methacrylate monomer was
synthesized by the thiol-ene coupling of allylcyclohexyl amine with mercaptoethanol

134
followed by the esterification with methacryloyl chloride. Plug membranes based on such
homo and random copolymers with butyl acrylate and divinyl benzene exhibited high
separation factors (65 - 80) and fair (2.3 and 3.4 g/m2h) 1,3-PD fluxes. A superior cost-
performance balance was achieved with these membranes by comparison with other
systems while providing a possible route to fabrication of membrane modules with
multilayer compositions.
5. Acknowledgements
The authors acknowledge the advice of Prof. M.T. Shaw, (Professor Emeritus, University
of Connecticut) in thermodynamic computations.
6. References
1. Z.L. Xiu, A.P.Zeng, Present state and perspective of downstream processing of
biologically produced 1,3-propanediol and 2,3-butanediol, Appl Microbiol Biotechnol.
78 (2008) 917–926.
2. A. Triguero, R. Blanco, H. Machado, M. Rodríguez, Evaluation of liquid extraction
potentials for downstream separation of 1,3-propanediol, Biotechnology Techniques.
13 (1999) 127–130.
3. P. Shao, R.Y.M. Huang, Polymeric membrane pervaporation, Journal of Membrane
Science. 287 (2007) 162-179.
4. M. Mulder, T. Franken, C.A. Smolders, Preferential sorption versus preferential
permeability in pervaporation, J. Membr. Sci. 22 (1985) 155–173.

135
5. T.T. Ames, Process for the isolation of 1,3-propanediol from fermentation broth. US
Patent 6361983 B1 (2002).
6. Y. Gong, Y. Tong, X.L. Wang, D.H. Liu, The possibility of the desalination of actual
1,3-propanediol fermentation broth by electrodialysis, Desalination. 161 (2004) 169–
178.
7. J. Hao, D.H. Liu, Desalination of fermented broth containing 1,3-propanediol by
electrodialysis, Chinese J Proc Eng. 5 (2005) 36–39.
8. Z. Li, B. Jiang, D. Zhang, Z. Xiu, Aqueous two-phase extraction of 1,3-propanediol
from glycerol-based fermentation broths, Separation and Purification Technology. 66
(2009) 472–478.
9. A. Baiada, A. Vitner, R.P. Jansen, A.M. Baniel, Process for producing 1, 3-
propanediol. US Patent 7056439 B2 (2006).
10. A.K. Hilaly, T.P. Binder, Method of recovering 1,3-propanediol from fermentation
broth. US Patent 6479716 B2 (2002)
11. J. Hao, F. Xu, H. Liu, D. Liu, Downstream processing of 1,3-propanediol fermentation
broth, Journal of Chemical Technology and Biotechnology.81(2006) 102–108.
12. J.J. Malinowski, Reactive Extraction for Downstream Separation of 1,3-Propanediol,
Biotechnology Progress. 16 (2000) 76–79.
13. M.H. Cho, S.I. Joen, S.H. Pyo, S. Mun, J.H. Kim, A novel separation and purification
process for 1,3-propanediol, Process Biochem. 41 (2006) 739–744.
14. P. Anand, R.K. Saxena, R.G. Marwah, A novel downstream process for 1,3-
propanediol from glycerol-based fermentation, Appl. Microbiol. Biotechnol. 90 (2011)
1267–1276.
136
15. S. Li, V.A. Tuan, J.L. Falconer, R.D, Noble, Separation of 1,3- propanediol from
glycerol and glucose using a ZSM-5 zeolite membrane, J. Membr Sci. 191 (2001a)
53–59.
16. S. Li, V.A. Tuan, J.L. Falconer, R.D. Noble, Separation of 1,3- propanediol from
aqueous solutions using pervaporation through an X-type zeolite membrane, Ind Eng
Chem Res 40 (2001b) 1952– 1959.
17. P.Izák, M. Köckerling, U. Kragl, Stability and selectivity of a multiphase membrane,
consisting of dimethylpolysiloxane on an ionic liquid, used in the separation of solutes
from aqueous mixtures by pervaporation, Green Chem. 8 (2006) 947–948.
18. N.M. Kocherginsky, Q. Yang, L. Seelam, Recent advances in supported liquid
membrane technology. Separation and Purification Technology, Separation and
Purification Technology 53 (2007) 171–177.
19. G. Odian in Principles of Polymerization, fourth ed., John Wiley & Sons Inc., Hoboken,
NJ, 2004.
20. U. Mansfeld, C.Pietsch, R.Hoogenboom, C.Remzi Becer, U.S. Schubert, Clickable
initiators, monomers and polymers in controlled radical polymerizations – a
prospective combination in polymer science, Polym. Chem. 1 (2010) 1560–1598.
21. Y. Xia, R.C.Larock, Castor oil-based thermosets with varied crosslink densities
prepared by ring-opening metathesis polymerization (ROMP), Polymer 51 (2010)
2508-2514.
22. T. Boyle, A. Szopinski, A. Verrall, Method and apparatus for continuously preparing
crosslinked, solution–cast polymer film. US Patent 20070085235 A1 (2007)

137
23. Q. Guo, P.N. Pintauro, H. Tang, S.O’Connor, Sulfonated and cosslinked
polyphosphazene – based proton – exchange membranes, J. Membr. Sci. 154 (1999)
175 – 181.
24. S. Li, R. Srivastava, R.S. Parnas, Separation of 1-butanol by pervaporation using a
novel tri-layer PDMS composite membrane, J. Membr. Sci. 363 (2010) 287–294.
25. S. Rogers, L.Mandelkern, Glass Transitions of the Poly-(n-Alkyl Methacrylates), J.
Phys. Chem. 61 (1957) 985–991.
26. D. K. Owens, R. C. Wendt, Estimation of the surface free energy of polymer, Journal
of Applied Polymer Science 13 (1969) 1741 – 1747.
27. W.J.Koros, Membranes: Learning a lesson from nature, Chem Eng. Prog. 91 (1995)
68–81.
28. E. Stefanis. C. Panayiotou, Prediction of Hansen Solubility Parameters with a New
Group-Contribution Method, Int J. Thermophys. 29 (2008) 568–585.
29. C.M. Hansen, Hansen solubility parameter: A users handbook, second ed., CRC press
Taylor and Francis group, Boca Raton, London, New York, 2007.
30. M. Alizadeh, F. Abbassi, M. Farahi, K. Jalili, Silicone based hydrogels prepared by
interpenetrating polymeric network synthesis: Swelling properties and confinements
effects on the formation kinetics, J appl Poly Sci. 124 (2012) 985–992.
31. E. Kuhlman, S. Himmler, H. Giebelhaus, P. Wasserscheid, Imidazolium
dialkylphosphates – a class of versatile, halogen-free and hydrolytically stable ionic
liquids, Green Chem. 9 (2007) 233 – 242.
32. P. Izak, M. Köckerling, U. Kragl, Mehrphasen–Membran. German Patent
DE102006024397 B3 (2007).

138
Figure 5.1: Monomer Synthesis Scheme
Allylcyclohexylamine
h, AIBN
Mercaptoethanol Thiol – ene Click Adduct
Esterification
50C, 12 hours
Methacrylate monomer
+

139
Figure 5.2: NMR (a) ACA (b) Click adduct (c) Methacrylate monomer CHAPTPMA
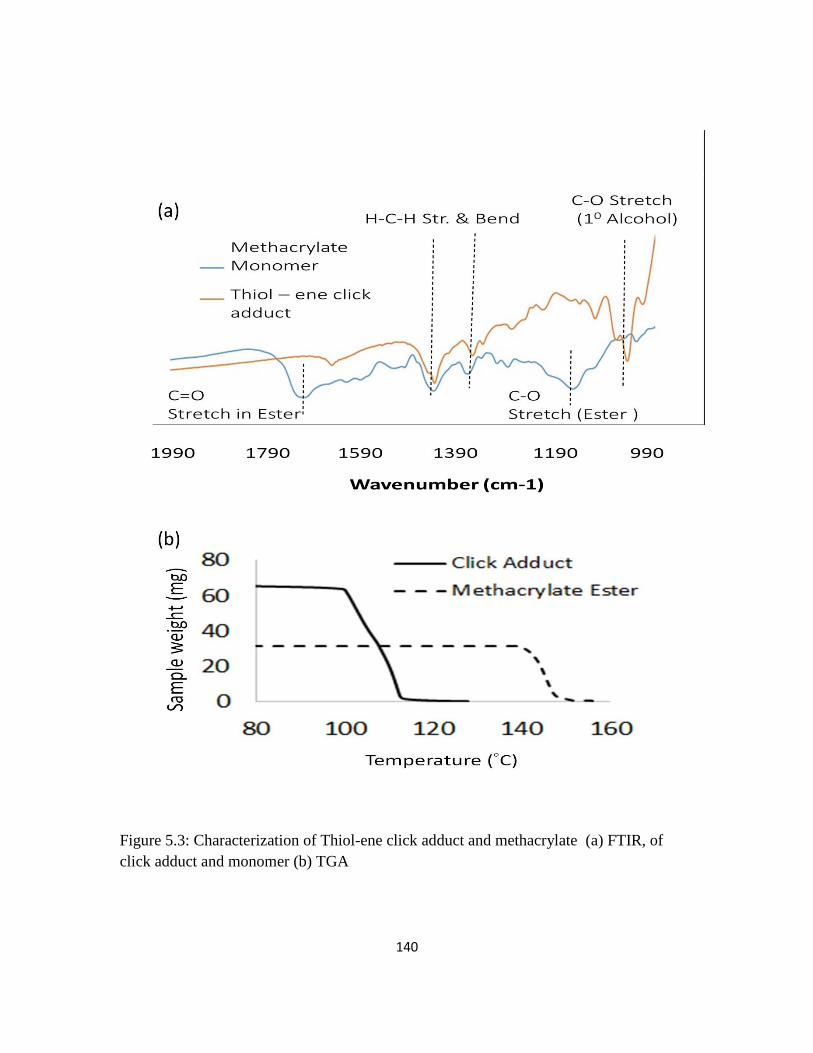
140
Figure 5.3: Characterization of Thiol-ene click adduct and methacrylate (a) FTIR, of
click adduct and monomer (b) TGA

141
P(Acryl) Homopolymer(a)
P(Acryl)_DVB copolymer (c)
N-H
(b)
–O–CH2–
Reduction in C=C protons
N–H
(ppm)
(ppm)
– O – CH2–
N-H – O – CH2–
Aromatic Protons
(ppm)
P(Acryl)_BuA Copolymer
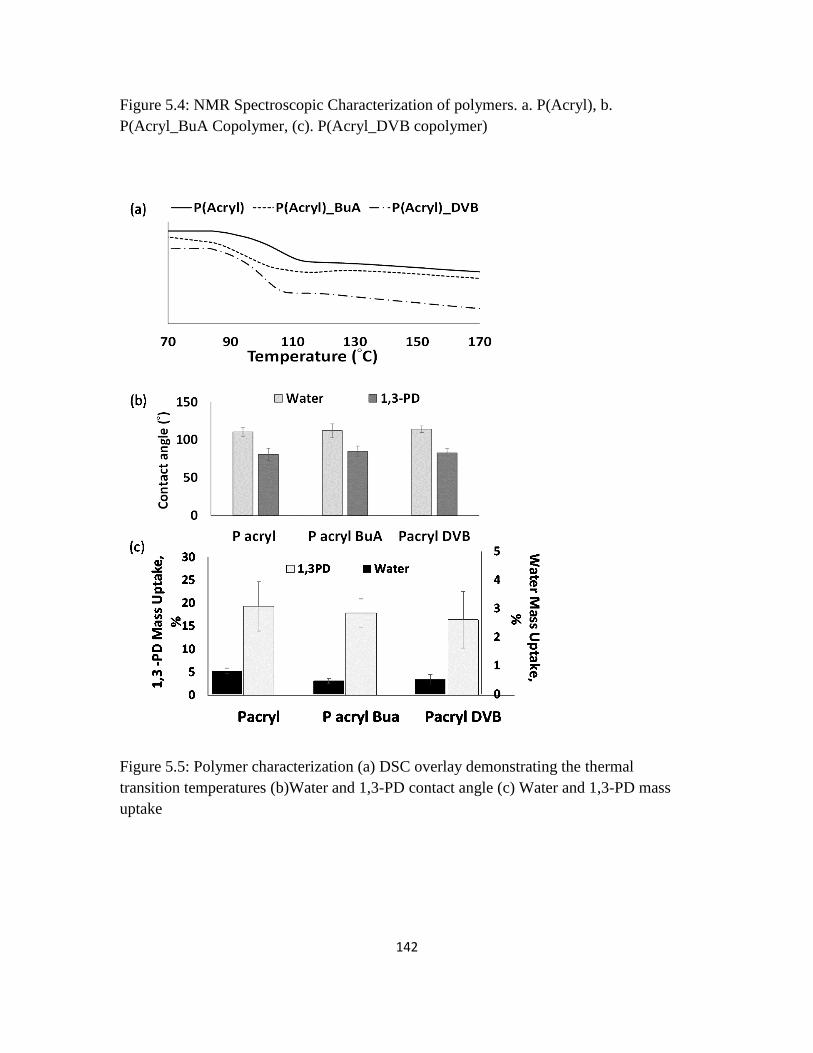
142
Figure 5.4: NMR Spectroscopic Characterization of polymers. a. P(Acryl), b.
P(Acryl_BuA Copolymer, (c). P(Acryl_DVB copolymer)
Figure 5.5: Polymer characterization (a) DSC overlay demonstrating the thermal
transition temperatures (b)Water and 1,3-PD contact angle (c) Water and 1,3-PD mass
uptake

143
Figure 5.6: Plug Membrane (a) Schematic (b)Photograph (c) Section FESEM

144
Figure 5.7 : Batch Pervaporation – Variation with temperature (a) Component Flux
(b)1,3-PD separation factor

145
Figure 5.8 : Batch Pervaporation – Variation with 1,3-PD feed concentration (a)
Component Flux (b)1,3-PD separation factor

146
Table 5.1 : Hansen Parameters and corresponding Ra computed using group contribution
method
Parameter D H P Ra
Methacrylate
Monomer
19.52 3.97 5.01
water / monomer
40.01 1,3-PD/monomer
21.25 1,3PD/water
19.43
Water
15.50 16.00 42.31
1,3-PD
16.80 13.51 23.20

147
Chapter 6. Imidazolium Dibutylphosphate Ionic Liquid Based Methacrylate Polymer
Membranes For Efficient Pervaporative Enrichment of 1,3-propanediol From Binary
Aqueous Mixtures*
Abstract
The challenge of pervaporative enrichment of 1,3-propanediol (1,3-PD) from dilute
aqueous mixtures was addressed by the synthesis of a novel hydrophobic imidazolium
dibutylphosphate ionic liquid structure based methacrylate monomer. Vinylimidazole was
“thiol-ene coupled” with mercaptoethanol followed by conversion into an
imidazoliumdibutyl phosphate ionic liquid and finally to the methacrylate monomer by
esterification with methacryloyl chloride. Plug membranes based on such homo and
random copolymers with butyl acrylate and divinyl benzene exhibited high separation
factors (88 - 115) and fair (2.8 and 3.6 g/m2h) 1,3-PD fluxes. The membrane performance
was robust against changes in temperature and feed 1,3-PD concentrations. The monomer
provides a inexpensive recourse to high performing materials by balancing its 1,3-PD
affinity with its hydrophobic nature. The excellent cost – performance trade off makes this
an attractive candidate for possible industrial applications in multilayer modules.
Keywords: Imidazolium ionic liquids, 1,3-propanediol, pervaporation, Tributyl phosphate
*Imidazolium Dibutylphosphate Ionic Liquid Based Methacrylate Polymer Membranes
For Efficient Pervaporative Enrichment of 1,3-propanediol From Binary Aqueous
Mixtures, B. Kanjilal, , I.Noshadi, J.R. McCutcheon, A.D. Asandei, R.S. Parnas, Green Chemistry
(In Preparation)

148
Introduction
Glycerol, a platform chemical for the production intermediate biorenewable
chemicals, can be obtained as a low value waste feed stock from a wide variety of
industries. Its fermentative conversion to intermediate biorenewable chemicals such as 1,3-
propanediol (1,3-PD is an environmentally and economically sustainable recourse to its
utilization [1]. However, the principle impediment in fermentative conversion of glycerol
to 1,3-PD lies in the downstream enrichment of 1,3-PD concentration given that it has to
be enriched from very low starting concentrations [2 – 4]. Conventional processes, like
evaporation, chromatography and reactive extraction amongst others have been used but
are associated with either high energy usage or yield and process complication issues [5-
17].
Pervaporation mitigates the challenge of high energy associated with processes
involving phase change [18]. It deals with the minor component hence reducing the bulk
energy usage. Additionally, pervaporation uses membranes with affinities tailored to be
selective towards a given component. Pervaporation has been ranked as one of the better
technologies for liquid separation and has found viable application in solvent dehydration,
removal of volatile organic content, aroma recovery and some organic/organic separations
[19].
The thermodynamic and kinetic factors that control permeation are manifested as
the preferential solubility of one permeating component over the other and the diffusivity
of the permeating components [18]. Since water, as a smaller molecule, has greater
diffusivity than 1,3-PD, a high preferential sorption of 1,3-PD and low water solubility in
149
the membrane must be exploited to allow preferential permeation of 1,3-PD across a
membrane [20]. Herein, the proximity of the thermodynamic solubility parameters of 1,3-
PD and its highly hydrophilic character marks the limitation in the availability of
appropriate materials.
Ionic Liquids have attracted attention due to their unique properties one of which
is low vapor pressure at ambient temperatures [21]. They have been put to use in
applications which require low solvent and their uses range from electrochemisty and
catalysis to being used as engineering and process fluids, heat transfer agents, as liquid
pistons in gas compressors and paint and coating additives [22 – 29]. They have been used
in the field of extraction, extractive distillation and as supported liquid membranes [17]
For the separation of 1,3-PD from water and model aqueous fermentation broths,
Zeolite membranes have been used for pervaporative separation of 1,3-PD from model
fermentation broths where the membranes proved to be selective towards water [15,16].
Izak et al reported the application of a cyanoborate ionic liquid based based supported
liquid membrane with high separation factors [17]. The low vapor pressure of Ionic liquids
makes them particularly attractive for application in liquid membranes [17, 21, 30].
However, the leaching and loss of solvent cannot be completely alleviated [30]. Yet another
major requirement for the use of IL in pervaporative applications such as separation of
organic hydrophilic compounds from aqueous broths is the water stability at operating
temperatures [21, 30]. The hydrolytic instability limits the application of
hexaflurophosphate and tetrafluoroborate based ionic liquids to anhydrous processes [21].
Additionally, ionic liquids are usually expensive and their technical applications are limited
by the price of their anions [21, 30].

150
A Dupont patent deals with solvent extraction of 1,3-PD with feed broths containing ~5%
1,3-PD and a wide variety of hydrophibic solvents of which one reported solvent is Tributyl
Phosphate [5,9,10]. 1,3-PD is extracted into the hydrophobic solvent, preferentially over
other fermentation products [5,9, 10]. The choice of TBP is prompted by its balance of
hydrophobic character and its high affinity for 1,3-PD [10]. While solvent extraction for
1,3-PD in general has efficiency limitations owing to the high water affinity of 1,3-PD and
limited partitioning [31], the incorporation of the TBP into a polymerized ionic liquid
structure in this work was shown to successfully separate 1,3-PD from water with high
selectivity.
Polymers of ionic liquids (PIL) have been used in select applications such as ion
conduction, as polymer electrolytes and for the synthesis of phase transferrable graphene
sheets [32]. However, the application of ionic liquids in separations has been largely
limited to them being used in supported liquid membrane structures [21, 32].
This work reports the synthesis of an acrylate monomer based on an ionic liquid of tributyl
phosphate (TBP), its polymerization, fabrication into a plug membrane and subsequent
batch pervaporation on binary water-1,3-PD mixtures. A vinyl imidazole as first converted
into an alcohol using a thiol-ene click chemistry step. This was followed by the formation
of an imidazolium ionic liquid by high temperature reaction with TBP, in which the
dibutylphosphate anion forms the counter ion for the 3-N-imidazolium cation. The remnant
hydroxyl on the IL was esterified and converted to a methacrylate monomer which was
then polymerized by simple radical polymerization. Membranes fabricated from the
polymers were evaluated for 1,3-PD selectivity in batch pervaporation experiments. High
separation factors and good 1,3-PD fluxes were achieved by creating a highly hydrophobic
151
membrane with high affinity for 1,3-PD. The wide difference in solubility of water and
1,3-PD is the major factor exploited in deciding the selective permeability of 1,3-PD over
water and hence its enrichment. The development and fine tuning of such materials present
themselves as steps towards establishment of commercially viable and energy efficient
alternatives to conventional purification processes presenting a possibility of membrane
module fabrication for continuous pervaporation.
Experimental
Materials:
For the synthetic scheme involving monomer preparation and polymerization,
Vinylimidazole (VIM), Methacryloyl chloride, Divinyl benzene(DVB) and Butyl
Acrylate(BuA) monomer was dried prior to use. Mercaptoethanol, Tri ethylamine (TEA)
and AIBN radical initiator were used without modification. The solvents, Toluene,
Chloroform, Dioxane and Hexane were dried prior to use. All chemicals were purchased
from Sigma Aldrich.
For the fabrication of the plug membranes, 0.65 cm inner diameter glass pipettes from
Fischer were used. Cotton wool was used to act as the porous support base and was
purchased from the local market.
1,3 propanediol (1,3-PD), 98% purity was purchased from Sigma Aldrich and used for the
partition coefficient and preparation of binary mixtures with distilled water as feed
solutions for pervaporation experiments.

152
Analytical Methods:
Brucker DMX-500 MHz and Brucker Ascend 400 WB spectrometers were used for NMR
spectroscopy, while IR spectra were taken on samples on a Nicolet Magna-IR 560
spectrometer using KBr powder as background. Molecular weight of the polymers were
determined by GPC in an Agilent 1260 Infinity system using N,N-Dimethylacetamide as
eluent. The system used narrow molecular weight PMMA from Sigma Aldrich calibration
standards. Thermo-gravimetric analysis (TGA) was carried out in a TA Instruments Hi-
Res 2950 TGA instrument in nitrogen. Thermal transitions were measured by Differential
Scanning Calorimetry in TA Instruments Q100 DSC instrument. An Olympus TGHM
goniometer was used to measure Contact angles on thin clean glass substrates and on
polymer films cast on clean glass surface. Field Emission scanning electron microscopy
(FESEM) was used to obtain images of the membrane structure with a JEOL 6335F field
emission scanning electron microscope. The 1,3-PD concentrations in the initial feed
solutions and permeate samples from the pervaporation experiments were analyzed using
on 0.22µm syringe filtered aqueous samples by gas chromatography (GC) using a DB-
FFAP capillary column and an MS detector and a 1µL injection volume. GC injector,
detector and initial oven temperatures were kept at 240C, 270C, and 40C respectively.
Partition Coefficient Measurement:
The coefficient of partition of 1,3-PD between water and TBP was determined at 30C. 1
ml of a 10 g/l of 1,3-PD solution was vortexed with 1ml of TBP for 15 minutes and the
layers allowed to separate. The concentration of 1,3-PD, in the aqueous phase, determined

153
by GC, before and after partition, was used to compute the coefficient of partition based
on equation 1:
𝐾𝑝 =𝐶𝑇𝐵𝑃
𝐶𝑤𝑎𝑡𝑒𝑟 ------------------(1)
Synthesis, purification and characterization of methacrylate monomer:
The monomer synthesis scheme is depicted in Figure 6.1. The thiol-ene click chemistry
adduct was synthesized by AIBN mediated addition of the vinyl double bond of the VIM
to the thiol bond of mercaptoethanol [33]. The reaction was carried out in a pressure tube,
degassed prior to reaction with dry argon in a schlenk line. The solventless reaction was
carried out at 600C in the presence of UV and catalyzed by AIBN [33]. The reactants were
weighed out in stoichiometric amount. The product was purified by vacuum drying off the
excess VIM. The thiol-ene click adduct was spectroscopically characterized by 1H NMR
and FTIR, while its vaporization temperature was estimated by TGA. A typical run
consisted of 0.94 g of Vinylimidazole, 0.78 g of Mercaptoethanol and 0.02 g of AIBN
initiator.
The click adduct was subsequently reacted with TBP at 1400C. The dibutyl phosphate
anion serves as the counter ion for the imidazolium cation in this ionic liquid [21]. The
ionic liquid product was spectroscopically characterized by 1H NMR. A typical run
consisted of 1.7 g of the thiol – ene click adduct and 2.7 g of TBP. The reaction was carried
out for at least 72 hours.
The remnant hydroxyl group from the mercaptoethanol moiety on the ionic liquid was
subsequently esterified using methacryloyl chloride and triethyl amine as the catalyst [34].

154
A typical run consisted of 4.3 g of the ionic liquid, 1 g of triethyl amine and 1 g of
methcryloyl chloride in ~ 10 ml of solvent. The ionic liquid was dissolved in dry toluene
and a stoichiometric amount of methacryloyl chloride and triethylamine were added and
refluxed at 750C for 12 hours. The solvent was evaporated off by stirring in an open beaker
at 400C overnight. The resultant mixture of the methacrylate monomer, which still
contained triethyammonium hydrochloride, was dissolved in hexane. The triethyamine
hydrochloride separated out, the supernatant hexane layer containing the hydrophobic
methacrylate ester of the ionic liquid was filtered off. The hexane was subsequently
evaporated overnight in a vacuum oven at 400C. The purified methacrylate monomer was
characterized by 1H NMR, 13C NMR, FTIR and TGA. The absolute density of the
methacrylate monomer was measured by weighing a fixed volume of the monomer. The
NMR results are epicted in Figures 6.2(a) – (c) and in Figures 6.3 (a) and 6.3(b). The FTIR
and TGA results for the monomer are shown in Figure 6.4 (a) and (b). Figure 6.5 (a) and
(b) illustrate the solubility of the methacrylate monomer in water and 1,3-PD.
Synthesis, purification and characterization of polymers:
The methacrylate monomer was homopolymerized and copolymerized separately with 5
mol% of BuA and 5mol% of DVB using AIBN initiator. The polymerizations were carried
out at 700C in a 250 ml two necked round bottom flask fitted with a reflux condenser with
the system being constantly purged with nitrogen. The dioxane solutions of the monomer(s)
were passed through an inhibitor remover column to remove the inhibitor contained in the
methacryoylchloride prior to polymerization. A 25ml dioxane batch typically consisted of
contained ~5g of the methacrylate monomer with AIBN in a stoichiometric monomer:

155
initiator ratio of 100:1. The polymerizations were blanketed by a stream of nitrogen. At
the end of each batch, the reaction mixtures were characterized by 1H NMR. The polymer
was stripped off the remnant volatiles and solvent by evaporation and dried to constant
weight at 800C under vacuum. The solid polymers were spectroscopically evaluated for
thermal transitions by DSC.
The reaction mixtures were used to cast films on clean glass and kapton substrates. The
former were used to evaluate the water and 1,3-PD contact angles, while the latter were
peeled off from the kapton substrate and evaluated for water and 1,3-PD mass uptake. The
NMR of the polymers are shown in Figures 6.6 (a) – (c).
The DSC results are shown in Figure 6.7(a), while Figure 6.7(b) shows the results for water
and 1,3-PD contact angle measurement. The mass uptake results are shown in Figure
6.8(a). The non crosslinked polymers (i.e. those not employing DVB in their composition)
were evaluated by GPC for molecular weight.
The acronyms used for the homopolymer, butylacrylate copolymer and divinyl benzene
copolymer are PVIM, PVIM_BuA and PVIM_DVB respectively
Membrane Fabrication and Pervaporation experiments:
Plug membranes were fabricated inside 0.65 cm inner diameter glass pipettes. A known
weight of dry cotton wool was stuffed inside a glass pipette to form a base. A small and
known weight of dry cotton wool was soaked in a known volume of with the polymer
solution and allowed to dry slowly at 400C over 3-4 days. Once nearly dry, the polymer
solution soaked cotton wool was lightly pressed with a flat screw head to set it as a

156
membrane on top of the cotton wool base inside the glass pipette. The solvent was
evaporated slowly over nearly a week at room temperature till the plug attained a constant
weight. The slow solvent evaporation prevented pinhole formation and allowed the plug
membrane to adhere to the inner wall of the glass pipettes. Figure 6.8 (b) is an FESEM
image of a section of a typical membrane plug. The volume inside the glass pipette above
the membrane was used for ~1.5-1.7 ml of pervaporation feed solution.
The materials were evaluated in a batch pervaporation set up using the fabricated plug
membranes. The structures were affixed in an upright position in a water bath at 30C. The
plug membrane proffered a pervaporation area of 4.91 mm2. Each batch pervaporation
experiment was allowed to run for a period of 20 - 30 hours and the permeate collected in
two dry –ice cooled traps. A vacuum pump was employed to pull a vacuum of 1 – 3mmHg
on the downstream side. The permeate collected was thawed, weighed, diluted and
analyzed for 1,3-PD concentration by GC.
Pervaporation is monitored by key performance indicators of permeate flux and separation
factor given by equation 2 [35 ].
=𝐽𝑝
𝐽𝑤.
𝑥𝑤
𝑥𝑝 ------(2)
Jp and Jw represent the 1,3-PD and water fluxes and xp an xw represent the feed mass
fractions of 1,3-PD and water respectively.

157
Results and Discussions:
Partition Coefficient in Amine:
The partition coefficient of 1,3-PD in Tributyl Phosphate (TBP) over water was estimated
at 0.62±0.12. TBP is a hydrophobic solvent, with a Log Pow (Octanol – water redistribution
coefficient) ~4 in which 1,3 propanediol is miscible in all proportions.
Synthesis, purification and characterization of methacrylate monomer
The scheme for synthesis of the methacrylate monomer is shown in Figure 6.1. Thiol-ene
click chemistry was used to block the vinyl double bond on VIM (Step 1) and yield a Thiol-
enelick adduct This was done to prevent any polymerization in the subsequent high
temperature step which converted the imidazole based thiol-ene click adduct to an
imidazolium hydrophobic ionic liquid (Step 2). The remnant hydroxyl proton on the
imidazolium ionic liquid was esterified using methacryoyl chloride into the final
methacrylated monomer (Step 3). The NMR for the monomer synthesis sequence is shown
in Figure 6.2(a) – (c) and in Fig 6.3(a) and (b).
Vinyl protons of vinylimidazole appear at ~ 5 – 5.5 in Figure 6.2a and are marked 1,1’.
The conversion of vinylimidazole into the thiol-ene click adduct was confirmed by the
disappearance of these vinyl upon conversion to the thiol – ene click adduct (Fig. 6.2b).
Mercaptoethanol shows a thiol proton signal (SH) at ~ 1.38 (figure not shown here). This
thiol (SH) proton signal was also seen to disappear [33]. The ratio of the area integrals
under 5.5 ppm and 7.7 ppm (5.5 ppm/ 7.7 ppm) for vinylimidazole were compared to those
obtained for the thiol – ene click adduct to arrive at an approximate yield of 97%.

158
The click adduct was then converted to an imidazolium ionic liquid by high temperature
reaction with TBP. The NMR of the imidazoliul ionic liquid is shown in Fig 6.2c. The
signal at ~ 10.25 corresponds to the N–CH=N+ proton. The figure also shows the
appearance of the protons from the dibutylphosphate counteranion at ~ 3.71, 1.43, 1.22
and 0.74 with progressive distance from oxygen in the [O=P(OCH2CH2CH2CH3)2]- counter
anion structure. The –OCH2CH2CH2CH3 attached to the imidazolium ring Nitrogen shows
NMR signals at ~ 4.27, 1.77, 1.26 and 0.86 with progressive distance from the nitrogen
atom [21]. The chemical shifts of these groups are individually delineated in Fig 6.2c as
insets. The conversion is also marked by the disappearance of the N–CH=N proton at ~
7.7. The ratio of the area for this proton to that at ~7.4, marked as 5 in the vinylimidazole
NMR, Figure 6.2 (a), (7.7 ppm/ 7.4 ppm) is used to estimate the % conversion for the
formation of the ionic liquid at ~ 89%.
The imidazolium ionic liquid is then subsequently converted to a methacrylate monomer
by reacting the hydroxyl group with Methacryoyl chloride [34]. The NMR of the
methacrylate ester monomer is shown in Fig 6.3(a). The appearance of the methacrylate
protons ( -C=CH2) are shown in the figure at ~ 5.4 and 6.1. The reaction is marked by the
reduction in the C-OH proton NMR peak at ~3.5 ppm. The area of this peak to that at
~7.4 ppm (3.5 ppm/ 7.4 ppm) before and after formation of the methacrylate ester was used
to estimate the approximate % conversion for the formation of the methacrylate ester at ~
78%.

159
Figure 6.3(b) represents the 13C NMR spectrum of the methacrylate monomer. The
positions of the carbons pertinent to the dibutylphosphate counteranion and the butyl chain
attached to the quaternary nitrogen are shown as insets on the figure.
The FTIR spectra of the thiol – ene click adduct and the methacrylate monomer are shown
in Figure 6.4 (a). The key bonds are shown on the figure. The conversion of the thiol – ene
click adduct to the methacrylate via the imidazolium ionic liquid pathway is underscored
by the disappearance of the C – O single stretch in primary alcohols and the disappearance
of the C – Nsingle bond stretch and the C = N double bond stretch in the imidazole ring at
wavenumbers 1080-1100cm-1, 1230cm-1 and 1500 cm-1 respectively.
The TGA results on the thiol-ene click adduct, the imidazolium ionic liquid and the
methacrylate monomer are shown in Figure 6.4(b). While the thiol-ene imidazole click
adduct was amber colored viscous liquid, the color deepened and the viscosity increased
significantly with the formation of the ionic liquid. In the thiol-ene adduct hydrogen
bonding is responsible for some molecular associations leading to a vaporization
temperature of ~ 3150C.
The subsequent step of reaction with TBP leads to the formation of an ionic liquid. The
ionic liquid shows weight loss in two steps. Imidazolium ionic liquids are known to
undergo dissociation via competing mechanisms in this temperature range [38]. The
cleavages are thought to occur via the breaking of the C-N bond cleavage at an alkyl group
due to nucleophilic attack by the counter negative ion [38]. The exact mechanism of
cleavage and the products formed can only be ascertained upon a GC MS analysis of the
fragmented products. That study is however, beyond the scope of this work. The ionic
160
liquid formed has a fairly high boiling point. Ionic liquids are considered as “low melting
salts” and hence are liquids with fairly high boiling points with niche applications[21, 38].
The conversion of the click-adduct-imidazolium ionic liquid to the methacrylated ester
made an insignificant change in the vaporization temperature.
The presence of hydroxyl group in the imidazolium ionic liquid contributes to hydrogen
bonding and hence a high vaporization temperature. Its conversion to the methacrylate
group is expected to lower the vaporization temperature. The effect is balanced out by a
slight increase in molecular weight resulting in nearly the same vaporization temperature
for both the ionic liquid and the subsequent methacrylate. As in the ionic liquid, so also in
the final methacrylate monomer, the imidazolium moiety, exhibits decomposition before
the material reaches vaporization. It may be noted that decomposition also leads to eventual
carbonization manifested as nearly 8-9% residue in the ionic liquid and subsequent
methacrylate monomer.
The density of the methacrylate monomer at 300C was estimated at 1.047±0.06 kgm-3.
The solubility of the methacrylated monomer in water, 1,3-PD and a hydrophobic solvent
such as chloroform was evaluated. This is shown in Figures 6.5(a) and 6.5(b) which are
photographs of a drop of the methacrylated monomer dropped into ~2 ml of water and 2
ml 1,3-PD. While the monomer liquid droplet appears miscible with both chloroform and
1,3-PD, the immiscibility with water is apparent in the photograph.

161
Characterization of polymers:
The methacrylate monomer was solution polymerized to yield a homopolymer and
copolymerized separately with 5 mol% BuA and 5 mol% DVB. The NMR traces of the
homopolymer and copolymers are shown in Figure 6.6 (a) – (c).
An estimate of the percentage of butylacrylate incorporation into the copolymer was made
from the NMR spectra. Figure 6.6 (a) is the NMR of the homopolymer. Polymerization
occurs with a reduction in the relative abundance of acrylate double bonds. Figure 6.6(b)
is the NMR of the copolymer with Butyl acrylate. The 1H NMR traces were utilized to
estimate the BuA content in the copolymer composition by comparing the integrated peak
areas of the N – H proton from the methacrylate monomer at ~ 2.4ppm, with those at =
3.8 ppm (–O–CH2– from BuA). Both the methacrylate monomer and the BuA co-monomer
exhibit chemical shifts at ~ 3.8 ppm due to –O–CH2– protons. The difference between
the –O–CH2– signals in the copolymer and the homopolymer, divided by the N-H signal
at ~2.4 ppm, was used to estimate the BuA composition in the copolymer. The estimated
BuA incorporation was computed as ~6.8 mol%.
An estimate of the divinyl benzene incorporation in the polymer structure (Fig 6.6c) was
made from the 13C NMR spectra of the DVB compolymer. The NMR traces were utilized
to estimate copolymer composition by comparing the integrated peak areas of the C=O
carbon from the methacrylate monomer at ~168ppm with those at ~ 145-155 ppm
(aromatic ring carbons from DVB). The estimated DVB incorporation was computed as ~
8.3 mol%. Due to the limited degree of crosslinking with ~5mol% of DVB, the polymer
does not separate out of solution unless the solvent is evaporated off.

162
GPC molecular weight measurements were made only on the homopolymer and the
copolymer with butyl acrylate. The weight average molecular weight of the homopolymer
and butylacrylate copolymer were 45073 and 39850 with a PDI of 4.99 and 4.06
respectively.
The thermal transitions of the polymers were evaluated by DSC and the results are
presented in Figure 6.7(a). Polymers of ionic liquids are generally characterized by high
thermal transition temperatures. Glass transitions in the range of 176 -1840C were noted.
The presence of a small amount of BuA copolymer reduced the thermal transition by ~30C
while crosslinking with DVB increased the glass transition by ~ 40C.
The polymerization reaction mixtures, at the end of the polymerization process were used
to cast this films on clean glass substrates and evaluated for water and 1,3-PD contact
angles and the results are shown in Figure 6.7(b). The polymer was found to be
hydrophobic as the average water contact angles ranged between 117–1210. Conversely,
the wettability of the surfaces with 1,3-PD was confirmed by the acute contact angles
ranging from 68–720. The overlapping error bars on the measurements indicated
insignificance of the difference in behavior between the three polymers.
Figure 6.8(a) shows the water and 1,3-PD mass uptake results. The low water mass uptake
(< 0.5%) and the high 1,3-PD mass uptake (18 – 23%) underscore the comparative
preference of the polymers for 1,3-PD over water. The overlapping error bars meant that
no significant difference between the mass uptakes were noted for the four polymers. The
results are in corroboration with the solubility behavior of the methacrylate monomer in
water versus 1,3-PD

163
A representative FESEM of the membrane is shown in Figure 6.8(b). The average thickness
of the membranes, as obtained by Image J analysis software was ~400 – 450 µm.
Pervaporation results on 1,3-propanediol – water binary feed mixtures
The 1,3-PD and water flux and separation factors for batch pervaporation are illustrated in
Figures 6.9(a) – (c) and 6.10 (a) – (c). Each data point was an average of experiments in
triplicate. The polymers demonstrated high separation factors between 88 and 115. The
highest data point obtained for separation factor was 125 with the homopolymer.1,3-PD
flux between 2.8g/m2h and 3.6g/m2h were obtained. The water flux varied between
2.6g/m2h and 3.8g/m2h.
Effect of Copolymerization
While the separation factors appeared to follow a trend, the error bars obtained from
averaging experimental results in triplicate overlapped indicating statistical insignificance
of the variations. Nonetheless, the incorporation of Butyl acrylate as a comonomer was
seen to reduce the average separation factor from 115 with the homopolymer to 106. It was
accompanied by statistically insignificant changes in either water or 1,3-PD flux. Butyl
acrylate on its own has affinity neither in favor of water nor 1,3-PD.
The incorporation of a small molar percentage of divinyl benzene changed the separation
factor to 97.7. With the DVB copolymer, the flux 1,3-PD reduced. The incorporation of
DVB decreased the affinity of the material towards 1,3-PD and water, since DVB is partial
towards neither component. The extent of crosslinking may be seen as too low to cause

164
any statistically significant change in the flux of the components. However a slight
decrease in 13-PD flux and a slight increase in water flux was noted.
Effect of Temperature
The separation factors for all polymers were seen to decrease very slightly with
temperature. The water flux increased with temperature and this effect was more obvious
with the DVB copolymer than with the other two structures. Similarly, the 1,3-PD flux
increased with temperature with all membrane structures. An increase in temperature
enhances diffusion of both water and 1,3-PD. This causes a concomitant reduction in
selectivity. The results are presented in Figure 6.9 (a) – (c).
Effect of 1,3-PD feed concentration
The average separation factors for the homopolymer and the BuA copolymer decreased
with an increase in the feed 1,3-PD concentration. An increased 1,3-PD in the feed possibly
causes plasticization of the membrane allowing a greater amount of water to diffuse
through. Additionally, 1,3-PD may possibly act as a “water carrier” an enhance the water
transport leading to a decrease in selectivity. A slight anomaly was observed with the DVB
copolymer where the separation factor decreased with an increase in the feed 1,3-PD
concentration from 10g/l to 15 g/l but increased slightly with feed 1,3-PD of 25 g/l. The
results are presented in Figure 6.10 (a) – (c).
Discussions:
In pervaporation, a component is preferentially removed by virtue of its high solubility in
the membrane phase or its higher diffusivity or both [18]. Pervaporation has found

165
applications for removal of water in solvent dehydration, volatile organic removal from
water or in aroma recovery [19]. Amongst all applications, the dehydration of solvents is
the best developed due to the fact that the use of hydrophilic membranes ensures in a
solubility – diffusivity synergistic effect in favor of water selectivity [18, 19]. Water, due
to its smaller molecular size diffuses faster and the use of hydrophilic membranes also
ensures a higher solubility [20]. However, for the separation of organic molecules from
water, the solubility selectivity into the membrane material in favor of the organic molecule
must be higher than that of water [19]. The membrane material must be significantly
hydrophobic and must have substantial affinity for the organic permeant[18, 19]. This is
the way a membrane may reject water and cause selective enrichment of the organic
permeant.
The solubility is proportional to the affinity of a given component for the membrane
material. The affinity is described by the Hansen solubility parameters comprising of
hydrogen bonding interaction (H), polar interaction (P) and dispersion interaction (D).
The large differences in Hansen parameters, especially the hydrogen bonding interaction,
H determines the feasibility of organic solvent dehydration [18]. The proximity of 1,3-PD
with water in terms of these parameters makes the pervaporative separation of 1,3-PD a
difficult task.
While ionic liquids are liquids are room temperature, polymers of ionic liquids (PIL) are
mostly solids [32]. The uses of PILs was targeted at mostly electrochemical applications
[39 – 41]. Their low vapor pressure has also prompted their use in refrigeration and energy
applications requiring fluids for heat transfer [42, 43]. PILs can be synthesized with direct

166
polymerization of the IL monomer [32]. Alternatively, chemical modification of existing
monomeric structure is sought for subsequent polymerization. For example, in synthesizing
a methacryoyl PIL monomer, the conventional route chosen is the conversion of
methacryloyl cfhloride to an ester of an organic alcohol with a halide group at another end
of the alcohol moiety. This is subsequently converted into an imidazolium halide IL and
polymerised through the acrylic double bond [32]. The synthetic scheme explored in this
paper is different and combines simple synthetic routes to derive a novel route (Figure 6.1).
While ILs can be polymerized through almost all conventional routes of addition
polymerization, such as AIBN initiated radical polymerization and controlled radical
polymerzations such as ATRP and RAFT, the incorporation of a thiophene group is
required for oxidative polymerizations [32].
The water solubility of an IL and PIL depends on both the cation as well as the counter
anion. A small alkyl substituent such as ethyl or methyl on the 3-N atom for an imidazolium
halide has been shown to be hydrophilic. However as the size of the alkyl substituent
grows, the hydrophilic character reduces. Similarly the water affinity is defined by counter
anion too [32, 44]. With small counter anions, such as halides NO3-, CF3CO2- etc, if the
character of a given IL is hydrophilic, its water affinity reduces when the counter anion s
substituted by eg; BF6- or CF3SO3-. When the counter anion is substituted by PF6- or
[N(CF3SO2)2]-, the same IL becomes completely hydrophobic [32, 44]. In this case the
counter anion (CH3CH2CH2CH2)2PO4-, derived from the hydrophobic TBP is
sufficiently large and hydrophobic to effectively reject water but still have high affinity for
1,3-PD [21, 32]. This is underscored by the contact angle and water and 1,3-PD mass
uptake results.
167
Hydrolytic instability of many anions such as hexafluorophosphate and tetrafluoroborate
limits their use to anhydrous applications [21, 45]. The research on halogen free,
hydrolytically stable ionic liquids is of current interest and dialkylphosphate anions provide
an easy recourse to the same.
Anion exchange is yet another route in which IL monomers and polymers may be modified
by changing the counter anion [32, 46]. Replacement of halide counter anions with ore
hydrophobic anion have been shown to convert hydrophilic ILs to hydrophicic [46]. This
paper showcases results on batch pervaporations. However, given the simplicity of the
polymerization process and the ease of material availability, the method holds promise for
scale up and use in continuous pervaporation modules. A possible problem that can be
envisaged during continuous pervaporation using the material developed in this work is
that of concentration polarization which is concomitant with high intrinsic enrichments.
Membrane module designs and multilayer membrane structures may be used in the case of
a polymer membrane to optimize separation performance and impart mechanical
robustness to membrane structures.
According to the literature, 1,3-propanediol has been separated from water using
pervaporation through an X-type zeolite membrane where the membrane is selective for
water [15, 16]. Additionally, one report exists on the separation of 1,3-PD from binary
mixtures using an ionic liquid based SLM stabilized in a nano porous module with a
separation factor of 177 and flux of permeability 3.86 g m2 h-1 at 22C [17, 47]. However,
despite the promising performance of this module, the low stability of SLM modules due

168
to leaching and the difficulty of their fabrication into stable and mechanically robust
structures makes them difficult to scale up [30].
Yet another limitations associated with the usage of ionic liquids is the expense associated
with the counter anion [21]. Pervaporation of aqueous broths require that the membrane
materials be hydrolytically stable [45]. Ionic liquids have shown great promise in various
applications but their technical applications are limited by either hydrolytic instability or
high price of the anions for hydrolytically stable ionic liquids [21, 45]. The ionic liquid
structure developed in this work is based on a rather inexpensive 1,3-PD solvent which has
been proven as a hydrolytically stable counter ion in an earlier work.
This work can be directly compared to one investigation on pervaporative separation of
1,3-PD from water. Izak et al (2007) achieved a separation factor of 177 and flux of 3.86
g/m2h at 22C for 1,3-PD in a binary mixture with water [17, 47]. Their work used a
supported liquid membrane (SLM) based on cyanoborate ionic liquid and claimed 9 month
membrane stability. The work reported herein achieved separation factors between 85 -
118 with 1,3-PD fluxes between 2.4 and 3.5 g/m2h. The polymers developed in this work
can be produced as flat sheets that may be fabricated into modules and scaled-up for
commercial separations.
A brief comparison of the material price developed in this work versus that used for the
cyanoborate SLM was carried out with retail price data from Sigma Alridch [48], Oakwood
Chemicals Inc [49] and Fluorochem Ltd. [50]. The computation was based on molecular
structures and prices of the individual chemicals making up the compound. The tetrapropyl
ammonium cyanoborate ionic liquid costs $36,004/mole, while the methacrylate monomer

169
developed in this work costs $168.5/mol. The cost per unit weight of the ionic liquid is
$120/g, while that of the methacrylate monomer developed in this work is $ 0.33/g.
A Price/performance trade off estimate was generated using the experimental results
detailed here and reported in the work on the cyanoborate SLM. A rough estimation was
made of the total volume of membrane material required to reach a final 1,3-PD
concentration of >90%, from a starting composition of 1% 1,3-PD for a feed flow of 100
g/h. The computation assumes that separation factor and flux of 1,3-PD remained constant
after each enrichment stage. This assumption was made because separation factor and flux
data for high 1,3-PD feed concentrations were not available. The average separation factor
for the homopolymer, PVIM, membrane was taken as 104 with an average 1,3-PD flux of
3.0g/m2h. The computation yielded a requirement of 3 enrichment steps requiring a total
pervaporation area of 6000 cm2. The volume required using a 400 micron thick membrane
was computed as 240 cm3. Using the estimated density for the ionic liquid, the cost of the
material required to achieve the aforementioned enrichment level is ~$86.
The same computation was carried out for the cyanoborate ionic liquid membrane
stabilized in a nanoporous ceramic module. The flux of 1,3-PD (3.86 g/m2h) and the
separation factor (177) reported in their work [17,47] were used as constants for the
computation. The same enrichment level from a starting composition of 1% 1,3-PD was
calculated to require 2 enrichment steps with a total area of 4660m2. The thickness of the
module reported [47] is 3 mm (with a 7mm inner diameter and 10 mm outer diameter). The
nano porous module reported in their work has a porosity of 30% [17, 47]. Thus the total

170
cyanoborate ionic liquid requirement is 419 cm3. Assuming a rough density of 1g/cm3, the
cost of material required to achieve the same enrichment level is ~$50,328.
The price versus performance attractiveness, in addition the possibility of fabrication into
variety of membrane module designs and scale up offers this novel polymer as a feasible
route to the alleviating the downstream process bottleneck of 1,3-PD concentration
enrichment in fermentation processes.
Conclusion:
This work developed a novel methacrylate monomer based on a vinylimidazolium-
tributylphosphate IL. The IL based methcrylate monomer was polymerized and
copolymerized with DVB and BuA by conventional AIBN initiated radical polymerization
and fabricatedito plug membranes. Batch pervaporation with 1,3-PD – water binary
mixtures showed high separation factors and moderate 1,3-PD fluxes and were studied at
varying temperatures and 1,3-PD feed concentrations. The Hildebrand solubility arameters
were used to underscore the performance which is determined by the high 1,3-PD solubility
and hydrophobicity of the polymers. The polymers can be an easy to use and cheap
alternatives to conventional processes and other reported developments.
References
1. A.J. Ragauskas, C.K. Williams, B.H. Davison, G. Britovsek, J. Cairney, C.A.
Eckert, W.J. Frederick Jr., J.P. Hallett, D.J. Leak, C.L. Liotta, J.R. Mielenz, R.

171
Murphy, R. Templer, T. Tschaplinski, The path forward for biofuels and
biomaterial, Science. 311 (2010) 484–489.
2. Z.L. Xiu, A.P.Zeng, Present state and perspective of downstream processing of
biologically produced 1,3-propanediol and 2,3-butanediol, Appl Microbiol
Biotechnol. 78 (2008) 917–926.
3. R.K. Saxena, P. Anand, S. Saran, J. Isar, Microbial production of 1,3-propanediol:
Recent developments and emerging opportunities, Biotechnology Advances. 27
(2009) 895–913.
4. A.P. Zeng, H. Biebl, Bulk chemicals from biotechnology: the case of 1,3-
propanediol production and the new trends, in: T. Scheper, K. Schugerl, A.P. Zeng
(Eds.), Advances in biochemical engineering and biotechnology, Vol. 74, Springer-
Verlag, Berlin, Heidelberg, New York, 2002, pp239–59.
5. T.T. Ames, Process for the isolation of 1,3-propanediol from fermentation broth. US
Patent 6361983 B1 (2002).
6. Y. Gong, Y. Tong, X.L. Wang, D.H. Liu, The possibility of the desalination of actual
1,3-propanediol fermentation broth by electrodialysis, Desalination. 161 (2004)
169–178.
7. J. Hao, D.H. Liu, Desalination of fermented broth containing 1,3-propanediol by
electrodialysis, Chinese J Proc Eng. 5 (2005) 36–39.
8. Z. Li, B. Jiang, D. Zhang, Z. Xiu, Aqueous two-phase extraction of 1,3-propanediol
from glycerol-based fermentation broths, Separation and Purification Technology.
66 (2009) 472–478.

172
9. A. Baiada, A. Vitner, R.P. Jansen, A.M. Baniel, Process for producing 1, 3-
propanediol. US Patent 7056439 B2 (2006).
10. A.K. Hilaly, T.P. Binder, Method of recovering 1,3-propanediol from fermentation
broth. US Patent 6479716 B2 (2002)
11. J. Hao, F. Xu, H. Liu, D. Liu, Downstream processing of 1,3-propanediol
fermentation broth, Journal of Chemical Technology and Biotechnology.81(2006)
102–108.
12. J.J. Malinowski, Reactive Extraction for Downstream Separation of 1,3-
Propanediol, Biotechnology Progress. 16 (2000) 76–79.
13. M.H. Cho, S.I. Joen, S.H. Pyo, S. Mun, J.H. Kim, A novel separation and
purification process for 1,3-propanediol, Process Biochem. 41 (2006) 739–744.
14. P. Anand, R.K. Saxena, R.G. Marwah, A novel downstream process for 1,3-
propanediol from glycerol-based fermentation, Appl. Microbiol. Biotechnol. 90
(2011) 1267–1276.
15. S. Li, V.A. Tuan, J.L. Falconer, R.D, Noble, Separation of 1,3- propanediol from
glycerol and glucose using a ZSM-5 zeolite membrane, J. Membr Sci. 191 (2001a)
53–59.
16. S. Li, V.A. Tuan, J.L. Falconer, R.D. Noble, Separation of 1,3- propanediol from
aqueous solutions using pervaporation through an X-type zeolite membrane, Ind
Eng Chem Res 40 (2001b) 1952– 1959.
17. P.Izák, M. Köckerling, U. Kragl, Stability and selectivity of a multiphase membrane,
consisting of dimethylpolysiloxane on an ionic liquid, used in the separation of
solutes from aqueous mixtures by pervaporation, Green Chem. 8 (2006) 947–948.

173
18. P. Shao, R.Y.M. Huang, Polymeric membrane pervaporation, Journal of Membrane
Science. 287 (2007) 162-179.
19. M. Mulder, T. Franken, C.A. Smolders, Preferential sorption versus preferential
permeability in pervaporation, J. Membr. Sci. 22 (1985) 155–173
20. W.J.Koros, Membranes: Learning a lesson from nature, Chem Eng. Prog. 91 (1995)
68–81
21. E. Kuhlman, S. Himmler, H. Giebelhaus, P. Wasserscheid, Imidazolium
dialylphosphates – a class of versatile, alogen – free and hydrolutically stable ionic
liquids, Green Chemistry, 2007, 9, 233-242
22. F. Endres and S. Z. El Abedin, Phys. Chem. Chem. Phys., 2006, 8, 2101–2116
23. R. Kawano, H. Matsui, C. Matsuyama, A. Sato, M. A. B. H. Susan, N. Tanabe and
M. Watanabe, J. Photochem. Photobiol., A, 2004, 164, 87
24. A. Bosmann and T. J. S. Schubert, GB 2005-10772 2414553, 2005
25. T. Brinz and U. Simon, Robert Bosch GmbH, DE 2002-10245337 10245337, 2004
26. K. Fukumoto, M. Yoshizawa and H. Ohno, J. Am. Chem. Soc., 2005, 127, 2398
27. M. Earle in Ionic Liquids in Synthesis, 2003, ed. P. Wasserscheid and T. Welton,
Wiley-VCH, Weinheim, 2003, pp. 174–213
28. T. Welton and P. J. Smith, Adv. Organomet. Chem., 2004, 51, 251
29. R. A. Sheldon, R. M. Lau, M. J. Sorgedrager, F. van Rantwijk and K. R.
Seddon, Green Chem., 2002, 4, 147
30. N.M. Kocherginsky, Q. Yang, L. Seelam, Recent advances in supported liquid
membrane technology. Separation and Purification Technology, Separation and
Purification Technology 53 (2007) 171–177.

174
31. J.J. Malinowski, Evaluation of liquid extraction potentials for downstream
separation of1,3-propanediol, Biotechnology Techniques 13: 127–130, 1999.
32. J. Yuan, M. Antonietti, Poly(ionic liquid)s: Polymers expanding classical property
profiles, Polymer 52 (2011) 1469 – 1482
33. U. Mansfeld, C.Pietsch, R.Hoogenboom, C.Remzi Becer, U.S. Schubert, Clickable
initiators, monomers and polymers in controlled radical polymerizations – a
prospective combination in polymer science, Polym. Chem. 1 (2010) 1560–1598.
34. Y. Xia, R.C.Larock, Castor oil-based thermosets with varied crosslink densities
prepared by ring-opening metathesis polymerization (ROMP), Polymer 51 (2010)
2508-2514.
35. S. Li, R. Srivastava, R.S. Parnas, Separation of 1-butanol by pervaporation using a
novel tri-layer PDMS composite membrane, J. Membr. Sci. 363 (2010) 287–294
36. T. Boyle, A. Szopinski, A. Verrall, Method and apparatus for continuously preparing
crosslinked, solution–cast polymer film. US Patent 20070085235 A1 (2007)
37. Q. Guo, P.N. Pintauro, H. Tang, S.O’Connor, Sulfonated and cosslinked
polyphosphazene – based proton – exchange membranes, J. Membr. Sci. 154 (1999)
175 – 181.
38. C. Maton, N. De Vos, C. V. Stevens, Ionic liquid thermal
stabilities: decomposition mechanisms and analysis tools, Chem. Soc. Rev.,
2013,42, 5963-5977
39. H. Ohno, M. Yoshizawa, W. Ogihara, Electrichimica Acta 50(2004) 255-261
40. W. Ogihara, S. Washiro, H. Nakajima, H. Ohno, Electrochimica Acta 51 (2006)
2614-2619

175
41. H. Nakajima, H. Ohno, Polymer 46 (2005) 11499 – 11504
42. X. Wang, Y. Chi, T. Mu, Journal of Molecular Liquids 193 (2014) 262 – 216
43. D. Zheng, L. Dong, W. Huang, X. Wu, N. Nie, A review of imidazolium ionic
liquids research and development towards working pair of absorption cycle,
Renewable and Sustainable Energy Reviews, 37 (2014) 47 – 68
44. K. Vijayakrishna, S.K. Jewrajka, A. Ruiz, R. Marcilla, J.A. Pomposo, D.
Mecerreyes, D. Taton, Y. Gnanou, Macromolecules, 41 (2008), pp. 6299–6308
45. R.P. Swatloski, J.D. Holbrey, R.D. Rogers, Green Chem , 2003 5, 361
46. R. Marcilla, J. Alberto Blazquez, J. Rodriguez, J.A. Pomposo, D. Mecerreyes,
J Polym Sci Part A Polym Chem, 42 (2004), pp. 208–212
47. P. Izak, M. Köckerling, U. Kragl, Mehrphasen–Membran. German Patent
DE102006024397 B3 (2007).
48. Sigma Alridch, www.sigmaaldrich.com, (accessed November 2013)
49. Oakwood Chemicals Inc,
http://www.oakwoodchemical.com/ProductsList.aspx?CategoryID=-
2&txtSearch=51553&ExtHyperLink=1, (accessed November 2013)
50. Fluorochem Ltd., http://www.fluorochem.co.uk/Products/Product?Code=062234,
(accessed November 2013)

176
Figure 6.1: Monomer Synthesis Scheme
Step 1 Thiol – ene Click Adduct
hµ, AIBN
Step 2
Step 3
Imidazolium DialkylphosphateIonic Liquid
Methacrylate Monomer

177
Figure 6.2: NMR of the monomer synthesis scheme (a) Vinylimidazole 1H NMR, (b)
Thiol – ene click adduct 1H NMR, (c) Imidzolium ionic liquid 1H NMR, Insets showing
the proton shifts for the butyl group attached to Imidazolium nitrogen and the dibutyl
phosphate counter anion
Step 1
Step 2
(a) Vinylimidazole
1,1’
2
35, 4
1,1’2
3
4
5
(ppm)
(b) a
b
b’
b’f
c
d
e
ab’bf
c,d,e
(ppm)
Thiol – ene Click Adduct
Imidazolium ionic Liquid(c)
(ppm)
, µ
*#
µ
#
*
~1.77
N+– CH2CH2CH2CH3
~0.86~1.26
~4.27
~1.43
P(OCH2CH2CH2CH3)2
~0.74~1.22
~3.71

178
Figure 6.3: NMR of the monomer synthesis scheme (a) Methacrylate monomer 1H NMR,
(b) Methacrylate Monomer 13C NMR, Insets showing the carbon shifts for the butyl
group attached to Imidazolium nitrogen and the dibutyl phosphate counter anion

179
Figure 6.4: Monomer Characterization (a) FTIR, (b) TGA
(b)
% C
han
ge in
wei
ght
Temperature (0C)
(a)
Wavenumber (cm-1)

180
Figure 6.5: Photographs of monomer solubility (a) In water, arrow indicating the
insoluble droplet of monomer in water (b) In 1,3-propanediol
Drop of methacrylate monomer in Water
Drop of methacrylate monomer in 1,3-PD
(a)
(b)

181
Figure 6.6: NMR of the polymers (a) PVIM - Homopolymer 1H NMR , (b) PVIM_BuA
Copolymer 1H NMR, (c) PVIM_DVB Copolymer 13C NMR

182
Figure 6.7: Polymer Characterization (a) DSC (b) Contact Angle
(a)
Temperature (C)
0
50
100
150
PVIM PVIM_BuA PVIM_DVB
Water 1,3-PD
Co
nta
ct A
ngl
e (
)
(b)
PVIM_DVB
PVIM_BuA
PVIM
183.2C
176.5C
179.3C
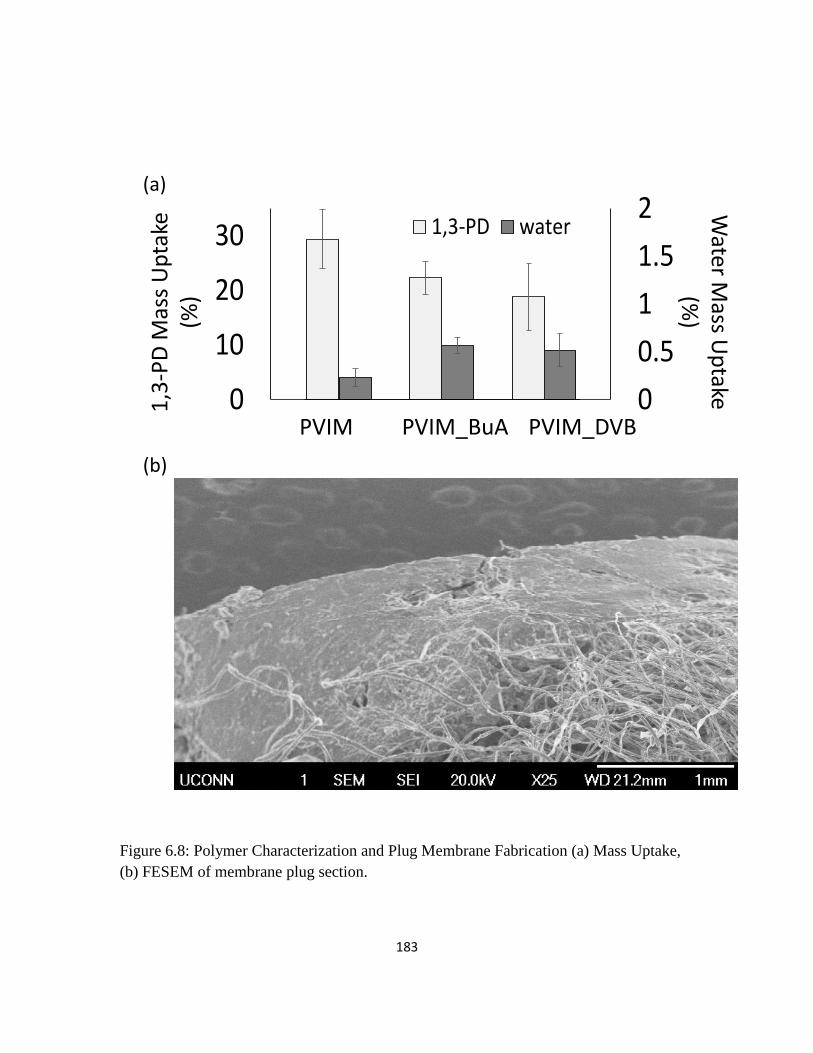
183
Figure 6.8: Polymer Characterization and Plug Membrane Fabrication (a) Mass Uptake,
(b) FESEM of membrane plug section.
0
0.5
1
1.5
2
PVIM PVIM_BuA PVIM_DVB
water
0
10
20
30
PVIM PVIM_BuA PVIM_DVB
1,3-PD
PVIM PVIM_BuA PVIM_DVB
1,3
-PD
Mas
s U
pta
ke(%
)
Water M
ass Up
take(%
)
(a)
(b)

184
Figure 6.9: Component flux and separation factors with varying temperatures (a) Water
Flux (b) 1,3-PD (c) Separation factors
1.8
2.2
2.6
3
3.4
3.8
0 1 2 3 4
water flux 30 C
water flux 40C
water flux 50C
Wat
erFl
ux(g
/m2
h)
2
2.5
3
3.5
4
4.5
0 2 4
1,3-PD Flux 40C
1,3-PD flux 50C
1,3-PD flux 30C
1,3-PD Flux
(g/m2h)
0
50
100
150
PVIM PVIM_BuA PVIM_DVB
30C
40C
50C
Sepa
rati
on F
acto
r
PVIM PVIM_BuA PVIM_DVB
PVIM PVIM_BuA PVIM_DVB
PVIM PVIM_BuA PVIM_DVB
(a)
(b)
(c)

185
Figure 6.10: Component flux and separation factors with varying feed 1,3-PD
concentrations (a) Water Flux (b) 1,3-PD (c) Separation factors
1.8
2.3
2.8
3.3
3.8
0 1 2 3 4
water flux 10g/l feed
water flux 15g/l feed
water flux 25g/l feed
Wat
erFl
ux
(g/m
2h
)
2
2.5
3
3.5
4
0 1 2 3 4
1,3-PD Flux 15g/l feed
1,3-PD flux 25g/l feed
1,3-PD flux 10g/l feed
1,3
-PD
Flux
(g/m2
h)
0
50
100
150
PVIM PVIM_BuA PVIM_DVB
10g/l
15g/l
25 g/l
Sep
ara
tio
n F
act
or
PVIM PVIM_BuA PVIM_DVB
PVIM PVIM_BuA PVIM_DVB
PVIM PVIM_BuA PVIM_DVB
(a)
(b)
(c)

186
Chapter 7. Pervaporative enrichment of 1,3-propanediol from model fermentation
broths by hydrophobic specialty polymers
Abstract
The present work describes a study on the pervaporation enrichment of 1,3-propanediol
from model fermentation broths using three hydrophobic polymer families – functionalized
siloxanes, cyclohexylamine base methacrylates and imidazolium ionic liquid based
methacrylates with progressively increasing separation efficiency. While the highest 1,3-
PD permeabilities were seen with the siloxane polymers, the imidazolium IL based
methacrylates exhibited the best separation factors both with respect to water and glycerol.
The effect of glycerol on transport coupling was evaluated. The permeability and
separation factors from the pervaporation experiments with these polymers were siloxanes
were collated to arrive at a Robeson’s upper bound of pervaporation of 1,3-propanediol
from aqueous solution by polymeric membranes.
Keywords: 1,3-propanediol, membranes, pervaporation

187
1. Introduction
The production of 5 – 10 gallons of crude glycerol for every 100 gallons of
biodiesel, in addition to glycerol being produced as a byproduct from other industries, has
led to a current glycerol overcapacity [1]. The bio-fermentation of crude glycerol to 1,3-
propanediol as a value added product gives a recourse to capitalizing on the current over
capacity of glycerol as it does to improve the economic viability of biodiesel production
[1]. The principle process bottleneck in fermentative conversion of glycerol to 1,3-PD lies
in the downstream enrichment of 1,3-PD concentration given that it has to be enriched from
very low starting concentrations [2-4]. While the main difficulty lies in enriching 1,3-
propanediol from water, it also needs to be separated from other products of fermentation
[2, 5]. Conventional processes, like evaporation, chromatography and reactive extraction
amongst others are associated with either high energy usage or yield and process
complication issues [5-18]. Pervaporation mitigates the challenge of high energy
associated with processes involving phase change as it deals with the minor component
[19]. Additionally, pervaporation membranes are tailored to have affinities to favor the
enrichment of a select component. Pervaporation has found viable application in solvent
dehydration, removal of volatile organic content, aroma recovery and some
organic/organic separations [19].
Water, as a smaller molecule, diffuses faster than 1,3-PD. Thus, membrane
materials with a high preferential sorption of 1,3-PD and low water solubility allow
preferential permeation of 1,3-PD across a membrane [19, 20]. A real time fermentation

188
system deals with separating 1,3-PD from other broth components in addition to water. The
presence of glycerol in concentrations, at times, exceeding those of 1,3-PD makes it an
important factor in affecting separation efficacy. The membrane affinity for each individual
component and the ability of each individual component to effect a coupled transport
phenomenon drives the eventual efficacy of the membrane, both in enriching 1,3-PD from
water as well as separating it from other broth components [19].
The pervaporative separation of 1,3-PD from model aqueous fermentation broths has been
studied in earlier work on zeolite membranes [16, 17]. However, since such membranes
work by size exclusion processes, the systems proved to be selective towards water [16,
17]. Izak et al reported the application of a cyanoborate ionic liquid based supported liquid
membrane in batch pervaporation with high separation factors for 1,3-PD enrichment from
binary aqueous feed [18].
While the membranes examined in this work base their separation efficacy on the wide
difference in solubility of water and 1,3-PD, a compromise on the 1,3-PD flux becomes
unavoidable to achieve a high separation factor. A hydrophilic membrane with a 1,3-PD
mass uptake several times that of water may prove to be inefficient in separating 1,3-PD
from water. While, ideally, its sorption characteristics may tilt the balance in favor of 1,3-
PD permeation, coupling of water transport with 1,3-PD along with swelling of the
membrane allows for water permeation greater than expected reducing the separation
efficacy despite showing higher flux. Preferred membrane chemistries are hence those that
not only have large differences between mass uptakes of water and 1,3-PD but also

189
concomitantly reject water [21]. As a caveat, such structures also have a limitation in their
affinity towards 1,3-PD, owing to the proximity of thermodynamic parameters of 1,3-PD
and water, which contribute to the limitation in flux, resulting in the upper bound [22]. The
development and fine tuning of such materials and membrane structures based on a
combination of 1,3-PD enriching materials are steps towards establishment of
commercially viable and energy efficient alternatives to conventional purification
processes.
In this paper, three membrane material systems are examined for properties and
pervaporation performance with simulated model broth compositions. The first system is
an allylcyclohexylamine functionalized siloxane and its phase separated blend with
styrene-butyl acrylate copolymer. The phase separated blend allowed for the recovery of
mechanical strength lost due to functionalization without loss in separation performance.
The second system is a conventional radical polymer based on an allylcyclohexylamine
based methacrylate monomer which was synthesized using thiol-ene click chemistry. The
third material is also a methacrylate polymer system based on an ionic liquid of tributyl
phosphate (TBP). Its synthesis involved the conversion of vinyl imidazole into an alcohol
using a thiol-ene click chemistry step. This was followed by the formation of an
imidazolium ionic liquid by high temperature reaction with TBP, in which the
dibutylphosphate anion formed the counter ion for the imidazolium cation. The remnant
hydroxyl on the IL was subsequently esterified and converted to a methacrylate monomer
which was then polymerized by simple radical polymerization. All three systems are
hydrophobic materials with high affinity for 1,3-propanediol. The pervaporative
performance is examined with continuous pervaporation in one material system, while the

190
other two are studied in a batch pervaporation set up with a small plug membrane. The
separation factors of 1,3-PD over water as well as its preferential enrichment over other
broth components is examined with respect to temperature and glycerol concentration.
Coupling effects were examined by comparing results under similar process conditions
with binary 1,3-PD feed mixtures. The effect of temperature on the coupling was also
evaluated. The permeability and separation factors were collated from this work and
compared with earlier works on binary mixtures, zeolite membranes and ionic liquid
supported liquid membrane systems to estimate a Robeson’s upper bound for pervaporative
enrichment of 1,3-PD.
2.Experimental
2.1 Materials:
Poly(methylhydrosiloxane) (PHMS) of degree of polymerization ~ 35 to 40,
Allylcyclohexyl amine (ACA), Vinylimidazole (VIM), Tributyl Phosphate (TBP),
Methacryloyl chloride, Styrene, Divinyl benzene (DVB) and Butyl acrylate monomer
(BuA) were dried prior to use. The Chloroplatinic acid, Dibutyl Tin dilaurate, Potassium
persulphate, tert-Butyl perbenzoate, Sodium bicarbonate, Sodium
dodecylbenzenesulfonate, AIBN radical initiator and Tetraethyl orthosilicate (TEOS) were
used without modification. 1,3 propanediol (1,3-PD), 98% purity, Glycerol, Ethanol,
Butyric Acid and Acetic Acid were used for the partition coefficient measurements and for
preparation of binary mixtures with distilled water as feed solutions for pervaporation
experiments. The solvents Toluene, Chloroform, Dioxane and Hexane were dried prior to
use. All chemicals were purchased from Sigma Aldrich. Porous polyethylene sheets were

191
obtained from Interstate Specialty Products for use as the support sheet for membrane
fabrication. The nominal thickness reported was 500 microns with pore diameters of 75 -
110 microns and a porosity of 48%. For the fabrication of the plug membranes, 0.65cm
inner diameter glass pipettes from Fischer were used. Cotton wool was used to act as the
porous support base and was purchased from the local market.
2.2 Polymer Synthesis and Membrane Fabrication
2.2.1Allylcyclohexylamine functionalized Siloxane polymer and phase-separated
blend
The PHMS was functionalized with ACA by hydrosilylation using the Chloroplatinic acid
catalyst solution. The reaction was carried out in a clean and dry glass pressure tube flushed
with high purity argon on a schlenk line. A 25mg/ml chloroplatinic acid catalyst solution
in isopropanol was prepared. A typical run consisted of 1.5 g PHMS with varying
quantities of ACA, depending upon the targeted extents of substitution, and 1 ml of toluene
as solvent. The catalyst solution was added to the extent of 5 l/ml of reaction volume. The
reaction temperature was controlled at 70 ±20C. All reagents were thoroughly dried prior
to use.
A high molecular weight Styrene-Butyl acrylate copolymer (SBA) was synthesized by
emulsion polymerization. The reaction was carried out at 800C in a 250 ml two necked
round bottom flask fitted with a reflux condenser with the system being constantly purged
with nitrogen. A typical batch consisted of 50 g deionized water, 0.5g Potassium
Persulphate, 0.25g Sodium Bicarbonate, 1g Sodium dodecylbenzenesulfonate 0.25g tert-

192
Butyl perbenzoate, 50g Butyl acrylate and 50g Styrene. Sodium bicarbonate and Sodium
dodecylbenzenesulfonate were added beforehand and the monomer mixture was added
dropwise over a period of 15 minutes through the second neck. After the monomer
addition, the temperature was reduced to 650C and the Potassium Persulphate and tert-
Butyl perbenzoate added and the reaction was allowed to run for 2 hours. A silicone rubber
tube fitted with a needle was used to blanket the surface of the reaction mixture with
nitrogen throughout the 2h course of the reaction. At the end of the reaction, the emulsion
was flocculated by Sodium Chloride, the flocculated polymer washed thoroughly and
repeatedly, centrifuged and dried at room temperature. ACA functionalized PHMS
polymers were blended with the emulsion polymerized Styrene-Butylacrylae polymer
(SBA) and TEOS. The SBA and TEOS were kept at 10% and 2% of the total weight while
the Dibutyl Tin Dilaurate catalyst was kept at 0.1% by weight of the mixture. A small
amount of toluene was added to this mixture to lower its viscosity. A piece of porous
Polyethylene sheet was soaked in measured quantities of this mixture and the solvent was
allowed to evaporate at room temperature over a period of ~ 24 hours. The membrane was
then allowed to cure at 600C for 4 days to ensure completion of crosslinking and cut to the
required shape. Membranes were fabricated using 50%, 70% and 90% ACA functionalized
PHMS and were given the nomenclature 50ACA, 70ACA and 90ACA respectively. The
details of polymerization, polymer characterization and membrane fabrication are
delineated in Chapter 4. The chemical structure of the membrane polymer is shown in
Figure 7.1 (a).

193
2.2.2 Allylcyclohexylamine based methacrylate polymer and copolymers
A thiol-ene click chemistry adduct was synthesized by AIBN mediated addition of the allyl
double bond of the ACA to the thiol bond of mercaptoethanol. The reaction was carried
out in a pressure tube, in bulk, and in the presence of UV light at 600C. The pressure tube
was degassed with dry argon in a schlenk line and the reactants kept under argon pressure.
The click adduct was esterified using methacryloyl chloride and triethyl amine as the
catalyst to form the methacrylate monomer. The click adduct was dissolved in dry toluene
and a stoichiometric amount of methacryloyl chloride and triethylamine were added, and
the mixture was refluxed at 700C for 12 hours. The toluene was evaporated from the system
at 400C overnight. The resultant mixture of the methacrylate monomer and triethyamine
hydrochloride was added to hexane. The triethyamine hydrochloride being hexane
insoluble separated out, and the supernatant fluid containing the methacrylate monomer
was filtered and the hexane evaporated overnight in a vacuum oven at 400C. AIBN initiated
radical polymerization was carried out in dioxane solvent with the methacrylate monomer.
The methacrylate monomer was also copolymerized with 5mol% BuA or 5mol% DVB.
The resultant polymers are referred to below as P(Acryl), P(Acryl)_BuA and
P(Acryl)_DVB, respectively. The polymerizations were carried out at 700C in a 250 ml
two necked round bottom flask fitted with a reflux condenser with the system being
constantly purged with nitrogen. Plug membranes were fabricated inside 0.65 cm inner
diameter glass pipettes. The glass pipettes were weighed and stuffed with a known weight
of dry cotton wool. A small, but known weight of dry cotton wool was soaked with the
polymer solution and the solvent allowed to evaporate slowly at 40C over a period of 3-4
days. When the solvent had nearly all evaporated, the polymer solution soaked cotton wool

194
was lightly pressed with a flat surface to set the membrane on top of the cotton wool base
inside the glass pipettes, and the weight of the plug noted. The solvent was allowed to
further evaporate over a period of 1 week at room temperature till the plug attained a
constant weight. The slow solvent evaporation was carried out to prevent the formation of
pinholes and to allow the plug membrane to adhere to the inner wall of the glass pipettes.
This process gave rise to a fiber supported membrane structure. The volume inside the
glass pipette above the membrane was used to hold ~1.5-1.7 ml of pervaporation feed
solution. The details of polymer synthesis, characterization, membrane fabrication and
characterization are delineated in Chapter 5. The chemical structure of the membrane
polymers is shown in Figure 7.1 (b).
2.2.3 Imidazolium alkylphosphate ionic liquid based methacrylate polymer and
copolymer:
A thiol-ene click chemistry adduct was synthesized by AIBN mediated addition of the vinyl
double bond of the VIM to the thiol bond of mercaptoethanol. The solventless reaction was
carried out in a schlenk tube at 600C in the presence of UV and catalyzed by AIBN. The
reactants were weighed out in stoichiometric amount. The click adduct was subsequently
reacted with TBP at 1400C. The dibutyl phosphate anion serves as the counter ion for the
imidazolium cation in this ionic liquid. The remnant hydroxyl group from the
mercaptoethanol moiety on the ionic liquid was subsequently esterified using methacryloyl
chloride and triethyl amine as the catalyst as per the method detailed in the previous section.
The methacrylate monomer was homopolymerized and copolymerized separately with

195
5mol% of BuA, and 5mol% of DVB using AIBN initiator. The nomenclatures for these
polymers were PVIM, PVIM_BuA and PVIM_DVB for the homopolymer, butyl acrylate
copolymer and divinylbenzene copolymer respectively. The details of polymer synthesis,
characterization, membrane fabrication and characterization are delineated in Chapter 6.
The chemical structure of the membrane polymer is shown in Figure 7.1 (c). Plug
membranes were fabricated as per the method detailed in the previous section.
2.3 Feed Compositions:
The model broth feed compositions to the membranes were kept close to the compositions
of the fermentation product streams obtained for steady states with CSTR runs reported in
Chapter 2. The three membrane feed compositions were as follows and they represent the
compositions obtained with fermentation product streams at dilution rates of 0.04h-1,
0.11h-1 and 0.19h-1 respectively:
Feed composition M1: 1,3 PD: 10 g/l, Glycerol :15 g/l, Acetic Acid: 1.5 g/l , Butyric acid:
2 g/l, Ethanol: 0.5 g/l
Feed composition M2: 1,3 PD: 6 g/l, Glycerol :25 g/l, Acetic Acid: 1 g/l , Butyric acid: 1.5
g/l, Ethanol: 0.2 g/l
Feed composition M3: 1,3 PD: 3 g/l, Glycerol :30 g/l, Acetic Acid: 0.5 g/l , Butyric acid:
0.5 g/l, Ethanol: 0.1 g/l
M1, M2, M3, represent membrane feed compositions corresponding to the fermentation
product stream obtained from using fermentation feed composition optimized by the
196
Design of experiment (detailed in Chapter 2) at dilution rates of 0.04h-1, 0.1h-1 and 0.19 h-
1 respectively.
2.4 Analytical Methods:
The concentrations of individual components in the initial feed solutions and permeate
samples from the pervaporation experiments were analyzed using 0.22µm syringe filtered
aqueous samples by gas chromatography (GC) using a DB-FFAP capillary column and an
MS detector and a 1µL injection volume. GC injector, detector and initial oven
temperatures were kept at 240C, 270C, and 40C respectively. The GC was standardized
with broth compositions of progressively increasing concentration of each component.
2.5 Partition Coefficient Measurement:
The partition coefficient of 1,3-PD, glycerol, ethanol, acetic acid and butyric acid between
water and TBP and between water and ACA was determined at 30C. 1 ml of a 10g/l
solution of the respective component was mixed with 1ml of TBP or ACA for 15 minutes
and the layers allowed to separate. The concentration of each tested component in the
aqueous phase was determined by GC before and after partitioning. The following equation
was used to compute the coefficient of partition:
𝐾𝑝 =𝐶𝑜𝑟𝑔𝑎𝑛𝑖𝑐 𝑝ℎ𝑎𝑠𝑒
𝐶𝑤𝑎𝑡𝑒𝑟 ------------------(1)

197
2.6 Pervaporation experiments:
2.6.1 Continuous Pervaporation :
Continuous Pervaporation was carried out on Functionalized Siloxane membranes
(50ACA, 70ACA and 90ACA). Pervaporation was carried out in a custom made membrane
holder providing a pervaporation area of 43cm2. It was fabricated at the Technical Services
Facility at University of Connecticut [21]. The feed solutions consisting of 1,3-PD-water
binary mixtures were maintained at various temperatures. The feed solutions were
recirculated over the membrane on a perforated brass support in the membrane holder by
a peristaltic pump, providing a range of controllable cross flow rates. The permeate was
collected in two parallel cold traps, cooled in a dry ice – acetone bath. A vacuum pump
was employed to maintain the permeate side pressure at less than 1 mm Hg. Permeate
samples were collected at regular time intervals until steady state was reached. The
permeate compositions were analyzed by gas chromatography. The pervaporation
equipment used and its schematic are detailed in an earlier work by Li et al 2010 [21].
Pervaporation experiments were carried out at a constant cross flow rate of 32l/h and
temperatures of 300C, 400C and 500C using the feed compositions detailed in the earlier
section. The feed composition was also evaluated from time to time to verify the
concentrations of the components. The key performance indicators of the pervaporation
experiment were the component fluxes and the separation factor defined as:
=
𝐽𝑖𝐽𝑗𝑥𝑖𝑥𝑗
--------------(2)

198
Where Ji and Jj represent the fluxes of the ith and jth component and xi and xj represent the
feed mass fractions of the ith and jth component, respectively.
2.6.2 Batch Pervaporation
Batch pervaporation was carried out on the Allylcyclohexylamine based methacrylate
polymers [P(Acryl), P(Acryl)_BuA and (PAcryl)_DVB)] as well as the imidazolium
dialkylphosphate based methacrylate polymers [PVIM, PVIM_BuA and PVIM_DVB]
using plug membranes fabricated as described above. The plug structures were affixed in
an upright position in a water bath at 300C. The plug membrane had a pervaporation area
of 4.91 mm2. Each batch pervaporation experiment was allowed to run for a period of 20 -
25 hours and the permeate collected in a small dry–ice cooled trap. A vacuum pump was
employed to pull a vacuum of 1 – 3mmHg on the downstream side. The permeate collected
was thawed, weighed, diluted and analyzed for 1,3-PD concentration by GC. Pervaporation
was monitored by key performance indicators of permeate flux for each component and
separation factor given by equation 2.
3.Results and Discussions:
3.1 Partition Coefficient:
The partition coefficients of 1,3-PD, Glycerol, Ethanol, Acetic acid and Butyric Acid in
ACA and Tributyl Phosphate (TBP) over water are shown in Figure 7.2.
Allylcyclohexylamine is a hydrophobic solvent, with a Log Pow (Octanol – water
redistribution coefficient) ~ 2.2 – 2.4, in which 1,3-PD is miscible in all proportions.

199
TBP is a hydrophobic solvent, with a Log Pow (Octanol – water redistribution coefficient)
~4 in which 1,3 propanediol is miscible in all proportions.
Both ACA and TBP show a fairly favorable partition coefficient in favor of 1,3-PD.
However, since 1,3-PD is infinitely soluble in water, the partition coefficient of these and
other solvents have not been found to be high enough for economically feasible solvent
extraction processes [22]. The partition coefficient of glycerol and ethanol follow 1,3-PD
for both the solvents. The partition coefficients of acetic acid and butyric acid are very low
in both ACA and TBP, despite the fact that ACA being a secondary amine may be expected
to show some basicity.
3.2 Individual Component Mass Uptakes:
The results of mass uptake experiments are shown in Figure 7.3. All three polymer systems
are fairly hydrophobic with water mass uptakes <1% [21]. The functionalized siloxane
polymers show the lowest water mass uptake amongst the three families of polymers.
The hydrophobic character of the Allylcyclohexylamine methacrylate polymer system and
the Imidazolium Ionic liquid based methacrylate polymer system are comparable. With the
latter, the homopolymer (PVIM) has the lowest water uptake. For the ACA Acrylate
system, the water uptake was reduced by copolymerization with 5% BuA and DVB.
The mass uptakes of ethanol, acetic acid and butyric acid are comparable for the three
polymer systems and lie within 0.3 – 1.8%.
The mass uptake of glycerol for the functionalized siloxane system hovers around 2-3%
and shows no trend with increasing ACA functionalization of the siloxane. Interestingly,

200
the high molecular weight styrene – butylacrylate copolymer used to make the phase
separated blend in the siloxane system was tested for pervaporative enrichment of one such
model broth (data not shown) and was found to be selective in favor of glycerol while
failing to enrich 1,3-PD. The mass uptake of glycerol for the ACA based methacrylate
polymers [P(Acryl), P(Acryl)_BuA and P(Acryl)_DVB], is around 7 – 9 %. Similar
glycerol mass uptake values are observed for PVIM, PVIM_Bua and PVIM_DVB.
The mass uptake of 1,3-PD for the functionalized siloxane system increases with increasing
levels of functionalization and lies within 2 – 5%. The 1,3-PD mass uptake for the ACA
based methacrylate polymer decreases with copolymerization with BuA and DVB and lies
in the range of 17 – 20%. The same trend is noted with the imidazolium based methacrylate
polymers and this system has the highest affinity for 1,3-PD with mass uptakes between
18 – 30%. The three systems, chronologically developed, can be seen as groups with
progressively increasing 1,3-PD affinity over water and have been shown in earlier
chapters to be progressively more efficient in enriching 1,3-PD from binary feeds.
Additionally, after water, glycerol is the other component present in a significant
concentration that 1,3-PD needs to be separated from. A comparison of the three polymer
systems also reveals that the relative difference in affinity for 1,3-PD versus glycerol
increases in favor of 1,3-PD with the siloxane being the lowest, followed by the ACA-
methacrylate system. The imidazolium ionic liquid based polymers have the greatest
difference between 1,3-PD and glycerol mass uptakes.
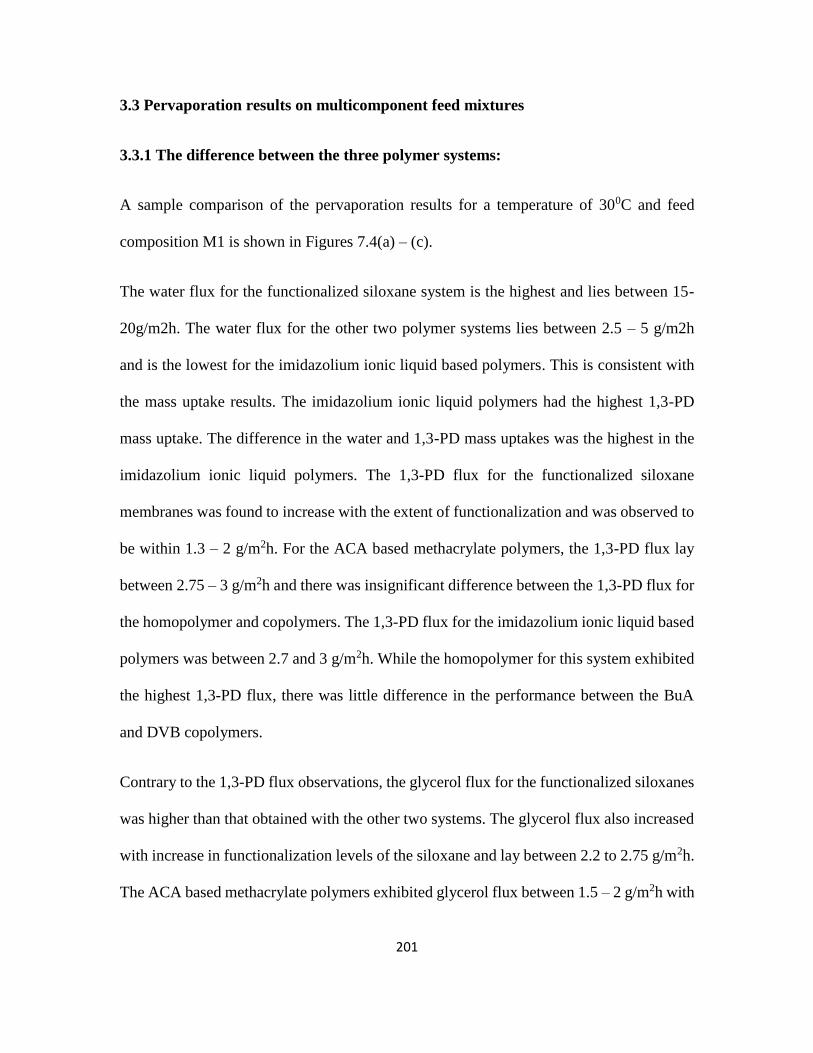
201
3.3 Pervaporation results on multicomponent feed mixtures
3.3.1 The difference between the three polymer systems:
A sample comparison of the pervaporation results for a temperature of 300C and feed
composition M1 is shown in Figures 7.4(a) – (c).
The water flux for the functionalized siloxane system is the highest and lies between 15-
20g/m2h. The water flux for the other two polymer systems lies between 2.5 – 5 g/m2h
and is the lowest for the imidazolium ionic liquid based polymers. This is consistent with
the mass uptake results. The imidazolium ionic liquid polymers had the highest 1,3-PD
mass uptake. The difference in the water and 1,3-PD mass uptakes was the highest in the
imidazolium ionic liquid polymers. The 1,3-PD flux for the functionalized siloxane
membranes was found to increase with the extent of functionalization and was observed to
be within 1.3 – 2 g/m2h. For the ACA based methacrylate polymers, the 1,3-PD flux lay
between 2.75 – 3 g/m2h and there was insignificant difference between the 1,3-PD flux for
the homopolymer and copolymers. The 1,3-PD flux for the imidazolium ionic liquid based
polymers was between 2.7 and 3 g/m2h. While the homopolymer for this system exhibited
the highest 1,3-PD flux, there was little difference in the performance between the BuA
and DVB copolymers.
Contrary to the 1,3-PD flux observations, the glycerol flux for the functionalized siloxanes
was higher than that obtained with the other two systems. The glycerol flux also increased
with increase in functionalization levels of the siloxane and lay between 2.2 to 2.75 g/m2h.
The ACA based methacrylate polymers exhibited glycerol flux between 1.5 – 2 g/m2h with

202
slightly higher fluxes being obtained with the homopolymer than with the copolymers. The
glycerol flux for the imidazolium based polymers were significantly lower than those of
the other two systems and were observed to be between 0.8 – 1 g/m2h. The difference
between the hompolymer and copolymer was insignificant.
The fluxes of ethanol, acetic acid and butyric acid were significantly higher for the siloxane
polymer compared to the other two systems.
The Separation factor of each permeating component with respect to water is shown in
Figure 7.4b. The Separation factor of 1,3-PD for the siloxane polymers was observed to be
in the range of 7 – 15. Those for the ACA based methacrylate polymers was seen to lie
between 60 – 72, while the imidazolium ionic liquid based polymers showed the highest
efficiency with separation factors in the range of 90 – 117.
The separation factor for glycerol with respect to water was between 9 and 11 for the
siloxane system. The enrichment of glycerol for the ACA based methacrylate polymer
system and the imidazolium based methacrylate polymers was similar with separation
factor between 25 and 30.
Ethanol concentration enrichment for the siloxane polymers was higher than that with the
other two polymeric systems with separation factors between 10 and 12. The
ACA_methacrylate polymer system showed ethanol separation factors between 4 and 8
with a slightly higher enrichment seen with the copolymers. The
imidazolium_methacrylate polymers showed ethanol separation factors between 4 and 6.
The separation factor of acetic acid for the siloxane polymers was between 3 and 4. This

203
was closely followed by the imidazolium_methacrylate polymers with separation factors
between 2 and 3 and the ACA_methacrylate polymers with separation factors between 1
and 1.5. There was a significant disparity between the enrichment of butyric acid by the
siloxane polymers in comparison to the other two systems. While the separation factor of
butyric acid for the siloxanes was between 3 and 5, that for the other two systems was as
low as 0.8 to 1.1.
The separation factor of 1,3-PD over the other broth components was also computed from
equation 2 and the results are shown in Figure 7.4c. The siloxanes enriched both 1,3-PD
and glycerol but failed to enrich 1,3-PD in favor of glycerol with the 1,3−𝑃𝐷𝑔𝑙𝑦⁄
values
lying between 0.7 and 0.9. The ACA_methacrylate polymers, on the other hand
preferentially enriched 1,3-PD over glycerol with 1,3−𝑃𝐷𝑔𝑙𝑦⁄
between 2.4 and 2.7. The
imidazolium_methacrylate polymers were the most efficient in preferential enrichment of
1,3-PD over glycerol with 1,3−𝑃𝐷𝑔𝑙𝑦⁄
between 4.3 and 4.6. Similar observations were made
with the preferential enrichment of 1,3-PD over other components. While 1,3-PD was
preferentially enriched over ethanol, acetic acid and butyric acid by the siloxane polymer,
the performance of the other two systems was significantly superior. This is underscored
by the mass uptake results.
Thus, the overall permeability of 1,3-PD is higher with the sioxanes, but the separation
efficacy is superior with the other two polymer families. It is common for membrane
separation systems to show a trade off between the permeability and separation efficacy
and this forms the basis for defining a performance upper bound [23].

204
3.3.2 Pervaporation results: The effect of temperature
Pervaporation was carried out with all the polymer systems at temperatures of 30, 40 and
50C. The results are shown in Fig 7.5a – c.
The separation factor of 1,3-PD over water (Fig 7.5a) was seen to decrease for all systems.
For the siloxanes, the effect was sharp with an increase in temperature from 30 – 40 C, but
tapered off with further increase in temperature. Increase in temperature causes an increase
in diffusivity of all components and hence a reduction in selectivity. A similar trend was
seen for pervaporation with binary feed systems in an earlier work with the siloxane
polymer membranes.
The same trend was seen for all ACA_methacrylate polymers, wherein the separation
factor decreased from ~70 to 57 for the homopolymer as well as copolymers. Similarly for
the imidazolium_methacrylate polymers where the separation factors decreased from
values as high as ~117 to 75 upon increasing the temperatures from 30 to 50C. In addition
to an increase in diffusivity, the polymers may be thought to increasingly swell due to the
permeating components with increased temperature and that aids the diffusion through of
water causing a reduction in separation efficiency.
Interestingly, the separation factor of 1,3-PD over glycerol (1,3−𝑃𝐷𝑔𝑙𝑦⁄
), shown in Fig 7.5b.
was not significantly altered with increase in temperature, and this observation was seen
for all three families of polymers. Increase in temperature reduces the separation factor of
glycerol with respect to water (𝑔𝑙𝑦𝑤𝑎𝑡𝑒𝑟⁄
). While increase in temperature increases the flux
of all components, the increase in glycerol and 1,3-PD diffusivity is expected to be lower

205
than that of water owing simply to their molecular sizes compared to water. It is likely that
the concomitant increase in flux of glycerol and 1,3-PD with temperature may have
balanced out resulting in no significant trend in 1,3−𝑃𝐷𝑔𝑙𝑦⁄
.
The flux of 1,3-PD with temperature is shown in Figure 7.5c. Barring two anomalous data
points with 90ACA and P(Acryl), the flux of 1,3-PD increased with temperature.
3.3.3 Pervaporation results: The Effect of Feed Glycerol Concentration
Pervaporation with different feed compositions was carried out using the 90ACA (Siloxane
system), P(Acryl) (ACA_methacrylate system) and PVIM (Imidazolium_methacrylate
system) polymers only (Fig.7.6). Feed compositions M1, M2 and M3 were employed at a
temperature of 30C. While the feed compositions M1, M2 and M3 vary the concentrations
of other broth components, the results were chosen to be plotted against glycerol
concentration due to the fact that glycerol is present in a much higher concentration and is
more likely to affect the transport properties and swell the membrane than ethanol, acetic
acid and butyric acid. Additionally, from the mass uptake results, it is obvious that the
membranes have a much higher affinity for glycerol compared to ethanol, acetic acid and
butyric acid and thus glycerol is more likely to be absorbed and the activity of glycerol
inside the membrane is likely to be higher with a correspondingly greater effect on the
transport of 1,3-PD and water.
The separation factor of 1,3-PD over water (1,3𝑃𝐷𝑤𝑎𝑡𝑒𝑟⁄
) was seen to decrease with
increasing glycerol concentration in the feed. This is shown in Figure 7.6a. The most likely
reason for this was the swelling of the membrane in the presence of glycerol which causes

206
higher diffusion of all components and a decrease in selectivity. Also, glycerol may be
responsible for coupled water transport and may act as a carrier for water additionally
causing a reduction in separation factors.
The separation factor of 1,3-PD over glycerol (1,3𝑃𝐷𝑔𝑙𝑦⁄
) undergoes a sharp decrease with
increasing glycerol concentration and this is shown in Fig 7.6b. Figure 7.6c. shows the 1,3-
PD flux versus glycerol feed concentration. It is interesting to note that 1,3-PD flux
decreases with increasing glycerol feed concentration indicating that glycerol competes
with 1,3-PD for permeation through the membrane. Additionally, the formation of
hydrogen bonded molecular associations in the feed between 1,3-PD and glycerol is not
unlikely [24]. Such loose associations at both ionic and molecular level for salts and polar
organic molecules are known to exist which become increasingly diffuse with dilution and
vanish near infinite dilution [25]. Such an “associated” entity may depress the diffusivity
of 1,3-PD and hence its permeability on the pretext of its “larger” size.
3.3.4 Pervaporation results: Coupling Effect Vs Temperature
The pervaporative performance of all membranes with binary 1,3-PD–water feed solutions
were compared with model broth solutions. While binary solutions consisted of only 1,3-
PD and water in varying concentrations, the model solutions had varying concentrations of
other metabolites. A quantitative estimation of the coupling effect was studied by
comparing the overall mass transfer coefficients obtained in binary feed experiments vis-
à-vis those obtained with model broth feeds under corresponding and comparable
experimental conditions. As mentioned earlier, the compositions of the model broth
solutions M1, M2 and M3 were chosen to replicate the steady state compositions obtained

207
with the CSTR fermentation. The transport behavior of 1,3-PD with binary feeds has been
modeled in accordance to the solution-diffusion mechanism in an earlier work [21] and
earlier chapter. The transport behavior of for pervaporative separation with model broth
solutions is also expected to follow the same solution diffusion mechanism, which forms
the basis for the computation of the overall mass transfer coefficients of 1,3-PD [26].
Pervaporation mass transport in nonporous dense membranes is often described by the
solution diffusion mechanism where the diffusion is typically described by Fick’s first law
[27, 28] The driving force is the difference in activity or fugacity of the ith species given
by the following equation .
𝑓𝑖 = 𝑥𝑖∗
𝑖𝑃𝑖
𝑠𝑎𝑡-------(3)
where f is the fugacity, 𝑥𝑖∗is the mole fraction of the ith component in the feed at the
interface, γi is the activity coefficient, 𝑃𝑖𝑠𝑎𝑡 is the saturation pressure. The flux of the solute
(ith species) across the pervaporation membrane may be expressed as follows:
𝐽𝑖 =𝑃𝑖
𝑙(𝑥𝑖
∗ 𝑖
𝑃𝑖𝑠𝑎𝑡 − 𝑦𝑖
∗𝑃𝑝)-------(4)
Where 𝐽𝑖 and 𝑃𝑖 are the flux and membrane permeability of the ith species, l is membrane
thickness, y is mole fraction of the vapor and 𝑃𝑝 is the total pressure at the permeate side.
The steady state flux can be expressed alternatively, as per the following equation in terms
of concentration in bulk solution [21, 29].
𝐽𝑖 = 𝑝𝑖,𝑜𝑣
𝑙 (𝑥𝑖 𝑖
𝑝𝑖𝑠𝑎𝑡 − 𝑦𝑖𝑃𝑝) --------(5)

208
where 𝑃𝑖,𝑜𝑣 is the overall permeability. The partial pressure on the permeate side, 𝑦𝑖𝑃𝑝,
upon application of vacuum, is neglected and thus the equation above becomes:
𝐽𝑖 =𝑝𝑖,𝑜𝑣
𝑙 𝑥𝑖𝑖
𝑝𝑖𝑠𝑎𝑡 = 𝐾𝑖,𝑜𝑣𝐶𝑖 ------(6)
where 𝐾𝑖,𝑜𝑣 is the overall mass coefficient of solute i and Ci is the molar concentration in
kg mole/m3. 𝐾𝑖,𝑜𝑣 can be expressed as 𝑃𝑖,𝑜𝑣 𝑖
𝑃𝑖𝑠𝑎𝑡
𝑙𝐶𝑇 where 𝐶𝑇is the total molar
concentration of the feed solution, and 𝐶𝑖 = 𝑥𝑖𝐶𝑇 relates the species flux to the
concentration of the respective species in the feed. Thus the component flux could be used
to compute the overall mass transfer coefficient and overall permeability of 1,3-PD.
Activity coefficients of the feed concentrations were computed by the Wilson equation and
saturation vapor pressure by the Antoine equation [27, 28].
The driving force of pervaporation is the chemical potential which is affected by the
presence of other compounds in the model feed compositions M1, M2 and M3. This is a
major factor behind the coupling phenomenon in multicomponent pervaporation set up
where the impact of the coupling effect on the transport behavior of the target compound
(1,3-PD) could be positive, negative or negligible [26].
Coupling effect has been studied for a wide variety of systems [30-34]. The addition of
salts to a model broth was found to increase the pervaporative flux of 1-propanol through
a PDMS composite membrane [30]. In pervaporative dehydration of binary and ternary
mixtures of methanol and ethanol, alcohol fluxes during dehydration of ternary solutions
decreased compared to the binary feed solutions [31]. The coupling effect here was
attributed to a decrease in preferential dissolution into the hydrophilic membrane as the

209
alcohol tended to stay in the solutions containing a second alcohol because the presence of
the alcohol decreased solution polarity. Butanol pervaporation has also been studied with
respect to coupling effects [32-34].
The coupling effect was estimated quantitatively by the following equation [26]:
𝐶𝐸(%) = (𝐾𝑃𝐷′′ − 𝐾𝑃𝐷
′
𝐾𝑃𝐷′ ) × 100 ---------- (7)
Where CE (%) is the coupling effect, 𝐾𝑃𝐷 ′′ and 𝐾𝑃𝐷
′ are the overall mass transfer
coefficients of 1,3-PD for the separation from the binary feed solutions versus model broth
compositions, respectively. It is to be noted here that the mass transfer coefficients for
binary and model solutions used for comparison pertained to comparable experimental
conditions [26]. For example, membrane system, the feed temperature, feed 1,3-PD
concentration and cross flow rate, wherever applicable, were the same for the data sets used
for computation.
The computed coupling effects versus temperature are graphically shown in Figure 7.7 (a)
– (c) for the membrane systems. All polymers show a negative coupling effect, which
means the presence of glycerol and other components in the feed mixture adversely affects
the 1,3-PD flux, a fact that is seen in the slight reduction in separation factors compared to
binary feeds.
The coupling effect is distinctly higher for the siloxane polymers with multicomponent
feed pervaporation versus binary feeds. The coupling effect appears to be greater for lower
levels of functionalization than at 30C. As the temperature increases to 50C, the coupling

210
effect levels out for all siloxane polymers studied. For the 50 ACA polymer the coupling
effect decreases with temperature while for the 90ACA polymer the opposite effect is seen.
Both the P(Acryl) and the P(VIM) homopolyers showed a small increase in the coupling
effect with increase in temperature, perhaps due to enhanced glycerol dissolution in the
membrane with temperature which adversely affected both the 1,3-PD flux as well as
enrich over water and glycerol. No particular trend with temperature could be ascertained
for the butyl acrylate copolymer for both the systems. There was a minimal temperature
effect on the CE% with the P(Acryl)_DVB copolymer.
3.4 Robeson’s Upper Bound
While membrane separation processes have a high initial investment cost, they offer the
advantage of low energy in running the process [23]. Thus membrane processes are being
considered as viable options to conventional separation processes. The key parameters for
determining the membrane performance are permeability and the separation factor. The
concept of an upper bound of separation performance, which defines a permeability –
separation trade off is a well-studied aspect in gas separations [23]. The permeability and
separation factor are considered as “trade-off” parameters as one generally increases at the
cost of the other and this trade off is related to an “upper bound” relationship [35, 36]. In
gas separations, the log of permeability versus the log of separation factor of the gas with
higher permeability is seen to yield a performance limit for high separation – high
permeability combination [23, 35, 36]. The relationship is expressed as

211
𝑃𝑖 = 𝑘𝑖𝑗𝑛 ----------(8)
Where Pi is the permeability, 𝑖𝑗 is the separation factor of the ith component over jth
component and n is the slope of the log- log graph and k is the pre-factor for the upper
bound relationship.
For gas separations, 1/n was shown to have a linear relationship with the difference in the
kinetic diameters of the permeating gas molecules. For gases, diffusion is the primary
factor responsible for the separation. The value of the exponent n, was also predicted by
activation energy theories for gas separations as was also shown y this theory to be
dependent on the kinetic diameters of the permeating molecules. The front factor, k, on the
other hand, has been shown to be related to the solubility of gases in the membrane matrix
[23].
The upper bound relationship is based on homogenous polymer membrane matrices. For
many established upper bound relationships, surface modifications or the use of mixed
matrices with sieving structures incorporated into a homogenous polymer matrix have been
seen to break the established upper bound limits for given systems [37 – 40].
In this paper the existence of a possible upper bound was explored with data collated from
the experiments reported here and in earlier studies with binary feed mixtures. The
separation factor of 1,3-PD with respect to water only was considered for the corresponding
experiment. The collated data is presented in Figure 7.8.
The figure shows the three distinct polymer families labeled as Siloxanes, ACA
methacrylates and Imidazolium IL methacrylates. An upper bound for the pervaporative
212
purification of 1,3-PD from aqueous mixtures using homogenous polymeric membranes
could be envisaged. The exponent n and the front factor k were approximated at ~-0.217
and ~ 1013 respectively
A caveat on the estimation of the Robeson’s upper bound parameters must be offered here.
The data deals with a limited number of data points which may not be enough to define an
upper bound for a process.
The phenomenon of concentration polarization which affects systems especially with high
intrinsic enrichment is automatically covered by the upper bound definition in bringing
forth the limitation in enrichment achievable for a target compound. However that said,
Robesons upper bound may be exceeded with multilayer systems that mitigate such
limitations.
3.5 Hansen Solubility Parameters
In pervaporation, a component is preferentially removed by virtue of its high solubility in
the membrane phase or its higher diffusivity or both [19]. Pervaporation has found
applications for removal of water in solvent dehydration, volatile organic removal from
water or in aroma recovery. Amongst all applications, the dehydration of solvents is the
best developed due to the fact that the use of hydrophilic membranes ensures in a solubility
– diffusivity synergistic effect in favor of water selectivity [19]. Water, due to its smaller
molecular size diffuses faster and the use of hydrophilic membranes also ensures a higher
solubility [20]. However, for the separation of organic molecules from water, the solubility
selectivity into the membrane material in favor of the organic molecule must be higher than

213
that of water. The membrane material must be significantly hydrophobic and must have
substantial affinity for the organic permeant. This is one way a membrane may reject water
and cause selective enrichment of the organic permeant. The solubility is proportional to
the affinity of a given component for the membrane material. The affinity is described by
the Hansen solubility parameters comprising of hydrogen bonding interaction (H), polar
interaction (P) and dispersion interaction (D). The large differences in Hansen parameters,
especially the hydrogen bonding interaction H, determine the feasibility of organic solvent
dehydration [41, 42]. The proximity of 1,3-PD with water in terms of these parameters
makes the pervaporative separation of 1,3-PD a difficult task.
Permeation may be defined as 𝑃 = 𝐷. 𝑆 where D is the diffusion coefficient and S is the
solubility for components into the membrane from the feed. The relative enrichment of
components in a pervaporation feed occurs by virtue of their higher affinity for the
membrane material or greater diffusivity or both [41, 42]. The membrane- component
affinity is described by the Hansen solubility parameter comprising hydrogen bonding
interaction (H), polar interaction (P) and dispersion interaction (D) [19, 41]. For a binary
system, the Hansen’s solubility parameter distance Ra is a measure of the dissimilarity
between two components [41].
𝑅𝑎 = √4(𝑑1 − 𝑑2)2 + (𝑝1
− 𝑝2)2 + (𝐻1
− 𝐻2)2 -----------------(9)
The chemistry of the membrane and its interaction with permeating components affects Ra
and the separation performance [20, 43]. Water has the highest P, closely followed by
glycols, such as 1,3-PD [19]. Water also possesses the highest H also closely followed by

214
glycols [19]. Large differences between H for water and organic solvents makes their
pervaporative dehydration feasible and efficient [19, 43]. Additionally, the diffusive
efficacy of components through a membrane depends upon their kinetic diameter (dk)
which considers the molecular size and shape [19, 20]. Given that the dk of water is
significantly lower than that of 1,3-PD, it diffuses faster [20]. Hence the onus of
pervaporative enrichment in favor of 1,3-PD lies on preferential sorption of 1,3-PD into
the membrane and the concomitant rejection of water [19]. The proximity of the solubility
parameters of water and 1,3-PD compounds the difficulty of separation using conventional
membrane materials such as PDMS and hence calls for its functionalization. The chemistry
of functionalization, while enhancing the affinity for 1,3-PD must also make the membrane
more hydrophobic and this is reflected in the partial solubility parameters.
The partial solubility parameters of water, 1,3-PD and TBP were obtained from literature
[43-45]. The H for PDMS were obtained from literature while P and D computed from
the refractive index and dipole moments respectively [44-46]. Those of ACA were
computed using a group contribution method [47], employing two kinds of characteristic
groups: first-order groups that describe the basic molecular structure of compounds and
second-order groups based on the conjugation theory to improve the accuracy of
predictions. The contribution towards H, P and D were computed from literature values
provided for the participating groups and identifiable conjugates in ACA[47]. In the
absence of the availability of reliable H, P and D group contribution for Si-O, Si-H and
Si-CH3 the partial solubility parameters for the ACA modified siloxane materials could not
be computed. Additionally, the solubility parameters for the imidazolium ionic liquid based

215
monomeric and polymeric structure could not be computed due to the absence of adequate
data on group contributions pertinent to ionic liquid like structures.
The 3-parameter Hansen system is easily represented in a simple planar triangular graph
using a set of fractional parameters derived from the three individual Hansen parameters.
Such a graph is called a TEAS graph. TEAS parameters or fractional parameters, were
computed from the partial interaction parameters and indicate a fractional contribution of
each partial parameter to the whole solubility parameter. They are defined as fD=D
D+H+P
, fH=H
D+H+P and fP=
P
D+H+P . The Hansen’s solubility parameter distance in the form
of a TEAS graph is shown in Figure 7.9.
The distance of separation between 1,3-PD and water is similar to that between 1,3-PD and
ACA or TBP. Thus 1,3-PD can be only partly partitioned into ACA or TBP, while the
hydrophobic character of ACA and TBP is underscored by its large separation distance
from water, due primarily to the disparities in H and P. While two materials may end up
with the same solubility parameters, computed arithmetically, the individual contributions
that make up this value may be different with ramifications on their mutual affinity.
3.6 Price Performance Trade Off:
A brief comparison of the prices for the materials developed in this work versus that used
for the cyanoborate SLM [18] was carried out with retail price data from Sigma Alridch
(http://www.sigmaaldrich.com), Oakwood Chemicals Inc
(http://www.oakwoodchemical.com/). and Fluorochem Ltd.
(http://www.fluorochem.co.uk). The computation was based on molecular structures and

216
prices of the individual chemicals making up the compound. A Price/performance trade off
estimate was generated using the experimental results detailed here with model feed
solutions and those reported in the work on the cyanoborate SLM. However the work on
the cyanoborate SLM reported results with binary 1,3-PD –water feed compositions, which
has been used here for comparison. A rough estimation was made of the total volume of
membrane material required to reach a final 1,3-PD concentration of >90%, from a starting
composition of 1% 1,3-PD for a feed flow of 100 g/h. The separation factors and 1,3-PD
fluxes considered here for the computation were those obtained at 300C for a feed 1,3-PD
concentration of 10g/l. The computation assumes that separation factor and flux of 1,3-PD
remained constant after each enrichment stage. This assumption was made because
separation factor and flux data for high 1,3-PD feed concentrations were not available. For
the cyanoborate ionic liquid membrane stabilized in a nanoporous ceramic module, the
thickness of the module reported – 3mm(with a 7mm inner diameter and 10 mm outer
diameter) was used for computation. The nano-porous module reported in their work has a
porosity of 30% [18, 48].
The tetrapropyl ammonium cyanoborate ionic liquid costs $36,004/mole, while the ACA
based methacrylate monomer costs $1326/mol. The Imidazolium ionic liquid based
methacrylate monomer costs $168.5/mol. The ACA functionalized siloxanes cost
$1133/mol, $892/mol and $655/mol for the 90%, 70% and 50% functionalized materials,
respectively.
The cost per unit weight of the tetrapropyl ammonium cyanoborate ionic liquid is $120/g,
while that of the ACA based methacrylate monomer is $4.65/g. The cost of the

217
imidazolium ionic liquid based methacrylate monomer is $0.33/g. The ACA functionalized
siloxanes cost $6/g, $5.6/g and $4.9/g for 90%, 70% and 50%, functionalized materials
respectively.
The price performance estimates indicate that while the cost required to achieve the
aforesaid levels of enrichment for the cyanoborate ionic liquid SLM is ~$50,000, the same
enrichment can be achieved with the functionalized siloxanes at a cost of ~ $1714, $1638
and $1537, respectively, for the 50%, 70% and 90% functionalized materials.
The same performance can be achieved with the ACA based methacrylate homopolymer
at a cost of ~$1200 and the imidazolium ionic liquid based methacrylate homopolymer at
a cost of ~$100.
The development and study of such novel materials pave a way for establishment of
commercially viable and energy efficient alternatives to conventional purification
processes presenting a possibility of membrane module fabrication for continuous
pervaporation.
4.Conclusion:
The pervaporative performance of three novel polymer systems developed in earlier works
is examined with model feed compositions in continuous and batch pervaporation set ups.
The separation factors of 1,3-PD and its enrichment over other components was studied
with respect several experimental parameters. Coupling effect and its variation with
temperature was studied The permeability and separation factors were collated from the

218
experiments in this work and from earlier binary pervaporation studies to arrive at
Robeson’s upper bound parameters for pervaportive enrichment of 1,3-PD using
homogenous polymeric membranes.
5.References
1. A.J. Ragauskas, C.K. Williams, B.H. Davison, G. Britovsek, J. Cairney, C.A.
Eckert, W.J. Frederick Jr., J.P. Hallett, D.J. Leak, C.L. Liotta, J.R. Mielenz, R.
Murphy, R. Templer, T. Tschaplinski, The path forward for biofuels and
biomaterial, Science. 311 (2010) 484–489.
2. Z.L. Xiu, A.P.Zeng, Present state and perspective of downstream processing of
biologically produced 1,3-propanediol and 2,3-butanediol, Appl Microbiol
Biotechnol. 78 (2008) 917–926.
3. R.K. Saxena, P. Anand, S. Saran, J. Isar, Microbial production of 1,3-propanediol:
Recent developments and emerging opportunities, Biotechnology Advances. 27
(2009) 895–913.
4. A.P. Zeng, H. Biebl, Bulk chemicals from biotechnology: the case of 1,3-
propanediol production and the new trends, in: T. Scheper, K. Schugerl, A.P. Zeng
(Eds.), Advances in biochemical engineering and biotechnology, Vol. 74, Springer-
Verlag, Berlin, Heidelberg, New York, 2002, pp239–59.
5. A. Triguero, R. Blanco, H. Machado, M. Rodríguez, Evaluation of liquid extraction
potentials for downstream separation of 1,3-propanediol, Biotechnology
Techniques. 13 (1999) 127–130.

219
6. T.T. Ames, Process for the isolation of 1,3-propanediol from fermentation broth. US
Patent 6361983 B1 (2002).
7. Y. Gong, Y. Tong, X.L. Wang, D.H. Liu, The possibility of the desalination of actual
1,3-propanediol fermentation broth by electrodialysis, Desalination. 161 (2004)
169–178.
8. J. Hao, D.H. Liu, Desalination of fermented broth containing 1,3-propanediol by
electrodialysis, Chinese J Proc Eng. 5 (2005) 36–39.
9. Z. Li, B. Jiang, D. Zhang, Z. Xiu, Aqueous two-phase extraction of 1,3-propanediol
from glycerol-based fermentation broths, Separation and Purification Technology.
66 (2009) 472–478.
10. A. Baiada, A. Vitner, R.P. Jansen, A.M. Baniel, Process for producing 1, 3-
propanediol. US Patent 7056439 B2 (2006).
11. A.K. Hilaly, T.P. Binder, Method of recovering 1,3-propanediol from fermentation
broth. US Patent 6479716 B2 (2002)
12. M.H. Cho, S.I. Joen, S.H. Pyo, S. Mun, J.H. Kim, A novel separation and
purification process for 1,3-propanediol, Process Biochem. 41 (2006) 739–744.
13. P. Anand, R.K. Saxena, R.G. Marwah, A novel downstream process for 1,3-
propanediol from glycerol-based fermentation, Appl. Microbiol. Biotechnol. 90
(2011) 1267–1276.
14. J. Hao, F. Xu, H. Liu, D. Liu, Downstream processing of 1,3-propanediol
fermentation broth, Journal of Chemical Technology and Biotechnology.81(2006)
102–108.

220
15. J.J. Malinowski, Reactive Extraction for Downstream Separation of 1,3-
Propanediol, Biotechnology Progress. 16 (2000) 76–79.
16. S. Li, V.A. Tuan, J.L. Falconer, R.D, Noble, Separation of 1,3- propanediol from
glycerol and glucose using a ZSM-5 zeolite membrane, J. Membr Sci. 191 (2001a)
53–59.
17. S. Li, V.A. Tuan, J.L. Falconer, R.D. Noble, Separation of 1,3- propanediol from
aqueous solutions using pervaporation through an X-type zeolite membrane, Ind
Eng Chem Res 40 (2001b) 1952– 1959.
18. P.Izák, M. Köckerling, U. Kragl, Stability and selectivity of a multiphase membrane,
consisting of dimethylpolysiloxane on an ionic liquid, used in the separation of
solutes from aqueous mixtures by pervaporation, Green Chem. 8 (2006) 947–948.
19. P. Shao, R.Y.M. Huang, Polymeric membrane pervaporation, Journal of Membrane
Science. 287 (2007) 162-179
20. W.J.Koros, Membranes: Learning a lesson from nature, Chem Eng. Prog. 91 (1995)
68–81
21. S. Li, R. Srivastava, R.S. Parnas, Separation of 1-butanol by pervaporation using a
novel tri-layer PDMS composite membrane, J. Membr. Sci. 363 (2010) 287–294.
22. J.J. Malinowski, Evaluation of liquid extraction potentials for downstream
separation of1,3-propanediol, Biotechnology Techniques 13: 127–130, 1999.
23. L.M. Robeson, The upper bound revisited, J. Membr. Sci. 320 (2008) 390 – 400.
24. J.L. Dashnau, N.V. Nucci, K. A. Sharp, J. M. Vanderkooi, Hydrogen Bonding and
the Cryoprotective Properties of Glycerol/Water Mixtures, J. Phys. Chem. B 110
(2006) 13670–13677.

221
25. H. Chakrabarti, B. Kanjilal, Measurement of the Diffusivity of Cesium Ion in
Aqueous Rubidium Chloride Solution , Journal of Solution Chemistry 39 (2010)
409-416.
26. S.Y. Li, R. Srivastava, R.S. Parnas, Study of in situ 1-Butanol Pervaporation from
A-B-E Fermentation Using a PDMS Composite Membrane: Validity of Solution-
Diffusion Model for Pervaporative A-B-E Fermentation, Biotechnol. Prog. 27
(2011) 111–120.
27. J.G. Wijmans, R.W.Baker, The solution Diffusion model: a review, J. Membr.Sci.
107 (1995) 1–21.
28. S.J. Lue, W.W. Chen, S.Y. Wu, L.D. Wang, Vapor permeation modeling of
multicomponent systems using a poly(dimethylsiloxane) membrane, J. Membr. Sci.
311 (2008) 380–389.
29. P. Wu, B.J. Brisdon, R. England, R.W. Field, Preparation of modified difunctional
PDMS membranes and a comparative evaluation of their performance for the
pervaporative recovery of p-cresol from aqueous solution, J. Membr. Sci. 206
(2002) 265–275.
30. Lipnizki F, Hausmanns S, Field RW. Influence of impermeable components on the
permeation of aqueous 1-propanol mixtures in hydrophobic pervaporation. J Membr
Sci. 2004;228:129–138. 32.
31. Van Baelen D, Reyniers A, Van der Bruggen B, Vandecasteele C, Degreve J.
Pervaporation of Binary and Ternary Mixtures of Water with Methanol and/or
Ethanol. Sep Sci Technol. 2005; 39:563. 33.

222
32. Favre E, Nguyen QT, Bruneau S. Extraction of 1-butanol from aqueous solutions by
pervaporation. J Chem Technol Biotech- nol. 1996;65:221–228. 34.
33. Liu F, Liu L, Feng X. Separation of acetone–butanol–ethanol (ABE) from dilute
aqueous solutions by pervaporation. Sep Purif Technol. 2005;42:273–282. 35.
34. Garcıa V, Pongra ´cz E, Muurinen E, Keiski RL. Recovery of n-butanol from salt
containing solutions by pervaporation. Desalination 2009;241:201–211
35. L.M. Robeson, Correlation of separation factors versus permeability for polymeric
membranes, J. Membr. Sci. 62 (1991) 165
36. L.M. Robeson, W.F. Burgoyne, M. Langsam, A.C. Savoca, C. F. Tien, High
performance polymers for membrane separations Plymer 25 (1994) 4970
37. C.M. Zimmerman, A. Singh, W.J. Koros, Tailoring mixed matrix composite
membranes for gas separations, J. Membr. Sci. 137 (1997) 145
38. S. Husain, W.J. Koros, Mixed matrix hollow fiber membranes made with modified
HSSZ-13 zeolite in polyetherimide polymer matrix for gas separations, J. Membr.
Sci. 288 (2007) 195
39. T.S. Chung, L.Y. Liang, Y.Li, S. Kulprathiraja, Mixed matrix membranes (MMMs)
comprising of organic polymers with dispersed inorganic fillers or gas separations,
Prog. Polym. Sci. 32 (2007) 483
40. D. Sen, H. Kalipcilar, L. Yilmaz, Development of polycarbonate based zeolite 4A
mixed matrix gas separation membranes, J. Membr. Sci. 303 (2007) 194
41. M. Mulder, T. Franken, C.A. Smolders, Preferential sorption versus preferential
permeability in pervaporation, J. Membr. Sci. 22 (1985) 155–173.
223
42. D.J. Benedict, S.J. Parulekar, S.P. Tsai, Pervaporation assisted esterification of lactic
and succinic acids with downstream ester recovery, J. Membr. Sci. 281 (2006) 435–
445.
43. C.M. Hansen, Hansen solubility parameter: A users handbook, second ed., CRC
press Taylor and Francis group, Boca Raton, London, New York, 2007.
44. M. Alizadeh, F. Abbassi, M. Farahi, K. Jalili, Silicone based hydrogels prepared by
interpenetrating polymeric network synthesis: Swelling properties and confinements
effects on the formation kinetics, J appl Poly Sci. 124 (2012) 985–992.
45. J.N. Lee, C. Park, G.M. Whitesides, Solvent Compatibility of
Poly(dimethylsiloxane)-Based Microfluidic Devices, Anal Chem. 75 (2003) 6544–
6554.
46. N.A.Diachun, A.H. Marcus, D.M. Hussey, M.D.Fayer, Dynamics in
Polydimethylsiloxane: The Effect of Solute Polarity, JACS. 116 (1994) 1027–1032.
47. E. Stefanis. C. Panayiotou, Prediction of Hansen Solubility Parameters with a New
Group-Contribution Method, Int J. Thermophys. 29 (2008) 568–585.
48. P. Izak, M. Köckerling, U. Kragl, Mehrphasen–Membran. German Patent
DE102006024397 B3 (2007).
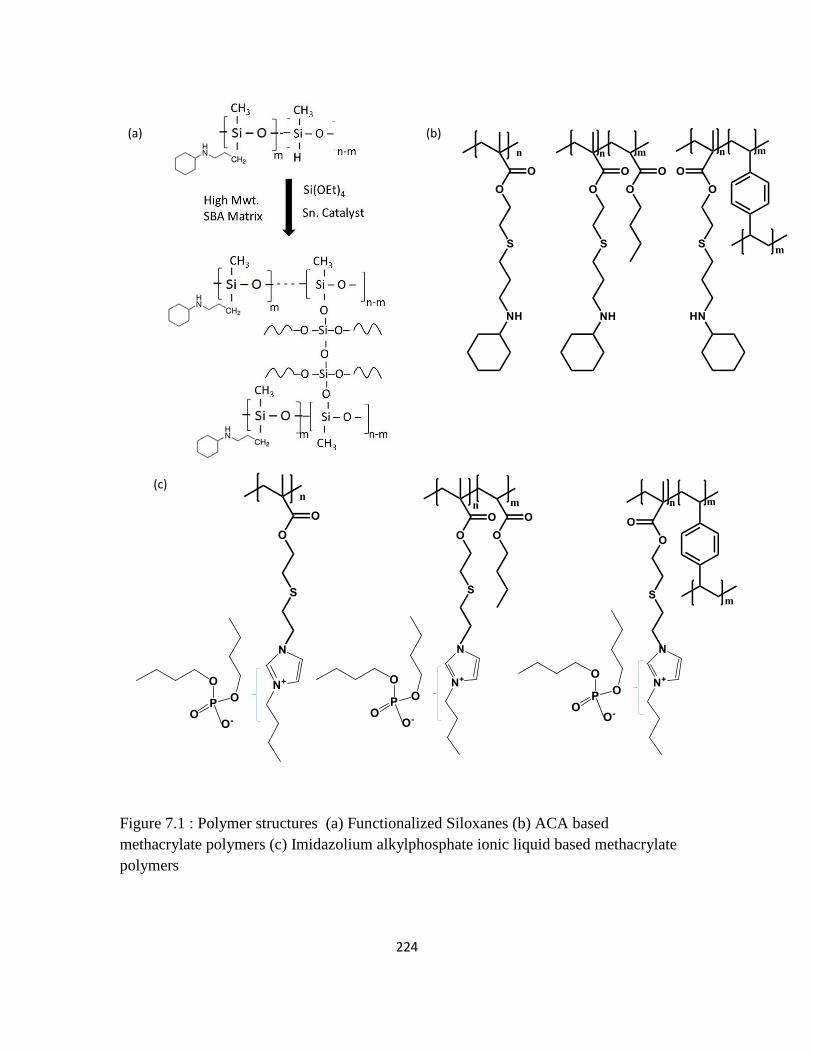
224
Figure 7.1 : Polymer structures (a) Functionalized Siloxanes (b) ACA based
methacrylate polymers (c) Imidazolium alkylphosphate ionic liquid based methacrylate
polymers
(a) (b)
(c)
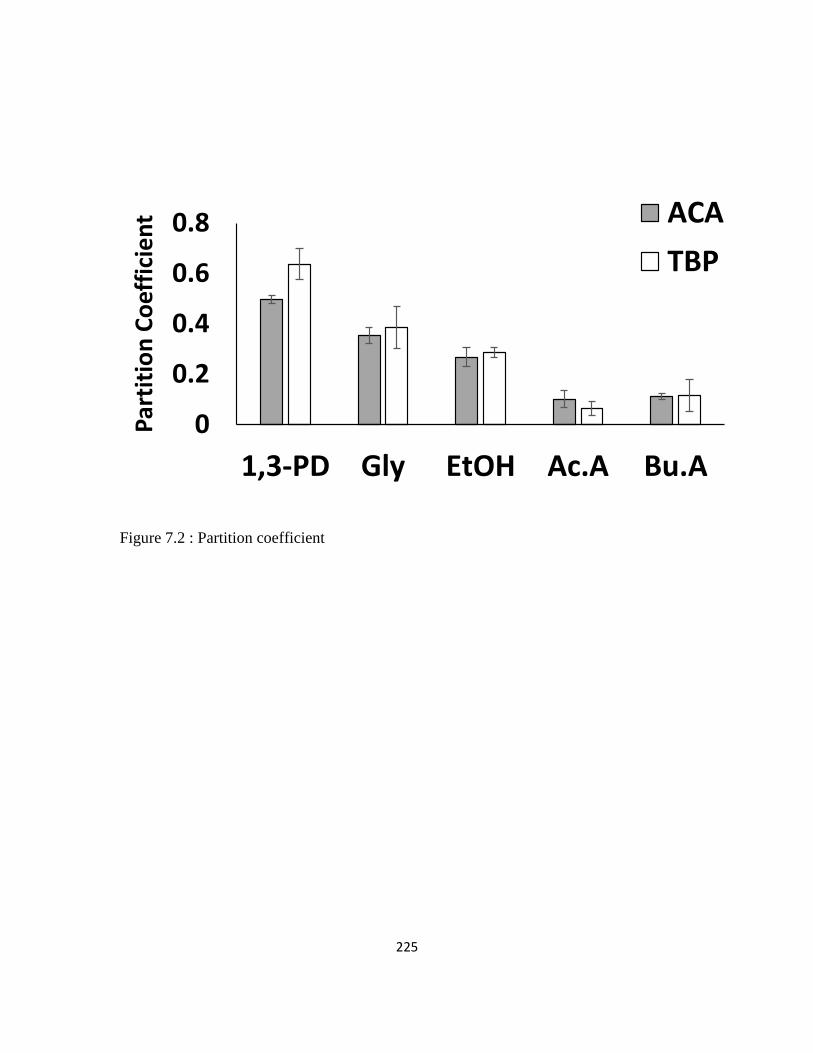
225
Figure 7.2 : Partition coefficient
0
0.2
0.4
0.6
0.8
1,3-PD Gly EtOH Ac.A Bu.A
ACA
TBP
Par
titi
on
Co
effi
cie
nt

226
Figure 7.3: Component mass uptakes by membrane materials
0
5
10
15
20
25
30
35
0 1 2 3 4 5 6
Mas
s U
pta
ke (
%)
0.1
0.6
0.98 1.18Mas
s U
pta
ke (
%)
0.31
0.81
1.31
1.81
3.9 4.4 4.9 5.4 5.9 6.4
Mas
s U
pta
ke (
%)
Water 1,3-PD Gly EtOH Ac.A Bu.A
Water
EtOH Ac.A Bu.A
Inset 1
Inset 2
Legends:50ACA 70ACA 90ACA P(acryl) P(Acryl)_BuA P(Acryl)_DVB
PVIM PVIM_BuA PVIM_DVB
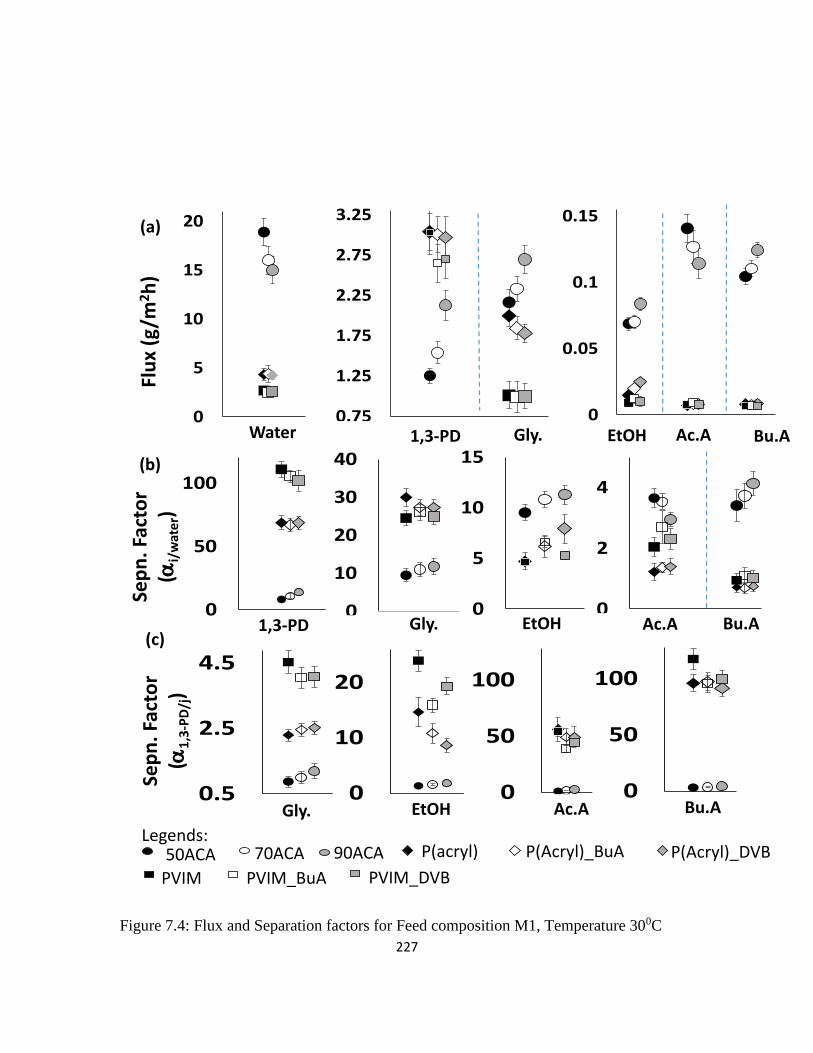
227
Figure 7.4: Flux and Separation factors for Feed composition M1, Temperature 300C
Legends:50ACA 70ACA 90ACA P(acryl) P(Acryl)_BuA P(Acryl)_DVB
PVIM PVIM_BuA PVIM_DVB
0
50
100
1.5 2 2.5 3 3.50
10
20
30
40
2.8 3 3.2 3.40
5
10
15
3.9 4.1 4.30
2
4
4.7 5.2 5.7 6.21,3-PD Gly. EtOH Ac.A Bu.A
Sep
n.
Fact
or
(i/
wat
er)
(b)
0.5
2.5
4.5
2.8 3 3.2 3.40
10
20
2.8 3 3.2 3.40
50
100
4.8 5.30
50
100
5.8 6 6.2
Sep
n.
Fact
or
(1
,3-P
D/j
)
(c)
Gly. EtOH Ac.A Bu.A
0
5
10
15
20
0 1 20.75
1.25
1.75
2.25
2.75
3.25
1.5 2 2.5 3 3.50
0.05
0.1
0.15
3.8 4.3 4.8 5.3 5.8 6.3
Water 1,3-PD Gly. EtOH Ac.A Bu.A
(a)
Flu
x (g
/m2h
)

228
Figure7.5 : (a) Variation of 1,3-PD Separation factor with temperature (b) Variation of
1,3-PD enrichment over glycerol with temperature (c) Variation of 1,3PD flux with
temperature
(a)
(b)
(c)
Sep
n. F
acto
r(
1,3
-PD
/wat
er)
Sep
n. F
acto
r(
1,3
-PD
/gly
)1
,3-P
D F
lux
(g/m
2h
)
Legends:50ACA 70ACA 90ACA P(acryl) P(Acryl)_BuA P(Acryl)_DVB
PVIM PVIM_BuA PVIM_DVB
6
11
16
25 35 45 55T(0C)
50
60
70
25 35 45 55
T(0C)
75
100
125
25 35 45 55T(0C)
30 40 50 30 40 50 30 40 50
0.5
1
1.5
25 35 45 55
T (0C)
1.5
2
2.5
3
25 35 45 55
T (0C)
2.8
4.8
25 35 45 55
T (0C)
30 40 50 30 40 50 30 40 50
1.1
1.6
2.1
25 35 45 55
T (0C)
2.7
2.9
3.1
3.3
25 35 45 55
T (0C)
2.3
2.8
3.3
25 35 45 55
T (0C)
30 40 50 30 40 50 30 40 50

229
Figure 7.6 (a) Variation of 1,3-PD Separation factor with feed glycerol concentration (b)
Variation of 1,3-PD separation factor with feed glycerol concentration (c) Variation of
1,3-PD flux with feed glycerol concentration
0.5
50.5
100.5
10 20 30 40Feed Gly. Conc. (g/l)
8
12
16
10 20 30Feed Gly. Conc. (g/l)
0
2
4
6
10 20 30 40Feed Gly. Conc. (g/l)
0.3
0.5
0.7
28 30 32
Feed Gly. Conc. (g/l)
1
2
3
4
10 20 30 40
Feed Gly. Conc. (g/l)
0.81
1.21.41.61.8
28 30 32Feed Gly. Conc.
(g/l)
Sep
n. F
acto
r (
1,3
-PD
/wat
er)
(a)
(b)
Sep
n. F
acto
r (
1,3
-PD
/gly
)
(c)
1,3
-PD
Flu
x (g
/m2h
)
Legends:
90ACA P(acryl) PVIM

230
Figure 7.7: Variation of coupling effect with temperature (a) Functionalized Siloxanes
(b) ACA based methacrylate polymers (c) Imidazolium alkylphosphate ionic liquid based
methacrylate polymers
-70
-20 25 35 45 55
-15
-10
-5
025 35 45 55
-10-7.5
-5-2.5
025 35 45 55
Co
up
ling
Effe
ct
(%)
Co
up
ling
Effe
ct
(%)
Co
up
ling
Effe
ct
(%)
(a)
(b)
(c)
Legends:50ACA 70ACA 90ACA P(acryl) P(Acryl)_BuA P(Acryl)_DVB
PVIM PVIM_BuA PVIM_DVB
Temperature (0C)
30 40 50
Temperature (0C)30 40 50
Temperature (0C)30 40 50

231
Figure 7.8: Log-Log plot of 1,3-PD permeability versus separation factor to arrive at a
Robeson’s upper bound

232
Figure7.9 : TEAS graph of the percentage contribution by the partial solubility
parameters for each component.
TBPGlycerol
Ethanol
Acetic Acid
Butyric Acid

233
Chapter 8. Thesis Summary and Way Forward
This research thesis put forward, in two parts, the production and concentration
enrichment of 1,3-propanediol from waste industrial glycerol. The batch production was
scaled up to 10 liter capacity at the Dave C. Swalm School of Chemical Engineering
Mississippi State University in November 2013, with results closely matching those shown
in Chapter 2. This demonstrates a possible feasibility of taking the results up for scaled up
trials forming a blueprint for a continuous process for converting glycerol to 1,3-
propanediol by fermentation. However, as mentioned before, purification and
concentration enrichment accounts for the bulk of the process cost and thus warrants the
development of an energy efficient process such as pervaporation for the work. This thesis
concentrated on the development of materials and their evaluation in simple laboratory set
ups. These materials could be developed into membrane modules or multilayer structures
to optimize performance prior to scale up. Of the three materials developed, the
imidazolium ionic liquid based methacrlyate polymers showed the most promise with
respect to separation factors as well as cost – performance trade off. While the separation
factor is indeed of greater importance given that 1,3-PD needs to be enriched from a very
dilute concentration, the role of flux cannot be ignored. In this respect, the siloxane
materials, which showed fair separations but better flux and superior mechanical
properties, may be considered as a support layer in a multilayer matrix. Yet another aspect
of possible research is the possible development of hollow fiber pervaporation modules
based on these novel materials. The thermodynamic aspect of transport across these
materials also provides for an interesting future research topic.


![Diethyl 4,4′-dihydroxy-3,3′-{[(3a RS ,7a RS )-2,3,3a,4,5,6,7,7a-octahydro-1 H -1,3-benzimidazole-1,3-diyl]bis(methylene)}dibenzoate](https://static.fdokumen.com/doc/165x107/63258a10584e51a9ab0ba0e1/diethyl-44-dihydroxy-33-3a-rs-7a-rs-233a45677a-octahydro-1.jpg)
![ChemInform Abstract: Competing Regiodirecting Effects of Ester and Aryl Groups in [3 + 3] Cyclocondensations of 1,3-Bis(trimethylsilyloxy)-1,3-butadienes: Regioselective Synthesis](https://static.fdokumen.com/doc/165x107/6323a25a4d8439cb620d0030/cheminform-abstract-competing-regiodirecting-effects-of-ester-and-aryl-groups-in.jpg)


![Synthesis of Pyrrolo[1,3]-Diazepines and Potential Poxvirus ...](https://static.fdokumen.com/doc/165x107/63286568051fac18490eb53f/synthesis-of-pyrrolo13-diazepines-and-potential-poxvirus-.jpg)

![1-Phenyl-1 H -naphtho[1,2- e ][1,3]oxazin-3(2 H )-one](https://static.fdokumen.com/doc/165x107/6323a0da078ed8e56c0af332/1-phenyl-1-h-naphtho12-e-13oxazin-32-h-one.jpg)