Federal Reserve Bulletin March 1961 - CiteSeerX
128
FEDERAL RESERVE ••-**§ March 196] BOARD OF GOVERNORS OF THE FEDERAL RESERVE SYSTEM Digitized for FRASER Federal Reserve Bank of St. Louis
-
Upload
khangminh22 -
Category
Documents
-
view
5 -
download
0
Transcript of Federal Reserve Bulletin March 1961 - CiteSeerX

FEDERAL RESERVE••-**§
March 196]
BOARD OF GOVERNORSOF THE FEDERAL RESERVE SYSTEM
Digitized for FRASER Federal Reserve Bank of St. Louis
E D I T O R I A L C O M M I T T E ECharles Molony
Ralph A. Young Woodlief Thomas Guy E. NoyesThe Federal Reserve BULLETIN is issued monthly under the direction of the staff editorial
committee. This committee is responsible for opinions expressed, except in official statements
and signed articles.
Contents
Gold and Dollar Transfers in 1960 265
Federal Reserve Operations in Perspective 272
Quarterly Survey of Consumer Buying Intentions 282
Law Department 288
Current Events and Announcements 301
National Summary of Business Conditions 304
Financial and Business Statistics, U. S. (Contents on p. 307) 308
International Financial Statistics (Contents on p. 367) 368
Board of Governors and Staff 384
Open Market Committee and Staff; Federal Advisory Council 385
Federal Reserve Banks and Branches 385
Federal Reserve Board Publications 387
Index to Statistical Tables 389
Map of Federal Reserve System Inside back cover
Volume 47 * Number 3
Subscription Price of Bulletin
A copy of the Federal Reserve Bulletin is sent to each member bank without charge; member banks desiringadditional copies may secure them at a special $2.00 annual rate. The regular subscription price in the UnitedStates and its possessions, Bolivia, Canada, Chile, Colombia, Costa Rica, Cuba, Dominican Republic,Ecuador, Guatemala, Haiti, Republic of Honduras, Mexico, Nicaragua, Panama, Paraguay, Peru, El Salvador,Uruguay, and Venezuela is $6.00 per annum or 60 cents per copy; elsewhere, $7.00 per annum or 70 centsper copy. Group subscriptions in the United States for 10 or more copies to one address, 50 cents percopy per month, or $5.00 for 12 months.
Digitized for FRASER Federal Reserve Bank of St. Louis
Gold and Dollar Transfers in i960
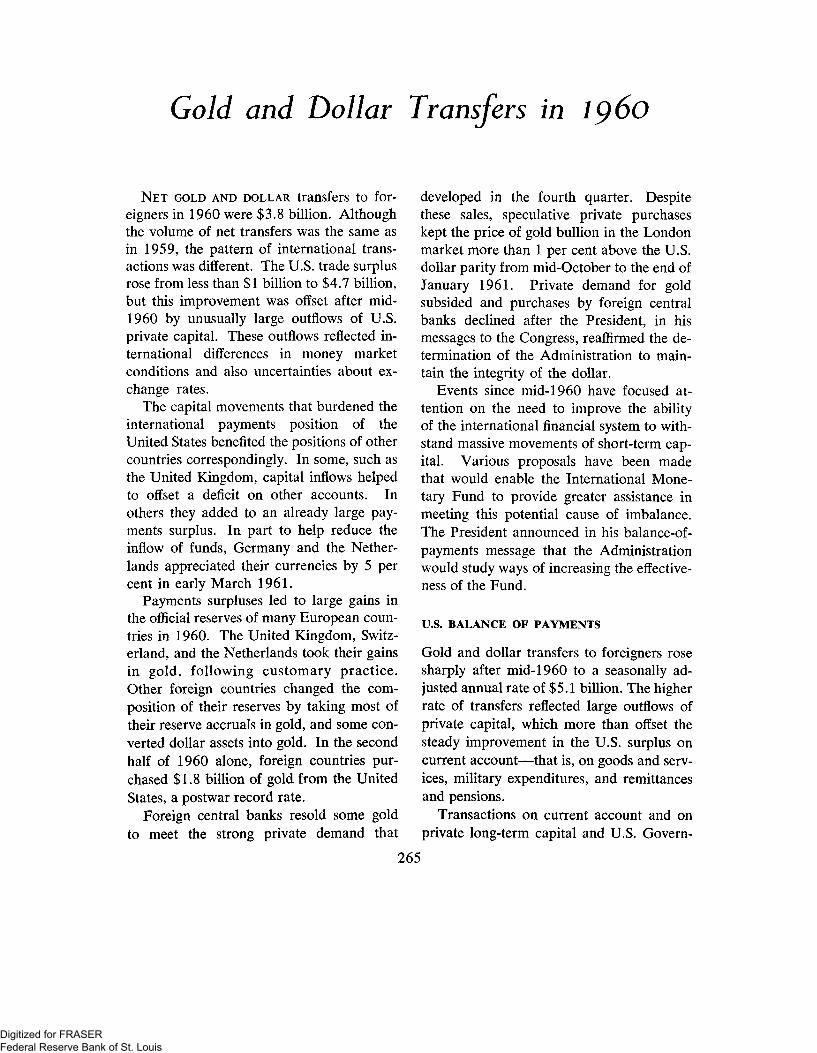
NET GOLD AND DOLLAR transfers to for-eigners in 1960 were $3.8 billion. Althoughthe volume of net transfers was the same asin 1959, the pattern of international trans-actions was different. The U.S. trade surplusrose from less than $1 billion to $4.7 billion,but this improvement was offset after mid-1960 by unusually large outflows of U.S.private capital. These outflows reflected in-ternational differences in money marketconditions and also uncertainties about ex-change rates.
The capital movements that burdened theinternational payments position of theUnited States benefited the positions of othercountries correspondingly. In some, such asthe United Kingdom, capital inflows helpedto offset a deficit on other accounts. Inothers they added to an already large pay-ments surplus. In part to help reduce theinflow of funds, Germany and the Nether-lands appreciated their currencies by 5 percent in early March 1961.
Payments surpluses led to large gains inthe official reserves of many European coun-tries in 1960. The United Kingdom, Switz-erland, and the Netherlands took their gainsin gold, following customary practice.Other foreign countries changed the com-position of their reserves by taking most oftheir reserve accruals in gold, and some con-verted dollar assets into gold. In the secondhalf of 1960 alone, foreign countries pur-chased $1.8 billion of gold from the UnitedStates, a postwar record rate.
Foreign central banks resold some goldto meet the strong private demand that
developed in the fourth quarter. Despitethese sales, speculative private purchaseskept the price of gold bullion in the Londonmarket more than 1 per cent above the U.S.dollar parity from mid-October to the end ofJanuary 1961. Private demand for goldsubsided and purchases by foreign centralbanks declined after the President, in hismessages to the Congress, reaffirmed the de-termination of the Administration to main-tain the integrity of the dollar.
Events since mid-19 60 have focused at-tention on the need to improve the abilityof the international financial system to with-stand massive movements of short-term cap-ital. Various proposals have been madethat would enable the International Mone-tary Fund to provide greater assistance inmeeting this potential cause of imbalance.The President announced in his balance-of-payments message that the Administrationwould study ways of increasing the effective-ness of the Fund.
U.S. BALANCE OF PAYMENTS
Gold and dollar transfers to foreigners rosesharply after mid-19 60 to a seasonally ad-justed annual rate of $5.1 billion. The higherrate of transfers reflected large outflows ofprivate capital, which more than offset thesteady improvement in the U.S. surplus oncurrent account—that is, on goods and serv-ices, military expenditures, and remittancesand pensions.
Transactions on current account and onprivate long-term capital and U.S. Govern-
265
Digitized for FRASER Federal Reserve Bank of St. Louis

266 FEDERAL RESERVE BULLETIN • MARCH 1961
ment capital and aid may be regarded asthe underlying elements in the balance ofpayments. Long-run balance in these ele-ments is essential to equilibrium in the totalbalance of payments. The U.S. deficit inthese underlying elements declined from$4.5 billion in 1959 to $1.7 billion in 1960.This deficit dropped to an annual rate of$1.5 billion in the third quarter and would
U. S. BALANCE OF PAYMENTS[Billions of dollars]
Component
Current account:Exports of merchand i se 1 . . . .Exports of services
Total
Imports of merchandiseImports of services2
Total
Balance on current acct.
Long-term capital and aid:U.S. Govt. capital and aid:3
Net loansNonmilitary grants
Private capital:3
U.S. capitalForeign capital
Balance on current acct.,long-term capital,and aid3
U.S. short-term capital3
Unidentified transactions3
Net transfers to foreigners
1959
16.27.2
23.5
15.39.0
24.3
- 0 . 9
4 - . 4- 1 . 6
- 2 . 2.5
- 4 . 5
- . 1.8
3.8
Memorandum: Transfers,without seasonal adjust-ment 3.8
Seasonallyadjusted
annual rates,1960
1sthalf
19.07.6
26.6
15.29.4
24.6
2.0
- 0 . 9- 1 . 6
- 1 . 9.7
- 1 . 8
- . 44
2.6
2.8
2ndhalf*
19.97.8
27.7
14.29.4
23.6
4.1
- 1 . 3- 1 . 7
- 2 . 7(5)
- 1 . 6
- 2 . 0- 1 . 4
5.1
4.8
p Preliminary.1 Excludes military transfers under grants.2 Includes military expenditures abroad, remittances, and pensions.3 Minus sign indicates outflow from the United States.4 Excludes U.S. subscription to International Monetary Fund.5 Less than $50 million.NOTE.—Data are from U.S. Department of Commerce and Federal
Reserve. Details may not add to totals because of rounding.
have declined further in the fourth quarterexcept for the large foreign investment of aU.S. automobile company. Much of the im-provement reflected differences in businesscycle timing between the United States andindustrial countries overseas.
Current account Exports expanded vigor-ously in 1960 and imports declined. Theannual rate of exports in the fourth quarterwas $1.5 billion higher than in the firstquarter of the year and $4.5 billion abovethe cyclical low early in 1959. Most of thegains occurred in exports to Europe andJapan, where boom conditions prevailed in1960. The growth in exports to thesecountries, however, included a wider rangeof goods than those accounting for the ma-jor cyclical fluctuations in exports between1956 and 1959.
Although heavily influenced by cyclicalfactors, the behavior of exports suggests thatthe underlying competitive position of U.S.industries has improved. Nevertheless, fur-ther expansion in exports will be required tocover outflows of private long-term and ofGovernment capital as well as some increasein imports associated with future growth inthe U.S. economy.
Imports were a little lower than in 1959.Accompanying the downturn in demand inthe United States, imports declined by morethan $1.5 billion at annual rates from thesecond to the fourth quarter of 1960. Lowerdomestic consumption of industrial materialsreduced imports of metals, building mate-rials, rubber, and wool. Imports of steel millproducts declined from the exceptionallyhigh level of late 1959 and early 1960. Asa result of increased competition from do-mestic compact cars and of some reductionin inventories, imports of foreign automo-biles in the fourth quarter were reduced toless than half the first-quarter rate.
Digitized for FRASER Federal Reserve Bank of St. Louis
GOLD AND DOLLAR TRANSFERS IN 1960 267
U.S. Government capital and aid. The out-flow of Government capital was larger in1960 than in 1959, reflecting U.S. subscrip-tion payments to two new international in-stitutions, the Inter-American DevelopmentBank and the International DevelopmentAssociation. Receipts from advance repay-ments of outstanding loans to industrialcountries, which had been large in 1959,were lower last year. As a result, the netoutflow of Government loans increased by$700 million. Government grants changedlittle.
Private long-term capital. Mainly becauseof a reduced rate of foreign investment in theUnited States, the net outflow of privatelong-term capital was one-sixth larger thanin 1959. Foreigners purchased $300 million,net, of U.S. corporate securities in the firsthalf of 1960 but were net sellers aftermidyear as evidence of recession appeared.In early 1961 they again added U.S. cor-porate securities to their portfolios.
There was little change from 1959 to1960 in the recorded net outflow of long-term private U.S. capital, despite a largetransfer in December 1960 when a U.S.automobile manufacturer purchased minor-ity interests in its British subsidiary. Newissues of foreign securities in the U.S. mar-ket were at the lowest level since 1956. TheInternational Bank floated a loan early in1960, but thereafter it borrowed abroad.Canadian borrowings declined sharply afterthe first quarter of the year, following warn-ings by the Canadian Finance Minister thatCanadian borrowing abroad involved an ex-change risk.
Private U.S. short-term and unidentifiedcapital flows. Large recorded outflows ofshort-term U.S. capital began in mid-1960.They were accompanied by net payments of$700 million in the second half of the year
on unidentified transactions, which appearin the balance of payments as errors andomissions. Customarily such transactionsshow net receipts.
U.S. banking claims on foreigners rose$900 million in the second half of 1960,after increasing less than one-fourth as muchin the first half. About one-third of thesebank funds moved to Europe and Canada.This movement resulted in large part fromchanges in money market conditions.
After the June increases in short-term in-terest rates in Germany and the UnitedKingdom and the decline in U.S. rates, therewere strong incentives to transfer funds fromthe United States to those countries. In thesecond half of 1960 short-term rates in theUnited Kingdom generally exceeded thosein the United States by more than 1 percent-age point after allowing for the cost of cover-ing the exchange risk. During much of theperiod there was also an interest advantagein favor of Canada, although a smaller one.
On the other hand, an increase of $460million in bank claims on Japan in 1960resulted in large part from changes in Jap-anese exchange regulations. These changesbroadened the use of dollar acceptance cred-its for financing imports and also permittedthe establishment by Japanese banks of con-vertible yen accounts for foreigners. Theincrease of $300 million in bank claims onLatin American countries represented fi-nancing of commercial transactions as wellas assistance to some countries that sufferedfrom imbalances in their international pay-ments.
Unidentified outflows reflected not onlydifferences in money market conditions be-tween the United States and foreign coun-tries but also uncertainty about exchangerates. A large part of this flow appears tohave gone to European markets, including
Digitized for FRASER Federal Reserve Bank of St. Louis

268 FEDERAL RESERVE BULLETIN • MARCH 1961
some in which interest rates were lower thanin the United States. Changes in commercialterms of payment were important in uniden-tified flows. In addition, these flows in-cluded transactions by both U.S. residentsand foreigners in connection with purchasesof gold and of securities and short-term as-sets in foreign currencies that were expectedto appreciate. In mid-January the U.S.Treasury Gold Regulations were amended toprohibit acquisition and possession of goldor gold securities outside the United Statesby persons subject to the jurisdiction of theUnited States.
Gold and dollar transfers. Net foreignpurchases of gold from the United States in1960 were $1,670 million. Foreign coun-tries purchased $1,970 million of gold, whilethe International Monetary Fund sold $300million to the United States and invested the
TRANSFERS OF GOLD AND DOLLARSTO FOREIGNERS, I9601
[Net transfers from, or to ( —) the United States,in billions of dollars]
Type of transfer
Total . . .
GoldDollar holdings....
Deposits at:F.R. Banks...Commercial
banksU.S. Govt. sec:
Short - term3.Bonds and
notesOther securi-
ties*Others
Year
3.8
1.72.1
- . 1
1.3
.2
.1
.5
.1
Jan.-Mar.
.5
(2).4
2
(2)
- . 1
.1
.1
.4
Apr.-June
.9
.1
.8
A
.9
- . 1
.1
.1- . 1
July-Sept.
1.2
.6
.6
(2)
.5
.3
— . 2.
- . 1
Oct.-Dec.
1.2
.9
.3
(2)
(2)
.1
.2- . 2
1 Includes international institutions.2 Less than $50 million.3 Excludes items described in note 4.4 Represents special nonnegotiable, non-interest-bearing U.S. notes
(International Monetary Fund series and International DevelopmentAssociation series).
5 Represents mainly bankers' acceptances and short-term com-mercial paper.
NOTE.—Details may not add to totals because of rounding.
proceeds in U.S. Government securities.Five countries—the United Kingdom, Switz-erland, the Netherlands, France, and Bel-gium—accounted for almost three-fourthsof the purchases by foreign countries.
Foreigners increased their dollar holdingsby $2.1 billion in 1960. Almost two-thirdsof the increase was in deposits with commer-cial banks. Some of these deposits repre-sented working balances of European bankswhich they acquired by accepting dollar-denominated deposits. Time deposits of for-eign and international institutions also rosein 1960. The increase occurred in the sec-ond half when U.S. Treasury bill yields werebelow rates paid on time deposits.
Non-interest-bearing notes held by inter-national institutions increased, reflectingboth the initial U.S. payment to the Inter-national Development Association and re-payments of dollars to the InternationalMonetary Fund by countries that had drawnon the Fund in earlier years. Increased for-eign holdings of short-term marketable U.S.Government securities after midyear re-sulted from reserve gains of countries thattraditionally hold a large share of their re-serves in such securities.
Foreign private dollar holdings declined$500 million in the second half of 1960after rising by almost that amount in thefirst half. At the end of the year, however,they were still more than $1 billion higherthan in mid-1958 when U.S. short-term rateswere at their previous cyclical lows.
When foreign private holders sell dollarsto foreign central banks that take all or partof their reserve gains in gold, there is an in-creased demand for monetary gold. Thus,movements of private funds from the UnitedStates to the United Kingdom, Switzerland,and the Netherlands contributed importantlyto net foreign gold purchases from the
Digitized for FRASER Federal Reserve Bank of St. Louis

GOLD AND DOLLAR TRANSFERS IN 1960 269
United States in the second half of 1960.Part of the dollar movements presumablywere connected with private purchases ofgold in the London market.
FOREIGN GOLD AND DOLLAR HOLDINGS
Additions of $4.2 billion to foreign gold re-serves and dollar holdings in 1960 reflectedtransfers from the United States and netpurchases of an estimated $370 million ofgold from new production and other sources.In the fourth quarter, when private pur-chases of gold reached a record level of al-most $500 million, foreign central bankssold an estimated $160 million, net, to pri-vate purchasers. During almost all of thisperiod the price of gold in the London mar-ket was above the price at which officialinstitutions in member countries are per-mitted to buy gold under the regulations ofthe International Monetary Fund. By theend of January 1961 these private demandsfor gold had declined to more normal levels.In February the gold premium disappearedand the flow of monetary gold into privatehoards stopped.
The increase in gold reserves and dollarholdings in 1960 was more concentrated ina few industrial countries than in other re-cent years. Holdings of many industrialcountries changed little, and those of mostof the less industrialized countries declined.
Germany, the United Kingdom, andJapan increased their holdings by a total of$3.5 billion. This sum, in combination withthe smaller gains of Canada and France,was equal to the total amount of gold anddollars transferred to foreigners by theUnited States during the year. Most foreigncountries had smaller export surpluses in1960 than in the preceding year, and thesharp increases in gold and dollar holdingswere due to capital inflows.
INCREASES IN FOREIGN GOLDAND DOLLAR HOLDINGS
Bil l ions of do l lo
1954-56 1958 1959 1960ANNUAL
AVERAGE
NOTE.—Includes international institutions. Countries withlargest gains are:
1954-56: Germany, Switzerland, and Canada;19S8: United Kingdom, Italy, and the Netherlands;1959: Italy, France, and Japan;1960: Germany, United Kingdom, and Japan.
By contrast, Germany once again had anexport surplus on merchandise account ofmore than $1.3 billion. In addition, net cap-ital inflows were of record proportions. As aresult German gold and dollar holdings in-creased $1.8 billion, compared with a rise of$200 million in 1959 when unusual transac-tions helped prevent reserves from increas-ing. Capital imports reflected high interestyields as well as speculation on the Germanmark and on capital appreciation of securi-ties.
British holdings increased $1.1 billion in1960 after repayment of [ $300 million to theInternational Monetary JFund. This rise inholdings occurred despite a record Britishtrade deficit and some decline in reservesof sterling area countries. Foreign dollardeposits placed with British banks increasedthe dollar holdings of these banks in thefirst half of the year, ahd high short-termyields in Britain attracted short-term fundsin the second hah*.
Digitized for FRASER Federal Reserve Bank of St. Louis

270 FEDERAL RESERVE BULLETIN • MARCH 1961
GOLD RESERVES AND DOLLAR HOLDINGSSIUCTCD IUROMAN COUNTRIIS
Billions of dollars7
-
--wv_,S UNITID KINGDOM
NITHIRIANDS
f 1 1
OIRMANV /
ITALY
^FRANCI j . ,
/ ' . . • . ^ *
_
i 1
- 4
- 3
- 2
195* 1960
NOTE.—End-of-quaner data except for France which areend-of-year data in 1954, 1955, and 1956.
Most of the increase in Japanese holdingsresulted from a capital inflow of $460 mil-lion from the United States. Canadian hold-ings increased in the first half of the year asnon-Canadians deposited U.S. dollar fundswith Canadian banks.
The concentration among a few countriesof gains in gold and dollar holdings at a timeof very large transfers to foreigners empha-sized the importance of capital flows whenmajor currencies are convertible. Largeoutflows of funds contributed to uncertain-ties in financial markets. Inflows of foreignfunds, on the other hand, greatly increaseddomestic liquidity in some countries thatobtained these funds, thus hampering theeffectiveness of monetary restraint for purelydomestic purposes.
In an effort to restrain inflows, Germanyprohibited the payment of interest on for-eigners' deposits and the sale of money mar-
ket paper to foreigners after mid-1960, andin August Swiss banks imposed a charge of1 per cent per annum on foreign-held de-posits of less than six months duration. Therevaluations of the currencies of Germanyand the Netherlands in March 1961 alsowere aimed, at least in part, at reducing theinflows of foreign funds that were contrib-uting to inflationary pressures.
The convertibility of most European cur-rencies, in fact established at the end of1958, was formally recognized in February1961. At that time nine of these countries(and also Peru) accepted the obligations ofArticle VOI of the Articles of Agreementof the International Monetary Fund. Pre-viously only the United States, Canada, and8 Latin American countries had acceptedthose obligations. All these countries arenow prevented from imposing restrictions oncurrent exchange transactions and from per-mitting divergent exchange rates for theircurrencies (multiple-currency practices)without prior approval of the Fund.
GOLD AND THE DOLLAR EXCHANGESTANDARD
Gold is the major component of the inter-national reserves of many countries, includ-ing virtually all major capital-exportingcountries. At the end of 1960 official goldreserves of foreign countries exceeded $20billion, the gold stock of the United Stateswas $17.8 billion, and gold holdings of theInternational Monetary Fund were $2.4 bil-lion. In addition, foreign countries heldmore than $10 billion of official reserves indollars, and 13 British Commonwealth coun-tries, together with the dependencies of theUnited Kingdom, held the equivalent ofabout $6 billion in sterling.
Digitized for FRASER Federal Reserve Bank of St. Louis

GOLD AND DOLLAR TRANSFERS IN 1960 271
These official holdings of gold, dollars,and sterling, together with the drawingrights on the International Monetary Fund,constitute the reserves of the international fi-nancial system of the free world. To assistin meeting international payments, coun-tries may supplement these reserves by bor-rowing abroad and by utilizing private hold-ings of foreign exchange.
Growth in international reserves in thepast decade has been almost entirely in goldand dollar holdings and in increased draw-ing rights on the Monetary Fund. Sterlingreserves have changed little. For the periodas a whole the increase in dollar reserves hasbeen about three-fourths of that in gold re-serves. In recent years gold has becomemore important.
From the end of 1950 to the end of 1956foreign countries added about $3.5 billionto their gold holdings and about $4.5 billionto their official short-term dollar holdings.The development and extension of thedollar-exchange standard in these years wasmarked by an increase in foreign officialdollar holdings from about one-fourth tomore than one-third of total foreign goldand short-term dollar reserves. Since 1956this proportion has declined, as foreigncountries have added $6 billion to their goldholdings and only $2.5 billion to officialdollar assets.
The increased emphasis on gold in recentyears has reflected in part substantial growthin the reserves of four European countriesthat have traditionally maintained their re-serves almost exclusively in gold. Thesefour—Belgium, the Netherlands, Switzer-land, and United Kingdom—added a totalof $2.5 billion in gold to their reserves be-tween the end of 1956 and the end of 1960.
More important, France, Germany, and
Italy during the same period added morethan $4 billion in gold to their reserves. Bythe end of 1960 Italy had more than doubledthe proportion of its reserves held in gold,and the proportion of French reserves heldin this form was higher than at other timesof large reserve holdings. The gold propor-tion of German reserves declined sharplyafter mid-1959 as official foreign exchangeholdings increased very rapidly.
In 1960 the increased emphasis on goldas a basis for reserves was not confined toindustrial countries. After midyear, whenforeign purchases of gold began to rise,and especially after October, when privatespeculation led to the establishment of apremium on gold, the central banks of anumber of less industrialized countries alsopurchased large amounts of gold. Some ofthese countries, such as Argentina andSpain, were experiencing rapid increases intheir reserves and they expanded their hold-ings of convertible foreign currencies as wellas their gold reserves. Others apparentlyconverted dollar assets into gold.
Although rapid conversions of foreignexchange into gold may contribute to inter-national disequilibrium, a continuing, rapidaccumulation of monetary reserves in a fewcountries is a more fundamental problem.International equilibrium is more likely tobe maintained in the long run if countrieswith adequate reserves and continuing bal-ance-of-payments surpluses finance their ex-port surpluses on a long-term basis that in-cludes credits or other aid to less developedareas, instead of adding further to reserves.Current efforts to distribute the burden ofinternational assistance more widely amongindustrialized nations are thus an essentialpart of a program to improve the systemof international payments.
Digitized for FRASER Federal Reserve Bank of St. Louis

Federal Reserve Operations inPerspective
ALMOST A YEAR AGO, in the earlier partof 1960, the Federal Reserve System beganto lean against the incipient down-wind ofwhat has come increasingly to be classifiedas the fourth cyclical decline of the post-war era.
Already, as the winter faded, and withit the inflationary psychology that had char-acterized the economic situation carryingover from 1959, bank reserve positions—which govern the ability of the bankingsystem to expand loans—had been madeless dependent on borrowed funds.
Then, with the spring in progress, theFederal Reserve moved further: first, topromote still greater ease in bank reservepositions; and next, beginning in May, toprovide additional reserves to induce a mod-erate expansion in bank credit and themoney supply.
In this period in particular, new suppliesof reserve funds were injected into the econ-omy by means of open market operations.The first effect was to enable member banksto reduce appreciably their reliance on bor-rowed reserves. After this was accomplished,the added reserves went to support the po-tential for bank credit expansion. In theseopen market operations, from late Marchthrough July, the Federal Reserve paid outabout $1.3 billion, net, for the Govern-ment securities it was buying on an increas-ing scale. After cushioning the reserve im-pact of a $500 million increase of currencyin circulation and gold outflow, this sum
NOTE.—Statement of William McC. Martin, Jr.,Chairman, Board of Governors of the Federal Re-serve System, before the Joint Economic Committee,March 7, 1961.
made possible a $300 million reduction inmember bank borrowing and a $500 mil-lion increase in member bank reserves.
But other means available for the exe-cution of System policy were used as well,particularly after mid-1960.
In early June, and again in August, dis-count rates were reduced, by Vi percent-age point each time. These reductions low-ered the cost of member bank borrowingsfrom the Federal Reserve Banks to 3 percent from the 4 per cent level that had pre-vailed before.
In August also, and again in November,by actions taken in implementation of a1959 Act of Congress, nearly $2 billionpreviously tied up in vault cash of memberbanks was released to assure ample cover-age of heavy borrowing needs for the falland pre-Christmas seasons. An additional$700 million was provided by further netpurchases of U. S. Government securities.
After midyear, the task of monetary pol-icy was complicated by an outflow of goldexceeding $1.5 billion. Thus, a substantialpart of the reserve funds provided by theSystem in this part of the year went to off-set the effect of this outflow on memberbank reserves.
Taking the year 1960 as a whole, thechange in bank reserve positions was dra-matic. From net borrowings from the Fed-eral Reserve of $425 million in December1959, member banks as a whole moved byDecember 1960 to a surplus reserve of $650million. The total turnaround exceeded abillion dollars.
Nevertheless, the money supply showed
272
Digitized for FRASER Federal Reserve Bank of St. Louis

FEDERAL RESERVE OPERATIONS IN PERSPECTIVE 273
a stubborn downtrend until mid-1960. Inthe spring, bank credit seemed to respondless promptly to easier reserve conditionsthan in comparable periods in the past.After May, however, the seasonally ad-justed money supply did begin to reflect ouractions. In the second half of the year themoney supply rose at an annual rate of about1.5 per cent. By year-end it had risen to$140.5 billion, just below the end-of-1959level. The money supply has expanded fur-ther in January and February of this year.Indeed, the annual rate of increase calcu-lated from the performance of these twomonths was in the neighborhood of 4 percent and the total money supply is nowabove year-ago levels.
The savings and time deposits of bankscontinued to grow in 1960 and after mid-year the pace of growth was unusuallyrapid. This increase in time deposits per-mitted an increase of total bank loans andinvestments for the year as a whole by $8.4billion. That was twice as much as the yearbefore.
Total credit in the economy in 1960 ex-panded by some $37 billion. That figurewas about two-fifths less than the record ex-pansion of $61.5 billion in 1959, on whichI reported to you a year ago, and morenearly in line with total credit extensions ofother recent years. The smaller growth in1960 was attributable to reduced pressureof borrowing demand, especially on the partof the Federal Government.
The most significant thing about the Fed-eral Reserve's operations in 1960 is not thatthey were extraordinary but, instead, thatthey were typical of Federal Reserve oper-ations under the flexible monetary policythat has been in effect now for a full decade.
That policy, as I have capsuled it beforein the shortest and simplest description I
have been able to devise, is one of leaningagainst the winds of inflation and deflationalike—and with equal vigor.
It is, in my opinion, the policy that theFederal Reserve must continue to follow ifit is to contribute to the provision of con-ditions conducive to a productive, activelyemployed, growing economy with relativelystable prices.
Yet, while the necessity for adhering tothat policy remains as great as ever, thedifficulty of executing it has become vastlygreater. This is so because of economic andfinancial crosswinds that have been devel-oping for years and, since mid-1960, havebeen gaining in force.
The problem, it now appears, and it isby no means a problem for monetary pol-icy alone, is to lean against crosswinds—simultaneously. I do not know how effec-tively this can be done. I do know, how-ever, that it will not be easy—just as theproblems of monetary policy and of otherfinancial policy have never been easy.
To put in perspective the problems thatthe Federal Reserve faces today—and howit is adapting to these problems—let mebriefly review monetary policy over the past20 years.
Immediately upon the United States' en-try into World War II in December 1941,the Board of Governors announced that theFederal Reserve was prepared—
(1) "To use its powers to assure thatan ample supply of funds is available atall times for the war effort, and
(2) "To exert its influence towardmaintaining conditions in the U. S. Gov-ernment security market that are satisfac-tory from the standpoint of the Govern-ment's requirements."Making good on its words, the Federal
Reserve saw to it that the banking system
Digitized for FRASER Federal Reserve Bank of St. Louis

274 FEDERAL RESERVE BULLETIN • MARCH 1961
was supplied with ample lendable reservesto provide the Government with all the war-financing funds that it could not raisethrough taxation and through borrowingpeople's savings.
It did so by buying outstanding Govern-ment securities on a huge scale. The Fed-eral Reserve's payments for these securitieswound up in bank reserves. In turn, thebanking system used these additional re-serves to purchase new securities that theTreasury was issuing to obtain further fundsto finance the war effort.
To keep the process going, the FederalReserve in effect maintained a standing of-fer to buy Government securities in unlim-ited amount at relatively fixed prices, sethigh enough to assure that their interestrates or yields would be pegged at pre-determined low levels. When no one elsewould accept those yields and pay thoseprices, the Federal Reserve did so. And inso doing, it helped to finance the war.
The process was successful for its emer-gency purpose. But the procedure of peg-ging Government securities at high pricesand low yields entailed a price of its ownthat the economy—the people and the Gov-ernment alike—would later have to pay.The results were two-fold:
(1) During wartime, money was createdrapidly and continually, in effect setting atime bomb for an ultimate inflationary ex-plosion—even though the immediate infla-tionary consequences were held more or lessin check by a system of direct controls overprices, wages, materials, manpower, andconsumer goods.
(2) The market for Government securi-ties became artificial. The price risks nor-mally borne by participants in that marketwere eliminated: bonds not payable for 20years or more became the equivalent of in-
terest-bearing cash since they could beturned into cash immediately at par valueor better—at the option of the owners, atany time.
The pegging of yields and prices of Gov-ernment securities was continued for sometime after the war to provide a gradual tran-sition to a market freely responsive to thechanging demand for and supply of securi-ties. A gradual transition was especially im-portant because capital values generally hadbecome moored to the artificial yields andprices in the pegged market for Govern-ment securities.
By 1950, however, the need to end thedependence of the Treasury and the Gov-ernment securities market upon money cre-ation by the Federal Reserve, and to haltthe inevitable inflationary consequences, hadbecome clear to many observers. The out-break of hostilities in Korea and the infla-tionary crisis that accompanied it broughtthe matter to a head.
Understanding of the problem was en-hanced by an exhaustive investigation con-ducted by a Special Subcommittee of theJoint Congressional Committee on the Eco-nomic Report, under the chairmanship ofSenator Paul Douglas. In its report in Janu-ary 1950, the Congressional Subcommitteesaid means must be found for discontinuingthe pegging of the Government securitiesmarket—if financial stability and effectivecontrol over the creation of new moneywere to become possible in the decade ofthe 1950's.
After considerable negotiation, the Treas-ury and the Federal Reserve System reachedan Accord, jointly announced by them onMarch 4, 1951, that served to recognize andreaffirm that:
(1) To serve the public welfare, Fed-eral Reserve policy must be directed toward
Digitized for FRASER Federal Reserve Bank of St. Louis

FEDERAL RESERVE OPERATIONS IN PERSPECTIVE 275
maintaining monetary conditions appropri-ate for the economy as a whole, rather thantoward special treatment for the Treasuryand the Government as if their interestscould differ properly from those of the peo-ple as a whole.
(2) Likewise to serve the public welfare,the Treasury's borrowing operations in man-agement of the Government's debt must bereasonably calculated to induce loans to theGovernment in an economic system whereno one can be compelled to lend his moneyat interest rates that he would be unwillingto accept voluntarily.
Thus, the Accord reestablished the com-plementary operation of monetary and debtmanagement policies: by the Federal Re-serve, to regulate the availability, supply,and cost of money with a view to its eco-nomic consequences; by the Treasury, tofinance the Government's needs in the tra-ditional context of a competitive market.
To provide for the gradual withdrawalof the pegs that had fixed market prices andyields, several procedures were institutedimmediately and carried out over the nextweeks and months.
That's much easier to say now than itwas to do then. For this was the problem:
(1) Hanging over the market like astorm cloud were two issues of the longestterm, 2V£ per cent bonds, outstanding inthe total amount of $19.7 billion. Theirprices had been propped around 100%throughout January and February 1951, byprice-supporting purchases.
(2) Although these bonds were not duefor redemption until 1967-72, they were in-stantly saleable in markets. In fact, manyof their holders were exercising their rightto sell—and selling in large amounts—so asto reinvest the proceeds in private securitiesyielding a higher return.
(3) Even a lowering of the price props,much less a complete withdrawal, mightvery easily cause holders of these instantlymarketable securities to unload them on themarket so heavily as to cause a collapse inthe market that might, in turn, provoke asharp economic setback.
Since the primary necessity was to safe-guard the market and the economy againstthat danger, these were the first steps takenunder the Accord:
Holders of the overhanging, fully market-able 2Vi per cent bonds of 1967-72 wereoffered an opportunity to exchange them, inearly April 1951, for 2% per cent bonds of1975-80 that could not be sold at all al-though they could, at the holder's option,be converted into 1 Vi per cent notes carry-ing sale privileges.
While the exchange was being effected,support buying was continued by the Fed-eral Reserve and the Treasury, but at de-clining prices: from January through April,net purchases by the Federal Reserve totaledapproximately $1.4 billion. When the ex-change was completed, the offer of nonmar-ketable bonds had been accepted on a scalesufficient to remove from the market $13.6billion of the overhanging marketable bonds,including $5.6 billion that had been heldby the Federal Reserve and the Treasury.
This exchange paved the way for discon-tinuance of Federal Reserve purchases ofGovernment bonds in support of their prices.
In May and June net purchases by theFederal Reserve of long-term bonds droppedoff to $250 million, but that was enough toassure against development of disorderlyconditions in the market. After that theFederal Reserve ceased buying almost alto-gether; purchases during the entire last halfof 1951 totaled only $20 million. Andprices, which had been supported around
Digitized for FRASER Federal Reserve Bank of St. Louis

276 FEDERAL RESERVE BULLETIN • MARCH 1961
100% at the start of the year, fluctuatedaround 97 during the last half of the yearwhen the bond market was on its own.
As the years 1951 and 1952 progressed,however, market developments demon-strated a disturbing skepticism among in-vestors that the Federal Reserve was in factabstaining (or would continue to abstain)from attempting to maintain certain prede-termined interest rates, regardless of theover-all state of the demand for and thesupply of savings. This skepticism was fedby market observation that the System en-gaged in purchases of securities involved inTreasury financings around the periods ofsuch financings.
After very careful study of the function-ing of the Government securities market andof the relation of Federal Reserve monetaryoperations to the market, the System de-cided that it would limit its open markettransactions to short-term securities, usuallythose of the very shortest term: Treasurybills. It also decided to refrain from opera-tions in securities involved in Treasury fi-nancings. In taking these steps, the FederalReserve objective was to convince the mar-ket that it was not undertaking to peg in-terest rates—and most certainly not thoseon intermediate- and long-term securities.
Accordingly, to minimize market uncer-tainty as to possible Federal Reserve opera-tions affecting market rates, and thereby toaid the effective competitive functioning ofthe market, the System announcd in April1953 that until further notice, unless dis-orderly conditions arose in the market, itwould operate only in the short-term area,where its operations would have the leastmarket impact.
I think I should point out here, in fair-ness to my colleagues on the Federal OpenMarket Committee, that in this decision to
limit our open market operations to the shortend of the market, we were not unanimous—neither then, nor since then.
Indeed, the divergence of views in theSystem on this question has been moremarked and more continuous than on anyother that I can recall in my ten years inthe Federal Reserve. That, I think, is read-ily understandable because the question re-lates to the techniques of open market oper-ations—a highly technical and involved sub-ject—rather than to general credit policy it-self.
In my opinion, it is and always will beeasier to achieve full agreement on what todo than on how to do it. To me, that ex-plains why the uninterrupted character ofthe divergence in the System over operat-ing techniques contrasts sharply with therather high degree of agreement we havehad, most of the time, over questions ofgeneral credit policy—whether and whento ease or restrain, and how much. Also,why it contrasts completely with the unde-viating firmness of our opposition, at alltimes, to returning to a pegged market.
These matters, however, are too wellknown to members of this Committee forme to labor them further at this point: therecords of your past hearings, as well as ourAnnual Reports, contain the views on thatscore of several members of the Open Mar-ket Committee, including the former andthe present vice chairmen of our Commit-tee, Messrs. Allan Sproul and Alfred Hayesof the Federal Reserve Bank of New York,as well as myself as chairman.
In any event, following the 1953 decisionI have described—the decision to confineour open market transactions to the short-term sector of the market—the emphasis inFederal Reserve operations continued to beplaced upon providing bank reserves to meet
Digitized for FRASER Federal Reserve Bank of St. Louis

FEDERAL RESERVE OPERATIONS IN PERSPECTIVE 277
the economy's needs rather than to set par-ticular rates of interest. Inevitably, how-ever, interest rate movements, since they re-flected basic demand and supply conditions,continued to be one of many factors consid-ered by the Federal Reserve in making judg-ments about the need for changes in the re-serve base. Conversely, Federal Reserve op-erations in the market continued, inevitably,to be an important influence affecting thegeneral level of market interest rates.
Despite confinement of its operations or-dinarily to the short-term area, the FederalReserve stood prepared to buy securitiesother than Treasury bills should unusualdevelopments create disorderly conditions inthe Government securities market and thusin credit markets as a whole. When disor-derly conditions seriously threatened as inlate November of 1955 or actually devel-oped as in the summer of 1958, the Fed-eral Reserve bought longer term securitiesto maintain or reestablish orderly trading.Apart from these exceptional and infrequentcircumstances, however, the Federal Re-serve maintained its reliance upon opera-tions in Treasury bills without interruptionuntil 1960. With the introduction of the 6-month Treasury bill in 1958 and the 12-month Treasury bill in 1959, the Systemextended the maturity range of its operationswithin the short-term area.
Toward the close of 1959 there were in-creasing indications, signaled by rapid risesin market interest rates accompanying amounting intensity of borrowing demands,that conditions bordering on the disorderlymight be encountered increasingly in the fu-ture and that there might be more occa-sions than in the past for corrective opera-tions by the Federal Reserve in maturitiesbeyond the range of Treasury bills.
After the middle of 1960, another con-
sideration pointing to a possible need forFederal Reserve operations in longer termsecurities arose from the convergence of twoimportant developments:
(1) On the domestic front, a decline inkey sectors of business activity, accompaniedby gradual rise in unemployment, suggestedthat the economy might be moving down-ward on a broad pattern of recession.
(2) In the area of international finan-cial accounts, a big deficit in the U. S. bal-ance of payments was made larger by a sub-stantial outflow of short-term funds from theUnited States to foreign money centers,partly in response to higher interest ratesabroad.
As I stated earlier, the Federal Reservehad been making bank reserves available toease the credit situation since the winter of1960. Thus, it had been a contributinginfluence in the decline in market interestrates to mid-1960. In the light of the do-mestic business and employment situationand the balance-of-international-paymentsdeficit, this decline presented us with adilemma in the latter part of 1960.
If the Federal Reserve continued to sup-ply reserves by buying only Treasury bills,the direct impact of its purchases mightdrive the rate on those securities so low asto encourage a further outflow of funds toforeign markets and thus aggravate thealready serious balance-of-payments deficit.
If, on the other hand, the Federal Reserverefrained from further action to supply fundsfor bank reserves because of the balance-of-payments situation, it would be unable tomake its maximum contribution towardcounteracting decline in domestic economicactivity through the stimulative influence ofcredit ease.
Thus, in an effort to expand reserves andyet to minimize the repercussions on the bal-
Digitized for FRASER Federal Reserve Bank of St. Louis

278 FEDERAL RESERVE BULLETIN • MARCH 1961
ance of payments, the Federal Reserve be-gan, in late October 1960, to provide someof the additional reserves needed by buy-ing certificates, notes, and bonds maturingwithin 15 months. Since that time, the Sys-tem has bought and sold such securities, inaddition to bills, on a number of occasions,duly reporting these portfolio changes in apublic statement issued every Thursday.
Now here let me note something aboutthe decline in interest rates that took placein 1960. During the first eight monthsmarket rates on Treasury bills and interme-diate-term issues fell much more sharplythan on bonds, as is usual in a period ofdeclining rates.
After late summer, however, the differen-tial between short- and long-term ratesceased to widen, and the average level ofrates itself remained relatively unchanged.The increased net outflow of domestic andforeign capital from the United States in thesecond half of the year, in response partlyto the attraction of higher interest rates andpotential capital gains abroad, was itself afactor in keeping interest rates in the UnitedStates from declining, because it reduced thesupply of funds available here.
It was in the latter part of 1960, as I havenoted, that Federal Reserve operations weredirected more and more toward reducingthe direct impact on Treasury bill yieldsof Federal Reserve purchases. Thus, whenthe System was providing for the large sea-sonal expansion in credit needs that occursin the fall and pre-Christmas seasons, itdid not rely solely on further open marketpurchases but took actions that made vaultcash holdings of banks fully available formeeting reserve requirements. And onthe occasions when the System did engagein open market operations, it often con-ducted these operations in short-term Gov-
ernment securities other than Treasury bills.With the domestic economy and the bal-
ance of payments continuing to pose con-flicting problems, open market transactionsin securities other than Treasury bills arecontinuing. Beginning on February 20, aswe stated in an announcement issued on thatdate, the Federal Reserve has engaged inpurchase of securities having maturities be-yond the short-term area, putting to prac-tical test some matters on which it has beenpossible in recent years only to theorize.1
There is still a question as to the possi-bility of bringing about a meaningful de-cline in longer term rates through purchasesof longer term securities without, at the sametime, causing a shift in market demand to-ward short-term securities that would alsopress down levels of short-term rates.
On the other hand, it seems to me, fewcould question the desirability of the result,if it can be attained, as a means of keepingfinancial incentives attuned to the currentneeds of our domestic economy and our in-ternational financial position.
We will want to observe closely, of course,the effect of this change in operating tech-niques on the market and its capacity to ful-fill its role in transferring a large volume ofsecurities among our various financial insti-tutions to facilitate their responses to shiftsin the supply of savings and the demands ofborrowers.
In our country the Government cannotforce anyone to lend his money at rates heis unwilling to accept—any more than it canforce him to spend his money at prices heis unwilling to pay. In the securities mar-ket, investors always have the alternative ofinvesting their funds in short-term securitiesif they feel that yields in the longer term
1For text of this announcement, see BULLETIN forFebruary, 1961, p. 165.
Digitized for FRASER Federal Reserve Bank of St. Louis

FEDERAL RESERVE OPERATIONS IN PERSPECTIVE 279
area are unfavorable. Therefore, in the out-come of this test much will depend on thereactions of investors.
As I have said many times in the past,before this Committee and others, I am infavor of interest rates being as low as pos-sible without stimulating inflation, becauselow rates can help to foster capital expendi-tures that, in turn, promote economicgrowth.
Yet, as I assume we can all agree, in-terest rates cannot go to and long remainbelow the point at which they will attracta sufficient volume of voluntary saving tofinance current investment at a relativelystable price level. At least we can agree, Ithink, that interest rates cannot be drivenand long held below that point without re-sort to outright creation of money on sucha scale as to invite inflation, serious socialinequity, severe economic setback, and, un-der present conditions, an outflow of fundsto other countries and consequent drains onthis country's gold reserves.
I do not believe anyone expects the Fed-eral Reserve to engage in operations thatwill promote a resurgence of inflation inthe future. In combating inflation in thepast, undue reliance has perhaps been placedon monetary policy. I can readily agreewith those who would have fiscal policy,with all of its powerful force, carry a greaterresponsibility for combating inflation, and Iam encouraged to think that this may belikely in the future. If we do this, we shouldmore nearly achieve our over-all stabiliza-tion goals, along with some reduction inthe range of interest rate fluctuation.
That, however, is a matter for anotherday. Today, we have in this country a seri-ous problem to contend with in the erraticbut persistent rise in unemployment that hastaken place since mid-1960. In January the
seasonally adjusted rate of unemploymentwas 6.6 per cent of the labor force, the high-est percentage since 1958; the actual num-ber of persons unemployed was 5.4 million,the highest number since the days beforeWorld War II.
The contracyclical operations that theFederal Reserve is and has been conducting,despite the handicaps imposed by the bal-ance-of-international-payments difficultiesthat we hope will be overcome, should behelpful, as they have been in the past, incombating that part of unemploymentcaused by general economic decline. Cer-tainly those of us in the Federal Reservemean them to be.
While the unemployment that arises fromcyclical causes should prove only tempo-rary, there are, however, forces at work thathave produced another, structural type ofunemployment that is worse, in that it al-ready has proved to be indefinitely persist-ent—even in periods of unprecedented gen-eral prosperity.
The problem of structural unemploymentis manifest in the higher total of those leftunemployed after each wave of the threemost recent business cycles, and in the idle-ness of many West Virginia coal miners,Eastern and Midwestern steel and auto work-ers, West Coast aircraft workers, and likegroups, in good times as well as bad.
To have important effect, attempts to re-duce structural unemployment by massivemonetary and fiscal stimulation of over-alldemands probably would have to be carriedto such lengths as to create serious new prob-lems of inflationary character—at a timewhen consumer prices already are at a rec-ord high.
Actions effective against structural unem-ployment and free of harmful side effectstherefore need to be specific actions that
Digitized for FRASER Federal Reserve Bank of St. Louis

280 FEDERAL RESERVE BULLETIN • MARCH 1961
take into account the who, the where, andthe why of unemployment and, accordingly,go to the core of the particular problem.
Analysis of current unemployment showsthat, in brief:
(1) The lines of work in which job op-portunities have been declining most pro-nouncedly for some years are farming, min-ing, transportation, and the blue collarcrafts and trades in manufacturing indus-tries.
(2) The workers hardest hit have beenthe semiskilled and the unskilled (along withinexperienced youths newly entering thelabor market). These workers have ac-counted for a significant part of the increasein the level and duration of unemployment.Among white collar groups, employment hascontinued to increase and unemploymenthas shown little change even in times ofcyclical downturn.
(3) The areas hardest hit have been, pri-marily, individual areas dependent upon asingle industry, and cities in which such in-dustries as autos, steel, and electrical equip-ment were heavily concentrated.
Actions best suited to helping these groupswould appear to include more training andretraining to develop skills needed in expand-ing industries; provision of more and betterinformation about job opportunities for var-ious skills in various local labor markets;tax programs to stimulate investment thatwill expand work opportunities; revision ofpension and benefit plans to eliminate pen-alties on employees moving to new jobs;reduction of impediments to entry into jobs,and so on. Measures to alleviate distressand hardship are, of course, imperative atall times.
In some of the instances cited, the pri-mary obligation of the Government will beleadership, rather than action, for obviously
a major responsibility and role in efforts toovercome unemployment, both cyclical andstructural, rests upon management and labor.
For our part we in the Federal Reserveintend to do our share in combating thecyclical causes of unemployment, as effec-tively as we can, and in fostering the finan-cial conditions favorable to growth in newjob opportunities.
Meanwhile there is, I think, need on thepart of all of us to recognize that the worldin which we live today is not only a worldthat has changed greatly in recent years,but also a world that even now is in a pe-riod of further transition.
In economics and finance, no less than inother relationships, the lives of nations andpeoples throughout the earth have beenmade more closely interlinked by develop-ments that have progressed since the begin-ning of World War II—interlinked at suchspeed, in fact, as to outstrip recognition.
Today, the condition of our export trade,from which a very large number of Amer-icans derive their livelihood, depends notonly upon keeping competitive the costs andprices of the goods we produce for saleabroad, but also upon the prosperity or lackof it in the countries that want to buy ourgoods.
Whether our Government's budget is bal-anced or not, a factor that greatly affectsour economic and financial condition, de-pends not only upon our own decisions re-specting expenditures and taxes, but alsoupon decisions by governments abroad as tohow far they will share the costs of mutualdefense and of programs to aid underdevel-oped nations of the world. The decisionsthose governments make affect, in turn, theirbudget positions and, through them, eco-nomic and financial conditions in their owncountries.
Digitized for FRASER Federal Reserve Bank of St. Louis

FEDERAL RESERVE OPERATIONS IN PERSPECTIVE 281
Every country, of course, will always haveproblems of its own that differ from the cur-rent problems of other lands. CommunistRussia, for example, gives some signs ofworry over a problem old and familiar tous and to them: The danger of economicallydestructive inflation. The New York Timesof January 30 reported that Premier Khru-shchev, in a recent public speech, hadpointed to precisely that danger, noting that"the purchasing power in the hands of theSoviet people might exceed the value of thegoods available for them to buy."
In Brazil a new administration is seekingmeans to cope with an inflation that alreadyhas exacted an enormous price in sufferinginflicted upon her people by soaring in-creases in the cost of living.
In Belgium a program of austerity, tobring about adjustments made necessary bythe loss of the Congo, provoked riots thatrecently made headlines across the UnitedStates.
In the free world the United States hasnot been alone in finding that its domesticsituation and balance-of-payments positionseemed to call for conflicting actions, thuspresenting monetary and fiscal policy mak-ers some complicating crosscurrents.
On January 19, for example, the GermanFederal Bank reduced its equivalent of ourdiscount rate and made known at the timethat it was doing so, despite the high levelof activity in the German economy, for thepurpose of reducing a heavy and trouble-some inflow of funds from other countries.A month earlier the Bank of England had
reduced its bank rate also, to curb a short-term capital inflow.
Over the last weekend Germany and theNetherlands up-valued their currencies bynearly 5 per cent; these actions should helpthem to reduce the inflow of volatile capital.
The truth of it is that the major countriesof the Western world, after a long and pain-ful struggle in the wake of World War IIto restore convertibility of their currencies,and thus to lay the necessary basis for in-terchanges that can enhance the prosperityof all, have succeeded—only to find thatsuccess, too, brings its problems.
Today, though currency convertibilitydoes in fact make possible an expanding vol-ume of mutually profitable interchangesamong nations, it also makes possible dan-gerously large flows of volatile funds amongthe nations concerned—flows on a scale thatcould shake confidence in even the strong-est currencies, and cause internal difficultiesin even the strongest economies.
To the cause of these flows—differencesin interest rates, conditions of monetary easeor tightness, budgetary conditions, and de-velopments of any kind that raise questionsand doubts about determination to preservethe value of a country's currency—we mustremain alert and ready, willing and able tomeet whatever challenge arises.
I, for one, am confident that we will meetsuch challenges as may come. Our oppor-tunities for the future are more importantthan the problems they bring with them.Let us seize these opportunities, firmly andwithout fear.
Digitized for FRASER Federal Reserve Bank of St. Louis

Quarterly Surveyof Consumer Buying Intentions
IN EARLY 1961, the proportions of con-sumers reporting plans to buy both new andused automobiles within the next six monthswere at about the same level as a year ear-lier, after having fallen below year-earlierlevels in the second half of 1960. The pro-portion reporting plans to buy major house-hold appliances was substantially smallerthan a year earlier, but about equal to theJanuary 1959 level. Plans to buy houseswere also lower than in January 1960.These findings are based on data from theJanuary Survey of Consumer Buying In-tentions, conducted for the Board of Gov-ernors by the Bureau of the Census.1
Total plans to buy both automobilesand household durable goods showed littlechange from October 1960 to January 1961,compared with a sharp decline in the cor-responding period the year before. Thesharp reduction last year, however, reflectedin part the exceptionally high level of plansreported in October 1959.
The proportion of families reporting adecline in income from a year earlier washigher in January than at any time during1960, although the proportion reporting in-creases remained larger than the proportionreporting declines. Consumer expectations
1 This article presents the findings of the ninth Quar-terly Survey of Consumer Buying Intentions. TheQuarterly Survey is conducted under the supervisionof Mona E. Dingle of the Board's staff and Selma F.Goldsmith of the Bureau of the Census. Articles cov-ering the previous eight Surveys and giving a detaileddescription of the Survey appeared in the Federal Re-serve BULLETIN for September 1960, pp. 973-1003 andfor December 1960, pp. 1332-37. The current articlewas prepared by Tynan Smith and Theodore G.Flechsig.
regarding future income prospects remainedabout the same as in other recent Surveys.
Automobiles. In January 1961, 3.5 percent of the families interviewed reportedplans to buy new automobiles during thenext 6 months, compared with 3.4 per centa year earlier and 3.0 per cent in January1959. In October 1960, reported plans tobuy new automobiles had been substanti-ally lower than a year earlier. In October1959, however, buying plans had been un-usually high, in part as a result of the in-terest engendered by the introduction ofcompact cars.
Plans to buy used cars were at about thesame level in January as at the beginningof each of the two preceding years, with4.5 per cent of all families expressing plansto buy within 6 months. There was a slightdecline from year-earlier levels, however, inthe number of planners who were unde-cided between new and used cars. Reinter-view studies show that these families aregenerally more likely to purchase used cars.During 1960 plans to buy used cars wereclose to or below 1959 levels, but plannerswho were undecided between new and usedcars were more numerous in 1960.
About the same proportion of familiesthis January as a year earlier expressed dis-satisfaction with the automobile they cur-rently owned or reported that they hadshopped for an automobile in the weeksimmediately preceding the Survey. In Jan-uary 1959, fewer families had expresseddissatisfaction with their automobiles butmore had reported shopping for an auto-
282
Digitized for FRASER Federal Reserve Bank of St. Louis

QUARTERLY SURVEY OF CONSUMER BUYING INTENTIONS 283
mobile, perhaps in part because of the laterintroduction date for 1959 model automo-biles.
According to both survey data and salesdata from independent sources, consumerpurchases of new cars continued aboveyear-earlier levels in the fourth quarter of1960 despite the lower level of buying plansas compared with late 1959. Comparisonwith late 1959, however, is affected by thelow level of sales associated with shortagesfollowing the steel strike; this developmentapparently was not fully taken into accountby families interviewed in mid-October ofthat year. Consumer purchases of usedcars were about the same in each quarterof 1960 as in the corresponding periods of1959, but the sustained level of sales was
accompanied by a substantial reduction inused car prices.
Major household appliances. Reportedplans to buy washing machines and refrig-erators within 6 months continued belowyear-earlier levels in January, after havingbeen at year-earlier levels last July. Plansto buy television sets were about the sameas in January of each of the two precedingyears. The sum of buying plans for these3 major household durable goods in Janu-ary was substantially lower than the totalreported in January 1960, but about thesame as in January 1959. Plans to buythe four growth items introduced in the 1960Surveys—clothes dryers, dishwashers, airconditioners, and radio and phonographicequipment—were also lower than in Janu-
PLANS TO BUY DURABLE GOODS WITHIN 6 MONTHSPer cent of all families Per cent of all families12
10
8
NEW AND USED
^ ^ 1960
1961 V .
AUTOMOBILES
1 9 5 9 ^
> ^
1 1
-
1
WASHING MACHINES
NEW AUTOMOBILES
REFRIGERATORS
USED AUTOMOBILES
JAN. APR. JULY OCT.
TELEVISION SETS
JAN. APR. JULY OCT.
NOTE.—Plans for new and used automobiles combined include plans of families undecided between new and used.
Digitized for FRASER Federal Reserve Bank of St. Louis

284 FEDERAL RESERVE BULLETIN MARCH 1961
ary I960.2 The decline in 6-month plansfor household durable goods from early1960 was general for all major income andage groups and for each of the four geo-graphic regions.
The number of consumer purchases ofthe 7 household durable goods covered inthe Survey totaled 14.1 per 100 families inthe last quarter of I960, slightly below the14.9 reported for the same quarter a yearearlier. The decline reflects fewer pur-chases of washing machines, refrigerators,and clothes dryers. Purchases of wash-ing machines and refrigerators had fallensharply below year-earlier levels in the thirdquarter of 1960 after having been aboveyear-earlier levels in the second quarter.
Houses. Reported plans to buy housesin both the 6-month period and the 12-month period following the January Surveywere fewer than a year earlier. In Janu-ary 1961, 4.8 per cent of the families re-ported plans to buy houses in the next year,compared with 5.7 per cent in January1960. Buying plans for new houses weredown relatively more than plans to buyexisting houses, declining to 1.7 per centfrom 2.2 per cent a year earlier. Plans tobuy existing houses were 1.9 per cent thisJanuary as compared with 2.1 per cent ayear earlier. No data are available on housepurchase plans prior to 1960.
Income change. The proportion of fami-lies reporting lower incomes than a yearearlier was larger this January than in Jan-uary 1960, and the proportion reportinghigher incomes was correspondingly smaller.Income reductions were reported by 18.7per cent of the families interviewed in therecent Survey, the largest proportion sinceJanuary 1959, when about 20 per cent re-
2 Detailed information on plans to buy houses andthese four household durable goods will be presentedin the report on the April 1961 Quarterly Survey.
ported such reductions. Reports of incomereductions had declined after January 1959,increased during the steel strike, and de-clined again in the first half of 1960.
Nearly one-fourth of the families inter-viewed this January expected their incomesto increase in the coming year. This wasabout the same proportion as in other Sur-veys conducted in 1959 and 1960. Theproportion of families expecting their in-come to decline also has remained rela-tively unchanged at about 6 per cent.
Sampling variability. Data from the Quar-terly Surveys are based on about 17,000interviews and, as is true of all sample sur-veys, may differ because of sampling vari-ability from data that would be obtained ifa complete census were taken. The chancesare about 2 in 3 that an estimate from theSurvey would differ from a complete censusby less than the sampling errors shown inthe table, and 95 in 100 that the differencewould be less than twice the errors shown.
SAMPLING ERRORS OF PROPORTIONS
The chances are about 2 out of 3 that the value being estimated lieswithin a range equal to the reported percentage plus or minus thenumber of percentage points shown below.
Number of households
1,000,0002,000,0005,000,000
10,000,00020,000,00050,000,000!
Reported percentage
2 or 98
0.80.60.4
0.30.20.1
10 or 90
1.81.30.8
0.60.40.3
25 or 75
2.61.81.2
0.80.60.4
50
3.02.11.4
1.00.70.4
1 Approximate total number of households.
The reliability of estimates of percentagesdepends on the size of the estimated per-centage and the size of the sample on whichthe percentage is based. Proportions of thetotal sample in the Quarterly Survey arebased on somewhat more than 50 millionhouseholds. The number of households invarious income and age groups can be esti-mated from the total number of householdsand the distributions shown in Table 5.
Digitized for FRASER Federal Reserve Bank of St. Louis

QUARTERLY SURVEY OF CONSUMER BUYING INTENTIONS 285
TABLE 1
PLANS TO BUY DURABLE GOODS, 1959-61 *
[Percentage of all families]
Buying plan1959
Jan. Apr. July Oct.
1960
Jan. Apr. July Oct.
1961
Jan. 2
New or used automobile:3
Planning to buy within 12 monthsDoesn't know about 12-month plan
Planning to buy within 6 monthsTiming of planned purchase:
First 3 monthsSecond 3 monthsDoesn't know when in 6 months
Doesn't know about 6-month plan
Has shopped for automobile4
Dissatisfied with automobile owned
New automobile:Planning to buy within 12 months
Planning to buy within 6 monthsDegree of certainty:
DefinitelyProbablyMaybe
Timing of planned purchase:First 3 monthsSecond 3 monthsDoesn't know when in 6 months
Used automobile:Planning to buy within 12 months
Planning to buy within 6 monthsDegree of certainty:
DefinitelyProbablyMaybe
Timing of planned purchase:First 3 monthsSecond 3 monthsDoesn't know when in 6 months
Washing machine:Planning to buy within 6 months
Degree of certainty:DefinitelyProbablyMaybe
Timing of planned purchase:First 3 monthsSecond 3 monthsDoesn't know when in 6 months
Doesn't know about 6-month plan
Refrigerator:Planning to buy within 6 months
Degree of certainty:DefinitelyProbablyMaybe
Timing of planned purchase:First 3 monthsSecond 3 monthsDoesn't know when in 6 months
Doesn't know about 6-month plan
Television set:Planning to buy within 6 months
Degree of certainty:DefinitelyProbablyMaybe
Timing of planned purchase:First 3 monthsSecond 3 monthsDoesn't know when in 6 months
Doesn't know about 6-month plan
16.98.3
8.4
2.13.82.54.8
5.18.9
6.6
3.0
1.21.10.8
0.91.40.7
8.4
4.6
.3
.6
.7
.2
.9
.5
5.8
3.2
2.6
1.32.12.43.2
3.6
1.8
1.8
0.71.31.62.6
4.2
2.5
1.7
1.11.41.73.0
15.67.7
7.5
2.43.02.14.3
4.88.1
6.5
2.7
0.90.90.8
0.71.40.6
7.1
4.0
.5
.41.1
5.0
2.9
2.1
2.12.9
3.4
1.8
1.6
1.01.01.42.2
2.3
1.5
1.01.41.42.7
16.88.3
8.2
2.53.22.54.9
5.28.1
6.9
3.1
1.21.10.9
0.91.40.8
7.7
4.1
.4
.5
.2
.5
.31.3
6.0
3.1
2.9
1.51.92.63.5
4.0
2.02.1
1.01.21.83.0
3.9
2.3
1.5
1.21.31.43.3
20.97.5
10.1
3.04.32.84.7
6.59.1
9.5
4.6
1.81.61.2
1.42.11.1
9.2
4.6
1.61.41.6
1.42.01.2
6.9
3.5
3.4
1.72.42.83.0
4.6
2.0
2.5
0.91.81.92.7
5.6
3.3
2.3
2.01.71.93.1
18.48.9
9.3
2.54.42.44.7
4.59.8
7.3
3.4
1.31.01.1
0.91.70.8
8.3
4.5
1.61.51.5
1.32.01.2
6.4
2.01.23.2
1.42.42.63.3
4.4
1.20.92.2
0.91.81.73.3
4.5
1.41.12.0
1.21.61.73.5
16.89.4
8.6
3.03.22.44.9
5.58.7
6.9
3.2
1.50.90.8
1.21.30.7
1.31.21.3
1.41.3
5.9
2.11.22.6
1.52.12.33.0
3.7
1.20.81.7
1.01.21.53.0
4.0
1.41.11.6
1.21.51.33.3
16.59.3
7.9
2.63.02.35.0
4.98.0
6.8
3.0
1.21.00.8
0.91.40.7
7.1
3.7
1.31.21.2
1.41.21.1
5.8
1.91.32.7
1.62.02.23.5
3.9
1.20.72.0
1.01.21.73.3
3.9
.3
.0
.7
.2
.3
.43.5
18.39.0
8.9
2.93.62.44.7
6.39.6
7.8
3.6
1.51.20.9
1.31.40.9
7.9
3.9
1.21.31.4
1.31.70.9
5.4
1.91.32.2
1.42.21.83.2
3.3
1.10.61.6
0.81.21.32.9
4.8
.9
.5
.43.2
17.97.4
9.0
2.54.12.42.7
4.510.0
7.4
3.5
.4
!o
.0
.60.9
8.3
4.5
1.51.41.6
1.32.01.2
5.5
1.71.12.7
1.32.12.11.1
3.7
1.20.71.9
0.91.41.40.7
4.4
1.21.22.0
1.31.51.61.0
1 As reported in interviews in January 1959 and in the first monthof succeeding quarters. Interviews are taken in the week that includesthe 19th of the month. Planning period begins on date of interview.
2 In the 1959 and 1960 Surveys, nonresponse cases on buying plans(2 per cent or less of all families) were classified in the "doesn'tknow" group. Beginning in January 1961, these nonresponse cases
were distributed proportionately among the groups for which re-sponses were obtained.
3 Includes those undecided between new and used.4 In the weeks immediately preceding interview.NOTE.—Details may not add to totals because of rounding.
Digitized for FRASER Federal Reserve Bank of St. Louis

286 FEDERAL RESERVE BULLETIN • MARCH 1961
TABLE 2
PLANS TO BUY DURABLE GOODS WITHIN 6 MONTHS, 1959-61
Income or age group
1959
Jan. Apr. July Oct.
1960
Jan. Apr. July Oct.
1961
Jan.i
Prospective purchasers as a percentage of all families in group
New or used automobile:2
All families
Income: 3Under $3,000$3,000-$4,999$5,000-$7,499$7,500-59,999$10,000 and over
Age of head:Under 3535-5455 and over
New automobile:All families
Income:3
Under $3,000$3,000-$4,999$5,000-$7,499$7,500-$9,999$10,000 and over
Age of head :Under 3535-5455 and over
Used automobile:All families
Income:3
Under $3,000$3,000-$4,999$5,000-$7,499$7,500-$9,999$10,000 and over
Age of head:Under 3535-5455 and over
Household durable goods:4
All families
Income:3
Under $3,000$3,000-$4,999$5,000-$7,499$7,500-$9,999$10,000 and over
Age of head:Under 3535-5455 and over
4.18.6
10.413.317.0
11.69.44.9
3.0
0.21.93.97.3
10.8
3.23.52.1
4 . 6
3.65.95.55.14.2
7.34.92.3
13.6
10.714.314.918.021.5
18.514.59.1
7 .5
3.47.19.2
12.913.9
10.68.53.9
2.7
0.51.83.16.38.5
3.23.01.8
4.0
2.64.65.15.43.8
6.24.51.8
12.2
8.512.813.816.117.7
16.113.18.0
8.2
4.47.4
10.413.116.1
11.19.34.7
3.1
0.91.84.06.8
10.4
3.43.72.3
4 . 1
3.24.75.25.23.8
6.84.51.7
10.1
4.49.8
13.116.119.6
12.811.86.2
4 . 6
0.73.15.5
10.015.3
4.35.83.3
4 . 6
3.45.86.24.63.3
7.64.82.3
9 .3
4.28.3
11.715.119.3
11.211.45.4
3.4
0.72.23.96.6
11.7
3.14.42.4
4 . 5
3.04.75.96.25.4
6.45.42.1
8.6
4.37.2
11.312.415.7
11.610.14.7
3.2
0.91.74.45.49.4
3.24.02.2
3.8
2.64.24.84.73.2
6.74.21.4
7 .9
4.16.89.3
13.816.1
11.19.04.4
3.0
0.81.53.56.49.6
3.33.62.0
3.7
2.84.04.55.34.0
6.53.91.5
Prospective purchases per 100 families in group
13.9
10.414.216.217.521.5
17.015.79.5
17.0
12.718.419.220.525.8
21.118.612.1
15.3
11.314.517.322.823.3
18.317.410.6
13.6
9.713.014.216.620.9
19.314.68.4
13.6
9.513.615.917.521.8
19.014.98.5
8.9
4.37.9
10.814.018.0
11.810.35.2
3 .6
0.62.34.46.7
11.4
3.64.32.8
3.9
2.94.34.85.53.8
6.64.21.6
13.5
9.014.115.518.520.9
19.214.98.0
9 . 0
3.97.7
11.512.417.7
11.810.75.2
3.5
0.61.94.16.3
11.3
3.64.32.5
4 . 5
2.84.96.04.94.8
7.15.02.0
13.7
8.511.616.218.523.1
17.515.58.9
1 In the 1959 and 1960 Surveys, nonresponse cases on buying plans(2 per cent or less of all families) were classified in the "doesn'tknow" group. Beginning in January 1961, these nonresponse caseswere distributed proportionately among the groups for which re-sponses were obtained.
2 Includes those undecided between new and used.3 Total money income of family in 12 months immediately pre-
ceding interview.4 Refers to sum of all prospective purchases of the following
durable goods: washing machines, refrigerators, television sets.
Digitized for FRASER Federal Reserve Bank of St. Louis

QUARTERLY SURVEY OF CONSUMER BUYING INTENTIONS 287
TABLE 3
PURCHASERS OF AUTOMOBILES AND OTHER SPECIFIED DURABLE GOODS, 8 QUARTERS, 1959-60*
[Percentage of all families]
Type of durable good
Automobile:New . . . .Used
Washing machineRefrigeratorTelevision set
1959
Jan.-Mar.
2.45.22.51.73.4
Apr.-June
2.85.72.52.22.6
July-Sept.
2.65.23.33.13.3
Oct.-Dec.
2.44.73.22.34.8
1960
Jan.-Mar.
2.75.02.41.63.3
Apr.-June
3.25.72.72.42.9
July-Sept.
2.85.22.82.73.4
Oct.-Dec.
2.84.92.91.94.8
i As reported in month immediately following purchase period.
TABLE 4
PAST AND EXPECTED CHANGES IN INCOME, 1959-61
[Percentage distribution of families]
Direction of change
Current income compared with a year earlier:HigherSameLower.Doesn't know
All families
Expected income compared with current:2
HigherSameLowerDoesn't know
All families . . . .
1959
Jan.
22.754.319.93.2
100.0
24.355.86.9
13.0
100.0
Apr.
22.358.316.43.0
100.0
21.059.86.0
13.2
100.0
July
23.357.815.73.2
100.0
23.058.66.3
12.1
100.0
Oct.
23.455.617.53.5
100.0
24.457.06.2
12.5
100.0
1960
Jan.
24.355.416.63.7
100.0
23.757.95.6
12.7
100.0
Apr.
21.659.715.13.6
100.0
23.658.65.5
12.3
100.0
July
20.860.015.23.9
100.0
23.857.85.8
12.5
100.0
Oct.
22.657.116.53.8
100.0
23.857.65.7
12.9
100.0
1961
Jan.i
22.657.918.70.8
100.0
24.657.26.0
12.2
100.0
1 In the 1959 and 1960 Surveys, nonresponse cases for the dataincluded in this table (between 2 and 3 per cent of all families) wereclassified in the "doesn't know" group. Beginning in January 1961,these nonresponse cases were distributed proportionately among the
groups for which responses were obtained.2 Expected a year hence.NOTE.—Details may not add to totals because of rounding.
TABLE 5
INCOME AND AGE OF PURCHASERS OF SPECIFIED DURABLE GOODS, FOURTH QUARTER, 1960 *
[Percentage distribution]
Income or age group
Income:2
Under $3 000$3,000-$4 999$5,000-$7,4999$7 500-$9 999$10,000 and overNot ascertained
All families. .
Age of head :Under 3535-5455 and over
All families
All families(purchasersand non-
purchasers)
27.221.724.010.610.36 .2
100.0
22.942 534.6
100.0
Automobile
New orused
14.921.828.614.215.15 .4
100.0
32.648.319.1
100.0
New
7.713.827.020.626.3
4 . 7
100.0
23.953.322.9
100.0
Used
19.126.429.610.48.65.9
100.0
37.745.416.9
100.0
Washingmachine
17.621.826.712.413.28.2
100.0
33.246.620.2
100.0
Refrig-erator
23.320.124.410.812.29.1
100.0
32.943.123.9
100.0
Televisionset
21.923.925.012.710.85.8
100.0
33.144.822.1
100.0
1 As reported in month immediately following purchase period.2 Total money income of family in 12 months immediately pre-
ceding interview in January 1961.
NOTE.—Details may not add to totals because of rounding.
Digitized for FRASER Federal Reserve Bank of St. Louis

Law DepartmentAdministrative interpretations, new regulations, and similar material
Savings Deposits Not Evidenced by a Pass BookRegulation Q, Payment of Interest on Deposits,
permits a member bank to classify as "savingsdeposits" funds of individuals and certain typesof corporations that are held by the bank, evi-denced only by a written receipt or agreement,provided "withdrawals are permitted only throughpayment to the depositor himself but not to anyother person whether or not acting for the de-positor." The purpose of this prohibition is toeliminate the so-called "agency privilege." Thereason for this is that withdrawal by an agent ofthe depositor merely by presenting a "writtenreceipt or agreement" for a specific amount de-posited with the bank could result in the use ofsuch deposits, in effect, as checking accounts.
For example, in lieu of taking one "receipt"for his deposit of, say, $100, the depositor couldrequest 20 receipts for $5 each. Then, when hewished to pay a bill, he could hand his creditorsufficient receipts and the latter, as his "agent,"could present them for payment. This procedureis possible with a savings deposit evidenced by apass book, but the cumbersome procedure ofturning the pass book over to a third party is adeterrent to the use of such savings accounts forchecking purposes. At least not more than oneso-called check could be outstanding against thesavings account at any time, because the depositorwould have to regain the pass book before turningit over to another person for a second withdrawalof funds.
With respect to the use of deposits not evi-denced by a pass book as collateral to a loaneither by the bank or by a third person, the abovequoted provision renders ineffective such use, sinceonly the depositor himself may receive payment.This likewise prevents the use of such deposits, ineffect, for checking purposes.
Order Under Section 3 of Bank HoldingCompany Act
The Board of Governors of the Federal ReserveSystem has issued the following Order and State-ment with respect to an application by a holding
company for approval of the acquisition of votingshares of a bank:
THE FIRST VIRGINIA CORPORATION
In the Matter of the Application of The FirstVirginia Corporation for prior approval of acquisi-tion of voting shares of Falls Church Bank, FallsChurch, Virginia.
ORDER APPROVING APPLICATION UNDERBANK HOLDING COMPANY ACT
There having come before the Board of Gov-ernors pursuant to Section 3(a)(2) of the BankHolding Company Act of 1956 (12 USC 1842)and Section 4(a)(2) of the Board's Regulation Y(12 CFR 222.4(a)(2)), an application on behalfof The First Virginia Corporation, Arlington, Vir-ginia, for the Board's prior approval of the acquisi-tion of 51 per cent or more of the voting shares ofFalls Church Bank, Falls Church, Virginia; aNotice of Receipt of Application having been pub-lished in the Federal Register on November 29,1960 (25 Federal Register 12209), which pro-vided interested persons an opportunity to submitcomments and views regarding the proposed ac-quisition; and the time for filing such commentsand views having expired and no such commentsor views having been filed;
IT IS HEREBY ORDERED, for the reasons set forthin the Board's Statement of this date, that the saidapplication be and hereby is granted, and theacquisition by The First Virginia Corporation of51 per cent or more of the voting shares of FallsChurch Bank, Falls Church, Virginia, is herebyapproved, provided that such acquisition is com-pleted within three months from the date hereof.
Dated at Washington, D. C , this 2nd day ofMarch, 1961.
By order of the Board of Governors.Voting for this action: Chairman Martin, and Gover-nors Balderston, Szymczak, Mills, Robertson, andShepardson. Present and not voting: Governor King.
(Signed) MERRITT SHERMAN,
Secretary.
288
Digitized for FRASER Federal Reserve Bank of St. Louis

LAW DEPARTMENT 289
STATEMENT
The First Virginia Corporation, Arlington, Vir-ginia ("First"), a registered bank holding com-pany, has applied pursuant to Section 3 (a) (2) ofthe Bank Holding Company Act of 1956 ("theAct"), for the Board's prior approval of the ac-quisition of 51 per cent or more of the capitalstock of Falls Church Bank, Falls Church, Vir-ginia ("Bank").
Views and recommendations of the Commis-sioner of Banking for the State of Virginia. Asrequired by Section 3(b) of the Act, the Boardforwarded notice of the application to the Com-missioner of Banking for the State of Virginia,who stated that he had no objection to approval.
Statutory factors. Section 3(c) of the Actrequires the Board to take into consideration thefollowing five factors: (1) the financial historyand condition of the holding company and bankconcerned; (2) their prospects; (3) the characterof their management; (4) the convenience, needs,and welfare of the communities and the area con-cerned; and (5) whether or not the effect of theacquisition would be to expand the size or extentof the bank holding company system involvedbeyond limits consistent with adequate and soundbanking, the public interest, and the preservationof competition in the field of banking.
Discussion. First presently controls four banksin the counties of Arlington, Fairfax, Prince Wil-liam, and Loudoun, with a total of eight officesand aggregate deposits of about $60,580,000 asof October 3, 1960. Its largest subsidiary bankis Old Dominion Bank, Arlington, with four officesand total deposits of about $44,650,000. Thebank to be acquired has three offices with totaldeposits of about $19,000,000. Its main officeand one branch are located in the independentCity of Falls Church, which lies between Arlingtonand Fairfax counties; all of these areas are in theWashington, D. C, Metropolitan Area. The otherbranch is nearby in Arlington County. FallsChurch, with a population of over 10,000, occu-pies an area of approximately two square miles.Arlington and Fairfax counties together have apopulation of over 420,000 within an area ofabout 430 square miles.
The financial history and condition, prospects,and management of both First and Bank are pres-ently satisfactory and would be expected to con-
tinue so. There is evidence that the acquisitionwould enable First to assure effective managementsuccession in Bank and there is some possibilitythat the acquisition would increase the availabilityof new capital to support expansion of banking ac-tivities in connection with growth in the area. How-ever, these considerations alone do not providecompelling reasons for approval of the application.
It appears that the provision of full bankingservices at Bank's two branches, as proposed byFirst, would benefit the areas served by them.However, consideration of all aspects of the con-venience, needs, and welfare of the areas con-cerned discloses no substantial support for ap-proval on this ground, because it is probable thatBank would continue to serve its community andarea adequately even if not owned by First. Onthe other hand, consideration of this factor dis-closes nothing inconsistent with approval.
At present, First controls nearly 17 per cent ofthe commercial banking offices and 23.5 per centof total deposits of individuals, partnerships, andcorporations ("IPC deposits") of banks in FallsChurch and the 4 counties in which First's banksoperate. The proposed acquisition would causeit to control in those counties and the City ofFalls Church 23 per cent of banking offices and30 per cent of IPC deposits. For the more im-mediately affected areas of Arlington and Fairfaxcounties and the City of Falls Church, the effectof the acquisition would be to increase First'spercentage of banking offices from about 16 percent to about 26 per cent and its percentage ofIPC deposits from about 25 per cent to about33 per cent.
Bank's primary service area consists of the Cityof Falls Church and portions of Arlington andFairfax counties. In that area are four otherbanking offices, none of which is controlled byFirst. However, one of First's banks has beenauthorized to establish a branch in Bank's primaryservice area. There are 16 banking offices (3 ofwhich are in First's system) within a radius of 4miles of Bank's offices.
After the acquisition there would remain inArlington and Fairfax counties 23 banking officesnot controlled by First. Bank's primary servicearea does not now overlap that of any of First'ssubsidiaries. Only two of First's subsidiaries(those in Arlington and Fairfax counties) drawIPC deposits of any significance from Bank's
Digitized for FRASER Federal Reserve Bank of St. Louis
290 FEDERAL RESERVE BULLETIN • MARCH 1961
primary service area; at September 30, 1960, theamount in each case was less than 5 per cent ofthe subsidiary's total IPC deposits, and the aggre-gate was an amount equal to approximately 15per cent of Bank's IPC deposits. Nearly three percent of Bank's IPC deposits originated from theprimary service areas of the two subsidiaries, andthis amount equaled about one per cent of theaggregate IPC deposits of the two subsidiaries.
Accordingly, it appears that the acquisitionwould result in the elimination of some competi-tion. However, the provision of full bankingservices at Bank's two branches would enhancebanking competition in the area to some extentand, in the Board's opinion, the acquisition wouldnot have a materially adverse effect on the com-petitive position of other banks in the area con-cerned; nor would the control of Bank by Firstdeprive the public of adequate alternative sourcesof banking service.
Consideration of the facts in this case does notindicate that the proposed acquisition would ex-pand the size of the First system or the resourceswithin its control beyond limits consistent withadequate and sound banking, the public interest,and the preservation of competition in the fieldof banking.
It is the judgment of the Board, based on therelevant facts considered in the light of the gen-eral purposes of the Act and the factors enumer-ated in Section 3(c) thereof, that the proposedacquisition would be consistent with the statutoryobjectives and the public interest, and that theapplication should be approved.
Order Under Section 4(c)(6)of Bank Holding Company Act
The Board of Governors of the Federal ReserveSystem has issued an Order approving a requestby a bank holding company for a determinationunder Section 4(c) (6) of the Bank Holding Com-pany Act of 1956 that a subsidiary corporation isexempt from the prohibitions of Section 4 of theAct. The Board's Order and accompanying State-ment, together with the Report and RecommendedDecision of the Hearing Examiner, read as follows:
ST. JOSEPH AGENCY, INC.In the Matter of the Request of St. Joseph Agency,Inc. for determination under Section 4(c)(6) ofthe Bank Holding Company Act of 1956, in re-
gard to the proposed interest in St. Joseph Insur-ance Agency, Inc. Docket No. BHC-57.
ORDER
The St. Joseph Agency, Inc., South Bend, Indi-ana, a bank holding company within the meaningof Section 2(a) of the Bank Holding CompanyAct of 1956 (12 USC § 1841), has filed a requestfor a determination by the Board of Governors ofthe Federal Reserve System that a corporationwhich has been formed, St. Joseph InsuranceAgency, Inc., also of South Bend, Indiana, andits prospective activities, are of the kind describedin Section 4(c)(6) of the Act and Section222.5(b) of the Board's Regulation Y (12 CFR222.5(b)), so as to make it unnecessary for theprohibitions of Section 4 of the Act with respectto acquisition and retention of shares in nonbank-ing organizations to apply in order to carry outthe purposes of the Act.
A hearing having been held pursuant to Section4(c)(6) of the Act and in accordance with Sec-tions 222.5(b) and 222.7(a) of the Board's Regu-lation Y; a brief in support of its request havingbeen filed by St. Joseph Agency, Inc.; the HearingExaminer having filed on January 19, 1961, hisReport and Recommended Decision wherein herecommended that the request with respect to St.Joseph Insurance Agency, Inc., be approved; thetime for filing with the Board exceptions and briefto the recommended decision of the Hearing Ex-aminer having expired and no exceptions havingbeen filed; the Board having given due considera-tion to all relevant aspects of the matter; and allsuch steps having been taken in accordance withthe Board's Rules of Practice for Formal Hear-ings (12 CFR 263):
IT IS HEREBY ORDERED, for the reasons set forthin the accompanying Statement of the Board ofthis date, that St. Joseph Insurance Agency, Inc.,and its proposed activities are determined to beso closely related to the business of banking or ofmanaging or controlling banks as to be a properincident thereto and as to make it unnecessary forthe prohibitions of Section 4 of the Bank HoldingCompany Act of 1956 to apply in order to carryout the purposes of that Act, and, therefore, Ap-plicant's request with respect to St. Joseph Insur-ance Agency, Inc., shall be, and hereby is, grantedprovided that St. Joseph Insurance Agency, Inc.,shall engage only in the general insurance businessand in no other activity or activities; and provided
Digitized for FRASER Federal Reserve Bank of St. Louis

LAW DEPARTMENT 291
further that this determination shall be subject torevocation by the Board if the facts upon whichit is based should substantially change in such amanner as to make the reasons for such deter-mination no longer applicable.
Dated at Washington, D. C, this 9th day ofMarch, 1961.
By order of the Board of Governors.
Voting for this action: Governors Balderston, Szym-czak, Robertson, Shepardson, and King. Absent:Chairman Martin and Governor Mills.
(Signed) MERRITT SHERMAN,Secretary.
[SEAL]
STATEMENT
Background of the case. Under date of Sep-tember 30, 1960, the St. Joseph Agency, Inc.(hereafter sometimes called the "Applicant"), anIndiana corporation with its principal office andplace of business in South Bend, Indiana, and abank holding company as defined in Section 2(a)of the Bank Holding Company Act of 1956 (the"Act"), filed with the Board of Governors of theFederal Reserve System (the "Board") a requestfor a determination that the acquisition and re-tention of all of the shares of stock in a nonbank-ing subsidiary, the St. Joseph Insurance Agency,Inc. ("Insurance Agency"), and the proposed ac-tivities of that subsidiary, will be of such a natureas to be exempt from the prohibitions of Section4(a) of the Act.
Section 4(a) of the Act makes it unlawful,subject to certain exceptions, for a bank holdingcompany (1) to acquire direct or indirect owner-ship or control of voting shares of any companythat is not a bank, or (2) to retain direct or indi-rect ownership or control of voting shares of anysuch company after two years from date of enact-ment (May 9, 1956) of the Act. Insurance Agencyis a nonbanking company incorporated under thelaws of the State of Indiana on May 16, 1960, allof the stock of which Applicant proposes to ac-quire and retain.
The Applicant's proposed acquisition of stockof Insurance Agency escapes the prohibitions ofthe Act only if it falls within one of the exceptionsprovided by the Act. Section 4(c) (6) of the Actexcepts shares of a nonbanking company if tworequirements are met: (1) if all the activities ofthe company are of a financial, fiduciary, or in-
surance nature, and (2) if the Board determineson the basis of the record made at a hearing, thatall the activities of the company are so closelyrelated to the business of banking or of managingor controlling banks as to be a proper incidentthereto and as to make it unnecessary for theprohibitions of Section 4 to apply in order tocarry out the purposes of the Act.1 Section222.5(b) of the Board's Regulation Y, issued pur-suant to the Act, paraphrases the provisions of theAct, but requires that the activities of a companymust be closely related to the business of bankingor of managing or controlling banks "as conductedby such bank holding company or its bankingsubsidiaries."
As required by the Act a hearing on the Appli-cant's request was held at Chicago, Illinois, on No-vember 21, 1960, before a duly designated Hear-ing Examiner. Following the conclusion of thehearing, Applicant submitted proposed findings offact and conclusions of law. On January 19,1961, the Hearing Examiner filed with the Boardhis Report and Recommended Decision whereinhe recommended approval of the Applicant's re-quest.
The salient facts with respect to the insurancebusiness to be carried on by Insurance Agency areset forth hereafter in this Statement. Additionalfacts with respect to its activities are contained inthe Hearing Examiner's Report and RecommendedDecision attached hereto; and to the extent notinconsistent with this Statement, the findings offact made by the Hearing Examiner are herebyadopted.
In determining whether or not the pending re-quest should be granted, the Board has consideredsolely the facts embraced in the record of thehearing held in this matter. In addition, how-ever, the Board has considered arguments pre-
1 The relevant language of the Act is as follows:"Sec. 4(a) Except as otherwise provided in this Act, no bank
holding company shall—"(1) after the date of enactment of this Act acquire direct
or indirect ownership or control of any voting shares of anycompany which is not a bank, or
"(2) after two years from the date of enactment of this Act. . . retain direct or indirect ownership or conrol of any votingshares of any company which is not a bank or a bank holdingcompany. . . .
* * * • *"(c) The prohibitions of this section shall not apply—
* * * * *"(6) to shares of any company all the activities of which
are of a financial, fiduciary, or insurance nature and which theBoard after due notice and hearing, by order has determined tobe so closely related to the business of banking or of managingor controlling banks as to be a proper incident thereto and asto make it unnecessary for the prohibitions of this section toapply in order to carry out the purposes of this Act. . . ."
Digitized for FRASER Federal Reserve Bank of St. Louis

292 FEDERAL RESERVE BULLETIN • MARCH 1961
sented in the Applicant's proposed findings of factand conclusions of law, and the Hearing Exam-iner's Report and Recommended Decision. TheBoard's findings and conclusions are hereafter setforth.
Factual summary. St. Joseph Bank and TrustCompany ("Bank") is a State bank whose princi-pal office is located in South Bend, Indiana. Bankhas two branches, one north of the city of SouthBend, in the village of Roseland, and the other inthe southeastern part of the city, on Miami Street.Bank is third in size of five commercial banks inSouth Bend, a city whose population is approxi-mately 130,000.
Applicant's history can be traced to an insurancedepartment operated in connection with a prede-cessor of Bank, St. Joseph Loan and Trust Com-pany. The insurance department was incorpo-rated in 1935 and it is this corporation which isthe Applicant in the present proceedings. Appli-cant now owns 4,110-7/8 shares of the outstand-ing 25,000 shares of Bank, which was organizedin 1939. Applicant also owns a majority of the1,750 outstanding shares in the Hamlet State Bankof Hamlet, Indiana, and of the 2,500 outstandingshares of stock in Central State Bank of Lakeville,Lakeville, Indiana. All 25,000 shares of Appli-cant's stock are held in trust by Bank as Trusteefor its own shareholders, under a trust agreementdated January 21, 1944. Each share of stock inBank is endorsed to show that the share carriesa beneficial interest in the trust which holds thestock of Applicant. Accordingly, both Bank andApplicant are bank holding companies.
The Hearing Examiner states that:"The Applicant . . . engages in the business of sell-
ing all forms of casualty, fidelity, and liability insur-ance to the general public, but primarily to customersof the banks it is associated with and principally inconnection with bank loans. It does not sell life in-surance as such, but does sell what is known as creditlife insurance. . . ."
Applicant estimated that approximately 80 percent of the total premium volume on insurancewritten by it comes from customers of the asso-ciated banks and that the remainder comes fromsuch sources as former bank customers, or casualcustomers who walk in off the street. The Appli-cant does not solicit insurance business from thegeneral public. The estimated proportions aresupported by analysis of 28 accounts of the largestdepositors and best customers of Bank, which
shows that in 1958 these accounts produced 41per cent of the total net premiums of Applicant,and that in 1959 they produced 43 per cent ofthe same total. Similarly, it is estimated that 40to 50 per cent of the insurance required in con-nection with loans made by the instalment creditdepartments operated by Bank and by the CentralState Bank of Lakeville is supplied by Applicant.Applicant surveys all the insurance needs con-nected with loans by these departments and makesrecommendations based on the surveys. Appli-cant makes similar surveys in connection withmortgage loans by these two banks, and counselsall three of the banks generally in connection withtheir insurance needs. The banks do not requirethat insurance be purchased from Applicant inconnection with loans, and the Hearing Examinerfound that "many of the services of the Applicantare performed without the direct knowledge of thebank customers involved." These services appearto be rendered without charge. Applicant alsofurnishes the insurance on the property of thethree related banks and all their other direct needsfor insurance.
Operation of Applicant is closely connectedwith that of Bank. Applicant's office is locatedon the premises of Bank, the two companies shar-ing a common lobby and a common entrance.Applicant pays rent to Bank for the use of theoffice. The employees of Applicant are coveredby Bank's hospital, medical, and pension plans.Bank and Applicant have identical Boards of Di-rectors, and all officers of Applicant have an offi-cial connection with Bank. Some officers anddirectors of Applicant also interlock with someofficers and directors of the two other relatedbanks. While Applicant's employees are not alsoemployees of Bank, Bank's auditors handle theauditing of Applicant, and the general managerof Applicant is a member of the managementcommittee of Bank.
In the past, Applicant has engaged in certainactivities in addition to the writing of insurance.As found by the Hearing Examiner, these activitiesincluded "buying and selling real estate, and deal-ing in stocks and bonds" as well as making "loansof money to persons who could not qualify forbank loans," most of these loans having beenmade to employees of Bank. However, it appearsfrom the record that these other activities havesubstantially ceased, and Applicant indicates that
Digitized for FRASER Federal Reserve Bank of St. Louis

LAW DEPARTMENT 293
only the insurance activities will be transferred toInsurance Agency.
While no evidence was introduced at the hearingtending to show how prevalent is the practice inthe area of operating insurance agencies in con-nection with banks, the Hearing Examiner foundthat
"The Indiana laws do not prohibit the operation of aninsurance department by banks, and the evidenceshows that banks in the City of South Bend, otherthan those connected with the Applicant, have relatedinsurance businesses.
:': * *"This practice has continued in South Bend, In-
diana, without objection from the banking authoritiesfor some twenty-five years."
Preliminary requirement as to nature of activi-ties. Assuming that Insurance Agency will con-fine itself to selling insurance and counseling therelated banks on insurance matters, it appears thatthe preliminary requirement for exemption underSection 4(c)(6) of the Act will be met—that allthe activities of the company involved will be ofan insurance nature.
Relation to banking business. In addition tothe required finding discussed above, as to thenature of the company's existing or proposed busi-ness, the statute and the Board's Regulation Yalso require that the company's activities must bedetermined by the Board to be so "closely related"to the business of banking or of managing or con-trolling banks, as conducted by the Applicant orits banking subsidiaries, as to be a "proper inci-dent" to such business and as to make it unneces-sary for the prohibitions of Section 4 of the Actto apply in order to carry out the purposes ofthe Act. This determination is to be made onthe basis of all the relevant facts and circumstancesdisclosed at a hearing held in the case.
The weight which the Board believes should begiven various factors and circumstances was dis-cussed at length in its Statement in the First BankStock Corporation matter, 1959 Federal ReserveBULLETIN 917, 930-933. Applying the reasoningtherein set forth to the present case, it is theBoard's judgment that the direct connection whichthe record reflects between the proposed activitiesof Insurance Agency and the three related banks,when considered in the light of the physical, per-sonnel, and historical connection between thebanks and Applicant, is sufficiently established soas to satisfy the statute's requirement as to close
relationship. Insofar as Applicant's insurance ac-tivities are related to the business of banking asconducted by Applicant's banking subsidiaries,Hamlet State Bank and Central State Bank ofLakeville, that relationship would appear to meetthe requirements of Section 221.5(b) of Regula-tion Y. While this portion of Applicant's insur-ance activities, taken alone, might not constituteenough of the whole to justify a favorable deter-mination, it is believed that in view of the purposeof the regulation and of the statute, the relation-ship between insurance activities of Applicant andthe banking business of Bank, the parent holdingcompany, may also be taken into considerationand that the total relationship substantially sup-ports a favorable determination.
Closeness and propriety of relationship. On thebasis of the record and particularly the facts here-tofore stated, it is the Board's view that the activi-ties of Insurance Agency will bear a direct andsubstantial relationship to the business of the threebanks which are related to Applicant. For thereasons set forth in the Board's Statement in theFirst Bank Stock Corporation matter, cited above,and incorporated herein, the Board believes thatthe relation of Insurance Agency's activities to thebusiness of Bank, the parent holding company,and of Hamlet State Bank and Central State Bankof Lakeville, Applicant's subsidiaries, will not beinconsistent with the purposes of the Act.
Conclusion. After considering historical, physi-cal, and personnel relationships between Applicantand Bank and Applicant's other two banking sub-sidiaries; the extent of direct connection betweenthe proposed activities of Insurance Agency andthe activities of those three related banks; thedegree to which common customers will be en-joyed by both; the fact that banks are permittedby Indiana law to conduct an insurance business,and that bank-related insurance agencies haveexisted in the South Bend area for more thantwenty-five years without objection from Statebank supervisory authorities; the Board concludesthat the activities of Insurance Agency will be soclosely related to the business of banking as con-ducted by St. Joseph Bank and Trust Company,Hamlet State Bank, and Central State Bank ofLakeville as to be a proper incident thereto andas to make it unnecessary for the prohibitions ofSection 4 of the Act to apply in order to carryout the purposes of the Act.
Digitized for FRASER Federal Reserve Bank of St. Louis

294 FEDERAL RESERVE BULLETIN • MARCH 1961
The other activities of Applicant present a dif-ferent question. The Board has held in Applica-tion of Otto Bremer Company, 1959 Federal Re-serve BULLETIN 892, 894-896, 898-901, that themaking of loans under circumstances similar tothose described in this record, and the buying andselling of real estate, are not sufficiently "closelyrelated" to the business of banking so as to bequalified for exemption from divestiture, and fur-ther, that the nature of these activities precludesa finding that they are a "proper incident" to thatbusiness. The present record presents no factswarranting a different holding here.
Accordingly, it is the Board's judgment that therequested exemption with respect to the St. JosephInsurance Agency, Inc., should be granted on thecondition that it engage only in insurance activi-ties of the kind carried on by Applicant, as de-scribed above; and IT IS SO ORDERED.
As indicated in the Board's Order, its approvalof this request is based solely on the facts disclosedby the record; and if the facts should substantiallychange in the future in such manner as to makethe reasons for the Board's conclusion no longerapplicable, the statutory exemption resulting fromthe Board's present determination would, ofcourse, cease to obtain.
REPORT AND RECOMMENDED DECISION
STATEMENT OF THE CASE
Under date of September 30, 1960, St. JosephAgency, Inc., herein Applicant, filed with the Board ofGovernors of the Federal Reserve System, hereinBoard, application requesting determination of theBoard, pursuant to Section 4(c)(6) of the Bank Hold-ing Company Act of 1956 (70 Stat. 133), herein theAct, that shares of stock which the Applicant proposesto acquire in a certain nonbanking company incor-porated under the laws of the State of Indiana, knownas St. Joseph Insurance Agency, Inc., of South Bend,Indiana, are exempt from the prohibitions of Sections4(a) ( l ) and 4(a)(2) of the Act.
On November 2, 1960, notice of request for deter-mination pursuant to Section 4(c)(6) and an orderfor a hearing thereon was entered, the same beingpublished in 25 Federal Register 10714, November 9,1960. In accordance therewith, a hearing was held inChicago, Illinois, on November 21, 1960, before theundersigned Hearing Examiner who was duly desig-nated and assigned to hear such. The Applicant andthe Board, the latter in a nonadversary capacity, wererepresented at the hearing by counsel and were af-forded full opportunity to be heard—to examinewitnesses and to introduce exhibits into the record.
On December 22, 1960, an Order was entered clos-ing the hearing, and counsel were allowed 15 daysthereafter to file proposed findings of fact, conclusions
of law, and briefs. Counsel for the Board, havingappeared in a nonadversary capacity, neither favoringnor opposing the application, but assisting merely inthe development of pertinent information whether thesame tended to support or oppose the application,made no such filing; however, counsel for the Appli-cant, within the time allowed, submitted proposedfindings of fact and conclusions of law. The Appli-cant filed no brief within the time allowed for such,but thereafter, by special permission of the Board, abrief of the Applicant was received. To the extentconsistent with the findings of fact and conclusionsof law made below, the same are accepted.
Upon the entire record in the proceeding, givingconsideration to the contentions of all parties of rec-ord, and those of their counsel, and from my ownobservations of the witnesses, the oral testimony, andthe exhibits, I make the following
FINDINGS OF FACT
I. Introduction
1. The particular sections of the Act pertinentherein are as follows:
"Sec. 4. (a) Except as otherwise provided in thisAct, no bank holding company shall—
" (1) after the date of enactment of this Act acquiredirect or indirect ownership or control of any votingshares of any company which is not a bank, or
"(2) . . . retain direct or indirect ownership orcontrol of any voting shares of any company whichis not a bank or a bank holding company or engagein any business other than that of banking or of man-aging or controlling banks or of furnishing servicesto or performing services for any bank of which itowns or controls 25 per centum or more of the votingshares.
* * *"(c) The prohibitions in this section shall not ap-
ply—* * *
"(6) to shares of any company all the activities ofwhich are of a financial, fiduciary, or insurancenature and which the Board after due notice and hear-ing, and on the basis of the record made at suchhearing, by Order has determined to be so closelyrelated to the business of banking or of managing orcontrolling banks as to be a proper incident theretoand as to make it unnecessary for the prohibitions ofthis section to apply in order to carry out the purposesof this Act;"
2. Acting under the provisions of Section 4(c)(6)of the Act, the Applicant has applied to the Boardseeking a determination that the insurance activitieswhich are now carried on by the Applicant, and thosesame activities when in the future are carried on bySt. Joseph Insurance Agency, Inc. as a subsidiarycorporation of the Applicant, are of a financial, fidu-ciary, or insurance nature and are so closely relatedto the business of banking or of managing or con-trolling banks as to be a proper incident thereto, andso as to make it unnecessary for the prohibitions ofSection 4 of the Act to apply in order to carry outthe purposes of the statute.
Digitized for FRASER Federal Reserve Bank of St. Louis

LAW DEPARTMENT 295
II. St. Joseph Agency, Inc.
1. The St. Joseph Agency, Inc., the Applicant, is anIndiana Corporation with its principal office locatedin the City of South Bend of that State. It is a bankholding company within the meaning of Section 2(a)of the Act and has duly registered with the Board assuch. It was organized in August of 1935 as a generalcasualty and fidelity insurance, and the backgroundof its founding and the manner in which it becamea bank holding company are explained as follows:
a. Prior to 1935, a banking institution in the Cityof South Bend, known as the St. Joseph Loan andTrust Company, had an insurance business as a de-partment of the bank. It became apparent that theinsurance department was creating problems withcertain customers and depositors of the bank whowere connected with other insurance concerns, andit was also realized that there were limitations on thedepartment as a part of the bank when it came towriting insurance on the bank's own property, andfor these reasons it was deemed advisable to form aseparate corporation to carry on the insurance busi-ness. The Applicant was then formed and the in-surance business was transferred to it, its stock beingheld in trust by various officers and directors of theSt. Joseph Loan and Trust Company for the stock-holders of said bank.
b. The St. Joseph Loan and Trust Company hadbeen closed during the bank holiday of 1933 but hadbeen allowed to reopen, on a limited basis underrules and regulations in effect at that time, until cer-tain Class A debentures to the Reconstruction FinanceCorporation and Class B debentures to its own de-positors were sold. In 1938, the Department of Fi-nancial Institutions for the State of Indiana com-pleted the liquidation of this bank, and that of anallied bank known as the St. Joseph County SavingsBank, and the acceptable assets of the two bankswere transferred to a new bank which had been or-ganized and began business during the year 1939, thesame becoming the St. Joseph Bank and Trust Com-pany. The liquidation and the changes in the banksdid not affect the operation of the insurance businessof the Applicant.
c. When the St. Joseph Bank and Trust Companywas organized, because of the difficulty in sellingsufficient stock to complete its organization amongthe depositors and shareholders of its predecessorbanks, and since under its corporate powers the Appli-cant could acquire bank stock, its officers and direc-tors being likewise interested in the formation of thisnew bank, caused the Applicant to borrow moneythrough a Chicago bank and purchase 475 shares ofthe common capital stock, the number needed to com-plete the organization of the St. Joseph Bank andTrust Company. Since that time the Applicant haspurchased the stock of other shareholders who desiredto sell, and it now owns 4,110 Vs shares of the out-standing 25,000 shares.
d. In 1949 and 1950, the Applicant purchased thecontrolling interest in the Hamlet State Bank of Ham-let, Indiana. It has owned and controlled the majorityof such common capital stock since that date, andnow has 910 shares which is 52 per cent of the out-standing 1,750 shares.
e. Prior to 1956, there was a branch of the St.Joseph Bank and Trust Company located in the townof Lakeville, Indiana, approximately eight miles south
of the City of South Bend. Because said branch wascontrolled by the rules of the South Bend ClearingHouse of Banks, and its interest rates on savings andhours of business were not in keeping with the needsof the people of this rural community, and in orderto provide banking services more in keeping with suchneeds, the bank was closed and reestablished under aseparate corporation known as the Central State Bankof Lakeville. The Applicant acquired and now owns1,300 shares of the outstanding 2,500 shares of stockin this bank, this being 52 per cent thereof.
f. It was through the above set forth processes andprocedures that the Applicant became a bank holdingcompany.
2. In order for the Applicant to vote the shares ofstock it owns in the Hamlet State Bank and the Cen-tral State Bank of Lakeville, it must obtain a votingpermit each year from the Department of FinancialInstitutions for the State of Indiana.
3. The Applicant's common capital stock consistsof 25,000 shares with a par value of $5.00 per share,all of which are held in trust by the St. Joseph Bankand Trust Company, as Trustee for its own share-holders, pursuant to a trust agreement dated January21, 1944. Each share of stock of this bank bears thewording that it also carries a beneficial interest in thetrust holding the stock of the Applicant, and a saleof a share of bank stock automatically carries withit the beneficial interest in the trust. The shares ofbank stock and the beneficial interest in the trust arenot divisible and cannot be sold separately.
4. The Applicant's office is located on the premisesof the St. Joseph Bank and Trust Company, and infact the two companies share a common lobby anda common entrance, and the Applicant has alwaysoperated from the premises of such bank or its pre-decessor banks. The entrance to the Applicant's placeof business in the common lobby with the bank isdesignated by a sign "Insurance Department."
5. The Board of Directors of the St. Joseph Bankand Trust Company constitute the Board of Direc-tors of the Applicant, and all the officers of the Appli-cant, past and present, have had or now have someofficial connection with such bank. Likewise, thereis an interlocking of certain officers and directors ofboth the Applicant and said bank with the officersand directors of Hamlet State Bank and the CentralState Bank of Lakeville. The result is that all theseconcerns follow the same general direction andpolicies.
6. The employees of the Applicant are eligible forand are members of the St. Joseph Bank and TrustCompany employees' hospital, medical and pensionplan. The Applicant handles the collection of itsemployees' contributions to such, and also contributesits share of these costs to said bank.
7. Although the Applicant and the St. Joseph Bankand Trust Company occupy common quarters theydo not observe the same business hours, the Appli-cant being open on business weekdays until 5 p.m.,while the bank observes the banking hours in effectfor the City of South Bend. The Applicant has fiveemployees on its payroll which it maintains separateand apart from the bank, however, the bank's audi-tors do the auditing for the Applicant. The generalmanager of the Applicant is a member of the man-agement committee of the bank, and as such he meetsin a weekly conference with bank officers for discus-sion of management problems. The Applicant pays
Digitized for FRASER Federal Reserve Bank of St. Louis

296 FEDERAL RESERVE BULLETIN • MARCH 1961
rent to the St. Joseph Bank and Trust Company forthe space it occupies in the bank building, but makesno charges for the services it renders to such bankthe like of which as will hereinafter appear.
III. St. Joseph Bank and Trust Company
1. The St. Joseph Bank and Trust Company, here-inafter sometimes called the Bank, is a bank holdingcompany under the provisions of the Act, the reasonfor such being because it holds all of the stock ofthe Applicant in trust for its own shareholders. It isengaged in the general banking business, operates atrust department, and makes all types of bank loansincluding instalment loans. The Bank has some30,000 loan and deposit accounts at the present time,and had approximately $34,600,000 on deposit andapproximately $12,200,000 in loans as of December31, 1959.
2. The Bank has two branches; one north of theCity of South Bend in the Village of Roseland, andthe other in the southeastern part of the City onMiami Street. In addition to the Bank, there arethree other downtown banks in South Bend and onelocated in the outlying section of the City—the Bankis third in size of the five banks. The population ofSouth Bend is approximately 130,000.
3. When the Miami Street branch of the Bank wasestablished, the quarters for the same were obtainedunder lease from the Applicant, and when the samewere enlarged, in August of 1953, the Applicant fur-nished the funds for such. The reason for the Appli-cant providing such quarters and funds for theexpansion thereof was because the directors of theBank, being likewise directors of the Applicant, didnot think the Bank was in position to add to its fixedassets at that time. The same reasoning had occurredearlier, when in June 1953 the Bank had added toits main establishment by constructing a drive-infacility on property the Applicant leased from theowner.
4. The Bank receives all the dividends declared bythe Applicant and distributes the same to its ownshareholders, since it holds all stock of the Applicantin trust for its shareholders. This is helpful to theBank in promoting good relations with its stockholdersbecause some years the Bank has been unable to payother than a modest dividend, and by adding thedividends from the Applicant to such, the Bank'sstockholders have received a total return sufficient tokeep them happy.
IV. The Insurance Business of the Applicantand Its Services to Allied Banks
1. The Applicant, having general authorizationfrom the State of Indiana for such, engages in thebusiness of selling all forms of casualty, fidelity, andliability insurance to the general public, but primarilyto customers of the banks it is associated with andprincipally in connection with bank loans. It does notsell life insurance as such, but does sell what is knownas credit life insurance which insures the life of aborrower from one of the banks on a reducing termbasis where the remaining unpaid balance on a loanis insured during the existence of the loan in case ofthe borrower's death. In insurance parley this is notconsidered life insurance.
2. The Applicant through its employees, some ofwhom have become experts in the field of insurance,serves as an insurance counsellor to the Bank andits allied banks—the Hamlet State Bank, and theCentral State Bank of Lakeville. Such services havebecome so important to these banks that their officersconsider them on a par with services of their attorneyson legal matters. The Applicant has maintained sucha relationship with its related banks since they werefounded, and since it was founded to serve the needsof the predecessor bank, the now extinct St. JosephLoan and Trust Company.
3. The Applicant furnishes the insurance on theproperty of these related banks, and all their otherdirect needs for insurance such as Bankers' BlanketBonds and Liability Insurance policies. It also pro-vides insurance information, insurance surveys, andwrites insurance for customers of the three bankswhen needed in connection with bank loans.
4. Whether or not it writes the insurance, theApplicant surveys all the insurance needs in connec-tion with loans from the mortgage loan departmentsof the St. Joseph Bank and Trust Company, and theCentral State Bank of Lakeville. Its surveys are madeat the inception of the loans, and followed throughon renewals of the policies during the life of theloans. It also makes recommendations to the loancustomer for his individual protection.
5. The St. Joseph Bank and Trust Company, andthe Central State Bank of Lakeville operate instal-ment credit departments, and varied insurance re-quirements are needed in connection with loans fromsuch departments. The Applicant surveys all theseneeds, and makes recommendations with respectthereto. It writes the insurance in connection withfrom 40 to 50 per cent of these loans.
6. The Applicant consults with the officers andemployees of the trust department of the St. JosephBank and Trust Company in connection with theextent and coverage of insurance on all the trustand agency accounts therein. It surveys the insuranceneeds in connection with these accounts, and advisesthe department with respect thereto.
7. The Applicant makes no requirement that neededinsurance be purchased from it because of its servicesto the banks or their customers, neither do the banksrequire their depositors or loan customers to buyinsurance of the Applicant. Many of the services ofthe Applicant are performed without the direct knowl-edge of the bank customers involved.
8. An example of the Applicant's services to thebanks is that of its counseling with the instalmentcredit department on mobile home loans. Such loansusually will be for long terms, and the Bank is vitallyinterested in its complete insurance protection for theentire life of the loan, it also desires to have its cus-tomer fully protected, and for these reasons it seeksthe Applicant's advice on the form insurance policiesneeded, the proper coverage, the loss payable clauses,and term of duration of the policies. The services ofthe Applicant also come into play on the adjustmentsof such claims as may occur. No charge is madeto the Bank's customer for such service, and he isnot required to purchase his insurance from theApplicant.
9. Of the total premium volume on insurance writ-ten by the Applicant, approximately 80 per cent isderived from customers of its associated banks. The
Digitized for FRASER Federal Reserve Bank of St. Louis

LAW DEPARTMENT 297
remaining premium volume comes from such non-banking sources as policyholders who were formerbank customers, or just people who walk in from thestreets. The Applicant has no general outside sales-man, and it does not solicit insurance business fromthe general public by mail, advertising, or in anyother manner. When policies are about to expire,the Applicant sends a notice to the policyholdercalling the expiration date to his attention at leastthirty days in advance of the same. Regardless ofthis method of doing business, however, and to someextent the Applicant does solicit insurance businessfrom the customers of its allied banks. The extraservices it provides, and the efforts it makes to keepall those concerned abreast of their insurance needsis a form of a bid for business. The banks makepersonal solicitations for new accounts, and the Appli-cant's employees accompany bank employees onsuch calls to explain the insurance requirements andits services in regard thereto. These calls do resultin new business for the banks and the Applicant.When bank loans have been liquidated, often theinsurance on the property involved is left with theApplicant. The banks, however, never require theirloan customers to place the needed insurance withthe Applicant as a prerequisite to obtaining a loan.
10. No cross-reference record is made between theaccounts of the Applicant and those of its allied banks,and there is no way to ascertain how many of theApplicant's insurance customers are also customersof one of the banks, except by checking the recordsfor each separate account of the Applicant against therecords of all the accounts of the banks. The onlyevidence offered concerning such was the estimationsof certain witnesses. The Applicant has between2.500 and 3,000 insurance accounts, and a survey of28 of these was made for the years 1958 and 1959.These accounts are of some of the largest depositorsand best customers of the St. Joseph Bank and TrustCompany. It shows that
For 1958: Out of Applicant's total net premiumsamounting to $249,533.33, these 28 accounts produced41 per cent of the total, or $102,424.80.
For 1959: Out of Applicant's total net premiumsamounting to $251,420.12, these 28 accounts produced43 per cent of the total, or $108,434.94.
11. The Applicant is not a real estate broker, butit has purchased considerable real property, muchof which was to aid the banks in securing adequatespace. The Applicant is often a bidder on propertywhich the banks must foreclose because of default inthe payment of loans secured by the same.
12. Over the years, the Applicant has purchasedstock in the St. Joseph Bank and Trust Company, fromshareholders who desired to sell such, and in thismanner it has afforded a market for such stock. Attimes the Applicant has made loans of money to per-sons who could not qualify for bank loans—most ofthese incidents have been for employees of the Bank.
13. The officers and employees of the Applicantdevote the major portion of their time (estimated at95 per cent of such) in answering the requests of,and servicing the needed insurance policies of cus-tomers of its allied banks, including the furnishingof insurance information, insurance surveys, andwriting the policies.
V. St. Joseph Insurance Agency, Inc.
1. The St. Joseph Insurance Agency, Inc., some-times hereinafter referred to as the Agency, wasincorporated under the laws of the State of Indianaon May 16, 1960. Its principal office and place ofbusiness is located in the City of South Bend, Stateof Indiana.
2. The total authorized capital stock of the Agencyis divided into 12,500 shares without par value, butno certificates have yet been issued. If the Boarddetermines that the acquiring and holding of suchstock by the Applicant is exempt from the prohibitionsof Section 4 of the Act, under the provisions of Sec-tion 4(c)(6) of the Act, and as herein applied for,the Applicant proposes to acquire and hold all of suchshares and to transfer and convey all of its presentinsurance business, including the goodwill, accountsreceivable, assets and liabilities pertaining to such,to the Agency in exchange for said stock. The em-ployees of the Applicant who work in connection withits present insurance business will become employeesof the Agency, and the Agency will perform all theservices of an insurance nature, now being performedby the Applicant, to the same banks, the customersof these banks, and to the general public. Thereafterthe Applicant will cease to be in the insurance busi-ness, will have nothing to do with the same, and willbecome a bank holding company only.
3. The purposes for which the Agency is incor-porated, as contained in its Articles of Incorporationare:
"(a) To maintain and operate an agency for thepurpose of writing all forms of insurance, except lifeinsurance, including liability, casualty, credit life in-surance, and fidelity and surety bonds; to conductand carry on the business of writing as agent of allforms of insurance, except life insurance, includingliability, casualty, credit life insurance and fidelityand surety bonds; the owning, buying and selling ofbonds, stocks and real estate, the leasing of real estateand the performance of all matters incident thereto.
"(b) To acquire, hold or own real estate andequipment necessary to the successful accomplish-ment of the said business.
"(c) To buy, purchase or otherwise acquire andto hold, cancel, retire, reissue or otherwise dispose ofthe shares of the common capital stock, bonds, deben-tures, notes and other obligations of the corporationfrom time to time, to such extent, at such price, andin such manner and upon such terms as the Boardof Directors of this corporation shall from time totime determine.
"(d) To guarantee payment of promissory notes,bills of exchange or other evidences of indebtedness.
"(e) To carry on, engage in or conduct any busi-ness or businesses or do any act which a naturalperson or persons might do and which are necessary,convenient or expedient to accomplish the purposesfor which this corporation is formed and such as arenot repugnant to law."
4. The Agency does not propose to conduct anybusiness, or engage in activities except that pertainingto the conduct of a general insurance business.
5. It is legal under the laws of the State of Indianafor State banks to have an affiliated insurance busi-ness, and some banks in the City of South Bend,other than the banks involved herein, do have affiliatedagencies.
Digitized for FRASER Federal Reserve Bank of St. Louis

298 FEDERAL RESERVE BULLETIN • MARCH 1961
DISCUSSION OF THE CASE
The application under consideration herein is inthe nature of a request for determination by theBoard that the prohibitions of Section 4 of the Actshall not apply to the acquisition and retention, bythe Applicant, a bank holding company, of all thestock in a nonbanking corporation which has beenincorporated and authorized to begin business, butwhich has yet to be finally organized and imple-mented. The Applicant, in addition to being a bankholding company, is engaged in other activities whichare of a nonbanking nature, including that of a gen-eral insurance business. It proposes to transfer andconvey all of its insurance business to this newlycreated nonbanking corporation in exchange for thestock when, and if, the Board determines that theprohibitions of Section 4 of the Act do not applyagainst its acquiring or retaining such. Since thenonbanking concern has yet to function as an activebusiness, the subject of this inquiry is the activitiesit proposes to carry on, and these activities must bejudged by the way they have heretofore been carriedon in the hands of the Applicant, and as if they werepresently being carried on by St. Joseph InsuranceAgency, Inc. The Board has held that such con-sideration is appropriate, saying in First Bank StockCorporation, Federal Reserve BULLETIN, August 1959,at page 928—
"While the language of Section 4(c)(6) is couchedin the present tense, it does not, in the Board's opin-ion, preclude consideration of a request for exemptionwith respect to a corporation in which the Applicantproposes to acquire stock where, as here, the natureof the activities to be carried on by that corporationis susceptible of determination. . . . Accordingly, itis appropriate to consider the present request asthough all such activities were presently being car-ried on by Agencies, Inc. . . ."
The Applicant was originally founded for the pur-pose of taking over the insurance business of a bank.This bank was then in process of being liquidatedand after a few years its assets were transferred to anewly organized bank. Meanwhile, the Applicantseems to have prospered, and by reason of such wasable to borrow money and purchase a large numberof shares in the new bank. Later it was able to ac-quire the controlling interest in two other banks, andit became a bank holding company. Over the yearsthe Applicant has developed a large insurance busi-ness, and it has also engaged in other activities suchas buying and selling real estate, and dealing in stocksand bonds. The evidence does not fully disclose allof the activities the Applicant has engaged in, or howsuch activities, other than insurance, relate to thebanks it is associated with, but it is apparent that thesaid banks have used the Applicant for many andvaried purposes. On the basis of the record herein,some of the activities of the Applicant could not beheld to be so closely related to the business of bankingor of managing or controlling banks as to be a properincident thereto, but it does not propose to transferthese activities to the St. Joseph Insurance Agency,Inc., or rather the said Agency proposes only to carryon the activity of engaging in the general insurancebusiness free of all other activities.
The Board has made clear in a number of proceed-ings under Section 4(c) (6) of the Act that the primarypurpose of the Act is to remove sources of evil, and
particularly those that may be said to arise from, orbe accentuated by the operation of bank holding com-panies. The operation of an insurance business inclose relation with the banking business of an alliedbank, when the same has been found to be a properincident to banking, has been approved by the Boardas being properly exempt from the prohibitions ofSection 4 of the Act in many cases. So it is well-established that such is not evil, or a source of evil;but to deal in real estate and traffic in stocks andbonds might be, and the purposes for which the St.Joseph Insurance Agency, Inc., is incorporated arebroad enough to include such—in fact, broad enoughto include almost any activity. The proposal is, how-ever, to engage only in insurance activities on thesame basis as the Applicant conducted its insurancebusiness, and it is on such basis that this applicationis considered.
In order for the holding of stock in a nonbankingcorporation to be exempt from the prohibitions ofSection 4, under the provisions of Section 4(c)(6), apreliminary requirement is that all the activities mustbe of a financial, fiduciary, or insurance nature. Thewriting of all types of insurance and the servicing ofthe policies by keeping up with expiration dates, noti-fying policyholders concerning such, seeing that ade-quate coverage exists, and that proper loss payableclauses are attached, are all activities of an insurancenature. The insurance business of concern herein hasincluded all these activities, and the St. Joseph Insur-ance Agency, Inc., proposes to continue them. It alsoplans to furnish a counselling service on insurancematters to the banks with which it will be allied,similar to that which has been carried on by the Appli-cant. This service all deals with insurance mattersand insurance problems, and is considered as being ofgreat importance by the banks. They place its valueon a par with the services of attorneys on legal mat-ters. The insurance business has prospered in thehands of the Applicant; in 1959 its net premiumswere $251,420, and the inference is clear that thegood service it has rendered the banks, and its cus-tomers, plays no small part in its success. There isevery reason to believe this good service will continuewhen the St. Joseph Insurance Agency takes over thebusiness, and that it too will prosper. These are theonly activities the Agency will engage in, and sincethey all are of an insurance nature, the preliminaryrequirement for exemption under Section 4(c)(6) ofthe Act is satisfied. In Re Otto Bremer Company,Federal Reserve BULLETIN, August 1959, at page 896.
The preliminary requirement having been met, itmust now be determined if the insurance activitiesare so closely related to the business of banking orof managing and controlling the involved banks asto be a proper incident thereto, and so as to make itunnecessary for the prohibitions of Section 4 of theAct to apply in order to carry out the purposes of theAct. This determination must be made on the factsof the case, and there is no fixed standard for makingsuch as each case must be judged on its own merits.In discussing the method of making this determinationthe Board stated in First Bank Stock Corporation,supra, at page 930:
"The law prescribes no specific standards to guidethe Board in making such determinations; it does not,for example, require that a majority or even a sub-stantial part of the business of the company involvedbe directly connected with transactions of subsidiarybanks. In effect, it leaves the determination to be
Digitized for FRASER Federal Reserve Bank of St. Louis

LAW DEPARTMENT 299
made by the Board on the basis of the record of thehearing held in each case. As stated by the SenateBanking and Currency Committee's Report on theHolding Company Act, it was deemed advisable 'toprovide a forum before an appropriate Federal au-thority in which decisions concerning the relationshipor such activities to banking can be determined ineach cast on its merits'."
In the case just referred to above, the Board recog-nizes its responsibility to "consider all of the relevantfacts and circumstances," and it points out that bothFederal and State laws "implicitly recognize that in-surance has some general relation to the business ofbanking." The Indiana laws do not prohibit the oper-ation of an insurance department by banks, and theevidence shows that banks in the City of South Bend,other than those connected with the Applicant, haverelated insurance businesses.
There is no question as to the need of insurance inconnection with bank loans, trust agreements, andmany other banking services offered by banks. Allbanks need good insurance services readily availableto them and their customers, but it is common knowl-edge that almost any community has insurance agen-cies which offer all types of insurance and will performall of the services necessary and incidental thereto.So it cannot be said that having an insurance agencyconnected with a bank is a matter of necessity, andmany banks survive without such. On the other hand,an insurance agency connected with a bank can be aproper incident thereto if it is closely related to thebusiness of banking. In this case the insurance agencyis very closely related to the banking carried on. Itsservices are used in every transaction calling for in-surance whether it writes the policy or not, and infact the insurance services of this Agency properlyand naturally appertain to the banking done at itsallied banks, a test which the Board has applied whendealing with this question.
The Board has dealt with many cases involving in-surance activities, and examination of these casesbrings to light some of the important factors that theBoard has relied upon to determine whether or notthe prohibitions of Section 4 should apply. The fol-lowing questions are based upon the Board's actionsin a number of such cases, and are answered in ac-cordance with the evidence herein:
(1) Is it the general practice in the area for suchbanks to have a related insurance agency?
The evidence herein is not specific on this question.Nothing is shown concerning the insurance activitiesof the banks generally in the State of Indiana, or inany particular area of said State; however, the evi-dence does show that in the City of South Bend somebanks, other than those involved herein, have relatedinsurance businesses.
(2) Has the practice been in existence for sometime?
As for the Applicant, it has existed since 1935. Forthe banks involved, it has existed since their forma-tion, and there is evidence that it existed with theirpredecessor banks for a long while prior thereto.There is no evidence as to how long it may haveexisted with other South Bend banks.
(3) What is the physical relationship of the insur-ance agency to the Bank; that is, does it operate outof banking quarters?
This Agency is located just off the main lobby ofthe principal bank involved, and operates out of thebanking quarters.
(4) Do Bank employees also operate the insuranceagency?
The answer to this question is "no" from the stand-point of employees. The insurance business is toobig for Bank employees to carry on its operation ona part-time basis. It has its own independent staff.Its officers and directors, however, are all connectedwith the involved banks, and its general-manager is amember of the banks' policy committee. The businessof the insurance company is so related to the involvedbanks that there is almost constant consultation be-tween the two.
(5) Is the operation of the insurance agency inti-mately related to the operation of the Bank?
The evidence herein shows such to be the case.Each department of the banks relies upon the Agencyfor insurance information, advice, insurance surveys,and for other related insurance services. The banksconsider these services as important as the legal serv-ices of their attorneys.
(6) Is a substantial part of the business of theAgency done with Bank customers?
The evidence shows approximately 80 percent ofthe insurance policyholders are Bank customers. In1959, twenty-eight Bank customers furnished 43 percent of the volume of the net premiums.
(7) Is the maintenance of the Agency deemed ofbenefit to the Bank's operation?
The evidence shows it to be of great benefit andimportance.
(8) Are the Bank's customers required to obtaintheir insurance needs through the Agency, or do theydo so voluntarily?
There is no requirement that Bank customers pur-chase insurance from the Agency, and the evidenceis that the Agency counsels the banks on insurancematters in connection with Bank transactions whetherthe insurance is purchased from the Agency or not.
(9) Have the banking authorities in the area per-mitted the practice to continue without objection?
This practice has continued in South Bend, Indiana,without objection from the banking authorities forsome twenty-five years.
(10) Is the relationship between insurance agenciesand banks peculiar to banks in holding companygroups in the area, or is it prevalent also among non-holding company banks in the area?
The evidence herein does not deal with this ques-tion.
As indicated from the above, the answers to theabove questions are favorable to the application inthe majority of instances, but some of the questionscannot be answered satisfactorily. In other casesbefore the Board, it did not always find that everyone of these questions could be answered favorablyin a given case, yet where most of the questions couldbe answered favorably, it has found the prohibitionsof Section 4 of the Act did not apply. On this basis,the case at hand should be considered as meeting therequirement for exemption from such prohibitions.
Careful consideration of all the facts and circum-stances in this proceeding, in the light of the rulingof the Board in other cases of a similar nature, leadsto the conclusion that the insurance activities nowcarried on by the Applicant and contemplated to be
Digitized for FRASER Federal Reserve Bank of St. Louis

300 FEDERAL RESERVE BULLETIN • MARCH 1961
carried on by the St. Joseph Insurance Agency, Inc.,are of an insurance nature, and are so closely relatedto the business of banking, and managing and con-trolling the involved banks, as to be a proper incidentthereto, such as to make it unnecessary for the pro-hibitions of Section 4 of the Act to apply in orderto carry out the purposes of the Act.
Accordingly, upon the foregoing findings of factand in keeping with my opinion as expressed in theforegoing discussion of the case, I arrive at the follow-ing:
CONCLUSIONS OF LAW
The insurance activities for consideration herein1. Are all of an insurance nature;2. So closely related to the banking business of the
St. Joseph Bank and Trust Company, the Central StateBank of Lakeville, and the Hamlet State Bank, andthe managing and controlling of these banks, as to bea proper incident thereto;
3. It is unnecessary for the prohibitions of Section4 of the Act to apply in order to carry out the pur-poses of the Act; and
4. The application herein should be granted.
I therefore make the following
RECOMMENDATIONS
That the Board of Governors of the Federal Re-serve System—
1. Enter an order determining the issues in thisproceeding in accordance with the findings of factand conclusions of law made above.
2. Grant the application of the Applicant, St.Joseph Agency, Inc., and determine that shares ofstock to be issued to it in a corporation known asSt. Joseph Insurance Agency, Inc. are exempt fromthe prohibitions of Section 4 of the Bank HoldingCompany Act of 1956; but, provided that this de-termination be subject to revocation by the Board ifthe facts upon which it is made should substantiallychange so as to make the same no longer applicable.
Dated at Washington, D. C , this 19th day of Jan-uary, 1961.
(Signed) EDWARD H. MCMAHAN,
Hearing Examiner,
Digitized for FRASER Federal Reserve Bank of St. Louis

Current Events and Announcements
APPOINTMENTS OF PRESIDENTS AND FIRST VICE PRESIDENTS
The Board of Governors has approved appointment of the following Presidents and First VicePresidents at the Federal Reserve Banks for the five-year terms beginning March 1, 1961. Names inCAPITALS indicate new appointments; all other are reappointments. Brief biographical data on newappointees follow the list of appointments.
BankBostonNew YorkPhiladelphiaClevelandRichmondAtlantaChicagoSt. LouisMinneapolisKansas CityDallasSan Francisco
Federal Reserve Bank of Boston
PresidentGEORGE H. ELLISAlfred HayesKarl R. BoppW. D. FultonEDWARD A. WAYNEMalcolm BryanCarl E. AllenDelos C. JohnsFrederick L. DemingGEORGE H. CLAYWatrous H. IronsELIOT J. SWAN
First Vice PresidentE. O. LathamWilliam F. TreiberRobert N. HilkertDonald S. ThompsonAUBREY N. HEFLINHarold T. PattersonC. J. ScanlonDarryl R. FrancisA. W. MillsHenry O. KoppangHarry A. ShufordH. E. HEMMINGS
GEORGE H. ELLIS graduated from the Uni-versity of Maine and holds M.A. and Ph.D. de-grees from Harvard University. During 1949-51,he was Assistant Professor of Economics and Busi-ness Administration at the University of Maine.Mr. Ellis entered the employ of the Boston Re-serve Bank in 1951, and has been Vice Presidentand Director of Research since 1957.
Federal Reserve Bank of Richmond
EDWARD A. WAYNE began his banking ca-reer in 1918 in Columbia, South Carolina. Hewas Chief Examiner for the South Carolina Boardof Bank Control from 1936 to 1940, and becameExecutive Secretary of the North Carolina StateBankers' Association in 1940. In 1943, Mr.Wayne joined the Reserve Bank as Vice Presidentin charge of the Bank Examination Departmentand was later assigned to the Bank Relations andPublic Information Department. He was namedFirst Vice President in 1953.
AUBREY N. HEFLIN is a graduate of theUniversity of Richmond and the Law School of
the University of Virginia. He has been a memberof the Bank's legal staff since 1941, and VicePresident and General Counsel since 1953.
Federal Reserve Bank of Kansas City
GEORGE H. CLAY holds A.B. and LL.B.degrees from the University of Missouri. Mr.Clay was a practicing attorney from 1934-44,serving with three different law firms. In 1944he became associated with Trans-World Airlineswhere, immediately prior to Reserve Bank em-ployment, he was a Vice President and chiefexecutive officer in Kansas City. He has beenwith the Federal Reserve Bank since Februrary1, 1958, as Vice President, General Counsel, andSecretary.
Federal Reserve Bank of San Francisco
ELIOT J. SWAN is a graduate of the Univer-sity of California. He also carried on graduatestudies at the University and served as teachingassistant, 1932-37. He was an Assistant Profes-sor at St. Mary's College, 1937-38, and a Lecturerin Economics at the University of California,
301
Digitized for FRASER Federal Reserve Bank of St. Louis

302 FEDERAL RESERVE BULLETIN • MARCH 1961
1938-41. In 1941 he joined the Federal Reserve eral Reserve Bank in 1927. He was transferredBank as a Research Assistant, was appointed anAssistant Vice President in 1950, and promotedto Vice President in 1954. He has served as FirstVice President since March 1956.
H. E. HEMMINGS was employed by the Fed-
to the Bank's Salt Lake City Branch as AssistantManager in 1947, returning to San Francisco asAssistant Cashier in 1950. He was appointedCashier in 1956, and promoted to Vice Presidentin 1959.
RETIREMENTS OF RESERVE BANK PRESIDENTS
The following Presidents of the Reserve Banksretired on February 28, 1961:
BankBostonRichmondKansas CitySan Francisco
PresidentJoseph A. EricksonHugh LeachH. G. LeedyH. N. Mangels
Joseph A. Erickson joined the Boston ReserveBank as President effective December 15, 1948.Before coming with the Reserve Bank, Mr. Erick-son had been Executive Vice President of theNational Shawmut Bank of Boston.
Hugh Leach has been associated with the Fed-eral Reserve Bank of Richmond since 1920. Dur-
ing his employment, Mr. Leach served in turnas General Auditor, Managing Director of theCharlotte Branch, Managing Director of the Balti-more Branch, and First Vice President. He hasbeen President of the Bank since 1936.
H. G. Leedy joined the Federal Reserve Bankof Kansas City in 1924 as Counsel. He was ap-pointed Vice President and General Counsel in1938, becoming President in 1941.
H. N. Mangels joined the San Francisco ReserveBank staff in 1916, and was appointed an AssistantCashier in 1920. He was promoted successivelyto Cashier, Vice President, and First Vice Presi-dent. Effective March 1, 1956, he was appointedPresident.
APPOINTMENT OF DIRECTOR
On February 9, 1961, the Federal Reserve Bankof Richmond appointed G. Harold Myrick, Lin-colnton, North Carolina, a director of its CharlotteBranch for the unexpired portion of a term endingDecember 31, 1962. Mr. Myrick is ExecutiveVice President of the First National Bank, Lin-colnton. As a director of the Charlotte Branch hesucceeds Charles D. Parker of Asheville, NorthCarolina, who resigned.
RESIGNATION OF DIRECTOR
Mr. Charles D. Parker, who had served as adirector of the Charlotte Branch of the FederalReserve Bank of Richmond since January 1, 1957,resigned effective February 9, 1961. Mr. Parkerwas formerly Vice Chairman of the Board andFirst Executive Vice President, First Union Na-tional Bank of North Carolina, Asheville.
CHANGES IN THE BOARD'S STAFF
Fred A. Nelson, Assistant Director, Division ofExaminations, retired March 1, 1961. Mr. Nelsonjoined the Board's staff in 1933 as a FederalReserve Examiner. He was appointed an AssistantSecretary in 1940, and Assistant Director of theDivision of Administrative Services when the Divi-sion was organized in 1944. He also served asDirector of the Division of Personnel Administra-tion for four years before returning to the Divisionof Examinations on October 30, 1950.
To succeed Mr. Nelson, the Board, effectiveMarch 1, 1961, appointed Brenton C. Leavitt anAssistant Director in the Division of Examina-tions. Prior to joining the Board's staff as aReview Examiner in 1955, Mr. Leavitt, a graduateof the University of Wyoming, was associated foreight years with the Wyoming State Banking De-partment and the Federal Reserve Bank of KansasCity.
Digitized for FRASER Federal Reserve Bank of St. Louis

CURRENT EVENTS AND ANNOUNCEMENTS 303
Arthur W. Marget, Director of the Board'sDivision of International Finance since the Divi-sion was established on July 1, 1950, resignedeffective March 26, 1961, to accept a position withthe International Cooperation Administration.
Mr. Marget, who prior to joining the Board'sstaff was Professor of Economics and Finance atthe University of Minnesota and held official posi-tions with U. S. Government agencies in Austriaand France, will reside in Guatemala, where hewill be responsible for maintaining liaison withthe Governments of Central America concerningthe work of Central American economic integra-tion.
PUBLICATION OF ANNUAL REPORT
The Forty-Seventh Annual Report of the Boardof Governors of the Federal Reserve System,covering operations for the calendar year 1960,is available for distribution. Copies may be ob-tained upon request from the Board's Division ofAdministrative Services, Washington 25, D. C.
FLOW-OF-FUNDS SUPPLEMENTARY TABLES
Supplement No. 4 of flow-of-funds and savingmaterial is now available for distribution. Thissupplement is a revision and extension of Supple-ment No. 1 previously distributed. It includesannual data for 1946-59 and quarterly data for1952-59 for Tables 2, 3, and 4 of the Flow-of-Funds/Saving presentation appearing quarterly inthe BULLETIN. Supplement No. 4 is statisticallyconsistent with the flow-of-funds tables in theAugust 1960 issue of the BULLETIN; it repeats the
annual and quarterly flow estimates published inthe August 1960 BULLETIN and, in addition, incor-porates corresponding revisions for time periodsprior to those covered in that issue.
Copies of Supplement No. 4 are being mailedto all those whose names are on the permanentmailing list for flow-of-funds supplementary ma-terials. Others who would like to receive copiesof No. 4 should address their requests to the Flowof Funds and Saving Section, Division of Researchand Statistics, Board of Governors of the FederalReserve System, Washington 25, D. C. In request-ing copies, please indicate if you would like to haveyour name placed on the permanent mailing list.
TABLES PUBLISHED ANNUALLY, SEMIANNUALLY, ORQUARTERLY
Latest BULLETIN Reference
Annually Issue Page
Bank holding companies:List of, Dec. 31, 1959 June 1960 697Banking offices and deposits of group
banks, Dec. 31, 1959 July 1960 813Banking and monetary statistics, I960.. Feb. 1961 232-39Banks and branches, number of, by class
and State Apr. 1960 440-41Earnings and expenses:
Federal Reserve Banks Feb. 1961 228-29Member banks:
Calendar year May 1960 564-72First half of year Nov. 1960 1294Operating ratios July 1960 810-12
Insured commercial banks May 1960 573Stock Exchange firms, detailed debit and
credit balances Sept. 1960 1069
Sem [annually
Banking offices:Analysis of changes in number of Feb. 1961 230On, and not on, Federal Reserve Par
List, number of Feb. 1961 231
Quarterly
Flow of funds Jan. 1961 96-103Principal assets and liabilities of Federal
business-type activities Feb. 1961 240
Digitized for FRASER Federal Reserve Bank of St. Louis

National Summary of Business ConditionsReleased for publication March 16
Industrial production was unchanged in Feb-ruary. Nonagricultural employment declined,but the rate of unemployment remained at aboutthe December-January level. Retail sales ad-vanced. Commercial bank credit and the moneysupply increased. Between mid-February andmid-March, common stock prices rose, on bal-ance.
INDUSTRIAL PRODUCTION
Industrial production in February was 102 percent of the 1957 average, unchanged from Jan-uary. While production of materials declinedslightly further, output of final products wasmaintained. Among consumer goods, increasesin television sets, radios, and some applianceswere about offset by further decreases in autosand furniture. The decline in auto assemblieswas 6 per cent, compared with 20 per cent inJanuary; current production rates suggest someadditional decrease in March. Output of businessequipment, after declining 5 per cent from themid-1960 level, was maintained in February.
Iron and steel production increased furtherbut output of automotive parts, construction ma-terials, and some other durable materials con-
INDUSTRIAL PRODUCTION1957 = 100
NONDURABLEMANUFACTURES^
FINALPRODUCTS
/ MATERIALS
CONSUMERGOODS
J I L_
Federal Reserve indexes, seasonally adjusted. Monthlyures, latest shown are for February.
fig-
tinued to decline. Output of nondurable ma-terials was unchanged.
CONSTRUCTION
The value of new construction activity declinedslightly further in February to a seasonally ad-justed annual rate of $54.4 billion. While privateresidential construction continued to decrease,most other types of construction changed little.
EMPLOYMENT
Seasonally adjusted employment in nonfarmestablishments declined in February, with reduc-tions in manufacturing, mining, construction,transportation, and trade. State and local gov-ernment employment continued to rise. In man-ufacturing, layoffs were centered in automobilesand other durable goods lines. Average weeklyhours and earnings in manufacturing were un-changed. The seasonally adjusted unemploymentrate, at 6.8 per cent of the civilian labor force,was about the same as in December and January.
DISTRIBUTION
Following three months of decline, retail salesincreased slightly in February as sales at depart-ment and other general merchandise stores rosesubstantially. Sales of autos remained at the re-duced January rate. In February, as in January,dealers' stocks of autos changed little in contrastwith the usual seasonal increase.
COMMODITY PRICES
The wholesale commodity price index declinedslightly from early February to early March, re-flecting decreases in prices of foods, mainly meatand eggs. Prices of steel scrap and some othersensitive industrial materials advanced but pricesof most industrial commodities were stable.
BANK CREDIT AND RESERVES
Total commercial bank credit increased con-traseasonally in February. Loans expanded sub-stantially, mainly reflecting purchases of con-sumer instalment receivables from one large re-
304
Digitized for FRASER Federal Reserve Bank of St. Louis

NATIONAL SUMMARY OF BUSINESS CONDITIONS 305
tailer. Business and security loans rose mod-erately at city banks. Holdings of U. S. Gov-ernment securities declined less than usual andholdings of other securities continued to increase.The seasonally adjusted money supply, on a dailyaverage basis, rose further by $700 million.
Member bank borrowings from the FederalReserve averaged about $110 million and excessreserves $640 million over the four weeks endingMarch 8. Borrowings were higher and excessreserves were lower than in the preceding fourweeks. During the four weeks ending March 8,the gold stock declined further; the decrease,however, was considerably smaller than in otherrecent periods. Federal Reserve System holdingsof U. S. Government securities declined $70 mil-lion as a reduction in short-term securities wasoffset only in part by an increase in issues of
longer maturities. Required reserves declined,although less than they usually do in this period.
SECURITY MARKETS
From mid-February to mid-March, yields onTreasury securities showed some decrease onbalance. Yields on corporate bonds also de-clined while those on State and local govern-ment bonds increased. On March 15, the Treas-ury announced an advance refunding of fourissues maturing in 1962 and 1963. Holders willhave the option of exchanging up to $8 billionof outstanding securities for two new issues ma-turing in 1966 and 1967.
Common stock prices rose to new highs inearly March, then declined slightly. Trading ac-tivity has been heavy—averaging over 5 millionshares a day since mid-February.
RETAIL TRADE1947 - 49 = 100
RETAIL SALES DEPARTMENT STORES
INTEREST RATESPer cenf
L O N G - T E R M
GOVERNMENT SECURITIES ,
Federal Reserve indexes, seasonally adjusted; retail salesbased on Department of Commerce data. Monthly figures;latest for stocks is December, for other series, February.
Discount rate, range or level for all F. R. Banks. Weeklyaverage market yields for U. S. Government bonds maturingin 10 years or more and for 90-day Treasury bills. Latestfigures shown are for week ending March 10.
Digitized for FRASER Federal Reserve Bank of St. Louis

Digitized for FRASER Federal Reserve Bank of St. Louis

Financial and Business Statistics
* United States *
Member bank reserves, Reserve Bank credit, and related items. 308Reserve Bank discount rates; margin requirements; reserve requirements 312Federal Reserve Banks 313Currency in circulation, money supply; bank debits. . . 316All banks: consolidated statement of monetary system; deposits and currency 318All banks, by classes . . . 319Commercial banks, by classes. 322Weekly reporting member banks. 324Business loans 327
Interest rates 328Security prices; stock market credit; open market paper. 329Savings institutions 330Business finance 332Security issues 334Federal finance 335Federal business-type activities. 340Real estate credit 341Short- and intermediate-term consumer credit. , 344Industrial production . 348
Selected indexes on business activity. . 354Construction 354Employment and earnings. 356Department stores 358Foreign trade 359Wholesale and consumer prices 360National product and income series. . . . 362Flow of funds, saving, and investment. 364
Tables not published each month—list with latest BULLETIN reference. 303
Index to statistical tables.. 389
Tables on the following pages include the prin- the basis of material collected by other agencies;cipal statistics of current significance relating figures for gold stock, currency in circulation,to financial and business developments in the Federal finance, and Federal credit agencies areUnited States. The data relating to Federal obtained from Treasury statements; the remain-Reserve Banks, member banks of the Federal ing data are obtained largely from other sources.Reserve System, and department store trade, Back figures for 1941 and prior years for bank-and the consumer credit estimates are derived ing and monetary tables, together with descrip-from regular reports made to the Board; pro- tive text, may be obtained from the Board'sduction indexes are compiled by the Board on publication, Banking and Monetary Statistics.
307
Digitized for FRASER Federal Reserve Bank of St. Louis

308 BANK RESERVES AND RELATED ITEMS
MEMBER BANK RESERVES, RESERVE BANK CREDIT, AND RELATED ITEMS
[In millions of dollars]
Periodor
date
Reserve Bank credit outstanding
U. S. Govt. securities
TotalBought
out-right
Heldunderrepur-chaseagree-ment
Dis-counts
andad-
vances
Float iTo-tal 2
Goldstock
Treas-urycur-
rencyout-
stand-ing
Cur-rency
incir-
cula-tion
Treas-urycashhold-ings
Deposits, otherthan member bank
reserves,with F. R. Banks
Treas-ury
For- Otheri
OtherF. R.
ac-counts
Member bankreserves 3
TotalWithF. R.Banks
Cur-rencyandcoin
Averages ofdaily figures
1929—June....1933—June....1939—Dec1941—Dec1945—Dec1947—Dec1950—Dec1951—Dec1952—Dec1953—Dec1954—Dec1955—Dec1956—Dec1957—Dec1958—Dec1959—June....
Dec
1960
FebMarAprMayJuneJulyAugSeptOctNovDec
1961
Jan
Feb
Week ending:
1960
Jan. 6132027
Feb. 3101724
Mar. 29
162330
A p r > ^ : : : : : : :2027
May 4
18!.'!!!!!25
June 18
152229
1791,9332,5102,219
23,70821,90520,34523,40924,40025,63924,91724,60224,76523,98226,31225,96327,036
25,32225,31025,48825,81826,12426,61926,98326,65327,05627,87127,248
26,94226,829
26,64226,39525,62225,450
25,44725,38925,35525,253
25,21225,27025,44425,32325,239
25,28425,39625,70125,521
25,66025,86825,76125,745
25,96826,13426,17626,01126,129
1791,9332,5102,21923,70821,90520,33623,31023,87625,21824,88824,31824,49823,61526,21625,94926,993
25,28925,26125,37325,69726,11826,52126,76826,54626,92927,54227,170
26,86226,630
26,60726,33925,62025,450
25,44225,35525,30025,253
25,15425,23525,31325,29025,234
25,26425,28525,41725,444
25,55725,61625,62725,718
25,94126,11826,17626,01126,129
99952442129284267367961443
33491151216
9821510712732978
199
5835131335
2011128477
10325213427
2716
97825085
381268142657
1,633448407840706716564938911
81863762350242538829323317016094
58146
1,018915918776
811853974620
794595726587608
735734561524
552549555403
436400375550412
611283170652681
1,1171,3751,2621,018992
1,3891,6331,4431,496 281,0091,426
1,3172,2082,6122,40424,74422,85821,60625,44627,29927,10726,31726,85327,15626,186
,41227,93729,435
1,0321,0651,0361,0271,1591,140 28894
1,1681,2251,156 291,665
27,21027,04727,18127,37821,13128,17628,20628,08828,49029,24129,060
1,4311,121
28,48428,145
1,5781,269 281,5131,103
29,31028,63328,09827,370
27,40627,13527,365
220 27,131
1,107853997
1
1,054 27,095174 27,075994 27,197
1,245 27,189898 26,778
898 26,950910 27,073,200 27,500
1,153 27,228
958 27,199924 27,371133 27,480
1,161 27,338
924 27,358993 27,557
1,029 27,6091,505 28,0961,168 27,739
4,0244,03017,51822,75920,04722,71222,87922,48323,27622,02821,71121,68921,94222,76920,56320,03019,482
19,42919,41019,38619,35619,34319,24519,05218,87018,57118,05817,954
17,56717,402
19,45619,45519,45519,454
19,44519,43319,43219,423
19,42119,41219,40919,40919,408
19,40619,39419,38619,373
19,36019,35919,35919,353
19,35219,35219,35119,34619,325
2,0182,2952,9563,2394,3224,5564,6294,7014,8064,8854,9825,0085,0645,1445,2305,2785,311
5,3235,3365,3445,3495,3535,3575,3645,3745,3825,3915,396
5,4015,404
5,3135,3155,3165,315
5,340
5,3445,346
5,3475,3485,3495,350
5,3495,3505,3535,3545,356
4,4005,4557,60910,98528,45228,93727,80629,13930,49430,96830,74931,26531,77531,93232,37131,81332,775
31,58031,62831,71331,72631,92632,17432,09132,15132,18332,47433,019
'32,26531,840
32,52432,28231,91031,650
31,56531,59931,63131,562
31,51831,61331,72631,67131,534
31,65431,82631,82831,581
31,60631,72331,77431,684
31,81231,91731,97631,92731,867
210272
2,4022,1892,2691,3301,2901,2801,271767805777772768691632396
445442419415414406403400406405408
411423
407410424424
436443451445
442435448450439
423417420417
414419413415
414424415412406
3081616592625967615271569602443434463385470495524
515481554534496492490516488462522
482521
582519494519
510417591529
542542446451479
509465660553
567504608547
468445490550505
30164739
1,5311,2471,016920571745466439459372345262277361
214197185194221213202216226243250
239189
348308231217
239203224206
219200200180203
163200188186
184184195202
206199206225249
353264290390365394247186337359348
340306307316381375377390405396495
399392
545332326332
333344353335
317293293305327
356349258269
311314349290
321343365398415
376350248292493614739796832908929983998
1,0631,1741,2191,195
921970890937994910948962891973
1,029
9411,054
843840836836
834834896
1,008
1,0081,007980944945
942917864857
855854887
1,034
1,0331,0341,001970971
2,3142,21111,47312,81216,02717,26117,39120,31021,18019,92019,27919,24019,53519,42018,89918,45118,932
18,21318,02718,10418,23918,29418,51818,50118,57018,73319,00419,283
19,315?18,957
19,14119,02918,96318,476
18,53718,26818,25018,061
18,10517,94118,10818,18917,894
17,86817,87018,28018,392
18,24318,30618,23518,168
18,12118,15218,15718,60218,342
2,3142,21111,47312,81216,02717,26117,39120,31021,18019,92019,27919,24019,53519,42018,89918,45118,628
17,94717,77017,84317,96218,00118,20818,11117,69717,84317,73716,688
16,71516,532
18,83118,71318,64818,161
18,25218,04917,97417,793
17,80017,73117,84917,93417,600
17,65017,63418,01218,083
17,96818,08117,96117,868
17,80617,89717,85918,31518,007
304
266257261277293310390873890
1,2672,595
2,600*>2,425
310316315315
285219276268
305210259255294
218236268309
275225274300
315255298287335
For notes see opposite page.
Digitized for FRASER Federal Reserve Bank of St. Louis

BANK RESERVES AND RELATED ITEMS 309
MEMBER BANK RESERVES, RESERVE BANK CREDIT, AND RELATED ITEMS—Continued
[In millions of dollars]
Periodor
date
Reserve Bank credit outstanding
U. S. Govt. securities
TotalBought
out-right
Heldunderrepur-chaseagree-ment
Dis-counts
andad-
vances
Float1 To-tal 2
Goldstock
Treas-urycur-
rencyout-
stand-ing
Cur-rency
incir-
cula-tion
Treas-ury
cashholdings
Deposits, otherthan member bank
reserves,with F. R. Banks
Treas-ury
517422548488
466452555485487
477465551579
467474489546
442418519469460
473522592522
441413528507
510523526496
485
588467
312558382513
456449545539
For-eign
226214209202
221192190195225
233204224200
213202215257
254250230224258
253237246260
245239248245
227196185172
217
238207
252256241261
225195194172
Other
OtherF. R.
ac-counts
Member bankreserves 3
TotalWithF.'R.Banks
Cur-rencyandcoin
Averages ofdaily figures
Week ending:
1960
July 6132027
Aug. 310172431
Sept. 7142128
Oct. 5121926
Nov. 29,
162330
Dec 7142128
1961
Jan. 4111825
Feb. 18
1522
End of month
1960
Dec
1961
Jan
Feb
Wednesday
1961
Jan. 4111825
Feb. 18
1522
26,55326,61326,55626,599
26,93027,09927,04126,99226,788
26,78426,64926,54126,539
27,02827,26827,03626,760
27,31328,01528,10527,83127,623
27,42127,38127,03427,074
27,37527,12426,96726,821
26,60026,86027,00726,740
27,384
26,57026,667
27,20527,00426,91226,747
26,69527,06127,16126,701
26,49126,51726,41626,522
26,76026,80626,81226,77226,682
26,64026,52426,49526,456
26,83627,13627,03626,681
26,94627,43927,58827,67827,607
27,42127,38127,01026,946
26,98426,98626,94826,821
26,58226,67226,65326,589
26,984
26,57026,667
26,98426,99126,91226,747
26,57026,68926,62526,586
6296
14077
170293229220106
1441254683
192132
"79
36757651715316
24128
39113819
18188354151
400
22113
125372536115
440 1341429351
315293416193273
26230186
244
21916895
262
211158190121121
67768056
,0391,1331,4231,085
877
28,06328,11528,43728,063
28,15428,246
976 28,46928,24527,882
822 28
1,014788
861 27,941052 28,035
28,18928,059
,527,242
096 28,38528,51728,62128,415
,0381,4531,354
1,098928
28,66229,154
976 29,32529,542
,022,532 29,228 29
1,057 281,272 282,1512,150
,594.778
29,31629,336
184604457
75188202116
33
98696668
188526471314
1,789 29,420350 28,592
28,47128,450
,408,523
,131,053829
1,326
1,847
8841,100
1,7541,1091,2591,006
859929907
1,229
27,85328,14828,08628,232
29,338
27,56027,866
29,11928,23028,28527,868
27,78828,56228,58928,294
19,32219,28219,25119,191
19,14719,09819,03919,02619,006
18,99918,97518,82818,731
18,67118,61518,58618.552
18,40518,12418,06817,99917,957
17,97418,08317,95717,882
17,74817,62917,59417,490
17,44117,42917,41017,385
17,767
17,441^17,373
17,67017,61517,51017,450
17,44117,41417,39817,373
5,3565,3565,3575,357
5,3585,3595,3635,3665,370
5,3725,3745,3765,375
5,3775,3805,3825,383
5,3875,3895,3915,3925,392
5,3915,3965,3965,398
5,3985,3995,4015,402
5,4025,4035,4045,405
5,398
5,401*>5,405
5,3995,4025,4015,401
5,4025,4045,4055,405
32,15532,36132,19932,041
32,04632,12932,18432,08731,980
32,17432,29132,17132,004
32,04932,27632,30432,120
32,10432,29832,52732,53232,640
32,72233,03833,17433,195
32,85332,63732,28731,964
31,77631,80531,93031,857
32,869
31,77631753
32,78532,44532,12231,801
31,75231,87731,90931,861
406406409405
408404409400395
399401403399
403408413403
403398402407414
413410414401
399403412417
422413417424
377
418
403416415428
427413427430
398374374371
358363386380384
411373379378
443379393373
456395408388387
474680443391
473381389392
393383401392
533
376404
381379387402
380384405403
958935884884
884884904
1,0161,014
1,011974936934
936932864862
865864914,073.071
,066.037,018,019
954941940942
9511,0181,0221,093
941
9401,092
940940941941
,018,024,097,091
18,32018,34918,76218,552
18.59118,52518,56418,40418,466
18,35818,58118,63518,609
18,75918,64018,83918,729
18,87318,79718,73418,76119,678
18,91618,93219,46019,447
19,94319,22619,29219,467
18,96318,948
^18,855^19,036
19,682
18,658n8,983
19,89719,13919,48319,153
18,96519,552
^19,459H9,216
18,07918,04118,42218,219
18,27218,27918,24318,07517,772
17,60717,67617,72917,671
17,92217,84017,90917,789
17,93118,04517,78417,83917,141
16,55816,33416,78216,828
17,20216,60516,66216,875
16,41716,64116,42016,""587 P2
241308340333
319246321329694
751905906938
837800930940
942752950922
2,537
2,3582,5982,6782,619
2,7412,6212,6302,592
2,5462,307*>2,435",449
17,081
16,06616,277
17,11516,25216,70816,373
16,37317,03816,81416,575
2,601
2,592*>2,706
2,7822,8872,7752,780
2,5922,514
^2,645^2,641
P Preliminary. r Revised.1 Figures beginning with 1960 reflect a minor change in concept of
float. For explanation, see the BULLETIN for February 1961, p. 164.2 Includes industrial loans and acceptances, when held. For holdings
of acceptances on Wednesday and end-of-month dates, see subsequenttables on Federal Reserve Banks. (Industrial loan program discontinuedAug. 21, 1959.) See also note 1.
3 Beginning Nov. 24, 1960, all currency and coin held by memberbanks allowed as reserves; during the period Dec. 1, 1959-Nov. 23, 1960,only part of such holdings were allowed. Monthly averages of currencyand coin are estimated.
4 Less than $500,000.
Digitized for FRASER Federal Reserve Bank of St. Louis

310 BANK RESERVES AND RELATED ITEMS
RESERVES AND BORROWINGS OF MEMBER BANKS, BY CLASSES
[Averages of daily figures. In millions of dollars]
Period
1929 June1933 June1939 Dec1941 Dec1945 Dec1947 Dec1950 Dec1951 Dec1952 Dec . .1953 Dec1954 Dec1955 Dec1956 Dec1957 Dec1958 Dec1959 June
Dec
I960 FebM a rAprMayJune . . .JulyAugSeptOctNovDec
1961 JanFeb
Week ending:
1960—Feb. 3101724
Sept. 71 4 . . . .2 1 . . . .2 8 . . . .
Oot. 5121 9 . . . .26
Nov 2 . .9
1 6 . . . .2330
Dec 714212 8 . . . .
1961—Jan. 411182 5 . . . .
Feb. 1 . . . .8
152 2 . . . .
All member banks
Totalre-
servesheldi
2,3145 2,16011,47312,81216,02717,26117,39120,31021,18019,92019,27919,24019,53519,42018,89918,45118 932
18,21318 02718,10418,23918 29418,51818,50118,57018,73319,00419,283
19 315P18,957
18,53718,26718,25118,061
18,35818,58118,63518,609
18,75918 64018,83918,729
18 87318,79718,73318,76119,678
18 91618,93219,46019,447
19,94419 22619 29219,467
18,96318,948
*18,855*19,036
Re-quired
re-serves2
2,2751,7976,4629,422
14,53616,27516,36419,48420,45719,22718,57618,64618,88318,84318,38318,04318 450
17,75817,61117,69617,77017,82818,01017,96117,93118,09518,24818,514
18 570Pi8,309
18,05617,83817,74317,637
17,70217,76218,11618,091
18,14817 95117,96318,200
18,30918,19118,12118,15418,481
18 21618,22218,70618,753
18,93018 65418 50018,463
18,41518,380
^18,201»18,321
Excessre-
serves 3
39363
5,0113,3901,491
9861,027
826723693703594652577516408482
455416408469466508540639638756769
745
481429508424
656819519518
611689876529
564606612607
1,197
700710754694
1,014572792
1,004
548568
P715
Bor-row-ings
atF. R.
Banks4
974184
35
334224142657
1,593441246839688710557921906
816635602502425388293225149142
87
49137
808850973620
261299
79225
20014874
240
18913616899
113
60707449
176513547
66179193107
Freere-
serves 3
- 9 3 5179
5,0083,3851,157
762885169
- 8 7 0252457
- 2 4 5- 3 6
- 1 3 3- 4 1
- 5 1 3- 4 2 4
- 3 6 1- 2 1 9- 1 9 4
- 3 341
120247414489614682
696
- 3 2 7-All- 4 6 5- 1 9 6
395520440293
411541802289
375470444508
1,084
640640680645
838521757957
482389
Central reserve city banks—New
Totalre-
servesheldi
762861
5,6235,1424,1184,4044,7425,2755,3574,7624,5084,4324,4484,3364,0333,9333,920
3,7533,7663,7653,8533,8523,8643,7803,7733,7883,7703,687
3,693P 3 , 6 3 2
3,8583,7733,7233,740
3,6813,6813,8353,834
3,9103,6973,8303,795
3,8153,7383,6993,7073,875
3,5593,5793,7693,753
3,8403,6763,6253,761
3,6583,6373,5783,616
Re-quired
re-serves2
755792
3,0124,1534,0704,2994,6165,2315,3284,7484,4974,3974,3924,3034,0103,9263,930
3,7443,7553,7843,8083,8193,8533,7803,7553,7653,7183,658
3,667*>3,598
3,8543,7533,7223,720
3,6513,6603,8353,836
3,8773,7013,7063,798
3,8073,7153,6883,7093,717
3,5403,5563,7533,725
3,8213,6703,6113,629
3,6593,6283,5483,597
Excessre-
serves 3
769
2,61198948
1051254430141235573423
7- 1 0
910
- 1 9453311
18225229
26P34
420
120
3021
1- 2
33- 4123- 3
82311
- 3158
20231628
196
15132
- 19
3120
Bor-row-ingsat
F. R.Banks4
174
n.a.n.a.1923858
15148611562
1961471391032299
599
12
17142720131819
8
6779
11815
1743
12,
14
58
2740
62
14
71
310126
'York
Freere-
serves 3
- 1 6 769
n.a.n.a.
- 1 4 46767
- 1 0 7- 4 5 6- 1 0 1
- 5 0- 1 6 2
- 9 1- 1 0 5
—80- 1 5
- 1 0 9
- 5 01
- 3 145162
- 2 7- 2
93410
26^26
- 6 3- 5 9
- 1 1 66
13- 2 2
1- 1 6
19- 4123
- 6 1
8- 4
- 2 9Q
157
20232
28
- 5 26
15132
- 4
1 913
Central reserve city banks—Chicago
Totalre-
servesheldi
161211
,1411,143
939,024,199
,406,295,210.166
l]lA91,1361,0771,0091,038
996975954988987
1,0201,0271,0141,0111,006
958
963*>954
f 03T1,007
993977
1,0021,0011,0291,019
1,033,001,015
1,004
1,006999998
[,008
937934962981
985972948967
957956939967
Re-quired
re-serves2
161133601848924
[,0111,1911,3531,4091,2951,2101,164
[J,127[,0701,006
038
993970955981988
1,0101,0241,0111,007
998953
959*>948
1,0311,003
997969
997996
1,0251,023
1,0211,002
9981,009
1,0131,004
995997990
934927966976
985965945951
960951937954
Excessre-
serves 3
78540295
141383
- 41
- 12
12873
36
- 17
- 11033484
4Pi
4- 5
9
544
- 4
13- 217
- 5
7241
18
47
- 35
83
16
- 262
13
Bor-row-ingsat
F. R.Banks4
63n an.a.n a
65
64232
37158597853966
104
1291579956584941
86
128
436
71137190104
18
12
611
21
301
1366
9
42
11
8288127
Freere-
serves 3
- 6 2n.a.n.a.n a.
1473
- 6 1- 2 3 6
- 3 6- 1 6- 8 3- 8 6- 7 7- 3 1- 6 3
— 104
- 1 2 6- 1 5 1- 1 0 0
- 4 9- 5 9- 3 9- 3 8
- 5- 2- 4- 4
v — 29
- 7 0- 1 3 3- 1 9 5
- 9 5
5- 1 4
4- 1 6
62
16- 2 6
- 2 3
- 9- 4
12
47
- 1 25
- 4 282
15
- 1 0- 2 2- 7 9- 1 4
For notes see opposite page.
Digitized for FRASER Federal Reserve Bank of St. Louis

BANK RESERVES AND RELATED ITEMS 311
RESERVES AND BORROWINGS OF MEMBER BANKS, BY CLASSES—Continued
[Averages of daily figures. In millions of dollars]
Period
Reserve city banks
Totalreserves
held*
761648
3,1404,3176,3946,8616,6897,9228,3237,9627,9277,9248,0788,0427,9407,7447,954
7,5447,4297,4987,5157,5407,6477,6547,6627,7617,8547,950
7,960^7,807
7,7037,6317,5107,498
7,6027,6087,7117,677
7,7277,7117,8277,768
7,8537,8227,8277,8017,938
7,7817,8517,9728,046
8,1358,0097,9238,057
7,7987,8137,7647,858
Requiredreserves2
749528
1,9533,0145,9766,5896,4587,7388,2037,8777,8367,8657,9837,9567,8837,7057,912
7,5037,3917,4537,4657,4967,5997,6077,5957,6967,7617,851
7,859^7,741
7,6657,5887,4687,434
7,5277,5417,6597,644
7,6667,6427,6547,738
7,8067,7697,7617,7637,729
7,7237,7327,9197,964
8,0077,9167,8487,813
7,7627,7697,7007,745
Excessreserves 3
12120
1,1881,303
4182712321841208591609686573941
42374551444847686594
100
101*66
38434164
75675233
6169
17330
47526638
209
58119
5283
1289375
244
364464
112
Borrow-ings at
Banks 4
40958
n.a.n.a.
96123
50354639184117398299314254574490
423289298224164176109112675620
1457
441418491289
11813926
145
839718
110
7858514549
2119149
44101710
19817447
Freereserves 3
-39762
n.a.n.a.322148182
-170-519
- 9 9- 2 6
-338-203-228-198-536-449
-381-252-253-173-120-128
- 6 2- 4 4- 23880
87
-403-375-450-225
- 4 4- 7 2
27-112
- 2 2- 2 9155
- 8 0
- 3 1- 5
15- 7161
37100
3873
848358
233
17- 3 7- 1 0
66
Totalreserves
held*
632441
1,5682,2104,5764,9724,7615,7566,0945,9015,6345,7165,8595,9065,8495,7656,020
5,9205,8575,8875,8825,9155,9876,0416,1206,1736,3746,689
6,699^6,564
5,9445,8566,0255,846
6,0736,2916,0596,078
6,0896,2316,1666,1626,1846,2316,2086,2536,857
6,6386,5696,7576,666
6,9846,5696,7956,683
6,5506,541
*6,574P 6 , 5 9 6
Country banks
Requiredreserves2
610344897
1,4063,5664,3754,0995,1615,5185,3075,0325,2205,3715,4575,4195,4065,569
5,5185,4945,5045,5175,5255,5485,5505,5695,6265,7716,053
6,085^6,022
5,5065,4935,5555,514
5,5265,5655,5975,587
5,5855,6065,6045,655
5,6835,7025,6775,6846,045
6,0206,0086,0686,089
6,1186,1036,0966,070
6,0356,032
*>6,017^6,025
Excessreserves 3
2296
671804
1,011597663596576594602497488449430359450
402363383366390439491551546602636
614P542
438363470332
547726462491
504626562506
501528532569811
619560689578
867466699613
515509
»558*572
Borrow-ings atF.R.
Banks 4
327126n.a.n.a.
46572989
23610552
159144172162259213
205180193222186149116
85635640
3136
229216174212
126995455
97505551
8151644257
39523740
18411736
36602627
Freereserves 3
-305- 3 0n.a.n.a.965540634507340489550338344277268101237
197183190144204290375466483546596
583P506
209146296119
420627408436
408576507455
420478468527754
580509652538
849425682577
479449
*>532P545
1929—June . . .1933—June . . .1939—Dec . . . .1941—Dec . . . .1945_Dec....1947_Dec... .1950—Dec...1951—Dec...1952—Dec...1953—Dec...1954_Dec. . .1955—Dec...1956—Dec...1957—Dec...1958—Dec...1959—June...
D e c . . .
1960—Feb....Mar... .
May. . .June. . .Ju ly . . .Aug....Sept....OctNov... .D e c . . .
1961—JanFeb. . . .
Week ending:
I960—Feb. 3101724
Sept.J2128
Oct. 5121926,
Nov. 2,9,
16,23.30,
Dec 7,14,21,28,
1961—Jan. 4,11,18,25,
Feb. 1,8,
15,22,
n.a. Not available. P Preliminary.1 Based on figures at close of business through November 1959; there-
after on closing figures for balances with Reserve Banks and openingfigures for allowable cash. Beginning Nov. 24, 1960, all currency andcoin held by member banks allowed as reserves; during the period Dec.1, 1959-Nov. 23, 1960, only part of such holdings had been allowed.Monthly averages of currency and coin are estimated.
2 Based on deposits as of opening of business each day. Monthly
averages for all classes of banks beginning with January 1960 are esti-mated.
3 Monthly averages for all classes of banks beginning with January1960 are estimated.
4 Based on closing figures.5 This total excludes, and that in the preceding table includes, $51
million in balances of unlicensed banks.
Digitized for FRASER Federal Reserve Bank of St. Louis

312 DISCOUNT RATES
FEDERAL RESERVE BANK DISCOUNT RATES
[Per cent per annum]
Federal Reserve Bank
Discounts for and advances to member banks
Advances secured by Governmentobligations and discounts of andadvances secured by eligible paper
(Sees. 13 and 13a)i
Rate onFeb. 28
In effectbeginning:
Other secured advances[Sec. 10(b)]
In effectbeginning:
Previousrate
Advances to individuals,partnerships, or corpora-tions other than memberbanks secured by directobligations of the U. S.
(last par. Sec. 13)
Rate onFeb. 28
In effectbeginning:
Previousrate
BostonNew York . . .Philadelphia..ClevelandRichmond...AtlantaChicagoSt. LouisMinneapolis..Kansas City..DallasSan Francisco
Aug. 23, 1960Aug. 12, 1960Aug. 19, 1960Aug. 12, 1960Aug. 12, 1960Aug. 16, 1960Aug. 19, 1960Aug. 19, 1960Aug. 15, 1960Aug. 12, 1960Sept. 9, 1960Sept. 2, 1960
Aug. 23,Aug. 12,Aug. 19,Aug. 12,Aug. 12,Aug. 16,Aug. 19,Aug. 19,Aug. 15,Aug. 12,Sept. 9,Sept. 2,
196019601960196019601960196019601960196019601960
Aug. 23,June 10,Aug. 19,Aug. 12,Aug. 12,Aug. 16,June 10,Aug. 19,Aug. 15,Aug. 12,Sept. 9,June 3,
196019601960196019601960196019601960196019601960
i Rates shown also apply to advances secured by obligations of Federalintermediate credit banks maturing within 6 months.
NOTE.—Maximum maturities. Discounts for and advances to memberbanks: 90 days for discounts and advances under Sections 13 and 13a ofthe Federal Reserve Act except that discounts of certain bankers' accept-ances and of agricultural paper may have maturities not exceeding 6
months and 9 months, respectively, and advances secured by obligationsof Federal intermediate credit banks maturing within 6 months arelimited to maximum maturities of 15 days; 4 months for advances underSection 10(b). Advances to individuals, partnerships, or corporationsunder the last paragraph of Section 13: 90 days.
FEDERAL RESERVE BANK DISCOUNT RATES i
[Per cent per annum]
Dateeffective
1948Jan. 12.
19.Auell:1950A u g ik1953
Jan. 16.23.
1954Feb. 5.
15.Apr. 14.
16.May 21 .
1955Apr. 14.
May 2 .Aug. 4 .
12!S e p M :Nov. 18.
23.
1956Apr. 13.
20.Aug. 24.
Range(or level)—
all F. R.Banks
1 -WAWA
1*4-1*4
WA
F. R.Bank
ofN. Y.
Dateeffective
Range(or level)—
all F. R.Banks
1957A u 8 - 2 3 :Nov. 15.Dec. 2.
1958Jan. 22.
24.Mar. 7.
13.21 .
Apr. 18.May 9Aug. 15.Sept. 12.
23.Oct. 24.Nov. 7.
1959Mar. 6.
16.May 29.June 12.Sept. 11.
18.
1960June 3.
10.14.
Aug. 12.Sept. 9.
1961In effectFeb. 28.
3 -3%
2*4-3
3 -3*4
3*1-43*4-4
3 723 -3*4
F. R.Bank
ofN. Y.
¥
1 Under Sees. 13 and 13a (as described in table above). For data for1941-47, See the BULLETIN for January 1959, p. 76.
NOTE.—The rate charged by the Federal Reserve Bank of New Yorkon repurchase contracts against U. S. Govt. securities was the same asits discount rate except in the following periods (rates in percentages):1955—May 4-6,1.65; Aug. 4,1.85; Sept. 1-2, 2.10; Sept. 8, 2.15; Nov. 10,2.375; 1956—Aug. 24-29, 2.75; 1957—Aug. 22, 3.50; 1960—Oct. 31-Nov. 17, Dec. 28-29, 2.75; and 1961—Jan. 9, 2.75; Feb. 6-7, 2.75.
MARGIN REQUIREMENTS i
[Per cent of market value]
Prescribed in accordance withSecurities Exchange Act of 1934
Regulation T:For extensions of credit by brokers and
For short salesRegulation U:
For loans by banks on stocks
Aug. 5,1958-
Oct. 15,1958
7070
70
Oct. 16,1958-
July 27,1960
9090
90
Effec-tive
July 28,1960
7070
70
1 Regulations T and U limit the amount of credit that may be extendedon a security by prescribing a maximum loan value, which is a specifiedpercentage of its market value at the time of extension: margin require-ments are the difference between the market value (100%) and the maxi-mum loan value.
MAXIMUM INTEREST RATES PAYABLE ON TIME DEPOSITS
[Per cent per annum]
Type of deposit
Savings deposits
Postal savings deposits
Other time deposits payable:In 6 months or moreIn 90 days to 6 months . . .In less than 90 days
Nov. 1,1933-
Jan. 31,1935
3
3
333
Feb. 1,1935-
Dec. 31,1935
2ft2%
Jan 1,1936-
Dec. 31,1956
2ft2ft
V
Effec-tive
Jan. 1,1957
3
3
3
NOTE.—Maximum rates that may be paid by member banks as estab-lished by the Board of Governors under provisions of Regulation Q.Under this Regulation the rate payable by a member bank may not in anyevent exceed the maximum rate payable by State banks or trust companieson like deposits under the laws of the State in which the member bank islocated. Effective Feb. 1, 1936, maximum rates that may be paid byinsured nonmember commercial banks, as established by the F.D.I.C.,have been the same as those in effect for member banks.
Digitized for FRASER Federal Reserve Bank of St. Louis

RESERVE REQUIREMENTS 313
MEMBER BANK RESERVE REQUIREMENTS
[Per cent of deposits]
Effective dateof change
In effect Dec. 31, 1945..
1948—Feb. 27June 11Sept. 16,24*. . . .
1949—May 1,5*June 30, July 1 *.Aug. 1 ,11*. . . .Aug. 16 ,18*. . . .Aug. 25Sept. 1
1951—Jan. 11,16*. . . .Jan. 25, Feb. 1 *.
1953—July 1,9*1954—June 16,24*. . . .
July 29, Aug. 1*
1958—Feb. 27, Mar.Mar. 20, Apr. 1*Apr. 17Apr. 24
1960—Sept. 1Nov. 24Dec. 1
In effect Mar. 1, 1961..
Present legal require-ments:
MinimumMaximum
Net demand deposits1
Centralreserve
citybanks
20
22242624
2324222120
19A1918%1817%
16%
16%
210222
Reservecity
banks
20
222120
8*18%18192019
18
17%17
16%
16%
10222
Coun-try
banks
14
1615141312
131413
12
12
12
714
DEPOSITS, CASH, AND RESERVES OF MEMBER BANKS,BY CLASSES
[Averages of daily figures. 1 In millions of dollars]
Time deposits
Centralreserve
andreserve
citybanks
ItemCoun-
trybanks
7%
6
Gross demand:Total
InterbankU. S. Government.Other
Net demand 2
TimeDemand balances due
from domestic banks.Currency and coinBalances with F. R.
BanksTotal reserves held
RequiredExcess
* First-of-month or midmonth dates record changes at country banks,and other dates (usually Thurs.) record changes at central reserve orreserve city banks.
1 Demand deposits subject to reserve requirements which, beginningAug. 23, 1935, have been total demand deposits minus cash items inprocess of collection and demand balances due from domestic banks (alsominus war loan and Series E bond accounts during the period Apr. 13,1943-June 30, 1947).
2 Prior to July 28,1959, the minimum and maximum legal requirementsagainst net demand deposits of central reserve city banks were 13 and26 per cent, respectively, and the maximum for reserve city banks was20 per cent.
Gross demand:Total
InterbankU. S. Government.Other
Net demand2
TimeDemand balances due
from domestic banks.Currency and coinBalances with F. R.
BanksTotal reserves held
RequiredExcess
Allmemberbanks
Central reservecity banks
NewYork
Chi-cago
Reservecity
banks
Coun-try
banks
Four weeks ending Jan. 25, 1961
127,56315,2293,838
108,496105,64358,936
7,7562,646
16,83619,48218,637
845
25,4364,645853
19,93820,6795,408
117210
3,5153,7253,682
43
6,2571,305211
4,7415,3451,588
12134
9349689617
49,8987,5961,401
40,90240,92622,870
2,269802
7,2298,0317,896135
45,9721,6841,374
42,91538,69329,070
5,2491,600
5,1586,7586,097661
Four weeks ending Feb. 22, 1961
122,59813,8213,900
104,877103,23860,098
6,9452,433
16,51718,95018,329
621
24,3244,363836
19,12620,1685,602
101185
3,4373,6223,608
14
6,0281,187210
4,6315,2361,732
9930
9259559505
47,7456,7841,515
39,44539,83823,417
2,056741
7,0677,8087,744
64
44,5021,4881,339
41,67437,99729,347
4,6901,475
5,0896,5646,027537
1 Balances with Reserve Banks are as of close of business; figures for allother reported items (that is, excluding total reserves held and excess re-serves) are as of opening of business.
2 Demand deposits subject to reserve requirements, i.e., gross demanddeposits minus cash items reported as in process of collection and demandbalances due from domestic banks.
MATURITY DISTRIBUTION OF LOANS AND U. S. GOVERNMENT SECURITIES HELD BY FEDERAL RESERVE BANKS 1
[In millions of dollars]
Item
Wednesday
1961
Feb. 22 Feb. 15 Feb. 8 Feb. 1 Jan. 25
End of month
1961
February January
1960
February
Discounts and advances—total.Within 15 days16 days to 90 days91 days to 1 year
Acceptances—total. .Within 15 days. . . .16 days to 90 days.
U. S. Government securities—total.Within 15 days16 days to 90 days91 days to 1 yearOver 1 year to 5 yearsOver 5 years to 10 yearsOver 10 years
314305
9
471461
10
526516
10
18817810
685810
5345
604911
501733
26,701407
4,47411,0979,2671,185
271
511536
27,161910
4,39811,1439,2601,179
271
469
37
27,0614,4521,4309,045
10,6841,179
271
461036
26,6954,2421,2769,054
10,6731,179
271
471829
26,747573
4,9389,113
10,6731,179
271
461135
26,667204
4,53111,1289,3441,189
271
461135
26,5703,9381,4559,054
10,6731,179
271
739732
7
351421
25,209216829
14,1708,544
657793
1 Holdings under repurchase agreements are classified as maturingwithin 15 days in accordance with maximum maturity of the agreements.
2 Less than $500,000.
Digitized for FRASER Federal Reserve Bank of St. Louis

314 FEDERAL RESERVE BANKS
CONSOLIDATED STATEMENT OF CONDITION OF ALL FEDERAL RESERVE BANKS
[In millions of dollars]
Federal Reserve Notes—Federal Reserve Agents' Accounts
Item
AssetsGold certificate accountRedemption fund for F. R. notes
Total gold certificate reserves
Cash .Discounts and advances:
For member banksFor nommember banks, etc
Acceptances Bousht outrishtHeld under repurchase agreement
U. S. Government securities:Bought outright:
BillsCertificates—Special
OtherNotes . . . .Bonds
Total bought outrightHeld under repurchase agreement
Total U. S. Government securities . . . . . .
Total loans and securities
Cash items in process of collectionBank premisesOther assets
Total assets
LiabilitiesFederal Reserve notes . . . .Deposits:
Member bank reservesU § Treasurer—general account .Foreign . . .Other
Total deposits . . .
Deferred availability cash itemsOther liabilities and accrued dividends
Total liabilities
Capital AccountsCapital paid inSurplus .Other capital accounts
Total liabilities and capital accounts
Contingent liability on acceptances purchased forforeign correspondents
U. S. Government securities held in custody forforeign account .
Wednesday
1961
Feb. 22
16,0291,050
17,079
490
3059
464
2,596
5,45715,9912,542
26,586115
26,701
27,065
4,453109133
49,329
27,083
16,575539172452
17,738
3,17537
48,033
419817
60
49,329
187
5,880
Feb. 15
16,0541,053
17,107
488
4629
465
2,628
5,46215,9942,541
26,625536
27,161
27,683
5,006108114
50,506
27,129
16,814545194405
17,958
4,10035
49,222
41881749
50,506
190
5,934
Feb. 8
16,0711,055
17,126
506
5179
46
2,619
9 04512,4842,541
26,689372
27,061
27,633
4,018109224
49,616
27,104
17,038449195384
18,066
3,08936
48,295
418817
86
49,616
192
5,866
Feb. 1
16,0821,058
17,140
518
1799
46
2,524
9,04512,4662,535
26,570125
26,695
26,929
4,220108210
49,125
26,994
16,373456225380
17,434
3,36132
47,821
418817
69
49,125
195
5,807
Jan. 25
16,0901,060
17,150
499
599
47
2,694
9 05012,4682,535
26,747
26,747
26,862
4,268108271
49,158
27,027
16,373513261402
17,549
3,26233
47,871
416817
54
49,158
213
5,724
End of month
1961
February
16,0291,046
17,075
495
449
46
2,596
5 45716,0562,558
26,667
26,667
26,766
4,235108144
48,823
26,989
16,277467207404
17,355
3,13533
47,512
421817
73
48,823
179
5,879
January
16 0821,058
17,140
512
519
46
2,524
9 04512 4662,535
26,570
26,570
26,676
3,861108284
48,581
27,004
16,066588238376
17,268
2,97731
47,280
415817
69
48,581
197
5,793
1960
February
18 169965
19,134
491
739
34
1,148
8 50713 0102,484
25,14960
25,209
25,982
3,706101183
49,597
26 854
17 754453191326
18,724
2,72732
48,337
393775
92
49,597
119
4,588
F R notes outstanding (issued to Bank)Collateral held against notes outstanding:
Gold certificate account
U S Government securities
28,978
9,25577
21,130
30,462
29
9
21
30
,040
,24574
,130
,449
29,152
9,25550
21,130
30,435
29
9
21
30
,294
,25547
,140
,442
29,430
9,25520
21,140
30,415
28
9
21
30
,888
,07516
,110
,201
29
9
21
30
,320
,25518
,140
,413
28
10
19
30
,631
,585147
,270
,002
NOTE.—For explanation of adjustments in preparing this consolidatedstatement, see the BULLETIN for February 1961, p. 164. Reserve ratios,
previously shown in this Table, appear on the opposite page.
Digitized for FRASER Federal Reserve Bank of St. Louis

FEDERAL RESERVE BANKS 315
STATEMENT OF CONDITION OF EACH FEDERAL RESERVE BANK ON FEBRUARY 28, 1961
[In millions of dollars]
Item
AssetsGold certificate accountRedemption fund for F. R. no te s . . . .
Total gold certificate reserves...
F. R. notes of other BanksOther cash . . .
Discounts and advances:Secured by U. S. Govt. securities. .Other
Acceptances:Bought outrightHeld under repurchase agreement..
U. S. Govt. securities:Bought outrightHeld under repurchase agreement. .
Total loans and securities
Cash items in process of collection. . .Bank premisesOther assets
Total assets. . . .
LiabilitiesFederal Reserve notesDeposits:
Member bank reservesU. S. Treasurer—general account. .ForeignOther
Total deposits
Deferred availability cash itemsOther liabilities and accrued divi-
dends
Total liabilities
Capital AccountsCapital paid inSurplusOther capital accounts
Total liabilities and capital accounts..
Ratio of gold certificate reserves todeposit and F. R. note liabilitiescombined (per cent):
Feb. 28, 1961Jan 31 1961Feb 29 1960
Contingent liability on acceptancespurchased for foreign correspond-ents
Total
16,0291,046
17,075
559495
4310
46
26,667
26,766
5,291108144
50,438
27,548
16,277467207404
17,355
4,191
33
49,127
421817
73
50,438
38.038.141 5
179
Boston
74662
808
5134
20)
1,433
1,435
38747
2,726
1,588
6812110
1
713
360
2
2,663
2040
3
2,726
35.132.039.6
9
NewYork
3,865247
4,112
151114
13
46
6,651
6,701
1,1699
36
12,292
6,410
4,21939
2 58340
4,656
855
7
11,928
117229
18
12,292
37.239.643 0
3 45
Phila-del-phia
93763
1,000
3328
41
1,527
1,532
34048
2,945
1,814
74025122
779
274
2
2,869
2448
4
2,945
38.637.742 4
11
Cleve-land
1.39591
1,486
4544
1
2,291
2,293
4138
13
4,302
2,496
1,2934119
1,354
328
3
4,181
3975
7
4,302
38.637.342 7
17
Rich-mond
1,00382
1,085
2628
41
1,688
1,693
36969
3,216
2,116
67851102
741
296
2
3,155
1937
5
3,216
38.036.836.7
9
Atlan-ta
82661
887
8431
31
1,462
1,466
430128
2,918
1,567
85247111
911
366
2
2,846
2344
5
2,918
35.836.039.6
10
Chi-cago
2,821186
3,007
5381
15
4,564
4,580
8342225
8,602
5,147
2,5266229
2,619
641
7
8,414
60116
12
8,602
38.739.541.3
26
St.Louis
63946
685
1626
7C1)
1,078
1,085
21776
2,042
1,190
60030
0)637
170
1
1,998
1427
3
2,042
37.538.138.9
6
Minne-apolis
35126
377
169
10)
619
620
14453
1,174
585
41224
50)
441
117
1
1,144
1019
1
1,174
36.734.638.7
4
Kan-sas
City
74249
791
1415
5C1)
1,145
1,150
27556
2,256
1,130
796419
847
222
2,200
1835
3
2,256
40.038.935.3
8
Dallas
66532
697
2519
1
1,075
1,076
226146
2,063
808
9354112
1
989
192
1
1,990
2447
2
2,063
38.836.638.1
11
SanFran-cisco
2,039101
2,140
4566
3,134
3,135
4871217
5,902
2,697
2,545452553
2,668
370
4
5,739
53100
10
5,902
39.938.745 8
23
Federal Reserve Notes—Federal Reserve Agent's Accounts
F. R. notes outstanding (issued toBank)
Collateral held against notes out-standing :
Gold certificate accountEligible paperU. S. Govt. securities
Total collateral
9
21
30
,888
,07516
,110
,201
1
1
1
,665
475
,275
,750
6
2
5
7
,801
,000
,100
,100
1
1
1
,883
6504
,325
,979
2
1
2
,654
870
,880
,750
2
1
2
,190
670
,560
,230
1,
1,
1,
638
475
200
675
5
1
3
5
,308
,700
,800
,500
1,235
380
1,322
662
180
" " 5 1 0
690
1,155
3005
900
1,205
850
275
625
900
2
1
2
3
,847
,100
,000
,100
1 Less than $500,000.2 After deducting $149,000,000 participations of other Federal Reserve
Banks.
3 After deducting $134,000,000 participations of other Federal ReseneBanks.
Digitized for FRASER Federal Reserve Bank of St. Louis

316 CURRENCY
DENOMINATIONS OF UNITED STATES CURRENCY IN CIRCULATION
[On basis of compilation by United States Treasury. In millions of dollars]
End of year ormonth
193919411945194719501955195619571958 . . . .1959
I960—JanFebMar.AprMayJune. . . .JulyAugSeptOctNovDec
1961—Jan
Totalin cir-cula-tion1
7,59811,16028,51528,86827,74131,15831,79031,83432 19332,591
31,56931,55231 63331,60031,87932 06532,03932,02732 02232,14432,63232,869
31,776
Total
5,5538,120
20,68320,02019,30522,02122,59822,62622,85623,264
22,40922,44022,53922,52922,80922,97022,94622,91222,90022,99623,41023,521
22,580
Coin and small
Coin
590751
1,2741,4041,5541,9272,0272,1102,1822,304
2,2682,2752,2942,3112,3242,3382,3452,3642,3752,3902,4172,427
2,391
$12
559695
1,0391,0481,1131,3121,3691,3981,4941,511
1,4191,4091 4101,4171,4401,4401,4281,4261,4441,4571,4871,533
1,439
denomination currency
$2
36447365647578808385
828382828384848585848688
86
$5
1,0191,3552,3132,1102,0492,1512,1962,1882,1862,216
2,1022,0982,1052,1042,1382,1412,1242,1132,1332,1472,1912,246
2,120
$10
1,7722,7316,7826,2755,9986,6176,7346,6626 6246,672
6,4156,4566 4946,4746,5616,6046,5676,5256,5426,5576,6836,691
6,409
$20
1,5762,5459,2019,1198,5299,940
10,19410,18710 28810,476
10,12310,12010,15410,14110,26310,36310,39810,39910,32010,36210,54510,536
10,135
Large denomination currency
Total
2,0483,0447 8348,8508,4389 1369,1929,2089 3379,326
9,1609,1129 0949,0709,0709 0959,0949,1159 1229,1489,2229,348
9,196
$50
460724
2 3272,5482,4222 7362,7712,7772 7922 803
2 7392,7192 7152 7122,7182 7372 7392,7382 7282 7312,7622,815
2,752
$100
9191,4334 2205 0705,0435 6415 7045,7525 8865 913
5 8255,7955 7875 7695,7675 7745 7765,8005 8185 8445,8885,954
5,875
$500
191262454428368307292280275261
254256255254252252250250249248248249
247
$1,000
425556801782588438407384373341
334334330327324323320319319317317316
314
$5,000
2024
75433333
333333333333
3
$10,000
324624171212141395
55555555555
10
5
1 Outside Treasury and Federal Reserve Banks. Prior to December1955 the totals shown as in circulation were less than totals of coin and
paper currency shown by denomination by amounts of unassorted cur-rency (not shown separately).
2 Paper currency only; $1 silver coins reported under coin.
KINDS OF UNITED STATES CURRENCY OUTSTANDING AND IN CIRCULATION
[On basis of compilation by United States Treasury. In millions of dollars]
Kind of currency
GoldGold certificates
Treasury currency—total
Standard silver dollarsSilver bullionSilver certificates and Treasury notes of 1890Subsidiary silver coinM inor coin . .United States notesFederal Reserve Bank notesNational Bank notes
Total Jan. 31 1961Dec 31 1960Jan. 31, 1960
Total out-standingJan. 31,
1961
17 44117,17029,318
5,401
4882 252
32 3701 580
583347
9655
(5)
(5)(5)
Held in the Treasury
As securityagainst
gold andsilver
certificates
17,170
32,370
1182 252
19,53919,90021,570
Treasurycash
2272
8957
42
5371
(4)
418377437
ForF. R.Banks
andagents
14 323
14,32314,66316,339
Held byF. R.Banks
andagents
2 8162 316
511
8
383751035
(4)(4)
5,6434,9855,405
Currency in circulation *
Jan. 31,1961
3026 9134,832
319
1,9871,501
5713059555
31,776
Dec. 31,1960
3027 8375,002
319
2,1111,533
5743139655
32,869
Jan. 31,1960
3126 7994,740
297
2,0091,436
53530210456
" 3i *569* *
1 Outside Treasury and Federal Reserve Banks. Includes any papercurrency held outside the continental limits of the United States. Totalsfor other end-of-month dates are shown in table above; totals for Wednes-day dates, in table on p. 309.
2 Includes $156,039,431 held as reserve against United States notesand Treasury notes of 1890.
3 To avoid duplication, amount of silver dollars and bullion held assecurity against silver certificates and Treasury notes of 1890 outstandingis not included in total Treasury currency outstanding.
4 Less than $500,000.5 Because some of the types of currency shown are held as collateral or
reserves against other types, a grand total of all types has no specialsignificance and is not shown. See NOTE for explanation of duplications.
NOTE.—There are maintained in the Treasury—(1) as a reserve forUnited States notes and Treasury notes of 1890—$156,039,431 in goldbullion; (2) as security for Treasury notes of 1890—an equal dollar amountin standard silver dollars (these notes are being canceled and retired onreceipt); (3) as security for outstanding silver certificates—silver in bullion
and standard silver dollars of a monetary value equal to the face amountof such silver certificates; and (4) as security for gold certificates—goldbullion of a value at the legal standard equal to the face amount ofsuch gold certificates. Federal Reserve notes are obligations of theUnited States and a first lien on all the assets of the issuing Federal ReserveBank. Federal Reserve notes are secured by the deposit with FederalReserve agents of a like amount of gold certificates or of gold certificatesand such discounted or purchased paper as is eligible under the terms ofthe Federal Reserve Act, or of direct obligations of the United States.Each Federal Reserve Bank must maintain a reserve in gold certificates ofat least 25 per cent against its Federal Reserve notes in actual circula-tion. Gold certificates deposited with Federal Reserve agents as collat-eral, and those deposited with the Treasury of the United States as aredemption fund, are counted as reserve. Gold certificates, as hereinused, includes credits with the Treasurer of the United States payablein gold certificates. Federal Reserve Bank notes and national banknotes are in process of retirement.
Digitized for FRASER Federal Reserve Bank of St. Louis

MONEY SUPPLY; BANK DEBITS 317
MONEY SUPPLY AND RELATED DATA
[Averages of daily figures. In billions of dollars]
Semimonthlyperiod
I960—Jan. 1. .2 . .
Feb. 1 . .2 . .
Mar. 1. .2 . .
Apr. 1. .2 . .
May 1. .2.
June 1 . .2. .
July 1. .2.
Aug. 1. .2 . .
Sept. 1. .2 . .
Oct. 1. .2 . .
Nov. 1. .2 . .
Dec. 1. .2 . .
1961—Jan. 1. .2 . .
Feb. 1. .2 * .
Money supply
Seasonally
Total
141.3141.3141.1140.9140.8140.3
140.3140.7140.2139.6139.4139.4
139.6139.7139.7139.8140.3140.5
140.0141.2140.6139.9140.3140.5
140.2141.0141.3141.2
adjustec
Cur-rency
28.929.028.929.029.029.0
29.129.029.029.028.928.9
28.929.029.028.829.028.9
29.029.029.029.028.929.0
28.929.028.928.9
Demandde-
posits 1
112.4112.3112.2111.9111.8111.3
111.3111.6111.2110.6110.5110.5
110.6110.7110.7111.0111.3111.6
111.0112.2111.6110.9111.4111.5
111.3112.0112.4112.3
Withoutseasonal adjustment
Total
145.2143.7141.9139.6140.0138.6
139.4140.9139.0137.0138.2137.9
138.1139.3139.6138.2139.8139.6
139.8141.4141.7141.2143.2144.4
144.0143.4142.0139.7
Cur-rency
29.128.628.728.628.728.6
28.928.628.828.728.928.8
29.229.029.228.929.228.9
29.229.029.229.329.529.6
29.128.528.628.5
Demandde-
posits !
116.1115.1113.2111.0111.2110.0
110.5112.3110.2108.3109.2109.0
108.9110.3110.4109.3110.7110.7
110.6112.4112.4111.9113.7114.8
114.9114.8113.3111.2
Memoranda:Deposits at member
banks (withoutseasonal adjustment)
De-mand
95.995.393.791.892.191.1
91.493.191.289.790.490.4
90.091.491.490.691.691.5
91.392.692.592.093.894.7
94.694.893.591.7
Time
53.953.553.553.553.753.9
54.154.254.454.554.755.0
55.455.755.956.556.857.0
57.357.557.657.557.858.3
58.959.260.260.6
U. S.Govt.
4 . 03 .23.44 . 03.34 . 3
2 . 93.85.46 .25 .36 .2
5.96 .25.55.43.95.8
5 .44 . 85 .25 .23 .64 . 7
4 . 13.13.55.1
Week
1960
Feb. 3.10.17.24 .
Mar. 2.
Nov. 2.9 .
16.2 3 .30.
Dec. 7.14.2 1 .28 .
1961Jan. 4.
11 .18.2 5 .
Feb. 1.8.
15.22 .
Mar. 1P
Money supply(Without seasonal
adjustment)
Total
142.7142.0141.1139.1
139.6
141.8141.5141.9140.9141.4
142.2143.9145.2143.8
144.2143.8144.0143.4
143.0142.2141.7139.7
139.7
Cur-rency
28.528.728.628.6
28.5
28.929.329.329.329.2
29.529.529.629.7
29.229.228.828.5
28.428.728.728.6
28.4
Demandde-
posits i
114.2113.3112.5110.6
111.1
112.9112.2112.6111.6112.2
112.7114.4115.7114.1
115.0114.6115.2114.9
114.6113.5113.0111.1
111.4
Memoranda:Deposits at
member banks(without
seas.
Time
53.453.553.553.5
53.5
57.657.857.557.557.5
57.757.858.158.4
58.858.859.059.2
59.460.260.460.5
60.8
adj.)
U. S.Govt.
3 .63 .33 .34 . 1
4 . 0
5.55 .44 . 85 .44 . 9
4 . 42 . 73.75 .3
5 .34 . 13 .02 . 9
3 .43 .83 .35 .2
5 .0
Preliminary. 1 At all commercial banks.
BANK DEBITS AND DEPOSIT TURNOVER
Year or month
19531954195519561957 . . . .19581959 . . . .I960
I960 FebMarAprMayJuneJulyAugSept . . . .OctNovDec . . .
1961 JanFeb
Debits to demand deposit accounts, except interbank andU. S. Government accounts
(In millions of dollars)
Allreportingcenters
Unadj.
1 759 0691,887,3662 043 5482,200,6432 356 7682,439,7542 679 1672,838,754
221,984245,729226,007232,844250 852223,539241,771240 772233,131235,100256 905
247,660222,666
Leading centers
New York
Adj.
90,78688,72186,04292,17691 60489,44499,947
103 83291,87098,79188 381
88,18698,269
Unadj.
632 801738,925766 890815,856888 455958,721
1,023 6051,102,850
85,05896,59386,17488,55199 80986,06392,43597 16289,90591,020
101 551
94,47389,831
6 others1
Adj.
49,75246,73048,41448,45348 58346,80750,12748 97448,08449,01747 871
51,05250,199
Unadj.
385 831390 066431 651462,859489 311487,432545 258577,606
45,62650,41046 86247,89550 41545,25449,47447 90947,56747,57752 313
52,38844,861
337 otherreportingcenters 2
Adj.
98,88695,63296,77798,00697 95194,79199,03696,22495,41898,30694 687
97,44697,657
Unadj.
740 436758,375845 007921,928979 002993,600
1,110 3041,158,298
91,30098,72692,97196,398
100 62992,22299,86295 70095,65996,503
103 041
100,80087,974
Annual rate of turnoverof demand deposits except interbank
and U. S. Government deposits
Leading centers
New York
Adj.
58.557.956.461.161.358.965.568.560.063.557.8
57.063.7
Unadj.
36 742.342 745.849 553.656.460.0
56.360.356.358.965.758.859.865.959.261.364 4
59.261.4
6 others1
Adj.
35.734.035.335.535 734.236.735 834.935.834 3
36.3*>35.4
Unadj.
25 625.827 328.830 430.032.534.8
33.436.635.535.236 534.034.735.534.734.936 5
36.2
337 otherreportingcenters 2
Adj.
26.425.826.126.326 425.526.626 025.526.225 1
25.7^25.7
Unadj.
18 919 220 421.823 022.924 525.7
25.025.825 426.226 925 726.026 225 726.226 6
25.8
v Preliminary.Adj. = adjusted for seasonal variation. Unadj. = without seasonal
adjustment.i Boston, Philadelphia, Chicago, Detroit, San Francisco and Los
Angeles. 2 Prior to April 1955, 338 centers.
NOTE.—Series revised by Federal Reserve beginning with 1950; fordescription and revised monthly figures, see the BULLETIN for Jan. 1960,pp. 8-11. Seasonally adjusted figures for earlier years, prepared byFederal Reserve Bank of New York, together with unadjusted datawere published in the BULLETIN for May 1959, p. 554.
Digitized for FRASER Federal Reserve Bank of St. Louis
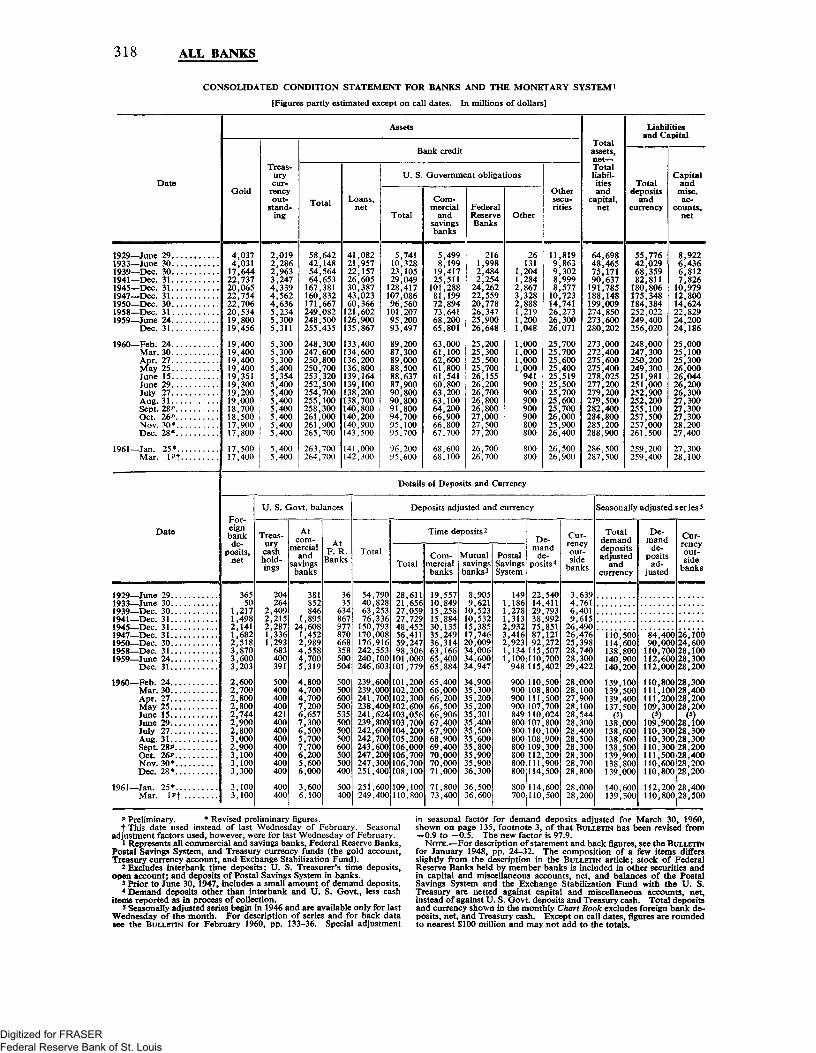
318 ALL BANKS
CONSOLIDATED CONDITION STATEMENT FOR BANKS AND THE MONETARY SYSTEM»
[Figures partly estimated except on call dates. In millions of dollars]
Date
Assets
Gold
Treas-urycur-
rencyout-
stand-ing
Bank credit
Total Loans,net
U. S. Government obligations
Total
Com-mercial
andsavingsbanks
FederalReserveBanks
Other
Othersecu-rities
Totalassets,n e t -Totalliabil-itiesand
capital,net
Liabilitiesand Capital
Totaldeposits
andcurrency
Capitaland
misc.ac-
counts,net
1929—June 291933—June 301939—Dec. 301941—Dec. 311945_Dec. 311947_Dec. 311950—Dec. 301958—Dec. 311959_june 24
Dec. 31
1960—Feb. 24Mar. 30Apr. 27May 25June 15June 29July 27Aug. 31Sept. 28^Oct. 26^Nov. 30*Dec. 28*
1961—Jan. 25*
Mar. i n
4,0374,03117,64422,73720,06522,75422,70620,53419,80019,456
19,40019,40019,40019,40019,35119,30019,20019,00018,70018,50017,90017,800
17,50017,400
2,0192,2862,9633,2474,3394,5624,6365,2345,3005,311
5,3005,3005,3005,4005,3545,4005,4005,4005,4005,4005,4005,400
5,4005,400
58,64242,14854,56464,653167,381160,832171,667249,082248,500255,435
248,300247,600250,800250,700253,320252,500254,700255,100258,300261,000261,900265,700
263,700264,700
41,08221,95722,15726,60530,38743,02360,366121,602126,900135,867
133,400134,600136,200136,800139,164139,100138,200138,700140,800140,200140,900143,500
141,000142,300
5,74110,32823,10529,049128,417107,08696,560101,20795,20093,497
89,20087,30089,00088,50088,63787,90090,80090,80091,80094,70095,10095,700
96,20095,600
5,4998,19919,41725,511101,28881,19972,89473,64168,20065,801
63,00061,10062,60061,80061,54160,80063,20063,10064,20066,90066,80067,700
68,60068,100
2161,9982,4842,25424,26222,55920,77826,34725,90026,648
25,20025,30025,50025,70026,15526,20026,70026,80026,80027,00027,50027,200
26,70026,700
26131
1,2041,2842,8673,3282,8881,2191,2001,048
1,0001,0001,0001,000941900900900900900800800
800800
11,8199,8639,3028,9998,57710,72314,74126.27326;30026,071
25,70025,70025,60025,40025,51925,50025,70025,60025,70026,00025,90026,400
26,50026,900
64,69848,46575,17190,637191,785188,148199,009274,850273,600280,202
273,000272,400275,600275,400278,025277,200279,200279,500282,400284,800285,200288,900
286,500287,500
55,77642,02968,35982,811180,806175,348184,384252,022249,400256,020
248,000247,300250,200249,300251,981251,000252,900252,200255,100257,500257,000261,500
259,200259,400
8,9226,4366,8127,82610,97912,80014,62422,82924,20024,186
25,00025,10025,30026,00026,04426,20026,30027,30027,30027,30028,20027,400
27,30028,100
Date
Details of Deposits and Currency
For-eignbank
de-posits,
net
U. S. Govt. balances
Treas-urycashhold-ings
Atcom-
mercialand
savingsbanks
AtF. R.
Banks
Deposits adjusted and currency
Total
Time deposits2
TotalCom-
mercialbanks
Mutualsavingsbanks 3
PostalSavingsSystem
De-mand
de-posits4
Cur-rencyout-side
banks
Seasonally adjusted series5
Totaldemanddepositsadjusted
andcurrency
De-mand
de-posits
ad-justed
Cur-rencyout-side
banks
1929—June 29.1933—June 30.1939—Dec. 30.1941—Dec. 31.1945—Dec. 31.1947_Dec. 31..1950—Dec. 30.1958—Dec. 31.1959—June 24.
Dec. 31..
1960—Feb. 24..Mar. 30..Apr. 27..May 25. .June 15..June 29..July 27..Aug. 31 . .Sept. 28*Oct. 26*Nov. 30*Dec. 28*
1961—Jan. 25*Mar. l^
36550
1,2171,4982,1411,6822,5183,8703,6003,203
2,6002,7002,8002,8002,7442,9002,8003,0002,9003,1003,1003,300
3,1003,100
204264
2,4092,2152,2871,3361,293683400391
500400400400421400400400400400400400
400400
381852846
1,89524,6081,4522,9894,5584,7005,319
4,8004,7004,7007,2006,6577,3006,5005,7007,7006,2005,6006,000
3,6006,100
3635
634867977870668358500504
500500600500535500500500600500500400
500400
54,140,?63,:76,:150,793170,008176,916242,553240,100246,603
239,239;241;238;241;239;242;242;243;247;247;251
251,600249,400
28,61121,65627,05927,72948,45256,41159,24798,306101,000101,779
101,200102,200102,300102,600103,056103,700104,200105,200106,000106,700106,700108,100
109,100110,800
19,55710,84915,25815,88430,13535,24936,31463,16665,40065,884
65,40066,00066,20066,50066,90667,40067,90068,90069,40070,00070,00071,000
71,80073,400
8,9059,62110,52310,53215,38517,74620,00934,00634,60034,947
34,90035,30035,20035,20035,30135,40035,50035,60035,80035,90035,90036,300
36,50036,600
1491,1861,2781,3132,9323,4162,9231,1341,100948
22,54014,41129,79338,99275,85187,121
92,in115,507110,700115,402
900 110,500108,800
900 111,500107,700110,024107,800
800 110,100108,900109,300
800 112,200111,900114,500
900849800
800800
800 114,600700,110,500
3,6394,7616,4019,61526,49026,47625,39828,74028,30029,422
28,00028,10027,90028,10028,54428,30028,40028,50028,30028,30028,70028,800
28,00028,200
110,500114,600138,800140,900140,200
139,100139,500139,400137,500
138,000138,600138,600138,500139,900138,800139,000
140,600139,300
84,90,
110,112,112,
110,111,111,109,
109?110,110,110,111,110,110,
400 26,100000 24,600700 28,100600 28,300000 28,200
800 28100 28200 28300 28I (900 28300 28300 28300 28500 28600 28800 28
3,3003,400$,200S,200
#003,3003,3003,2003,4003,2003,200
112,200 28,400110,800.28,500
*» Preliminary. * Revised preliminary figures.t This date used instead of last Wednesday of February. Seasonal
adjustment factors used, however, were for last Wednesday of February.1 Represents all commercial and savings banks, Federal Reserve Banks,
Postal Savings System, and Treasury currency funds (the gold account,Treasury currency account, and Exchange Stabilization Fund).
2 Excludes interbank time deposits; U. S. Treasurer's time deposits,open account; and deposits of Postal Savings System in banks.
3 Prior to June 30, 1947, includes a small amount of demand deposits.4 Demand deposits other than interbank and U. S. Govt., less cash
items reported as in process of collection.5 Seasonally adjusted series begin in 1946 and are available only for last
Wednesday of the month. For description of series and for back datasec the BULLETIN for February 1960, pp. 133-36. Special adjustment
in seasonal factor for demand deposits adjusted for March 30, 1960,shown on page 135, footnote 3, of that BULLETIN has been revised from—0.9 to - 0 . 5 . The new factor is 97.9.
NOTE.—For description of statement and back figures, see the BULLETINfor January 1948, pp. 24^-32. The composition of a few items differsslightly from the description in the BULLETIN article; stock of FederalReserve Banks held by member banks is included in other securities andin capital and miscellaneous accounts, net, and balances of the PostalSavings System and the Exchange Stabilization Fund with the U. S.Treasury arc netted against capital and miscellaneous accounts, net,instead of against U. S. Govt. deposits and Treasury cash. Total depositsand currency shown in the monthly Chart Book excludes foreign bank de-posits, net, and Treasury cash. Except on call dates, figures are roundedto nearest $100 million and may not add to the totals.
Digitized for FRASER Federal Reserve Bank of St. Louis

ALL BANKS 319
PRINCIPAL ASSETS AND LIABILITIES AND NUMBER OF ALL BANKS, BY CLASSES 1
[Figures partly estimated except on call dates. Amounts in millions of dollars]
Class of bankand date
Loans and investments
Total LoansU. S.Govt.obliga-tions
Othersecu-rities
Cashassets2
Totalassets—Totallia-
bilitiesand
capitalac-
counts 3
Deposits
Total 2
Interbank2
De-mand Time
Other
Demand
U. S.Govt.
OtherTime
Bor-row-ings
Totalcapital
ac-counts
Num-berof
banks
All banks:1941—Dec. 311945—Dec. 311947—Dec. 3H1958—Dec. 311959—June 24
Dec. 31I960—Feb. 24
June 29July 27Aug. 31Sept. 28*Oct. 26PNov. 30*Dec. 28*
1961—Jan. 25*Mar. i n
All commercial banks:1941—Dec. 311945—Dec. 311947—Dec. 31*1958—Dec. 311959__june 24
Dec. 31I960—Feb. 24
June 29July 27Aug. 31Sept. 28*Oct. 26*Nov. 30*Dec. 28P
1961—Jan. 25*Mar. l^f
All member banks:1941—Dec. 311945_Dec. 311947—Dec. 311958—Dec. 311959—June 24
Dec. 31I960—Feb. 24
June 29July 27Aug. 31Sept. 28POct. 26*Nov. 30*Dec. 28*
1961—Jan. 25*Mar. i n
All mutual savings banks:1941_Dec. 311945_Dec. 311947—Dec. 3H1958—Dec. 311959_june 24
Dec. 31I960—Feb. 24
June 29July 27Aug. 31Sept. 28*Oct. 26*Nov. 30*Dec. 28*
1961—Jan. 25*Mar. l*f
126227924485200,831410,200,370940,100620,71C,480,590,020
746019284165920270540900890240270680690,310160360
521183846865,007879405593
587282042997238240,016
10,37916,20818,64136,32037,28037,56137,87038,30038.48038,70038,83038,94039,02039,17039,43039,660
,615,362,002
121,571128,690135,958135,710140,990140,520141,230142,180141,720142,090145,390141,450144,050
21,71426,08338,05798,214
104,450110,832110,250114,840114,170114,660115,430114,790115,010118,160114,070116,530
18,02122,77532,62884,06189,30194,77994,11197,89897,18397,52398,19697,46997,708
100,53996,77399,558
4,9014,2794,944
23,35724,24025,12625,46026,15026,35026,57026,75026,93027,08027,23027,38027,520
25,101,81,19973,641
,999 27,.577 35;723 38!273 49;
68,170 26,340 42276;
65,801,000 25,760 25,200 25,110 25,190 25;,890 26;,760 25;,650 26;,600 26,090 26
26,071 50700 43450 43650 43600 43730 44010 45860 46440 48540 44880 46
344,415,388911730 270,296 283,490 273,710 276,770 279,830 280,500 282,750 286,680 287,050 293,470 287090 291
90,908177,332175,091
,816,612
161,865430 250,990 241,629 254.430 241;710 244.050 245;000 245;710 249;550 252;650 254;650 259.380 255,400 257,320
225 26,551331 34
21,80890,60669,22166,376 2060,860 20;610 41
006 37575 48
58,937 20,501 49
54,210 19,56,170 20,120 42" " ~ '",850 42
,020 43,000 43,15043,400 45,300 45,830 47
, ,56,580 20,(57,690 20,60,490 20,-60,380 20,61,320 20,:62,16061,560
19,53978,33857,91454,29949,16446,81344,314
930 43, 270 45
806 160;502 155,,990 238,,930 232,,467 244.,780 234;,880 237;,010 239,080 240,,710 242;,000 246,,910 247,200 253,670 246;,260 250.
79,104 71,283312 150,227377 144,103651 216,017380 206,630686 219,903300 206,810040 209,010270 210,420000 210,240530 213,520290 216,580,290 218,230,060 223,380,570 218,510320 220,650
5,961 23,1236,070 29,8457,304 32,845
,188
42,980 15,715
504 43542 37287 43,509 205;726980 37
,171
68,121138,304132,060202,017196,182
45,23845,19846,07348,37948,22449,11849,80649,438
3,70410,68211,9787,2657,3106,8646,8306,5506,5006,5306,5006,4006,3806,3306,4406,530
16,58116.661
892 37866 38013 38194 39
,68937,977
686 203628 206
196,501199,243201,057201,632
492 212;174 206
891669,455,659507
17,020 39,900 211,040
1,7741,2461,7185,6985,7305,5705,5805,6005,6305,6005,5805,6105,5605,6105,6105,610
793609886921800829710830760750790750770850800830
11,80417,02019,71437,77938,61038,94339,13039,67039,78040,00040,18040,26040,36040,59040,81041,080
61,717129,670122,528182,816174,073184.706172,827175,200176,214175,999178,952181,064182,550187,174182.603185,402
10,53315,38517,76334,04034,60034,98334,95035,46035,48035,59035,81035,93035,97036,35036,52036,670
10,98214,065
12,79315,79912,87015,12;13;13;13;13;14;
650710300070500670180600
15,43015,07014,480
2402,3742,030,443,290,440,480,610,670,690,740,780,780,780
44,355105,935
1,3464,2534,4205,0544,4807,0606,2305,4407,390
130;121
5>70 1245,3605,7703,2905,790
10,98214,065
94,381
26,47945,61353,105
131,622122,720
132 97,498600 100,310
119,570121120121
101,116100,560103,100
125129,180126,280124,930
460 103,660600 104,680130 105,470450 106,220290 106,210
107,570108,610110,3401
12,79215,79912,87015,64912,71013,30013,07013,50013,67014,18015,60015,43015,07014,480
10,38513,57612,35315,22712S35715,04812,24012,77512,52412,94313,10513,60115,01414,81714,46513,912
2402,3722,0301,4411,2901,4401,4801,6101,6701,6901,7401,7801,7801,780
44,349105,921
1,343 94,4,250 130;4,420 1215,0504,480 1227,060 1196,230 1215,440 120
430 68,210570 69,120100 69,690420 70,320,260 70,270
.,... ,150 71,2503 290 126,250 72,120
900 73,700
7,390 121,5,970 124,-5,360*"' '5,770
5,790
14064 2250
2,1871,8891,338,187,298,336,467,525,552,594,635,636,639
709179
1,1763,8223,9434,5043,9676,3605,6224,8876,8275,38545,2,9145,179
15,95230,2411
367 35,360
131,593
63,49365,74066,16965,64067,670
125,129,
124,
23 82271066118121
2,7102262422
2,820232,170232,590232,920242,050242,480241,330 242,03024
600241,86024
23 7,219 8,6510,7318;
2,71019;615 19;
2,82019;2,17020;2,59020,2,92020.2,05020;2,480 20;l,3302i;2,03021,
60021,1,86021,
,414 14,826,542 14,553
14,71414,020
360 13,997915150770 14;0890 13,999120230370 13^89590680680790
13,99113,999
13,99814,000
13,98513,98613,98613,978
173 14,278950 14,011059 14,181486 13,501030 13,479556 13.474730 13,482280 13,485380 13,484580 13,483660 13,485
13,474n3470
810000 *110 13,472100 " -"170
13,47213,464
37,136 12.640 24609 28448 51992 52989 52152 52790 53366 54594 55905 55498 56128 56
347j210340!132892i 2,827|281 "
5415,46061915,875581
977366108590028033891
105,990 57,598319
108,631
105,353
56,
59,
16,264
614
33
()(5)
1429 343029
10,527|15,371!17,7451
006i34,570,34,948i
30 34,92030 35,43030 35,45030 35,56030 35,7803O35,9OOi30 35,940130 36,32030 36,49030 36,6
10
88
5,8867,5898,464
,75916,387,06916,822,50516,892,78317,056,99617,114,42917,239,26917,390,973 17,46656317,464
,82517,629
1,2411,5921,8893,2193,3303,3593,4203,490
,510,540,570,560,590,570,580
3,620
6,6196,8846,9236,3126,2796,2336,2236,2126,2046,2056,2006,1876,1786,1746,1646,160
548542533519518517517515515515515515515514514514
* Preliminary. * Revised preliminary figures.fThis date used instead of last Wednesday of February.1 All banks in the United States. Beginning with January 1959,
all banks in Alaska with total deposits of $172 million were includedin the series (a national member bank has been included since April1954); beginning with August 1959, all banks in Hawaii with total depositsof $365 million were included in the series (a national member bankwith total deposits of $220 million has been included in the series sinceApril 1959).
All banks comprise all commercial banks and all mutual savings banks.All commercial banks comprise (1) all nonmember commercial and(2) all member commercial banks. Member banks include (1) a nationalbank in the Virgin Islands that became a member on May 31, 1957, (2)a noninsured nondeposit trust company, and (3) two (three prior to I960)
mutual savings banks that became members in 1941 (these banks areexcluded from all commercial banks).
Stock savings banks and nondeposit trust companies are included withcommercial banks. Number of banks includes a few noninsured banks,for which asset and liability data are not available. Comparability offigures for classes of banks is affected somewhat by changes in FederalReserve membership, insurance status, and the reserve classifications ofcities and individual banks, and by mergers, etc.
2 Beginning with June 30, 1942, excludes reciprocal balances, which onDec. 31, 1942, aggregated $513 million at all member banks and $525million at all insured commercial banks.
3 Includes other assets and liabilities not shown separately.For other notes see following two pages.
Digitized for FRASER Federal Reserve Bank of St. Louis

320 ALL BANKS
PRINCIPAL ASSETS AND LIABILITIES AND NUMBER OF ALL BANKS, BY CLASSES i—Continued
[Figures partly estimated except on call dates. Amounts in millions of dollars]
Class of bankand date
Loans and investments
Total LoansU.S.Govt.obliga-tions
Othersecu-rities
Cashassets2
Totalassets—Totallia-
bilitiesand
capitalac-
counts3
Deposits
Total 2
Interbank2
De-mand Time
Other
Demand
U. S.Govt. Other
Time
Bor-row-ings
Totalcapital
ac-counts
Num-berof
banks
Central reserve citymember banks:
New York City:1941—Dec. 311945—Dec. 311947—Dec. 311958—Dec. 311959—June 24
Dec. 311960—Feb. 24
June 29July 27Aug. 31Sept. 28^Oct. 26?Nov. 30?Dec. 28^
1961—Jan. 25?Mar. i n
Chicago:1941_Dec. 311945—Dec. 311947—Dec. 311958—Dec. 311959_ju n e 24
Dec. 31I960—Feb. 24
June 29July 27Aug. 31Sept. 28?Oct. 26?Nov. 30^Dec. 28^
1961—Jan. 25?Mar. i n
Reserve city member banks:6
1941_Dec. 311945_Dec. 311947—Dec. 311958—Dec. 311959_ju n e 24
Dec. 31I960—Feb. 24
June 29July 27Aug. 31Sept. 28?Oct. 26^Nov. 30PDec. 28?
1961—Jan. 25?Mar. i n
Country member banks:1941—Dec. 311945—Dec. 311947_Dec. 311958—Dec. 311959—June 24
Dec. 31I960—Feb. 24
June 29July 27Aug. 31Sept. 28POct. 26?Nov, 30?Dec. 28P
1961—Jan. 25?Mar. i n
12,89626,14320,39325,96625,48825,29124,46025,32025,69825,43826,27025,92726,40227,95326,82127,690
2,7605,9315,0886,8306,5166,8856,6346,5986,8116,6616,7406,8476,7297,0326,8757,094
15,34740,10836,04060,55860,61761,62158,84859,56360,42760,68360,79061,80561,62563,20861,87963,470
12,51835,00236,32461,51162,38664,08264,46365,11265,37765,80566,48267,46367,24168,04567,66567,762
4,0727,3347,17916,16516,68118,12117,61018,06017,61017,23617,71417,08217,74218,73217,38718,141
9541,3331,8013,6373,6874,2064,1654,3424,2844,3174,3614,3284,2604,4464,1954,534
7,1058,51413,44934,00336,61638,68638,11639,42139,29039,49739,43039,35439,27340,24438,76340,282
5.8905,59610,19930,25732,31733,76634,22036,07535,99936,47336,69136,70536,43337,11736,42836,601
7,26517,57411,9727,4866,4265,0024,6965,2735,9756,0316,2776,6256,6196,8997,0626,975
1,4304,2132,8902,5622,1371,9851,8121,6201,8451,7271,7921,9031,8411,9041,9891,886
6,46729,55220,19620,64518,22417,29215,34014,84615,82515,92016,02917,04016,94317,40917,56817,521
4,37726,99922,85723,60622,37722,53522,46621,24121,59321,52021,97522,81122,82122,90623,18723,056
1,5591,2351,2422,3152,3812,1682,1541,9872,1132,1712,2792,2202,0412,3222,3722,574
376385397631692694657636682617587616628682691674
1,7762,042
5,777643
5,3925,2965,3125,266 155,3315,4115,4095,5555,5485,667
6,6376,4397,2619,2987,2049,1747,6647,7737,6397,8298,1658,5418,3808,8727,5618,640
,566,489,739
2,158,842,003,882,854,745,927,980,954
2,040,981,814,894
8,51811,28613,06617,70115,76218,21115,60015,78615,74315,35315,80115,99816,64916,93715,78916,243
2,2502,4083,2687,6487,6927,7817,7777,7967,7857,8127,8167,9477,9878,0228,0508,105
6,40210,63210,77814,03112,36314,12212,54312,56412,85412,92412,74013,13513,31513,70213,01013,123
19,86232,88727,98236,39833,86935,75033,55334,60034,88634,92836,06836,13636,51238,40736,04838,000
4,3637,4596,8669,0718,4408,9678,5998,5468,6628,6988,8338,9238,8929,1348,8099,118
24,43051,89849,65979,78177,88781,44376,06577,09077,93877,79678,38179,64380,14181,99079,54381,632
19,46646,05947,55376,76775,98679,56778,28479,00779,57180,21080,60981,96781,91083,12882,10782,290
17,93230,12125,21631,67928,41530,64727,54328,65428,24327,94529,34729,07129,92231,35729,97931,031
4,0577,0466,4028,2147,4238,0627,2887,4747,5517,6477,7667,7257,8008,0147,7337,950
22,31349,08546,46772,64769.44873;67567,43568,02868,79668,48469,31770,42171,12672,94370,95872,418
17,41543,41844,44370,27768,78772,32370,56171,04471,62471,92372,52273,84773,70274,86073,93374,003
4,2024,6404,4534,7864,0084,7654,0094,3394,0134,0574,0564,1374,7374,5494,6614,419
1,0351,3121,2171,3571,1231,2311,0991,1511,1631,2361,1911,2311,3591,3111,2541,221
4,3566,4185,6277,5065,9947,4505,8776,0626,0746,3426,5096,7747,4337,3997,0206,836
7921,2071,0561,5781,2321,6021,2551,2231,2741,3081,3491,4591,4851,5581,5301,436
61712
1,7391,480988884985
1,0121,1011,1211,1791,2141,2201,2211,220
1043022377341303256241250285317286293326326329
8666,940267968775
1,027664
1,4151,2761,0051,9951,234955
1,238589992
1271,552
72249259272213407342275552301261331141285
4918,221405
1,4291,6001,6981,6612,5912,2471,9842,5002,0621,8671,9611,0852,130
2255,465
43 '1,1751,3091,5081,4291,9471,7571,6231,7801,7881,6981,6701,0991,772
12,05117,28719,04020,70418,57020,41918,68518,37918,36618,14818,40118,78218,94820,17519,25719,960
2,4193,4624,2015,1364,5865,0704,5364,4424,5524,6294,4974,6624,6294,7994,7434,665
8071,2361,4453,4823,5823,4483,3013,5363,5763,6343,7743,7394,0684,1754,2514,440
476719913,438,424,468,417,426,444,452,465,470,490,510,532,715
12,55724,6552 8 , —42,39,72142,'"38,37,38,38,28438,25739,39,40,39,39,488
990 11259 21
668 21956 20966 21925 21
410 21654 21897 22883 22
4,8069,760,423,075
21,792"",555,685,168,300
21,58921,734"",889
,879,360,644
23,635
10,10924,23528,37842,349 2540,115 2642,40,40,003 2740,52340,53340,750 2841,644 2841,89742,760 2842,10741,240 29
6,25812,49414,560"",137
,094,356,878,847
28,04628,433",617,930
28,59628,84629,171",529
19530
805232852473946
1,083865
1,201535
1,03399891
3164404311611951171252199311288138
2114
1,140238
1,0041,0641,0631,093803822434629237577
411233751071472371301490203187207199139219
1,6482,1202,2593,2823,2923,3613,3813,4273,4503,4833,4703,5003,5573,5503,5693,584
288377426733740762747769770783781804813813821826
1,9672,5662,8445,7605,9456,1066,0826,2576,2566,3066,3326,3666,4066,4276,4226,573
1,9822,5252,9345,6855,8986,0356,1776,3696,4166,4846,5316,5696,6146,6766,6526,646
36373718171616161615151515151515
13121414141411111111111010101010
351359353274273265233223222218218218217217215214
6,2196,4766,5196,0065,9755,9385,9635,9625,9555,9615,9565,9445,9365,9325,9245,921
4 Beginning with Dec. 31, 1947, the all-bank series was revised as an-nounced in November 1947 by the Federal bank supervisory agencies.At that time a net of 115 noninsured nonmember commercial bankswith total loans and investments of about $110 million was added, and8 banks with total loans and investments of $34 million were transferredfrom noninsured mutual savings to nonmember commercial banks.
5 Less than $5 million. Because preliminary data are rounded to thenearest $10 million no amount is shown except on call dates.
6 Beginning with February 1960 reserve city banks with total loans andinvestments of $950 million and total deposits of $1,070 million werereclassified as country banks.
For other notes see preceding and opposite pages.
Digitized for FRASER Federal Reserve Bank of St. Louis

ALL BANKS 321
PRINCIPAL ASSETS AND LIABILITIES AND NUMBER OF ALL BANKS, BY CLASSES *—Continued
[Amounts in millions of dollars]
Class of bankand date
Loans and investments
Total LoansU.S .Govt.obliga-tions
Othersecu-rities
Cashassets 2
Totalassets—Totallia-
bilitiesand
capitalac-
counts 3
Deposits
Total 2
Interbank 2
De-mand Time
Other
Demand
U.S.Govt. Other
Time
Bor-row-ings
Totalcapital
ac-counts
Num-berof
banks
All insured commercial banks:1941—Dec. 311945—Dec. 311947—Dec. 311957—Dec. 311958—Dec. 311959—June 10
Dec. 311960—June 15
National member banks:1941—Dec. 311945__Dec. 311947—Dec. 311957—Dec. 311958—Dec. 311959—June 10
Dec. 31I960—June 15
State member banks:1941—Dec. 311945—Dec. 311947—Dec. 311957—Dec. 311958—Dec. 311959__june 10
Dec. 311960—June 15
Insured nonmembercommercial banks:
1941—Dec. 311945—Dec. 311947—Dec. 311957—Dec. 311958—Dec. 311959__jUne 10
Dec. 311960—June 15
Noninsured nonmembercommercial banks:
1941—Dec. 311945—Dec. 311947—Dec. 3H1957—Dec. 311958—Dec. 311959—June 10
Dec. 311960—June 15
All nonmember commercialbanks:
1941—Dec. 311945—Dec. 311947—Dec. 31*1957—Dec. 311958—Dec. 311959—June 10
Dec. 311960—June 15
Insured mutual savings banks:1941—Dec. 311945—Dec. 311947__Dec. 311957—Dec. 311958—Dec. 311959_jUne 10 ,
Dec. 311960—June 15
Noninsured mutual savingsbanks:
1941—Dec. 311945—Dec. 311947_Dec. 3141957—Dec. 311958—Dec. 311959_j u n e 10
Dec. 311960—June 15
49,29021,809[14,274168,59583,596[84,63288,790[88,691
27,57169,31265,28091,20199,27799,98202,615102,309
15,95037,87132,56651,15255,58855,30755,26455,348
5,77614,63916,44426,26828,75929,37130,93931,05"
1,452,2112,0091,4731,5681,5181,4801,446
7,23316,84918,45427,74130,32730,88932,41932,498
1,69310,84612,68326.53528,98030,15030,58031,133
8,6875,3615,9577,2467,3417,0716,9817,167
21,25925,76537,58393,43097,730102,902110,299114,785
11,72513,92521,42850,35052,62755,81659,96262,398
6,2958,85011,20030,60031,43532,61634,81735,946
3,2412,9924,95812,49313,68214,48415,53416,450
45531847446848450453452:
3,6963,3105,43212,96114,16514,98816,06816,97:
6423,0813,56017,19419,18020,10620,94221,721
4,2591,1981,3844,0224,1774,0434,1844,348
21,04688,91267,94157,58065,669 2061,396 2058,348 20
6,984 25,7887,131
17
34,2921,926,127,689
750 36585 48198 48334 42,623 231
76,820157,544152,733220,865236,724
54,366
12,03951,25038,67431,23435,71433,15231,76129,298
7,50027,08919,24015,84618,58517,07215,05214,228
1,50910,58410,03910,51211,38111,18311,54610,848
7611,6931,28066070763958954'
2,27012,27711,31811,17212,08811,82112,13411,395
6297,1608,1655,4045,2155,32--5,0164,743
3,0753,5223,8132,1482,0502,0251,848
19143 49;540 46,
242240,728
69,411147,775141,851199,876214,485
149,474
212,442
10,65413,883
876 206!828 218
12,61515,48915,65313,33815,50013,756
3,8064,137 20;5,178 22i9,617 26!
14,977
10,936
4390
024786 120
114
26,78111,014 23,83510,892 27,46410,614 26,380
433220182,153397255636,433
2,1551,9332,1254,7075,5685,6195,3965,174
1,0251,0631,4483,2643,6963,7043,8593,755
24120025534537737535837
1,2661,2621,7033,6084,0744,0794,2164,131
421606958
3,9374,5854,7214,6224,669
1,353641760
1,0761,1131,003949934
8,1459,73110,82215,96016,40714,02116,04515,495
2,6684,4484,0835,3835,5044,7705,6514,952
763514576301301271309299
3,4314,9624,6595,6845,!5,0415,9615,251
15142967571975!630686624
64:180211171169150143141
24,68848,08443,87968,67673,62071,01073,09072,734
8,70819,25620,69132,06634,73734,64237,13236,582
2,2832,7682,6431,8311,9271,8501,8581,815
10,99:22,02423,33433,89736,66436,49138,99038,397
1,95811,42413,49927,67130,18931,22831,74332,211
9,8465,5966,2157,4977,5897,2987,2007,387
39,45884,93982,023109,091116,714112,659119,638116,178
22,25944,73040,50561,54566,10262,15265,06963,341
7,70218,11919,34029,26631,69631,36533,79532,942
1,8722,4522,2511,4491,5321,4441,4291,386
9,57320,57121,59130,71533,22^32,81035,22434,328
1,78910,36312,20725,02227,27728,04128,57728,824
8,7445,0225,5566,6726.7636,4616,4056,511
541,2642,2092,0131,3581,324
1,76223,7401,3253,8594,241
41,298 15,69980,276 29,87692,975 34,882
2,766 122,744
127 56,137214 63,168
5,03765,288
130,720 65,8586,396 124,091 66,875
6,7869,229
8,3758,9589,0357,8188,9477,937
35517767705514472
3,7394,411
3,9786,1246,1925,1276,1025,429
15729
1,4201,285825833
262407426392451389
129244
1,08814,013
7952,1662,2921,5262,7423,594
6218,166381
1,3061,530880
1,7632,151
531,560149388419361533651
23,26245,47353,54166,546 3069,808 3466,433 3671,01567,270 36
8,32216,22419,278",904,812,177
36,421"',905
13,87424,16827,06839,00140,64038,23739,97438,296
4,0257,9869,06214,38616,32016,62216,40616,631
4,16210,63512,36617,580 1018,76618,07419,73218,525
3,3605,6806,5580,87312,06312,51613,05913,357
177147146143150163
329181
18512116312:83
12:
1,2911,905
439554572536601553
457425
1,392840890830873792
190138185144103141
5,50414,101167427428368545669
13,75818,42019,65518,90320,60519,318
253365478303325342311290
3,6136,0457,03611,17612,38712,85813,37013,648
12233232
1226 242827 282828 28
1,78910,35112,192
,99127,24328,01128,544'",791
8,7385,0205,5536,6716,7626,4606,4046,510
84413,42613,297
73413,39813,142
15413,101._,76213,086
602 19,20613,1072,573 19,97813,140
10215616667
2,762
6,8,6719,73417,05118,"18,
3,6404,6445,4099,0709,643
1,420 10,041~'"10,302
10,686340
1,491
113091810
1,266240
1,012
2,2462,9453,0555,4835,8175,8795,9626,143
9591,0831,2712,5002,6962,8462,9443,151
329279325317332338350353
1,2881,3621,5962,8173,0283,1833,2943,503
1641,0341,2522,3082,4732,6082,6542,735
1,077558637751746707705730
5,1175,0175,0054,6204,5784,5594,5424,542
1,5021,8671,9181,7731,7341,7211,6911,675
6,8106,4166,4786,7536,7936,8106,8786,926
852714783425399383366350
7,6627,1307,2617,1787,1927,1937,2447,276
52192194239241251268268
496350339283278267249247
For other notes see preceding two pages. NOTE.—For revisions in series prior to June 30, 1947, see the BULLETINfor July 1947, pp. 870-71.
Digitized for FRASER Federal Reserve Bank of St. Louis

322 COMMERCIAL BANKS
LOANS AND INVESTMENTS OF COMMERCIAL BANKS, BY CLASSES 1
[In millions of dollars]
Class ofcommercialbank andcall date
Totalloans 2and
invest-ments
Loans2
TotaP
Com-mer-cialin-
clud-ing
openmar-ketpa-per
Agri-cul-tur-al
Loans forpurchasingor carryingsecurities
Tobro-kersanddeal-ers
Toothers
Loansto
financialinstitutions
Tobanks
Toothers
Reales-tate
loans
Otherloans
toin-di-
vid-uals
Otherloans
Investments
U. S. Government obligations
Total BillsCer-tifi-
catesNotes Bonds
Obli-ga-
tionsof
Statesand
polit-icalsub-divi-sions
Othersecu-rities
Total: 31947—Dec. 31 . .1958—Dec. 31. . ,1959—Dec. 31*.1960—June 15..
Oct. 3«.
All insured:1941—Dec. 31. . .1945—Dec. 31 . .1947—Dec. 31 . .1958—Dec. 31 . .1959—Dec. 31*.1960—June 15..
Member, total:1941—Dec. 31 . .1945—Dec. 31 . .1947—Dec. 31 . .1958—Dec. 31 . .1959—Dec. 31*.1960—June 15..
Oct. 3 . .
New York City:*1941—Dec. 31 . .1945—Dec. 31 . .1947_Dec. 31 . .1958—Dec. 31 . .1959—Dec. 31*.1960—June 15..
Oct. 3 . .
Chicago:*1941 —Dec. 31..1945—Dec. 31..1947—Dec. 31..1958—Dec. 31..1959—Dec. 31*.1960—June 15..
Oct. 3..
Reserve city:1941—Dec. 31 . .1945_Dec. 31. .1947—Dec. 31 . .1958—Dec. 31 . .1959—Dec. 31*.1960—June 15..
Oct. 3 . .
Country:1941—Dec. 31 . .1945—Dec. 31 . .1947—Dec. 31 . .1958—Dec. 31 . .1959—Dec. 31*.1960—June 15..
Oct. 3 . .
Nonmember:3
1947_Dec. 31 . .1958—Dec. 31 . .1959—Dec. 31*.1960—June 15..
16,28485,16590,27090,13793,990
49,29021,809114,274183,596188,790188,691
43,521107,18397,846154,865157,879157,657160,865
12,89626,14320,39325,96625,29125,71'426,386
2,7605,9315,0886,8306,8856,7076,80"
15,34740,10836,04060,55861,62159,75061,144
12,51835,00236,32461,51164,08265,42766,533
18,45430,32732,41932,498
18,167 1,660. 4,973
110,832 40,174 5,0185,363",570
38,05798,214 40J425 4
115,307 41,775116.180 41,900 5
8302,8323,018
1,2201,8291,850
2,602 1,739
,214 121,25925,76537,58397,730 40i289 4
9,9,4618,012 1
2,730
614
,780
662,4501,314 3,164 3,606\ 6 1 0 823 1,190
,913 2,797 1,810110,299 40,022 4,973 2,982 1,827114,785 41,625 5,318 2,584 1,719
18,02122,77532,62884,06194,779: ,98,344 38,204 398,815
8,6718,949
16,9623 7 , ' "36,
972 594 598855 3,133 3,378
444 3826 3
38,246 3
4,0727,3347,179
16,16518,12118,35017,760
9541,3331,8013,6374,2064,3864,422
7,1058,514
13,44934,00338,68639,53439,820
5,8905,596
10,19930,25733,76636,07436,813
5,43214,16516,06816,972
2,8073,0445,361
10,92810,54910,49910,367
732760
1,4182,6282,5272,7162,797
3,4563,6617,088
15,80815,25215,77815,864
1,046",052,116,297,451
300205225669765805860
811 1,0652,730 1,5992,8852,4692,593
4122,453
5451,6521,7401,463',353
4821173266268187203
114427170518580511597
1,5871,4881,521
1691,172267382403366367
522338797124123123
1941,503484851776713738
1,6761,4843,0968,080
659648818
2,36881498 2,321
1 2,465".,567
9,219,218 2
1,2052,9813,3483,571
6141,9211,9022,066
204223
294298308440
20102133134
183471227268284286293
156230263251
115719819
2,3652,260
4049114713813
2,360
3947113710811
2,3092,212
322693503531
1,050849
7,7,0636,—
9,39325,*"-255 20
5,723,698
118 28J060 24,166~:5,523
770 28',640 26,040
947 69,22166,37658,93754,913•7,570
3,4372,7842,7472,720
2,1936,2945,300,593,720
7,1057,043
4,7734,6779,26625,148 2027,948 2428,240 25
4,.2,3615,654",589,032,387
5051,132914
3,4202,7672,728
21,04688,91257,94155,669"8,348i4,366
31,9004,662
17,02819,877
736 22,309 20,93221,333
3,4943,4557,130
20,01322,1856,801
6,7366,434 22J446
19,53978,33857,914
,21154,299,60346,813,55043,526
9882,455,124,159,1893,527
9716531,057839
3,2,2,2,52945^69 4^625
2,275,987
4,6444,6122,521
1,7881,8861,744
41715191235924935
611
242361
588581576
3,3693,1843,083
1,0561,0851,031
317327
12380111641936870815
223646161183183188
1,5271,4593,1478,4059,2519,0369,042
1,8231,8813,82710,80611,81612,22012,402
2,2665,2565,8886,053
287564
1,5021,7391,8211,827
51149357435396401
1855
1,9696,9308,2118,4308,570
522272238921833795830
954026
210148211179
7,2657,5741,9727,4865,0025,3846,354
1,4304,2132,8902,5621,9851,6641,778
311477,002643639681,380
25613313223210846129
508 6,467'29,552
35120,1961,30120,645
98017,29214,921
86415,993
387
7071,9798,2399,491
10,28610,535
1,0613,6714,2894,591
1,528 4,37726,99922,857
77923,606$22,53521,556" , 8 4 5
3592242277964365265621
2951,034
373,293,484464
,203
110630480
2,4752,3811,329',913
10911,318,088
12,13419711,395
134 1
2061,6511,6891,073
7,7897,3992,4202,2102,860
9,0717,5527,3622,4042,184
6,9855,8166,1431,8121,5832,223
3,433640
1,106227369508
1,467235361784249
6,03413,3964,856[5,22416,730
53,20539,28735,36033,88732,260
276 3,729505 4,070
3,5433,1273,000
5,6,6,9586,7897,240
789 3
3,1596,0455,9183,2404,729- , . _.5,090 33,566 16
16,89951,34252,34738,90835,027
3,3333,258
129 3,6213,9323,4222,994
3,6513,8735,1296,2666,721",545
3,0074,271 444,815 451,117 32
11,604 2811,959 273,,398 25
15,561',807,295,396,785
27,463--,724
199 3
2,8712,8153,105
405 3,1002,6102,3152,183
3,0903,254
13,13,67713,47313,897
1,6233,325558
1,6021,2771,5461,574
153749248522467480551
5,33110,3399,7724,1352,8592,7882,892
,022,864,274,446,332,096,048
729606638
1,8691,8331,7221,996
182181213491562564526
6,9822,3582,370645365670
5,1022,5832,306863807995
1,9731,255608627
7515,6531,9014,4974,1094,006 104,683
5,42115,88315,56312,48411,0540,0869,437
9561,1261,34"4,86-4,8304,6234,663
830629604446335319276
1932041851401339375
820916
1,053',047813672668
4814,5442,1084,4955,7515,9286,591
1,2192,2803,2543,265
3,78716,72217,68714,33013,54013,49312,347
7,9206,9016,5846,429
222 11,1,3422,0066,1816,4526,5656,712
1,0783,1023,2833,31"
,0281,0671,2621,4671,3301,2321,164
625971934814
* Estimated.* For a discussion of revision in loan schedule, see the BULLETIN for
January 1960, p. 12.* All commercial banks in the United States. These figures exclude
data for banks in U. S. possessions except for member banks. During1941 three mutual savings banks became members of the Federal Reserve
System; these banks (two beginning June 1960) are included in memberbanks but are not included in all insured or total banks. Compar abilityof figures for classes of banks is affected somewhat by changes in F ederalReserve membership, insurance status, and the reserve classificati ons ofcities and individual banks, and by mergers, etc.
For other notes see opposite page.
Digitized for FRASER Federal Reserve Bank of St. Louis

COMMERCIAL BANKS 323
RESERVES AND LIABILITIES OF COMMERCIAL BANKS, BY CLASSES 1
[In millions of dollars]
Class ofcommercialbank andcall date
Total: 31947_Dec. 3 1 . . . .1958—Dec. 3 1 . . . .1959—Dec. 3 1 . . . .I960—June 15. . . .
Oct. 3 e...
All insured:1941—Dec. 3 1 . . . .1945_Dec. 3 1 . . . .1947_Dec. 3 1 . . . .1958—Dec. 3 1 . . . .1959—Dec. 3 1 . . . .I960—June 15. . . .
Member, total:1941—Dec. 3 1 . . . .1945—Dec. 3 1 . . . .1947_Dec. 3 1 . . . .1958—Dec. 3 1 . . . .1959—Dec. 3 1 . . . .I960—June 15. . . .
Oct. 3 . . . .
New York City:*1941—Dec 3 1 . . . .1945—Dec. 3 1 . . . .1947_Dec. 3 1 . . . .1958—Dec. 3 1 . . . .1959—Dec. 3 1 . . . .I960—June 15. . . .
Oct. 3 . . . .
Chicago:*1941_Dec. 311945—Dec. 311947_Dec. 311958—Dec. 3 1 . . . .1959—Dec. 3 1 . . . .I960—June 15. . . .
Oct. 3 . . . .
Reserve city:1941—Dec. 3 1 . . . .1945—Dec. 3 1 . . . .1947_Dec. 3 1 . . . .1958—Dec. 3 1 . . . .1959—Dec. 3 1 . . . .1960—June 15. . . .
Oct. 3 . . . .
Country:1941_Dec. 3 1 . . . .1945—Dec. 3 1 . . . .1947_Dec. 3 1 . . . .1958—Dec. 3 1 . . . .1959—Dec. 3 1 . . . .I960—June 15. . . .
Oct. 3 . . . .
Nonmember:3
1947_Dec. 311958—Dec. 311959—Dec. 31I960—June 15
p .
serveswith
FederalRe-serveBanks
17,79618,42717,93117,91717,550
12,39615,81017,79618,42717,93117,917
12,39615,81117,79718,42817,93217,91817,552
5,1054,0154,6394,4543,9084,0544,031
1,021942
1,0701,058
920995
1,074
4,0606,3267,0957,4727,5327,4827,148
2,2104,5274,9935,4445,5735,3885,300
Cash
vault
2,2163,2493,0123,2523,010
1,3581,8292,1453,2272,9903,232
1,0871,4381,6722,4412,2222,4272,249
93111151161151144144
43363036332830
425494562768681740684
526796929
1,4761,3571,5151,391
544808790826
Bal-anceswithdo-
mesticbanks s
10,21612,60912,23710,99911,530
8,57011,0759,736
12,35311,96910,737
6,2467,1176,2707,9777,5326,9137,275
141787092
1388778
298200175185142109117
2,5902,1742,1252,6702,3812,2292,130
3,2164,6653,9005,0304,8704,4884,950
3 9474,6334 7064,087
De-mand
de-posits
ad-justed 6
87,123115,518115,420110,025109,190
37,84574,72285,751
114,645114,563109,249
33,75464,18473,52896,21895,27491,04290,046
10 76115,06516,65316,17015,49415,33214,332
2,2153,1533 7374,2714,1713,6783,834
11,11722,37225,71435,50535,09532,87332,519
9,66123,59527,42440,27240,51439,15939,361
13,59519,30020 14618,983
Demand deposits
Interbankdeposits
Do-mestic 5
11,36214,14213,94412,48413,200
9,82312,56611,23614,02513,82512,356
9,71412,33310,97813,61413,38911,98012,648
3 5953,5353,2363,5193,4623,1493,509
1,0271,2921 1961,3141,1871,1931,200
4,3026,3075,4977,2177,1626,3546,540
7901,1991,0491,5651,5781,2851,399
385528555504
For-eign
1,4301,6571,7051,4361,490
6731,2481,3791,6291,6751,400
6711,2431,3751,6131,6591,3871,434
6071,1051,2171,2671,3031,0601,108
8202143434039
54110131289288272268
287
13241418
55434649
U.S.Govt.
1,3434,2505,0506,4147,310
1,76223,740
1,3254,2415,0376,396
1,70922,1791,1763,8224,5045,7456,715
8666,940
267968
1,0271,1401,947
1271,552
72249272335530
4918,221
4051,4291,6982,3192,512
2255,465
4321,1751,5081,9511,725
167428545669
Statesand
politicalsubdi-visions
6,79910,92811,45910,75311,040
3,6775,0986,692
10,84111,37210,648
3,0664,2405,5048,6038,9158,3048,563
319237290329310294307
233237285302329283366
1,1441,7632,2823,1533,3042,8032,904
1,3702,0042,6474,8194,9724,9234,986
1,2952,3252 5442,449
Certi-fiedandoffi-cers'
checks,etc.
2,5814,0433,9103,7013,880
1,0772,5852,5594,0013,8663,655
1,0092,4502,4013,7123,5423,3663,544
4501,3381,1051,5401,5361,8492,052
34666388
10585
104
286611705
1,0521,043
801796
239435528
1,032857631593
180331369335
Indi-viduals,partner-ships,
and cor-pora-tions
84,987115,132116,225110,429108,850
36,54472,59383,723
114,372115,482109,788
33,06162,95072,70498,13398,53293,89692,147
11 28215,71217,64618,83518,57317,75416,867
2,1523,1603 8534,7464,6364,3014,026
11,12722,28126,00338,05438,32136,15635,240
8,50021,79725,20336,49837,00335,68636,014
12,28416,99917 69216,533
Inter-bank
2402,3721,4411,4461,690
1587054
2,2091,3581,324
1406450
2,1871,3381,3051,547
61712
1,739988992
1,140
34234359
1043022
377303245314
30171736242634
190185103141
Time deposits
U. S.Govtand
PostalSav-ings
111327285259260
59103111327285259
5099
105300259234237
101236242425
27844
203845
124958081
315245
132132127127
6272625
States
polit-ical
subdi-visions
8663,5763,1663,6164,000
492496826
3,5123,0953,555
418399693
2,8292,3832,7683,117
292014
1006595
157
97
1287
243160332
1,4711,2291,3751,485
146219337
1,2501,0771,2901,467
172747783848
Indi-viduals,partner-ships,
and cor-pora-tions
34,38359,59062,71863,29065,610
15,14629,27733,94659,32962,47863,061
11,87823,71227,54248,00450,18550,53452,328
7781,2061,4183,3453,3593,3603,536
476719902
1,4231,4491,4011,458
4,5429,563
11,04519,48020,23119,48420,209
6,08212,22414,17723,75525,14626,28927,125
6,85811,61312 56012,775
Bor-
ings
6573
6152,5901,910
10215
6167
6022,573
4208
5454
5812,5031,829
19530
232980749
340
33381
21
14238870697
411233771
320302
12203487
Capi-talac-
counts
10,05918,48619,55620,33120,870
6,8448,6719,734
18,15419,20619,978
5,8867,5898,464
15,46016,26416,82917,268
1 6482,1202,2593,2823,3613,4303,493
288377426733762765786
1,9672,5662,8445,7606,1066,1816,343
1,9822,5252,9345,6856,0356,4536,645
1,5963,0273 2943,504
2 Beginning with June 30, 1948, figures for various loan items areshown gross (i.e., before deduction of valuation reserves); they do notadd to the total and are not entirely comparable with prior figures. Totalloans continue to be shown net.
3 Breakdowns of loan, investment, and deposit classifications are notavailable prior to 1947; summary figures for earlier dates appear in thepreceding table.
* Central reserve city banks.5 Beginning with June 30, 1942, excludes reciprocal bank balances,
which on Dec. 31,1942, aggregated $513 million at all member banks and$525 million at all insured commercial banks.
6 Demand deposits other than interbank and U. S. Govt., less cash itemsreported as in process of collection.
For other notes see opposite page.
Digitized for FRASER Federal Reserve Bank of St. Louis

324 WEEKLY REPORTING MEMBER BANKS
ASSETS AND LIABILITIES OF BANKS IN LEADING CITIES
[In millions of dollars]
Wednesday
Totalloansand
invest-ments 1
Loansand
invest-ments
ad-justed2
Loans
Loansad-
justed2
Com-mer-cialand
indus-trial
Agri-cul-tural
For purchasingor carrying securities
To brokersand dealers
U.S.Govt.
ob-liga-tions
Otherse-
curi-ties
To others
U.S.Govt.
ob-liga-tions
Otherse-
curi-ties
Financial institutions
Banks
For-eign
Do-mes-tic
com-mer-cial
Nonbankinstitutions
Per-sonalandsales
fi-nancecom-paniesetc.
Other
Realestate
Allotherloans
Valua-tionre-
serves
Total-Leading Cities
1960
Feb. 3101724
1961
Jan. 4111825
Feb. 18
15
22
New York City
1960
Feb. 3101724
1961
Jan. 4111825
Feb. 18
1522
OutsideNew York City
1960
Feb. 3101724
1961
Jan. 4111825
Feb. 18
1522
103,273102,931103,013102,759
112,555110,482110,128108,917
110,961109,831111,270110,435
24,56524,47724,57624,526
27,76526,93226,80826,548
27,06426,57527,29126,848
78,70878,45478,43778,233
84,79083,55083,32082,369
83,89783,25683,97983,587
102,177101,699101,597101,375
110,362109,068108,781108,417
109,651108,630109,786109,213
24,05323,79723,84823,859
26,98026,47426,34126,190
26,69626,24126,73026,393
78,12477,90277,74977,516
83,38282,59482,44082,227
82,95582,38983,05682,820
66,03665,91866,18966,210
70,08668,79668,41767,628
68,79268,11068,65168,497
17,07316,90117,00017,059
17,91217,37417,17616,905
17,30916,91017,15917,033
48,96349,01749,18949,151
52,17451,42251,24150,723
51,48351,20051,49f51,464
29,94130,04730,26230,162
31,79331,65331,45031,150
31,06731,04531,28931,248
10,28510,30010,38210,333
10,70110,66510,59410,490
10,47210,41410,49110,469
19,65619,74719,88019,829
21,09220,98820,85620,660
20,59520,63120,79820,779
901903897899
,094,097,084,082
,0861,0891,083
891893887
1,0851,0881,0751,073
1,0791,0761,0791,075
355312247296
1,119618759579
856417611585
201174112172
435250234213
501213320269
154138135124
684368525366
355204291316
1,5831,4921,4661,515
1,7241,5421,4401,385
1,4121,3391,3701,411
1,019905867878
1,073949851822
835779800835
564587599637
651593589563
577560570576
157149141146
129127126123
117117124127
125117110116
10010110199
93939699
1,1491,1511,1451,145
1,1721,1681,1581,163
1,1681,1591,1671,166
341339337336
353352350349
344347348349
812808809
819816808814
824812819817
753769764761
738706701694
697696697671
471480479487
477461460452
452452450420
282289285274
261245241242
245244247251
1,0961,2321,4161,384
2,1931,4141,347500
1,3101,2011,4841,222
512680728667
785458467358
368334561455
584552688717
1,408956880142
94286'92376
3,7753,7053,8133,832
4,1693,9093,8343,611
3,5733,5023,5253,494
1,1641,1311,2141,253
1,3641,2211,2331,128
1,1281,1021,1391,111
2,6112,5742,5992,579
2,8052,6882,6012,483
2,4452,4002,3862,383
,741,728,727,725
,685,671,629,619
1,6051,5771,5821,574
394397401403
318313311305
298286285280
1,3471,3311,3261,322
1,3671,3581,3181,314
1,3071,2911,2971,294
12,61512,61012,64512,637
12,50312,49312,49212,482
12,46912,44212,45812,463
939933948942
787792792785
784773781785
11,67611,67711,69711,695
11,71611,70111,70011,697
11,68511,66911,67711,678
14,50714,49414,52614,537
15,48215,33715,27215,269
16,27616,26416,27416,211
2,6292,6122,6312,627
2,7862,7562,7382,749
2,8862,9342,9312,904
11,87811,88211,89511,910
12,69612,58112,53412,520
13,39013,33013,34313,307
1,4411,4421,4441,445
1,5221,5251,5281,529
1,5361,5341,5351,536
412412412412
420420421421
424424424425
1,0291,0301,0321,033
1,1021,1051,1071,108
1,1121,1101,1111,111
1 After deduction of valuation reserves.2 Exclusive of loans to domestic commercial banks and after deduction
of valuation reserves; individual loan items are shown gross.
Digitized for FRASER Federal Reserve Bank of St. Louis

WEEKLY REPORTING MEMBER BANKS 325
ASSETS AND LIABILITIES OF BANKS IN LEADING COTES— Continued
[In millions of dollars]
Wednesday
Total—Leading Cities
1960
Feb. 3101724
1961
Jan. 4111825
Feb 18
1522
New York City
1960
Feb 3101724
1961
Jan. 4111825
Feb 18
1522
OutsideNew York City
1960
Feb. 3101724
1961
Jan. 4111825
Feb 18
1522 . . . .
Investments
U. S. Government obligations
Total
26,44426,11725,71325,525
30,23830,15430,27030,631
30,71230,26030,74730,310
4,8414,7584,6474,635
6,7876,7896,8566,916
7,0006,8927,0636,812
21,60321,35921,06620,890
23,45123,36523,41423,715
23,71223,36823,68423,498
Bills
2,0011,7531,6301,572
4,0183,8764,1014,423
4,4634,1073,8903,667
659597558584
1,3241,2271,3501,405
1,4701,3761,3611,278
1,3421,1561,072
988
2,6942,6492,7513,018
2,9932,7312,5292,389
Cer-tifi-
cates
1,2031,188
490475
1,5691,5721,5151,572
1,5941,5811,1591,080
280282
99108
574628552553
584572446392
923906391367
995944963
1,019
1,0101,009
713688
Notes and bondsmaturing:
With-in
1 year
1,7181,7021,6441,596
2,5972,5972,6002,641
2,6862,7073,8963,942
125145152153
442446441451
464471734724
1,5931,5571,4921,443
2,1552,1512,1592,190
2,2222,2363,1623,218
l t o5 years
15,03214,98116,82216,926
18,01618,08018,04518,031
18,02017,93817,91617,771
2,5422,5012,9362,918
3,6223,6573,6853,682
3,6583,6473,7123,629
12,49012,48013,88614,008
14,39414 42314,36014,349
14,36214,29114,20414,142
After5 years
6,4906,4935,1274,956
4,0384,0294,0093,964
3,9493,9273,8863,850
1,2351,233
902872
825831828825
824826810789
5,2555,2604,2254,084
3,2133,1983,1813,139
3,1253,1013,0763,061
Othersecu-rities
9,6979,6649,6959,640
10,03810,11810 09410,158
10,14710,26010,38810,406
2,1392,1382,2012,165
2,2812,3112,3092,369
2,3872,4392,5082,548
7,5587,5267,4947,475
7,7577 8077,7857,789
7,7607,8217,8807,858
Cash assets, excluding cash items in processof collection
Total
17,02516 89817,07016,745
17,43516,64116 78317,205
16,41216,79616 94416,700
4,0474 1153,9723,823
4,1383,5893,7413 970
3,8703,9813 8623,804
12,97812,78313,09812,922
13,29713 05213,04213 235
12,54212,81513,08212,896
Bal-anceswith
domes-tic
banks
2,6482,6442,7832,752
3,2993,0182 9123,473
2,8822,6293,0652,944
56566958
60636762
65476754
2,5922,5882,7142,694
3,2392,9552,8453,411
2,8172,5822,9982,890
Bal-anceswithfor-eign
banks
96909084
124109104123
110110122122
42403934
70555265
54446061
54505150
54545258
56666261
Currencyandcoin
1,1401 2121,1651,260
1,4081,4591 3801,358
1,2661,2791,3241,372
155174153162
233226209200
194193201193
9851,0381,0121,098
1,1751,2331,1711,158
1,0721,0861,1231,179
Re-serveswithF. R.Banks
13,14112 95213,03212,649
12,60412,05512 38712,251
12,15412,77812,43312,262
3,7943,8453,7113,569
3,7753,2453,4133,643
3,5573,6973,5343,496
9,3479,1079,3219,080
8,8298,8108,9748,608
8,5979,0818,8998,766
Allotherassets
3,4843 5443,4423,427
3,9534,0113 9203,965
4,0583,9873,9643,864
1,3911,4581,4361,423
1,6661,7661,6551,654
1,6491,6541 6781,622
2,0932,0862,0062,004
2,2872 2452,2652,311
2,4092,3332,2862,242
Totalassets—
totalliabili-
tiesand
capitalaccounts
134,250133 093134,935133,752
147,037143,118142 723140,489
143,554140,550146 224142,108
33,35233,17733,67033,609
37,81036,25736,20735,730
37,17635,54038,02636,028
100,89899,916
101,265100,143
109,227106,861106,516104,759
106,378105,010108,198106,080
Digitized for FRASER Federal Reserve Bank of St. Louis
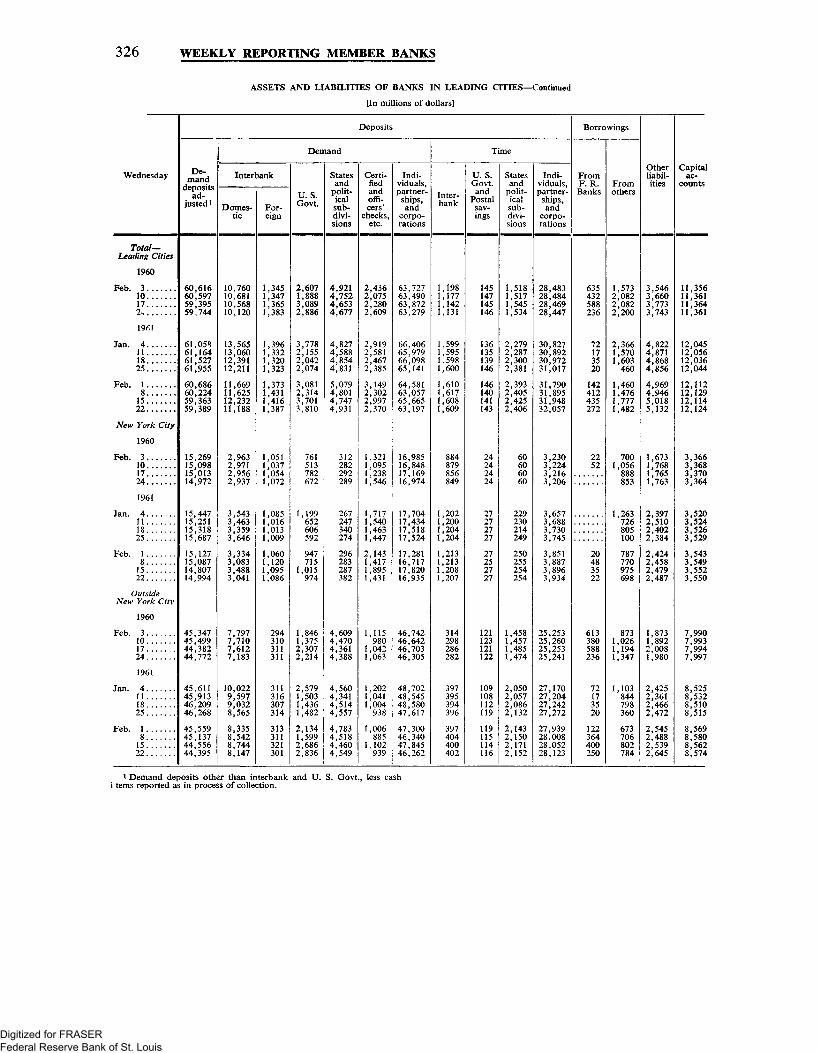
326 WEEKLY REPORTING MEMBER BANKS
ASSETS AND LIABILITIES OF BANKS IN LEADING CITIES—Continued
[In millions of dollars]
Wednesday
Deposits
De-mand
depositsad-
justed 1
Demand
Interbank
Domes-tic
For-eign
U.S.Govt.
Statesand
polit-icalsub-divi-sions
Certi-fiedandoffi-cers'
checks,etc.
Indi-viduals,partner-
ships,and
corpo-rations
Time
Inter-bank
U. S.Govt.and
Postalsav-ings
Statesand
polit-icalsub-divi-sions
Indi-viduals,partner-
ships,and
corpo-rations
Borrowings
FromF. R.Banks
Fromothers
Otherliabil-ities
Capitalac-
counts
Total-Leading Cities
1960
Feb. 310172 .
1961
Jan. 4111825
Feb. 18
15
22
New York City
1960
Feb. 31017241961
Jan. 4111825
Feb. 18
1522
OutsideNew York City
1960
Feb. 3101724
1961
Jan. 4111825
Feb. 18
1522
60,61660,59759,39559.744
61.05861,16461,52761,955
60,68660,22459,36359,389
15,26915,09815,01314,972
15,44715,25115,31815,687
15,12715,08714,80714,994
45,34745,49944,38244,772
45,61145,91346,20946,268
45,55945,13744,55644,395
10,76010,68110,56810,120
13,56513,06012,39112,211
11,66911,62512,23211,188
2,9632,9712,9562,937
3,5433,4633,3593,646
3,3343,0833,4883,041
7,7977,7107,6127,183
10,0229,5979,0328,565
8,3358,5428,7448,147
1,3451,3471,3651,383
1,3961,3321,3201,323
1,3731,4311,4161,387
1,0511,0371,0541,072
1,0851,0161,0131,009
1,0601,1201,0951,086
294310311311
311316307314
313311321301
2,6071,8883,0892,886
3,7782,1552,0422,074
3,0812,3143,7013,810
761513782672
1,199652606592
947715
1,015974
1,8461,3752,3072,214
2,5791,5031,4361,482
2,1341,5992,6862,836
4,9214,7524,6534,677
4,8274,5884,8544,831
5,0794,8014,7474,931
312282292289
267247340274
296283287382
4,6094,4704,3614,388
4,5604,3414,5144,557
4,7834,5184,4604,549
2,4362,0752,2802,609
2,9192,5812,4672,385
3,1492,3022,9972,370
,321,095,238,546
,717,540,463,447
2,1431,4171,8951,431
1,115980
1,0421,063
1,2021,0411,004938
1,006885
1,102939
63,72763,49063,87263,279
66,40665,97966,09865,141
64,58163,05765,66563,197
16,98516,84817,16916,974
17,70417,43417,51817,524
17,28116,71717,82016,935
46,74246,64246,70346,305
48,70248,54548,58047,617
47,30046,34047,84546,262
1,198,177,142,131
,599,595,598,600
,610,617,608,609
884879856849
,202,200,204,204
,213,213,208,207
314298286282
397395394396
397404400402
145147145146
136135139146
146140141143
27272727
27252727
121123121122
109108112119
119115114116
1,5181,5171,5451,534
2,2792,2872,3002,381
2,3932,4052,4252,406
229230214249
250255254254
1,4581,4571,4851,474
2,0502,0572,0862,132
2,1432,1502,1712,152
28,48328,48428,46928,447
30,82730,89230,97231,017
31,79031,89531,94832,057
3,2303,2243,2163,206
3,6573,6883,7303,745
3,8513,8873,8963,934
25,25325,26025,25325,241
27,17027,20427,24227,272
27,93928,00828,05228,123
635432588236
72173520
142412435272
2252
20483522
613380588236
72173520
122364400250
1,5732,0822,0822,200
2,3661,5701,603460
1,4601,4761,7771,482
7001,056888853
1,263726805100
787770975698
8731,0261,1941,347
1,103844798360
673706802784
3,5463,6603,7733,743
4,8224,8714,8684,856
4,9694,9465,0185,132
1,6731,7681,7651,763
2,3972,5102,4022,384
2,4242,4582,4792,487
1,8731,8922,0081,980
2,4252,3612,4662,472
2,5452,4882,5392,645
11,35611,36111,36411,361
12,04512,05612,03612,044
12,11212,12912,11412,124
3,3663,3683,3703,364
3,5203,5243,5263,529
3,5433,5493,5523,550
7,9907,9937,9947,997
8,5258,5328,5108,515
8,5698,5808,5628,574
i Demand deposits other than interbank and U. S. Govt., less cashi terns reported as in process of collection.
Digitized for FRASER Federal Reserve Bank of St. Louis

BUSINESS LOANS OF BANKS 327
CHANGES IN COMMERCIAL AND INDUSTRIAL LOANS OF WEEKLY REPORTING MEMBER BANKS, BY INDUSTRY 1
[Net decline, ( —). In millions of dollars]
Period2
Manufacturing and mining
Food,liquor,
andtobacco
Textiles,apparel,
andleather
Metalsand
metalprod-ucts3
Petro-leum,coal,
chemical,and
rubber
Other
Trade(whole-
saleand
retail)
Com-moditydealers
Publicutilities
(incl.trans-porta-tion)
Con-struc-tion
Allothertypes
ofbusiness
Netchangesclassi-
fied
Comm'landind'l
change—all
weeklyreport-
ingbanks
1959—July 8-Dec.
I960—Jan.-June...July-Dec...,
I960—Dec
1961—Jan..Feb..
Week ending:
1960—Dec. 7.14.21.28.
1961— Jan. 4.11.18.25.
Feb. 1.8.
15.22.
698
-558579
57
-222- 1 2
4069
- 5 2
- 1 4- 7 6- 5 7- 7 6
7- 4 6
32- 5
- 5 8
273-215
- 4 2
- 2 9116
- 6c
- 1 7- 1 4
3- 8
- 1 6- 2
21333824
- 1 4 8
1,062-665
-180126
-552585
- 4 6
-113T
- 4 7- 1 7
453
6017
248
-5258
97
88- 3 6
- 3 0175259
504911
- 2 2
- 1 8- 1 3
8- 1 3
26
354- 2 9
15
- 7 542
- 1 384
15
- 3 8- 4
- 2 1- 1 2
5- 32714
151
372- 2 8
-267
-244- 1 6
- 1 9- 2 2- 4 1
-184
- 5 5- 5 4- 7 8
- 5 9101221
738
-677507
49
- 2 542
- 1191913
- 2 1- 1 2
35
168
35- 1 7
480
- 4 861
118
- 3 2-119
- 7 137
11834
63- 4 3- 1 1- 4 1
- 3 7- 3 4
8- 5 7
9635
14
-18-12
221
-112
~7_ 4
- 6- 1
- 751
- 1 1
- 3 1
155310
69
475
6547
- 3 6
35- 624
- 6
- 1 6
1414
2,114
977615
120
-690134
-200205324
-209
-105-162-173-250
- 4 3- 4 5236
- 1 4
1,861
1,178299
182
-78198
199233348200
-138-140-203-300
- 8 3- 2 2244
- 4 1
* Data for a sample of about 200 banks reporting changes in theirlarger loans; these banks hold about 95 per cent of total commercialand industrial loans of all weekly reporting member banks and about
70 per cent of those of all commercial banks.2 Figures for periods other than weekly are based on weekly changes.3 Includes machinery and transportation equipment.
BANK RATES ON SHORT-TERM BUSINESS LOANS'
[Weighted averages. Per cent per annum]
Areaand
period
Annual averages,19 large cities:
1952195319541955
19561957195819591960
Quarterly:2
19 large cities:
1959—Dec. 31960—Mar
JuneSeptDec
Allloans
3.53.73.63.7
4.24.64.35.05.2
5.365.345.354.974.99
Size of loan(thousands of dollars)
1-10
4.95.05.05.0
5.25.55.55.86.0
5.996.016.005.945.90
10-100
4.24.44.34.4
4.85.15.05.55.7
5.745.755.765.585.56
100-200
3.73.93.94.0
4.44.84.65.25.4
5.545.505.535.215.21
200and over
3.33.53.43.5
4.04.54.14.95.0
5.245.215.224.784.82
Areaand
period
Quarterly (cont.): 2New York City:
1959—Dec. 3I960—Mar
JuneSeptDec
7 Northern andEastern cities:
1959—Dec. 3I960—Mar
JuneSeptDec
11 Southern andWestern cities:
1959—Dec. 31960—Mar
JuneSeptDec
Allloans
5.195.185.194.744.77
5.395.345.344.964.97
5.565.575.585.325.33
Size of loan(thousands of dollars)
10
5.825.815.815.735.73
5.955.955.945.905.86
6.086.126.106.046.00
10-100
5.615.635,645.455.42
5.775.735.725.545.52
5.815.835.845.685.65
100-200
5.415.415.425.004.99
5.505.475.525,215.19
5.645.575.615.345.36
200and over
5.125.105.104.624.66
5.305.245,244.814.83
5.385.405.415.105.12
1 For description see the BULLETIN for March 1949, pp. 228-37.2 Based on new loans and renewals for first 15 days of month.3 Coverage of Survey revised in accordance with changes in the loan
schedule of the call report of condition to exclude loans to nonbankfinancial institutions.
NOTE.—Bank prime rate was 3 per cent Jan. 1, 1952-Apr. 26, 1953.Changes thereafter occurred on the following dates (new levels shown, inper cent): 1953—Apr. 27, 3V4; 1954—Mar. 17, 3; 1955—Aug. 4, 3V4;Oct. 14, 3i/2; 1956—Apr. 13, 3V4; Aug. 21, 4; 1957—Aug. 6, 4%; 1958—Jan. 22, 4; Apr. 21, 31/i; Sept. 11,4; 1959—May 18, 4%; Sept. 1, 5; andI960—Aug. 23, 414.
Digitized for FRASER Federal Reserve Bank of St. Louis

328 INTEREST RATES
MONEY MARKET RATES
[Per cent per annum]
Year, month, or week
1958 average1959 averageI960 average .
I960—FebMarAprMayJune .JulyAugSeptOctNovDec
1961—JanFeb
Week ending:1961 Jan 28
Feb 4111825 . .
Primecom-
mercialpaper,4- to 6-months l
2.463.973.85
4.664.494.164.253.813.393.343.393.303.283.23
2.983.03
2.902 933.003.003.09
Financecompany
paperplaced
directly,3- to 6-
months 2
2.123.823.54
4.504.163.743.883.242 982.943.133 112.912.97
2.782.65
2.712 642.632.632.66
Primebankers'accept-ances,
90 days 3
2.043.493.51
4.443.963.883.783.283.133.043.003 003.002.92
2.862.78
2.882 752.752.752.81
L
3-month bills
Rateon new
issue
1.8393.4052.928
3.9543.4393.2443.3922.6412 3962.2862.4892.4262.3842.272
2.3022.408
2.2302 2992.3742.4622.496
Marketyield
K783.372.87
3.963.313.233.292.462.302.302.482.302.372.25
2.242.42
2.172.292.352.402.51
F. S. Government Securities (taxable)4
6-month bills
Rateon new
issue
3.8323.247
4.3213.6933.5483.6842.9092.8262.5742.8032.8452.6502.530
2.4962.601
2.4222.4972.5662.6522.688
Marketyield
3.793.20
4.303.613.553.582.742.712.592.832.732.662.50
2.472.60
2.422 492.552.592.68
9- to 12-month issues
Bills(marketyield)
3.41
4.453.683.834.013.103.032.822.862.922.872.64
2.632.75
2.662.682.712.732.83
Others
2.094.113.55
4.583.933.994.193.353.132.892.993.012.992.79
2.702.84
2.652.722.762.872.93
3- to 5-year
issues 6
2.904.333.99
4.664.244.234.424.063.713.503.503.613.683.51
3.533.54
3.573.573.563.563.48
1 Average of daily offering rates of dealers.2 Average of daily rates, published by finance companies, for varying
maturities in the 90-179 day range.3 Average of daily prevailing rates.
4 Except for new bill issues, yields are averages computed from dailyclosing bid prices.
5 Consists of certificates of indebtedness and selected note and bondissues.
6 Consists of selected note and bond issues.
BOND AND STOCK YIELDS i
[Per cent per annum]
Year, month, or week
Number of issues. . . .
1958 average1959 average1960 average
1960 FebMarAprMayJuneJulyAueSeptOctNovDec
1961—JanFeb
Week ending:1961 Jan 28 . .
Feb 4111825
Government bonds
UnitedStates(long-term)2
4-9
3.434.074.01
4.224 084.174 163.993.863.793.823.913 933.88
3.893.81
3.893 883.843.81i-76
Stateand local3
Total4
20
3.363.743.69
3.843.773.723.753.743.733.573.553.643.573.53
3.563.54
3.563 563.533.533.51
A a a
5
2.923.353.26
3.403.343.303.343.333.313.103.093.203.143.12
3.153.14
3.163.163.143.143.12
Baa
5
3.954.244.22
4.354.294.244.314.274.264.154.094.164.094.03
4 064.06
4.094 094.054.054.05
Total4
120
4.164.654.73
4.884.814.764.804.784.744.614.584.634.644.66
4.654.59
4.654.634.614.604.58
Corporate bonds-
By selectedratings
A a a
30
3.794.384.41
4.564.494.454.464.454.414.284.254.304.314.35
4.324.27
4.314.304.284.274.25
Baa
30
4.735.055.19
5.345.255.205.285.265.225.085.015.115.085.10
5.105.07
5.125.105.075.075.06
Bygroups
Indus-trial
40
3.984.514.59
4.714.644.614.654.644.614.494.464.504.514.55
4.524.46
4.514.494.474.444.43
Rail-road
40
4.394.754.92
5.054.994.974.984.944.904.824.784.844.854.87
4.864.82
4.874.854.824.834.83
Publicutility
40
4.104.704.69
4.894.794.704.764.764.714 534.484.564 564.58
4.574.51
4.564.554.534.514.48
Stocks 5
Dividend/price ratio
Pre-ferred
14
4 454.694.75
4.824 764.714 754.744.704 614.694.754 784 84
4 734.68
4.724 704 684.674.65
Com-mon
500
3 973.233.46
3.403 513.473 513.403.493 433.553.603 513.41
1 283.13
3.223 143.133.143.12
Earnings/price ratio
Com-mon
500
6.025.92
6.51
5.83
5.70
1 Monthly and weekly yields are averages of daily figures for U. S.Govt. and corporate bonds. Yields of State and local govt. bonds arebased on Thursday figures; dividend/price ratios for preferred andcommon stocks, on Wednesday figures. Earnings /price ratios for commonstock are as of end of period.
2 Series is based on bonds maturing or callable in 10 years or more.3 Moody's Investors Service. State and local govt. bonds include gen-
eral obligations only.
4 Includes bonds rated Aa and A .data for which are not shown sepa-rately. Because of a limited number of suitable issues, the number ofcorporate bonds in some groups has varied somewhat.
5 Standard and Poor's Corporation. Preferred stock ratio is basedon 8 median yields for a sample of noncallable issues—12 industrial and2 public utility. For common stocks, the ratios are based on the 500stocks in the price index. Quarterly earnings are seasonally adjustedat annual rates.
Digitized for FRASER Federal Reserve Bank of St. Louis

SECURITY MARKETS 329
SECURITY PRICES i
Year, month,or week
Bond prices
U.S .Govt.(long-term) 2
Mu-nicipal(high-grade) 3
!
Cor-po-rate
(high-grade) 3
Common stock prices
Standard and Poor's index(1941-43= 10)
TotalIn-
dus-trial
Rail-road
Pub-lic
util-ity
Securities and Exchange Commission index(1957-59= 100)
Total
Manufacturing
TotalDu-rable
Non-du-
rable
Trans-porta-
tion
Pub-lic-util-ity
Trade,fi-
nance,andserv-ice
Min-ing
Vol-umeof
trad-ing4
(inthou-sands
ofshares)
Number of issues
1958 average.1959 average1960 average . . .
I960—FebMarAprMayJuneJulyAugSeptOctNovDec
1961—JanFeb
Week ending:1961—Jan. 28
Feb. 4111825
94.0285.4986.22
83.6085.3284.2484.3986.5088.1288.9388.5787.5087.2387.84
87.7088.74
87.6687.8988.3888.7389.44
15
106.4100.7103.9
100.4101.9102.3102.2103.1103.9106.7106.7105.9107.7108.0
108.1109.7
108.7108.7109.4110.0110.7
17
102.995.094.7
92.893.994.294.194.294.896.496.896.095.595.1
95.696.3
95.896.196.396.496.5
500
46.2457.3855.85
55.7855.0255.7355.2257.2655.8456.5154.8153.7355.4756.80
59.7362.17
60.6362.0361.8361.7762.53
425
49.3661.4559.43
59.6058.7159.4658.8461.0659.2559.9657.9656.9058.8960.22
63.2065.71
64.2165.6365.3565.2766.07
25
27.0535.0930.31
32.5431.0130.5930.1830.8130.1930.1928.7627.7728.9329.03
31.4332.17
31.6431.9031.7132.0732.63
50
37.2244.1546.86
44.3844.6045.5345.7547.3548.0248.6548.6447.3447.8349.78
52.7355.64
53.3055.1655.3955.3956.00
300
93.2116.7113.9
114.1112.1113.5113.2117.0114.5115.6112.1109.1112.6115.2
120.9125.4
123.6125.5124.0125.4126.7
193
92.5116.5110.9
112.8109.9111.0110.7114.6111.2112.2107.6104.9108.5110.3
115.3119.2
117.5119.8117.8119.0120.4
108
90.4120.8117.3
119.115.8118.3118.7123.4119.0119.8114.1109.4113.0114.5
118.6121.4
120.1122.2119.1121.2123.0
85
94.4112.6104.9
107.0104.5104.3103.3106.6104.0105.1101.7100.8104.5106.4
112.1117.3
1 1 5 .
117.6116.7117.0118.0
18
91.0115.695.8
103.097.496.595.897.195.796.191.588.091.792.6
100.3102.6
100.6102.2101.3103.5103.5
34
95.8117.6129.3
122.3124.0127.1126.4129.8131.0132.6134.2130.5132.0138.5
148.7156.0
154.4155.2154.8156.2157.7
45
95.1122.3127.4
121.9122.2125.3125.8132.131.0131.8127.2122.8129.3132.4
134.8139.8
136.9137.0138.1141.3143.0
10
97.995.073.8
78.575.773.470.970.368.671.670.171.874.178.2
85.189.0
87.289.788.689.788.2
2,9653,2423,042
3,0272,8572,8653,2773,4792,6942,8412,8982,5923,1003,684
4,2434,884
4,3804,8794,6544,6045,174
1 Monthly and weekly data for (1) U. S. Govt. bond prices, Standardand Poor's common stock indexes, and volume of trading are averagesof daily figures; (2) municipal and corporate bond prices are based onWednesday closing prices; and (3) the Securities and Exchange Commis-sion series on common stock prices are based on weekly closing prices.
2 Prices derived from average market yields in preceding table on basisof an assumed 3 per cent, 20-year bond.
3 Prices derived from average yields, as computed by Standard andPoor's Corporation, on basis of a 4 per cent, 20-year bond.
4 Average daily volume of trading in stocks on the New York StockExchange for a 5l/2 -hour trading day.
STOCK MARKET CREDIT
[In millions of dollars]
End of month ]
Customer credit
T o t a l -securities
other thanU. S. Govt.obligations(col. 3 +
col. 5)
Net debit balances withNew York Stock Exchange
firms 2
Secured byU. S. Govt.obligations
Secured byother
securities
Bank loans to others (thanbrokers and dealers) for pur-
chasing and carrying securities3
U. S. Govt.obligations
Othersecurities
Broker and dealer credit2
Money borrowed
OnU. S. Govt.obligations
Onother
seeuritie;
Customers'netfree
creditbalances
1957—Dec..1958—Dec.1959—Dec.
I960—Feb.Mar.Apr..May.June.July.Aug.,Sept.Oct..Nov.Dec .
1961—Jan..Feb..
3,5764,5374,454
4,2744,1584,1534,1324,2144,1334,2434,2824,2944,2944,406
4,4164,524
68146150
1381171131301061101111221119995
7768
2,4823,2853,280
3,1293,0283,0373,0213,0823,0043,1093,1373,1333,1413,222
3,2533,358
6063164
146136135139135135140147136128134
123127
,094,252,174
,145,130,116,111,132,129,134,145,161,153,184
,163,166
125234221
202161185208162187173177161139142
10194
1,7062,0712,362
2,1942,0592,1552,1152,1102,0422,0632,1432,1392,1292,133
1,9371,905
8961,159
996
981988940970
1,0161,0181,0211,0591,0631,0621,135
1,2691,392
1 Data for cols. 4-7 are for last Wednesday of month.2 Ledger balances of member firms of the New York Stock Exchange
carrying margin accounts, as reported to the Exchange. Customers' debitand free credit balances exclude balances maintained with the reportingfirm by other member firms of national securities exchanges and balancesof the reporting firm and of general partners of the reporting firm. Bal-ances are net for each customer—i.e., all accounts of one customer areconsolidated. Money borrowed includes borrowings from banks andfrom other lenders except member firms of national securities exchanges.
3 Figures are for weekly reporting member banks. Prior to July 1959,loans for purchasing or carrying U. S. Government securities were re-ported separately only by New York and Chicago banks. Accordingly,for that period col. 5 includes any loans for purchasing or carrying suchsecurities at other reporting banks. Composition of series also changebeginning with July 1959; revised data for the new reporting series (butnot for the breakdown of loans by purpose) are available back throughJuly 1958 and have been incorporated.
Digitized for FRASER Federal Reserve Bank of St. Louis

330 OPEN MARKET PAPER; SAVINGS INSTITUTIONS
COMMERCIAL AND FINANCE COMPANY PAPER AND BANKERS' ACCEPTANCES OUTSTANDING
[In millions of dollars]
End of yearor month
19551956195719581959
I960—JanFebMarAprMayJuneJulyAugSen t . . .OctNovDec
1961_Jan
Commercial and financecompany paper
Total
2,0202,1662,666
32,7443,118
3,8894,0854,3204,2694,4924,4594,6524,9204,5585,0565,0974,312
4,949
Placedthroughdealers *
510506551840627
664718805888920
1,0211,1161,2661,2631,3651,3801,252
1,404
Placeddirect-
ly(financepaper)2
1,5101,6602,115
3 1,9042,491
3,2253,3673,5153,3813,5723,4383,5363,6543,2953,6913,7173,060
3,545
Dollar acceptances
Trxtut
642967
1,3071,1941,151
1,2291,2401,3661,3361,2631,3821,5611,6561,6681,7531,8682,027
2,029
Held by:
Accepting banks
To-tal
175227287302319
230218250320310311404424392501628662
725
Ownbills
126155194238282
193170178247237229299316284356454490
514
Billsbought
4972946436
364872737482
104108108145175173
210
F. R.Banks
Ownacct.
2869664975
423533302930293342394874
46
For-eigncorr.
3350766882
124119153167161182180204204196227230
197
Others
405621878775675
833868929819763859948996
1,0311,017
9651,060
1,061
Based on:
Im-portsinto
UnitedStates
252261278254357
341350364373352375400407409405401403
400
Ex-portsfrom
UnitedStates
210329456349309
337336413461474501545594632633647669
677
Dollarex-
change
172
468374
1491932011288794
166179123139146122
118
Goods stored in orshipped between
points in:
UnitedStates
63227296244162
15813114410965917683
107157229308
299
Foreigncountries
100148232263249
245229244266286321373393398419445524
535
1 As reported by dealers; includes finance company paper as well asother commercial paper sold in the open market.
* As reported by finance companies that place their paper directly withinvestors.
3 Beginning with November 1958, series revised to include all paperwith maturity of 270 days and over. Figures on old basis for Decemberwere (in millions of dollars): Total 2,731; place directly, 1891.
MUTUAL SAVINGS BANKS
[Data from National Association of Mutual Savings Banks unless otherwise noted. Amounts in millions of dollars]
End of yearor month
19411945
195319541955195619571958195931960
I960—JanFebMarAprMayJuneJuly,Aug. „SentOctNovDec . . .
Loans
Mort-gage
4,7874,202
12,79214,84517,27919,55920,97123,03824,76926,702
24,92825,04425 19425,32325,48425,65325,81226 01826,21426,38226,55326,702
Other
8962
165188211248253320358416
333372412386446396435449435417425416
Securities
U. S.Govt.
3,59210,650
9,1918,7558,4647,9827,5837,2706,8716,243
6,8626,8516 8836,7356,6556,5626,5146,5446,5126,3566,2886,243
Stateandlocalgovt.
1 •;
Corpo-rateand
other i
861,257
428608646675685729721672
715706709722699695691686687681676672
3,3113,5483,3663,5494,3444,9714,8455,076
4,8334,8244 8764,8574,8704,9274,9654,9574,9894 9855,0195,076
Cashassets
829606
9821 026
966920889921829874
698735776690732840771765787779788874
Otherassets
689185
330380414448490535552589
565569570575578569572564592585590589
Totalassets—
Totalliabili-
tiesand
surplusaccts.
11,77216,962
27,19929 35031,34633,38135,21537,78438,94540,571
38,93439,10139 42039,28839,46439,64239,76039,98340,21640 18540,33940,571
Deposits
10,50315,332
24,38826,35128,18230,02631,68334,03134,97736,343
34,90934,95935 27935,18435,24235,46335,48435,58935,86735 92335,96236,343
Otherliabili-
ties
3848
203261310369427526606678
660742722713799720795878806740810678
Surplusac-
counts
1,2311,582
2,6082,7382,8542,9863,1053,2273,3623,550
3,3653,4003,4193,3913,4233,4593,4813,5163,5433,5223,5673,550
Mortgage loancommitments2
Number
n.a.n.a.
n.a.n.a.n.a.n.a.n.a.
89,91265,24858,350
62,28555,77555,02857,91654,36452,63853,27656,01358,78260,39660,42058,350
Amount
n.a.n.a.
n.a.n.a.n.a.n.a.n.a.1,6641,1701,200
1,0991,0291,0081.0591,042,028
1,031,090
1,1641,205,242
1,200
n.a. Not available.1 Includes securities of foreign governments and international organiza-
tions and obligations of Federal agencies not guaranteed by the U. S.Government, as well as corporate securities.
2 Not a balance-sheet item. Data represent commitments outstandingof banks in New York State as reported to the Savings Banks Associationof the State of New York.
3 Data reflect consolidation of a large mutual savings bank with a com-mercial bank.
NOTE.—These data differ somewhat from those shown elsewhere inthe BULLETIN; the latter are for call dates and are based on reports filedwith Federal and State bank supervisory agencies. Loans are shownnet of valuation reserves.
Digitized for FRASER Federal Reserve Bank of St. Louis

SAYINGS INSTITUTIONS 331
LIFE INSURANCE COMPANIES 1
[Institute of Life Insurance data. In millions of dollars]
Date Total
Government securities
Total UnitedStates
State andlocal
(U.S.)Foreign2
Business securities
Total Bonds Stocks
Mort-gages
Realestate
Policyloans
Otherassets
End of year:3
19411945
1953195419551956195719581959
End of month:*1957—Dec...1958—Dec...1959—Dec.r.
I960—Jan...Feb.. .Mar...Apr...May..June..July..Aug...Sept...Oct. . .Nov...Dec...
32,73144,797
78,53384,48690,43296,011
101,309107,580113,650
101,309107,580113,650
114,202114,666114,965115,394115,908116,377117,005117,581117,947118,544119,066119,717
9,47822,545
12,53712,26211,82911,06710,69011,23411,581
10,69111,24211,599
11,73111,75511,63811,58311,55411,46811,65411,65011,75011,72911,78811,729
6,79620,583
9,8299,0708,5767,5557,0297,1836,868
7,0287,1826,858
7,0116,9756,8086,7236,6616,5596,6326,5926,5866,5246,5476,444
1,995722
1,2981,8462,0382,2732,3762,6813,200
2,3772.6913,221
3,1973,2223,2573,2783,3043,3173,4213,4643,5463,5793,6053,622
6871,240
1,4101,3461,2151,2391,285',370,513
,286,369,520
,523,558,573,582,589,592,601,595,618,626,636,663
10,17411,059
34,43837,30039,54541,54344,05747,10849,666
43,75046,42048,840
49,04749,17049,29849,45049,72549,88050,05150,26150,29950,61050,81151,010
9,57310,060
31,86534,03235,91238,04040,66642,99945,105
40,73743,04445,157
45,33045,43545,57645,70845,94046,09246,22346,38046,41446,66946,83146,956
601999
2,5733,2683,6333,5033,3914,1094,561
3,0133,3763,683
3,7173,7353,7223,7423,7853,7883,8283,8813,8853,9413,9804,054
6,4426,636
23,32225,97629,44532,98935,23637,06239,197
35,27137.09239,237
39,57339,76940,01140,23640,43940,63140,69440,92041,09941,31341,52141,798
1,878857
2,0202,2982,5812,8173,1193,3643,651
3,1203,3873,678
3,6883,6983,7123,7213,7663,7863,8093,8223,8283,8343,8513,804
2,9191,962
2,9143,1273,2903,5193,8694,1884,618
3,8724.1864,620
4,6514,7094,7744,8384,8974,9575,0295,0855,1385,1825,2255,267
1,8401,738
3,3023,5233,7434,0764,3384,6244,937
4,6055,2535,676
5,5125,5655,5325,5665,5275,6585,7685,8425,8335,8765,8706,109
r Revised.1 Figures are for all life insurance companies in the United States.2 Represents issues of foreign governments and their subdivisions
and bonds of the International Bank for Reconstruction and Develop-ment.
3 These represent annual statement asset values, with bonds carried onan amortized basis and stocks at end-of-year market value.
4 These represent book value of ledger assets. Adjustments for interestdue and accrued and for differences between market and book valuesare not made on each item separately, but are included in total, in "Otherassets."
SAVINGS AND LOAN ASSOCIATIONS i
[Federal Savings and Loan Insurance Corporation data. In millions of dollars]
End of yearor montk
19411945
1953195419551956195719581959rI960
1959 r—Dec
I960 »•—JanFebMarAprMay. . . .J u n e . . . .JulyAugSeptOctNovDec
Mort-gages2
4,5785,376
21 96226,10831 40835,72940,00745,62753,19460,084
53,194
53,51053,90854,45555,02055,65556,43557,05057,76358,40659,01159,51260,084
Assets
U. S.Govt.
obliga-tions
1072,420
1 9202,0132 3382,7823 1733,8194,4774,586
4,477
4,6734,7384,7164,7144,7354,5924,5594,5324,5334,5534,5894,586
Cash
344450
1,4791,9712,0632,1192,1462,5852,1832,715
2,183
1,8821,8481,8971,8701,9502,2792,0432,0732,0972,2012,2872,715
Other 3
775356
1 2971,4691,7892,1992,7703,1083,6764,104
3,676
3,5573,6223,7153,8214,0243,9663,8393,8413,9043,9894,1424,104
T * 1lotal
assets—2
Totalliabilities
6,0498,747
26 73331,63337 65642,87548 13855,13963,53071,489
63,530
63,62264,11664,78365,42566,36467,27267,49168,20968,94069,75470,53071,489
Savingscapital
4,6827,365
22 84627\25232,14237,14841,91247,97654,58362,154
54,583
55,05155,46056,08356,45557,08558,30158,45058,93959,54160,20860,76662,154
ReservesI W O v l V Wi9
andundivided
profits
475644
1 9012,1872 5572,9503 3633.8454,3934,982
4,393
4,4034,4124,4204,4244,4304,6434,6364,6374,6404,6404,6494,982
Liabilities
Borrowedmoney4
256336
1,027950
I 546,347,379,444
I TS7l\X9\
2,387
1,9251,8111,685[,7221,7271,938[,8111,8331,8821.8681J9192,191
Loans inprocess
(
Other
36402
9591,2441 4111,4301 4R4
,161,293,183
,293
,193,181,225,271,325,372,367,353,313,280
1,2091,183
713874979
874
1,0501,2521,370[,5531,797[,0181,2271,4471,5641,7581,987
979
JVL ongageloan
commit-ments 5
n.a.n.a.
n.a.n.a.833843862
,475,285,360
,285
,316,378,482,560,642,614,647,635,559,509,451,360
n.a. Not available. r Revised.1 Figures are for all savings and loan associations in the United States.
Data beginning with 1951 are based on monthly reports of insuredassociations and annual reports of noninsured associations. Data priorto 1951 are based entirely on annual reports.
2 Prior to 1958 mortgages are net of mortgage pledged shares. Assetitems will not add to total assets which include gross mortgages withno deductions for mortgage pledged shares. Beginning with January1958, no deduction is made for mortgage pledged shares. These have
declined consistently in recent years and amounted to $42 million at theend of 1957.
3 Includes other loans, stock in the Federal home loan banks and otherinvestments, real estate owned and sold on contract, and office buildingsand fixtures.
4 Consists of FHLB advances and other borrowing.5 Not a balance-sheet item.NOTE.—Data for 1960 are preliminary.
Digitized for FRASER Federal Reserve Bank of St. Louis

332 BUSINESS FINANCE
CORPORATE PROFITS, TAXES, AND DIVIDENDS
[Department of Commerce estimates. In billionsof dollars]
NET CHANGE IN OUTSTANDING CORPORATE SECURITIES1
[Securities and Exchange Commission estimates. In millions of dollars]
Year orquarter
1952...1953...1954...1955...1956...1957...1958...1959...
1958—3
1959—1234
1960—123
Profitsbeforetaxes
36.738.334.144.944.743.237.747.0
38.844.9
46.451.745.344.8
48.845.741.5
In-cometaxes
19.520.217.221.821.220.918.623.2
19.122.1
22.925.522.322.1
23.822.320.3
Profitsaftertaxes
17.218.116.823.023.522.319.123.8
19.622.723.526.222.922.7
25.023.421.3
Cashdivi-dends
9.09.29.8
11.212.112.612.413.4
12.612.0
13.013.213.613.8
13.913.914.0
Undis-tributedprofits
8.38.97.0
11.811.39.76.7
10.5
7.010.8
10.512.99.3
11.09.57.3
Year orquarter
19521953 . . . .195419551956195719581959 . . .
1959—34
1960—123
All types
Newissues
10,6799,550
11,69412,47413,20114,35014,76112,751
2,7883,499
2,9503,1013,293
Retire-ments
2,7512,4295,6295,5995,0383,6095,2964,607
1,1261,051
1,2111,1631,215
Netchange
7,9277,1216,0656,8758,162
10,7419,4658,144
1,6632,448
1,7391,9372,077
Bonds and notes
Newissues
7,3446,6517,8327,5717,9349,6389,6737,150
1,6472,093
1,6081,8082,055
Retire-ments
2,4031,8964,0333,3833,2032,5843,8172,891
681687
728717849
Netchange
4,9404,7553,7994,1884,7317,0535,8564,259
9671,406
8801,0901,206
Stocks
Newissues
3,3352,8983,8624,9035,2674,7125,0885,601
1,1411,405
1,3411,2931,238
Retire-ments
348533
1,5962,2161,8361,0241,4791,716
445363
482446366
Netchange
2,9872,3662,2652,6873,4323,6883,6093,886
6961.042
859847872
NOTE.—Quarterly data are at seasonally adjustedannual rates.
1 Reflects cash transactions only. As contrasted with data shown on p. 334 new issuesexclude foreign and include offerings of open-end investment companies, sales of securitiesheld by affiliated companies or RFC, special offerings to employees, and also new stockissues and cash proceeds connected with conversions of bonds into stocks. Retirementsinclude the same types of issues, and also securities retired with internal funds or withproceeds of issues for that purpose shown on p. 334
CURRENT ASSETS AND LIABILITIES OF CORPORATIONS i
[Securities and Exchange Commission estimates. In billions of dollars]
End of yearor quarter
19521953 . .19541955195619571958
1959—34 .
1960—123
Networkingcapital
90.191.894.9
103.0107.4111.6119.7
126.9128.8
130.7131.2132.5
Current assets
Total
186.2190.6194.6224.0237.9244.7246.4
262.1268.3
270.2271.5273.9
Cash
30.831.133.434.634.834.937.3
35.537.2
33.834.535.0
U.S.Govt.securi-
ties
19.921.519.223.519.118.619.6
22.923.5
23.421.720.3
Notes and accts.receivable
U.S.Govt. 2
2.82.62.42.32.62.82.8
2.72.9
2.92.92.9
Other
64.665.971.286.695.199.4
102.1
110.6112.7
113.6115.6118.2
Inven-tories
65.867.265.372.880.482.277.5
82.183.6
87.287.487.8
Other
2.42.43.14.25.96.77.0
8.48.3
9.49.59.6
Current liabilities
Total
96.198.999.7
121.0130.5133.1126.7
135.2139.5
139.6140.3141.4
Notes and accts.payable
U. S.Govt. 2
2.32.22.42.32.42.31.7
1.71.7
1.81.81.8
Other
57.057.359.373.881.584.381.0
85.889.4
89.891.091.3
Federalincome
taxlia-
bilities
18.118.715.519.317 615.413.0
14.415.4
14.013.0.3.4
Other
18.720.722.525.729 031.131.0
33.332.9
34.034.634.9
1 Excludes banks and insurance companies. 2 Receivables from, and payables to, the U. S. Government excludeamounts offset against each other on corporations' books.
BUSINESS EXPENDITURES ON NEW PLANT AND EQUIPMENT i
[Department of Commerce and Securities and Exchange Commission estimates. In billions of dollars]
Year
19531954195519561957195819591960196H
Total
28.326.828.735.137.030.532.535.734.6
Manu-factur-
ing
11.911.011.415.016.011.412.114.514.1
Min-ing
.0
.0
.02
.'.2.9
1.01.01.0
Transportation
Rail-road
1.3.9.9
1.21.4
.8
.91.0
.6
Other
.6
.5
.6
.7
.8
.5>.O
.91.9
Publicutili-ties
4 . 64 . 24 . 34 .96 .26.15.75.76.2
Com-muni-cations
1.71.72 02.73.02.6
1:110
Other 2
6.36.57.58.47.47.28.28.4
.8
Quarter
1959-4
1960—1234
1961—1 4 r24
Total
9.0
7.99.39.09.5
7.78.7
Manu-factur-
ingandmin-ing
3.8
3.34.03.94.3
3.23.8
Trans-porta-tion
.8
.7
.8
.7
.7
.6
.7
Publicutili-ties
.5
.2
.4
.5
.6
.2
.5
Allother 3
2.9
2.73.02.93.0
2.72.7
Total(season-ally ad-justedannualrate)
33.6
35.236.335.935.5
34.433.8
r Revised.1 Corporate and noncorporate business, excluding agriculture.2 Includes trade, service, finance, and construction.
3 Includes communications and other.4 Anticipated by business.
Digitized for FRASER Federal Reserve Bank of St. Louis

BUSINESS FINANCE 333
SALES, PROFITS, AND DIVIDENDS OF LARGE CORPORATIONS
[In millions of dollars]
Industry
Manufacturing
Total (180 corps.):SalesProfits before taxesProfits after taxesDividends
Nondurable goods industries (79 corps.):1
SalesProfits before taxesProfits after taxesDividends . • .
Durable goods industries (101 corps.):2
SalesProfits before taxes . . . . . . . .Profits after taxesDividends
Selected industries:Foods and kindred products (25 corps.):
Sales . .
Profits after taxesDividends
Chemicals and allied products (21 corps.):SalesProfits before taxesProfits after taxesDividends . . . .
Petroleum refining (16 corps.):SalesProfits before taxes . . . . .Profits after taxesDividends
Primary metals and products (35 corps.):SalesProfits before taxesProfits after taxes . . . . . . .
Machinery (25 corps.):Sales
Profits after taxesDividends
Automobiles and equipment (14 corps.):SalesProfits before taxesProfits after taxesDividends . .
Public Utility
Railroad:Operating revenueProfits before taxesProfits after taxesDividends
Electric Power:Operating revenue .Profits before taxesProfits after taxes . .Dividends
Telephone:Operating revenue .Profits before taxesProfits after taxes . •
Annual totals
1955
104,40214 8037,5643,847
36,8585,0132,8141,588
67,5449,7904,7502,259
8,632868414260
9 5841,866
955690
11,5151,344
979438
20,7443,2671,652
730
12,4801,253
637368
24,6244,0111,841
872
10,1061,341
927448
8 3602,3041 244
942
5,4251,282
638496
1956
107,71713 4187,0944,068
39,4635,1462,9431,683
68,2548,2724,1512,385
9 394955460211
10 1991,804
942698
12,4541,4441,068
481
22,3653,3311,727
880
13,9081,209
607403
21,2172,4731,186
791
10,5511,268
876462
9 0492,4621 3261,022
5,9661,430
715552
1957
114,22913,3497,1774,192
41,7405,0102,9441,776
72,5258,3394,2332,416
9,9871,024
497289
10 6691,823
948737
13,4631,3251,075
512
22,4682,9771,540
873
15,1151,457
729416
23,4532,7011,354
805
10,4911,058
737438
9 6702,5791 4131,069
6,4671,562
788613
1958
105,13410,4665,7144,078
41,5414,4022,5741,785
63,5936,0653,1402,294
10,7071,152
555312
10,3901,538
829111
12,838919791516
19,2262,1821,154
802
14,6851,463
734422
18,4691,332
706758
9,565843602419
10,1952,7041,5191,134
6,9391,860
921674
1959
115,87414,0137,2594,361
45,7185,6063,1311,916
70,1568,4074,1282,445
11,9371,275
604343
11,5932,1331,107
799
13,4131,194
913523
20,9782,3291,127
831
16,4721,854
933461
20,5932,9871,470
810
9,826848578403
11,1022,9881,6691,213
7,5722,1531,073
743
Quarterly totals
1959
1
29,5553,8992,0161,033
11,0851,376
769459
18,4702,5231,247
575
2,78628713685
2,770493254180
3,447360263133
5,621821416201
3,853422212113
6,2591,012
491184
2,38816799
116
2,928853469303
1,825522258178
2
32,4524,6432,4991,029
11,4501,482
808445
21,0013,1611,692
585
2,94732215378
3,054595302177
3,228300220128
7,1101,183
695204
4,189504254106
6,5851,117
570196
2,633310207
82
2,644682385302
1,891551272183
3
26,8722,4401,0991,051
11,4141,391
780448
15,4581,049
319603
2,98634016279
2,964550282179
3,281259215128
3,644- 8 8
-215204
4,100462231123
4,624356155197
2,3681278678
2,685713392301
1,909537268190
4
26,9953 0321,6451,247
11,7691,356
775564
15,2261,675
870683
3 218326154100
2 804495269264
3,458274215134
4,603413231221
4,331466237119
3,124503254233
2,437243186127
2 845739422306
1,947543275192
1960
1
31 5734 0022 0631,092
11 5991,407
785482
19 9742,5951 277
610
2 82130314292
3 057537276191
3,427307238130
6 003854426206
4,000389197121
7 0221,076
521199
2,4111659991
3 172901502325
1,967558277196
2
30 9243 5441 '8131,099
11 6631,421
797486
19 2602,1231 016
612
2 92833815988
3 146'534281186
3,282292226130
5,442611322208
4,171395202119
6 516936457199
2,47721213994
2 841739422321
2,025585290200
3
28 1102 7091 4791,102
11 6241,401
793480
16 4871,309
686622
2 925340160100
3 096492258186
3,387352265128
4,939413225210
4,015366186120
4 502273152207
2,3221046573
2,856757418322
2,042589294203
1 Includes 17 companies in groups not shown separately.2 Includes 27 companies in groups not shown separately.NOTE.—Manufacturing corporations. Data are obtained primarily
from published company reports.Railroads. Figures are for Class I line-haul railroads (which account
for 95 per cent of all railroad operations) and are obtained from reportsof the Interstate Commerce Commission.
Electric Power. Figures are for Class A and B electric utilities (whichaccount for about 95 per cent of all electric power operations) and areobtained from reports of the Federal Power Commission, except thatquarterly figures on operating revenue and profits before taxes are partlyestimated by the Federal Reserve to include affiliated nonelectric opera-tions.
Telephone. Revenues and profits are for telephone operations of the
Bell System Consolidated (including the 20 operating subsidiaries andthe Long Lines and General departments of American Telephone andTelegraph Company) and for two affiliated telephone companies, whichtogether represent about 85 per cent of all telephone operations. Divi-dends are for the 20 operating subsidiaries and the two affiliates. Dataare obtained from the Federal Communications Commission.
All series. Profits before taxes refer to income after all charges andbefore Federal income taxes and dividends. For detailed description ofseries (but not for figures), see pp. 662-66 of the BULLETIN for June 1949(manufacturing); pp. 215-17 of the BULLETIN for March 1942 (publicutilities); and p. 908 of the BULLETIN for September 1944 (electric power).For back data for manufacturing, see pp. 792-93 of the BULLETIN forJuly 1959; back data for other series are available from the Division ofResearch and Statistics.
Digitized for FRASER Federal Reserve Bank of St. Louis

334 SECURITY ISSUES
NEW SECURITY ISSUES 1
[Securities and Exchange Commission estimates. In millions of dollars]
Year ormonth
1953195419551956195719581959I960
1959—Dec
I960—Jan . .FebMarApr .MayJuneJuly. .AugSeptOct .NovDec
Gross proceeds, all issuers2
Total
28,82429,76526,77222,40530,57134,44331,07427,576
1,942
1,9582,1272,0774,5791,9512,4931,6263,1771,822
1,7991,9851,981
Year ormonth
1953195419551956195719581959I960
1959 Dec
I960 JanFebMarAprMayJuneJulyAugSeot .OctNovDec
Noncorporate
U.S.Govt. 3
13,95712 5329,6285,5179,601
12,06312,3227 906
380
420435391
2,860368350353
1,371338345326348
Fed-eral
agen-cy4
106458746169572
2,321707
1,672
86
182150150148354
199
160149181
Stateandmu-nici-pal
5,5586,9695,9775,4466,9587,4497,6817,230
476
696622568717556978475607682343496490
Manufacturing
Newcapital8
2,1282,0442,3973,3364,1043,2651,9412,052
164
6864
18517193
252183224163
191'252205
Retire-ment of
secu-rities
9019053324349
1957073
3
541232113
'5'2719
Others
306289182334557
1,052616609
75
111817443784928134038'647
Corporate
Total
8,8989,516
10,24010,93912,88411,5589,748
10,159
926
649740894811595
1,115770987761
'9131,009
915
Bonds
Total
77789978
,083,488,420,002,957,653,1901??
747
524554675584404859648816612
'783'876786
Pub-licly
offered
3,8564,0034,1194,2256,1186,3323,5574,817
277
323253361347185540415600329
'623518323
Pri-vatelyplaced
3,2283,4843,3013,7773,8393,3203,6323,305
470
201302314237219319234216283
160'357463
Pre-ferredstock
489816635636411571531393
45
262946313826213457251645
Proposed uses of net proceeds, major grou]
Commercial andmiscellaneous
Newcapital8
502831769682579867812798
61
64101122466949395047
'65'7967
Retire-ment of
secu-rities
4093515129132837
25
619
' 622
Transportation
Newcapital8
553501544694802778942659
60
572171568033489252
'28'3486
Retire-ment of
secu-rities
r
362703382014381540
1
1
1
35(9)
1(9)
1
Com-monstock
1,3261,2132,1852,3012,5161,3342,0271,644
134
10015617319615322910113792
105117
85
Proposed use of net proceedsall corporate issuers6
Total
8,7559 365
10,04910,74912 66111,3729,5279 936
907
635724875789577
1,085753968746
'896'989900
)s of corporate is
Public utility
Newcapital8
?
22
3
3
,905,675,254,474,821,605,189,738
346
155245198302144362127222302
183r317182
Retire-ment of
secu-rities
679901741451
1381550
2(9)18(9)
15
10
New capital
Total
8,4957,4908,821
10,38412,44710,8239,3929,655
900
577715860766567
1,034727962738
'874'959876
Newmoney7
7,9606 7807,9579,663
11 7849,9078.5788 905
844
550667803681519985652919692
'815'809815
Otherpur-poses
535709864721663915814750
56
274857864850754346
'59150
61
suers
Communication
Newcapital8
871651
1,0451 3841,4411,294
7071,023
72
36816952376457
16189
253'2797
Retire-ment of
secu-rities
36077214
118(9)
1
1
Re-tire-ment
ofsecu-rities
2601,8751,227
364214549135282
7
589
152311512668
'22'3024
Real estateand financial
Newcapital8
1 536788
1,8121 8151,7011 0141,8012 384
198
196203215139143275274212
84154'249240
Retire-ment of
secu-rities
24273
56176747
681
2
51
62
9243
1'13
' Revised.1 Estimates of new issues maturing in more than one year sold for cash
in the United States.2 Gross proceeds are derived by multiplying principal amounts or num-
ber of units by offering price.3 Includes guaranteed issues.4 Issues not guaranteed.5 Represents foreign governments, International Bank for Reconstruc-
tion and Development, and domestic eleemosynary and other nonprofitorganizations.
6 Estimated net proceeds are equal to estimated gross proceeds less costof flotation, i.e., compensation to underwriters, agents, etc, and expenses.
7 Represents proceeds for plant and equipment and working capital.8 Represents all issues other than those for retirement of securities.9 Less than $500,000.
Digitized for FRASER Federal Reserve Bank of St. Louis
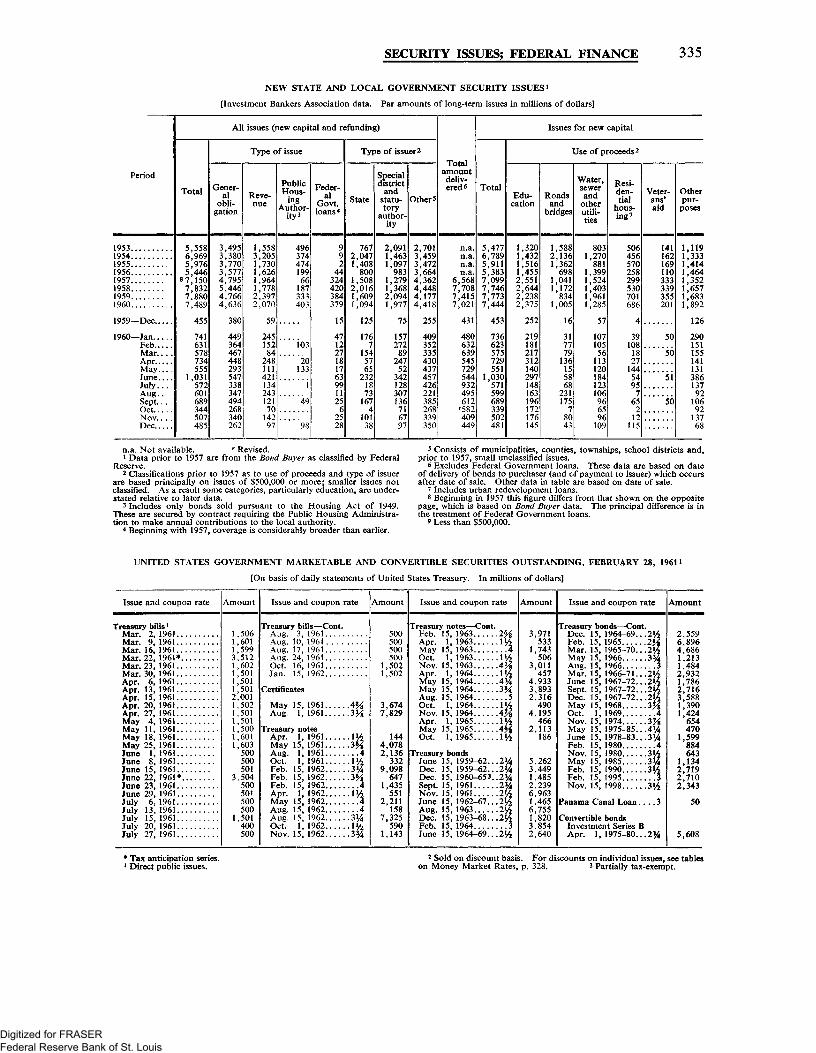
SECURITY ISSUES; FEDERAL FINANCE 335
NEW STATE AND LOCAL GOVERNMENT SECURITY ISSUES 1
[Investment Bankers Association data. Par amounts of long-term issues in millions of dollars]
Period
1953 . . . .195419551956 . . .1957195819591960
1959—Dec.
I960—Jan..Feb..Mar.Apr..May.June.July.Aug.Sept.. . .OctNov.. .Dec
All issues (new capital and refunding)
Total
5,5586 9695,9765,446
«7 1507,8327.8807,489
455
741631578734555
1,03157260 i689344507485
Type of issue
Gener-al
obli-gation
3,4953,3803,7703,5774,7955,4464,7664,636
380
449364467448293547338347494268340262
Reve-nue
1,5583,2051,7301,6261,9641,7782,3972,070
59
24515284
24811142113424312170
14297
PublicHous-
ingAuthor-
ity 3
49637447419966
187333403
103
20133
i49
98
Feder-al
Govt.loans4
992
44324420384379
15
4712271817639911256
2*>28
Type of issuer 2
State
7672,0471,408
8001,5082,0161,6091,094
125
1767
1545765
2321873
1674
10138
Specialdistrict
andstatu-tory
author-ity
2,0911,4631,097
9831,2791,3682,0941,977
75
157272
8924752
342128307136716797
Others
2,7013,4593,4723,6644,3624,4484,1774,418
255
409352335430437457426221385268339350
Totalamountdeliv-ered 6
n.a.n.a.n.a.n.a.
6,5687,7087,4157,021
431
480632639545729544932495612
'582409449
Total
5,4776,7895,9115,3837,0997,7467,7737,444
453
736623575729551
1,030571599689339502481
Edu-cation
1,3201,4321,5161,4552,5512,6442,2382,375
252
219181217312140297148163196172176145
Issues
1
Roadsand
bridges
1,5882 1361,362
6981,0411,172
8341,005
16
317779
136155868
231175
78043
for new capital
Use of proceeds 2
Water,sewerand
otherutili-ties
8031 270
8811,3991 5241,4031,9611,285
57
10710556
113120184123106966596
109
Resi-den-tial
hous-ing?
506456570258299530701686
4
391081827
1445495
7652
12115
Veter-ans'aid
141162169110333339355201
50
50
51
50
Otherpur-poses
1,119
,4141,464
35?[,6571,6831,892
1?6
290151155141131386137
9210692
13768
n.a. Not available. r Revised.1 Data prior to 1957 are from the Bond Buyer as classified by Federal
Reserve.2 Classifications prior to 1957 as to use of proceeds and type of issuer
are based principally on issues of $500,000 or more; smaller issues notclassified. As a result some categories, particularly education, are under-stated relative to later data.
3 Includes only bonds sold pursuant to the Housing Act of 1949.These are secured by contract requiring the Public Housing Administra-tion to make annual contributions to the local authority.
4 Beginning with 1957, coverage is considerably broader than earlier.
5 Consists of municipalities, counties, townships, school districts and,prior to 1957, small unclassified issues.
6 Excludes Federal Government loans. These data are based on dateof delivery of bonds to purchaser (and of payment to issuer) which occursafter date of sale. Other data in table are based on date of sale.
7 Includes urban redevelopment loans.8 Beginning in 1957 this figure differs from that shown on the opposite
page, which is based on Bond Buyer data. The principal difference is inthe treatment of Federal Government loans.
9 Less than $500,000.
UNITED STATES GOVERNMENT MARKETABLE AND CONVERTIBLE SECURITIES OUTSTANDING, FEBRUARY 28, 19611
[On basis of daily statements of United States Treasury. In millions of dollars]
Issue and coupon rate Amount Issue and coupon rate Amount Issue and coupon rate Amount Issue and coupon rate Amount
Treasury bills *Mar. 2, 1961Mar. 9, 1961Mar. 16, 1961Mar. 22, 1961*Mar. 23, 1961Mar. 30, 1961Apr. 6,1961Apr. 13, 1961Apr. 15, 1961Apr. 20, 1961Apr. 27, 1961May 4, 1 9 6 1 . . . . . . . . .May 11, 1961May 18, 1961May 25, 1961June 1,1961June 8,1961June 15, 1961June 22, 1961*June 23, 1961June 29, 1961July 6, 1961July 13, 1961July 15, 1961July 20, 1961July 27, 1961
,506,601,599,512,602,501,501,501,001.502,501,501,500,601,603500500501
3.504500501500500
1,501400500
Treasury bills—Cont.Aug. 3,1961Aug. 10, 1961Aug. 17, 1961Aus. 24, 1961Oct. 16, 1961Jan. 15, 1962
Certificates
May 15, 1961 4%Aug, 1,1961 3 ^
Treasury notesApr. 1,1961 \ViMay 15, 1961 3%Aug. 1,1961 4Oct. 1,1961 li/2Feb. 15, 1962 3*4Feb. 15, 1962 3%Feb. 15, 1962 4Apr. 1,1962 \ViMay 15, 1962 4Aug. 15,1962 4Aug. 15, 1962 3V4Oct. 1,1962 IViNov. 15, 1962 334
500500500500
1,5021,502
3,6747,829
1444,0782,136
3329,098
6471,435
5512,211
1587,325
5901,143
Treasury notes—Cont.Feb. 15, 1963 2%Apr. 1,1963 H/SMay 15, 1963 4Oct. 1,1963 1%Nov. 15, 1963 4%Apr. 1,1964 IViMay 15, 1964 4y4May 15, 1964 3%Aug. 15, 1964 5Oct. 1,1964 \ViNov. 15, 1964 4%Apr. 1,1965 1%May 15, 1965 4%Oct. 1,1965 \yi
Treasury bondsJune 15, 1959-62... 2 V4Dec. 15, 1959-62... 21/4Dec. 15, 1960-653..2%Sept. 15, 1961 2y4Nov. 15, 1961 214June 15, 1962-67... 2 ViAug. 15, 1963 2ViDec. 15, 1963-68... 2 ^Feb. 15, 1964 3June 15, 1964-69... 2 ^
3,971533
1,743506
3.011457
4,9333,8932,316490
4,195466
2,113186
5,2623,4491,4852,2396,9631.4656,7551,8203.8542,640
Treasury bonds—Cont.Dec. 15, 1964-69... 2 ViFeb. 15, 1965 2%Mar. 15, 1965-70.. .2*6May 15, 1966 3%Aug. 15, 1966 3Mar. 15, 1966-71... 2%June 15, 1967-72... 2&Sept. 15, 1967-72... 2ViDec. 15, 1967-72... 2UMay 15, 1968 3%Oct. 1,1969 4Nov. 15, 1974 3%May 15, 1975-85.. AV4June 15, 1978-83... 3 #Feb. 15, 1980 4Nov. 15, 1980 3ViMay 15, 1985 3 #Feb. 15, 1990 3ViFeb. 15, 1995 3Nov. 15, 1998 3Vi
Panama Canal Loan . . . . 3
Convertible bondsInvestment Series BApr. 1, 1975-80... 2%
2,5596,8964,6861,2131,4842,9321,7862,7163,5881,3901,424654470
1,599884643
1,1342,7192,7102,343
50
5,608
• Tax anticipation series.1 Direct public issues.
2 Sold on discount basis. For discounts on individual issues, see tableson Money Market Rates, p. 328. 3 Partially tax-exempt.
Digitized for FRASER Federal Reserve Bank of St. Louis

336 FEDERAL FINANCE
UNITED STATES GOVERNMENT DEBT, BY TYPE OF SECURITY
[On basis of daily statements of United States Treasury. In billions of dollars]
End ofmonth
1941 Dec1945 Dec1947 Dec1953 Dec1954 Dec1955 Dec1956 Dec1957 Dec1958 Dec1959 Dec . .
1960 FebMar . . .AprMayJune . . . .JulyAugSeptOctNovDec
1961 JanFeb
Totalgrossdebt*
64 3278 7257.0275 2278 8280.8276.7275 0283 0290.9
290.7287 0288 9289 5286 5288.5288.8288 6290.6290 6290.4
290 2290.7
Totalgrossdirectdebt 2
57.9278.1256.9275 2278.8280.8276.6274.9282 9290.8
290.6286.8288.8289 4286.3288.3288.7288.4290.5290 4290.2
290.0290.5
Public issues3
Total
50.5255.7225.3231.7233.2233.9228.6227.1236 0244.2
244.8240.5242.9242 4238.3241.1240.4240.4243.1242.6242.5
242.8243.5
Marketable
Total
41.6198.8165.8154.6157.8163.3160.4164.2175 6188.3
189.4185.4188.1187.7183.8186.9186.3186.4189.4188.8189.0
189.3189.9
Bills
2 . 017.015.119.519.522.325.226.929 739.6
41.237.237.137 333.436.436.436.539.539 539.4
39.739.9
cates
38.221.226.428.515.719.034.636.419.7
15.215.215.217.717.717.725.525.525.518 418.4
18.411.5
Notes
6.023.011.431.428.043.335.320.726 144.2
48.248.350.647 651.551.642.042.142 A51.251.3
51.358.7
Bonds
Bankeligi-ble 4
33.668.468.463.976.181.980.982.183 484.8
84.884.885.285 281.381.382.382.382.379 779.8
79.879.8
Bankre-
stricted
52.249.613.4
5.7
Con-vert-ible
bonds
12 011.811.410.89.58 37.1
6.96.66 .56 46 .36 .26.26.15.85 75.7
5.65 .6
Nonmarketable
Totals
8 956.959.565 163.659.257.453.452 148.9
48.548 448.348 248.248.048.047.948.048 047.8
47 947.9
Sav-ings
bonds
6.148.252.157 757.757.956.352.551 248.2
47.847.847.647 647.547.447.347.347.447 447.2
47.247.3
Tax
sav-ings
notes
2 . 58 .25 .46 .04 . 5
(6)
Specialissues
7 020 029.041 242 643.945.645 844 843.5
42.843 342.843 944 944.245.245 044.344 644.3
43 843.7
1 Includes some debt not subject to statutory debt limitation (amountingto $399 million on Feb. 28, 1961) and fully guaranteed securities, notshown separately.
2 Includes non-interest-bearing debt, not shown separately.3 Includes amounts held by Govt. agencies and trust funds, which
aggregated $10,744 million on Jan. 31, 1961.
4 Includes Treasury bonds and minor amounts of Panama Canal andpostal savings bonds.
5 Includes Series A investment bonds, depositary bonds, armed forcesleave bonds, adjusted service bonds, and R.E.A. bonds, not shown sep-arately.
6 Less than $50 million.
OWNERSHIP OF UNITED STATES GOVERNMENT SECURITIES, DIRECT AND FULLY GUARANTEED
[Par value in billions of dollars]
End ofmonth
1941 Dec . . . .1945 Dec1947 Dec1952—Dec1953—Dec1954 Dec1955—Dec1956 Dec1957 Dec1958—Dec1959 June
Dec
I960—JanFeb . . . .MarAprMayJuneJulyAugSeptOctNovDec
Totalgrossdebt
(includ-ing guar-
anteedsecuri-ties)
64.3278 7257.0267.4275.2278.8280.8276 7275.0283.0284 8290.9
291.2290.7287.0288.9289.5286.5288.5288.8288.6290 6290.6290.4
Held by
U. S. Govt.agencies andtrust funds1
Specialissues
7 . 020.029.039.241.242.643.945.645.844.844.843.5
42.642.843.342.843.944.944.245.245.044.344.644.3
Publicissues
2 . 67 .05 .46 .77 .17 .07 .88 .49 . 49 . 69 .9
10.2
10.610.410.410.410.510.410.610.710.610.810.810.7
FederalReserveBanks
2 . 324.322.624.725.924.924.824.924.226.326.026.6
25.525.225.325.626.026.526.926.827.027.427.527.4
Held by the public
Total
52.5227.4200.1196.9201.0204.2204.3197.8195.5202.3204.2210.6
212.6212.3208.0210.2209.1204.6206.8206.1206.0208.2207.7207.9
Com-mercialbanks 2
21.490.868.763.463.769.262.059.559.567.561.560.3
59.157.154.957.056.255.657.757.959.161.961.862.6
Mutualsavingsbanks
3.710.712.09 . 59 . 28.88.58 .07 . 67 .37 .36 .9
6.96.96 .96 .86 .76 .66 .56 .66 .56 .46.36.3
Insur-ance
panies
8.224.023.916.015.915.314.613.212.512.712.512.3
12.512.412.212.112.011.811.911.811.811.811.811.7
Othercorpo-rations
4 . 022.214.119.921.519.223.519.118.619.621.523.5
25.426.223.424.124.721.722.121.420.320.120.619.7
Stateand
govts.
.76 .57 . 3
11.112.714.415.116.117.016.716.717.7
17.818.018.218.018.018.117.917.717.417.317.217.0
Individuals
Savingsbonds
5 .442 946.249.249.450.050.250.148.247.747.045.9
45.845.845.745.745.645.645.645.645.645.645.645.7
Othersecurities
8 .221.219.416.015.413.514.815.615.414.317.821.9
22.723.023.723.222.922.622.322.122.322.021.821.3
Misc.inves-tors3
.99 18.4
11.713.213.915.616.116.616.619 722.1
22.322.922.923.322.922.522.823.122.923 222.623.7
1 Includes the Postal Savings System.2 Includes holdings by banks in territories and insular possessions,
which amounted to about $85 million on Dec. 31, 1959.
3 Includes savings and loan associations, dealers and brokers, foreignaccounts, corporate pension funds, and nonprofit institutions.
NOTE.—Reported data for Federal Reserve Banks and U. S. Govt.agencies and trust funds; Treasury Department estimates for other groups.
Digitized for FRASER Federal Reserve Bank of St. Louis

FEDERAL FINANCE 337
OWNERSHIP OF UNITED STATES GOVERNMENT MARKETABLE AND CONVERTIBLE SECURITIES 1
[On basis of Treasury Survey data. Par value in millions of dollars]
Type of holder and date
Marketable and convertible securities, by type
Total Bills Certifi- NotesMarket-
ablebonds2
Con-vertiblebonds
Marketable securities, by maturity class
Total Within1 year
1-5 5-10 Over10 years
All holders:1957—June 301958—June 301959—June 30
Dec. 31
1960—June 30Nov. 30Dec. 31
U. S. Govt. agencies and trust funds:1957—June 301958—June 301959—June 30
Dec. 31
1960—June 30Nov. 30Dec. 31
Federal Reserve Banks:1957—June 301958—June 301959—June 30
Dec. 31
I960—June 30Nov. 30Dec. 31
Commercial banks:1957—June 301958—June 301959—June 30
Dec. 31
1960—June 30Nov. 30Dec. 31
Mutual savings banks:1957—June 301958—June 301959—June 30
Dec. 31
I960—June 30Nov. 30Dec. 31
Insurance companies:1957—June 301958—June 301959—June 30
Dec. 31
I960—June 30Nov. 30Dec. 31
Other investors:Nonfinancial corporations 3
1960—June 30Nov. 30Dec. 31
Savings and loan associations3
I960—June 30Nov. 30Dec. 31
All others4
1957_jUne 301958—June 301959—June 30
Dec. 31
1960—June 30Nov. 30Dec. 31
165,985175,573185,709195,346
190,151194,584194,695
8,5549,4779,6819,982
10,24610,63510,528
23,03525,43826,04426,648
26,52327,48827,384
48,73457,50953,51351,945
48,09953,47354,349
7,3977,1107,0796,773
6,4896,2206,188
10,93610,58010,94710,933
10,52110,46710,394
11,49411,63110,746
2,4802,4962,515
67,32965,45978,44489,066
74,29972,17372,591
23,42022,40632,01739,643
33,41539,45439.446
13017386260
371680591
2872,7032,0322,626
2,5133,1723,217
2,8533,7963,5635,011
2,3766,4556,976
16389175191
209152144
326254503416
232291341
4,5796,1005,599
178160163
19,66115,39225,65931,140
22,95722,44622,415
20,47332,92033,84319,669
17,65018,44218,442
416599537363
459469461
11,36719,94618,65010,508
8,5089,1739,082
2,9133,3313,8832,094
1,8322,3262,573
114132209158
166128143
136112347231
165154145
1,7401,5001,331
705657
5,5278,79910,2166,315
4,7114,6364,649
30,97320,41627,31444,152
51,48351,22651,284
1,2821,1691,3891,700
1,8101,8121,771
8,579
2,87911,016
13,01112,53712,519
8,98411,53212,41713,172
15,59816,79616,947
367465684
1,1991,1921,190
648614798
1,074
1,2251,3811,375
1,8821,7971,712
495506510
11,1136,6369,14716,302
16,26315,20515,260
80,83990,93284,85384,804
81,29779,71879,843
3,6644,7034,9885,071
5,1365,2585,294
2,8022,7892,4842,498
2,4912,6062,566
33,83938,72033,53131,565
28,19927,80527,763
5,6555,4935,2284,892
4,6074,5004,466
7,2777,3987,3717,454
7,3047,2267,139
3,2842,2292,099
1,6751,7131,724
27,60231,82931,25233,325
28,60228,38128,791
10,2808,8987,6817,077
6,3065,7445,680
3,0632,8332,6802,587
2,4702,4172,411
144130120104
9591
1,098931783644
309248245
2,5492,2021,9281,758
1,5951,4151,393
3,4262,8022,1711,985
1,7661,5061,476
155,705166,675178,027188,269
183,845188,840189.015
5,4916,6447,0017,394
7,7768,2188.117
23,03525,43826,04426,648
26,52327,48827.384
48,59057,37953,39451,841
48,00453,38254,260
6,2996,1796,2966,129
6,1815,9725,944
8,3878,3789,0199,175
8,9269.0529,001
11,48511,62610,741
2,4182,4352,454
63,90462,65776,27387,082
72,53370,66771,115
71,03367,78272,95878,456
68,98273,83973,830
1,138899930
1,037
1.0701,5851,482
20,24623,01020,68718,654
19,38515,34415,223
12,26813,43110,04511,198
6,54613,95614,697
576303480486
463472480
955651
1,0921,023
595909940
8.4429,0788,340
297319322
35,85029,48939,72446,057
32,18432,17632.345
39,18441,07156,81961,609
72,84470,75572,298
1,2101,5651,6791,909
2,6832,4592,432
6811,0143,8876,524
14,73222,96118,53823,625
21,73120,02918,684
295913
1,4481,882
2,0621,5831,602
75057
410677
5,689 1,17910,694 I 1,17910,711 ! 1,179
23,50024,49431,30428,778
8,60014,2598,2339,235
33,342 | 5,96630,124 6,94031,596 ! 5.654
1,0821,1061,3601,401
1,7201,5561,544
601675
1,7002,254
2,6621,8631,849
1,775 1,0221,650 1,0042,085 1,6782,279 I 2,422
2.794 3,0632,517 2,1622.508 2,075
2,8712,3582,269
947851858
10,93611,24316,50320,717
22,80020,19620,381
9811658
472459473
3,4646,0545,0697,154
6,2295,7285,794
30,75634,86029,71324,579
20,28824,21724,204
2,8483,2672,9442,567
1,9612,5902,601
1,3581,3581,060793
271271271
4,2225,1953,8122,629
2,1512,3622,313
4,0404,0942,7561,987
1,3362,0822,071
4,6345,0744,1643,450
2,4753,4633,477
757472
703806802
13,65415,87214,97713,153
11,31712,56912,597
i Direct public issues.Data complete for U. S. Govt. agencies and trust funds and Federal
Reserve Banks, but for other groups are based on Survey data. Latestdata shown are for 6,303 commercial banks, 513 mutual savings banks,and 831 insurance companies, which together accounted for more than90 per cent of all holdings of banks and insurance companies, and 497nonfinancial corporations and 489 savings and loan associations, whichtogether accounted for about half of the total holdings of all nonfinancialcorporations and savings and loan associations.
Holdings of "all others," a residual throughout, include holdings ofall those not reporting in the Treasury Survey, including investor groupsnot listed separately.
2 Includes minor amounts of Panama Canal and postal savings bonds.3 Holdings first reported separately in the Treasury Survey for Feb-
ruary 1960. Monthly figures for February-May 1960 shown in theTreasury Bulletin for September 1960, pp. 55-56. See also note 4.
4 Holdings of nonfinancial corporations and savings and loan associa-tions included in this category until February 1960.
Digitized for FRASER Federal Reserve Bank of St. Louis

338 FEDERAL FINANCE
SUMMARY OF FEDERAL FISCAL OPERATIONS
[On basis of U. S. Treasury statements and Treasury Bulletin. In millions of dollars]
Period
Derivation of Federal Government cash transactions
Receipts from the public,other than debt
NetBudget
receipts ]
Plus:Trustfund
receipts
Less:Intra-Govt.trans-
actions 2
Equals:Totalrects.fromthe
public 3
Payments to the public,other than debt
Budgetex-
pendi-tures *
Plus:Trustfundex-
pendi-tures
Less:Adjust-ments4
Equals:Totalpayts.to thepublic
Excessof rects.
fromor
paytsto ( - ) ,
thepublic
Net Federal cash borrowing orrepayt. (—) of borrowing
In-crease,or de-crease
(direct& agen.)
Less:
Netinv. byGovt.
agen. &tr. funds
Othernon-cashdebts
Equals:Netcash
borrow-ing orrepayt.
()
Cal. year—1958...1959...1960.. .
Fiscal year—1957..1958..1959..I960..
Semiannually:1959—Jan.-June.
July-Dec..1960—Jan.-June.
July-Dec..
Monthly:I960—Jan
FebMarAprMayJuneJulyAugSeptOctNovDec
1961— Jan.?
68,69472,73879,517
70,56268,55067,91577,763
39,16333,57544,18835,329
4,8677,2379,5805,0646,550
10,8913,1286,4548,9812,8236,3007,643
4,846
16,79718,83022,732
14,36916,32917,08421,801
9,4499,381
12,42010,312
8282,3291,7081,4903,3012,7641,0572,9841,4061,1032,3621,400
938
3,7103,9663,906
2,7772,9273,2954,434
1,8192,1472,2871,619
229331198180161,187213195235269254453
196
81,72887,55298,287
82,10581,89281,66095,078
46,76840,78454,29443,993
5,4629,230
11,0846,3699,685
12,4653,9709,236
10,1463,6518,4038,586
5,585
75,78279,77777,565
68,96671,36980,34276,539
40,58639,19137,34840,217
6,1576,1426,4236,0326,0736,5216,1726,8036,7936,8296,7736,847
6,470
17,85620,24422,242
12,96116,06918,59722,158
9,67610,56811,59010,652
1,9741,6131,8682,0671,7802,2881,7901,7751,7981,7031,7711,815
2,018
4,6224,4665,114
1,9214,0264,1364,396
3,0011,4652,9312,183
1,363-3191,192280
-161576486
-348843653
-129678
1,214
89,01495,56094,694
80,00683,41294,80494,301
47,26548,29546,00648,688
6,7688,0747,1007,8198,0148,2327,4768,9267,7487,8798,6747,984
7,274
-7,287-8,0063,593
2,099-1,520-13,144
111
-4957,5118,2884,695
-1,3061,1563,984
-1,4501,6714,232
-3,506311
2,398-4,228-271603
-1,689
7,53310,112-548
-1,0536,2169,6563,371
2,7837,329
-3,9583,410
229-686
-3,6321,949898
-2,7152,094-338-3202,197-62-161
-323
-717-5431,625
2,339657
-1,181953
313-8561,809-184
-47232507
-4981,2201,022-5171,130-368-514339
-254
-484
4872,081491
-292-2002,160597
,50757423
468
14726
-1001253
-11484
-357611215477
42
7,7628,580
-2,670
-3,1005,7608,6781,821
9657,615
-5,7943,124
554-744
-4,0392,435-375
-3,6242,525
-1,433-29
2,600-555
16
119
Period
Effects of operations on Treasurer's account
Operating transactions
NetBudgetsurplus,
ordeficit
Trustfund
accumu-lation,
ordeficit
Recon-ciliationto Treas.
cash
Financing transactions
Netmarketissuance(+)ofGovt.agencyobliga-tions 6
Netinv. ( - )in Fed.sec. byGovt.agency& trustfunds6
Increase,or
decrease( - ) , ingrossdirectpublicdebt
Cash balances:inc., or dec. (—)
Heldoutside
Treasury
Treas-urer's
account
Account of Treasurer of UnitedStates (end of period)
Balance
Deposits in:
F. R.Banks(avail-able
funds)
Treas-ury
Tax andLoanAccts.
Othernet
assets
Fiscal year—1957..1958..1959..I960..
Semiannually:1959—Jan.-June.,
July-Dec..,1960—Jan.-June.
July-Dec..
Monthly:I960—Jan
FebMarApr ,MayJune ,JulyAug ,Sept ,OctNov ,Dec ,
1961—Jan
1,596-2,819-12,427
1,224
-1,423-5,617
6,841-4,888
-1,2901,0953,157-968476
4,370-3,044-3492,188
-4,006-473796
-1,624
1,409262
-1,511-359
-225-1,187
828- 343
-1,146716
-160-5771,521473
-7341,209-392-600590
-416
-1,080
-518670-29-149
203-43728854
634-838994134
-332-303186
-533559241
-643244
423
1,08556771
1,023
192366657
-492
310510414315315023
-69424218846
27
-2,300-1971,112-714
-32911
-1,625275
764-160-386296
-1,097-1,043
616-1,083
245659
-310148
-2,2245,8168,3631,625
1,7846,092
-4,4673,886
287-501
-3,7571,961579
3.0362,008334
-2492,063-73-197
-181
5140-23- 4
108-10510152
-26-3375
-1158311827
-12-48232042
15
-9564,159
-4,3992,654
389233
2,421-1,593
-722450
-1221,1051,217494
-1,006-1,1042,423
- 1,645-841580
-1,582
5,5909,7495,3508,005
5,3505,5838,0056,411
4,8625,3115,1896,2947,5118,0056,9985,8948,3176,6725,8316,411
4,829
498410535504
535504504485
567453549619462504477481489437512485
588
4,0828,2183,7446.458
3,7444,2166,4585,165
3,2463,8433,7384,4906,1806,4585,6764,6286,9875,4474,5175,165
3,215
1,0101,1211,0711,043
1,071863
1,043761
1,0491,015902
1,185869
1,043845785841788802761
1,026
n.a. Not available. p Preliminary.i Beginning with the October 1960 F. R. Bulletin figures are revised
to exclude certain interfund transactions from both net budget receiptsand budget expenditures. Figures for calendar year 1958 are not yetrevised. For more details see Treasury Bulletin for Sept. 1960, pp.II and 1.
2 Consists primarily of interest payments by Treasury to trust accountsand to Treasury by Govt. agencies, transfers to trust accounts representingBudget expenditures, and payroll deductions for Federal employees re-tirement funds.
3 Small adjustments to arrive at this total are not shown separately.For other notes, see opposite page.
Digitized for FRASER Federal Reserve Bank of St. Louis

FEDERAL FINANCE 339
DETAILS OF FEDERAL FISCAL OPERATIONS
[On basis of Treasury statements and Treasury Bulletin unless otherwise noted. In millions of dollars]
Period
Budget receipts
NetBudget
re-ceipts1'3
Adjustments from totalBudget receipts
Transfers to:
Old-age
trustfund?
High-waytrustfund
R. R.re-
tire-mentacct.
Re-funds
ofre-
ceipts
TotalBudget
re-ceipts
Income andprofit taxes
Individual
With-held Other
Corpo-ration
Ex-cise
taxes
Em-ploy-menttaxes8
Otherre-
ceipts
Selected excise taxes(Int. Rev. Serv. repts.)
Liquor To-bacco
Mfrs.'and re-tailers'
Fiscal year—1957195819591960
Semiannually:1959—Jan.-June
July-Dec1960—Jan.-June
July-Dec
Monthly:1960—Jan
FebMar
Mw'.'.'.'.'.'.JuneJulyAugSept . . . . . . .OctNovDec
1961—Jan
70,56268,55067,91577,763
39,16333,57544,18835,329
4,8677,2379,5805,0646.550
10,8913,1286,4548,9812,8236,3007,643
4,846
6,6347,7338,00410,211
4,6213,8156,3964,762
2981,2431,078839
1,8341,104365
1,524739373
1,214547
304
1,4792,1162,1712,642
1,0591,2811,3611,576
218264191202249238257296262253268240
223
616575525607
260307300297
168450178250178352158149
3,9174,4334,9335,045
4,299718
4,327794
-16432
1,3171,3361,0052521672031611732961
64
83,67583,97483,90496,962
49,60840,03556,92743,069
5,4259,28912,2177,4689,72512,8043,9768,59010,2113,6417,9008,751
5,537
26,72827,04129,00131,675
15,23215,65216,02316,615
8604,8352,541770
4,7442,2731,0554,8492,5271,0664,5272,591
1,049
12,30211,52811,73313,271
8,9063,04110,2303,186
2,144884791
3,5201,0391,852346147
1,959230121383
2,149
21,53120,53318,09222,179
11,9188,32313,8568,838
564483
6,192619467
5,530670409
3,492481455
3,331
534
10,63810,81410,76011,865
5,3965,9485,9176,238
794954
1,044945
1,0611,118995
1,1211,0241,0211,0691,008
918
7,5818,6448,85411,159
5,2014,1277,0325,063
3411,6111,149858
1,9181,155383
1,608792389
1,295596
348
4,8955,4145,4646,813
2,9562,9443,8693,129
722522500755496876527456417454433842
539
2,9732,9463,0023,194
1,4021,7031,4911,685
186214258248282303238272277321319259
n.a.
1,6741,7341,8071,932
876984948
1,008
138151152157166183151179177158178164
n.a.
4,0984,3164,3155,114
2,3522,4082,7063,315
1,320
1,386
1,448
1,276
Budget expenditures9
PeriodTotali'3
68,96671,36980,34276,539
40,58639,19137,34840,217
6,601
6.1576,1426,4236,0326,0736,5216,1726,8036,7936,8296,7736,847
Major national security
Total io
43,27044,14246,42645,627
23,18023,11922,50823,186
4,231
3,5233,6843,9763.6693; 6693,9873,4713,9763,9103,7283,8844,217
Militarydefense
38,43939,06241,23341,215
20,61420,97520,24021,170
3,856
3,1603,3713,5703,3063,3313,5023,0963,6383,6003,4323,5373,867
Militaryassist-ance
2,3522,1872,3401,609
1,195715894644
125
1361031711361102381461057977
114123
Atomicenergy
1,9902,2682,5412,623
1,2721,2901,3331,342
237
210210223222224244219230226217228222
Intl.affairs
andfinance
1,9732,2313,7801,833
2,574650
1,1831,068
123
157169140163196358133166161164301143
Inter-est
7,3087,6897,6719,266
3,9854,4944,7724,587
813
831788792111111807815758746756740772
Vet-erans'serv-
ices andbene-
fits
4,7935,0265,1745,060
2,5942,4932,5672,577
430
419420457421422428404461416422436438
Laborand
welfare
3,0223,4474,4214,419
2,2632,0862,3332,225
318
393362340412390436342375388376378366
Agri-culture
andagri-cul-turalre-
sources
4,5254.3896,5294,838
2,6072,9611,8772,998
536
470322289304229263369420412727476594
Nat-uralre-
sources
1,2971,5441,6691,713
77394!772
1,056
134
105119120104131193125197213182193146
Com-merceand
housing
1,4552,1093,4212,782
1,9831,950
8321,870
125
195161148
37149142379326380330236219
Gen-eral
govern-ment
Fiscal year—1957.1958.1959.1960.
Semiannually:1959—Jan.-June
July-Dec.1960—Jan.-June
July-Dec.
Monthly:1959—Dec
1960—JanFebMarAprM a y . . . .J u n e . . . .Ju ly . . . . .AugSeptOctNovDec
1,7901,3591,6061,695
841833862951
149
127127156158108186165159182140140165
4 Consists primarily of (1) mtra-Governmental transactions as de-scribed in note 2, (2) net accruals over payments of interest on savingsbonds and Treasury bills, (3) Budget expenditures involving issuance ofFederal securities, (4) cash transactions between International MonetaryFund and the Treasury, (5) reconciliation items to Treasury cash, and(6) net operating transactions of Govt. sponsored enterprises.
5 Primarily adjustments 2, 3, and 4, described in note 4.6 Excludes net transactions of Govt. sponsored enterprises, which are
included in the corresponding columns above.
7 Includes transfers to Federal disability insurance trust fund.8 Represents the sum of taxes for old-age insurance, railroad retire-
ment, and unemployment insurance.9 For more details see the Treasury Bulletin, Budget Receipts and
Expenditures, Table 6 and the 1962 Budget Document, Special Analysis C.10 Includes stockpiling and defense production expansion not shown
separately.For other notes, see opposite page.
Digitized for FRASER Federal Reserve Bank of St. Louis

340 FEDERAL BUSINESS-TYPE ACTIVITIES
SELECTED ASSETS AND LIABILITIES OF FEDERAL BUSINESS-TYPE ACTIVITIES
[Based on compilation by Treasury Department. In millions of dollars]
Asset or liability, and activity J
End of year
1953 1954 1955 1956 1957 1958
End of quarter
1959 1960
2
8,490526
1,547963
2,9732,480
5,8734,8151,056
1
717201174342
1,539
29389204
9,9043,5043,4252,874101
627563
3
7,636576
1,562972
3,0291,498
tf,J525,2381,113
1
726197170358
1,797
30891217
10,0843,5133,4252,998147
686623
Loans, by purpose and agency:To aid agriculture, total
Banks for cooperativesFederal intermediate credit banks 2 . .Farmers Home AdministrationRural Electrification Administration.Commodity Credit CorporationOther agencies
To aid home owners, totalFederal National Mortgage AssociationVeterans AdministrationOther agencies
To industry, totalTreasury DepartmentCommerce Department.. .Other agencies
To financing institutions
To aid States, territories, etc., total.Public Housing Administration..Other agencies
Foreign, totalExport-Import BankTreasury DepartmentInternational Cooperation Administration.Other agencies
All other purposes, totalHousing and Home Finance Agency.Other agencies
Less: Reserves for lossesTotal loans receivable (net) .
Investments:U. S. Government securities, total
Federal home loan banksFederal Savings and Loan Insurance CorpFederal Housing AdministrationFederal Deposit Insurance CorporationOther agencies
Investment in international institutionsOther securities 4
6,811377590648
2,0963,076
23
2,9302,462300168
588174
. 413
952
645500145
8,0432,8333,6201,537
53
1192990
-20319,883
2,602387217319
1,526152
3,385219
6,929367638701
2,2262,981
18
2,9072,46138363
431353
79
870
272112160
8,0012,8063,5701,624
1
16612739
-22819,348
2,967641228327
1,624147
3,385197
6,715375689681
2,3482,621
1
3,2052 Ml48084
678306
f 261{ 112
1,419
24590155
7,9882,7023,5191,767
Inventories, totalCommodity Credit CorporationDefense DepartmentGeneral Services AdministrationOther agencies
Land, structures, and equipment, totalCommerce Dept. (primarily maritime activities).. .Panama Canal CompanyTennessee Valley AuthorityHousing and Home Finance AgencyNat. Aeronautics and Space AdministrationBonneville Power AdministrationGeneral Services AdministrationPost Office DepartmentOther agencies
2,5152,087
3,8523,302
25620947
-26820,238
3,236745241381
1,720149
3,385179
4,3563,747
• 428
8,0624,834
3631,4751,040
550
8,0464,798
4211,739
728
609
7,8224,822
4211,829
450
Bonds, notes, & debentures payable (not guar.), total.Banks for cooperativesFederal intermediate credit banksFederal home loan banksFederal National Mortgage Association
350
1,182150619414
360
1,068156640272
300
2,379185665958570
6,752457734724
2,4882,349
(3)
3,6803,072
464145
619209219191
1,233
246106140
8,2232,7013,4701,995
57
21315657
-30920,657
3,7391,018256458
1,825181
3,420249
21,3753,65111,0046,517201
9,9854,502398
1,762236276311
1,298590613
2,711257721963770
6,681454935832
2,6881,778
(3)
4,7693,998770
674251217206
1,270
264105159
8,7543,0403,4702,195
49
34428362
-36722,395
3,804896274471
1,937226
3,420298
21,6283,02511,1367,282
185
9,9624,535398
1,80188283342
1,308599608
4,662247902825
2,688
8,672511
1,169819
2,8743,298
(3)
4,8603,924936
1
680216187278
1,298
293106187
9,5103,3623,4192,682
46
548458
-36825,493
4,198995288567
2,049300
3,420283
20,8103,0369,6817,919
174
10,6704,721396
1,77725285372
1,322637
1,134
4,038303
1,124714
1,898
64 63
-654 | -45126,788 27,138
4,4421,064310590
2,154324
4,795331 j
20,8213,6148,7518,278
178
8,8692,856409
1,8789
304357
1,241640
1,175
4,882314
1,488992
2,087
4,4781,046320622
2,162329
4.795335
21,8794,5278,8238,347
183
7,762623
1,396916
3,0831,745
(3)
6,7355,5681,167
1
733185166382
2,136
31987231
9,8403,2353,3733,043
189
75269162
-41327,865
4,6701,092
332649
2,178419
4,795323
8,178609
1,4991,0013,1401,929
(3)
6,9985,7591,238
1
739184158397
1,522
31691225
9,9723,2393,3733,115244
78272260
-41828,090
4,9981,282345667
2,270435
4,796337
82
1
1
1
,938,899408.907
9305354,234640,181
92
1
1
1
,124,880411,924
9310352,221640,376
5,582360
1,5321,4022,287
21,476 i 21,2944,493 4,2578,422 8.4258,370 ! 8,420
194 ! 193
9,1562,928411
1,9119
313349
1,261640
1,333
5,767396
1,4401,2932,638
5,974404
1,3591,7742,437
2,797553
1,6981,0133,1861,347
(3)
7,5646,0171,370176
754182155417
1,802
31192219
10,1643,2613,3733,244286
912765146
-54428,760
4,8741,165328653
2,289440
4,875338
20,8324,2287,9718,447186
9,0232,736418
1,9309
368355
1,312492
1,402
6,308342
1,6281,2553,082
1 Figures exclude interagency items. Prior to 1956, data for trustrevolving funds included such items.
2 Effective Jan. 1, 1957, the production credit corporations were mergedin the Federal intermediate credit banks, pursuant to the Farm CreditAct of 1956, approved July 26, 1956 (70 Stat. 659). Thereafter operationsof the banks are classified as trust revolving transactions.
3 Less than $500,000.4 Includes investment of the Agricultural Marketing revolving fund in
the banks for cooperatives; Treasury compilations prior to 1956 classifiedthis item as an interagency asset.
NOTE.—Coverage has changed in some of the periods shown. Be-ginning with 1956, changes reflect the expanded coverage and the newclassification of activities by type of fund now reported in the TreasuryBulletin. Classifications by supervisory authorities are those in existencecurrently. Where current Treasury compilations do not provide a de-tailed breakdown of loans, these items have been classified by FederalReserve on basis of information about the type of lending activity involved.
Digitized for FRASER Federal Reserve Bank of St. Louis

REAL ESTATE CREDIT 341
MORTGAGE DEBT OUTSTANDING, BY TYPE OF PROPERTY MORTGAGED AND TYPE OF MORTGAGE HOLDER
[In billions of dollars]
End of yearor quarter
19411945
19521953195419551956195719581959PI960?
1959 Mar PJune33 . . . .Sept p.Dec.*\
1960—Mar.*> . .June2'Sept.?Dec P
All properties
Allhold-ers
37.635.5
91.4101.3113.7129.9144.5156.6171.9191.1206.5
175.9181.5186.7191.1
194.4198.5202.8206.5
Finan-cial
insti-tutions
20.721.0
66.975.185.799.3
111.2119.7131.5145.4157.6
134.2138.3142.2145.4
147.9151.2154.6157.6
Otherholders
SelectedFederalagen-cies
4.72.4
4.04.44.65.26.07.57.8
10.011.2
8.49.09.5
10.0
10.310.611.011.2
Indi-viduals
andothers
12.212.1
20.621.823 425.427.329.432.735.637.7
33.434.234 935.6
36.236.737.337.7
Allhold-ers
31.230.8
84.293.6105.4120.9134.6146.1160.7178.8193.4
164.4169.5174.5178.8
181.9185.7189.8193.4
]Sonfarm
1- to 4-family houses
Total
18.418.6
58.566.175.788 299.0
107.6117.7130.8141.8
120.5124.3128.0130.8
133.2136.1139.1141.8
Finan-cial
insti-tutions
11.212.2
46.853.662.573.883.489.998.5
109.1118.6
100.6103.8106.8109.1
111.1113.6116.2118.6
Otherhold-ers
7.26.4
11.712.513.214.415.617.719.221.723.2
19.920.521.221.7
22.122.522.923.2
Multifamily andcommercial properties1
Total
12.9
25.727.529 732.635.638.543.047.951.6
43.945.246 647.9
48.749.750.751.6
Finan-cial
insti-tutions
8.1
17.218.519 921.823.925.828.831.834.4
29.330.131 031.8
32.333.033.734.4
Otherhold-ers
4.8
8.49.09.8
10.811.712.714.216.117.3
14.615.115.616.1
16.316.717.017.3
Farm
Allhold-ers
6.4
7.37.88 39 19.9
10.511.312.313.1
11.511.912 212.3
12.512.813.013.1
Finan-cial
insti-tutions
1.51.3
2 83.03 33 63.94.04.24 54.7
4.34.44 44.5
4.54.64.74.7
Otherholders 2
4.93.4
4.44.85 05 46.06.57.17 88.4
7.37.57 77.8
8.08.28.38.4
P Preliminary.1 Derived figures, which include negligible amount of farm loans held
by savings and loan associations.2 Derived figures, which include debt held by Federal land banks and
Farmers Home Administration.NOTE.—Figures for first three quarters of each year are Federal Reserve
estimates. Financial institutions represent commercial banks (includingnondeposit trust companies but not trust departments), mutual savingsbanks, life insurance companies, and savings and loan associations.Selected Federal agencies are FNMA, FHA, VA, PHA, Farmers Home
Administration, and Federal land banks, and in earlier years RFC,HOLC, and Federal Farm Mortgage Corporation. Other Federalagencies (amounts small or separate data not readily available currently)are included with individuals and others.
Sources.—Federal Deposit Insurance Corporation, Federal HomeLoan Bank Board, Institute of Life Insurance, Departments of Agri-culture and Commerce, Federal National Mortgage Association, FederalHousing Administration, Public Housing Administration, VeteransAdministration, Comptroller of the Currency, and Federal Reserve.
MORTGAGE LOANS HELD BY BANKS i
[In millions of dollars]
End of yearor quarter
19411945
1952 . . . .195319541955 . . .19561957195819591960^
1959 MarJune . .SeptDec
I960 Mar.?Junep
Sept p
Dec P
Commercial bank holdings 2
Total
4,9064 772
15,86716,85018,57321,00422,71923,33725,52328,14528,803
426,13027,06027,63528,145
28,23528,470
528,65028,803
Residential
Total
3,2923 395
12,18812,92514,15215,88817,00417,14718,59120,32020,373
19,02019,61520,04020,320
20,30020,34020,37520,373
FHA-in-
sured
3,6753,9124,1064,5604,8034,8235,4766,1225,844
5,6605,8856,0456,122
6,0455,9805,9055,844
VA-guar-
anteed
3,0123,0613,3503,7113,9023,5893,3353,1612,864
3,3053,2303,1753,161
3,1203,0302,9152,864
Con-ven-
tional
5,5015,9516,6957,6178,3008,7359,780
11,03711,665
10,05510,50010,82011,037
11,13511,33011,55511,665
Othernon-farm
1,048856
2,6212,8433,2633,8194,3794,8235,4616,2376,780
5,6055,8756,0106,237
6,3456,4856,6256,780
Farm
566S2t
,0581,082,159
1,297336
1,367,471
1,5881,650
[,5051,5701,5851,588
1,590,645
1,6501,650
Mutual savings bank holdings3
Total
4,8124 208
11,37912,94315,00717,45719,74621,16923,26324,99226,927
423,63824,11024,60024,992
25,41025,86526,42526,927
Residential
Total
3 8843 387
9,88311,33413,21115,56817,70319,01020,93522,48624,240
21,25721,67622,12622,486
22,87923,30823,82724,240
FHA-in-
sured
3,1683,4893,8004,1504,4094,6695,5016,2756,970
5,6845,9156 0956,275
6,4206,5736,7506,970
VA-guar-
anteed
2,2373,0534,2625,7737,1397,7908,3618,5899,100
8,4358,5108 5808,589
8,7318,8859,0609,100
Con-ven-
tional
4,4774 7925,1495 6456,1556 5517,0737 6228 170
7,1387,2517 4517 622
7,7287,8508,0178,170
Othernon-farm
900797
1,4441 5561,7401 8311,9842,1022,2752 4512 633
2,3282,3802 4202,451
2,4772,5042,5452,633
Farm
2824
535356585957535554
53545455
54535354
P Prelimiary.1 Represents all banks in the United States and possessions.2 Includes loans held by nondeposit trust companies, but excludes
holdings of trust departments of commercial banks. March and Septem-ber figures are Federal Reserve estimates based on data from MemberBank Call Report and from weekly reporting member banks.
3 Figures for 1941 and 1945, except for the grand total, are estimatesbased on Federal Reserve preliminary tabulation of a revised series ofbanking statistics. March and September figures are Federal Reserveestimates based in part on data from National Association of MutualSavings Banks.
4 On Jan. 1, 1959, holdings of commercial banks increased by $143million, and those of mutual savings banks declined by that amount,as a result of the absorption of a mutual savings bank by a commercialbank.
5 Data reflect a $40 million reclassification by one bank from commer-cial and industrial to real estate loans, reported August 24, 1960.
Source.—All-bank series prepared by Federal Deposit InsuranceCorporation from data supplied by Federal and State bank supervisoryagencies, Comptroller of the Currency, and Federal Reserve.
Digitized for FRASER Federal Reserve Bank of St. Louis

342 REAL ESTATE CREDIT
MORTGAGE ACTIVITY OF LIFE INSURANCE COMPANIES
[In millions of dollars]
Year or month
19411945
1952 . . .195319541955 . . . .195619571958 . . . .1959.1960P
1959—Dec
1960 TanFebMar . . .
MayJune .JulyAugSeptOctNovDec . . . .
1961 Jan
Loans acquired
Total
976
3,9784,3455,3446,6236,7155,2305,2775,9756,074
670
582445544483476490420536472507503616
569
Nonfarm
Total
3,6063,9254,9316,1086,2014,8234,8395,4795,600
621
530405483443438456392504446477465561
524
FHA-insured
864817672971842653
1,3011,5351,393
151
13911712211010110890
133118117124114
167
VA-guar-anteed
429455
1,3781,8391,652
831195199303
35
862828172321221918161312
12
Other
2,3132,6532,8813,2983,7073,3393,3433,7453,904
435
305260333316314327280352310344328435
345
Farm
372420413515514407438496474
49
524061403834283226303855
45
Loans outstanding (end of period)
Total
6,4426,636
21,25123,32225,97629,44532,98935,23637,06239,19741,798
39,237
39,57339,76940,01140 23640,43940,63140,69440,92041,09941,31341,52141,798
42,008
Nonfarm
Total
5 5295,860
19,54621 43623,92827,17230 50832,65234,39536 37038,803
36,411
36,75336 93337,15537 35837,54537,72237,76937,98238,15338 35638,55338,803
39,021
FHA-insured
8151,394
5,6816,0126,1166,3956,6276,7517,4438 2739,043
8,293
8,4118 4848,5598 6238,6778,7278,7298 8018,8678 9309,0049,043
9,134
VA-guar-anteed
3,3473 5604 6436,0747 3047 7217,4337 0866,929
7,102
7,1627 1507,1357 1177,0987,0807,0577 0287,0066 9786 9516,929
6,899
Other
4 7144,466
10,51811 86413 16914,70316 57718 18019,51921 01122,831
21,016
21,18021 29921,46121 61821,77021,91521,98322 15322,28022 44822 59822,831
22,988
Farm
913776
1,7051 8862 0482,2732 4812 5842,6672 8272,995
2,826
2,8202 8362,8562 8782,8942,9092,9252 9382,9462 9572 9682,995
2,987
v Preliminiary.NOTE.—Certain mortgage loans secured by land on which oil drilling
or extracting operations are in process are classified with farm throughJune 1959 and with "other" nonfarm thereafter. These loans totaled$38 million on July 31, 1959.
For loans acquired, the monthly figures may not add to annual totals,and for loans outstanding, the end-of-December figures may differ from
end-of-year figures, because monthly figures represent book value ofledger assets whereas year-end figures represent annual statement assetvalues, and because data for year-end adjustments are more complete.
Source.—Institute of Life Insurance; end-of-year figures are fromLife Insurance Fact Book, and end-of-month figures from the Tally ofLife Insurance Statistics.
MORTGAGE ACTIVITY OF SAVINGS AND LOAN ASSOCIATIONS
[In millions of dollars]
Year ormonth
19411945
1954.195519561957195819591960
1960
JanFebMarAprMayJuneJulyAugSeptOctNovDec
1961
Jan.p
Loans made
Total i
1 3791,913
8 96911,25510 32510,16012,18215 15114 304
868975
1,1441,1511 2321 3971,2681,4131,3161,2501,1401 150
967
Newcon-
struc-tion
437181
3 0763,9843 6993,4844,0505 2014 678
291339405404435471408430402394332367
285
Homepur-chase
5811,358
3,8465,1554,6204,5915,1726 6136,132
377405458461509598569651591545508460
400
Loans outstanding (end of period)
Total 2
4 5785,376
26,10831,40835,72940,00745,6275^,19460,084
53,51053,90854,45555,02055,65556,43557,05057,76358,40659,01159,51260,084
60,446
FHA-in-
sured
1,1701,4041,4861,6432,2062,9973,523
3,0433,0853,1263,1653,2113,2553,3043,3573,3983,4473,4873,523
3,561
VA-guar-anteed
4,7095,8836,6437,0117,0777,1927,211
7,1967,2017,2157,2147,2277,2287,2337,2297,2257,2167,2147,211
7,194
Con-ven-
tional2
20,22924,12127,60031,35336,34443,00549,350
43,27143,62244,11444,64145,21745,95246,51347,17747,78348,34848,81149,350
49,691
» Preliminary.
1 Includes loans for other purposes (for repair, additions and alterations,refinancing, etc.) not shown separately.
2 Beginning 1958 includes shares pledged against mortgage loans.Source.—Federal Home Loan Bank Board.
NONFARM MORTGAGE RECORDINGS OF $20,000 OR LESS
[In millions of dollars]
Year ormonth
1941.1945.
1953.1954.1955.1956.1957.1958.1959.1960.
1959
Dec .
1960
JanFebMar
MayJuneJulyAugSeptOctNovDec
Total
Season-allyad-
justed i
Withoutseasonal
adjust-ment2
2,485
2,4872,4302,4412,4002,4462,4272,4932,4882,4642,4512,426
4,7325,650
19,74722,97428,48427,08824,24427,38832,23529,341
2,487
2,0792,1492,4062,3662,5002,6902,5282,7842,5982,5252,3782,338
By type of lender(without seasonal adjustment)
Sav-ings &loan
assns.
1,4902,017
7,3658,31210,4529,5329,21710,51613,09412,158
963
777859983983,051,167,048,201,097,053978961
Insur-ancecom-
panies
404250
,480,768,932,799,472,460,523,318
3,6804,2395,6175,4584,2645,2045,8324,520
138
1071031191081141191161231111069795
Com-mer-cial
banks
1,1651,097
410
343342377382402415378406381372363361
Mutual
ingsbanks
218217
1,3271,5011,8581,8241,4291,6401,7801,557
152
115104104106120138145158145146141132
1 Three-month moving average, seasonally adjusted by Federal Re-serve.
2 Includes amounts for other lenders, not shown separately.Source.—Federal Home Loan Bank Board.
Digitized for FRASER Federal Reserve Bank of St. Louis

REAL ESTATE CREDIT 343
GOVERNMENT-UNDERWRITTEN RESIDENTIAL LOANS MADE
[In millions of dollars]
Year or month
1945
19521953.195419551956 . .1957195819591960 . .
I960 JanFebMarApr . . . .MayJune .JulyAugSeptOctNovDec
1961 Jan
FHA-insured loans
Total
665
3,1133,8823,0663,8073,4613,7156,3497,6946,293
514464463433456539509615613573558558
564
Homemortgages
Newprop-erties
257
9691,2591,0351,2691 133
8801,6662,5632,197
221198193172155170162189192196181167
186
Ex-istingprop-erties
217
9741,030
9071,8161,5051,3712,8853,5072,403
196170168163167195200228233237223223
224
Proj-
typemort-gages i
20
322259232
76130595929628711
1928352245715997
119467892
89
Prop-ertyim-
prove-ment
loans 2
171
8481,334
891646692869868997982
7868677688
10388
10068947776
65
VA-guaranteed loans
Total 3
192
2,7193,0644,2577,1565 8683,7611,8652,7871,985
195170173153155175160181169162150142
130
Homemortgages
Newprop-erties
1,8232,0442,6864,5823,9102,8901,3112,0511,554
148133137123124143126139132125113109
101
Ex-istingprop-erties
8901,0141,5662,5641 948
863549730428
473636293132344137363733
28
MORTGAGE DEBT OUTSTANDING ONNONFARM 1- TO 4-FAMILY PROPERTIES
[In billions of dollars]
* Monthly figures do not reflect mortgage amendments included in annual totals.2 These loans are not ordinarily secured by mortgages.3 Includes a small amount of alteration and repair loans, not shown separately; only such
loans in amounts of more than $1,000 need be secured.NOTE.—FHA-insured loans represent gross amount of insurance written; VA-guaranteed
loans, gross amount of loans closed. Figures do not take account of principal repaymentson previously insured or guaranteed loans. For VA-guaranteed loans amounts by typeare derived from data on number and average amount of loans closed.
Sources.— Federal Housing Administration and Veterans Administration.
End ofyear orquarter
1945
19521953195419551956195719581959PI960?
1959—Mar.*\...June*1
Sept.*...Dec*
I960—Mar.*....June*7 . . . .Sept.**....Dec.p
Total
18 6
58.566 175 788 299 0
107.6117 7130 8141.8
120.5124.3128.0130.8
133.2136.1139.1141.8
Government-underwritten
Total
4 3
25.428 132.138 943 947.250 153.856.4
51.352.153.153.8
54.555.055.856.4
FHA-m-
sured
4 1
10.812 012.814 315.516.519 723.826.7
20.921.822.923.8
24.625.226.026.7
VA-guar-anteed
2
14.616 119.324 628 430.730 430 029.7
30.430.330.230.0
29.929.829.829.7
Con-ven-
tional
14 3
33.138 043.649 355 160.467 677.085.4
69.272.274.977.0
78.781.183.385.4
v Preliminary.tal debt outstanding, 1
three quarters of year are Federal Reserve estimates.For conventional, figures are derived.
Sources.—Federal Home Loan Bank Board, FederalHousing Administration, Veterans Administration, andFederal Reserve.
FEDERAL NATIONAL MORTGAGE ASSOCIATION ACTIVITY *
[In millions of dollars]
FEDERAL HOME LOAN BANKS
[In millions of dollars]
1952195319M195519561957195819591960
ind of yearor month
I960 T a n
FebMarAprMayJuneJulyAugSeptOctNov
1961 Tan
Mortgage holdings
Total
2 2422,4622,4342,6153,0473,9743,9015,5316,159
5,5085,5775,6935,7855,8275 8275,9185,9916,0506,1066,1436,159
6,154
FHA-in-
sured
320621802901978
1,2371,4832,5463,356
2,6212,7132,8212,9052,9973,0423,1213,1853,2403,2933,3333,356
3,357
VA-guar-
anteed
1 9221,8411,6321,7142,0692,7372,4182,9852,803
2,8872,8642,8732,8802,8302,7842,7972,8062,8102,8122,8102,803
2,797
Mortgagetransactions
(duringperiod'
Pur-chases
538542614411609
1,096623
1,9071,248
11013816212612974
1139684796969
56
Sales
56
"PS6?
S3
48?5
357
11549
126750
3
119
27
33
Com-mit-
mentsun-dis-
bursed
323638476
76360764
1,541568576
600601580588561592569584584571575576
564
1 Operations beginning with Nov. 1, 1954, are on the basis of FNMA'snew charter, under which it maintains three separate programs: secondarymarket, special assistance, and management and liquidation. Data ex-clude conventional mortgage loans acquired by FNMA from the RFCMortgage Company, the Defense Homes Corporation, and the PublicHousing Administration.
Source.— Federal National Mortgage Association.
Year or month
1945
19531954195519561957195819591960
I960—Feb...Mar..Apr...May..June..July..Aug..Sept..Oct...Nov..Dec...
1961—Jan...Feb...
Ad-vances
1
1121
278
728734
,251745
,116,364,067,943
5888
155112290173168160133125344
90100
Repay-ments
1112
213
640818702934079
,331231
,097
1691961179694
269146121134119104
500176
Advances outstanding(end of period)
Total
195
952867
1,4171,2281,2651,2982,1341,981
1,6281,5201,5581,5741,7701,6741,6961,7361,7351,7411,981
1,5711,496
Shortterm*
11
1
1
176
634612991798731685
,192,089
963858828827932922967
,002986976
,089
C888822
Long-t e rm 2
19
317255426430534613942892
665662731747838751729734749765892
683674
Members'demandand timedeposits
46
558802698683653819589938
488534571590736682730737762788938
959978
c Corrected.1 Secured or unsecured loans maturing in one year or less.2 Secured loans, amortized quarterly, having maturities of more than
one year but not more than ten years.Source.—Federal Home Loan Bank Board.
Digitized for FRASER Federal Reserve Bank of St. Louis

344 CONSUMER CREDIT
CONSUMER CREDIT, BY MAJOR PARTS
[Estimated amounts of short- and intermediate-term credit outstanding, in millions of dollars]
End of year or month
193919411945
1954195519561957195819593I960
I960—JanFebMarAprMav.June ,JulyAug.Sept.OctNovDec
1961—Jan..
Total
7,2229,1725,665
32,46438,88242,51145,28645,544S2,11956 049
51,46851,18251,29852,35352 99153,66253,80954 09254,26554,34454,626^ 6 049
55,021
Instalment credit
Total
4,5036,0852,462
23,56828,95831,89734,18334,05739,85243,281
39,73839,78540,02040,65141,12541,75242,05042,37842,51742,59142,70343,281
42,782
Auto-mobilepaper i
1,4972,458
455
9,80913,47214,45915,40914,23716,54917.866
16,51916,62616,82617,17017,43117,75517,89318,02018,02117,99217,96717,866
17,611
Otherconsumer
goodspaper i
1,6201,929
816
6,7517,6348,5808,7828,923
10,47611,215
10,38610,25410,19210,28110,33910,46210,45210,47710,54310,62510,71511 215
11,050
Repairand mod-ernization
loans2
298376182
1,6161,6891,8952,0892,3272,7843,008
2,7692,7722,7832,8142,8652,9052,9342,9753,0013,0133,0203,008
2,967
Personalloans
1,0881,3221,009
5,3926,1636,9637,9038,570
10,04311,192
10,06410,13310,21910,38610 49010,63010,77110,90610,95210,96111,00111 192
11,154
Noninstalment credit
Total
2,7193,0873,203
8,8969,924
10,61411,10311,48712,26712 768
11,73011,39711,27811,70211,86611,91011,75911,71411,74811,75311,92312 768
12,239
Single-payment
loans
787845746
2,4083,0023,2533,3643,6274,1444,311
4,0564,1294,1914,2264,3134,2944,2654,2764,3174,2724,3014 311
4,314
Chargeaccounts
1,4141 6451,612
4,4854,7954 9955,1465,0605,1045 187
4,5954,1043 9274,2454 3424,4234,3114 2774,2834,3704,4635 187
4,599
Servicecredit
518597845
2,0032,1272 3662,5932,8003 0193 270
3,0793,1643 1603,2313 2113,1933,1833 1613,1483,1113,1593 270
3,326
* Represents all consumer instalment credit extended for the purposeof purchasing automobiles and other consumer goods, whether held byretail outlets or financial institutions. Includes credit on purchases byindividuals of automobiles or other consumer goods that may be usedin part for business.
2 Represents repair and modernization loans held by financial institu-tions; holdings of retail outlets are included in other consumer goods
3 Includes data for Alaska and Hawaii beginning with January andAugust 1959, respectively.
NOTE.—Monthly figures for the period December 1939 through 1946,and a general description of the series, are shown on pp. 336-54 of theBULLETIN for April 1953; monthly figures for 1947-57, in the BULLETINfor April 1953, pp. 347-53; October 1956, pp. 1035-42; December 1957,
•p. 1420-22; November 1958, p. 1344; and November 1959, pp. 1416-17.Revised monthly data for 1958 and 1959 (with notes describing the
changes) are shown on pp. 1406-09 of the BULLETIN for December 1960.A detailed description of the methods used to derive the estimates may beobtained from Division of Research and Statistics.
pp.Re^
INSTALMENT CREDIT, BY HOLDER
[Estimated amounts outstanding, in millions of dollars]
End of yearor month
193919411945
1954195519561957195819594I960
I960 JanFeb .MarAprMayJuneJulyAugSeptOctNovDec
1961—Jan
Totalinstal-mentcredit
4,5036,0852,462
23,56828,95831,89734,18334 05739,85243,281
39,73839,78540,02040,65141,12541 75242,05042,37842,51742 59142,70343,281
42,782
Total
3,0654,4801,776
19,45024,45027,15429,51529 07434,17637,502
34,33234,57634,76435,43135,90236 48136,85737,19937,31837,33037,36837,502
38,186
Financial institution
Com-mercialbanks
1,0791,726
745
8,79610,60111,77712,84312,78015,22716,398
15,36615,43315,44015,71115,91116,14516,23916,36216,41616,40816,40216,398
17,261
Salesfinancecom-panies
1,1971,797
300
6,1448,4439,1009,5738,740
10,14511,134
10,16810,27610,35710,60410,74410,94511,06211,14211,15411,14711,14111,134
11,030
Creditunions
132198102
1,3421,6782,0142,4292,6683,2803,906
3,2723,3083,3813,4713,5373,6263,6793,7543,7953,8333,8703,906
3,860
i
Con-sumerfinancecom-
panies^
2,2572,6563,0563,3333,3843,7744,212
3,7873,8073,8213,8723,9023,9574,0494,0994,1114,0974,1074,212
4,179
Other i
657759629
9111,0721,2071,3371.502
,750,852
,739,752,765
1,7731,8081,8081,8281,8421,8421,8451.8481,852
1,856
Retail outlets
Total
1,4381,605
686
4,1184,5084,7434,6684,9835,6765,779
5,4065,2095,2565,2205.2235,2715,1935,1795,1995,2615,3355,779
4,596
Depart-ment
stores2
354320131
1,2421,5111,4081,3931 8822,2922,401
2,1031,9972,0982,0502,0542,0732,0202,0122,0492,1032,1552,401
1,342
Furni-ture
stores
439496240
984,044,187,210,128,225,189
,189,167
1,1441,1351,1251,132,124
1,1321,1291,1301,140.189
1,151
House-holdappli-ance
stores
183206
17
377365377361292310292
304299294290290291290290291290288292
286
Auto-mobile
dealers 3
12318828
463487502478506481513
480482487496503512516520519518517513
504
Other
339395270
1 0521,1011 2691,2261 1751,368J.384
,3301,264I 233I 2491,251I 263I 2431,2251,211I 220
235.184
1,313
1 Consumer finance companies included with "other" financial institu-tions until September 1950.
2 Includes mail-order houses.
3 Represents automobile paper only; other instalment credit held byautomobile dealers is included with "other" retail outlets.
4 See note 3 to table above.
Digitized for FRASER Federal Reserve Bank of St. Louis

CONSUMER CREDIT 345
INSTALMENT CREDIT HELD BY COMMERCIAL BANKS,BY TYPE OF CREDIT
[Estimated amounts outstanding, in millions of dollars]
End of yearor month
193919411945
19541955195619571958195911960
I960 JanFebMarApr . . . . .MayJune . . .JulvAugSeptOctNovDec
1961—Jan
Totalinstal-mentcredit
1,0791,726
745
8,79610,60111,77712,84312,78015,22716,398
15,36615,43315,44015 71115,91116,14516,23916,36216,41616 40816,40216,398
17,261
Automobilepaper
Pur-chased
237447
66
2,2693,2433,6514,1304,0144,8275,264
4 8174,8454,9005 0045,0885,1955 2425,2905,3135 3115,3045,264
5,196
Direct
178338143
1,6682,0622,0752,2252,1702,5252,776
2,5352,5612,6092,6752,7262,7652,7772,7902,7782,7762,7832,776
2,757
Othercon-
sumergoodspaper
166309114
1,8802,0422,4642,5572,2692,6402,690
2,7812,7772,6552,6622,6672,6842 6902,6842,6862 6812,6702,690
3,683
Repairand
mod-erniza-
tionloans
135161110
1,3031,3381,4691,5801,7152,0392,163
2 0282,0242,0232 0452,0752,1052 1192,1442,1622,1702,1732,163
2,131
Per-sonalloans
363471312
1,6761,9162,1182,3512,6123,1963,505
3,2053,2263,2533,3253,3553,3963,4113,4543,4773,4703,4723,505
3,494
INSTALMENT CREDIT HELD BY SALES FINANCECOMPANIES, BY TYPE OF CREDIT
[Estimated amounts outstanding, in millions of dollars]
End of yearor month
193919411945
19541955195619571958195911960
I960—Jan..Feb..Mar.Apr.May.JuneJuly.Aug.Sept.Oct..Nov.Dec.
1961—Jan..
Totalinstal-mentcredit
1,1971,797
300
6,1448,4439,1009,5738,740
10,14511,134
10,16810,27610,35710,60410,74410,94511,06211,14211,15411,14711.14111,134
4,8706,9197,2837,4706,4047,3287,695
7,3057,3427,4077,5387,6317,7677,8227,8557,8327,7967,7577.695
L030
Auto-mobilepaper
8781,363164
7.555
Othercon-
sumergoodspaper
11516724
8411,0341,2271,4131,5671,8832,374
1,9221,9821,9882,0962,1322,1752,2252,2602,2922,3192,3472,374
)2,412 i
Repairand
modern-izationloans
14820158
31252320193564
363739424549525760636364
Per-sonalloans
566654
402465567670750899
1,001
905915923928936954963970970969974
| 1,001
ii 9 9 9
i Includes data for Alaska and Hawaii, beginning with January andAugust 1959, respectively.
1 Includes data for Hawaii, beginning with August 1959.
INSTALMENT CREDIT HELD BY FINANCIAL INSTITUTIONSOTHER THAN COMMERCIAL BANKS AND SALES
FINANCE COMPANIES, BY TYPE OF CREDIT
NONINSTALMENT CREDIT
[Estimated amounts outstanding, in millions of dollars]
[Estimated amounts outsi
End of yearor month
193919411945
195419551956 . . .19571958195911960
I960—JanFebMarApr.May . . . .JuneJulyAugSeptOctNovDec
1961—Jan
Totalinstal-mentcredit
789957731
4,5105,4066,2777,0997,5548,8049,970
8,7988,8678,9679,1169,2479,3919,5569,6959,7489,7759,8259,970
9,895
anding, in millions of dollars]
Auto-mobilepaper
8112254
5397619 4 8
[,1061,1431,3881,618
1,3821,3961,4231,4571,4831,5161,5361,565[,579,591,606
I 618
,599
Othercon-
sumergoodspaper
243620
375537648622610758885
757768780799820844860874885882880885
863
Repairand
modern-izationloans
151414
282326403489593710781
705711721727745751763774779780784781
772
Per-sonalloans
669785643
3,3143,7824,2784,8825,2085,9486,686
5,9545,9926,0436,1336,1996,2806,3976,4826,5056,5226,5556,686
6,661
i Includes data for Alaska and Hawaii, beginning with January andAugust 1959, respectively.
NOTE.—Institutions represented are consumer finance companies, creditunions, industrial loan companies, mutual savings banks, savings andloan associations, and other lending institutions holding consumerinstalment loans.
End of yearor month
193919411945
19541955195619571958195931960
I960—JanFeb.. .Mar...Apr.. .May. .June..July...Aug...Sept...Oct....Nov...Dec...
1961—Jan
Total. • z
mentcredit
2,7193,0873,203
8,8969,924
10,61411,10311,48712,26712,768
11,73011,39711,27811,70211,86611,91011,75911,71411,74811,753f1,92312,768
12,239
Single-payment
loans
Com-mer-cial
banks
625693674
2,0962 6352,8432,9373,1563,5823,737
3,5313,5493,5563,6273,6313,6823,6633,6563,7153,6923,7113,737
3,740
Otherfinan-cial
insti-tutions
16215272
312367410427471562574
525580635599682612602620602580590574
574
Charge accounts
De-part-ment
stores i
236275290
793862893876907958941
824685622656646633584584625661709941
805
Otherretail
outlets
1,1781,3701,322
3,5153 7173,8423,9533,8083^7533,801
3,3783,0342 9173^2063,3053,3823,2953,2363,1993,2663,3263,801
3,346
Creditcards2
177216260317345393445
393385388383391408432457459443428445
448
Servicecredit
518597845
2,0032 1272,3662 5932,800
3*270
3,0793,1643,1603,2313,2113,1933,1833,1613,1483,1113,1593,270
3,326
1 Includes mail-order houses.2 Service station and miscellaneous credit-card accounts and home-
heating-oil accounts.3 Includes data for Alaska and Hawaii, beginning with January and
August 1959, respectively.
Digitized for FRASER Federal Reserve Bank of St. Louis

346 CONSUMER CREDIT
INSTALMENT CREDIT EXTENDED AND REPAID, BY TYPE OF CREDIT
[Estimates of short- and intermediate-term credit, in millions of dollars. The terms "adjusted" and "unadjusted" refer to adjustmentof monthly figures for seasonal variation and differences in trading days]
Year or month
1954 .1955195619571958195911960
I960 Jan .FebM a rAprMay
July . . . .AugSeptOctNovDec
1961—Jan
1954195519561957195819591I960
I960—JanFebMarAprMayJuneJuly
SeptOctNovDec
1961—Jan
1954195519561957. ,1958 . . . .195911960
1960 JanFebMarAprMayJuneJulyAugSeptOctNovDec
1961—Jan
Total
AdjustedUnad-justed
Automobile paper
AdjustedUnad-justed
Other consumergoods paper
AdjustedUnad-justed
Repair andmodernization loans
AdjustedUnad-justed
Personal loans
AdjustedUnad-justed
Extensions
4,1604,1974,2594,4994,2554 3134,2144,0724,1254,1084,1344,007
3,869
31 05139,03940,17542 54540,78949,04550,343
3,5923,7634,2384,5094,3754,6154,1564,3654,0104,0124,0674,641
3,473
J 4541,5341,5911,6361,558I 538,417
1,422[,422[,4601,482
325
1,239
11,80716,74515 56316,54514,31617,94117,839
J 96Q,424
1,6291,6921,658I 733[,4731,5701,3721,4071,364
248
1,130
J 997,171
1,178,266
1,170248
,1681,112
16?1,1651,1591,200
1,185
9,11710,63411 70211,74711,63813,83714,226
1,023061
1,0891,2021,183I 2671,0851,165,173,207
[,217654
1,012
158178177182190186176180164160160147
140
1,2611,3881 5681,6601,8612,2012,058
127149167179203198183202177172163138
117
J T?1[,3141,313[,415[,337I 3411,453
358l|3771,3231,3331,335
1,305
8,86610,27211,34212,59312,97415,06616,220
1,1731,2291,3531,4361,3311 4171,4151,4281,2881,2261,3231,601
1,214
Repayments
3,8483,7653 7773,9353 9113,9343,9973,9183,9583 9943 9463,931
3,972
31243248256434437921715416711418876
-103
30 48833,64937,23640,25940,91543,40746,914
3,7063,7164,0033,8783 9013,9883,8584,0373,8713,9383 9554,063
3,972
5635 3902 9392,286-1265 7953 429
-11447
23563147462729832813974
112578
-499
1.359[,330
3421,379[ 402,392
1,3851,388,375417
[ 3973 5 6
1,387
11 83313,08214,57615,59515,48815 69816,522
1 2991,317t 4291,348I 3971,4091,3351,4431,371[,436
38934Q
1,385
Net increase,
9520424925715614632^4474385
- 3 1
-148
263 663
987950
— 1 1722 3121 317
- 3 0107200344261324138127
1- 2 9- 2 5
-101
-255
1 116J 084
081,111126
,135,148123
,1411471191 5 6
1,154
9 1459,'751
10,75611,54511,49712 30713,487
1.1131,093[,1511,113I 1251,1441,0951,1401,107,125
127154
1,177
148146151150153155155156149160158153
159
J 9551,3151,3621,466,623751
.834
142146156148152158154161151160156150
158
or decrease ( —), in credit outstanding2
1118797
15544
11320
- 1 121184044
31
28883946202141
1 553739
- 9 0-132
- 6 28958
123- 1 0
25668290
500
-165
10322632373121241502
- 6
- 1 9
673
2061942384^7224
- 1 53
11315140294126127
- 1 2
- 4 1
1,2251,2051,2031,2951 2301,2521,3091,2511,2931,2701,2721,266
1,272
96109110120107
8914410784536169
33
8,2559,501
10,54211,65312,30713,65115,071
1,1521,1601,2671,2691,2271,2771,2741,2931,2421,2171,2831,410
1,252
611771800940667
1 4731 149
216986
167104140141135469
40191
- 3 8
1 Extensions and repayments include current data for Alaska andHawaii beginning with January and August 1959, respectively. Thedifferences between extensions and repayments do not equal the changesin outstanding credit for 1959 because the differences do not reflect theeffect of the introduction of outstanding balances for these two States.
2 Obtained by subtracting instalment credit repaid from instalmentcredit extended, except as indicated in note 1.
NOTE.—Monthly figures for 1940-54 are shown on pp. 1043-48 ofthe BULLETIN for October 1956; for 1955-59, in the BULLETIN forDecember 1957, pp. 1420-22, November 1959, p. 1418, and December1960, pp. 1406-09.
A discussion of the composition and characteristics of the data anda description of the methods used to derive the estimates are shownin the BULLETIN for January 1954, pp. 9-17. Estimates of instalmentcredit extended and repaid are based on information from accountingrecords of retail outlets and financial institutions and often include chargesincurred under the instalment contract. Renewals and refinancing ofloans, repurchases and resales of instalment paper, and certain othertransactions may increase the amount of both credit extended and creditrepaid without adding to the amount of credit outstanding.
Digitized for FRASER Federal Reserve Bank of St. Louis

CONSUMER CREDIT 347
INSTALMENT CREDIT EXTENDED AND REPAID, BY HOLDER[Estimates of short- and intermediate-term credit, in millions of dollars. The terms "adjusted" and "unadjusted" refer to adjustment
of monthly figures for seasonal variation and differences in trading days]
Year or month
1954195519561I95711958119591, 2I960
1960 Jan ,FebMarAprMayJuneJulyAugSeptOctNovDec
1961 Jan.i
1954I95519561I957119581I9591, 2I960
I960 JanFebMarAprMayJuneJulyAugSeptOctNovDec
1961—Jan.i. .
1954195519561I95711958119591, 2I960
1960 JanFebMarApr . . . . . . .M ayJune . . . . .JulyAugSeptOctNovDec
1961 Jan 1
T o
Adjusted
tal
Unad-justed
Commerc
Adjusted
ial banks
Unad-justed
Sales financecompanies
AdjustedUnad-justed
Other financialinstitutions
AdjustedUnad-justed
Retail outlets
Adjusted Unad-justed
Extensions
4,1604,1974,2594,4994,2554,3134,2144,0724,1254,1084,1344,007
3,869
3,8483,7653,7773,9353,9113,9343,9973,9183,9583,9943,9463,931
3,972
31,05139,03940,17542 54540,78949,04550,343
3,5923,7634,2384,5094,3754,6154,1564,3654,0104,0124,0674,641
3,473
30,48833,64937,23640,25940,91543,40746,914
3,7063,7164,0033,8783,9013,9883,8584,0373,8713,9383,9554,063
3,972
1,4881,5371,5131,5451,5211,5341,4371,4421,4701,4731,4951,399
1,373
1,4121,3551,3471,3761,4111,4001,3951,3761,3881,4451,4111,376
1,433
11,26714,10914,46315,35514,86017,97617,854
1.368,419
1.5391,6321,6161,6581,4581,5601,4301,4191,3851.370
1,321
11,46912,30413,36214,36014,64715,56016,692
1,3501,3521.4201,3611,4161,4241,3641,4371,3761,4271,3911.374
1,434
915971972
1,028944943894894888896918847
800
Repaj
829810830862850849867870877868876853
855
7,26010,2009 600
10 2008,907
11,00711,110
802860967
1,008983
1,050955989879880872865
737
mients
7,0437,9018,9439,7279,7749,623
10,241
779792886841843849838909867887878872
841
1.064,075
[,0901,1751,124,128
1,233I 1291,1181,072I 078
077
1,028
973974966
1,047985
1,0241,0751,0271,0441,0211,0271.034
1,011
6 9838,4499 474
10 49510,45912,12213 363
920,004116
,167,121185
,201192051
.01110931 302
928
6 5117,5538,6039,673
10,00410,94312,197
926935
1,0161,018
9901,0411,0361,053
998984
1,0431,157
1,003
693614684751666708650607649667643684
668
634626634650665661660645649660632668
673
5,5416,2816,6386 4956,5637,9408,016
502480616702655722542624650702717
1,104
487
5,4655,8916,3286,4996,4907,2817,784
651637681658652674620638630640643660
694
Net increase or decrease ( —) in credit outstanding 3
312432482564344379217154167114188
76
- 1 0 3
5635,3902,9392,286— 1265,7953,429
- 1 1 447
23563147462729832813974
112578
- 4 9 9
197182
54169110134426682288423
916
- 2 0 21,8051,1761,066
— 632,4471,171
13967
7271200234
94123
54- 8- 6- 4
863
86201142246
94942724112842
- 6
- 5 5
2172,299
657473
— 8331,405
989
23108
81247140201117
8012
- 7- 6- 7
- 1 0 4
9110112412813910415810274515143
17
4728968718224S5
1,250,166
- 669
100149131144165139
532750
145
- 7 5
- 6 2- 5 2
16221
147
- 1 0- 3 8
07
16
-981
76390235
— 75315693103
- 2 7 0- 1 9 7
47- 3 6
348
- 7 8- 1 4
206274
444
- 1 , 1 8 3
1 Da ta on extensions and repayments have been adjusted to avoidduplication resulting from large transfers of other consumer goods paper.As a result, the differences between extensions and repayments for sometypes of holders do not equal the changes in outstanding credit.
2 Extensions and repayments include current data for Alaska andHawaii beginning with January and August 1959, respectively. Thedifferences between extensions and repayments do not equal the changesin outstanding credit for 1959 because the differences do not reflect theeffect of the introduction of outstanding balances for these two States.
3 Obtained by subtracting instalment credit repaid from instalmentcredit extended, except as indicated in notes 1 and 2.
NOTE.—Month ly figures for 1940-54 are shown on pp . 1049-54 of
the BULLETIN for October 1956; for 1955-59, in the BULLETINS forDecember 1957, pp. 1421-22, November 1959, p . 1419, and December1960, pp . 1406-09.
A discussion of the composition and characteristics of the data anda description of the methods used to derive the estimates are shown
repaid without adding to the amount of credit outstanding.
Digitized for FRASER Federal Reserve Bank of St. Louis

348 INDUSTRIAL PRODUCTION
INDUSTRY AND SUMMARY MARKET GROUPINGS1947-49= 100
[Seasonally adjusted]
Grouping
Annualaverage
1959 1960
1960 1961
Jan. Feb. Mar. Apr. May June July Aug. Sept. Oct. Nov. Dec. Jan.
INDUSTRY GROUPINGS
Total index.
Manufacturing, total.DurableNondurable
MiningUtilities
Durable Manufactures
Primary and fabricated metals.Primary metals
Iron and steelFabricated metal products
Structural metal parts
Machinery and related products...Machinery
Nonelectrical machineryElectrical machinery
Transportation equipmentMotor vehicles and partsAircraft and other equipment..
Instruments and related products.Ordnance and accessories
Clay, glass, and lumberClay, glass, and stone products.Lumber and products
Furniture and miscellaneous.Furniture and fixturesMisc. manufactures
Nondurable Manufactures
Textile, apparel, and leather products.Textile mill productsApparel productsLeather and products
Paper and printingPaper and productsPrinting and publishing.
Newspapers
Mining
Coal, oil, and gasCoalCrude oil and natural gas.
Oil and gas extraction..Crude oilGas and gas liquids..
Oil and gas drilling
Metal, stone, and earth minerals.Metal miningStone and earth minerals
Utilities
Electric.Gas
159
158165155125268
164
163169160127
125114107142150
197169141212228147390209
128115110145155
205174145222238168368221
168
168180159129280
148147149148156
212180148232251186365220
166
166178157126281
143140142148155
211ill147227250184366218
166
165175158126288
139135136145153
209178147227243173371220
165
164172159129287
133126125142151
206175145225239169368218
167
166174161127284
131119115147156
211178147228249176383222
166
165173163128288
126112105148158
207178148226237176347224
166
165173163128290
124108100148160
209180152226237166372226
165
163169162129293
12210694147160
206176146223237167367227
162
161166159127295
11910290144157
204173143222237168368220
161
160164160128291
11810091144156
201167142208240170371220
159
157159158129290
1119485138151
197167140211226151373221
'156
154156
'156'129-291
108'8880
137
r194466'137214219143
'369'216
Chemical, petroleum^ and rubber productsChemicals and products
Industrial chemicalsPetroleum productsRubber and plastics products
Foods, beverages, and tobaccoFoods and beverages
Food manufacturesBeverages
Tobacco products
143159125
147164133
136126153119
154170143135
215240298158199
128128131117127
12268147145135210
139158118
153171138
136121159113
160172152141
224255320161200
132132134120130
12267147146135
SUMMARY MARKET GROUPINGS
Final products, totalConsumer goodsEquipment, including defense.
Materials
159
146107188
270265
162155188157
145
163133194
289
169162195160
143158127
153173136
138124157119
159176148139
250314157206
131131134120130
12515148146135227159
153119188
279287
170164195167
143159126
152171136
135124155110
755173148137
219248311153204
129130132117123
12269146145134223146
157131183
280289
167160194166
138153122
152166139
136123158111
157171147136
220251317154201
130130133117129
12171144144133229136
159143175
288292
167160196164
143159126
154174138
137122161111
158173148139
256318161201
130131133117133
12211145145133226138
172146199
286291
168162194163
142160122
157177140
140126162116
160174152142
258322161205
132132134122131
12171143143132222144
170142198
284290
171164197162
144164120
158111143
141128162116
160172152143
233263331167214
132132134122131
12264148148137226145
167133201
289289
171165196161
145165122
158177143
140126163115
161173153142
232263331172204
132132134122126
12264149148137
139162113
155173141
138124161116
161111153141
229260330168201
132132135120130
12365149149138
137157114
150169134
133118155109
161173153140
224254320167194
132132135122130
12164148147136
135157111
151168138
133116156113
161112154142
223255314164192
133134136123131
12266148147136
132155105
149167135
131113156112
160168155141
r221'252'318162'191
131131134119133
12463151150139
143
167130205
291
144
167133202
296
144
162127197
297
147
160121201
293
152
163131195
291
170164198161
169162195159
168161195157
16S162195156
166159193153
r129148'106r145'163'130
'127109P152108
159'168152139
'218r251314r158184
132'133135120131
122'67'148147135
148
168147188
290
155
153155155129291
1099283135145
190166135215208129368216
130146111
143159130
124109143
159171152136
216252
"i58*
132132135
12264148147134
154
175153197
164158191150
162156189149
'Revised.
Digitized for FRASER Federal Reserve Bank of St. Louis

INDUSTRIAL PRODUCTION 349
INDUSTRY AND SUMMARY MARKET GROUPINGS
1947-49 = 100
[Without seasonal adjustment]
Grouping
INDUSTRY GROUPINGS
DurableNondurable
MiningUtilities . . . . . .
Durable Manufactures
Primary and fabricated metalsPrimary metals
Iron and steelFabricated metal products
Structural metal carts
MachineryNonelectrical machineryElectrical machinery
Transportation equipment . . .Motor vehicles and partsAircraft and other equipment . .
Instruments and related products
Clay glass and stone products .Lumber and products
Furniture and miscellaneousFurniture and fixturesMisc manufactures
Nondurable Manufactures
Textile apparel and leather productsTextile mill productsApparel products . . . . .Leather and products
Paper and printing . . •Paper and products
Newspapers .
Chemical petroleum and rubber products
Industrial chemicalsPetroleum products
Foods beverages and tobaccoFoods and beverases . . .
Food manufactures
Tobacco products
Mining
Coal oil and sasCoalCrude oil and natural gas.
Oil and sas extraction . . . .Crude oil .Gas and gas liquids . . . . . .
Oil and gas drilling
Metal stone and earth mineralsMetal miningStone and earth minerals
Utilities
ElectricGas
SUMMARY MARKET GROUPINGS
Final products, total
Annualaverage
1959
159
755165155125268
725114107142150
797169141212228147390209
143159125
147164133
136126153119
754170143135
275240298158199
725128131117127
12268
147145135210159
146107188
270265
162155188157
1960
164
755169160127
725115110145155
205174145222238168368221
759158118
153171138
755121159113
750172152141
224255320161200
752132134120130
72267
147146135
145
755133194
289
169162195160
Jan.
168
757181156128
149150152146156
216181150229262199373220
73 /149111
149170131
140127160121
755172144128
223250314157216
72312312898
130
72574
153151139240163
73794
171
297
169162197167
Feb.
169
755181158127
147148148146154
277182152232261196374220
136151119
757170134
145127170122
755177146133
224151322155215
727121125102124
72570
151152139242145
737108167
290
170162198168
Mar.
168
167179158126
144143143144153
215183153231253183379223
133149115
757166138
142124165121
161177150141
226257326153211
722122124114129
72371
148149137240129
141117164
293
170161200166
Apr.
167
755175161128
735132129142150
209178149222245174372220
142158124
750170133
144127171112
752178151148
225262325157207
725125125124127
72270
145146135226131
755138195
281
169162197164
May
755174161128
737121116145154
210177149222247176378221
146164125
757170136
142128167110
752174153151
227260325158201
729129128134135
77969
142142m214141
753163202
269
169162198163
1960
June
166
755172162129
727114106146157
206178149223237174346223
152168133
755173140
136127154113
757176151143
237262326167207
735134133144143
12066
144143133212146
757164210
279
171164197162
July
157
755160153124
7739387
143154
195168145203220149359219
142162117
750169133
124112143103
149156145124
275248312171177
733134135131116
77551
143142132
147
757149213
288
163155193151
Aug.
162
750160165130
7759889
148158
755169139216197117359223
148168125
759177144
144124171122
755174148126
225255317173191
142142144132139
72768
145144133
149
753153214
303
168163191157
Sept.
164
752165164129
7209990
151159
799174141229219145363220
145163124
755176142
729116149111
753174155141
226255316171196
146147152123135
12167
145145134
147
178147210
304
171165194158
Oct.
166
755168167129
72010293
148159
204170140219244175369222
144164122
160176147
137111162114
169183160153
227258317163202
745145150125140
12372
146145133
148
772133212
285
174170192
Nov.
161
759162160128
1139585
141155
207169137220238167372222
132155104
154169142
132116156108
164171159154
222r320
160'195
133134139108133
12466
150149137
149
157119197
280
167162190155
Dec.
154
151'157'149127
'7058678
'137152
197'167'138'214'229157
'371'219
r120'144'92
148'166132
r11410513099
153152154138
'275'247314
'162176
r126127132105106
r124' 65151
r151137
150
149118
'182
294
161'153191148
1961
Jan.
752155153128
7709486
H 4144
795166138
216138376216
77913797
759156125
725111146
156169148125
275251
158
124124129
12563
153152138
157
149120178
162154191149
r Revised.
Digitized for FRASER Federal Reserve Bank of St. Louis

350 INDUSTRIAL PRODUCTION
INDUSTRY GROUPINGS
1957=100
[Seasonally adjusted]
Grouping1957pro-por-tion
Annualaverage
1959 1960
1960 1961
Jan. Feb. Mar. Apr, May June July Aug. Sept. Oct. Nov. Dec. Jan.
Total index.
Manufacturing, total.DurableNondurable
MiningUtilities
Durable Manufactures
Primary and fabricated metals.Primary metals
Iron and steelFabricated metal products
Structural metal parts
Machinery and related products...Machinery
Nonelectrical machineryElectrical machinery
Transportation equipmentMotor vehicles and partsAircraft and other equipment..
Instruments and related products.Ordnance and accessories
Clayy glass, and lumberClay, glass, and stone products.Lumber and products
Furniture and miscellaneous.Furniture and fixturesMisc. manufactures
100.00
86.4949.6636.838.554.96
13.157.736.215.422.91
28.9815.318.926.39
10.765.045.501.661.25
105
10510211095
115
959086
104101
10210399
10898
10094
112
108
10810411497
989188
106103
10610610211210211589
119
111
11211111398120
113115119109104
10911010411810812788118
110
11010911296121
109110114108104
10910810311510712688117
109
11010811296124
106106109107102
10810810411510411889119
109
10910611398123
10199100104101
10610710211410211589117
110
11010711597122
1009492108104
10910910411510612092120
109
11010511697124
968884108106
10710910511410212084121
110
11010611698125
958580109107
10811010711410211390121
108
10810411598126
938376108107
10610710311310111488122
107
70710211396127
918072106105
70510510111210211589118
106
70510111397125
907873105104
10410210010510311689
119
105
10498
11298
125
557468
101101
70210298
10797
10390
119
103r102
96'•111'98
125
r82'"6964
10198
700101r96
1089498
r89116
Nondurable Manufactures
Textile, apparel, and leather productsTextile mill productsApparel productsLeather and products
Paper and printingPaper and productsPrinting and publishing
Newspapers
Chemical, petroleum, and rubber productsChemicals and products
Industrial chemicalsPetroleum productsRubber and plastics products .
Foods, beverages, and tobaccoFoods and beverages
Food manufacturesBeverages
Tobacco products
Mining
Coal, oil, and gasCoalCrude oil and natural gas
Oil and gas extractionCrude oilGas and gas liquidsOil and gas drilling
Metal, stone, and earth mineralsMetal miningStone and earth minerals
Utilities
ElectricGas
4.572.921.65
2.961.481.48
7.322.783.441.10
7.933.274.661.53
70.957.103.611.931.91
10.649.878.311.56
.77
7.051.305.754.984.33
.65
.77
7.50.70.80
3.761.20
777110113
772115109
/75113120106
705111105104
775114118105114
707106106106112
968299999810693
9411108
115114
709110107
775120113
7/5109125101
772112111108
118111121108115
709109109109114
95829810098
'8-5*
70596112
124
112110115
775121112
/75112124106
777115109106
775119125104118
709109109109114
9891991009811593
9887108
119124
7/2110115
775119111
11411112298
770113109105
775118124102117
107107107106108
958498999711385
70795106
120125
708106110
775116114
77511112499
/70112108104
775119126103115
708108108106113
948696999611680
702104101
123126
772110114
777122113
77511012799
7/0113109106
118122126107115
709108108106116
958797999711581
777106115
122125
777111110
779124115
778113127104
772113111108
779123128107117
770109109111115
96989611284
709103114
121125
772114109
720123117
779115127104
7/2112112109
722125132111122
770109109110115
9578991019911585
70797116
773114111
720124117
779113128103
772112112108
722125131115117
770110109111111
9678100102100
709112102
778121115
777111127103
772112113108
720124131112115
770109109109114
9680100102100
707109103
114118109
77210612297
772112112107
778121127111111
770110109110114
95119910199
705109100
775117113
772104122101
773112113108
777121125109110
777111lit112115
96819910199
70310795
773117110
77/10112399
/72110114108
126108109
709109109108117
9711101103101
r700103'96
rl 0114107
108r97
120r96
77/1f9112106
rll5120125105105
770110110109115
9910198
84
70794118
124
85
70796116
126
84
10492114
127
86
703
116
125
10495113
124
87
708107109
124
102
7029511098125
8372679997
9810195109898889116
707101101
709111106
70598113
777111112104
774120
7/0109110
95789910197
90
772111113
For notes see opposite page.
Digitized for FRASER Federal Reserve Bank of St. Louis

INDUSTRIAL PRODUCTION 351
MARKET GROUPINGS
1957= 100
[Seasonally adjusted]
Grouping
Total index
F i n a l p r o d u c t s t o t a l . . . . .Consumer goodsEquipment including defense
Materials
Consumer Goods
Automotive productsAutos . . . .Auto parts and allied products
Home goods and apparelHome goods
Appliances, TV, and radiosAppliancesTV and home radios
Furniture and rugsMisc home goods
Apparel incl knit goods and shoes
Consumer staples.. . .Processed foodsBeverages and tobaccoDrugs soap and toiletriesNewspapers, magazines, and booksConsumer fuel and lighting
Fuel oil and gasolineResidential utilities
ElectricityGas
Equipment
Business eQuipmentIndustrial equipmentCommercial equipmentFreight and passenger equipmentFarm equipment
Materials
Durable goods materialsConsumer durableEquipmentConstruction . . . .Metal materials n.e.c
Nondurable materialsBusiness supplies
ContainersGeneral business supplies
Nondurable materials n e e
Business fuel and powerMineral fuelsNonresidential utilities
ElectricityGeneral industrialCommercial and other
GasIndus t r i a l . . . . . . . . . . .Commercial and other
Supplementary groups of consumer goods
Automotive and home goodsApparel and staples
1957pro-por-tion
100.00
46.7531.1315.6253.25
3.352.031.32
9.604 401.751.26
.491.181.475.20
18 188.112.322.731.443.451.192.261.57
69
12.167.292.461.83
.58
3.46
27.813.678.109 056.99
25.448.872 915.967.05
9.526.292.702 19
.991 12
.51
.33
.18
7.7523.38
Annualaverage
1959
105
107110100104
70596
113
116115114119102119113116
108106108111106113104117118115
70097
10498
115
70010110310789
107108109107115
10096
113113110118113
110110
1960
108
111115103106
777117117
11711511111796
118117118
113109111118114121106
128
70510211810191
70210910110792
770110109111119
10396
121115127
116114
1960
Jan.
I l l
772116103110
727134117
727123130139106122117118
772109111115110117104123122
705104114106109
770121107109115
7/0111111
119
10498
118117114121121
125113
Feb.
110
770113102109
722125117
776117117121105118116116
770107106114109117105123122
70510411310397
709120107108111
770110111109120
10396
119118116121123
119112
Mar.
109
770113104108
114113116
116114112114107114116118
772108108115110119105127127
70510411510293
707117106105107
770109109109120
10396
121120118124124
114113
Apr.
109
777115102108
777116119
779117115116114121116120
773108110118112120108126126
10410211510189
705110104109102
770109108110120
10397
120120115126122
117114
May
110
772117104107
727122119
727121120120118123120122
775109112120113118105125124
70610411710589
70511510411098
770110107112121
10296
120119114125121
121115
June
109
772117103106
727123118
727120118121109122122121
114110112122113120107127126
7051031209989
70211598
11086
/77111108113123
10397
121121117126119
121115
July
110
772116104106
114108122
77911711311997
118121121
775110111122116122109129129
70610412110188
70/11010211086
772113113113123
10397
120121117127
116116
Aug.
108
777115103105
775114118
77711410811687
119118119
774110111120U5123108130131
7051031219583
70010610110984
777111111112121
10498
122123118130
115115
Sept.
107
770114103104
777119113
77311210511093
119114113
114110112119116123106131132
70510112010187
9911297
10681
709110108111117
10396
123124117132
114114
Oct.
106
111115103103
72/123118
//211010311282
115115114
115110113122115121105130130
70599
12110386
9710398
10579
709110107
116
10397
121122113H I
115115
Nov.
105
109113102101
772109116
11211010411478
114114114
113109111118116122105131130
7051001199988
949498
10277
109110106112116
10398
120121112130
111114
Dec.
103
10811210199
70597
118
1111 1 0107
11782
1 1 3112112
114109111118
116122104132130
70298
117r 9 9
97r91959975
r108110109
1 1 0115
102r97119120113128
108113
1961
Jan.
10?
70711110098
9478
118
70S11010511580
109116107
775110
117118
107134
70798
1199697
9087959878
707109111109114
10196
103113
r Revised.NOTE.—Published groupings include some series and subtotals not
shown separately. Detailed description and historical data are availablein Industrial Production—7959 Revision (for announcement of that pub-lication, see the BULLETIN for June 1960, p. 632). Figures for industrial
series and subtotals without seasonal adjustment are published in themonthly Business Indexes release, which is available on request from theDivision of Administrative Services, Board of Governors, of the FederalReserve System, Washington 25, D. C.
Digitized for FRASER Federal Reserve Bank of St. Louis

352 INDUSTRIAL PRODUCTION
INDUSTRY GROUPINGS
1957= 100
[Without seasonal adjustment]
Grouping1957pro-por-tion
Annualaverage
1959 1960
1960 1961
Jan. Feb. Mar. Apr. May June July Aug. Sept. Oct. Nov. Dec. Jan.
Total index.
Manufacturing, total.DurableNondurable
MiningUtilities
Durable Manufactures
Primary and fabricated metals.Primary metals
Iron and steelFabricated metal products
Structural metal parts
Machinery and related products...Machinery ,
Nonelectrical machinery ,Electrical machinery
Transportation equipmentMotor vehicles and partsAircraft and other equipment..
Instruments and related products.Ordnance and accessories
Clay, glass, and lumberClay, glass, and stone products.Lumber and products
Furniture and miscellaneousFurniture and fixturesMisc. manufactures
100.00
86.4949.6636.838.554.96
13.157.736.215.422.91
28.9815.318.926.39
10.765.045.501.661.25
105
10510211095
115
959086
104101
10210399
10898
10094
112
108
10810411497
111
11111111197
111
11211211296
111
11111011395
110
11010811497
109
11010711597
109
11010611698
103
10399
10994
107
10698
11798
108
10810211798
110
11010311998
106
10610011497
101noo
96106
r 9 7
9188
106103
10610610211210211589
119
113118122107104
11211010611611213690
119
112116118107103
11211110711711213490
118
110112114106102
11111210811710812591
120
104104103104100
10810810511310511990
118
1009593106103
10810810511210612091119
978985
107105
10710810511310111983
120
867369
105103
10110210210394
10287
118
907772
109105
9710398
109848086
120
917872
110106
10310699
116949988
119
928075
109106
10510498
11110412089
119
867468
103104
10410397
11210211490
119
816862
101101
102102
r 9 7109r98
107r89
118
Nondurable Manufactures
Textile, apparel, and leather products... .Textile mill productsApparel productsLeather and products
Paper and printingPaper and productsPrinting and publishing
Newspapers
Chemical, petroleum, and rubber productsChemicals and products
Industrial chemicalsPetroleum productsRubber and plastics products
Foods, beverages, and tobaccoFoods and beverages
Food manufacturesBeverages
Tobacco products
Mining
Coal, oil, and gasCoalCrude oil and natural gas
Oil and gas extractionCrude oilGas and gas liquids
Oil and gas drilling
Metal, stone, and earth mineralsMetal miningStone and earth minerals
Utilities
ElectricGas
4.572.921.65
2.961.481.48
7.322.783.441.10
7.933.274.661.53
10.947.103.611.931.91
10.649.878.311.56
.77
7.051.305.754.984.33
.65
.77
1.50.70.80
3.761.20
111110113
112115109
115113120106
108111105104
113114118105114
107106106106112
968299999810693
9411108
115114
109110107
116120113
115109125101
112112111108
118121127108115
109109109109114
95829810098
'85'
10596112
124
102103101
113119107
118114126107
10811210698
117119125104124
10210110489114
7008910310410112296
846898
127
106105108
7/5119110
123114134109
770115107102
118120128103123
70710010193109
988510110410112385
124
104104104
116113
720112130108
112115110108
118122129102121
102101101103113
9787991029912276
908595
125
110112
114119109
122114135100
113116111113
120125129104118
104104102113112
9585971009811577
705100112
120
113113114
115119111
12011513198
113113113116
119124129105115
107107104122119
938495979610983
117118116
115
118117120
775121115
775114121101
112114111110
121125130111119
112111108130125
948097989710886
120119121
119
110113106
114119109
10510011392
10410110795
114118124114101
110111109119102
775116114
121124118
122111134108
11310997
118122126115109
118118117120122
113113113
120123116
77010411799
114113114108
118121125114112
121122124112118
112114110
122123121
116108127102
118119117117
119123126109116
121120122113123
9688989997
70510894
777118116
11210412396
115111117118
117121127107112
11111398117
9780100102100
r94
100
r112117108
97r 9 4
102
70799113105
118125108101
1041051079693
97r ? 9
101103100
86
116108123
123
88
117111123
129
86
114107121
130
87
11097122
122
10186114
120
9686105
102
1019510997
8474699896
10010297108939491116
9395
106109102
707100114
70911010996
774120
103102105
9876103104100
92
9587103
126 !
For notes see opposite page.
Digitized for FRASER Federal Reserve Bank of St. Louis

INDUSTRIAL PRODUCTION 353
MARKET GROUPINGS
1957= 100
[Without seasonal adjustment]
Grouping
Total index . . .
Final vroducts totalConsumer goodsEquipment including defense
Materials
Consumer Goods
Automotive woductsAutosAuto parts and allied products
Home zoods and apparelHome goods
Appliances TV and radiosAppliancesTV and home radios
Furniture and rugsMisc home goods
Apparel, incl. knit goods and shoes
Processed foodsBeverages and tobaccoDross soar) and toiletriesNewspapers magazines and books . . . .Consumer fuel and lighting
Fuel oil and gasolineResidential utilities
ElectricityGas
Equipment
Industrial equipmentCommercial equipmentFreight and passenger equipmentFarm equipment .
Defense equipment
Materials
Durable zoods materialsConsumer durableEquipmentConstructionMetal materials n e e
Nondurable materialsBusiness supplies
ContainersGeneral business supplies . . . .
Nondurable materials n.e.c
Business fuel and powerMineral fuels
ElectricityGeneral industrialCommercial and other
Gas
Commercial and other
Supplementary groups of consumer goods
Automotive and home goods . . . . . . .Apparel and staples
1957pro-por-tion
100.00
46.7531.1315.6253.25
3.352.031.32
9.604.401.751.26
.491.181.475.20
18.188.112.322.731.443.451.192.261.57
.69
12.167.292.461.83
.58
3.46
27.813.678.109.056.99
25.448.872.915.967.05
9.526.292 702.19
.991.12
51.33.18
7.7523.38
Annualaverage
1959
105
107110100104
70596
113
776115114119102119113116
108106108111106113104117118115
70097
10498
115
700101103107
89
107108109107115
10096
113113110118113
110110
1960
108
777115103106
777117117
77711511111796
118117118
775109111118114121106
128
70510211810191
70210910110792
770110109111119
10396
121115127
116114
1960
Jan.
I l l
777115104110
756149116
118115116120106120110120
70910397
115109126108
141
707104115104112
770128109103112
777108105109121
106101
117115120
124112
Feb.
I l l
772115104111
755143118
725121127136106121114125
10810198
114109123105
136
706103115106107
770128109103112
777109108109123
105100
115113117
126112
Mar.
I l l
772114106110
124129116
72212012713996
116116123
709100107117112123103
136
707104116107105
108121108102110
772111109112123
10599
118118119
122112
Apr.
110
777115104109
725126118
72711812013193
120115124
770102112118112118103
126
706103115107100
706109104108104
772113111113123
10297
116115118
120113
May
109
777115105108
124126120
77911711712695
117118122
777104121118112113103
114
70710411710894
70511010311198
777112110113122
10094
116115118
120113
June
109
772116104107
725127121
77711811612692
117120117
114108129120111115106
116
70710411910591
70410998
11493
777112114112121
10194
121117128
121115
July
103
707110102100
70594
116
70710595
10763
11211?.109
775110113114113119108
122
10410211710179
969697
10977
70¥104106103112
9990
124112136
104112
Aug.
107
777115101104
8360
117
120111979698
121120127
779118121122116122110
128
7051021199275
979197
11281
770111118108118
10495
i3i119143
99121
Sept.
108
772117102105
9884
120
775118112110117122123112
722124114121118123108
130
70¥1021219678
70010897
11282
770113
112116
10395
129118142
110119
Oct.
110
114121101105
729134121
779118109107114122125120
720122116125117116104
121
70599
1229985
9910997
11183
772116115116119
10397
123116130
123120
Nov.
106
770115100102
720123114
11411410811199
116121114
114112104120116118105
122
70799
1209578
9510598
10377
770111102
1 1 5119
10298
i is114124
117114
Dec.
101
70610810198
770108112
'702107
r991 0 8
7711611097
77710795
117116127108
136
70299
12096
r95
90r98r97r9671
7061 0 4
941 0 9112
10398
118113125
1 0 8108
1961
Jan.
102
10610910198
9886
118
70610395
10180
108109109
775104
118117
111
70298
11995
100
9092979376
705106105107116
10398
101112
r Revised.NOTE.—Published groupings include some series and subtotals not
shown separately. Detailed description and historical data are availablein Industrial Production—7959 Revision (for announcement of that pub-lication, see the BULLETIN for June 1960, p. 632). Figures for individual
series and subtotals without seasonal adjustment are published in themonthly Business Indexes release, which is available on request from theDivision of Administrative Services, Board of Governors of the FederalReserve System, Washington 25, D. C.
Digitized for FRASER Federal Reserve Bank of St. Louis

354 BUSINESS ACTIVITY
SELECTED BUSINESS INDEXES
[1947-49 = 100, unless otherwise indicated]
Year ormonth
19481949195019511952
195319541955195619571958
19591960
I960—JanFeb .MarAprMay.June.July..Aug..Sept..Oct.. .Nov..D e c .
1961—Jan...Feb
Industrial production
Total
Adj.
10398
113123127
138130146151152141
159P164
168166166165167166166165162161159156
155P155
Major industrygrouping
Manu-fac-tur-ing
Adj.
10397
113123127
139129145150150139
158P163
168166165164166165165163161160157154
153^152
Min-ing
Adj.
10694
105115114
117113125132132120
125PI 27
129126
r126129
'127128128129127128129129
129*127
s
Util-ities
Adj.
101108123140152
166178199218233244
268
280'281288
'287'284'288290293295291290291
291P294
Major market groupings
Final products
Total
Adj.
10299
112121130
138132144150152145
162P169
170167167168171171170169168168166164
162*>162
Con-sumergoods
Adj.
101101115114116
124123136139141140
155P\62
164160160162164165164162161162159158
1562>155
Equip-ment
Adj.
10594
102142170
182161172188189165
188*>195
195194196194197196198195195195193191
1892>189
Mate-rials
Adj.
10496
114124125
137128147151151138
157*160
167166164163162161161159157156153150
149H48
Constructioncontracts *
Resi-den-tial
Unadj.
98116185170183
178232280•99100113
132117
8591
11913613413712213211812811581
90
Allother
Unadj.
105111142172183
201204248•98100107
101112
7979
110118118125142117116121102115
95
Nonag-ricul-
em-ploy-
total2
Adj.
101.699.0
102.3108.2110.4
113.6110.7114.4118.3119.2115.5
118.8120.9
120.9121.1120.8121.5121.4121.5121.5121.3121.2120.7120.2119.4
119 5P118.9
Manu-facturing 3
Em-ploy-ment
Adj.
102.893.899.6
106.4106.3
111.8101.8105.6106.7104.494.3
98.999.1
101.4101.4100.8100.8100.9100.399.698.398.497.496.594.6
93 8*>92.6
Pay-rolls
Unadj.
105.197.2
111.7129.8136.6
151.4137.7152.9161.4162.7148.7
167.3170.2
175.5173.9172.6168.8171.5172.5169.0169.2172.5170.5166.2
'160.6
158 3*156.8
Freightcar-
load-ings
Adj.
1048897
10195
968695979078
8178
908683848377737573787573
7573
Depart-mentstoresales
(retailvalue)
Adj.
10499
107112114
118118128135135136
144145
'147142138154141145149143144150142147
*>142C147
Prices
Con-sumer
Unadj.
102.8101.8102.8111.0113.5
114.4114.8114.5116.2120.2123.5
124.6126.5
125.4125.6125.7126.2126.3126.5126.6126.6126.8127.3127.4127.5
127 4
Whole-sale
com-modity
Unadj.
104.499.2
103.1114.8111.6110.1110.3110.7114.3117.6119.2
119.5119.6
119.3119.3120.0120.0119.7119.5119.7119.2119.2119.6119.6119.5
119.8120.0
•Estimated. * Preliminary. 'Revised.Adj. = adjusted for seasonal variation. Unadj. = without seasonal
adjustment.•See note 1.1 Indexes beginning with 1956 are based on data for 48 States from
F. W. Dodge Corporation, 1957 = 100. Figures for earlier years arethree-month moving averages, based on value data for 37 States east ofthe Rocky Mountains, 1947-49=100; the data for 1956 on this basis
were: residential, 271; all other, 266. A description of the old index,including seasonal adjustments, may be obtained from the Division ofResearch and Statistics.
2 Employees only, excluding personnel in the armed forces.3 Production workers only.NOTE.—Indexes for employment (excluding Alaska and Hawaii),
payrolls, and prices are compiled by the Bureau of Labor Statistics.
CONSTRUCTION CONTRACTS
[Figures for the 48 States, as reported by the F. W. Dodge Corporation. Value of contracts, in millions of dollars]
Type of ownership andtype of construction
Total construction
By type of ownership:PublicPrivate
By type of construction:
NonresidentialPublic works and utilities
Annual totals
1959
36
tl25
17117
,269
,068,201
.150,387,732
1960
36,
P23,
15,12,8,
318
587731
105240973
Jan.
2,193
7271,466
927801465
Feb.
2,240
7021,537
988698554
Mar.
3
1
11
,046
075,971
j?94,067685
Apr.
3,360
1,0672,293
1,4801,048
833
May
3
12
11
,337
0*>5,312
A^,110774
1960
June
3
12
11
,472
,236
,483,110879
July
3,
12,
11,1,
597
413184
-P9152116
Aug.
3,295
1 0182,277
1 4331,177
685
Sept.
3,119
9952,124
1 2771,124
717
Oct.
3
12
11
,319
P 5,194
390,165764
Nov.
2
11
1
,886
071,815
?53916717
Dec.
2,718
1 2181,500
878994846
1961
Jan.
2,485
974813698
NOTE.—Monthly data exceed annual total and are not comparable counting for negative adjustments in monthly data after original figureswith monthly data for earlier years because of a change in policy of ac- have been published.
Digitized for FRASER Federal Reserve Bank of St. Louis

CONSTRUCTION 355
VALUE OF NEW CONSTRUCTION ACTIVITY
[Bureau of the Census estimates.1 Monthly data at seasonally adjusted annual rates. In millions of dollars]
Year or month Total
Private
Total
Non-farmresi-
dential
Business
Total Indus-trial
Com-mercial
Publicutility
Othernon-resi-den-tial
Public
Total Mili-tary
High-way
Sewerand
water
Allother
1952195319541955195619571958
19592I960?
1960—Feb..Mar..Apr.,May.June.July..Aug..Sept..Oct...Nov..Dec.P
1961—Jan.p.Feb.**
34,67037,01939,36244,16445,77947,79548,903
56,20655,148
54,88954,41954,16655,26055,18955,38955,29855,32554,73655,43056,135
54,83554,433
23,88925,78327,68432,44033,06733,77833,491
39,94938,925
39,70939,26338,72238,91639,10339,03438,66038,69738,33138,58138,598
37,88437,331
12,84213,77715,37918,70517,67717,01918,047
24,46922,022
22,53622,39221,93022,18022,36222,30821,78321,71621,22821,42821,490
20,43219,845
7,5008,4958,5319,98011,60812,53511,076
11,08812,245
12,39612,12012,08412,03612,07412,10112,26212,36212,47812,51612,609
12,94012,963
2,3202,2292,0302,3993,0843,5572,382
2,1062,861
1,1371,7912,2123,2183,6313,5643,589
3,9304,072
2,7482,7722,7722,7602,7882,8682,9343,0413,0843,0362,982
4,3564,1164,0563,9603,8813,8703,9224,0364,1334,1984,307
3,0313,037
4,5164,536
4,0434,4754,2894,3634,8935,4145,105
5,0525,312
5,2925,2325,2565,3165,4055,3645.4065,2855,2615,2825,320
5,3935,390
3,5473,5113,7743,7553,7824,2244,368
4,3924,658
4,7774,7514,7084,7004,6674,6254,6154,6194.6254;6374,499
4,5124,523
10,78111,23611,67811,72412,71214,01715,412
16,25716,223
15,18015,15615,44416,34416,08616,35516,63816,62816.40516,84917,537
16,95117,102
1,3871,2901,0031,2871,3601,2871,402
1,4881,355
9961,5121,2361,2001,2831,2651,4301,3921.3541,8191,453
1,4401,334
2,6793,0153,6803,8614,3954,8925,500
5,9165,797
448112304168639768
6,1215,9875,7915,6006,660
5,8765,897
790883982
1,0851,2751,3441,387
1,4671,487
1,5361,5361,5361,5121,4751,455',447,454,465,448,484
,534,599
5,9256,0486,0135,4915,6826,4947,123
7,3867,584
7,2006,9967,3687,4647,6897,8677,6407,7957,7957,9827,940
8,1018,272
v Preliminary.1 Data for 1952-58 are joint estimates of the Departments of Commerce
ad Labor.
2 Beginning 1959, series includes Alaska and Hawaii.
NEW HOUSING STARTS
[Bureau of the Census, Federal Housing Administration, and Veterans Administration. In thousands of units]
Year or month
1952195319541955 . . .1956195719581959
19593I960
I960—JanFebMarAprMayJuneJulyAug.SeptOct.. .NovDec
1961—Jan
Seasonallyadjusted
annual rate(Private only)
Total
1,3661,3671,1121,3271,3331,3021,1821 2921,062
rl,2361,216P984
P 1 , 0 9 8
Nonfarm
1.291
r
P
,347,098,307,315,285,164273
,040,200,203P975
,070
Total
1,1271,1041,2201,3291,1181,0421,2091,379
1,554*l,280
889093
125130127115130102
1 1 096
?73
?72
Metro-politanareas1
795804897976780700827946
1,077878
656667839184808568746651
52
Non-
politanareasi
332300324353338342382432
477401
242527423944354434363022
20
Total
1,0691,0681,2021,3101,094
9931,1421,343
1,517P I . 2 3 8
878890
12412712211112596
r10894
P66
P69
Pri\
1-family
939933
1,0771,190
981840933
1,079
1,234988
697173
10210110090
10276847148
n.a.
'ate
2-family
4642343331333949
5643
333444443333
n.a.
Multi-family
8494908782
120170215
227207
151414182218182017202015
n.a.
Public
5936191924496836
37^42
123o35456
2P7
P3
Government-underwritten 2
Total
42140958367046 322439458
458336
202227333234313529?82619
19
F H A
280252276277195193337349
349261
161822252526242622232014
14
VA
141157307393271128102109
10975
4557787g7655
5
n.a. Not available. p Preliminary. r Revised.1 For new series, based on revised definition of metropolitan areas.2 Data from Federal Housing Administration and Veterans' Ad-
ministration represent units started, based on filed office reports of firstcompliance inspections.
3 New series, including both farm and nonfarm unless otherwiseindicated. Not strictly comparable with nonfarm series developed bythe Bureau of Labor Statistics, for which annual totals are given through1959.
Digitized for FRASER Federal Reserve Bank of St. Louis

356 EMPLOYMENT
LABOR FORCE, EMPLOYMENT, AND UNEMPLOYMENT
[Bureau of Labor Statistics estimates, without seasonal adjustment. In thousands of persons unless otherwise indicated]
Year or month
1954195519561957195819591960
I960 Feb 3
MarAprMayJune.Ju ly . . . .AugSeptOctNov.Dec
1961—JanFeb
Total non-institutionalpopulation
116,220117,388118,734120,445121,950123,366125,368
124,716124 839124,917125,033125,162125,288125 499125,717125,936126,222126,482
126,725126,918
Totallaborforce
67,81868,89670,38770,74671,28471,94673.126
70,97070,99372,33173,17175,49975,21574 55173,67273,59273,74673,079
72,36172,894
Civilian labor force
Total
64,46865 84867,53067,94668,64769,39470,612
68,44968,47369,81970,66773,00272,70672 07071,15571,06971,21370,549
69,83770,360
Employed *
Total
60,89062 94464,70865,01163 96665,58166,681
64,52064 26766,15967,20868,57968,68968 28267 76767,49067,18266,009
64.45264,655
In nonagri-cultural
industries
54,39556 22558,13558,78958 12259,74560,958
59,90159 70260,76561,37161,72261,80561 82861,17961,24461,51661,059
59,81859,947
Inagriculture
6,4956 7186 5726,2225 8445 8365,723
4,6194 5655,3935,8376,8566,8856 4546 5886,2475,6664,950
4,6344,708
Unem-ployed
3,5782 9042 8222,9364 6813 8133,931
3,9314 2063^6603,4594,4234,0173 7883*3883,5794,0314,540
5,3855,705
Not in thelabor force
48,40148 49248 34849,69950 66651 42052,242
53,74653 84552,58751,86249,66350,07450 94852 04552,34452,47653,403
54,36454,024
Unemploy-mentrate
(per cent)2
5.64 44 . 24.36.85.55.6
4.85 55.15.15.45.55 85.76.36.26.8
6.66.8
1 Includes self-employed, unpaid family, and domestic service workers.2 Per cent of civilian labor force. Monthly data are seasonally
adjusted.3 Beginning with January 1960, data include Alaska and Hawaii.
Figures for population increased by about 500,000 and total labor forceby nearly 300,000, most of which was in nonagricultural employment.
NOTE.—Information relating to persons 14 years of age and over isobtained through interviews of households on a sample basis. Monthlydata relate to the calendar week that contains the 12th day; annual dataare averages of monthly figures.
EMPLOYMENT IN NONAGRICULTURAL ESTABLISHMENTS, BY INDUSTRY DIVISION
[Bureau of Labor Statistics. In thousands of persons]
Year or month Total i Manufac-turing Mining Contract
construction
Transporta-tion andpublicutilities
Trade Finance ServiceFederal,
State andlocal
government
1954195519561957195819591960
SEASONALLY ADJUSTED
1960—FebMarAprMayJune.July. . .AugSeptO c t . . . . . . . .NovDec ,
1961—Jan.*>
Feb.P
WITHOUT SEASONAL ADJUSTMENT
I960—FebMarAprMayJuneJulyAugSeptOctNovDec
1961—Jan.*Feb.*>
48,43150,05651,76652,16250,54351,97552,895
52,97252,82353,12853,10553,14053,14553,04652,99852,80952.59152,221
52,27351,996
52,06052,17252,84452,95753,30952,92353,06253,49653,39153,13353,310
51,48051,105
15,99516,56316,90316,78215,46816,16816,336
16,56716,50916,52716,54016,49816,41716,26516,27516,13216,03015,790
15,67715,527
16,52016,47816,38016,34816,42216,25016,38616,50516,31316,12915,836
15,58315,471
777777807809721676664
669666684684678658665660656644638
630622
669666677677681655672663656647641
630622
2,5932,7592,9292,8082,6482,7672,771
2,7812,6012,7522,7832,7902,8582,8352,8002,8042,7832,647
2,6912,605
2,3892,3122,5902,8302,9773,0983,1303,0693,0062,8472,552
2,3792,238
4,0094,0624,1614,1513,9033,9023,902
3,9333,9203,9243,9273,9263,9103,8923,8793,8793.8583,821
3,8303,799
3,8873,9003,9173,9243,9423,9393,9213,9073,8893,8683,843
3,7733,755
10,52010,84611,22111,30211,14111,38511,643
11,62711,59511,65211,67511,71211,73611,76411,66511,66811,56811,541
11.66111,598
11,32911,32511,62011,54311,63711,59111,59211,66511,74211,84212,405
11,49011,301
2,1222,2192,3082,3482,3742,4252,485
2,4642,4562,4632,4692,4712,4802,4992,5152,5142,5122,517
2,5182,524
2,4392,4442,4632,4692,4962,5302,5362,5152,5012,4992,504
2,4932,499
5,6645,9166,1606,3366,3956,5256,637
6,6166,5776,6116,6186,6456,6826,6526,6656,6326,6656,679
6,6586,666
6,4846,5116,6446,7176,7456,7156,6856,6986,6986,6656,612
6,5256,533
6,7516,9147,2777,6267,8938,1278,456
8,3158,4998,5158,4098,4208,4048,4748,5398,5248,5318,588
8,6088,655
8,3438,5368,5538,4498,4098,1458,1408,4748,5868,6368,917
8,6078,686
* Preliminary.i Excludes data for Alaska and Hawaii.NOTE.—Data include all full- and part-time employees who worked
during, or received pay for, the pay period ending nearest the 15th of the
month. Proprietors, self-employed persons, domestic servants, unpaidfamily workers, and members of the armed forces are excluded. Backdata may be obtained from the Bureau of Labor Statistics.
Digitized for FRASER Federal Reserve Bank of St. Louis

EMPLOYMENT AND EARNINGS 357
PRODUCTION WORKER EMPLOYMENT IN MANUFACTURING INDUSTRIES
[Bureau of Labor Statistics. In thousands of persons]
Industry group
Seasonally adjusted
1960
Feb. Dec.
1961
Jan.* Feb.?
Without seasonal adjustment
1960
Feb. Dec.
1961
Jan.* Feb.?
Total
Durable goodsOrdnance and accessoriesLumber and wood productsFurniture and fixturesStone, clay, and glass productsPrimary metal industriesFabricated metal productsMachinery except electricalElectrical machineryTransportation equipmentInstruments and related productsMiscellaneous manufacturing industries.
Nondurable goodsFood and kindred productsTobacco manufacturesTextile-mill productsApparel and other finished textilesPaper and allied productsPrinting, publishing and allied industriesChemicals and allied productsProducts of petroleum and coalRubber productsLeather and leather products
12,537
7,25575
587322452
1,047854
1,173881
1,245231388
5,2821,042
80851
1,073448568534157208321
11,701
6,57974
529304416847786
1,076827
1,125216379
5,1221,022
74807
1.036435570528146187317
11,607
6,48473537299410835763
1,064834
1,081214374
5,1231,034
74804
1,024436573526147187318
11,455
6,34974525296403831744
1,056829
1,009211371
5,1061,032
77801
1,022433576527143184311
12,494
7,26875561328445
1,052863
1,191890
1,245231388
5,22693976860
1,111446565537155209329
11,745
6,61374518310416851794
1,081844
1.125218383
5,13298478819
1,052437579531145191317
11,515
6,46973507303400839771
1,075842
1,081215365
5,04694375808
1,034434573529144189318
11,405
6,35874501302397835751
1,072837
1,009211371
5,04792774809
1,058431573530141185319
v Preliminary.NOTE.—Data covering production and related workers only (full- and
part-time) who worked during, or received pay for, the pay period ending
nearest the 15th of the month.Bureau of Labor Statistics.
Back data may be obtained from the
HOURS AND EARNINGS OF PRODUCTION WORKERS IN MANUFACTURING INDUSTRIES
[Bureau of Labor Statistics. In unit indicated]
Industry group
Average weekly earnings(dollars per week)
Average hours worked(per week)
Average hourly earnings(dollars per hour)
1960
Feb. Dec.
1961 1960
Feb. Dec.
1961 1960
Jan.? Feb. Dec.
1961
Jan.""
Total
Durable goodsOrdnance and accessoriesLumber and wood productsFurniture and fixturesStone, clay, and glass productsPrimary metal industriesFabricated metal productsMachinery except electricalElectrical machineryTransportation equipmentInstruments and related productsMiscellaneous manufacturing industries...
Nondurable goodsFood and kindred productsTobacco manufacturesTextile-mill productsApparel and other finished textilesPaper and allied productsPrinting, publishing and allied industries..Chemicals and allied productsProducts of petroleum and coalRubber productsLeather and leather products
91.14
98.98107.6878.0174.5690.85115.2698.42104.5590.97111.7994.0777.81
79.9586.3361.3764.1656.1194.73104.12101.60116.87100.0060.64
89.55
96.97108.1477.5975.0191.48105.2896.58103.7492.28111.4494.4776.03
80.1889.2469.9561.8852.4495.35106.31104.30119.0799.5859.24
90.02
96.82108.6877.8071.4391.77
107.1696.68
104.9293.53
108.1497.1278.60
81.4190.2366.3561.5654.5496.28106.22104.55125.5599.5762.75
90.02
97.07108.4178.6071.2491.60106.5096.43104.6693.53108.9896.8878.80
80.9889.0466.7062.5954.7095.40105.84104.96123.7397.9161.88
39.8
40.441.139.440.340.240.340.541.039.940.840.239.9
39.039.636.140.136.242.138.041.340.340.037.2
38.6
39.140.238.639.939.637.239.139.939.139.839.238.4
38.040.239.338.233.441.137.740.940.538.935.9
38.8
39.240.438.938.239.937.639.340.239.838.940.339.3
38.440.137.738.034.341.537.841.041.339.237.8
38.8
39.3 j40.3 i39.3 !38.3 I40.0 I37.5 s39.2 i40.1 i39.8 |39.2 !40.2 i39.6 |
38.2 I39.437.938.4 !34.4 {41.337.8 |41.040.738.737.5
2.29
2.452.621.981.852.262.862.432.552.282.742.341.95
2.052.181.701.601.552.252.742.462.902.501.63
2.32
2.482.692.011.882.312.832.472.602.362.802.411.98
2.32 f 2.32
2.472.692.001.872.302.852.462.612.352.782.412.00 1
2.112.221.781.621.572.322.822.552.942.561.65
2.122.251.761.621.592.322.812.553.042.541.66
2.472.692.001.862.292.842.462.612.352.782.411.99
2.122.261.761.631.592.312.802.563.042.531.65
P Preliminary.NOTE.—Data are for production and related workers. Back data are
available from the Bureau of Labor Statistics.
Digitized for FRASER Federal Reserve Bank of St. Louis

358 DEPARTMENT STORES
DEPARTMENT STORE SALES AMD STOCKS, BY DISTRICTS
[Federal Reserve indexes, based on retail value figures. 1947-49 average= 100]
Year or month
SALES i1953 ,195419551956195719581959I960
SEASONALLY ADJUSTED
I960—JanFebMarAprMay
July
SeptOctNovDec
1961—Jan
WITHOUT SEASONAL ADJUSTMENT
I960—JanFebMarApr
JulyAueSeptOctNovDec
1961 Jan
STOCKS i19531954195519561957.19581959I960
SEASONALLY ADJUSTED
1959 Dec
I960 JanFeb..MarAprMay
July
SeptOctNovDec
WITHOUT SEASONAL ADJUSTMENT
1959—Dec
I960—JanFebMarAprMayJuneJuly
Sept .OctNovDec
UnitedStates
118118128135135136144145
142138154141145149143144150142147
111106115150138137122132145153171261
HOB
131128136148152148156
161
161160162159161165167169168167169^167
145
144152165165163157158165176186192
Federal Reserve district
Boston
114117123126122122126128
131130122134125129125124126129129128
126
99939513312412395106131132155249
96
124126132141138136142
^148
145
144143144141146148149153152152151147
135
128134146147149139135148159172177137
NewYork
105108113120124121131135
135133126144131135135137136140131135
129
108102107137127130101109138147167'245
103
120117119130138136142
145
146146147144149149151154153151152149
135
132136149150151140137150161171176140
Phil-adel-phia
111116125131132133140140
146143134151136144142136139145136136
131
108102113153134134108114141149178250
97
129127135148154152160
164
164160159157164168166166166165166164
148
144154164168167156149159114190'191148
Cleve-land
119112122128129128139140
'146136139144139139143139140144136142
140
'109105113144135131116128140145167254
105
125122124133136129134
P149
138
142142145139144150160157154151163145
126
125136149146148142147150160169184132
Rich-mond
127129140146148148156153
156149140168144149156149153162150153
^146
112105114165143139129135154169182283
141138159175178172179
179
178179111181187185187189188184182185
165
158167181188186174172186199209211170
At-lanta
131135149164166169181182
180175162192176183194178185189179187
nil
139137149194173165165170172187206329
^136
155152170195203197210^227
227
227225225224223227227232230231235^228
197
207223237232225213211225239251266"201
Chi-cago
114112122128128125133134
134127125145132134141134132140129137
130
10195108139130129113123136143
238
97
122120127138143139148
^154
154
150147151146152152155158160159158166
134
135139151155155149152155166175177144
St.Louis
120121132118138137144143
150134131159143144144140138149139142
141
111102110150144134119134142152166248
105
131125135148150143144
146
149145148147151152154154152150149147
132
133138150153149143146153161171170133
Minne-apolis
110113117126128128134136
137135123147133137136132134138137138
^134
9899105139127133109132144152154'238
123124130142146137144
»153
146
147145146146150152157162159158157150
136
135139149150150143148158166175179140
KansasCity
123129140144142146155155
156144142164150154159151154164157159
H61
115105119154150146140154159164181274
146141152164160153157
^165
162
162162160157160161165165171173173
146
146156164163161158158163176187196
^156
Dallas
132136149158159159172169
171163164181159170175169166172163171
135122143172159156156165159176190293
143140153168174165178
^187
183
186180182181185192190192189192192
170
163175191189183179180192201211211^168
SanFran-cisco
122122132141140143157156
'157158157159153153159155155160152159
152
'122121126153145147142154152156177282
118
140135142156158155167
3=178
175
178179183176167180180182178179178
160
158165182179166176177181188198205165
» Preliminary. r Revised.l Figures for sales are the average per trading day, while those for stocks
tre as of the end of the month or averages of monthly data.
NOTE.—For description of the series see the BULLETIN for December1957, pp. 1323-36. Back data may be obtained from the Division ofAdministrative Services.
Digitized for FRASER Federal Reserve Bank of St. Louis

DEPARTMENT STORES; FOREIGN TRADE 359
DEPARTMENT STORE MERCHANDISING DATA
[Based on retail value figures]
Period
Annual average:
19521953195419551956195719581959I960
Month:
1960 JanFebMar .AprMayJuneJulyAugSeptOctNovDec
1961 Jan.P
Amounts (in millions
Sales i(total
formonth)
397406409437454459462488492
384362418507448451373452471520584932
369
Stocks i(endof
month)
1,0971,1631,140,195,286
1,338(,3231,391
466
1,3011,3621,4681,4731,4611,3811 3711,4631,5641,6701,7351,339
1,309
Out-stand-
ingorders i(end ofmonth)
435421388446470461437510517
514456417420616678629621581479331
434
of dollars)
Re-ceipts2
(totalfor
month)
397408410444459461462495494
r368425524512436371363544572626649536
339
Neworders 3
(totalfor
month)
401401412449458458464498491
r456480466473439567425495564586547388
442
Ratios to sales4
Stocks
2.93.03 .02 . 93.03.13.03 .03.1
3.43.83.52.93.33.13.73.23.33.23.01.4
3.5
Out-stand-
ingorders
1.21.11.01 11.11.11.01.11.1
1.21.4
o!91.41 81.41.31.10.80.4
1.2
Stocksplusout-
stand-ing
orders
4.14 14 . 04 04 14 .14 14 .14.3
4.65 24.63.74.24.45 54.64.64 33.81.8
4.7
Re-ceipts
.0
oooooo1n
1.0J ?
(
(
(
1.31.0.0
o1.21.2I 2
).6
).9
v Preliminary. r Revised.1 These figures are not estimates for all department stores in the United
States. They are the actual dollar amounts reported by a group of de-partment stores located in various cities throughout the country. In 1959,sales by these stores accounted for about 45 per cent of estimated totaldepartment store sales.
2 Derived from the reported figures on sales and stocks.
3 Derived from receipts and reported figures on outstanding orders.4 The first three ratios are of stocks and/or orders at the end of the
month to sales during the month. The final ratio is based on totals ofsales and receipts for the month.
NOTE.—For description and monthly figures for back years, see theBULLETIN for October 1952, pp. 1098-1102.
MERCHANDISE EXPORTS AND IMPORTS
[Bureau of the Census. In millions of dollars]
Period
JanFebM a rAprMayJuneJuly .AugSeptOctNovDec
Jan -Dec
Merchandise exportsl
1959
1 4011,279I 4591,481t 5581,4271,4701.4101 4871 4821,4821 685
17,621
1960
1.561,576749
,818804
,737,699,609,610744
1,797r l 797
20,500
1961
1,647
Merchandise exports excludingmilitary-aid shipments 2
1959
1 287182378345418
,351,356
1,313I 407I 399I 380
SRO
16,395
1960
1,4841.497
632,703710
,637,629
1,5471,557I 6901,724
74T
19,551
1961
1,539
Merchandise imports3
1959 r
1. 154,119295
,221264
,370,250,188. 395
1 2021,2831,467
15,207
1960 r
1 143289378
,261262
,307,150.229
1 1601 1571,1611 157
14,654
1961
1,124
r Revised.1 Exports of domestic and foreign merchandise.2 Department of Defense shipments of grant-aid military equipment
and supplies under Mutual Security Program.3 General imports including imports for immediate consumption plus
entries into bonded warehouses.
Digitized for FRASER Federal Reserve Bank of St. Louis

360 PRICES
CONSUMER PRICES
[Bureau of Labor Statistics index for city wage-earner and clerical-worker families. 1947-49 =100]
Year or month
1929193319411945
19521953195419551956195719581959
I960—JanFeb.MarAprMayJuneJulyAugSeptOct.NovDec
1961—Jan
Allitems
73.355.362.976.9
113.5114.4114.8114.5116.2120.2123.5124.6
125.4125.6125.7126.2126.3126.5126.6126.6126.8127.3127.4127.5
127.4
Foods
65.641.652.268.9
114.6112.8112.6110.9111.7115.4120.3118.3
117.6117.4117.7119.5119.7120.3120.6120.1120.2120.9121.1121.4
121.3
Housing
Total
114.6117.7119.1120.0121.7125.6127.7129.2
130.7131.2131.3131.4131.2131.5131.3131.5132.0132.2132.1132.3
132.3
Rent
117 483.688.490.9
117.9124.1128.5130.3132.7135.2137.7139.7
140.9141.0141.2141.4141.4141.6141.8141.9142.1142.5142.7142.8
142.9
Gasandelec-
tricity
104.5106.6107.9110.7111.8113.0117.0119.9
123.2124.0124.1124.4124.7124.7124.8124.9125.7125.7125.7125.6
125.9
Solidfuelsand
fuel oil
118.7123.9123.5125.2130.7137.4134.9136.6
139.0139.0137.2136.3132.9132.3132.9133.4134.8136.1136.3137.0
139.6
House-fur-nish-ings
108.5107.9106.1104.1103.0104.6103.9103.9
104.0104.3104.7104.7104.3104.3104.1103.5104.1104.0104.0103.9
103.6
House-hold
opera-tion
111.8115.3117.4119.1122.9127.5131.4134.3
135.9136.3136.9137.0137.2137.3137.4137.6138.0138.1138.3138.3
138.3
Ap-parel
60 345.955.676 3
105.8104.8104.3103.7105.5106.9107.0107.9
107.9108.4108.8108.9108.9108.9109.1109.3110.6111.0110.7110.6
109.4
Trans-porta-tion
126.2129.7128.0126.4128.7136.0140.5146.3
147.6147.5146.5146.1145.6145.8145.9146.2144.7146.1146.5146.5
146.2
Med-icalcare
117.2121.3125.2128.0132.6138.0144.4150.8
153.5154.7155.0155.5155.9156.1156.4156.7156.9157.3157.9158.0
158.5
Per-sonalcare
111.8112.8113.4115.3120.0124.4128.6131.2
132.7132.6132.7132.9133.2133.2133.4133.8133.9134.0133.9133.7
133.7
Read-ingand
recrea-tion
107.0108.0107.0106.6108.1112.2116.7118.6
120.3120.6120.9121.1121.4121.1121.6121.9122.1121.9122.5122.3
122.2
Othergoodsandserv-ices
115.4118.2120.1120.2122.0125.5127.2129.7
131.8131.8131.7131.9131.9132.0132.2132.4132.7132.7132.7132.7
132.6
NOTB.—Revised index, reflecting, beginning with January 1953, the in-clusion of new series (i.e. home purchases and used automobiles) and re-
vised weights. Prior to January 1953, indexes are based on the "interimadjusted" and "old" indexes, converted to the base 1947-49 —100.
WHOLESALE PRICES, BY GROUPS OF COMMODITIES
[Bureau of Labor Statistics index. 1947-49 = 100]
1952.1953.1954.1955.1956.1957.19581959.
1960-
1961-
Year ormonth
JanFebMarAprMayJuneJulyAUKSent.OctNovDec . . . .
—Jan
Allcom-modi-
ties
111.6110.1110.3110.7114.3117.6119.2119.5
119.3119.3120.0120.0119.7119.5119.7119.2119.2119.6119.6119.5
119.8
Farmprod-ucts
107.097.095.689.688.490.994.989.1
86.587.090.491.190.489.088.986.687.789.589.988.7
89.7
Proc-essedfoods
108.8104.6105.3101.7101.7105.6110.9107.0
105.6105.7107.3106.8107.3107.6108.9107.8108.1109.0109.1
'109.2109.8
Total
113.2114.0114.5117.0122.2125.6126.0128.2
128.8128.7128.6128.7128.2128.2128.2128.2127.9128.0127.9127.9
128.1
Tex-tile
prod-uctsandap-
parel
99.897.395.295.395.395.493.595.0
96.696.596.396.396.396.396.396.195.995.895.495.2
95.0
Hides,skins,and
leatherprod-ucts
97.98 .94.93 .99 .99 .
100.114.
112.112.111.112.111.110.110.108.108.108.108.
108.
108.
?
?81463
708
2
171558
3
Fuel,power,
andlight-ingma-
terials
106.6109.5108.1107.9111.2117.2112.7112.7
111.9112.0112.3112.2110.8112.3113.8115.3116.1116.2116.1116.2
117.2
Chem-icalsand
alliedprod-ucts
104.5105.7107.0106.6107.2109.5110.4109.9
109.9110.0110.1110.2110.2110.2110.4110.5110.4110.3110.3110.4
110.4
Rub-berand
prod-ucts
134.0125.0126.9143.8145.8145.2145.0144.5
143.1144.6144.7144.7146.3146.7146.9145.3144.9144.7143.6
141.2
140.1
Other commodities
Lum-berand
woodprod-ucts
1?0120.118123.1?5119.117.125.
125.124.124.124.123.122.121.119.118.117.116.
116.
115.
3?064078
195374567795
8
Pulppaper,and
alliedprod-ucts
116.5116.1116.3119.3127.2129.6131.0132.2
133.7133.2133.1133.1133.4133.5133.5133.0133.0133.4133.1132.3
132.6
Metalsand
metalprod-ucts
123.0126.9128.0136.6148.4151.2150.4153.6
155.5155.3154.5154.5154.2153.8153.4153.6153.5152.8152.3152.2
152.2
Ma-chin-eryandmo-tive
prod-ucts
121.5123 0124.6128.4137.8146.1149.8153.0
153.8153.9153 9154.0153.5153 4153.2153.2151.3152.8
153.7153.6
153.6
Furni-tureand
otherhouse-holddura-bles
112.0114 2115.4115 9119.1122.2123.2123.4
123.4123.5123 7123.5123.2123 0123.1122.9122.8122.7122.6
122.6
122.5
Non-me-tallicmin-
erals—struc-tural
113.6118 2120.9124.2129.6134 6136.0137.7
138.4138.2138 2138.3137.9137 8137.8137.8138.0138.1137.9137.9
138.6
To-baccomfrs.and
bottledbev-erages
110.6115.7120.6121.6122.3126.1128.2131.4
131.7131.7131 7131.7131.7131.7131.8132.0132.0132.0132.0132.1
132.1
Mis-cella-neous
108.397 8
102.592 091.089 694.294 5
95.393.494 095.491.190 990 889.991.190.390.692.4
95.4
r Revised.
Digitized for FRASER Federal Reserve Bank of St. Louis

PRICES 361
WHOLESALE PRICES, BY GROUPS OF COMMODITIES—Continued
[Bureau of Labor Statistics index, 1947-49= 100]
Subgroup1960
Jan.
104.977.278.595.999.356.977.5
127.4
120.792.4
118.8104.5113.3145.2103.9
95.9104.079.4
122.0100.879.3
73.7105.5134.2108.0
124.1170.4116.6101.3114.4
124.1128.3103.093.849.2
109.6108.8106.5
162.8132.2144.6
126.1137.898.2
121.2108.0144.5
Nov.
107.570.381.890.8
102.3108.172.5
129.1
123.196.6
121.7r109.4117.4140.9102.8
91.7101.378.2
125.9101.092.1
65.897.1
132.5104.2
123.0170.4120.2102.4120.6
123.5128.4104.894.348.9
112.1111.9107.4
140.6141.3146.8
115.1135.896.1
121.277.4
145.7
Dec.
99.572.782.890.7
102.387.774.1
130.4
123.5r97.3122.0
110.1116.3140.9100.8
91.2100.877.8
125.7101.092.6
64.999.4
132.5103.9
123.1170.4
120.0102.3120.8
'123.5130.3104.494.348.5
111.8111.9
107.2
136.5137.1146.8
115.0135.5
95.1
114.567.8
145.7
1961
Jan.
106.775.384.890.8
101.475.277.6
128.0
123.598.3
121.2112.1116.2140.9101.1
90.7100.377.4
130.8100.799.6
62.697.9
132.5103.9
123.5170.4120.2102.3122.4
123.1131.5105.094.350.1
112.0112.2107.1
135.5137.2144.6
114.5135.692.5
114.567.8
145.7
Subgroup1960
Jan. Nov. Dec,
1961
Jan.
Farm Products:
Fresh and dried produceGrainsLivestock and poultryPlant and animal fibersFluid milk
Hay and seeds
Other farm products
Processed Foods:
Cereal and bakery productsMeats, poultry, and fishDairy products and ice creamCanned, frozen fruits, and vegetablesSugar and confectioneryPackaged beverage materialsOther processed foods
Textile Products and Apparel:
Cotton productsWool productsSynthetic textilesSilk productsApparelOther textile products
Hides, Skins, and Leather Products:
Hides and skinsLeatherFootwearOther leather products
Fuel% Power, and Lighting Materials:
CoalCokeGas fuels (Jan. 1958= 100)Electric power (Jan. 1958= 100)Petroleum and products
Chemicals and Allied Products:
Industrial chemicalsPrepared paintPaint materialsDrugs, Pharmaceuticals, cosmetics..,Fats and oils, inedibleMixed fertilizersFertilizer materials ,Other chemicals and products
Rubber and Products:
Crude rubberTires and tubesOther rubber products
Lumber and Wood Products:
LumberMillworkPlywood
Pulp, Paper, and Allied Products:
WoodpulpWastepaperPaper
Pulp, Paper, and Allied Products(Cont.):
PaperboardConverted paper and paperboardBuilding paper and board
Metals and Metal Products:
Iron and steelNonferrous metalsMetal containersHardwarePlumbing equipmentHeating equipmentFabricated structural metal productsFabricated nonstructural metal
products
Machinery and Motive Products:
Agricultural machinery and equip-ment
Construction machinery and equip-ment
Metal working machineryGeneral purpose machinery and
equipmentMiscellaneous machinery ,Electrical machinery and equip-
mentMotor vehicles
Furniture and Other Household Dura-bles:
Household furnitureCommercial furnitureFloor coveringHousehold appliancesTelevision, radios, phonographsOther household durable goods ,
Nonmetallic Minerals—Structural:
Flat glassConcrete ingredientsConcrete productsStructural clay productsGypsum productsPrepared asphalt roofingOther nonmetallic minerals
Tobacco Manufactures and BottledBeverages:
CigarettesCigarsOther tobacco productsAlcoholic beverages ,Nonalcoholic beverages
Miscellaneous:
Toys, sporting goods, small armsManufactured animal feedsNotions and accessoriesJewelry, watches, photo equipment..,Other miscellaneous
135.9130.0147.6
172.4142.7152.9173.4134.0120.9135.4
146.3
144.3
173.6177.7167.8149.7
155.8141.6
124.7155.8129.6103.391.7
157.8
135.3142.0130.5161.3133.1113.6132.8
134.8106.6155.7120.5171.1
117.775.697.5
110.6131.9
132.4131.1145.4
168.5135.5153.6174.6130.8118.4133.9
146.7
148.2
177.3182.3166.3150.7
153.1140.5
125.7157.1130.2100.690.5
156.6
132.4142.1131.0162.3133.2106.6133.6
134.8106.5155.7121.1171.4
118.666.896.4
110.9132.1
132.4131.1145.4
168.6133.9153.6'174.7130.8'116.8133.9
148.6
r148.0
177.0r182.6
166.1150.9
152.6142.2
125.7157.1130.2100.4'91.2156.6
132.4142.0131.0162.3133.2106.6133.6
134.8106.5155.7121.2171.6
118.670.096.4
111.0132.4
132.4131.7145.4
169.5131.9156.6174.9130.9115.7133.9
148.8
148.5
177.3182.8
166.1151.1
152.4142.2
125.6156.0128.8100.691.2
156.9
132.4142.2131.4162.0134.9114.3133.5
134.8106.5155.7121.2171.6
118.975.196.4
111.5132.7
r Revised
Digitized for FRASER Federal Reserve Bank of St. Louis

362 NATIONAL PRODUCT AND INCOME
GROSS NATIONAL PRODUCT OR EXPENDITURE
[Department of Commerce estimates. In billions of dollars]
Item
Annual totals
1929 1933 1941 1950 1956 1957 1958 1959 1960
Seasonally adjusted annual ratesby quarters
1959
4
1960
Gross national product
Personal consumption expendituresDurable goodsNondurable goodsServices
Gross private domestic investmentNew Construction
Residential, nonfarmOther
Producers' durable equipmentChange in business inventories
Nonfarm only
Net exports of goods and servicesExportsImports
Government purchases of goods and services.Federal
National defenseOtherLess: Government sales
State and local
Addendum: Gross national product in con-stant (1954) dollars
104.4
79.09.2
37.732.1
16.28.73.65.15.91.71.8
7.06.3
8.51.31.3.0
7.2
181.8
56.0
46.43.5
22.320.7
1.41.4
.51.01.6
- 1 . 6- 1 . 4
.22.42.3
8.02.0
> 2.0
.06.0
126.6
125.8
81.99.7
43.229.0
18.16.63.53.16.94.54.0
1.16.04.8
24.816.9
\ 13.81 3 :o 2
7.8
238.1
284.6
195.030.499.864.9
50.024.214.110.118.96.86.0
.613.112.5
39.019.314.35.2
.119.7
318.1
419.2
269.938.5
131.4100.0
67.435.517.717.827.24.75.1
2.923.120.2
79.045.740.4
5.7.3
33.2
400.9
442.8
285.240.4137.7107.1
66.136.117.019.028.5
1.6
4.926.221.3
86.549.744.4
5.7.4
36.8
408.6
444.2
293.537.3
142.0114.2
56.035.418.017.423.1
- 2 . 5- 3 . 6
1.222.721.5
93.552.644.8
8.3.5
40.8
401.0
482.1
313.843.4
147.6122.8
72.040.322.318.025.85.95.4
- 1 . 022.923.8
97.153.346.07.8
.543.9
428.0
503.2
327.843.6
152.4131.7
72.840.421.119.328.8
3.63.2
3.026.523.5
99.752.445.1
7.9.6
47.3
439.2
486.4
319.643.5
149.6126.6
70.839.421.318.126.84.74.3
- . 423.523.9
96.452.545.5
7.5.5
43.9
429.1
501.3
323.344.2
150.5128.6
79.340.821.419.327.111.411.0
1.225.223.9
97.551.844.97.5
45.1
440.5
505.0
329.044.5
153.5130.9
75.540.721.319.429.55.35.0
2.026.424.4
98.6. 51.7
A4.17.6
.646.9
442.2
503.5
328.342.7
152.7132.9
70.840.521.119.529.7
.6
.3
3.727.323.5
100.752.745.1
8.2.6
48.0
438.0
503.5
330.843.2
152.9134.7
66.040.320.519.828.7
- 3 . 0- 3 . 4
4.627.022.4
102.153.345.7
8.2.6
48.8
437.0
NATIONAL INCOME, BY DISTRIBUTIVE SHARES
[Department of Commerce estimates. In billions of dollars]
Item
Annual totals
1929 1933 1941 1950 1956 1957 1958 1959 1960
Seasonally adjusted annual ratesby quarters
1959 1960
National income
Compensation of employees
Wages and salariesPrivateMilitaryGovernment civilian
Supplements to wages and salariesEmployer contributions for social in-
suranceOther labor income
Proprietors' income
Business and professionalFarm
Rental income of persons
Corporate profits and inventory valuationadjustment
Profits before taxProfits tax liabilityProfits after tax
DividendsUndistributed profits
Inventory valuation adjustment
Net interest
87.8
51.1
50.445.5
.34.6
.7
'.6
14.8
8.86.0
5.4
10.1
9.61.48.35.82.4
40.2
29.5
29.023.9
.34.9
.5
A
5.6
3.22.4
2.0
- 2 . 0
.5
2- 2 . 4
104.7
64.8
62.151.9
1.98.3
2.7
2.0.7
17.4
10.96.5
3.5
14.5
17.07.69.444.9
6.4
-2
5.0
2 5
241.9
154.2
146.4124.
5.017.3
7.8
4.03.8
37.5
23.514.0
9.0
35.7
40.617.922.8
9.213.6
- 5 . 0
350.8
242.5
227.6189.6
9.728.4
14.9
6.88.1
43.7
32.111.6
10.9
42.0
44.721.223.512.111.3
366.9
255.5
238.5198.4
9.630.5
77.0
7.89.
44.5
32.711.8
11.9
41.7
43.20.922.312.69.7
4.5 5.5
- 2 . 7
11.7
- 1
13.4
367.7
257.0
239.7196.4
9.833.5
17.4
8.09.4
46.4
32.314.0
12.2
37.4
37.718.619.112.46.
14.7
399.6
277.8
258.2212.9
9.935.4
19.6
9.510.1
46.5
34.711.8
12.4
46.6
47.023.223.813.410.5
- . 5
16.4
294.4
272.5224.3
10.138.1
21.9
10.911.0
47.8
35.912.0
12.5
14.0
18.7
402.8
281.6
261.5215.6
9.836.1
20.1
9.610.5
46.3
35.111.2
12.5
45.5
44.822.122.713.88.9
.7
16.9
414.4
290.2
268.7222.1
9.936.7
21.5
10.810.7
46.0
35.410.6
12.5
48.0
48.823.825.013.911.0
- . 8
17.8
419.4
295.0
273.1225.5
10.037.6
21.9
10.910.9
48.1
36.012.1
12.5
45.3
45.722.323.413.99.5
- . 4
18.5
419.3
297.2
274.9226.0
10.138.8
22.3
11.111.2
48.3
36.112.2
12.5
42.2
41.520.321.314.07.3
.7
19.1
295.2
273.2
10.339.3
22.0
10.911.1
48.8
35.912.8
12.5
14.1
.4
19.4
N0TE#—For explanation of series see U. S. Income and Output (a supple-ment to the Survey of Current Business for 1959) and the Survey of CurrentBusiness, July 1960.
Digitized for FRASER Federal Reserve Bank of St. Louis

NATIONAL PRODUCT AND INCOME 363
RELATION OF GROSS NATIONAL PRODUCT, NATIONAL INCOME, PERSONAL INCOME, AND SAVING
[Department of Commerce estimates. In billions of dollars]
Gross national product
Less: Capital consumption allowancesIndirect business tax and nontax lia-
bility .Business transfer paymentsStatistical discrepancy. . .
Plus: Subsidies less current surplus of gov-ernment enterprises
Equals: National income
Less: Corporate profits and inventory valua-tion adjustment
Contributions for social insuranceExcess of wage accruals over disburse-
ments
Plus: Government transfer paymentsNet interest paid by governmentDividends .Business transfer payments
Equals: Personal income. . . .
Less: Personal tax and nontax payments
Federal . . .State and local
Equals: Disposal personal income
Less: Personal consumption expenditures
Equals: Personal saving
Addendum: Disposable personal income inconstant (1954) dollars
Annual totals
1929
104.4
8.6
7.0.6.3
- . 1
87.8
10.1.2
.0
.91.05.8
. 6
85.8
2.6
1.31.4
83.1
79.0
4.2
134.9
1933
56.0
7.2
7.1.7.9
.0
40.2
- 2 . 0.3
.0
1.51.22.1
.7
47.2
1.5
.51.0
45.7
46.4
- . 6
102.1
1941
125.8
9.0
11.3.5.4
.1
104.7
14.52.8
.0
2.61.34.5
.5
96.3
3.3
2.01.3
93.0
81.9
11.1
175.1
1950
284.6
19.1
23.7.8
- . 7
.2
241.9
35.76.9
.0
14.34.89.2
.8
228.5
20.8
18.22.6
207.7
195.0
12.6
231.0
1956
419.2
34.4
35.71 6
- 2 . 4
.9
350.8
42.012.6
.0
17.25.7
12.11.6
332.9
40.0
35.24.8
292.9
269.9
23.0
286.9
1957
442.8
37.4
38.21.8
— . 6
1.0
366.9
41.714.5
.0
20.16.2
12.61.8
351.4
42.6
37.35.3
308.8
285.2
23.6
293.8
1958
444.2
38.1
39.41.8
- 1 . 7
1.1
367.7
37.414.8
.0
24.56.2
12.41.8
360.3
42.4
36.75.7
317.9
293.5
24.4
296.2
1959
482.1
40.5
42.61.8
- 1 . 8
.6
399.6
46.617.3
.0
25.27.1
13.41.8
383.3
46.0
39.86.2
337.3
313.8
23.4
311.1
1960
503.2
43.2
45.11.8
.5
20.2
.0
27.28.0
14.01.8
404.2
50.0
43.36.7
354.2
327.8
26.4
320.8
Seasonally adjusted annual ratesby quarters
1959
4
486.4
41.4
43.51 8
- 2 6
.5
402.8
45.517.5
.0
26.07.6
13 81.8
389.0
46.5
40.26.3
342.4
319.6
22.8
313.6
1960
1
501.3
42.2
44.41 8
— 1 1
.5
414.4
48 019.9
.0
26.17.8
13 91.8
396.2
49.2
42.66 6
347.0
323.3
23.7
316.3
2
505.0
43.0
45.31 8
— 3 9
.6
419.4
45.320.2
.0
26.78.0
13.91.8
404.2
50.0
43.46.6
354.1
329.0
25.2
321.1
3
503.5
43.f
45.11 8
— 5 K
.5
419.3
42.220.4
.0
27.38.2
14.01.8
408.0
50.5
43 .*6 7
357 5
328.3
29.2
323 2
4
503.5
44.1
45.41 8
20.1
.0
28.78.2
14 11.8
408.5
50.4
43.66.8
358.1
332.0
27.2
322.0
PERSONAL INCOME
[Department of Commerce estimates. In billions of dollars]
Item!
Total personal income
Wage and salary disbursementsCommodity-producing industries...
Manufacturing onlyDistributive industriesService industriesGo vernmen t
Other labor income
Proprietors' income:Business and professionalFarm
Rental income
Dividends
Personal interest income.
Transfer payments
Less: Personal contributions forsocial insurance
Nonagricultural income
Agricultural income
1959
383.3
258.2107.284.768.237.545.3
10.1
34.711.8
12.4
13.4
23.5
27.0
7.8
367.6
15.7
1960
404.2
272.5111.488.071 941.048.2
11.0
35.912.0
12.5
14 0
26.8
29.0
9.3
388.1
16.1
1960
Jan.
395.7
268.2112.689.469.939.446.3
10.6
35.511.3
12.5
13.9
25.2
27.7
9.2
380.2
15.5
Feb.
395.7
268.6111.989.070.339.846.5
10.7
35.510.4
12.5
13.9
25.5
27.7
9.1
381.2
14.5
Mar.
397.0
269.3111.688.870.840.046.9
10.8
35.410.1
12.5
13.9
25.9
28.3
9.2
382.7
14.3
Apr.
401.9
277.7112.188.671.840.547.3
10.8
35.711.7
12.5
13.9
26.2
28.6
9.2
385.9
16.1
May
404.7
273.6113.389.572.040.747.6
10.9
36.012.1
12.5
13.9
26.5
28.4
9.3
388.2
16.4
June
406.1
274.0112.989.272.241.147.8
11.0
36.212.5
12.5
13.9
26.8
28.5
9.3
389.3
16.8
July
407.3
275.1112.888.712.441.348.5
11.1
36.212.0
12.5
13.9
27.1
28.7
9.3
391.1
16.2
Aug.
408.2
275.1111.587.772 941.649.0
11.2
36.112.2
12.5
14.0
27.4
29.1
9.4
391.8
16.4
Sept.
408.8
275.0111.287.572.741.949.2
11.2
36.112.2
12.5
14.0
27.5
29.7
9.3
392.4
16.4
Oct.
409.7
274.8110.987.272.542.049.4
11.3
36.112.6
12.5
14.1
27.6
30.0
9.3
393.0
16 .7
Nov.
409.0
273.6109.586.272.542.049.6
11.1
35.912.9
12.5
14.1
27.6
30.5
9.2
392.1
16.9
Dec.
406 9
271.4107.384.672.342.049.8
11.0
35.712.9
12.5
14.0
27.7
30 9
9.2
390 1
16.8
1961
Jan.p
406.3
271.0106.984.272.042.150.0
11.0
35.512.9
12.5
14.0
27.7
31.0
9.3
389.5
16.8
* Preliminary. r Revised.1 Monthly data are seasonally adjusted totals at annual rates.NOTE.—For explanation of series see U. S. Income and Output (a supple-
ment to the Survey of Current Business for 1959) and the Survey of CurrentBusiness, July 1960.
Digitized for FRASER Federal Reserve Bank of St. Louis

364 FLOW OF FUNDS/SAVING
SAVING AND INVESTMENT
[In billions of dollars]
Transaction category,or sector
A Net national saving1
B Consumer and nonprofitC Farm and noncorp. business2 . . . .D Corporate nonfinancial business..E Federal Government1
F State and local governmentsl
G Financial sectors
H Caoital consunmtion3 . . .I Consumer and nonprofitJ Consumer durable goodsK Owner-occupied homesL Plant and equip, (nonprofit)...
N Noncorp, nonfinan. businessO Corporate nonfinancial business. .
p Gross national savins Q Consumer and nonprofitR Farm and noncorp. businessS Corporate nonfinancial business..
U State and local governments1
W Gross national investment1
X Consumer durable goods
Y Other gross private domestic fixedinvestment
Z Consumer and nonprofita Nonfarm residen. constr.*....b Plant and equip, (nonprofit). .c Farm businessd Noncorp. nonfinan. business4..e Corp. nonfinan. business4
f Financial sectors
g Change in inventories 5 . . .h Farm businessi Noncorp. nonfinan. business...j Corp. nonfinan. business
k Net financial investment6
1 Consumer and nonprofitm Net acquis. offinan. assets...n Net increase in liabilitieso Farm and noncorp. business.. .p Net acquis. offinan. assets...q Net increase in liabilitiesr Corp. nonfinan. businesss Net acquis. offinan. assets...t Net increase in liabilities
u Federal Governmentv Net acquis. offinan. assets...w Net increase in liabilitiesx State and local governments...y Net acquis. offinan. assets...z Net increase in liabilitiesaa Financial sectorsbb Net acquis. offinan. assets...cc Net increase in liabilitiesdd Financial trans, discrep
ce Discreoancv (P—W)?
Annual totals
1955
39.526.6
12.4c
-3 .23 3
62.333.930.43.1
.53.77.0
17.6
101.960.510.730.1
.5-3 .2
3.3
103.639.6
58.219.316.62.74.2
10.1T24.0
7
5.8.3.6
4 . 9
*4.7
25.120.4
- 4 . 4.5
4.9- 2 . 216.819.0
.51.0
.5- 2 . 6
2.24.83.5
27.023.4
.5
- 1 . 8
1956
41.529.5
*5.95.9
- 2 . 72.9
67.536.933.03.4
.53.77.5
19.3
108.966.411.325.25.9
- 2 . 72.9
108.038.5
62.718.916.12.83.8
10.229.1
.7
4.7— .4
.24 . 9
2.112.127.415.2
- 2 . 5.5
3.0- 1 3 . 4
4.317.7
5.91.6
-4.3- 2 . 2
2.64.82.7
22.519.8- . 5
.9
1957
37.928.5
*5.33.6
- 3 . 23 7
73.340.135.83.7
.63.98.1
21.2
111.268.612.026.5
3.6- 3 . 2
3.7
110.740.4
64.618.214.93.34.09.7
32.08
1.68
.2
.6
4.214.826.812.0
- 2 . 7.8
3.5- 8 . 7
4.413.1
3.63.2
- .4- 3 . 2
3.36.53.0
23.920.9
- 2 . 6
.5
1958
19.526.1
*3.5
- 8 . 2- 5 . 03 1
75.241.637.04.0
.64 07.7
21.9
94.667.711.725.4
- 8 . 2- 5 . 0
3.1
93.637.3
58.518.314.73.64.49.1
25.97
- 2 . 51 0
*- 3 . 5
.315.327.312.1
- 2 . 91.34.2
-.97.28.0
- 8 . 21.69.7
- 5 . 22.57.74.5
36.231.7
- 2 . 2
1.0
1959
36.130.6
#11.44 5- 4 . 43 1
79.043.438.54.3
.64 18.2
23.3
115.274.012.334.8
- 4 . 5- 4 . 4
3.1
113.743.4
66.122.218.53.74.9
10.827.4
8
5.95
.64 . 8
1 o10^631.320.7
- 4 . 5- .44.1
- 1 . 613.415.0
- 4 . 56.3
10.8- 3 . 9
3.16.93.7
29.225.5
- 1 . 6
1.5
Quarterly totals
1958
3
5.78.5
-5^4- 1 . 7
1 5
18.810.59.31.0
1 01.95.5
24.618.92.68.7
- 5 . 4- 1 . 7
1.5
23.28.7
15.14.63.61.01.22.56.5
2
- . 42
.1- . 8
- . 26.18.62.4
- 1 . 5.3
1.71.16.94.8
- 5 . 4-4.4
1.0-1.1
- .91.92.51.9
-.7- 1 . 3
1.4
4
3.85.82.44.2
- 7 . 6- 1 . 6
.5
19.210.69.41.0
.11 02.05.6
22.916.45.39.8
- 7 . 6- 1 . 6
5
26.911.4
15.75.34.31.01.02.47.0
2
- . 12c
.1
*3.39.05.72.2
.8-1.4
1.55.23.7
- 7 . 6.7
8.3- . 31.01.3
A15.415.3
.7
- 4 . 0
1959
1
9.98.2
- . 51.1
.7- . 6
.9
19.310.79.51.0
.21 02.05.6
29.218.92.56.7
.7- . 6
9
26.49.4
13.95.24.3
.9
1A5.3
2
3.62
1.12 . 4
- . 54.27.33.1
- 1 . 9-.51.4
- 1 . 5.2
1.7
.1
.2-.5
- 1 . 6.2
1.81.4
.2-1.1- 1 . 8
2.8
2
10.17.9
- 1 . 83.81.4
- 1 . 8.6
19.710.89.61.1
.21 02.05.8
29.718.71.29.61.4
- 1 . 86
30.111.2
17.34.94.1
.91.43.37.4
2
2 .1
.21.7
- . 41.87.96.2
- 3 . 8
3.9.8
5.64.8
1.44.32.9
- 1 . 2.7
1.9.6
10.19.5
A
- . 3
3
8.48.4
- 1 . 63.3
- 2 1—1.2
1.6
19.910.99.71.1
.21 02.15.8
28.319.4
1.59.1
- 2 . 1- 1 . 2
1 6
27.110.4
17.75.94.91.01.33.07.3
22
' l
— 1
- . 82.87.85 0
- 2 . 8- . 22.5
.53.63.1
- 2 . 12.64.7
- 1 . 3.9
2.31.18.56.3
*
1.2
4
7.76.13.93.3
— 4 5- . 9- . 1
20.211.09.71.1
.21 02.16.0
27.917.17.09.3
- 4 . 5- . 9
30.112.4
17.36.25.31.01.02.57.4
2
.41
- . 69
•2.08.46 44.0
.3-3.7- 1 . 4
4.15.4
- 4 . 5-.83.7
.31.2
.9«
10.310.9
A
-1.1
1960
1
12.48.7
- 1 . 3*
4 02
20.311.19.81.1
.21 i2.16.1
32.719.81.96.14.0
- . 31 2
28.810.0
14.45.44.5
.91.02.15.6
2
4.51
1.23 2
*2.84.92 1
-2 .5- .42.0
-4 .5-2.6
1.9
4.0-.3
-4.3- . 51.01.51.7
-2.9-4.6-1 .1
3.9
2
10.46.2
- . 61.24 4
-1 .5.6
20.611.29.91.2
.2
2.16.2
31.017.42.67.54.4
-1 .54
28.811.2
17.14.73.8
.91.33.17.8
2
.41
- . 14
.1-1 .2
3.95 1
-1 .7.3
2.0-1A
.72.9
4.44.0
c-.9
.41.31.0
12.211.2
.5
2.2
3*
9.9 A9.9 B
-1 .0 C2.1 D
— 5 E-2 .1 F
1.5 G
20.9 H11.3 I10.0 J
1.2 K.2 L
1 1 M2.2 N6.3 O
30.8 P21.2 Q2.2 R8.5 S
- . 5 T-2 .1 U
15 V
27.4 W10.1 X
17.6 Y5.4 Z4.3 a7.7 b1.2 c3.0 d7.8 e
2 f
- . 1 g1 h• i
— 2 j
- . 1 k3.7 17.4 m3 6 n
-2.0 o
1:1 I- 1 . 2 r
7.7 s2.9 t
- . 5 u.5 v
7.5 w- 2 . 1 x- . 7 y1.9 z1.8 aa
70.5 bb5.5 cc
.1 dd
3.4 ee
* Less than $50 million. *> Preliminary.t Includes $0.3 billion of existing facilities purchased from Federal
Government.1 For govt. sectors, saving is excess of all nonfinancial receipts over all
nonfinancial outlays; investment, changes in financial assets and liabilitiesonly. Govt. current outlays include, and govt. (and national) investmentexcludes, govt. purchases of tangible assets.
2 Annual figures for farm sector are retained earnings of corporatefarms; farm and nonfarm unincorporated businesses shown as havingzero annual net saving. Quarterly figures for both sectors include seasonalnet saving. See p. 838 of the BULLETIN for August 1959.
3 Depreciation, accidental damage to fixed capital, and capital outlayscharged to current account. Line H includes amounts for financialsectors not shown separately. See discussion on p. 836 of the BULLETINfor August 1959.
4 For consumers, 1-to 4-family dwellings completed and purchases ofadditions and alterations. Investment of nonfarm business sectors
includes work in process on 1-to 4-family dwellings and other privateresidential construction.
5 After inventory valuation adjustment.6 Financial component of national investment equals net lending to
rest of world; financial flows among domestic sectors cancel out innational total. (Discrepancies in financial transactions attributed entirelyto domestic transactions.) Differs from U. S. "net foreign investment"(net exports minus net unilateral transfers in national income accounts)by discrepancy in rest-of-world account, which equals "errors andomissions" in Dept. of Commerce balance-of-payments statement forthe United States.
7 Saving and investment are equal in concept but may differ statisticallybecause of discrepancies. See p. 857 of the BULLETIN for August 1959.
NOTE.—Descriptions of sectors and of transaction categories are givenin notes to tables and in "Technical Notes," pp. 846-59 of the BULLETINfor August 1959. For latest detailed flow of funds/saving tables, seethe BULLETIN for January 1961.
Notes to table on opposite page.1 Demand deposit liabilities of banking system are net of F. R. float
and cash items in process of collection as reported by commercial banks.Sum of sector holdings (partly on holder-record basis) differs from liabilitytotal mainly because of mail float (checks in transit from drawers todrawees). For further discussion, see p. 853 of the BULLETIN for August1959.
2 Consumer-held only; includes net interest accruals. Savings bonds
held by other sectors included in Federal obligations category.3 Mainly time deposits of State and local governments, corporate
businesses, and savings institutions.4 Assets in these categories are treated as consumer holdings.5 Marketable issues maturing within one year and, prior to 1956
savings notes.6 Excludes loans to domestic commercial banks. Gross of valuation
reserves.
Digitized for FRASER Federal Reserve Bank of St. Louis

FLOW OF FUNDS/SAVING 365
SUMMARY OF PRINCIPAL FINANCIAL FLOWS
[In billions of dollars]
Transaction category,or sector
I. Demand deposits and currency
A Net increase in commercial bkg.system liability 1
B Net increase in assets, by sectorC Federal GovernmentD Other domestic sectorsE Consumer and nonprofitF Farm and noncorporate bus . .G Corporate nonfinancial bus . . . .H State and local governmentI Financial sectorsJ Rest of the worldK Discrepancy (A—B)
II. Fixed-value redeemable claims
A Net increase, by typeB Time depositsC Savings sharesD U.S savings bonds2
E Net increase in liab., by sectorF Federal GovernmentG Commercial bankingH Savings institutions
I Net increase in assets, by sectorJ Consumer and nonprofitK Other domestic sectors3
L Rest of the world (time deposits).
III. Saving through life insuranceand pension funds
A Net increase, by typeB Life insuranceC Pension funds
D Net increase in liab., by sector4
E Federal GovernmentF State and local governmentG Life insurance companies . . .H Private noninsured pension plans.
IV. Credit and equity marketinstruments
A Net increase, by typeB Federal obligationsC Short-term direct5
D OtherE State and local obligations... .F Corporate and foreign bonds . . . .G Corporate stockH 1- to 4-family mortgagesI Other mortgagesJ Consumer creditK Security creditL Bank loans n e e . .M Other loans
N Funds raised, by sector .O Consumer and nonprofitP Farm business . . .Q Noncorporate nonfinancial bus...R Corporate nonfinancial business..S Federal GovernmentT State and local governmentU Financial sectorsV Rest of the world
W Funds advanced, by sectorX Consumer and nonprofitY Farm and noncorp. businessZ Corporate nonfinancial business..a Federal Governmentb State and local governmentc Commercial banking systemd Monetary authoritiese Commercial banksf Securitiesg Loons**h Savings institutionsi Insurance sectorj Finance n e e .k Rest of the world
Annual totals
1955
2.3.8
- . 61.5
- . 8.3
1.04
.6*
1.4
8.42.95.3
.3
8.4
1.37.1
8.48.7
- . 1- . 1
8.43.25.1
8.4.6
1.24 . 62 . 0
44.0.8
-7 .17.93.54.03 0
12.63.66.4
1956
1.71.7
2\\l1.0
2.2.2.1
8.93.65 4
9.0- . 32.17.3
8.99.0
*- . 1
9.33.85.6
9.31.01 44 . 82 .1
30.7- 5 . 6
7.4-13 .0
3.25.03 8
10.83.83.6
1 0j — 68.0 5.91.1
44.120.3
1.22.9
10.1- . 13 55.9
.3
44.08.0
.25.01.51.94.8
- . 35.0
-7.012.18.18.15.31.0
.9
31.215.1
.92.0
13.0- 5 . 4
3 31.21.0
30.7
.3- 3 . 8
1.12.34.8
.34.5
-3.58.07.38.01.61.3
1957
-A
c.6
2
'.:
10.16.85.2
- 1 . 9
10.12 25^56.9
10.19.8
.4*
9.02.86.1
9.0.6
1 64.32.6
36.71.15.5
- 4 . 44.77.54 08.63.52.8
_ 32.32.6
36.911.81.1
13ll1.04.92.41.4
36.7
.2
.42.42.64.3
- . 85.11.33.87.28.32.5
.6
1958
5.86.5
.16.42.51 31.7
.7
- . 7
16.110.16 5
5
16.2
8.9
16.113.51.7
.9
10.33 46.9
10.31.01 74 72 8
46.29 0
- 1 . 210.25 76.84 2
10.15.2
31 71 32.0
46.212.01 52.3
11.89.35 91 22.3
46.2
*1.21.71.4
17.02.2
14.910.44.59.48.92.0
1959
1.11.7
.7
.9
.9— 7
.1- . 6
7.62.27.2
- 1 . 8
7.6- 2 . 0
1.28.4
7.69.6
- 1 . 0- 1 . 0
11.63 77.9
11.61.01 85.63.2
61.511.35.55.84.94.74 4
13.35.86 3
7.92.8
61.420.62 04.8
11.610.75 15.7
.8
61.5
.45.53.82.95.6
.35.3
-7.212.510.69.84.53.1
Quarterly totals
1958
3
- 3 . 4- 2 . 5- 5 . 0
2.72.3
1.0
-'.9
2.51.6l.C
— . 2
2.5— . 21.11.5
2.53.0
- . 4- . 1
2.61 01.7
2.6.34
1 3.6
7.01.11.2
- . 11.31.3
93.01.3
.1— 1 4— .2- . 3
7.02.4
2*
3.11.11.4
- 1 . 7.5
7.0
- . 11.3
.5
.2- . 6- . 4- . 21.0
-1.22.92.3
-1 .9.8
4
8.06.6
6.32.3
32 .5
6.5.3
1.4
3.1.9
2.3- . 2
3.12
2.9
3.13.5
- . 4
2.81 01.8
2.8
41 5
8
22.77 63.83.8
81.61 13.21.61 91 i2 71.0
22.75.6
*2.83.17.9
81.8
.6
22.7
1959
1
- 7 . 0- 5 . 3
c
-'.9
- 2 . 9— 4- . 3- . 1
- 1 . 7
2.31.11.4
- . 2
2.3- . 2
.62.0
2.32.2
*.1
2.99
2.0
2.9.25
1 31 0
7.3
- 4 . 64.61.31.11 22.91.2
— 7_ 2— 4
.9
7.33.0
7— 4l!9
- . 21 3
.7
.2
7.3
.5! - . 34.2| 1.0
.9 .7
.58.01.46.61.74.92.42.52.1
.3
.6- 5 . 4- . 9
- 4 . 5-4.2-.32.72.5
.9
.2
2
2.11.91.0
.7- . 7— 21.5
1*
.2
.2
3.01.22.3
c
3.0- . 6
.92.6
3.03.5
- . 24
3.21 22.0
3.2.45
1 68
18.72.04.7
- 2 . 71 41.01 23.81.72 6
3.61.3
18.76.21 12.53.81.71 51.5
.4
18.7
.31.21.7
.54.2
.63.6
-1.75.33.22.6
.91.0
3
2.12.01.5
.4
.8— 2- . 2
2- . 3
.1
.2
.8
1.2- . 5
.8- . 6- . 11.4
.81.7
- . 7- . 3
2.58
1.7
2.5.35
1 2.5
18.35 3
.74.61.81.1
73.71.51 7
— 32 8
J
18.35.0
31.62.95.21 81.2
.3
18.3
- . 11.51.01.23.3
.52.8
-.83.63.02.1
.81.3
4
3.83.1
- 1 . 24.41.6
— 21.8
6.6
- . 1.7
1.6- . 12.3
- . 6
1.6- . 6- . 22.4
1.62.1
- . 22
3.19
2.1
3.1.15
1 6.9
17.24.04.7
- . 7.4
1.51 23.01.42.7
61.9
.5
17.16.4
- . 21.12.94.1
.52.3
*
17.2
.51.9
.5
.73.5
.13.4
-.43.81.62.62.0
.7
1960
1
- 8 . 8- 7 . 7- . 4
- 6 . 9- 3 . 0
- 3 . 4•
- . 4- . 4
- 1 . 1
1.6.2
1.5- . 2
1.62*
1.81.61.6
.22
2.9.7
2.1
2.9.15
1.21.1
2.3- 4 . 1- 7 . 4
3.41.01.1
92.31.1
- . 9— 1.6
.32.1
2.32.1
.5
.22.7
- 4 . 11.0
- . 3.3
2.34.3
- . 4- . 2
.9- 7 . 9- 1 . 4- 6 . 5-5.6-.82.32.9
.2
.5
2
2.52.32.8
- . 6- 1 . 2
.6— 4
.4*
.2
3.91.72.4
- . 1
3.9- . 21.52.6
3.93.4
.3
.2
3.31.02.3
3.3.7.5
1.3.8
11.4- 1 . 4- 2 . 1
.6
.81.2
.92.91.32.3
.52 .01.0
11.45.1
.81.22.7
- 1 . 5.8
1.7.5
11.4- . 7
.3- 1 . 3
1.0.4
5.01.23.8
.53.62.32.42.0
3^
1.5 A1.5 B
.2 C1.2 D1.4 E
. . . . F.2 G
— 2 H- . 2 I
* J* K
4.0 A2.6 B1.4 C
• D
4.0 E- . 1 F2.2 G1.8 H
4.0 I3.2 J
.5 K
.3 L
2.8 A1.2 B1.6 C
2.8 D.1 E.5 F
1.5 G.7 H
10.4 A1.2 B5.3 C
- 4 . 1 D1.4 E1.3 F
9 G3.0 H1.2 I
.6 J6 K
- . 5 L.5 M
10.4 N3.6 O
.2 P1 Q
2.5 R1.4 S1.5 T
.7 U
.4 V
10.4 W.8 X
- . 1 Y- 1 . 9 Z
.5 a- . 3 b5.2 c
.5 d4.7 e3.8 f
'9 g2.7 h2.5 i
3 k
* Less than $50 million. P Preliminary.NOTE.—Data for excluded categories—trade credit, proprietors' net
investment, gold, Treasury currency, and misc.—and more detail on
sector transactions appear in other flow of funds/saving tables in theBULLETIN for January 1961.
For other notes see opposite page.
Digitized for FRASER Federal Reserve Bank of St. Louis

Financial Statistics
* International *
Reported gold reserves of central banks and governments 368
Gold production 369
Net gold purchases and gold stock of the United States 370
Estimated foreign gold reserves and dollar holdings 371
International capital transactions of the United States 372
United States balance of payments. 381
Money rates in foreign countries. 381
Foreign exchange rates. 383
Index to statistical tables 389
Tables on the following pages include the prin- dealers in the United States in accordance withcipal available statistics of current significance the Treasury Regulation of November 12, 1934.relating to international capital transactions of Other data are compiled largely from regularlythe United States, foreign gold reserves and dol- published sources such as central bank state-lar holdings, and the balance of payments of the ments and official statistical bulletins. Back fig-United States. The figures on international cap- ures for 1941 and prior years, together with de-ital transactions are collected by the Federal Re- scriptive text, may be obtained from the Board'sserve Banks from banks, bankers, brokers, and publication, Banking and Monetary Statistics.
367
Digitized for FRASER Federal Reserve Bank of St. Louis

368 GOLD RESERVES
REPORTED GOLD RESERVES OF CENTRAL BANKS AND GOVERNMENTS
[In millions of dollars]
End ofmonth
1954—Dec1955—Dec1956 Dec1957—Dec1958—Dec1959—Dec
I960 JanFebMarAprMayJuneJulyAusSeptOctNovDec.
1961—Jan
End ofmonth
1954—Dec1955—Dec1956—Dec1957—Dec.1958—Dec1959—Dec
I960—JanFebMarAprMay. . . .JuneJuly.AugSeptOct..NovDec
1961—Jan
End ofmonth
1954—Dec1955 Dec1956—Dec1957—Dec1958—Dec1959—Dec
I960—JanFebMarAprMayJuneJuly
SeptOctNovDec
1961 Jan
Esti-matedtotal
worldJ
36,94037 62038,11538 82039,49040,185
40 355
40 570
40 690
HO 520
Cuba
1861361361368050
502119191919193311
Iran
138138138138141140
140131131131131131131131131131131130
130
Int'lMone-
taryFund
1,7401 8081,6921 1801,3322,407
2 4162 4212,4542 4952,4892,5152,5272 5622 5642,6032 7232 439
2,446
Den-mark
313131313131
313131313131313131313131
31
Iraq
814203484
848484848484848484
11198
UnitedStates
21,79321,75322,05822 85720,58219,507
19 49419 47119,45719 40319,39519,36319,18819 04518,72518,44317 94817,804
17,480
Domin-ican
Repub-lic
121211111110
101010101010101010101010
0
Ire-land,
Repub-lic of
181818181818
181818181818181818181818
18
Esti-matedrest ofworld
13,40514 06014,36514 78517,57518,270
18,445
18,690
19 400
^20 275
Ecua-dor
232322222220
202020202020202020202020
20
Italy
346352338452
1,0861,749
1,8161,8701 9021,9021,9831,9971,9982,0882,1862,1862 198
Argen-tina
3723722241266056
5656565656555580848484
Egyp-tianRe-
gion—U.A.R.
174174188188174174
174174174174174174174174174174174174
Leb-anon
6374779191
102
102102102102102102102102102102102119
Aus-tralia
138144107126162154
157160163166170149153156159157147147
El Sal-vador
292828313130
303030303030303030303030
30
Mex-ico
62142167180143142
142142142142142142122122121140
Aus-tria
627171
103194292
292292292292292292293293293293293293
293
Fin-land
313535353538
383838383838383838414141
41
Nether-lands
796865844744
1.0501,132
1,1321,141I 1641,1641,1641,2311,2461.2461,3461 3761 376
r l ,451
1,451
Bel-gium
778929925915
1,2701,134
1 1431 1751,1831 1971,1821,1911,1751 0941 0941,1121 1581 170
1,156
France2
708942924581750
1.290
1,2851,298L 3221,3991,5131,5511,560I 5681,6271,6221,626
641
1,641
NewZealand
333333333334
343434343434343535353535
35
Brazil
322323324324325327
326326294294286286287287287287287287
Ger-many,Federal
Republicof
626920
1,4942,5422,6392,637
2,6382,6522 6702,7042,7412,7722,8182,8792,8882,9152,9432 971
2,999
Nor-way
454550454330
303030303030303030303030
30
Canada
1,0731,1341,1031,1001,078
960
952952950945922909906904894891886885
885
Greece
111110131726
2626262626262626313131
Paki-stan
384849494950
525252525252525252525252
52
Chile
424446404043
424141424242424242454545
39
Guate-mala
272727272724
242424242424242424
Peru
353535281928
282828282828282827424242
47
Co-lombia
868657627271
717273717273747475767778
India
247247247247247247
247247247247247247247247247247247247
247
Phil-ippines
91622
6109
101112131516161213141415
16
Congo,Rep.of the
115116122818342
423838383838
Indo-nesia
818145393733
333333333333333333375757
Portu-gal
429428448461493548
548548549549549549550550550550550552
* Preliminary.For notes see following page.
r Revised.
Digitized for FRASER Federal Reserve Bank of St. Louis

GOLD RESERVES AND PRODUCTION 369
REPORTED GOLD RESERVES OF CENTRAL BANKS AND GOVERNMENTS—Continued
[In millions of dollars]
End ofmonth
1954—Dec1955 Dec1956—Dec1957 Dec1958 Dec1959—Dec
I960—JanFebMarAprMayJuneJuly
SeDtOct . . .NovDec
1961 Jan
SouthAfrica
199212224217211238
248244256258255240233219204187176178
170
Spain
1321321321015768
787878787878788898
108158178
189
Sweden
265276266219204191
191171171171171171171171171171171170
170
Switzer-land
1,5131,5971,6761,7181 9251,934
1 8261 8071,7771 7671,7671,7741 8961,9601,9802 0202 0592,185
2,184
SyrianRe-
gion—U.A.R.
1719192424
Thai-land
113112112112112104
104104104104104104104104104104
Turkey
144144144144144133
133133133133133133133133133133134134
134
UnitedKing-dom3
2,7622,1202,1332,2733,0692,736
2,6852 7222,7802,8312,8592,8922,9963,0723,1083,1393 1673,231
3,245
Uru-guay
227216186180180180
180180180180180180180180180180180180
Vene-zuela
403403603719719
r652
'652r652'652'512'512'512'512'512'462428398398
398
Yugo-slavia
141617131716
101010977776554
5
Bankfor
Int'lSettle-ments4
761215924
- 4 2-134
- 3 19
17(6)
-122-103-107-103
- 7 9- 5 4— 36- 1 9
53
EPU-EF5
15324426825412640
39
48
53
56
' Revised.i Excludes U.S.S.R., other Eastern European countries, and China
Mainland.Represents reported gold holdings of central banks and governments
and international institutions, unpublished holdings of various centralbanks and governments, estimated holdings of British Exchange Equaliza-tion Account based on figures shown for United Kingdom, and esti-mated official holdings of countries from which no reports are received.
The figures included for the Bank for International Settlements repre-sent the Bank's gold assets net of gold deposit liabilities. This procedureavoids the overstatement of total world gold reserves since most of thegold deposited with the B.I.S. is included in the gold reserves of individualcountries.
2 Represents holdings of Bank of France and French Exchange Stabili-zation Fund.
3 Beginning with December 1958, represents Exchange EqualizationAccount gold and convertible currency reserves, as reported by BritishGovernment; prior to that time represents reserves of gold and UnitedStates and Canadian dollars.
4 Represents net gold assets of B.I.S., i.e., gold in bars and coins andother gold assets minus gold deposit liabilities.
5 European Payments Union through December 1958 and EuropeanFund thereafter.
6 Less than $500,000.
GOLD PRODUCTION
[In millions of dollars at $35 per fine troy ounce]
Year or month
1953195419551956195719581959
1959—Dec
I960—JanFeb . . .MarApr . . . .Mi ayJuneJuly
SentOct
Dec
Estimatedworld
production1
'845.0r895 0'940.0'975.0
r l 015 0r l , 0 5 0 . 0'1 ,125 .0
Production reported monthly
Total
776.0826.0873.5911.6952.8980.1
1 059.9
88.4
89.388.589 190.2
Africa
SouthAfrica
417.9462.4510.7556.2596.2618.0702.2
59.3
60.860.059.661.863.163 463.663 563.463.463.462.2
Rho-desia
17.518.818.418.818.819.419.8
1.6
1.61.61.61.71.61.61.6
Ghana
25.427.523.821.927.7^9 231.8
2 . 7
2 . 62 .62 .72 .72 .62 62 .6? 62 . 62 .52 . 52 . 5
Congo,Rep.of the
13.012.813.013.113.112.812.0
.8
1.31.4
.9
.81.4
North and South America
UnitedStates
69.065.165.765.363.061.657.2
3.7
3.43.13.53.54 .13.94 . 54 95.04 . 44 . 33.9
Can-ada
142.4152.8159.1153.4155.2158.8156.9
13.2
13.213.013.612.813.213.513.813.312.914.113.713.8
Mex-ico
16.913.513.412.312.111.611.0
.8
.71.11.1
.9
Nica-ragua 2
9.18.28.17 .66.97 .27 .3
.6
.5
.6
.6
.7
.5
.6
.56
.6
.7
.6
Brazil
4 04 23.94 . 34 . 23.93.9
.4
.4
.43
.4
.33
.44
.3
.3
.4
Colom-bia
15.313.213.315.311.413.013.9
1.2
1.545
4?
1 f
Other
Aus-tralia
37.739.136.736.137.938.638.1
3 .6
2 .82 .83 23.32 83 43 23 13.43 .3
India
7 88 47 . 47 36 36 .05 8
.5
.555454455
r Revised.1 Excludes U.S.S.R., other Eastern European countries, China Main-
land, and North Korea.2 Gold exports representing about 90 per cent of total production.Sources.—Estimated world production: based on reports of the U. S.
Bureau of Mines.
Production reported monthly: reports from individual countries exceptGhana, Republic of the Congo and Brazil, data for which are fromAmerican Bureau of Metal Statistics. For the United States, annualfigures are from the U. S. Bureau of the Mint and monthly figures arefrom American Bureau of Metal Statistics.
Digitized for FRASER Federal Reserve Bank of St. Louis

370 U. S. GOLD
NET GOLD PURCHASES BY THE UNITED STATES, BY COUNTRIES
[In millions of dollars at $35 per fine troy ounce. Negative figures indicate net sales by the United States]
Area and country
Western Europe:Austria
France . . . .Germany (Fed. Rep. of)
PortugalSpainSwitzerland . • •United KingdomBank for Int'l Settlements...Other
Total
Canada
Latin America:ArgentinaMexicoVenezuelaOther
Total
Asia:
Other
Total
All other
Total foreign countries..
International institutions2
Annual totals
1953
- 8 5
-130
- 6 5- 6 0
- 65- 480
94- 3 7
-1 ,016
- 8 5- 2 8
- 1 9
-132
- 6
- 6
- 1 0
-1,164
-1,164
1954
- 6
-226
- 5 5
- 16- 50- 2 0
- 6
-378
80- 30
12
62
- 1 0
- 1 0
- 1
-327
-327
1955
- 6 8- 1 0
- 5
4
- 7 8
14
14
- 5
- 5
- 6 8
- 6 8
1956
3- 3 4
- 8100
18
80
15
115
-20056
- 2 8
0)0)14
80
200
280
1957
3
25
31
8
68
5
75
6
81
18
18
0)172
600
772
1958
- 8 4-329
"XAQ
-261- 2 0
32-215-900-178
- 2 1
-2,326
67
2
69
-30- 4
- 3 4
- 3
-2,294
-2,294
1959
- 8 3-39
-266
- 3 0- 1 0
20-350
- 3 2- 3 8
-827
- 3 065
- 1 6
19
-157- 2 8
-186
- 5
-998
3-44
3-1,041
1960
— 1-141— 173
- 3 4
- 2 4 9
- 1 1 4— 324— 550
- 3 6- 9 6
- 1 , 7 1 8
- 5 0- 2 0
- 3 0
100
—15- 9 7
113
- 3 8
- 1 , 9 6 9
300
- 1 , 6 6 9
Quarterly totals
1959
Oct.-Dec.
—200
20
- 1 7
-197
65- 1
64
- 2 0
- 2 0
- 4
-157
100
- 5 7
1960
Jan.-Mar.
- 2 6
- 1 0
- 2
- 4 0
- 1
- 1
(!)
0)0)
- 4 2
- 4 2
Apr.-June
- 2 5
- 2 5
1
- 4 9
- 1
- 1
- 2 6
- 2 6
- 8
- 8 4
- 8 4
July-Sept.
- 7— 56
— 110
- 3 3160
— 200
- 1 1
- 5 7 6
- 3 0
- 6
- 3 6
- 1 5- 4
- 1 9
0)- 6 3 2
- 6 3 2
Oct.-Dec.
- 8 3117
- 3 4
— 105
— 81165350
— 36- 8 3
- 1 , 0 5 3
- 2 0- 2 0
- 2 2
- 6 2
67
- 6 7
- 2 9
- 1 , 2 1 2
300
- 9 1 2
1 Less than $500,000.2 Figures represent purchase of gold from, or sale to ( — ) International
Monetary Fund.
3 Includes payment of $344 million in June 1959 as increase in UnitedStates gold subscription to the International Monetary Fund.
ANALYSIS OF CHANGES IN GOLD STOCK OF THE UNITED STATES
[In millions of dollars]
Year
19491950195119521953
19541955195619571958
19591960
Gold stock(end of year)
Treas-ury
24,42722,70622,69523,18722,030
21,71321,69021,94922,78120,534
19,45617,767
Total i
24,56322,82022,87323,25222,091
21,79321,75322,05822,85720,582
19,50717,804
Totalgold
stock:increase,
or de-crease( - )
165-1,743
53380
-1,162-297
- 4 1306799
-2,2752-1,076-1,703
Netgold
import,or
export(-)
686-371-549
6842
1697
106104260
302333
Ear-marked
gold: de-crease,or in-crease( - )
-496-1,352
618-305
-1,171
-325-132
319600
-2,515-1,324-1,982
Domes-tic goldproduc-
tion
6780666769
6566656362
5749
Month
I960—FebMarAprMayJune. . . .JulyAugSeptOctNovDec
1961—JanFeb
Gold stock(end of month)
Treas-ury
. 19,421
. 19,408
. 19,360
. 19,352
. 19,322
. 19,144
. 19,005
. 18,685
. 18,402
. 17,910
. 17,767
. 17,441
. *>17,373
Total i
19,47119,45719,40319,39519,36319,18819,04518,72518,44317,94817,804
17 480ni, 412
Totalgold
stock:increase,
or de-crease( - )
- 2 3- 1 4- 5 4
- 8- 3 2
-174-144-319-282-495-144
-324P - 6 8
Netgold
import,or
export
4178
107749125
12519
3
—20(3)
Ear-marked
gold: de-crease,or in-crease( - )
- 2 1- 1 3- 7 1- 1 4
-102-222-151-319-397-512-145
-32243
Domes-tic goldproduc-
tion
34444555444
( 3 )
( 3 )
P Preliminary.1 Includes gold in Exchange Stabilization Fund, which is not included
in statistics on gold stock (Treasury gold) used in the Federal Reservestatement "Member Bank Reserves, Reserve Bank Credit, and RelatedItems" or in the Treasury statement, "Circulation Statement of UnitedStates Money."
2 Includes payment of $344 million as increase in United States goldsubscription to the International Monetary Fund.
3 Not yet available.4 Gold held under earmark at the Federal Reserve Banks for foreign
and international accounts amounted to $12,162 million on Feb. 28, 1961.Gold under earmark is not included in the gold stock of the United States.
Digitized for FRASER Federal Reserve Bank of St. Louis

GOLD RESERVES AND DOLLAR HOLDINGS 371
ESTIMATED GOLD RESERVES AND DOLLAR HOLDINGS OF FOREIGN COUNTRIES AND INTERNATIONALINSTITUTIONS
[In millions of dollars]
Area and country
Western Europe:AustriaBelgiumDenmarkFinlandFranceGermanv (Fed Reo of)GreeceItalyNetherlandsNorwayPortugalSpainSwedenSwitzerlandTurkeyUnited KingdomOthers
Total
Canada • • •
Latin America:ArgentinaBrazilChileColombiaCubaGuatemalaM exicoPanama Republic ofPeru • • •UruguayVenezuelaOther4
Total.
Asia:IndiaIndonesia . . . .•[ranJapanPhilippines .ThailandOther
Total
All other:AustraliaEgyptian Region—U.A.RUnion of South Africa. .Others
Total
Total foreign countries 6
International institutions
Grand total 6 . . .
Memorandum item:Sterling area
Dec. 31
Gold&short-term
dollars
6051,385
200104
1,2824,394
1432,2071,389
173656
93507
2,777164
3,723870
20,672
3,097
21046314024136669
56114696
2621,213
250
4,017
324145184
1,094186245
1,041
3,219
241190241512
1,184
32,189
2,876
35,065
4,837
, 1958
U.S.Govt.bonds
& notes
7661
1213
210
120(2)
31076
19429
489
341
1(2)(2)86
42
11
106
(2)
(2)131
27
32
14
15
983
495
1,478
242
Dec. 3
Gold&short-term
dollars
6231,272
168115
1,9454,624
2123,1181,617
125686154404
2,903164
3,490593
22,213
'3,158
39347822828821461
584129110242
'929253
'3,909
361172187
1,564181240
1,244
3,949
264194287
'523
'1,268
'34,497
'5,565
'40,062
4,729
, 1959
U.S.Govt.bonds
& notes
77
641
3516
(2)17
14113
10188
32351
855
452
1
82
31
312
105
(2)1
(2)231
46
53
141
42
1,507
660
2,167
407
Mar. 31, 1960
Gold&short-term
dollars
5561,339
145125
2,0414,682
1863,0611,646
129674189388
2,708163
'3,716617
'22,365
'3,307
44445019327716877
574128100242
'897273
'3,823
351183176
1,644190248
1,236
4,028
272207299526
1,304
'34,827
5,753
'40,580
'4,972
U.S.Govt.bonds
& notes
76
641
3716
(2)18
14113
7987
36838
866
485
1
82
43
12
106
10
(2)231
53
70
854
55
1,582
709
2,291
476
June 30, 1960
Gold&short-term
dollars
4901,340
11199
2,3105,245
1383,0571,643
131637227432
2,713152
'4,124507
'23,356
'3,439
44344818626214970
497116105240
'813388
'3,717
306188168
1,755214258
1,107
3,996
263216280547
1,306
'35,814
'5,832
'41,646
'5,302
U.S.Govt.bonds
& notes
77
531
1816
(2)17
158
37984
40338
885
429
1
821421
311
105
40
(2)221
70
115
157
58
1,592
755
2,347
550
Sept. 30, 1960
Gold&short-term
dollars
5161,240
7885
2,2735,997
1093,2031,646
115638235395
2,786149
4,503469
24,437
3,552
45446017924210865
49512797
244795400
3,666
297195156
1,984237270
1,026
4,165
259196235553
1,243
37,063
6,130
43,193
5,627
U.S.Govt.bonds
& notes
77
531
1716
(2)14
15813
7874
38139
849
424
(2)63
142
311
86
40
(2)
2(2)59
103
28
29
1,491
671
2,162
489
Dec. 31, 1960?
Gold&short-term
dollars
5361 317
8587
2 1606,449
1363,1321,779
112636327397
2,863152
4,470528
25,166
3,325
419481180236
7568
537123114231781373
3,618
301235152
2,166218284989
4,345
235196207603
1,241
37,695
6,392
44,087
5,561
U.S. Govt.bonds & notes *
Oldseries
76
28
1616
(2)12
143
37757
41140
818
416
(2)
(2)39
122
139
59
40
(2)22
(2)43
87
27
28
1,408
884
2,292
512
Newseries
32
31
53
(2)
148
18294
41945
837
446
12
1
7
1
15
41
2(2)45
92
8S34
1,424
900
2,324
535
P Preliminary. ' Revised,1 Of the two sets of figures shown, the first continues the series based
on a 1955 survey and reported securities transactions; the second isbased on a survey as of November 30, 1960, and reported securitiestransactions in December. Data are not available to reconcile the twoseries or to revise figures for earlier dates.
2 Less than $500,000.3 Includes other Western European countries, unpublished gold
reserves of certain Western European countries, gold to be distributedby the Tripartite Commission for Restitution of Monetary Gold, EuropeanPayments Union/European Fund, and the Bank for International Settle-ments; the figures for the gold reserves of the B.I.S. represent the Bank'snet gold assets, (see note 1 to table on reported gold reserves).
4 Includes other Latin American republics and the Inter-AmericanDevelopment Bank.
5 Includes unspecified countries in Africa, Oceania, and EasternEurope, and all Western European dependencies located outside Europeand Asia.
6 Excludes gold reserves of the U. S. S. R., other Eastern Europeancountries, and China Mainland.
NOTE.—Gold and short-term dollars include reported and estimatedofficial gold reserves, and total dollar holdings as shown in "Short-termLiabilities to Foreigners Reported by Banks in the United States byCountries" (Tables 1 and la-Id of the following section). U. S. Govt.bonds and notes are holdings with original maturities of more than oneyear.
Digitized for FRASER Federal Reserve Bank of St. Louis

372 BVTL CAPITAL TRANSACTIONS OF THE U. S.
TABLE 1. SHORT-TERM LIABILITIES TO FOREIGNERS REPORTED BY BANKS IN THE UNITED STATES, BY COUNTRIES 1
[Amounts outstanding, in millions of dollars]
End of month
1956—Dec1957 Dec1958 Dec1959—Dec
1960 JanFebMarAprMayJuneJulyAueSeptOctNovDec?
1961—Jan.?
Grandtotal
14,93915,15816,15919,387
19,389r19 49219,68119,860'20 187'•20,442'20,748r21,218'21,22821 44220,91221,371
20,975
In-terna-tionalinsti-
tutions2
1,4521,5171,544
43,158
3,1383 2853,3003,2343 3593,3173,3343,466
'3,5663,6823,6973,953
3,941
Foreign countries
Total
13,48713,64114,61516,229
16,252r16,20716,38216,62616,82817,12517,41417,75217,66217,76017,21617,418
17,034
Official
8,0457,9178,665
r9,152
'8,903r8,880r9,011'9,224r9,275r9,600'9,759
10,16010,10910,32810,10410,371
10,200
Private
5,4425,7245,950
'7,076
'7,348'7,326r7,371'7,402'7,553'7,525'7,655'7,592'7,5537,4327,1127,047
6,834
Ger-many,Fed.Rep.
of
1,8351,5571,7551,987
1,8991,9082,0122,1992,2202,4732,7042,8683,1093,2923,3673,478
3,505
UnitedKing-dom
1,0121,275
873990
1.0081,1651,2661,3401,5001,5991,7361,8001,8281,7931,6411.670
1,635
OtherEurope
4,0194,3105,0815,501
5,4145 2845,1224,9634,9404,8694,5734,5234,2644 2163,9823,958
3,648
TotalEurope
6,8657,1427,7088,479
8,322'8 357'8,399'8,502'8 660'8,942'9,013'9,190r9,2029 3028,9909,107
8,788
Canada
1,5161,6232,0192,198
2,3202 2722,3572,3862 4232 5302,6832,6992,6582 7112,5072,440
2,443
LatinAmerica
2,3462,5752 4032,406
2,3932 3782 3832,4782 5262 4322,4942 5402,4322 3662 3402,414
2,317
Asia
2 4151,9462 2052,774
2 8292 8062 8602,8432 8172 8242,8542 9372,9972 9983 0173,107
3,145
Allother
346355279373
388394382417403397369386374384362349
341
Table la. Other Europe
End of month
1956—Dec1957—Dec1958 Dec1959—Dec
I960 JanFebMarAprMayJuneJulyAueSeptOctNovDec.P
1961 Jan *>
OtherEurope
4,0194,3105,0815,501
5,4145,2845,1224,9634 9404,8694,5734,5234,2644,2163,9823,958
3,648
Aus-tria
296349411331
308300264234221198197203223229231243
213
Bel-gium
117130115138
152137156134141149172166146140141147
134
Den-mark
65112169137
120112114928280725347535354
54
Fin-land
53646977
839087757161644947484546
48
France
626354532655
664675719711726759650726646658583519
579
Greece
177154126186
188197160146128112977578546763
49
Italy
9301.079
,121,369
,358,245,159,142,050,060,095,127.017981952934
857
Neth-er-
lands
134203339485
496496482442430412386355300289277328
276
Nor-way
6793
13095
9594999697
101888585838182
80
Por-tugal
137142163138
128130125113104
88888788848584
81
Spain
43243686
9399
111108120149133132137187157149
114
Swe-den
217260303213
151196217265267261250250224219210227
229
Switz-er-
land
836967852969
977950931930928939878820806755693678
612
Tur-key
20182031
303130232419181416181718
21
Allother'
299360694590
571533468451552483386380402418391387
301
Table lb. Latin America
End of month
1956—Dec1957—Dec1958 Dec1959 Dec
I960 JanFebMarAprMayJuneJulyAueSeptOctNovDec.P
1961— Jan.?
LatinAmer-
ica
2,3462,5752 4032,406
2,3932,3782 3832,4782,5262 4322 4942,5402,4322 3662,3402,414
2,317
Argen-tina
146137150337
360380388386412388394393370324335315
299
Bo-livia
29262224
252321202221202023222123
23
Brazil
225132138151
152164156159172162162176173185186194
203
Chile
9175
100185
170159152147156144132132137116117135
120
Co-lom-bia
153153169217
222232204205205189185175167181166158
174
Cuba
211235286164
163151149146138130120111105908474
68
Do-min-icanRe-pub-
lic
68544037
363529293535353633343437
31
ElSal-
vador
25272628
313533333331272322222424
27
Guate-mala
64654237
445253545246403741414244
50
Mex-ico
433386418442
425All432437409355390399374358359397
367
Neth-er-
landsAn-tillesand
Suri-nam
69737986
868385828693989087797276
77
Pan-ama,Re-
pub-lic of
109136146129
131125128129123116123128127126122123
108
Peru
84607782
837072817977827770646472
65
Uru-guay
73558262
626862626360555464615251
49
Vene-zuela
455835494277
250209245317351301355407333349360383
363
OtherLatinAmer-ica6
111124133148
154172175190191285275282306313303306
293
* Preliminary. r Revised. For other notes see following page.
Digitized for FRASER Federal Reserve Bank of St. Louis

1NTL CAPITAL TRANSACTIONS OF THE U. S. 373
TABLE 1. SHORT-TERM LIABILITIES TO FOREIGNERS REPORTED BY BANKS IN THE UNITED STATES, BY COUNTRIES i—Continued
[Amounts outstanding, in millions of dollars]
Table lc. Asia and All Other
End of month
1956—Dec1957—Dec1958—Dec1959—Dec
I960—JanFebMarAprMayJune . . .JulyA u sSent .OctNovDec p
1961—Jan.?
Asia
Total
2,4151 9462,2052 774
2 8292,8062 8602 8432,8172 8242,8542,9372 9972,9983,0173,107
3,145
HongKong
66706260
616165615858595859586057
57
India
768277
114
11390
104686759555150363754
45
Indo-nesia
186151108139
146153150152138155158164162170148178
181
Iran
20554347
464345394737352725262522
20
Israel
45525687
938787939180687259627175
67
Japan
1,017586935
1,285
1.319,318365
,413,445476
,536,627705
,758808
,887
,953
Ko-rea,Re-pub-licof
99117145148
149145141140136139143144148153150152
139
Phil-
pines
272175176172
174177178184194198216219224217212203
193
Tai-wan
61869994
949595919090878989868484
84
Thai-land
148157133136
142142144142152154158163166169177180
190
Other
425417371494
493494486459399379339322311263245214
216
All other
Total
346355279373
388394382417403397369386374384362349
340
Aus-tralia
848579
110
10711210913511311410795
100878088
72
Con-£°>Rep.
ofthe
44393031
333442374637252729
r303232
33
Egyp-tianRe-
gion—U.A.R.
50401620
253833394142464022242722
20
Unionof
SouthAfrica
53383049
625743393040363231303329
38
Other
114153125162
162152157166174164155191192
'213189178
177
Area or country
Other Europe:AlbaniaBulgaria
Czechoslovakia 8Estonia
IcelandIreland Republic ofLatvia .LithuaniaLuxembourgMonacoPoland 8Rumania 8Soviet Zone of GermanyU. S. S. R.8
Other Latin America:Bahamas 9
BermudaCosta RicaEcuadorFrench West Indies and French Guiana. .HaitiHondurasNicaragua . • •ParaguayWest Indies Federation »
Other Asia:AdenAfghanistanBahrein Islands
Table lc1. Supplementary Areas and Countries7
End of year
1957
.16
\l1.7
.72 . 99 . 0
.55
16.45.43.2
.83.1
.7
7 916.422.7
.811.212 612.75.1
15.8
.84.7
.9
1958
.3
.3
.2
.61.7
.93.5
10 0.67
16.15.94.9
.91.42.2
6 824.517.4
.57.76 3
11.33.4
31.6
1.74 5
.9
1959
.31 2
.3
.71.81.32 . 75 4
.66
7.25.34.0
.91.52.6
14 318.921 7
.510 512 812.56.7
32.6
2.211 0
. 9
1960
.25
.51.0n.a.1.05.12 7
.56
12.64.16.11.11.3
12.1
47.221 719.827 3
.410.715 011.94.6
11.3
n.a.9 8n.a.
Area or country
Other Asia (Cont.):BurmaCambodia . . . . . .Ceylon
IraqJordan
LaosLebanonM^alaya Fed of . .PakistanPortuguese India (Goa)Ryukyu IslandsSaudi ArabiaSingapore .Syrian Region—U.A.RViet-Nam
All other:AlgeriaEthiopia and EritreaFrench SomalilandGhana .LiberiaLibya . . . . . . . . .Madeira IslandsMorocco,MozambiqueNew CaledoniaNew Zealand . .Somali RepublicSudan . . . .Tunisia
End of year
1957
6.720 034.236.319.6
1.65.9
33.128.2
1 612.82.5
32.794.87.13.5
58.5
935.1
3.1
23.010 7
.951.53.41.71.91.31 7
.8
1958
5.924 944.136.018.02 . 8
10.320 937.9
1 25.62.5
15.260.22.54.7
48.8
527.8
1 0.7
13.06 41.0
43.52.91.46.91.35 2
.3
1959
4 319 734.435.863.1
2 . 59 . 4
21 038 0
1 423.5
2.314.8
111.63.55.0
68.3
618.72 0
.420 317 6
657.82.01.36.8
.81 68.4
1960
910 96.9
34 8n.a.1.89 65 0
36 26 3
10.61.4n.a.18 41.9n.a.n.a.
49 3
9n.a.n a5 6
964.32.2n.a.n.a.3.5n a2 . 8
n.a. Not available. » Preliminary.1 Does not include banking liabilities to foreigners maturing in more
than one year; such liabilities amounted to $7 million on January 31,1961.
2 Includes International Bank for Reconstruction and Development,International Monetary Fund, and United Nations and other inter-national organizations.
3 Represents liabilities to foreign central banks and foreign centralgovernments and their agencies (including official purchasing missions,trade and shipping missions, diplomatic and consular establishments, etc.).
4 Includes $1,031 million representing increase in United States dollarsubscription to the International Monetary Fund paid in June 1959.
5 Includes Bank for International Settlements.« Beginning June 1960 includes Inter-American Development Bank.7 Except where noted, these data are based on reports by banks in
the Second (New York) Federal Reserve District. They represent apartial breakdown of the amounts shown in the "other" categories inTables la- lc .
8 Based on reports by banks in all Federal Reserve districts.» Prior to 1960 data for the Bahamas included with West Indies
Federation.NOTE.—Statistics on international capital transactions of the United
States are based on reports by U. S. banks, bankers, brokers, and dealers,by branches or agencies of foreign banks, by certain domestic institutionsnot classified as banks that maintain deposit or custody accounts forforeigners, and by the U. S. Treasury. The term "foreigner" is used todesignate foreign governments, central banks, and other official institu-tions, as well as banks, organizations, and individuals domiciled abroadand the foreign subsidiaries and offices of U. S. banks and commercialfirms.
Digitized for FRASER Federal Reserve Bank of St. Louis
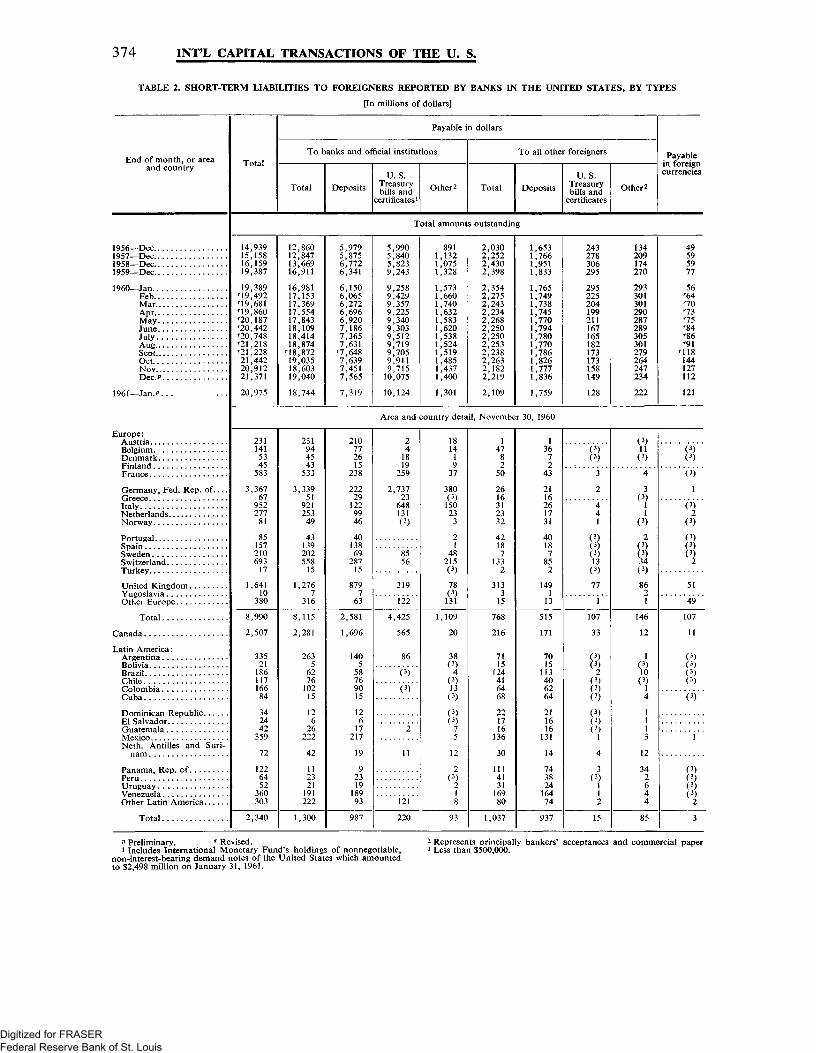
374 INT'L CAPITAL TRANSACTIONS OF THE U. S.
TABLE 2. SHORT-TERM LIABILITIES TO FOREIGNERS REPORTED BY BANKS IN THE UNITED STATES, BY TYPES
[In millions of dollars]
End of month, or areaand country
1956 Dec1957 Dec1958 Dec1959 Dec . .
1960 JanFebMarAprMayJuneJulyA.ugSentOctNOVDec p
1961— Jan.?. . .
Europe:AustriaBelsiumDenmarkFinland
Germany, Fed. Rep. of....
ItalyNetherlandsNorway
PortugalSpainSwedenSwitzerlandTurkey
United Kinsdom
Other Europe
Total
Canada
Latin America:ArgentinaBoliviaBrazilChileColombiaCuba
Dominican RepublicEl SalvadorGuatemalaMexicoNeth. Antilles and Suri-
nam
Panama Rep. ofPeruUrusuavVenezuelaOther Latin America
Total
Total
Payable in dollars
To banks and official institutions
Total Deposits
U.S.Treasurybills and
certificates1
Other 2
To all other foreigners
Total Deposits
U.S.Treasurybills and
certificates
Other 2
Payablein foreigncurrencies
Total amounts outstanding
14,93915,15816,15919,387
19,38919,492r19,68119,860r20,187r20,442'20,748r21,218'21,22821,44220,91221,371
20,975
12,86012,84713,66916,911
16,98117,15317,36917,55417,84318,10918,41418,874
18,87219,03518,60319,040
18,744
5,9795,8756,7726,341
6,1506,0656,2726,6966,9207,1867,3657,631
'7,6487,6397,4517,565
7,319
5,9905 8405,8239,243
9,2589 4299,3579,2259 3409,3039,5129,7199,7059,9119,715
10,075
10,124
8911,1321,0751,328
1,5731,6601,7401,6321,5831,6201,5381,5241,5191,4851,4371,400
1,301
2,0302,2522,4302,398
2,3542,2752,2432,2342,2682,2502,2502,2532,2382,2632,1822,219
2,109
,653766
,951,833
,765749
,738,745770
,794,780770
,786,826111
1,836
1,759
243278306295
295225204199211167165182173173158149
128
134209174270
293301301290287289305301279264247234
222
49595977
56r64
'73r75r84'86'91
1 1 8144127112
121
Area and country detail, November 30, 1960
2311415345
583
3,36767
952277
81
85157210693
17
1,64110
380
8,990
2,507
33521
186117166
84
342442
359
72
1226452
360303
2,340
231944543
533
3,33951
92125349
43139202558
15
1,2767
316
8,115
2,281
2635
6276
10215
126
26222
42
112321
191222
1,300
210772615
238
22229
1229946
4013869
28715
8797
63
2,581
1,696
1405
58769015
126
17217
19
92319
18993
987
24
1819
259
2,73723
648131
8556
319
122
4,425
565
86
(3 )
( 3 )
2
11
121
220
1814
19
37
380(3)
15023
3
21
48215
78
131
1,109
20
38(3 )
4(3 )
13
(3 )75
12
2
2
8
93
147
82
50
2616312332
42187
1332
3133
15
768
216
7115
124416468
221716
136
30
1114131
16980
1,037
3672
43
2116261731
40187
852
1491
13
515
171
7015
113406264
211616
131
14
743824
16474
937
(3 )
3
2
44
( 3 )
( 3 )
13
77
1
107
33
( 3 )2
(3 )
(3 )
(3 )(3 )
4
3
112
15
( 3 )
11(3)
4
3
11
2
( 3 )34
8621
146
12
1( 3 )
10(3 )
14
1
13
12
342644
85
(3)
1
(3 )
2
(3)(3)(3)
2
51
49
107
11
( 3 )( 3 )(3 )
( 3 )
1
( 3 )
(3 )(3 )
3
P Preliminary. r Revised.1 Includes International Monetary Fund's holdings of nonnegotiable,
non-interest-bearing demand notes of the United States which amountedto $2,498 million on January 31, 1961.
2 Represents principally bankers' acceptances and commercial paper3 Less than $500,000.
Digitized for FRASER Federal Reserve Bank of St. Louis

INT'L CAPITAL TRANSACTIONS OF THE U. S. 375
TABLE 2. SHORT-TERM LIABILITIES TO FOREIGNERS REPORTED BY BANKS IN THE UNITED STATES, BY TYPES—Continued
[In millions of dollars]
Area andcountry
Asia:Hong KongIndiaIndonesia . . . . •IranIsrael
JapanKorea Rep ofPhilippinesTaiwanThailand . .Other Asia
Total
All other:AustraliaCongo Rep of the .Egyptian Region—U.A.R..Union of South Africa....Other
Total
Total foreign countries.
International institutions....
Grand total
Total
6037
1482571
1,80815021284
177245
3,017
80322733
189
362
17,216
3,697
20,912
Payable
To banks and official institutions
Total
3526
1462067
1,79014819377
174210
2,886
77312629
163
325
14,907
3,696
18,603
Deposits
U.S.Treasurybills and
certificatesOther i
n dollars
To all other foreigners
Total
Area and country detail, November 30,
2922832023
9791361677420
153
1,706
30211729
126
222
7,192
258
7,451
33
\A
7331221
12239
975
4288
35
93
6,277
3,438
9,715
74
29
30
78
53
3317
205
521
2
11
1,437
1,437
2411254
162
1973
35
127
3
14
25
34
2,182
C2)
2,182
Deposits
U.S.Treasurybills and
certificates
1960—Continued
2311254
152
1963
33
123
3I14
23
31
1,777
1,777
«
p>
p>
i
(2)
(2)
158
158
Other i
1
(2)
1
( 2 ) "
1
3
(22>
2
247
247
Payablein foreigncurrencies
(2)1
(2)
1
(2)1
3
(2)C2)
2
3
127
127
1 Represents principally bankers' acceptances and commercial paper.2 Less than $500,000.
TABLE 3. SHORT-TERM CLAIMS ON FOREIGNERS REPORTED BY BANKS IN THE UNITED STATES, BY COUNTRIES i
[Amounts outstanding, in millions of dollars]
End of month Total France
Ger-many,Fed.
Rep. of
ItalySwit-zer-land
UnitedKing-dom
OtherEurope
TotalEurope
Can- LatinAmer-
icaAsia All
other
1956—Dec..1957—Dec..1958—Dec..1959—Dec..
I960—Jan..Feb..Mar.Apr..May.June.July.Aug.Sept.Oct..Nov.Dec.
1961—Jan.p
1,9462,1992,5422,623
2,7002,6802,7282,70^r2,6912,7643,06:r3,1173,160'3,3543,3263,554
3,586
1811410257
463825252628273329322831
33
1571407754
515153555562636877847881
78
43563630
393830333232303533423534
38
29344238
513937413642364145545560
10498124121
111124112129135181234239256237222244
201
216211315234
229229231228226230227212226236240260
237
568654696534
526519488512509575617628665685658710
648
157154243272
255234246254258272336341356397376401
413
840956,099,175
,241,248,257,172,124,111,203,200,150,244,254,350
,342
337386435586
624626682715743746r845r886'"921'958972
1,025
1,110
43506956
555354555660616268696668
73
P Preliminary. r Revised.1 Short-term claims reported in these statistics represent principally
the following items payable on demand or with a contractual maturityof not more than one year; loans made to and acceptances made for
foreigners; drafts drawn against foreigners that are being collected bybanks and bankers on behalf of their customers in the United States;and foreign currency balances held abroad by banks and bankers and theircustomers in the United States.
Digitized for FRASER Federal Reserve Bank of St. Louis

376 INTL CAPITAL TRANSACTIONS OF THE U. S.
TABLE 3. SHORT-TERM CLAIMS ON FOREIGNERS REPORTED BY BANKS IN THE UNITED STATES, BY COUNTRIES i
[Amounts outstanding, in millions of dollars]
Table 3a. Other Europe
Continued
End of month
1956 Dec1957—Dec1958 Dec1959 Dec
I960 JanFebMarAprMay
July
SeptOctNovD e c p
1961—Jan.P
OtherEurope
216211315234
229229231228226230227212226236240260
237
Aus-tria
7674
433222323232
2
Bel-gium
28256556
565349514650494141455061
63
Den-mark
12111418
181512977679
101313
14
Fin-land
4468
899988978999
9
Greece
4675
333444565576
5
Neth-er-
lands
21295638
332630263634363029323033
34
Nor-way
2323227
87867789
11161717
11
Por-tugal
2222
222222223334
3
Spain
88
308
76665577
10878
6
Swe-den
13102419
171718192322221823252628
26
Tur-key
o n
767247
506669676062555961585349
41
Yugo-slavia
(2)
1789
1112121211978
11
9
Allother
7109
18
161614151314121315161518
14
Table 3b. Latin America
End of month
1956—Dec1957 Dec1958 Dec1959—Dec
I960—JanFebMarAprMay
JulyAugSeptOctNovDec p
1961 Jan P
LatinAmer-
ica
840
rT
r
1,0991,175
1,241,248
1,2571,1721,1241,1111,2031,2001,150[.244,254
ISO
1,342
Argen-tina
15284060
606165636876818796
108112121
122
Bo-livia
4333
333444444444
4
Brazil
72100148117
138150151148161156173176189212206225
229
Chile
16335259
585751505050575457556372
74
Co-lom-bia
1451035168
717071757777807879777680
80
Cuba
9o113166115
1039695927767625531292726
25
Do-min-icanRe-
pub-lic
7151929
292723201917161817171716
14
ElSal-
vador
118
1015
105556779
14191922
21
Guate-mala
78
1210
121312131311111111121314
13
Mex-ico
213231293291
288257282297325321335333316303302340
342
Neth-er-
landsAn-tillesand
Suri-nam
5264
355355564458
5
Pan-ama,Re-
pub-lic of
12182318
181918172217171620192223
27
Peru
35313136
353836404143434643424344
48
Uru-guay
15425247
474651524942383952555257
50
Vene-zuela
144170142247
314346334242157169224219164233235234
231
OtherLatin
Amer-ica
49515357
525554525050
r50r50r52565765
57
Table 3c. Asia and Ail Other
End of month
1956 Dec1957—Dec1958 Dec1959 Dec
I960 JanFebMarAprMayJune ..July
SeptOctNovDec P
1961—Jan v
Asia
Total
337386435586
624626682715743746
'845r886r921'958972
1,024
1,110
HongKong
476
10
11121211121110109888
7
India
6646
666887979
11119
8
Iran
20222729
3030313533353638363534CO
C
O
Israel
16242314
141713151617161514151724
27
Japan
170146179324
362372420456488497
r586r628'660••695712780
866
Phil-ippines
16536724
241822222114222623252419
16
Tai-wan
6669
999
10101110106877
7
Thai-land
9141315
141213101211151415151624
22
Other
91110111155
154151154148145143141140149147143121
123
All other
Total
43506956
555354555660616268696668
73
Aus-tralia
1113C
OO
O
OO
vC
18192123252527292727
28
CongoRep.of the
6543
3333333253
CO
CO
I
Egyp-tianRe-
gion—U.A.R.
2132
22
21221229CO
C
O
Unionof
SouthAfrica
8122112
101110111111121011101011
12
Other
17192921
222123192021212223252524
27
* Preliminary. f Revised.* See note 1 on preceding page.
2 Less than $500,000.
Digitized for FRASER Federal Reserve Bank of St. Louis

ENTL CAPITAL TRANSACTIONS OF THE U. S. 377
TABLE 4. CLAIMS ON FOREIGNERS REPORTED BY BANKS IN THE UNITED STATES, BY TYPES
[In millions of dollars]
End of month, or areaand country
1955 Dec1956 Dec1957 Dec . .1958 Dec1959 Dec
I960 JanFebMarAprMayJuneJulyAugSeptOctNovDec P
1961— Jan. v
Europe:AustriaBelsiumDenmarkFinlandFrance
Germany, Fed. Rep. ofGreeceItalyNetherlandsNorway
Portusal .Spain .SwedenSwitzerland . .Turkey
United Kingdom
Other Europe
Total
Canada • . . . .
Latin America:Argentina
BrazilChileColombiaCuba
Dominican RepublicEl Salvador
Netherlands Antilles andSurinam
Peru
Other Latin America
Total
Long-term—total i
Short-term
Total
Payable in dollars
Total
Loans to:
Banks andofficialinstitu-tions
Others
Collec-tionsout-
standingOther
Payable in foreign currencies
TotalDeposits
withforeigners
Other
Total amounts outstanding
671839
r
1,1741,3621,545
1,5271,5171,5331,5871 6281,5991,6661,6361,6261,6281,6591.694
1,650
1,5491,9462 1992,5422,623
2,7002,6802,7282,7072,6912,7643.062
r3,117r3,160r3,3543,3263.554
3,586
1,3851,7962,0522,3442,406
2,4912,4872,5202,4902,4662,4852,665
%708r2,729r2,8762,9023,077
3,111
489582627840848
873845806774768726731715
f719831772813
804
236330303428460
425411397408392387387385386404436480
466
353440423421516
517526538562569579
r561r554r578'591604591
620
307444699656582
676705779746737793986
1,0541,0451,0491,0911,192
1,221
164150147198217
209194208218224280397409431478424477
475
144131132181203
195175179186191198223221270293221242
198
2019151615
141929313482
173188161185203235
276
Area and country detail, November 30, 1960
330
33
21
264
2710
133
35
322
2919
341
68
114(2)
2184128
1
1PJ197
3
3011(2)
19365
910
350139
28
787
353017
37
265553
2228
15
658
376
1124
206637627
171913
3025
224352
23557
1,254
249139
26
657
332615
36
243653
578
15
446
242
914
206627627
161913
2985
224352
23457
1,227
( 2 )
291
2
212874
1338
49
642
151
13
9(2)64
874
581
123
1
596
4
336
( 2 )
42
3
61531
615
3
2
52
192
8(2)1317112
12
492
1173
488
183
11122
10
214
15123
11663
1715
123
14
273
33142619
357
333
517
35233
285
(2)587
11
17
47
197
3125
120
22
46
952332
2
862
93
18423813
423
<*)
(2)2
13
142
220
166
8212
134
21
n\(2)(2)(2)
(44
8(2)
1
27
(2)1
(2)2
12
i "4
18
77(2)
107
47
21
1(2)3
(2)(2)
( 2 )
24
(2)(2)
(2)(2)
<?(2)
n\1
12
89
(2)
105
87
(2)
n\(2)(2)
( 2 )
1
(2)1
(2)
( . 2 ) . .
3
year.
Preliminary. r Revised,i Represents mainly loans with an original maturity of more than one
2 Less than $500,000.
Digitized for FRASER Federal Reserve Bank of St. Louis

378 BNTTL CAPITAL TRANSACTIONS OF THE U. S.
TABLE 4. CLAIMS ON FOREIGNERS REPORTED BY BANKS IN THE UNITED STATES, BY TYPES—Continued
[In millions of dollars]
Area andcountry
Asia:
Indonesia
Israel
JapanKorea Rep. of
TaiwanThailandOther Asia
Total
Allother:AustraliaCongo Rep. of theEgyptian Region—U.A.R..Union of South AfricaOther
Total
International institutions... .
Grand total
Long-term—total i
120391410
19
17
2
129
2740
55881
211
1,659
Short-term
Total
811
3417
7122
247
16141
972
2722
1025
66
3,326
Payable in dollars
Total
Loan
Banks andofficialinstitu-tions
s to:
Others
Collec-tionsout-
standing
Area and country detail, November 30,
88
3417
6722
247
16140
929
24229
21
58
2,902
51
23
107
S27
120267
1
3
4
772
p>
2
15
3
3
436
26
2
782212
18
145
11218
15
37
604
Other
Payable in foreign currencies
Total
960—Continued
1
12
485
i471
512
12
11
14
1,091
2
40
(2)
1
43
4
3
8
424
Depositswith
foreigners
<?
39
(2)
(2)
40
1
333
2
221
Other
2
/ •2 \
i
2
3
3
6
203
i Represents mainly loans with an original maturity of more thanone year.
2 Less than $500,000.
TABLE 5. PURCHASES AND SALES BY FOREIGNERS OF LONG-TERM SECURITIES, BY TYPES i
[In millions of dollars]
Year or month
1957195819591960^
I960—JanFebMarAprMayJuneJUlyAu2SeptOctNovDec*
1961—Jan.?
U. S. Govt. bonds & notes
Pur-chases
6661 2241,2171,730
104119113188166198486144
148345195
73
Sales
7181,188
5281,604
53887086
24117058
r18793
196262
99
96
Net purchases,or sales (—)
Total
— 5236
689125
503242
102- 7 5
29- 1 0
r -126-49- 4 8
8296
- 2 3
Foreigncountries
117-237
527- 9 9
49179
44- 2 9
- 5- 9
r - 5 0- 4 2-48- 1 3- 2 3
- 2 3
U. S. corporate securities 2
Pur-chases
1 6171,7592,5932,417
229194199191205272189
r183181179187208
250
Sales
1 4231,7982,1582,166
152149156145183220192
r184199187180219
219
Net pur-chases, orsales ( - )
194- 3 9435251
774643452352
r _ 4
- 1 8- 8
7- 1 2
30
Foreign bonds
Pur-chases
699889946882
577757765984533673
2443631
54
Sales
1,3921,9151.4581,430
59238174109
87142836089
2684477
89
Net pur-chases.orsales ( - )
693-1,026
-512-548
- 1-161-117
- 3 3- 2 8- 5 8- 3 0- 2 4- 1 6- 2 4o- 4 5
- 3 5
Foreign stocks
Pur-chases
593467566501
564142415850353536354331
51
Sales
622804804575
453644594670464844355448
49
Net pur-chases, orsales ( - )
—29-336-238- 7 4
115
- 2- 1 9
12- 1 9- 1 1— 13
- 8
-ft- 1 7
2
P Preliminary. r Revised.i Includes transactions of international institutions.
2 Includes small amounts of U. S. municipal securities.3 Less than $500,000.
Digitized for FRASER Federal Reserve Bank of St. Louis

INT'L CAPITAL TRANSACTIONS OF THE U. S. 379
TABLE 6. NET PURCHASES BY FOREIGNERS OF UNITED STATES CORPORATE SECURITIES,BY TYPE OF SECURITY AND BY COUNTRY 1
[Net sales, ( —). In millions of dollars]
Year or month Total 2
Type of security
Stocks Bonds
Country
Belgium FranceNeth-
er-lands
Switz-er-
land
UnitedKing-dom
OtherEurope
TotalEurope
CanadaLatinAmer-
icaAll
other2
195719581959I960?
I960—Jan...Feb..Mar..Apr..May.June.July..Aug..Sept..Oct . .Nov..Dec?
1961—Jan. P.
194- 3 9435251
774643452352
r_4r-l- 1 8
- 87
- 1 230
143- 5 6363201
72342934
646
- 14
- 1 8- 2 2
106
32
51177350
5111412176
r 3r-5
114
- 3-18
- 1
14- 3
55
8(3)()
1- 4- 1
3
24038
97433322
- 1232
35- 831
1
3- 6
52321
(3)
- 4
2
10119
254171
28342321
430
- 11 3
- 1 22014
- 2
77_ |15
- 4 8
13- 6
68
- 3114
- 4- 7
- 2 9- 2 0- 2 1
20
3566
1772443
_ j17
25510
379234
713741371350
41 6
- 1 3- 7
3- 1 7
22
- 9 9- 8 6- 3 0- 4 6
- 22
- 124
- 4- 1 2- 2 2
- 4- 6- 2
- 4
23234036
77123323125
15144628
21353432
- 2325
Preliminary. r Revised,i Includes small amounts of U. S. municipal securities.
2 Includes transactions of international institutions.3 Less than $500,000.
TABLE 7. NET PURCHASES BY FOREIGNERS OF LONG-TERMFOREIGN SECURITIES, BY AREAS
Year ormonth
195719581959I960?
1960—JanFeb..Mar..Apr..May.June.July..Aug..Sept..Oct...Nov..Dec.p
1961— Ian P. ..
[Net sales, ( - ) .
Inter-national
insti-tutions
- 3 8 4- 5 5 8- 1 5 7— 147
29- 1 0 1
7- 2
- 3 95
- 9- 1 0- 2 1- 1 6
72
- 1
Totalforeigncoun-tries
- 3 3 8- 8 0 5- 5 9 3- 4 7 5
- 2 0- 5 6
- 1 2 6- 5 0
22- 8 3- 3 3- 2 7
- 4o
- 2 6- 6 4
- 3 3
In millions of dollars]
Europe
231- 7 2- 5 0
-106
- 1 79
- 3- 422
f-27- 6
- 3 4- 5- 7
- 1 8- 1 9
- 2 7
Can-ada
-552-543-443-197
2- 4 3- 8 9- 2 4
-8- 1 05
128
10- 1 6
- 5
LatinAmer-
ica
155
11- 9 2
0)- 2 0- 3 2
223
- 1 53
- 79
- 1 4- 2 4
1
Asia
- 4 5- 4 5- 9 7- 4 1
- 6- 3- 4- 2
2- 4- 4- 1- 6
7- 6- 9
- 6
Allother
13- 1 5 0
- 1 5- 3 6
112
- 2 21
- 2211
- 2 413
4
p Preliminary. r Revised,i Less than $500,000.
TABLE 8. DEPOSITS AND OTHER DOLLAR ASSETS HELD ATFEDERAL RESERVE BANKS FOR FOREIGN CORRESPONDENTS i
[In millions of dollars]
End of month
1959—Dec
I960—FebM a r . . . .A p r . . . .M a y . . .J u n e . . .J u l y . . . .Aug.. . .SeptOctN o v . . . .Dec
1961—JanFeb
Deposits
345
191184194215254215204223251252217
238207
Assets in custody
U. S. Govt.securities2
4,477
4,7074,7284,8184,8414,9775,2725,4235,4795,6345,4305,726
5,7935,879
Miscel-laneous 3
570
466615639643672671701713718752756
714694
1 Excludes assets held for international institutions, and earmarkedgold. See note 4 at bottom of p . 370 for total gold under earmark atFederal Reserve Banks for foreign and international accounts.
2 U. S. Treasury bills, certificates of indebtedness, notes, and bonds.3 Consists of bankers' acceptances, commercial paper, and foreign and
international bonds.
Digitized for FRASER Federal Reserve Bank of St. Louis

380 INTL CAPITAL TRANSACTIONS OF THE U. S.
TABLE 9.—SHORT-TERM LIABILITIES TO AND CLAIMS ON FOREIGNERS REPORTED BY NONFINANCIAL CONCERNS
[End of year or quarter. In millions of dollars]
Area and country
Europe:Austria
Finland
Germany, Fed. Rep. ofGreeceItalyNetherlands • . .Norway
Portugal
SwedenSwitzerland
United KingdomYugoslaviaOther Europe
Canada
Latin America:
Brazil
ColombiaCuba
Dominican RepublicEl SalvadorGuatemalaMexicoNeth. Antilles and Surinam.
PeruUruguay
Other Latin America
Total
Asia:
India
Korea Ret> of . . . .
ThailandOther Asia
Total
All other:
Conco Ret) of the . . . .Egyptian Region—.U.A.R.Union of South AfricaOther
Total
International institutions
Grand total
Liabilities to foreigners
Dec. 1957
126
11
27
1088
1713
16871
8021
219
75
41
21656
72
10113
173
98
34321
35
268
70
181128
30
0)491
Dec. 1958
329
11
34
121
101714
17
14151
90
252
31
101
16335
1
1104
435
145
85
26231
13
216
42
19
45
29
C1)
440
Dec. 1959
12821
42
551
133911
18
26342
11215
382
54
121
18435
10)
7
234
184
87
28342
15
164
53
5
75
18
0)593
Mar. 1960
32121
43
561
14399
2042
2
10915
376
54
53
15539
10)
6
324
205
86
33331
23
145
53
6
66
19
C1)
588
June 1960P
21621
37
481
13447
1429
1
8916
320
58
92
20534
10)
6
533
194
87
24441
19
235
51
81165
22
0)537
Claims on foreigners
Dec. 1957
21341
21
255
29265
210137
22
5516
248
112
113
68101025
525
331
1219
64619
275
26248
42
18
25
107
12237
12
36
0)777
Dec. 1958
31071
21
213
31237
310255
25
6214
262
101
132
6286
24
425
361
313
53315
234
26194
37
24
19
95
8227
10
28
0)720
Dec. 1959
41093
25
312
33214
211221313
530)
264
101
253
54107
27
314
271
1182
3516
235
2527
11
361
1023
13
92
16136
10
38
0)730
Mar. 1960
4942
28
253
26154
31223199
730)
265
89
144
5599
26
213
301
563
3218
220
2728
11
411823
15
100
15158
11
41
C1)
715
June 1960^
51151
33
272
26166
41127209
14913
358
110
123
629
1120
224
302
985
3119
228
2718
10
391724
18
99
15168
11
41
0)837
* Preliminary.i Less than $500,000.NOTE.—Reported by exporters, importers, and industrial and com-
mercial concerns in the United States. Data excludes claims held throughUnited States banks, and intercompany accounts between United Statescompanies and their foreign affiliates.
Digitized for FRASER Federal Reserve Bank of St. Louis

U- S. BALANCE OF PAYMENTS 381
UNITED STATES BALANCE OF PAYMENTS
[Department of Commerce estimates. Quarterly totals in millions of dollars]
Item1957 1958 1959 1960
Exports of goods and services, total1 .MerchandiseServices2
Imports of goods and services, total...MerchandiseServicesMilitary expenditures
Balance on goods and services1
Unilateral transfers (net)3
Private remittances and pensions...Government nonmilitary grants.. . .
U.S. long- and short-term capital (net)2
Private, totalDirect investmentPortfolio and short-term invest-
mentGovernment
Foreign capital and gold (net)Increase in foreign short-term assets
and Government securitiesIncrease in other foreign assetsGold sales by United States
Errors and omissions
6,3264,4621,864
5,3613,2651,381
715
965
-499-164-335
-544-410-339
- 7 1-134
-269
-26018
- 2 7
347
6,6544,6621,992
5,1523,3851,047
720
1,502
-581-180-401
-956-588-324
-264-368
227
27550
- 9 8
-192
5,6114,0581,553
4,9413,139
970832
670
-563-178-385
-887-642-155
-487-245
580
19713
370
200
5,9654,1931,772
5,2783,1661,200
912
687
-598- 1 7 4- 4 2 4
-1,251-1,025
-411
-614-226
1,086
26- 1 5
1,075
76
5,6073,8161,791
5,3883,1241,425
839
219
-544-174-370
-784-451-156
-295-333
934
477- 2 6483
175
6,1424,1961,946
5,4463,5221,095
829
696
-633-196-437
-893-726-372
-354-167
901
50252
347
- 7 1
5,4213,8021,619
5,4313,5971,059
775
- 1 0
-627-190-437
-470-391-267
-124- 7 9
947
7807295
160
5,7974,0601,737
5,9673,8841,293
790
-170
-578-185-393
4-1,033-745-449
-2964-288
4829190
4397
365
5,8784,0351,843
6,2003,8481,579
773
- 3 2 2
- 5 3 4- 2 0 1- 3 3 3
-620-392-229
-163-228
1,444
1,119158167
32
6,3684,3282,040
5,9623,9861,224
752
406
-663-203-460
-536-773-365
-408237
567
36712872
226
6,3094,6041,705
5,7613,8201,177
764
548
-575-195-380
-768-546-269
- 2 7 7- 2 2 2
801
56618550
- 6
6,9035,0001,903
6,0493,8581,455
736
854
-624-213-411
-1,064-683-297
-386-381
979
73315294
-145
6,6814,6732,008
6,0223,5551,677
790
659
-614-209-405
-1,008-864-345
-519-144
1,151
515- 1637
-188
P Preliminary.1 Excluding military transfers under grants.2 Including military transactions.
3 Minus sign indicates net outflow.4 Excluding additional U. S. subscription to IMF of $1,375 million,
of which $344 million was transferred in gold and $1,031 million innoninterest bearing U. S. Government securities.
OPEN MARKET RATES
[Per cent per annum]
Month
1958—Dec1959—Dec
1960—JanFebMarAprMayJuneJulyAugSeptOctNovDec
1961—Jan
Canada
Treasurybills,
3 months1
3.465.02
4.814.693.873.402.872.873.132.531.892.653.533.53
3.20
Day-to-day
money2
2.074.30
3.604.143.833.332.772.843.242.701.582.363.263.16
2.75
United Kingdom
Bankers'accept-ances,
3 months
3.343.72
4.144.694.744.804.765.045.765.755.715.624.984.64
4.45
Treasurybills,
3 months
3.163.61
4.074.554.594.654.584.885.585.585.535.364.744.44
4.25
Day-to-day
money
2.702.85
3.073.783.913.673.873.984.674.794.854.794.303.88
3.77
Bankers'allowance
ondeposits
2.002.00
2.353.003.003.003.003.254.004.004.003.923.503.12
3.00
France
Day-to-day
money3
6.074.07
3.914.114.174.224.254.154.534.054.153.993.763.70
Germany
Treasurybills
60-90days 4
2.383.75
3.753.884.004.004.004.884.884.884.884.884.003.75
3.25
Day-to-day
moneys
2.633.56
3.693.944.063.943.884.754.694.755.255.314.694.31
3.88
Netherlands
Treasurybills,
3 months
2.262.52
2.532.482.332.252.302.492.192.052.001.961.571.51
1.32
Day-to-day
money
1.501.50
1.501.541.651.751.541.751.641.561.501.641.141.13
1.00
Switzer-land
Privatediscount
rate
2.502.00
2.002.002.002.002.002.002.002.002.002.002.002.00
2.00
i Based on average yield of weekly tenders during month.* Based on weekly averages of daily closing rates.3 Rate shown is on private securities.
4 Rate in effect at end of month.5 Based on average of lowest and highest quotation during month.
Digitized for FRASER Federal Reserve Bank of St. Louis

382 MONEY RATES
CENTRAL BANK RATES FOR DISCOUNTS AND ADVANCES TO COMMERCIAL BANKS 1
[Per cent per annum]
Country
Argentina 2
BelgiumBrazil2
Canada3
Ceylon2
Chile4
Colombia2
Costa Rica2
Cuba2
DenmarkEcuador2
EgyptEl Salvador2
FinlandFranceGermanyGreece . . .Honduras 5
IcelandIndia Indonesia2
Ireland
IsraelItalyJapan 2
MexicoNetherlands
New Zealand . . . . .NicarasuaNorwayPakistanPeru2
Philippine Republic2
Portugal . . . .South AfricaSpainSweden
SwitzerlandThailandTurkeyUnited KingdomVenezuela 2
Rate as ofFeb. 29, 1960
Percent
6.04.54.0
10.03.0
4.862.5
16.45.03.0
6.05.55.03.05.5
6.754.04.09.02.0
11.04.03.04.04.75
6.03.57.34.53.5
6.06.03.54.09.5
6 52.04.05.05.0
2.07 .06.05.04.5
Montheffective
Dec. 1957Apr. 1959Dec. 1959Apr. 1958Feb. 1948
Feb. 1960Dec. 1959Jan. 1960Aug. 1959Apr. 1939
Jan. 1960Jan. 1960Nov. 1956Nov. 1952Jan. 1960
Mar. 1959Apr. 1959Oct. 1959Dec. 1959Jan. 1953
Feb. 1960May 1957Apr. 1946Aug. 1948Jan. 1960
Feb. 1955June 1958Dec. 1959June 1942Nov. 1959
Oct. 1959Apr. 1954Feb. 1955Jan. 1959Nov. 1959
Feb 1959Jan. 1944Jan. 1959Aug. 1959Jan. 1960
Feb. 1959Feb. 1945June 1956Jan. 1960Nov. 1959
Changes during the last 12 months
1960
Mar.
5.0
3.26
Apr.
3.51
7.0
4 . 6
May
3.26
6.0
June
3.32
5.0
6.6
July
3.17
16 55
5.5
Aug.
5 .0
2.54.0
6 94
4 5
Sept.
1.95
5.75
Oct.
3.28
3 5
5 56.5
Nov.
4.02
4 . 06 .0
5 31
5 0
Dec.
3 .5
9 . 0
5 0
1961
Jan.
3.29
3 5
6.57
Feb.
3.46
Rateas of
Feb. 28,1961
6.05.05.0
10.03.0
3.464.0
16.555.03.0
6.05.55.03.05.5
6.753.53.56.02.0
9.04.03.04.05.31
6.03.56.574.53.5
6.06.03.54.09.5
5.02.04.54.65.0
2.07.06.05.06.5
1 Rates shown represent mainly those at which the central bank eitherdiscounts or makes advances against eligible commercial paper and/orgovernment securities for commercial banks or brokers. For countrieswith more than one rate applicable to such discounts or advances, therate shown is the one at which the largest proportion of central bankcredit operations is understood to be transacted. In certain cases otherrates for these countries are given in note 2.
2 Discounts or advances at other rates include:Argentina—3 and 5 per cent for certain rural and industrial paper, de-pending on type of transaction;Brazil—8 per cent for secured paper and 4 per cent for certain agriculturalpaper;Ceylon—4.0 per cent for advances against certain types of commercialand production paper (increased from 2.5 per cent on Jan. 20, 1960);Colombia—3.5 per cent for agricultural and industrial developmentpaper of up to 150 days, 3 per cent for economic development paperof up to 5 years, and 2 per cent for specific small business, cooperativeand employee paper;Costa Rica—5 per cent for paper related to commercial transactions(rate shown is for agricultural and industrial paper);Cuba—5.5 per cent for sugar loans and 5 per cent for loans secured bynational public securities;Ecuador—6 per cent for bank acceptances for commercial purposes;
El Salvador—4.5 per cent for agricultural and industrial paper and 3.5per cent for special cases;Indonesia—various rates depending on type of paper, collateral, com-modity involved, etc.;Japan—penalty rates (exceeding the basic rate shown) for borrowingsfrom the Central bank in excess of an individual bank's quota;Peru—8 per cent for agricultural, industrial and mining paper;Philippine Republic—^4.0 per cent for crop loan paper and 4.0 per cent forexport packing credit paper; andVenezuela—6 per cent for rediscounts of certain agricultural paper andfor advances against government bonds or gold and 7 per cent on ad-vances against securities of Venezuelan companies.
3 Since Nov. 1, 1956, the discount rate has been set each week atlA of one per cent above the latest average tender rate for Treasury bills;end-of-month rate shown.
4 Since April 1, 1959, new rediscounts are granted at the average ratecharged by banks in the previous half year. Old rediscounts remain subjectto old rates provided their amount is reduced by one-eighth each monthbeginning May 1, 1959, but the rates are raised by 1.5 per cent for eachmonth in which the reduction does not occur.
5 Rate shown is for advances only.6 Since May 16, 1957, this rate applies to advances against commercial
paper as well as against government securities and other eligible paper.
Digitized for FRASER Federal Reserve Bank of St. Louis

FOREIGN EXCHANGE RATES 383
FOREIGN EXCHANGE RATES
[Average of certified noon buying rates in New York for cable transfers. In cents per unit of foreign currency]
Year or month
Argentina(peso)
Official Free
Aus-tralia
(pound)
Austria(schilling)
Belgium(franc)
Canada(dollar)
Ceylon(rupee)
Finland(markka)
France(franc)
1955.1956.1957.1958.1959.1960.
1960—FebMarAprMayJuneJulyAugSeptOctNovDec
1961—Jan..Feb..
5.5565.5565.556
.2730
.2026
.2032
.2030
.2004
.2005
.1989
.2010
.2022
.2037
.2042
.2054
.2061
1.20581.2061
7.1832.8352.5062.207
222.41222.16222.57223.88223.81223.71
223.37223.57223.86223.59223.32223.78223.92224.12224.03224.18223.69
223.62223.10
85808580853985368619
3.8461
.8419
.8418
.8407
.8406
.8426
.8468
.85733.86093.85093.84323.8409
3.83913.8352
1,99052.00301.99062.00442.00122.0053
2.00482.00512.00612.00552.00532.00411.99552.00242.00612.01302.0131
2.00742.0026
101.40101.60104.29103.03104.27103.12
105.07105.15103.84102.24101.79102.19103.10102.82102.18102.37101.78
100.69101.03
20.89420.94620.91321.04921.05521.048
21.03121.04421.06221.04721.02021.04821.06121.07221.06321.06521.044
21.03721.013
.4354
.4354
.3995
.3118
.3115
.3112
.3113
.3113
.3112
.3112
.3112
.3111
.3111
.3111
.3111
.3112
.3112
.3112
.3112
.23762.2374.2038
320.389
20.36920.37620.38420.39620.40120.40420.40420.40420.37520.40220.387
20.40120.402
Year or monthGermany(deutsche
mark)
India(rupee)
Ireland(pound)
Italy(lira)
Japan(yen)
Malay-sia
(dollar)
Mexico(peso)
Neth-erlands(guilder)
NewZealand(pound)
195519561957195819591960
1960—Feb..Mar.Apr.,May,JuneJuly.Aug.Sept.Oct..Nov.Dec.
1961—Jan..Feb..
23.76523.78623.79823.84823.92623.976
23.97723.97823.97823.97823.98023.97923.97823.97823.96823.97423.973
23.96823.966
20.89420.93420.91021.04821.03120.968
20.95120.96320.97820.95820.93520.96620.97820.99020.98321.00020.982
20.97520.950
279.13279.57279.32280.98280.88280.76
280.33280.59280.95280.60280.27280.84281.02281.27281.16281.35280.74
280.64279.99
.1610
.1610
.1610
.1610
.1611
.1611
.1611
.1611
.1611
.1611
.1611
.1610
.1610
.1610
.1607
.2779
.2779
.2779
.2778
.2778
.2773
.2773
.2776
.2774
.2768
.2783
.2787
.2787
.2787
.2778
.2781
.2786
.2786
32.62432.58232.52732.76732.85732.817
32.77132.76732.83332.81032.78532.83932.84632.85132.83832.85832.833
32.82632.774
.0056
.0056
.0056
.0056
.0056
.0056
.0056
.0056
.0056
.0056
.0056
.0056
.0056
.0056
.0056
.0056
.0056
.0056
.0056
26.23026.11326.17026.41826.49226.513
26.51226.51126.51626.51926.51926.51126.51226.51826.51826.49226.517
26.49926.400
276.36276.80276.56278.19278.10277.98
277.55277.81278.17277.82277.49278.06278.24278.49278.37278.57277.96
277.86277.22
Year or monthNorway(krone)
Philip-pine
Republic(peso)
Portu-gal
(escudo)
South Africa
(pound) (rand)
Spain(peseta)
Sweden(krona)
Swit-zerland(franc)
UnitedKing-dom
(pound)
1955...1956...1957...1958...1959...1960...
I960—FebMarAprMayJuneJulyAugSeptOctNovDec
1961—JanFeb
14.00814.00814.00814.00814.02814.018
13.99014.00614.03514.01814.00714.018
49.67749.67649.69349.69549.721449.770
49.77049.770449.770
14.02614.04014.03214.03814.021
14.00413.985
3.49003.49003.49003.49003.49673.4937
3.48983.49233.49573.49353.49053.49363.49563.49793.49733.49923.4950
3.49283.4861
278.09278.52278.28279.93279.83279.71
279.28279.54279.90279.55279.22279.79279.97280.22280.11280.30279.69
279.595279.19 6139.37
2.38102.05791.6635
.6625
.6637
.6637
.6633
.6636
.6640
.6640
.6640
.6640
.6641
.6642
.6635
.6644
19.33319.33319.33119.32819.32419.349
19.31119.31419.35919.33919.36519.36619.39219.37919.36519.35519.334
19.33919.342
23.33123.33423.33023.32823.14223.152
23.05423.05823.04823.12423.17523.18323.19823.21923.21123.21623.225
23.22023.144
279.13279.57279.32280.98280.88280.76
280.33280.59280.95280.60280.27280.84281.02281.27281.16281.35280.74
280.bA279.99
1 Effective Jan. 12, 1959, the Argentine Government established asingle exchange rate for the peso in place of the former official and freerates.
2 Effective rate of 420 francs per U. S. dollar, established Aug. 12, 1957,was extended to all foreign exchange transactions on Oct. 28, 1957, andon June 23, 1958, became the official rate. On Dec. 29, 1958, the francwas further devalued to 493.706 francs per U. S. dollar.
3 A new franc equal to 100 old francs was introduced on Jan. 1, 1960.4 Based on quotations through Apr. 22, 1960.5 Based on quotations through Feb. 10, 1961.6 Effective Feb. 14, 1961, South Africa adopted the decimal system.
The new currency unit, replacing the pound, is the rand, consisting of100 cents and equivalent to 10 shillings or one-half the former pound.
Digitized for FRASER Federal Reserve Bank of St. Louis

BOARD OF GOVERNORSof the Federal Reserve System
W M . M C C . MARTIN, JR., Chairman C. CANBY BALDERSTON, Vice Chairman
M. S. SZYMCZAK J. L. ROBERTSON CHAS. N. SHEPARDSON
A. L. MILLS, JR. G. H. KING, JR.
WOODLIEF THOMAS, Adviser to the Board RALPH A. YOUNG, Adviser to the Board
JEROME W. SHAY, Legislative Counsel CHARLES MOLONY, Assistant to the Board
CLARKE L. FAUVER, Assistant to the Board
OFFICE OF THE SECRETARYMERRITT SHERMAN, SecretaryKENNETH A. KENYON, Assistant SecretaryELIZABETH L. CARMICHAEL, Assistant Secretary
LEGAL DIVISIONHOWARD H. HACKLEY, General CounselDAVID B. HEXTER, Assistant General CounselG. HOWLAND CHASE, Assistant General CounselTHOMAS J. O'CONNELL, Assistant General
CounselWILSON L. HOOFF, Assistant General Counsel
DIVISION OF RESEARCH AND STATISTICSGUY E. NOYES, DirectorFRANK R. GARFIELD, AdviserROBERT C. HOLLAND, AdviserALBERT R. KOCH, AdviserROLAND I. ROBINSON, AdviserDANIEL H. BRILL, Associate AdviserLEWIS N. DEMBITZ, Associate AdviserKENNETH B. WILLIAMS, Associate Adviser
DIVISION OF INTERNATIONAL FINANCEJ. HERBERT FURTH, AdviserA. B. HERSEY, AdviserROBERT L. SAMMONS, AdviserSAMUEL I. KATZ, Associate Adviser
DIVISION OF BANK OPERATIONSJOHN R. FARRELL, DirectorGERALD M. CONKLING, Assistant DirectorM. B. DANIELS, Assistant DirectorJOHN N. KILEY, JR., Assistant Director
DIVISION OF EXAMINATIONS
FREDERIC SOLOMON, Director
ROBERT C. MASTERS, Associate DirectorC. C. HOSTRUP, Assistant DirectorGLENN M. GOODMAN, Assistant DirectorHENRY BENNER, Assistant DirectorJAMES C. SMITH, Assistant Director
BRENTON C. LEAVITT, Assistant DirectorLLOYD M. SCHAEFFER, Chief Federal Reserve
Examiner
DIVISION OF PERSONNEL ADMINISTRATION
EDWIN J. JOHNSON, Director
H. FRANKLIN SPRECHER, JR., Assistant Director
DIVISION OF ADMINISTRATIVE SERVICES
JOSEPH E. KELLEHER, Director
HARRY E. KERN, Assistant Director
OFFICE OF THE CONTROLLER
J. J. CONNELL, ControllerSAMPSON H. BASS, Assistant Controller
OFFICE OF DEFENSE PLANNING
INNIS D. HARRIS, Coordinator
384
Digitized for FRASER Federal Reserve Bank of St. Louis

FEDERAL RESERVE BANKS AND BRANCHES 385
Federal Open Market Committee
W M . M C C . MARTIN, JR., Chairman ALFRED HAYES, Vice Chairman
CARL E. ALLEN G. H. KING, JR. ELIOT J. SWAN
C. CANBY BALDERSTON A. L. MILLS, JR. M. S. SZYMCZAK
WATROUS H. IRONS J. L. ROBERTSON EDWARD A. WAYNE
CHAS. N. SHEPARDSON
RALPH A. YOUNG, Secretary ROBERT S. EINZIG, Associate EconomistMERRITT SHERMAN, Assistant Secretary GEORGE GARVY, Associate EconomistKENNETH A. KEN YON, Assistant Secretary GEORGE MITCHELL, Associate EconomistHOWARD H. HACKLEY, General Counsel GUY E. NOYES, Associate EconomistDAVID B. HEXTER, Assistant General Counsel BENJAMIN U. RATCHFORD, Associate EconomistWOODLIEF THOMAS, Economist CHARLS E. WALKER, Associate Economist
ROBERT G. ROUSE, Manager, System Open Market Account
Federal Advisory CouncilOSTROM ENDERS, BOSTON HOMER J. LIVINGSTON, CHICAGO, President
GEORGE A. MURPHY, NEW YORK NORFLEET TURNER, ST. LOUIS
HOWARD C. PETERSEN, PHILADELPHIA GORDON MURRAY, MINNEAPOLIS, Vice President
REUBEN B. HAYS, CLEVELAND R. OTIS MCCLINTOCK, KANSAS CITY
ROBERT B. HOBBS, RICHMOND I. F. BETTS, DALLAS
JOHN C. PERSONS, ATLANTA CHARLES F. FRANKLAND, SAN FRANCISCO
HERBERT V. PROCHNOW, Secretary WILLIAM J. KORSVIK, Assistant Secretary
Federal Reserve Banks and Branches
Chairmen and Deputy Chairmen of Boards of Directors
FEDERAL RESERVE CHAIRMAN AND DEPUTY CHAIRMANBANK OF— FEDERAL RESERVE AGENT
BOSTON NILS Y. WESSELL ERWIN D. CANHAM
NEW YORK PHILIP D. REED JAMES DECAMP WISE
PHILADELPHIA HENDERSON SUPPLEE, JR. WALTER E. HOADLEY
CLEVELAND ARTHUR B. VAN BUSKIRK JOSEPH H. THOMPSON
RICHMOND ALONZO G. DECKER, JR. EDWIN HYDE
ATLANTA WALTER M. MITCHELL HENRY G. CHALKLEY, JR.
CHICAGO ROBERT P. BRIGGS JAMES H. HILTON
ST. LOUIS PIERRE B. MCBRIDE J. H. LONGWELL
MINNEAPOLIS ATHERTON BEAN
KANSAS CITY RAYMOND W. HALL HOMER A. SCOTT
DALLAS ROBERT O. ANDERSON LAMAR FLEMING, JR.
SAN FRANCISCO F. B. WHITMAN Y. FRANK FREEMAN
Digitized for FRASER Federal Reserve Bank of St. Louis

386 FEDERAL RESERVE BULLETIN • MARCH 1961
Presidents and Vice Presidents
FederalReserveBank of
Boston
New York
Philadelphia
Cleveland
Richmond
Atlanta
Chicago
St. Louis
Minneapolis
Kansas City
Dallas
San Francisco...
PresidentFirst Vice President
George H. EllisE. O. Latham
Alfred HayesWilliam F. Treiber
Karl R. BoppRobert N. Hilkert
W. D. FultonDonald S. Thompson
Edward A. WayneAubrey N. Heflin
Malcolm BryanHarold T. Patterson
Carl E. AllenC. J. Scanlon
Delos C. JohnsDarryl R. Francis
Frederick L. DemingA. W. Mills
George H. ClayHenry O. Koppang
Watrous H. IronsHarry A. Shuford
Eliot J. SwanH. E. Hemmings
Vice Presidents(Vice Presidents in charge of branches are
listed in lower section of this page)
D. Harry AngneyAnsgar R. Berge
Harold A. BilbyCharles A. CoombsHoward D. Crosse
Joseph R. CampbellWallace M. CatanachDavid P. Eastburn
Roger R. ClouseE. A. FinkClyde Harrell
N. L. ArmisteadJ. G. Dickerson, Jr.
J. E. DenmarkJ. E. McCorvey
Ernest T. BaughmanA. M. GustavsonHugh J. Helmer
Marvin L. BennettHomer Jones
Kyle K. FossumC. W. Groth
John T. BoysenC. A. CravensJ. R. Euans
James L. CauthenP. E. ColdwellThomas A. Hardin
J. L. Barbonchielli
Benjamin F. GrootDana D. Sawyer
Marcus A. HarrisHerbert H. KimballRobert G. Rouse
Murdoch K. GoodwinPhilip M. Poorman
W. Braddock HickmanL. Merle HostetlerF. O. Kiel
Upton S. MartinJohn L. NoskerJoseph M. Nowlan
L. B. Raisty
Paul C. HodgeL. H. JonesC. T. Laibly
George E. KronerDale M. Lewis
M. B. HolmgrenA. W. JohnsonH. G. McConnell
F. H. LarsonL. F. MillsE. U. Sherman
G. R. MurffJames A. ParkerThomas W. Plant
R. S. EinzigE. H. Galvin
O. A. SchlaikjerCharles E. Turner
Walter H. Rozell, JrH. L. SanfordTodd G. Tiebout
James V. VergariRichard G. Wilgus
Martin MorrisonPaul C. Stetzelberger
Benjamin U. RatchfordJames M. Slay
Brown R. RawlingsCharles T. Taylor
George W. MitchellH. J. NewmanHarry S. Schultz
Howard H. WeigelJoseph C. Wotawa
F. L. ParsonsM. H. Strothman. Jr,
Clarence W. TowJ. T. White
L. G. PondromW. M. PritchettCharls E. Walker
John A. O'Kane
Vice Presidents in Charge of Branches of Federal Reserve Banks
Federal ReserveBank of
New YorkCleveland
Richmond
Atlanta
ChicagoSt. Louis
Branch
BuffaloCincinnatiPittsburghBaltimoreCharlotteBirminghamJacksonvilleNashvilleNew Orleans
DetroitLittle RockLouisvilleMemphis
Vice Presidents
I. B. SmithR. G. JohnsonJ. W. KossinD. F. HagnerE. F. MacDonaldH. C. FrazerT. A. LanfordR. E. Moody, Jr.M. L. Shaw
R. A. SwaneyFred BurtonDonald L. HenryE. Francis DeVos
Federal ReserveBank of
MinneapolisKansas Ci ty . . . .
Dallas
San Francisco...
Branch
HelenaDenverOklahoma CityOmaha
El PasoHoustonSan Antonio
Los AngelesPortlandSalt Lake CitySeattle
Vice Presidents
C. A. Van NiceCecil PuckettH. W. PritzP. A. Debus
Howard CarrithersJ. L. CookCarl H. Moore
W. F. VolbergJ. A. RandallE. R. BaFglebaughA. B. Merritt
Digitized for FRASER Federal Reserve Bank of St. Louis

Federal Reserve Board Publications
Unless otherwise noted, the material listed may be obtained from the Division of Administrative Services,Board of Governors of the Federal Reserve System, Washington 25, D. C. Where a charge is indicated,remittance should accompany order and be made payable to the order of the Board of Governors ofthe Federal Reserve System. A more complete list, including periodic releases and additional reprints,appeared on pages 1431-34 of the December 1960 Bulletin. {Stamps and coupons not accepted.)
THE FEDERAL RESERVE SYSTEM—PURPOSES AND TREASURY-FEDERAL RESERVE STUDY OF THE GOV-
FUNCTIONS. February 1961. 238 pages.
ANNUAL REPORT OF THE BOARD OF GOVERNORSOF THE FEDERAL RESERVE SYSTEM.
FEDERAL RESERVE BULLETIN. Monthly. Sub-scription price in the United States and its pos-sessions, Bolivia, Canada, Chile, Colombia,Costa Rica, Cuba, Dominican Republic, Ecua-dor, Guatemala, Haiti, Republic of Honduras,Mexico, Nicaragua, Panama, Paraguay, Peru,El Salvador, Uruguay, and Venezuela is $6.00per annum or 60 cents per copy; elsewhere$7.00 per annum or 70 cents per copy. (Groupsubscriptions in the United States for 10 ormore copies to one address, 50 cents per copyper month, or $5.00 for 12 months.)
FEDERAL RESERVE CHART BOOK ON FINANCIALAND BUSINESS STATISTICS. Monthly. Annualsubscription includes one issue of HistoricalSupplement. Subscription price in the UnitedStates and the countries listed above is $6.00per annum or 60 cents per copy; elsewhere$7.00 per annum or 70 cents each. (Grouprate of 50 cents each for 10 or more of sameissue for single shipment.)
HISTORICAL SUPPLEMENT TO FEDERAL RESERVECHART BOOK. Issued annually in September.Annual subscription to monthly chart book in-cludes one issue of Supplement. In the UnitedStates and countries listed above under FederalReserve Bulletin, single copies 60 cents each,elsewhere 70 cents each. (Group rate in quan-tities of 10 or more for single shipment 50 centseach.)
INDUSTRIAL PRODUCTION CHART BOOK. February1961. 210 pages. $1.75 per copy; in quan-tities of 10 or more for single shipment, $1.50each.
ERNMENT SECURITIES MARKET. Part I. July1959. 108 pages. Part II. February 1960.159 pages. Part III. February 1960. 112pages. Individual books $1.00 each; set of 3books $2.50.
INDUSTRIAL PRODUCTION—1959 REVISION. July1960. 229 pages. $1.00 per copy; in quanti-ties of 10 or more for single shipment, 85 centseach.
THE FEDERAL FUNDS MARKET—A Study by aFederal Reserve System Committee. May1959. I l l pages. $1.00 per copy; in quanti-ties of 10 or more for single shipment, 85cents each.
DEBITS AND CLEARINGS STATISTICS AND THEIRUSE (rev. ed.). May 1959. 144 pages. $1.00per copy; in quantities of 10 or more for singleshipment, 85 cents each.
ALL-BANK STATISTICS, 1896-1955. Part I, U. S.Summary. Part II, Summaries by States andother areas. April 1959. 1,229 pages. $4.00.
THE FEDERAL RESERVE ACT, as amended throughDecember 31, 1956, with an Appendix con-taining provisions of certain other statutes af-fecting the Reserve System. 385 pages. $1.00.
FLOW OF FUNDS IN THE UNITED STATES, 1939-53.December 1955. 390 pages. $2.75.
BANKING AND MONETARY STATISTICS. November1943. 979 pages. $1.50.
RULES OF ORGANIZATION AND RULES OF PROCE-DURE—Board of Governors of the Federal Re-serve System. 1946. 31 pages.
REGULATIONS OF THE BOARD OF GOVERNORS OFTHE FEDERAL RESERVE SYSTEM.
ADMINISTRATIVE INTERPRETATIONS OF REGULA-TION F—SECTION 17—COMMON TRUST FUNDS.9 pages.
CONSUMER INSTALMENT CREDIT—Six books (Parts I-IV, published in 1957), giving the results of anintensive study undertaken by the Board on request of the Council of Economic Advisers bydirection of the President. Pt. I—Growth and Import, Vol. 1, $1.25, Vol. 2, $1.00; Pt. II—Conference on Regulation, Vol. 1, $1.75, Vol. 2, $.60; Pt. Ill—Views on Regulation, $1.00;Pt. IV—Financing New Car Purchases, $.60. Requests and remittances for these six books shouldbe directed to the Superintendent of Documents, Government Printing Office, Washington 25, D. C.
387
Digitized for FRASER Federal Reserve Bank of St. Louis

388 FEDERAL RESERVE BULLETIN • MARCH 1961
REPRINTS(From Federal Reserve Bulletin unless preceded
by an asterisk)
THE MONETARY SYSTEM OF THE UNITED STATES.
February 1953. 16 pages.INFLUENCE OF CREDIT AND MONETARY MEASURES
ON ECONOMIC STABILITY. March 1953. 16pages.
FEDERAL FINANCIAL MEASURES FOR ECONOMICSTABILITY. May 1953. 7 pages.
•DETAILED DESCRIPTION OF SOURCES AND METH-ODS USED IN REVISION OF SHORT- AND INTER-MEDIATE-TERM CONSUMER CREDIT STATISTICS.April 1953. 25 pages.
DEPARTMENT STORE SALES AND STOCKS, BYMAJOR DEPARTMENTS (Revised Indexes). No-vember 1953. 65 pages.
A FLOW-OF-FUNDS SYSTEM OF NATIONAL AC-
COUNTS, ANNUAL ESTIMATES, 1939-54. Octo-ber 1955. 40 pages.
SURVEYS OF BANK LOANS FOR COMMERCIAL AND
INDUSTRIAL PURPOSES. Business Loans ofMember Banks. April 1956. 14 pages. CreditLines and Minimum Balance Requirements.June 1956. 7 pages. Member Bank Lendingto Small Business, 1955-57. April 1958. 19pages. Member Bank Term Lending to Busi-ness, 1955-57, April 1959. 16 pages. SecurityPledged on Business Loans at Member Banks.September 1959. 16 pages.
FINANCING OF LARGE CORPORATIONS, 1951-55.June 1956. 9 pages.
REVISION OF CONSUMER CREDIT STATISTICS. Oc-
tober 1956. 24 pages. (Also, similar reprintfrom April 1953 BULLETIN.)
AGRICULTURAL LOAN SURVEY. November 1956
and January, February, and March 1957 BUL-LETINS. 52 pages.
SURVEY OF FINANCE COMPANIES, MID-1955.
April 1957. 17 pages.REVISION OF MONTHLY DEPARTMENT STORE IN-
DEXES. December 1957. 30 pages.OPEN MARKET OPERATIONS IN LONG-TERM SE-
CURITIES. November 1958. 15 pages.•PART I, ALL-BANK STATISTICS, 1896-1955. April
1959. 94 pages.1959 SURVEY OF CONSUMER FINANCES. March,
July, and September 1959. 48 pages. (Simi-lar Surveys available for some earlier years inthe period 1952-58.)
A QUARTERLY PRESENTATION OF FLOW OF FUNDS,SAVING, AND INVESTMENT. August 1959. 49pages.
THE GOVERNMENT SECURITIES MARKET. August1959. 22 pages.
REVISED INDUSTRIAL PRODUCTION INDEX. De-cember 1959. 24 pages.
CAPITAL MARKETS and MONEY AND BANK CREDITIN 1959. Combined reprint. January and Feb-ruary 1960. 14 pages.
REVISED SERIES FOR SEASONALLY ADJUSTEDMONEY SUPPLY. February 1960. 4 pages.
SURVEY OF COMMON TRUST FUNDS, 1959. May
1960. 7 pages. (Also, similar reprints fromAugust 1956, June 1957, May 1958, and May1959 BULLETINS.)
INTEREST RATES IN LEADING COUNTRIES. June1960. 6 pages.
RECENT MONEY AND CREDIT DEVELOPMENTS.
July 1960. 8 pages.THE BALANCE SHEET OF AGRICULTURE, 1960.
August 1960. 9 pages.CONSUMER BUYING INTENTIONS AND QUARTERLY
SURVEY OF CONSUMER BUYING INTENTIONS.
Combined reprint. September 1960. 31 pages.THE U. S. BALANCE OF PAYMENTS, 1959-60. Oc-
tober 1960. 7 pages.A NEW MEASURE OF THE MONEY SUPPLY. Octo-
ber 1960. 22 pages.CAPITAL MARKETS IN 1960. December 1960.
7 pages.IMPLEMENTATION OF THE 1959 ACT ON RESERVE
REQUIREMENTS. December 1960. 6 pages.QUARTERLY SURVEY OF CONSUMER BUYING IN-
TENTIONS. December 1960. 6 pages.SMALL BUSINESS FINANCING: CORPORATE MANU-
FACTURERS. January 1961. 15 pages.CREDIT AND MONEY IN 1960. February 1961.
8 pages.BANKING AND MONETARY STATISTICS, 1960. Se-
lected series of banking and monetary statisticsfor 1960 only. February 1961. 13 pages.(Similar reprint of 1959 data, February andMay 1960 BULLETINS.)
GOLD AND DOLLAR TRANSFERS IN 1960. March1961. 7 pages.
FEDERAL RESERVE OPERATIONS IN PERSPECTIVE.
March 1961. 10 pages.QUARTERLY SURVEY OF CONSUMER BUYING IN-
TENTIONS. March 1961. 6 pages.
Digitized for FRASER Federal Reserve Bank of St. Louis

Index to Statistical Tables
Acceptances, bankers', 328, 330Agricultural loans of commercial banks, 322, 324Agriculture, Govt. agency loans, 340Assets and liabilities {See also Foreign liabilities and
claims):Banks and the monetary system, consoli-
dated, 318Corporate, current, 332Domestic banks, by classes, 319, 322, 324, 330Federal business-type activities,
by fund or activity, 340Federal Reserve Banks, 314
Automobiles:Consumer instalment credit, 344, 345, 346Production index, 348, 351
Bankers' balances, 323, 325{See also Foreign liabilities and claims)
Banks and the monetary system, consolidated state-ment, 318
Bonds {See also U. S. Govt. securities):New issues, 332, 334, 335Prices and yields, 328, 329
Brokers and dealers in securities, bankloans to, 322, 324
Business expenditures on new plant and equip-ment, 332
Business indexes, 354Business loans {See Commercial and industrial loans)
Capital accounts:Banks, by classes, 319, 323, 326Federal Reserve Banks, 314
Carloadings, 354Central banks, foreign, 368, 382Coins, circulation of, 316Commercial banks:
Assets and liabilities, 319, 322Consumer loans held, by type, 345Number, by classes, 319Real estate mortgages held, by type, 341
Commercial and industrial loans:Commercial banks, 322Weekly reporting member banks, 324, 327
Commercial paper, 328, 330Commodity Credit Corporation, loans, etc., 340Condition statements {See Assets and liabilities)Construction, 354, 355Consumer credit:
Instalment credit, 344, 345, 346, 347Major parts, 344, 346Noninstalment credit, by holder, 345
Consumer price indexes, 354, 360Consumption expenditures, 362, 363Corporate sales, profits, taxes, and dividends, 332, 333Corporate security issues, 332, 334Corporate security prices and yields, 328, 329Cost of living {See Consumer price indexes)Currency in circulation, 309, 316, 317Customer credit, stock market, 329
Debits to deposit accounts, 317Demand deposits:
Adjusted, banks and the monetary system, 318Adjusted, commercial banks, by classes, 317, 323Banks, by classes, 319, 326Turnover of, 317Type of holder, at commercial banks, 323
Department stores:Merchandising data, 359
Department stores—ContinuedSales and stocks, 354, 358
Deposits {See also specific types of deposits):Adjusted, and currency, 318Banks, by classes, 313, 319, 323, 326, 330Federal Reserve Banks, 314, 379Postal savings, 312, 318
Discount rates, 312, 382Discounts and advances by Federal Reserve
Banks, 308, 313, 314Dividends, corporate, 332, 333Dollar assets, foreign, 371, 379Dwelling units started, 355
Earnings and hours, manufacturing indus-tries, 354, 357
Employment, 354, 356, 357Export-Import Bank, loans, etc., 340
Farm mortgage loans, 340, 341, 342Federal business-type activities, assets and liabilities,
by fund or activity, 340Federal Deposit Insurance Corporation,
assets, etc., 340Federal finance:
Cash transactions, 338Receipts and expenditures, 339Treasurer's balance, 338
Federal home loan banks, loans, etc., 340, 343Federal Housing Administration, loans, etc., 340, 341,
342, 343Federal National Mortgage Association,
loans, etc., 340, 343Federal Reserve Banks:
Condition statement, 314U. S. Govt. securities held by, 308, 313, 314,
336, 337Federal Reserve credit, 308, 313, 314Federal Reserve notes, 314, 316Finance company paper, 328, 330Financial institutions, loans to, 322, 324Flow of funds, saving and financial flows, 364Foreign central banks, 368, 382Foreign deposits in U. S. banks, 308, 314, 318, 323, 326Foreign exchange rates, 383Foreign liabilities and claims:
Banks, 372, 374, 377, 379Nonfinancial concerns, 380
Foreign trade, 359
Gold:Earmarked, 370Net purchases by U. S., 370Production, 369, 370Reserves of central banks and governments, 368Reserves of foreign countries and international
institutions, 371Stock, 308, 318, 370
Gold certificates, 314, 316Govt. debt {See U. S. Govt. securities)Gross national product, 362, 363
Home owners, Govt. agency loans, 340Hours and earnings, manufacturing indus-
tries, 354, 357
Industrial production index, 348, 354Instalment loans, 344, 345, 346, 347Insurance companies, 331, 336, 337, 342
389
Digitized for FRASER Federal Reserve Bank of St. Louis

390 FEDERAL RESERVE BULLETIN • MARCH 1961
Insured commercial banks, 321, 322Interbank deposits, 312, 319, 323, 326Interest rates:
Bond yields, 328Business loans by banks, 327Federal Reserve Bank discount rates, 312Foreign countries, 381, 382Open market, 328, 381Stock yields, 328Time deposits, maximum rates, 312
International capital transactions of the U. S., 372International institutions, 368, 370, 371Inventories, 362Investments (See also specific types of investments):
Banks, by classes, 319, 322, 325, 330Federal Reserve Banks, 313, 314Govt. agencies, etc., 340Life insurance companies, 331Savings and loan associations, 331
Labor force, 356Loans (See also specific types of loans):
Banks, by classes, 319, 322, 324, 330Federal Reserve Banks, 308, 313, 314Govt. agencies, etc., 340Insurance companies, 331, 342Savings and loan associations, 331, 342
Loans insured or guaranteed, 341, 342, 343
Manufactures, production index, 348, 354Margin requirements, 312Member banks:
Assets and liabilities, by classes, 319, 322Borrowings at Federal Reserve Banks, 308
314, 326Deposits, by classes, 313Number, by classes, 320Reserve requirements, by classes, 313Reserves and related items, 308Weekly reporting series, 324
Mining, production index, 348, 354Money rates (See Interest rates)Money supply and related data, 317Mortgages (See Real estate loans)Mutual savings banks, 318, 319, 321, 330, 336,
337, 341
National banks, 321National income, 362, 363National security expenditures, 339, 362Nonmember banks, 314, 321, 322, 323
Payrolls, manufacturing, index, 354Personal income, 363Postal Savings System, 312, 318Prices:
Consumer, 354, 360Security, 329Wholesale commodity, 354, 360
Production, 348, 354Profits, corporate, 332, 333
Real estate loans:Banks, by classes, 322, 324, 330, 341Type of mortgage holder, 341, 342, 343Type of property mortgaged, 341, 342, 343
Reserve requirements, member banks, 313
Reserves:Commercial banks, 323Federal Reserve Banks, 314Foreign central banks and governments, 368Foreign countries and international institu-
tions, 371Member banks, 308, 313, 323, 325
Residential mortgage loans, 341, 342, 343
Sales finance companies, consumer loans of, 344,345, 347
Saving:Flow-of-funds series, 364National income series, 363
Savings deposits (See Time deposits)Savings institutions, principal assets, 330, 331Savings and loan associations, 331, 337, 342Securities, international transactions, 378, 379Security issues, 332, 334, 335Silver coin and silver certificates, 316State member banks, 321State and municipal securities:
New issues, 334, 335Prices and yields, 328, 329
States and political subdivisions:Deposits of, 323, 326Holdings of U. S. Govt. securities, 336Ownership of obligations of, 322, 330, 331
Stock market credit, 329Stocks:
New issues, 334Prices and yields, 328, 329
Tax receipts, Federal, 339Time deposits, 312, 313, 318, 319, 323, 326Treasurer's account balance, 338Treasury cash, 308, 316, 318Treasury currency, 308, 316, 318Treasury deposits, 308, 314, 338
Unemployment, 356U. S. balance of payments, 381U. S. Govt. balances:
Commercial bank holdings, by classes, 323, 326Consolidated monetary statement, 318Treasury deposits at Federal Reserve
Banks, 308, 314, 338U. S. Govt. securities:
Bank holdings, 318, 319, 322, 325, 330, 336, 337Federal Reserve Bank holdings, 308, 313, 314,
336, 337Foreign and international holdings, 314, 371International transactions, 378, 379New issues, gross proceeds, 334Outstanding, by type of security, 335, 336, 337Ownership of, 336, 337Prices and yields, 328, 329
United States notes, outstanding and in circula-tion, 316
Utilities, production index, 348, 354
Vault, cash, 308, 313, 323Veterans Administration, loans, etc., 340, 341,
342, 343
Weekly reporting member banks, 324
Yields (See Interest rates)
Digitized for FRASER Federal Reserve Bank of St. Louis

BOUNDARIES OF FEDERAL RESERVE DISTRICTS AND THEIR BRANCH TERRITORIES
[ JMinneapolis J]
C° THE FEDERAL RESERVE SYSTEM o)
HAWAII
1 Boundaries of Federal Reserve Districts Boundaries of Federal Reserve Branch Territories
© Board of Governors of the Federal Reserve System
® Federal Reserve Bank Cities • Federal Reserve Branch Cities
Digitized for FRASER Federal Reserve Bank of St. Louis