
Procedures for the Analysis of Comparative Data Using Phylogenetically Independent Contrasts
Upload
nottinghamCategory
view
3download
0
Feature-specific interactions in salience from combinedfeature contrasts: Evidence for a bottom–up saliencymap in V1
Department of Psychology, UCL, London, UK,Knowledge Creating Communication Research Center,
NICT, Kyoto, Japan, &ATR Computational Neuroscience Laboratories,
Kyoto, JapanAnsgar R. Koene
Department of Computer Science, UCL, London, UKLi Zhaoping
Items that stand out from their surroundings, that is, those that attract attention, are considered to be salient. Salience isgenerated by input features in many stimulus dimensions, like motion (M), color (C), orientation (O), and others. We focuson bottom–up salience generated by contrast between the feature properties of an item and its surroundings. We comparethe singleton search reaction times (RTs) of items that differ from their surroundings in more than one feature (e.g., C + O,denoted as CO) against the RTs of items that differ from their surroundings in only a single feature (e.g., O or C). Themeasured RTs for the double-feature singletons are compared against “race model” predictions to evaluate whethersalience in the double-feature conditions is greater than the salience of either of its feature components. Affirmative answerswere found in MO and CO but not in CM. These results are consistent with some V1 neurons being conjunctively selectiveto MO, others to CO, but almost none to CM. They provide support for the V1 hypothesis of bottom–up salience (Z. Li, 2002)but are contrary to expectation from the “feature summation” hypothesis, in which different stimulus features are initiallyanalyzed independently and subsequently summed to form a single salience map (L. Itti & C. Koch, 2001; C. Koch &S. Ullman, 1985; J. M. Wolfe, K. R. Cave, & S. L. Franzel, 1989).
Keywords: salience, reaction time, feature contrast, feature combinations, salience map, V1
Citation: Koene, A. R., & Zhaoping, L. (2007). Feature-specific interactions in salience from combined feature contrasts:Evidence for a bottom–up saliency map in V1. Journal of Vision, 7(7):6, 1–14, http://journalofvision.org/7/7/6/, doi:10.1167/7.7.6.
Introduction
Items in the visual field with features that are differentfrom their surroundings automatically “pop out” in visualscenes and attract attention. Traditionally, this “pop-out”phenomenon has been demonstrated in singleton searchtasks, where the reaction time (RT) for finding targets thatdiffer from uniform surrounding distracters in at least onefeature dimension (e.g., color, orientation, and motion)does not increase with the number of distracter items. Thedegree to which an item or location stands out from itssurroundings, that is, attracts attention, is referred to as the“salience” of the item/location (Titchener, 1908). Theterm salience has been used in the visual perceptionliterature in a number of different contexts and withslightly different meanings (e.g., Parkhurst, Law, &Niebur, 2002; Titchener, 1908; Wolfe, 1994). In thisarticle, the term salience will always refer to a purelybottom–up attraction of attention arising from the contrastbetween the feature properties of an item and itssurroundings (Moraglia, 1989; Nothdurft, 1991, 1992,1993) rather than top–down aspects such as the task-
specific feature relevance. We shall therefore not beconsidering the effects of top–down modulations thatmay play a role in guided search (e.g., Bacon & Egeth,1997; Lamy, Leber, & Egeth, 2004; Leber & Egeth, 2006;Sobel & Cave, 2002; Wolfe, Cave, & Franzel, 1989).Salience has been shown to play a crucial role in the
localization of targets (Duncan & Humphreys, 1989;Foster & Ward, 1991; Treisman & Gelade, 1980;Treisman & Gormican, 1988; Wolfe, Friedman-Hill,Steward, & O’Connell, 1992), control of eye movements(Deubel & Frank, 1991; Findlay, Brogan, & Wenban-Smith,1993; Nothdurft & Parlitz, 1993), and allocation of spatialattention (Joseph & Optican, 1996; Julesz, 1981, 1986;Nothdurft, 1999; Wolfe et al., 1989). Furthermore, theglobal properties of a scene also affect the salience of atarget stimulus; for example, a target item on a nonuni-form background is much less salient than a target on auniform background (Duncan & Humphreys, 1989;Nothdurft, 1991, 1992). Thus, increased overall featurecontrast in the background pattern reduces the relativesalience of the target. As shown by various studies (e.g.,D’Zmura, 1991; Dick, Ullman, & Sagi, 1987; Duncan &Humphreys, 1989; Itti & Koch, 2001; Koch & Ullman,
Journal of Vision (2007) 7(7):6, 1–14 http://journalofvision.org/7/7/6/ 1
doi: 10 .1167 /7 .7 .6 ISSN 1534-7362 * ARVOReceived August 12, 2006; published May 23, 2007
1985; Nagy & Sanchez, 1990; Nakayama & Silverman,1986; Nothdurft, 1993, 1995, 2000; Treisman & Gelade,1980; Wolfe et al., 1989), salience is generated by featurecontrasts in a wide variety of stimulus feature dimensions,like motion, color, luminance, depth, and others. All thesesaliency effects seem to display qualitatively similarproperties as described above. Salience, therefore, doesnot appear to be feature specific. This is consistent withthe concept that the function of salience is to attractattention for the investigation of the item. The featureproperties of the attracting item are investigated afterattention has been attracted to that location.
Mechanisms and neural correlates of salience
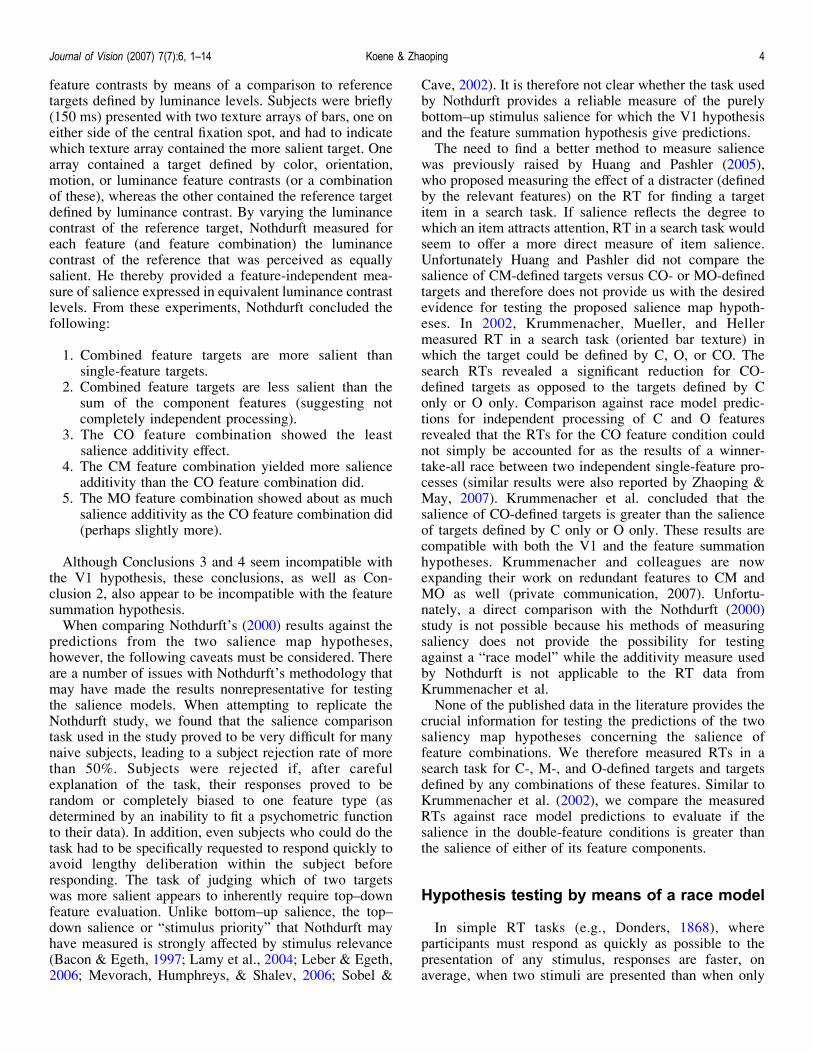
Various groups have suggested that stimulus informationis first processed in separate feature maps, representingsingle visual features such as red color and verticalorientation, and is subsequently summed into a singlemaster map (Itti & Koch, 2001; Koch & Ullman, 1985;Wolfe et al., 1989) to represent salience irrespective of theactual features (Figure 1a). We shall refer to thishypothesis as the “feature summation hypothesis”.Unfortunately, neither the neural mechanisms nor the exactunderlying cortical areas responsible for the feature andsaliency maps have been clearly specified in the featuresummation hypothesis. The strong influence of the sur-rounding on a target’s salience suggests that contextualmodulation effectsmay be particularly important (Nothdurft,2000). Such contextual effects were demonstrated in aseries of studies on single cells in area V1 (e.g., Allman,Miezin, & McGuinness, 1985, 1990; Kastner, Nothdurft,& Pigarev, 1997, 1999; Knierim & van Essen, 1992;Lamme, 1995; Lee, Mumford, Romero, & Lamme, 1998;Nothdurft, Gallant, & van Essen, 1999; Sillito, Grieve,Jones, Cudeiro, & Davis, 1995; Zipser, Lamme, & Schiller,1996; see also Schofield & Foster, 1995, for a biologicallyinspired model based on surround suppression). Although theresponses to a stimulus in the receptive field (RF) are fre-quently suppressed when similar stimuli are simultaneouslypresented outside the RF, the suppression is often weaker oreven absent when the surrounding stimuli are different tothat in the RF. Thus, the mean responses of the cell popula-tion to contrasting stimuli are relatively enhanced over thoseto uniform texture fields. The response differences correlatewell with the salience of pop-out targets. A biologically basedmodel of the preattentive computational mechanisms in theprimary visual cortex was developed by Li (2002), showinghowV1neural responsescancreateasaliencymap that awardshigher responses to more salient image locations. We shallrefer to thishypothesisas the“V1hypothesis”.Keydifferencesthat differentiate the V1 hypothesis (Li, 2002) from thefeature summation hypothesis are the following:
1. The V1 hypothesis does not sum the separatefeature-based information.
2. The V1 model includes cells that are tuned tospecific feature combinations.
The V1 hypothesis relies on conventional V1 cells tunedto input features, such as orientation and color, and knowninteractions between these cells (Figure 1b).
Model predictions
In the V1 hypothesis, firing rates of V1 cells codesalience at the RF locations, regardless of the featureencoded by any specific cell. The activities of multiple V1cells that respond to the same retinotopic location are notsummed. Each V1 cell competes on its own, and the V1cell with the greatest firing rate determines the mostsalient location (i.e., winner-take-all). The salience ofstimulus features is therefore related to the presence of V1cells that are sensitive to these features. For example,because a red vertical bar excites “vertical”, “red”, and“red and vertical” sensitive V1 cells at its location, withresponses RO, RC, and RCO, respectively, from theorientation-tuned (to vertical), color-tuned (to red), andconjuntive-tuned (to red and vertical) cells, the salience of
Figure 1. (a) Feature summation hypothesis. Visual inputs are firstprocessed in separate feature maps tuned to different stimulusfeatures (e.g., orientation, color, and motion). The output of thesefeature maps is summed to produce a single salience map. (b) V1hypothesis. V1 cells tuned to different features interact throughlateral connections. Activity in cells responding to uniform featuretexture stimuli is suppressed through mutual inhibition. The mostsalient location is the RF location of the cell with the greatest firingrate. C = color, CO = color and orientation, O = orientation, MO =motion direction and orientation, M = motion direction tuned cells.
Journal of Vision (2007) 7(7):6, 1–14 Koene & Zhaoping 2
the red vertical bar is determined by the strongestresponse from these V1 cells, that is, Salience ò max(RO, RC, RCO). When this red vertical bar is among greenvertical bars, the red-tuned cell will be the mostresponsive (because it is least suppressed by other cellstuned to the same color); thus, Salience ò RC. We denotethis salience by unique color as Salience(C) and, similarly,salience by unique orientation as Salience(O) and salienceby unique double feature as Salience(CO). Then, for a redvertical bar among green vertical bars, Salience(C) ò RC,and similarly, Salience(O) ò RO. However, for a redvertical bar among green horizontal bars, when thesingleton differs from the background by both C and O,Salience(CO) ò max(RO, RC, RCO) because all threetypes of cells will escape iso-feature contextual suppres-sion. Consequently, the V1 hypothesis predicts
SalienceðCOÞ Qmax½SalienceðCÞ; SalienceðOÞ� ð1Þ
This inequality is derived under a simplistic assumption that,to single-feature singletons, the responses from the con-junctively tuned cells are never the dominant one of theresponses from all cell types. The inequality still holds whenthis assumption does not hold, as long as we assume thatthe conjunctively tuned cells respond more vigorously to thedouble-feature than the single-feature singleton and that thesingle-feature tuned cells do not respond more vigorously tothe single-feature than the double-feature singletons.Because in V1, there are numerous conjunctive cells
sensitive to “orientation and motion” (MO) or “color andorientation” (CO) but only very few, if any, conjunctivecells sensitive to “color and motion” (CM; Horwitz &Albright, 2005; Hubel & Wiesel, 1959; Livingstone &Hubel, 1984; Ts’o & Gilbert, 1988), the V1 hypothesismakes clearly distinctive predictions for the salience ofMO, as well as CO versus CM combined feature contrasts.If we generalize from above and denote the salience of astimulus feature (combination) x as Salience(x), where x iscolor (C), orientation (O), motion (M), or a combinationof these (MO, CO, or CM), we can formulate the V1prediction for the MO and CO feature combinations as
SalienceðMOÞ Qmax½SalienceðMÞ; SalienceðOÞ�; ð2Þ
and
SalienceðCOÞ Qmax½SalienceðCÞ; SalienceðOÞ�: ð3Þ
For the CM feature combinations, however, the lack of V1conjunctive cells means that the salience of a CM featurecombination is equal to the salience of the stronger of thetwo feature dimensions. Using the same notation asbefore,
SalienceðCMÞ ¼ max½SalienceðCÞ; SalienceðMÞ�: ð4Þ
Therefore, comparing the salience of items that differfrom their surrounding by MO, CO, or CM featuresagainst the salience of items that differ from theirsurroundings in only a single feature, for example,orientation (O), motion (M), or color (C) targets, providesa test of the validity of the V1 hypothesis.In contrast, the feature summation hypothesis assumes
that all stimulus features are initially analyzed in separatefeature maps, which are subsequently summed to form asingle salience map. Thus, there is no prior reason toassume that certain feature combinations should be moresalient than others. Double-feature items will cause activa-tion in two feature maps, resulting in a greater activation ofthe summed salience map at the location of these items.Using the same notation as before, we can write,
SalienceðMOÞ¼wðMÞ�FeatureðMÞþwðOÞ�FeatureðOÞK SalienceðMÞ þ SalienceðOÞ9 max½SalienceðMÞ;SalienceðOÞ�: ð5Þ
Here, Feature(O) or Feature(M) denotes activation inthe orientation or motion feature maps, respectively, andw(O) and w(M) are the weights that sum feature maps tothe master salience map (Mueller, Herrer, & Ziegler,1995). Thus, for example, Salience(O) = w(O)� Feature(O),and so on, assuming that salience from a single feature ismainly due to the activation from the corresponding featuremap. Therefore, the feature summation hypothesis predictsthat
SalienceðMOÞ 9max½SalienceðMÞ;SalienceðOÞ�: ð6Þ
And similarly,
SalienceðCOÞ 9max½SalienceðCÞ;SalienceðOÞ� ð7Þ
and
SalienceðCMÞ 9max½SalienceðCÞ;SalienceðMÞ�: ð8Þ
This model therefore predicts that items that differ fromtheir surroundings in the MO, CO, or CM featuredimensions are all more salient than corresponding itemsthat differ from the surrounding in the C, M, or O featurecomponent alone.
Evidence for increased salience from featurecombinations
Nothdurft (2000) measured the relative salience ofsingleton targets defined by various single- or double-
Journal of Vision (2007) 7(7):6, 1–14 Koene & Zhaoping 3
feature contrasts by means of a comparison to referencetargets defined by luminance levels. Subjects were briefly(150 ms) presented with two texture arrays of bars, one oneither side of the central fixation spot, and had to indicatewhich texture array contained the more salient target. Onearray contained a target defined by color, orientation,motion, or luminance feature contrasts (or a combinationof these), whereas the other contained the reference targetdefined by luminance contrast. By varying the luminancecontrast of the reference target, Nothdurft measured foreach feature (and feature combination) the luminancecontrast of the reference that was perceived as equallysalient. He thereby provided a feature-independent mea-sure of salience expressed in equivalent luminance contrastlevels. From these experiments, Nothdurft concluded thefollowing:
1. Combined feature targets are more salient thansingle-feature targets.
2. Combined feature targets are less salient than thesum of the component features (suggesting notcompletely independent processing).
3. The CO feature combination showed the leastsalience additivity effect.
4. The CM feature combination yielded more salienceadditivity than the CO feature combination did.
5. The MO feature combination showed about as muchsalience additivity as the CO feature combination did(perhaps slightly more).
Although Conclusions 3 and 4 seem incompatible withthe V1 hypothesis, these conclusions, as well as Con-clusion 2, also appear to be incompatible with the featuresummation hypothesis.When comparing Nothdurft’s (2000) results against the
predictions from the two salience map hypotheses,however, the following caveats must be considered. Thereare a number of issues with Nothdurft’s methodology thatmay have made the results nonrepresentative for testingthe salience models. When attempting to replicate theNothdurft study, we found that the salience comparisontask used in the study proved to be very difficult for manynaive subjects, leading to a subject rejection rate of morethan 50%. Subjects were rejected if, after carefulexplanation of the task, their responses proved to berandom or completely biased to one feature type (asdetermined by an inability to fit a psychometric functionto their data). In addition, even subjects who could do thetask had to be specifically requested to respond quickly toavoid lengthy deliberation within the subject beforeresponding. The task of judging which of two targetswas more salient appears to inherently require top–downfeature evaluation. Unlike bottom–up salience, the top–down salience or “stimulus priority” that Nothdurft mayhave measured is strongly affected by stimulus relevance(Bacon & Egeth, 1997; Lamy et al., 2004; Leber & Egeth,2006; Mevorach, Humphreys, & Shalev, 2006; Sobel &
Cave, 2002). It is therefore not clear whether the task usedby Nothdurft provides a reliable measure of the purelybottom–up stimulus salience for which the V1 hypothesisand the feature summation hypothesis give predictions.The need to find a better method to measure salience
was previously raised by Huang and Pashler (2005),who proposed measuring the effect of a distracter (definedby the relevant features) on the RT for finding a targetitem in a search task. If salience reflects the degree towhich an item attracts attention, RT in a search task wouldseem to offer a more direct measure of item salience.Unfortunately Huang and Pashler did not compare thesalience of CM-defined targets versus CO- or MO-definedtargets and therefore does not provide us with the desiredevidence for testing the proposed salience map hypoth-eses. In 2002, Krummenacher, Mueller, and Hellermeasured RT in a search task (oriented bar texture) inwhich the target could be defined by C, O, or CO. Thesearch RTs revealed a significant reduction for CO-defined targets as opposed to the targets defined by Conly or O only. Comparison against race model predic-tions for independent processing of C and O featuresrevealed that the RTs for the CO feature condition couldnot simply be accounted for as the results of a winner-take-all race between two independent single-feature pro-cesses (similar results were also reported by Zhaoping &May, 2007). Krummenacher et al. concluded that thesalience of CO-defined targets is greater than the salienceof targets defined by C only or O only. These results arecompatible with both the V1 and the feature summationhypotheses. Krummenacher and colleagues are nowexpanding their work on redundant features to CM andMO as well (private communication, 2007). Unfortu-nately, a direct comparison with the Nothdurft (2000)study is not possible because his methods of measuringsaliency does not provide the possibility for testingagainst a “race model” while the additivity measure usedby Nothdurft is not applicable to the RT data fromKrummenacher et al.None of the published data in the literature provides the
crucial information for testing the predictions of the twosaliency map hypotheses concerning the salience offeature combinations. We therefore measured RTs in asearch task for C-, M-, and O-defined targets and targetsdefined by any combinations of these features. Similar toKrummenacher et al. (2002), we compare the measuredRTs against race model predictions to evaluate if thesalience in the double-feature conditions is greater thanthe salience of either of its feature components.
Hypothesis testing by means of a race model
In simple RT tasks (e.g., Donders, 1868), whereparticipants must respond as quickly as possible to thepresentation of any stimulus, responses are faster, onaverage, when two stimuli are presented than when only
Journal of Vision (2007) 7(7):6, 1–14 Koene & Zhaoping 4
one is presented (e.g., Raab, 1962). One possible cause isstatistical facilitation.If all stimuli (stimulus features) are detected separately,
the response is initiated as soon as the first one is detected.The RT is determined by the latency of a single detectionprocess if only one stimulus is presented but is determinedby the winner of a race between two detection processesin redundant trials to detect either of the two simulta-neously presented stimuli. This is equivalent to theapplication of the V1 hypothesis to the CM doublefeature, when the salience is determined by the higher ofthe two responses to the two single features. Generally,the average time for the winner of the race will be shorterthan the average time for either racer (see Miller & Ulrich,2003).Alternatively, the activations produced by the two
stimuli (stimulus features) could be summed (e.g., thesalience map in the feature summation hypothesis) so thatthe “decision threshold” is reached more rapidly when twostimuli (stimulus features) are presented than when onlyone is (e.g., Miller, 1982; Schwarz, 1989, 1994; seeTownsend & Nozawa, 1995, for an in-depth analysis).One way to distinguish summation/interaction at thestimulus processing level from statistical facilitation isby means of the so-called race model inequality (Miller,1978, 1982; Ulrich & Giray, 1986), in which
FrðtÞ e F1ðtÞ þ F2ðtÞ; ð9Þ
for every value of t, where F1 and F2 are the cumulativeprobability distributions of RT in the two single-stimuliconditions and Fr is the cumulative distribution function(CDF) of RT in the redundant-stimulus condition. Thisinequality holds for all separate-activations race models(e.g., CM in the V1 hypothesis but not in the featuresummation hypothesis), where the processes detecting thetwo possible stimuli (stimulus features) operate separatelyand each operates at the same speed regardless of whetherthe other signal is presented (Ashby & Townsend, 1986;Luce, 1986).Comparison of observer RTs for double-feature stimuli
against the corresponding prediction from the race modelwill therefore determine if there is bottom–up interactionthat increases the salience of double-feature-definedtargets. We can thus test the basic assumptions of theV1 and feature summation hypotheses independent of anyparticular computational implementation of these hypoth-eses. In particular, the feature summation hypothesispredicts that the mean RT for the double features shouldbe shorter than that predicted by the race model regardlessof the underlying feature dimensions. In contrast, the V1hypothesis predicts that mean RTs for CM double-featurestimuli should be predicted by the race model from theRTs for the corresponding single features and that meanRTs for CO and MO double features should be shorterthan predicted by the race model.
Methods
Participants
Eight observers (both authors and six naive subjects)participated in the experiment. All had normal orcorrected-to-normal vision. The subjects were fourwomen and 4 men. Informed consent was obtained afterthe nature and possible consequences of the study wereexplained.
Apparatus and stimuli
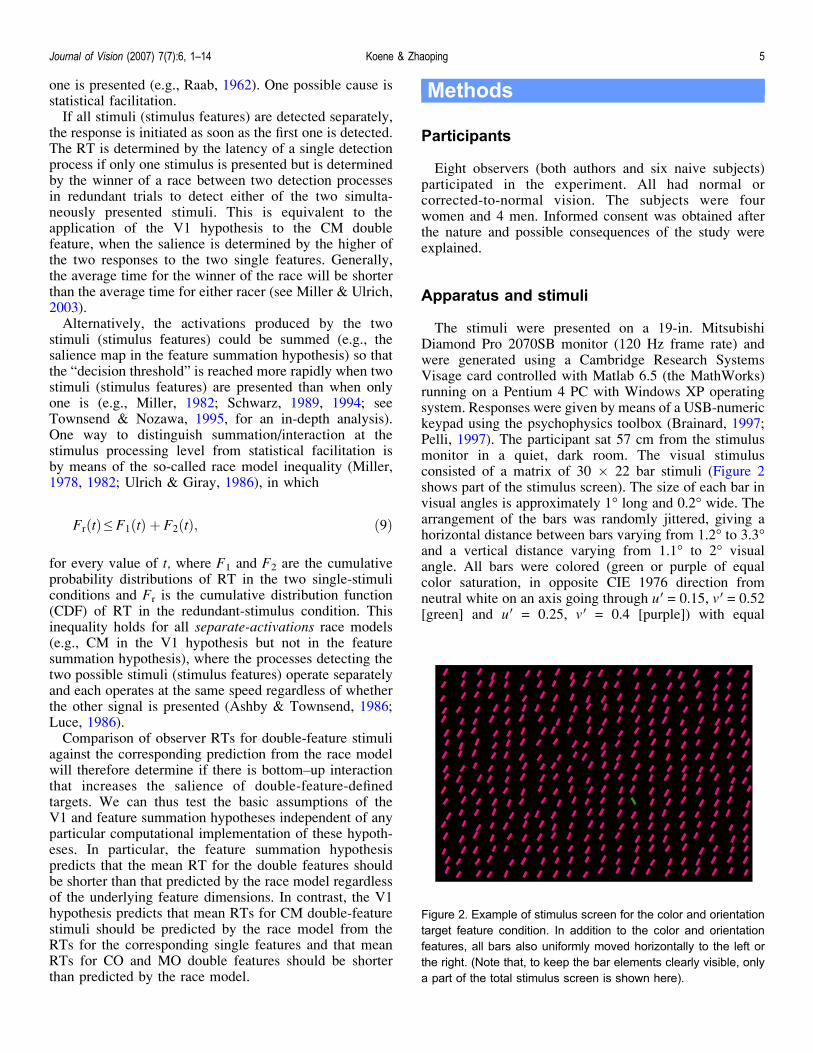
The stimuli were presented on a 19-in. MitsubishiDiamond Pro 2070SB monitor (120 Hz frame rate) andwere generated using a Cambridge Research SystemsVisage card controlled with Matlab 6.5 (the MathWorks)running on a Pentium 4 PC with Windows XP operatingsystem. Responses were given by means of a USB-numerickeypad using the psychophysics toolbox (Brainard, 1997;Pelli, 1997). The participant sat 57 cm from the stimulusmonitor in a quiet, dark room. The visual stimulusconsisted of a matrix of 30 � 22 bar stimuli (Figure 2shows part of the stimulus screen). The size of each bar invisual angles is approximately 1- long and 0.2- wide. Thearrangement of the bars was randomly jittered, giving ahorizontal distance between bars varying from 1.2- to 3.3-and a vertical distance varying from 1.1- to 2- visualangle. All bars were colored (green or purple of equalcolor saturation, in opposite CIE 1976 direction fromneutral white on an axis going through uV= 0.15, vV= 0.52[green] and uV = 0.25, vV = 0.4 [purple]) with equal
Figure 2. Example of stimulus screen for the color and orientationtarget feature condition. In addition to the color and orientationfeatures, all bars also uniformly moved horizontally to the left orthe right. (Note that, to keep the bar elements clearly visible, onlya part of the total stimulus screen is shown here).
Journal of Vision (2007) 7(7):6, 1–14 Koene & Zhaoping 5
luminance (14 cd/m2), equally tilted clockwise or counter-clockwise from vertical, and moved with the same speedto the left or to the right. On each trial, all of thebackground distracter bars had the same color, tilt, andmotion direction, whereas the target bar had theopposite color, tilt, or motion direction, or a combina-tion of these. Target bars could be at 1 of 18 locations(9 left, 9 right) at a constant eccentricity of 12.8- fromthe intertrial fixation spot in the center of the screen.Unlike the Nothdurft (2000) and Krummenacher et al.(2002) studies, where the contrast between the target-defining feature property and the corresponding back-ground feature property was always set to the maximumachievable contrast level (i.e., 90- orientation contrast,fully saturated color features, and rapid motion), thedegree of color saturation, tilt, and speed of motion wasadjusted per individual to achieve single-feature targetcontrasts that would yield mean search response times ofapproximately 600 ms (orientation contrast ranged from20- to 45-, color saturation ranged from 60% to 100%,and motion speed ranged from 0.7-/s to 2.7-/s). Aftereach response button press, the bars were replaced bylow-contrast crosses and one high-contrast fixation pointin the middle of the screen. This fixation screen stayeduntil the subject pressed another button to initiate thenext trial.
Design and procedure
The measurement procedure employed a 2AFC searchtask in which subjects had to report in which half of thescreen (left or right) a singleton target was located. Eachtrial contained a target that could be defined either by onefeature (C, O, or M) or by multiple features (CM, CO, orMO). Targets defined by different feature dimensionswere randomly mixed so that subjects could not antici-pate which feature dimension to attend to. Each sessioncontained 20 trials for each of the six feature conditions,giving a total of 120 trials per session. Each subjectperformed about 16 sessions, yielding a total of about320 trials per feature condition per subject. Subjectsperformed all sessions consecutively in 1 day. Onaverage, each session lasted 10 min. Subjects wereallowed to take short breaks between sessions. Trialswere self-paced, and subjects were instructed to take abreak between trials if they felt that they were losingconcentration. The experimenter sat next to the subjectsthroughout the experiment to monitor their performance.If a subject seemed to lose concentration (i.e., a sequenceof incorrect responses were given), the experimentersuggested taking a short break between trials. Subjectswere instructed to respond as rapidly and accurately aspossible to indicate which side the target was on. As anextra incentive for giving rapid correct responses,subjects were presented with a score at the end of each
session based on their mean RT and percentage correctresponses. Reaction time was recorded as the timebetween stimulus onset and button press. Subjects wereinstructed to press the left cursor (located on their lefthand side) to indicate “target in left half of screen” andthe right cursor (on their right hand side) to indicate“target in right half of screen”. The subject-specificfeature contrast tuning was done during separate trainingsessions before data collection, during which only single-feature-defined targets were used. These sessions alsoserved to familiarize subjects with the search task. Weaimed for a mean RT of 600 ms for all single-feature-defined targets to ensure roughly equal task difficulty(salience) for each single-feature condition, to allowsufficient range for possible significant RT reductions inthe double-feature conditions (minimum RT, as measuredby presentation of a target stimulus with no backgrounddistracters, was approximately 300 ms), and to reduce theavailable time for the top–down signals to affect theresponse. A mean RT of 600 ms also reduced the chancefor target–distractor collisions in the conditions thatcontained motion contrast (M, CM, and MO). Dependingon the subject, the percentage of trials in which acollision occurred varied from 0% to 2.9% of trialscontaining motion contrast.
Outlier removal
Outliers were defined as RTs that were more than 3 SDdifferent from the mean RT. For each subject and eachstimulus condition, the RT outliers were removed basedon the mean and standard deviation of the RTs of thatparticular subject and condition. For each subject andstimulus condition, outliers constituted less than 3.2% ofthe RT data. All results presented here are based on theRT data after removing the trials with erroneous responsesor RT outliers. Qualitatively, the same results wereobtained when the outliers are retained.
Results
Percentage error rates
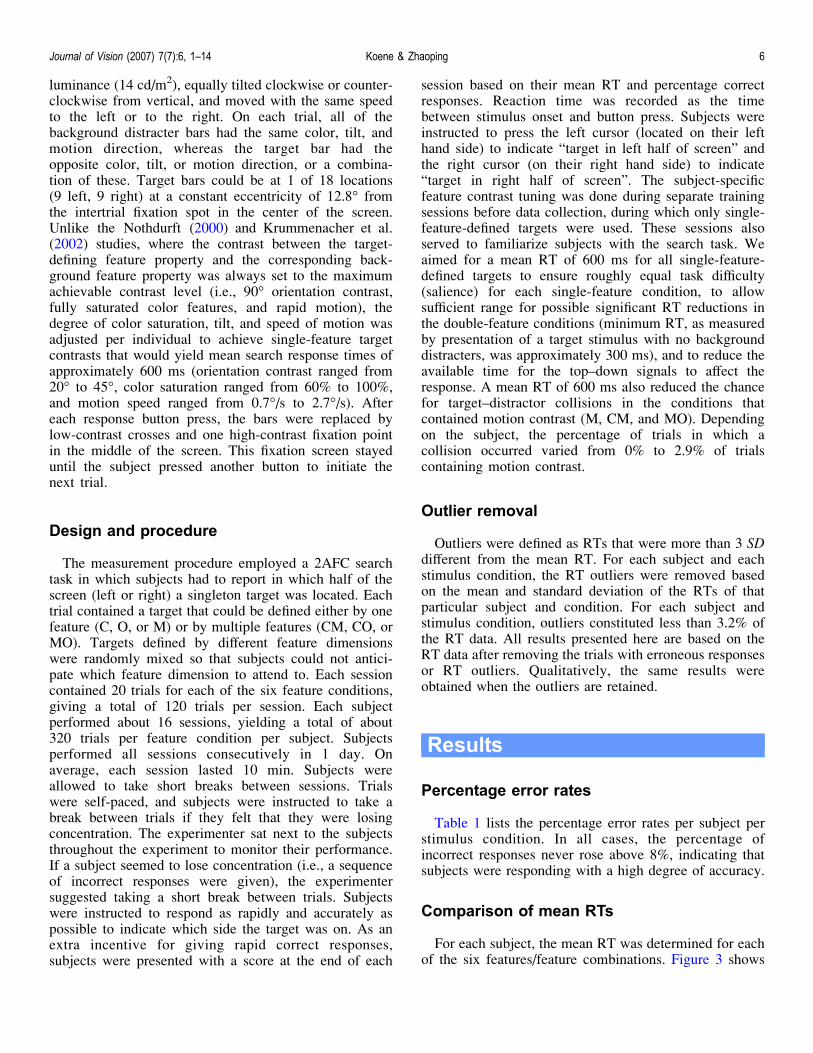
Table 1 lists the percentage error rates per subject perstimulus condition. In all cases, the percentage ofincorrect responses never rose above 8%, indicating thatsubjects were responding with a high degree of accuracy.
Comparison of mean RTs
For each subject, the mean RT was determined for eachof the six features/feature combinations. Figure 3 shows
Journal of Vision (2007) 7(7):6, 1–14 Koene & Zhaoping 6
the mean of these mean RTs across subjects. The raw datasuggest that subject performance is faster for all double-feature conditions than for any of the single-featureconditions. However, as discussed in the Introductionsection, further analysis (by means of a race model) isnecessary to determine if this performance differencereflects feature summation or a statistical facilitation inindependent parallel processing of stimulus features.
RT cumulative distribution functions
Next, we considered in more detail the RT distributionsfor each of the stimulus conditions. To get a generalcomparative overview of the RT distributions, we plottedthe CDFs of the RTs by pooling trials from all subjects for
each of the stimulus conditions (Figure 4). The CDFsclearly show a separation between the single- and double-feature conditions, indicating that the double-featureconditions (solid lines) contained a greater percentage offast RTs, and a separation between the CM condition(cyan line) and the faster MO (black line) and CO(magenta line) conditions.
Comparison against race model prediction
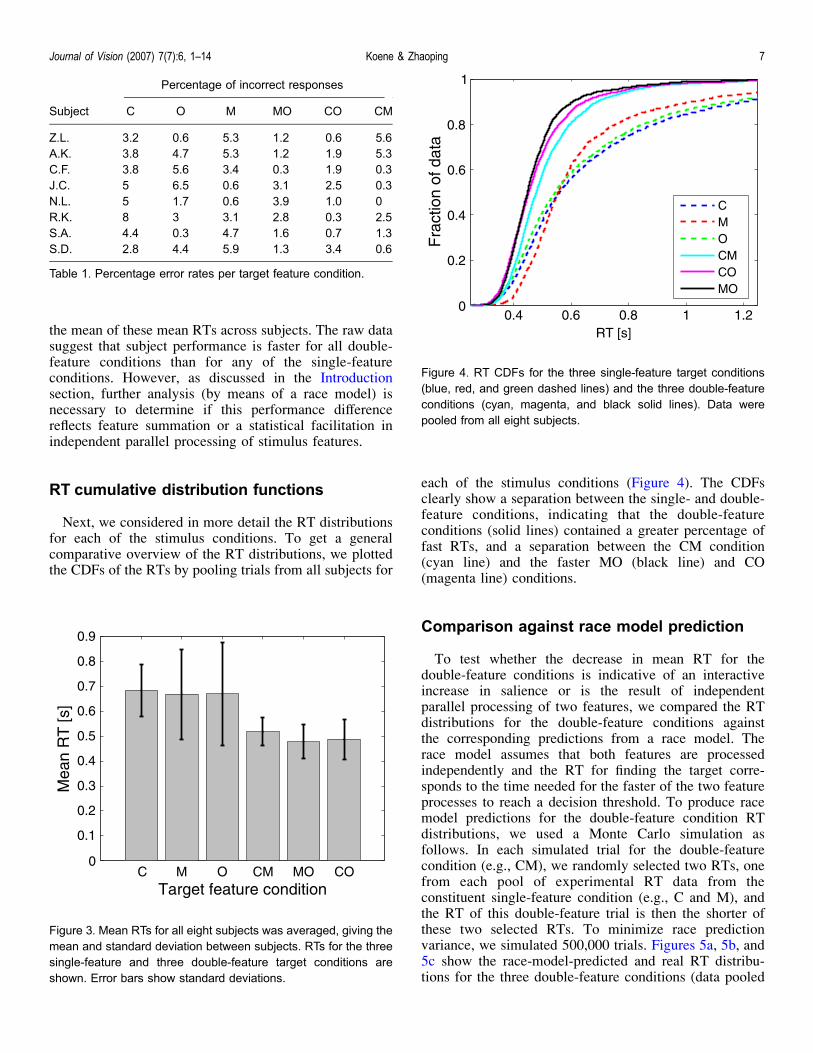
To test whether the decrease in mean RT for thedouble-feature conditions is indicative of an interactiveincrease in salience or is the result of independentparallel processing of two features, we compared the RTdistributions for the double-feature conditions againstthe corresponding predictions from a race model. Therace model assumes that both features are processedindependently and the RT for finding the target corre-sponds to the time needed for the faster of the two featureprocesses to reach a decision threshold. To produce racemodel predictions for the double-feature condition RTdistributions, we used a Monte Carlo simulation asfollows. In each simulated trial for the double-featurecondition (e.g., CM), we randomly selected two RTs, onefrom each pool of experimental RT data from theconstituent single-feature condition (e.g., C and M), andthe RT of this double-feature trial is then the shorter ofthese two selected RTs. To minimize race predictionvariance, we simulated 500,000 trials. Figures 5a, 5b, and5c show the race-model-predicted and real RT distribu-tions for the three double-feature conditions (data pooled
Figure 3. Mean RTs for all eight subjects was averaged, giving themean and standard deviation between subjects. RTs for the threesingle-feature and three double-feature target conditions areshown. Error bars show standard deviations.
Figure 4. RT CDFs for the three single-feature target conditions(blue, red, and green dashed lines) and the three double-featureconditions (cyan, magenta, and black solid lines). Data werepooled from all eight subjects.
Subject
Percentage of incorrect responsest1.1
C O M MO CO CMt1.2
Z.L. 3.2 0.6 5.3 1.2 0.6 5.6t1.3
A.K. 3.8 4.7 5.3 1.2 1.9 5.3t1.4
C.F. 3.8 5.6 3.4 0.3 1.9 0.3t1.5
J.C. 5 6.5 0.6 3.1 2.5 0.3t1.6
N.L. 5 1.7 0.6 3.9 1.0 0t1.7
R.K. 8 3 3.1 2.8 0.3 2.5t1.8
S.A. 4.4 0.3 4.7 1.6 0.7 1.3t1.9
S.D. 2.8 4.4 5.9 1.3 3.4 0.6t1.10
t1.11t1.13 Table 1. Percentage error rates per target feature condition.
Journal of Vision (2007) 7(7):6, 1–14 Koene & Zhaoping 7
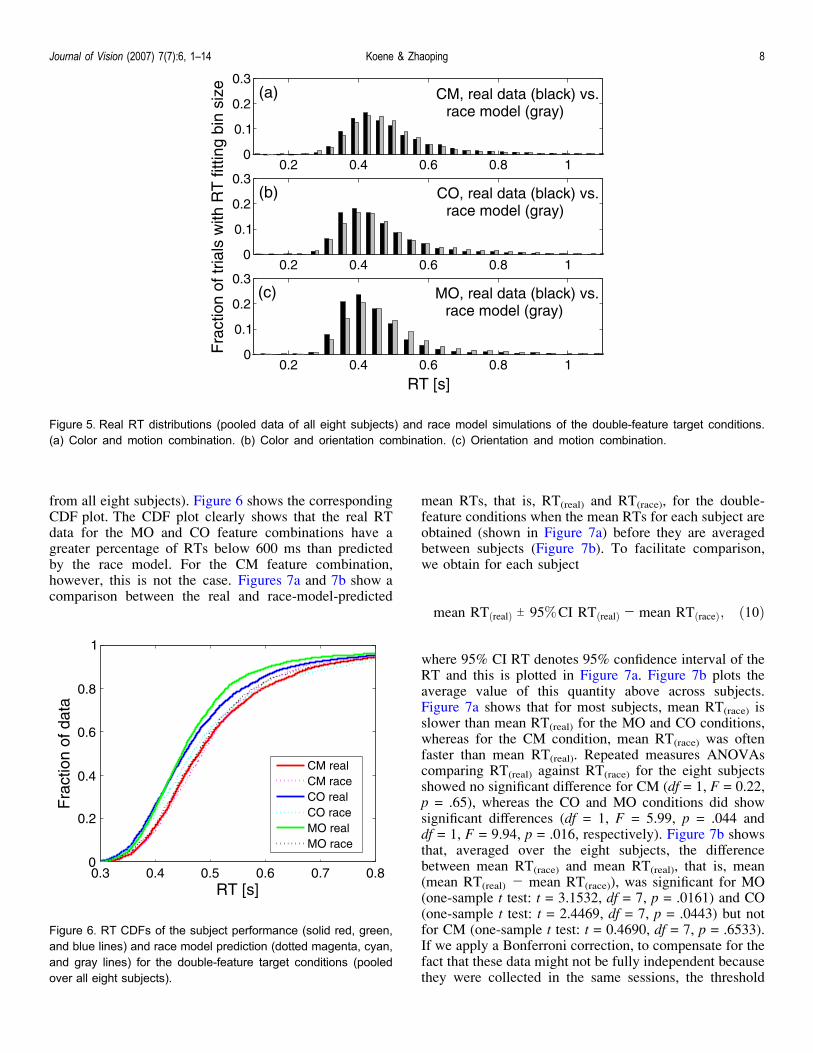
from all eight subjects). Figure 6 shows the correspondingCDF plot. The CDF plot clearly shows that the real RTdata for the MO and CO feature combinations have agreater percentage of RTs below 600 ms than predictedby the race model. For the CM feature combination,however, this is not the case. Figures 7a and 7b show acomparison between the real and race-model-predicted
mean RTs, that is, RT(real) and RT(race), for the double-feature conditions when the mean RTs for each subject areobtained (shown in Figure 7a) before they are averagedbetween subjects (Figure 7b). To facilitate comparison,we obtain for each subject
mean RTðrealÞ T 95%CI RTðrealÞ j mean RTðraceÞ; ð10Þ
where 95% CI RT denotes 95% confidence interval of theRT and this is plotted in Figure 7a. Figure 7b plots theaverage value of this quantity above across subjects.Figure 7a shows that for most subjects, mean RT(race) isslower than mean RT(real) for the MO and CO conditions,whereas for the CM condition, mean RT(race) was oftenfaster than mean RT(real). Repeated measures ANOVAscomparing RT(real) against RT(race) for the eight subjectsshowed no significant difference for CM (df = 1, F = 0.22,p = .65), whereas the CO and MO conditions did showsignificant differences (df = 1, F = 5.99, p = .044 anddf = 1, F = 9.94, p = .016, respectively). Figure 7b showsthat, averaged over the eight subjects, the differencebetween mean RT(race) and mean RT(real), that is, mean(mean RT(real) j mean RT(race)), was significant for MO(one-sample t test: t = 3.1532, df = 7, p = .0161) and CO(one-sample t test: t = 2.4469, df = 7, p = .0443) but notfor CM (one-sample t test: t = 0.4690, df = 7, p = .6533).If we apply a Bonferroni correction, to compensate for thefact that these data might not be fully independent becausethey were collected in the same sessions, the threshold
Figure 5. Real RT distributions (pooled data of all eight subjects) and race model simulations of the double-feature target conditions.(a) Color and motion combination. (b) Color and orientation combination. (c) Orientation and motion combination.
Figure 6. RT CDFs of the subject performance (solid red, green,and blue lines) and race model prediction (dotted magenta, cyan,and gray lines) for the double-feature target conditions (pooledover all eight subjects).
Journal of Vision (2007) 7(7):6, 1–14 Koene & Zhaoping 8
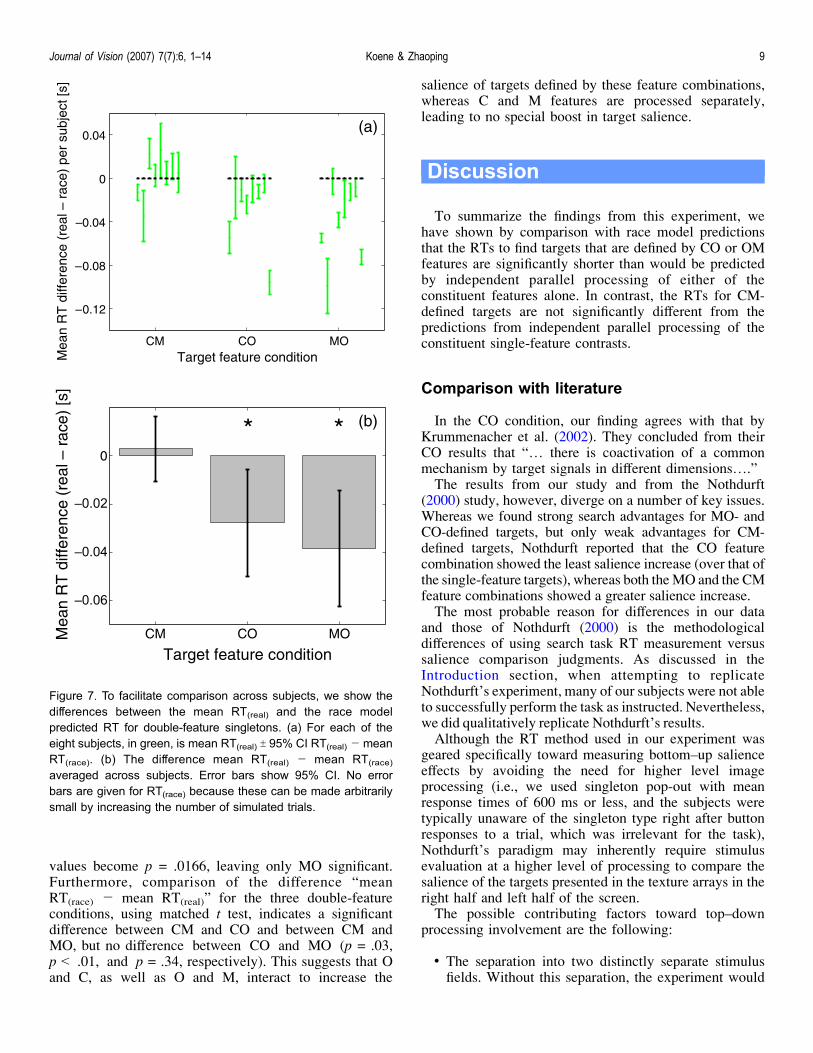
values become p = .0166, leaving only MO significant.Furthermore, comparison of the difference “meanRT(race) j mean RT(real)” for the three double-featureconditions, using matched t test, indicates a significantdifference between CM and CO and between CM andMO, but no difference between CO and MO (p = .03,p G .01, and p = .34, respectively). This suggests that Oand C, as well as O and M, interact to increase the
salience of targets defined by these feature combinations,whereas C and M features are processed separately,leading to no special boost in target salience.
Discussion
To summarize the findings from this experiment, wehave shown by comparison with race model predictionsthat the RTs to find targets that are defined by CO or OMfeatures are significantly shorter than would be predictedby independent parallel processing of either of theconstituent features alone. In contrast, the RTs for CM-defined targets are not significantly different from thepredictions from independent parallel processing of theconstituent single-feature contrasts.
Comparison with literature
In the CO condition, our finding agrees with that byKrummenacher et al. (2002). They concluded from theirCO results that “I there is coactivation of a commonmechanism by target signals in different dimensionsI.”The results from our study and from the Nothdurft
(2000) study, however, diverge on a number of key issues.Whereas we found strong search advantages for MO- andCO-defined targets, but only weak advantages for CM-defined targets, Nothdurft reported that the CO featurecombination showed the least salience increase (over that ofthe single-feature targets), whereas both theMO and the CMfeature combinations showed a greater salience increase.The most probable reason for differences in our data
and those of Nothdurft (2000) is the methodologicaldifferences of using search task RT measurement versussalience comparison judgments. As discussed in theIntroduction section, when attempting to replicateNothdurft’s experiment, many of our subjects were not ableto successfully perform the task as instructed. Nevertheless,we did qualitatively replicate Nothdurft’s results.Although the RT method used in our experiment was
geared specifically toward measuring bottom–up salienceeffects by avoiding the need for higher level imageprocessing (i.e., we used singleton pop-out with meanresponse times of 600 ms or less, and the subjects weretypically unaware of the singleton type right after buttonresponses to a trial, which was irrelevant for the task),Nothdurft’s paradigm may inherently require stimulusevaluation at a higher level of processing to compare thesalience of the targets presented in the texture arrays in theright half and left half of the screen.The possible contributing factors toward top–down
processing involvement are the following:
& The separation into two distinctly separate stimulusfields. Without this separation, the experiment would
Figure 7. To facilitate comparison across subjects, we show thedifferences between the mean RT(real) and the race modelpredicted RT for double-feature singletons. (a) For each of theeight subjects, in green, is mean RT(real) T 95% CI RT(real) j meanRT(race). (b) The difference mean RT(real) j mean RT(race)
averaged across subjects. Error bars show 95% CI. No errorbars are given for RT(race) because these can be made arbitrarilysmall by increasing the number of simulated trials.
Journal of Vision (2007) 7(7):6, 1–14 Koene & Zhaoping 9
have corresponded more to a uniform “target versusdistracter” type task, similar to the task used byHuang and Pashler (2005; except that both singletonswere equally valid as target).
& The response method and instruction. Nothdurft’s taskwould have been more “bottom–up salience oriented”if the direction of initial eye movements had beenrecorded while subjects were instructed to simplysearch for a singleton element. Instructing the subjectto “press the button on the side where the more salienttarget is” promotes responses based on awareness oftarget features and internal reflection about thepercept. The task in Nothdurft’s experiment impliesa comparison between two targets, whereas bottom–up salience is thought to simply provide initialattention grabbing.
Models of bottom–up salience
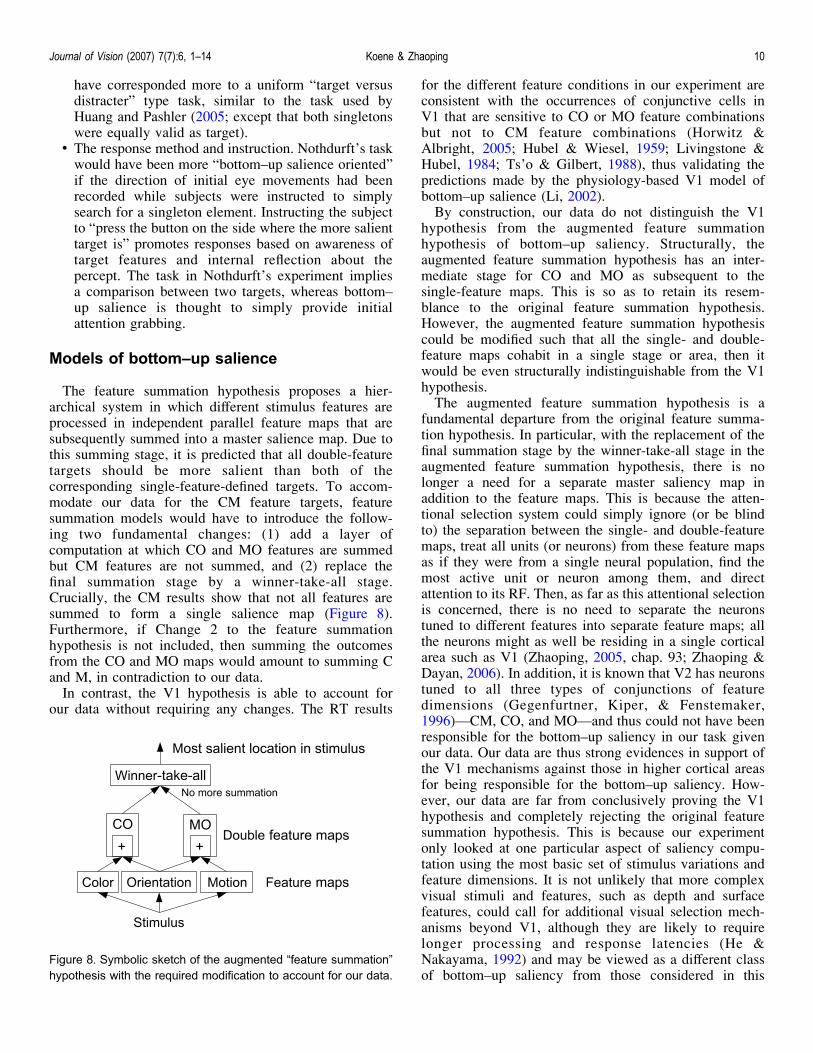
The feature summation hypothesis proposes a hier-archical system in which different stimulus features areprocessed in independent parallel feature maps that aresubsequently summed into a master salience map. Due tothis summing stage, it is predicted that all double-featuretargets should be more salient than both of thecorresponding single-feature-defined targets. To accom-modate our data for the CM feature targets, featuresummation models would have to introduce the follow-ing two fundamental changes: (1) add a layer ofcomputation at which CO and MO features are summedbut CM features are not summed, and (2) replace thefinal summation stage by a winner-take-all stage.Crucially, the CM results show that not all features aresummed to form a single salience map (Figure 8).Furthermore, if Change 2 to the feature summationhypothesis is not included, then summing the outcomesfrom the CO and MO maps would amount to summing Cand M, in contradiction to our data.In contrast, the V1 hypothesis is able to account for
our data without requiring any changes. The RT results
for the different feature conditions in our experiment areconsistent with the occurrences of conjunctive cells inV1 that are sensitive to CO or MO feature combinationsbut not to CM feature combinations (Horwitz &Albright, 2005; Hubel & Wiesel, 1959; Livingstone &Hubel, 1984; Ts’o & Gilbert, 1988), thus validating thepredictions made by the physiology-based V1 model ofbottom–up salience (Li, 2002).By construction, our data do not distinguish the V1
hypothesis from the augmented feature summationhypothesis of bottom–up saliency. Structurally, theaugmented feature summation hypothesis has an inter-mediate stage for CO and MO as subsequent to thesingle-feature maps. This is so as to retain its resem-blance to the original feature summation hypothesis.However, the augmented feature summation hypothesiscould be modified such that all the single- and double-feature maps cohabit in a single stage or area, then itwould be even structurally indistinguishable from the V1hypothesis.The augmented feature summation hypothesis is a
fundamental departure from the original feature summa-tion hypothesis. In particular, with the replacement of thefinal summation stage by the winner-take-all stage in theaugmented feature summation hypothesis, there is nolonger a need for a separate master saliency map inaddition to the feature maps. This is because the atten-tional selection system could simply ignore (or be blindto) the separation between the single- and double-featuremaps, treat all units (or neurons) from these feature mapsas if they were from a single neural population, find themost active unit or neuron among them, and directattention to its RF. Then, as far as this attentional selectionis concerned, there is no need to separate the neuronstuned to different features into separate feature maps; allthe neurons might as well be residing in a single corticalarea such as V1 (Zhaoping, 2005, chap. 93; Zhaoping &Dayan, 2006). In addition, it is known that V2 has neuronstuned to all three types of conjunctions of featuredimensions (Gegenfurtner, Kiper, & Fenstemaker,1996)VCM, CO, and MOVand thus could not have beenresponsible for the bottom–up saliency in our task givenour data. Our data are thus strong evidences in support ofthe V1 mechanisms against those in higher cortical areasfor being responsible for the bottom–up saliency. How-ever, our data are far from conclusively proving the V1hypothesis and completely rejecting the original featuresummation hypothesis. This is because our experimentonly looked at one particular aspect of saliency compu-tation using the most basic set of stimulus variations andfeature dimensions. It is not unlikely that more complexvisual stimuli and features, such as depth and surfacefeatures, could call for additional visual selection mech-anisms beyond V1, although they are likely to requirelonger processing and response latencies (He &Nakayama, 1992) and may be viewed as a different classof bottom–up saliency from those considered in this
Figure 8. Symbolic sketch of the augmented “feature summation”hypothesis with the required modification to account for our data.
Journal of Vision (2007) 7(7):6, 1–14 Koene & Zhaoping 10
article. With these more complex visual features, someproperties in the original feature summation hypothesiscould still be relevant. These questions should be closelyinvestigated in future studies.
Role of V1 conjunctive cells for salience
The increased salience of double-feature-defined targetsis correlated with the occurrence of conjunctive cells inV1 sensitive to specific feature combinations. If thepresence of conjunctive cells makes corresponding dou-ble-feature targets more salient, why do targets defined byMO or CO feature combinations not pop out in con-junction search tasks?The Li (2002) V1 hypothesis is based on the observa-
tion of contextual influences on the neural firing rates ofV1 cells through finite range lateral interaction betweenLayer 2–3 pyramidal cells and interneurons. The outputactivity of each cell therefore depends not only on itsdirect input (i.e., the stimuli within its classical RF [CRF])but also on the contextual stimuli outside the CRF. Eachcell receives inhibitory inputs from cells with neighboringCRFs that are sensitive to the same featureViso-featuresuppression (with the exception of collinear edge- or bar-detector cells, which provide excitatory input). Althoughreading out the actual input features from the V1 responserequires feature-specific decoding from the populationresponses (Dayan & Abbott, 2001), the location of themost salient item simply corresponds to the CRF of themost responsive cell. A feature singleton pops out withinthis framework simply because it evokes response in aneuron that does not suffer from the iso-feature suppres-sion, whereas neurons responding to the nonsingletonitems do. To understand why a unique feature conjunction(which is not a feature singleton) does not pop out, V1’sconjunctive cells must get inhibitory inputs not only fromother conjunctive cells sensitive to the same featurecombination but also from single-feature cells sensitive toeither of the features to which the conjunctive cell responds.Thus, during conjunctive search tasks, the activity of theconjunctive cell will be suppressed qualitatively (althoughperhaps not quantitatively) just like the activities in single-feature tuned cells, making the situation qualitatively similarto that without conjunctive cells.
Conclusion
Using RT measurements in a singleton search task, wehave shown that OM and CO double-feature-definedtargets can be found significantly faster than predictedfrom a race model assumption of independent processingfor the C, M or O features, suggesting a low-levelinteraction that increases the salience of OM and CO
double-feature-defined targets. For CM double-feature-defined targets, however, the RT was not significantlydifferent from the race model prediction, suggesting thatcolor and motion do not interact (at low level) but areinstead processed independently and in parallel. Theseresults are in agreement with predictions from the V1salience map model (Li, 2002) but contradict the assump-tion of a general summation over all feature maps thatforms the output of the feature maps hypothesis (Itti &Koch, 2001; Koch & Ullman, 1985; Wolfe et al., 1992).
Acknowledgments
This research was supported by a Gatsby CharitableFoundation grant to Dr. Li Zhaoping.
Commercial relationships: none.Corresponding author: Li Zhaoping.Email: [email protected]: Department of Computer Science, UniversityCollege London, Gower St. London WC1E 6BT, UK.
References
Allman, J., Miezin, F., & McGuinness, E. (1985).Direction- and velocity-specific responses frombeyond the classical receptive field in the middletemporal visual area (MT). Perception, 14, 105–126.[PubMed]
Allman, J., Miezin, F., & McGuinness, E. L. (1990).Effects of background motion on the responses ofneurons in the first and second cortical visual areas. InG. M. Edelman, W. E. Gall, & M. W. Cowan (Eds.),Signal and sense: Local and global order in percep-tual maps (pp. 131–142). New York: Wiley-Liss.
Ashby, F. G., & Townsend, J. T. (1986). Varieties ofperceptual independence. Psychological Review, 93,154–179. [PubMed]
Bacon, W. J., & Egeth, H. E. (1997). Goal-directedguidance of attention: Evidence from conjunctivevisual search. Journal of Experimental Psychology:Human Perception and Performance, 23, 948–961.[PubMed]
Brainard, D. H. (1997). The Psychophysics Toolbox.Spatial Vision, 10, 433–436. [PubMed]
D’Zmura, M. (1991). Color in visual search. VisionResearch, 31, 951–966. [PubMed]
Dayan, P., & Abbott, L. (2001). Theoretical neuroscience.Cambridge, MA: MIT Press.
Deubel, H., & Frank, H. (1991). The latency of sac-cadic eye movements to texture-defined stimuli. InR. Schmid & D. Zambarbieri (Eds.), Oculomotor
Journal of Vision (2007) 7(7):6, 1–14 Koene & Zhaoping 11
control and cognitive processes (pp. 369–384). NorthHolland: Elsevier.
Dick, M., Ullman, S., & Sagi, D. (1987). Parallel andserial processes in motion detection. Science, 237,400–402. [PubMed]
Donders, F. C. (1868). Over de snelheid van psychischeprocessen [On the speed of mental processes]. InW. G. Koster (Ed. and Trans.), Attention and perfor-mance II (pp. 412–431). Amsterdam: North Holland.(Original work published 1868.)
Duncan, J., & Humphreys, G. W. (1989). Visual searchand stimulus similarity. Psychological Review, 96,433–458. [PubMed]
Findlay, J. M., Brogan, D., & Wenban-Smith, M. G.(1993). The spatial signal for saccadic eye move-ments emphasizes visual boundaries. Perception &Psychophysics, 53, 633–641. [PubMed]
Foster, D. H., & Ward, P. A. (1991). Asymmetries inoriented-line detection indicate two orthogonal filtersin early vision. Proceedings of the Royal Society B:Biological Sciences, 243, 75–81. [PubMed]
Gegenfurtner, K. R., Kiper, D. C., & Fenstemaker, S. B.(1996). Processing of color, form, and motion inmacaque area V2. Visual Neuroscience, 13, 161–172.[PubMed]
He, Z. J., & Nakayama, K. (1992). Surfaces versusfeatures in visual search. Nature, 359, 231–233.[PubMed]
Horwitz, G. D., & Albright, T. D. (2005). Paucityof chromatic linear motion detectors in macaqueV1. Journal of Vision, 5(6):4, 525–533, http://journalofvision.org/5/6/4/, doi:10.1167/5.6.4.[PubMed] [Article]
Huang, L., & Pashler, H. (2005). Quantifying objectsalience by equating distractor effects. VisionResearch, 45, 1909–1920. [PubMed]
Hubel, D. H., & Wiesel, T. N. (1959). Receptive fields ofsingle neurons in the cat’s visual cortex. The Journalof Physiology, 148, 574–591. [PubMed] [Article]
Itti, L., & Koch, C. (2001). Computational modelling ofvisual attention. Nature Reviews Neuroscience, 2,194–203. [PubMed]
Joseph, J. S., & Optican, L. M. (1996). Involuntaryattention shifts due to orientation differences. Per-ception & Psychophysics, 58, 651–665. [PubMed]
Julesz, B. (1981). Textons, the elements of texture per-ception, and their interactions. Nature, 290, 91–97.[PubMed]
Julesz, B. (1986). Texton gradients: The texton theoryrevisited. Biological Cybernetics, 54, 245–251.[PubMed]
Kastner, S., Nothdurft, H. C., & Pigarev, I. N. (1997).Neuronal correlates of pop-out in cat striate cortex.Vision Research, 37, 371–376. [PubMed]
Kastner, S., Nothdurft, H. C., & Pigarev, I. N. (1999).Neuronal responses to orientation and motion con-trast in cat striate cortex. Visual Neuroscience, 16,587–600. [PubMed]
Knierim, J. J., & van Essen, D. C. (1992). Neuronalresponses to static texture patterns in area V1 of thealert macaque monkey. Journal of Neurophysiology,67, 961–980. [PubMed]
Koch, C., & Ullman, S. (1985). Shifts in selective visualattention: Towards the underlying neural circuitry.Human Neurobiology, 4, 219–227. [PubMed]
Krummenacher, J., Mueller, H. J., & Heller, D. (2002).Visual search for dimensionally redundant pop-outtargets: Parallel-coactive processing of dimensionsis location specific. Journal of Experimental Psy-chology: Human Perception and Performance, 28,1303–1322. [PubMed]
Lamme, V. A. (1995). The neurophysiology of figure-ground segregation in primary visual cortex. Journalof Neuroscience, 15, 1605–1615. [PubMed] [Article]
Lamy, D., Leber, A., & Egeth, H. E. (2004). Effects oftask relevance and stimulus-driven salience infeature-search mode. Journal of Experimental Psy-chology: Human Perception and Performance, 30,1019–1031. [PubMed]
Leber, A. B., & Egeth, H. E. (2006). It’s undercontrol: Top–down search strategies can overrideattentional capture. Psychonomic Bulletin & Review,13, 132–138. [PubMed]
Lee, T. S., Mumford, D., Romero, R., & Lamme, V. A.(1998). The role of the primary visual cortex in higherlevel vision. Vision Research, 38, 2429–2454.[PubMed]
Li, Z. (2002). A saliency map in primary visual cortex.Trends in Cognitive Sciences, 6, 9–16. [PubMed]
Livingstone, M. S., & Hubel, D. H. (1984). Anatomy andphysiology of a color system in the primate visualcortex. Journal of Neuroscience, 4, 309–356.[PubMed] [Article]
Luce, R. D. (1986). Response times: Their role ininferring elementary mental organization. Oxford:Oxford University Press.
Mevorach, C., Humphreys, G. W., & Shalev, L. (2006).Opposite biases in salience-based selection for leftand right posterior parietal cortex. Nature Neuro-science, 9, 740–742. [PubMed]
Miller, J. O. (1978). Multidimensional same–differentjudgments: Evidence against independent compari-sons of dimensions. Journal of Experimental
Journal of Vision (2007) 7(7):6, 1–14 Koene & Zhaoping 12
Psychology: Human Perception and Performance, 4,411–422. [PubMed]
Miller, J. (1982). Divided attention: Evidence for coac-tivation with redundant signals. Cognitive Psychol-ogy, 14, 247–279. [PubMed]
Miller, J., & Ulrich, R. (2003). Simple reaction time andstatistical facilitation: A parallel gains model. Cogni-tive Psychology, 46, 101–151. [PubMed]
Moraglia, G. (1989). Display organization and thedetection of horizontal line segments. Perception &Psychophysics, 45, 265–272. [PubMed]
Mueller, H. J., Herrer, D., & Ziegler, J. (1995). Visualsearch for singleton feature targets within and acrossfeature dimensions. Perception & Psychophysics, 57,1–17. [PubMed]
Nagy, A. L., & Sanchez, R. R. (1990). Critical colordifferences determined with a visual search task.Journal of the Optical Society of America A, Opticsand image science, 7, 1209–1217. [PubMed]
Nakayama, K., & Silverman, G. H. (1986). Serial andparallel processing of visual feature conjunctions.Nature, 320, 264–265. [PubMed]
Nothdurft, H. C. (1991). Texture segmentation and pop-out from orientation contrast. Vision Research, 31,1073–1078. [PubMed]
Nothdurft, H. C. (1992). Feature analysis and the role ofsimilarity in pre-attentive vision. Perception &Psychophysics, 52, 335–375. [PubMed]
Nothdurft, H. C. (1993). The role of features in preattentivevision: Comparison of orientation, motion and colorcues. Vision Research, 33, 1937–1958. [PubMed]
Nothdurft, H. C. (1995). Generalized feature contrast inpreattentive vision. Perception, 24, S22.
Nothdurft, H. C. (1999). Focal attention in visual search.Vision Research, 39, 2305–2310. [PubMed]
Nothdurft, H. C. (2000). Salience from feature contrast:Additivity across dimensions. Vision Research, 40,1183–1202. [PubMed]
Nothdurft, H. C., Gallant, J. L., & van Essen, D. C. (1999).Response modulation by texture surround in primatearea V1: Correlates of “popout” under anesthesia.Visual Neuroscience, 16, 15–34. [PubMed]
Nothdurft, H. C., & Parlitz, D. (1993). Absence of expresssaccades to texture or motion defined targets. VisionResearch, 33, 1367–1383. [PubMed]
Parkhurst, D., Law, K., & Niebur, E. (2002). Modeling therole of salience in the allocation of overt visualattention. Vision Research, 42, 107–123. [PubMed]
Pelli, D. G. (1997). The VideoToolbox software for visualpsychophysics: Transforming numbers into movies.Spatial Vision, 10, 437–442. [PubMed]
Raab, D. H. (1962). Statistical facilitation of simplereaction times. Transactions of the New York Acad-emy of Sciences, 24, 574–590. [PubMed]
Schofield, A. J., & Foster, D. H. (1995). Artificialneural networks simulating visual texture segmenta-tion and target detection in line-element images.Philosophical Transactions of the Royal Society ofLondon Series B: Biological Sciences, 350, 401–412.[PubMed]
Schwarz, W. (1989). A new model to explain theredundant-signals effect. Perception & Psychophy-sics, 46, 498–500. [PubMed]
Schwarz, W. (1994). Diffusion, superposition, and theredundant-targets effect. Journal of MathematicalPsychology, 38, 504–520.
Sillito, A. M., Grieve, K. L., Jones, H. E., Cudeiro, J., &Davis, J. (1995). Visual cortical mechanisms detect-ing focal orientation discontinuities. Nature, 378,492–496. [PubMed]
Sobel, K. V., & Cave, K. R. (2002). Roles of salience andstrategy in conjunctive search. Journal of Experimen-tal Psychology: Human Perception and Performance,28, 1055–1070. [PubMed]
Titchener, E. B. (1908). Lectures on the elementarypsychology of feeling and attention. New York: TheMacMillan Company.
Townsend, J. T., & Nozawa, G. (1995). Spatio-temporalproperties of elementary perception: An investigationof parallel, serial and coactive theories. Journal ofMathematical Psychology, 39, 321–359.
Treisman, A. M., & Gelade, G. (1980). A featureintegration theory of attention. Cognitive Psychology,12, 97–138. [PubMed]
Treisman, A., & Gormican, S. (1988). Feature analysis inearly vision: Evidence from search asymmetries.Psychological Review, 95, 15–48. [PubMed]
Ts’o, D. Y., & Gilbert, C. D. (1988). The organization ofchromatic and spatial interactions in the primate striatecortex. Journal of Neuroscience, 8, 1712–1727.[PubMed] [Article]
Ulrich, R., & Giray, M. (1986). Separate-activationmodels with variable base times: Testability andchecking of cross-channel dependency. Perception &Psychophysics, 39, 248–254. [PubMed]
Wolfe, J. M. (1994). Guided search 2.0: A revised modelof visual search. Psychonomic Bulletin and Review, 1,202–238.
Wolfe, J. M., Cave, K. R., & Franzel, S. L. (1989). Guidedsearch: An alternative to the feature integration modelof visual search. Journal of Experimental Psychology:Human Perception and Performance, 15, 419–432.[PubMed]
Journal of Vision (2007) 7(7):6, 1–14 Koene & Zhaoping 13

Wolfe, J. M., Friedman-Hill, S. R., Stewart, M. I., &O’Connell, K. M. (1992). The role of categorizationin visual search for orientation. Journal of Exper-imental Psychology: Human Perception and Perfor-mance, 18, 34–49. [PubMed]
Zhaoping, L. (2005). The primary visual cortex creates abottom up saliency map. In L. Itti, G. Rees, & J. K.Tsotsos (Eds.),Neurobiology of attention (pp. 570–575).San Diego, CA: Elsevier.
Zhaoping, L., & Dayan, P. (2006). Pre-attentive visualselection. Neural Networks, 19, 1437–1439. [PubMed]
Zhaoping, L., & May, K. A. (2007). Psychophysical testsof the hypothesis of a bottom-up saliency map inprimary visual cortex. PLoS Computational Biology,3, e62. [PubMed] [Article]
Zipser, K., Lamme, V. A., & Schiller, P. H. (1996).Contextual modulation in primary visual cortex.Journal of Neuroscience, 16, 7376–7389. [PubMed][Article]
Journal of Vision (2007) 7(7):6, 1–14 Koene & Zhaoping 14
Copyright © 2022 FDOKUMEN