fea student and alumni conference
436
PAPERS APRIL 19 TH – 20 TH , 2017 FEA STUDENT AND ALUMNI CONFERENCE ادس عشربة و المتخرجين السطلؤتمر ال م
-
Upload
khangminh22 -
Category
Documents
-
view
3 -
download
0
Transcript of fea student and alumni conference

III
PAPERSAPRIL 19TH – 20TH, 2017
FEA STUDENT AND ALUMNI CONFERENCEمؤتمر الطلبة و المتخرجين السادس عشر

II
Gold Supporters Contributing Supporters
Beirut Digital District Consolidated Contractors Company
Maliks Universal Snack

Copyright and Reprint Permission
This publication may not be reproduced, stored in a retrieval system, or transmitted in any form or by any means, electronic, mechanical, or otherwise, without the prior permission of the American University of Beirut. The findings, interpretations, and conclusions expressed in this proceeding are entirely those of the authors and should not be attributed to the American University of Beirut, to its affiliated organizations, or to members of its Board of Trustees. For permission to reprint a page or more of this publication, submit a Permission Reprint request form available by fax at 00961-1-361-091 or e-mail [email protected] rights reserved. ©2017 American University of Beirut.
Faculty of Engineering and Architecture. American University of Beirut P.O. Box: 11-0236. Beirut-Lebanon
Creative direction and production: Mayda Freije MakdessiDesign and production: Stephany Madi-Rawane Damaj-Sirine Labban-Hana Hammour

1
16TH FEASAC PROCEEDINGSThe Sixteenth FEA Student and Alumni ConferenceAmerican University of BeirutAPRIL 19 – 20, 2017Beirut, Lebanon

2

3
ORGANIZING COMMITTEE 16TH FEASAC
FACULTY MEMBERS
STUDENTS
STAFF MEMBERS
GRAPHIC DESIGN
Saif Al Qaisi IEM
Sabla Alnouri CPE
Mayssa Dabaghi CEE
Mona Fawaz ArD
Ahmad Gharbieh ArD
Howayda Harithy ArD
Rouwaida Kanj ECE
Matthias Liermann ME, Committee Chair
Youssef Nasser ECE, Editor
Mutasem Shehadeh ME
Mayda Freije Makdessi ARD Creative Director
Rawane Damaj
Hana Hammour
Sirine Labban
Stephany Madi
Natalie El-Khatib SRC rep
Aya El Murr ASME
Dany Nicholas ASME
Zeina Chamoun Dean’s office
Sara Halwani FEA career center
Maher Itani FEA IT
Suzanne Kobaissi Communications

4
WELCOME TO THE 16TH FEASAC
Welcome to the 16th Annual FEA Student and Alumni Conference! We have much to celebrate at the Maroun Semaan Faculty of Engineering and Architecture this year. FEA remains a power house of undergraduate and graduate student talent, which will be on display in the coming two days of presentations and panel discussions. Of course this talent is nurtured by a world class faculty that is also engaged in cutting-edge research, creative output, and challenging the status quo as public intellectuals. We will be recognizing six of them in the coming two days.
Apart from research publications and patents, this great Faculty can also lay claim to a large and influential group of alumni who accomplished what the founders of the FEA had envisioned in the 1940’s: to help build the economies of this oil rich region, and to provide technical expertise to the region’s governments which were at the time engaged in large scale infrastructure development. We are grateful to have with us today and tomorrow several of our alumni, eight of whom will be receiving the FEA distinguished alumni and distinguished young alumni awards.
The 1940s and 50s were a time of great technological optimism. Nuclear power was to deliver free electricity to the world. Automobiles were to whisk us quickly from home to work on open highways. Plastic was to make available to the masses vastly more consumer products that could be used and discarded. Work was to be made easier through labor-saving devices. Today we recognize the limitations of this optimism. Obscene inequality. An environment on the brink. People spending longer hours at mind-numbing jobs with less security and lower pay. Unprecedented rates of suicide and obesity. Mass surveillance. A growing fraction of the world’s population being considered “redundant” by the centers of power.
This year the FEA made human well-being its central organizing concern, and dedicated itself in its new vision statement to helping bring about “a viable, livable, and equitable world”. In our pedagogy

5
and our research we will be more green, more in sync with the needs of the social majorities, and more wise about the promise and peril of modern technology. This effort will build on the tradition of the liberal education model that AUB celebrates. At its heart, a liberal education asks us to critically engage the question “what kind of life is worth living?” It seems to me that always starting with this question can lead us towards a more liberating role for science and technology, and grounding for a more humane world.
It was in this spirit that this year’s FEA Student and Alumni Conference was designed. The first thing you may notice from the program is that it does not respect disciplinary boundaries. The organizing committee sought to foster conversations across disciplines through four cross-cutting themes: Design & Conceptualization, System & Data Analysis, Safety & Environment, and Engineering for Life’s Sake. The format this year is also different in that every session ends in a panel discussion with the presenters and audience.
I would like to thank the organizing committee, chaired by Professor Matthias Liermann, and made up of FEA faculty members, students, and staff for their excellent efforts. I also would like to thank our distinguished alumni, and our distinguished faculty members for their participation in this conference. Thanks to Khaled Joujou for overseeing the transformation of this student lounge-by-the-sea into a conference- ready room. Thanks to Graphic Design professor Reza Abedini for designing the trophies that will be awarded this year. A word to the wise: Reza is a world-acclaimed artist, so guard your trophies carefully!
Finally, I would like to extend an open invitation to all of you to attend the award ceremony on the Bechtel Engineering Building Terrace on Thursday at 6:30 pm.
I look forward to seeing you over the next two days. Have a great conference!
ALAN SHIHADEH INTERIM DEAN

6
CONTENTDISTINGUISHED ALUMNI
DISTINGUISHED YOUNG ALUMNI
8 Tony Haddad ECE
10 Wissam Tawil ME
12 Fadlo Touma CEE
14 Fadel Adib ECE
16 Monzer Chammas ME
18 Gustave Cordahi CEE
20 Houssam Hayek IEM
22 Fouad Mezher ARD
24 Mohamed-Asem Abdul Malak CEE
26 Mahmoud Al-Hindi CHEN
28 Riad Chedid ECE
30 Mona Harb ARD
32 Ghanem Oweis ME
34 Moueen Salameh IEM
DISTINGUISHED FACULTY

7
AUTHOR INDEX
36 Architecture and Design
53 Civil and Environmental Engineering
196 Electrical and Computer Engineering 254 Mechanical Engineering 337 Chemical and Petroleum Engineering
360 Industrial Engineering and Management Biomedical Engineering Program
430 Index
DEPARTMENTS OF

8
BIOGRAPHY
Tony Haddad graduated from AUB in 1975, with a bachelor degree of electrical engineering.He then pursued an MBA degree at AUB alsoHe started his career as a maintenance engineer at Unipack - Indevco group, then as a project engineer.In 1982, in the middle of the Israeli invasion, Tony left Indevco group to follow a crazy dream of building conveyors and automation equipment in Lebanon, and sell them to the world.For this, he formed Technica International in 1982 as a family owned business and started his journey with a team of 4 engineers and technicians in a workshop area of 76m2. 35 years later, Technica International staffs 200 engineers , technicians and administrative staff, operating over a built up factory of 6500 m2 in the industrial zone of Bickfaya.Technica presently manufactures conveyors and automation equipment for over 300 customers in 36 countries and is approved vendor to most multinational companies: Pepsi Cola, Coca Cola, Nestle, Danone, Heineken, Marai, Savola, PG, Unilever, and Mars. Technica also supplies turnkey lines for the beverages industry by integrating Technica conveyors with equipment from partners in Europe. The family has initiated last year a succession plan over 5 years, to pass the flame to the second generation in a smooth transition phase.
• ECETONY HADDAD
DESIGN & CONCEPTUALIZATION

9
ABSTRACT
I graduated from AUB as electrical engineer in 1975.Being an A+ student, it was not difficult for me to receive many job offers in the Gulf area.
Despite the start of war, I turned down all these offers and instead worked in Lebanon at Indevco group as maintenance engineer. For some reason, I felt that I could create more value, being home than in the Gulf.
After 7 years of experience and after many automation systems installed, a question was bugging my mind: Why can’t we make these machines in Lebanon?
Slowly, the dream was becoming more and more clear in my mind: I want to form a company to make machines in Lebanon and sell them to the world.
The most valuable piece of advice I got came from a management consultant; he told me: Tony you are a brilliant engineer, but to achieve your dream you must think as a businessman; go and study for an MBA.
So in the middle of the raging war, with 1 child and a pregnant wife; working part time to secure our living, I went back to AUB to study MBA.
And when in 1982, I was ready for my dream and I told everyone that I was leaving a well-paid job in a good company, to form Technica, which will make machines in Lebanon and sell them to the world, I got the same reaction from everyone: You are crazy.
The only person who encouraged me was my wife. Her words were: Follow your dream, if things go bad, we will always find “a bread and olive” to eat.
Now 35 years later, while I am addressing you, Technica makes equipment and sells them in 33 countries across the world.
These equipment are designed by 30 young engineers like you, and manufactured and installed by 80 technicians, all Lebanese.
Technica today:- Plant areas: 16500m2- Products: Automation equipment and robotic solutions- Staff: 200- Turnover: 16 million USD
My message to each one of you is that if you have a dream and have the passion to drive it, leave everything and follow your dream.Dreams cannot wait.
STORY OF A DREAM

10
BIOGRAPHY
Wissam Tawil is a Lebanese Mechanical Engineer, with a BE in Mechanical Engineering AUB Class of 92 and a Master Degree in Engineering Management Class of 1997. After working 10 years for various engineering consultancy firms, Wissam Tawil set up his own company in Beirut, Lebanon in 2001 and in less than ten years the company has moved from designing projects of a few thousands dollars to multimillion dollar projects. Wissam Tawil & Associates SAL (WTA) specializes in Mechanical, Electrical & Plumbing (MEP) design and supervision. Currently, over 30 members have joined the WTA team, and projects are ongoing in East and West Africa, North Africa, the Levant and the Gulf area.WTA has a strict quality control policy and is ISO 9001 certified.In addition to managing WTA, Wissam Tawil is an appointed trainer for the Middle East by “De Dietrich Thermique” France; a French company specialized in the heating sector. He is a Member of the MEP committee for setting the Lebanese Norms with Libnor. He is also a Member of the Council of the Order of Engineers & Architects of Beirut (OEA) 2013-2016 & 2016-2019. Wissam Tawil is an advisory board member of Pro Green Program Diploma and the Head of Scientific Committee in the (OEA) 2014 - 2015 and 2016 – 2017.In the OEA, he had several achievements such as implementing “Online payments”, creating “Criteria for Green Buildings in Lebanon”, implementing the safety regulations for lifts, and organizing a national conference on Solid Waste Management.
• MECHWISSAM TAWIL

11
ABSTRACT
After graduating from AUB as a Mechanical Engineer in 1992, Wissam Tawil decided to stay in Lebanon, despite the trend of AUB Engineering graduates to work outside the country. After working for about 10 years in several consultancy firms, Wissam Tawil opened his own firm dealing with MEP design & supervision for Building services. Now the firm has about 30 members & works in Africa, Levant and Gulf area.The key points for a sustainable success:- Passion- Know-how and competence- Good reputation- Respectable incomeThe works of the company spread across Africa, Levant & the Gulf with projects such as:
Major projects done in Lebanon:- FNB Headquarters- Mandarin Oriental Hotel- Byblos Sud Resort- Achrafieh Heights Tower- Beit Beirut MuseumMajor projects done in Africa:- KBR – Lagos - Nigeria- Matrix Tower – Kinshasa - DRC- CMKD – Tanger - Morocco- Timimoun – Algeria Major projects done in the Gulf:- Al Munajem – Riyadh - KSA- Lamina Tower – Jeddah - KSA- Lusail – Qatar- Cinema City – Mall of Qatar- KAUST Hotel – Jeddah - KSAMajor Projects in Romania:MARe Museum – Bucharest
In addition to that, Wissam Tawil is a council member in the OEA – Beirut since 2013. A brief of what was accomplished during the past 4 years:1- Establishing the criteria for Green Buildings in Lebanon2- Implementing online payment for annual renewal fees and insurance 3- Implementing safety measurements for lifts as per NL-EN-814- National Conference on Solid Waste Management
MY PRIVATE AND PUBLIC CAREER PATH
SAFETY & ENVIRONMENT

12
BIOGRAPHY
Fadlo Touma graduated in Civil Engineering from American University of Beirut (AUB) obtaining his B.S. in 1966 and his M.S. degree in Geotechnical Engineering in 1969.
While working for his M.S degree, he gained practical experience with Consolidated Engineering Company in Beirut. He then attended the University of Texas for his graduate work in Geotechnical Engineering and was awarded his doctorate in 1972.
Fadlo started in 1975 what was to become a sizeable geotechnical group of companies in the Gulf area (Saudi Arabia, United Arab Emirates, Qatar and in Lebanon). The group comprises a consulting geotechnical and environmental company, a site investigation and materials testing company and a ground engineering and piling company, employing more than one thousand five hundred engineers, scientists and technicians. He founded Engineering & Research International (ERI) of Champagne, Ill, specializing in pavement evaluation and maintenance management.
Fadlo sat on the University of Texas Visiting Committee from 1994 to 1997. He was elected vice mayor of his hometown from 1998 to 2004. Fadlo also sat on the Committee for the writing of the Building Code of the Kingdom of Saudi Arabia, and contributed to the geotechnical field particularly in founding on coral soils of the Red Sea, and on collapsing soils. Fadlo was elected as distinguished graduate of the University of Texas, and he is a member of the Lebanese Council for Business and Investment in Saudi Arabia.
• CEEFADLO TOUMA

13
ABSTRACT
The presentation describes the rise in the geotechnical and materials testing fields over the last 40 years. Statistics in terms of exploratory drilling and piling will illustrate the prominence the geotechnical field has risen to. A brief description of the spread of activities of Engineering and Research International (ERI) will also be presented.
The presentation will explain the reasons for the growth and speculate on the future of the business. Some of the trends that will impact the next generation will also be presented such as marine sciences, corrosion, maintenance engineering, and environmental monitoring. The Gulf region is expected to continue to grow beyond the oil era due to multiple resources and on advanced infrastructure. The transformation of the economy will impact the technologies of the giant multinationals. The Lebanese can participate in this transformation provided our educational establishments continue to upgrade curricula.
Some personal reflections on the journey of life will be made emphasizing the values of hard work and the will to learn.
ENGINEERING 4 LIFE’S SAKE
THE RISE OF GEOSCIENCES

14
FADEL ADIB• ECE
Fadel Adib is an Assistant Professor at MIT. He leads the Signal Kinetics research group, which he founded at the MIT Media Lab in 2016. His group explores and develops new technologies that can extend human and computer abilities in communication, sensing, and actuation. Fadel received his bachelor’s degree in CCE from AUB in 2011, where he graduated with the university’s highest GPA on record, and his Master’s and PhD degrees in EECS from MIT in 2013 and 2016 respectively.
Fadel’s research has been identified as one of the 50 ways MIT has transformed Computer Science over the past 50 years. His work has been featured in major media outlets including CNN, BBC, Le Figaro, Der Spiegel, and The Guardian. Fadel was named to the Forbes’ list of 30 under 30 and MIT Technology Review’s list of the world’s top 35 innovators under 35. Fadel is also the recipient of other honors, including the Microsoft Research Fellowship, the Jacobs Presidential Fellowship from MIT, the AUB Merit Scholarship, the MobiCom 2014 Best Demo Award, the CHI 2015 Honorable Mention Award, and the best Master’s thesis award in EECS at MIT.
Fadel’s research is being commercialized by a recent startup called Emerald, currently in the pilot stage. It is also being used in non-contact sleep apnea monitoring studies at Massachusetts General Hospital. In 2015, he demoed his research to then-President Obama at the White House after being selected to participate in the First-Ever White House Demo Day.

15
AN AUBITE’S JOURNEY: BLURRING THE BOUNDARIES BETWEEN SCIENCE & SCIENCE FICTION
ABSTRACT
My first research paper appeared in the AUB FEA Student conference in 2009, when I was a second-year undergraduate student at AUB. In this talk, I will describe my journey from there to becoming a professor at MIT in 2016 and establishing my own research group. A central part of this journey is my research on developing a new technology for sensing using wireless signals. I will describe how I started my research on seeing through walls with WiFi, and how the research progressed so that today we can even monitor human breathing, heartbeats, and emotions using wireless signals and without requiring any body contact. I will also touch on how my group is developing new technologies that can help in solving major problems that face modern society in manufacturing, communications, health-care, and human-machine interfaces.
Finally, I will discuss the challenges and opportunities throughout this journey, and touch on my experiences in interacting with the media, starting a company, and visiting the White House.
ENGINEERING 4 LIFE’S SAKE

16
Monzer Chammas serves as director at leading oil and gas service provider Petrofac. He holds a BE in mechanical engineering from AUB and an MBA in finance with high distinction from HEC Montreal. He has 16 years of multi-faceted industry experience, namely in estimation, execution, management and project finance for international multi-million dollar projects across the oil and gas value chain.
He began his career onsite as construction supervisor, eventually working his way up to the role he holds today, gathering experience along the way in engineering design, supply chain, construction and business development. Monzer resides in Dubai with his wife Carole and children Marie, Julie and David.
• ME
BIOGRAPHY
MONZER CHAMMAS

17
SYSTEMS & DATA ANALYSIS
ABSTRACT
Not withstanding the cyclical nature of the industry, a career in Oil and Gas can be quite rewarding. The real challenge is for the individual to achieve agility in either surviving the down cycles, or moving from one area to another without experiencing setbacks in one’s professional life.Before tackling this further, we need to understand the whole hydrocarbon value chain. Ultimately, all hydrocarbons are owned by either NOCs or IOCs. They are the real risk takers who gain or lose vastly by fluctuations in the market. They embark on exploration, development and production projects to maintain or improve their production supply. Next come the refining and petrochemical companies who breakdown the crude oil or gas into final products. Last but not least, there are the service providers. These companies possess the technical and execution know-how in servicing the above companies.
A decline in oil and gas prices does of course have an adverse effect on the financial performance of all these companies that form the industry that leads to layoffs. By precisely positioning oneself in areas common to many adjacent industries such as supply chain, project management, construction management or business development, an employee can benefit from the oil and gas industry when the time is right, but still maintain a steady career through challenging times.
In summary, I believe the oil and gas remains a complex yet lucrative industry where solid careers can be built however one should keep some degree of flexibility for the tough times.
RIDING THE OIL SLIDE

18
GUSTAVE CORDAHI• CEE
Gustave A. Cordahi is a Lead Associate with Booz Allen Hamilton in Washington, D.C. He currently leads the Strategy & Policy cross-cut within Booz Allen’s Transportation team. He is an expert in Transportation Strategy & Technology and has led a range of Performance Management projects, including Program Evaluations, Impact Assessments of emerging technologies, process evaluations, and benefit-cost analyses for a wide range of Transportation Programs, for clients spanning from U.S. Federal and National agencies to State and Local Departments of Transportation.
Winner of Booz Allen Hamilton’s most prestigious award, the VIP (Values In Practice) Award. Was also awarded The Stephen Penrose Award for the Faculty of Engineering and Architecture (FEA), and The Distinguished Graduate Award for the Department Civil and Environmental Engineering Department by the American University of Beirut (AUB) after being constantly ranked in the top tier of his class and being placed on the Dean’s Honor List during all his semesters. Received a Research Fellowship from the University of California at Berkeley.
Holds a Masters of Science (MS) in Transportation Engineering from the University of California at Berkeley (2008) on top of his Bachelor’s degree in Civil and Environmental Engineering with distinction from AUB (2007) and his Research Experience at the Massachusetts Institute of Technology (MIT).
Gustave maintains an active involvement on the social, political, and networking fronts. He held leadership positions in the Greater Washington D.C. AUB Alumni (WAAAUB) Chapter, and is the co-founder and Executive Director of the Back To Roots Summer Academy Program.
BIOGRAPHY

19
ABSTRACT
The Intelligent Transportation Systems Joint Program Office (ITS JPO) is responsible for conducting research on behalf of the U.S. Department of Transportation (USDOT) and all major modes to advance transportation safety, mobility, and environmental sustainability through electronic and information technology applications. The Department’s ITS Program supports the overall advancement of ITS through investments in major research initiatives, exploratory studies, and a deployment support program including technology transfer and training. The ITS Strategic Plan 2015-2019 outlines the direction and goals of the USDOT’s ITS Program and provides a framework around which the ITS JPO and other Department agencies will conduct research, development, and adoption activities to achieve the program’s outcomes and goals.STRATEGIC PLAN PRIORITIESThe 2015-2019 ITS Strategic Plan’s framework is built around two key ITS Program priorities— realizing connected vehicle implementation and advancing automation. The priorities reflect stakeholder feedback on the need for the ITS Program not only to conduct research, but also to help with deployment and implementation of specific technologies related to connected vehicles and automation.
Mr. Gustave A. Cordahi is a key author of the ITS Strategic Plan 2015-2019. He will provide an overview of the Plan’s main components, making a case for how disruptive technologies such as Connectivity and Automation are transforming the way society moves.
DISRUPTIVE TECHNOLOGIES AND TRANSPORTATION: HOW CONNECTIVITY AND AUTOMATION ARE TRANSFORMING THE WAY SOCIETY MOVES
SAFETY & ENVIRONMENT
20
Houssam Hayek is the Manager of Quality Assurance department at Murex. Murex is known as the #1 provider of integrated solutions front to back to risk for the capital markets industry in the world.
Houssam was born in Beirut on 11 May 1984. He graduated from Lycée Abdel Kader in Beirut in 2002 and from American University of Beirut with a Bachelor of Computer and Communication Engineering in 2006. He remained at American University of Beirut to complete his Master in Engineering Management in 2009.
After receiving his bachelor degree and in parallel with his graduate studies, Houssam joined Murex in 2006 as a test analyst. Then, he worked later as a test lead on several key business solutions such as forex and money market trading and asset management, and other technical projects such as interfaces with other platforms, and objects workflows. Then, he was promoted to a test manager role where he introduced new notion of testing in production contexts where main target was to replicate clients’ business utilization models internally.
In April 2016, Murex offered him the leadership of Quality Assurance department as a continuous evolution in his testing career. He is leading a 100+ quality assurance engineers’ team ensuring a corporate quality from development phase until client delivery. During his almost 11 years journey at Murex, he kept learning new topics such as CFA, and ISTQB certifications that helped him better understand and apply market trends and standards related to his work domain.
HOUSSAM HAYEK • IEM
BIOGRAPHY

21
SYSTEMS & DATA ANALYSIS
ABSTRACT
Presentation will cover three main axes:• Brief introduction of Murex - Murex is the #1 provider of integrated solutions front to back to risk for the capital markets industry - Our presence: 3 Regional Hubs, 17 offices covering all time zones - Overview on solution we offer for our clients• How did I evolve within Murex? - Joined Murex in 2006 as a test analyst - Worked later as a test lead on several key business solutions (forex and money market trading, asset management) and on other technical projects such as interfaces with other systems and objects workflows - Then promoted to a system test manager role where I introduced new notion of testing in production contexts (main target was to replicate clients’ business utilization models and production internally) -Then offered leadership of Quality Assurance department as a continuous evolution in testing career (leading 100+ quality assurance engineers’ team ensuring a corporate quality from development phase until clients delivery)
• How did my studies at AUB helped reach my current role? - It is not only limited to studying technical courses (computer engineering, or financial engineering) - Studying at AUB (in general)• Practice (not only theory)• Pragmatic (broader thinking)• Research (learning is a continuous process)• You are ready for market when you graduate - Engineering Management was a turning point in my career• Learned better financial word which is a key component in our job• Optimization and Problem Solving skills• Gained leadership skills
SOFTWARE AND FINANCIAL ENGINEERING MIXED AS A CAREER

22
FOUAD MEZHER
BIOGRAPHY
Based in Lebanon, Fouad Mezher works as an illustrator on projects ranging from children’s books to animations, but his primary focus is on comics. His work in comics started with Samandal in which he wrote and illustrated the series The Educator as well as other short comics. His other work in comics includes illustrating The Fifth Column: Homecoming, written by Fadi Baki, in Zamakan, as well as writing and illustrating the silent comic Fragile for Risha Project. His latest work in comics was illustrating The Mezzotint in Ghost Stories of an Antiquary Volume One, adapted from M. R. James by Leah Moore and John Reppion. His comics have featured deaths caused by reanimated specters, pens, giant feet and an assortment of mutant animals.
Mezher’s work in comics extended beyond making them when he helped organize the International Festival of Comics - Beirut: 2012. His duties included co-instructing a series of workshops, designing promotional materials, and jurying. In 2015, he was invited to speak at Arab Comics: 90 Years of Popular Visual Culture, a symposium at Brown University. The same year, he participated in the “Al Sutouh” roundtables and “the artist at work” workshops at Cairocomix. His work has been exhibited at Brown and Cairocomix, as well as Beirut Animated, Trick Animation Festival and Lucca Comics and Games.
He is currently in his second year pursuing a Masters in Comics at California College of the Arts, where he is at work on a graphic novel. Surprisingly, it doesn’t feature gruesome death.
• ARD

23
ABSTRACT
In 2009, I worked on a comic titled Enigma about a young Lebanese girl who decided to become a superhero. I drew the first chapter, of what was supposed to be a graphic novel, as a final year project at the Graphic Design program in AUB.
Working as a freelance illustrator following graduation, all my professional decisions have been informed and punctuated by attempts to continue Enigma. Almost a decade after its inception, I’ve finally returned to working on this story, as a thesis project at the MFA in Comics program in CCA. My hope is to publish it in a few years with the slightly modified title of Enigma Stigma. It’s no longer a superhero comic, at least not on the surface.
In presenting the evolution of this story as it relates to my commercial illustration work and other work in comics, my hope is to highlight the benefits and pitfalls of how a single project can guide one’s professional trajectory, and make sense of the relationship between teenage superheroes, disgustingly cute cartoon elephants and murderous mutant dogs.
DECODING THE ENIGMA
DESIGN & CONCEPTUALIZATION

24
• CEE
MOHAMED-ASEM ABDUL-MALAK
BIOGRAPHY
Prof. Mohamed-Asem Abdul-Malak earned his BE degree in Civil Engineering from Beirut Arab University in 1983 (with High Distinction) and his Master’s and Ph.D. degrees in Construction Engineering and Project Manage-ment from the University of Texas at Austin, in 1986 and 1990, respectively.
He has been a full-time faculty with the AUB’s Faculty of Engineering and Architecture since September 1990, serving both the Civil and Environmental Engineering Department and the Engineering Management Graduate Program. His teaching and research interests are primarily in the areas of project risks and management, legal aspects and contract administ-ration, and construction disputes resolution. His major research accomplishments are in the areas of design and construction work program administration and in construction claims and disputes tracking and management.
His professional service activities have included delivery of, or participation in, workshops and seminars, sponsored by a wide range of organizations including the ASCE, ESCWA, UNWRA, USAID, EPA, ICC, and Order of Engineers and Architects. His professional consulting work has been on projects of all sizes and complexities, affording him a unique exposure to a diversity of work environments of different engineering, contracting, management consulting, legal, and project development offices and organizations and for developing a sound understanding of the constraints under which the engineering and construction industry operates in the Middle East and North Africa Region. He acts in varying capacities as a dispute resolution specialist in respect of amicable settlement, adjudication, mediation, arbitration, and litigation proceedings, under various contract forms and jurisdictions.

25
ABSTRACT
Ending up with an academic and professional career in construction engineering and management was not anywhere near being a goal I would have strived to achieve had it not been for the civil war that erupted back in the mid 70’s. Yet, by retrospect, I find what I am having the chance to be involved in and exposed to, both as an academician and a practitioner in this field, to be graciously and rather exceptionally rewarding. Construction is one core sector in every nation’s economy, as the need to find or build a shelter probably came second as a survival priority for our ancestries, after their unyielding need to first search for food. Nowadays, those priorities have not changed much, except that the delivery of construction projects cannot be viewed but as a process potentially involving unprecedented complexities, owing to the progressively increasing sophistication of developmental requirements afforded by the advancements in construction methods and in technologies related to a wide array of other engineering-based industries. To this end, the talk has the objective of highlighting example method-ologies offering architecture and engineering practitioners the kind of systematic frameworks that are devised for assisting them in administrating project-management-related aspects known to be critical for achieving success with any well-intended construction project.
SYSTEMS & DATA ANALYSIS
ORDERED ADMINISTRATIVE SYSTEMS FOR CONSTRUCTION PROJECT MANAGEMENT

26
MAHMOUD AL-HINDIBIOGRAPHY
Mahmoud Al-Hindi received a B.Sc. (Hons.) and an M.Sc. in chemical engineering from the University of Leeds, UK and a Ph.D. in chemical engineering from Imperial College London, UK. Mahmoud has over sixteen years of industrial experience with multinational environmental services companies where he worked as a process engineer, project manager, technical and commercial director and general manager.
He joined the American University of Beirut in 2009 and is currently an Associate professor in the Department of Chemical and Petroleum Engineering at the Faculty of Engineering and Architecture.
His research interests are in the areas of renewable energy desalination, water reuse, membrane processes, occurrence and removal of emerging contaminants from water and process integration and optimization. Mahmoud is a member of the Institution of Chemical Engineers and of the International Desalination Association.
• CHEN
SAFETY & ENVIRONMENT

27
ABSTRACT
The impact of residual pharma-ceuticals on the aquatic environment has gained widespread attention over the past years. Various studies (in the thousands) have established the occurrence of several hundred pharmaceutical compounds (in excess of 600 have been detected and at levels ranging from the low ng/L to mg/L) in different water bodies throughout the world. Unfortunately, in the Arab World/MENA region the number of published investigations and the number of pharmaceuticals detected in the region’s water bodies are far smaller in number; less than 20 studies in six countries and out of the 42 compounds investigated 28 have been detected.
In this presentation, various aspects of “pharmaceuticals in the environment” will be addressed and the relevance/significance of these issues to the Arab World will be detailed. Major pathways of release, occurrence in water bodies, environmental risks, prioritization strategies, removal technologies and research challenges will be outlined.
PHARMA-CEUTICALS IN THE ENVIRONMENT: WHAT ARE THE ISSUES?

28
• ECERIAD CHEDID
ENGINEERING 4 LIFE’S SAKE
BIOGRAPHY
Dr. Riad B. Chedid is a university professor, an administrator and an energy specialist. He received his PhD degree in electrical engineering in 1992 from Imperial College, University of London. Upon graduation, Dr. Chedid joined the American University of Beirut as assistant professor of electrical & computer engineering and played a pivotal role in establishing teaching and research tracks in renewable energy. He was promoted to the ranks of associate and full professor in 1997 and 2003 respectively.
Professor Chedid carried out numerous consulting activities in the area of renewable energy and climate change for international agencies such as UNDP, ESCWA and UNFCCC. In 2002, he was appointed by the Cabinet of Ministers in Lebanon member of the Board of Directors of the Lebanese Electric Utility and in 2007, he was nominated as advisor to the Lebanese Minister of Energy and Water.
In 2008, professor Chedid became the founding President of Fahd Bin Sultan University in Saudi Arabia, and in 2010, he was selected to lead a team of around 60 experts for developing the American University of Abu Dhabi. In 2014, Professor Chedid was appointed President of Rafik Hariri University to lead a business transformation process and remained there till January 2017.
Prof. Chedid was recognized for his efforts to promote renewable energy in Lebanon by the third Beirut Energy Forum in 2012. He received the Abdul Hamid Hallab REP Service Excellence Award in 2011, and was decorated with the medal of the Lebanese Electric Utility in 2007.

29
ABSTRACT
We are living in an era where advancement of technology has brought fundamental changes to all aspects of our lives. The world around us is changing, and engineers are expected to continue to lead the change process. Although, there has never been a better time to be an engineer with the vast opportunities that the advancement of digital technology is offering, one could also argue that there has never been a more challenging time be an engineer. “Ordinary” skills and abilities are no more adequate to find and retain a job in a complex, competitive world. To have self-motivation to learn that little more and to engage in lifelong learning is the new norm.
In this presentation, key challenges and opportunities will be highlighted with the purpose of inspiring FEA graduates to act as change agents for our societies that are facing uncertain future as it navigate immense challenges that threaten their existence. Examples from the professional practice will be presented to make the young engineers appreciate their future role as not only technical problem solvers, but also problem definers, team leaders, agenda setters all the while fostering innovative solutions, embracing impeccable ethical values, addressing national developmental needs, and responding to environmental constraints and public opinion.
CHALLENGES AND OPPORTUNITIES AHEAD FOR GRADUATING ENGINEERS

30
• ARDMONA HARB
DESIGN & CONCEPTUALIZATION
BIOGRAPHY
Mona Harb is Professor of Urban Studies and Politics and Associate Dean at the Faculty of Engineering and Architecture, at the American University of Beirut. She received her PhD in Political Science in 2005 from the Institut d’Etudes Politiques at Aix-Marseille (France).
She is the author of Le Hezbollah à Beyrouth (1985-2005): de la banlieue à la ville (Karthala-IFPO, 2010), co-author of Leisurely Islam: Negotiating Geography and Morality in Shi’ite South Beirut (Princeton University Press, 2013, with Lara Deeb,), and co-editor of Local Governments and Public Goods: Assessing Decentralization in the Arab World (Beirut: LCPS, 2015, with Sami Atallah). Her ongoing research investigates local governance and refugees, urban social movements, and youth in Lebanon. Harb is the recipient of grants from the IDRC, Ford Foundation, LSE-Emirates Fund, EU-FP7, Wenner-Gren, ACLS, and the Middle-East Awards.
She serves on the editorial boards of IJURR and CSSAME, and is a trustee of the Arab Council for the Social Sciences. She is the founder and co-editor of the Cities Page on Jadaliyya e-zine. She served as the coordinator of the AUB graduate programs in Urban Planning, Policy and Design for several years. She provides professional advice on urban development issues for several international organizations (ESCWA, WB, EU, UNDP).

31
ABSTRACT
This talk reflects on my journey since the time I was told by an AUB chairperson I was “too hybrid” to become a full-time faculty member in his social science department. He thought my undergraduate professional training in architecture combined with my post-graduate degrees in urban studies and politics were “too much” for his “too classical department.” It was a polite, yet condescending way to tell me I was too impure to count as a real social scientist. In an odd twist of fate, shortly after, I was invited to apply to a position in the graduate programs in urban planning and design at my Architecture and Design department at AUB—which I did with moderate enthusiasm, still bitter over being rejected by my disciplinary peers. I wanted to be in conversation with political scientists, not with architects, designers, and planners—which I also devalued as being lesser social scientists.
Today, fifteen years later, I am fully engaged in collaborative research projects, professional endeavors, and activist networks that bring together political scientists and urban scholars, anthropologists and graphic designers, urban planners and economists, historians and lawyers. My learning curve is steep, and my intellectual curiosity in full gear. Being “too hybrid” revealed to have many merits, as it enabled the navigation of complex and diverse terrains, and favored project-based interactions, and experiential opportunities.
ON THE MERITS OF BEING LABELED TOO HYBRID

32
• MEGHANEM OWEISBIOGRAPHY
Ghanem Oweis is an associate professor of mechanical engineering (ME) at the American University of Beirut. He teaches graduate and undergraduate courses in the topical area of fluid mechanics and thermal sciences. He has published peer reviewed articles on turbulent flows, cavitation bubble dynamics, and biomedical fluid dynamics. His current research encompasses quantitative flow visualization of fundamental and biological flows; and the development of laser assisted optical imaging diagnostics for hyperthermia therapies including radio frequency catheter ablation for heart arrhythmias and high intensity focused ultrasound destruction of cancerous tumors.
Dr Oweis collaborates with AUBMC researchers in these areas. Dr Oweis received his PhD, MSc, and BSc degrees in ME from the universities of Michigan, Leeds, and Jordan, respectively. s efforts to promote renewable energy in Lebanon by the third Beirut Energy Forum in 2012. He received the Abdul Hamid Hallab REP Service Excellence Award in 2011, and was decorated with the medal of the Lebanese Electric Utility in 2007.

33
ABSTRACT
Mankind has always been intrigued and fascinated by how waters and winds flow, and has often sought to tame their powers. To do so it was necessary to understand their behavior and motion, as Leonardo DaVinci once noted.
Fast forward to the latter years of the 20th century, the affordability of coherent laser light sources, digital cameras, and computational power made this once vague task attainable through the techniques of flow visualization; and thus making the invisible visible.
In this talk, work on flow visualization in the Experimental Fluids Laboratory at AUB will be highlighted, and examples presented on applications including hemodynamics and biological fluid dynamics.
WHEN FLOW MEETS LIGHT
SYSTEMS & DATA ANALYSIS

34
MOUEEN K. SALAMEH• IEM
DESIGN & CONCEPTUALIZATION
BIOGRAPHY
Moueen K. Salameh is a professor of engineering management and industrial engineering at the American University of Beirut. He is currently the University Registrar and Professor in the Engineering Management Graduate Program. He received his Ph.D. in Industrial Engineering and Operations Research from Virginia Polytechnic Institute and State University, Blacksburg, VA. His research interests cover areas in production planning, inventory control, project management, scheduling and sequencing, and systems analysis and optimization.
Dr. Salameh is a member of INFORMS and IIE. He has published several articles in numerous international journals such as Production Planning and Control, International Journal of Production Economics, IEE transactions, Production and Inventory Management, and Applied Mathematical Modeling.

35
Most universities are faced with the problem of scheduling of exams at the end of each semester. In this presentation we solve the problem by using a partitioning algorithm based on graph coloring to generate disjoint non-conflicting time slots. The work is extended to meeting students’ preferences of not having more than two exams in a single examination day. A Microsoft ExcelTM Visual BasicTM program is developed and samples of real examinations scheduling records are presented.
Final examinations in all courses are given during the assigned examination period at the end of each semester. At AUB, the final examinations schedule (date, time, and examination place) are prepared by the Registrar’s Office and posted at the Web after the Add/Drop period.
A GRAPH THEORY APPROACH TO FACILITATE SCHEDULING OF FINAL EXAMINATIONS
ABSTRACT

36

37
DEPARTMENT OF ARCHITECTURE AND DESIGN

38

39
CONTENTARCHITECTURE AND GRAPHIC DESIGN
40 Fayssal YatimReconstructing Karbala
45 Yasmine AtouiRewriting Beirut with a Pervasive Game

40
Reconstructing Karbala Fayssal Yatim | FEA Conference
Introduction
Initial Interest –Ashoura as a Spectacle
Muharram, the first month of the Islamic year, marks the anniversary of the Battle of Karbala, when Imam Hussein, the grandson of Prophet Muhammed was killed with his family members and companions.
This Anniversary is commemorated every year by Shia Muslims through recounting the narrative in a 10-day event. The commemoration is resumed after 40 days where people perform a pilgrimage to the shrine of Imam Hussein in the city of Karbala.
Poetry and narratives play an important role for the Shia communities in the formation of a Civil Society. The narrative often serves to “guide individual behavior, cultural customs, physical structures, as well as collective actions and revolutions”. The myth of Karbala has played an important role in shaping certain rituals which have as a result been used to construct space and place.
Shiite Muslims reenact and remember the events of martyrdom in Karbala in three ways:
1) Dramatic Narration of the life and the suffering of Imam Hussein and his companions.
2) Public procession and self – flagellation.
3) Passion play performance which offers the theatrical representation of Karbala events.
Knowledge of past events is crucial in shaping the Karbala Paradigm in the Shiite memory; it serves the role of continuing this mythology and shaping our historical collective memory. Knowledge of the past informs our memory and as a result it shapes how we experience our present. Memory subsides in the individual and an event can be experienced and remembered in multiple ways. The importance of the role of a commemoration is in the bridge it creates between the individual memory and the collective memory and helps to sustain it through rituals and performance. Memory influences the creation of a ceremony and its form which in turn influences, sustains and affects the memory.
The commemoration of Ashura revolves around the concept of Performance and Performativity. Repetitive movements along with language, in parallel to the nature of body movements creates an unchanged myth, this makes it find its way to our memory. Performance is in the action a person produces, whereas performativity is the repetition of the action until it starts having a meaning or until it defines an individual. In this way performance becomes a form of language that communicates exchange between the performer and the audience.
Without audience, there is no performance and the lines between audience and performance are blurred since the audience can take over the narration and are given power in developing the narrative as it sees fit. The relation of the group to the individual is important to maintain this memory. Groups provide individuals with frameworks in which their memories are located, to provide a mental space, which refers back to material space for the group to occupy.
Framework of Research
My research involved field work investigation. Participating in the event was crucial in understanding by taking part.
My 3 investigations and participations involved
1) Almujtaba Husseinieh at Architectural scale
2) The Final Procession at Urban scale
3) The Shahideyn Cemetery as an intermediate scale
In my paper I will talk about the extracted information from these 3 participations and how the isolation of the elements and dissecting them helps us understand it as a whole.
Understanding Ashoura
Almujtaba Husseinieh
Ashoura as a spectacle or event does not need customized or designed space. It is merely the occupation of space and how performance shapes the space and how the space itself is shaped by the performance.
The experience of Ashoura in the Mujataba Husseinieh allowed the space to be reformed 4 times.
In the commemoration several rituals take place in order to reach the transcendence or enter the parallel time.
The space first occupied is a social space where people gather without any order. It is encapsulated in physical material and the organization of the users is dispersed.
The second space is the prayer space where people are structured in parallel rows and perform the same actions following a leader. The person here becomes encapsulated in the first cloud of isolation.
The third space is the lecture space where poetry is used to narrate the story. People retract to the periphery walls of the physical space and enter the second cloud of isolation. They
The fourth and final space is the flagellation space where people are organized in a structure and are in a state of trance and enter the third cloud of isolation. Here people transcend and exit the physical space and enter the mental space. The individual is either in the plains of Karbala fighting with Hussein or is in another space or narrative that reflects a personal memory. Both real time and mythic time start to weave into each other and the separation is unclear.

41
As the diagrams suggest, the plan, height and shape of the space affect the shape the ritual itself takes. The behavior of people is assigned to the elements of the space. For example, the wall becomes important in becoming the outline where the intensity of crying is increased since the user feels more encapsulated versus and user in the middle of the space.
The Final Procession
The last day of Ashura, which is the tenth day marks the climax of the event. The event is taken from the husseiniehs where the event is hosted in enclosed and scattered spaces across the southern suburbs to the open streets. The whole suburbs are transformed into a commemorative space, which as a result transforms the functions of its elements.
Isolating the elements of the procession, the following were extracted and explored –
1- The street 2- The machinery 3- The users 4- The commercial space 5- The façade/balcony of buildings 6- The buildings
The street and commercial spaces
The street is composed of
1- Pavement 2- Pedestrian Road 3- Driving lane 4- Street divider
Each element plays an important role in the commemoration. The elements become actors within the framework to serve a function. The elements are perceived as architectural conventions. The pavement at +0.2 m hosts certain actors, like the flag/icon seller, the food/water donating.
The pavement under the highway starts to house street vendors and the slight elevation becomes a physical separation between the commercial pavement and the commemorative street.
The streets function is altered where now it becomes inhabited by people instead of cars. The street becomes a place to sit and a place for the procession to take place. The street defines the trajectory and length of the procession as well as how clustered or further apart the people are. People that hold boxes to collect donated money are placed every 20 m.
At +0.1 m, the pedestrian road is occupied by people cooking food but also a place for commercial activity to advertise or expose itself. The road is occupied by food vendors, people consuming drinks and food, and at some locations, shisha. The shops use it as an opportunity to advertise their products either by using their window displays, or by hanging banners across streets and hanging billboards on buildings.
The street vendors become the gateways between the commemorative strip and the commercial strip.
The machinery
The machinery used to produce the event plays an important role in acting as platforms for the commemoration. The machinery used has a relationship to street intersections with main procession road. The street intersections are an opportunity and strategy to place the machinery. Many types of machinery including, scissor platform, truck platform, and cranes are used for different functions. While some are used to host the person narrating, his voice is projected through speakers held by cranes. Roads that are less wide and do not have intersections allow for the scissor platform to be placed. The shooting of the event and the camera man require a certain type of crane as well. Often the speaker/sound confronts the people, only later to see the narrator. The speakers project the sound of the narrator and influences people in a certain location. At some point, the sound is faded, and these become vacuum zones where people are under no influence.
42
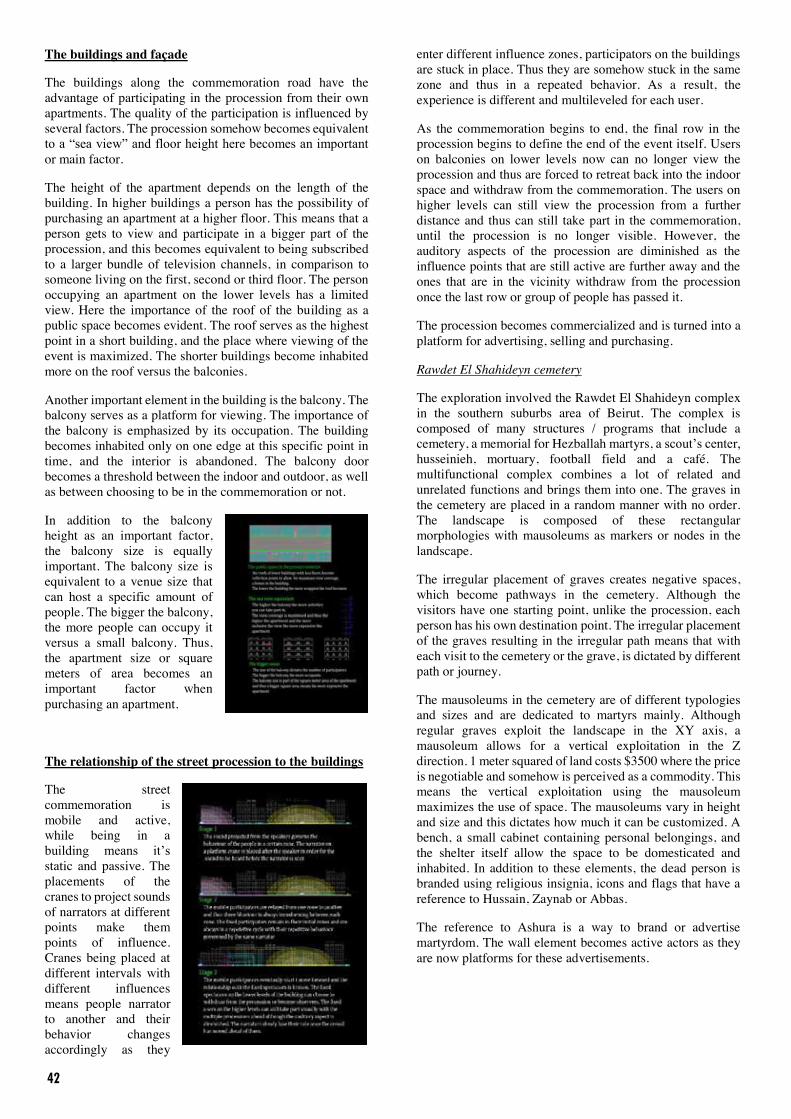
The buildings and façade
The buildings along the commemoration road have the advantage of participating in the procession from their own apartments. The quality of the participation is influenced by several factors. The procession somehow becomes equivalent to a “sea view” and floor height here becomes an important or main factor.
The height of the apartment depends on the length of the building. In higher buildings a person has the possibility of purchasing an apartment at a higher floor. This means that a person gets to view and participate in a bigger part of the procession, and this becomes equivalent to being subscribed to a larger bundle of television channels, in comparison to someone living on the first, second or third floor. The person occupying an apartment on the lower levels has a limited view. Here the importance of the roof of the building as a public space becomes evident. The roof serves as the highest point in a short building, and the place where viewing of the event is maximized. The shorter buildings become inhabited more on the roof versus the balconies.
Another important element in the building is the balcony. The balcony serves as a platform for viewing. The importance of the balcony is emphasized by its occupation. The building becomes inhabited only on one edge at this specific point in time, and the interior is abandoned. The balcony door becomes a threshold between the indoor and outdoor, as well as between choosing to be in the commemoration or not.
In addition to the balcony height as an important factor, the balcony size is equally important. The balcony size is equivalent to a venue size that can host a specific amount of people. The bigger the balcony, the more people can occupy it versus a small balcony. Thus, the apartment size or square meters of area becomes an important factor when purchasing an apartment.
The relationship of the street procession to the buildings
The street commemoration is mobile and active, while being in a building means it’s static and passive. The placements of the cranes to project sounds of narrators at different points make them points of influence. Cranes being placed at different intervals with different influences means people narrator to another and their behavior changes accordingly as they
enter different influence zones, participators on the buildings are stuck in place. Thus they are somehow stuck in the same zone and thus in a repeated behavior. As a result, the experience is different and multileveled for each user.
As the commemoration begins to end, the final row in the procession begins to define the end of the event itself. Users on balconies on lower levels now can no longer view the procession and thus are forced to retreat back into the indoor space and withdraw from the commemoration. The users on higher levels can still view the procession from a further distance and thus can still take part in the commemoration, until the procession is no longer visible. However, the auditory aspects of the procession are diminished as the influence points that are still active are further away and the ones that are in the vicinity withdraw from the procession once the last row or group of people has passed it.
The procession becomes commercialized and is turned into a platform for advertising, selling and purchasing.
Rawdet El Shahideyn cemetery
The exploration involved the Rawdet El Shahideyn complex in the southern suburbs area of Beirut. The complex is composed of many structures / programs that include a cemetery, a memorial for Hezballah martyrs, a scout’s center, husseinieh, mortuary, football field and a café. The multifunctional complex combines a lot of related and unrelated functions and brings them into one. The graves in the cemetery are placed in a random manner with no order. The landscape is composed of these rectangular morphologies with mausoleums as markers or nodes in the landscape.
The irregular placement of graves creates negative spaces, which become pathways in the cemetery. Although the visitors have one starting point, unlike the procession, each person has his own destination point. The irregular placement of the graves resulting in the irregular path means that with each visit to the cemetery or the grave, is dictated by different path or journey.
The mausoleums in the cemetery are of different typologies and sizes and are dedicated to martyrs mainly. Although regular graves exploit the landscape in the XY axis, a mausoleum allows for a vertical exploitation in the Z direction. 1 meter squared of land costs $3500 where the price is negotiable and somehow is perceived as a commodity. This means the vertical exploitation using the mausoleum maximizes the use of space. The mausoleums vary in height and size and this dictates how much it can be customized. A bench, a small cabinet containing personal belongings, and the shelter itself allow the space to be domesticated and inhabited. In addition to these elements, the dead person is branded using religious insignia, icons and flags that have a reference to Hussain, Zaynab or Abbas.
The reference to Ashura is a way to brand or advertise martyrdom. The wall element becomes active actors as they are now platforms for these advertisements.

43
The objects of mourning
Ashoura as an event is produced by objects and the process of their consumption. This event of mourning is consumed in itself by the consumption of certain objects. Elements like the water bottle, tissues, copies of the Quran and Harkous Chicken become the objects involved in this event and sustain it. Printing presses become activated in the mass production of copies of the Quran to be distributed for mourners. Tissue paper becomes an important element, and the purchase of it depends on the quality and price of it and the place of purchase becomes an important factor.
The same applies for the water bottles that are brought depending on the brand. Sometimes the tag is replaced with different tags that have religious connotations and references. This customization allows the product itself to adapt to the event.
Advertising Martyrdom – Martyrdom as a product
Walls of martyrdom in Iran
The Islamic Republic introduced murals on an extensive and organized scale as part of an orchestrated propaganda campaign aimed at asserting the Islamic character of the 1979 Iranian Revolution. The use of murals as a means of state propaganda continued throughout the 1980s and 1990sThe city of Tehran became a platform for branding martyrdom by transforming the exterior walls of building into murals/billboards. Eventually the blind walls became a crucial part in the typology of residential buildings. The architects conceived buildings to allow for these blind walls to be built to maximize certain views strategically to expose the propaganda. This allowed for new opportunities for these murals to take place and extend the propaganda when needed. The blind walls became opportunities for a new political reform and their placement became critical to become a form of advertising as well as creating building typologies. This
also questions how can a building function as a billboard and advertise a certain ideology.
Architectural Thesis Investigation
My thesis attempts to investigate the culture of Ashoura and the perception of martyrdom as a product to be consumed. this consumption is both reinforced by and reinforces our everyday consumerism. the mall becomes the interface which allows the mothers of the martyr orphans to be visited and viewed from a distance through the act of shopping. This unravels the processes of the creation of the martyr before he is turned into a 2D image for advertising.
It is only through martyrdom that the system can sustain itself.
Starting point - The orphanage The program of an orphanage as an education system serves as a pipeline to start of the process of production. It attempts to unravel the process of the creation of the martyr
and his transformation from a human figure to a two-dimensional image; Thus a visual merchandise for branding.
Between what is utopic in the opportunity of an educational system and dystopic in the final martyrdom and the return to the cemetery the Architecture becomes a threshold between both and it serves as the start and the end of the process without knowledge of the in-between.
The commercial mall The commercial mall is a platform for halal shopping, The combination of programs makes shopping an act of piety. Spending money and consuming products funds the orphanage. The orphanage creates the fighter and the eventual martyr. This encourages expenditure and consumerism in the commercial space and thus creates more funds for the orphanage that is now able to sustain itself and produce more martyrs. An ongoing cycle that consumes and feeds into itself.
Conclusion
It is through the juxtaposition of these two seemingly unrelated programs that moments are created that investigate Ashoura as an event that happens in the everyday and shopping is seen as a continuation of procession where shopping serves to transform us from one place to another.

44
The commercial mall and the orphanage run in parallel into each other, but they never meet. A visual connection is established without a physical one. The commercial space serves as a circulation space to view the martyr who inhabits the window shop. It unravels his life in this institution through the act of shopping. The orphan becomes an object placed in a vitrine. A visual merchandise and a merely and object of display.
The Architecture is activated by a plug-in which is the user and is seen as an extension of the procession.

45
Rewriting Beirut with a Pervasive Game Yasmine Atoui | FEA Conference 2017
Abstract The gradual development of media, mobile and wireless communication technologies is changing the way people use cities and inhabit them. It has become necessary for architects and designers to take into consideration that technological developments in mobile communication have extended the mode of living beyond the confine-ness of physical space. The new mode exists in a partial physical, partial virtual space and hence the traditional way of conceiving space is not filtered through that trajectory. After observing the behavior of pervasive gamers in public space, I argue that architecture should be looked at with a new framework as new readings in the virtual are creating new forms of spaces. Those spaces harbor unpredicted and unplanned scenarios that architects should be accounting for in their conceptualization of space. Considering that the virtual is affecting our everyday activities, this thesis aims at understanding how the virtual space can inform and serve physical space. My research is based on understanding the operation and application of pervasive games at the level of the city, taking case of one game, Pokémon Go, which was recently played all over the world and studying its application in Beirut particularly. I will place this case study in the Lefebvrian analysis of production of space in order to project how architects can benefit from it and use it as a tool for urban re-conceptualization. I back-up my arguments through surveys I have done on people who have played pervasive games, by talking to game developers, by playing the game myself and by projecting a series of interruption on the gaming process which would generate architectural potentials. Pervasive Games, like many digital applications available to the general public, have the ability to rewrite our cities by projecting a virtual layer which enhances our understanding of the physical built environment. The additional layer of information creates a space of its own, which can influence architects to conceive a more dynamic typology for public space in between the virtual and the physical space. At the end of this research, I will demonstrate my thesis by proposing my own hybrid architecture project as a potential scenario. Key Words
Virtual | Not physically existing as such but made by software to appear to do so. Immaterial - thoughts, associations, beliefs or ideals that form the actual
Actual | Existing in act or fact, current or present that consists of experiences and sensations.
Digital |Available in electronic form; readable and manipulable by computer.
Augmented Reality | Live direct or indirect view of a physical, real-world environment whose elements are
augmented by computer-generated sensory input such as sound, video, graphics or GPS data
Pervasive Games | A video game where the game experience is extended onto the real world
Introduction
We live in augmented cities where virtual and actual spaces are no longer separate entities but part of a new whole, which shapes a new understanding of the city. Citizens experience and occupy urban public spaces through invisible technologies such as pervasive games. The term pervasive literally means “totally penetrating”, if something is pervasive, it signifies that it is spread through our physical environment. The citizens have access to digital information and acquire a new skill of digital navigation from almost any location, which suggests that the boundaries between physical space and virtual space are blurred and that the citizen is rewired to think in both spaces very naturally. This indicates how embedded these digital technologies have become and how realistic the functions in them have become. I began my research by thinking about the opportunities that comes with the superimposing the digital layer on the real physical city by looking into immersive and augmented technologies and then focusing on pervasive games which have the ability tap into both realms.
In the first part of my paper, I will introduce pervasive games in the theoretical discourse of the production of space, to understand where the new nature of the combination of physical and digital stands in comparison to what has been said about the production of space.
In the second part, I will analyze the application of the game at the urban scale through a series of maps, then at the citizen scale by drawing upon surveys and understanding game theories.
In the third part, I will look at the challenge that urban designers and architects can face, while dealing with these augmented spaces to finally propose my own design as a potential scenario to approach this changing arena.
Theoretical Framework
Henri Lefebvre, a French Marxist philosopher and sociologist, argues that everyday life was an underdeveloped sector compared to technology and production, and that in the mid-20th century, capitalism changed such that everyday life was to be colonized—turned into a zone of sheer consumption
In today’s context we are spending more and more time in cyberspace, immersed in our virtual realities. This departure raises the issues of the loss and abandonment of physical space. Places of interaction and gathering have now relocated themselves into instruments like cell phones and computers. As technology develops new ways of emergence into the digital, there is a disappearance of the use of physical spaces which have been re-appropriated into the digital. The demand for information spaces, such as office cubicles, libraries, cultural centers, classrooms are diminishing because access to information can be done through a small device. Devices which enable information disrupt physical space but also affect how people pay attention to these

46
spaces. In order to understand a space, I refer back to Lefebvre’s understanding of a space. In The Production of Space (1991), Henri Lefebvre addresses how spaces are socially produced. His analysis permits an examination of the processes of a place construction, and it gives as much importance to activities in the representational and symbolic realm as much as to material activities. . Lefebvre attributes three levels of the construction of space: physical, mental and social of the same space. “The form corresponds approximately to the moment of communication, hence to the realm of the perceived. The function is carried out, and corresponds to the directly experienced in a representational space. The structure is conceived and implies a representation of space. The whole is located within a spatial practice.”[…] “There is no perfect balance between these moments or “formants “of space. Considering that what appears first will later become mere appearance, the prospect is the other moments will consequently become more “real” in comparison.”
Within this discourse, today’s pervasive gamers have a stronger association and attachment to a space before it even begins to be transformed physically.
Understanding Pervasive Games
Pervasive Games are video games where the fictive virtual experience extends out into and blends with the real world. These games are usually played over the scale of the city and use digital media platforms such as mobile phones, websites and GPS tracking. Examples of such games are Geocaching (2000), BotFighters (2002), Ingress (2012) and most recently Pokémon Go (2016).
What distinguishes them as different to traditional video games types is that they use the real world as their game space. This results in them blurring the boundaries between game and reality. This expanding and blurring of the boundaries of game space creates an ambiguity between game world and non-game world that in turn alters the players’ experience and perception of place, both during and potentially after the game.
Playing a game means acting according to a specific set of rules, objectives and codes of conduct, different to the ones we normally navigate within in our everyday lives. Playing a game therefore requires stepping into a different world; a magic circle. The notion of the magic circle presents games as closed systems: when players join a game they simultaneously enter a sort of contract with this game, agreeing to understand and accept the game world, its rules and its boundaries. In Homo Ludens, Dutch historian socialist Johan Huizinga points out that the boundaries are both physical and temporal; consisting of a physical border such as a chessboard, ring, field, stadium, stage, etc., and temporal border involving a clear beginning and end, which sets the game in a temporary interruption of everyday life. In Pervasive Games, the play area expanded from the board game, or the computer room into the public arena of cities. Pervasive games challenge the magic circle while still allowing the user to be immersed in them. As such, the gamer’s perception of their city is altered, a city is no longer “a relatively large, dense, permanent settlement of heterogeneous individuals” as defined by American sociologist Louis Wirth, but a city becomes a playground, a
game space or a battlefield. Designers can begin to design their architecture from that point on. Knowing that the association of space can become stronger than space itself through digital games, designing merely in the physical space in today’s context will lead to the demise of that space. This becomes an opportunity for designers to extend their expertise and design the entire system for the production of a space.
I will take the case of the most recent virtual game, Pokémon Go, to illustrate user’s changed experience of Beirut. Pokémon Go, launched in the summer of 2016, is played by a large amount of people, in Beirut and around the world. The Application received 15 million downloads globally in the first month of July. When first launched, gamers invaded the streets of their cities to compete and collaborate on catching virtual objects.
Pokémon Go changing the city experience
Pokémon Go Is a free to play augmented reality game, developed by Niantic and the Pokémon Company, and used through mobile devices. Developers wanted gamers to step outside of their game space to push them to explore their cities. Public space is being regenerated by pervasive game users.
It uses the phone’s GPS to place the user in a real-world location allowing him to catch Pokémon. (Figure1)
The game itself places an avatar in an empty neon version of Google Maps, showing the user walking along the streets, through parks and public spaces. As a player moves about, they will eventually encounter a virtual Pokémon via the augmented map. This map creates a new representation of city; the buildings are flattened on the ground level, “Poke-stops”, in the game space, are places you collect Balls that allows you to catch the Pokémons(refill supplies). In real space, they are usually, public spaces, landmarks, statues, public art or well-known spots, represented by a blue Icon on the augmented map. “Gyms” in the game space are places where Pokémon trainers (avatars) battle to claim territory for their team. The teams in the game are blue, red and yellow. If a player wins the gym, it will be inscribed under his gamer name, until someone new comes and beats the battle in your gym. In real space, gyms are also landmarks, well known spots, represented by a red icon.
In relation to Lefebvre’s discourse and in the case of Pokémon Go, an a-priori consciousness is produced about the space. The space exists in the virtual space which is made visible through digital gaming. There is already an association with the space before visiting it. The association is controlled in the virtual space by the game code. The game codes of a Pokemon, a Pokestop or a gym are inscribed in the mental association the gamer has with a space. In order to find the location, the app provides photo clues that require the gamer user to look up and around and match the picture to buildings and monuments. Pokéstops have been placed strategically near places such as public art, distinctive architecture or gathering places. (Figure 2)
Moreover, the experience is altered because, in that space, temporal modulations of rising, falling and evolving happen in the mental space of the user. He experiences “tension”, “release”, “challenge”, “effort”, “uncertainty”, “risk” through the game, the game is able to create these moments while the user is being challenged, to find tactics and tricks to win in the game.

47
In the case of Beirut
To prove the hypothesis that games are reproducing our city experience, I will place the game within the context of Beirut.
With the launch of the game in July 2016, players of all ages, hit the streets of Beirut to play Pokémon Go. Real gamers, who have played the game thoroughly and continue to play it, have found tactics to outsmart the game by drawing a mental map of areas that increases their chances of catching Pokémon’s. They play during the afternoon, when the largest variety of Pokémon’s appear in the augmented map of Beirut, and by immersing themselves into the game and allowing themselves to discover places they were unaware of. The Pokémon Go developers only allow the gamer to see 40 meters from where they are standing through the program. The screen does not give the gamer a top view of the city. This allows the gamer to keep walking until a Pokémon appears on his screen.
As Lefebvre argues, space is a social product that has been used for social control by media, choosing what can be displayed and what should be hidden. As such Pervasive Games seek to critique and to disrupt social norms in order to reclaim the streets from purely commercial interests or as a strategy for urban renewal. Avid gamer, Firas Chamas, would rarely go to the BCD or Beirut Souks, because it is crowded area and there nothing that interests him there. He claims that while playing the game, he noticed that many Pokestops are placed in that region which drew him to go to the Beirut Souks at night times, to play around the Pokestops and find rare Pokemons that are visible only at night. A space that had a negative connotation in this players’ mind became a space he re-appropriated through this leisure practice. The gamer claims and intervenes on the space virtually, which allowed him to construct a space of intimacy during night time exempted from the crowds’ intervention and pushed him away from the entering the space.
Looking at the map of Beirut, most of the city is invaded by the virtual Pokémon’s however; certain areas have recurring visitors because the visibility of Pokémon is more permanent. According to Lebanese game developer, Youhanna Basmaji, the most active areas in relation to the gamers,are sites such as Ain El Mraisseh, Zaytouna Bay, Raouche, Sanayeh, the BCD, Hamra. By active, he suggests areas, where people choose to meet up to play the game together because when forming a team, you are able to trade and work together to gain more points and catch more Pokémons. However, “the most exciting thing about Pokemon Go is that it can make your neighborhood interesting, and you are able to discover spots around you that you would not have possibly known otherwise”1. Moreover, what gamers realize while playing, is that gyms that are located in “unknown” areas become easier for a gamer to claim for a long period of time. Drawing on the surveys at the end of the paper, Player C, admits that Before he played the game, he did not know about three spots on his way back home from school, once he found them, he started going regularly, and stomp upon the people who are there and begin to converse with them. He claimed this “unknown “gym on the way to his house, which allows him to gain coins daily, and therefore level up. The game is able to reveal previous hidden, unknown aspects of the physical
1 Interview with Youhanna Basmaji
spaces and well as the creation of new opportunities for expression and interaction.
Likewise, player E reveals that the game enable spaces of discovery. Gamers can apply tactics learned from the game to their advantage and hack the actual physical infrastructure. “Thanks to the Pokémon Radar, we can know where the some Pokémon’s are; I noticed I usually walk on a Pokémon-free road so I switched to another one which ended up having more Pokémon and being shorter distance!” 2
The game is able to alter a players’ perception of place. When experiencing the city while reading a book or listening through an Ipod, the perception of the city changes due to the immersion of the user in another space. “ people usually look for tactics to avoid social contact”3 A book becomes a mobile medium that helps us to filter our surroundings and produce our own individualized space, though we still “perceive the physical space with other senses, like haptic, olfactory and auditory”4. Likewise, the Ipod acts as an aestheticizing layer, rather than simply ignoring what is around them, users change the way they perceive the space. The city experience is re-appropriated by the users through their desire. Most gamers in Beirut replied that they are too distracted by the Pokémons for them to pay attention to the city because they are immersed in the game. Their perception of the city contradicts Kevin Lynch’s proposal of the 5 elements that define the Image of the city, because the image of a gamer is cut, blurred and augmented. Mental recording of the game is edited through the gamer’s advantage for catching the most Pokemons. The gamer divides the city into two elements, spots that have Pokémons and spots that do not. After playing the game, the memory of an area in inscribed by the Pokémon the gamer caught, which is an image that is associated to a virtual space. In my own experience, driving near Ain el Mrasseh, I begin to imagine the Corniche with the virtual Pokestops that are overlaid on it, ever since I started to play the game.
Looking at these three cases in Beirut, we can withdraw that the city experience is reproduced by the gamer in three forms; the gamer can claim a space virtually that allows him to create a space of his own physically. The gamer is able to discover spaces that are not highlighted in other practices or maps and finally the gamer enables a personalized perception of the city that is inscribed in both virtual and physical spaces. The gamer’s intervention brings new challenges to the urban designers who needs to deal with a user that navigates in a hybrid space in the city existing in between the virtual and physical realms.
The gamer‘s mental map of the city draws two elements; spots that have Pokémon’s and spots that do not. If a gamer has enough experience, he can also draw spots that are easy to claim which are unknown spots in the real city, and spots that everyone can claim which are the existing social hubs in
2 Survey Question 4 Player E 3 Simmel 1903 4 Lynch 1964

48
the city such as Beirut Souks, Ain el Mraisseh, Gemmayze,etc.
After examining the practice of the game on the city, we are able to trace a new map whereby the gamers go to secondary hubs in the city in order to claim spaces to their names. Logically, spaces that are “out of mind” become strategic places for gamers to claim and activate through the game. At this point I realized that these new formed spots could become sites for intervention. However, these spots had to remain places for the gamers to inhabit and explore.
Proposing a pervasive architectural game that responds to the city needs
Pokémon Go has puts forward the gamer’s mental map which highlights landmarks and anti- landmarks. (Figure 3) Their presence is augmented onto the game map as locations; however as an architect I seize this opportunity given by the game to transfer this location into a physical space, or an installation with a function, which can act as a catalyst in the city for a non-active area. Moreover, I aim at understanding the potential of harnessing gaming and its various strategies towards collaboration and building a public space.
The project that I proposing is a game that responds to the two highlighted problems; the lack of public leisure spaces in the city, and the disconnection between citizens and their city. The game acts in both virtual and physical realms. In the virtual realm it connects information navigation tools such as GIS (Geographic information System), Google maps and the codes of my game. In the physical realm it acts as a collaboration platform for citizens, designers, and suppliers to engage into creating a public leisure space in their respective neighborhood. (Figure5)
“X-fields”, combines the power of games such as Pokémon Go, Mine craft and Sims City into one game that is played out in physical for the purpose of creating physical leisure structures. The structure systems fall in between an installation and a building and act in both virtual and real.
The imagined result is an acupuncture of many installations connected through a virtual autonomous structure that works as a pervasive game with the goal of activating and sustaining real public leisure spaces to respond to the problem that Lefebvre suggests in the beginning of the paper, which is the demise of the everyday life, particularly leisure space. I argue that these spaces, bound on their own will not get activated, because as mentioned before, today’s citizens are trapped in virtual amnesia and do not seek the potential of physical space.
My proposal goes against Pokémon Go, yet follows its scheme, whose main goal is to create real public social interaction platforms that are not tied to consumerist models. Potentially, creating a new set of markers that make important consumer markers disappear. Current active leisure spaces in the city are consumer oriented, and they are also being augmented by the existing virtual games which reinforces their role as leisure spaces. By using the power of pervasive gaming, I can activate spaces that are not consumer oriented and create leisure spaces that act as catalysts in dormant parts of the city.
The game, transfers the notion of “claiming a space” found in Pokémon Go into a physical action. In order to do that, I would need to create the new rules. The new game, allows
gamers to claim physical space (empty lots), activate them and sustain them. Instead of catching Pokémons in order to claim a virtual “gym”, the goal of my game is to claim a “real space” by catching real life suppliers and then implementing a series of typologies of spaces, designed by designers’ inventory of spaces. The citizens can choose within the inventory of each site, what it is they would like to build with the help of the suppliers. As such, the game creates a dialogue between these three games into producing the most desired space for their neighborhood. Like Pokémon Go, my new game abides by its own rules, and gives these three types of gamers the opportunity to become positive injections in their city instead of dormant virtual users.
The maps that are generated through GIS allow the Designer Gamers to examine potential public spaces in the city. The designers analyze the site conditions and surroundings through GIS to determine the amenities and services that the neighborhood can offer. Once analyzed, Designer Gamers propose a schematic design of a public space that responds to the needs of the neighborhood, the design is then transferred to the game so Citizens can begin to claim the land. Moreover, after examining the potential of the sites, the designers create an inventory of typologies of spaces that plugged-in depending on the needs and constraints of the site. The designers would need to propose several options for each “type” from which citizens can choose from.
The Supplier Gamers are neighborhood specific. They donate materials and services in exchange of access to the public space that is being activated. By doing so, they can use the game as a visibility platform to display their work and engage with citizens.
The Citizen Gamers chooses one of the three teams, finds a potential public space, claim it through the game and begin to try to implement the spaces from the site specific inventory set by The Designer Gamers. They do so, by catching the Supplier gamers’ services which are available to the gamers within a certain time frame.
Altogether, and for the sake of speeding up game in order to gain points for their respective teams, all types of games can submit relevant information about the site to the virtual cloud of the game, so that the “assigned” designers can access them and have ideas to look into and create options in the inventory of spaces. (Figure 5). These augmented reality tools such as GIS Data analysis, or simply drone photography, are quickly being integrated into education systems in Lebanon n and made available for the general public. Nonetheless, for those who do not have access to such technologies, can still be included in gameplay, as traditional mapping techniques and interviewing are still the most useful tools which come into analyzing a site.
The intent of this game is to create architecture of meaning. When the gamers are involved in the production of a built environment through a fun game, their association with it becomes much stronger and they gain a sense of ownership and belonging. With collaboration and play, the relationship of a gamer to his city becomes stronger.
In the physical realm, the architectural objects created, act as a meeting points for their respective neighborhoods, they could potentially act as unifiers of the sectarian geography of the city. Because these objects are tied to a game and not

49
a “person with an interest” they have a neutral, generic identity which is shaped by the surrounding communities.
The structure is a form of cloud scaffold that has an edgeless, permeable shape, which is built through phases by the community. (The three types of Gamers)
It defines a space, yet has no distinct boundary formed between the interior and the city. The structure is a set of modules, created by materials that are found, specifically in each site. The size of the cloud increases or decreases depending on the game play. The programs inserted are site specific and respond to the needs of the neighborhood. As general form the needs fall into 5 categories: Cultural, Environmental, Social, Educational and General Public Amenities.
For my design proposal, I play out the game on existing sites in Beirut with potential scenarios. I go in depth into designing one scenario on Damascus Road to demonstrate the potential and limits of the game that I am putting forward.
In the case that I chose which is located on Damascus road; the plot is an empty lot with vegetation that has grown out from the debris of the war. It is a plot that is exactly between Ras el Nabaa and Sodeco and its interesting feature is that the Jewish cemetery that is located in front of the site has created an opening in the sky in the middle of the dense urban fabric. The next step for the designers in this case, only me, has to acknowledge the features, draw upon surveys in the surrounding neighborhoods in order to assess what the community needs but also what can it provide. Given the modularity of the projects, the programs that come from this analysis are : the plaza, the stage, the library, the watchtower and the park. These characters have to be placed in the “Damascus Road Site” inventory of possible spaces and different “types” should be proposed for the community to choose from. The plug-ins are based on a constructional and functional logic determined by the three actors of the game. The size and the possibilities of their plug-ins grow as they level up in the game. The temporary structure could become permanent depending on how well the gamers sustain the public space created. The gamers are the initiators of this production process however the game encourages the community to be involved and play, for them to start appropriating the clouds as extension of their homes.
As such, Small empty lands in the middle of neighborhoods have the potential to become active public leisure spaces that connects the community together. The outcome generates new social pockets in the city that are connected through this game, which changes the urban semiotics of the city.
Conclusion
Designing today’s spaces means taking into consideration the extensions technology offers. Architects and designers should re-imagine how buildings can start to perform in both physical and virtual space, in order for buildings and landscapes to regain physical purpose. Pervasive Games have the ability to stitch back lost connections the inhabitant have with their city. I am proposing a pervasive architecture which plays out on physical empty lots yet its rules and construction is connected through a virtual cloud.
Within the past decade we have acquired new skills of navigating through information. Online platforms facilitate
research and collaborations which suggest that productivity’s shortest path does not have to follow a control command path, rather online collaboration have enhanced our productivity in new forms. Architecture can make use of this phenomenon. The aim of this paper is to promote the possibility of rewiring the very organization of Architecture. I choose pervasive gaming because I believe games have the great ability of motivating and challenging users. They assert simple sets of rules and structures yet they permit an aleatory process to unfold which does not have to be associated to an end goal but suggests play and the creation of “meaning”.

50
References
Primary Sources:
Lefebvre, Henri. The Production of Space. Oxford, OX, UK: Blackwell, 1991. Print
Lynch, Kevin. The Image of the City. Cambridge, MA: MIT, 1960. Print
Simmel, Georg. The metropolis and mental life. The Urban Sociology Reader 23–31. 1903. Print
Wirth, L. (n.d.). Urbanism as a way of life. Indianapolis, IN: Bobbs-Merrill. (1939). n.d.
Critical Literature
Aurigi, A and F D. Cindio. (2008). Augmented urban spaces: Articulating the physical and electronic city. Aldershot, Hampshire, England: Ashgate, n.d..
Borries, . and S alz. P., B ttger, M., Davidson, D., Kelley, H., K cklich, . . Space time play: n.p., n.d..
Luciano Frizzera ,(2015) Mobile Media as New Forms of Spatialization, Interdisciplinary Science Reviews
Silva, Adriana de Souzae, and JordanFrith. 2012. Mobile interfaces in public spaces: n.p., n.d.
Wilkie, Robert. The Digital Condition: Class and Culture in the Information Network. New York: Fordham UP, 2011. Print.
Additional Research
Koolhaas, R. (1995). Generic city. Sassenheim: Sikkens Foundation.
Illustrations
Figure1: Pokemon Go Augmented Map (40m from standing point)
Figure 2 : Poke stops and Gyms in the Beirut
Figure 3: Primary and secondary virtual hubs Gamer’s mental map )

51
Figure 4: low Chart explaining my new game “X-fields” which involves citizens and designers into creating public spaces
Figure 5 : Example of an inventory of types of spaces designed by the designer gamers, that fit in a given site from which citizens can begin “wining” and choosing depending on the level they have attained.

52
Survey: How Pokémon Go rewriting your city I drew a survey of 10 questions, asking Pokémon Go players on the Lebanese Pokémon Go forum to understand their goals while playing the game and if their relationship with their cities has changed. I have selected the answers of 5 different types of players. Q1: How often do you play Pokémon Go? What time of the day would that usually be? A: Whenever I go down to the city. Mostly PM B: I’d say i play it often because I usually play it whenever I leave home and I'm on my way to anything. C: Daily,i play it at about 4:30pm D: Not usually, while I’m driving E: Everyday, usually played in intervals not continuously Q2: Do you play while “on the way to something” or do you fix a certain time to play and find yourself exploring and getting lost? A: Usually on the way to places. There has been a few times where I went to a new place solely for the sake of finding out what Pokémon will I find there and to explore the area B: Mostly on the way to something. C: I play it while I’m on my way to something and after i come back from school every day i always go to the same 3 spots and search for Pokémon’s D: On the way to something E: On my way to something Q3: What is the purpose of playing the game? A: Just like any other game. As well as the new way of gaming it offers, and the joy of playing it with others of the same team (3-4 people usually) B: Just like the purpose of everything a human comes up, to keep our minds away from death and that our lives are going to end soon. Short answer: Certain amount of Pokémon’s that I want to catch before I quit. C: I like playing every Pokémon game and this game made me lose weight just by walking and having fun D: Catch them all E: Fun Q4: Describe interesting cases of re-routing your routine walk because of the game A: Not necessarily a change of route, but definitely choosing to go to places that have poke stops around them or high Pokémon spawns. B: Everyday especially that I like to walk long distances to hatch eggs. C: Before i played the game i didn’t know about the 3 spots that i always go to,i found them by accident while playing the game D: I would sometimes base my walk on finding Pokémon, so walk longer distances then i should on the way to something E: thanks to the Pokémon Radar, we can know where the some Pokémon’s are, I noticed I usually walk on a Pokémon-free road so I switched to another one which ended up having more Pokémon and being shorter distance! Q5: Have you ever found yourself in a place you were unfamiliar with that captivated your attention ( an old church, a cemetery, a garden) did you stop for a moment to discover it or were you too distracted by the Pokémon’s? A: I have, some of them in Bekaa. Some in Zahle and Beirut. I never have noticed some of them and it was interesting to read about it for the first time on a poke stop. B: Because I live in Abu Dhabi, we don't have as much interesting places. (Too distracted) C: No, because after the first or second week i stopped exploring new places, I just go to places that i know. Spot 1:A small park where there are a lot of statues and people can sit there, every statue is a pokestop,a lot of
Pokémon Go players go there Spot 2:On my way to the park there's a road where i can see Beirut, the airport and the sea from it Spot 3:Next to my house there's a spot where a Pokémon spawns every 5 minutes so i go there I always find people playing Pokémon Go in the park, sometimes i talk to some people there about the game but i usually play the game alone D: Too distracted by Pokémon’s E: Yes, usually captivates my attention Q6: Do you think Pokémon go is distracting you from enjoying the city or is it making you understand it better? A:. Neither. I think it might be a little bit useful for those who don't know the city that well. B: Deep question. It's just like any other game, distracts you from doing better things C: Pokémon Go is definitely making me understand the city better, because before i started playing the game i never thought about going to any place that I don’t know in my city D: Neither, when I play it I’m looking for Pokémon, when I’m not i enjoy the city E: It depends, if you are an obsessive player then yeah it would be distracting because you would be only focusing on your phone but if you are curious to know more about the city then it's pretty helpful Q7: Have you ever gotten in trouble while catching Pokémon’s? If yes, describe situation A: No. B: Almost, I was working in a military base and it's not allowed to have a camera phone there but I sneaked it there and was almost caught by the army. C: no, I usually play it with my friends on the weekends D: no E: No Q8: Did you find yourself purchasing items from stores after finding poke stops nearby? A: Yes B: I prefer to hang out in places that have poke stops. C: no D: A couple of times E: If I like what the store has then yes Q9: Did you enjoy playing Pokémon in certain cities more than others? Elaborate. A: Yes. Beirut is better than zahle. Zahle is the best place to play in Bekaa. B: I’ve only played it in one city. C: Yes, I enjoy the game in Beirut more than anywhere else because there are a lot more Pokémon’s and poke stops D: Barcelona contains a lot more poke stops then Beirut, which makes the game easier, the walkability is better in Barcelona as well E: I enjoyed playing Pokémon in Toronto more than in Beirut because there are much more poke stops and also you get to walk around. In Beirut it was usually too hot to go outside during the summer.
Q10: What would you change in the game experience? A: The ability to see other players on the game who are nearby and walk up to them although it might be a bit dangerous but still cool. B: Nothing. C: I would make the game less "pay to win" because everything important in the game i can only get it by real money D: to be able to fight with trainers, trade with trainers E: Nothing

53
DEPARTMENT OF CIVIL AND ENVIRONMENTAL ENGINEERING

54
56 Elias Hawa, Alessio Zogheib, Rawad Nasrany, Karim Ounsi, Rawad Mallak A Comparison Between Traditional, Location-Based and Artificial Intelligence Planning and Scheduling Methods in Construction
63 Sara Alameddine, Ruba Bizri, Sawssan Boubess, Tony Sakr, Waseem Zakharia
A Sustainable Master-Plan of Quarry Rehabilitation
71 Ahmad Hazimeh, Karim Rahhal, Bassel Ajami, Mustafa El Noamani, Mustafa Ruzz
Adding a Floor to the Municipality of Burj El-Chemali
79 Boulos Habiby, Ali El Hajj, Freddy El Khoury, Elie Kareh, Roy KazziAgricultural Center in Rural South Lebanon
83 Noor Al Hoda Saleh, Samir Sari Ad Din, Ali Zalghout, Ahmad El Khatib, Kamel Saleh
An Experimental and Numerical Study of Hydronic Asphalt Pavement Systems
91 Jessy Abdelnour, Mazen Al Abed, Carl Rawadi, Riad El Soufi, Marie-jeanne Sleiman
Applying Sustainability and Retrofitting FEA Buildings
99 Rany Abbas, Mohammed Abdul Nabi, Ali Karaki, Bassam Ramadan, Farah Said
Blast Proofing the College Hall in the American University of Beirut
105 Omar Al Ghaly, Rami Nassar, Mahmoud Kobeissi, Camille Hoyek, Rida KlinkBuilding an Offshore Petroleum Rig in Lebanon
113 Ibrahim Itani, Tarek Itani, Issam El Baba, Abdul Rahman Dankar, Tarek Khayat Enhancing Municipal Capacities Using a Geographic Information System
121 Michel Nseir, Mario El Feghali, Michel El Boustany, Majed Sader, Marc Hachem
Implementation of a Light Rail System in the Beirut Area
129 Kamal Nakouzi, Fares Lattouf, Nada Khraich, Ahmad Merhebi, Reina El Mustapha
Karantina Master Development Plan: A Pragmatic Approach Towards Area Regeneration
CONTENTCIVIL AND ENVIRONMENTAL ENGINEERING, CONSTRUCTION ENGINEERING

55
137 Nicolas El Marj, Tarek Gebran, Serge Karam, Christian Lahoud, Chaoul Saber
Rehabilitation and Management of Sebaali Quarry in Metn Region
143 Ghia El Rifai, Rania Ghalayini, Mostafa Kabalan, Riwa Kanaan, Jihan Salem
Revitalization of an Existing Community in Lebanon
151 Dania Ammar, Yara Kharoubi, Batoul Shoukini, Nadine Fouani, Laura Ezzedine
Scientific Assessment of Advanced Modular Construction in Lebanon: A Case Study of ABC Verdun
159 Haisam Daouk, Anas Kaddoura, Walid Alaiwan, Nizar El Hakim, Abdul Salam Saad
Seismic Vulnerability and Risk Assessment of AUBMC and Its Peripheries
167 Ziad Taktouk, Chaouki El Rassi, Robert Karam, Jad ChaptiniSelf-Sufficient Sustainable Remote Penitentiary Compound
171 Mohamad Mahdi Hallal, Alaa Itani, Rawan Ramadan, Nada Jammal, Samia Zein
Sustainable Earth Structures for Displaced Populations
177 Sumaya Nsair, Amenah Chehadi, Marwa Sinno, Leen Tabbara, Mohammad Salam
The Well Being of Syrian Students in Refugee School Systems
184 Zeina Baydoun, Joud Yassine, Mariam Yammine, Marcelle Haddad, Alehandro El Khoury
Training Center for Crisis Management
192 Kareem Oueidat, Nader Shaer, Mohamad Toukan, Nazih Kassem, Mohmad Itani
Vertical Farming

56
A Comparison Between Traditional, Location-Based, and Artificial Intelligence Planning and Scheduling
Methods in Construction
Elias Hawa Rawad Mallak Rawad Nasrany Karim Ounsi Alessio Zogheib Department of Civil and Environmental Engineering
American University of Beirut P.O.Box 11-0236 / Riad El-Solh / Beirut 1107 2020 - Lebanon
[email protected] [email protected] [email protected] [email protected] [email protected]
Abstract-
outcome on the project. Nonetheless, multiple planning methods have been developed to improve the effect a planner has on the project. These methods are still unknown to the construction industry in the region. The aim of this project is to study the evolution of planning methods and how the implementation of artificial intelligence reduces of unnecessary wastes, costs and delays during the construction phase of the project. These methods allow planners to develop numerous schedules that enhance their role. The goal will be achieved by considering a tower in Beirut, modelling it and analysing it based on given architectural and structural plans. Then, the construction phase will be planned and scheduled using three different methods: Critical Path Method (CPM), Location-Based Management System (LBMS) and Artificial Intelligence in planning (AI). Based on the results, the importance of Artificial Intelligence will be discussed and how it is superior to current methods.
I. INTRODUCTION
During the past fifteen years, two industries have been growing exponentially: construction and computer science.
In 2013, around 8.2 trillion USD were spent on construction works worldwide. This number is expected to reach 11 trillion USD by 2020 [1]. Most of this cost is due to the long duration of the planning phase. This results in little time for planners to iterate and improve their work. Thus, all improvements are made during the construction phase yielding in rework, increased costs, and delays. The planner spends several weeks working to finish one schedule, which is one of millions of permutations of different schedules that could have been followed. However, due to lack of time the planner may be able to iterate once or twice. Thus, all improvements are implemented during the construction phase often yielding poor quality, rework, large buffers, increased costs, and delays (waste). This certainly highlights the importance of enhancing the management and planning of construction works. The evolution in the technological sector and software has helped in the construction management process. Developers have been capable of providing engineers and contractors with tools that allow better organization of their work and reduction of different types of wastes.
The main problem with the traditional method is that it is labor intensive. Planners spend most of the time gathering data and information and doing necessary calculations for
production rates and durations. This leaves them with little time to observe various schedule permutation and end up choosing one of many alternatives, which may not fulfill all their requirements. With location-based management, planners have to do similar activities, while they aim at continuous flow of resources to reduce buffers and clashes. Through artificial intelligence, planners become the thinkers they should be. With the software executing data collection, calculations, and trivial analysis, the engineer will have the time to observe several outcomes and decide on the schedule that best suits the needs of the project.
The following parts of the document consist of four main sections. First, the literature review will shed the light on the management. Second, the data and results will be presented followed by a discussion in order to compare the different methods and software.
Last, a conclusion will wrap up the study and determine the impact the different planning methods have on the construction field and which software provides the best outcome.
II. LITERATURE REVIEW
The history of scheduling goes back almost sixty years. However, different moments in history have marked the scheduling industry and allowed it to improve towards better results in cost savings and delays. In this part of the article, the different theories that have marked the construction scheduling industry will be thoroughly introduced and explained. The disadvantages of each theory will also be briefly discussed in order to show the reason behind construction projects.
A. Critical Path Method (CPM) Theory Morgan A. Walker and James K. Kelley, Jr. are considered
as the originators of the CPM theory including
[2]. Later, more research was conducted in the hope of
developing the theory. This resulted in the following definition in 2003, ne what we are talking about when we use the term CPM: If we have created a network that contains a sequence of interdependent activities, each having a scope and a duration and if we are then able to calculate early and late

57
dates by means of a forward and backward pass then we will
The CPM theory is currently the most extensively used in the construction industry. However, it can be seen in Fig.1 that since 2000, construction projects in the UK have been late on delivery with a peak of 58% in 2007 [4]. This leads to question the CPM theory as the best for the planning of construction projects.
Figure 1: Percentage Delay of Projects Throughout the Years in the UK
(Source: The KPI Team, 2015)
B. Location Based Management System (LBMS) Theory Activity based planning and scheduling had dominated the
construction management market until location based management system appeared and encountered the limitations of Critical Path Method.
The term location-based was adopted to describe a planning methodology that models the activities occurring in multiple locations [5]. It makes use of work breakdown structure based
limitations on a micro basis. In addition, LBMS engages the
assuming that the resources drive the workflow. The graphic representation of LBMS includes an improved version of CPM
tion can rarely be seen as a continuous repetitive construction process, but rather as a series of physical locations in which work of variable type a
The visualization of task location and crew production rate allows minimizing the number of starts and stops of work, titling LBMS as an error proof and control tool in construction. However, planners using LBMS in construction rely on previous experience and early expectations to present long-term planning and promises. It is important to note that the main deficiencies in CPM and LBMS are the lack of standardization of processes and inappropriate look ahead practices.
C. Artificial intelligence (AI) Any software used in planning today follows a path that is
set by its user. This means that the user develops a plan for the construction process according to his experience and limited knowledge in planning. VICO, a software introduced by Olli Seppänen, improved the planning process by allowing the user to set/change one parameter. The software is a 5D BIM construction software, which means that it enables the user to visualize a 3D BIM model, while visualizing the progression of a construction process (4D- time) and maintaining the cost of the concerned project below assigned budget (5D- cost). However, the Lebanese engineer Dr. René Morkos cleverly modified this model to consider the whole process parametric. This means that every single item in the process is introduced
as a parameter that may be changed (e.g. crew number, productivity, etc.). The software is the world's first automated Building Information Model (BIM) to optimize construction and schedule industrial solutions capable of generating thousands of viable scheduling options at the push of a button, while respecting the constraints known by engineers [6].
Finally, note that the major theory that current AI practices rely on is the Tri-Constraint Method (TCM). This method revolves around a computerized construction scheduling method capable of resolving precedence, discrete, and disjunctive constraints. Meaning, the software is able to provide tens of feasible schedules while maximizing special utilization, eliminating special clashes, and restricting the schedules to boundaries set by prerequisites, spatial limitations, and resource availability [7].
D. Comparison of the three methods via software The software illustrating each of the methods described
above are respectively: Primavera, VICO and the AI software. It is important to mention here that each software is oriented and designed differently. Primavera is activity-based, VICO is location based and the AI software is element based.
III. DATA AND RESULTS
This section describes how the tower was modeled, its structural analysis and its results with the design of certain members. Add to that, the scheduling process and the different results based on the different software will be discussed. It is important to note that the study will be limited to the scheduling of the structural phase of the project only.
A. REVIT In order to compare the three different planning techniques,
the Nahr-Project, Beirut, Lebanon - commercial building- contracted by MAN Enterprise was chosen. The 20-story building is divided into 3 different facilities: parking spaces stretching from the third basement up until the second floor, excluding the ground and mezzanine floors, the third until the tenth floor are offices with varying floor areas, and the rest is residential.
Using Revit for Structure 2015, the project was modeled in order to be linked to both VICO Office and the AI software for scheduling purposes. The model had to cater to the requirements of the software whereby elements had to be connected the way they would be constructed. All vertical elements were attached to the horizontal limit bounding their base and top. For example, all columns were attached to the bottom of the upper slabs or beams. Moreover, the tower was divided into various zones based on the concrete pouring areas. The third basement is divided into five zones. Basements two up to the mezzanine into four zones, floors one to six into three, floor seven to ten into two zones and finally the remaining floors into one zone.
The main advantage in using Revit comes with its application to the AI software. The parametric modeling allowed the software to differentiate between elements (i.e., slabs, beams, columns) while analyzing the model for scheduling purposes. The fact that the model is in 3D helps it

58
identify the vertical elements from the horizontal ones. In addition, Revit calculated the BOQ directly in the software. Thus, the AI software used this BOQ in order to calculate durations for different activities in the schedule. Fig. 2 represents the modeled building.
Figure 2: Nahr-Beirut Tower 3-D Model
B. Primavera P6 Primavera P6 is currently the most used construction
software in the contracting world. P6 uses inputs that include activity names, durations, relationships, resources, budgeted labor hours, in addition to a detailed WBS (work breakdown structure) that specifies the location of each activity (i.e., floor, zone). It uses the critical path method to calculate durations and floats of different activities. Primavera evolved in the past years and now features a range of software that tackles the different fields of project control. By using the estimates provided by MAN enterprise, a P6 schedule was generated that describes the construction process of the structure of the building including the following set of activities that represents the construction of the concrete structure: Concrete Casting for Foundation, Concrete Casting Slab, Concrete Casting to Core wall, Curing & Strike Shutter, Embedded Works to Core Wall, F/R Slab, F/R to Core wall, F/R/C Columns & Walls, F/R/C Retaining Walls, MEP embedded works in Raft, MEP embedment in Slab, Pulling Cables & Strands and Water Proofing. In addition, the schedule takes into consideration the list of predecessors and relationships listed in (Table 3-Appendix).
Primavera Results The results of the schedule presented in Fig. 3 are
summarized as follows: Number of activities: 476 Total duration: 510 days Number of critical activities: 117 Critical path description:
F/R/C Columns & Walls F/R Slab Concrete Casting Slab
MEP embedment in Slab
Figure 3: Gantt Chart of The Project Generated Using Primavera
These results can be considered logical although hard to
achieve given the size of the project and the multiple challenges associated with it. First, weather can cause many delays to the project, and productivity tends to decrease during winter. This would surely add a few weeks to the schedule. In addition to this, the productivity rates are estimated based on previous projects, which might be different. The challenges have to be addressed by constantly updating the schedule and comparing it to the actual work in order to better estimate the remaining activities.
Although Primavera is the most used scheduling software, it remains challenging to follow the schedule. This is due to the inability to see clashes between different trades, or detect and use the hidden floats in the schedule.
C. VICO Office As mentioned previously, VICO software allows the planner
to tackle the project from a location-based scope. Engineers divide the project into zones in which activities are repetitive. This division enables them to identify locations of clash between different trades and activities; as well as, locations with discontinuous flow of work. The strength of this method is in managing the flow of trades and assuring that no two activities occur in the same location at the same time and detecting zones of buffer (time or work).
VICO Office is a 5-D software and is composed of eight modules in one dashboard. It enables the user to link all the managerial aspects of project together. Any change in the model yields in a direct alteration of the quantities, schedule, cost, etc. In order to perform the required scheduling, the software user has to follow specific steps. First, the BIM-model is published from the respective software to VICO Office. Then, the Bill of Quantities is generated based on the different elements of the model and tasks. Later, the model is broken down into the locations of work. Then, a task list is generated to which respective quantities are linked and production rates are assigned. The whole data is linked to the scheduler. Finally, relationships and logics between the

59
different tasks are added to the scheduler and both the Gantt chart and line-of-balance (Flowline) graph are generated. These steps were followed for this model as it was published from Revit to VICO in which the different structural elements were assigned the quantities and costs. The location breakdown was performed based on the zones previously defined. Finally, the task list was generated with activities similar to the ones used in Primavera.
VICO Results According to the schedule generated by VICO (Fig. 4), the
duration of the project is 620 days meaning one hundred ten days longer than that generated by Primavera.
Figure 4: Flowline Graph for the Project Generated Using VICO
These findings are interesting as they comply with the
location-based method. First, the staggered form of the flowline is due to the fact that structural activities are sequential and construction of a floor is dependent on the casting of the slab of the previous floor. However, among zones of the same floor one can clearly identify continuous workflow per activity. Another important aspect that one can detect in the flowline view is that no two activities are working in the same zone at the same time. This yields a reduced potential of clash and reduction of productivity due to waiting for the different crews to finish. This fact is the main reason behind having a duration in this case greater than that resulting from Primavera. In the latter, the planner has difficulty in checking where the crews exactly are working and whether they are clashing or not. This results in clashes on site and delays. In the case of location based management, planners have the upper hand as their work is proactive. They know where different crews are working and can check areas where waste is generated (buffer of work or time). Thus, they try to eliminate these wastes as much as possible to reduce the duration of work within a zone and ultimately the whole project.
Consider the case of the raft as an example to explain how waste can be detected and lessened. Fig. 5 presents a selection of the raft activities. The activities are sequenced from left to right: Waterproofing Raft (Green), Formwork Raft (Black), Rebar Raft (Fuchsia), MEP Embedment to Raft (Light Blue), Concrete Casting of Raft (Yellow).
Figure 5: Flowline View of Tasks in Raft
For an optimal workflow, the lines presented Fig.5 should
all be parallel in order for the work to be continuous between the different activities in the different zones while buffers are minimal (one-piece flow). In this case, we can see two types of buffers: the first between the green and black lines (as well as the blue and yellow) the second between the black and fuchsia lines. This buffer is identified by the lag between either the starts or the finishes of two consecutive activities (Red triangles in Fig. 5). It is generated by the fact that the consecutive activities are at different paces (one is faster than the other). Hence, planners can decide on whether the production rates of certain activities should be increased by involving more crews or leveling the resources in an attempt to make the lines as parallel as possible. In brief, this ability to check the workflow between locations and the interaction of different trades is the edge that LBMS implying VICO has over CPM implying Primavera.
D. AI Software Artificial Intelligence Construction Engineering is the first
software of its kind. It introduces artificial intelligence for the first time in the construction management sector mainly in planning and scheduling. The software is still in its BETA version and lacks several features. It is an evolution of previous software as it takes the same boundaries into consideration with optimized algorithms while introducing newer ones. Moreover, the scheduling phase is based on elements. Once the model is linked to the software the different elements are identified and joined to the way they will be constructed. This implies that the user should no longer provide logical links as the software links columns to slabs and beams to slabs on its own. Nonetheless, for this to happen, the project should be modeled at high levels of details where elements should not overlap and should be clearly attached.
R the software. The former is split based on the different elements (e.g., slabs, columns, beams, etc.) and the following data for each element should be indicated:
Duration/Production rate Number of crews Number of workers per crew Duration of activity per crew Labor cost per hour Workweek of crews Material used Unit cost of material

60
After inputting both the model and the Recipe, the software works on creating multiple schedules by iterating the number of working crews per element thus reducing the time required to finish a task.
AI Software Results The software was able to generate approximately thirty-five
schedules with the shortest during of about 780 days. Each of them corresponds to a different project schedule yielding in a different cost or duration. It is important to note that all of the schedules were generated by the same base parameters and iteration of the number of crews which the software performs based on an algorithm.
The results seem to be a bit problematic and this is due to
the fact that some software features are still under development. First, the AI software is still in its beta version; which means that the main advantage of using AI, which is its self-learning capability, is not available since only a few projects have been completed using it. Second, as explained by the engineers of the AI software, multiple calibrations to the model and to the parameters inputted in it are a must in order to achieve more accurate results. Unlike different software where calibrations take several days, calibrations in it are performed in less than an hour.
Moreover, further calibration will reduce the whole duration of the project by enhancing relationships and construction sequences. Add to that, the software also detects a crew saturation limit above which adding more crews will only result in additional cost and will not reduce the duration.
With the new results, the shortest schedule generated by the AI software would fit between that generated by Primavera (CPM) and the one by VICO (LBMS). This is reasonable since the AI software is element based (i.e., It not only breaks down the project into zones, but also works on each element alone). as efficiency increases by decreasing batch size [8]. Thus, the schedule does not take as much time as P6 but is shorter than VICO. Add to that, the main importance and advantage that the AI software has over the rest of the software is that it generates multiple schedules giving the planner the luxury of choosing the one that best suit financial, duration, or resource needs.
E. Discussion of the Results Based on what was described throughout this paper, the
results have shown that the duration of the schedule was the shortest in Primavera (CPM) and the longest in VICO (LBMS). These results make sense for several reasons.
CPM does not allow the planner to check for the location of work nor the interaction of workers on site resulting in shorter durations on paper due to overlap. On site, this is not the case, crews may not find locations to work in or find that work is still not made available.
Location-Based made t by displaying the activities as they happen through locations. This enables the former to establish schedules that assure continuous flow and interaction between different trades hence
minimizing the incidents and clashes that may occur during construction.
Finally, AI in planning- and TCM- is the most recent. Thus, developers were able to gather from the preceding methods and build on. This is how the software was developed. The project is not only broken down into zones but the software detects every element alone, which is an optimization to the location breakdown considered in LBMS, and plans its activities. Nonetheless, using the power of computers, the algorithms allow the generation of multiple schedules using the same input and iterating on different data. As a result, TCM merged with AI shows the best outcome compared to CPM and LBMS.
F. CBA Analysis Choosing by Advantages (CBA) Analysis is performed
when a user wants to compare different alternatives based on different criteria and on the cost of each alternative. After the analysis is completed, one can easily find how much moving from one alternative to the other can cost, per advantage point. Therefore, an evaluation table listed in (Table 2- Appendix) was sent to professional users of Primavera, VICO and to an engineer from , as the software is not yet available to the public and was graded using a scale from 1 to 5. The scale was defined as shown in (Table 1- Appendix). Additionally, using a software called Paramount Decisions, the different criteria were inputted and each was given an attribute using the previously filled evaluation table. Then, the least preferred attribute was selected for each criterion and the advantages of each alternative were stated. In addition, the most important advantage was named for each criterion. Then, a weight was given to each criteria subjectively depending on its importance and one paramount advantage, which is the advantage with the highest level of importance (the number of permutations for the schedule was chosen) was assigned to one of the criteria. Finally, the cost of the different alternatives (Primavera, VICO and the AI software) was not inputted. This is because the scheduling software are not used by a single person, but by a company. Therefore, the benefits of using any software are much more important than the cost spent on their licenses to use software. In fact, the time saved using better software can allow the company to win more contracts and incentives, outweighing the cost spent for such sophisticated software. In addition, planning using a better software will reduce the costs incurred on-site and will allow the contractor to avoid clashes on-site. The results obtained from the CBA Analysis were plotted in Graph 1 showing the variation of points obtained from the importance scale set in the software in function of each software.

61
Graph 1: Variation of Advantage Points in Function of Criteria
The sum of advantage points attributed to Primavera, VICO
and the AI software was calculated to be equal to 770, 1175 and 1700 points respectively.
IV. ETHICAL SIDE OF ARTIFICIAL INTELLIGENCE
Finally, what is interesting to note is that using AI to create ultra-intelligent machines will be the last invention that man need ever make [9].
going to be augmented by computational systems that help humans think, robotic systems that allow them to make and digital nervous systems that connect them to the world far beyond all natural senses. It is believed that over the next 20 years, more change will happen to the way work is done than it has happened for the last 2000 years [10].
Nowadays, Artificial intelligence has surpassed humans brainpower in some areas. Stock markets, medicine, military weapons and other important sectors are dependent on complex algorithms that have been developed by human beings, but have improved on their own using artificial intelligence. Consequently, human beings are no longer able of turning there is no switch available [11].
On the other hand, the power of AI will allow shifting from things that are fabricated, to things that are farmed. Hence, the radical change is expected to create more variety, connectedness, dynamism and complexity. Merging technologies like AI and 3D printing with nature and humanity will provide more freedom and flexibility to the world of engineering and design.
V. CONCLUSION
This paper tackled three different planning methods: Critical Path, Location-Based and Artificial Intelligence in planning. In addition to the respective software that allow the use of the methods (Primavera, VICO Office, AI software). Based on the analysis of the three different schedules and the CBA, the AI software proved to have the upper hand. As a developing software, it aims to add to what is currently available and improve on it.
However, the biggest benefits are still ahead. To achieve the full potential of the system, planners have to take advantage of this new planning technique to enhance their outcome on the projects.The incorporation of artificial intelligence may be the key to the evolution of the construction sector as long as planners are in control of their software and can use them to their optimum.
VI. ACKNOWLEDGEMENT
The group acknowledges to Prof. Farook Hamzeh for his hard work, advising and guiding throughout the work.
Appreciation is also extended to Mr. Ralph Azar and Mr. Marvin Lahoud who were the contacts at MAN Enterprise and provided the team with all the needed details and information, to Mr. Mohammad Barakat who helped us with overcoming problems faced during the modeling phase, and to Dr. René Morkos and Mr. Dimitrios Farmakis for their hard work on the AI software and their extensive collaboration.
Finally, a thank you to Prof. Ghassan Chehab who guided the group throughout the entire process and was present for any needed help and assistance.
VII. REFERENCES
[1] IHS Economics, 2013.
[2] Fundamentals, [3] B. Huber and Construction . 11th Annual Conference of the International Group for Lean Construction, 2003. [4]
[5] -based management of construction projects: Part of a new typology for project scheduling
[6] R. Morkos, "Systems and methods for generating scheduling options in consideration of specific space constraints within a construction site", US20140277666 A1, 2014 (Patent). [7] M. Fischer, "Creating 1,000s of Schedules to Find the Best One: History and Outlook of Automated 4D Modeling", 2017. [8] Operations Research, Vol. 9, No.3 pp. 383-387, 1961. [9] J. Barrat, Our Final Invention . 2013. [10] The TEDxPortland. Portland: TEDx Talks, 2016. [11] J. T Artificial Intelligence: it will kill us. Hamburg: TEDx Talks, 2017.

62
APPENDIX Table 1: Relationships of Activities
Table 2: List of Activities, Predecessors and Relationships Table 3: Evaluation Table
1 Not available
2 Available but not practical
3 Available but needs much adjustment
4 Available but needs few adjustment
5 Available and working properly
Activity Predecessors Relationship Lag
Cor
e w
all F/R to Corewall Concrete casting of previous floor corewall FS 0
Embedded Works to Core Wall
F/R to Corewall FF 0
Concrete Casting to Core wall
F/R to Corewall FS 0
Embedded Works to Core Wall FS 0
Sla
bs a
nd v
ertic
als F/R/C Columns & Walls Concrete Casting Slab of previous floor FS 0
F/R Slab
F/R/C Columns & Walls SS 2 F/R/C Columns & Walls FF 2
Concrete Casting to Core wall (same floor) FS 0 Concrete Casting to Core wall (next floor) FS 0
MEP embedment in Slab F/R Slab SS 2 F/R Slab FF 0
Concrete Casting Slab F/R Slab FS 0
MEP embedment in Slab FS 0 Pulling Cables & Strands Concrete Casting Slab FS 7
Curing & Strike Shutter Pulling Cables & Strands FS 0
CRITERIA Primavera VICO AI
Suitability for Linear Projects 5 5 5 Ease of Learning 4 1 5
Extent of 4D Features (Scheduling, Project Analysis, Conflict Detection) 1 4 5 Animation Time 1 4 4
Animation Quality 1 3 5 Import And Export (File format, File Size, Snapshots and videos) 4 3 2
Exchange with P6 and Auto Linking 1 3 1 Clash Detection Rules 1 4 5
Multiple Users 4 4 5 5D & QTO Capabilities 1 5 5
Ability to Generate Schedule in Gantt or Linear Format 5 5 5 Location Breakdown Structure 3 5 1
Bill of Quantities 1 4 1 Resource Histogram 5 5 1
Control Chart Color-Coding 5 1 5 Schedule Forecast According To Real Progress Inputs 5 4 5
Link Multiple Projects 1 2 5 Risk Analysis & Simulation 1 4 5
Prerequisites Check Capability (For the procurement) 4 4 5 Cost and Cash Flow Capability 5 2 5
Look Ahead Reporting Capability 5 4 5 Integration with MS Project and Primavera 5 3 1
What if Scenario 1 2 5 Project Duration as Compared Other |Scheduling Software 4 2 5
Leveling of Resources and Labors 5 4 5 Cost Optimization 1 3 5
Simulation of Ongoing Works 1 5 1 Ability to Modify Schedule (based on occurred delay) 5 4 5
Ability to Generate Several Permutations of Same Project 1 1 5 Automatic Use of Data From Previous Projects 4 2 5

63
7
APPENDIX Table 1: Relationships of Activities
Table 2: List of Activities, Predecessors and Relationships
1 Not available
2 Available but not practical
3 Available but needs much adjustment
4 Available but needs few adjustment
5 Available and working properly
Activity Predecessors Relationship Lag
Cor
e w
all F/R to Corewall Concrete casting of previous floor corewall FS 0
Embedded Works to Core Wall F/R to Corewall FF 0
Concrete Casting to Core wall F/R to Corewall FS 0
Embedded Works to Core Wall FS 0
Slab
s and
ver
tical
s F/R/C Columns & Walls Concrete Casting Slab of previous floor FS 0
F/R Slab
F/R/C Columns & Walls SS 2 F/R/C Columns & Walls FF 2
Concrete Casting to Core wall (same floor) FS 0 Concrete Casting to Core wall (next floor) FS 0
MEP embedment in Slab F/R Slab SS 2 F/R Slab FF 0
Concrete Casting Slab F/R Slab FS 0 MEP embedment in Slab FS 0
Pulling Cables & Strands Concrete Casting Slab FS 7
Curing & Strike Shutter Pulling Cables & Strands FS 0
A Sustainable Master Plan of Quarry Rehabilitation
Sara Alameddine, Ruba Bizri Sawssan Boubess, Tony Sakr, Waseem Zakharia Department of Civil and Environmental Engineering
Beirut, Lebanon American University of Beirut
[email protected] [email protected] [email protected] [email protected]
Abstract- The aim of this project is to rehabilitate an abandoned quarry located in Chekka, Lebanon to compensate for the adverse effects induced by quarrying. It also introduces a social and economic attraction in the form of a masterplan, integrating aspects of sustainability and environmental restoration to the area of study. Therefore, the project breaks down the masterplan into three components: reforestation, recreational activities, and structural built up area. The master plan includes a hotel, open-air restaurants, a recharge pond, a conference hall, meeting rooms, a dome-shaped ballroom, bungalows, and a recreational public park- all surrounded by a forest. Moreover, the project focuses on the geotechnical, structural, transportation, and environmental design of the hotel construction. The foundation design, the hotel guest room and service facility distribution, and the structural and reinforcement components of the building are all studied. Additionally, the parking design is conducted, along with the design of the main access road. The project further highlights the use of green technology, renewable energy, and other components of sustainability such as rainwater harvesting system, solar panel installation, use of recyclable construction material, and installation of green roofs. By implementing the mentioned sustainable items, the project targets attaining LEED certificate qualifications.
I. INTRODUCTION
The modern day witnesses an ominous phenomenon of expansion of industrialization at the expense of greenery. Consequently, an increase in air, soil, and water pollution accompanies the growing urban lifestyle. Moreover, Lebanon is naturally a country rich in the presence of limestone material, which promotes mountain quarrying to obtain construction material. However, there is a lack of regional and governmental regulations addressing quarry rehabilitation, rendering Lebanese quarries abandoned in a state of environmental obstruction. A prominent such quarry is found in Chekka; though the area is supposedly rural, a large piece of land is rendered covered with rock and an eradicated flora and fauna. In addition to the need the area has for environmental remediation, Chekka has a need for a facility where tourists, business or family vacationers can retreat. These facts were the drivers for a project that changes the debilitated condition of the rocky Chekka quarry and rehabilitates it. Thus, this project combines the social and economic need for recreation with the environmental need for remediation. It proposes a master plan of reforestation, recreational activities, and an environmentally integrated, sustainable hotel facility construction. The project goes into
detail of the design and conceptualization of the hotel, in addition to an adjacent access road and parking facility. In addition to the structural and transportation fields, the design also includes the foundation of the building, as well as the incorporation of sustainability components, in terms of energy and water. The design aspires to be in compliance with LEED gold certificate standards of sustainability; those elements include green concrete, green roof, rainwater harvesting system, and solar panel design.
II. THE MASTERPLAN
Given the vast area provided by the land, measurably 1km2, a master plan is devised consisting of sections of environmental reforestation, built up area design, and land development plans. One of the prominent initial targets of the project was to bring environmental remediation and rehabilitation to the Quarry, replacing the colossal space of rock with greenery and maximizing sustainable use of the land. Another aspect of the plan is the construction of a facility that is geographically novel, relevant, and eco-friendly. A survey was conducted to determine the preferences of the Chekka local and peripheral citizens, as well as other potential visitors, in terms of the components of the masterplan. The survey resulted with ample demand of facilities, operations, and recreational activities; however, in addition to the diverse array of suggestions, the one demand of consensus was to bring environmental remediation to the area. The consequently devised masterplan took the outcome of the survey in mind; it accommodates the consensual demand to eco-friendliness through not only applying reforestation to the land but also designing green, sustainable buildings. Nevertheless, it encompasses numerous recreational activities, in addition to a main hotel facility, to increase attraction to the area.
A. Environmental Rehabilitation
Holcim conducted a study releasing a detailed report regarding the environmental aspects acquired for the vegetation of a quarry site on the land adjacent to this area respectively. By safe analysis of this report in parallel with lab soil testing performed on our area, environmental reforestation of this current degraded land incorporates growth in numerous new plantations suited to the Chekka neighborhood. By

64
maximal utilization of the water resources provided naturally and collected through a constructed rainwater harvesting system, rain-fed agricultural produce such as fruit crops will be planted to incorporate produce with the surrounding vegetated greenery. Furthermore, the area will include forestry that shall be conjoined with leisurely recreational activities.
B. Recreational Area
Following the results of the survey provided by the residents of Chekka and neighboring areas, a high demand for recreational activities was expressed, and their natural integration with the environment was requested. The results of the survey were aligned with the project’s initial vision of reintegrating the environment with Chekka, since it is considered a rural area. The suggestions reflected the need of residents of Lebanese cities for a rural escape to destress in nature and rejuvenate energy to face the urban lifestyle. Moreover, the survey responses reflected a need for youth activities, such as several forms of sports and entertainment. Addressing that demand, the masterplan includes a diverse array of activities accommodating the youth, vacationing families, and tourists; thus, the recreational activities include gold courts, a football field, zip-lining, hiking, camping, mountain biking, and horse riding. As such activities, will be dispersed around the forest, the visitors will have the choice to stay at the hotel, or at bungalows distributed around the forest to complete their natural experience.
C. Built up area
The third and central component of the masterplan is the part that is built up and structurally, geotechnically, and environmentally engineered. After feasibility research and deliberation of the results as well as the survey outcome, the built-up area was designated as a 3-part hotel facility. The hotel building is divided into three sections, accommodating business, touristic, and family guests respectively. It includes facilities such as a restaurant, a pool, rooftop jacuzzies, a conference center, and a ballroom. The layout is displayed in figure 5 in the appendix along with the built-up area section below.
III. BUILT UP AREA
The built-up area consists of three main parts: The hotel, a dome-shaped ballroom, a parking area, and a naturally integrated recreational area.
The hotel location was selected importantly to integrate the structure with the surrounding environment based on several criterions. Firstly, the appointed location minimizes the cut and fill volumes required for the construction process by utilizing the readily available valley of dimensions 180 meters deep and 150 meters wide. Secondly, an access road leading from the major road to the hotel entrance will be constructed to grant access for visiting hotel guests, as well as service and
staff employees. The hotel consists of three entrances located at the back of the hotel opposing the sea view to avoid obstructing the natural view. The central main entrance is acquired for hotel guests, and the other two side entrances are for hotel service purposes. Finally, the frontal side of the hotel is designed to be in front of a natural recharge pond.
Figure 1: Backside View/ Entrance Side of Hotel
On the right of the hotel backside, a dome-shaped building consisting of two floors is located (as shown in the appendix). The first floor is a conference hall tailored for business events and meetings; the second floor is a ballroom specialized for events such as weddings and other ceremonies. The aesthetic advantage of this floor is that it has a round, open glass ceiling. On the other hand, the recreational space entails a landscape specialized for the numerous and diversified activities such as hiking trails, the cycling trails, etc...
A. Structural Design of Hotel
To proceed with the structural design of the facility in Chekka, the appropriate standards and regulations were considered. About the Lebanese local building codes and regulations, the minimum built up area, the site boundary limits, the maximum number of floors above ground level were determined. The site topography was mapped using Google Earth and Sketch up. As for the structural design of the general layout of the hotel including foundation, column, and slab reinforcement design, it was done about the ACI code and modeled through AutoCAD, SAP2000, and Revit. The main construction material used is reinforced green concrete, which makes use of construction waste material.
The geotechnical aspect includes the foundation design. By conducting soil testing in AUB labs on a sample of the limestone rock material, the compressive strength of the rock in the quarry is determined. This enables determining the size of the building and conducting the load assessment. The present rock has very high cohesion and phi parameters; consequently, the foundation will be a series of isolated footings connected through tie beams.
The hotel design requirements were based on Neufert Architectural design standards, including the maximum area, service area, and number of rooms. Moreover, the rooms and facilities were designed, while maximizing space efficiency and following the resort standard. The rooms have a spacious area of 38m2, while the suites have an area of 74m2, including

65
balconies. The total number of hotel rooms consists of 111 regular rooms, and 20 prestigious suites on the top floor. Another adopted standard is the double glazing walls for daylight insulation- namely: heat and sound.
The hotel has two floors above ground level, including the lobby and reception on the ground floor, and three underground floors that are open from one side of the building: the rooms’ side facing the sea. The layout, shown in the appendix, has a panoramic elevator on the side, and a terrace of private Jacuzzis on the roof. Figure 2 below provides a frontal view of the hotel providing a sea-view for accommodated guests.
Figure 2: Front side view of Hotel
The hotel has the shape of a sideway multi-leveled terrace shown below in figure 3, where the extremities contain large green areas on each floor. Finally, the exterior facade is a honeycomb design formed of limestone cladding and composed of recycled material.
. Figure 3: Roof top and Terrace view of Hotel
As for the structural design, it entails reinforced concrete throughout the entire 6-floor structure. The three underground floors are built-into the mountain, and the walls extending from this basement stops at the ground floor. An expansion joint is added to preclude excessive stresses in case of thermal expansion of the wall. Moreover, the design includes continuous drop beams of 4.3m spans, lying on top of the columns, and other ones at the edge of the balcony lying on top of structural walls. The slabs have a thickness of 30 cm. As for the long-span cantilevers from the balconies, the initial design included ribbed slabs. However, upon several iterations, readjustments, and design reevaluations, two-way slabs were
installed instead, since there are drop beams at the edge of the balcony lying on the structural walls and supporting the cantilever. Therefore, all slabs are composed of two-way solid slabs. The structural design also includes that of the retaining wall in the back of the building, and it incorporates I-shaped structural wall installations to account for seismic design.
B. Road and Parking Design
The design of the access road and parking facility will be done based on the AASHTO code. A conceptual access road has been laid out in the master plan as seen in figure 5 located in the appendix. This two-way road will ensure the mobility guests from the site’s entry point to the hotel.
The parking is designed to accommodate hotel guests, ball/conference room attendees, employees, and resort visitors. Following the Neufert guide for hotel parking design, the rule followed states that the first 60 rooms get 60 parking’s then each two rooms one parking space. This parking will have a capacity of 250 vehicles.
The parking lot is located behind the hotel between the access road and the hotel’s entrance. Parking management systems will be adopted since the lot is not directly connected to the hotel. Shuttle and valet services can be provided to facilitate the commute between the hotel and the parking.
Since the development of this project revolves around sustainability, clean energy will be used by implementing the green roof concept on the parking area. Furthermore, 7500 m2 of photovoltaic solar panels will be installed on top of the outdoor parking, and they will be linked to the main electrical network. Having green roofs implemented in this project will not only result in environmental benefits but also economical since the dependence on electricity generators will decrease. This project will be one of the first promoters of green energy for the area and will incentivize residents and similar projects to adopt the same strategy in the Northern region of Lebanon.
C. Sustainability Features
A conceptual and thorough structural study is currently being done that incorporates numerous sustainable design aspects within the structural system. These aspects consist of the incorporation of a rainwater harvesting system with a runoff collection tank, the use of solar panels to generate electricity, and the use of green concrete. By implementing the above items, this project will work to obtain LEED gold certification. This certification will serve as an affirmation for the projects’ sustainable and eco-friendly design.
a. Green Technology
Green technology will include the use of green concrete and the implementation of green roofs where applicable. Green concrete is a term given to concrete that contains extra

66
procedures in the mix design and placement to ensure a sustainable structure and a long-life cycle with a low maintenance surface. This green concrete will be applied all throughout the construction of the project, and therefore abandoning regular PCC. The first sustainable aspect of the concrete is the replacement of coarse aggregates with waste material, reducing the depletion of raw resources, and the second advantage is that there is a lower thermal conductivity in the concrete, which implies reduced energy consumption for heating the facilities.
b. Sustainable water consumption:
In alignment with the project’s goal, which is to provide an eco-friendly and sustainable rehabilitation plan for the quarry concerned, rainwater harvesting system and a retention pond will be implemented. Rainwater harvesting is a technique used for collecting, storing, and using rainwater for landscape irrigation and other uses. Figure 4 to the right, provides a schematic diagram of how the rainwater harvesting system functions. The rainwater is collected from various hard surfaces such as rooftops and other manmade structures. Also, it is important to mention that the site has a retention pond previously developed. This pond is used to manage storm water runoff; it is essentially an artificially designed pond that retains runoff. The proposed water management systems will contribute to a more sustainable lifestyle. The water would then be distributed throughout the project for many purposes, ranging from irrigation of the forestland and food crop plots, to the supply of services such as: the pool, jacuzzies, and the guest rooms. This system will not cover all the hotel’s water demands but will help reduce water consumption. Monthly rainfall data has been collected for the area. Using this data and the total catchment area of the hotel, a volume of harvested rainwater has been determined. The catchment area is equal to 2100 m2. After calculating the monthly volume of water harvested. A percent reduction from the seasonal water consumption was established for each month. This percentage was calculated by dividing the monthly volume of water harvested over the monthly water consumption of the hotel. The total water consumption differs depending on the season. Per several studies performed on hotels in the Mediterranean a general decrease in water consumption occurs in the winter season (50% less than summer) hence the water saving occur mostly in winter. The following tables 1 and 2 show the percentage of water savings per month.
Percentage of water saved in Summer April: 5.4 May: 1.8 June: 0.3 July: 0.0
August: 0.0 September: 0.1
Table 1: % of water saved in summer
Percentage of water saved in Winter October: 6.9
November: 11.4 December: 18.3 January: 20.6
February: 15.2 March: 15.2
Table 2: % of water saved in winter
Figure 4: Schematic drawing of a rainwater harvesting system.
c. Energy
The total solar irradiance in Lebanon throughout the year amounts to 2160 KWh/m2/yr, where the majority is available during the summer season. Using 7500 m2 of solar photovoltaic panels that operate at around 10% efficiency, (according to the available products in the Lebanese market) one can harness almost 1,468 MWh/yr. Based on a study where over a thousand hotels all over Europe were assessed, it was deduced that the expected energy consumption by the hotel can surmount to 1,600 MWh/yr. Most of which is during the summer seasons since that is when most of the guests are

67
expected to stay. Furthermore, accompanying the energy reductions are cutbacks on CO2 emissions, which are both presented in table 3 on the following page.
Table 3: Energy and CO2 Consumptions Versus Savings Through the use of Solar Photovoltaic System
The energy generated will be connected to the main electrical grid to avoid using electricity and will be also used as backup instead of fuel driven electrical generators. Solar panels have a considerable impact on reducing the carbon footprint as shown above in the table and have economic benefits on the long run in terms of electricity savings.
d. Reforestation
In order to determine an adequate restoration process vis-a-vis both the flora and fauna’s lives, the assessment of previous studies on the nature of the region was done. A study titled ‘Mediterranean Quarry Rehabilitation Manual – Learning from the Holcim Experience’ was performed by Holcim at a quarry located 2 km away from the project’s site. The resultant report helped formulate an idea on the types of plants that the land could encompass. As a result, the soil type to be introduced in the area of study was chosen to be taken from neighboring areas as topsoil and soil for planting, since they are of a similar nature and type. The obtained results regarding the chosen flora and fauna species to introduce to the adjacent Holcim site can be adopted for this site’s masterplan as well, since both sites are covered with the same limestone and conditioned with the same weak ecosystem dynamics, as well as poor plant and habitat communities. Since recreational human activities will be integrated within the forest, the chosen plantation must be both aesthetically pleasing and safe. In terms of safety, wild plants having properties such as thorns should be avoided not to endanger any by-passers through the woods. Some of the suggested trees to be planted are the Laurel, Pine, Hibiscus, Olive, Eucalyptus, Carub, and Oleander tree. Two different types of canopies will be created and distributed throughout the forest, with each zone containing three to four types of trees in combination with several lowland plants and shrubs. Some of these plants are the Thymus vulgaris, Salvia triloba, Rhus coriaria,Pistacia palaestina, Thymbra spicata, and Pampas grass. The shrubs, such as the Buxus sempervirens, can also be used throughout the built up area to create a certain layout or natural divisions.
In terms of fauna, among the prominent species found were the red fox, snakes, turtles, a few reptiles, such as the
Laudakia stellio, and a low number of birds including, but not limited to, Falco tinnuculus and Galerida cristata. The plan is to introduce vegetation in order to enrich the greenery and natural habitat communities, not to mention increase soil fertility and prevent future erosion. The report entails proposed seeds and seedlings to plant on the final soil layer, which is installed as topsoil over a structure of rocks and gravels. This allows a diversity of species habitation and the formation of an integrated eco-system. A table was also prepared by Holcim which summarizes the flora used in the project which is included in the Appendix labeled figure 7.
e. LEED Certification
The Leadership in Energy and Environmental Design is a green building certification that the hotel seeks to obtain. The design of the building is oriented towards obtaining a LEED gold certification. LEED gold means that the project will earn between 60 to 79 points. A point/credit system is adopted for LEED certification; these points span along 8 main categories. The LEED categories for new construction are: Location and Transportation, Sustainable Sites, Water Efficiency, Energy and Atmosphere, Material and Resources, Indoor Environmental Quality, Innovation and Regional Priority. All sustainability features incorporated in the Hotel design will help obtain this certification. Table 4 presented below shows the points earned for each category:
Table 4: LEED Scoresheet
The regional priority category only applies to North America; therefore, no points were obtained.
IV. CONCLUSION
Projected Consumption/
Releases
Savings due to Solar Energy Use
Electricity consumption by the hotel
1,600 MWh /year
1,468 MWh/year 92% by solar energy
CO2 released by the hotel
1,023 tons of CO2/year
938 tons of CO2/year can be avoided

68
This report summarizes the key elements included in the project of rehabilitating the Chekka quarry. As the development of the masterplan evolves, some aspects are going to be expanded, more developed and discussed further such as the detailed broken down structural design of the elementary elements of the hotel, the solar panels’ distribution along the parking’s roof, and the detailed design of the road connecting the entrances and ballroom to the main highway.
Throughout this report, the issue of merging both construction and sustainability was tackled. The masterplan of the project presented showed ecofriendly and pro-environmental emerging technologies and novelties that are implemented in addition to the edifices themselves. This project on a large scale serves to render the quarry’s disturbing aesthetics and functions into a long-term sustainable plan that has many positive impacts and outcomes on a societal, environmental and economic level. The project’s implementation is supposed to boost the Chekka region as well as a touristic site and help concentrate its residents in the studied region by providing them with what they need.
This assignment touches on various fields regarding civil engineering from management, environmental, material, transportation, and structures, making it even more tangible and easily implemented.
ACKNOWLEDGMENT
The group members of this project would like to offer gratitude to the main advisor providing guidance and consultation, Dr. George Saad. Additionally, Dr. Ghassan Chehab, the course coordinator, for delivering objective, resourceful, and useful lectures regarding the layout and program required to carry out this project. Dr. Chehab was also available to answer questions that the group would present, and helped overcome problems that were faced during the project delivery.
Moreover, the knowledge and skills applied are mostly acquired from the numerous professors in the Department of Civil and Environmental Engineering in the American University of Beirut, who taught the various subjects related to the field. The group would furthermore like to thank Miss Grace El Azar, a representative of Holcim Company, for providing vital information about the Chekka site by offering the Holcim Rehabilitation Manual which was used as a framework, and her aid in additional inquiries faced within
this project. Furthermore, the input and understanding of Al Sabeh group were highly appreciated as they assured that no obstacles would stand in the way of the project’s efforts.
REFERENCES [1] CSI. (2011). “Guidelines on Quarry Rehabilitation”
WBSCD. [2] CNRS-L/AFDC/IUCN/Holcim. (2014). “Mediterranean Quarry
Rehabilitation Manual: Learn the Holcim Experience”. [3] Awad, E. A. (2011). “Sustainable Building Systems - Alternative
Construction Materials.” (AUB, ed.). [4] “Green Roof Industry Survey.”. Green Roof Industry Survey,
<http://www.greenroofs.org/index.php/resources/green-roof-industry-survey> (Nov. 6, 2016).
[5] Hanson, B., and Schmidt, S. (2012). Green roofs and rooftop gardens. Brooklyn Botanic Garden, Brooklyn, NY.
[6] Darwish, T. (2009). “Sustainable Land Management Practices to Reverse Land Degradation in Lebanon.”.
[7] Delpeuch, and Benoit. (2012). “Contribution à l’élaboration d’une stratégie de réhabilitation des carrières au Liban Législation et acteurs - Etat des lieux et prospectives 2010.”.
[8] Department of Transport. (2007). “Guidance on Transport Assessment.” UK.
[9] Holcim, "Mediterranean Quarry Rehabilitation Manual", IUCN, Amman- Jordan,2012

69
Appendix
Figure 5: Masterplan Layout with Close up on Built-up Area and access road in bold black
Figure 6: Objective Views of the Hotel from Revit

70
Figure 7: Snapshot of Table created by Holcim
Figure 8: Initial State of the Quarry

71
ADDING A FLOOR TO THE MUNICIPALITY OF
BURJ EL-CHEMALI
Ahmad Hazimeh ([email protected])
Bassel Ajami
Karim Rahhal ([email protected])
Mustapha El Noamani
Mustafa Ruzz ([email protected])
Faculty of Engineering and
Architecture
Civil Engineering Department
American University of Beirut Hamra Beirut Lebanon

72
Abstract
The purpose of this project is to build an additional
floor to the municipality of Burj el-Shemali (3 km east
of Tyre) that is currently under construction. The
project consists of two floors building for the use of
the municipality, and the extra floor to be added will
consist of multi-purpose hall. This hall is to be
constructed with spans up to 20 meters with the extra
floor having a combination of steel and concrete
structures. Previous architectural design and soil tests
can be provided by the current company working on
the project. This project includes different fields of
Civil and Environmental engineer which are
structural, geotechnical, construction management,
transportation, and environmental. The structural part
would be designing the new hall with its large spans
and shear walls, while the geotechnical part would
deal with checking the current foundation used due to
the addition of the new floor. Moreover, this
municipality doesn’t have a parking so in this project
considering a parking design next to the municipality
is vital. The duration of the construction, plan and the
available budget will be discussed later as part of the
management field. Finally, the environmental crisis is
becoming an international concern these days, that’s
why it is important in the project to include the
environmental field to reduce the damage on the
environment. This project will provide a solution for
the high demand on such hall in this area.
Introduction
Burj el-Shemali is a village in the Tyre Region in
South Lebanon, located 3 km east of the city of Tyre.
The municipality of Borj el-Shemali suggested a
project that aims in providing an additional floor to
their building that is currently under construction. The
building consists of two floors for the use of
municipality and the extra floor will be used for multi-
purpose hall.
Fig. 1. Site location
There were several reasons for conducting such
project. Agricultural firms tend to present their
products in villages consisting of high population, so
they need a centralized location to cover their
activities with a suitable large space. In addition, The
UN in south Lebanon offers sessions for farmers and
residents of this area to show some key points in their
agricultural techniques. The multipurpose hall can
provide a free space cultural, social, and agricultural
assembly for people. Besides, parliamentary and
municipal elections need a large space to afford a huge
number of voters. Moreover, the current hall in the
municipality could not cover the increasing demand on
such spaces that’s why implementing such project will
be helpful for many people who are concerned in the
area of south Lebanon.
The project will touch several disciplines of Civil and
Environmental Engineering such as structural,
geotechnical, transportation, construction
management, and environmental. Since the additional
floor will be used for ceremonies, conferences, and

73
exhibitions. The hall should deal with large spans of
20 meters, pre-tension slabs, and shear walls
governing the structural part. Regarding the
geotechnical field, this project will involve the
analysis of the designed foundation to check if it can
bear the additional load. Besides, the project will
include the design of a parking for the municipality
near the building to facilitate community problems.
From the environmental perspective the project will
deal with the design of a small waste water treatment
plant for the municipality. Concerning the
construction management, it imposes suitable
planning and scheduling of the construction. These
fields are elaborated in the literature review, scope of
work and methodology, constraints, and
implementation schedule.
Scope of Work and Methodology
In this project the scope of work is divided into five
main aspects, in which the implementation schedule
will be generated accordingly. Each aspect represents
the integration of several tasks to be studied and then
achieved during the timeframe assigned. The aspects
of the project are of the following:
Geotechnical investigation
Parking and Pavement Design
Design modeling of the new hall
Water treatment design
Environmental
Geotechnical investigation:
The addition of an extra floor consisting of a large
hall to the municipality will subject the structure to
much vulnerability concerning the soil behavior.
Therefore, an extensive review of the soil type,
bearing capacity, shear strength, and many other
factors was done .The soil reports suggestions and
analysis will be taken into consideration, but will not
be the reference for studying the soil behavior for the
project. Only the experimental data will be taken as the
given. The figure below shows the location of the
boreholes made for site investigations after the soil

74
report was requested from the geotechnical company
responsible for the site.
Fig. 2. Boreholes location
From the soil report given from SANA group the
bearing capacity was recalculated using a similar
approach to give a value of 3.2 kg/cm^2. These reports
provide the base data to check if the soil will be able
to handle the additional load of the floor. Using the
ROBOT software and by hand calculation the loads
that result from the addition of the extra floor where
calculated.
Fig. 3. Loads resulting from the new hall
Using the loads, calculation was done and showed
that the new hall will lead to a lower factor of safety
that is 4.3 and a settlement of 2.1. These results show
that the new hall is safe and can be performed without
any geotechnical problems.
Parking and Pavement design
A parking lot is one of the major components of the
transportation system. It is very essential as it controls
various aspects of activities that require traveling by
vehicle. It affects land use, development patterns, and
travel behavior. Since every trip needs an area where
the vehicles can park for a certain amount of time, the
parking lot is of utmost importance. Therefore,
learning how to design one is the main goal of this
project.
The parking is essential for such project due to high
demand on parking spaces during conferences and
ceremonies. This parking is to be executed in a free
space area included in the land of the municipality.
The software used for designing the parking is
AutoCAD Civil 3D.

75
The total number of parking spaces that could be
achieved through the preliminary design of the parking
is as follows:
Total number of parking spaces for Private
use (offices of the municipality): 18.
Total number of parking spaces for Public
use (for the use of the hall): 88.
Circulation configurations should be clear and simple
as possible. They should be designed to avoid
complications between vehicles as well as for
pedestrians’ comfort and safety. The internal layout
adopted in the proposed plan was designed to provide
consistent search pattern and reduce travel distances
and number of turns as much as possible; providing
two-way circulation whenever possible (whenever the
width of the aisle is 6 m or more), while also trying to
avoid dead-end aisles. As shown in the screenshot
below, the circulation designed adopted is clear and
simple, and the driver should not encounter any
complications while searching for a parking spot. The
parking slots for the handicapped (shown as blue
hatched in the drawings) were placed right next to the
pedestrians’ path, providing them with high levels of
comfort. Also, cross-walks for pedestrians were
provided, so they can cross safely to the entrances
without interfering with the drivers while parking
(shown in yellow in the design).
Fig. 4. Parking plan

76
Design modeling of the new hall
This section presents the conceptual design along with
the software to be used for each design task. The
previous architectural drawings of the municipality
were received from Deco’dar the architect firm. The
architectural drawings are AutoCAD files while the
3D modelling perspective files are done using 3ds max
.For the additional floor the software used before for
the architectural drawings and the new 3D perspective
will stay the same.
Fig. 5. Current Municipality perspective
As discussed before, the main aspect of the structural
design of the new floor is to design slabs of long spans
reaching 20 meters. To achieve this goal and as shown
earlier in the literature review one of the best methods
used to implement such slabs is by using pre-stressed
concrete.
The Mediterranean Sea area is known for its large
amounts of faults that happened in the past. For this
reason and since the building is going to deal with high
populations and large events, shear walls will be used
in the design of the extra floor.
The design office responsible for the structural design
of the municipality (PEC) will be asked to provide the
structural analysis files of the project being
constructed. The expected structural modeling of the
municipality is on software called Robot. A trial to
import the .dxf file to ETABS and then continue the
design of the extra floor using ETABS will be
completed. If this trial failed the structural modeling
of the hall can be done using ROBOT to benefit from
the structural modeling data provided by the design
office.
Water treatment design
A water treatment system was designed to be used for
the treatment of rain water which will be collected
over the parking area by the porous pavement
provided along with the under drain system. Having a
total parking area of 2000 m^2 and an average rainfall
yearly rainfall in Lebanon equal to 600 mm we will
end up with a total collected water of 1200 m^3 per
year which is equivalent to an average flow of 3.3 m^3
per day to be treated by the system. This will provide
drinkable water for the area of Burj El-Chemali that
has a shortage in such resources. The treatment system
consists of a storage tank, slow sand granular filtration
system along with membrane processes including
reverse osmosis and a disinfecting system. No settling
tank was used since the usual turbidity of rainwater is
below 100 mg/l which can be applied directly to the
slow sand filter.

77
Fig. 6. Water treatment plant plan
Environmental
In the project, one of the important issues was aiming
to turn the building into a more environmental firendly
one. But According to the proposed project, and
understanding the cirmcumstances that the building
was already built, greening the building was limmited
by the added floor. Knowing the availability of
manipulations, it was tried to cocentrate on other
additional parts of the project. First step in this sense
was adding a water treatment system to recycle the
used water in the bulding. Moreover, collecting the
rain water was another idea, and that was by
introducing a porous pavement under the designed
parking. This water can be used after it passes some
treatment using the previously mentioned system.
These steps would be very helpful to reduce the
exhastion of water in the area where the project is
taking place. Where there is a large population
compared to the availability of water resources. Beside
these steps, Making use of the solar energy as much
applicable was another step towards making the
building more environmental friendly. So it was
thought to add solar cells along the area of the newly
developed slab where we can produce a reasonable
amount of electrical energy and provide it to the
building. Further steps in using the solar enery was to
base the architecture of the building on glass sheets
that allows the entrance of light, thus reducing the
electrical energy used for lighting.
Fig. 7. Average capital costs and yield of solar cells by
content
Conclusion
Briefly, a rational form of work was applied
throughout the knowledge gained from the courses
given by the civil engineering department at the
American University of Beirut to deliver a reliable
project. The main goal of the data presented in the
preliminary report is to provide sufficient space for
people in the area of Burj El-Chemali. This is achieved
by adding an additional floor to the municipality
consisting of a multipurpose hall.
To create a clear image about the scope of work and
methodology of the project an extensive literature
review was achieved in the various fields of civil
engineering. Soil reports and location of boreholes of
the project along with the foundation design used in
the municipality were received. Moreover,
preliminary design of the parking area of the
municipality was formed. Finally, an initial design of
the water treatment system plant of the project was
considered in the report.

78
References
Helen Rix Design, TechMedia and Pty Ltd. (2003).
“Guide to Long-Span Concrete Floors”.
MARTI P., RITZ P. and THÜRUMANN B. (1977)
“Prestressed Concrete Flat Slabs”.
Ofelia Moroni, M. (2002) “CONCRETE SHEAR
WALL CONSTRUCTION”.
Daniels B. and Mesner N. (2005). “Drinking Water
Treatment Systems”.
Lebanese Building Decree, (2005). “Parking
Standards”.
https://www.aub.edu.lb/fas/epi/Documents/Short%
20notice%20on%20earthquake%20hazard%20in%20
Lebanon.pdf. Web. (4/11/2016).
Shackelford, R. (2015)."New Treatment of Shear
Wall Aspect Ratios in the 2015 SDPWS".
Lazzari, P. M. (2013). "Automation of the
evaluation of bonded and unbonded prestressed
concrete beams".
Richard Bradshaw, David Campbell, Mousa
Gargari, Amir Mirmiran, and Patrick Tripeny,
(2002) “Special Structures: Past, Present, and
Future”.
Dario Gasparini, (2007) , “The Prestressing of
Structures: a Historical Review”.

79
Agricultural Center in Rural South Lebanon
Ali El Hajj, Freddy El Khoury, Boulos Habiby, Elie Kareh, Roy Kazzi Department of Civil & Environmental Engineering
American University of Beirut P.O.Box 11-0236, Riad El-Solh, Beirut 1107 2020, Lebanon
[email protected], [email protected], [email protected], [email protected], [email protected]
Abstract- Marwaheen is a village located in Southern Lebanon at the borders of Lebanon and Palestine. The Center for Civic Engagement and Community Service (CCECS) has proposed the establishment of an agricultural center that will serve the local farmers by providing them with the proper farming expertise and supplying them with products needed for sustainable agriculture. It will serve a cluster of villages located near Marwaheen; namely, Ramieh, Zalouteye Dhayra, Jibein, Marwaheen and Em el-Tout. The main aim of the center is to update cultivation practices, introduce rainwater harvesting as a modern water management technique, and utilize the areas of uncultivated public communal land. The purpose of the project is to establish an agricultural center with the aim of training farmers and developing the center in a sustainable manner that relates to water resources, energy harvesting methods, and construction materials. The land area upon which the project will be based is divided into three sectors; namely, a multipurpose agricultural building that hosts a meeting room and an agricultural pharmacy, an area for greenhouses that will serve as a prototype for farmers to implement sustainable irrigation techniques and construction methods, and an agricultural nursery. The project encircles various disciplines in civil engineering; namely, structures, water resources and energy, construction materials, environment and sustainability, and civic engagement. The tasks include carrying out a structural design of the agricultural building, collecting rainwater for irrigation use and designing the various components associated with rainwater harvesting, testing rammed earth samples to determine the feasibility of implementing the concept on site and proposing a practical construction method of rammed earth structures, studying the feasibility of installing wind turbines at the site, and ensuring the replicability of the project for easy employment in other areas in Lebanon. The team will perform these tasks with the aid of the American University of Beirut’s Center for Civic Engagement and Community Service. Research was conducted on different components of the project to study the feasibility of implementation on site and to ensure that the best systems and designs are achieved.
I. INTRODUCTION
Doe Zantamata, an author, artist, and photographer, once said this about agriculture: “To most people, this is just dirt. To a farmer, it is potential” [1]. It is well-known that the need for good agricultural practices in developing countries is a pressing matter, and Lebanon is no different. For the case of this paper, the rural village of Marwaheen in Southern Lebanon was taken as a pilot area for the construction of an agricultural center that will serve to educate local farmers on proper farming techniques, as well as supply them with fertilizers and medication for the crops they grow. The land area upon which the project will be based is divided into three sectors, namely an agricultural building that includes a conference room, offices, bathrooms and an agricultural pharmacy, an area for
greenhouses that will serve as a prototype for farmers to implement sustainable irrigation techniques and construction methods, and an agricultural nursery. The purpose of the project is to develop the agricultural sector in the area in a sustainable manner, namely through implementing rainwater harvesting as a viable irrigation technique, studying the feasibility of employing renewable energy sources such as wind and solar energy to power the facility, in addition to utilizing environmentally friendly construction materials, namely rammed earth. It is worth noting that the project will entail the construction of a rammed earth fence around the site to serve as a proof of concept for its future implementation on actual one to two-story structures. This rammed earth structure will thus utilize the potential of this dirt to serve a good purpose other than farming. This paper will show the rainwater harvesting study on the plot of land available and on the greenhouses that will be present on site, sustainability studies related to energy matters, the lab study conducted to check for the practicality of using rammed earth as a construction material in the project, in addition to the structural engineering design and results for the proposed agricultural facility.
II. RAINWATER HARVESTING
Since the project under study falls within the domain of agriculture, water becomes an indispensable component in the project at hand. The following illustrates the steps that lead the group into concluding that if a rainwater harvesting system was applied for the case of the Marwaheen project, 40% of the initial water demand would be saved.
1) Determination of the average amount of rainfall: From the “Atlas Climatique Du Liban (1969)” [2], and taking into consideration the effects of global warming from the year 1969 to 2017, the average amount of rainfall tuned out to be 702.45 mm annually.
2) Determination of Crop water needs: Table I illustrates the water needs in mm/d for the different crops that are to be planted within the facility [3].
TABLE I WATER DEMAND OF VARIOUS CROPS
Crop Water Needed (mm/d)
Bean 4.8
Cabbage 3.3
Pea 4.5
Potato 4.8
Tomato 3.8

80
3) Identifying the potential areas for rainwater harvesting for the facility: Three locations were considered to serve as a rainwater harvesting site within the facility’s perimeter. These include: building roof, building surroundings (parking, garden, etc.), and greenhouses.
4) Design of rainwater harvesting systems: the following will be divided into three sections, one for each harvesting location.
a) Building Roof: Fig. 1 represents the system adopted for collecting water falling within the roof’s area [4].
Figure 1. One-way Drainage System
b) Building Surroundings: a concrete cover was chosen to
act as the surface that would transport water hitting the ground towards nearby ditches.
c) Greenhouses: Fig. 2 represents the unique rainwater harvesting system to be constructed over the greenhouses.
Figure 2. Greenhouses Rainwater Harvesting System
5) Determination of the amount of harvested rainfall: After
conducting necessary calculations, the following amounts regarding the net amount of water that could be harvested by the proposed rainwater harvesting system are shown in Table II.
TABLE II POTENTIAL AMOUNT OF HARVESTED RAINWATER
Catchment Area Water Collected (L/d)
Level 1 Roof 116
Pavement 315
Level 2 1005
Total 1436
6) Sample crop water needs: Considering that the greenhouses available within the project will cater to the growth of tomatoes, potatoes, peas, cabbage and beans, the amount of water that would be needed for the growth of these plants within the
greenhouses is 3780 L/day. This amount was calculated considering an average water demand of 4.2 mm/day over an area of 900 m2.
7) Calculation of water savings: By dividing the amount of water harvested by the amount of water needed, it turns out that implementing such a rainwater harvesting system would lead to savings of 40% in the amount of water that would be purchased from local distributors.
III. RENEWABLE ENERGY
A. Solar Energy The team has proposed to include both an active and passive
solar thermal system in the design of the building facility of the project. For the case of the passive system, a direct gain solar thermal system was chosen to harvest the sun’s heat and use it to keep the facility warm during the winter season. The discussed system is further elaborated in Fig. 3 [5].
Figure 3. Direct Gain Passive Solar Thermal System
For the case of the active system, an evacuated tube collector
system was chosen to make use of the sun rays to heat the water that will be used by the facility. Fig. 4 represents such a system [6].
Figure 4. Evacuated Tube Collector System Operation
B. Wind Energy
The team has conducted a study to determine the feasibility of implementing wind turbines. Due to the small size of the

81
project’s land, only two 4-meter wind turbines could be installed. The cost of both turbines adds up to around 10,000 $. Moreover, based on the wind speeds in the Marwaheen area, calculations resulted in the fact that the installation of such turbines would provide enough electricity to power only 8 light bulbs. Therefore, since those turbines were expensive (relative to the total project’s budget of 60,000 U.S dollars, excluding land cost), and since they provide minimal electricity, the installation of wind turbines was deemed not feasible.
IV. RAMMED EARTH
The purpose of rammed earth construction is to use the soil available on site as a building material. The team’s main goal was to construct an environmentally friendly fence with the smallest possible carbon footprint. Therefore, new materials such as clay, sand, lime as well as a small percentage of cement were used in the mix. If this mix proves to be sturdy, this construction method can be further used to build compression members in one and two-story structures. To test the feasibility of this concept and reach the best soil proportions needed for this project, several tests were conducted. During the first site visit, soil samples were collected from the area at different depths and their properties were determined in the lab. Tests showed that the soil is mostly composed of clay (80-90%), with the remaining portion being sand. Based on an ASCE research paper that relates the plasticity index of a soil to the sand-to-clay ratio [7], the sand-to-clay ratio needed was 3:1. The optimum moisture content for the obtained sand-clay mixture was obtained by conducting the standard proctor compaction test, and turned out to be 13% by weight. Since rammed earth construction is a single component of the multidisciplinary Final Year Project, several assumptions had to be made and some proportions were taken to be the control variables, to keep up with the tight schedule. Lime content was taken as the only variable in the samples, where cement, water ratios, and soil mixture remained constant (water quantities in the table vary to account for the increase in lime content). The main aim was to study the effect of lime on the compressive strength of the mixture. Table III below shows the components of the three samples that were tested.
TABLE III CONSTITUENTS OF SAMPLE SOIL MIXTURES
Components Sample 1 (kg) Sample 2 (kg) Sample 3 (kg)
Clay & Sand 10.00 10.00 10.00
Cement 0.200 0.200 0.200
Lime 0.500 0.700 0.900
Water 1.505 1.555 1.605
Three cylinders of each sample were produced to provide
comprehensive results and minimize errors. They will be cured for two weeks and then waterproofed with a coating. The coating will be used to prevent water infiltration since it is expected to undergo weathering with time due to rain.
Samples will then be immersed in water for two days to study their behavior in such conditions.
This experimentation will then be followed by the construction of a prototype wall similar to that which will be built on site. This wall will be built by applying the same energy that was applied on the cylinders under laboratory conditions. A practical and easy construction method that will not necessitate heavy machinery or consume excessive amount of time will be devised so that it can be adopted by an average contractor on site.
V. PROTOTYPE STUDY
Since such projects have a significantly positive impact on the agricultural sector in the area, a preliminary study was conducted on the feasibility of building sister facilities for villages in other regions across the country, as shown in Fig.5.
Figure 5. Potential Sister Facility Locations
The following criteria were taken into consideration for the selection of potential locations:
1) Availability of agricultural land 2) Availability of water or the possibility of having a water
source 3) The need of such a facility in terms of technologies
and/or agricultural pharmacy Fig. 3 shows the potential sites locations that resulted from
the analysis for building such projects. VI. STRUCTURAL DESIGN
The Agricultural Center’s main building was planned to serve 3 functions and did so using office spaces, an agricultural pharmacy and a conference room. Future expansion was considered and the design of the center was done with an extra story taken into consideration. Fig. 6 shows a plan of the building.

82
Figure 6. Plan Drawing of Building
The limited construction know-how in the area and the architecture of the building were major constraints on the type of slab to be chosen. This resulted in using one-way hourdis slabs and transfer beams for the 3 roofs. The design of the slabs and beams was done using the RCM ACI Builder software and rechecked using hand calculations. The resulting cross-sections were sketched on paper and included the different sizes, flexural reinforcement details, as well as the shear reinforcement details.
The vertical elements were designed based on an ETABS model of the two-story building. Fig. 7 shows this model.
Figure 7. ETABS Model of Building
Columns were allowed to be as thick as the double walls and were found to require less than minimum reinforcement. This meant that the project was designed properly and safely.
Footings were somewhat more complicated to tackle due to the lack of geotechnical data on the ground’s basic bearing capacity and the limited budget that did not allow for a proper geotechnical site investigation to be conducted. Thus, after consulting with experts, the footings were designed as single footings based on a very conservative ground bearing capacity of 2 kg/cm2.
AutoCAD drawings are yet to be finalized for proper construction and placement on site.
VII. CONCLUSION As a conclusion, it can be said that if the rammed earth tests
proved to be a success and the compressive strength results of the prepared samples were deemed acceptable, then this could prove to be a platform for a more complex application of rammed earth in other projects, such as utilizing it as a construction material for structural elements that can hold significant building loads. Moreover, following the rainwater harvesting study conducted, it was determined that
implementing rainwater harvesting for the project in Marwaheen significantly minimized the amount of water that needs to be supplied for irrigation by about 40%, which renders it a viable option to pursue. After touching upon the feasibility of using renewable energy sources for this particular site, it was found that using wind turbines or solar panels was not feasible economically due to the limited budget at hand. Several processes are yet to be accomplished. For instance, calculating the approximate cost of the project is a step that still needs to be undertaken. This will be followed by planning and scheduling of activities in order to have an idea of the expected completion date of the project.
ACKNOWLEDGMENT
The team would like to thank Dr. Mounir Mabsout for his help in gathering the required information and contacting people who know best about such projects. Through his wide experience in civic engagement and community based projects, he is providing an added value to the project. His efforts are much appreciated.
The team would also like to express its gratitude to Mr. Ali Basma of the CCECS for his constant willingness to help. The experience acquired from his former work in Marwaheen and the various studies held in the area helped the team define the scope of the project.
Moreover, the team acknowledges the help received from Mr. Mohammad Obeid, the ex-mayor of Marwaheen, for the valuable information he shared during the site visit.
The team would also like to thank Dr. Habib Basha for his constant moral support, and his never-ending attempts in setting the project in the perfection zone.
REFERENCES
[1] D. Zantamata, "AgriThoughts," 2015. [2] Service Meteorologique, "Atlas climatique du liban," in Observatoire de
Ksara: Service Meteorologique Du Liban, 1969. [3] C. Brouwer and M. Heibloem, "Crop water needs," in Irrigation Water
ManagementAnonymous Via delle Terme di Caracalla, 00100 Rome, Italy.: Food and Agriculture Organization of the United Nations, 1986, .
[4] Carson Dunlop, "Flat Roof Drainage Systems," 2012. http://www.ashireporter.org/photos/thumbnails/2012_12/CarsonDunlop-0121.jpg.
[5] University of Southern California, "Direct Gain Systems," 2015. [6] C. Marken, "Solar Collectors... Behind The Glass," 2009. [7] S. Burroughs. Soil property criteria for rammed earth stabilization. J.
Mater. Civ. Eng. 20(3), pp. 264-273. 2008. . DOI: 10.1061/(ASCE)0899-1561(2008)20:3(264).

83
An Experimental and Numerical Study of Hydronic Asphalt Pavement Systems
Ahmad El Khatib, Kamel Saleh, Nooralhuda Saleh, Samir Sari Ad Din, Ali Zalghout
Department of Civil and Environmental Engineering American University of Beirut
P.O. Box 11-0236, Riad El-Solh Beirut 1107 2020, Lebanon [email protected], [email protected], [email protected], [email protected], [email protected]
Abstract - The emergence of Hydronic Asphalt Pavements (HAPs) presents an alternative pavement system that is both more durable and more sustainable. The purpose of such a system can be any of the following: snow-melting and deicing, cooling the pavement, and/or energy-extraction. The objective of this paper is to develop a numerical model that allows the simulation of the thermal response of the HAP to different parameters. Results obtained from the model will be used to later design and construct a large-scale HAP system. The paper also tackles constructability difficulties that optimum HAP parameters could face in large-scale construction. To that end, constructability was studied by experimenting with different piping support and paving techniques on a 4 m2 slab that was constructed inside AUB campus. Results of numerical modeling show that surface temperature is highly sensitive to the thermal conductivity of the pavement, followed by spacing, depth, flow rate, and lastly diameter. Copper was found not to have a significant effect in decreasing surface temperature compared to other pipe materials.
I. INTRODUCTION
Roads provide nations and individuals the improved ability of transporting goods, people, and information as well as the transfer of services. The National Center for Pavement Preservation has reported as much as 6.5 million kilometers of paved public roads in the United States, estimated to value a tremendous 1.75 trillion USD. This huge investment merits employing long-term strategies that contribute to the pavement’s performance, whether through extending the pavement’s life by decreasing distresses such as cracking and permanent deformation or improving the road safety such as decreasing accidents due to ice and snow during winter. The emergence of Hydronic Asphalt Pavements (HAPs) presents an alternative pavement system that is both more durable and more sustainable. HAP systems consist of a series of pipes embedded within the asphalt pavement which function to extract or reject heat from/into the pavement via a circulating fluid. The purpose of such a system can be any of the following: snow-melting and deicing, cooling the pavement, and/or energy-extraction.
By circulating a cold fluid through the HAP in summer, the system will be able to decrease the pavement’s surface temperature which enhances its resistance to permanent deformation. This also leads to creating a more eco-friendly environment by mitigating the Urban Heat Island Effect (UHI), a phenomenon known to directly cause urban areas to be several degrees warmer than the surrounding regions. Alternatively, by circulating a hot fluid in winter, the system will ensure snow removal and deicing – thereby relieving the
pavement from any damage incurred by spraying chemicals or employing mechanical methods while also allowing safe passage for pedestrians and vehicles.
The HAP’s summer functionality (commonly called Asphalt Solar Collector (ASC)) has been studied extensively in literature. Much research has been directed towards studying the sensitivity of the thermophysical properties of ASC materials [1, 2, 3], pipe configuration [4, 5], pipe material [6, 1], pipe diameter, depth, and spacing [1, 7, 8], as well as flow rate and heat exchange fluid [9, 10, 3, 8]. Research at AUB has also been conducted on ASCs to study the effect of pipe diameter and to investigate the system’s potential to harvest energy [11, 12, 13].
The study methods followed in literature cited previously to analyze the behavior of ASC are based on experimental tests or theoretical studies using numerical modeling and simulation. Experimental studies found in literature generally involve small-scale laboratory tests and small-scale tests under real weather conditions but only few studies are based on large-scale systems. The latter systems could exhibit a behavior different to that of small-scale lab tests, namely because of heterogeneity of asphalt, the employment of heavy equipment, and the involvement of contractors and numerous workers that might introduce variability unaccounted for in small-scale tests.
The HAP’s winter functionality has been less studied, and only few have investigated how to optimize the system [14, 15]. Winter functionality generally necessitates employing an external source of energy, but research is currently being conducted to investigate whether geothermal energy can be incorporated instead to achieve the objectives of HAP [16, 17].
II. OBJECTIVE
Previous work has established the conceptual feasibility of the system in small-scale laboratory tests [11, 13, 3] and in small-scale tests under real conditions [12, 9], now it is essential to study the performance and behavior of the system on a large-scale section of considerable size geometries where certain otherwise neglected parameters have a significant effect, such as real weather and traffic conditions as well as the behavior of heterogeneous materials such as asphalt. However, extending the study to large-scale would place it just a step behind being a practice-ready solution to deicing and cooling the pavements. Therefore, ensuring first that the system is constructible and economical on large-scale is essential before embarking with the performance study. The objective of this paper is hence two-fold:

84
- Develop a model to conduct thermal analyses to study the temperature distribution in a HAP system integrating parameters that are not necessarily optimum but that prove to be constructible. This system will be later constructed on large-scale based on recommendations presented at the end of this study to function both in summer and winter using geothermal energy. It’s necessary to develop such a model to predict the system’s performance in soil and asphalt media.
- Study and resolve constructability issues that are expected to be faced when constructing a large-scale HAP system that functions both in summer and winter.
III. THERMAL ANALYSES
Understanding the temperature distribution within the pavement is essential to the design of a system that is both constructible and sufficiently functional under both summer and winter thermal loadings. The temperature distribution varies according to the material and geometrical properties of the system. To establish this thermal distribution as the properties change, a numerical model was developed.
A. Thermal Model
A transient 3D heat transfer model was developed in a MATLAB environment in order to assess the thermal behavior of HAPs. The model uses finite-difference methods and was validated against data found in the literature [12]. The purpose of the model, in the context of this work, is to study the sensitivity of the thermal response of a HAP to the various parameters.
B. Theory
The thermal behavior of a HAP is governed by partial differential equations of heat transfer. Figure 1 shows the energy balance of a HAP.
For the asphalt domain, heat is transferred only by diffusion/conduction: (1)
The boundary conditions are set to be of Neumann type. At the surface boundary, the pavement receives heat from solar irradiation and exchanges heat by long-wave radiation (with
Figure 1. Energy balance of a HAP.
the sky), convection (with the ambient), and conduction (through the pavement medium). Therefore the upper boundary condition is:
(2)
The rest of the boundaries are zero-flux boundaries: (3) The fluid domain is governed by the Advection-Diffusion
equation:
(4)
The temperature inlet is fixed (Dirichlet boundary condition), and the outlet temperature has a zero-flux boundary. The boundary condition for the pipe-fluid interface is:
(5)
Assuming the pavement to be isotropic, Diffusion can be re-written as:
(6) Moreover, since the flow is unidirectional and the velocity is
constant (pipes are of uniform diameter), Advection can be simplified as follows:
(7)
Diffusion is discretized using central-difference scheme, Advection using an upwind-difference scheme, and time using forward-difference scheme in accordance with the recommendations given in the literature [18]. All schemes are explicit in nature.
The Nusselt number for convective heat transfer between the pipe and the fluid is taken from the Gnielinski correlation [19]:
(8) The convective coefficient for the fluid can be directly
calculated from: (9) The convective coefficient for the surface is taken from the
following correlation [20]: (10) The sky temperature is estimated using [21]: (11) where the sky emissivity is calculated by: (12)
and the dew-point temperature:
(13)

85
TABLE I WEATHER CONDITIONS AND REFERENCE MODEL PARAMETERS
C. Calibration
The first step in developing the model was to ensure that the proper parameters were used. The initial conditions of the model are obtained from a transient 1D model of asphalt pavement without pipes – subjected to the weather conditions presented in Table 1. The model was run to simulate 4 days to ensure steady state. The results – temperature distribution with depth – were used as initial conditions of the 3D model at the start of the simulations.
D. Sensitivity Analysis
After calibration, the model was used to simulate the thermal response of a proposed HAP system to different values of the following parameters: flow rate, pipe spacing, pipe diameter, pipe depth, and thermal conductivity of the pavement. In these simulations, all except the studied parameter were kept equal to the parameters of the reference model presented in Table 1. The sensitivity study can be summarized in Figure 2. It can be observed that the surface temperature of the pavement can be
Figure 2. Sensitivity of surface temperature to change of various parameters.
Figure 3. Temperature distribution as spacing varies significantly decreased (by around 20%) if thermal conductivity of the pavement is increased from 0.6 to 1.8 W/m k. Such a decrease could be significant in increasing the resistance to permanent deformation. Variation of pipe spacing and depth represent a clear increasing trend. The increase in value of either of these parameters would negatively influence the surface temperature. The effect of spacing seems to be more pronounced as it contributes to roughly 16% increase in surface temperature compared to a 7.5% increase due to depth when there is a 100% increase in these parameters.
Flow rate and diameter exhibit the least influence on surface temperature. The trend in both is decreasing, which encourages choosing a higher flow rate and a bigger diameter if the surface temperature is to be lowered.
E. Pipe Spacing
Studying pipe spacing could be crucial in determining the quantities of pipes required per meter of asphalt pavement, and hence the cost. As can be seen in Figure 3, a smaller spacing results in not only lower temperatures throughout the pavement but also in a homogenous temperature distribution, which helps in lowering thermal stresses in the pavement. Choosing a larger spacing would generally result in higher outlet water temperatures.
F. Pipe Depth
The closer the pipe is to the surface, the lower the temperature at the point directly above the pipe. However, the surface temperature between the pipes remains roughly unaffected as the depth increases. As can be observed in Figure 4, the temperature distribution becomes more homogenous as depth increases. From a structural point of view, the increased depth will allow for greater stress distribution and thus lower stress experienced by the pipe.
G. Pipe Diameter
The larger the diameter, the greater the surface area that is in contact with the asphalt pavement. It can be observed from
Parameter Value Parameter Value Weather Conditions
Relative Humidity 65% Air Temperature “Ref. [12]” Cloud Cover 0.5 Wind Velocity
Solar Radiation Reference Model
Thermal Conductivity of Pavement
1.3 W/m k
Diffusivity of the Pipe
24.3 mm2/s
Pavement Width 4 m Inlet Temperature 15 C Pavement Emissivity 0.93 Fluid Water
Pavement Absorptivity 0.93 Pipe Thickness 2.5 mm Cross-sectional Depth 16 cm Pipe Spacing 25 cm
Time of Simulation 12 hrs Inner Pipe Diameter 25 mm Flow Rate 0.2 L/s Pipe Depth 2.5 cm

86
Figure 4. Temperature distribution as depth varies
Figure 5. Temperature distribution as diameter varies Figure 5 that larger diameters were able to achieve greater reduction in the pavement temperature compared to smaller diameters. However, it is expected that smaller diameters will be able to heat the smaller volume of water to a higher degree compared to the larger volume of water passing in large diameter pipes.
H. Flow Rate
Low flow rates will contribute to increasing the water temperature, whereas high flow rates will contribute insignificantly to decreasing the pavement temperature. The effect of flow rate on the temperature of the fluid can be observed in Figure 6 in the Appendix.
IV. CONSTRUCTABILITY
The studies done in literature to optimize the HAP system, especially ASC, were carried out to increase the efficiency of the system either under controlled lab tests or for a small-scale slab subjected to real weather conditions. The findings of such studies establish the feasibility of the system and list favorable parameters found to be optimum. However, when it comes to paving a road, heavy equipment such as a paver and a vibratory steel drum compactor are involved. Therefore, the implementation of a HAP system on a large-section warrants studying the placement and support of the pipes, the order and thickness of asphalt lifts to be laid down, the equipment used to compact the lifts, and precautions to be followed to prevent any damage to the pipes during the construction process. In addition, the feasibility of the system is governed by the total cost of implementation, which could be inflated if optimum parameters are used.
The findings in the literature can be summarized as follows: to optimize energy extraction, using a highly conductive material such as copper is encouraged [22]. The depth at which the pipes must be placed must be as close to the surface as possible such that the structural integrity of the system is not compromised [7, 22]. Smaller pipe diameters must be chosen to yield a higher output water temperature [11, 9]. Spacing is dependent on flow rate, but it should be large enough to avoid cool spots, but small enough to increase the efficiency of the
system [23]. Flow rate must be chosen so as to create a turbulent flow [9]. The thermal conductivity of the asphalt pavement could be enhanced by using additives such as graphite [24]. Finally, using a serpentine configuration yields higher water temperature than other configurations [23].
In the following, analysis of the findings in the literature will determine whether using the optimum parameters are indeed practical and feasible to construct. A. Pipe Material
Copper costs 10 USD/m, while steel and polypropylene (PPR) pipes cost 4 USD/m according to a local supplier. Hence, having hundreds of meters of copper pipes in the road would entail a high capital cost. Other pipe materials are considered: steel, PPR class 2 (can withstand temperature less than or equal to 70 C), PPR class 5 (can withstand temperatures greater than 70 C), PPR with aluminum, plastic, and PEX. The main concern in using such materials is the low conductivity exhibited by steel (60.2 W/mk) and PPR (0.3 W/mk) compared to that of copper (385 W/mk). However, simulations of the pipe material using the 3D heat transient model developed in this paper, showed that there is around 13% decrease in surface temperature after 5 hours when using a PPR pipe compared to a 18% decrease when using a copper pipe. It is up to the designer to estimate whether the additional cost of using copper pipes would significantly add to the value of the system. For the purpose of this paper, further research will be conducted to study whether the employment of PPR pipes instead of copper would be a sound constructability judgement.
A new concern is the pipes’ ability (especially PPR) to withstand the high temperatures of asphalt, which can go up to 140 C during compaction and can be damaging to the surface of the pipes. To verify this, loose asphalt mixture was heated in the oven at 170 C for two hours and then poured over the different pipes and left to cool. The pipes were removed and inspected. PPR pipes were found to be more ductile and bendable when subjected to heat; however, the aggregates and
Figure 7. Effect of pipe material on surface temperature with time

87
Figure 8. Bendability of PPR pipe after being subjected to 170 C several sharp bends didn’t puncture the pipe, as shown in Figure 8. B. Pipe Depth and Diameter
Copper was found to be suitable in withstanding high levels of stress [22], but there is only little documentation in literature regarding the behavior of PVC or PPR pipes in asphalt. The heavy loads that the pipes will be subjected to under a vibratory steel drum compactor while being in an environment of elevated temperatures could pose a risk to their structural integrity. The risk increases as the pipes are situated closer to the surface, and since many roads are thin pavements and even limited to 5 cm to 7 cm thickness in low-capacity roads, there is a chance that having a HAP system would place the pipes as close as 2 cm to the surface of the pavement. To ensure the system is functional after construction, a 4 m2 area of HAP was constructed. The system involved using different types of pipe material (copper, steel, PPR class 2, PPR class 5, and PPR with aluminum), different diameters (20 mm, 25 mm, and 32 mm), different embedment depths (2 cm and 4 cm), and different paving techniques (laying of pipes on subgrade, laying of pipes on an un-compacted asphalt layer, and using spacers). Figures 9 and 10 show the small-scale study.
The condition of the pipes after construction was assessed by pressure-testing. All pipe scenarios presented previously demonstrated no leakage except for the plastic pipe (diameter 20 mm, embedment 4 cm, and laid on subgrade). Although not severe, the leak was anticipated to occur at the fittings that are only attached to the pipes by glue and that could easily be weakened by heat.
Figure 9. Different pipe material and diameters
Figure 10. Support of pipes and paving C. Thermal Conductivity
It is essential to use materials that will promote energy transfer and minimize losses. Having done a sensitivity analysis, it was determined that the thermal conductivity of the asphalt pavement plays a critical role in determining the efficiency of the system. A proposed modification to the asphalt mix is to add graphite powder which has been proven to increase the thermal conductivity of the asphalt mix up to 2 W/m.K [24]. The thermal conductivity and resistivity of an asphalt mixture are dependent on the respective conductivities of the constituent materials (coarse and fine aggregates, asphalt binder, and mineral filler) which vary according to the local available materials. Therefore, to better quantify the improvement of the thermal conductivity of the specific asphalt mix to be used in this project, a laboratory study was done using the materials and mix design of a local contractor. Table 2 summarizes the mix design used.
Representative samples of each stockpile of limestone aggregates were collected and the gradation of each was obtained. The dosages of graphite considered were 0%, 10%, and 20% by volume of binder. Graphite equivalent to these dosages was substituted instead of the bag house fines. The specimens of dimensions 30 cm x 30 cm x 2 cm were fabricated and tested using a Heat Flow Meter Apparatus. Figure 11 illustrates the results obtained. 20% replacement achieved a thermal conductivity 15% higher than the control.
TABLE 2 MIX DESIGN OF A LOCAL CONTRACTOR
Pipe Material % by Weight of Total Mix Fine Aggregates (0 mm – 6 mm) 39.6%
Intermediate Aggregates (6 mm – 12 mm) 30.5%
Coarse Aggregates (12 mm – 18 mm) 22.1%
Bag House Fines 3.5% Bitumen 4.3%

88
Figure 11. Thermal conductivity as a function of % graphite replacement It can be observed from Figure 7, that the thermal conductivity of the pipe material is not very significant. At peak hour, the surface temperature of the pavement with PPR pipes is around 60C; while that of Copper pipes is 56-57C. This corresponds to a mere 5.83% decrease in surface temperature when increasing the conductivity from 0.3 W/mk (PPR) to 385 W/mk (Copper). On the other hand, as can be seen from Figure 2, increasing the thermal conductivity of the asphalt by 50% (e.g. from 1.2 W/mk to 1.8 W/mk) results in a 7.5% decrease in surface temperature. This implies that instead of investing money in expensive pipes (such as Copper pipes), it is best to resort to cheaper pipe options (such as PPR pipes) yet invest in ways to improve the thermal conductivity of the asphalt (by for e.g. adding graphite).
CONCLUSION
Having developed a 3D heat transient model, it is now possible to simulate the thermal response of a HAP system consisting of any combination of geometrical and thermophysical properties. The sensitivity analysis conducted shows that the surface temperature of the pavement is highly affected by thermal conductivity of the pavement, followed by spacing, depth, flow rate, and lastly the diameter of the pipes. It was also established that PPR’s low thermal conductivity results in a surface temperature 13% lower than the normal surface temperature if no pipes were incorporated in comparison to copper’s 18% lower surface temperature. It was also established that it is safe to use PPR pipes in HAPs since no damage occurs to them during construction. The addition of graphite (dosage of 20%) resulted in a 15% in thermal conductivity of the asphalt.
Based on the findings of this study, future work will consist of constructing a cost-effective large-scale HAP system incorporating non-optimum parameters that have been proven to be constructible. The system will be designed according to simulations of the developed 3D heat transient model to be functional during both winter and summer. Another large-scale HAP system operated using geothermal energy will be constructed and assessed based on efficiency and capacity compared to the first system. A cost-benefit analysis to evaluate the strengths and weaknesses of the two systems will be presented.
ACKNOWLEDGMENT
The authors would like to thank Dr. Ghassan Chehab for his continuous guidance and support throughout the development
of this work. A special thanks goes to Mr. Helmi Al Khatib and Ms. Dima Al Hassanieh for their tireless efforts. Dr. George Saad’s input and counsel is very much appreciated. The authors would also like to thank: Mr. Abed Al Sheik, Mr. Anis Abdallah, Mr. Khaled Bcharra, Mr. Khaled JouJou and Advanced Plastic Industries S.A.L (API).
NOMENCLATURE : density of asphalt (
: specific heat of asphalt (
: thermal conductivity of asphalt (
: density of the fluid (
: specific heat of the fluid (
: thermal conductivity of the fluid (
: solar irradiation (
: surface convection coefficient (
: fluid convection coefficient (
: Stefan-Boltzmann constant (
: velocity (
: inner diameter
: cloud cover
: emissivity of asphalt
: emissivity of sky
: absorptivity of asphalt
: Nusselt number
: Reynolds number
: Prandtl number
: Darcy friction factor
: asphalt temperature
: fluid temperature
: ambient temperature
: sky temperature
: dew-point temperature
REFERENCES
[1] Wang, H., Wu, S., Chen, M., & Zhang, Y. (2010). Numerical simulation on the thermal response of heat-conducting asphalt pavements. Physica Scripta, 2010(T139), 014041. [2] Gui, J., Phelan, P. E., Kaloush, K. E., & Golden, J. S. (2007). Impact of pavement thermophysical properties on surface temperatures. Journal of Materials in Civil Engineering, 19(8), 683-690. [3] Mallick, R.B., Bhowmick, S., & Huken, M. S. (2008). Capturing Solar Energy from Asphalt Pavements. Draft Paper submitted to the International Society of Asphalt Pavements. [4] Abdel-Khalik, S. I. (1976). Heat removal factor for a flat-plate solar collector with a serpentine tube. Solar Energy, 18(1), 59-64. [5] Chiou, J. P. (1982). The effect of nonuniform fluid flow distribution on the thermal performance of solar collector. Solar Energy, 29(6), 487-502. [6] Mallick RB, Chen B, Bhowmick S. Reduction of urban heat island effect through harvest of heat energy from asphalt pavements.

89
[7] Chen, B. L., Rockett, L., & Mallick, R. B. (2008). A laboratory investigation of temperature profiles and thermal properties of asphalt pavements with different subsurface layers. Journal of the Association of Asphalt Paving technologists, 77. [8] Van Bijsterveld, W., Houben, L., Scarpas, A., & Molenaar, A. (2001). Using pavement as solar collector: effect on pavement temperature and structural response. Transportation Research Record: Journal of the Transportation Research Board, (1778), 140-148. [9] Shaopeng, W., Mingyu, C., & Jizhe, Z. (2011). Laboratory investigation into thermal response of asphalt pavements as solar collector by application of small-scale slabs. Applied Thermal Engineering, 31(10), 1582-1587. [10] Wu, S. P., Chen, M. Y., Wang, H., & Zhang, Y. (2009). Laboratory study on solar collector of thermal conductive asphalt concrete. International Journal of Pavement Research and Technology, 2(4), 130-136. [11] Deeb, I., El Jisr, H., Hotait, I. A., Najdi, A., & Zankoul E. (2013). Effects of Pipe Diameter Variation in Geothermal Pavement Systems. 12th Faculty of Engineering and Architecture Student and Alumni Conference. [12] Dakessian, L., Harfoushian, H., Habib, D., Chehab, G. R., Saad, G., & Srour, I. (2016). Finite Element Approach to Assess the Benefits of Asphalt Solar Collectors. Transportation Research Record: Journal of the Transportation Research Board, (2575), 79-91. [13] Ballouz, J. J., Chukrallah, J., Dakessian, L., Daou, E., Habib, D., Harfoushian, H., Imad, M., Kabbani, O., Saad, W., & Saliby, S. (2014). Energy Harvesting Pavements: A Finite Element Approach to Real World Applications. [14] Xu, H., & Tan, Y. (2012). Development and Testing of Heat-and Mass-Coupled Model of Snow Melting for Hydronically Heated Pavement. Transportation Research Record: Journal of the Transportation Research Board, (2282), 14-21. [15] Ho, C. H., Shan, J., Du, M., & Ishaku, D. I. T. (2015, July). Experimental Study of a Snow Melting System: State-of-Practice Deicing Technology. In International Symposium on Systematic Approaches to Environmental Sustainability in Transportation. [16] Siebert, N., & Zacharakis, E. (2010). Asphalt Solar Collector and Borehole Storage; Design study for a small residential building area. [17] Boyd, T. L. (2003). New Snow Melt Projects in Klamath Falls, OR. Industrial Uses of Geothermal Energy, 12. [18] LeVeque, R. J. (2007). Finite difference methods for ordinary and partial differential equations: steady-state and time-dependent problems. Society for Industrial and Applied Mathematics [19] Bergman, T. L., Incropera, F. P., DeWitt, D. P., & Lavine, A. S. (2011). Fundamentals of heat and mass transfer. John Wiley & Sons. [20] CIBS Guide Book A, Section A3, CIBS, London (1979). [21]Berdahl, P., & Martin, M. (1984). Emissivity of clear skies. Solar Energy, 32(5), 663-664. [22] Carelli, J. J. (2010). Design and Analysis of an Embedded Pipe Network in Asphalt Pavements to Reduce the Urban Heat Island Effect. Worcester Polytechnic Institute. [23] Mallick, R. B., Chen, B. L., & Bhowmick, S. (2009). Harvesting energy from asphalt pavements and reducing the heat island effect. International Journal of Sustainable Engineering, 2(3), 214-228. [24] Bai, B. C., Park, D. W., Vo, H. V., Dessouky, S., & Im, J. S. (2015). Thermal properties of asphalt mixtures modified with conductive fillers. Journal of Nanomaterials, 16(1), 255.
APPENDIX
Figure 6. Variation of fluid temperature with flow rate and time
Figure 12. Solar flux and change of temperature profile with time
Figure 13. Preparation of pipe network for large-scale construction
0.0 1.7 3.3 5.0 6.7 8.3 10.0 11.7
01002003004005006007008009001000
0
10
20
30
40
50
60
70
0.0 0.8 1.7 2.5 3.3 4.2 5.0 5.8 6.7 7.5 8.3 9.2 10.0 10.8 11.7
Time (hr)
Sola
r Flu
x (W
/m2)
Tem
pera
ture
(
)
Time (hr)Temperature @ Surface Temperature @ 2 cm Temperature @ 4 cmTemperature @ 6 cm Temperature @ 9 cm Solar Flux

90
Figure 14. Evolution of surface temperature with time
Figure 15. Schematic of the large-scale system to be constructed.

91
Applying Sustainability and Retrofitting FEA Buildings
Jessy Abdelnour, Mazen Al Abed, Riad El Soufi, Carl Rawadi, Marie-Jeanne Sleiman
Civil and Environmental Engineering Department American University of Beirut
Riad El Solh / Beirut 1107 2020, Lebanon [email protected]; [email protected]; [email protected]; [email protected]; [email protected]
Abstract - In this paper, several aspects are investigated in the Faculty of Engineering and Architecture (FEA) at the American University of Beirut (AUB) mainly: space, safety, energy efficiency and environment. The main focus is on the Dar AlHandasah Architecture Building which is the most outdated among the FEA buildings. For each scenario, a solution is proposed, with a minimized cost and maximized benefit.
I. INTRODUCTION
AUB is known to be the second-best university in the Middle East Region with a rapid increase in ranking internationally. The university offers an excellent educational curriculum and a unique formation of its students. Afar from meeting international education standards, the university campus should be safe, comfortable and most importantly sustainable in all its faculty buildings. Safety, capacity and energy efficiency are issues that every building on the AUB campus should address.
In comparison with the Irani/Oxy Engineering Complex (IOEC) and Bechtel building, the Dar-AlHandassah Architecture Building at AUB is an outdated facility that does not properly serve the needs of the students and teachers of that department. This building, not meeting basic requirements, has hindered the development of the department in many ways. The aim of this project is to provide a safe and sustainable facility that the department can benefit from.
To begin with, the department faces limited space availability; the existing attic currently occupies 60% of the available area. This matter is to be addressed by removing and redesigning the attic as a level that benefits from the actual usable space. The building also does not meet earthquake and environmental design standards. In the past, sizeable earthquakes have struck Lebanon; most recently a series of earthquakes, the largest of which had a proposed magnitude of 5.1 according to the European-Mediterranean Seismological Centre, took place in 2008 [1]. Thus, structural safety is improved by reinforcing the building against seismic activity.
The IOEC building has rainwater harvesting system which Bechtel and the Architecture building lack. A rainwater harvesting system is designed for these buildings to transport collected water from their roofs to a shared tank.
On an environmental level, a full scale energy audit is conducted to recommend a more efficient design by modeling
and analyzing the existing building’s energy loads and benchmarking against new designs that include improved insulation and ventilation. Apart from the Architecture building and surrounding modifications, the project described also includes an aspect in the FEA that studies the possibility of designing a recycling center for cardboard and paper to be reused within the campus.
The remainder of this paper is organized in the following manner: section 2 states the methodology used, section 3 illustrates the literature review, section 4 presents the different results and investigation obtained so far and section 5 presents a summary of the paper.
II. LITERATURE REVIEW
The remodeled third level of the Architecture building is designed either using concrete or steel structures.
Reinforced concrete has a high compressive strength resulting in minimum deflection. It is fire and water resistant with an ability to be casted in a variety of shapes from simple slabs, beams, and columns to arches and shell. Moreover, it is the most economical material available for footings, floor slabs, walls and piers since it has a considerable compressive strength per unit cost compared to other materials [2]. Furthermore, it is a durable material which results in low maintenance costs [2]. Due to these many advantages, reinforced concrete is used in most of the residential buildings, bridges, dams, and tunnels.
In order to measure the effect of an earthquake on the ground, the acceleration or “rate of speed” is defined. Together, the acceleration and duration of an earthquake can define the power of destruction. Seeing that it is impractical to take down a building and remodel it to resist earthquake load, several earthquake design methods on standing structures are being used today.
Most energy use in buildings depends on heating, cooling, lighting and ventilation systems [3]. Studies by the Environmental Information Administration (EIA) show that those factors comprise 70% of the energy use in buildings [4].
A suitable heating and cooling design is one of the most effective methods to reduce energy costs in a building. The HVAC system in a building can be analyzed using improved computer software that provide design and simulation results.

92
The Hourly Analysis Program (HAP) produces such results and analysis.
Indoor air quality (IAQ) is of high priority for the studios of the building. Architecture students spend the most time in their department’s building compared to students of other departments, and yet students regularly complain of the inadequate ventilation and air tightness of their working spaces [5]. Maintaining the ASHRAE standard 62-2004 standards for calculating the fresh air requirement is recommended [6]. HAP can produce such results including the appropriate air ventilation system. The process is further discussed in the methodology section below.
From early civilizations, farmers have always needed to store water for reuse during dry periods [7]. Since then, technology and society developed new ways in order to consume collected water. Nowadays, several nations encourage this policy. An essential water conservation technique that has already been implemented around the world is rainwater harvesting. The aim of this study is to highlight the importance of rainwater collection for re-consumption and more specifically its feasibility within the FEA area. Water demand is always increasing in a large community such as AUB which encompasses students, staff, animals and plants. With the depletion of water resources, new methods should be implemented to satisfy increasing water demands that AUB is unable to meet due to the rationing of the municipality water and the bad quality of the brackish water - a mix of seawater with fresh water - extracted from wells on campus.
In Lebanon, the municipal solid waste’s (MSW) final destination has recently cause political and economic turmoil. The existing landfill infrastructure has reached and exceeded capacity, such is due to faulty planning and management of those sites. 15% of the MSW is composted, 8% recycled, 48% landfilled and 29% dumped; in comparison to international standards, Lebanon is one of the countries with the largest landfilled and dumped ratios. Few companies such as SIPCO and Unipack are involved in recycling paper and cardboard which account for 16% of Lebanon’s solid waste generation [8]. The increase in the number of students at AUB has led to high consumption of cardboard and paper. Waste management in AUB has been limited to sorting since the 1990s using trash bins that are divided into three compartments: glass, cans and paper.
III. METHODOLOGY
A. Structural Analysis The first step for performing seismic analysis on the
Architecture building is the selection of a proper code that would define the ETABS model inputs. The Lebanese Decree 11266 (1997) set a requirement for seismic design criteria based on the Uniform Building Code (UBC) of 1997 [9]. The UBC adopts a “Seismic zone factor” based on zone specific characteristics that dictate the peak ground acceleration similarly as in (1):
𝑆𝑆𝑆𝑆𝑆𝑆𝑆𝑆𝑆𝑆𝑆𝑆𝑆𝑆 𝑧𝑧𝑧𝑧𝑧𝑧𝑆𝑆 𝑝𝑝𝑝𝑝𝑝𝑝𝑝𝑝𝑆𝑆𝑆𝑆𝑝𝑝𝑆𝑆𝑝𝑝 = 𝑍𝑍 × 𝑔𝑔 (1) Z = the zone factor according to Table 16-J of the
UBC 1997. g= Gravitational acceleration taken as 9.81 m2/s.
Since the Architecture Building at AUB is not prepared for
seismic loads, this building will be redesigned for a seismic zone factor of 0.25g using two software, AutoCAD and ETABS. Note that the decree indicates that a seismic zone parameter of 0.2g (Zone 2B) should be used for all areas in Lebanon. However, in the Beirut Region it is advisable to consider this factor as 0.25g.
ETABS provides a simulation of how a building will react to the additional loads resulting from seismic activity, superimposed dead load and live load. The methodology undertaken is as follows: 1. Obtain existing hard copies of the Architecture Building plans. 2. Convert those plans into soft copies on AutoCAD. 3. Redesign the third level on AutoCAD so that it occupies the full available area. 4. Locate the centers of all the structural elements to proceed with the design on ETABS. 5. Convert the AutoCAD drawings into versions compatible with ETABS. 6. Define the loads, sections, rigidity, stiffness and materials of each element on ETABS. 7. Build the model with the defined components. (Figure.1 in appendix A) 8. Run the analysis. 9. Identify the failing components. (Figure.2 in appendix A) 10. Redesign the failed components to withstand the new loads. 11. Check the foundation to verify its suitability to such additional loads. 12. Develop a 3D model for the resulting building on Revit. 13. Conduct a feasibility report to convey the costs of the project.
Concrete jacketing will be implemented on the failing components along with steel reinforcement to withstand tension forces. (Figure.3 in appendix A)
B. Energy Analysis A full scale energy analysis, using the software Hourly
Analysis Program (HAP), has been conducted to determine the efficiency of the existing heating and cooling system in the building’s third level.
Indoor air quality (IAQ) is of high priority for the studios of the building. Architecture students spend most of their time working in the Architecture building and regularly complain of the inadequate ventilation and air tightness of their working spaces. In addition to pollutants produced by occupants, furnishings and building materials, architecture students use an extensive array of stationary materials ranging from cardboards and Plexiglas boards to special adhesives, which are all high with Volatile Organic Compound (VOC) content. Hence, additional care should be given to ventilation in order to properly dilute the polluted air and prevent the carcinogenic effects of the long term exposure to VOCs and their kinds. By using HAP, the ventilation for acceptable indoor air quality will be calculated and a proper HVAC system will be designed accordingly. The software complies with the ASHRAE Standard 62.1-2007 for acceptable indoor air quality and follows the standard’s Ventilation Rate Procedure [6]. The objective of the ventilation rate calculation is to determine how

93
much outdoor air must be introduced to the HVAC system’s outdoor air intake to ensure every space served by the system receives the required minimum ventilation to the breathing zone.
HAP software results are presented in an air system sizing summary. The data to be extracted include the central heating and cooling sizing specifications, and the design airflow for the ventilation fan. Furthermore, the distribution of the load along the different spaces is presented. The methodology to conduct the energy analysis is as follows: 1. Surveying the building and compiling a list of all walls, separators, U-values of surfaces, and lights. 2. Setting up the HAP software model
a. Creating the floor spaces with their specific characteristics (spaces sizes and usage, lighting, and utilization schedule) b. Selecting the required air system and including the spaces assigned under the said system. (CAV, VAV etc...)
3. Running the software and producing the Design Data report. 4. Comparing the wattage/m2 of the existing A/C system to the proposed system. 5. Comparing the ventilation sizing to the existing system. 6. Introducing additional alterations to existing design such as improved building envelopes, optimal shading, and window glazing. 7. Feasibility analysis to justify the investments.
C. Water Harvesting The process of rainwater harvesting involves catching
rainwater and storing it for later use, typically with roof collection systems. The size of the tank depends on the projected water use and potential average precipitation. Rain collected from rooftops contains contaminants that need to be reduced by installing a filtering system. The procedure will go as follows: 1. Measure the area of the FEA buildings’ roofs. 2. Find the average monthly precipitation in Beirut. 3. Calculate the rainwater captured on every roof per month. 4. Gather information about water supplied according to the demand on campus. 5. Find a location for the tank. 6. Design the piping system on EPANET. 7. Design a filtering system to purify the collected water. 8. Conduct a cost and feasibility analysis.
C. Recycling Center This part studies the possibility of designing a recycling
center for cardboard and paper so that they can be reused within the campus. Several steps have to be followed in order to design a recycling center. 1. Estimate the quantity of paper and cardboard produced per day by a student or faculty member. 2. Collect information about the recycling process. 3. Identify the area needed according to the volume of recycled material. 4. Find a suitable location in the lower campus. 5. Specify the equipment suitable for the quantity of waste produced. 6. Sketch the center that will be constructed. 7. Feasibly and cost analysis.
IV. RESULTS AND INVESTIGATION
A. Structural Analysis After running the ETABS model, several structural
members failed under the new load combinations defined. These failures are highlighted in red and shown Figure. 2 of appendix A. The interaction option on ETABS allows a user to understand whether a member is failing in tension or in compression. The failing members need to be redesigned by either widening the section or increasing the steel reinforcement: Widening the involved section to further resist
compression. Increasing the steel reinforcement for extra tension
resistance; t also requires widening of a section to a certain extent.
The dimensions of a jacket are determined by calculating the needed enlargement in order to resist the difference between the service load and the ultimate load as defined by ACI code [10]. The extra steel reinforcement is to be determined by calculating the minimum required area for tension resistance to withstand the service load according to the ACI code. Figure. 3 in appendix A is a diagram that illustrates how a redesigned jacketed section would appear.
As for the foundation of the building, the loads defined on ETABS are used to analyze the suitability of the existing footing for the modified structure. In case of failure, a new footing will be proposed which would be based on either widening of the existing spread footing or the union of the spread footing in a raft.
B. Energy Analysis Table 5 in appendix B presents the input parameters used in
the HAP software model. General space characteristics such as the floor area and the average ceiling heights were measured. The outdoor air (OA) ventilation requirements are adopted from the ASTM Standard 62.1-2004 that are previously built into the software. Once space usage parameters are selected the software adopts the said characteristics, those include the people outdoors air rate (Rp) and the Area outdoor air rate (RA). The standard defines Rp as the outdoor airflow rate per person provided to dilute contaminants that are emitted at a rate that is related to occupant’s population, whereas the RA as being related to the floor area. Both values can be found in Table 6.1 of the standard. Values for toilets have been selected from ASTM St. 62.1-2004 Table E-2 since the former table does not list OA requirements for toilets [6]. Using (2) the RA is calculated, while Rp has been assumed to be zero.
𝑅𝑅𝐴𝐴 = 𝑂𝑂𝑂𝑂𝑂𝑂𝑂𝑂𝑂𝑂𝑂𝑂𝑂𝑂 𝑂𝑂𝑟𝑟𝑟𝑟𝑂𝑂𝑟𝑟𝑂𝑂𝑟𝑟𝑟𝑟𝑟𝑟𝑟𝑟𝑂𝑂 (𝐿𝐿𝑠𝑠)
𝐹𝐹𝐹𝐹𝑂𝑂𝑂𝑂𝑂𝑂 𝐴𝐴𝑂𝑂𝑟𝑟𝐴𝐴 (𝑟𝑟2) (2) C. Water Harvesting Piping System
During an interview conducted with Mr. Jean Abdelnour, the Director of the Physical Plant Department at AUB, water demand and supply quantities were gathered [11].
On a daily basis, AUB should receive at least 1,300m³ of water from the government to keep its tank at a full capacity of 8500m³ to fulfill the increasing demand. For the past six years, the daily city supply has decreased from 1,100m³ per day in

94
2011 to 850m3 per day in 2017. To compensate for the lack of city water supply, AUB buys around 100m³ of water twice a week from private tanker suppliers which costs around 650$ per week. In addition to the water received from the government and the private tanker suppliers, AUB bought a reverse osmosis (RO) unit in 2014 that can supply 250m3 per day and a second unit that can supply 500m3 per day in 2015 at a budget cost of $500,000 including infrastructure and piping works. The water supplied to the RO is from three brackish water wells that can be found on AUB campus [11]. Graph 1 shows the distribution of daily water supply from three different sources:
GRAPH 1
Daily water supply by source In order to further reduce the water bought from private tankers, a feasibility for the implementation of a rainwater harvesting system on the roofs of the FEA buildings will be studied. The average monthly rainfall in Beirut in 2013 is represented in the Graph 2 below:
GRAPH 2
Histogram for rainfall in 2013
Effectively, the water can only be collected during the months where the precipitation exceeds 1 in, mainly: January, February, April and December. Having found the catchment area for every building, the rainwater captured per month is calculated using (3): Rainwater captured (m3) = Rainfall (in) x Roof area (m2) x 0.0254 (m/in) x Efficiency (3)
Roof systems typically capture 75% of rainfall with 25% being lost to leaks and evaporation, so the efficiency will be taken as 75%.
For every FEA building, the roof area was measured using existing AutoCAD plans as well as the rainwater captured on every roof using equation (3). According to Table 1 shown below, the highest volume collected from precipitation is in January (888m3).
TABLE 1 Input for rainwater harvesting
Rainwater captured (m3)
Buildings Roof Area (m2)
Jan Feb April Dec Total
IOEC 1200 297 80 91 160 628
SRB 555 137 37 42 74 290
RGB 192 48 13 15 26 102
Bechtel 961 238 64 73 128 503
Architecture 680 168 45 52 91 356
Total 888 239 273 479
For the rainwater harvesting system, a comparison between
three different types of pipes in terms of advantages, disadvantages (Table 2) and costs (Table 3) is presented to pick the optimal type of pipe.
TABLE 2 Advantages and Disadvantages of different pipes
Type Advantages Disadvantages
Ductile Iron
- Good corrosion resistance when coated - High strength
- Heavy - Expensive
Concrete
- Good corrosion resistance when coated - High strength - Widespread availability - Good load supporting capacity
- Heavy - Requires careful installation to avoid cracking
Plastic (PVC)
- Lightweight - Easy to install - Economical - Good corrosion resistance - Flexible
- Susceptible to attack by solvents
TABLE 3
Average Cost of Pipes
Type Average Cost per pipe Ductile Iron 70 $
Concrete 20 $ Plastic (PVC) 35 $
After investigating the FEA buildings, it is noted that Bechtel
and the Architecture building are the only buildings that do not

95
have a water tank for rainwater harvesting in their basements. Based on the above comparison (Tables 2 and 3) it is concluded that the Polyvinyl Chloride (PVC) pipe is used for rainwater harvesting. The pipes are installed underground because of safety issues and aesthetics, connecting the buildings’ roofs to a shared water tank found in the boiler room.
D. Recycling Center While trying to identify the components of waste generated
by the AUB community, samples of waste bags weighing 437 Kg were sorted. This is equivalent to 14% of the campus waste generation. From this quantity, 35% was recyclable waste and 14% of them were paper and cardboard. Based on the AUB fact book, there are 2,648 students in the FEA. Assuming there are 200 employees (faculty members, janitors, lab instructors…), the total number of people will be estimated to be 2,850. Considering that the employees consume the same quantity of paper as students, the total quantity generated in the FEA area is: 0.4 x 0.14 x 2850 = 160 Kg/day ~ 60 T/year.
Based on an interview conducted with Mr. Karim Haddad, the Assistant General Manager at SICOMO located in Bekaa, the surface area within a recycling plant is usually divided into 3 distinctive units (raw materials warehouse, pulping and recycling machine units, converting machine unit) supported by supplementary facilities [12]. SICOMO is a large scale facility which occupies more than 20,000 m2 of space and recycles around 130 Tons per day of paper.
AUB produces approximately 60 Tons per year of raw material, mainly used cardboard and paper. All types of paper can be recycled except those in contact with food, hygienic, or treated for waterproof resistance. Clean materials are already sorted in trash bins at AUB but should be collected from FEA buildings by a truck and transported to the warehouse where they undergo separation (colored material, white material) and baling to ensure easy handling.
Pulping and recycling machines constitute the bulk of the production process. Fibers should undergo three stages of treatment: primary, secondary and final. In the primary stage, each kind of raw material is introduced into the pulper where it is mixed with recirculating white water and pulped for around 20 minutes. To cleanse the pulp, a screen removes primary coarse waste materials from the fibers. This will be followed by the elimination of high density material. The pulp is then sent to the secondary stage that consists of eliminating low density material. In the final stage, the pulp is thickened and its consistency is regulated by electronic instruments. The pulp is spread on a Fourdrinier board sheet formation table and is drained to create a continuous paper web. After the forming section, the wet web passes through a press section to squeeze out excess water followed by a heated drying section [12].
Supplementary components usually include: boilers, generators, fuel tanks, gas tank, finished product warehouse and offices. Note that, many chemicals are used within the process such as Caustic Soda for washing, Polyvinyl alcohol and Polyvinyl acetate for gluing and Alkenyl Succinic Anhydride to prevent water absorption to the paper.
TABLE 4 The 3M’s at SICOMO
SICOMO Laborers 180
Equipment weight Extra Heavy Equipment Cost $16M
Maintenance Continuous Equipment Lifespan >20yrs Water Consumption 5m3/ton
Thermal Consumption 800 kw (90 liters fuel oil)
Electricity Consumption 400 kw (100 liters of diesel)
Noise pollution <80 dB
Table 4 shown above illustrates the cost of equipment used for the recycling process and the consumption of energy and electricity at the SICOMO large-scale recycling facility [12]. These numbers are high but acceptable compared to the amount of waste received. The advantage is that the equipment lifetime spans more than 20 years and the noise pollution is close to the ideal value (60 dB). The acquired knowledge will allow the design of a small scale recycling center. After identifying the process needed to produce paper and cardboard, a benchmark of machines that occupy small spaces, low energy and recycle a quantity of 160 Kg/day will be conducted.
Based on an interview conducted with the recycling NGO “Arc-En-Ciel”, an area of 200 m2 can host paper and cardboard waste of around 2500 people [13]. The facility will be designed on the ground floor due to the weight of stored paper and machinery. Also, this provides easier manipulation, circulation and access. Students and faculty contribution in the sorting process and raising awareness are substantial for the success and feasibility of the center. Three locations with areas large enough to accommodate the recycling center are investigated in the lower campus:
1. ANNEX between Bechtel and Architecture building – this area (217m2) is occupied by a prefabricated steel hangar which serves offices for few faculty members and should be removed before being replaced by the recycling center.
2. Scrapyard between the FS1 Orange Building and the Architecture Building – this area (225m2) is being used to temporarily store broken desks and chairs.
3. Area to the left of the FS1 Orange Building – this area (245m2) is overlaid by a concrete slab that lies above two underground fuel tanks.
The second location is chosen since it offers a favorable construction without removing any existing structure, and the soil there is already improved by compaction with easy access to electricity, fuel and water from the corporation yard which is very close to this space.
SUMMARY The aim of this paper is to investigate a sustainable solution for the Architecture building at AUB. To achieve this goal, several topics are covered: structural analysis, environmental awareness, energy and hydrologic modeling. Each topic

96
requires the collection of data from AUB and the expertise of professional people in their corresponding fields. Also, many software are used to test the hypotheses and goals to be achieved. Structural analysis was conducted and the available solutions have been explored. The HVAC system will be specifically designed to reduce the energy consumptions of the building and provide adequate ventilation. Locations were chosen for the recycling center as well as the water tanks. After validating the feasibility of each aspect, a cost analysis will be conducted.
ACKNOWLEDGMENT
The authors would like to thank the coordinator of the final year project Dr. Ghassan Chehab. Gratitude goes to the technical advisor, Dr. Bilal Hamad and co-advisor, Dr. Aram Yeretzian for their guidance throughout the project. Several people helped in gathering the needed information and using several software. Therefore, special thanks go to Mr. Jean Abdelnour, Mr. Ali Dawi, and Mr. Karim Haddad. Also, different facilities at AUB should be appreciated and recognized for their time and help. These facilities are the Physical Plant Department, the EHSRM and FPDU.
REFERENCES
[1] Huijer, C.; Harajli, M.; Sadek, S. 2011. “Upgrading the Seismic hazard of Lebanon in light of the recent discovery of the offshore thrust fault system.”, Lebanese Science Journal, Vol. 12, 67-83 [2] McCormac, J. C., & Brown, R. H. 2015 “Design of reinforced concrete.” John Wiley & Sons. [3] Pacheco, R., Ordó˜nez, J., and Martínez, G. 2012 “Energy efficient design of building: A review.”, Renewable and Sustainable Energy Reviews, 16, 3559–3573. [4] US Energy Information Administration, 2012. Commercial buildings energy consumption survey: Energy usage summary, New York, United States of America. [5] Browne, R. B., & Fishwick, M. W. 1988. “Symbiosis: Popular culture and other fields.” Bowling Green, Ohio: Bowling Green State University Popular Press [6] ANSI/ASHRAE Standard 62-2004 – Ventilation for Acceptable Indoor Air Quality [7] “History of Rainwater Harvesting.” (n.d.). The renewable energy hub. Retrieved from https://www.renewableenergyhub.co.uk/rainwater-harvesting-information/the-history-of-rainwater-harvesting.html [8] “Lebanon Country Report on SWM” 2014. Retrieved from http://www.moe.gov.lb/Main/Announcements/Announcement/SolideWaste2015/2-LEBANON-COUNTRY-REPORT-ON-SWM-2014.asp [9] Uniform Building Code (1997). Retrieved from http://www.ahm531.com/My%20courses/this-semester/Uniform%20Building%20Code%20Volume%202(1997).pdf (Volume 2, 1-469) [10] American Concrete Institute. "ACI 318-14 Building Code Requirements for Structural Concrete and Commentary". Retrieved from www.concrete.org. [11] Physical Plant Department, American University of Beirut, private communication, March 2017 [12] SICOMO, Bekaa, private communication, March 2017 [13] Arc-en-ciel, Sin l fil, private communication, February 2017

97
requires the collection of data from AUB and the expertise of professional people in their corresponding fields. Also, many software are used to test the hypotheses and goals to be achieved. Structural analysis was conducted and the available solutions have been explored. The HVAC system will be specifically designed to reduce the energy consumptions of the building and provide adequate ventilation. Locations were chosen for the recycling center as well as the water tanks. After validating the feasibility of each aspect, a cost analysis will be conducted.
ACKNOWLEDGMENT
The authors would like to thank the coordinator of the final year project Dr. Ghassan Chehab. Gratitude goes to the technical advisor, Dr. Bilal Hamad and co-advisor, Dr. Aram Yeretzian for their guidance throughout the project. Several people helped in gathering the needed information and using several software. Therefore, special thanks go to Mr. Jean Abdelnour, Mr. Ali Dawi, and Mr. Karim Haddad. Also, different facilities at AUB should be appreciated and recognized for their time and help. These facilities are the Physical Plant Department, the EHSRM and FPDU.
REFERENCES
[1] Huijer, C.; Harajli, M.; Sadek, S. 2011. “Upgrading the Seismic hazard of Lebanon in light of the recent discovery of the offshore thrust fault system.”, Lebanese Science Journal, Vol. 12, 67-83 [2] McCormac, J. C., & Brown, R. H. 2015 “Design of reinforced concrete.” John Wiley & Sons. [3] Pacheco, R., Ordó˜nez, J., and Martínez, G. 2012 “Energy efficient design of building: A review.”, Renewable and Sustainable Energy Reviews, 16, 3559–3573. [4] US Energy Information Administration, 2012. Commercial buildings energy consumption survey: Energy usage summary, New York, United States of America. [5] Browne, R. B., & Fishwick, M. W. 1988. “Symbiosis: Popular culture and other fields.” Bowling Green, Ohio: Bowling Green State University Popular Press [6] ANSI/ASHRAE Standard 62-2004 – Ventilation for Acceptable Indoor Air Quality [7] “History of Rainwater Harvesting.” (n.d.). The renewable energy hub. Retrieved from https://www.renewableenergyhub.co.uk/rainwater-harvesting-information/the-history-of-rainwater-harvesting.html [8] “Lebanon Country Report on SWM” 2014. Retrieved from http://www.moe.gov.lb/Main/Announcements/Announcement/SolideWaste2015/2-LEBANON-COUNTRY-REPORT-ON-SWM-2014.asp [9] Uniform Building Code (1997). Retrieved from http://www.ahm531.com/My%20courses/this-semester/Uniform%20Building%20Code%20Volume%202(1997).pdf (Volume 2, 1-469) [10] American Concrete Institute. "ACI 318-14 Building Code Requirements for Structural Concrete and Commentary". Retrieved from www.concrete.org. [11] Physical Plant Department, American University of Beirut, private communication, March 2017 [12] SICOMO, Bekaa, private communication, March 2017 [13] Arc-en-ciel, Sin l fil, private communication, February 2017
APPENDIX A: ETABS MODEL
Figure 1- The existing model produced on ETABS
Figure 2- Failing members shown in red and acceptable members in pink
Figure 3-Jacketing and reinforcement of a column

98
APPENDIX B
TABLE 5 Inputs collected for HAP
General Space Characteristics OA Ventillation Requirements
Space Floor Area
Average Ceiling height
Space Usage People
Outdoor Air Rate (Rp)
Area Outdoor Air Rate (Ra)
Units> m2 m L/s/person L/(s-m2)
Tabl
e 6.
1 (N
on-R
esid
entia
l Dw
ellin
gs)
Corridor 400 (East) 47.2 3.0 General: Corridor 0.0 0.3
Corridor 400
(West) 40.6 3.0 General: Corridor 0.0 0.3
Design Meeting
room 406 16.3 4.2 General:
Conference/meeting 2.5 0.3
Office 403 11.9 3.0 Office: Office Space 2.5 0.3
Office 404 11.9 3.0 Office: Office Space 2.5 0.3
Office 405 16.2 3.0 Office: Office Space 2.5 0.3
Office 407 30.6 3.0 Office: Office Space 2.5 0.3
Office 408 26.7 3.0 Office: Office Space 2.5 0.3
Store 402A 54.2 3.0 Miscellaneous:
Warehouse 0.0 0.3
Store 411 94.7 3.0 Miscellaneous: Warehouse 0.0 0.3
Store 412 95.2 3.0 Miscellaneous: Warehouse 0.0 0.3
Store 413 17.6 3.0 Miscellaneous: Warehouse 0.0 0.3
Store 414 4.5 3.0 Miscellaneous: Warehouse 0.0 0.3
Studios 402 242.3 4.2 Education: Art
Classroom 5.0 0.9
Tabl
e E-
2 (P
rivat
e dw
ellin
gs,
sing
le,
Mul
tiple
) Toilets 417 12.0 3.0 Baths, Toilets 0.0 0.9
Toilets 418 12.0 3.0 Baths. Toilets 0.0 0.9

99
Blast Proofing the College Hall in the American University of Beirut
Rany Abbas, Mohammed Abdul Nabi, Ali Karaki, Bassam Ramadan, Farah Said
Department of Civil and Environmental Engineering American University of Beirut
Bliss Street, Beirut [email protected], [email protected], [email protected], [email protected], [email protected],
Abstract
The aim of this paper is to blast-proof the College Hall at the American University of Beirut. The paper starts with a risk assessment analysis for the college hall building in order to assign a certain worst-case scenario. Based on the assigned scenario, blast calculations are going to be conducted and the corresponding structural analysis will be carried out. Several structural and non-structural materials that can contribute in the enhancement of the performance of the building in a blast event are reviewed. The building is also assessed according to sustainable standard measures and scales. The theme of this paper is System and Data Analysis.
I. INTRODUCTION
College Hall is one of the oldest and most important buildings at the American university of Beirut. It was subjected to an act of terrorism that leveled it back in 1991.Therefore, the aim of the paper is mainly to retrofit the College Hall against blast loading. Studies on explosive-resistant materials are going to be reviewed and incorporated in the retrofitted building in order to enhance the performance of the building against any potential explosive. The design will also be done according to different sustainability measures that will decrease energy consumption and maintain a sustainable and eco-friendly building. In this paper, the focus is on the calculation of the blast loads and the factors that affect their intensity and pattern. A structural analysis model of the structure is developed and analyzed accordingly using ETABS. Also, different explosive-resistant materials are selected based on researches and previously done experiments. The Sustainability status is evaluated and represented according to certain scaled measures and guidelines.
II. LITERATURE REVIEW
The knowledge on blast loads and their impact on structures is fairly recent, accumulated over the past 50 years, prompted by both acts of terrorism and accidental explosions. Considering the complexity of their analysis, the low probability of an explosion incident near residential or commercial buildings, and the added cost of construction, most structural designs do not
account for blast loads, and therefore, they are susceptible to damages from explosions given that the blast loads are much larger than the conventional design loads [9].
An explosion is defined as a large sudden release of massive energy over a short period of time that lasts for a few milliseconds, causing very high temperatures and pressures. At the time of detonation, the resulting hot gases expand and occupy the near surroundings, leading to wave propagation through space in a spherical direction through unconfined areas. This is known as a blast wave or shock front. As the shock wave expands, its strength and velocity decay due to spherical convergence. Of the released chemical energy of the blast, only a third is released upon detonation, the rest of the energy is released slowly in smaller air explosions after the explosive products mix with air and burn. Yet, these have a minor effect on the blast wave since they occur at a significantly larger period of time [8].
Pressure Time History Figure 1 displays the pressure profile in relation with time
of a blast wave as described in [7]. At t = 0, the pressure of the element (structure) is equal to the ambient pressure P0, at t = tA, the time of arrival from the detonation point to the element, the pressure increases instantaneously to Pso, the peak pressure, also referred to as the peak overpressure. The time of increase to the peak pressure is infinitesimal, and therefore is considered to be zero for design purposes. The pressure then decays exponentially until it reaches P0 for a time period of to, which is also the duration of the positive phase. The pressure continues to decrease below P0, until it reaches a minimum value of Pso
-, and then it returns to the ambient pressure P0. The negative phase has a duration of to
-, which is larger than to. However, Pso-
is much smaller than Pso, thus, it has a small impact on the structural integrity. During the negative phase, the structure undergoes suction forces, which explains the presence of shattered glass and debris on the exterior of the building.
For an explosion that occurs near the ground, the initial shock wave encounters a rigid surface and is therefore refracted, and increased by reflection from the ground. The reflected wave and initial wave merge together to form a single wave, thus amplifying the peak overpressure. The reflected wave is often several times larger than the incident pressure.

100
Figure 1. Pressure Time History of Incident and Reflected Peak Pressure
III. SCOPE AND METHODOLOGY
Scope: The scope of this paper is mainly to retrofit the College
Hall, at the American University of Beirut, against blast loading taking into consideration high sustainable features and measures. First, a risk assessment is carried out to estimate the level of risk College Hall is exposed to. The blast loads are calculated based on the factors that influence these loads such as explosive materials used, explosive weight, and standoff distance. A structural analysis of the building under these loads is then carried out using ETABS. Different materials are analyzed based on their ability to resist blast loadings. Finally, a sustainability evaluation is to conducted and analyzed based on different measures and criteria.
Methodology Blast Loads:
Based on existing literature blast loads are calculated based
on a risk assessment analysis where the worst-case scenario is taken into consideration. The main blast load parameters, such as the peak pressure and duration of the positive phase, depend on the weight of the explosives and standoff distance. Risk assessment
Risk assessment of the College Hall is conducted based on the layout of AUB maps, in particular the location of the building with respect to the university access points. With the help of the security department at AUB, different scenarios are identified. Historical evidence and are also taken into consideration to estimate a worst case likely scenario.
Materials:
Different materials that may be used in the retrofitting and retrofitting of College Hall are considered. The materials can be used for either structural or non-structural elements such as blast-proof glass and carbon fiber reinforced polymers. The maximum strength capacities and characteristics of different materials are investigated based on the purpose of their usage.
Structural Analysis
The College Hall building is modeled on ETABS based on
the architectural and structural layout provided by the FPDU. The structural model is subjected to the calculated blast loads. The results of the structural analysis are used to design the structure and examine if any elements are overstressed.
Sustainability
To evaluate the sustainability standards in college hall,
several things were done. First, a meeting was carried out with different people from the Physical Plant Department which is responsible for managing the different electrical, mechanical, electromechanical things in the AUB buildings. FPDU provided the information regarding the energy consumption،, water consumption, building management system, water fittings, lighting system, waste audits, safety regulations, ventilation system, and accessibility for the disabled. After analyzing the information gathered, different recommendations will be provided to meet sustainability in the college hall.
IV. RISK ASSESSMENT
College Hall is located in front of the AUB Main Gate at an approximate distance of 30 meters. Reviewing the layout of the map of AUB, and consulting with security guards, it was concluded that the only way a vehicle can target college hall is by parking near the Main Gate on Bliss. On the other hand, the building can be easily accessed in person, given that people are rarely fully inspected at the gates.
Historically in Lebanon, large explosions have been used, with thousands of Kilograms of TNT equivalent. In 2005, Rafik Harriri was assassinated by a massive explosion with an estimated 1800 Kg of TNT equivalent [12]. Also, in 1983, two large trucks with an estimated 9525 Kg of TNT equivalent were used in the barracks bombing against the building housing the Multinational Force in Lebanon, killing 241 US and 58 French peacekeepers.
For the purposes of the College hall design, the blast load of two scenarios are analyzed. The first is a truck carrying approximately 5000 Kg of TNT, detonating his explosives at the main gate, which is approximately 30 meters from the building. The second scenario is that of a suicide bomber carrying an estimated 20 Kg in his vest, detonating his explosives inside the College Hall Building, at a close distance to the structural

101
elements. A 20% safety factor of the explosive mass is used for load calculations.
V. BLAST LOAD CALCULATION
To quantify the explosive wave, scaling is introduced for simplification, where the idea is that two different explosions, of the same type of explosives, at the same scaled distance, with the same geometry but different mass, have a similar blast waves under the same conditions. According to Hopkinson-Cranz law, a dimensional scaled distance is introduced as described by Equation (1) [7].
𝑍𝑍 = 𝑅𝑅
√𝑊𝑊𝑒𝑒3 (1)
Where, R = Distance from the Detonation point to the Structure
element. We = Mass of explosives in Kilograms of TNT
Using the above data, and the Value of 𝑍𝑍, the peak pressure (Pso) in bars can be calculated using equation (2) [3].
𝑃𝑃𝑠𝑠𝑠𝑠 = 6.7𝑍𝑍3 + 1 … … … 𝑓𝑓𝑓𝑓𝑓𝑓𝑃𝑃𝑠𝑠𝑠𝑠 > 10 𝑏𝑏𝑏𝑏𝑓𝑓𝑏𝑏 (2)
𝑃𝑃𝑠𝑠𝑠𝑠 = 0.975𝑍𝑍 + 1.455
𝑍𝑍2 + 5.85𝑍𝑍3 − 0.019 … 𝑓𝑓𝑓𝑓𝑓𝑓𝑃𝑃𝑠𝑠𝑠𝑠 < 10 𝑏𝑏𝑏𝑏𝑓𝑓𝑏𝑏
The dynamic pressure 𝑞𝑞𝑠𝑠 is given by equation (3) [8].
𝑞𝑞𝑠𝑠 = 5𝑃𝑃𝑠𝑠𝑠𝑠2
2(𝑃𝑃𝑠𝑠𝑠𝑠 + 7𝑃𝑃0) in bars (3)
Where P0 = Ambient pressure.
Due to the reflection of the blast wave, the Pressure is amplified and is given by equation (4) [10].
𝑃𝑃𝑟𝑟 = 2𝑃𝑃𝑠𝑠𝑠𝑠 (7𝑃𝑃0 + 4𝑃𝑃𝑠𝑠𝑠𝑠7𝑃𝑃0 + 𝑃𝑃𝑠𝑠𝑠𝑠
) (4)
Where,
Pr = Reflected pressure. The pressure on the side walls, rear and roof is given by equation (5). [7]
𝑃𝑃 = 𝑃𝑃𝑠𝑠𝑠𝑠 + 𝐶𝐶𝑑𝑑𝑞𝑞𝑠𝑠 (5)
Where,
Cd = Drag Coefficient. Finally, the duration 𝜏𝜏 of the positive phase is estimated using equation (6) [7].
𝜏𝜏 = 1.2√𝑊𝑊𝑒𝑒6 ×√𝑅𝑅 in ms (6)
Table 1. Drag Coefficients
Loaded Surface CD Front 0.8-1.6 Rear 0.25-0.5
Side and Roof (Depending pressure, KN/m2)
0-172 -0.4 172-345 -0.3 345-896 -0.2
1) Load Calculations of Scenario 1: Truck
Table 2 represents the calculated peak overpressures on the
surfaces of college Hall due to 5000 Kg of TNT detonated near the main gate.
Table 2. Blast Loads of Scenario 1
Surface Load (Bars) Front 8.5 Side 1.53 Roof 1.53 Rear 3.1
2) Load Calculations of Scenario 2: Suicide Vest
Table 3 represents the calculated peak overpressures due to
a suicide vest at several standoff distances from point of detonation. These are the values of pressure an element is subjected to at that distance.
Table 3. Blast Loads of Scenario 2
Distance (m) Load (Bars)
1 1254 2 153
2.5 64.4 3 48 4 19.5 5 7.1 6 4.33 7 2.88
Blast Load Modeling
The response of a structure under a blast load depends on
several factors other than the shape of the structure and its distance from the blast. The natural period of the structure and its relation to the positive phase duration of an excitation plays a fundamental role on determining its behavior. If the duration of the excitation is longer than the natural period 𝑇𝑇𝑇𝑇 of the structure, then its maximum deflection takes place before the excitation ceases, and dynamic analysis should be used, as often

102
is the case for earthquake loading. If the duration of the positive phase of the excitation is a lot shorter than the natural period (< 𝑇𝑇𝑇𝑇/4), then the structure deals with an impulsive loading [7].
A blast wave only lasts for a few milliseconds. Since the College Hall building is comprised of 5 floors, its natural period is approximately 0.5 seconds, much larger than the duration of the positive phase. Therefore, it is safe to assume that the elements will barely experience a deflection before the complete passage of the blast wave. Thus they are loaded according to the impulse value of the wave’s time history. The exact natural period of the structure can be calculated accurately using the ETABS software.
The pressure time history of the blast wave experiences the peak pressure instantaneously, then it undergoes an exponential decrease to the ambient pressure.
However, practically, the load can be assumed to decrease linearly, and hence be modeled as a triangular load.
VI. STRUCTURAL ANALYSIS
The response of the structure was analyzed using the ETABS software. The architectural and structural plans of College Hall were acquired from the FPDU.
The different sections were defined and drawn. An f’c = 45 MPA was assumed for columns and walls. An f’c = 35 MPA was assumed for the slabs.
The usual load patterns were defined, along with the load cases and load combinations.
In addition to the dead load, superimposed dead load, live load, and seismic loads in both directions, the blast loads were added for this particular analysis.
To define the blast load, a time history function was defined as a triangular function with instantaneous increase to the peak, and linear decrease to 0 over a span of 28 ms. The load pattern was defined as a Blast load.
Figure 2: Model of College hall with the assigned loads
The settings defined in ETABS to define the load case are as follows. The load case was defined as a time history, calculated using non-linear direct integration. The load case type was defined as a Load Pattern (i.e. not acceleration), and the function called was the previously defined Blast time history function.
For design purposes, load combinations are defined according to the likely combinations of loads to occur simultaneously. The load combinations of most interest based on the ACI and UFC codes are the following:
1.2Dead + 1.6Live 1.2Dead + 0.5Live + or – EQ 1.2Dead + 0.5Live + Blast
The blast loads were assigned to the frames of the front façade, to the side surfaces, to the rear façade, and to the roof of the building. The loads calculated for the first scenario are displayed in figure 2.
Note that the natural period was evaluated to be 0.601 seconds.
After running the analysis, and checking for the concrete design of the frames, the results obtained are displayed in fig. 3.
Figure 3: Analysis results of concrete frames
The concrete frames highlighted in red are the overstressed members. Most of the overstressed members are located in the front façade, which bears most of the loads. Only the element with largest section in the front façade is not overstressed. As for the side surfaces, the loads are considerably lower and therefore the elements are not overstressed. However, the members on the top floor are overstressed due to the presence of the blast load on the roof. To avoid collapse, the sections of the overstressed elements need to be redesigned.
As for the second scenario that involves suicide vest, the loads are significantly higher, by order of 10 to 100 times higher, depending on the distance between the structural member and the point of detonation. Therefore, failure of the corresponding elements is a sure thing. And considering that the suicide

103
bomber is able to move freely, all the elements may be subjected to the blast in a different plausible scenario.
A remedy for that situation would be to install a metal detector prior to entering College Hall to eliminate that particular threat, which would be more practical, time saving, and economical.
VII. RETROFITTING MATERIALS
The following materials were used in the retrofitting of College Hall
1) Carbon Fiber Reinforced Polymer
Unreinforced masonry walls (URM) do not provide a good protection against air blasts. When they are subjected to a relatively huge load, the wall will fail and the interior of the structure will be receiving the debris. For blast protection requirements, this type of wall has been prohibited.
The solution for this case lies in using sprayed-on polymer coating to retrofit unreinforced masonry walls and increase resistance to air blast [4]. The polymer material has the ability to permit deformation and dissipate blast energy while containing the wall fragments. The coating will contain the debris and remain intact. The most known polymer is Carbon Fiber Reinforced Polymer (CFRP) for protecting building against blast loads. It is a very durable and lightweight composite material, and it resembles wallpaper, it adheres easily to most surfaces and shapes [5]. CFRP is nearly three times stronger than steel. FRP do not deal with the building foundation so the entire application can be done in fewer than 75 days without interrupting any other operations for an occupied building. The point here focuses on humans’ safety even if the building may not be usable after the event.
FRP has risen in the structural engineering community, and by time it is gaining the acceptance in its field especially when the needs are being satisfied. Briefly, the process consists of weaving the fibers into a fabric (saturated with epoxy resin) and then applying it to the component’s surface that requires blast proofing [6]. After the resin cures, a tensile reinforcement/ confinement is added to the material.
After an explosion, the building (target) will be subjected to an impulse load. Every structural component of the building will be having a specific degree of blast resistance which can be established by modelling loads in different directions on walls, floor slab, ceiling slab and columns. FRP strips come as a solution when a negative bending effect is present in regions where there is insufficient steel reinforcement. The danger lies when debris is transformed into high speed projectiles leading to destruction and human casualties.
Experiments have led to several conclusions about CFRP. The most important one lies when considering the worst-case scenario (no reinforcement), CFRP had the ability to avoid effectively the URM wall’s collapse and all debris were contained, thus, 100% rate of human survival and minimum damage.
The CFRP layer/membrane is a very thin one (less than 1/8 inch usually) can be installed in a clever way hiding it architectural finishes. With a large increase in strength but a moderate increase in stiffness (10%), it consists of materials with strong ultimate tensile strength (3000 MPa). The guide for the design and construction of FRP systems is fully detailed in ACI- 440.2R-08.
The Slabs and masonry walls in College Hall will be coated with the CFRP material. This will limit the projectile debris from harming individuals. Also, in case of Slab failure, the debris not fall lower slabs and cause extra loads on it, which helps to avoid a progressive collapse.
2) Anti-shatter Film
Anti-shatter film (ASF), also commonly known as "shatter-
resistant window film" (SRWF) or "security film," is a laminate used to improve post-failure performance of existing windows. Applied to the interior face of glass, anti-shatter film holds the fragments of broken glass together in one sheet, thus reducing the projectile hazard of flying glass fragments. A more appropriate name for anti-shatter film would be "fragment reduction" film, since the methodology behind this hazard mitigation technique is focused upon retaining glass fragments resulting from blast overpressures.
VIII. SUSTAINABILITY STANDARDS CHECK
Before considering any upgrade in the building to meet
sustainable measures, it is important to understand its status. The standards reference used in the evaluation is “Existing Building Retrofit” guidebook, published by Centre for Sustainable Buildings and Construction, Building and Construction Authority. 1) Energy consumption was audited for electricity
consumption by reviewing energy bills, and was found to be 2,966,784 KWh in 2016, which is considered high.
2) Water consumption was reviewed and found to be six m3 per day.
3) The water fittings in College Hall are labeled under the Water Efficiency Labeling Scheme (WELS) and are sensor activated.
4) The lighting system (lamps, luminaires, and ballasts) was checked and found to be activated by motion sensors in corridors and in office.
5) The Building Management System (BMS) is a computer-based control system that monitors, controls and optimizes the mechanical and electrical equipment in the building, to identify its weaknesses.
6) In the college hall, fire alarms are installed and the Protection Office Control Room manages them and they comply with the Fire Code Regulations.
7) College hall is found to be accessible to the disabled through its main entrance. The disabled can access the Registrar or the Cashiers desk from the inside doors.

104
8) The ventilation system is will be checked to see whether natural ventilation is a feasible alternative. Based on the information provided by Miss Lilian, air cooled chillers are used. There are two units that provide college hall and their capacity is 200 Tons.
Table 4. Building Performance Assessment
Performance Grade Excellent Good Poor
Thermal Comfort
+ 0.5 MPV (Predicted mean
vote)
Energy Consumption 40th
Percentile
Water Consumption
WELS Excellent & Very Good Fittings
Mechanical System
100% planned availability and meeting current
functional demands - No standing
alarms, no losses or events- Fully
meets design functionality.
Electrical/IT/ Comms Sys.
100% availability- No event reports due to equipment
unreliability
Staff Satisfaction
Few complaints - Below average absenteeism.
Flexible Floor Plate
Very flexible- Multiple exits, no
internal columns or obstructions, easily
sub leased.
% of Net Lettable Area with 2.5% Daylight
30-60%
The level of refurbishment needed is level 1, Which means
minor refurbishment need to be made to College Hall to make it competitive with a new office building. Minor refurbishment requires for example installing modern blinds, revising layout to improve daylight and flexibility, repainting interior and other things.
ACKNOWLEDGMENT
The members of the group would like to thank the two advisors of the project, Dr. Mayssa Dabaghi and Dr. Hiam Khoury for their constant help and advice, also for sharing their vast and wide experience in both the fields of structures and construction management.
Also, the group’s members would like to acknowledge Dr. Ghassan Chehab, for general guidance throughout the process of completing this paper.
The group also thanks the security departments for their help in the risk assessment evaluation of College Hall
Finally, the group has the utmost gratitude for the FPDU personnel for supplying the layout plans of College Hall along with any other necessary data.
REFERENCES
[1] ACI (American Concrete Institute). “Guide for the Design and
Construction of Externally Bonded FRP Systems for Strengthening Concrete Structures”. ACI 440.2R-08. (2008)
[2] Barstow, E .“Fort Bragg Barracks Receives Pioneering Force Protection Retrofit (for Blast Loading)”. Public Works Digest. (2009).
[3] Brode, H.L. “Numerical solution of spherical blast waves”, Journal of Applied Physics, American Institute of Physics, New York. (1955).
[4] Brown, P. “UA Civil Engineers Blast Proof New UN Headquarter in Beirut.” University of Arizona Website. (2013).
[5] Buchana, P.A. and Chen, J.F. “Blast resistance of FRP composites and polymer strengthened concrete and masonry structures – A state-of-the-art review”. The University of Edinburgh. (2006).
[6] Ehsani, M., & Peña, C. “Blast Loading Retrofit of Unreinforced Masonry Walls With Carbon Fiber Reinforced Polymer (CFRP) Fabrics”. Structure Magazine, April, 16-20. (2009).
[7] Karlos, V., and Solomos, G. “Calculation of Blast Loads for Application to Structural Components.” Joint Research Center. (2013).
[8] Mays, G. and Smith, P. “Blast Effects on Buildings –Design of Buildings to Optimize Resistance to Blast Loading”, Tomas Telford. (2001).
[9] Moon, N. N. “Prediction of Blast Loading and its Impact on Buildings”, Department of Civil Engineering, National Institute of Technology, Rourkela. (2009).
[10] Ngo, T., Mendis, P., Gupta, A., and Ramsay, J. “Blast Loading and Blast Effects on Structures - An Overview.” Electronic Journal of Structural Engineering Special Issue, Loading on Structures. (2007).
[11] UFC (Unified Facilities Design). “Structures to Resist the Effects of Explosions. UFC 3-340-02 (2008)
[12] “Wetzel, J and Mitri, Y. The Special Tribunal for Lebanon: A Court for a Divided Country. The Law and Practice of International Courts and Tribunals. 7: 81–114. (2008).

105
1
BuildinganoffshorepetroleumriginLebanon
FYPInterimReport2016/2017
Groupmembers
OmarAlGhaly201401988
RamiNassar201402751
MahmoudKobeissi201401320
CamilleHoyek201400344
RidaKlink201400067
106
2
Abstract The recent discovery of oil and gas resources in Lebanon has created an urge to develop technologies allowing the exploitation of these resources. Moreover, considering the crisis that hit the oil prices recently, now is the time to start exploiting offshore resources before it is too late and not financially feasible. For that, the implementation of an offshore oil rig in Lebanese waters is suggested. Not only will this help revive the Lebanese economy by creating job opportunities and generating considerable revenues but also end the Lebanese national debts.
I. Introduction
The recent discovery of oil and gas resources along the Lebanese coastline has been a major undertaking in the country's limited economic spectrum. Furthermore, growing interest has been shown regarding the highly lucrative new market by banks, investors, international firms and politicians among many others. In fact, several papers have already been published regarding the feasibility of extracting oil and gas. However, no applicable plan has yet been proposed by concerned parties (“Credit Libanais Economic Research Unit” 2015). For that, the suggested solution is the implementation of an offshore oil rig in Lebanese waters. The main focus of this paper will be to provide an oil rig implementation plan. The fundamental steps undertaken in such a project include finding the optimal location, a set of pre-construction studies. As this venture is a rather complex one, extensive reviews of existing projects will be carried out, advice from experts in their respective fields will be sought and rigorous data mining will be required. The planning, design, and construction of an offshore oil rig in Lebanon is difficult due to the many constraints that govern this specific venture. Furthermore, an optimistic scenario would allow economic growth in Lebanon as the role of oil and gas in a country's economy has been known to be of primary importance.
II. Literature Review
Nowadays, numerous offshore facilities exist with different characteristics. In choosing the right offshore structure for oil and gas exploration, the most controlling factor involved is the extreme marine environment present whether above or below seafloor level. It is the reason why advanced geologic studies are conducted to assess soil types and stratigraphy. In order to do that, multinational oil and gas companies come into the picture for the implementation and operation of such projects. “Today there are 1,470 offshore oil rigs around the world” (Brixey-Williams 2015). The Gulf of Mexico and the North Sea are home for the largest number of oil rigs with respectively 213 and 184 rigs. Offshore structures must be safely designed to serve for a period of twenty-five years and therefore selection is particularly based on water depths. Major events that marked the history of oil and gas in Lebanon will be pointed out, followed by the description of different types of offshore oilrigs which are split into mobile and fixed platforms. Then, a research conducted by the USGS on the geologic composition of the seabed substrate will be tackled and finally several case studies will be discussed.
1. Case Studies Jack – St Malo Deepwater is a project located in the Gulf of Mexico between two oil fields; Jack Field (2,133 m) and St Malo Field (640 m). The fields are located in geological formation called “Lower Tertiary” which was deposited around 65 million years ago, about 6,096 m below the seabed. The deep-water project sits 609 m over the seabed with reservoirs beginning at 5,944 m below the seabed. The fields were discovered around 2003 using drilled wells. They are estimated to contain enough resources for projects lasting 30 to 40 years, around 500 million oil-equivalent barrels. The type of rig used is a semi-submersible floating reaching a depth of approximately 2,133 m. In 2010, an investment of 7.5 billion US dollar was made to proceed with the first phase of the project development. Production from this project started in the end of 2014. ("Jack / St Malo Deepwater Oil Project, Gulf of Mexico" 2016)

107
3
2. Types of oil platforms a) MobilePlatforms
As opposed to drilling barges, jack-up rigs operate from a working platform that is elevated above sea level. This is made possible by three or four surrounding legs that are lowered until they reach the sea floor. Another major difference is that jack-up rigs are suitable for shallower water depths up to 150 m. Operating above sea level gives an advantage of using this type of rig over any other since it is considered safer. Having their operating platform in contact with the ocean or seawater, submersible rigs consist of two hulls positioned on top of each other. The upper hull is used as the crew living quarters and contains the drilling platform. The lower functions as a submarine: when the rig is in motion, the hull is filled with air increasing the rig’s buoyancy. Once at the drill site, air is let out of the lower hull making the rig submerge back to the sea. This type of rig shares a lot of common features with semi-submersible rigs. However, the action of semi-submersible rigs against heave make them suitable for depths ranging from 180 to 10,600 m. This is made possible by reducing the contact area between the hull and the water using several circular columns beneath the deck (“SEA for Petroleum Activities In Lebanese Waters.” 2012).
b) FixedPlatformsFixed platforms or compliant towers are very similar in that they are formed of a narrow tower fixed to a foundation on the seafloor. However, the advantage of the compliant tower is that it is more flexible making it possible to operate in deeper water. Tension leg platforms consist of 4 columns making the structure very similar to that of the semisubmersible. Its attachment to the seabed using tension cables prevents vertical movement of the structure. The conventional design is suitable for water depths ranging from 200 to 1,100 m however, modified designs can go up to 2000 m. Spar platforms are very similar to tension leg platforms but differ in the use of more conventional mooring lines instead of vertical tension cables. Three designs are usually adapted: the conventional one-piece cylindrical hull, the truss spar and the cell spar. One advantage of using spar platforms is that their implementation is considered more economical for mid size rigs and their heavy counterweight gives them more stability and can go
up to 3,000 m (“SEA for Petroleum Activities In Lebanese Waters.” 2012).
3. History of oil and gas in Lebanon After drilling wells in 1926 and collecting data from seismic surveys, the Lebanese Petroleum Administration (LPA) was founded in 2012 to handle and organize all the research done and that will be done regarding this subject. ("TIMELINE OF EVENTS | Lebanese Petroleum Administration" 2016)
4. Geologic Composition European Marine Observation and Data Network, provided data on the geology of the seabed around Europe including the North Sea, the Mediterranean Sea and other coasts. The seabed surface substrate in the Mediterranean Sea is mainly mud and sandy mud, whereas in the North Sea, it is composed of sand and coarse substrate. This composition is needed in order to design a specific foundation for the oilrig (Emelyanov et al. 1996). In 1926, according to the Lebanese Petroleum Administration, a geological mapping was performed on the coast of Lebanon and in the Mediterranean Sea. The focus of this bathymetric study will be on the Lebanese coast. The depth of water in the Lebanese waters reaches approximately 2,130 m. In 2007, GeoArabia provided a map of the stratigraphy of the Levantine basin, offshore Lebanon and Syria. The main lithologies present in offshore Lebanon are marl, chalk, limestone and sandstone. This data is crucial for the completion of the design of the oil rig’s foundation (Roberts and Peace 2007). Regarding the hydrocarbon potential, a French consultant group, Beicip-Franlab analyzed a seismic data performed on the region (Levantine Basin) in 2011 to assess the deep layer of sediments (up to 10,000 m). This study resulted in the discovery of Mesozoic and Cenozoic sediments. All elements were present to successfully have hydrocarbon in Deepwater. In 2010, the USGS (U.S. Geological Survey 2010) estimated approximately 1.7 billion barrels of recoverable oil in the Levantine Basin. In 2012, British Spectrum company had estimated around 25 trillion cubic feet of gas only in Lebanon.

108
4
5. Oil reservoirs After meeting with the President of the Lebanese Petroleum Administration, Mr. Wissam Chbat, information regarding oil reservoir was gathered. In Lebanon, hydrocarbons form in source rocks defined as type II which are mainly algae and dead animals. Over the years, the hydrocarbons charge existing reservoirs surrounding them by following a migration path. Depending on the porosity of rocks, the reservoirs will be charged accordingly. An oil reservoir is sealed from all sides to ensure that the oil and gas present would not escape. As Mr. Chbat said, 80% of the Lebanese seabed has a 1,500 m thick layer of salt that prevents the content of the reservoir to flow out.
III. Methodology
1. Methodology In order to proceed with building an offshore oil rig in Lebanon, probing data or maps will be used from previous reports in order to assess the location and quantities of available reserves. However, quantities that will be acquired are only estimates and leaks from oil companies that worked on the exploration of oil and gas in Lebanon. The location and depth of reserves will have to be assumed in one of the ten blocks delineated by the Lebanese Petroleum Administration. Using bathymetric and seabed substrate studies conducted in the Mediterranean Sea, data on depths and soil types will be available. The seabed soil type and depth will determine the type of anchor foundations to be designed. Moreover, interview with Dr. Ghorayeb and Mr, Wassim Chbat president of the Lebanese Petroleum Administration will be conducted in order to acquire more information about different types of projects that can be incorporated in Lebanon and various maps that can be used to assess the design of the offshore platform. From the data collected in previous steps, the rig type will be chosen according to the seabed depth and substrate while the location will be determined from the distribution of blocks. The choice of rig will also be chosen depending on the information given by Mr. Chbat.
As mentioned by Dr. Ghorayeb, chemical engineering professor and former Schlumberger employee, the hierarchy of oil companies is organized in the following manner. National oil companies (NOC) elects an international oil company (IOC) with a production sharing agreement (PSA). The IOC in its turn, subcontracts works to a service company that will be responsible for building and operating the facility.
2. Progress From the previously obtained maps, a possible location for the rig can be determined by imposing requirements on each of the above mentioned determining factors for any possible location. The first criterion is the choice of a block on which to operate, as divided by the Lebanese Petroleum Administration. As explained by the LPA president Mr. Chbat the ten blocks were delineated according to data gathered by the Lebanese Petroleum Administration in order to distribute risk and make each block equally attractive for international oil companies. It is clearly shown in the map below that larger blocks are deeper than smaller ones. Considering the distance from the Lebanese coast and a wide range of depths it would be ideal to go with blocks 10, 7, 4 or 2. However, as mentioned above, since all blocks are equally attractive, choosing block 4 with depth ranging from 686 m to 1,845 m, the most suitable facility would be a tension leg platform attached to the ground using anchors. The primary focus will mainly be on the seabed depth regarding the location of the rig within block 4 –as determined previously. The range for an acceptable operational depth of an oil rig of the above chosen type is between 1,500 m and 2,000 m, a range which encompasses the whole block as seen in Figure 6, leaving us with the freedom of placing the oil rig at any location within it. As for the underwater currents’ intensities, they are similar along the Lebanese coastline but vary depending on the water layer’s depth. Direction of the current is South to North, with currents moving parallel to the Lebanese coastline in this direction (El-Geziry and Bryden 2010). The following representation of currents can be derived from El-Geziry & Bryden, 2010.

109
5
Substrate type at the seabed is mud all across Lebanese waters (European Marine Observation and Data Network 2016), while in-depth stratigraphy is composed of hard rock – varying between chalk, limestone and sandstone depending on the exact depth in question and the exact latitude and longitude considered (Roberts & Peace, 2007). The soil type is thus similar in characteristics regarding the eligibility of a specific location as an implementation site. To favor an easy and fast transportation of materials and labor during construction, and to favor accessibility to the platform during its whole lifespan, a relatively close to shore location will be chosen. The final location will be located by overlaying data maps on google earth, thus obtaining the following coordinates: - Latitude: 34° 8'19.32"N - Longitude: 35°14'27.20"E
IV. Oil Rig Implementation Constraints
1. Political Constraints Lebanon has always been conditioned by the political situation of its neighboring countries. It has always been affected by political constraints in the region. Many conflicts in the Levant have impacted Lebanon and impeded its growth and prosperity over the years. The Lebanese-Israeli conflict is no different. The two countries have been at war for years, and have no diplomatic relations. This hostility hindered the delimitation of their maritime borders. This being said, there are overlapping maritime areas between the two countries. Tension is always on the rise and strong verbal statements between the two governments have been launched, for years, both threatening each other from the consequences that will follow if a country tries to steal from the other country’s resources. (Meier 2013) Legally, every country is entitled to exercise its sovereignty over its exclusive economic zone. Nonetheless, as long as the maritime border are not defined, Lebanon will not be able to exploit or manage the resources present in what is still an undetermined area. Despite the absence of a Lebanese-Israeli maritime border limitation, the borders from the Cypriot side
were supposedly set in 2007 when Lebanon signed a maritime agreement with Cyprus. Nonetheless, this agreement was contested by a Cypriot-Israeli one in 2009, further complicating the border delimitation. (Wählisch 2011) The maritime border delimitation itself is not the only political burden preventing Lebanon from exploiting its offshore resources. The internal political discords are another major reason. The different political parties in Lebanon are still contesting over the division of these resources among them, obstructing the exploitation of the resources, even in the uncontested parts of the Lebanese exclusive economic zone. There are two decrees pending the approval of the Lebanese Cabinet. These decrees are crucial to the start of the tendering process. The first relates to the blocks division and the second to the tender protocol and the model agreement. The different political parties in Lebanon are thriving to ensure that the exploitation of the reserves is to be divided among them, which is delaying the signature of the decrees, and thus, the start of the exploitation.
2. Economical and Financial Constraints Lebanon has been in huge debt for years which has exerted a huge pressure on its economy. Building an offshore oil rig is a very costly project which can cause a further strain on the Lebanese economy. Nonetheless, the revenues generated during the first seven years of oil and gas exploitation are expected to cover the Lebanese debt and can thus be a turning point for Lebanon’s financial and economic situation.
3. Environmental Constraints The environmental impacts of extracting oil and gas are numerous, not only resulting from the process of extraction, but also from locating the oil and getting the geological data of the region.The seismic surveys and studies performed to locate the oil have an impact on aquatic species: the waves affect the health of fish and the noise affects their hearing. Searching for deposits in the sea bed can lead to migratory patterns.Water pollution is a major impact of drilling: the fluid that is used in the process of cooling and regulating the pressure contains toxic elements (heavy metals and petroleum products). The result is affecting the health and reproduction of aquatic species and spreading the toxic substances through the food chain. The use of low aquatic toxicity and

110
6
high biodegradability drilling fluids should be taken into account to reduce water pollution.The risk of oil spills is also a big issue when it comes to evaluating the environmental impacts. Since the chemicals involved in the process are very toxic, spills into a body of water can damage the marine environment. Also, oil spill cleanups imply the use of biological and chemical methods. In other words, the addition of toxic microorganisms and dispersants to remove the oil is considered dangerous for its unknown effects on the long term. For that reason, safety standards must be sufficient to avoid oil spills.The operation of machinery and burn-off of gases on the offshore rigs emits huge amounts of nitrogen oxides, sulfur oxides, carbon monoxide and other volatile organic chemicals, affecting local air quality and contributing to global warming and climate change. (“The Environmental Impacts of Offshore Oil Drilling.” 2016)
4. Health and Safety ConstraintsDue to chemical exposure, the health of workers is at risk. Drilling and oil processing result in the emission of hazardous toxic chemicals (hydrogen sulfide…). If precautions are not taken (protection masks…), headaches, skin irritations, chemical burns, respiratory problems and cancers would be recurrent. On another hand, there is a continuous threat of fire and explosion on an offshore rig due to the presence of highly combustible gases. The areas that are most likely to be the source of accidents are gas chambers, electricity rooms, and oil tanks. Regular inspections and maintenance of the equipment, training of the employees and efficient equipment such as extinguishers are a must to account for such hazards (Chamberland 2015).
5. Geological ConstraintsUncertainties surround the project when it comes to determining the quantities of oil and gas present in the Lebanese waters. This is common to oil and gas explorations, since there are many factors that affect the presence of the resources. Studies and surveys have been conducted to determine the nature of the sea bed in Lebanon. However, given that the oil and gas resources are situated at a depth of 2,000 m or more, the studies do not provide enough information to have a precise image of the subsurface stratigraphy.
As explained by Mr. Wassim Chbat, probability of success study is performed in order to define the resources as “probable, possible, or proven reserves” (Chbat 2016). Nevertheless, currently, the Lebanese resources are yet to be proven, since no wells have been drilled. In Cyprus for instance, after having delineated the first oil reservoir, they starting drilling, but it turned out that the oil viscosity and the porosity of the source rock are low. Therefore, the oil could not be extracted. It was then, that they were able to modify their data and increase their accuracy. This is why uncertainties can be a huge problem in this field and can cause big losses.
V. References
• Brixey-Williams, S. (2015). “Where are the world’s oil rigs?” World Economic Forum, <https://www.weforum.org/agenda/2015/10/where-are-the-worlds-oil-rigs/> (Nov. 5, 2016).
• “Jack / St Malo Deepwater Oil Project, Gulf of Mexico.” (2016). Offshore Technology, <http://www.offshore-technology.com/projects/jackstmalodeepwaterp> (Nov. 4, 2016).
• “Deepwater Horizon.” (2016). Wikipedia, Wikimedia Foundation, <https://en.wikipedia.org/wiki/Deepwater_Horizon> (Dec. 6, 2016).
• "Magnolia (oil platform)". (2016). En.wikipedia.org, <https://en.wikipedia.org/wiki/Magnolia_(oil_platform)> (Dec. 4, 2016).
• “TIMELINE OF EVENTS | Lebanese Petroleum Administration.” (n.d.). TIMELINE OF EVENTS | Lebanese Petroleum Administration, <http://www.lpa.gov.lb/timeline.php> (Nov. 6, 2016).
• Chamberland, S. (2015). “5 Common Hazards Faced By Oil and Gas Employees.” Oilpro, Oilpro, <http://oilpro.com/post/2557/5-common-hazards-faced-by-oil-and-gas-employees> (Nov. 7, 2016).
• “The Environmental Impacts of Offshore Oil Drilling.” Soapboxie, <https://soapboxie.com/social-issues/the-environmental-impacts-of-oil-drilling> (Nov. 7, 2016).
• Wählisch, M. (2011). “Israel-Lebanon Offshore Oil & Gas Dispute – Rules of ...” American Society of International Law, <https://www.asil.org/insights/volume/15/issue

111
7
/31/israel-lebanon-offshore-oil-gas-dispute-–-rules-international-maritime> (Nov. 3, 2016).
• Meier, D. (2013). “Lebanon’s Maritime Boundaries: Between Economic Opportunities and Military Confrontation.” <http://lebanesestudies.com/wp-content/uploads/2013/10/maritime.pdf> (Nov. 3, 2016).
• “SEA for Petroleum Activities In Lebanese Waters.” (2012). Strategic Environmental Assessment (SEA) for Petroleum Activities in Lebanese Waters, Lebanese Petroleum Organization, <http://www.lpa.gov.lb/pdf/vol 4 gap analysis - sea for petroleum activities.pdf> (2016)
• “Off-shore Platforms.” (2010). Civil Engineering Resources, <http://civil-resources.blogspot.com/2010/06/offshore-platforms.html> (2016).
• “Seabed substrates and sedimentation rates of the European ...” (n.d.). <http://meetingorganizer.copernicus.org/egu2015/egu2015-13410-1.pdf> (Nov. 7, 2016).
• Credit Libanais Economic Research Unit. (2015). “OIL & GAS SECTOR: A NEW ECONOMIC PILLAR FOR LEBANON.” Credit Libanais SAL Economic Research Report.
• Roberts, G., and Peace, D. (2007). “Hydrocarbon plays and prospectivity of the Levantine Basin, offshore Lebanon and Syria from modern seismic data.” GeoArabia, 12(3), 99–124.
• El-Geziry, T. M., and Bryden, I. G. (2010). “The circulation pattern in the Mediterranean Sea: issues for modeller consideration.” Journal of Operational Oceanography, 3(2), 39–46.
• Choong. (2013). “Some design notes for semi-submersible and TLP.” Some design notes for semi-submersible and TLP, <http://kimwhye.blogspot.com/2013/08/basic-design-consideration-for-semi.html> (Dec. 8, 2016).
• S. F. Chou, F., Ghosh, S., and W. Huang, E. (1983). Conceptual Design Process of a Tension Leg Platform.
Appendix
Figure 1: History of oil and gas in Lebanon ("TIMELINE OF EVENTS | Lebanese Petroleum Administration" 2016)
igure 2: Types of fixed platforms (“SEA for Petroleum Activities In Lebanese Waters.” 2012).

112
8
Figure 5: Rig location obtained via google earth
Figure 6: Components of a tension leg platform (Choong 2013). Figure 7: Forces and reactions involved in a tension . . leg platform (S. F. Chou et al. 1983)
Figure 4: Water circulation in the Mediterranean basin (El-Geziry and
Bryden 2010) Figure 3: Seabed surface substrate (“EMODnet Geology Lot August” 2016)

113
ENHANCING MUNICIPAL CAPACITIES USING A GEOGRAPHIC INFORMATION SYSTEM Abdul Rahman Dankar, Issam El Baba, Ibrahim Itani, Tarek Itani, and Tarek Khayat
Department of Civil and Environmental Engineering, American University of Beirut
Beirut, Lebanon
[email protected], [email protected], [email protected], [email protected], [email protected]
Abstract With population growth and the increase in financial responsibility, municipal planning and resource management has become more
complex and in dire need of automated and organized management systems. To solve this problem, municipalities have employed digital applications to facilitate editing, storing and sharing data among many other benefits. Thus, municipalities started using geographic information systems (GIS) to assist in solving several infrastructure and services management problems. The town of Hammana in Mount Lebanon was chosen as a pilot location to introduce GIS-enhanced management applications in three fields of interest. The main area of focus of the project includes developing a system that can optimize pavement management practices, parking deficit assessment and and solid waste collection management. A pavement assessment system was devised such that pavement performance was assessed through geo-tagged images observed on an integrated map on ArcGIS. In addition, a roadway network was developed using existing and newly plotted roadway maps. The roadway network is used in conjunction with a file containing the existing waste bins and their capacities and a file containing the current buildings distribution to optimize waste collection routes, bin locations, and bin capacities under recycling and non-recycling conditions. Furthermore, this project takes advantage of ESRI ArcGIS’s power to assess the impact of future scenarios that involve changes to the current parking supply and demand for the cherry festival of Hammana. Although this project’s work is focused on the town of Hammana, it aims at developing a municipal infrastructure and management framework that could be applied to any town or city.
1 Introduction With population growth, increased financial responsibility
and increased complexity, the responsibilities of municipalities have increased significantly in terms of infrastructure/utilities management and municipal planning. As such, municipalities are evolving and started relying on advanced technologies to assist them in meeting the challenges of infrastructure service provision to a growing population. In this context, Geographic Information Systems (GIS) emerged as the preferred tool that municipalities are adopting for municipal planning to evenly allocate their resources and to provide efficient services. The purpose of this project is to develop a pilot municipal management system under a GIS framework to enhance municipal capacities towards improved service provision in Lebanon. The pilot municipality is located in the upper Metn area (Hammana) and was selected upon agreement with municipality officials to provide data and access to information in order to populate a GIS database and allow the implementation of the proposed system. This project was developed to facilitate operations and organization in municipalities through integrating data with maps. The newly developed system would enable easier creation of effective and
dynamic solutions.The engineering disciplines involved include pavement engineering management, environmental engineering, and transportation engineering.
As communities grew larger, the need for an entity to organize, plan and manage the interdisciplinary needs of the people was met with creating municipalities. However, as time evolved, the communities grew even larger and the infrastructure planning advanced, which required more effort and strategizing from the municipalities [1]. As a result, they began drawing and documenting detailed plans for the major infrastructure lines such as property lines, water and waste water, electricity, pavements and roads [2]. This step was essential not only for planning, but also for maintenance. However, with the digitization of data in modern days, municipalities found an opportunity to transfer their plans to computers for easier access and modifications [3]. This was achievable using many tools such as ArcGIS and AutoCAD. Moreover, using GIS in managing municipal activities and infrastructure has shown, until now, several benefits to local governments such as saving time, improving efficiency, providing good decision support, improving accuracy, and helping in managing resources and automating tasks [4]. GIS application also decreases planning costs and has positive

114
impacts on infrastructure projects [5]. GIS is advantageous because it combines information with its respective geographic location into one platform, a geodatabase. Thus, GIS was the primary tool used to complete the scope of work outlined below.
This project involves creating a GIS based framework to enhance the municipal capacity for the municipality of Hammana. After developing a geographic database, three main engineering applications were identified and implemented thoroughly. The first application includes creating a comprehensive pavement assessment system that can aid the municipality in managing its road maintenance plan. The second application consists of a framework for assessing parking deficit and a full plan on developing a parking area if a deficit is present. The third application includes a system to identify the optimal location and capacity of waste bins under existing conditions or in a completely new system. The study will also include optimizing a recycling scenario. Finally, GIS will be used to find the optimal routing for collection of the waste from the bins. 2 Methodology
The following sub-sections illustrate the methodologies adopted in order to complete the defined scope of work.
2.1 Pavement Assessment System A pavement assessment system was developed by
combining ArcGIS’s geographic referencing capabilities with the commonly used Pavement Condition Index (PCI) assessment method.
The PCI is a commonly used pavement assessment method worldwide. PCI is determined by calculating the Distress Manifestation (DM) and the Riding Comfort Index (RCR) [6]. PCI is calculated using the following equation:
𝑃𝑃𝑃𝑃𝑃𝑃 = 100(0.1 × 𝑅𝑅𝑃𝑃𝑅𝑅)0.5 − 320 − 𝐷𝐷𝐷𝐷320 (1)
DM is a function of the severity, density and weight of significance of several pavement distresses. Distresses are classified as surface defects, surface deformations and cracks with their respective subcategories [6]. Both density and severity range on a scale from 1 to 5 based on predefined criteria by the Pavement Distress Identification Manual prepared by the federal highway administration of the United States [7]. DM is calculated using the following equation:
𝐷𝐷𝐷𝐷 = ∑ 𝑊𝑊𝑊𝑊𝑊𝑊𝑊𝑊ℎ𝑡𝑡𝑖𝑖(𝐷𝐷𝑊𝑊𝐷𝐷𝐷𝐷𝑊𝑊𝑡𝑡𝐷𝐷𝑖𝑖 + 𝑆𝑆𝑊𝑊𝑆𝑆𝑊𝑊𝑆𝑆𝑊𝑊𝑡𝑡𝐷𝐷𝑖𝑖)𝑛𝑛
𝑖𝑖 (2)
The PCI calculated and the classification of the road under assessment is cross-referenced with a decision matrix that determines suitable time of maintenance.
ArcGIS was used to incorporate both PCI calculations and pavement condition documentation. A platform on ArcGIS was developed that uses distress severity and density inputs and generates PCIs and decision recommendations for road segments. In addition a color-coded map pinpointing areas of high urgency to low urgency of maintenance is generated.
Several data items were required to construct a database to be used throughout pavement management activities. These data items include road characteristics, geographic information, photographic documentation and pavement related information. ArcGIS is a practical platform because of its ability to incorporate all the aforementioned data items. The assessment phase started by collecting geo-tagged images of 150-meter pavement segments and projecting them on the developed GIS map of Hammana. The images were captured by mounting a wide angled GoPro camera on the hood of a vehicle. While driving at a cruise speed of 40 Km/hr, time lapse photos and videos of the pavement segments were captured. The time lapse photo frequency was predetermined in order to capture images at fixed distances. The next step included, assessing these segments by rating any existing pavement distresses according to severity and density. The ratings were entered into the PCI calculation matrix in ArcGIS. The PCI value is then processed through a Python code, based on the aforementioned decision matrix, which determines the urgency of maintenance.
2.2 Parking Deficit Assessment A parking deficit assessment framework was developed for
cases of sudden increase in parking demand due to a large inflow of vehicles into a specific area. The cherry festival of Hammana offered similar conditions and set the environment for building this framework.
Three scenarios were studied. The first is the standard festival where one street is closed and visiting vehicles park on the sides of the roads. The second scenario is when the festival expands to the extent of a large area reducing the available parking on the curb side of the street. The third scenario is when the festival has a number of visiting vehicles exceeding the amount of parking available on the streets.
The demand is deducted from the supply to check for deficit.
The supply is obtained by the following equation:
𝑆𝑆𝑆𝑆𝑆𝑆𝑆𝑆𝑆𝑆𝐷𝐷 = 𝑆𝑆𝑊𝑊𝐷𝐷𝑊𝑊𝑡𝑡ℎ𝑠𝑠𝑠𝑠𝑠𝑠𝑠𝑠𝑠𝑠𝑠𝑠 × 𝐷𝐷5.6 (3)
Where “n” is if the street allows one sided or two sided parking and 5.6m is the length of the parking in regulation.
The demand is obtained through the use of the Institute of Transportation Engineers (ITE) parking generation rates based

115
on the type of land use and built up area (BUA) of buildings in the analysis zone following the equation below [8]:
𝐷𝐷𝐷𝐷𝐷𝐷𝐷𝐷𝐷𝐷𝐷𝐷 = 𝐺𝐺𝐷𝐷𝐷𝐷𝐷𝐷𝐺𝐺𝐷𝐷𝐺𝐺𝐺𝐺𝐺𝐺𝐷𝐷 𝑅𝑅𝐷𝐷𝐺𝐺𝐷𝐷 × 𝐵𝐵𝐵𝐵𝐵𝐵 (4) A suitability modelling approach was adopted to locate
potential parking lots to refuge the deficit in parking supply. The model addressed multiple factors that are taken into consideration when choosing an appropriate land parcel to locate the parking facility. The governing factors include accessibility of land parcels with the road network, proximity from festival centre, if the land is built or not and the type of ownership whether privately or publicly owned. Each factor is s+tudied separately and parcels receive a score ranging from least suitable (1/9) to most suitable (9/9). The developed multiple assessment results and the nominated land parcels are inputted in a score matrix that determines the most suitable parking locations.
ArcGIS was used to calculate the governing parameters of the land parcels understudy and assimilate it with the scoring matrix. A platform on ArcGIS was developed that uses service area and geometry calculation to facilitate recommendations for appropriate land parcels. In addition, a color-coded map locating land parcels according to suitability to host a parking facility is generated.
Subsequently, detailed parking design was performed to the chosen parcel to accommodate for the deficit in parking spots and to manage the shuttles transporting visitors between the parking and the event centre. The Lebanese Building Code was taken into consideration in designing the parking stalls’ dimensions, regulating vehicular circulation within the parking, and accounting for the required clearance along with turning radii.
2.3 Waste Management Application
Firstly, the demand was calculated by estimating the average residency per building in Hammana. The generation per capita used was 0.8 kg/capita/day for rural areas according to a study done by the German Federal Ministry for Economic Cooperation and Development generation [9]. In order to cut down on unnecessary cost, two bin types were used according to the total waste generation: one with 120 L capacity and another with 1100 L.
Optimizing the bins location and capacity was conducted under three scenarios, which represent different municipalities’ requirements.
In the first scenario, the bins’ current location was preserved and the study compared the generation to the bins capacity to identify locations of shortage or surplus of capacity. As a result, the bins capacity was updated in the existing locations, and new bins were added and others were removed. In the second scenario, a completely new bins system is put in place which optimizes the bins location and capacity. In the third scenario, waste was split into three different bin types; one for organic waste, one for plastic paper and cardboard, and one for all other commingled waste. Finally, the optimal route for the collection of waste from the bins to the landfill is done using the network analyst extension in GIS.
In all the scenarios, the maximum utilization factors of the bins is taken as 90% to avoid spilling. The placement of bins in the study is based on the roads to ensure a bin could be reached by residents and by collection vehicles. Finally, the maximum walking distance from the buildings to the bins is calculated at 30m and at 100m which are both acceptable walking distance according to the Central Public Health and Environmental Engineering Organization (CPHEEO) in India which specifies the limit at 250 m [10].
3 Results The following sub-sections will include all the results
produced over the three fields of interest. These include detailed maps and figures outline the system created on ArcGIS
3.1 Pavement Assessment System The PCI assessment system coupled with the geographic
capabilities of ArcGIS creates an interactive interface where the process of pavement assessment is accelerated. Through geo-tagged images taken by the wide angled GoPro camera, an interactive map featuring images of road segments is generated as shown in fig. 1.
Thereafter, images are analysed and pavement distresses are judged based on the pavement distress identification manual. This process involves weighing distresses according to their severity and density. The next stage of the assessment involves calculating the parameters required to calculate the PCI and subsequently generating the required maintenance required of a selected road segment.

116
Figure 1. Interactive Pavement Assessment Tool
The assessment is concluded by organizing the road segments according to their maintenance requirements in the form of colour segregation as shown below.
Figure 2. Pavement Maintenance Priority Map
After assessing the distresses of Hammana’s main roads, 53% of the roads are found to be adequate, 13% of the roads need to be rehabilitated within 5 years, and 34% of the roads need rehabilitation within 6 to 10 years. The segment connecting Hammana and Saoufar is in a damage and in need of immediate reconstruction. As seen in fig. the roads leading to Hammana’s main roundabout need maintenance in the coming years because of cracks resulting from high traffic volumes. Although, the eastern Hammana-Falougha road is used heavily by traffic, it is adequate because it was rehabilitated in the summer of 2016. It must also be noted that several potholes were patched throughout the town; however, cracks were neglected.
3.2 Parking Deficit Assessment To assess the deficit, the analysis area was divided into two
zones, the curbside parking supply is selected and the buildings contributing to the demand are drawn in fig.3 below.
In the first and second scenarios, there was no deficit in the curbside parking supply for 200 vehicles visiting the festival area. This shows that even by closing all of zone 1 in the second scenario, the streets in zone 2 will be have enough spaces for the incoming vehicles.
In the third scenario, a high number of vehicles is inflowing (800 vehicles) such that there is a large deficit of 570 parking spots. Assessing streets further away from the festival zone will result in large walking distances for visitors so a solution consisting of a temporary off street parking with shuttles to and from the festival center will be adopted.
Figure 3. Parking Assessment Map

117
Figure 1. Interactive Pavement Assessment Tool
The assessment is concluded by organizing the road segments according to their maintenance requirements in the form of colour segregation as shown below.
Figure 2. Pavement Maintenance Priority Map
After assessing the distresses of Hammana’s main roads, 53% of the roads are found to be adequate, 13% of the roads need to be rehabilitated within 5 years, and 34% of the roads need rehabilitation within 6 to 10 years. The segment connecting Hammana and Saoufar is in a damage and in need of immediate reconstruction. As seen in fig. the roads leading to Hammana’s main roundabout need maintenance in the coming years because of cracks resulting from high traffic volumes. Although, the eastern Hammana-Falougha road is used heavily by traffic, it is adequate because it was rehabilitated in the summer of 2016. It must also be noted that several potholes were patched throughout the town; however, cracks were neglected.
3.2 Parking Deficit Assessment To assess the deficit, the analysis area was divided into two
zones, the curbside parking supply is selected and the buildings contributing to the demand are drawn in fig.3 below.
In the first and second scenarios, there was no deficit in the curbside parking supply for 200 vehicles visiting the festival area. This shows that even by closing all of zone 1 in the second scenario, the streets in zone 2 will be have enough spaces for the incoming vehicles.
In the third scenario, a high number of vehicles is inflowing (800 vehicles) such that there is a large deficit of 570 parking spots. Assessing streets further away from the festival zone will result in large walking distances for visitors so a solution consisting of a temporary off street parking with shuttles to and from the festival center will be adopted.
Figure 3. Parking Assessment Map
The large number of parcels (3200) makes a manual search for the best candidate a tedious task, the process is automated through the implementation of a suitability model based on multiple criterias which results in the following map fig. 4.
Figure 4. Potential Parking Sites by Score
The most favorable parcels for a parking have a score of 8.5
to 9. The area of the site should be enough to accommodate 570 vehicles which results for a site that has an area of 17’100 square meters. One parcel met all the criterias and is selected for design.
The selected parcel is designed following the Lebanese
guidelines having stalls with a size of 5.2m x1.8m, aisle width of 6m and two-way circulation. A shuttle drop-off area is allocated at the southern boundary of the parking.
The shuttles routes are designed to be the shortest possible allowing the visitors a quicker access to the festival zone. At a constant speed of 30 Km/h, the travel time will be 3 minutes. The shuttles will have a capacity of 10 passengers. To have a shuttle ready for carrying the visitors every minute, 7 shuttles are needed. This will result in a short waiting time and a higher transport capacity of the system. The following map in fig. 5 shows the routes adopted along with the selected parking site.
Figure 5. Shuttle Routes between Parking and Festival
3.3 Waste Management Assessment The optimization of the bins location and capacity results in
a map showing in fig. 6 the locations, number, and type of bins at each location. Currently, waste is collected in Hammana from the door of every household; each building has its own bin. Therefore, using the second scenario of allocating new bins proved more efficient in cost of bins and collection time.
The second scenario was run on a section of Hammana and the resulting map is shown in the figure below. The null locations on the map show prospective locations for bins that do not fall near any building, so no bin would be installed there. As shown in the map, all the bins were placed on roads and hence are easily accessible. Using this system, the average walking distance from a house to a bin is 48 m with a standard deviation of 30 m. The maximum distance recorded was 150 m which is an acceptable walking distance according to the Central Public Health and Environmental Engineering Organization (CPHEEO) in India which specifies an acceptable value of 250 m [10]. Finally, the use of two types of bins greatly improves the efficiency of the system; 54% less unused bins capacity was achieved in the executed model.

118
Figure 6. Map of Bins Location Plan by type and number
4 Conclusion In conclusion, GIS has proven to be a powerful tool for
municipal planning, facilitating data administration and mapping. The end product developed has also proven to be a powerful tool in optimizing municipal planning activities such as pavement, parking deficit and waste management assessment. The developed framework can be implemented in other municipalities throughout Lebanon. Finally, this project could be expaned to include other engineering applications in the various fields, such as water resources and power supply, based on municipal needs
5 Acknowledgments The group would like to extend its gratitude to Dr. Ibrahim
Alammedine, Dr. Mutasem Fadel and Dr. Ghassan Chehab for their guidance throughout the duration of this project. The group would also like to thank the municipality of Hammana for its cooperation and assistance.
6 References [1] T. Laosuwan and S. Ritjareonwattu, "An innovative
approach to the development of spatial data infrastructures and Web 2.0 technologies," International Journal of Geoinformatics, Review vol. 8, no. 2, pp. 53-61, 2012.
[2] M. P. Lewis and A. Ogra, "An approach of Geographic Information System (GIS) for good urban governance," in 2010 18th International Conference on Geoinformatics, Geoinformatics 2010, 2010.
[3] W. A. Abdulaal, "Framework for enterprise GIS for Saudi municipalities," International Journal of Geographical Information Science, Article vol. 23, no. 6, pp. 687-702, 2009.
[4] M. M. Alterkawi, "Measures towards a comprehensive municipal GIS - The case of Ar-Riyadh Municipality," Habitat International, Article vol. 29, no. 4, pp. 689-698, 2005.
[5] M. E. Hayward and A. Shelvey, "How Geographic Information Systems (GIS) can benefit the small municipality," Journal of New England Water Environment Association, Conference Paper vol. 38, no. 1, pp. 69-81, 2004.
[6]J. Hajek, W. Phang, A. Prakash and G. Wrong, "Performance Prediction for Pavement Management", in 1st North American Pavement Management Conference, Ontario, 1985.
[7] Federal Highway Admistration, "Distress Identification Manual", US Department of Transportation, Washington DC, 2003.
[8] McCourt Ransford S, and Kevin G Hooper. Parking Generation. 3rd ed. Washington, D.C., USA: Institute of Transportation Engineers, 2004. Print.
[9] German Federal Ministry for Economic Cooperation and
Development (BMZ), "Country report on the solid waste management in LEBANON", Moe.gov.lb, 2014. [Online]. Available: http://www.moe.gov.lb/Main/Announcements/Announcement/SolideWaste2015/2-LEBANON-COUNTRY-REPORT-ON-SWM-2014.aspx [Accessed: 17- Mar- 2017].
[10] CPHEEO “Manual on Municipal Solid Waste
management”, Central Public Health and Environmental Engineering, pp.219-227. New Delhi, India, 2000.
[11] Ontario Good Roads Association, "Ontario Good
Roads Association", Ontario Good Roads Association, Ontario, 2017.

119
Appendix
Table 1. PCI Decision Matrix [11]
Time of Improvement
Freeway Arterial Collector Local
Adequate >85 >85 >80 >80 6 to 10 years 76 to 85 76 to 85 71 to 80 66 to 80
1 to 5 years 66 to 75 86 to 75 51 to 70 46 to 65 Now Rehabilitate
60 to 65 50 to 55 45 to 50 40 to 45
Now Reconstruct
<60 <50 <45 <40
Table 2. Sample Results of the waste bins allocation
Bin Number Roads ID Total Demand Average Distance (m) Bldgs Count Number of Bins
1 15 64 26.8 1 1 small 2 130 448 48.7 7 1 large 3 136 256 71.5 4 1 large 4 137 256 62.0 4 1 large 5 138 64 17.1 1 1 small 6 139 128 55.8 2 2 small 7 140 128 45.4 2 2 small 8 141 448 47.2 7 1 large 9 197 512 47.2 8 1 large
10 198 192 127.3 3 2 small 11 199 64 72.1 1 1 small 12 330 192 100.0 3 2 small 13 331 576 37.0 9 1 large 14 332 192 28.6 3 2 small 15 333 64 21.0 1 1 small 16 334 64 39.7 1 1 small 17 335 384 83.3 6 1 large 18 336 128 148.2 2 2 small 19 485 128 74.2 2 2 small 20 494 128 31.2 2 2 small 21 495 64 17.9 1 1 small

120
Figure 7. Code Steps for Optimizing Existing Bins Locations on GIS

121
Implementation of a Light Rail System in the Beirut Area
Michel El Boustany, Marc Hachem, Majed Sader, Mario El Feghali, Michel Nseir
Department of Civil and Environmental Engineering American University of Beirut Bliss Street, Beirut, Lebanon
[email protected], [email protected], [email protected], [email protected], [email protected]
Abstract The implementation of a light rail network from scratch in the Beirut area will be studied in details from several perspectives. Linking the downtown area, core of the city, to the airport and extending along the Bechara El-Khoury corridor, the light rail will finally serve the uprising demand for a fast and comfortable public transport mean. This project will serve under the theme of Conceptualization and Design since the main goal is to design a concept of a light rail that satisfies the needs of the population on several aspects.
Research will be conducted as a start to know more about the existing public transport network and a comparative study will be performed between the light rail system and other means of transport that could also be implemented in the region. Also, research on new and efficient light rail networks, benchmarks from other countries and a first budget forecast will be derived to arrive to the most efficient network.
Furthermore, on an environmental perspective, not only will the emissions of greenhouse gases be examined and monitored according to the Lebanese standards but also will the sound pollution, the location of sound barriers and the impact on households. The study will include a detailed structural design of a typical light rail station, a maintenance station, the track alignment and also the design of the foundation to be provided below the track in order to support the moving load as well as a distribution of the stations in the Beirut area. The network will be simple, consisting of stations and one maintenance station at the beginning and end of the railway path. The circulation, the number of vehicles in the fleet, the number of stations, the staff needed and other logistics will be looked at from a closer perspective.
Finally, a preliminary non-technical design of a mobile application that could facilitate the user experience will come to light, allowing the people to know how and when to utilize the system.
I. INTRODUCTION
With the ever-increasing Lebanese population and therefore number of transport vehicles in greater Beirut area, Lebanon is currently facing a severe traffic problem that will only get worse in the upcoming years. Moreover, Lebanon has lacked sustainable and efficient transport system and infrastructure, exacerbating the level of congestion on the roads.
Many different alternatives were drawn up to reduce the traffic congestion in the area of Beirut. These include the attempts to control and reorganize the bus network in the city, the expansion of arteries and roads, the creation of an underground railway system and other trials. The first alternative mentioned was ruled out since the majority of buses are owned by the private sector and do not easily respond to the public sector regulations. Moreover, every option involving the expansion of roads requires the use of new lands which are not available in a high densely occupied city like Beirut and therefore is not optimal solutions. The light rail system is a realistic and doable solution that, unlike the underground system, does not require immense construction works and excavations. The installed track will be a ground level structure with its own right of way except in high congestion areas where an elevated design will be proposed. The system will be composed of outer and inner loops that covers approximately all the Beirut area. In order to bring back the old nostalgia of tramway in Lebanon and at the same time keep pace with the technological advancement, the light rail system is proposed. This project will serve under the theme of Conceptualization and Design since the main goal is to design a light rail system from scratch. The methodology of the analysis will be tackled first, followed by the results and discussion and finally the recommendations.
II. METHODOLOGY
1. Transportation Aspect: Data Collection:
Throughout the design, data will be collect from private and governmental companies and organizations which are: Khatib and Alami, Dar Al-Handasah and SETS as private organization as well as Beirut municipality. The possible data that will be acquired from the organizations cited above:
- Transportation studies already conducted for Beirut such as the K&A BRT project study.
- The volumes of vehicles and passengers at different times and locations and for different origin-destination options.
- Factors to consider in the mode-choice and demand forecast models (from surveys).

122
Modeling demand using data:
The different data collected will be used to model the demand. The data collected will be analyzed as such to localize the places with high demand and low demand and help in defining stations and alignments right after that. For the mode of transport choice modeling, the logit model will be used and is based on the concept of utility maximization and taking into consideration factors including travel time, travel cost, seat availability, number of transfers and passenger comfort. The utility formula is as follows [1]:
(1)
: parameter defining the importance of factor k on the utility of the user
: value of attribute k for alternative i. The probability of choosing a certain alternative over the others is then computed as follows [1]:
(2)
Definitions of stations, vertical and horizontal alignment:
After collecting the data of the system under study, stations will be defined along the rail using Google Earth for locations and on-site visits. Vertical and horizontal alignments will be shown in the section "Findings and results" later in the report in a Google Earth image. Tables of two alternatives of the different stations as well as the distance between each station and the other one will be shown.
Operational Characteristic Analysis:
Further analysis and study will help determining the number of tracks in the system, the number of rail lanes, the capacity of each rail car (by performing the demand forecast) and the speed of the rail car (by studying a successive stop scenario and an alternative stop scenario)
2. Structural Field:
The structural design of the project will be conducted according to the ACI code, and through the use of AutoCAD. For the column design, static load and distributed uniform load will be taken into consideration for the elevated railway car. For the railway deck design, it will be design depending on the material that will be used. The station design will be designed on AutoCAD to be adequate to the amount of people that will be waiting on the stations as well as the possibility of the implementation of solar panels on the station will be discussed later.
3. Environmental Aspect:
Air Emission: In order to conduct the air impact study, the following data should be collected to conduct the study:
- Emission of CO2 by cars (g/km), tree CO2 consumption (kg) and emission of CO2 per KWh
- Number of cars, average number of people per car and distance traveled by car per year (km)
- Usage of electricity by the LRT (KWh/km) calculations of tons of CO2 produced
To calculate the equivalent car emissions saved by the LRT, the number of passengers between each two stations was found. The number of passengers is multiplied by the distance between the stations. Using the relation of the number of persons per car, the distance equivalent is computed, which was converted to carbon dioxide (CO2) using the appropriate factors. By deducting the emissions produced from the LRT from the amount of emissions “equivalent”, the net saving is found.
Noise pollution:
The sound level to be considered depends on the distance between the closest building and the track, the noise level equivalent can be found using these following formulas [2]:
(4)
Leq hour (50 ft): Equivalent continuous noise level over an hour at 50 feet from the track (dBA) Leq (D): Equivalent continuous noise level at a distance D (feet) from the track (dBA) N: Average number of locomotives per train S: Speed of the train, in mph V: Hourly volume of train traffic during peak-hour to be more conservative, (trains per hour) SELref: equal to 80 dBA
By iterating for different distances, it can be found that different ranges are found for each of which measures will be taken. If the building is far away (more than 15.6m) no noise-reducing measures will be implemented. If the distance is closer to the track (minimum. distance 5.75m), noise barriers as well as sound-proofing windows may be installed to the building.

123
Modeling demand using data:
The different data collected will be used to model the demand. The data collected will be analyzed as such to localize the places with high demand and low demand and help in defining stations and alignments right after that. For the mode of transport choice modeling, the logit model will be used and is based on the concept of utility maximization and taking into consideration factors including travel time, travel cost, seat availability, number of transfers and passenger comfort. The utility formula is as follows [1]:
(1)
: parameter defining the importance of factor k on the utility of the user
: value of attribute k for alternative i. The probability of choosing a certain alternative over the others is then computed as follows [1]:
(2)
Definitions of stations, vertical and horizontal alignment:
After collecting the data of the system under study, stations will be defined along the rail using Google Earth for locations and on-site visits. Vertical and horizontal alignments will be shown in the section "Findings and results" later in the report in a Google Earth image. Tables of two alternatives of the different stations as well as the distance between each station and the other one will be shown.
Operational Characteristic Analysis:
Further analysis and study will help determining the number of tracks in the system, the number of rail lanes, the capacity of each rail car (by performing the demand forecast) and the speed of the rail car (by studying a successive stop scenario and an alternative stop scenario)
2. Structural Field:
The structural design of the project will be conducted according to the ACI code, and through the use of AutoCAD. For the column design, static load and distributed uniform load will be taken into consideration for the elevated railway car. For the railway deck design, it will be design depending on the material that will be used. The station design will be designed on AutoCAD to be adequate to the amount of people that will be waiting on the stations as well as the possibility of the implementation of solar panels on the station will be discussed later.
3. Environmental Aspect:
Air Emission: In order to conduct the air impact study, the following data should be collected to conduct the study:
- Emission of CO2 by cars (g/km), tree CO2 consumption (kg) and emission of CO2 per KWh
- Number of cars, average number of people per car and distance traveled by car per year (km)
- Usage of electricity by the LRT (KWh/km) calculations of tons of CO2 produced
To calculate the equivalent car emissions saved by the LRT, the number of passengers between each two stations was found. The number of passengers is multiplied by the distance between the stations. Using the relation of the number of persons per car, the distance equivalent is computed, which was converted to carbon dioxide (CO2) using the appropriate factors. By deducting the emissions produced from the LRT from the amount of emissions “equivalent”, the net saving is found.
Noise pollution:
The sound level to be considered depends on the distance between the closest building and the track, the noise level equivalent can be found using these following formulas [2]:
(4)
Leq hour (50 ft): Equivalent continuous noise level over an hour at 50 feet from the track (dBA) Leq (D): Equivalent continuous noise level at a distance D (feet) from the track (dBA) N: Average number of locomotives per train S: Speed of the train, in mph V: Hourly volume of train traffic during peak-hour to be more conservative, (trains per hour) SELref: equal to 80 dBA
By iterating for different distances, it can be found that different ranges are found for each of which measures will be taken. If the building is far away (more than 15.6m) no noise-reducing measures will be implemented. If the distance is closer to the track (minimum. distance 5.75m), noise barriers as well as sound-proofing windows may be installed to the building.
4. Pavement and Material Specifications: The pavement materials to be used will be defined following the speed of the rail car and the location of the different stations. In the case of sharing the same lane with cars, a different type of pavement will be provided depending on the data collected for this issue, as well as for the elevated sections of the railway. Also, the materials for both the stations and the tracks installed will be carefully selected by reviewing material specifications from charts gathered in data collection and by looking at several benchmarks
5. Management Field:
Benefit cost analysis will be performed in parallel with data collection. Two benefits cost analysis will occur. The first one related to the implementation of the light rail system in comparison with other public transport modes that can be implemented. The second one will be performed on a later stage concerning the implementation of solar panels on the roof of the stations to justify its usage by means of cost to benefits or else remove it. The light rail system chart will be done by using the data collected and by locating the critical points to be covered by the system. The scheduling and frequency of the different rail cars will be analyzed and set depending on the volume of people estimated on each future station at different times of the day.
III. RESULTS AND DISCUSSIONS
1. Transportation Analysis:
Comparison between LRT and other modes:
The two formulas mentioned in the methodology part above were used in order to establish a logit model in order to compare different modes of transport considering two factors: travel time and travel cost. The four modes of transport used in the model were: car, bus, taxi and service. Two models were established, one without LRT and one including LRT. In the first model excluding LRT, service had the highest probability (30%), whereas in the second model including LRT, LRT had the highest probability (26%). The logit model results are shown in Figure 8 and Figure 9 in the Appendix.
Stations: The station locations were distributed along the Bechara El Khoury highway, starting and ending by maintenance stations at the airport and at the Martyr’s place. The small in-between stations will only have simple functions. The stations have been placed mostly near intersections or in locations where there is a high user density. The distance between stations is
approximately 1km which is not too short and therefore allows a fast travel time. At the same time, the distance is not too large to increase the system accessibility by users. The distribution of the stations and the distance between them are shown in the table below. Placing the station in the middle of the path is advantageous where the number of stations to construct will be reduced (No need for two stations in each direction but simply one 2-way station). The Location of the stations as well as the distance between each station is presented in Table I below:
TABLE I
LOCATION AND DISTANCES BETWEEN THE STATIONS
Station Distance Between Stations (m)
Cumulative Length (m)
Pre-Station - -
Martyrs Place 140 140
Sodeco 770 910
Barbeer 850 1,760
Horsh Beirut 970 2730
Ghobeiry 1,480 4,210
Great Prophet 1,450 5,660
Beirut Airport 1,790 7,450
Pre-Station 140 7,590
Path:
The path that links the stations from the martyr’s place to the
airport is almost straight (no need to study curvature). It is a two-way path links the martyr’s place to the airport and vice-versa. A plan view of the track alignment is shown in figure 1 below. The two rails, adjacent to each other, will mostly be at the middle of the highway. It is only at the station locations that the track will widen out, leaving room for the station in the middle. At the two maintenance stations, enough space will be given for the railways to make a turn and switch direction. A study of the exact curvature is on-going and will be presented in a later stage. The first draft of the path made on AutoCAD with a Google Earth background is Figure 6 in the Appendix.
Figure 1. Plan view of the track alignment

124
Pedestrians: Locating the railway in the middle of the highway made
pedestrian access a critical issue. One proposed solution was to install light signals before and after the stations, which would make the passenger passing safer. However, both the congestion created by such initiative and the risk of having some vehicles burn the red light outweigh the benefits offered. Another approach consisted in digging and constructing a tunnel below the highway allowing crossing which is not practical; the chances of having a high-water table, shutting down the highway for construction for a long period and possibly breaking infrastructure lines lead to cast out such approach. The optimal solution was to construct cross pedestrian bridges of concrete above the train, allowing the users to reach the station and embark/disembark safely. A representation of the concept is shown in the AutoCAD drawing in Figure 7 in the Appendix.
Speed:
The speed for the light rail should be in average between 65
to 90 km/hour [3]. An optimal speed of 75 km/hour will be taken in the study, implying an average speed of 50 km/hr with (stops, deceleration, etc..). Since the train is running at a speed greater than 55 km/hour, the light rail transit crossings should be equipped with flashlights according to the Manual of Uniform Traffic Control Devices [3].
Demand and Capacity:
In order to determine the number of trains required and the
capacity of each one, data were collected from Dar Al-Handasah and a model was established. We derived the number of people boarding, disembarking and on board at each station from the Marty’s Place all the way to the Airport and vice versa. Calculations were made based on several factors:
- Demand (Peak Hour, Non-Peak Hour and Low demand)
- Weekdays and Weekends - Both Directions - Year 2020 and 2035
A total of twelve tables were issued combining all of the factors above. The values at peak hour during weekday in 2020 and in 2035 are shown in Table II in the Appendix.
The values in the table have been computed by attributing to each demand rate a factor and by using the formula below from 2020 to 2035:
(5)
An example histogram in 2020 and 2035 on weekday at peak
hour is presented in Figure 3 and in Figure 4 in the Appendix showing that the people using the Light Rail will increase significantly from 2020 and 2035.
Having a peak of 739 people on board at Horsh Beirut station in 2020 at peak hour on weekday and a peak of 1,152 people at Horsh Beirut at peak hour and on weekday in 2035.
Number of Trains:
The cycle time can be calculated using the formula [1]:
(6) Cycle time: round trip travel time (min) L: one-way route distance = 7.6 km Vav: average speed = 50 km/h Number of stops: 7 (in way) Stopping time: 45 sec = 0.75 min Layover and terminal time at each end: 5 min
Therefore, the total cycle time is calculated below:
For a fixed headway of 10 minutes which means that at any point in the system, a train passes every 10 minutes, and for a calculated cycle time of 33.5 minutes, the number of vehicles required can be calculated following this formula [1]:
(7)
To satisfy the demand, four trains in each direction must be provided each one having a capacity of 230 people [7], this satisfies the peak demand which is 1,580. Since each train passes each 10 minute, 1,580/6 = 263 approximately satisfied by a 230-capacity train. Structures Analysis:
Stations:
The two-end stations at the Martyr’s Place and at the Airport
will be maintenance stations constructed mainly with steel. The stations in between will be very simple steel stations
constructed with a roof bending over at approximately 90 degrees.
Loads and Forces:
The loads and forces used in the design of the railway are presented in the Table II and III below [8]:

125
TABLE II
DEAD LOAD CONSIDERATION
Element Load assumption Track rails 200 lb per linear ft of track
Own Weight of the concrete structure
150 lb per cubic ft
TABLE III
TRACK ELEMENT DESIGN
Vehicle Load per Wheel 12,000 pounds Track Modulus
Timber Tie Concrete Tie
2,500 lb/inch square [17.2 N/mm2 ] 5,000 lb/inch square [34.5 N/mm2 ]
Desired load transfer to Ballast
Subgrade
<65psi [0.45Mpa] <20psi [0.14Mpa]
Ballast Depth
Around 12 inches [300 millimeters]
Sub ballast Depth 8 inches [200 millimeters]
Foundation: A 4 to 5 meters wide excavation for the track will be
necessary. The soil profile will have many layers in order to support the moving and the static loads [4]:
1- Asphalt 2- Ballast (Top Ballast, Bottom Ballast, Sub Ballast) 3- Soil Fill 4- Natural Ground
A typical section of the foundation below the railway is
shown in Figure 2 below:
Figure 2. Typical foundation section
Typical Elevated Section:
A typical elevated section will be designed. It will be used at
some intersection where the on-ground rail may interfere with the existing structures and roads. However, elevated sections were reduced as much as possible in order to avoid ups and downs during the rides.
The elevated rail will be supported by steel piers which design and calculations will be shown in the final report. The slope of the rail will be 6% [3].
The parabolic formula for a vertical curve is illustrated through the following equation [1]:
(8)
Since the vertical curve to be designed is symmetrical, with a g1 = 6% and g2 = -6%, and L = 90m, then to find the difference in elevation (which is at midpoint), the x should be assigned a value of 45m.
Hence, the offset between the two elevations is of 1.35m, which means that the highest point reached by the vertical curve is at 1.35 meters above the original height of the rail.
2. Environmental Analysis:
Air pollution:
In Lebanon, a running car produces on average 260.4 g/km of CO2 [5]. Assuming an average of 2 people per car, the length of the path from Martyr’s Place to the Airport being of 7.6km, one car containing two people produces on this distance 2 kg of CO2. On one lane of the highway from Martyr’s Place to the Airport approximately per trip, 1250 cars can pass at peak hour (This number was found by dividing the whole distance by the average length of one car taken to be 3m and leaving a space of 3m between a car and another). These values engender a production of 2,500 kg of CO2 per trip.
Whereas the Light Rail consumes 127 g/passenger-km on average for a total emission of 32kg/km [6]. On the whole distance of 7.6 km it will be a consumption of 243.6 kg. One light rail can satisfy the trip to 500 individuals equivalent to 250 cars. Then at peak hour 5 trips must be made to satisfy all the passengers in the 1250 cars, engendering a total carbon dioxide emission of 1230 kg. Ignoring tree absorption, we can deduce that on average for one trip at peak hour, the Light rail economize 1,270 kg of CO2 which is approximately 50% of CO2 reduction.
Noise pollution:
Having the path of the railway designed on AutoCAD,
distance will be measured from the center of the railway to the houses near the highway. Noise barriers may be provided on some sections of the path were the distance between the center

126
of the railway and the closer house is less than 15.6m. The sections corresponding to the installation of the sound barriers are highlighted in Figure 10 in the Appendix.
3. Materials Analysis: The materials to be used were specified within each section.
Stations and railway will be formed by steel as well as the piers supporting the elevated railway. Concerning the foundation below the rails, different layers has been specified for the whole path, however, a layer of concrete will be added on top at the station because the stopping of the railway there could cause cracking.
4. Management Analysis:
Cost: A developed table will be provided in the final paper when
all the different materials and the final quantities and path length will be specified as well as the unit price of each one of the above.
For the ticket cost, we established a survey at Bechara El-Khoury and asked people how much they are willing to buy for a seat in the Light Rail. The survey results are shown in Figure 5 in the Appendix. According to this survey and to further studies the price of the ticket will be specified in the final report.
Schedule:
A schedule for the trains will be establish. In general, the
trains will start circulating at 5am until midnight. The stopping time at each station will be of 45 seconds [9].
Application:
A mobile application could be developed in a further step
allowing a better accessibility to the people by showing them approximately after how many minutes the train will arrive at a specific station and how much time will it take from the user’s location until his/her destination. Also, to encourage the users, points could be accumulated through the application by using the train more often and will results in free rides by attaining a certain number of points.
IV. CONCLUSION AND RECOMMENDATIONS
Knowing that the theoretical background filtered from the sources served as a ladder for the studies conducted and that the case studies visited offered concrete support to every assumption or result derived, the team is certain that more resources, studies and surveys will be used in future times to support future studies. Beirut is a critical city to lunch a mass transit system in due to its political instability and the lack of data/studies in it, which encourages the team to rely on
numerous sources in order to avoid any misconceptions or errors. Most parts of the project have already been tackled; some small tasks and details are still on-going and will be presented on a later stage. On the transportation side, it is essential that the light rail system be implemented in the Beirut area, leading to a significant reduction in traffic and in travel time from the Martyr’s place all the way to the Airport and vice-versa. Also, the offered system will serve the demand of the people leaving from the airport and will save them time trying to catch a taxi or find another way of transport. From the environmental perspective, this project will reduce the air pollutant emissions especially CO2 as mentioned in the section above. This reduction will be a sustainable measure for our environment. On a later stage, the team will dig deeper into the details and a benefit cost analysis table will be presented.
ACKNOWLEDGMENT
Many thanks are attributed to the technical advisors Dr. Isam Kaysi and Dr. Maya Abou Zeid for their continuous support and for the feedback they offered throughout this paper preparation. The meticulous and professional guidance of Dr. Chehab is also much appreciated.
REFERENCES [1] Wright, P. H., and Dixon, K. Highway engineering, 7th ed. Wiley,
Hoboken, NJ, 2004. [2] Hanson, C., Towers, D., Meister, L., “Transit Noise and Vibration
Impact Assessment”. U.S. Department of Transportation, Federal Transit Administration Office of Planning and Environment, 1200 New Jersey Avenue, S.E. Washington, DC 20590, 2006.
[3] Transport Research Board of the National Academies, Track design
handbook for light rail transit. National Academy Press, Washington, D.C., 2012.
[4] Nalsun, R.“Railway Ballast Chracteristics, Selction Criteria and
Performance”. Thesis for the degree of Philosophiae Doctor, Norwegian University of Science and Technology, Trondheim, 2014.
[5] Mansour et al., ADEME, “The Transport Sector”, Chapter 5, 2011 [6] Bradley MJ. “Updated Comparison of Energy Use& CO2 Emissions From
Different Transportation Modes.” Updated Comparison of Energy Use & CO2 Emissions From Different Transportation Modes, 2014.
[7] Siemens Industry, Inc. “San Diego, California.” S70 Light Rail Vehicle,
2014. [8] Fleming G. “Guide Specifications for Structural Design of Rapid Transit
and Light Rail Structures”. Massachusetts Bay Transportation Authority, Massachusetts, 2005.
[9] Denver Transit Partners. “Design Basis Manual for the Eagle
Project .” Contract 18FH012 , CDRL 7A-05, 2013.

127
APPENDIX
TABLE IV
DEMAND DATA AT PEAK HOUR DURING WEEKDAY IN 2020 AND 2035
Martyr's Place to Airport - Peak - Weekday
2020 2035
Stations Boarding Disembarking Number of Passenger on Board
Boarding Disembarking Number of Passenger on Board
Martyr’s Place 613 613 955 955
Sodeco 163 62 714 254 97 1112
Barbeer 186 241 659 290 375 1027
Horsh Beirut 215 135 739 335 210 1152
Ghobeiry 195 256 678 304 399 1057
Great Prophet 41 138 581 64 215 906
Beirut Airport 581 0 905
Figure 3. Histogram showing demand in 2020 at peak hour during weekday Figure 4. Histogram showing demand in 2035 at peak hour during weekday
Figure 5. Survey result showing the different prices to pay for a ride

128
Figure 6. Plan View of the path at the Airport Terminal Station
Figure 8. Results of the first model with only four modes of transport
Figure 9. Results of the first model with only four modes of transport compared with LRT
Figure 10. Noise Bracket
Figure 7. Typical widening of track and pedestrian access to station

129
Karantina Master Development Plan: A Pragmatic Approach Towards Area Regeneration
Fares Lattouf, Kamal Nakouzi, Nada Khraich, Ahmad Merhebi, Reina El Mustapha
Department of Civil and Environmental Engineering American University of Beirut
Hamra-Lebanon [email protected], [email protected], [email protected], [email protected], [email protected]
Abstract- Urban planning regulations in Lebanon have remained outdated for decades. Governments did not consider putting effort regarding changing the laws to accommodate for present conditions. Until today, governments issue building permits erratically without taking into consideration different land uses and zones. Karantina neighborhood was one of the victims of such improper zoning regulations. Thus, different land uses dominated the area in a disorderly manner. This paper presents a practical master development plan aiming to regenerate the area by tackling problematic issues in the fields of zoning, transportation, structures, and environment. The impact of the master plan is studied socially by integrating public views, economically by estimating the project’s costs and studying potential economic booms, and environmentally by assessing the environmental impacts. The end results of this plan include reduction of the negative effect of intertwined zones and enhanced road connectivity through the design of a directional ramp. In addition, educational and commercial facilities are proposed aiming to enhance the socio-economical aspect of the area. Finally, a solution to the waste crisis is provided through a waste to energy management strategy.
I. INTRODUCTION
Throughout the past couple of decades, Lebanon has encountered several occupations and internal conflicts. Due to the occurrence of these conflicts and the lack of proper governmental urban planning, many parts of the country were subject to poor road networks and conditions, deprived infrastructure, and improper zoning regulations. Radical social and geographical divisions became evident. Among the most affected regions was the Karantina neighborhood, the northern entrance of the capital, Beirut. Until the present time, the neighborhood did not undergo any major development and is still socially alienated from other areas in Beirut, with minimal infrastructural connectivity. Essential facilities, including educational and commercial institutes, are missing. Internally, the area consists of a port and two major zones, industrial and residential, that are overlapping and intertwining in a disorderly fashion. Within these zones, residents are divided into three social groups with massive differences in sects, beliefs, and social traditions. Additionally, many undesired facilities, such as a firefighting center, a slaughter house, and Sukomi waste sorting facility, are in the area. Army barracks deployed bases in many sites in an unorganized manner impeding connectivity within the neighborhood. The negative outcome of this chaos is the degradation of the quality of life and the dissatisfaction of residents and visitors of the area.
Appendix B shows a snapshot of the neighborhood in reference to landmarks in Beirut.
The paper aims to develop a pragmatic master urban development plan that incorporates the technical and social aspects to ultimately benefit and fulfill the needs of area stakeholders. The master plan delivers solutions in accordance to zoning regulations, transportation and connectivity, design of needed facilities, and management of solid waste using waste to energy methods. To do so, the paper proceeds such as the next section provides a literature review on master planning, urban transportation planning, waste to energy methods, and the neighborhood social and property features. It is followed by a data collection and analysis section after which the developed master plan is set. The impacts of the plan are evaluated socially, economically, and environmentally. Finally, the paper concludes with a summary of the master plan outcomes.
II. LITERATURE REVIEW
A. Master Planning A master plan is a document that provides relevant
information needed for community development. It acts as guidance for local officials and addresses social, economic, environmental, and transportation solutions. The purpose of a master plan is to guide any public/private entity towards future growth of communities. It sets the vision and objectives towards future improvements, and inaugurates development rules and principles. The common thing between all master plans is that each plan is comprehensive and sustainable for a period of five years or more. A master plan opens the door for decision making and fulfills the desire of stakeholders by providing development and growth ideologies [1]. Developing a successful master plan is a process of multiple crucial steps that act as guidelines aiming to shape the future of a desired location. It starts by preparing a methodology that identifies the SWOT (strengths, weaknesses, opportunities, and threats) of the area under study. Data collection with respect to land use, traffic and roadway conditions, utilities and municipal services, housing, environment, and commercial activities are used to analyze current conditions. Next, a vision is set to seek for a development strategy and an economical plan. Weaknesses from SWOT analysis can be evaluated to set a list of priority projects essential to revive the area [2].

130
B. Urban Transportation Planning Poor urban environment forces residents to move out of
their communities to nearby places. A sustainable and successful master plan considers an efficient urban transportation planning strategy to improve the quality of life and standard of living. The ease of accessibility of a community with the “mother” urban area and its surroundings is a key factor achieved via an effective road design network and proper use of transportation modes. An appropriate land use, good zoning, and proper location of residential and commercial territories can lead to enormous economic gains and development of a strong social interface. Several ways exist for improving the town modal transportation systems. One method is maintaining traffic movement and decreasing stops. Another method is designing sufficient sidewalks to promote ease of walkability within a community [3].
Designing a ramp-freeway junction is a critical task given the importance of the overall safety performance of a controlled facility. Ramps increase workload on drivers, since more entrance and exit maneuvers should be done implying an increased likelihood of driver error. Introducing an exit ramp to a highway needs to take into consideration the speed of the moving vehicle [4].
C. Waste to Energy As population increases, the demand for natural resources
increases. Thus, the limited natural energy resources are becoming scarcer. Efforts are put by the global energy organizations to develop alternative energy production techniques. On another hand, the burden that wastes impose on any village, city, or even country can be turned out to be beneficial in energy production. Waste management plans aim to control the huge volume of wastes being produced every day. Several energy production techniques such as incineration, pyrolysis, plasma arc gasification, and refused derived fuel can release energy from wastes. Such techniques are promising in both the field of energy and the field of waste management [5].
Incineration is a thermal process designed to reduce the volume of the waste generated. The process relies on the combustion of organic compounds present in the waste streams, ultimately converting them into ash and heat. The heat generated can be used as an energy source. Recently, many developed countries have been diverting from landfill disposals and opting for incineration and recycling. This is mainly due to the rising awareness of climate change and material conservation. Municipal Solid Waste (MSW) is the targeted waste when it comes to incineration due to its high organic composition [6].
D. Karantina Neighborhood Social and Property Features Residents in Karantina neighborhood, part of Moudawar
district in Beirut, belong to three different demographic groups: Maronite group, Arab Al Maslakh group, and an Armenian group. These groups suffer from the lack of potential social connections and the diversity is not considered and ultimately wasted. Additionally, the three groups reside in different parts of the neighborhood. This fact is not allowing
the area to have a unified identity. Concerning the property classification system of the area, properties are divided into five categories ranging from high density to low density and large to small scale properties [7].
III. DATA COLLECTION AND ANALYSIS
Developing a master plan is a dynamic process that considers long term results affecting various stakeholders, usually with contradicting wants and needs, and is affected by regulations and legislations. The first step to satisfy stakeholders’ needs on the long term is identifying and categorizing the stakeholders themselves. Stakeholders in the neighborhood are classified into two groups, primary and secondary. The primary stakeholders are the residents and the industrial proprietors, while the secondary stakeholders are the municipality officials and the government body. To identify the needs or visions of each group, surveys and interviews were conducted sampling residents from different social groups, industrial proprietors, area spokesman, and municipality officials. Residents’ needs included providing necessary institutes, public spaces, and developing a solution to the poor waste management practices. Area spokesman encouraged limiting army barracks deployment in the area into a single zone to reduce the effects of the unsystematic spread. However, all stakeholders agreed that a comprehensive development plan that targets major improvements of road connectivity and conditions and enhancements of the economic situation in the neighborhood is vital.
A. Current Zoning Current zoning regulations in Beirut divide the
neighborhood into two zones, seven and nine. Zone nine, the port, is a “Non Aedificandi” zone where no building of any size is allowed. On the other hand, in zone seven, the rest of the area, 70% surface exploitation factor of land is permitted. Zone seven is further separated into two blended zones, residential and industrial. Fig. 1 shows the delineation of current zones emphasizing the degree of overlap between different regions in the neighborhood. Furthermore, the properties in zone seven are divided into two types, private and public (owned by the municipality) as shown in Fig. 2. Large public properties are considered the most influential when setting new zoning laws. Other municipal properties exist, yet they are relatively very small to consider for planning.
Figure 1. Current zones

131
•Large industrial zone
•Waste accumulation
•Large municipal properties
•Lack of needed facilities
•Lack of road connectivity
•Presence of army barracks
•B018 night club •Forum De
Beyrouth •Public park
S W
T O
Figure 3. SWOT analysis
Figure 2. Public properties
A. SWOT Analysis Identifying strengths, weaknesses, opportunities, and threats
is an essential analysis of the current situation. Fig. 3 shows a SWOT analysis which studies the different types of land uses in the neighborhood.
B. Urban Transportation Planning Data regarding external connectivity, internal road
conditions, and circulation is needed to develop an effective urban transportation plan. Table I shows dimensions of Charles El Helou highway, the major road passing through the neighborhood. A traffic survey on Charles El Helou highway aiming to measure the capacity and level of service was conducted by the Council for Development and Construction in Lebanon. The capacity of the highway in the direction from Beirut to Dora facing Forum Du Beyrouth was found to be equal to 1929 passenger car/hour/lane and a level of service “E.” to dominate. To assess the practicability of current external connectivity with the neighborhood, two experiments were conducted measuring the travel time from the interchange facing Forum De Beyrouth on Charles El Helou highway (side leaving Beirut towards the north) to the northern most road in the neighborhood (adjacent to B018).
The first experiment was performed during heavy traffic hours consuming 38 minutes, while second experiment was done during light traffic hours consuming 3 minutes. Since heavy traffic times prevails, this data demonstrates the need for an alternative route connecting the “mother” urban area, Beirut, to the neighborhood.
Internally, to obtain an estimate of the number of trips generated per day, to and within the neighborhood, traffic counts were performed sampling two weekdays and two weekends during “am” and “pm” peak hours. The experiments were done by counting the number of vehicles in parking, on the sides of the streets, and those circulating. Moreover, since Forum De Beyrouth is a large entertainment venue, strongly affecting the trip generation on event days, a traffic count was done on one event day to account for the extra traffic. Summing up the study, a traffic count targeting trucks entering the area to deploy wastes in Sukomi waste sorting facility was also done. Table II summarizes the results of the conducted traffic counts.
TABLE I
HIGHWAY DIMENSIONS
TABLE II
TRAFFIC COUNTS
C. Waste Management Council for Development and Reconstruction (CDR) data
shows that the total solid waste generated in the greater Beirut area is approximately 2794 tons/day. Sukomi waste sorting plant, receives 61.5% of this waste. The remaining portion goes to a sorting plant in Amroussieh. In both Karantina and Amroussieh, waste is manually sorted since no important source-separation plan is currently implemented in Beirut. To properly assess and improve the current waste management plan, data on waste distribution (by weight) in Lebanon is shown in Appendix A. Arriving at Sukomi sorting facility in Karantina are 1805 tons/ day of which only around 185 tons/ day of organics and 100 tons/ day of recyclables are being sent to the composting and recycling plants respectively. The rest of waste is to be disposed in landfills. The current waste management plan presents many flaws due to the insufficient number of waste management facilities including recycling plants. Most of the compost being produced ends up in landfills since no such markets are available in Lebanon. Further, the Nehmeh landfill has reached full capacity, leaving no proper place for the large amount of waste to be disposed of. These reasons promote the need to design a new waste
Highway Width 30 m (including median) Median Width 4 m Number of Lanes 8 lanes (4 on each side)
Weekday automobile traffic count 850 trips Weekend automobile traffic count 550 trips Event automobile day traffic count 2150 trips Waste truck traffic count 105 trips

132
management plan to improve current conditions and find suitable methods to dispose wastes efficiently.
IV. IMPLEMENTING THE MASTER PLAN
As proposed by this paper, a practical master development plan is put to serve the needs of stakeholders. The amendments include setting new zoning regulations to reorganize the neighborhood into residential and industrial zones with minimal overlap. A directional ramp serving as a connectivity enhancement with the surrounding is designed. The ramp connects Charles El Helou highway (side leaving Beirut towards the north) to Karantina neighborhood. Complimentary structures including a school design and a public/commercial space are proposed. Finally, two alternative waste management plans aiming to produce energy from waste through incineration are presented. The first alternative discusses the design of an incinerator given the current waste management situation in Lebanon, while the other alternative suggests an incinerator design based on a near optimum waste management plan.
A. New Zoning Current zoning regulations and delineation shows the
excessive convergence between the residential and industrial regions within the area. Aiming to mitigate this issue, new zoning regulations are set dividing the industrial area into three different portions, light, medium, and heavy. The heavy industrial area is located closest to the port encompassing the waste management complex. The advantage of such placement is that all odors and gas emissions will move with the dominant wind direction, towards north east and accordingly towards the Mediterranean Sea. The light industrial area is in regions with close residential proximity. The army barracks are grouped and placed on one territory. Despite of the new zoning regulations, some residential areas are still in direct contact with industries. Since mitigating such a problem requires demolition and relocation of existing structures, a green wall is proposed to compliment the new zoning plan and avoid any relocation. The wall acts as a barrier separating residential buildings from near industries. It extends around 385 meters within the neighborhood and has a height of 5 meters. Fig. 4 shows the new zoning regulations and the green wall.
B. Educational and Commercial Facilities The conducted surveys and interviews with stakeholders
justifies the need of introducing educational and commercial facilities to enhance the standard of living within the neighborhood. Accordingly, a public school is designed using AutoCAD to accommodate approximately 450 students. A public space with basic commercial shops including clothing and food is proposed. Both the school and the commercial/public space are located within the large public property (adjacent to Charles El Helou highway). The school takes the place of current warehouses, while the public space substitutes the current army zone within the property. Fig. 5 shows the locations of the newly added facilities.
Figure 4. New zoning
Figure 5. New facilities
C. Urban Transportation Planning Given the poor road connectivity and aiming to improve the
roadway conditions, a one-lane directional ramp, from Charles El Helou highway (side leaving Beirut towards the north) towards Karantina neighborhood is designed using AutoCAD Civil 3D. The ramp is designed to land on the edge of a large public property within the area, occupying a small portion of the property. Fig. 6 shows a map of the roads within Karantina neighborhood including the designed ramp.
The designed ramp is 5m wide and 406m long with a design speed of 30 km/hr. The ramp decreases the capacity of the highway from 7716 pc to 5787 pc. A decrease in the highway’s median width and lane width from 4m to 1m and 3.5m to 3m respectively is essential to prevent any reduction in capacity maintaining the highway’s level of service (LOS) the same. The time needed to commute towards Karantina neighborhood with the new ramp design is calculated to be 50 seconds. Comparing the time needed to reach Karantina neighborhood currently with the ramp’s travel time presents a motivation to accept the design proposed. Regarding the area’s internal transportation, a new circulation plan is set to ease commuting within the neighborhood given the new structures, public space, and directional ramp. Multiple two way streets were changed into one way routes to provide more on street parking and account for the extra traffic resulting from the proposed improvements.

133
Figure 6. Road network and designed ramp
D. Waste to Energy Two alternative waste management plans for waste arriving
at the Sukomi sorting facility in Karantina both aiming to achieve energy recovery from waste through incineration are discussed. The operational lifetime of both incinerator designs is around 20 years. Both alternatives are designed on a public land currently used as a solid waste disposal area. Fig. 7 presents the location of the proposed incineration plant. Given the current conditions, the first alternative is based on the existing waste management plan, while the second alternative is based on the possibility of developing a near optimum waste management plan considering proper sorting (at source and in advanced sorting plants) and advanced recycling and composting.
Alternative 1: The waste arriving at Sukomi sorting facility in Karantina is classified into 3 categories: bulky items, high residual recyclables, and other wastes. Bulky items that sum up to 5 tons per day are sent to landfills. High residual recyclables consisting of metals and glass summing up to 102.6 tons per day are sent to available recycling facilities in Beirut and its proximity. Other wastes are composed of organic and inorganic waste materials. Twenty percent of the organic wastes summing up to 185.04 tons per day are sent to Coral composting plant producing 69 tons per day as rejects. Thus, the incinerator design capacity is calculated to accommodate the amount of inorganic wastes and rejects from composting equivalent to 1581.4 tons/day. This value is rounded up to 1600 tons/day.
Figure 7. Incinerator location
At the end of the incineration process, the waste reduced to 208 tons per day is sent to landfills and the energy produced is approximately 880 MWh/day given a production rate of 0.55 MWh/ton.
Alternative 2: The design of this alternative follows the same procedure as alternative 1, yet the amount of waste sent to recycling plants and composting facilities increases to 402.6 and 500 tons per day respectively. These numbers rely on the assumption that multiple recycling and composting facilities are developed in Lebanon. An incinerator capacity of 1000 tons per day is needed to accommodate for the residuals from this plan. The amount of wastes sent to landfills is 160 tons per day and the energy produced is approximately 550 MWh/day. Both waste management alternatives are further elaborated in Appendix A. Table III shows the gaseous emissions resulting from each alternative in tons per year.
TABLE III
GASEOUS EMISSIONS
V. EVALUATION OF THE MASTER PLAN
A. Cost Estimation Prices per unit meter and meter squared are estimated by
looking at similar projects done in Lebanon and around the world. The cost is then calculated by multiplying unit prices with the number of units relevant to each improvement as shown in table IV. The revenue of each alternative, considering income from recycling and composting material whenever relevant is shown. The payback period is then calculated to be 18.6 years and 11.13 years for incinerators 1 and 2 respectively.
B. Traffic Forecast Using the “Institute of Transportation Engineers Trip
Generation Handbook,” the number of trips generated resulting from the addition of a public school, a public and commercial space, and an incinerator are calculated and displayed in Fig. 8 with a comparison to current trip data. The projected trips are served by all entrances to the area, including the newly designed directional ramp.
TABLE IV
COST ESTIMATION Item Cost Revenue Public School $ 1,794,500 - Green wall $ 231,000 - Directional ramp $ 3,195,433 - Incinerator 1* $ 62,610,640/year $ 36,653,760/year Incinerator 2** $ 26,376,360/year $ 20,284,423/year
*An additional capital cost $447,000,000 ** An additional capital cost of $279,000,000
Gases Alternative 1 (tons/yr) Alternative 2 (tons/yr) CH4 0.57 0.39 N2O 1.72 1.08 SO2 28.68 17.92 NOX 160.60 100.38 CO2 126185.70 78866.07
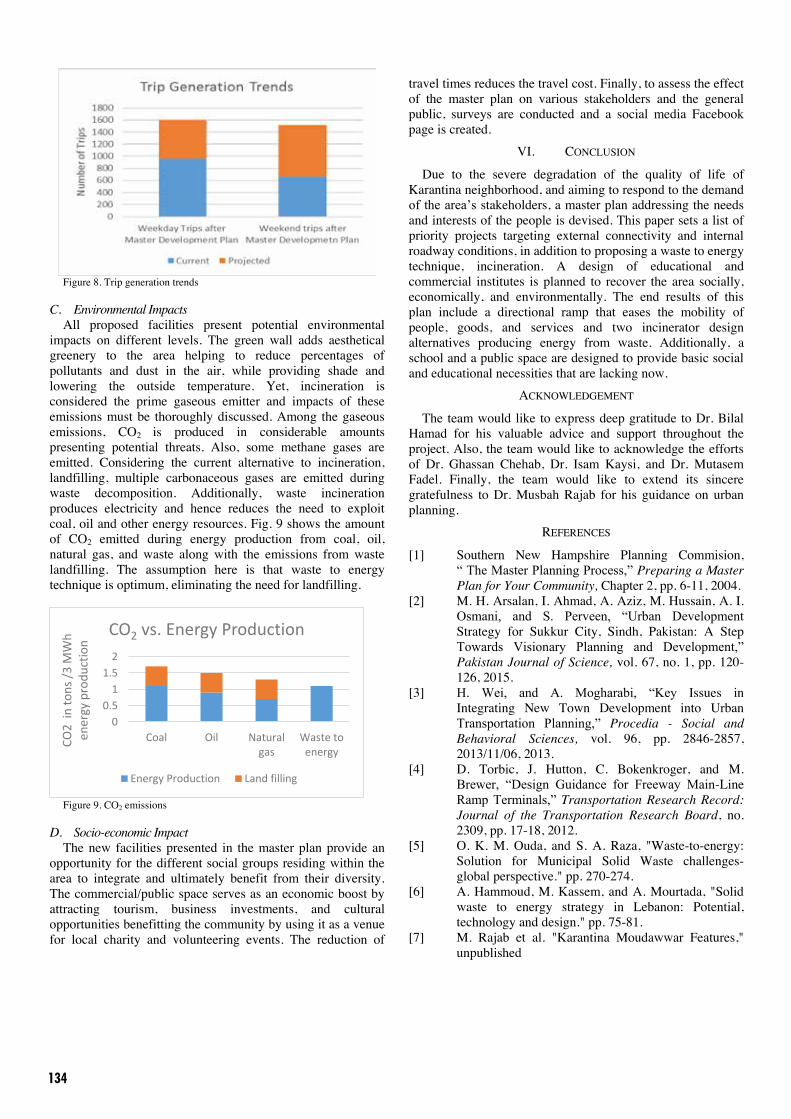
134
Figure 8. Trip generation trends
C. Environmental Impacts All proposed facilities present potential environmental
impacts on different levels. The green wall adds aesthetical greenery to the area helping to reduce percentages of pollutants and dust in the air, while providing shade and lowering the outside temperature. Yet, incineration is considered the prime gaseous emitter and impacts of these emissions must be thoroughly discussed. Among the gaseous emissions, CO2 is produced in considerable amounts presenting potential threats. Also, some methane gases are emitted. Considering the current alternative to incineration, landfilling, multiple carbonaceous gases are emitted during waste decomposition. Additionally, waste incineration produces electricity and hence reduces the need to exploit coal, oil and other energy resources. Fig. 9 shows the amount of CO2 emitted during energy production from coal, oil, natural gas, and waste along with the emissions from waste landfilling. The assumption here is that waste to energy technique is optimum, eliminating the need for landfilling.
Figure 9. CO2 emissions
D. Socio-economic Impact The new facilities presented in the master plan provide an
opportunity for the different social groups residing within the area to integrate and ultimately benefit from their diversity. The commercial/public space serves as an economic boost by attracting tourism, business investments, and cultural opportunities benefitting the community by using it as a venue for local charity and volunteering events. The reduction of
travel times reduces the travel cost. Finally, to assess the effect of the master plan on various stakeholders and the general public, surveys are conducted and a social media Facebook page is created.
VI. CONCLUSION
Due to the severe degradation of the quality of life of Karantina neighborhood, and aiming to respond to the demand of the area’s stakeholders, a master plan addressing the needs and interests of the people is devised. This paper sets a list of priority projects targeting external connectivity and internal roadway conditions, in addition to proposing a waste to energy technique, incineration. A design of educational and commercial institutes is planned to recover the area socially, economically, and environmentally. The end results of this plan include a directional ramp that eases the mobility of people, goods, and services and two incinerator design alternatives producing energy from waste. Additionally, a school and a public space are designed to provide basic social and educational necessities that are lacking now.
ACKNOWLEDGEMENT
The team would like to express deep gratitude to Dr. Bilal Hamad for his valuable advice and support throughout the project. Also, the team would like to acknowledge the efforts of Dr. Ghassan Chehab, Dr. Isam Kaysi, and Dr. Mutasem Fadel. Finally, the team would like to extend its sincere gratefulness to Dr. Musbah Rajab for his guidance on urban planning.
REFERENCES
[1] Southern New Hampshire Planning Commision, “ The Master Planning Process,” Preparing a Master Plan for Your Community, Chapter 2, pp. 6-11, 2004.
[2] M. H. Arsalan, I. Ahmad, A. Aziz, M. Hussain, A. I. Osmani, and S. Perveen, “Urban Development Strategy for Sukkur City, Sindh, Pakistan: A Step Towards Visionary Planning and Development,” Pakistan Journal of Science, vol. 67, no. 1, pp. 120-126, 2015.
[3] H. Wei, and A. Mogharabi, “Key Issues in Integrating New Town Development into Urban Transportation Planning,” Procedia - Social and Behavioral Sciences, vol. 96, pp. 2846-2857, 2013/11/06, 2013.
[4] D. Torbic, J. Hutton, C. Bokenkroger, and M. Brewer, “Design Guidance for Freeway Main-Line Ramp Terminals,” Transportation Research Record: Journal of the Transportation Research Board, no. 2309, pp. 17-18, 2012.
[5] O. K. M. Ouda, and S. A. Raza, "Waste-to-energy: Solution for Municipal Solid Waste challenges- global perspective." pp. 270-274.
[6] A. Hammoud, M. Kassem, and A. Mourtada, "Solid waste to energy strategy in Lebanon: Potential, technology and design." pp. 75-81.
[7] M. Rajab et al. "Karantina Moudawwar Features," unpublished
00.5
11.5
2
Coal Oil Naturalgas
Waste toenergy
CO2
in to
ns /3
MW
h en
ergy
pro
duct
ion
CO2 vs. Energy Production
Energy Production Land filling

135
Appendix A Waste distribution by weight and elaboration on waste management alternatives 1 and 2 respectively
51.40%
15.60%
13.40% 2.20%
3% 3.50% 1%
3.40% 2% 4.50%
Waste Distribution by Weight
Organics Paper & Cardboard plastics Metals
Textiles Glass Wood Diapers
Others Losses
Karantina (1805 T/d)
Manual Sorting
Other wastes (1697.4 T/d)
Organics (925.2 T/d)
Coral composting facility
(185.04 T/d)
Rejects (69 T/d)
Others (740.2 T/d)
Others (772.2 T/d)
Incineration (1581.4 T/d)
Rejects to landfill (208 T/d)
High residual recyclables (glass and
metals) (102.6 T/d)
Recycling centers
Bulky Items (5T/d)
Bsalim Landfill

136
Appendix B Snapshot of Karantina neighborhood (bounded by the red line) relative to landmarks in Beirut.
Karantina (1805 T/d)
Manual Sorting
Other wastes (1397.4 T/d)
Organics (925.2 T/d)
Coral composting facility
(500 T/d)
Rejects (75 T/d)
Others (425.2 T/d)
Others (472.2 T/d)
Incineration (972.4 T/d)
Rejects to landfill (160 T/d)
Recyclables (glass, metals, and others)
(402.6 T/d)
Recycling centers
Bulky Items (5T/d)
Bsalim Landfill

137
Rehabilitation and Management of Sebaali Quarry in Metn Region
Nicolas El Marj – Tarek Gebran – Serge Karam – Christian Lahoud – Chaoul Saber
Civil and Environmental Engineering Department American University of Beirut
[email protected] – [email protected] – [email protected] – [email protected] – [email protected]
Abstract- Lebanon is plague by over 1200 exploited quarry
sites with no subsequent proper rehabilitation. This project aims at rehabilitating the abandoned Sebaali rock quarry site in the Abu Mizen Region, whereby the end product shall be the engineered transformation of this degraded location into a facility intended to serve the general welfare of the community. The facility shall include an elderly foster home (one of the largest of its kind in Lebanon), a restored green area integrated with its surroundings, and a private parking space. Furthermore, it shall incorporate various amenities tailored to meet the specific needs of this critical customer segment. These include physiotherapy rooms, leisure common halls, an infirmary, a cafeteria, a laundry room, and a guest salon among others. Surrounding the designed building, a re-integrated green park stretching across 4400 m2 will be designed. This park will fulfill two purposes: re-establishing the ecosystem previously damaged by quarrying works and serving as a much-needed sanctuary that provides a setting of tranquility and peace of mind. In line with the primary objective of designing an environmentally friendly end product, different best practice sustainability measures shall be adopted. As such, the project is designed to take into account ecofriendly methods such as rainwater management and reuse, grey water use, passive solar technology, renewable off-grid photovoltaic energy, and xeriscaping. The designed facility is planned to be ready for implementation through conducting the required architectural, structural, and geotechnical design studies by resorting to all necessary Autodesk software. With respect to project planning and scheduling, the project shall undergo a detailed work breakdown structure (WBS) depicting all construction activities to be performed.
I. INTRODUCTION
There is an extensive historical practice of quarrying in
Lebanon that originated several decades ago. Quarrying practices were initially conducted at a small scale having little adverse effect on the environment. Changes in the needs and the growth of the construction industry have increased the magnitude of these practices with adverse environmental consequences. Rapid population growth has also contributed to increased demand for construction materials and induced a rise in the number of quarries in Lebanon to 1278 quarries (SOER, 2011). The wide use of stone in the construction process for cement, aggregates, foundations, and building stone is likely to maintain this demand well into the future. During the civil war, the country witnessed a boom of quarrying malpractice that intensified with the lack of proper implementation of rules and regulations, and the effects of this manifesting trend remain prominent up to this day. After operation, a large number of
quarries is left abandoned all over the country, with no adequate post-rehabilitation conducted by their previous exploiters. Such untreated sites pose considerable risks and potential hazards which include air pollution (i.e. inhalable crystalline silica, solid particulates PM2.5 and PM10), groundwater contamination by material runoff, landslides/soil erosion (i.e. steep slopes and lack of vegetation weakens the internal soil structure of a quarry and renders it vulnerable to potential landslide), and visual pollution in terms of aesthetic degradation of the surrounding locale.
To mitigate the detrimental effects of such abandoned sites, this project aims at incorporating a sustainable eco-friendly facility in an exploited quarry selected in Abou Mizen area in the Metn region. The importance of such a project lies within the fact that it acts as an initiative to transform the quarrying industry in Lebanon into an environmentally and economically sustainable practice.
II. SCOPE OF WORK AND METHODOLOGY
This section presents the methods that will be used to implement the project’s scope of work. Fig. 1 below illustrates the various tasks performed and the ones planned to be executed later.
Figure 1 - Scope and Methodology of Proposed Study

138
A. Scope of Work The scope of this project is to remediate an abandoned
over-exploited quarry site, whereby the area is environmentally restored and transformed to a sustainable design facility. This will be executed on a rock quarry site selected in Abou Mizen region, through three main phases: site physical characterization, facility design and project management. The site physical characterization consists of assessing the area biodiversity, geological and hydrological conditions, and topographic features. The sustainable facility is to be architecturally designed by a third party. Subsequently, the work would encompass the structural and geotechnical integration of the designed facility with the existing quarry site in a compatible and sustainable manner. In addition, a study shall be conducted to provide a self-sufficient and possibly renewable energy harnessing system for the facility. Finally, the proposed project will undergo proper scheduling, financial assessment, and environmental impact evaluation with respect to its surrounding.
B. Methodology Physical Characterization
• Site visit: a site visit was conducted in order to select the convenient quarry, and to visually assess its aspects relative to the surrounding area, such as the ease of accessibility and the preliminary topographic and geologic characteristics.
• Soil classification through geologic maps: as previously mentioned, such quarries are exploited for their rock resources. As such, the geologic determination of the quarry’s soil is determined by the aid of a geologic map of the area. This process provides required knowledge for the foundation design of the facility, in the form of rafts, footings, or piles.
• Site surveying: the studied quarry is abandoned, and no technical personnel were available to provide any documents concerning its detailed topographical characteristics. The first suggested line of action was the application of surveying methods using technical equipment such as theodolites, total stations, or other machines borrowed to undertake this task. After consulting construction management specialist Dr. Issam Srour and our advisors Dr. Darine Salam and Dr. Rana Bilbeisi, such venture was deemed unnecessary and surplus to requirements based on project scope and scale of expenditures. An efficient and feasible alternative was the deployment of an aerial photographic drone to capture top view images of the topographic surface, followed by applying the needed calculation methods to estimate the surface area of the quarry.
• Rainfall estimation through HEC-HMS: a thorough hydrological study of the site was conducted by first delineating the watershed (area that drains into a common waterway) using the site’s topographic characteristics while also using GPS processing (e.g. Google Earth). The runoff to be generated was
calculated using the HEC-HMS software. This study enables the minimization of site flooding by ensuring proper drainage after computing the amount of water runoff that will drain into the quarry.
Facility Design
• Architectural Concept: the facility shall comprise a foster home building and a green outdoor area as well as a parking space. An architectural layout is provided in Figure 6 in the Appendix.
• Structural Design: after having acquiring the architectural drawings, a structural design was conducted in order to determine the type of concrete material, dimensions of structural elements (walls-columns-slabs-footings) as well as the steel reinforcement needed to safely sustain the potential dead, live and lateral loads expected. The mentioned analysis was done using finite element modeling software such as ETABS, SAFE, and SAP2000. Following this step, all the required structural elements were determined and design drawings of the facility provided in Figure 7 the Appendix.
• Energy Consideration: as the final product is expected to promote sustainability, renewable energies are considered mainly in the form of solar energy that will be harvested. While not all energy will be provided from the previously mentioned source due to intermittency of low sunlight, an initiative has been established in order to reduce the use of fossil fuels to the largest extent possible. This is done first by collecting and analyzing weather data in order to estimate the annual amount of sunlight received on site. Next, energy needs shall be estimated based on the daily number of residents and staff. Finally, the extent to which solar PV could be installed coupled with the intermittency of solar radiation will determine the allocation between conventional and renewable energy sources.
Project Management
• Scheduling: In order to produce the project schedule, construction tasks shall be incorporated within the software Primavera in order to define the different activities and produce the project time frame. This would ensure the project having a reasonable time frame along with a well-defined display of construction stages that are necessary for adequate time and resource management (e.g. Labor, Finances).
• Cost Estimation: Costs shall be estimated by conducting thorough research in order to assess the costs of labor, material, equipment and overhead costs in the region. This cost estimation shall also be done after completing the project design and scheduling in order to enhance accuracy and reduce margins of error.
III. SITE STUDY
A. Surface Area Estimation
As discussed previously, surveying was not a feasible option and another approach was taken. Moreover, the use of GIS and Google Earth did not provide the accuracy and

139
resolution needed for a relatively small piece of land. Thus, to determine the total area, a second site visit was conducted. The group used a flying drone to take aerial 3D pictures and a plan view is provided in Figure 8 the Appendix. Two scales of twenty-five meters were used as reference for manual distance measurements. Three group members extending the scales in between them were positioned at a right angle forming two perpendicular edges of a square. Using Powerpoint editing, the square was completed and the surface area was estimated by the number of covering square footprints.
Following the calculation procedure, a balanced allocation of land was achieved. The built facility was allocated a footprint of approximately 3200 m2 (equivalent of 5 squares), while the green park and the parking were allocated around 4400 m2 and 1900 m2, respectively.
B. Impact on biodiversity Species and their natural habitats were directly damaged
by the excavations that were held a few years ago. After visually inspecting the site during the conducted site visit, visual observation has proven that some habitats can become dehydrated while others flooded due to the changes in ground and surface water following quarrying activities. Also, noise pollution during excavation can have a large impact on species and especially on their reproduction ability. Tree trunks are chopped down and. A well-managed rehabilitation of the quarry will mitigate these risks and will regain part of the species life that has been impaired few years ago especially with the installation of the proposed green area that shall restore the ecosystem’s characteristics. Indeed, the choice of vegetation to be incorporated in the design of the park shall restore the site within its intact surroundings. Upon visual inspection and enquiry from local workers, and literature review of the flora distribution in different area in Lebanon, it was found that the main types of flora in the area include mostly Cyprus oak trees and Kermes oak (Jaradi, 2010).
C. Geotechnical Geotechnical investigation is an essential part of any
construction project, and is necessary in determining the type of foundation needed on a particular site. The uncertainty naturally always exists, and a geotechnical investigation will help reduce this ambiguity. This study provides the different rock characteristics (physical, chemical, strength parameters…) and composition, along with depth, of the various subsurface layers.
The first step was acquiring the Beirut area geological map
to be used as a reference. Upon locating the site of interest, the rock type in the Abou Mizen region was determined; it is classified in the legend of the geologic map done by Dubertret as “Calcaires du Kesrouane”. In other words, calcareous formations with specific characteristics form the basis of determining what type of foundation should be implemented in accordance with the findings related to the rock characteristics obtained from the map. The design to be implemented will be isolated footings. By definition, each isolated footing supports individual columns and transmit loads from the columns to the
rock/soil lying beneath it. Furthermore, the calcareous formations on site raise an important issue that should be considered for a better understanding of the subsurface. The dissolution of soluble rocks such as limestone could lead to underground drainage systems with cavities, sinkholes, and caves know as karst features. Limestone deposits along the river’s stream flowing next to the site necessitate checking for the existence of karst features below the surface.
D. Hydrological Study The following study has been completed to estimate the
runoff value reaching the quarry during rainstorms. The value obtained is of importance since it shall be used in the design stage in order to plan an adequate drainage and collection system, which would eliminate the risk of flooding during construction and project lifetime. Furthermore, the obtained runoff value can be used to assess the potential of harnessing rainwater for sanitary and irrigation purposes around the park and facility at the design stage.
The objective of this section is to estimate the runoff peak discharge at the location under study in order to conduct the abovementioned design that will efficiently convey storm water during rainfall events. The main watershed of the site is delineated using Google Earth elevation data. Next, the main watershed is further sub-divided into three sub-basins. The main watershed represents the total area that drains into the quarry site, while each sub-basin is a smaller watershed within the main watershed. Sub-watersheds are used to reduce modeling calculation errors. The main stream corresponds to Nahr El-Kalb River and the watershed is surrounded by Faitroun, Mairouba, Hrajel and Faraya. Fig. 2 below represents the watershed delineation resulting from the analysis conducted via modeling software HEC-HMS:
Figure 2- Quarry Site Watershed Delineation

140
The watershed consists of three subbasins that drain into the quarry. Table. 1 below displays the computed runoff results:
Table 1- Watershed runoff results
IV. ABU MIZEN REGION SURVEY
The purpose of the survey was to determine the built facility to be incorporated in the quarry. The choice of facility depends on the needs of the local community based on the availability of public facilities in the nearby region. The following services were found to be accessible to the public, and thus, excluded from the list of alternatives:
• Sports center: “El Delb Country Club” located in Delb area near Bikfaya is a renowned membership sports club accessible to the public during both summer and winter seasons. In addition, some public football/basketball courts are also found in Bikfaya and Mhaydseh.
• Restaurants: Bikfaya village (and its locality) is a summer touristic attraction visited by many across the country, and is saturated with restaurants, diners, and snacks.
• Horseback riding arena: A horseback riding arena is available in the Delb region for all lovers of the sport.
• Karting track: A Go-Kart race track is located in Dhour Shweir village, only 15 minutes away from the Bikfaya/Abou Mizen region.
• Library: A public library already exists in the center of Bikfaya. A small chat with the library manager also revealed that it is rarely visited and could soon be closed, as people are more inclined to resort to the internet for educational and cultural purposes.
• Residential: The Abou Mizen quarry is a relatively remote area and would not serve as an attractive residential spot for a busy lifestyle. Moreover, the aim of the prospective facility is oriented towards public use.
• Sorting plants: Bikfaya already holds a newly functional sorting plant, “Bi Clean”. In addition, Baskinta holds its own sorting facility developed by “Baskinta Baytouna and Suburbs Organization” which operates in the higher regions of El-Metn.
The choice of the facility to be built was taken to be a sustainable elderly foster home, surrounded by a public park. The decision was based on three main factors:
• Social Need/Scarcity of Foster Homes
• Adequate Setting
• Demographic Characteristics of the studied region
(10.24% are above 65 years of age)
The facilities to be incorporated within the design of the foster home were chosen in line with best practices around the world. During the design stage, special criteria were assigned to first aid units, medical storage rooms, counseling departments, kitchen, common entertainment areas, dormitories, physiotherapy department, and reception area among others. In addition, the already existing sand road linking the quarry site to the main road shall be paved and rehabilitated to ensure optimal access and safety to the foster home facility. This will be further detailed at the beginning of the design stage. After conducting phone interviews with different foster homes in Lebanon such as Douma and St. George foster houses, the capacity of a single elderly home was found to be fairly modest ranging between 20 to 60 tenants. Accordingly, the goal of this project was to design a facility that would be the largest of its kind, housing around 80 tenants, in addition to their caretakers, staff, and administrative personnel.
V. BUILDING ORIENTATION
A. Objective The objective of this study is to determine the optimal configuration of the foster home with respect to the site conditions and solar trajectory. In designing any building, architects and engineers should opt to maximize the utility of the sun as a valuable resource for effective lighting and heat distribution. Such approach goes in line with the concept of passive solar architecture, which is by definition solar energy and resource optimizations applied to our built environment.
An important tool in providing the abovementioned sustainability measures lies in building orientation. In Lebanon, the conventional approach in the design of the internal building layout is to position sleeping rooms towards the East so as to provide exposure to the rising sun in the morning, and deliver cooling in the afternoon. This method plays a significant role in reducing the consumption of fossil fuels for heating, cooling and lighting.
B. Sun Path Diagram
After consulting with Dr. Aram Yeretzian from the Architectural Department of the American University of Beirut

141
(AUB), the proposed method to determine the ideal foster home orientation was chosen to be the use of the Sun Path Diagram associated with a latitude of 32°N, the most applicable to Lebanon. Such a diagram enables the user to determine the emitted sunlight direction in any day and time of the year.
To conduct the analysis, the previous topographic drone-surveying results were used to construct a scaled model of the site as well as a footprint assumption of the building. Fig. 3 below shows the obtained model consisting of the external building structure along with the surrounding quarry reproduced at a scale of 1 to 400.The analysis was performed for two days chosen as representatives of opposing weather conditions during the calendar year. The first was taken during the month of June as a reference for the longest average daytime duration during a given year whereas the second was chosen to be during the month of December to simulate the shortest annual daytime duration. For each day, the exercise was conducted at two different times during the day: 9AM and 4PM sampling the early and late daytime hours respectively.
Figure 3- Quarry Topographic Model
The results are displayed in Fig. 4 showing the solar lighting effects in each of the four cases:
Figure 4-Sun Path Diagram Analysis
After several trials with different building orientations, the ultimate positioning was chosen to satisfy the following results:
• According to the 9AM studies for both June and December, the alignment of bedrooms along the eastern front of the building would ensure the desired sunlight exposure in the morning.
• The 9AM studies also reveal a shadow strip along the course of the quarry cliff. This vicinity would provide sunlight shelter and the opportunity for a morning walk in a potential green park.
• All studies show that the building roof and the
western flat surface remain exposed to sun radiation during most of the day, which would be adequate for potential PV panel installation.
C. Land Use Distribution
As a result of the aforementioned study, the chosen land use spatial distribution is represented in Fig. 5 below:
Figure 5- Land Use Distribution
VI. ENGINEERING DESIGN
Based on the previously mentioned space requirement, the architectural drawing of the building and the layout of the parking lot were chosen. The structural and geotechnical designs were conducted using design software. A four-story building was designed, and a typical floor layout can be observed in the Appendix.
In addition, an energy analysis will be conducted to determine the possibility of harnessing solar energy through the installation of photo-voltaic panels in order to enhance structure sustainability and reduce fossil fuel consumption.
To assess feasibility from an engineering perspective, a project schedule and a project cost estimating exercise were prepared.

142
VII. REFERENCES
[1] GEOTECHNICAL CONSULTATION WITH DR. SHADI NAJJAR, AMERICAN UNIVERSITY OF BEIRUT, LEBANON.
[2] HYDROLOGICAL CONSULTATION WITH DR. MAJDI ABOU NAJM, AMERICAN UNIVERSITY OF BEIRUT.
[3] PHONE CALL WITH MS. GRACE AL AZAR, HOLCIM, LEBANON.
[4] KHATER, C., ENG. MAKSOUD, C., EL-HAJJ, R., TOHME, S. (2015). MEDITERRANEAN QUARRY REHABILITATION MANUAL: LEARNING FROM THE HOLCIM EXPERIENCE, HOLCIM, LEBANON.
[5] DR. JARADI, G. (2010). STATE AND TRENDS OF THE LEBANESE ENVIRONMENT, BIODIVERSITY AND FORESTS, LEBANON.
APPENDIX
Figure 6- Architectural Layout
Figure 7- Etabs 3D Figure
Figure 8- Aerial Plan View Image of Quarry Site

143
Revitalization of an Existing Community in Lebanon Ghia El Rifai, Rania Ghalayini, Mostafa Kabalan, Riwa Kanaan and Jihan Salem
Department of Civil and Environmental Engineering American University of Beirut
Riyadh El Soloh, Beirut, Lebanon [email protected], [email protected], [email protected], [email protected], [email protected]
Abstract- The proposed project is a community based project which aims to develop an area of 189,178 m2 located in Bashoura, Beirut which is a highly urbanized and challenging area with a population of 9,650 people. Al Bashoura is an area of high traffic and high population density and has electricity and water shortage. Citizens there are not living in ideal conditions and are mostly considered low-income families. The project’s objective is to improve the quality of life in terms of water and energy supply, traffic, and job opportunities. Solutions include implementing water harvesting systems, green roofs and solar panels, and developing a pedestrian zone and a wood workshop in the area. The chosen area was characterized according to the different uses of the structures in the area, the height, age, and façades of the buildings. Moreover, a survey was conducted to show the needs and demands of the community. The different solutions will be assessed in order to know their feasibility and level of success. Cost and financial analysis will be conducted at the end to conclude the total cost of the project and its benefits.
I. INTRODUCTION
This project aims to revitalize an existing community in Lebanon. The community was chosen to be in Bashoura, Beirut as shown in figure 1. This community suffers from water and energy shortage, traffic congestion, and deficiency in job opportunities. However, the area is known for its antiques shops that are mostly owned by local residents. Therefore, the objective of this project is to improve the quality of the locals’ lives by trying as much as possible to cover their basic needs. The proposed solution to decrease traffic and boost economically the area is the development of a pedestrian zone in Ahmad Tabbara Street and Abdel Kader Al Kharsa Street where the antique stores are located. To reduce the water shortage, rooftop harvesting systems will be designed and implemented. Green roofs and solar panels will be implemented to reduce energy consumption. In order to create jobs and boost the economic viability of the area, a wood workshop will be implemented which will complement the already existing skills of the residents in the community. The project will include the design of each of the components of the proposed solutions, the suitable location of each solution and their efficiency. A design prototype was developed for every proposed solution after having assessed several sample buildings based on their architectural and structural characteristics. In addition to the environmental and social
aspects of the project, the budget and cost analysis of the project will be studied. II. APPROACH
At the beginning, the map of Beirut was obtained from the municipality in order to choose the targeted area. Bashoura was chosen because it is an area having high population density with relatively flat topography. It also suffers from water and energy shortage. There’s a high level of traffic congestion and low availability of job opportunities. To approach the problem, the area was first characterized. The site was divided according to the usage of its structure which includes residential, commercial, religious, or governmental purposes. This characterization helped in determining the water and energy demand and how diverse the community is in terms of functions. This self-sufficient community includes all basic activities such as educational (schools, nursery), recreational (park, public library, restaurants, coffee shops), commercial (shops, mini-markets, banks) and religious (church, mosque). Another characterization was dividing the residential buildings according to their height. The low buildings are buildings having 1 to 3 floors, the medium buildings are buildings having 4 to 7 floors, and the high buildings are buildings having more than 8 floors .This characterization helped in determining the population density of the community as well as the feasibility of the proposed solutions. The buildings were also characterized according to façade which include a façade of concrete, tile clad, or sandstone. Such characterization helped in determining the strength of the buildings and their energy
Fig. 1- Zoomed-in photo of the chosen area (Bashoura) in Beirut

144
consumption as a whole. The final characterization was categorizing the buildings according to age. The age of the buildings was divided into three categories the new ones which were built 25 years ago, the middle aged buildings which were built 25 to 50 years ago, and the oldest historical building which were built more than 50 years ago. Such characterization helps in assessing the structural integrity of the buildings before implementing any of the proposed solutions. All characterization maps and tables are presented in the appendix. A sketch up model was done for the area as shown in figure 2 in order to properly visualize the context and to portray the outcomes of this research. After area characterization, surveys were done and 50 individuals from shop owners to local resident were interviewed. The results of the full survey are presented in the appendix. This survey helped in quantifying water shortage, energy consumption, and the willingness of local residents to allow the implementation of proposed solutions to their own buildings and streets. It turned out that the majority will accept the implementation of solutions that will improve their quality of life regardless if the solutions were associated with change.
In order to reduce the energy consumption, it will be proven later in the paper that green roofs were most efficient for low rise buildings while solar panels were more effective for high rise buildings. In the water field a rooftop harvesting system for medium rise buildings was developed to reduce the water shortage. The traffic congestion was put under the transportation field and a pedestrian zone was established to reduce traffic congestion, carbon emissions as well as to appeal more people to the antique shops in the targeted street boosting the area’s economy. The last problem to target was increasing job opportunities; a wood workshop was designed in an already existing building. For all proposed solutions the structural integrity of implementing the solution on existing buildings was tested using the Schmidt Hammer test in order to the findings lead to get their approximate compressive strength. In the following paper, the plan, design, and budget of each solution will be explained.
III. ENERGY
A. Green Roof
1. Planning and Development
Green roofs will be implemented to reduce the building energy consumption, green back the city, and increase biodiversity. The three basic categories of green roof infrastructure are: intensive, semi-intensive and extensive. These types are different in terms of cost, design and construction. Green roof offers thermal insulation for the topmost floor. Thus, low rise buildings (1-2 floors) were chosen to come up with an efficient design. Moreover, after testing the structural load of samples low rise buildings and modeling them using ETABS (as shown in figure 3) it turned out that the building couldn’t carry except extensive green roofs (130 kg/ m²) because low rise buildings are mostly old (more than 48 years) and they are made up of sandstone. Extensive green roofs have a thin growing medium typically <15 cm with small plants resulting in less structural strain on the roof and these small plants are self-sustaining requiring less maintenance resulting in less operating costs [1]. However, small greenery volume in extensive roofs results in less than optimal heating and cooling effects. In order to calculate energy savings (concerning cooling and heating systems only), the Hourly Analysis Program (HAP 4.9) will be used.
2. Design
For the design of extensive green roofs on top of low rise buildings, Mrs. Monika Fabian, instructor from the department of Landscape Design at AUB, helped in choosing the suitable design parameters, the green roof layers and type of plants that are drought tolerant, local and accustomed to Beirut’s climate. A Table in the appendix includes the various items needed for the roof, their description, prices, quantities and total price. The depth of the growing medium should be around 20 cm due to excessive soil shrinkage during summer in Beirut. The average area of low rise buildings was taken as 145 m² of which 50% was allocated to the green roofs.
Fig. 2 - SketchUp model of the chosen area
Fig.3 - ETABS model for a sample low rise building where green roof will be installed

145
The Green roof dimensions based on the shape of the sample building’s roofs turned out to be: rectangular with 4 m in width and 13.2m in length. The layers of soil that are used are 1/3 coco peat, 1/3 terro and 1/3 clay. For irrigation, drip irrigation will be used (40 L/session)
a) December-March: no irrigation needed b) April-May: 2 times/ week= 0.32 m³/month c) June-September: 5 times/week= 0.8
m³/month d) October-November: 2 times/week= 0.32
m³/month
Air conditioning condensate will be harvested and used for irrigation. In Lebanon, the amount generated per day is approximately 20L for 10 hours of operation which is enough for the green roof [2]. The feasibility of adding a storage tank to cover the water requirement during the year on the roof was assessed using ETABS. The layout of the green roof as well as the storage tank is shown in the SketchUp model in figure 4.
3. Budget
Table 1 shows the budget for implementing the green roof. It has a total budget of 4851 $.
Table 1 - Budget of implementing green roof
Category Cost Plants 1150 $ Layers 3361 $ Installation cost 300 $ Total 4851 $
With a total of 87 low rise buildings in the area the total cost
of implementing green roofs would be 422,013 $. B. Solar Panels
Adding a solar water heating system is beneficial in terms of energy and money saving. A research done in Lebanon showed
that one unit of solar water heater saves up to 3.5 MWh/year which is equivalent to 350 $/year [3]. On average, a household can save up to 20% of its electric bill and consumption when using solar water heaters. In Lebanon, per household 150 liters of 60 water is consumed. Solar water heating utilizes a renewable energy source, lessens the power charge for the buyer while having a long lifetime (usually 20 years). One option studied is Solior, a local company that is supported by the ministry of Energy and the Central Bank of Lebanon. Solior is a system that integrates the solar collector and storage tank in one system on the roof. It is proven to be more efficient than conventional solar hot water systems. The system needs virtually no maintenance beyond a quick functional check-up once a year. This system has 150 L of water capacity with 1.85 m2 collector area occupying 2. 5 m2 footprint on the roof and taking into account that the solior system will be installed on high rise buildings which are on average 9 floors having 3 apartments per floor and having a roof area of 430 m2. Considering that each apartment will have its own solior, the total required area for installing all units will be 67.5 m2. Thus all units can be accommodated on a typical high rise building. It weighs 240 Kg filled with water. A diagram of this system is shown in the appendix. A cost benefit analysis for every building was conducted to determine if installing solior systems on top of high rising buildings is worth the investment. The market price for installing one solior unit is 500 $ and having a total of 27 apartments per building the total initial cost of installation will be 13,500$. The benefit of installing one unit is 350 $ per year. Based on the annual worth, the profit generated will be 8,543 $ per year per building. The total cost of implantation for the 40 high rise buildings in the area is 384,000 $.
IV. WATER
A. Planning and Development
Harvesting water in a very condensed area is highly challenging. Scientifically speaking from a water perspective this is said to be an ill-defined problem. The ideal option would be to rehabilitate the infrastructure but this is not feasible in the chosen area since these projects are typically done on a large scale level. For this reason only localized solutions are feasible. These are limited due to the little space available and high cost of land. The two localized solutions are rain water harvesting and ground water recharge. Groundwater harvesting requires very detailed hydrogeological studies which need a higher level of expertise and thus is eliminated from the options. The only solution left is rainwater harvesting. This can be done in several methods including rooftop harvesting, catchment area and porous pavements. However the surface water in Lebanon is very contaminated especially in Beirut and has been further increased due to the garbage crisis. The fecal contamination in Beirut ranges from 10% to 20% [4]. Therefore the best option available is to optimize a rooftop harvesting system for each building in the area. However this solution is not efficient for high-rise buildings due to the large
Fig.4 - SketchUp model for the green roof on the sample low rise building

146
number of apartments relative to the building’s footprint. In addition green roofs are already designed for low-rise buildings which would decrease the amount of runoff harvested. Thus the system is most feasible for medium-rise buildings.
B. Design
The average rainfall in Beirut is 900 mm/year, which is above the minimum average precipitation of 600 mm/ year for the possibility to install rainwater harvesting [5]. The average demand per day for a resident in Beirut is 180L/Capita/day. Using a population of 4.1cap/household the total water demand for every home is 738L/Day [6]. From the survey, it was found that the government currently supplies water four times per week instead of daily. On average every home should be supplied 1 m3 per day. The current supply for every home is 571L/day. Therefore the shortage is 167L/day per home. The first step of design is to develop a metric to assess the efficiency of this system for every building. Having a water shortage of 5.01 m3 per household per month and based on the area of each roof the amount of water that can be harvested in January (maximum rainfall) was calculated. Systems that are less than 35% efficient are going to be disregarded since the cost of implementation would be higher than its benefits. A table showing the distribution of the buildings based on efficiency is presented in the Appendix. A prototype was developed to show the details of the system.
C. Budget
Table 2 shows the cost of each component in the rainwater harvesting system.
Table 2 - Budget of implementing rainwater harvesting system
Category Cost Storage tank 2,000 $ Pipes and fittings 55 $ Pump 60 $ Filtration system 41 $ Total 2156 $ The area includes 133 medium rise buildings, which gives a total cost of 286,748 $.
V. TRANSPORTATION
A. Planning and Development The pedestrian zone will be done for Ahmad Tabbara Street and Abdel Kader Al Kharsa where the antique shops are located. Such pedestrian zone will reduce carbon emissions and disturbance to neighboring buildings, and appeal more people to the antique shops. These roads were specifically chosen because the roads are blocked in “Ashoura” each year, so it has already been implemented before.
Several elements have to be considered when designing a pedestrian zone to ensure its success. The first element of its success is accessibility where the entrances have to be frequent approximately one entrance each 300 ft. (90m) [7]. Moreover, access to public transportation in such an area is a necessity to encourage people to visit it. Parking spaces along the edges of the pedestrian zones for both cars and bicycles should be offered. The second important element is use because variation in the outdoor activities helps in bringing people together [8]. Benches have to be provided, and public spaces with trees increase pedestrians’ comfort since they act as a shelter and absorb carbon dioxide reducing pollution [9]. The Tabbara Street has a length of 317 m and width of 8.6 m while Al Kharsa Street has a length of 167.1 and a width of 9.6 m. The area of the pedestrian zone is 4170 m2. The chosen street has all the above stated elements.
1. Accessibility The pedestrian zone has 8 entrances, and it is quite accessible because almost all entrances are less than 90 m far. The zone will only be accessible to pedestrians, cyclist, emergency cars, and the locals’ cars in order to reach their buildings. The local residents will be allowed to park on the sidewalks near their buildings. Other vehicles like delivery vehicles will be allowed to access the area early in the morning or at night. There are 3 public buses (buses number 2, 5, and 8) which pass through entrance of Independence Street. Moreover, an existing parking on the edge of the pedestrian zone will be modified and will be the parking specialized for the pedestrian zone. It will be accessed from the street behind the pedestrian zone. The residents will have special permits which provide them with specific parking spaces.
2. Uses It has mixed uses since it is part residential, part commercial, part recreational as it includes a park which is at the edge and part educational. Figure 5 shows the pedestrian zone highlighted in light blue with all the entrances to the zone numbered, the distances between the entrances, the bus station locations, the parking lot colored in dark blue with its accessibility.
Fig. 5. The pedestrian zone with the streets marked in light blue, entrances numbered, and the parking lot highlighted
in dark blue

147
B. Design In this section the traffic analysis results and parking design will be covered.
3. Traffic Analysis For this zone to work, Tabbara Street will be closed so people who wanted to reach the independence street have now to take a diverted road passing through Bechara El Khoury. To check the feasibility of such diversion, a traffic analysis was done. Volume of cars was counted at the entrance of the pedestrian zone and this is the volume which will be diverted. Moreover, volume of cars which use the diverted road was also counted. In the end the diverted volume of cars from pedestrian zone was added to the existing volume, so it turned out that the new volume was within the diverted road’s capacity and lead to an acceptable level of service which reflects an acceptable comfort of the drivers.
4. Parking Design
The parking space has to accommodate those who are visiting the area, the cars which already park in the existing parking, and the cars of the local residents. The parking would accommodate 50 parking stalls for visitors considering that the scale of the pedestrian zone is not vast and considering the fact that people have to be encouraged to use public bus to reach the area. For the residents in the area 100 parking stalls will be provided considering the fact that the sidewalks in the pedestrian zone cannot accommodate all residents’ cars. Cars already in the available parking are approximately 50 cars (counted during one of the site visits). Therefore the total number of parking spaces needed is 200 parking spaces. The available dimension of the parking is 81.8 m*26 m. Having a parking stall of 5.2*1.8 m stalls, 0.4 m offset between the cars, 6 m way aisle, thus 1 story of parking is impossible to contain 200 stalls. Thus a multi- story parking in the area is needed. The parking will have 5 stories with a capacity of 52 parking stalls thus a total capacity of 208 cars. Setbacks are required to be 2.5 meters from roads and 4 meters from the buildings which is applied to get a structure that is 76.8x18 meters. Using the geological map of Lebanon and asking some of the residents that built the old houses around the area, the subgrade is found to be Basalt thus a conservative estimate of the allowable strength (qallowable) was assumed to be 1.5 kg/cm2 after discussion with specialists in the geotechnical field. What follows is a floor plan view in figure 6.
The total volume of reinforced concrete required is about 2800 m3 including the 6 slabs, 27 columns, footings, the ramp, electrical and mechanical rooms, and elevator’s walls. A module on ETABS of the parking is shown below in figure 7.
C. Budget The cost of building the parking includes the cost of built reinforced concrete, the mechanical and electrical systems including the lights, elevators, fire alarms, and security system, the cost of preconstruction studies and excavation costs. The total cost of the parking structure is estimated to be 330 000$ without taking into consideration the cost of land.
VI. WOOD WORKSHOP
A wood workshop was chosen to be implemented in the area since it complements the already existing skills of the residents who work in the antique shops. This area is known for its antique products and such a workshop would boost the industry there. The proposed location is an old building that was previously Al-Makassed School that is found in that area, specifically at the southern entrance of the pedestrian zone. The wood workshop will be producing antique, tables, chairs, beds, and any other kind of furniture. Another function it may have is renovation of old antique and pieces of furniture. Upon discussion with an owner of a similar facility the following information are gained:
1- The main machines with their space needed, weight, and cost are deduced. The machines needed are shown below in table 3.
2- Three types of wood with three different densities are mostly used that are Nut, oak, and maple that costs 250$/m3 up to 4000$/m3.
3- The workshop can take up to 40 workmen, manager, assistants, accountants, procurers.
4- Access roads for trucks coming in with raw material and out with finished furniture will be available.
5- Productivity of each worker per day of such a facility differs upon the kind of furniture and how decorated it is from 20 cm3/day up to 1 m3/day.
6- Workmen wage on average is 30 $/day.
Fig.7 - ETABS model for the proposed parking design
Fig. 6 – AutoCAD plan view of one floor of the parking

148
Table 3 - The required machines in the wood workshop with their
associated cost and the space needed for each
The loads are added to the chosen building after doing the Schmidt Hammer test and calculated the load capacity of the material. The building is modeled on ETABS as shown in figure 8.
VII. SUMMARY AND CONCLUSION
The implementation of the proposed solutions would lead to the revitalization of the area environmentally by incorporating green roofs and reducing carbon emissions, socially by implementing a wood workshop that would strengthen the community ties as well as increase the employment rate and economically by developing a pedestrian zone that would increase the number of visitors to the antique shops. It may not lead to a high rate of sustainability but given the challenges in the area this is the most optimal solution.
ACKNOWLEDGMENT
The group members would like to thank their advisors Dr. Issam Srour and Dr. Aram Yeretzian for their constant help and encouragement. By sharing their expertise, they provided invaluable guidance throughout this whole semester. Moreover, Dr. Ghassan Chehab has given precious advice on how to improve the scope of the project. Also Dr. Maya Abou Zeid, Dr. Majdi Abou Najim, and Dr. George Saad have offered great help regarding specific technical advice in each of their fields. In addition, the team would like to extend their acknowledgments to Beirut’s municipality which supplied the team with the needed plan map. Finally, a special thanks to Ms. Monica Fabien who helped us with the design of the green roofs and Mr. Richard Khouri who welcomed us in his workshop and gave us the information needed.
REFERENCES
[1] L. Whittinghill, D. Rowe, J. Andresen and B. Cregg, "Comparison of stormwater runoff from sedum, native prairie, and vegetable producing green roofs", Urban Ecosystems, vol. 18, no. 1, pp. 13-29, 2014.
[2] K. Loveless, A. Farooq and N. Ghaffour, "Collection of Condensate Water: Global Potential and Water Quality Impacts", Water Resources Management, vol. 27, no. 5, pp. 1351-1361, 2012.
[3] E. Kinab and M. Elkhoury, "Renewable energy use in Lebanon: Barriers and solutions", Renewable and Sustainable Energy Reviews, vol. 16, no. 7, pp. 4422-4431, 2012.
[4] S. Korfali and M. Jurdi, "Provision of safe domestic water for the promotion and protection of public health: a case study of the city of Beirut, Lebanon", Environmental Geochemistry and Health, vol. 31, no. 2, pp. 283-295, 2008.
[5] G. Yamout and M. El-Fadel, "An Optimization Approach
for Multi-Sectoral Water Supply Management in the Greater Beirut Area", Water Resources Management, vol. 19, no. 6, pp. 791-812, 2005.
[6] Council for Development and Reconstruction, "Wastewater: Achievements to Date", 2014.\
[7] K. Bates, "Making Pedestrian Malls Work", Oregon, 2013.
[8] K. Gehl, "Life Between Buildings: Using Public Space", Island Press, vol. 8, no. 1, pp. 54-55, 2011.
[9] O. Marquet, "Speck, Jeff (2012). Walkable City: How Downtown Can Save America, One Step at a Time", Documents d'Anàlisi Geogràfica, vol. 61, no. 2, p. 436, 2015.
Machine Maximum Weight (Kg)
Cost ($)
Maximum Space Needed (m²)
Table Saw 240 100-2500
10.8x3.6
Drill Presses
50 100-1200
4x4
Samders 100 250-900
8x6
Fig. 8 - ETABS model showing the feasibility of implementing the wood workshop

149
APPENDIX
Table 4- Percent distribution of the structures in the area according to their uses
Function Residential Residential and commercial
Shops Religious Education Deserted Offices Government Property
Total Structures
% of structures 46 42 2.5 1 1 5.5 1 1 279
Table 5- Percent distribution of the buildings in the area according to their height
Height of Building Low Medium High Total
Buildings % of Buildings 33 52 15 264
Table 6- Percent distribution of the buildings in the area according to their age
Age of Building New Mid Aged
Old Total Buildings
% of Buildings 10 42 48 264
Table 7- Percent distribution of the buildings in the area according to their façade
Façade of Building
Concrete Tile cladded
Sandstone Total Buildings
% of Buildings
60 16 24 264
Fig. 9- Characterization of Bashoura according to structures’ use (commercial, residential, education, religious...)
Fig. 11. Characterization of Bashoura according to the height of the buildings
Fig. 12. Characterization of Bashoura according to the age of the buildings
Fig. 10. Characterization of Bashoura according to the façade of buildings

150
Category Item Description
Price per unit
quantityQuantity Unit Total
price ($)
Pennisetum
setaceum
Brown plants of 1 m height with 80
cm spacing
7500 L.L 32 1 pot 160
sedum reflexum
Green plants of
0.5 m height
with 40 cm
spacing
7500 L.L 52 1 pot 260
Plants Aptenia cordifolia
Red flower of
0.5 m height with 40
cm spacing
7500 L.L 49 1 pot 245
Lampranthus
spectabilis
Yellow flower of
0.5 m height with 40
cm spacing
7500 L.L 50 1 pot 250
Carpobortus Edulis
Purple flower of
0.5 m height with 40
cm spacing
7500 L.L 47 1 pot 235
Waterproofing
membrane
Bitumen, SIPcoat
WB10500 L.L 53 Square
meter 371
Drainage system
put geotextile on top of
the drainage system
which acts as a
bonding between
plant roots and plastic
7500 L.L 53 Square meter 265
Layering from the bottom to
the top
Filter membrane
keeps soil and other particles
from percolating into the drainage system
10500L.L 53 Square meter 371
Coco peat 400 $ 3.5 Cubic meter 1400
Terro 212.5$ 3.5 Cubic meter 743.75
clay 60 $ 3.5 Cubic meter 210
Maintenance
Gardening services
Minimal gardening because
extensive green roof requires
very minimal
maintenance
5 $ 8 Hrs/month 40 $
Growing medium
Question Answers Percentage distribution
1 to 3 30
4 to 6 40>6 30
Social purposes 10Gardening or watering plants -
Satellites and water tanks 70Non-accessible 20
Willing 50
Not-willing 10Not sure 40
50,000-70,000 L.L 6070,000-100,000 L.L 20
>100,000 L.L 20<50,000 L.L 14
50,000-70,000 L.L 2970,000-100,000 L.L 43
>100,000 L.L 14
Yes 50
No 50Wells 10
Lebanese water company 90
3 15
4 705 15
0-1 602 to 3 30
>3 10Building parking lot 20Private parking lot 10Sidewalk parking 70
Yes 60
No 40
Monthly subscription to an electrical
generator
Number of people in the household
Function of the roof of the building
Willingness to accept the implementations
of the proposed solutions
Average electrical bill during winter
Average electrical bill during the summer
Main source of water
Frequency of water supply from the
government
Number of cars per household
Car Parking options
Willingness to work and collaborate with
others in the community (for shop-
owners)
Table 8- Efficiency in covering the water shortage when
implementing water harvesting system in January
Efficiency
<35% 35-70% >70%
Number of Buildings
4 88 41
Table 7- Results of the survey
Table 10- Bill of quantities (BOQ) needed to set up the Green Roof
Fig. 13. Schematic drawing of the solior

151
Scientific Assessment of Advanced Modular Construction in Lebanon: A Case Study of ABC
Verdun Dania Ammar, Laura Ezzedine, Nadine Fouani, Yara Kharoubi, Batoul Shoukini
Department of Civil and Environmental Engineering American University of Beirut
Beirut, Lebanon [email protected], [email protected], [email protected], [email protected], [email protected]
Abstract-Modular concrete construction is one method of construction that has been recently replacing cast in-situ concrete constructions, and it encompasses two tiers of modules: two- dimensional modules and three-dimensional modules. It is the use of molds in off-site precast manufacturing factories to produce concrete modules that are transported to construction sites where they are installed. The purpose of this paper is to report on research dedicated to providing an evaluation to the three different construction methods in Lebanon which are: [1] in-situ traditional construction, [2] two-dimensional modular construction, and [3] three-dimensional modular construction, through comparing their performance based on: [1] structural design, [2] construction materials, [3] construction management and logistics, and [4] and sustainability. A research is presented on one of the most important on-going hybrid projects in Lebanon that has integrated both, on-site and 2D modular construction, to investigate the implementation of modular construction along with Lean principles. Following the implementation of the project’s methodology, results illustrate that the integration of three- dimensional modules meaningfully shortens the project duration by at least two working months, which is translated into a reduction in the overall cost of the project by $6.1 million. Towards a greener design, the suggested method saves at least 28% of material wastes and energy compared to those spent in the other two construction methods over the structure’s life span, thus saving 13% in CO2 emissions.
I. INTRODUCTION
Traditional construction method involves time-consuming activities translated through in-situ concrete casting and steel reinforcement arrangement. Due to the high demand of fast-rate housing establishment after World War II, many academics and industry practitioners have been concerned with this issue. The common suggestions to shorten the construction duration are to subcontract activities and allocate additional manpower and equipment (Faridi and El-Sayegh 2006). As to the project’s delivery method, Design-Build (DB) and Integrated Project Delivery (IPD) methods ensure better results in terms of time reduction (Khemlani 2009). The integration of Lean principles is also in charge of minimizing delaying wastes including time buffer and rework (Hamzeh et al 2016).
Another effective way to reduce project duration is the
adoption of modular construction. It is the process through which two-dimensional or three-dimensional modules of the building are cast off-site in standardized molds at a centralized manufacturer, sustained through proper control measures, trans-located to the construction site, and assembled in their desired position. Modular construction is a time-effective method because pre-fabrications are processed under controlled environmental conditions, at a rate much faster than on-site casting and are characterized by the high speed of their assembly operation. Moreover, their manufacture takes place simultaneously with on-site work, thus running more than one activity at once. In his statistical comparison between conventional construction systems and industrialized building systems (IBS) which entails hybrid, 2-D precast or 3-D precast construction methods, Kadir et al. (2006) concludes that IBS implementation increases productivity and decreases labor demand and cycle time of residential projects in Malaysia. Modular construction has also proved its effectiveness in the design and sustainability aspects. Nevertheless, all the previously mentioned benefits of modular construction do not often favor its employment over traditional construction. In his study, Hamzeh et al. (2016) concludes to several technical, aesthetic, logistical, organizational and cultural factors that function as barriers to the use of precast concrete construction in Lebanon. Figure 1 shows the three construction methods.
Figure 1. Three construction methods

152
While the Lebanese construction industry still heavily relies on the implementation of off-site construction, it is now witnessing a trifling shift to the use of modular concrete. Even though some studies have presented an assessment to the methods of construction in locations such as USA (Chen et al. 2010), Hong Kong (Jaillon and Poon 2009), and the UK (Pan et al. 2012) none has conducted a detailed comprehensive comparison for the functionality of the three construction methods in Lebanon: in-situ concrete construction, 2-D and 3- D precast concrete construction (Hamzeh et al. 2016).
For closing this gap, this paper presents the first elaborate comparison for the implementation of the three construction methods in Lebanon. The study analyzes the influence of the three methods on different attributes which are: [1] design, [2] materials, [3] construction management, and [4] sustainability; thus, determining the most suitable method for the situation at hand upon measuring the importance of the corresponding advantages. It reports results of research performed on a current project in Lebanon illustrating the application of the in-flow hybrid method and the model of running a 3-D modular construction.
II. STANDARDIZATION
The 3-D modular construction is a new technique that surfaced recently in the region and Lebanon. It is the fabrication of a three-dimensional reinforced concreted module using an offsite predesigned steel mold. This method yields a room-shaped module made up of a reinforced slab supported by load bearing edge walls, all cast monolithically in the steel mold. Upon concrete hardening, the frame is lifted out of the mold as shown in Figure 2.
Figure 2. Steel mold
The erection of this steel mold is time consuming due to the hydraulic concrete pumping and self-induced vibratory mechanisms. Thus, this controlled environment limits the number of molds dedicated for a certain project, imposing a standardized architectural design for the building’s sections.
In the case of ABC Verdun, the architectural plans
obstructed the implementation of 3D construction all over the area of the mall. However, a fair standardization of zones in the first five superstructure floors of the mall aided the simulation of this technique successfully without a significant change in the architectural plans. The application of modularization in this project has encountered several limitations that will be discussed in the following sections of the paper. Figure 3 shows the two suggested areas for modularization: the red area represents the department store, and the green area represents 6 retail stores.
Two different span lengths, which are 10.5m and 5.25m, have been used in the proposed areas of the current project. To account for both the maximum weight of the module a mobile crane can lift and the current architectural plans, a 5.25 wide mold was used for an efficient standardization process. In the department store of each floor, the wall is 60cm wide and 10cm thick, thus having two adjacent modules yields a total wall thickness of 20cm on each side. Figure 4 shows a snapshot from Revit showing the total modules used in the department zone in 3D and plan views.
Moving to the other proposed area, six stores are modularized. Edge walls of the first and last module are 20 cm wide, and the other inner walls of the modules are 10cm wide; whereas the length of each module is determined based on the length of masonry walls shown in the architectural plans.
Figure 3. Standardized areas
Figure 4. Standardized modules in the department store

153
III. STRUCTURAL DESIGN In conventional and 2-D modular construction methods, the slabs transfer the live and dead loads to the beams which in turn transfer them over to the columns. In the case of the 3-D technique, the bearing walls are the main elements responsible for transferring the loads down to the foundation system. Furthermore, the presence of a 1m drop beam at each edge of the slab is to avoid its punching in shear at the supports. Each module is designed separately whereby the bottom wall joints are assigned as fixities that resist movement and rotation in all directions. However, the adjacent modules are connected to each other with a specialized steel top and bottom connectivity. A 2-cm spacing between each adjacent module is left empty during construction to install horizontal connections. The module-to-module connection consists of bolting the clip angles welding them to the adjacent floors. Having done this on site, the connections between modules will transfer in-plane forces throughout the structure, thus providing integrity and robustness. Following the installation of the connection, the spacing is filled with grout. This typical connection is shown in the figure below.
The structural design of each slab is performed by modeling each module on SAFE. The design of each module is based on the ACI Code. Accordingly, the thickness of all the slab modules is determined to be 17 cm. Based on this thickness and the varying span length, top and bottom reinforcing steel are determined for the slab to resist tensile stresses. The steel distribution also accounts for the development of a deflection less than the maximum allowable value. The slab to the left in figure 6 shows that auxiliary reinforcement is still needed in the colored zones. After adding the needed reinforcement, 0mm2/mm of
needed reinforcement shows in the other slab. Moving to the design of walls, each module is replicated
5 times to account for the maximum axial load coming from the upper four floors that should be carried by the walls of this module. Figure 7 shows a sample of the axial loads applied on walls of each floor for one module in the department store. This preliminary design of walls has been done without including the effect of seismic forces.
IV. LOGISTICS
The case study at hand, ABC Verdun, is a commercial project extending over an outsized footprint located in one of the most congested areas of Beirut. The project’s size and location impose complexities in terms of planning and logistics. For planning purposes, the site is divided into zones of similar areas to facilitate the scheme of site layout. The site layout specifies for each of the zones: [1] trucks accessibility points, [2] cranes’ location and maneuver plan, and [3] lay down areas for storage. The stated parameters are a function of the target construction method and its constraints.
Traditional construction does not encompass severe logistical limitations. However, constraints arise in modular construction depending on the units’ weight, volume, and safety regulations. Precast beams and slabs weight does not exceed 3 tons which enables the ease of rotation of the tower crane over the maximum radius 50 m. Therefore, cranes can navigate over the entire project area while sharing the burden such that no one zone is completed only by one crane. Although cranes provide flexibility, delivery of elements to the site was not synchronized with the installation process, therefore, leading to the use of neighboring zones as storage areas, and the initiation of multi-handling of elements by cranes. Addressing these issues from a Lean perspective, synchronization between delivery and installation activities should be applied. The current state on site is illustrated in
Figure 5. Module-to-module connection
Figure 6. Auxiliary slab reinforcement
Figure 7. Axial loads carried by walls

154
the appendix using a value-stream map which draws the process at hand and proposes a plan representing the process’s activities, order, available time for completion, and necessary improvements to satisfy the target demand.
Further complications in modular construction are witnessed in the case of 3-D elements due to their significant weight and area. The weight of modules reaches up to 40 tons. These modules shall be delivered and installed by high capacity trucks and cranes. Flatbed trucks of an expandable width reaching 6 m and a fixed length of 10 m carry the modules one at a time from the manufacturing plant to the site. The size of these trucks and the load they carry limit their accessibility to site because they shall move only along wide and flat terrains with high turning radii. Typically, modules are delivered from a temporary manufacturing plant located in a nearby area that does not obstruct the travel of the truck to the site. After investigating the surrounding region, an area located at 400 m away from the construction site and meeting the specified criteria is selected to be the temporary manufacturing plant. The 4400m2Concrete modules are cast in four metallic molds each of 42 m2 area. After 18 hours, the modules are handled and stored in the remaining space. The storage area can go up to 3 levels of modules placed on top of each other because modules are of high strength concrete which reaches a capacity of 20 MPa within 1 day from casting. The aerial images shown in figure 8 shows the location of the manufacturing plant and the roads accessed by the trucks reaching the site and vice-versa.
Tower cranes present on site do not have the capability of lifting modules from the truck to the target point of installation. Only one crane available in Lebanon can complete the job. The selection of the crane is based on the capacity at specific height and radius reliant on the 3-D
construction zone of ABC Verdun. An “All-Terrain Crane” of 400 Tons capacity fits the assigned criteria. This mobile crane parks at different points depending on the area of installation. Installation starts with the furthest modules and then it reaches the edges to keep the modules protected from any possible accidents. The updated site layout considering the hybrid site conditions of 3-D and 2-D modular construction is shown in figure 9.
V. PROJECT DURATION Initially, it has been planned that the construction stage of
ABC follows a traditional cast in-situ process. Nevertheless, a shift to 2-D modular construction has taken place at the early start due to the intense need of faster construction. This research conducts a comparative time assessment of the application of the two previously mentioned methods in addition to the application of 3-D construction. To validate the results, schedules simulating the three scenarios regarding the erection of the superstructure of ABC have been prepared. The results obtained using Primavera show that 8.5 months, 9.5 months, and 7.5 months are required for the structural completion of the superstructure of ABC using in-situ construction, 2-D and 3-D modular construction respectively.
These schedules are optimized as they follow a strategic implementation of Lean principles; in other words, they are mainly based on the upstream demand dictating productivity rates. The resultant theoretical rapidity of in-situ construction compared to 2-D modular construction is basically due to the allocation of more resources than those set by the threshold. Another contribution to these results is the fact that 2-D construction is constrained by the number of precast pieces that can be daily delivered to site such that no multi-handling takes place.
Similarly, simulating the application of 3-D modules takes place during the night shift only. The 3-D modular construction, nevertheless, is still able to finish in a shorter duration than the other 2 methods due to its fast rate assembly that requires minimal preparations prior to the
Figure 8. Proposed location of the manufacturing plant and truck path
Figure 9. Updated cranes layout

155
arrival of modules on site and due to the elimination of time consuming in-situ steel reinforcement and casting of columns. Better time reduction results could have taken place in the absence of the various logistical constraints. These are related to the unavailability of more than one "All-Terrain Crane" thus prohibiting the simultaneous assembly of modules on different zones of the site. Moreover, the unavailability of higher capacity cranes that would allow the boom to reach farther zones in the site has resulted in the decrease of the modularized area. A simple demonstration of the completion of a 2192 m2 area with the three different scenarios is represented in figure 10.
VI. PROJECT COST
The total cost of construction of the whole floors from GF till F4 is estimated for each method. As shown in the figure below, a significant reduction in cost by 44% of construction of the method combining 3-D and 2-D is due to the use of less labors, formwork, propping systems, and concrete in the modularized areas.
VII. SUSTAINABILITY Due to the importance of global climate change and
greenhouse gases, the term “CO2 emissions” is often used as one indicator to highlight whether the product is environmentally sustainable. In this section, the assessment of CO2 emissions is conducted throughout the life cycle for each of the three construction methods. The equation used in the estimation of CO2 emissions is:
𝐸𝐸𝐸𝐸𝐸𝐸𝐸𝐸𝐸𝐸𝐸𝐸𝐸𝐸𝐸𝐸𝐸𝐸𝐺𝐺𝐺𝐺𝐺𝐺 = 𝑄𝑄𝑄𝑄𝑄𝑄𝐸𝐸𝑄𝑄𝐸𝐸𝑄𝑄𝑖𝑖×𝐸𝐸𝐸𝐸𝐸𝐸𝐸𝐸𝐸𝐸𝐸𝐸𝐸𝐸𝐸𝐸 𝐹𝐹𝑄𝑄𝐹𝐹𝑄𝑄𝐸𝐸𝐹𝐹 (1)
The figure below shows the studied systems’ boundaries along with the resulting CO2 emissions. It’s important to note that the quantities have been approximated as per m3 of concrete; therefore, the resulting emissions are also per m3 of concrete.
Based on the volumes of concrete mentioned earlier, the
total amount of emissions for each construction method is represented in the below histogram.
Figure 10. Project duration of the three scenarios
Figure 11. Resources cost of each construction method
Figure 12. CO2 emissions per one cubic meter of concrete
Figure 13. CO2 emissions attributed to each construction method

156
VIII. CHOOSING BY ADVANTAGE
Choosing by Advantage (CBA) is an evaluation tool used to decide on the utmost solution. In this aspect, the three different construction methods that apply to ABC Verdun are compared using the Paramount Decisions software. Upon then, different attributes such as logistics, rate of construction, safety, and sustainability are defined, and the methods are characterized as per these predefined attributes shown in figure 14.
The advantage of each method compared to the least performing method is then estimated. Subsequently, a comparison between the importance of these advantages is decided, and the elevated advantages are weighed accordingly. A relative comparison is next conducted such that the advantages per attribute are relatively weighed. Consequently, each method collects unique value points that are finally counterweighed with the cost. Comparing the results, the histogram in figure 15 suggests two options: one is paying a total of 6M dollars for 400 advantage points provided by 3-D modular construction; the other one is paying an additional 8M dollars for 100 more advantage points provided by 2-D modular construction. Contemplating the results, 3-D modular construction has been selected for this case .
IX. CONCLUSION
The analysis carried before choosing the most sustainable method was based on several factors. These factors were architectural design, structural design, logistics, cost, project duration, and sustainability. Some of these factors were strongly affected by constraints specific to the case study. Thus, such considerations prevent the modular construction method of showing its actual potential in achieving greater sustainable results. As a conclusion, if this method were to be implemented in a project of minimal constraints on its logistics and design, it would have proved greater impact towards a greener design in terms of project duration, CO2 emissions, and overall performance.
ACKNOWLEDGEMENT
The team members would like to thank Dr. Farook Hamzeh, Dr. Ghassan Chehab, MAN engineers, Green Precast, and others who helped and supported the team.
REFERENCES
[1] Abdul Kadir, M., Lee, W., Jaafar, M., Sapuan, S., and Ali, A. (2006). "Construction performance comparison between conventional and industrialized building systems in Malaysia". Structural Survey, 24(5), 412-424. [2] Chen, Y., Okudan, G., and Riley, D . (2010). "Sustainable performance criteria for construction method selection in concrete buildings". Automation in Construction, 19(2), 235-244. [3] Faridi, A. and El4Sayegh, S. (2006). "Significant factors causing delay in the UAE construction industry". Construction Management and Economics, 24(11), 1167-1176. [4] Hamzeh, F.R, Kallassy, J., Lahoud, M., and Azar, R. (2016). “The First Extensive Implementation of Lean and LPS in Lebanon: Results and Reflections.” In: Proc. 24th Ann. Conf. of the Int’l. Group for Lean Construction, Boston, MA, USA, sect.6 pp. 33-42. [5] Hamzeh F. R., Abdul Ghani, O. (S), and Abbas,Y. (S) “How Do Designers, Manufacturers, and Contractors Perceive Precast Concrete Construction?” Journal of Engineering Construction and Architectural Management. Accepted (September 2016). [6] Jaillon, L. and Poon, C. (2009). "The evolution of prefabricated residential building systems in Hong Kong: A review of the public and the private sector". Automation in Construction, 18(3), 239-248. [7] Pan, W., Dainty, A., and Gibb, A. (2012). "Establishing and Weighting Decision Criteria for Building System Selection in Housing Construction". Journal of Construction Engineering and Management, 138(11), 1239-1250.
Figure 14. Advantage points vs. attributes
Figure 15. Total advantage points vs. cost

157
APPENDIX Current Value Stream Map
At an early stage, the Planning and Control Unit at MAN Enterprise has decided on a schedule that targets the installation of 260 prefabricated beams and 858 prefabricated pre-slabs per month which is equivalent to 15 beams and 40 pre-slabs per day. The illustrated process in figure is described as follows: Handling 1: Unloading from the truck to the temporary storage area. The time available for this step is the working
hours in the two shifts, less the break time, since trucks’ arrival is also occurring at night which results in 79,200 seconds.
Handling 2: Trans-locating prefabrications from the temporary storage area to a storage zone located near the target zone. The number of elements trans-located depends on the demand to be installed in the night shift. Therefore, a total of 33 slabs and 10 beams are being lifted using a crane during one shift which is equivalent to 39,600 available seconds.
Handling 3: Trans-locating prefabrications from the storage zone to the target zone. This process is characterized by passing the prefabs to their desired place prior to the start of the assembly procedures.
Assembly: Installing the beams and pre-slabs to their destiny. This process takes place while the element is still hooked to the crane, and it depends on the rate of workers who are responsible for assigning the right location of the element and checking for its alignment.
Based on the information corresponding to each step and the production rates accompanying each step, we notice an additional daily amount of 7 pre-slabs and 5 beams kept in the temporary storage zone. This cycle continues and more inventories accumulate as the project proceeds to reach inventory that serves for 8 working days. Figure 16 shows the value stream map of the current situation.
Figure 16. Current value stream mapping

158
Future State
The current state value-stream mapping allows detecting the regions responsible for the disruption of the continuous flow of precast elements. Although the suppliers manage to deliver the assigned quantities at the scheduled times, the production rate on site is much lower than the delivery rate. This foreshadows for the occurrence of a bottleneck at the level of assembly. To solve this problem, modifications integrating lean principles are introduced to the current state map, thus creating an optimized process. The bottleneck is best released by synchronizing the delivery schedule with the assembly plan. The trucks’ capacity should match the installation production rate. Along with improvements made for the preparation and delivery processes represented by “Kaizen”, the production rate of installation increases to 50 elements per day per location, 15 beams and 35 slabs. Of the important modification: Kaizen Burst 1: Having zones readily available for the assembly process. This eliminates the occurrence of double
and triple handling on site arising from the functioning of zones as temporary storage areas. This kitting procedure is achieved through proper coordination between the suppliers and the contractor.
Kaizen Burst 5: Coding the elements as per location eases the assembly processes. This problem is mainly concentrated in Soprel’s un-coded deliveries. Therefore, error proofing (pokayoke) ensures the right assembly of elements as designed instead of waste trials made to find the desired piece or even made to carry on in-situ casting.
Kaizen Burst 6: Preparing the truck based on the assembly plan made and not based on dimensions. The coded materials facilitate this procedure as the keeper in the manufacturer’s storage area can follow a backward sequence of elements in the truck so that the first to be laid on site is the last to be added to the truck.
Figure 17 shows the value stream map of the suggested situation.
Figure 17. Proposed value stream mapping

159 1
SEISMIC VULNERABILITY AND RISK ASSESSMENT OF AUBMC AND ITS
PERIPHERIESWalid Alaiwan, Haisam Daouk, Nizar El Hakim, Anas Kaddoura, Abdul Salam Saad
Department of Civil and Environmental Engineering American University of Beirut
Theme: Engineering 4 Life’s Sake Abstract – Beirut is situated in an earthquake-prone zone, meaning people living and working in Beirut are at risk of being severely affected by a seismic event. The AUBMC Phase I structure houses the hospital’s emergency response unit, and therefore is the center of the study. After a seismic event, ensuring access to-and-from the hospital for emergency first responders is critical. The vulnerability of the buildings surrounding AUBMC and its peripheral roads could potentially have adverse effects on the ability of first-responders to move in and out of the area. Additionally, the vulnerability of the buildings in the area surrounding AUBMC could potentially put thousands of people at risk. The following paper will present the methodology, analysis, and final results of the completed seismic vulnerability and risk assessment of AUBMC and its peripheries. The probabilistic fragility curve method is used to predict the vulnerability of buildings in the study area around AUBMC is introduced and discussed. Furthermore, the development of an interactive network analyst model on ArcGIS, and the benefits of developing such models are discussed. The adopted methodology for generating the AUBMC Phase I structural model, from the hand drawn shop drawings, is presented, and its limitations examined.
I. Introduction
The unpredictable nature of earthquakes means that their effects can be potentially devastating for an unprepared community. For this reason, it is imperative to consider measures that serve to mitigate the life-threatening effects of earthquakes. Conducting seismic vulnerability and risk assessments of critical structures and densely populated areas allows emergency first-responders to predict the extent of the damage and potential number of causalities. The seismic vulnerability of a structure refers to its proneness to reaching or exceeding a certain damage state in response to a specific seismic demand. On the other hand, risk is generally defined as vulnerability multiplied by the probability of experiencing the demand seismic activity.
Beirut is located in a relatively seismically active zone. Located between the Mount Lebanon Thrust (MLT) fault to the east, and Yammouneh fault to the west, the capital city is not a stranger to earthquakes. In fact, seismic records show that
Lebanon was struck, on numerous occasions, by magnitude 6-7 (Richter scale) earthquakes causing severe and widespread damage [1].
The seismic vulnerability and risk assessment is centered on Lebanon’s largest medical establishment, The American University of Beirut Medical Center (AUBMC), specifically the Phase I structure where the emergency response unit is located. Illustrated in figure 1 is the comprehensive study area and the AUBMC Phase I structure included in the study. The study is comprised firstly, of a seismic vulnerability and risk assessment of the buildings in the study area, conducted by applying the probabilistic fragility curve method that will be explained further in the methodology section. Furthermore, a network analyst model was developed and used to predict the changes in travel times to-and-from the medical facility in the case of various road blockage scenarios. To conclude with the study, a finite element model of AUBMC Phase I structure was developed and used to conduct structural analysis tests to determine the structure’s serviceability following a seismic event.
Figure 1. Comprehensive study area and AUBMC Phase I structure

160
2
II. Methodology
The following section will explain the adopted methodologies for conducting the seismic vulnerability and risk assessment of the buildings surrounding AUBMC and the Phase I structure itself. Firstly, the probabilistic fragility curve method will be explained, as well as its limitations and the assumptions made during the study. Similarly, the adopted procedure used to develop the network analyst model will be described. Secondly, the methodology for the dynamic structural analysis and retrofitting plan for the Phase I structure will be clarified.
A. BuildingSurvey
A survey of the buildings in AUBMC’s peripheral neighborhoods will serve as the data to be inputted into the fragility functions. Up till now, there is no comprehensive study of Beirut’s buildings’ seismic response behavior; therefore, the vulnerability study will have to be based on a simplified method that takes as input parameters the type of structure, height category and seismic design level. The survey was conducted manually. Firstly, the coordinates of each building were obtained on a hand-held device using GOOGLE MAPS and saved onto a cloud-based spreadsheet. Secondly, the number of storeys of the building were counted, and similarly, the spreadsheet was updated. In order to determine the level of seismic design code of each building, satellite images from 2012 were compared to recent satellite images. Because the most recent version of the Lebanese seismic design code was put into effect in 2012, any buildings built prior to 2012 were considered to have low to no level of seismic design.
B. ProbabilisticFragilityCurveMethod
The implemented probabilistic fragility curve method is based on probabilistic lognormal fragility curves adopted from the study, Fragility curves for reinforced concrete buildings in Greece [2]. The study categorized reinforced concrete structures by 3 main criteria: framing systems, level of seismic design, and height categories. Analogous to the study conducted by the authors of [2], 3 height categories were proposed as shown in table 1.
Table 1. Height categories for R/C buildings
Due to the lack of information regarding the framing systems
and level of seismic design of structures in the study area, all buildings were assumed to have a dual frame system (denoted by RC4.2) and low level of seismic design. The assumptions produced conservative values on which the analysis was based
on. Additionally, the study by the authors of [2] defined 5 individual damage states ranging from “no damage” to “collapse”, as shown in table 2.
Table 2. Damage states for R/C structures
Damage state Damage state label DS0 No damage DS1 Slight DS2 Moderate DS3 Substantial to heavy DS4 Very heavy DS5 Collapse
The fragility curves produced by the authors of [2] model the probability of reaching or exceeding a certain damage state as a function of peak ground acceleration (PGA), refer to Appendix A. The study was conducted for a PGA of 0.25G in accordance to the seismic hazard contour map, for 10% exceedance in 50 years, in Re-evaluation and updating of the seismic hazard of Lebanon [3], refer to Appendix B. Lognormal cumulative distribution curves are characterized by 2 parameters: mean (µ), and standard deviation (s), refer to Appendix D. For dual-frame systems (RC4.2) with low seismic design codes the characterizing parameters for damage state 3 (DS3) are unique for every height category as shown in table 3.
Table 3. RC4.2 lognormal cumulative distribution parameters for DS3
RC4.2: Substantial to Heavy Damage (DS3)
Height category Mean (µ) ST Dev (s) low 0.372 0.331 med 0.389 0.309 high 0.423 0.337
Similarly, the tests were conducted for dual frame systems with high seismic design codes, and reinforced concrete frames with regular infills (RC3.1) with high and low seismic design codes. The probability values for every building were illustrated spatially using ArcGIS to facilitate the analysis.
C. NetworkAnalyst
The network analyst model was produced to predict the effect road blockages will have on travel times to-and-from the AUBMC Phase I structure that includes the emergency response unit. By adding the locations of forecasted incidents and a destination facility (AUBMC), the model calculates the fastest route to reach the hospital. Furthermore, the model allows the user to input different road blockage scenarios, and outputs the most efficient alternative route choice based on the shortest travel distance. The roads and road directions were inputted onto a shapefile using ArcGIS. Subsequently, the shapefile was used to create the network analyst model, refer to Appendix C. For the purpose of this study, 3 entry points into the study area were selected as shown in figure 2.
Number of Storeys Height Category
1-3 Low rise
4-7 Medium rise
8+ High rise

161
3
Figure 2. Network analyst model
D. DynamicStructuralAnalysis
Upon acquiring the hand drawn structural drawings of the AUBMC Phase I structure, the floor plans were digitized using AutoCAD. The digitized floor plans were then imported into SAP2000, where the column and beam reinforcements were defined. Because several column and beam schedules were unavailable, assumptions were made regarding the similarities of steel reinforcement schemes between adjacent storeys. Therefore, the final model was developed by assuming the 2 basement storeys shared the same beam schedules, and the 8 above-ground levels shared the same beam schedules. The assumption allowed for the simplification of the model, and allowed for the development of a complete model of the Phase I structure. Furthermore, the structure was imported into ETABS where it was subjected to various loading combinations. Figure 3 shows the Phase I structure subjected to the seismic load equivalent to a 0.25G PGA seismic event showing the resulting deflections in millimeters. In addition, the structure was subjected to its self-weight, a superimposed dead load of 0.5ton/m2, and a 3.25ton/m2 live load, with loading factors 1.4 and 1.7 respectively.
Figure 3. AUBMC Phase I structural model on ETABS
Additionally, 2 seismic loads were defined as per the ASCE 7-10 code, EX and EY which together comprise the earthquake load. 7 loading combinations were defined; tabulated in table 4 are the corresponding load factors for the dead loads, live loads, and earthquake loads.
Table 4. Loading combinations
Load Combination
Dead load Live load Earthquake load
1 1.4 0 0 2 1.2 1.6 0 3 1.2 1 0 4 1.2 0 0 5 1.2 1 1 6 0.9 0 0 7 0.9 0 1

162
4
The 7 different loading combinations, were combined into 1 loading envelope. The Phase I structure subjected to the loading envelope is shown in figure 4.
Figure 4. Phase 1 structure subjected to the loading envelope
E. SeismicRetrofitting
Common forms of seismic retrofitting include damping, which absorb the energy of the earthquake, and element bolstering methods which aim to increase the strength of critical sections and joints. Due to the large size of the AUBMC phase I structure, and the usage of the building, closing the building to install large dampers would be unfeasible. However, installing column-joint braces would be a more cost effective and viable method of seismically retrofitting the hospital. Structures designed and built prior to the introduction of modern seismic design codes often had weak and un-engineered beam-column joints. Reinforcing joints, the most critical elements, with steel jackets will increase their ductility and ability to withstand lateral earthquake loads. Also, reinforcement around slab openings and shafts should also be considered to minimize the deflections around openings.
III. Analysis and Results
The seismic vulnerability and risk assessment of the buildings in AUBMC’s peripheral areas was conducted by analyzing the results represented spatially in figure 5. The results for dual frame (RC4.2) buildings with low seismic design codes yielded that a total of 40 buildings will reach or exceed damage state 3 (DS3), tabulated in table 5. There is a significant difference in the number of buildings predicted to exceed the substantial to heavy damage threshold. For example, the number of buildings set to reach DS3 decreased from 40 to 3 between buildings with low to high levels of seismic design.
By assuming 5 residents residing per storey in residential buildings in the study area, there is approximately 3500 people living along AUBMC’s peripheries. Factoring in the number of people that work in the area daily, it can be approximated that around 5000 people are in the study area during the peak work hours of the day. For this reason, the seismic risk in the area is high due to the high concentration of people in close proximity to vulnerable structures. The results also yield that, from permanent residents alone, almost 1000 people are possibly significantly affected from a 0.25G PGA seismic event.
Figure 5. Probabilities, roads, and road junctions
Judging by the values in figure 5, Abdul Aziz street is particularly prone to blockage due to the high number of vulnerable buildings along its edges.
Table 5. Seismic vulnerability and risk analysis results
Height Category
Probability of reaching DS3
Number of buildings
Number of buildings exceeding
DS3 High rise 0.34 37 13
Medium rise 0.39 59 23 Low rise 0.44 10 4
Total 106 40 Likewise, several other scenarios were considered for the analysis. The number of buildings exceeding DS3 for RC frames with regular masonry infills (RC3.1) and RC dual frame systems for both low and high levels of seismic design are shown in table 6.
Table 6. Number of buildings exceeding DS3 for RC4.2 and RC3.1
Framing Type Level of Seismic Design
Number of buildings exceeding DS3
RC Dual Frame (RC4.2) Low 40
RC Dual Frame (RC4.2) High 3
RC Frame with Regular Infills (RC3.1)
Low 61
RC Frame with Regular Infills (RC3.1)
High 15
By examining the structural model subjected to the loading
envelope, and after running the running the analysis of the

163
5
model, serious deflections appeared to be threatening the well-being of the structure and its optimal serviceability, under the minimum conditions implied by the ASCE 7-10 structural design code. Maximum displacements within the structure’s members ranged between 5 - 10 cm in the X and Y directions which is alarming and might cause serviceability and possibly minor structural failures, such as fracturing.
It is noteworthy to mention that the results obtained from the ETABS structural model do not absolutely represent the possible response of the structure to a seismic event. There are several limitations to be considered which include the following:
• The replication of floor elements after choosing a representative floor with representative sections, without considering the exact details of each member at each floor as present in the shop drawing, which is in turn a cumbersome process that is not essential for the scope of this study.
• The idealized assumptions in structural analysis, that do not take into consideration the actual structure’s condition, such as the assumption of homogenous and non-fractured material.
IV. Conclusion
It is evident, from the finals results, that the AUBMC area and its peripheries are vulnerable to earthquakes due to the lack of adequately designed buildings in the area, and due to the age of the AUBMC Phase I structure. Finalized network analyst models indicate that several road blockages could potentially have a detrimental effect on travel routes, and travel times to-and-from the Phase I structure.
In order for the network analyst model to yield valid and practical results, the study area must be expanded to account for more path choices. A network of the Ras Beirut area would be satisfactory for a study of this scale, as it would account for enough entrance and exit paths into the study area.
A seismic retrofitting plan for the Phase I structure will target vulnerable column-beam joints, and other vulnerable structural elements. The plan will be studied by comparing the response of the structure with and without the retrofitting elements to identical loading combinations.
The purpose of conducting a seismic vulnerability and risk assessment of the AUBMC area and its peripheries, is to model and predict how the area will be affected by an earthquake. The estimates of the damage can be used by emergency first responders to determine how many potential casualties they will encounter. Similarly, the vulnerability study can be used to identify particularly vulnerable structures and roads in the study area, and improvements can be made accordingly to ensure public safety. It is imperative to consider the seismic vulnerability of structures in Beirut because of the prominent
seismic risk in the area. The sustainable development of the city and the wellbeing of its citizens is contingent on the ability of engineers to assess, design, and construct safe systems and structures, by making paramount, the need to engineer for life’s sake.
Acknowledgments
The team would like to thank Dr. Bilbeisi and Dr. Alameddine for their guidance and support throughout the length of this study. Additionally, the team would like to acknowledge Dr. Dabaghy and Dr. Hamad for their technical support and supervision. Furthermore, the team would like to acknowledge Dr. Al Sayed and Mr. Deeb for their help in obtaining structural plans of the AUBMC Phase I and Phase II buildings.
References
[1] Harajli MH, Tabet C, Sadek S, Mabsout M, Moukaddam S, Abdo M (1994). “Seismic hazard assessment of Lebanon: zonation maps, and structural seismic design regulations.” Ministry of Public Works, Beirut, Research report submitted to the Directorate of Urbanism
[2] Kappos, A. J., and Panagopoulos, G. (2008). “Fragility curves for reinforced concrete buildings in Greece.” Structure and Infrastructure Engineering, 6(1-2), 39
[3] Huijer, C., Harajli, M., and Sadek, S. (2015). “Re-evaluation and updating of the seismic hazard of Lebanon.” J Seismol Journal of Seismology, 20(1), 233–250

164
Appendix 1
Appendix A
Fragility Function Manager
Name:KapposEtAl2003-RC4-LR-LC
Description:RC Dual systems (RC frames and walls) - Low Rise - Low Code
Element at risk:Buildings
Construction material
Reinforced Concrete
Height:Low Rise
Original taxonomy:RISK-UE
Greece
Region:
Hybrid
Methodology
PGA
Intensity Measure Type:
EMS98
Damage Scale:
Reference:
Observations:
A. J. Kappos, C.Panagiotopoulos, G. Panagopoulos, El. Papadopoulos. WP4 Reinforce Concrete Buildings (Level 1 and Level 2 analysis). RISK-UE, 2003.
Sample Data. Buildings: earthquake-damaged greek buildings + a large number of building types are modeled and analysed. Seismic Hazard: real earthquakes (1978 Thessaloniki earthquake) and 16 accelerograms.
The hybrid approach combines statistical data with appropriately processed results from nonlinear dynamic or static analyses.
Three primary sources of uncertainty are taken into account: uncertainty in the definition of damage state, variability in the capacity curve and uncertainty
Construction material:
MRF-W/C/RC/R/R/X-X/ND/X-X/X-X/LR-X/LC
Syner-G taxonomy:

165
Appendix 2
Appendix B
Appendix C

166
Appendix 3
Appendix D Basic Form of the Lognormal Function Curve

167
Self-sufficient Sustainable Remote Penitentiary Compound
Jad Chaptini, Johnny Dagher, Chaouki El Rassi, Robert Karam, and Ziad Taktouk Civil and Environmental Engineering Department
American University of Beirut P.O Box: 11-0236, Riad El Solh, Beirut, Lebanon
[email protected], [email protected], [email protected], [email protected], [email protected]
Abstract- This report proposes the development of an offshore penitentiary compound to alleviate the overpopulation and security issues that Lebanon’s prisons are facing. The proposed facility is to be located on Palm Island off the coast of Tripoli, will be linked to the mainland by a bridge and will be designed in such a manner that it will not harm its surrounding environment. The project depicts preliminary design of the facility to realize an ecological, self-sufficient unit. Windmills and solar panels will be installed around and in the compound to feed energy needs. Three different ways to access the facility are also proposed: by sea, by air and through the bridge. Concerning water, a desalination plant was considered to be the most feasible solution while wastewater issues were solved by implementing sceptic tanks that are maintained on a regular basis. The correctional facility is thus a self-contained fully functioning independent city within its own secure perimeter. Needs of both the inmates as well as administrative members were assessed and appropriate space was accordingly given to each of them. This paper then presents the compound’s components to ensure safety and security while respecting international standards set by the United Nations on prisoners’ rights. The compound’s layout is also mentioned in such a manner that it benefits from wind flows and natural lighting, saving on energy consumption just like the American University of Beirut’s Hostler Center. Further research was also performed to investigate different design considerations. The paper examines the compound’s feasibility through cost-analysis of building a bridge as well as the penitentiary itself, and highlights the locals’ current dismal management of the island. The environmental, social, economic and technical constraints are also discussed.
I. INTRODUCTION
The Human Rights law acknowledges, “convicted persons go to prisons as punishment and not for punishment”. This, unfortunately, does not apply to Lebanon’s penitentiaries. The overpopulation issue in Lebanon has led to that same problem in the country’s prisons. The reasons behind these conditions is that many illegal immigrants spend years in cells before their release as well as numerous inmates are detained for excessive periods of time pending trial. In addition to that, the government is failing to find solutions to expand capacity in these prisons and improve the detained conditions of the
prisoners. Thus, the nation’s need for a brand new facility becomes important.
Furthermore, prisons in Lebanon are not isolated. They are located in many civilized and populated regions such as Roumieh, Baabda and Tripoli. This puts the inhabitants of these regions in danger, especially during the transfer of the prisoners from and to the facilities. In fact, these transfers are made on main arterials and roads that could easily be ambushed, putting people’s life at risk and eventually causing the escape of inmates. It is also important to stress that most of the inmates’ transportations are for trial purposes. For that, building an offshore compound composed of both a cell building and a courthouse is ideal; reducing movements and increasing security. The project is thus a Sustainable Offshore Penitentiary Compound to be located on the existing Rabbit/Palm Island near the coast of Tripoli. Moreover, as stated earlier, multiple structural buildings with different characteristics and purposes are envisioned. Finally, construction management knowledge helps dissect the prison’s organization and development. The measures taken to uphold the security and welfare of everyone on the island have also been examined.
Rabbit Island is the expected site of the prison. The fact that it is located 5 kilometers off the coast of Tripoli is an advantage because it separates the dangerous detained convicts from the rest of the country. Locals in the surrounding areas need not worry about the threats of a prison in their vicinity, as any potential escapees would be captured long before they could reach the shore.
II. LITERATURE REVIEW
A. Inhumane living conditions It is well known that prisons in Lebanon are overcrowded
and that inmates are detained in inhumane conditions. A report in the Tribune Business Times stated that prisons are operating at double capacity, with 7000 prisoners regularly detained [1]. Another report vividly describes the abysmal situation in the country’s largest male top-security prison in Roumieh: “pre-trial detainees are incarcerated in 50 m2 foyers, containing 80 persons, equipped with only one cold water tap also used as a shower” while also stating that basic maintenance such as clean pipes and safe wiring was not being performed [2].

168
Overcrowding is not only a human rights violation, but a health and safety problem as well. When inmate congestion occurs, it is more difficult to control prisoners’ actions. They are more likely to be violent with fellow inmates as well as staff and security. Moreover, while the spread of diseases such as HIV/AIDS occurs in penitentiaries, the effect of overcrowding only increases this possibility [3]. Reference [3] also notes that only five cases of HIV were reported in Roumieh Prison, a number that is extremely low and most likely incorrect. This highlights the lack of transparency and the culture of deceit by the Lebanese authorities when it comes to official statistics of detainees, meaning that the conditions are even worse than stated. The above stresses the need for a new and improved facility to alleviate the pressure on existing prisons.
B. A Natural Reserve The islands of Tripoli, on which this facility would be built,
have been classified as a natural reserve. In fact, they are designated as important bird areas and as a Mediterranean Specially Protected Area under the 1995 Barcelona Convention [4]. The Barcelona Convention prohibits pollution to the Mediterranean Sea. However, in 2006, the islands suffered from the bombings by Israel during the war. In fact, the opposing country bombed the Jiyeh power plant, which triggered an oil spill causing an environmental disaster. The spill caused damage to scarce species and unstable coastal ecosystems on the reserve. This motivated a national response. A project initiated by the Ministry of Environment (MOE) in 2006 consisted of cleaning up the Palm Island as well as the Tripoli coastline. At the end of the year, experts assessed the cleanness of the island and defined it as adequate [5]. However, it remains recognized by the MOE that inadequate management keeps degrading the natural and cultural values of the islands. Studying the current state of the islands was thus required. It is, however, assumed that most of the once-existing biodiversity is lost. Nevertheless, the project looked to design the compound while preserving the currently present species.
C. An Eye on Sustainability Lastly, the project emulated a lot of the steps employed in building the Charles Hostler student center at the American University of Beirut. Besides the various similarities found in the sense that both can be termed as costal facilities, the Charles Hostler center is a model that should be followed. Its open plaza with multiple building volumes connecting fields of habitable spaces with gardens, and its careful attention to maintaining existing trees, were main factors in placing it high in the rankings of the American Institute of Architect (AIA)’s Environment Top Ten Green Projects [6]. The following paragraph discusses how the group precisely planned on imitating this climate responsive, state of the art complex. The
compound will be naturally ventilated in order to decrease the use of cooling systems when unnecessary. In addition, the buildings will be positioned on the north-south axis, allowing each structure to receive a fair amount of shade, while enabling the interior spaces to be day-lit. Also, just like Hostler center, windows will be strategically placed to allow the air to flow through the interior while enabling hot air to flow out. This strategic placement of buildings is of essence in order to save on energy consumption. Concerning water, a drainage system collecting rainwater will irrigate the native plants around the facility. Which is why information on precipitation has also been gathered. Furthermore, gray water collected from showers and lavatories will be treated in a gray water plant. This will allow for potable water to be strictly used for kitchen, lavatories, and showers while clarified gray water will be used for toilet flushing. Of course, waste generated from this process will also be treated adequately [7].
III. THE FACILITY
A. Location Choice To examine the potential social impact of this project, the
team conducted a paper base survey on the 28th of October in Tripoli, El Mina. 150 copies were distributed to the residents of this region. The survey established the level of discomfort due to the restriction of access to the island. The total number of people filling the survey was 96. The results of the survey are presented in Fig. 1 below. As shown: of those 96 residents, 62 are against building a penitentiary compound on the Island (around 65%) since their answer on the last question indicates that they will be strongly disappointed with the project. However, their answer on the 6th question of the survey: “Do you clean up after yourself when leaving the island?” indicates that more than 80% of the opposition (50 out of 62) of the islands do not clean up their wastes after doing any activity. Thus one can conclude that the majority of the visitors are polluting the island. Therefore, by restricting public access to the island and making it a protected area, the island is safe from frequent pollution and littering.
Figure 1: Survey Results

169
B. Facility Layout Correctional facilities should be self-contained fully
functioning independent cities within their own secure perimeter. The needs of the prisoners should be assessed, but it is not sufficient: there are many administrative positions that require their own components. Staff members such as warden, deputy warden, business operators, human resources, kitchen workers, guards and others should be considered and the appropriate space should be accordingly given to each of them. Moreover, as prisons become more crowded and internal problems arise, it is important to keep control and stability inside and outside of the prison. Furthermore, all functional components of the facility have been considered to meet the needs of both detainees and prison staff as stated in the United Nations Office of Project Services Technical Guidance for Prison Planning [8]. These components are listed below:
• Prison Cells of Different Security Levels • Outdoor Recreational Areas • Kitchen + Food Services + Cafeteria • Library + Education Centre • Prayer Rooms (Chapel/Mosque) • Court Room + Judge Offices + Administration • Parking • Infirmary + Psychological Ward • Frontier Walls
Fig. 2 shows Rabbit Island along with the compound.
Inmates are housed in either the High Security section (consisting of four buildings) or the Medium Security section. The design for the former was taken from Ref. [8] and is seen in Fig. 3. Prisoners held in the former are kept on lockdown – with the exception of a daily outing into the shared outdoor space – while the latter are given more freedoms. These are manifested in the form of a common cafeteria and activity centers.
The different components of the facility are arranged to
allow efficient and minimal movement, while the design of the housing buildings was completed based on templates and instructions from the Technical Guidance for Prison Planning. Common showers are available while toilets are present in every cell. The structural design of a single cell will be shown in the final report.
B. Utilities
The penitentiary has a capacity of 2000 inmates. These inmates require hundreds of prison staff to manage their daily lives. This includes, but is not limited to, security guards, maintenance personnel, kitchen staff, nurses and administrative members. This is an important consideration when accounting for water requirements. An elaborate piping network is to be designed to fulfill the water requirements of inmates and staff. Electricity demand is also being deliberated in order to calculate the number of solar panels and windmills needed to keep the facility running. A desalination plant will be installed on the outskirts of the facility to reduce surface and groundwater consumption and to make the most of the surroundings. Details concerning this plant will be presented in the final report.
Figure 2: AutoCAD Screenshot of the Compound
Figure 3: AutoCAD Screenshot of a High-Security Building

170
C. Infrastructure
The topographic lines of the island and its surroundings are found in Fig. 4. It is noticeable that the maximum water depth between the shore and the island does not exceed 15 meters. That is due to the presence of a ridge in the water between Tripoli and the island making the average water depth along the ridge to be 4.8 meters. Due to the presence of that ridge, the implementation of a bridge on piers connecting the island to the shore becomes economically feasible. The suggested bridge is a 2-lane bridge that lays on concrete piers and that connects the island to the shore following the line with the lowest water depth. The delineated path is also seen in Fig. 4. The cost of the bridge was calculated to be approximately 15 M dollars based on length of bridge, number of lanes and pier heights.
Although the price is somewhat high, it is important to mention the benefits this infrastructure would offer:
• Easy and controlled single access to and from the island by government-controlled shuttle, making the facility a 4-minute drive from El Mina. This would include the transportation of prisoners, workers, visitors, goods and other utilities.
• From a Construction Management perspective, this bridge will also facilitate the construction of the facility, making it less costly since materials and equipment can be directly transported to the island. The bridge would thus be constructed first.
• Facilitated access to required utilities from the mainland (internet, electricity, sewage pipes if necessary)
• A quick flow of emergency vehicles (fire department or security forces)
IV. CONCLUSION
This report represents the bulk of the abstract effort exerted. The completed design, to be presented in the final report, will allow for a better visualization of the end product as well as a complete representation of the necessary components that will ensure sustainability, self-sufficiency and serviceability of the inmates. Through the survey, resistance against this project is somewhat rebutted, as the residents of Tripoli are currently harming the island’s ecosystem. Concerning transportation, a conceptual design of the bridge linking the island to the mainland offers the facility a safe and single access point. The most important aspect of this project, however, is its potential service to the people suffering in horrid conditions in overcrowded dangerous prisons. Improving the living conditions of thousands of marginalized people while responsibly managing a polluted island is sure to have a positive impact on Lebanon.
ACKNOWLEDGMENT
The authors are extremely grateful to Doctor M. Asem Abdul Malak for his approval in working on this project as an advisor, as well as his enthusiasm and professional guidance coupled with productive feedback. Moreover, the group commends the Civil Engineering faculty members for their welcoming spirit and assistance whenever their expertise was requested.
The authors would also like to thank Doctor Ghassan Chehab for his thorough follow-up and concerns regarding the progress of the works.
REFERENCES [1] [1] S. Sikimic. Prisons in lebanon operating at double capacity: Report.
McClatchy - Tribune Business News 2011. [2] O. Nashabe, "Brief report: The future of prisons in Lebanon," Futurics, vol.
27, pp. 96, 2003. [3] D. F. Ammar, H. L. El Zein and N. El Jor, "HIV/AIDS prisoners: a case
study on quality of life in Roumieh, Lebanon," SAHARA-J: Journal of Social Aspects of HIV/AIDS, vol. 8, pp. 74-81, 2011.
[4] N. N. Kanbar, An Environmental Economic Approach to Assess the Sustainability of Managing Protected Areas: The Case of the Palm Islands, 1999.
[5] A. Cippà, “Clean Up Operation Palm Islands Coastline Enfe-Tripoli”” Ministry of Environment, 2007.
[6] American Institute of Architects, “The Charles Hostler Student Center,” 2009.
[7] C. Levesque, "Towards and Ecology 01'Desire: The Charles Hostler Student Center," 2009.
[8] UNOPS, “Technical Guidance For Prison Planning,” United Nations, 2016.
Figure 4: Proposed Bridge Path on Topographic Map

171
Sustainable Earth Structures for Displaced Populations
Mohamad Mahdi Hallal – Alaa Itani – Nada Jammal – Rawan Ramadan – Samia Zein Department of Civil and Environmental Engineering
American University of Beirut Beirut, Lebanon
[email protected] – [email protected] – [email protected] – [email protected] – [email protected]
Abstract - Rammed earth construction is an ancient technique
employing local soils that are compacted to form structural ele-ments. This method has attracted renewed interests throughout the world due to its social, economic, and environmental benefits. The utilization of local soils enhances the local economy, reduces transportation costs, and minimizes the embodied energy of the structure. In this paper, the suitability of using a local soil was studied by conducting compression, tension, and durability tests. The soil was not reconstituted by adding sand in order to assess the suitability of using on-site natural soils which are likely to be rich in fines. The effect of using varied percentages of two stabilizers, cement and natural lime, on the mechanical properties and stress-strain relations of rammed earth was also assessed. Experimental results show that natural soils with 6 percent stabilizer are suitable for earth construction. Moreover, using lime as a replacement to cement in certain proportions enhances the mechanical and durability properties of rammed earth structures. The results of this research were used to improve the well-being of Syrian refugees in Lebanon by redesigning a school which is currently under worrisome conditions.
I. INTRODUCTION
Technological advancements provide innovation in construction materials and the enhancement of their quality; however, parallel to these advancements are the depletion of scarce resources and the deterioration of environmental conditions. These drawbacks have initiated the need to utilize alternative construction materials. Of these materials, earth has gained popularity for being readily available and reusable. Earth construction employs local soils that are compacted to produce blocks or walls. The high demand for houses further exacerbates the drawbacks of using conventional material and favors the usage of natural soil. The utilization of on-site soils for earth structures reduces transportation costs, increases the availability of quality housing, enhances the local economy, and minimizes carbon emissions. Earth construction is thus energy efficient, affordable, and sustainable [1]. This is crucial to developing countries, such as Lebanon, burdened by the vast increase in the number of refugees and the demand for affordable and protected housing.
Earth structures, with focus on rammed earth walls, present a promising solution to this crisis. Thus, the suitability of using a locally available soil was investigated. Varied percentages of different mixes were studied by assessing the mechanical properties such as compressive strength, stress-strain relations, tensile strength, and durability. The optimum mix, which met all design requirements and had minimal cost and environ-mental impact as reflected by requiring the lowest stabilizer content, was selected to design a temporary school for Syrian refugees, who lack access to proper educational facilities.
II. LITERATURE REVIEW
Rammed earth is a construction method dating back thou-sands of years where it has been used by many ancient civilizations. Today, around one-third of the world’s population resides in earth structures especially in developing countries. Due to the high demand for housing in these countries, earth construction presents a cheap alternative by requiring local materials and primitive methods. As for devel-oped countries, this technique became the focus of scientific research since it is associated with sustainable development [2]. The objective of the ongoing research is to improve the mechanical properties and durability of earth structures that suffer from loss of strength and erosion when exposed to water. Therefore, different stabilizers have been introduced such as cement, lime, and fibers. However, cement has wide applications unlike natural binders, such as lime, although their benefits were reported by researchers such as Nagaraj [3].
The most commonly used parameter to assess the suitability of rammed earth is the compressive strength. Although the minimum recommended values differ, 2 MPa is considered to be adequate as mentioned in several studies [1, 4]. Researchers also recommend determining the wet compressive strength because earthen materials are highly affected by moisture content. Lateral loads due to wind, earthquakes, and communication openings necessitate evaluating the flexural and tensile performance of rammed earth structures. For this purpose, researchers adopted flexure and splitting tensile tests [4]. However, the tensile strength is usually assumed to be zero due to its low value. Durability problems in built earth structures pushed academics to assess the material’s resilience when exposed to water by conducting accelerated erosion and water absorption tests [5]. Results were compared to minimum values in building standards and had proven to be acceptable.
Despite this scientific focus, the engineering understanding and design of stabilized rammed earth are still in rudimentary stages. A detailed literature review reveals that the available recommendations are in contradiction and wide ranges exist for the different soil properties suitable for earth construction. While unstabilized earth applications recommend the use of granular soils with very low fines content (15%), stabilized earth applications continued to follow the same practice. However, soils with high fines content are usually encountered and thus are reconstituted by adding sand or fine aggregates, which defies the purpose of rammed earth in using on-site soils. Moreover, the stress-strain relations of rammed earth were studied by few researchers such as Walker and Maniatidis who reported the need for further investigations [4].

172
III. OBJECTIVES
The objective of this study is to explore the use of local soils for low-cost and sustainable construction. Many limitations can be identified in the literature on stabilized rammed earth:
Tests involve the addition of sand whereas natural soils are likely to be rich in fines.
Cement is studied as a stabilizer to the exclusion of lime. Stress-strain relations are not systematically investigated. Tensile strength is usually neglected due to its low value.
To address these limitations and to further advance the state of knowledge in understanding the behavior of stabilized rammed earth, this study aims to:
Test the suitability of using a natural local soil with high fines content
Investigate the effect of lime in combination with cement Supplement the limited data on stress-strain relationships Examine the tensile strength
For the purpose of this study, the results of the experimental work are used to design a temporary school for Syrian refugees in Lebanon. A mix design that provides the required protection while considering the structure’s lifetime, cost, and sustainability is selected.
IV. MATERIAL CHARACTERIZATION
In this section, the materials used throughout the testing program are described, including the soil, cement, and lime.
A. Soil The soil used in this study was excavated from the
Advancing Research Enabling Communities Center (AREC) that is located in Beqa'a Valley, Lebanon. The topsoil was removed due to its high organic content. Moreover, the soil was passed through a 12.5 mm sieve since the maximum allowed gravel size should be equal to one eighth the diameter of the testing samples, which is 100 mm [4]. Sieve analysis, hydrometer, Atterberg limits, specific gravity, modified Proctor compaction, and organic content tests were conducted according to the standard procedures outlined in the American Society for Testing Materials (ASTM). All the results are presented in Table I. The soil is classified as inorganic clay of low plasticity (CL) according to the unified soil classification system (USCS). Mineralogical analysis showed that clay minerals are predominantly Illite.
B. Cement Type I Portland cement conforming to ASTM C150 was
used in this study for being readily available in Lebanon and since the special properties of other types were not required.
C. Lime Hydrated hydraulic lime in accordance with ASTM C141
was also used. This type was selected for being natural and associated with green building material.
TABLE I PROPERTIES OF SOIL USED
Property Parameters Details Textural Composition Gravel (%) 9
Sand (%) 15 Silt (%) 36
Clay (%) 40 Specific Gravity 2.71
Atterberg Limits Liquid Limit, LL (%) 42 Plastic Limit, PL (%) 20
Plasticity Index, PI (%) 22 Compaction Characteristics Optimum Moisture Content (%) 18
Maximum Dry Density, ρd (kg/m3) 1,750 Chemical Characteristics Organic Matter (%) 5.4
V. EXPERIMENTAL PROGRAM
In this study, one type of soil was used and mixed with different stabilizer percentages varying between 4 and 8%. The range of stabilizer content was based on a 3.5% minimum stabilization recommended in earth building codes and a trial sample with 10% cement, which had a 7-day compressive strength more than the required 28-day strength [1]. The properties of different mixes were investigated by conducting compression, tension, and durability tests. Compressive and tensile strengths were studied in both dry and wet states; three samples were tested in each state. Two samples were also tested for durability. Additionally, a control mix with soil only was studied. Wet strength and durability tests were not done as the control samples completely disintegrate when soaked in water. Table II gives a summary of the testing program.
VI. CASTING AND TESTING PROCEDURES
The specimen preparation steps and the adopted testing procedures are described in this section.
A. Casting Steps The soil was brought in its natural wet state, oven dried, and
pulverized to break the clay clods without crushing the gravel. The soil and the stabilizer, added as a percentage by mass of the dry soil, were weighed then mixed until the mixture acquired a uniform consistency. An amount of tap water, added as a percentage equal to the optimum moisture (OMC) of the whole mix, was sprayed while mixing to ensure uniform moisture distribution. All samples were compacted at the OMC since it was found that there is a negligible difference between the OMC for the soil with and without stabilizers.
TABLE II DETAILS OF TEST SAMPLES
Mix Designation
Cement (%)
Lime (%)
Number of Samples Tested Compression Tension Durability
C-0 0 0 3 3 0
C-4 4 0 6 6 2 C-6 6 0 6 6 2
C-8 8 0 6 6 2 LC-2 2 4 6 6 2 LC-4 4 4 6 6 2

173
The wet soil-stabilizer mix was then compacted using an au-tomatic Proctor machine in three layers to reproduce the compaction employed during actual construction. All samples were 100 mm in diameter and 200 mm in height. The top of each compacted layer was scarified before adding the material of the next one to prevent reduction in strength at layer inter-faces. The upper uneven surface of the sample was trimmed using a straightedge. Then, the samples were extracted from the mold using a hydraulic jack, wrapped with plastic film to prevent water loss, and left to cure at ambient conditions for 28 days. After curing, the specimens were dried in an oven at 55°C until a constant mass was reached. Samples tested for durability were cured for 7 days only without drying as required in the testing procedures.
B. Testing Procedures The procedures followed to conduct compression, tension,
and durability tests are presented below.
1) Unconfined compression tests The cylinders were tested in compression between two steel
plates to ensure uniform load distribution. Testing was done according to ASTM D5102 for compacted soil-lime mixtures and ASTM D2166 for cohesive soils [6, 7]. Both standards require the same procedure and only differ in the stress calcula-tions. ASTM D5102 was also adopted to test compacted soil-cement mixtures. Cylinders were tested in a displacement-controlled machine at a rate of 1 mm/min until failure. Four LVDT sensors were used to measure displacements and verify the repeatability of the results. Tests were done in a dry state after drying the samples in the oven and in a wet state by com-pletely submerging them in water for 24 hours. Representative samples were collected from the failed specimens to measure moisture content (w) according to ASTM D2216.
2) Splitting tension tests The splitting tensile strength of the compacted cylinders was
determined according to ASTM C496 [8]. This standard is for cylindrical concrete specimens; however, the same procedure was applied for compacted soil-cement and lime samples. The cylinder was placed horizontally between two steel bearing plates and tested at a loading rate of 0.1 N/mm2/min until failure. Samples were tested in both dry and wet states.
3) Durability tests In order to assess the durability of the material, twelve wet-
ting-drying cycles were performed according to ASTM D559 [9]. The test consists of immersing two samples from each mix in water for 5 hours and then drying them in an oven at 71°C for 42 hours. The procedure is repeated for twelve cycles. After each cycle one sample is brushed to remove the loose
fragment of the material. The mass, length, and diameter of both samples are measured after each cycle. The percentages of mass and volume loss due to the twelve cycles are taken as a measure of durability. Also, to assess the impact of the cycles on the strength, unconfined compression tests are conducted on samples that didn’t detach after the durability test.
VII. RESULTS AND DISCUSSION
This section presents the experimental results and analysis of the conducted compression, tension, and durability tests.
A. Unconfined Compression Tests The ultimate dry and wet compressive strengths (fcu) of the
samples were determined and the results are presented in Table III. All values represent the mean of three specimens. The coefficient of variation (CV) was calculated and the values indicate stable properties. The results show that dry and wet compressive strengths increase with the stabilizer percentage irrespective of the stabilizer used. The hydration products of cement and lime enhance the rigidity of the sample by forming water insoluble bonds between soil particles. By increasing stabilizer content, more cementitious material is available and thus more rigid bonds are formed yielding higher strengths. Since these bonds are water-resistant, the wet compressive strength increases. However, immersing the samples in water for 24 hours reduces the compressive strength by more than 50% for all mixes and the reduction increases as the stabilizer content decreases. At lower stabilizer contents, the amount is insufficient to coat all soil particles given the soil’s high fines content (75%) and thus high surface area. The uncoated clay minerals will absorb water and cause reduction in strength. This is shown in the results as with lower stabilizer content, the water content is higher. Strength reduction is also expressed as the ratio of wet to dry compressive strength, which has been reported by researchers as a measure of durability. Ratios above 0.33 indicate good performance [1]. The obtained ratios presented in Table III show that all mixes satisfy the minimum value except for C-4, which has the lowest stabilizer content.
1) Stabilizer content and strength relations The relation between dry compressive strength and cement
content is not linear unlike that with the wet compressive strength as shown in Fig. 1. An additional 2% of cement in the dry state increases the strength by 1.28 MPa (50% increase) between C-4 and C-6 but by only 0.48 MPa (12.5% increase) between C-6 and C-8. This implies that at higher cement contents, the addition of the same percentage of cement results in a lower increase in strength. Conversely, in the wet compressive strength, an extra 2% cement from C-4 to C-6
TABLE III SUMMARY RESULTS OF COMPRESSION TESTS
Mix Dry State Wet State
ρd (kg/m3)
w (%)
η (%)
fcu (MPa)
CV (%) ɛu E
(MPa) ρd
(kg/m3) w
(%) fcu
(MPa) CV (%) ɛu E
(MPa) Wet/Dry Strength
C-0 1,760 5.4 31.1 1.30 7.7 0.030 40 - - - - - - - C-4 1,780 6.4 33.4 2.54 6.3 0.024 140 1,750 19.4 0.77 6.5 0.020 50 0.30 C-6 1,750 9.2 35.9 3.82 4.5 0.026 210 1,770 18.5 1.45 6.9 0.015 125 0.38 C-8 1,750 7.1 36.3 4.30 6.5 0.023 250 1,780 17.7 2.10 9.6 0.015 225 0.49
LC-2 1,720 8.4 35.3 3.71 7.2 0.022 250 1,720 19.0 1.49 8.1 0.017 130 0.40 LC-4 1,740 9.3 35.7 4.84 9.9 0.020 355 1,740 18.9 2.16 3.7 0.017 180 0.45

174
Figure 1. Relation between stabilizer content and compressive strength.
and C-6 to C-8 results in 0.70 MPa additional strength, indicating a steady increase with cement content. To better understand the relation between cement content and compressive strength, the sources of strength were examined.
a) Source of strength in stabilized rammed earth The strength in rammed earth results from the frictional
resistance and interlocking between soil particles, capillary forces due to suction, cohesion due to electrostatic attraction between clay particles (van der Waals force), and chemical bonds resulting from the hydration of the stabilizer [10].
b) Dry Compressive Strength In the dry state, the increase in porosity reduces both suction
and cohesion. The porosity (η) of all mixes was determined and the results show that porosity increases with the stabilizer content and consequently suction and cohesion decrease. The effect of stabilizer content on increasing porosity was also proved by researchers [11]. Cement further inhibits cohesion as it acts as a barrier between clay particles [11]. Therefore, as the cement content increases, strength from suction and cohesion decrease resulting in a lower gain in strength. The gain continues despite the reduction in suction and cohesion due to the increase in chemical bonds.
c) Wet compressive strength The increase in moisture content reduces frictional
resistance, suction, and cohesion [10]. Thus for C-0, all sources of strength become negligible when soaked in water leading to complete disintegration. However in the presence of a stabilizer, insoluble chemical bonds exist and thus the wet compressive strength could be solely attributed to those bonds. This explains the steady increase in wet compressive strength with cement content; an additional percentage will result in the same additional amount of chemical bonds irrespective of the cement content, thus causing the same increase in strength.
2) Effect of Stabilizer Type The effect of replacing portion of the cement with lime was
studied by comparing mixes having the same total stabilizer percentage: C-6 with LC-2 and C-8 with LC-4. The results show that LC-2 and C-6 almost have the same strength while LC-4 has 12.5% more strength than C-8. The effectiveness of lime in enhancing strength is due to the soil’s high clay content (40%), which undergoes pozzolanic reactions with lime thus
forming various types of cementitious products. However, the inefficacy of lime in LC-2 could be attributed to the low percentage of cement (2%), which is not enough to produce continuous cementation throughout the soil matrix. Many researchers have reported negligible increase in strength at low percentages of cement [11]. The benefit of lime is also reflected in increasing the elastic modulus (E) by 20-40%. This reduces settlements compared to mixes with cement only and thus improves the performance of the structure.
3) Stress-Strain Relations The stress-strain curves for all mixes in the dry state are
shown in Fig.2. All curves start with an initial low slope due to the closure of fine shrinkage cracks. Then, the material shows a linear behavior as strain increases steadily with stress up to about 85% of the ultimate stress. Beyond this, the material shows a plastic behavior over a narrow range until ultimate stress, which is followed by drooping curves. Most of the curves show a brittle behavior due to the crushing of the material unlike C-0, which shows more ductility. Values of the elastic modulus (E) and strain at ultimate stress (ɛu) are shown in Table III for both dry and wet states. The results show an increase in the elastic modulus with stabilizer content irrespec-tive of the stabilizer used. This is attributed to the increase in stiffness with stabilizer content due to the formation of more rigid chemical bonds. All strains at ultimate stress are in the order of 0.02 which is unusual for brittle material. However, similar behavior and strains at ultimate stress were reported by researchers and justified by the presence of clay minerals that control deformation [4].
4) Failure Patterns The failure in both dry and wet states was initiated by the
development of vertical and inclined shear cracks, which appeared suddenly and grew rapidly along the height of the sample. The typical shear failure, where the inclined crack connects the two opposite sides of the sample, is shown in Fig. 3a and b for the dry and wet states respectively.
B. Splitting Tension Tests The ultimate dry and wet tensile strengths (ftu) of the
samples were determined and the results are presented in Table IV. The results show that dry and wet tensile strengths increase with the stabilizer percentage. Similar to the compressive strength, this is attributed to the products of the
Figure 2. Stress-strain relations in the dry state.

175
(a) (b)
Figure 3. Failure patterns: (a) dry state; (b) wet state.
chemical reactions of the stabilizer, which produce a rigid structure throughout the soil matrix. The results also show that the difference in strength between C-6 and C-8 is negligible. However, the density of C-6 is high compared to that of C-8, and density has a significant effect on strength [4]. This implies that the negligible difference between C-6 and C-8 is due to differences in density. It is also clear that replacing cement with lime didn’t contribute to additional strength when compared to cement only. The reduction in strength in the wet state is 40% for all mixes except for C-4, which is 60%.
C. Durability Tests
All stabilized mixes were tested under cycling wetting and drying. As shown in Fig. 4, most scratched samples suffered light loss of particles except for C-4, for which deterioration was significant all across the surface. As for the samples that were not scratched, C-8 and LC-4 showed no deterioration, C-6 and LC-2 showed minor loss with C-6 undergoing more deterioration, and C-4 suffered severe damage as the bottom of the cylinder detached after the 11th cycle as shown in Fig. 5. The mass and volume loss were calculated and the results are shown in Table V. The results indicate that durability im-proves at higher stabilizer content. The recommended limit for maximum mass loss is 10%, indicating that only C-4 has low durability performance. This conforms to the results of the wet to dry compressive strength ratio of C-4, which also indicates low durability. Additionally, the results show that mixes with lime performed better than those with cement only with the exception of LC-4, which suffered higher mass loss than C-8. However, this is due to the loss of gravels during scratching, which were at the bottom of the sample and uncoated with soil-stabilizer mix. The better performance of lime is due to the autogenous healing which results in the closure of cracks.
Figure 4. Status of cylinders after wetting and test with scratching.
TABLE IV SUMMARY RESULTS OF TENSION TESTS
Mix Dry State Wet State
ρd (kg/m3)
ftu (MPa)
CV (%)
ρd (kg/m3)
ftu (MPa)
CV (%)
Wet/Dry Strength
C-0 1,750 0.17 7.7 - - - - C-4 1,720 0.18 5.5 1,775 0.07 2.5 0.39 C-6 1,790 0.31 2.3 1,810 0.18 3.1 0.58 C-8 1,705 0.33 0.9 1,740 0.19 7.7 0.58
LC-2 1,750 0.23 4.8 1,750 0.13 6.8 0.57 LC-4 1,760 0.32 9.2 1,740 0.18 9.8 0.56
A key question is the degree to which the damage resulting from wetting and drying cycles reduces strength. Therefore, all undetached samples were tested under compression to determine strength retention, which is the ratio of the strength after durability cycles to that without cycles. The results are shown in Table V. A counterintuitive observation is that C-8 exhibited an increase in strength in both samples. This may be due to the enhanced curing of cement when soaked in water and placed in the oven under high temperatures without being completely dried. However, all other samples show reduction in strength with LC-2 having an optimum value in the scratched samples (94%) and LC-4 suffering no reduction in the unscratched samples. The relatively high reduction in strength in the scratched LC-4 sample (20%) is again due to the gravels which were lost at the bottom edge of the sample and at which cracks initiated during the compression test.
VIII. DESIGN
The analysis of the available local soil shows acceptable strength and durability performance as compared to the recommended values in several studies and national standards. According to the Australian Earth Building Handbook, a minimum design compressive strength (fc) between 0.4 and 0.6 MPa should be used. As for the New Mexico Earthen Building Material Code, a minimum strength of 2 MPa is required [4].
TABLE V SUMMARY RESULTS OF DURABILITY TESTS
Mix
With Scratching Without Scratching Mass Loss (%)
fc (MPa)
Strength Retention
(%)
Volume Loss (%)
fc (MPa)
Strength Retention
(%) C-4 10.2 1.94 76 - - - C-6 4.06 3.38 88 4.72 3.47 91 C-8 1.59 5.64 131 2.66 4.92 114
LC-2 3.05 3.27 94 5.06 2.88 83 LC-4 1.95 3.86 80 3.81 4.80 99
Figure 5. Status of cylinders after durability test without scratching.

176
However, the flexural strength is usually ignored for conservative purposes. Considering these requirements, LC-2 was chosen as the optimum mix design since it has acceptable performance and includes lime, which is associated with sustainable materials. The results of this research were used to rebuild an existing one-story school in one of the Syrian refugees’ camps in Beqa'a. The camp is a rented land in which 2,700 refugees live under worrisome conditions. The school is located at the entrance of the camp and is currently closed due to water overflow from a nearby construction project.
Taking into consideration area limitations, the school was designed according to the existing dimensions. The design was done according to recommendations from rammed earth international codes due to the absence of local regulations. The Australian and New Zealand codes agree that the wall thickness should be more than 200 mm for external walls and 125 mm for internal walls to control deflection. However, 300 mm-thick external walls eliminate the need for thermal insulation [12, 13]. Therefore for this school, the thicknesses of the external and internal walls were taken 300 and 150 mm respectively. The height of stabilized rammed earth walls is recommended to be less than 3 m and thus was taken as 2.7 m. The openings of windows and doors were framed by 150 mm-thick timber lintels. At the top of the wall, timber bond beams with 150 mm thickness were used to provide anchorage for the roof. The roof is made of a timber beam system and has an inclination of 10 degrees for drainage purposes. The architec-tural model was done using REVIT and is shown in Fig. 6.
Based on the architectural plan, simulations on ETABS were run to assess the structural design. Two simulations were done for both dry and wet conditions using the experimental results of each state. Several parameters were needed to describe the earthen material as well as the interface layer. The stress-strain curve obtained during testing was used. Moreover, Poisson’s ratio was obtained from the literature (0.22) [14]. Bui et al. found that the interface characteristics don’t have any effect and thus were ignored for simplicity purposes [14]. The density of the material was taken equal to that obtained in both dry and wet states. The axial and shear forces acting on the walls were then checked according to the limits set by the Australian and New Zealand standards. All forces were found to be less than the maximum acceptable values which implies that the structure can well-perform under its own weight, superimposed dead load, and live load acting on the roof.
Figure 6. REVIT model of the designed school.
IX. CONCLUSION
The work presented in this paper aimed at investigating the suitability of using a local soil in earth construction. The objective was to use the natural soil as obtained with only a low stabilizer percentage to minimize cost and environmental impact. The results of the experimental program, which included compression, tension, and durability tests on different mixes, clearly indicate the possibility of using local soils for one-story structures. This allows obtaining around 95% of the construction material on-site. The most important finding of this study is that natural soils with high fines content could be used as present on-site without reconstituting them with sand. Moreover, the study clearly demonstrates the effectiveness of using lime in combination with cement to enhance the mechanical properties and durability of rammed earth. In addition, the tensile strength was examined and the results indicate that ignoring it is too conservative. More research and experimental testing is needed to put together a comprehensive design standard for earth structures.
ACKNOWLEDGMENT
The authors would like to thank Dr. Salah Sadek and Dr. Shadi Najjar for their guidance and encouragement throughout this project. We would also like to thank Mr. Helmi El-Khatib and Ms. Dima Al-Hassanieh for their ample assistance in the laboratory testing.
REFERENCES [1] D. D. Tripura and K. D. Singh. Characteristic properties of cement-
stabilized rammed earth blocks. J. Mater. Civ. Eng. 27(7), pp. 4014214. 2015; 2014. . DOI: 10.1061/(ASCE)MT.1943-5533.0001170.
[2] G. Minke. Building with Earth: Design and Technology of a Sustainable Architecture (2nd ed.) 2012; 2006. DOI: 10.1007/3-7643-7873-5.
[3] H. B. Nagaraj et al. Role of lime with cement in long-term strength of compressed stabilized earth blocks. International Journal of Sustainable Built Environment 3(1), pp. 54-61. 2014. . DOI: 10.1016/j.ijsbe.2014.03.001.
[4] V. Maniatidis and P. Walker. Structural capacity of rammed earth in compression. J. Mater. Civ. Eng. 20(3), pp. 230-238. 2008. . DOI: 10.1061/(ASCE)0899-1561(2008)20:3(230).
[5] K. K. G. K. D. Kariyawasam and C. Jayasinghe, "Cement stabilized rammed earth as a sustainable construction material," Constr. Build. Mater., vol. 105, pp. 519-527, 2/15, 2016.
[6] Standard Test Method for Unconfined Compressive Strength of Compacted Soil-Lime Mixtures, ASTM D5102-09, 2009.
[7] Standard Test Method for Unconfined Compressive Strength of Cohesive Soil, ASTM D2166/D2166M-16, 2016.
[8] Standard Test Method for Splitting Tensile Strength of Cylindrical Concrete Specimens, ASTM C496/C496M-11, 2004.
[9] Standard Test Methods for Wetting and Drying Compacted Soil-Cement Mixtures, ASTM D559/D559M-15, 2015.
[10] Q. Bui et al, "Effect of moisture content on the mechanical characteristics of rammed earth," Constr. Build. Mater., vol. 54, pp. 163-169, 3/15, 2014.
[11] M. I. Gomes, T. D. Gonçalves and P. Faria. Hydric behavior of earth materials and the effects of their stabilization with cement or lime: Study on repair mortars for historical rammed earth structures. J. Mater. Civ. Eng. 28(7), pp. 4016041. 2016. . DOI: 10.1061/(ASCE)MT.1943-5533.0001536.
[12] Engineering Design of Earth Buildings, NZS 4297, 1998 [13] The Australian Earth Building Handbook, Walker, P., Sydney, 2002,
pp.151 [14] Bui et al. Modeling rammed earth wall using discrete element method.
Continuum Mechanics and Thermodynamics 28(1), pp. 523-538. 2016. . DOI: 10.1007/s00161-015-0460-3

177
The Well Being of Syrian Students in Refugee School Systems
Sumaya Nsair Department of Civil & Environmental Engineering
American University of Beirut Beirut, Lebanon
Marwa Sinno Department of Civil & Environmental Engineering
American University of Beirut Beirut, Lebanon
Amenah Chehadi Department of Civil & Environmental Engineering
American University of Beirut Beirut, Lebanon
Leen Tabbara Department of Civil & Environmental Engineering
American University of Beirut Beirut, Lebanon
Mohammed Salam Department of Civil & Environmental Engineering
American University of Beirut Beirut, Lebanon

178
1
The article investigates the possibilities of improving the current situation within the refugee school systems in Bekaa. It studies improvements in drainage systems, waste management, structural integrity and aesthetics, as well as the thermal comfort of the individuals residing in the classrooms.
I. INTRODUCTION This project studies the well-being of Syrian
refugee students in the temporary schools constructed in the Bekaa Valley. It concentrates on four different aspects:
Construction Materials
Drainage System and Hydrology Studies
Environmental Waste Management
Structural Analysis of the Schools
The following is a summary of the work done so far, in addition to the future steps needed in order to complete the project as a whole.
II. CONSTRUCTION MATERIALS
A. Thermal Comfort in School Classrooms Thermal comfort within school classrooms is a
key factor in deciding whether the temporary refugee schools constructed provide a comfortable environment for the students or not. That said, experiments and tests were performed in order to estimate the thermal comfort of the stud
ents in two different schools. These schools were selected such that one of them includes insulation material within the classrooms walls, while the other does not. Temperature, humidity, and dew point sensors were installed in two separate classrooms (one in every school), in addition to an outdoor weather station for a comparison of indoor and outdoor data. To guarantee acceptable results, the two classrooms under study had similar dimensions and orientation.
In order to test whether the existing thermal conditions meet the acceptable standards of human thermal comfort, the data acquired from these sensors was collected on a regular basis, and then analyzed using the static model and the adaptive thermal comfort formulas. In addition to that, the data was tested for statistical differences using T-tests where p-values were obtained using the excel formula: T-test (array1, array2, tails, type). The null hypothesis used when testing declared that “there is no difference in parameters measured (temperature, humidity and dew point) between classrooms with polystyrene insulation and classrooms without polystyrene insulation”.
The tests performed on the classrooms data showed that p-values were all below 0.05. This result indicated that the null hypothesis stated was to be rejected. Hence, it was safe to conclude that a difference exists between polystyrene insulated and non-insulated classrooms in terms of temperature, humidity and dew point. To predict thermal comfort the Predicted Mean Vote Model is used. The Predicted Mean Vote (PMV) model predicts the thermal sensation as a function of activity, clothing and the four classical thermal environmental parameters: air temperature, mean radiant temperature, air velocity and humidity. The advantage of the PMV model is that it is a flexible tool that includes all the major variables influencing thermal sensation. This model is applied on data collected from two different seasons, winter and autumn. The results are shown in the tables below.
Results from September till November
School PMV PPT
Tuliani 1.5 89%
Saadnayel -1.6 94%
Results from December till January
School PMV PPT
Tuliani -6.73 100%
Saadnayel -6.73 100%
Based on ASHARE standard-55, the results show that the PMV and the Predicted Percentage Dissatisfied (PPD) results are not acceptable because they are not within the acceptable ranges. The recommended acceptable PMV range for thermal comfort is between -0.5 and +0.5 and the recommended acceptable PPD range is less than 10% persons dissatisfied. From the thermal sensation scale shown in figure 5 in the appendix, the students feel too cold in winter in both schools. In autumn, the students feel approximately warm in Tuliani School and cool in Saadnayel School. This implies that the insulation material affects the thermal sensation of students only in fall season.
Table 2: PMV results in winter
Table 1: PMV results in fall

179
2
WQv= 1. 𝑅𝑅𝑅𝑅 .𝐴𝐴12
B. Straw Insulation The material chosen to be the natural insulator for
the classrooms was the crop by-product, straw. In the Bekaa region, thirty thousand tons of wheat were produced during 2015, and the straw produced, as a result of wheat production, might be invested in insulation for the improved models of the schools. However, to provide the maximum efficiency, an experiment on the thermal conductivity, as well as vibrational conductivity, of the straw was to be investigated, based on the current form of the sample of the straw samples, as well as the orientation of the straw relative to the incoming stimulus
An appropriate experiment involves using the Guarded Hot Plate available within the university campus to measure the thermal conductivity of a container with the straw sample inside. The container is made of the same recycled wood material used in the school wall frame construction, so as to make the experiment as close as possible to the field conditions. The samples are designed to be a perfect fit to the requirements of the Guarded Hot Plate with experiment duration of one day (24 hours). This experiment will provide the empirical data which will be used alongside suitable equations for the determination of the form and orientation of the straw to best insulate the classrooms.
The second experiment studies the sound insulation capacity of straw. It involves creating a noise insulating box, which prevents the leakage of noise from within, as well as the penetration of noise from the outside. The reason behind having the box insulated is that it would not interfere with the results attained from using the Sound Level Meter. This device would measure the incoming noise, from one side of the box, as it receives incoming vibrational noise from the speaker in the other side of the box. The straw samples would be placed in the middle, between the speaker and the Sound Level Meter, allowing us to determine which form and orientation of straw best suits the purposes of sound insulation.
III. DRAINAGE SYSTEM AND HYDROLOGY STUDIES Storm-water management is a pressing human
need. In refugee camps, where people have nothing except basic construction elements, this need becomes harder to attain. To study the storm-water management alternatives in refugee schools, Tolyane School at Bar-Elias is taken as an un-equipped utility example.
A. Important Hydrologic Parameters Bar-Elias is located in a region where Eutric
Cambisols is the dominant soil type. Cambisols are mostly of a high porosity, a high water holding capacity, and of good internal drainage. Furthermore,
soils in the area are considered to be permeable, as the land is mainly agricultural. In addition, the average water level at Bar-Elias is estimated in 2010 to be 892.5m (International Resources Group (IRG), 2013). As for the infiltration rate, it is estimated to be 25 mm/hour for a less than 4 % land slope and a sandy loam soil texture.
B. Surrounding Site Investigation By looking into the drainage systems implemented
in the surrounding refugee schools, the Saadnayel and Malala schools, also located in Bekaa, have been identified to have executed a natural drainage solution that focuses on gradation of aggregates to infiltrate water naturally into the ground (please find further details in Appendix). The system seems to be of a good functionality, as the ponding of surface water was treated and no underground utilities were required to be built.
C. Possible Storm-water Management Solutions Table 3 (next page) shows possible storm water
management alternatives, along with their advantages and disadvantages. Based on the Table 3 and given that a natural solution works well for such a project, as proven by application at nearby refugee schools, implementing rain gardens for storm-water management in Tolyane School, seems to be cost efficient, aesthetically appealing, and practical for such a small scale project. A rain garden, which is an infiltration-based Low Impact Development (LID) method, depends on slight depressions to help collect surface water and vegetation to help with natural infiltration. It ponds storm-water in the planted area, before allowing water to filter through the soil mix and plant roots. Figure 1 summarizes the components of a rain garden.
For rain gardens, also called bio-retention devices, the water quality volume (WQv) is the most significant criterion in the sizing process. The water quality volume is one of the unified storm-water sizing criteria, and requires the removal of 80% of Average Annual Total Suspended Solids (TSS). For Tolyane School, the water quality treatment volume will be assumed to be equal to the runoff generated from 1 inches of rainfall, as most of the rain events measured by the weather station installed at the school were less than 1 inches during two months of measurement (January and February).In numerical terms, WQv is calculated as follows (George Stormwater Management Manual, Aug 2001):
Where: WQv = water quality volume (Acre-Feet); Rv = 0.05 + 0.009(I); I =percent impervious cover; A = site area (Acre).

180
3
Af= 𝑊𝑊𝑊𝑊𝑊𝑊 . 𝐷𝐷𝐷𝐷
𝐾𝐾 . 𝐻𝐻𝐷𝐷:𝐷𝐷𝐷𝐷 . 𝑇𝑇𝐷𝐷
I= 𝐼𝐼𝐼𝐼𝐼𝐼𝐼𝐼𝐼𝐼𝑊𝑊𝐼𝐼𝐼𝐼𝐼𝐼𝐼𝐼 𝑆𝑆𝐼𝐼𝐼𝐼𝐷𝐷𝑆𝑆𝑆𝑆𝐼𝐼 𝐴𝐴𝐼𝐼𝐼𝐼𝑆𝑆𝑇𝑇𝐼𝐼𝑇𝑇𝑆𝑆𝑇𝑇 𝐴𝐴𝐼𝐼𝐼𝐼𝑆𝑆 .100=
𝑅𝑅𝐼𝐼𝐼𝐼𝐷𝐷 𝑆𝑆𝐼𝐼𝐼𝐼𝐷𝐷𝑆𝑆𝑆𝑆𝐼𝐼 𝐴𝐴𝐼𝐼𝐼𝐼𝑆𝑆𝑇𝑇𝐼𝐼𝑇𝑇𝑆𝑆𝑇𝑇 𝑆𝑆𝐼𝐼𝐼𝐼𝐷𝐷𝑆𝑆𝑆𝑆𝐼𝐼 𝐴𝐴𝐼𝐼𝐼𝐼𝑆𝑆 . 100
I= 37788329 . 100 = 45.3 %.
Rv =0.05+0.009. (45.3)=0.46.
WQv= 0.46 . 0.19 12 =0.0073 Acre-Ft = 316 ft3.
For Tolyane School: A= 8329 ft2.
Next, the required rain garden area is computed using the following equation (based on Darcy’s Law):
Where: Af = Surface area of ponding area (ft2); Df = Filter bed depth (minimum of 2 ft); K = Permeability coefficient of filter media in ft/day (k=1 ft/day for sandy-loam); Hf = Average height of water above filter bed (ft) (typically 3 inches, which is half of the 6-inch ponding depth); Tf = Design filter bed drain time in days (taken to be 1 day).
Storm-water Management
Solutions Advantages Disadvantages
Bio-swales
Removal of storm-water pollutants.
Slowing of the runoff rate in comparison to
storm drain pipes.
Irrigation required to maintain vegetation.
Rebuilding of the system is required in
case of clogging.
Retention Ponds
Peak flow reduction.
Ecological and aesthetic benefits.
Not good with runoff volume reduction.
Large Land area and a moderate financial
investment is required.
Perceived health and safety risks.
Regular inspections for erosion and
removal of sedimentation and
algae must be made.
Traditional Pipe System
Proven efficiency in surface water
drainage.
Regular maintenance is required.
Underground tank and pipe system must be
installed.
Not as sustainable as other solutions.
Rain Garden
Aesthetic benefits.
Aquifer recharge can be enriched.
Can help remove pollutants.
Low Maintenance and
capital cost ($4.00 - $10.00
per Ft 3).
Can accumulate standing water or
cause erosion if build the wrong way.
Af= 316 2 1 0.25:2 1 =281 ft2.
Figure 1: Rain Garden Components
Table 3: Storm-water management alternatives

181
4
IV. ENVIRONMENTAL WASTE MANAGEMENT
Concerning environmental management, the project looks for possible ways to reduce the amount of produced wastes in the schools, in addition to searching for better solutions to properly dispose of the generated organic wastes without harming the environment.
In hopes of achieving a reduced waste policy, thorough researches and experiments done by international universities were studied. One of the most successful experiments found can be summarized as follows:
The study suggests delaying the students’ breakfast time till after their recess, making them more hungry and in need of the energy, and thus promoting the eating of the food without throwing any of it. After performing this experiment in several Canadian schools, around 70% of the wastes produced were found to be gone.
That said, a small survey was created, asking the administration and teachers of the refugee schools they believe such a solution can be implemented in order to lessen the amount of organic wastes. The results obtained were all positive, and the administrations of both schools were found to be willing to try the solution out.
As mentioned earlier, the project also searches for ways to properly dispose of the produced waste, without harming the environment. After thorough research on this topic, and keeping in mind the limited resources available in the areas under study, it was concluded that the optimum solution for waste disposal is composting. Several environmental and agriculture engineers were interviewed for guidelines regarding the implementation of the solution. Dr. Bachour at the Faculty of Agriculture and Food Science helped greatly by explaining the different aerobic and anaerobic composting techniques and advising to go with anaerobic composting due to its cheap price, quick results, and guaranteed effectiveness.
Having done the research, it was time to start implementation. Two composting compartments, each having an area of 1 square meter were installed. Every week, the wastes were (and still are) moved from one compartment to the other, thus aerating them and keeping them moist. Figure 2 shows one of the compartments after filling it with organic wastes for the first time.
In addition to that, a composting experiment was performed in one of Beirut’s most popular schools (HHS2). In October 2016, and with the help of their biology and chemistry teachers, grade 11 students performed the same anaerobic composting experiment with their own organic wastes. After several months,
the results obtained showed perfect composting material, indicating the success of the experiment. This experiment was analyzed and studied before installing the composting compartments in the refugee schools in order to guarantee successful results.
V. STRUCTURAL ANALYSIS OF THE SCHOOLS The fourth dimension of improvement of the
school model performance is capacity. According to the OECD (International organization helping governments tackle the economic, social and governance challenges of a globalized economy), the average number of students per primary education classes in educational institutions in developing countries is around 26 (OECD, 2012). However, in the refugee schools under study, this number increases to reach an average of 36 students per classroom. This rise in number results in negative effects on the students’ ability to learn and comprehend the subjects taught.
To increase the capacity of the school while maintaining an acceptable class size, vertical expansion through two story models was studied structurally and financially. Designing two story models using wood, steel, and the basic construction material and technology available was found to be challenging but possible.
The current school structural system has been constructed from plywood for the walls, steel columns and gutters, and fiber sheets for the roof as shown in Figure 3. The materials used can be disassembled, moved, and reassembled on different locations whenever needed, which is a requirement that needs to be satisfied in the new designed two-story model. In addition, the structure is classified as prefabricated, which allows for reduction of cost, improvement of quality (the components can be manufactured under controlled conditions), speed of construction while using locally available materials with required characteristics as light weight, ease of workability, and enhancement of thermal insulation (Christopher, 2013). Due to the aforementioned reasons the same materials is to be used in the improved model, in addition to the experimentally approved insulation.
Figure 2: Composting bin filled with organic wastes

182
5
Figure 3 shows the dimensions of a typical classroom which is constructed separately from the other classrooms. This means that a two story model will require the construction of a staircase for each classroom separately. The cost of construction of one straight wooden stairs that reaches up to 2.6m, which is the height of the ground floor classrooms, is about $760 USD ( “Exterior Stairway Costs”, n.d., 2016) with a low cost of $424 USD (“Build Stairs and Railing Costs”, n.d., 2016). These costs are comparable to the cost obtained from a local carpenter (Mr. Yusuf Nsair) who estimated the cost of such stairs by $700 USD. This cost can impose a financial restraint and lead to a structural model that is completely different from the existing one, a one where the upper classes will have corridors joining them and access to the second story will require the presence of two stairs only; one for regular access and another for emergencies as fire. In addition, external stairs are chosen since generally, building indoor stairs is harder, slower, and results in a more complicated structural stability.
Figure 3: Current Structural Model in Tuliani School
The two story structure is modeled on sap2000. Figure 4 shows the model.
Figure 4: Two Story Model on Sap2000
The model was proven to be able to carry the loads, rendering the vertical expansion possible. It is currently being further analyzed for minor constructability details.

183
6
ACKNOWLEDGMENT
The team would like to express gratitude to Dr. Issam Srour and Dr. Aram Yeretzian for their continuous assistance and follow up. Also, the team would like to thank Dr. Ghassan Chehab and Mrs. Reem Mehdi for provision of proposal guidelines in addition to the informative FYP sessions.
REFERENCES
[1] A. Beck, U. Heinemann, M. Reidinger and J. Fricke, "Thermal Transport in Straw Insulation", Journal of Building Physics, vol. 27, no. 3, pp. 227-234, 2004
[2] Atlanta Regional Commission, “Georgia Stormwater Management Manual”, Technical Handbook, Vol.2ED1, pp.37, Aug. 2001.
[3] "Cost to install exterior stairs - Estimates and Prices at Howmuch", HowMuch,2017.[Online].Available: https://howmuch.net/costs/exterior-stairs-wood-install-build. [Accessed: 20- Mar- 2017].
[4] G. Gaslow, "The Difference Between Internal and External Staircases", TheStaircaseExperts,2017.[Online].Available:https://thestaircaseexperts.wordpress.com/2014/01/27/the-difference-between-internal-and-external-staircases. [Accessed: 20- Mar- 2017].
[5] "Human Thermal Comfort | Sustainability Workshop". Sustainabilityworkshop.autodesk.com. N.p., 2017. Web. 10 Apr. 2017.
[6] “LITANI RIVER BASIN MANGEMENT SUPPORT PROGRAM,” 04-Dec-2016.[Online].Available:http://www.databank.com.lb/docs/Groundwater%20modeling%20within%20the%20upper%20Litani%20Basin-Oct%202013.pdf. [Accessed: 20-Mar-2017].
[7] M. El Khoury, “Thermal Comfort Models”, working paper, AUB, Beirut, Lebanon
[8] "Recess Before Lunch", NEA, 2017. [Online] Available:http://www.nea.org/home/43158.htm. [Accessed: 20- Mar- 2017].
[9] S. Al Husseini, "قمح البقاع ينتظر قرار تسلمه", Assafir, 2015
[10] 2017.[Online].Available:https://www.scribd.com/doc/183466978/168358333-Prefabricated-Structures-pdf. [Accessed: 20- Mar- 2017].
A
APPENDIX:
Figure 5: Thermal Sensation Scale
Figure 6: Drainage Layering in Saadnayel and Malala Schools

184
1
Training Center for Crisis Management
ZeinaBaydoun, Alehandro El Khoury, Marcelle Haddad, Mariam Yammine, and JoudYassine Civil and Environmental Engineering Department
American University of Beirut P.O.Box 11-0236 / (Department) Riad El-Solh / Beirut 1107 2020
Lebanon [email protected] [email protected]
[email protected] [email protected]
Abstract - The following paper presents the final year project of Group 11. The project consists of establishing a training facility for crisis management in Lebanon. The paper first assesses the need for the project and identifies its components. It further provides its concept and design.
I. INTRODUCTION Lebanon is subject to various types of disasters that contribute to the high rate of fatalities and structural damage of the urban and rural areas. Also, many armed conflicts and terrorist attacks have targeted Lebanon's infrastructure and have caused great human and financial losses over the past years. The proposed project aims to mitigate the impact of the natural catastrophes as well as the man-made disasters on the Lebanese society in terms of fatalities, building collapses and loss of infrastructure by planning and designing a training center for crisis management. The facility will enhance the emergency responders' preparedness to such situations. It will therefore host Red Cross volunteers, Civil Defense Units and Lebanese Armed Forces and provide them with a well-rounded training program composed of two stages. The first stage consists of offering the trainees theoretical knowledge about the different types of crises that could occur in Lebanon and their consequences through lectures given in classrooms. The second stage will allow the trainees to apply the acquired knowledge through different mock-ups existing on campus. This paper presents the plan and design of the training center that is inspired by similar facilities around the world where a mock-up is associated to each type of hazard [2].
II. LITERATURE REVIEW In order to establish the need for this project, the different natural and man-made hazards threatening Lebanon are identified. Additionally, the current situation in Lebanon to manage such hazards was investigated. Finally, similar
facilities around the world that can help set a framework for the proposed training center were considered [2].
A. Hazards in Lebanon Based on historical evidence collected, Lebanon is exposed to a variety of manmade and natural hazards which include: floods and flashfloods, landslides, earthquakes and tsunamis, terrorist attacks, and building collapses.
B. Current Issue: Disaster Risk Management Program (DRM)
According to the United Nations Development Progamme (UNDP), the Lebanese community is vulnerable to the previously discussed risks mainly due to the lack of a strong strategic risk management plan. Thus, UNDP Lebanon supports the Lebanese government in developing and implementing an official Disaster Risk Management (DRM) program. The goal of this collaboration is to establish an inter-ministerial DRM unit, capable of developing a National Action Plan. According to Ms. Karine Zoghbi, who is the project officer of the UNDP DRM Unit of the Presidency of the Council of Ministers, "Strengthening Disaster Risk Management Capacities in Lebanon” is already an ongoing project. The DRM plan is in accordance with the Sendai Framework which will be implemented between 2015 and 2030, and takes into account the capabilities of Lebanon, as an underdeveloped country. The project further helps in the strategic planning of the Government through four elements: Prevention, Preparedness, Response and Recovery [2].
C. Similar Facilities Many training centers for disaster management and emergency preparedness have previously been constructed in multiple countries around the world. The Guardian Centers and Texas A&M Engineering Extension Service (TEEX) are compounds located in the USA that provide realistic tactical training and

185
2
disaster preparedness scenarios through lectures and real-life testing on mock ups. Based on the findings, the need for establishing a training center for crisis management in Lebanon is of paramount importance. It will assist the agencies in the execution of a comprehensive DRM and guarantee a faster intervention and a better response. This will ultimately attenuate the harm generated in case of a disaster [2].
III. LOCATING THE FACILITY The success of the project is highly dependent on the location of the campus. Therefore, many considerations are necessary in the siting process such as having an easy accessible network and location near health care institutions in case of emergency. In order to identify the best location for the campus, a two-stage process was adopted. First, the spatial analysis tools like ArcGIS and Google Earth were used. These platforms are helpful in managing and analyzing the data related to the campus siting process, through the manipulation of geo-referenced-digital maps. However, despite their ability to present, map, and analyse the input data, they serve only as a support for the final decision making. Therefore, as a second stage, a field visit was necessary to finalize the decision making.
A. ArcGIS Modeling In order to optimize the choice of the location, “ArcGIS”, a spatial analysis tool capable of generating maps, assembling geographic data, and analyzing the information on the map is used. The relevant available layers are the following: Chebaa limits, roads, historical sites, operating hospitals, sewer outfalls, industrial sewer outfalls, airports, ports, Libancell coverage, population and fixed telephone coverage. These layers are superposed on the actual map of Lebanon. The siting process relied on distancing from undesired elements, and approaching other favorable ones. This was done through the “Multiple Ring Buffers” tool and resulted in concentric distances around the inputted layers. In addition, a weighted scoring approach was adopted for each of the concentric distance. A distance with a high positive score indicates the favorability for the location selection. Similarly, a low score reflects that the related distance is not favorable for the location selection. Table I found in the Appendix shows the inputted layers, a brief description of the layers and their relation to the campus location, the scores and the assigned buffered distances.
B. Location Determination
Through a process of multiple ring buffers, intersection and scoring, GIS highlights potential locations. The scoring results are sorted from highest score being the best suitable location, to the lowest score being the least desirable. The highest score achieved is 200 and the potential locations are shown in Fig. I shown below, highlighted in cyan color. Highlighted locations are further investigated through both GIS and Google Earth Pro software. This resulted in the elimination of many suggested locations mainly due to the urban agglomerations detected. Thus, after conducting successive field visits, the selected land is located in Tabarja as shown in Fig. 7 and Fig. 14 found in the Appendix.
Figure 1. Potential locations and the selected campus location
C. Geologic Formation
According to the map of Fig. 8 found in the Appendix, the chosen location of the campus belongs to the C4D geologic formation also known as the Cenomanian stage or the "Sannine Limestone". In Tabarja, The Cenomanian limestone's thickness is approximately equal to 575 meters. This geologic formation consists of three units. The unit at the surface has a thickness of 200m, and is formed of thin beds of limestone and marls. This unit's high content of fossils and organic remains as well as the intensive joints between the beds enhanced its permeability and enabled it to act as an efficient upper aquifer [6]. The second unit possesses a depth of 200 meters. This unit is comprised of dense limestone and accumulations of chert and calcite. Hence, it prevents water from infiltrating and

186
3
forms an aquiclude. The third unit has a depth of 100 m and is comprised of thin beds of fractured limestone [6].
IV. THE CAMPUS
The designed campus consists of several mock-ups and facilities assembled in the master plan found below.
Figure 2. Master plan of the campus
V. THE COLLAPSED BUILDING MOCK-UP
A. Purpose In order to mitigate the impact of earthquakes and bombings, a Collapsed Building mock-up that replicates the real conditions of residential and commercial buildings after disasters is designed. This will help the trainees learn and apply the rescuing operations on the victims entrapped in collapsed buildings in a safe and efficient environment.
B. Conceptual Design The concept behind the collapsed building mock-up was inspired by the failure mechanisms of the different types of structures in Lebanon due to earthquakes.
i. Ground failure Ground failure is manifested by the horizontal and vertical movements of the ground along faults, landslides, settlements or soil liquefaction. It can cause the complete collapse of a building. This type of failure is not considered in the design of the mock-up [7].
ii. Ground Shaking Ground shaking due to earthquakes causes the building's foundations to vibrate. Therefore, some construction materials such as brick or masonry tend to crack. In the designed mock-up, the rubble resulting from cracked material is considered. Behavior of the structural elements:
Free standing masonry walls are overturned by the seismic force. Moreover, shear walls containing openings experience shear and bending cracks between these openings. Roofs and floors that are not strongly tied to the walls or that can't resist bending will be displaced [7]. This situation is replicated in the designed mock-up by providing inclined columns and slabs as well as cracked openings.
C. Architectural Design The architectural drawings of the building were executed by further developing the conceptual design. The mock-up consists of a basement, a ground floor, three floors and a roof. The building has a commercial and residential function that exposes the emergency responders to rescuing operations specific to each building type. The ground floor and first floor replicate offices whereas the second and third floors were designed as residential units. The mockup illustrates different stages of potential damages to the collapsed building and is shown in Fig. 9 in the Appendix.
i. Moderate Structural Damage Moderate structural damage exists when the structure's ability of carrying load is slightly lessened. This case is applicable to the following floors:
Ground floor Two corner columns are entirely demolished because they are directly located under the slabs that fell from the first floor.
First Floor The slab's shape is irregular; it is cracked from various sides due to the detachment of many sections of the slab that fell on the floors below. One of the columns C7 is entirely collapsed and missing. The second column C7 is partially demolished due to the inclination of the supported slab. Columns C6 are inclined by an angle of 450 due to the drop of the supported slab as shown in Fig. 10 in the Appendix.
Second Floor The lower right section of the slab drops by a height of 1 meter but is still attached to the rest of the slab through the steel reinforcements. The slab is therefore tilting downwards with a slope of 10%.
The stairs leading to this floor are demolished.
ii. Severe Structural Damage This stage occurs when the building has lost 50% of its structural elements. This case is applicable to the following floors:
Third Floor

187
4
A large opening in the slab is present. Columns C8 and C10 are crushed by the inclination of the slab of the roof that dropped down by a height approximately equal to 3 meters. The large opening along with the irregular slab shape on the roof show that part of the slab has fell on the third floor causing an inclination of the column C11 by an angle of 200 and the partial destruction of column C9 located at the corner of F3 as shown in Fig. 11 in the Appendix. The plan view of this floor is shown in Fig. 13 in the Appendix.
Roof
Three large openings in the slab exist on the roof. These openings can be caused by incendiary bombs that target buildings in case of wars.
The upper left and lower right sections of the slab have cracked and dropped down by heights of 3 m and 1.7m respectively while staying attached to the original slab by the steel reinforcements.
D. Structural Design The irregular elements of this mock-up imposed a challenge in its design. ETABS was used to execute the structural analysis and design of this building that were based on the ACI Building Code Requirements (ACI 138-14). The model obtained can be found in Fig. 12 in the Appendix.
V. THE TUNNEL MOCK-UP
A. Purpose
The impact of catastrophes like vehicle accidents, flooding and fire is further intensified when they occur inside enclosed roadways like all types of tunnel structures and underground parking, or enclosed roadway created by highway bridges. Therefore, having a tunnel mock-up, inside the Training Center, where the critical and dangerous scenarios can be simulated is of a detrimental use for the efficiency of the training program. The structure will represent a typical tunnel in Lebanon, particularly an underpass.
B. Geometrical Configuration
After going through an iterative design process, the optimum tunnel alignment and cross section is chosen. In addition to the general roadway requirements, the design further considers the special requirements for the tunnel structure like the lighting, ventilation, fire safety systems, and emergency egress capacity.
i. Design Standards Used The design of the tunnel is based on AASHTO’s “Green Book” - A Policy on Geometric Design of Highways and Streets.
ii. Horizontal and Vertical Alignment
Maximum Grades The effective grade is set to be 2 % which is less than the maximum allowable effective grades of 4% to exceptionally 6% in some locations. This will also eliminate the need of having a climbing lane for heavy vehicles which complicates the construction considerably.
Horizontal and Vertical Curves The tunnel mock will include a horizontal curve since rescue operations are more complicated in critical sections. A maximum allowable horizontal radii of 1000-ft is required knowing that it accounts for the traffic speed, the sight distances, and the super-elevation. The turning radius is set to be 300 m. The super elevation rate, which is the rise in the roadway surface elevation from the inside to the outside edge of the road, is 3% which is less than the maximum of 6%.
Sight and Braking Distance Requirements Sight and braking distance are necessary considerations in the design. The Stopping Sight Distance is specified to be 80 km/hr. The tunnel will not necessitate a local widening through a “sight shelf” to meet the SSD requirements.
C. Travel Clearance
The 5th Edition of AASHTO Green Book (2004) recommends that the minimum vertical clearance to be 4.9 m for highways and 4.3 m for other roads and streets. Therefore, the tunnel mock-up has a clearance of 4.5m to account also for the ventilation system, shown in Fig. 3 below.
Figure 3. Clearance height
D. Cross-section Elements The cross-section of the tunnel should be able to accommodate horizontal and vertical features of a tunnel such as travel lane,

188
5
shoulder, and sidewalk width and other drainage, ventilation, light and safety considerations.
i. Width of Travel Lane, Shoulder, and Sidewalk/Curb
According to AASHTO 5th Green Book the minimum width of a travel lane is 3.6 meter and that of the shoulder should be between 0 and 2.75m. Maintenance personal use the sidewalk or curb in a tunnel to access equipment control areas. Moreover, in case of an emergency, passengers and rescue operators use it to get to the nearest exists. It is recommended to place the sidewalk or curb after the shoulder at a width of 0.7m. Furthermore, a raised barrier should be provided so that moving vehicles will not damage the tunnel wall or any lighting fixtures. In the proposed tunnel design, the assumed travel lane width is 3.6 m, the shoulder width is 1m, and the sidewalk/curb width is 0.7m as shown in Fig. 4 below.
Figure 4.Tunnel Roadway Widths
ii. Tunnel Drainage The drainage system inside the tunnel mock-up include: pipes, channels, control systems for the collection and disposal of effluents that might accumulate and a sump/pump located at the low points of the tunnel and at points where water will be entering the tunnel.
iii. Tunnel Ventilation A ventilation system is needed in the underpass. In the tunnel design, the longitudinal ventilation system will be adopted. It introduces the air into the system and removes it outside in the direction of longitudinal flow of traffic. The machines are put at different points inside the tunnel. It also has a lower capital cost, as shown in Fig. 5 below.
Figure 5. Schematic Drawing of Longitudinal Ventilation System
iv. Tunnel Lighting and other Safety Elements Lighting fixtures in tunnels are usually placed on the ceiling or attached to the walls next to the ceiling. For safety measures, it is advisable to identify exit routes using lighting. Exit sign should be place at low levels, so that in case there is smoke, one can identify the exit sign. In addition to the lighting criteria, other safety equipment will be placed in the tunnel mock-up, such as:
Water supply pipes for fire fighters Fire extinguishers and hose Surveillance Cameras Emergency telephones
v. Fire Simulation in the Tunnel
In order to add realism to the training scenarios specifically the fire safety training, a fire simulating machine is implemented along with a smoke generator. Upon conducting market research, Superior ST-10 Smoke generator manufactured by Superior® Smoke company, is found to be suitable for the training purposes. This will mimic the poor visibility conditions during fire. Whereas for the fire simulation, FAUXFIRE® simulated fire system is used to produce the fake flames. A combination of 6 ft and 8ft units is needed. Both mechanisms will not cause no any harm to the trainees since no toxic smoke is involved neither hot flames.
VI. THE BASIN MOCK-UP
The designed campus encloses a mock-up to simulate the risk of tsunamis that Lebanon is prone to. This mockup consists of a basin containing a two-story building that can be immersed in water to replicate tsunamis.
A. Conceptual Design The main aim behind this facility is to replicate the tsunamis risk contributing highly in the Lebanese hazards map. The basin entails the following elements: A two-story building built at 6 meters below ground level
as shown in the sketch provided in Figure 6 below. A retaining wall bearing the Earth pressure from one side
and the water pressure from the other side in case of immersion. The retaining wall is offset 2 meters away from the building creating a 2-meter wide channel between the retaining wall and the building.
A controllable pumping system connecting the sea water to the basin, as well as a dewatering system consisting of dewatering pumps located at the bottom of the basin.
These elements will further be designed in future stages of the project.

189
6
Figure 6. Sketch representing the basin with the immersed building
B. Operational Phase
Under operation, water is pumped into the basin, through a piping system pumping sea water preceded by a series of fixed screens to remove floating and suspended solids from the water entering the basin. The operational phase consists of immersing the building with water up to 6 meters of water, thus covering the entire building. Different training scenarios can immerse the building with water to different depths for several purposes and applications.
VII. OTHER MOCK-UPS
A. Trench Excavation Mock-up
In order to alleviate the injuries and accidents that occur during construction, the team has decided to place a trench mock-up that would simulate real-life scenarios. The main reason for injuries in trench excavations is cave-in where the soil collapses on the workers. Other causes include falling into the trenches, exposure to underground services or overhead cables as well as toxic and irritating gases. The trench has a length of 10 m, a width of 2.5 m, and a depth of 5 m.
B. Apron Mock-up
The dimensions of the apron are based on the dimensions of one of the most commonly used aircrafts for military, search and rescue services which is the Sikorsky S-92. In this mock-up, aerial activities are exercised. The apron's length and width are equal to size of 30 m and hence it occupies an area of 900 m2.
C. Administration Building
The purpose of the administration building is to incorporate classrooms and conference rooms where the theoretical aspect of the training program is provided. In fact, the classrooms host lectures concerning the rescuing operations and safety regulations that are followed by the emergency responders
prior to training on the mock-ups. Additionally, lectures are given to students from different Lebanese educational institutions to raise awareness about avoiding and responding to emergencies. The building is also home to the command and control unit that manipulates all the mock-ups. The unit has access to cameras which serve as means to monitor the training sessions as well as to control special effects. These effects include smoke, fire and water generators. The allocated area for the building is 300 m2.. This facility consists of two floors, six classrooms, three conference rooms and one command and control unit. Each classroom occupies an area of 50 m2 and accommodates a maximum of 20 trainees while the conference rooms have an area of 60 m2 each. The command and control unit occupies an area of 100 m2.
D. Dormitories
The purpose of the dormitories is to provide a secure place to stay for the trainees who live far from the center and wish to stay in the facility. Three dormitories are available and can host 100 people. Each building's area is 400 m2 and consists of two floors. A kitchen and a living room are provided on the first floor while the second floor is allocated for rooms where trainees can sleep.
ACKNOWLEDGMENT
This project was supported by the Civil and Environmental Engineering Department at the American Universit of Beirut, under the guidance of Dr. Shadi Najjar.
References
[1]A. Karimi, M. Jafari, A. Usachov and H. KananiMoghaddam, "The Fire Simulation in a Road Tunnel", Journal of Applied Fluid Mechanics,, vol. 4, no. 1, pp. 121-138, 2017. [2]Z. Baydoun, A. El Khoury, M. Haddad, M. Yammine and J. Yassine, "Training Facility for Crisis Management in Lebanon.", Beirut, Lebanon. [3]J. Wisniewski, N. Munfah, J. Monsees and C. Hung, "Technical Manual for Design and Construction of Road Tunnels — Civil Elements", National Highway Institute U.S. Department of Transportation, Washington, D.C., 2009. [4]"Superior Smoke", Superior Signal, 2017. [Online]. Available: http://superiorsignal.com/superior-smoke. [Accessed: 10- Mar- 2017]. [5]"Faux Fire", Technifex, 2017. [Online]. Available: http://technifex.com/products/fauxfire-2/. [Accessed: 10- Mar- 2017]. [6]Tuglamari,K., “The Stratigraphy, Structure and Hydrogeology of the Nahr-El-Kalb-Maameltein coastal area”, pp. 66-69, June 1975.

190
7
[7]2017. [Online]. Available: https://www.nicee.org/iaee/E_Chapter2.pdf. [Accessed: 20- Mar- 2017].
APPENDIX TABLE I
SCORING RESULTS AND DESCRIPTIONS OF INPUTTED LAYERS
Content of the Layer
Description
Buffered Distances (in km)
Assigned Score
Chebaa Limits
The campus should be away froChebaa limits to avoid any securtiy threats
10 -100
20 -90
ARoads The availability of roads is crucial to ensure the access to and from the campus
2 100
4 90
6 80
8 70
Historical sites
The campus should be away from historical sites
1 -100
2 -90
3 -80
4 -70
5 -60
Operating hospitals
Hospitals should be located close to the campus in case of health emergencies during training
1 100
2 90
3 80
4 70
5 60
Sewer outfalls
The campus should be located away from the sewer outfalls to avoid any contamination to the maritime training equioment
0.5 -100
1 -90
1.5 -80
2 -70
Industrial sea outfalls
The campus should be located away from the industrial sea outfalls to avoid any contamination to the maritime training
0.5 -100
1 -90
1.5 -80
2 -70
Airports The campus should be located away from existing airports to avoid any noise distrubance and induced congestion
0.5 -100
1 -90
1.5 -80
2 -70
Figure 7. Sattelite image of the chosen location
Figure 8. Geologic map showing the C4 formation

191
8
Figure 9. 3- Dimensional view of the collapsed building mock-up
Figure 10. Cross-sectional view of column C6
Figure 11. Elevation of the irregular columns
Figure 12. ETABS model of the collapsed structure
Figure 13. Plan view of the third floor of the collapsed structure
Figure 14. Results of ArcGis modeling for location determination

192
Vertical Farming Kareem Oueidat - Nazih Kassem - Mohamad Toukan - Mohamad Itani - Nader Shaer
Department of Civil and Environmental Engineering American University of Beirut
Beirut, Lebanon [email protected] - [email protected] - [email protected] - [email protected] - [email protected]
Abstract This paper investigates the possibility of vertical farming (VF) in tackling the threat of food security due to increase in population. This paper will examine how a multi-story complex in Qatar is able to meet the constant demand for food. Through extensive research on the technology used in previous vertical farms and sustainable design techniques, this paper shall determine whether a full-fledged structure in the Gulf can produce enough food for it to be a viable solution in fulfilling food security, in a way where losses are minimal. The research will conclude with a summary of works done to date and what their impact was.
I. INTRODUCTION
Vertical Farming is an innovative technique tackling the worlds increase in population. By the year 2050, nearly 80% of the earth’s population will reside in urban centers (WHO 2004). Food shortage due to the high demands of citizens and increased air pollution due to congestion and overcrowding are some of the problems Vertical Farming can tackle. The full-fledged vertical farm provides a solution to the Gulfs’ barren land issues.
This project requires the collaboration of multiple civil engineering disciplines: water resources (hydrology/hydraulics), sustainability, materials, structural, and environmental engineering. Vertical farms include aspects of hydrology where a detailed study will be conducted in order to provide the plants with optimal water content, and the most suitable quality needed for them to grow without bearing any additional costs. Furthermore, the hydraulics aspect will require providing pipes to transmit irrigation water to the plants in a way that will reduce losses and maximize the efficiency of the system. Given that the project is about vertical plantation, sustainability is a major issue. Choosing the proper type of material (concrete, soils, lights, etc.) that favor the growth of plants and reduces energy input is an important. Vertical Farms have been implemented in various locations over the past ten years. Their adoption is present and expanding in several places in North America, Europe and Asia. The Netherlands and Japan have embraced this idea, taking advantage of its efficient land-use. Nevertheless, the most advanced vertical farms are located in the USA.
II. METHODOLOGY AND SCOPE OF WORK
A. METHODOLOGY
The methodology that was set out includes identifying the proper location, identifying the crop requirements and the food demand in Qatar and analyzing the environmental contribution of the vertical farm. B. LOCATION With the Gulf region being one of the driest regions in the world, and subjected to harsh climatic conditions, extremely low rainfall, a poor irrigation system and a workforce lacking in necessary farming skills, the countries are driven to depend heavily on imports to meet consumption needs (Wyatt 2015). A vertical farm in one of these countries can be an optimal solution to address the issue of food security allowing them to finally produce fruits and vegetables which it has been used to through importing. Vertical farming technologies such as hydroponics and grey water reusing are readily available in GCC countries such as Qatar and the UAE which facilitates the implementation of a vertical farm in this region. C. CROP REQUIREMENTS Evapotranspiration is the most important feature in a vertical farm. Evapotranspiration results in cooling by the latent heat effect (Davis 2015). Latent heat is absorbed by plants in order for transpiration to occur. So, determining the potential evapotranspiration of certain types of crops is essential to know how much moisture supply is needed for continuous cooling by latent heat effect. The Penman Monteith equation will be used to calculate the evapotranspiration potential. This equation requires radiation, air temperature, air humidity and wind speed data for calculations (FAO 1981). Therefore, weather data for the Qatar region will be collected. Most of the calculations will be based on the FAO 56 “guidelines for computing crop water requirements” report. Soil water content and water conductivity are also important factors in determining transpiration rates. Higher soil moisture results in a higher transpiration rate. Indoor environmental conditions will be optimized so that plants can achieve more of their growing potential (Plantlab 2010). Variables such as root temperatures, air humidity, airflow, radiation wavelength and light intensity and CO2 will

193
be controlled to allow optimal growth conditions (Plantlab 2010). D. FOOD DEMAND For the food production variant of the VF, food demand will be estimated by determining the quantities imported by the country of study. These values will be divided by the total population to determine yearly food demand per capita. Finally, the food demand per capita is multiplied by 200 in order to study the food demand per 200 capita. The food demand calculated will therefore be considered as the target yield of our vertical farm structure. The selection of crop types should therefore help in meeting this target yield. E. ENVIRONMENTAL CONTRIBUTION The evapotranspiration rates calculated will be used to estimate the cooling effect of the atmosphere. This is the energy required to vaporize the water in the plants. Evapotranspiration units will be converted from mm/unit time obtained from the Penman Monteith equation to MJ/m2/day based on the latent heat of vaporization. Having the vegetation cover area, the “removed heat” will be calculated and cooling effects estimated.
III. TECHNOLOGIES USED
A. HYDROPONICS
Hydroponics is a method used in growing plants without the use of soil. First developed in 1933 by Dr. William frederick gericke at the university of california, davis, hydroponics was established to sprout roots in water before they are transplanted into a soil medium. The theory behind this method is based on the fact that plants do not require soil to grow. The soil itself only serves as a “solid base of operations into which they can spread their roots, thus plants can grow in any medium as long as there is enough water, dissolved minerals and a source of nitrogen“(despommier 2009). When such a system is employed in a “closed-loop” technique, water is conserved and losses are minimized. Different types of hydroponic systems were implemented such as : drip irrigation, ebb and flow and nutrient film technique. B. SOLAR PANELS Solar panels were used in projects in order to produce enough energy to power the hydraulic system passing water to the plants. Despommier, a leading figure in Vertical Farming, stated that solar panels must be placed on the façade (one side) and on the rooftops to garner the optimal amount of energy needed (Al-Chalabi 2015). Vertical farms such as Skyfarm Toronto, ThePlant in Chicago, and Farmedhere in Chicago implemented solar panels in their design in order to reduce the high costs of energy needed to grow the plants.
C. LED LIGHTS
LED lighting for urban farming allows for a very efficient energy conversion over other artificial lighting sources (Despommier 2009). Farmedhere in Chicago have used LED lights to provide energy to these plants in order to eliminate any excessive heat that might be trapped between the plants (Matros 2015). Lighting is a crucial factor in any effort to grow inside, since plants require a lot of light to grow but also because lighting is a vertical farm’s highest cost.
D. WATER TREATMENT A water treatment facility was designed in orcer to reuse the surplus water in the hydraulic system. Knowing that the amount of water to be supplied to the facility’s hydroponic trays and channels is much greater than the water requirements of the plants, a water treatment system will serve to save on the water demand of the vertical farm. Furthermore, the water treatment facility will ensure that water will be available to the plants in case of a water shortage of up to 10 days.
IV. CALCULATIONS AND RESULTS
A. MATCHING PLANTS TO THEIR HYDROPONIC SYSTEMS Data on Qatar’s food imports was gathered from FAOSTAT’s 2013 data report. The report presented a list of the quantity of imports of several crops in 2013. A handful of crops that are suitable for growth in hydroponic systems constituted the food basket for the VF study. Each crop from the food basket was matched with a hydroponic system that best suits its growth needs. Each hydroponic system has characteristics that are favorable to certain types of crops. The Nutrient film technique’s inclined apparatus made it unsuitable for heavy plants. However, its constant flow of water made it fitting for plants that require constant moisture supply. The flood and drain mechanism of the ebb and flow technique made it suitable for plants with short roots or leafy vegetables. This technique is also compatible for heavy plants, or plants that need space; the growing medium can be used as a support. The deep-water culture system completely submerges a plant’s roots in a nutrient solution, which made it appropriate for water intensive plants. In this technique, however, plants require support in form of a physical tray. After careful consideration of each plant’s characteristics, water and support requirements, one or more hydroponic system was assigned to it.

194
Table 1- Crop Imports and Hydroponic Systems
B. DETERMINING SIZE OF VERTICAL FARM Knowing the Qatar food demand as well as the hydroponic crop yield (g/m2) of the different crops in the food basket, the area required for each plant, and hence each system can be determined. The food demand is divided by the population to determine the food demand per capita. Our study will take into consideration the food requirements per 200 capita and thus the value will be multiplied by 200. Consequently, it is divided by the specific crop yield for each crop of the food basket to obtain the area required. That area would be needed to meet all the hydroponic crops demands. That area could be provided by the number of floors in the vertical farm or by ‘unit area’ buildings. The hydroponic crop yields for the different crops in the food basket are given in the table below. In area calculations, the average hydroponic yield will be taken for each crop. For example, the hydroponic yield for lettuce will be taken as the average of the hydroponic yield for iceberg, leaf and romaine lettuces:
C. DETERMINING THE AMOUNT WATER THAT WILL BE TREATED Knowing the amount of water that is needed per day for the plants to grow, the total amount of water needed to circulate through the system is determined, and thus the total amount of
water needed to be treated can be calculated. Furthermore, after acquiring the amount of water that can be treated per day, a storage system is produced in order to store water that is equal to 10 days’ worth of water needed for planting.
V. CONCLUSION
The vertical farm concept in Qatar has showed how civil engineering, in its various disciplines, can contribute to solving worldwide issues such as food security and urban heat island effect. With new technologies such as hydroponics and proper sustainable designs being implemented today, Vertical Farming has become more than just a fictional design, but a concrete structure that can help in solving food security issues in the world today.
ACKNOWLEDGMENT
The group would like to thank Dr. Majdi Abou Najm for his continuous support and guidance throughout this project. His knowledge in hydrology has helped us tackle several problems that were challenging us.
REFERENCES [1] “Clear Point Towers Sustainability.” (n.d.). Clear Point Residences,
(Nov. 1, 2016).
[2] “FAO.org.” (n.d.). Statistics | FAO,
<http://www.fao.org/statistics/en/> (Nov. 6, 2016).
[3] “Hydroponics.” (2015). Encyclopedia Britannica.
[4] “The Vertical Essay.” (n.d.). Vertical Farm RSS,
<http://www.verticalfarm.com/?page_id=36> (Nov. 6, 2016).
[5] Al-Chalabi, M. (2015). “Vertical Farming: Skyscraper
sustainability?” Sustainable Cities and Society, 18, 74–77.
[6] Davis, M. M., and Hirmer, S. (2015). “The potential for vertical
gardens as evaporative coolers: An adaptation of the ‘Penman
Monteith Equation.’” Building and Environment, 92, 135–141.
[7] EPA. (n.d.). “Heat Island Effect.” EPA, Environmental Protection
Agency, <https://www.epa.gov/heat-islands> (Dec. 6, 2016).
[8] F. A. O. (n.d.). “CHAPTER 6. DRIP IRRIGATION.” CHAPTER 6.
DRIP IRRIGATION,
<http://www.fao.org/docrep/s8684e/s8684e07.htm> (Nov. 6, 2016).
[9] Faculty of Agriculture and Food Sciences. (n.d.). “AUB Landscape
Plants Database.” AUB Landscape Plants Database,
<http://landscapeplants.aub.edu.lb/Search/ByCriteria#Wizard>
(Dec. 7, 2016).
plant hydroponic technique
imports (tonnes,
2013)
2016 imports (5%
increased projection based on
2016 population)
artichokes ebb and flow 3 3.15 asparagus ebb and flow 19 19.95 peas ebb and flow 2,075 2178.75 beans ebb and flow 6,338 6654.9 carrots ebb and flow 13,728 14414.4 potatoes ebb and flow 40,283 42297.15 onions ebb and flow 47,697 50081.85 spinach NFT 28 29.4 cucumber NFT 8,311 8726.55 cabbage NFT 9,903 10398.15 Lettuce NFT 11,247 11809.35 cauliflower drip systems 0 0 broccoli drip systems 10,856 11398.8 tomatoes drip Systems 39,852 41844.6

195
[10] Goode, L. (2015). “Urban Farming ™ (
http://wwwurbanfarming.org ).” Journal of Agricultural & Food
Information, 16(3), 189–195.
[11] Matthews, J. A. (2014). Encyclopedia of environmental change.
SAGE Publications, Ltd.
[12] Ministry of Development Planning and Statistics. (n.d.). “Ministry
of Development Planning and Statistics.” Ministry of Development
Planning and Statistics,
<http://www.mdps.gov.qa/en/pages/default.aspx> (Dec. 6, 2016).
[13] Padayachee, A. (2013). “nutritional quality of hydroponics vs. soil
grown veggies and fruit.” The Simple Scientist,
<https://drannelinepadayachee.wordpress.com/2013/05/22/191/>
(Nov. 3, 2016).
[14] Pandey, A. K., Pandey, M., and Tripathi, B. (2015). “Air Pollution
Tolerance Index of climber plant species to develop Vertical
Greenery Systems in a polluted tropical city.” Landscape and
Urban Planning, 144, 119–127.
[15] Rothman, B. L. (n.d.). “Vertical Farming.” Home Page,
<https://attra.ncat.org/attra-pub/viewhtml.php?id=512> (Nov. 5,
2016).
[16] Sheikh, B. (n.d.). “Gray Water Use.” California Agricultural Water
Stewardship Initiative,
<http://agwaterstewards.org/practices/gray_water_use/> (Nov. 6,
2016).
[17] Talhouk S.N. , Fabian M., Dagher R. 2015. Landscape Plant
Database. Department of Landscape Design & Ecosystem
Management, American University of Beirut.
(http://landscapeplant.aub.edu.lb, 08 Dec 2016)

196

197
DEPARTMENT OF ELECTRICALAND COMPUTERENGINEERING

198

199
200 George Adaimi, Anthony GebrayelA Drone Vision System for Security Surveillance with an Accelerated Design for Deep Learning Face Recognition
206 Jad Aboul Hosn, Hussam Abdul Khalek, Bassel Abou Ali ModadA Medical Emergency Cognitive Radio Communication Device
210 Kamal Haddad, Abdallah Moussawi, Anthony ChahineAn FPGA-Accelerated Design for Deep Learning Pedestrian Detection in Self-Driving Vehicles
216 Mohammad Hamdan, Walid Kalash, Georgette NaufalAutomated Cheating Detection in Written Exams Using Computer Vision
220 Mohamad Fares Al Jajeh, Omar Fathallah, Haissam Akhras, Shirine El Zaatari, Qusai Suwan, Kareem Kassem
Design Algorithm for Economic Optimization of a Photovoltaic Hybrid Generation System
225 Shirine El Zaatari, Qusai Suwan, Kareem KassemDesign and Evaluation of an Autonomous Self-Balancing Bicycle
230 Ebrahim Karam, Emad Yehya, Mohammad RaadDrAcuLA: Drone Accurate Localization Algorithm
234 Ahmad Ghalayini, Saadallah Kassir, Mohamad El HajjErgonomic UAV Control Using Eye-Tracking
239 Ahmad Al Masri, Abdel Rahman KoleilatFirefighter Indoor Tracking System
244 Hasan Shami, Sami Kanafani, Georges MelkiSmart Walking Cane for the Visually Impaired
248 Haytham Dbouk, Mohamad Ghamlouch, Rayan Alsayed AliTemperature Control System for Residential Solar Water Heating Systems
CONTENTELECTRICAL AND COMPUTER ENGINEERING, COMPUTER AND COMMUNICATIONS ENGINEERING

200
A Drone Vision System for Security Surveillance with an Accelerated Design for Deep Learning Face
Recognition
Rebecca Adaimi, George Adaimi, and Anthony Gebrayel Department of Electrical and Computer Engineering
American University of Beirut Beirut, Lebanon
Email: rma128, gma28, [email protected]
Abstract- With the evolution of drones and computer vision technologies, new opportunities are emerging for leveraging these technologies. One such example is to develop a drone system that can ensure authorized personnel are permitted in a particular environment. No longer will there be queues of people waiting at the door for ID confirmation. Instead, every person will be recognized automatically. However, even the state of the art vision system performs poorly when the camera’s angle is not direct. Drone face recognition addresses this problem as the drone can be flown to have a direct camera exposure to the person of interest. Accordingly, our project aims to provide a fully integrated surveillance system operation in which highly accurate state-of-the-art face detection and recognition algorithms are implemented on an Altera Cyclone V board. We propose to train a deep learning algorithm called OpenFace which is based on Google’s FaceNet (CVPR 2015). Our main contribution is the design and implementation of an accelerated OpenFace algorithm on the Altera Cyclone V board. With the use of an IP camera attached to a drone, the camera would transmit a real-time video feed to a PC/laptop where the face detection algorithm would detect and crop the faces and send the cropped images to the Cyclone V board connected to the PC/laptop via a Peripheral Component Interconnect Express connection (PCIe). The field programmable gate arrays (FPGA) board would be running the accelerated OpenFace algorithm that would recognize the faces. The drone vision system will be tested in a real environment on AUB campus.
I. INTRODUCTION
To distinguish between different individuals, humans use different face features to be able to make a clear judgment on the other individual’s identity. Over the past few decades, computer vision, more specifically face recognition, has been gaining a lot of importance due to the increasing demand for its application. This is apparent in the many research studies that have been conducted in order to emulate this human ability with the highest accuracy.
With the increasing demand for better security and surveillance operations, a better application is sought, and multiple techniques are being tested and even implemented in some places. Our application of a face detection and recognition system using a drone deals with this need and provides a real-time surveillance and recognition model. This approach was initially considered as a security system for a university campus since many people ranging from students, staff, faculty members, and visitors go in and out of a university campus daily.
Security officers, despite their efforts in maintaining the safety of a university, are not able to make sure that no unauthorized people enter the campus. Therefore, our application would benefit any university in terms of security and can also be used in open door events or large establishments such as airports.
In this paper, our objective is to develop a new design and implementation of FPGA-based acceleration of an available face recognition neural network called OpenFace, which is a modification of the CVPR 2015 algorithm FaceNet. OpenFace’s key design advantage is that it is suitable for mobile applications, giving a high accuracy with low training dataset.
II. RELATED WORK
A. Face Detection Algorithms Given a random image, face detection is applied in order to
capture any face present in the image. Many difficulties are faced when trying to detect a face, mainly due to variations in scale, orientation, pose, and image quality.
Starting with Viola-Jones’s original framework for object detection introduced in CVPR 2001 [1], Haar-like features are extracted from a new illustration, “Integral Image” which allows computation to be very rapid. However, despite its high detection accuracy and low computation time, it is very sensitive to all variations that arise in uncontrolled environments, such as differing poses, expressions, and lighting conditions. Thus, Liu and Shum [2] considered searching for generic linear features using the Kullback-Leibler (KL) divergence of both positive and negative histograms projected during boosting. [3] applied Fisher discriminant analysis in order to find the linear projections. However, Haar-like features of Viola-Jones required less computational load than the linear features [4]. Dalal and Triggs [5] proposed a pedestrian detection scheme called histogram of oriented gradients (HoG) which is a statistics-based features type that resulted in a higher performance for pedestrian detection. The proposed feature tackles the issue of illumination variability, allowing it to capture properties of the face that are rather difficult to detect using Viola-Jones’s Haar-like features.
Despite the high accuracy achieved from the previously proposed features, there was a tradeoff between advanced

201
features with a more accurate classifier and extra computation stages. Thus, a convolutional neural network is applied which can automatically learn features that capture intricate facial variations. Of the recent CNN based approaches, Regions with CNN features, known as R-CNN, was proposed by Girshick et al. [6] for object detection. R-CNN was further improved resulting in Fast R-CNN [7] which uses a single spatial pyramid (RoI – region of interest) pooling layer allowing end-to-end tuning of the pre-trained model and leading to an improved performance compared to R-CNN [6]. However, both R-CNN and Fast R-CNN rely on hand-crafted features that do not generalize as good as deeply learned representations. Therefore, Faster R-CNN was proposed which consists of the Region Proposal Network (RPN) and the Fast R-CNN module that share convolutional layers, and thus allowing the image to pass only once through the CNN [6].
Cheney et al. [8] compared 9 face detection algorithms of which two algorithms were OpenCV’s Viola-Jones Haar features and the HoG detector implemented by the library DLib, which were our main focus. Even though Viola-Jones detector proved to be the fastest in terms of speed of detection, the HoG detector performed better in terms of accuracy. The main aspects that affect an algorithm’s performance are detection time, poses in the picture, image resolution, and poor illumination. With these in mind, Faster R-CNN would prove to be a more robust face detection model with a high accuracy but slow processing speed compared to the hand-crafted feature extractors. For preliminary testing purposes, HoG detector proved to be more practical and easily implementable.
B. Face Recognition Algorithms
Face recognition has been an ongoing research topic, with multiple approaches presented over the years. Face recognition algorithms can be one of three approaches: feature-based approach or holistic-based approach [9]. Local facial features such as eyes, nose, and mouth and their relative position to one another and local geometric statistics are extracted in the feature-based approach, whereas the holistic approach analyzes the image as a whole and inputs the entire face region into a recognition classification. This helps against difficulties resulting from rotation, scaling, and illumination disparities.
For the holistic matching methods, the most widely used face representations are the Eigenpictures based on the principal-component analysis [9]. In 1991, Turk and Pentland [10] studied the technique of transforming each image into an Eigenface using a direct application of PCA, first introduced by Kirby and Sirovich [11], decomposing of the face into orthogonal components known as Eigenfaces. PCA’s main idea is the orthogonal transformation of correlated observations to linearly uncorrelated principal components [11]. Another approach using PCA is the Fisherfaces [12] that use linear/Fisher discriminant analysis (FLD/LDA) proposed by Fisher in 1938 [13]. Independent-component analysis (ICA)-based feature system proposed by Bartlett et al. [14] provided better facial recognition performance than PCA since it removes the
correlation between the high-order input moments as well as the second-order moments [15].
The feature-based approaches make use of the head width, the position of the eyes, the location of the mouth, the angles between eye corners, etc. The Hidden Markov Model (HMM-) based method proposed by Nefian et al. [16] focuses on the pixels covering the forehead, eyes, mouth, nose, and chin [9], generating a signal with a single state memory constructed based on probabilistic transitions. Another successful approach is the graph matching system that uses Dynamic Link Architecture (DLA) proposed by Okada et al. [17] in which synaptic plasticity is used to form sets of neurons forming structured graphs while still preserving an overall neural system [18].
While all the discussed conventional methods have limited computational load capacity, deep neural networks provide better scaling properties and improved performance. An example of such application is DeepFace [19] which uses deep trained CNN’s with a Siamese network architecture in which descriptors are compared to the Euclidean distance. However, the most recent state-of-the-art model is Google’s FaceNet [20] which is a neural network system that uses a combination of convolution, max-pooling, normalization, and inception layers, all in order to perform three specific tasks: face verification, face recognition, and face grouping. Fortunately, FaceNet is implemented in an open source code known as OpenFace [21], a general-purpose library offering real-time face recognition application suitable for mobile applications. The face detection step of OpenFace is done using a pretrained face detector implemented in a library called Dlib: The HoG feature combined with a linear classifier.
Thus, OpenFace is further analyzed and implemented as a face detection and recognition model in our application, especially since it tackles the limitations accompanied by real-time testing on a drone with limited training dataset.
C. Acceleration Design Convolutional neural networks require computationally
extensive operations. Hence a compelling way that can accelerate the processing is the use of field programmable gate arrays (FPGA) boards. However, using FPGA with a strict
Figure 1 OpenFace Structure [21]

202
power and area constraint to run convolutional neural network is challenging, since it requires long design cycles and expertise in hardware design.
One approach was an FPGA-based implementation using on-chip memory only [22]. This approach proposed by Park and Sung consists of reducing the word length by 3 bits and using fixed point optimization. This approach can achieve high throughput and low power consumption unit with no DRAM access and all the weights being on the on-chip memory. Another reduction in memory technique was explained by Page and Mohsenin [23]. Their approach was not based solely on fixed point arithmetic but also on singular value decomposition. Using this technique, a power reduction can be achieved, however that can cause a loss in accuracy. Another approach for a high accuracy model using FPGA was proposed by Motamedi et al. with their design space exploration of FPGA-based Deep Convolutional Neural Networks [24]. Their design consists of an architecture that is capable of taking advantage of all resources of parallelism in a convolutional neural network. Consequently, we worked on exploiting all possible parallelisms in our design.
III. DESIGN AND IMPLEMENTATION
A. OpenFace Google’s FaceNet is a unified vision system for verifying,
recognizing, and clustering images of the same person. This state of the art algorithm, from the CVPR 2015, demonstrated a high accuracy on the LFW benchmark (99.63%) [21]. A source for FaceNet is not available, and its training is based on a private dataset of 100-200M images. On the other hand, OpenFace implements FaceNet’s architecture with some modifications that reduces the number of parameters to 3,733,968 and is trained on a smaller training dataset of 500k images. Its key design concern was developing a system with high accuracy and low training and prediction times [21]. OpenFace was able to achieve an accuracy of 92% on the LFW dataset, which is comparable to the state-of-the-art deep learning techniques despite the smaller training dataset. This makes it suitable for mobile applications, such as our drone vision system.
Figure 1 shows the overall implementation of OpenFace using Torch, Lua, and Python libraries for training and testing. The training of the neural network was done on the LFW dataset
adding to it our own images. The trained neural network generates 128 embeddings that are then fed to FaceNet’s triplet loss function which improves the learning process by clustering faces of the same person. Triplet loss uses three images of which two belong to the same identity and tries to minimize the Euclidean distance between the same-identity face and maximize the distance with the third, thereby clustering the images of the same person together. This training procedure follows a unit hypersphere that constrains the embeddings: low-level face representations that result from the neural network, is trained in such a way to distinguish the faces relating to the same person (Figure 2).
TABLE 1 OPENFACE NETWORK DEFINITION [21]
Type Output size #1x1 #3x3
reduce
#3x3 #5x5
reduce
#5x5 Pool
proj
Conv1(7x7x3,2) 48x48x64
Max pool+norm 24x24x64 m 3x3,2
Inception (2) 24x24x192 64 192
Norm+max pool 12x12x192 m 3x3,2
Inception (3a) 12x12x256 64 96 128 16 32 m, 32p
Inception (3b) 12x12x320 64 96 128 32 64 l2, 64p
Inception (3c) 6x6x640 128 256,2 32 64,2 m 3x3,2
Inception (4a) 6x6x640 256 96 192 32 64 l2, 128p
Inception (4e) 3x3x1024 160 256,2 64 128,2 m 3x3,2
Inception (5a) 3x3x736 256 96 384 l2, 96p
Inception (5b) 3x3x736 256 96 384 m, 96p
Avg pool 736
Linear 128
l2 normalization 128
After the triplet loss function, we obtain a trained model that
can be used as a feature extractor in the testing phase. In the testing phase, once an image is inputted for recognition, the first step involves the detection of the face. Dlib’s pre-trained face detector: HoG feature extraction is used due to its higher accuracy in face detection compared to Viola-Jones. However, an issue with the resulting bounding boxes around the detected faces is the face’s pose and illumination conditions. Thus, a solution to this problem is a 2D affine transformation which involves detecting 68 landmarks of the face such as the nose and eyes. Then the image is transformed so that the eye corners and nose are closer to their mean location. Landmark detection is done using dlib’s face landmark detection. The resulting image would be resized and cropped into 96x96 pixels that are then inputted to the neural network for feature extraction. After this step, classification is used to classify the face found in the image and recognize it. There are multiple classification methods implemented in OpenFace that can be chosen: SVM, DBN, etc. For now, SVM is used for classification.
The neural network is composed of different layers based on FaceNet’s architecture (Table 1). The architecture includes four inception layers, and one convolution layer. The inception layer typically consists of 1x1, 3x3, and 5x5 convolution layers with
Figure 2 Illustration of FaceNet's Triplet Loss Function [21]

203
dimension reductions computed by additional 1x1 convolution layers, and a max pooling operation (Figure 3). In Table 1, the input and output sizes are described in rows × cols × #filters. Each row is a layer in the neural network and the last six columns indicate the parameters of pooling or the inception layers.
B. Host Interface and Coupling Decisions
Dealing with the constraints imposed on this application in terms of powering the FPGA, and payload of the drone, the limited space on the FPGA, and the camera connection, we eventually decided on a suitable design. After conducting multiple payload tests on two available drones (QBall drone and Asctec Pelican), it was clear that the weight of the FPGA (~280g) poses a major challenge in terms of integrating the FPGA on the drone. Eventhough the QBall quadrotor was said to have a payload capacity of 300g, it was not able to lift the FPGA at all. As for the Asctec Pelican, with a payload capacity of 500g, it was able to lift the FPGA at full force. And that was before even considering the added weight of the power supply and the camera. As a result, we considered using an IP camera, attached to the drone, that would transmit a video feed to a PC/laptop where the face detector would be running. The output of the face detector, in our case HoG face detector, would transmit the cropped aligned faces to the Cyclone V board via a Peripheral Component Interconnect Express connection (PCIe) (Figure 4). PCIe connection was used because of its higher speed. The speed of measured PCIe bandwidth is 470 Mbps and vector add operations through pcie deliver 0.047 GFLOPS. The FPGA board would be running the accelerated OpenFace algorithm that would recognize the faces.
The design of the accelerator consists of multiple modules. Each module corresponds to a layer in OpenFace. The modules are designed in such a way that they can be configured for different feature map sizes and data precision. The module has three AXI streaming interfaces: (1) an interface for the data, (2) an interface for the coefficients and (3) an output streaming interface for the results (Figure 5).
C. Altera Cyclone V Board The FPGA used in our application is the Altera Cyclone V
(5CGTD9N) board. It contains 896 MB of on-board memory and a total fabric of memory of 1.525 Mbytes. Moreover, it contains 342 DSP units, 684 18x18 multipliers, 1220 M10K memory, 301k logic elements, 113,560 adaptive logic modules, 454,240 flip flops, 1,717 Kb MLAB memory.
D. Fixed-point Arithmetic
Some studies [25] have shown that the testing/inference phase of deep neural network algorithms require fixed-point arithmetic with data precisions as low as 16 bits. In addition, FPGAs are able to efficiently perform fixed-point arithmetic with arbitrary precision. Therefore, instead of performing floating-point arithmetic that are complex and resource consuming, we perform fixed-point arithmetic on the FPGA fabric by defining different precision for every layer in order to ensure that the accuracy is maintained.
E. Convolutional Neural Network
A typical CNN performs the following computation:
Y r,m, n = W r, q, k, l . X q,m − k, −l./0123
4/0523
6/0723 (1)
where r is the output feature map, q is the input feature map, m and n are pixel indices, k and l are the convolution indices.
It can be easily seen that the kernel convolutions of the neural network are the most expensive operations as compared to the inexpensive pooling and sampling operations that follow each layer. Thus, it is necessary to speed up the convolution computations. In order to do so, first the feeding of images and feature maps from the PC to the FPGA was setup in such a way that makes use of three application FIFO buffers: one for feeding the weights of the convolution kernel, one for feeding the input image stream, and one for returning the output stream for the results of the convolution. In order to support the FPGA FIFO stream, the 2D convolution is rewritten as a set of 1D convolutions in which each line of the kernel is convolved with
PCIe Figure 4 Hardware Design Interface
Figure 3 Inception module Figure 5 Streaming interface design

204
each line of the image and then summed up to achieve a 2D convolution, as in (2).
Y n,m = S n,m, k95: (2)
where S n,m, k9 = W k0, k9 . I(n − k0,m − k9)5>
Thus, the image can be inputted to the FPGA line by line and
combined in the FPGA [26]. The resulting FPGA-based convolution design is depicted in Figure 6, with K being the dimension of the convolution kernel, in this case 3 for illustration, Δ representing a one clock delay, and W being the width of the input feature map. The design in Figure 6 exploits the spatial and temporal parallelisms of a 2D convolution operation.
F. OpenFace Accelerator Design Based on a recently implemented AlexNet accelerator on a
ZedBoard at AUB, we were able to use the same methodology to implement an OpenFace accelerator. With the computationally intensive part of OpenFace being the convolution layers, they were carefully and properly designed in such a way to minimize the resources used on the FPGA and exploit all possible parallelisms.
OpenFace has multiple convolution operations used multiple times, especially in the inception layers. However, the main layers are: • Convolution with a kernel of size=7x7, stride=2 in each
direction, and padding=3 in each direction. • Convolution with a kernel of size=1x1, stride=1 in each
direction, and padding=0 in each direction. • Convolution with a kernel of size=3x3, stride=2 in each
direction, and padding=1 in each direction. • Convolution with a kernel of size=3x3, stride=1 in each
direction, and padding=1 in each direction. • Max pooling of kernel size=3x3, stride=2 in each direction,
and padding=1 in each direction. • Convolution with a kernel of size=5x5, stride=1 in each
direction, and padding=1 in each direction. • Convolution with a kernel of size=5x5, stride=2 in each
direction, and padding=2 in each direction.
Each layer should be designed properly in order to ensure acceleration. However, all follow the same methodology, but only differ in the kernel size, stride, and padding which are the hyperparameters. Changing the stride has a major effect on the design, since by having a stride=2, many multiplication operations can be dropped which would accelerate the convolution operation. The proposed design made use of the fact that many unnecessary operations that would have been performed in the case of a stride=1 can be dropped. In order to dwell into the design of the convolution with stride=2, we will demonstrate the design for the 7x7 convolution layer, and the others follow the same concept.
Figure 6 demonstrates the design of the 3x3 convolution with stride=1. If we follow the same design for the 7x7, stride=2 operation, we would have 49 multipliers and adders with multiple operations that have to be ignored (stride=2). This takes up a lot of resources on the FPGA, and slows down the operation. Therefore, as a solution to this problem, we implement a special coefficient feeder that feeds in the coefficient of the kernel in a certain way that does not allow unnecessary operations to be performed.
The design of the 7x7 convolution layer is demonstrated in
Figure 7 which shows the final design of a 1D convolution of kernel size equal to 7. This design is the culmination of several reductions that reduces the size of the convolution layer on the FPGA from 49 multipliers to only 16 multipliers. As can be seen in Figure 7, a mechanism is needed to feed the coefficients of the kernel correctly. After multiplication, the product is added with the output of the multiplexer. This block allows the addition to either accumulate with what is found in the register or the output of the previous addition. Thus this block runs between two states: either accumulation or addition.
In order to expand this diagram to run a 2D convolution with a kernel size of 7x7, two changes will occur (Figure 8). First of all, each multiplier is replaced by a 1D convolution block that takes as input both coefficients and data. Second, the coefficient
Figure 6 FPGA-based design for 3x3 convolution acceleration [26]
Figure 7 Design of 1D convolution with kernel size = 7 and stride = 2
Figure 8 Design of 2D convolution with a kernel of size 7x7 and stride =2 (the 1D convolution box is replaced by the diagram of Figure 6)

205
feeder now feeds 8 coefficients at a time to the coefficient feeder inside the 1D block. Moreover, the output of each 1D convolution is added to the output of the multiplexer and then inputted to a FIFO buffer. The size of the FIFO buffer depends on the size of the kernel as well as the stride. This FIFO acts similar to the accumulator in the 1D convolution block but instead allows the accumulation of lines of the feature map rather than single samples. Then the output of the FIFO is fed to the next accumulator. This is how a 7x7 convolution layers operates and thus the output can be fed serially to the next layer.
The same methodology can be implemented for the remaining convolution layers thus reducing the resources used and increasing he execution time.
IV. CONCLUSION
In this paper, a new accelerator design for a face recognition algorithm called OpenFace is proposed in which spatial and temporal parallelisms are leveraged in order to minimize execution time. OpenFace is based on Google’s FaceNet architecture (CVPR 2015) with modifications that reduce the number of parameters making it suitable for mobile applications. This also makes it easier to implement an OpenFace accelerator on a low-end Cyclone V FPGA platform. Moreover, a methodology for the convolution layers of stride=1 and stride=2 is proposed which reduces the number of multipliers used. The proposed accelerator solution is believed to speed up the inference process of the drone vision system providing a real-time face recognition system. The accelerator design is still in progress with future prospects of testing the accelerator design and comparing it to a CPU-based and GPU-based implementation of OpenFace. The drone vision system will be tested in a real environment on AUB campus.
ACKNOWLEDGMENT This work was made possible with the support and guidance
of our advisor Dr. H. Hajj and our co-advisors Dr. H. Akkary and Dr. M. Saghir. Moreover, we thank A. Kanso for his insight on the drones available allowing us to use the Asctec Pelican drone for testing purposes. We also thank R. Morcel for his help in understanding the hardware design of convolution layers and sharing the methodology he used for his AlexNet accelerator design. We also thank Intel Corporation for its sponsorship and collaboration on this project.
REFERENCES [1] P. Viola and M. Jones, "Rapid object detection using a boosted cascade of
simple features," Proceedings of the 2001 IEEE Computer Society Conference on Computer Vision and Pattern Recognition. CVPR 2001, 2001, pp. I-511-I-518 vol.1.
[2] Ce Liu and Hueng-Yeung Shum, "Kullback-Leibler boosting," 2003 IEEE Computer Society Conference on Computer Vision and Pattern Recognition, 2003. Proceedings., 2003, pp. I-587-I-594 vol.1.
[3] Peng Wang and Qiang Ji, "Learning discriminant features for multi-view face and eye detection," 2005 IEEE Computer Society Conference on Computer Vision and Pattern Recognition (CVPR'05), 2005, pp. 373-379 vol. 1.
[4] C. Zhang and Z. Zhang, "A Survey of Recent Advances in Face Detection," Microsoft Corporation, Redmond, 2010.
[5] N. Dalal and B. Triggs, "Histograms of oriented gradients for human detection," 2005 IEEE Computer Society Conference on Computer Vision and Pattern Recognition (CVPR'05), San Diego, CA, USA, 2005, pp. 886-893 vol. 1.
[6] R. Girshick, J. Donahue, T. Darrell and J. Malik, "Rich Feature Hierarchies for Accurate Object Detection and Semantic Segmentation," 2014 IEEE Conference on Computer Vision and Pattern Recognition, Columbus, OH, 2014, pp. 580-587.
[7] R. Girshick, "Fast R-CNN," 2015 IEEE International Conference on Computer Vision (ICCV), Santiago, 2015, pp. 1440-1448.
[8] J. Cheney, B. Klein, A. K. Jain and B. F. Klare, "Unconstrained face detection: State of the art baseline and challenges," 2015 International Conference on Biometrics (ICB), Phuket, 2015, pp. 229-236.
[9] W. Zhao, R. Chellappa, P. Phillips, and A. Rosenfeld, "Face Recognition: A Literature Survey," ACM Computing Surveys, vol. 35, no. 4, pp. 399–458, Dec. 2003.
[10] M. Turk and A. Pentland, "Eigenfaces for Recognition," Journal of Cogitive Neuroscience, vol. 3, no. 1, pp. 71–86, Dec. 1991.
[11] D. Bhati and V. Gupta, "Survey – A Comparative Analysis of Face Recognition Technique," International Journal of Engineering Research and General Science, vol. 3, no. 2, pp. 597–609, Mar. 2015.
[12] P. N. Belhumeur, J. P. Hespanha and D. J. Kriegman, "Eigenfaces vs. Fisherfaces: recognition using class specific linear projection," in IEEE Transactions on Pattern Analysis and Machine Intelligence, vol. 19, no. 7, pp. 711-720, Jul 1997.
[13] R. Fisher, "The Statistical Utilization of Multiple Measurements," The Annals of Human Genetics, vol. 8, no. 4, pp. 376–386, Aug. 1938.
[14] M. Stewart Bartlett, H. Martin Lades, and T. Sejnowski, "Independent component representations for face recognition*," Face Image Analysis by Unsupervised Learning, pp. 39–67, 2001.
[15] Y. Freund and R. E. Schapire, "A Decision-Theoretic Generalization of On-Line Learning and an Application to Boosting," Journal of computer and system sciences, vol. 55, p. 119–139, Dec. 1996.
[16] A. V. Nefian and M. H. Hayes, "Hidden Markov models for face recognition," Acoustics, Speech and Signal Processing, 1998. Proceedings of the 1998 IEEE International Conference on, Seattle, WA, 1998, pp. 2721-2724 vol.5.
[17] K. Okada et al., "The Bochum/USC Face Recognition System and How it Fared in the FERET Phase III Test," Face Recognition, pp. 186–205, 1998.
[18] S. Mishra and A. Dubey, "FACE RECOGNITION APPROACHES: A SURVEY," International Journal of Computing and Business Research (IJCBR), vol. 6, no. 1, Jan. 2015.
[19] Y. Taigman, M. Yang, M. Ranzato and L. Wolf, "DeepFace: Closing the Gap to Human-Level Performance in Face Verification," 2014 IEEE Conference on Computer Vision and Pattern Recognition, Columbus, OH, 2014, pp. 1701-1708.
[20] F. Schroff, D. Kalenichenko and J. Philbin, "FaceNet: A unified embedding for face recognition and clustering," 2015 IEEE Conference on Computer Vision and Pattern Recognition (CVPR), Boston, MA, 2015, pp. 815-823.
[21] B. Amos, B. Ludwiczuk, M. Satyanarayanan, "Openface: A general-purpose face recognition library with mobile applications," CMU-CS-16-118, CMU School of Computer Science, Tech. Rep., 2016.
[22] J. Park and W. Sung, "FPGA based implementation of deep neural networks using on-chip memory only," 2016 IEEE International Conference on Acoustics, Speech and Signal Processing (ICASSP), Shanghai, 2016, pp. 1011-1015.
[23] A. Page and T. Mohsenin, "FPGA-Based Reduction Techniques for Efficient Deep Neural Network Deployment," 2016 IEEE 24th Annual International Symposium on Field- Programmable Custom Computing Machines (FCCM), Washington, DC, 2016, pp. 200-200.
[24] M. Motamedi, P. Gysel, V. Akella and S. Ghiasi, "Design space exploration of FPGA-based Deep Convolutional Neural Networks," 2016 21st Asia and South Pacific Design Automation Conference (ASP-DAC), Macau, 2016, pp. 575-580.
[25] Gupta, Suyog, et al. "Deep learning with limited numerical precision." CoRR, abs/1502.02551 392 (2015).
[26] A. Alhamali et al., "FPGA-Accelerated Hadoop Cluster for Deep Learning Computations," 2015 IEEE International Conference on Data Mining Workshop (ICDMW), Atlantic City, NJ, 2015, pp. 565-574.

206
A Medical Emergency Cognitive Radio Communication Device
Hussam Abdul Khalek Bassel Abou Ali Moadad Jad Aboul Hosn Department of Electrical and
Computer Engineering American University of Beirut
Department of Electrical and Computer Engineering
American University of Beirut [email protected]
Department of Electrical and Computer Engineering
American University of Beirut [email protected]
Abstract – Cutting down on emergency response time, preventing critical urgent threats magnifies the importance of a biomedical emergency device, capable of functioning in rural, disconnected areas. It’s considered one of the critical factors governing the safety and well-being of elderly citizens and patients in need currently residing in remote areas with no cellular coverage or immediate supervision. These areas suffer from a lack of communication means and cellular coverage which makes it much harder to relay any emergency signal. The only type of signals that can always reach these areas is Ultra-High Frequency (UHF) TV signals, which contains free white space frequencies. We intend to utilize these vacant frequency bands in the digital TV spectrum to continuously relay any emergency message. The proposed device is a reconfigurable antenna operating on two UHF white space frequencies 868 MHz and 575 MHz (free TV white spaces) that can always achieve communication and transmit the emergency signals.
I. INTRODUCTION
Originally, Telemedicine was introduced as “the use of telecommunications technologies to provide medical information and services” [1]. Telemedicine supports distant interaction between a patient and their health care providers, hence reducing the urgent need for frequent hospital visits. It provides health care services across geographical areas, including rural areas where such advanced health services might not be available. Current studies [2] show that it is feasible to perform immediate remote analysis of collected data which supplies specialists and physicians with enough readings for a rapid assessment of a patient’s health status. Remote health care services have been expanding recently, changing the way we deliver health care [3]. Successful applications of Telemedicine must consider that in implementing a new technology, ease of access for both patients and health professionals must be guaranteed, by introducing a user-friendly training and direct application.
On the other hand, cellular coverage is considered the world’s
largest network, servicing more than 5 billion people [4]. Almost a billion people lack access to these essential services, whether due to poor infrastructure, under-developed economic factors or even geographical challenges. Studies show that a significant part of the uncovered population lives in rural areas, even without a power grid [5]. Lack of connectivity hampers the economic rise of many of these rural areas, and even affects their access to report urgent emergency needs.
In Figure 1, a recent map showing voice cellular network coverage in the United States shows that some areas still lack
regular cellular coverage which leaves elderly citizens and patients in danger of any eminent medical emergency, threat or hazard. Having a prompt response from local emergency agencies, healthcare facilities or law enforcement units is crucial to prevent any immediate health incidents. Rural areas, with low density population face a number of challenges in reporting urgent medical threats, including heart attacks and strokes. In this paper, we suggest a biomedical emergency device designed in a compact form (40mm×40mm) to detect and report any emergency signals to the nearest health care provider. The design involves a software controlled reconfigurable antenna that transmits the emergency signal based on a trigger signal from a processing device continuously monitoring the user’s vital signs via a wearable biomedical sensor.
Our project takes advantage of UHF TV white space bands in
lieu of the otherwise unavailable cellular coverage. Such TV bands became available after the migration of TV channels from analog terrestrial TV to digital terrestrial TV. Our objective is to design the antenna part of the device that operates over available UHF TV white space bands depending on the user’s location. Smart communication is then achieved using a cognitive radio system by switching over the white space frequencies. Based on collected historical data, a pattern governs the decision of which UHF white space should be selected to avoid collision of emergency signals between different users. Such pattern is the result of a trained
Fig 1. Recent map showing voice cellular coverage in the USA (2017) [12]

207
prediction model that takes as input previous readings of available channels, noise levels to avoid interference which governs the availability of the selected UHF white space bands at the time of the measurement. By invoking this pattern, the device would choose to send the emergency signal through the best frequency band, avoiding collision in real-time.
Recent collected data in the US show a clear shortage on compliance with ideal criteria for ideal cardiovascular conditions for a healthy heart (avoiding heart attack and strokes). Figure 2 shows that citizens that are above the age of 40 have a decreasing level of compliance with general criteria for better heart conditions. Citizens above 60 years old, one of our main targets, are at a higher risk of potential of heart attacks.
TABLE I IMPORTANCE OF TELEMEDICINE IN THE HEALTH SECTOR [6]
Clinical Significance of Telemedicine Telemedicine changed the way medical services are delivered (responsive diagnostic). Teleradiology, considered among the first telemedicine services, brought diagnostic radiology to millions in urban and rural patients. Telemedicine brought critical health services to underserved populations (less frequent hospital/care visits).
Such a communication device aims to reduce the average emergency response time by cutting down on the emergency reporting time lag, and hence enhance the communication between rural patients and the remote emergency centers. Leveraging information technologies, RF innovation and telecommunication linkage focuses on the importance of utilizing creative solutions for servicing rural areas habitants and regions with low population density. Thus, we serve the well-being of mankind by dedicating engineering solutions for life threatening situations. This is achieved by empowering these rural areas that otherwise lack basic medical attention and support.
II. LITERATURE REVIEW
The proposed design operates on UHF TV white spaces spectrum between two frequencies, 868 MHz and 575 MHz, using interweave communication. Interweave Communication is a cognitive radio technique where a system opportunistically communicates on empty frequency bands that are not being used by their primary operators. One suggested solution to switch between these two bands is a frequency reconfigurable antenna that can operate on both of the suggested UHF frequencies.
This configurability of the antenna can be achieved through integrating switches in its structure, either RF-MEMS or PIN diodes, to connect disjoint parts of the antenna thus increasing the total length of the radiating structure and reducing the operating frequency, since the latter is inversely proportional to the length of the antenna (which is related to its wavelength). In order to change the operation frequency, different combinations of the disjoint parts of the antenna can be activated or deactivated using the switches (PIN diodes or RF-MEMS). One design that uses multiple PIN diodes on the ground plane of the antenna is presented in [7], this antenna switches between four narrow-bands and one wide-band covering a total range of 1.1 GHz from 2.63 GHz until 3.7 GHz. Another reconfigurable design in [8] uses polarization reconfigurability, which reconfigures the way the radiated electric and magnetic fields propagate. The antenna in [8] is an E-shaped patch with two RF-MEMS connecting the arms of the “E” shape, it switches between left hand and right hand circular polarization (the radiated fields are perpendicular to each other and the antenna can receive signals that have any other polarization) in the frequency range of 2.2 - 2.7 GHz.
UHF antennas are usually large in size due to their low frequency of operation in the MHz range. We note that there is a direct correlation between the size of the antenna, and its frequency of operation. As the length of the antenna increases, the frequency of operation decreases, hence inversely proportional. Our innovation lies in designing a compact microstrip patch antenna (which is known for its small size and high operating frequency in the GHz) that operates in the UHF range compared to regular UHF antennas (typical length of 1 meter). Some of techniques that are used to reduce the antenna size include meandering, presented in [9], which increases the length of the antenna while staying in the same designated area, thus producing a lower operating frequency. The length is increased by adding turns to the antenna structure. There are two types of meandering: uniform meandering where the turns have the same length and are separated by the same distance. Non-uniform meandering is when each turn of the antenna structure has a different length and the separation between the turns is not the same, which produces an
Fig 2. Age estimates for US adults ages >20 for meeting different numbers of criteria for ideal cardiovascular health (age and sex subgroups) [13]

208
operation on multiple frequencies. Another technique is based on changing the antenna topology by meandering as presented in [10], where a regular patch antenna is cut into a grid-like pattern, then each line in the grid is meandered in a sinusoidal way thus reducing the operating frequency.
It should be noted that all the miniaturization techniques come with a trade-off between operating frequency, gain and radiation efficiency. The lower the operating frequency for a given small antenna size, the worse the gain and the radiation efficiency at that frequency.
III. ANTENNA DESIGN
The proposed antenna design consists of two substrates separated by a layer of free space. Both substrates are Rogers Duroid 5880 of relative permittivity εr = 2.2 and a total dimension of 4x4 cm2, on which a reconfigurable meandered loop antenna is etched. The bottom layer substrate contains a λ/4 electric length microstrip transmission line used to match the loop on the top layer with the 50 Ω probe input. The microstrip line is connected to the antenna using a via through the foam. The ground plane is on the bottom of the second substrate with dimensions 4x4 cm2. The suggested antenna operates on two frequencies, 868 MHz when the RF-MEMS switch is turned OFF, and 575 MHz when it is ON.
Fig 3. Top view of the antenna design
As for the choice of the design, the main constraint was the compactness of the antenna. In order to achieve an electric length of λ/2 at the initial frequency 868 MHz, the antenna should be meandered such that its total horizontal length is λ/2, in order fit on the substrate. At 868 MHz, the required width of the microstrip antenna with characteristic impedance Z0 = 50 Ω can be determined by manipulating the following equation:
𝑍𝑍# = &'
()'' *.,-,./0.12 34
/0.*.555
[11]
With 𝜀𝜀788 =(9.*:+ (9<*
:1 + *:>
?
<@1 [11]
We then reduced the width to meet the design constraints and relied on impedance matching methods to compensate for the difference.
The next step in the design process is adding a switch on the antenna to make it reconfigurable between 868 MHz and 575 MHz. The added switch is an RF-MEMS with a small finite resistance and capacitance depending if it’s ON or OFF respectively. We note that f ∝1/λ, as the frequency increases the wavelength decreases and vice versa; in other words, as the frequency decreases the required size of the antenna increases. Therefore, when the switch is ON (acting as a resistor) we increase the λ by connecting the radiating copper lines and by that we decrease the frequency as desired.
IV. RESULTS
To understand the antenna results, we need to mention the major components that we are concerned with. First of all, we have the S11 parameter measured in dB which represents the reflection of the incident signals at our antenna input port. This parameter is mainly affected by the matching we mentioned previously; in other words, the better the match the lower the S11 at the center frequency and vice versa. Moreover, it is agreed upon that a good match represents an S11 below -10 dB at the required frequencies; hence our band width can be represented as the frequencies where the S11 is below -10 dB.
In our case, and as observed in Figure 4, the antenna operates at a center frequency of 867.5 MHz with a Band Width of 2.5
MHz; thus, covering the required frequency (868 MHz).
Fig 4. S11 reflection coefficient of the antenna
As for the gain, it represents the factor by which the antenna multiplies the received or transmitted signal power. Generally, an antenna should have a gain bigger than or close to 0dB in order to

209
maximize the power transmitted or received. However, miniaturized UHF antennas are expected to have a lower gain due to the miniaturization process. Thus, in our case the gain at the center frequency is around -1.3 dB.
Last but not least, we’re also concerned with antenna radiation efficiency which represents how efficiently the antenna is radiating the signal, meaning how much power is radiated compared to the input power to the antenna. In other words, the higher the radiation efficiency the better the antenna radiation is.
As observed in Figure 5, our radiation efficiency is 85.32 % which is a good result representing enough radiation efficiency for our purpose.
Fig 5. Radiation efficiency of the antenna at 868 MHz
V. CONCLUSION
The suggested design in this paper covers an efficient solution for urgent medical needs that might arise in rural areas, with no cellular coverage. It aims to cut down on the health response time by preventing any lag between health care providers and the patients. By focusing on the direct benefits of Telemedicine, we propose a compact reconfigurable antenna design that operates at two ultra-high-frequencies, 575 MHz and 868 MHz. The compactness is achieved by miniaturizing the antenna structure. In our case, this miniaturization process is best accomplished by meandering the copper lines to achieve the required length within the antenna compact dimensions compared to regular UHF antennas. The reconfigurability was achieved by adding an RF-MEMS switch that connects two separate copper lines of the antenna structure when it’s ON; thus, increasing the total length
when operating at 575 MHz. Otherwise, the switch is OFF and hence maintaining the original length of the copper lines when operating at 868 MHz. By operating on two different frequencies, this device manages to select the convenient frequency band based on a prediction pattern, trained on historical data.
REFERENCES
[1] D. Perednia and A. Allen, Telemedicine technology and clinical applications, JAMA, 1995, pp. 483-488.
[2] S. Shafqat, J. Kvedar, M. Guanci, Y. Chang and L. Schwamnn, "Role for Telemedicine in Acute Stroke," Stroke, vol. 30, no. 10, pp. 2141-2145, 1999.
[3] G. Demiris and B. Henesel, "Technologies for an aging society: a systematic review of "smart home" applications," Yearb Med Inform, no. 3, pp. 33-40, 2008.
[4] K. Heimerl, k. Ali, J. Blemnstock, B. Gawalt and E. Brewer, "Expanding Rural Cellular Networks with Virtual Coverage," NSDI, pp. 283-296, April 2013.
[5] GSM Association, "Powering Telecoms: East Africa Market Analysis Sizing the potential for Green Telecoms in Kenya, Tanzania and Uganda.," [Online]. Available: http://www.gsma.com/mobilefordevelopment/ powering-telecoms-east-africa-market-analysis.. [Accessed 3 2017].
[6] R. Weinstein, A. M. Lopez, B. Joseph, K. Erps and M. Holcomb, "Telemedicine, Telehealth, and Mobile Health Applications That Work: Opportunities and Barriers," The American Journal of Medicine, vol. 127, no. 3, pp. 183-187, 2014.
[7] A. Mansoul, F. Ghanem, M. R. Hamid and M. Trabelsi, "A Selective Frequency-Reconfigurable Antenna for Cognitive Radio Applications," IEEE ANTENNAS AND WIRELESS PROPAGATION LETTERS, pp. 515-518, 2014.
[8] H. Rajagopalan, J. M. Kovitz and Y. Rahmat-Samii, "MEMS Reconfigurable Optimized E-Shaped Patch Antenna Design for Cognitive Radio," IEEE TRANSACTIONS ON ANTENNAS AND PROPAGATION, vol. 62, no. 3, pp. 1056-1064, 2014.
[9] S. Saeed, A New Reconfigurable Meander Line Antenna for Wireless Communication Applications, Fullerton, CA: California State University, Fullerton, 2013.
[10] J. Oh and K. Sarabandi, "A Topology-Based Miniaturization of Circularly Polarized Patch Antennas," IEEE TRANSACTIONS ON ANTENNAS AND PROPAGATION, vol. 61, no. 3, pp. 1422-1426, 2013.
[11] R. Ludwig and G. Bogdanov, RF Circuit Design Theory and Applications, New Jersey: Pearson Education, 2009.
[12] "Voice and Data Coverage," [Online]. Available: https://www.uscellular.com/coverage-map/coverage-indicator.html. [Accessed March 2017].
[13] American Heart Association Journals, "AHA Journals," American Heart Association Journals, 7 March 2017. [Online]. Available: circ.ahajournals.org/content/early/2017/01/25/CIR.0000000000000485. [Accessed 20 March 2017].

210
An FPGA-Accelerated Design for DeepLearning Pedestrian Detection in Self-Driving
VehiclesAbdallah Moussawi, Kamal Haddad, and Anthony Chahine
Department of Electrical and Computer EngineeringAmerican University of Beirut
Beirut, LebanonEmail: [email protected], [email protected], [email protected]
Abstract— With the rise of self-driving vehicles comesthe risk of accidents and the need for higher safety,and protection for pedestrian detection in the followingscenarios: imminent crashes, thus the car should crashinto an object and avoid the pedestrian, and in the caseof road intersections, where it is important for the carto stop when pedestrians are crossing. Currently, a specialtopology of deep neural networks called Fused Deep NeuralNetwork (F-DNN) is considered to be the state of the artin pedestrian detection, as it has the lowest miss rate, yet itis very slow. Therefore, acceleration is needed to speed upthe performance. This project proposes two contributionsto address this problem, by using a deep neural networkused for object detection, called Single Shot Multi-BoxDetector (SSD). The first contribution is training andtuning the hyperparameters of SSD to improve pedestriandetection. The second contribution is a new FPGA designfor accelerating the model on the Altera Arria 10 platform.The final system will be used in self-driving vehicles inreal-time. Preliminary results of the improved SSD shows3% less miss-rate than F-DNN on Caltech pedestriandetection benchmark, but 4x performance improvement.The acceleration design is expected to achieve an additionalperformance improvement significantly outweighing theminimal difference in accuracy.
I. INTRODUCTION
Self-driving vehicles are at the forefront of futuretransportation technology, nevertheless, the question ofpedestrian safety always arises when discussing them. Itis a question of whether or not autonomous vehicles candetect pedestrians, distinguish them from other objectsand perform the right course of actions(s) accordingly.In this paper, the goal is to design, implement, and accel-
erate a system that detects pedestrians and distinguishesbetween humans and objects, on a field programmablegate array (FPGA), with self-driving vehicles in mind.
A. Motivation
The motivation behind the project is to applyengineering disciplines in solving the problems ofdetecting humans vs. objects in self-driving vehicles.
According to the National Highway Traffic SafetyAdministration, approximately 94% of vehicle-relatedaccidents in the United States are caused by humandrivers [1]. Technology companies have removed thecause of this large percentage by building self-drivingvehicles.
Research pertaining to pedestrian detection is vital tomake driverless cars safer, and more acceptable in soci-ety. This project will aid in self-driving cars becomingcommodities as cars are nowadays, because they willinevitably save more lives. It is important for self-drivingcars to avoid all obstacles, but with a higher priority onhumans. For example, in a scenario where a vehicle hadto crash into either an object or a human, it would crashinto the object.
II. LITERATURE REVIEW
A. Pedestrian Detection
1) Pipeline: A common pipeline to build a pedestriandetector is as shown in Figure 1. First pedestrianbounding boxes are proposed, then image features are

211
extracted from each proposed bounding box, and finallythose features are passed to a classifier to classify eachbounding box as a pedestrian or not.
Fig. 1: Pedestrian detector pipeline
Proposals generation can be done using a simplesliding window as used in [2]. In [3], they proposed amethod called Selective Search that generates boundingboxes that most likely contain an object. [4] proposesa convolutional neural network called Region ProposalNetwork RPN that predicts the bounds of an object andits objectness score in an image.
People were mostly working on the feature extraction,by trying to find the features that most represents apedestrian. Those features are either hand-crafted orgenerated by convolutional neural networks. More onthat in Section II-A.2 and II-A.3.
For classification, in [2] a linear SVM is used, [5]uses a cascade of classifiers, and deep learning basedmethods uses fully connected layers as in [6].
This is a general pipeline, some methods mightcombine proposals generation and feature extraction ina single box, others might combine feature extractionand classification, and it’s also possible to do all ofthem in a single shot.
2) History: Pedestrian detection has been an on-going research for more than a decade. Its importancefor surveillance systems, autonomous driving cars,robotics, has been driving many researchers to workon that problem. One of the first successful objectdetection methods was Viola and Jones [5] in 2001, itwas first applied successfully on face detection, it wasthen applied to pedestrian detection, but it had a highmiss-rate (95%) on the challenging Caltech dataset [7].Later on in 2005, a more successful method, at its time,called Histogram of Oriented Gradients HOG, waspublished [2], it uses a histogram of oriented gradientsas a feature set and it achieves a low miss-rate (46%)
on the easy pedestrian INRIA dataset, but it has a highmiss-rate (68%) on Caltech dataset [7]. In [8], they usea bigger set of features called Integral Channel Features(ChnFtrs) that are a combination of multiple channelsfeatures such as color (RGB, grayscale..etc), gradienthistogram(i.e HOG), image gradients magnitude. It hada miss-rate (56%) on Caltech dataset [7]. All thesesmethods followed the same pipeline. For proposingregions, all used a simple sliding window approach,then those windows are processed for feature extraction(HOG, Haar, wavelets..etc), and for classification, someused cascaded decision trees classifiers with Adaboosttraining(Viola Jones, ChnFtrs) and other used supportvector machines SVM (HOG). Other methods alsoexisted, many of them were variants of the abovemethods, where the researchers worked on better set offeatures and better classifiers.
Some methods as in VeryFast [9] worked on speedingup the detection speed. They used ChnFtrs as a baselinedetector. Their major speed-up was by using a cascadeof classifiers to prune false positives, and by requiringno image rescaling as a preprocessing step, where mostmethods above apply this preprocessing step. Theyachieved a speed of 100FPS, compared to 1.3FPS usingChnFtrs only, but they had a miss-rate of 45% onCaltech pedestrian dataset.
3) State Of The Art: Due to advancements in deeplearning, specifically the convolutional neural networksused for image classification and object detection [10][4], many of the state-of-the-art pedestrian detectionmethods are using ConvNets as a box in the pipelineto either do regions proposals, feature extractions,classification, or any combination of them. For instance,Angelova et. al [6] proposed a deep network calledLarge-Field-Of-View (LFOV) to generate proposals thatmight contain pedestrians and then pass those proposalsto AlexNet [10] for pedestrian verification and theyachieved a relatively low miss-rate (35%) and a speed of4FPS. Also Angelova et al. in [11] used a cascade of thepreviously mentioned deep network [6] and a cascade ofVeryFast [9], and they were able to achieve with sometuning a miss-rate of 26.21% with an almost real-timespeed of 15FPS. In [12], researchers use the RegionalProposal Network from [4] as a region proposals, which
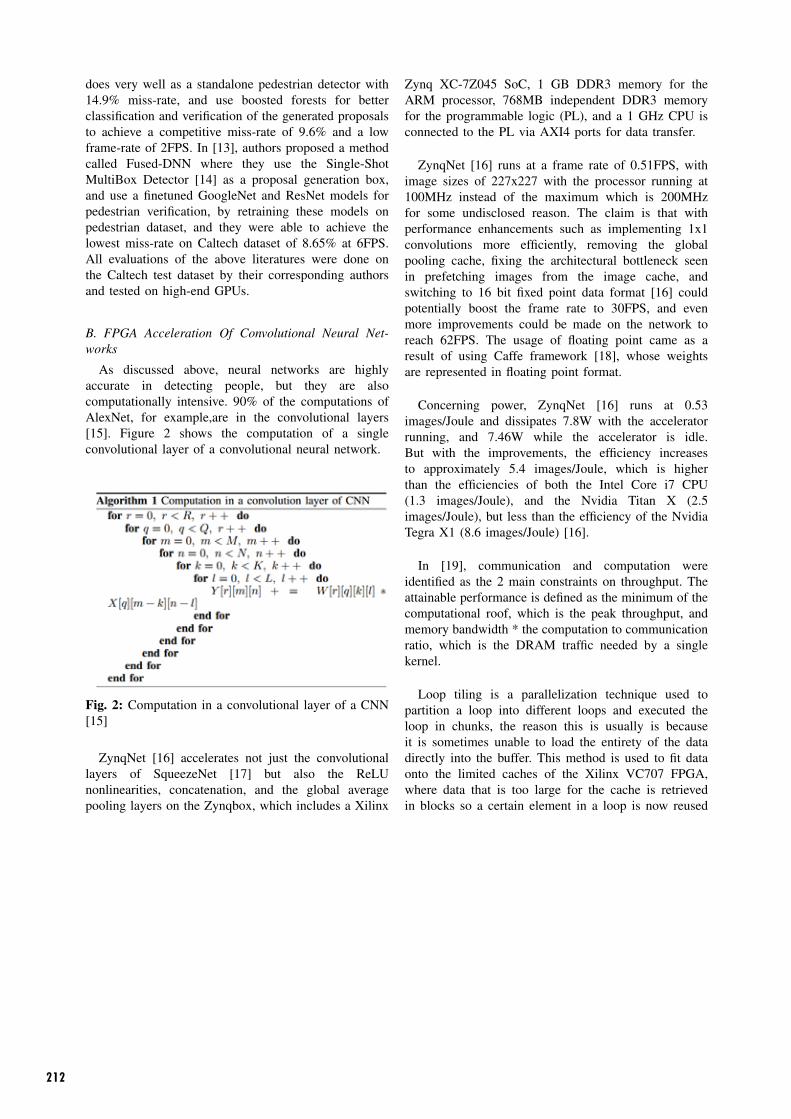
212
does very well as a standalone pedestrian detector with14.9% miss-rate, and use boosted forests for betterclassification and verification of the generated proposalsto achieve a competitive miss-rate of 9.6% and a lowframe-rate of 2FPS. In [13], authors proposed a methodcalled Fused-DNN where they use the Single-ShotMultiBox Detector [14] as a proposal generation box,and use a finetuned GoogleNet and ResNet models forpedestrian verification, by retraining these models onpedestrian dataset, and they were able to achieve thelowest miss-rate on Caltech dataset of 8.65% at 6FPS.All evaluations of the above literatures were done onthe Caltech test dataset by their corresponding authorsand tested on high-end GPUs.
B. FPGA Acceleration Of Convolutional Neural Net-works
As discussed above, neural networks are highlyaccurate in detecting people, but they are alsocomputationally intensive. 90% of the computations ofAlexNet, for example,are in the convolutional layers[15]. Figure 2 shows the computation of a singleconvolutional layer of a convolutional neural network.
Fig. 2: Computation in a convolutional layer of a CNN[15]
ZynqNet [16] accelerates not just the convolutionallayers of SqueezeNet [17] but also the ReLUnonlinearities, concatenation, and the global averagepooling layers on the Zynqbox, which includes a Xilinx
Zynq XC-7Z045 SoC, 1 GB DDR3 memory for theARM processor, 768MB independent DDR3 memoryfor the programmable logic (PL), and a 1 GHz CPU isconnected to the PL via AXI4 ports for data transfer.
ZynqNet [16] runs at a frame rate of 0.51FPS, withimage sizes of 227x227 with the processor running at100MHz instead of the maximum which is 200MHzfor some undisclosed reason. The claim is that withperformance enhancements such as implementing 1x1convolutions more efficiently, removing the globalpooling cache, fixing the architectural bottleneck seenin prefetching images from the image cache, andswitching to 16 bit fixed point data format [16] couldpotentially boost the frame rate to 30FPS, and evenmore improvements could be made on the network toreach 62FPS. The usage of floating point came as aresult of using Caffe framework [18], whose weightsare represented in floating point format.
Concerning power, ZynqNet [16] runs at 0.53images/Joule and dissipates 7.8W with the acceleratorrunning, and 7.46W while the accelerator is idle.But with the improvements, the efficiency increasesto approximately 5.4 images/Joule, which is higherthan the efficiencies of both the Intel Core i7 CPU(1.3 images/Joule), and the Nvidia Titan X (2.5images/Joule), but less than the efficiency of the NvidiaTegra X1 (8.6 images/Joule) [16].
In [19], communication and computation wereidentified as the 2 main constraints on throughput. Theattainable performance is defined as the minimum of thecomputational roof, which is the peak throughput, andmemory bandwidth * the computation to communicationratio, which is the DRAM traffic needed by a singlekernel.
Loop tiling is a parallelization technique used topartition a loop into different loops and executed theloop in chunks, the reason this is usually is becauseit is sometimes unable to load the entirety of the datadirectly into the buffer. This method is used to fit dataonto the limited caches of the Xilinx VC707 FPGA,where data that is too large for the cache is retrievedin blocks so a certain element in a loop is now reused

213
Fig. 3: FPGA Accelerator Design of [19]
after iterationsblocksize iterations instead of n iterations. Loop
unrolling, which was discussed before and loop pipelin-ing are also methods used to increase parallelism. Looppipelining enables the use of overlapped instructions byrunning the iterations in a pipelined fashion. Only theconvolutional layers of AlexNet [10] were executed onthe FPGA in [19]. This FPGA accelerator achieved a4.74x speed-up with respect to a 2.2GHz CPU runningwith 16 threads in parallel.
III. DESIGN
Field Programmable Gate Arrays (FPGAs) are usedfor accelerating CNNs, for their scalability and powerefficiency compared to GPUs that are more powerfulbut also more expensive. In this project power and costwere important factors when designing the system foracceleration.
The design for accelerating the neural network onthe high-end Altera Arria 10 is based on a previousVHDL design of AlexNet on the Xilinx ZedBoard. Weare currently writing the VHDL code layer by layer,starting from the first layer.
Since the FPGAs have a limited number of DSPblocks and a limited amount of Random Access Memory(RAM), the layers must be tiled, meaning that layersmust be loaded to the FPGA from external memoryin chunks, similar to what is shown in Figure 3. Asthe network propagates forward, new layers are loaded,but it important that if layers that are already on theboard need to be reused, then no fetching from externalmemory will be done. Improvements in convolutionalcomputations [19], and the pipelining and parallelism
found in [16], and [19] will also help accelerate thenetwork to run in real-time.
Figure 4 shows a block diagram of the system froma high-level perspective, and summarizes the procedureof detecting a pedestrian in real-time.
Fig. 4: System Block Diagram
In our design, we are limiting the number ofmemory accesses by exploiting the DDR3 DRAMspatially by placing all coefficients next to one another.Additionally, we are reducing the number of MACs(Multiplication and Addition Computations) by storingsome computation results in buffers and reusing themfor other computations. The design also does not use ahard processor, but instead uses the Nios II softprocessorprovided by Altera which we program to intialize DMAtransactions, and place the coefficient values next toeach other in memory, and as the frames are inputtedfrom the camera into the FPGA, they are also stored inmemory, and requested when computations are neededto be done on them. Therefore, no communicationbetween the processor and the DRAM is needed, thememory reads and writes are directly done through asoft memory controller, though we will transition toa hard memory controller because it provides almostdouble the bandwidth.
We are also quantizing our caffe model, and testing,layer by layer, to find the optimal number of bits forfixed point computations such that the model’s miss rateis slightly affected. This step is important because theArria 10’s DSP slices require fixed point multiplicationsand additions, and that significantly speeds up the modelwhen compared to the 32 bit floating point computationsthat our GTX TITAN X is doing.

214
IV. PRELIMINARY IMPLEMENTATION AND TESTING
A. Single-Shot MultiBox Detector SSDSingle-Shot MultiBox Detector [14] is a deep network
based general object detector. It achieved a relativelyhigh average precision of 74.3% on PASCAL VOCgeneral object detection competition at high speed of59FPS [14].
In [14], the authors propose SSD, a fully convolutionalneural network. SSD discretizes the possible outputbounding boxes into a default set of bounding boxes atdifferent scales and aspect ratios. The model predictsthe object scores of each default bounding box, andregress the output bounding boxes’ offsets to thosedefault bounding boxes.
Fig. 5: SSD model [14].
SSD model architecture is shown in Figure 5. It usesVGG16 [20] as a base network to generate feature maps.VGG-16 is is an ImageNet classification competitionsecond place runner, and ImageNet localizationcompetition first place runner. SSD also uses additionalfeature layers at the end of the base network as shownabove. Some of the generated feature maps are passedto a convolutional predictors to compute the confidenceof each default bounding box in each of these featuremaps and regress the bounding box offsets. Duringtraining, the default bounding boxes are matched to thegroundtruth bounding boxes as shown in Figure 6. Thenumber of default boxes, their sizes and aspect ratiosrepresent the hyper-parameters of the SSD model thatshould be chosen wisely based on the dataset objectssizes and aspect ratios.
B. Training and TestingWe have chosen Single-Shot MultiBox Detector [14]
as the baseline detector, as it was shown to achieve
Fig. 6: Default boxes and groundtruth matching [14]
low miss-rate of 13.06% on Caltech pedestrian dataset[13]. SSD source code was made available on https://github.com/weiliu89/caffe/tree/ssd,which uses Caffe [18] for training and testing.
In order to train SSD model, we had to collectpedestrian dataset. Caltech pedestrian dataset [7] is usedfor both training and testing. This dataset contains 10hours of 30FPS video. Caltech dataset is split into 6sets for training and 5 sets for testing. Caltech datasetcontains three datasets, ’person’ if a pedestrian wasidentified, ’people’ if a large group of pedestrians wasidentified, and ’person?’ if it was unclear whether theidentified object is a person or not. We only used’person’ annotation and any other annotation was ig-nored. For each video in the Caltech training dataset,we extracted one frame every 5 frames, that resultedin 26k images, with a total of 25k annotations of’person’. In addition to Caltech dataset, we used bothETH pedestrian dataset [21] and TUD-Brussels datasets[22], that resulted in additional 4k images, and 14kannotations. The dataset preprocessing was done usingthe Caltech MATLAB evaluation/labeling code [7]. Wethen setup the model with the hyper-parameters basedon the statistics of pedestrians scales and aspect ratiosof Caltech pedestrian dataset [7]. After a lot of testingand experiments, we concluded that using a single aspectratio [0.41] was enough to describe the default boundingboxes at all layers, and we used 3 different scales [0.04,0.07, 0.085] at the con4 3 layer, these scales correspondsto small size pedestrians, while the scales on the re-maining layers were equally spaced starting with 0.1on fc7 and ending with 0.9 on conv10 2 layer. We alsofinetuned from a pre-trained SSD model that was trainedon VOC+COCO general object detection datasets. Thecurrent configuration led to a state-of-art miss-rate of

215
11.88% and running at 24FPS on NVIDIA GTX TitanX, which is best to our knowledge the fastest state-of-art model. Table I shows the improvements we havedone on the default configuration of SSD model. TableII compare our current model SSD with other state-of-art models. Overall performance stands for pedestriansthat are at least 20pix tall with less than 80% of theirbody occluded, while Reasonable performance stands forpedestrians that are at least 50pix tall with less than 35%of their body occluded.
Miss-rate ImprovementSSD
(training from scratch) 20.32% -+finetuning 16.04% 4.28%
+better hyper-parameters 11.88% 4.16%
TABLE I: SSD model improvement over the defaultconfiguration.
ModelMiss-rate
(Reasonable)Miss-rate(Overall)
Speed(FPS)
SAF R-CNN 9.68% 62.5% 1.7MS-CNN 9.95% 60.9% 15
CompACT-Deep 11.75% 64.4% 2RPN+BF 9.58% 64.6% 2F-DNN 8.65% 50.5% 6.25
SSD-ours 11.88% 54.4% 24
TABLE II: Comparison between our current model SSDand other state-of-art models on Caltech dataset.
REFERENCES
[1] National Highway Traffic Safety Administration, “Critical rea-sons for crashes investigated in the national motor vehicle crashcausation survey.” https://crashstats.nhtsa.dot.gov/Api/Public/ViewPublication/812115. Ac-cessed: 2016-10-15.
[2] N. Dalal and B. Triggs, “Histograms of oriented gradients forhuman detection,” CVPR, 2005.
[3] J. R. R. Uijlings, K. E. A. van de Sande, T. Gevers, andA. W. M. Smeulders, “Selective search for object recognition,”International Journal of Computer Vision, 2013.
[4] S. Ren, K. He, R. Girshick, and J. Sun, “Faster R-CNN: Towardsreal-time object detection with region proposal networks,” NIPS,2015.
[5] P. Viola and M. Jones, “Rapid object detection using a boostedcascade of simple features,” CVPR, 2001.
[6] A. Angelova, A. Krizhevsky, and V. Vanhoucke, “Pedestriandetection with a large-field-of-view deep network,” Proceedingsof ICRA 2015, 2015.
[7] P. Dollar, C. Wojek, B. Schiele, and P. Perona, “Pedestriandetection: An evaluation of the state of the art,” PAMI, 2012.
[8] P. Dollar, Z. Tu, P. Perona, and S. Belongie, “Integral channelfeatures,” BMVC, 2009.
[9] R. Benenson, M. Mathias, R. Timofte, and L. Van Gool, “Pedes-trian detection at 100 frames per second,” CVPR, 2012.
[10] A. Krizhevsky, I. Sutskever, and G. E. Hinton, “Imagenet classi-fication with deep convolutional neural networks,” NIPS, 2012.
[11] A. Angelova, A. Krizhevsky, V. Vanhoucke, A. Ogale, andD. Ferguson, “Real-time pedestrian detection with deep networkcascades,” Proceedings of BMVC 2015, 2015.
[12] L. Zhang, L. Lin, X. Liang, and K. He, “Is faster r-cnn doingwell for pedestrian detection?,” ECCV, 2016.
[13] X. Du, M. El-Khamy, J. Lee, and L. S. Davis, “Fused dnn: Adeep neural network fusion approach to fast and robust pedestriandetection,” arXiv preprint arXiv:1610.03466, 2016.
[14] W. Liu, D. Anguelov, D. Erhan, C. Szegedy, S. Reed, C.-Y. Fu,and A. C. Berg, “SSD: Single shot multibox detector,” ECCV,2016.
[15] A. Alhamali, N. Salha, R. Morcel, M. Ezzedine, O. Hamdan,H. Akkary, and H. Hajj, “Fpga-accelerated hadoop cluster fortraining deep learning architectures,” 2015 IEEE InternationalConference on Data Mining Workshop (ICDMW), 2015.
[16] D. Gschwend, “Zynqnet: An fpga-accelerated embedded convo-lutional neural network,” ETH Zurich, 2016.
[17] F. N. Iandola, M. W. Moskewicz, K. Ashraf, S. Han, W. J.Dally, and K. Keutzer, “Squeezenet: Alexnet-level accuracy with50x fewer parameters and <1mb model size,” arXiv:1602.07360,2016.
[18] Y. Jia, E. Shelhamer, J. Donahue, S. Karayev, J. Long, R. Gir-shick, S. Guadarrama, and T. Darrell, “Caffe: Convolutionalarchitecture for fast feature embedding,” Proceedings of the 22NdACM International Conference on Multimedia, 2014.
[19] C. Zhang, P. Li, G. Sun, Y. Guan, B. Xiao, and J. Cong, “Optimiz-ing fpga-based accelerator design for deep convolutional neuralnetworks,” Proceedings of the 2015 ACM/SIGDA InternationalSymposium on Field-Programmable Gate Arrays, 2015.
[20] K. Simonyan and A. Zisserman, “Very deep convolutional net-works for large-scale image recognition,” NIPS, 2015.
[21] A. Ess, B. Leibe, K. Schindler, , and L. van Gool, “A mobilevision system for robust multi-person tracking,” in IEEE Confer-ence on Computer Vision and Pattern Recognition (CVPR’08),IEEE Press, June 2008.
[22] C. Wojek, S. Walk, and B. Schiele, “Multi-cue onboard pedestriandetection,” CVPR, 2009.
[23] P. Gysel, M. Motamedi, and S. Ghiasi, “Hardware-orientedapproximation of convolutional neural networks,” arXiv preprintarXiv:1604.03168, 2016.
[24] M. Zhu, L. Liu, C. Wang, and Y. Xie, “Hardware-orientedapproximation of convolutional neural networks,” arXiv preprintarXiv:1606.06234, 2016.
[25] Intel Corporation, “Efficient implementation of neuralnetwork systems built on fpgas, and programmed withopencl.” https://www.altera.com/en_US/pdfs/literature/solution-sheets/efficient_neural_networks.pdf. Accessed: 2016-11-20.

216
Automated Cheating Detection in Written Exams Using Computer Vision
Mohammad Hamdan [email protected]
Walid Kalash [email protected] Georgette Naufal [email protected]
Department of Electrical and Computer Engineering American University of Beirut
Abstract – Our project, Automated Cheating Detection in Written Exams Using Computer Vision, aims to make the detection of cheating in written exams easier for instructors, simultaneously helping to minimize number of proctors needed during an exam. Our software has been customized to detect potentially dishonest activities specifically in rooms 224A, 224B or 224C of AUB’s Ray Irani Oxy Engineering Complex. The final deliverable is an application that takes as an input live video from exam room cameras and analyzes students’ behavior in pseudo-real time, notifying the proctor when potential anomalous behavior synonymous with cheating occurs. The program relies mainly on the OpenCV (Open Source Computer Vision) library and uses a semantics based approach to delineating cheating behavior instead of a machine learning one, and consists of two main modules: first, a head orientation estimation module, which notifies the instructor when students are looking in suspicious directions. This was executed using head orientation estimation projects and libraries. Second, a suspicious object detection module, which spots such disallowed objects as a cell phones or calculators in students’ possession, executed using OpenCV’s machine learning training. Our program also stores the recorded video along with other relevant information, such as the time of probable cheating occurrence, for later inspection by authorized individuals.
I. INTRODUCTION
Cheating in exams can be described as lying or stealing an intellectual property from others. Skipping the hard working involved in the learning acquisition process leads to fake representation of a person’s knowledge and his/her ability to perform a specific task he/she was tested for; thus, leading to a bad allocation of human resources in the society, hence, failure at both personal and the community levels will be observed.
II. PREVIOUS WORK
Previous work in this field was aimed at detecting threats that were more “security” oriented, such as suspicious gatherings or lingering. Concerning the approach for tackling the problem, several papers for automated security surveillance used machine learning approaches [1,2]. Both papers used artificial neural network techniques which are part of machine learning. Other papers used semantics-based approach [2,3].
The authors of “Automated Real-Time Detection” [3] said that since machine learning depends on reliable standard database, semantics-based approach gives better results. The papers that their authors used machine learning approach agreed with that for the authors of “Neural network classifiers” [2] said that they used 402 scenarios, including normal and suspicious behavior,
for training and 198 scenarios, that are independent, for testing. In addition, [4] said that it is extremely hard to get reliable standard data for anomalous types of behaviors which is important to determine classifier parameters and thresholds.
The authors of “Suspicious movement detection and tracking based on color histogram” [4] claimed that semantics-based “is a more feasible and viable method” than machine learning. They said that semantics-based approach does not require training data to teach the machine parameters and thresholds which is not intuitive. Instead we can replace that with intuitive parameters inputted statically.
Concerning the cheating methods, we looked at several
methods. First, we looked for head orientation and gaze estimation. In a gaze detection project entitled by “A ROBUST REAL TIME EYE TRACKING AND GAZE ESTIMATION SYSTEM USING PARTICLE FILTERS” [10] published as a thesis in 2012, the experimental setup used was an Intel(R) Core(TM) i3 processor at 2.4GHz with 4GB of RAM with Logitech C615 Webcam’ with a resolution of 640 × 480 pixels where the user has to be with in one to two feet far from the webcam. Next, we looked for students’ collision using extremities detection. Extremities detection is based on the idea of tracking the student’s body, then, drawing a contour around it [5] using Single Correlation Filter. Finally, we looked for prohibited objects detection. The fundamental challenge is that the input is in 2D which is compared to a 3D similar object to be recognized [6]. There are different algorithms used in object recognition, for example, there is are algorithms that tracks objects based on their color [7] and others based on luminosity (used to detect fire). Thus, the list of disallowed objects should be analyzed to extract the characteristics that distinguish them from other objects in order to use the related identifier.
Concerning the programming languages and libraries to be
used, we found that OpenCV and MATLAB are two of the most famous computer vision tools, if not the most famous ones. OpenCV (Open Source Computer Vision) is a library written in C++ that contain methods for computer vision and machine learning that has C++, C, Python, Java and MATLAB interfaces [8].
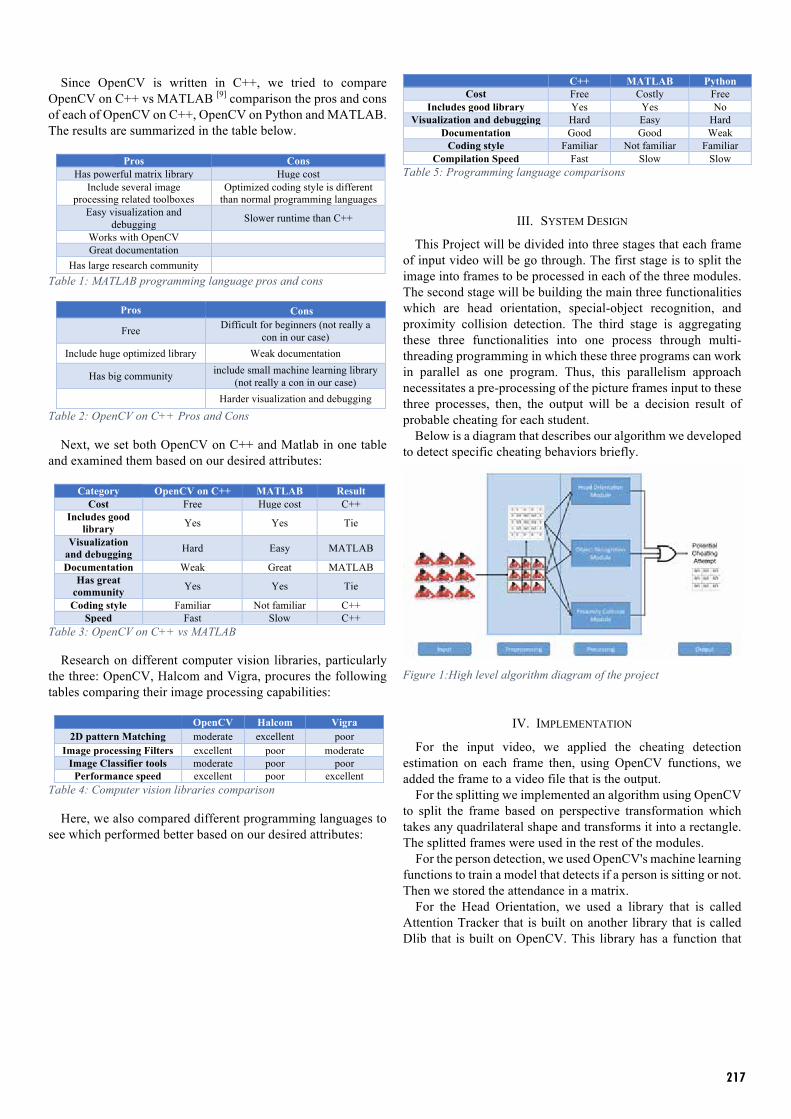
217
Since OpenCV is written in C++, we tried to compare OpenCV on C++ vs MATLAB [9] comparison the pros and cons of each of OpenCV on C++, OpenCV on Python and MATLAB. The results are summarized in the table below.
Pros Cons
Has powerful matrix library Huge cost Include several image
processing related toolboxes Optimized coding style is different
than normal programming languages Easy visualization and
debugging Slower runtime than C++
Works with OpenCV Great documentation
Has large research community Table 1: MATLAB programming language pros and cons
Pros Cons
Free Difficult for beginners (not really a con in our case)
Include huge optimized library Weak documentation
Has big community include small machine learning library (not really a con in our case)
Harder visualization and debugging
Table 2: OpenCV on C++ Pros and Cons
Next, we set both OpenCV on C++ and Matlab in one table and examined them based on our desired attributes:
Category OpenCV on C++ MATLAB Result Cost Free Huge cost C++
Includes good library Yes Yes Tie
Visualization and debugging Hard Easy MATLAB
Documentation Weak Great MATLAB Has great
community Yes Yes Tie
Coding style Familiar Not familiar C++ Speed Fast Slow C++
Table 3: OpenCV on C++ vs MATLAB
Research on different computer vision libraries, particularly the three: OpenCV, Halcom and Vigra, procures the following tables comparing their image processing capabilities:
OpenCV Halcom Vigra
2D pattern Matching moderate excellent poor Image processing Filters excellent poor moderate
Image Classifier tools moderate poor poor Performance speed excellent poor excellent
Table 4: Computer vision libraries comparison
Here, we also compared different programming languages to see which performed better based on our desired attributes:
C++ MATLAB Python Cost Free Costly Free
Includes good library Yes Yes No Visualization and debugging Hard Easy Hard
Documentation Good Good Weak Coding style Familiar Not familiar Familiar
Compilation Speed Fast Slow Slow Table 5: Programming language comparisons
III. SYSTEM DESIGN
This Project will be divided into three stages that each frame of input video will be go through. The first stage is to split the image into frames to be processed in each of the three modules. The second stage will be building the main three functionalities which are head orientation, special-object recognition, and proximity collision detection. The third stage is aggregating these three functionalities into one process through multi-threading programming in which these three programs can work in parallel as one program. Thus, this parallelism approach necessitates a pre-processing of the picture frames input to these three processes, then, the output will be a decision result of probable cheating for each student.
Below is a diagram that describes our algorithm we developed to detect specific cheating behaviors briefly.
Figure 1:High level algorithm diagram of the project
IV. IMPLEMENTATION
For the input video, we applied the cheating detection estimation on each frame then, using OpenCV functions, we added the frame to a video file that is the output.
For the splitting we implemented an algorithm using OpenCV to split the frame based on perspective transformation which takes any quadrilateral shape and transforms it into a rectangle. The splitted frames were used in the rest of the modules.
For the person detection, we used OpenCV's machine learning functions to train a model that detects if a person is sitting or not. Then we stored the attendance in a matrix.
For the Head Orientation, we used a library that is called Attention Tracker that is built on another library that is called Dlib that is built on OpenCV. This library has a function that
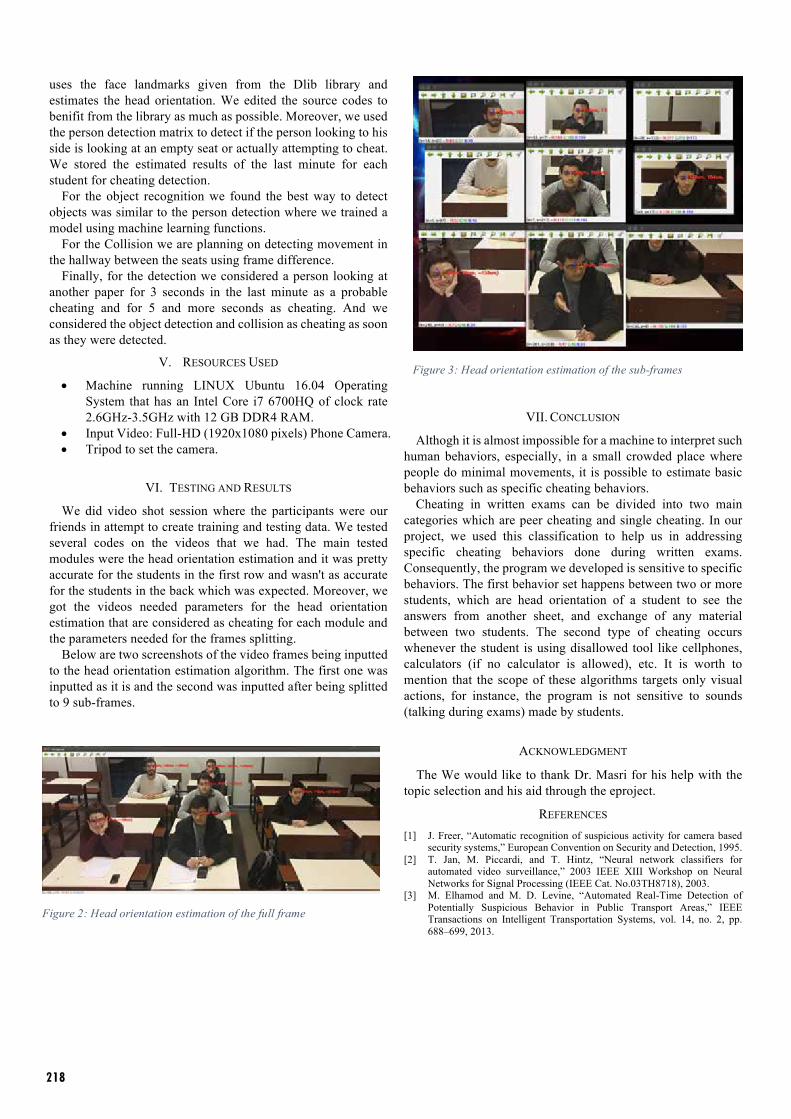
218
uses the face landmarks given from the Dlib library and estimates the head orientation. We edited the source codes to benifit from the library as much as possible. Moreover, we used the person detection matrix to detect if the person looking to his side is looking at an empty seat or actually attempting to cheat. We stored the estimated results of the last minute for each student for cheating detection.
For the object recognition we found the best way to detect objects was similar to the person detection where we trained a model using machine learning functions.
For the Collision we are planning on detecting movement in the hallway between the seats using frame difference.
Finally, for the detection we considered a person looking at another paper for 3 seconds in the last minute as a probable cheating and for 5 and more seconds as cheating. And we considered the object detection and collision as cheating as soon as they were detected.
V. RESOURCES USED
• Machine running LINUX Ubuntu 16.04 Operating System that has an Intel Core i7 6700HQ of clock rate 2.6GHz-3.5GHz with 12 GB DDR4 RAM.
• Input Video: Full-HD (1920x1080 pixels) Phone Camera. • Tripod to set the camera.
VI. TESTING AND RESULTS
We did video shot session where the participants were our friends in attempt to create training and testing data. We tested several codes on the videos that we had. The main tested modules were the head orientation estimation and it was pretty accurate for the students in the first row and wasn't as accurate for the students in the back which was expected. Moreover, we got the videos needed parameters for the head orientation estimation that are considered as cheating for each module and the parameters needed for the frames splitting.
Below are two screenshots of the video frames being inputted to the head orientation estimation algorithm. The first one was inputted as it is and the second was inputted after being splitted to 9 sub-frames.
VII. CONCLUSION
Althogh it is almost impossible for a machine to interpret such human behaviors, especially, in a small crowded place where people do minimal movements, it is possible to estimate basic behaviors such as specific cheating behaviors.
Cheating in written exams can be divided into two main categories which are peer cheating and single cheating. In our project, we used this classification to help us in addressing specific cheating behaviors done during written exams. Consequently, the program we developed is sensitive to specific behaviors. The first behavior set happens between two or more students, which are head orientation of a student to see the answers from another sheet, and exchange of any material between two students. The second type of cheating occurs whenever the student is using disallowed tool like cellphones, calculators (if no calculator is allowed), etc. It is worth to mention that the scope of these algorithms targets only visual actions, for instance, the program is not sensitive to sounds (talking during exams) made by students.
ACKNOWLEDGMENT
The We would like to thank Dr. Masri for his help with the topic selection and his aid through the eproject.
REFERENCES [1] J. Freer, “Automatic recognition of suspicious activity for camera based
security systems,” European Convention on Security and Detection, 1995. [2] T. Jan, M. Piccardi, and T. Hintz, “Neural network classifiers for
automated video surveillance,” 2003 IEEE XIII Workshop on Neural Networks for Signal Processing (IEEE Cat. No.03TH8718), 2003.
[3] M. Elhamod and M. D. Levine, “Automated Real-Time Detection of Potentially Suspicious Behavior in Public Transport Areas,” IEEE Transactions on Intelligent Transportation Systems, vol. 14, no. 2, pp. 688–699, 2013.
Figure 2: Head orientation estimation of the full frame
Figure 3: Head orientation estimation of the sub-frames

219
[4] S. Patil and K. Talele, “Suspicious movement detection and tracking based on color histogram,” 2015 International Conference on Communication, Information & Computing Technology (ICCICT), 2015.
[5] D. S. Bolme, Y. M. Lui, B. A. Draper and J. R. Beveridge, "Simple real-time human detection using a single correlation filter," Performance Evaluation of Tracking and Surveillance (PETS-Winter), 2009 Twelfth IEEE International Workshop on, Snowbird, UT, 2009, pp. 1-8.
[6] D. G. Lowe, “Three-dimensional object recognition from single two-dimensional images,” Artificial Intelligence, vol. 31, no. 3, pp. 355–395, 1987.
[7] T. Gevers and A. W. Smeulders, “Color-based object recognition,” Pattern Recognition, vol. 32, no. 3, pp. 453–464, 1999.
[8] “ABOUT,” OpenCV. [Online]. Available: http://opencv.org/about.html. [Accessed: 17-Oct-2016].
[9] S. Mallick, “Home,” Learn OpenCV, 30-Oct-2015. [Online]. Available: https://www.learnopencv.com/opencv-c-vs-python-vs-matlab-for-computer-vision/. [Accessed: 17-Oct-2016].

220
Design Algorithm for Economic Optimization of a Photovoltaic Hybrid Generation System
Mohamad Fares Al Jajeh, Omar Fathallah, Haissam Akhras
Electrical and Computer Engineering Department American University of Beirut
Bliss, Beirut, Lebanon [email protected], [email protected], [email protected]
Abstract- This paper presents a modular approach to supply Lebanese villages with renewable energy systems. In this approach, the system load is thoroughly studied along with the given natural resources and an optimal design is reached that is most financially feasible. Due to the load shedding from the electricity grid, most villages use diesel generators that are polluting to the environment. The proposed approach uses an excel program that can compute the optimal sizing of the hybrid system that includes photovoltaics, diesel generators, and battery banks with given constraints. The novelty of the approach is in the utilization of the patterns of the electrical grid cut-offs and taking them into account in the system design. The result is a levelized cost of electricity (LCOE) of the hybrid system being less than the LCOE of the diesel generators alone. In addition, the simulation results show a significant decrease in the role of the diesel generators in the hybrid energy system and further financial incentives to include PV in an electrical system.
I. INTRODUCTION
The supply of electricity in Lebanon is really a tragic problem. EDL, Electricite Du Liban, has become incapable of supplying electricity demand, hence electricity shortage is main issue that exists everywhere in Lebanon and mainly in rural areas and villages where the utility electricity is supplied for only 12 hours per day. In consequence, people referred to installing emergency diesel generators to compensate for this shortage which is an uneconomical and an unfriendly environmentally solution. On the other hand, economies of scale and worldly subsidized PV systems have made the techonology much cheaper and more popular. PV power provides a clean energy solution to the shortage while satisfying people electricity demands economically.
There are two types of PV generation plants: grid-tied and standalone plants. The decision of the plant type is based on many factors such as consumer location, geographical restrictions, capital prices and price of electricity. On-grid PV systems generate DC electricity and converts it into AC through an inverter that synchronizes it with the grid electricity. The advantages gained by coupling the generation system with the grid are enormous, most importantly stability related issues. By stability, we mean how fast and reliable our system is in responding to sudden load and environmental changes [11]. Off-grid PV systems by definition, are electricity generation systems that are not tied to the national grid [9]. Off-grid systems being independent from the grid, it means that the PV
system must be able to respond to peak demand under the worst weather conditions. Hence it must take into account any added future load to the system. However, over sizing PV systems is not very profitable, and is really a loss if not all the energy produced is stored or consumed. This brings up the need for two things: First, to install with the PV system a battery bank in the form of a storage device. This would save any excess energy produced by the system. Second, to have an intermittent diesel generator that can respond quickly in times of peak demand.
Hybrid generation systems (HGS) are systems of composed of multi-sourced generation systems, such as diesel generators, PV, wind and hydro. A typical PV-Diesel hybrid system has components as in the following figure:
Fig 1: A flow Diagram of a Hybrid Generation System[13]
Hybrid systems are mainly two categories [14]: a) Systems that depend primarily on non-renewable sources, with the renewable energy resource supplying during times of low demand. In addition, a battery bank installed that store any excess generated energy. The output of the renewable source is much smaller than the average load demand.
b) Systems that rely on the renewable energy generation at large. In this case, the none-renewable generator is used as a backup supply for periods of high demand and bad weather conditions that can result in low renewable energy output. The PV system is made up of PV cells that are interconnected together to form a PV module as well as with other components such as the inverters and the controller. There is a high number of PV technologies used to convert sunlight into electrical energy. These technologies differ from one another by their production cost as well as their efficiency of converting incident sunlight. Until today, the technologies

221
that are commercially available are predominantly silicon-based [3].
Table 1: Comparison of PV Modules [6]
Batteries are an excellent alternative design to store the excessive energy produced throughout the day and use it at night while the generators are running. This could decrease the load on the generators significantly, decrease the consumption of fuel, and decrease CO2 emission. Batteries that are usually used in a PV system are the deep cycle batteries, which are based on a chemical reaction that occurs inside to give electricity. The main difference between the deep cycle and starting batteries is that the starting battery gives a burst of energy in a very short period of time while the deep cycle battery gives a steady power for a long period of time [17]. Different types of batteries are found in the market. Lithium-ion battery is one of the most used types of batteries in the PV system industry. Firstly, it has high energy density with a lot of potential. Also it is not need prolonged priming when new; one regular charge is all that’s needed. Not to forget the relatively low self-discharge where it si less than half of the nickel-based batteries. Low maintenance is also an advantage [18]. This paper will discuss the different types of systems (stand-alone and hybrid) to be able to simulate the financials of each one of them and commit to the most economical solution.
II. DATA MODELLING
To begin with, the solar irradiation must be known before designing the system. This is done by knowing the different parameters of the location of the project (latitude, longitude and temperature variation).
Fig 2: Example of Solar irradiance
Once collected, power analyzers must be installed in the project site to identify the load demand curve and the yearly energy consumed which is critical for knowing what type of systems is needed. Usual patterns show an increase in load during the night when there is no solar energy which necessitates the use of batteries to store the excess energy during the day and discharge it during the peak demand of the night.
Fig 3: Example of load demand curve
Since patterns are usually alike, a pattern for one project could be used for another similar one. The yearly energy consumption will still be required in order to scale the pattern over the whole year.
III. DIESEL GENERATION CASE
A. System Sizing and Operation Diesel Generators are composed mainly of the prime mover
and the alternator. The prime mover is driven mechanically by the burning of diesel and rotates at a certain rotational speed. Synchronous generators rotation speed works according to the formula:
N = 120 f / p
Where N is the mechanical rotational speed in RPM, f is the electrical frequency in Hertz, and p is the number of poles in the generator.
Generators consume fuel in a nonlinear fashion, where they are most energy efficient when working at a high loading percentage. Also, Generators must not work under a certain percentage, usually 40%, which varies according to the supplier, as this would lead to magnetizing the generator and induce maintenance costs. Finally, they must keep reserve capacity of 10% loading as so to account for contingencies.
The Algorithm program accounts for the aforementioned constraints in the following fashion:
40% < PG < 90% Finally, fuel consumption amount depends primarily on
generator rated size and percentage loading. Hence the

222
program can approximate the diesel consumption on an hourly basis and hence the daily operational costs.
IV. SOLAR/DIESEL HYBRID SYSTEM OPERATION SIZING
Sizing the Solar system takes into consideration specific pre-identified solar module. The solar module parameters are then used for the subsequent calculations.
In modeling the hybrid system, hourly energy generation must be accounted for as because solar energy varies during the day and vanishes at night. Hourly operation during the day would simulate the fuel savings when solar energy kicks in during the day and offsets the generation from diesel burning. Therefore, the total hourly load operation is computed as:
Load = Solar + Generator (KW)
Using solar irradiation databases, and generator specific datasheet, daily, monthly and yearly energy consumption and operational costs are modelled to a good degree of accuracy.
Figure 4. Magnetization as a function of applied field.
Note how the caption is centered in the column. In Figure x, simulation of multiple energy sources on hourly
basis is done. Here, the graph shows how the utility grid is providing electricity in patterns, and how the hybrid system provides the electricity during the blackouts. During the blackout, PV and Diesel are adding up to provide for the unmet load.
It can be observed that the solar PV system is not providing a significant contribution. This is where the algorithm takes place. It would suggest the optimum Diesel generator size, that would maximize the PV output, by also taking into consideration the utility electricity patterns. This optimum sizing takes into account economic consideration as will be later shown such as the levelized cost of electricity and payback period.
V. STORAGE SYSTEM SIZING
In simulating the storage system, similarly to PV, a specific battery model is taken into account for as to work out the equations. However, this model is changeable if needed. The most important battery parameters are the: Nominal Voltage, Average Nominal Capacitance and depth of Discharge.
Nominal Voltage is important so as to be able to know how many batteries are required to connect in series to the battery charger. Average Nominal capacitance gives available stored energy in terms of the number of discharging hours. Hence if the person requires 8 hours of operation on batteries, a nominal capacitance in (Ah) and hence battery storage capacity can be calculated. Depth of discharge gives the number of cycles the battery can provide before it dies. This would give an estimate on the lifetime of the batteries by making an assumption such as discharging and charging once per day, and hence 1 cycle per day. Every battery model has a unique DoD graph, however they all have the same shape.
As for sizing, hourly simulation is taken into consideration as to model the excess storable PV energy. For this modeling, a typical day in each month is considered, and it can be shown how every month in the year could provide excess PV energy for storage. Now, the user would demand for a number of hours of autonomy per day. To design for the hours of autonomy so as to be met throughout the whole year, enough PV energy must be stored during winter (Over sizing PV) to be able to supply the load at night, and enough battery sizing must be taken into account (Oversizing the storage system) to be able to supply the night summer load as it is usually modeled to be higher than the Winter case. Since there are several cases, the user can choose the option to size the battery system as follows:
Winter Option: Smaller battery capacity, however extra PV is required to be able to install them.
Summer Option: Larger battery capacity, no excess PV energy is required to be installed.
Spring Option: A balanced mode, with average performance.
It is important hence to note that battery provided power have seasonal variation, and hence it would impose constraints on the load.
VI. ALGORITHM SUMMARY AND FINANCIALS
The financials that takes place into comparing hybrid projects are the LCOE, levelized cost of electricity, Payback period and pollution avoided, considering NOx and Cox emissions.
To calculate the LCOE, the following equation is used: LCOE = Annual Costs/ Yearly Energy
To get the payback period, net yearly savings must be calculated. Then it would be the year that the savings would accumulate to cover the capital costs of the project.
Following up on the know-how of sizing of the several energy components in the system, the automation of the system design goes as follows:
1. Load is acquired as in section I through modeling the load variation or by installing power analyzers.
2. Total area is inserted as an input from the user side. 3. Solar irradiation is modelled according to user
location.

223
4. The algorithm loops on the KWp of PV, and on the Generator Rating, and on each iteration, LCOE is calculated so to be able to locate a local minimum.
5. Storage system is then simulated in each of the previously mentioned cases, so as to create separate financial reports.
6. The end result would be a complete financial feasibility study on the proposed hybrid system, and a hybrid system with a storage system, and comparing them with the original case.
VII. CASE STUDY
Algorithm is tested to a system design in a village in Koura, Lebanon called Bishmezzine. The load demand in the village is as shown in figure 3. The latitude and longitude are required as input to use the correct meteorological data. In Bechmezzine, they are: (34.3197202, 35.7923681).
Figure 5. Sample Screenshot of the Excel Program As seen in figure 5, the algorithm iterates the values of the Genset 1 and the KWp of the solar system for a specified range to get the lowest possible solar LCOE, Levelized cost of electricity. The table shows a sample run for Bishmezzine. Key financial terms are specified such as the price of diesel/liter and the bank interest rate. The algorithm workflow can be controlled by constraints depending on the customer wants, such as the Loss of Load Expectation Percentage, or the solar fraction of the system. Ie. If the customer does not mind paying more money in return of getting a higher solar fraction, they can choose to do so. The algorithm also shows key financial terms such as the payback period, net present value and the levelized cost of electricity.
ACKNOWLEDGMENT
We would like to thank our advisor Dr. Sami Karaki to supervising our work. We would also like to express thanks to Moneera NGO, for following up with us on the project on Bishmezzine Village.
REFERENCES [1] “Project MONEERA – Pilot,” MONEERA, 2015. [2] MONEERA, “Case for change” [Online]. Available:
http://www.moneera.org/case-for-change.html [3] First Solar, “PV Technology Comparison [Online]. Available: [4] http://www.dmphotonics.com/Solar_technologies/Technology_Comparis
on_PV_NA.pdf [5] “Photovoltaics: Technologies, Cost, and Performance,” U.S. Department
of Energy, 2012 [6] 2015. [Online]. Available:
http://www.esru.strath.ac.uk/EandE/Web_sites/09-10/Hybrid_systems/pv-background.htm).
[7] Solar Power World, “Advantages and disadvantages of a solar tracker system” [Online]. Available: http://www.solarpowerworldonline.com/2016/05/advantages-disadvantages-solar-tracker-system/
[8] Linak, “Solar Tracking”, [Online]. Available: http://www.solar-tracking.com/
[9] V. Salas, W. Suponthana and R. Salas, "Overview of the off-grid photovoltaic diesel batteries systems with AC loads", Applied Energy, vol. 157, pp. 195-216, 2015.
[10] UNDP, "PHOTOVOLTAIC PLANTS IN LEBANON", CEDRO, LEBANON, 2013.
[11] IRENA, "OFF-GRID RENEWABLE ENERGY SYSTEMS: STATUS AND METHODOLOGICAL ISSUES", IRENA, 2015.
[12] EDL, "Agreement for Renewable Energy Producers and Subscribers", EDL, 2011.
[13] T. Kushida and R. Abe, "Optimal design of a grid connected PV-diesel hybrid system," 2016 IEEE 16th International Conference on Environment and Electrical Engineering (EEEIC), Florence, 2016, pp. 1-4.
[14] B. Wichert, "PV-diesel hybrid energy systems for remote area power generation — A review of current practice and future developments", Renewable and Sustainable Energy Reviews, vol. 1, no. 3, pp. 209-228, 1997.
[15] World Bank, "OFF-GRID SOLAR MARKET TRENDS REPORT 2016", Bloomberg, 2016.
[16] Google Books, 'Designing with Solar Power', 2015. [Online]. Available: https://books.google.com.lb.[Accessed: 16- Oct- 2016].
[17] Solarchoice.net.au, ‘battery storage system specifications’ [online] Available: http://www.solarchoice.net.au/blog/battery-storage-system-specifications
[18] Batteryuniversity.com, ‘whats the best battery’ [online]. Available: http://batteryuniversity.com/learn/archive/whats_the_best_battery
[19] Solarchoice.net.au, ‘batteries for stand alone solar power systems’ [online]. Available: http://www.solarchoice.net.au/blog/batteries-for-stand-alone-solar-power-systems/
[20] Globalsource.com, ‘LiFePO4 battery’ [online] Available: http://www.globalsources.com/gsol/I/LiFePO4-battery/a/9000000134682.htm
[21] (2014). Solar Inverter [online]. Available: http://solar.inverter.co/#top [22] (2013, June 10). Solar pv power plants major causes of performance
degradation [online]. Available: https://livingonsolarpower.wordpress.com/2013/06/10/solar-pv-power-plants-major-causes-of-performance-degradation/
[23] (2016). Sunny central [online]. Available: http://www.sma.de/en/products/solarinverters/sunny-central-800cp-xt-850cp-xt-900cp-xt.html

224
[24] (2016). Sunny tripower [online]. Available: http://www.sma-america.com/products/solarinverters/sunny-tripower-12000tl-us-15000tl-us-20000tl-us-24000tl-us-30000tl-us.html
[25] "SMA Sunny Island Off Grid Inverters | Wind & Sun", Windandsun.co.uk, 2016. [Online]. Available: http://www.windandsun.co.uk/products/Inverters/SMA-Inverters/SMA-Sunny-Island-Off-Grid-Inverters#.WD3yglw_xRY.
[26] P. Luckow, "2015 Carbon Dioxide Price Forecast", 2015. [Online]. Available: http://www.synapse energy.com/sites/default/files/2015%20Carbon%20Dioxide%20Price%20Report.pdf.
[27] "How much carbon dioxide is produced by burning gasoline and diesel fuel? - FAQ - U.S. Energy Information Administration (EIA)", Eia.gov, 2016. [Online]. Available: http://www.eia.gov/tools/faqs/faq.cfm?id=307&t=11.
[28] Solar Insolation Level In Lebanon, 1st ed. DAWTEC, 2013.

225
Design and Evaluation of an Autonomous Self-balancing Bicycle
Qusai Suwan, Shirine El Zaatari, and Kareem Kassem Electrical and Computer Engineering
American University of Beirut Beirut, Lebanon
[email protected], [email protected], [email protected]
Abstract- This paper proposes a new design of an autonomous self-balancing bicycle. A customized sub-system of moveable masses is designed to shift the center of gravity (CG). This is necessary for low-speed balancing and for stable trajectory tracking. In addition, the steering angle is controlled to be able to change travel orientation and maintain stability. Newtonian, under static equilibrium assumptions, and dynamic Lagrangian models are developed for the bicycle, including the CG shifting mechanism. Afterwards, control schemes to achieve stationary and non-stationary balancing, in addition to trajectory control are discussed. To assess the viability of the suggested design, simulations of the modelled system and proposed controllers are conducted. Finally, the design is manufactured and testing results are discussed.
I. INTRODUCTION
It is well-known that bicycles have the most preferred architecture of one-person vehicles, when compared to other designs (e.g. tricycles or 4-wheeled vehicles). From a stability point of view, it is safer to ride vehicles with more points of contact with the ground. Yet, people still prefer to ride bicycles due to their maneuverability and intuitive drivability.
An autonomous, self-balancing bicycle can be beneficial in many future applications. For example, it can be utilized efficiently in automated deliveries of products. Alternatively, bicycles can travel autonomously to their users. With the rise of autonomous cars R&D, such applications have potential commercial significance in the near future.
Since their invention, bicycles stability and control were explored in detail. In the 19th century, Whipple [1] and Sharp [2] modelled the bicycle dynamics, capturing self-stability at sufficiently high speeds. More recent research focused on drivability based on the drivers weight [3]. Astrom in [4], after a general overview, presented a linear control scheme, based on the steer angle as control input. Niki and Murakami [5], exploiting the steer angle and variable CG proposed a PD controller, specifically advantageous for low speeds. The variability of the CG is based on assuming an inverted pendulum, possibly representing a human, on the bicycle. This assumption is typical for the majority of literature tackling the topic. Different non-linear control schemes were also studied for bicycles. Berkemeier [6], controlling trajectories of an acrobat, discussed a fast non-linear control algorithm to follow trajectories with minimal error at relatively high speeds (~1 Hz). Other proposed variable structure control(VSC), like in [7] & [8], use sliding mode controllers and under actuated VSCs to achieve more robust results than linear alternatives. Arguably,
these controllers perform better with the increase of uncertainties.
Other proposed methods for stabilization of 2-wheeled vehicles are based on gyroscopic effects. In [9], controlled precession torque is deployed to regulate the lean angle.
To achieve autonomous drivability, controlling the steer angle is insufficient due to system kinematics. At least one more control input is needed to follow trajectories, while maintaining stability. Assessing practical feasibility of the previously discussed designs, one can see that implementation require setups with undesirable characteristics (e.g. heavy, bulky, fragile, etc.). Thus, proposing a new design for an autonomous 2-wheeled vehicle is the purpose of this paper. Detailed investigation is done, augmented with experimental testing and implementation.
II. AUTONOMOUS BICYCLE DESIGN
A. Center of Gravity Manipulation A system of two rotating masses, in a plane parallel to the
ground, is attached to the bicycle’s body. The masses are meant to move together to a common direction to shift the bicycle’s CG. Having 2 masses acting collectively is necessary, since this would result, by design, in cancellation of reaction torques of actuators, increasing stability.
The compensation system is located below the pedals, close to the ground. Although this hinders movement on rough terrains, it is advantageous in maximizing the effective arm length of the masses, when the tilt angle is different from zero. Figure 1 compares two hypothetical masses that can be mounted on the bicycle to apply torque its body using their weight. As clear in the figure, raising the elevation of the moving mass would diminish its resultant torque, since the effective arm length is shorter when the bicycle is tilted. In addition, lowering the system minimizes the dynamic effects of the compensation system considerably, as clear in the equations in the next section.
Figure 1: Illustration of the rear view of the bicycle

226
A stress analysis was conducted on critical elements of this
mechanism in order to choose the suitable dimensions and materials preventing failure under fatigue or fracture. Figure 2 is a sample from an intermediate design iteration conducted on the beam holding the mass horizontally at one end.
B. Steer Angle Manipulation Actuating steering is essential in an autonomous bicycle,
whether to be able to go along curved paths or for easier balancing at stationarity and straight paths. There are two main factors to consider when discussing automated steering: the bicycle trail and the needed torque.
A stepper motor was chosen for actuation since it provides better precision and controllability than a DC motor. The torque needed to rotate the front bicycle fork was estimated from the Bicycle Torque Sensor Experiment [10]. In [10], the torque needed to steer the bicycle, on circular paths of different radii and on sudden turns of different angles, is measured. The scope of our project covers balancing the bicycle on a straight path at low speeds and at stationarity. Therefore, only the results pertaining to steering the bicycle suddenly at angles between 15° and 45° are considered. From [10], it was concluded that no more than a holding torque of 4.5 N.m was needed, leading to the choice of motor used.
Whether the bicycle has a negative or positive trail determines the direction of steering necessary to prevent the bicycle from falling in a certain direction. For a negative trail, the fork wheel has to be steered in the direction of falling in order to regain balance. For a positive trail, the bicycle falls in the direction of steering. The bicycle operated on in this paper has a negative trail, thus leading to the choice of steering direction.
The motor fixture was designed to accommodate the specific design of the project bicycle. Figure 3 details the steering mechanism assembly, including power transmission (belt and pulleys) and feedback acquisition (encoder).
Figure 3 Steering mechanism simulation setup
III. SYSTEM MODELLING
A. Nomenclature The model derivation is based on the notation of Astrom’s
paper in [4]. To model the introduced changes, an extended notation is used, which is clear in Table 1.
Table 1: Symbol definitions and their estimated values
Also, the coordinates of the system are the inclination angle 𝜑𝜑, the upper mass angle 𝛽𝛽1, the lower mass angle 𝛽𝛽2, the steer angle 𝛿𝛿 and the wheel rotation angle 𝜌𝜌.
B. Stationary 2-DOF Model
It is of special importance to investigate stability at zero forward speed because natural corrective forces are generated by design at high-speeds. Accordingly, stability is more of a concern when the bicycle is stationary. Thus, a dynamic Lagrangian model is developed, modelling the bicycle’s body as
Symbol Description Est. Value m1 Upper moving mass 3 kg m2 Lower moving mass 3 kg mt Total mass, less m1 & m2 31 kg r1 Arm length of m1 0.19 m r2 Arm length of m2 0.19 m rw Radius of wheel 0.3 m l1 Height of m1 0.105 m l2 Height of m2 0.085 m a1 Distance [P1, motor1] 0.37m a2 Distance [P1, motor2] 0.645m a Horizontal distance [P1,CG] 0.5 m b Horizontal distance [P1, P2] 1.06 m c Trail 0.16 m h Height of CG 0.45 m Jzz Inertia about Z-axis through CG 1.653 kg.m2
Jwheel Inertia of wheel about its center 0.09 kg.m2
Jfork Inertia of front assembly about the fork 0.09 kg.m2
Jxx Inertia about X-axis through P1 6.2775 kg.m2 λ Head angle 0.4π rad g Gravitational acceleration 9.82 m/s2
Figure 2 Factor of Safety of beam under weight of mass

227
an inverted pendulum and assuming one moving mass in a perpendicular plane as discussed previously.
Following this assumptions, the inclination angle 𝜑𝜑 and the rotating mass angle 𝛽𝛽 are considered as generalized coordinates. The set (𝜑𝜑,𝛽𝛽) is independent, complete, and holonomic, which makes it suitable for direct application of Lagrange equations. Taking the Lagrangian as
L=T-V (1) And applying 𝑑𝑑
𝑑𝑑𝑑𝑑𝜕𝜕
𝜕𝜕𝑞𝑞𝑗𝐿𝐿 − 𝜕𝜕
𝜕𝜕𝑞𝑞𝑗𝑗𝐿𝐿 = 𝑄𝑄𝑗𝑗 (2)
The following system dynamics is attained (ℎ2𝑚𝑚𝑑𝑑 + 𝑙𝑙12𝑚𝑚1 + 𝑚𝑚1𝑟𝑟12 sin(𝛽𝛽1)2)𝜑
= 𝑔𝑔𝑚𝑚1(𝑙𝑙1sin(𝜑𝜑) –𝑟𝑟1 cos(𝜑𝜑)sin(𝛽𝛽1)) + 𝑔𝑔ℎ𝑚𝑚𝑑𝑑sin(𝜑𝜑) - 2𝛽𝛽1
2𝑚𝑚1𝑟𝑟1𝑙𝑙1sin(𝛽𝛽) + 𝛽𝛽1𝑙𝑙1𝑚𝑚1𝑟𝑟1cos(𝛽𝛽1) - 2𝛽𝛽1𝜑𝑚𝑚1 𝑟𝑟12cos(𝛽𝛽1)sin(𝛽𝛽1)
(3) (𝑚𝑚1𝑟𝑟12)𝛽𝛽1 = 𝜏𝜏𝛽𝛽+ (𝜑2𝑚𝑚1𝑟𝑟12sin(2𝛽𝛽1))/2 – 𝑔𝑔𝑚𝑚1𝑟𝑟1cos(𝛽𝛽1)sin(𝜑𝜑)
+𝜑𝑙𝑙1𝑚𝑚1𝑟𝑟1cos(𝛽𝛽1)) (4)
C. Non-stationary 5-DOF Model
Since stability is less of an issue for a moving bicycle, having a Newtonian model, with static equilibrium assumption suffices for the purposes of controller design. Accordingly, using Astrom’s equations as basis [4], and augmenting it with moving masses effects, the following model is obtained: 𝐽𝐽𝑥𝑥𝑥𝑥𝜑 = 𝑚𝑚𝑡𝑡𝑎𝑎ℎ 𝜌𝑠𝑠𝑠𝑠𝑠𝑠(λ)
𝑏𝑏 𝛿 + 𝑚𝑚𝑡𝑡𝑠𝑠𝑠𝑠𝑠𝑠(λ)(𝜌2ℎ−𝑎𝑎𝑎𝑎𝑎𝑎) 𝑏𝑏 + 𝑔𝑔(𝑚𝑚𝑑𝑑ℎ +
𝑚𝑚1𝑙𝑙1 + 𝑚𝑚2𝑙𝑙2) 𝑠𝑠𝑠𝑠𝑠𝑠𝜑𝜑 − 𝑚𝑚1𝑔𝑔𝑟𝑟1𝑠𝑠𝑠𝑠𝑠𝑠(𝛽𝛽1) − 𝑚𝑚2𝑔𝑔𝑟𝑟2𝑠𝑠𝑠𝑠𝑠𝑠(𝛽𝛽2) (5) 𝑚𝑚1𝑟𝑟12𝛽𝛽1 = 𝜏𝜏𝛽𝛽1 − 𝑔𝑔𝑚𝑚1𝑟𝑟1𝑐𝑐𝑐𝑐𝑠𝑠(𝛽𝛽1)𝑠𝑠𝑠𝑠𝑠𝑠(𝜑𝜑) (6) 𝑚𝑚2𝑟𝑟22𝛽𝛽2 = 𝜏𝜏𝛽𝛽2 − 𝑔𝑔𝑚𝑚2𝑟𝑟2𝑐𝑐𝑐𝑐𝑠𝑠(𝛽𝛽2)𝑠𝑠𝑠𝑠𝑠𝑠(𝜑𝜑) (7) 𝐽𝐽𝑓𝑓𝑓𝑓𝑓𝑓𝑓𝑓𝛿 = 𝜏𝜏𝛿𝛿 − 𝑚𝑚𝑡𝑡𝑎𝑎𝑎𝑎𝑎𝑎𝑠𝑠𝑠𝑠𝑠𝑠(λ)
𝑏𝑏 𝜑𝜑 − 𝑚𝑚𝑡𝑡𝑎𝑎𝑎𝑎𝑠𝑠𝑠𝑠𝑠𝑠(λ)𝑏𝑏2 (𝜌2𝑠𝑠𝑠𝑠𝑠𝑠(λ) −
𝑏𝑏𝑔𝑔𝑐𝑐𝑐𝑐𝑠𝑠(λ))𝛿𝛿 (8) 𝐽𝐽𝑤𝑤ℎ𝑒𝑒𝑒𝑒𝑒𝑒𝜌 = 𝜏𝜏𝜌𝜌 (9)
IV. CONTROLLER DESIGN
From the equations of motion derived in the previous section, the state space representation is now obtained. After neglecting the coupled terms and linearizing, the system reduces to the following:
𝐴𝐴
=
[ 0 1 0 0 0 0 0 0 0 0𝑔𝑔(𝑚𝑚𝑑𝑑ℎ + 𝑚𝑚1𝑙𝑙1 + 𝑚𝑚2𝑙𝑙2)
𝐽𝐽𝑥𝑥𝑥𝑥0 −𝑚𝑚1𝑔𝑔𝑟𝑟1
𝐽𝐽𝑥𝑥𝑥𝑥0 −𝑚𝑚2𝑔𝑔𝑟𝑟2
𝐽𝐽𝑥𝑥𝑥𝑥0 −𝑚𝑚𝑑𝑑𝑎𝑎𝑐𝑐𝑔𝑔 sin 𝜆𝜆
𝑏𝑏𝐽𝐽𝑥𝑥𝑥𝑥0 0 0
0 0 0 1 0 0 0 0 0 0−𝑔𝑔𝑟𝑟1
0 0 0 0 0 0 0 0 00 0 0 0 0 1 0 0 0 0−𝑔𝑔𝑟𝑟2
0 0 0 0 0 0 0 0 00 0 0 0 0 0 0 1 0 0
−𝑚𝑚𝑑𝑑𝑎𝑎𝑐𝑐𝑔𝑔 sin 𝜆𝜆𝑏𝑏𝐽𝐽𝑓𝑓𝑓𝑓𝑓𝑓𝑓𝑓
0 0 0 0 0 𝑚𝑚𝑑𝑑𝑎𝑎𝑏𝑏𝑐𝑐𝑔𝑔 sin 𝜆𝜆 cos 𝜆𝜆𝐽𝐽𝑓𝑓𝑓𝑓𝑓𝑓𝑓𝑓
0 0 0
0 0 0 0 0 0 0 0 0 10 0 0 0 0 0 0 0 0 0]
𝐵𝐵 =
[ 0 0 0 0 00 0 0 0 00 0 0 0 00 1
𝑚𝑚1𝑟𝑟120 0 0
0 0 0 0 00 0 1
𝑚𝑚2𝑟𝑟220 0
0 0 0 0 00 0 0 1
𝐽𝐽𝑓𝑓𝑓𝑓𝑓𝑓𝑓𝑓0
0 0 0 0 00 0 0 0 1
𝐽𝐽𝑤𝑤ℎ𝑒𝑒𝑒𝑒𝑒𝑒]
(1) where A is the 𝑠𝑠 × 𝑠𝑠 state matrix and B is the 𝑠𝑠 × 𝑚𝑚 input matrix. The next step is to design a control law for the system of the form:
𝑢𝑢 = −𝐾𝐾𝐾𝐾 (2) in order to regulate all the states. The most convenient scheme for this task is the Linear Quadratic Regulator.
Figure 4: LQR Controller Block Diagram

228
This common method in optimal control tend to minimize a cost function of the states and the input defined by:
𝐽𝐽 = ∫ (𝑥𝑥𝑇𝑇𝑄𝑄𝑥𝑥 + 𝑢𝑢𝑇𝑇𝑅𝑅𝑢𝑢) 𝑑𝑑𝑑𝑑∞
0
(3) where Q and R are the 𝑛𝑛 × 𝑛𝑛 and the 𝑚𝑚 × 𝑚𝑚 matrices that represent the weight allocated to the states and the inputs respectively. The gain vector K is given by:
𝐾𝐾 = 𝑅𝑅−1𝐵𝐵𝑇𝑇𝑃𝑃 (4)
where P is a symmetric positive definite constant matrix obtained from the solution of the following Riccati equation:
𝐴𝐴𝑇𝑇𝑃𝑃 + 𝑃𝑃𝐴𝐴 − 𝑃𝑃𝐵𝐵𝑅𝑅−1𝐵𝐵𝑇𝑇𝑃𝑃 + 𝑄𝑄 = 0 (5)
The optimal value of K given by Eqn. (4) minimizes the cost function described in (3), which maintains the total energy in the closed loop system as small as possible [11].
V. SIMULATION RESULTS
From the equations The designed controller is simulated using MATLAB & Simulink. The Q and R are taken as identity matrices. The time step is set to 1 𝑚𝑚𝑚𝑚. The simulation starts with an initial inclination angle of 3 degrees and an initial speed of 1 m/s.
VI. EXPERIMENTAL SETUP
Figure 5 details the COG manipulation experimental setup. It constitutes of 2 mass pendulums in the horizontal plane rotated by two separate stepper motors. The encoders are mounted on top of the stepper motors. The whole system is fixated to the bicycle frame with rigid T-links.
Figure 6 details the steering mechanism experimental setup. The power transmission is accomplished through a belt and two pulleys. The encoder is set above the motor.
Figure 6 Steering mechanism experimental setup
ACKNOWLEDGMENT We would like to express our sincere gratitude to our advisor Dr. Naseem Daher for guiding us through this project.
REFERENCES [1] F.J.W. Whipple, “The stability of the motion of a bicycle,” Quart. J.
Pure Appl. Math., vol. 30, no. 120, pp. 312–348, 1899. [2] A. Sharp, Bicycles & Tricycles: A Classic Treatise on Their Design and
Construction. New York: Dover, 2003 [3] F. Grasser, A. D’Arrigo, S. Colombi, and A. Rufer, “JOE: A mobile,
inverted pendulum,” IEEE Trans. Ind. Electron., vol. 49, no. 1, pp. 107-114, Feb. 2002.
[4] K. J. Astrom, R. E. Klein and A Lennartsson, “Bicycles dynamics and control,” IEEE Contr. Syst. Magazine, vol. 3740 25, no. 4, pp.26-47, Aug. 2005.
[5] K. Iuchi, H. Niki and T. Murakami, “Attitude control of bicycle motion by steering angle and variable COG control,” 32nd Annual Conference of IEEE IECON, pp. 2065-2070, Nov.2005.
[6] M. D. Berkemeier and R. S. Fearing, “Tracking fast inverted trajectories of the underactuated acrobot,” IEEE Trans. Robotics & Autom., vol. 15, no. 4, pp. 740-759, 1999.
[7] Y. Hung, W. Gao and J. C. Hung, “Variable structure control: A survey,” IEEE Trans. Ind. Electron., vol. 40, no. 1, pp. 2-22, 1993.
[8] C. Hwang, H. Wu, and C. Shih, “Autonomous dynamic balance of an electrical bicycle using variable structure under-actuated control” IEEE IROS, Nice, France, Sept, 22-26, 2008.
[9] Beznos, A.V., Formalky, A.M., Gurfinkel, E.V., Jicharev, D.N., Lensky, A.V., Sativsky, K.V. and Tchesalin, L.S., ”Control of Autonomous Motion of Two-Wheel Bicycle with Gyroscopic Stabilization”, Proceedings of the 1998 IEEE International Conference on Robotics and Automation, Leuven, Belgium, May 1998, pp. 2670-2675.
[10] Cheng K. Y., Bothman D., Astrom K., “Bicycle Torque Sensor Experiment”, 2003.
[11] Canoplat Tosun, D., Işık, Y., & Korul, H. (2015). LQR control of a quadrotor helicopter., (pp. 247-252). Vienna, Austria.
Figure 5 COG manipulation experimental setup

229

230
DrAcuLA: Drone Accurate Localization AlgorithmEbrahim Ephrem Karam, Emad Hisham Yehya, and Mohamad Ghazi Bilal Raad
Department of Electrical and Computer EngineeringAmerican University of Beirut
Beirut, LebanonEmail: [email protected], [email protected], [email protected]
Abstract—The project is a drone & a mobile application. Thedrone is guided towards a certain user by having an app installedon the user’s phone that helps propagate a signal, indicating it’sposition to the drone which is likely out of range. This signalwill then propagate to other mobile devices and then spread in amanner similar to breadth first search. The quad-copter uses acombination of WIFI and WIFI-Direct signals to locate the userand map its surroundings. It then moves towards the user byorienting itself into deeper signal radii (akin to moving closer tothe route node in the above graph), and finally using triangulationto reach the exact location.
Index Terms—Drone, Localization, Algorithm, Raspberry Pi,WIFI-Direct
I. INTRODUCTION
DrAcuLa (Drone Accurate Localization Algorithm) is atool that allows an entity such as a drone, robot, vehicle,and etc. . . to go from Point A to B without the use of theconventional GPS system. The system relies on a high densityof phones and Wi-Fi and Wi-Fi direct signals to locate the enduser.
A. Motivation
GPS (Global Positioning System) has become a stapleto today’s electronic devices, with location sensors beinginstalled on everything from computers, to smart wallets. Withthe extreme complexity of modern everyday life, keeping trackof everything becomes cumbersome. It makes the ability totrack valuables possible. However, GPS has many shortcom-ings, such as reduced accuracy when relying on less optimaladapters, in addition to a general lack of reliable GPS signalin underdeveloped countries. Furthermore, from a practicalperspective, the A-GPS adapter consumes a large amount ofbattery power, so in the case of mobile devices, this becomesan issue.
Receiver Used Accuracy radiusA-GPS 8 metersWIFI 74 metersCellular positioning 600 meters
TABLE ITABLE SHOWING THE ACCURACY RANGES OF DIFFERENT RECEIVING
ADAPTERS [1]
The fundamental concept of GPS (and the origin of it’sshortcomings) is having a set of satellites in space that deduces
the location based on tri- angulation, requiring no assumptionson the phone’s behalf. By challenging that assumption andinstead requiring a set of adapters within a certain density,we seek to create a positioning system that uses positionsgathered from nearby devices (hereon called APs - AccessPoints) to determine the location. While unreliable on a largescale without setting up predetermined, fixed APs, in a well-populated campus, such as the AUB campus, this could proveworthwhile.
B. Benefits of Such a System
The system becomes a cross over between IPS (IndoorPositioning System) and GPS. The difference is that we have abetter range or scope. GPS is usually too large and doesn’t giveaccurate readings. IPS is usually restricted to a building andrequires a large array of external sensors. This system wouldgive a reasonable location approximation within a buildingbut it wouldn’t be restricted to indoor use. The system couldspan over the entire campus or organization. As a result, thesystem could be used for document/package delivery withinan organization such AUB, Google MTV office, etc . . .
II. SOFTWARE & APPLICATION
A. The Algorithm
1) Signal Spread: The first point to tackle is how thedrone will get to the destination AP D. It’s reasonable toassume that the drone will be out of D’s signal range, assuch, we will need the other APs to help propagate D’slocation. To this end we define, for each AP, an index. Theindex of an AP describes how far away it is from D. D hasan index of 0. All APs in range of D’s signal have an indexof 1. All APs in range of APs or index 1, but not in range ofD’s signal have index 2, etc.
All APs A such that A = D thus follow the followingalgorithm for propagating their signal:
1) The AP A receives a push notification from the backendserver that a destination device has been activated.
2) A activates it’s WIFI-Direct scanner, scanning for neigh-boring APs.
3) If a set of APs S is detected, read the indicies of Si andset indexA = minSi
indexSi + 1
4) Transmit a signal with index as found in step 3.5) Check if the drone has reached D (via querying backend).
If not, repeat from 3, else, stop.

231
Thus given some time (≈ 10 seconds/index level) the entirecampus will have signals pointing towards D. The figurebelow shows an example spread due to this algorithm.
Fig. 1. Simulation of AUB Campus
2) Drone Movement: It should thus be clear from thediscussion of an AP’s index how the drone will move. Thedrone simply moves in the direction of the device with thelowest index. Once the drone is close enough to that device,a newer device with a lower index should reveal itself. Thiscycle repeats until the drone finally reaches D with index 0.The new question is thus: after determining the AP A with thelowest index, how can we determine the direction in which itlies, and, subsequently, in which the drone has to move?This can be solved by installing 4 WIFI-direct dongles onthe raspberry pi, one in each of the four cardinal directions.Each of these dongles is then placed inside of an aluminumdish (aluminum blocks/weakens WIFI signals) with the gapin the direction in which the dongle is placed. More detailsand a graphical demonstration of the dongle’s configuration isprovided in the hardware section.The usage of these dongles and aluminum dishes is that now asignal received from the north is only collected by the northerndongle (as the other dongles will have the signal blocked bythe aluminum). Thus if we know which dongle received APA’s signal, we know which direction to move in. In imple-mentation, we have 4 slave processes, each corresponding toone of the dongles, that scan for the lowest index they canfind. There is then a master process which collects data fromthe 4 slaves, determines the best signal (lowest index, highestRSSI), and based on this determines an angle to move in(angle ∈ 0, 45, 90, 135, 180, 225, 270, 315). If twoslaves report the same AP with equal index and equal RSSI,we assume it’s between the two and thus move in a diagonal.
B. The User Application
An Android Application is being developed to be installedon the user’s cellphone. The application will provide the ability
for a user to order a delivery, thus signaling the drone to flytowards the user to pick the package up then deliver it to arecipient who also has the app. In addition, the app functionsas a WIFI-direct scanner/transmitter when the backend signalsthat a delivery is taking place, as per the algorithm discussedin Signal Spread (i.e. searches for APs, sets index to lowest+ 1, transmits and repeats scan).
C. The backend
The backend will be responsible for signaling to the apps tostart and stop transmitting, based on whether the drone is intransit (and as such requires the signals), or not. Furthermore,it prevents the app users from requesting multiple deliveriesat a time to avoid having two Ds at a time.
III. OTHER TOOLS USED
A. WIFI-Direct
WIFI-Direct provides peer to peer connection based onIEEE802.11 technology. This implies a device-to-device con-nection can be established without the presence of an Accesspoint (AP). This is the purpose it was built for by theWIFI Alliance. However unlike previous failed options, WIFI-Direct aims to solve the ad-hoc network problem by allowingdevices to communicate between each other and allows themto negotiate which device will take the AP functionality. TheWIFI-direct signal is one of the very few signals that existson most phones and is generally not in use by default (theonly other signal would be Bluetooth, however there are othertechnical difficulties which make it impossible to use for ourpurposes), and so it is the signal to be used to transmit signalsbetween the APs and the drone. [2]To send the AP’s index without establishing a peer-to-peerconnection, we can set the index in the name, as that isimmediately available on signal detection.
B. ROS
ROS is an open-source system that interfaces between theDrone’s SDK and a meta-operating system for the drone. ROSwill be used to control the drone as this will then allow theprogram to be applied to most drones with almost any SDK(as long as ROS supports it), and because it is closer to anindustrial standard.
C. Ubuntu Mate
Ubuntu mate is the operating system used on the RaspberryPi, as it is supports both wpa cli and wpa supplicant, usedto detect WIFI-direct signals and their RSSI, as well as ROSand the parrot SDK. Other options that were considered areRaspbian, which did not support parrot SDK, and Archlinux,which is a terminal-only OS, making the development processmarkedly harder without a GUI.
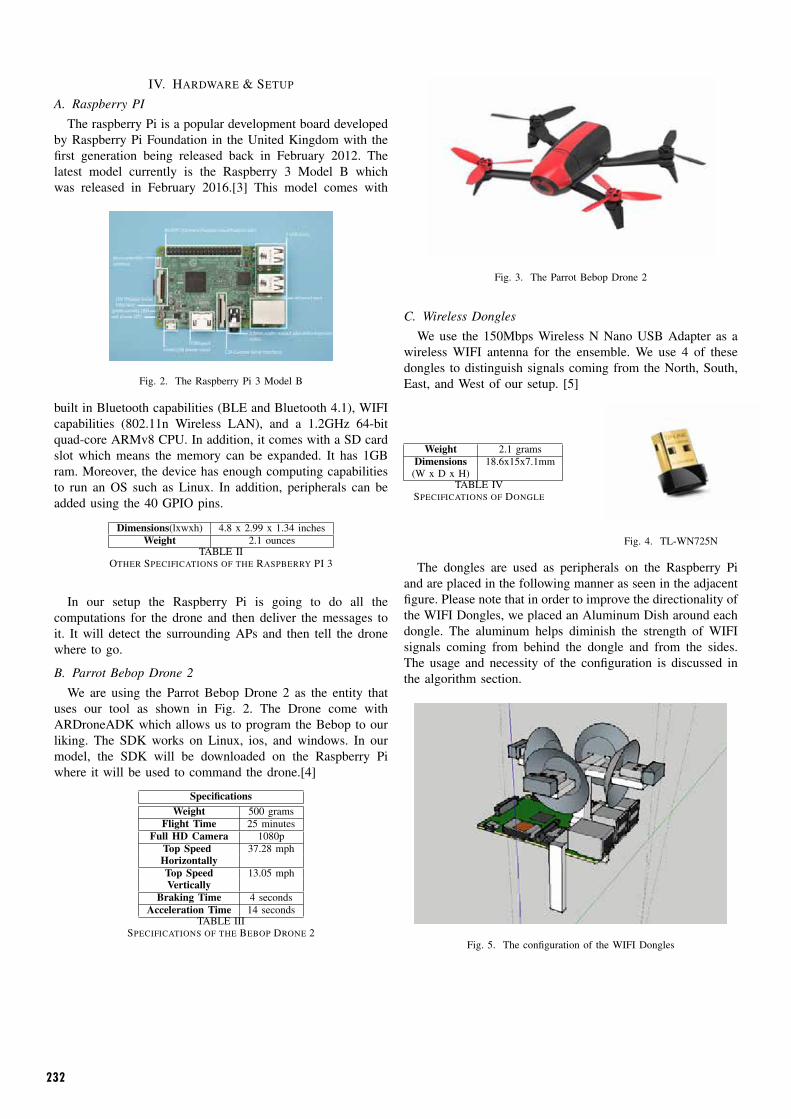
232
IV. HARDWARE & SETUP
A. Raspberry PI
The raspberry Pi is a popular development board developedby Raspberry Pi Foundation in the United Kingdom with thefirst generation being released back in February 2012. Thelatest model currently is the Raspberry 3 Model B whichwas released in February 2016.[3] This model comes with
Fig. 2. The Raspberry Pi 3 Model B
built in Bluetooth capabilities (BLE and Bluetooth 4.1), WIFIcapabilities (802.11n Wireless LAN), and a 1.2GHz 64-bitquad-core ARMv8 CPU. In addition, it comes with a SD cardslot which means the memory can be expanded. It has 1GBram. Moreover, the device has enough computing capabilitiesto run an OS such as Linux. In addition, peripherals can beadded using the 40 GPIO pins.
Dimensions(lxwxh) 4.8 x 2.99 x 1.34 inchesWeight 2.1 ounces
TABLE IIOTHER SPECIFICATIONS OF THE RASPBERRY PI 3
In our setup the Raspberry Pi is going to do all thecomputations for the drone and then deliver the messages toit. It will detect the surrounding APs and then tell the dronewhere to go.
B. Parrot Bebop Drone 2
We are using the Parrot Bebop Drone 2 as the entity thatuses our tool as shown in Fig. 2. The Drone come withARDroneADK which allows us to program the Bebop to ourliking. The SDK works on Linux, ios, and windows. In ourmodel, the SDK will be downloaded on the Raspberry Piwhere it will be used to command the drone.[4]
SpecificationsWeight 500 grams
Flight Time 25 minutesFull HD Camera 1080p
Top Speed 37.28 mphHorizontallyTop Speed 13.05 mphVertically
Braking Time 4 secondsAcceleration Time 14 seconds
TABLE IIISPECIFICATIONS OF THE BEBOP DRONE 2
Fig. 3. The Parrot Bebop Drone 2
C. Wireless Dongles
We use the 150Mbps Wireless N Nano USB Adapter as awireless WIFI antenna for the ensemble. We use 4 of thesedongles to distinguish signals coming from the North, South,East, and West of our setup. [5]
Weight 2.1 gramsDimensions 18.6x15x7.1mm
(W x D x H)TABLE IV
SPECIFICATIONS OF DONGLE
Fig. 4. TL-WN725N
The dongles are used as peripherals on the Raspberry Piand are placed in the following manner as seen in the adjacentfigure. Please note that in order to improve the directionality ofthe WIFI Dongles, we placed an Aluminum Dish around eachdongle. The aluminum helps diminish the strength of WIFIsignals coming from behind the dongle and from the sides.The usage and necessity of the configuration is discussed inthe algorithm section.
Fig. 5. The configuration of the WIFI Dongles

233
V. PRELIMINARY MODEL
We created the following antenna and were able to get thefollowing RSSI readings when the phone was placed in frontof the north antenna at various distances.
Receiver Average RSSI Min RSSI Max RSSINorth x x-5 x+5South x-30 x-35 x-25East x-10 x-15 x-5West x- 10 x-15 x-5
TABLE VTHE DIFFERENT READINGS OF RSSI ACROSS THE 4 SENSORS WHERE X IS
THE AVERAGE READING ON THE NORTH RECEIVER
The cellphone was placed at various positions indoors aswell as outdoors to testify whether the system is feasible indifferent environments. The testings were carried out on aSamsung Galaxy Note S5. Please note that even with WiFi-direct on, the user was still able to access the Internet.
Fig. 6. Our implementation of directional antenna
VI. CONCLUSION
DrAcuLA is a simple tool with very promising results. Itrelies on a very intuitive design and a simple algorithm andhas the possibility of setting new standards for localization.The system works on existing technology and exploits simplesignals from users’ phones to determine the end destination. Inaddition, it achieves the objective without the use of a cameraor GPS signals. Therefore, the system is considered quite lightin terms of computations which makes it quite desirable whenspeed and power are key factors.
ACKNOWLEDGMENT
The authors would like to thank Loauy Bazzi for advisingproject, the ECE lab managers for providing the materials forthe project as well as the AUB robotics Club for lending us a
couple Raspberry Pis. We also like to acknowledge the workof Qusai Suwan.
REFERENCES
[1] Community Health Maps, How accurate is the gps onmy smart phone? (part 2). [Online]. Available: https ://communityhealthmaps.nlm.nih.gov/2014/07/07/how-accurate - is - the - gps - on - my - smart - phone - part - 2/(Accessed: Apr. 8, 2017).
[2] D. Camps-Mur, A. Garcia-Saavedra, and P. Serrano,“Device-to-device communications with wi-fi direct:Overview and experimentation,” IEEE wireless commu-nications, vol. 20, no. 3, pp. 96–104, 2013.
[3] Raspberry Pi Foundation, Raspberry pi 3 model b, Feb.2016. [Online]. Available: https://www.raspberrypi.org/products/raspberry-pi-3-model-b/ (Accessed: Mar. 20,2017).
[4] Parrot, Parrot bebop 2. [Online]. Available: https://www.parrot.com/us/drones/parrot-bebop-2.
[5] TP-Link, 150mbps wireless n nano usb adapter. [Online].Available: http://www.tp- link.com/ca/products/details/cat-11%5C TL-WN725N (Accessed: Mar. 20, 2017).

234
Ergonomic UAV Control Using Eye-TrackingSaadallah Kassir, Ahmad Ghalayini, and Mohamad Hadi El-Hajj
Department of Electrical and Computer EngineeringAmerican University of Beirut
Beirut, LebanonEmail: [email protected], [email protected], [email protected]
Abstract—With the aim of increasing the productivity of theusers and enabling them to perform other manual tasks whilemaneuvering a drone at the same time, we propose a hands-free,scalable, efficient, intuitive, and reliable solution for controllingdrones from a control room using only their gaze. We aim todo so by developing an intuitive high-level language using theusers gaze; allowing to send commands to the drone through agraphical user interface in a simple and ergonomic fashion, whilemaintaining minimal latency and remaining robust to commanddetection errors. Our tasks focus on designing efficient eye-tracking algorithms, building an ergonomic user-interface, andcontrolling the drone from signals generated on a computer. Ourfinal deliverable is a prototype of our complete system that will beused to assess its general performance, as well as more specificfacets of the project such as the efficiency of the eye-trackingalgorithms implemented and the prototypes ergonomic aspect.
I. INTRODUCTION
In our modern world, drones have become increasinglypopular for various applications such as urban surveillance,security, agriculture, 3D modeling, and many others [1]. Yet,issues arise with the practicality of controlling them, especiallyfor large-scale applications, where it is impractical to controldrones while on the field and more practical to commandthem while sitting in a control room. In many such cases, anemployee would also be responsible for controlling multipledrones simultaneously, as well as monitoring statistics orperforming some data analytic on the side. However, theprocess of controlling the drone using a conventional joystickis currently not ergonomic enough to accommodate such mul-titasking capabilities in an intuitive way. In fact, the literatureincludes attempts to control a drone using gaze data. Forexample, the Neural Engineering Group in the department ofBiomedical Engineering in the City College of New York usesan eye tracker, the AR.Drone, some software libraries, andhardware to design such a gaze-controlled system. However,their system is not proven to be scalable because they havelimited their implementation to just one drone, and is notproven to be maximally intuitive [2][3]. Moreover, no com-mercial drone in the market offers the gaze-control feature,to the best of our knowledge. Therefore, we can say that themain contributions of our project are two-fold. First, we aimat developing an intuitive high-level language using the usersgaze, allowing to send commands to the drone through thegraphical user interface in a simple and ergonomic fashion,while remaining robust to command-detection errors like Mi-das Touch [4]. The second contribution is the demonstration of
the possibility of controlling the drone with minimal latency,yet accurately, only using ones eyes. The remaining of thispaper is organized as follows. We will first present a systemmodel of our design in Section II. In Section III, we proposeand explain the algorithms we use for eye-tracking, beforepresenting the ergonomic aspect of the project in section IV.We finally conclude our work in section V.
II. SYSTEM MODEL DESIGN
The system we propose is composed of three componentsthat communicate with each other, as shown in Figure 1. Eachcomponent has been designed and tested independently beforebeing integrated together. In this section, we first presenthow each of these components work individually and thenexplain how they can be used together to solve the surveillanceproblem.
Eye Tracker
Visual Interface
DroneDrone Control
Eye Movement
Control Commands
ControlCommands
Video Stream
ConnectionCommands
Video Feed+
Telemetry Data
GUICommands
Fig. 1: Block diagram
A. Eye-Tracker
The Eye-Tracker is one of the main interfaces of theproposed design. It consists of the specialized eye-trackingcamera as well as the software that drives it and processesthe data generated. This interface detects the position ofthe users eyes and detects the gaze location on the screenafter the user customized calibration step. The eye-trackingcamera generates then a stream of coordinates consisting ofthe gaze location on the screen, that is made available to theapplication-specific processing software.
For our design, we opted for the Tobii EyeX eye-trackingcamera, as it provides to the associated software both raw andpre-processed data, allowing it to use either fast and low-leveldata samples, or highly reliable ones in relevant modules ofthe program. Moreover, its sampling rate of 60Hz permits the

235
detection of both fixations and saccades of the users gaze,where a fixation consists in the halting of the gaze on aspecific location for typically 100-150ms minimum [5], whilea saccade is a rapid eye movement between two fixations,typically lasting less than 100ms. In order to process thedata in real-time, we opted for a C++ based implementationfor the associated software. The program filters the data andmaps the screen coordinates to relevant windows on the screenassociated with a specific object or area on the GraphicalUser Interface (GUI). Each of these windows, or sequenceof windows, is uniquely mapped to a command, as presentedin Section IV. Depending on the nature of the command,the corresponding signal is transmitted either to the VisualInterface, or to the Drone Control process. The data filteringand processing techniques relevant to our application arediscussed in Section III.
B. Visual Interface
The Visual Interface is composed of the GUI and thebackground program that communicates with the other blocks.The main components of the GUI are the main video panel,the sub-video panel, and the info panel. The main video paneldisplays the video feed from the main selected drone, the sub-video panel shows the video feed from the other connecteddrones, and the information panel displays the telemetry datareceived from the controlled drone. Since the final programshould allow the user to navigate through the GUI almostexclusively using their gaze at steady-state, the visual interfacemust receive GUI commands from the eye-tracker, such aspermuting the main video feed with the one of another dronewhen the corresponding sub-video panel is selected. TheVisual Interface is also the block initiating the connection withthe drone control process, by selecting the drone(s) to whichthe GUI should connect. Besides these connection commands,our system must allow for fast reaction in case of emergencyin order to ensure the safety of the people in proximity of thedrone, as well as the vehicle itself. To support such a feature,the visual interface can also send emergency commands tothe drone controller when the user presses on specific keys onthe keyboard. The Visual Interface was designed using the Qtprogramming tool for the C language.
C. Drone Controller
The Drone Control process plays the role of an interfacebetween the user and the drone. Commands are received fromthe user either through the eye-tracker or the visual interface.Once a command is received, the corresponding message issent over WiFi to the drone, which will react accordingly. Inthe opposite direction, as soon as the drone is connected tothe drone controller after a command coming from the visualinterface, a live video stream is transmitted back from thedrone to the drone controller. The drone controller will itselfforward the video packets to the visual interface that willplay the video on its video player. For our practical systemimplementation, we decided to work with a Parrot Bebop2drone as it offers a stable Software Development Kit, and is
embedded with a powerful 14 MP camera, recording videos ata 1080p quality, allowing that way for the best user experience.
D. Control Modes
To maximize the practicality of our proposed system andmake it as relevant as possible to the surveillance applicationof our product, we propose two different modes that will allowthe user to perform complementary operations with the drone:Control mode and Patrol mode.
1) Drone Control Mode: In drone control mode, the userhas the possibility of maneuvering the drone freely, usingthe video feedback from the UAV. The commands allow formovements from and to any point in the 3D aerial space, bycontrolling three of the six spatial degrees of freedom. Bycontrolling the forward/backward movements over the x-axis,the altitude, and the yaw of the drone, several commandscan be sent to the drone. It becomes therefore possible toinstruct the drone to move forward, backward, rotate right,rotate left, move diagonally by combining two of the previouscommands, move upward and downward, as listed in Table I.While the pitch and the roll of the drone do not need to bedirectly controlled to move the drone to a specific location, theleft/right movements over the y-axis do. However, combiningrotation and x-axis movement can lead to the same effectivemovement. Besides these commands, the user also has thepossibility to command the drone to take-off, land and takepictures.
2) Patrol Mode: In patrol mode, the user has the ability tolet the drone pilot itself automatically following a predefinedpath, or staying still at a fixed location, and control thecamera of the Unmanned Aerial Vehicle (UAV). This modeis particularly relevant when a wide area is to be observed,and facilitates further multitasking as the user does not needto be constantly focusing on the screen to control the drone.The user can switch modes during flight time to make thefeature as effective as possible. This feature was implementedusing the universal MAVlink tool, working on a wide varietyof UAV models.
III. ALGORITHMIC ASPECT
The first contribution of our work is the implementation ofefficient algorithm aiming at reducing the processing delay ofthe data stream from the eye-tracker as well as improving therobustness of the system against errors from the user gaze’sinteraction. As discussed in the system model section, theeye tracker through its Software Development Kit (SDK) canprovide gaze data samples which include the timestamp t aswell as the x and y coordinates on the screen in pixels. Thesesamples are processed by our software algorithms to decideon what commands to send to the drone control interface,according to the mapping proposed in Table I.The Gaze-Window-Commands function is used to return the donothing, move forward/backward, and rotate right/left and thecombination of forward/backward and right/left commands,while the Blinking-Commands function is used to return the

236
take picture and switch mode commands. As for the Gaze-Gesture-Detection function, it is used to return the gaze gesturecommands of take-off, land, altitude up, and altitude down.Below are the general algorithms of the functions, all of whichtake as input the Sample(X,Y,t) from the eye tracker, where(X,Y) are the coordinates of the user’s gaze on the screen inpixels, and t is the sample’s timestamp:
Algorithm 1 Gaze-Window-Commands (Sample(X,Y,t))-sampleDataBuffer: array of gaze samples, with length corre-sponding to a time interval T-sampleDataBuffer.getWindow: returns a valid window if useris looking at it 100% of the time-window: variable to hold the inferred window where the useris looking-window-command(window): returns the command associatedwith inferred window, according to Table 1
1: sampleDataBuffer.add(Sample(X,Y,t))2: if sampleDataBuffer.isFull then3: window=sampleDataBuffer.getWindow4: sampleDataBuffer.clear5: return window-command(window)6: end if
Algorithm 2 Blinking-Commands (Sample(X,Y,t))Using the difference in the time stamp t of the incomingsamples, when there is a sequence of well-defined time gapsT1 between the data samples (which comes from the factthat during blinking no eye gaze data samples are registered),decide on a blinking/winking command.
*Error Parameters, referred to in Algorithm 3:- In the general case, the samples must be above a threshold
percentage E0% in a particular window.- We allow for a window to be repeated three times (3∗T0 in
time) until we decide that the user is not intending to continuethe sequence (or gesture), so we reset the process by clearingthe guessGesture.
- Ensure that the time gap between the samples is not abovea certain time threshold T2, or else decide that the guess anddata might be compromised and reset the process by clearingthe guessGesture and the sampleDataBuffer.
**Special cases, referred to in Algorithm 3:- If the samples of the two windows: expectedWindow as
well as the window before it in the current guessGesture, areabove a certain threshold E1%, then the function clears thesampleDataBuffer and exits.
This is due to the fact that in some cases, when theuser’ gaze samples are split between the two windows, whenthey are moving from one window to another in the cor-rect sequence. To avoid any errors, allow one T0 (i.e. onesampleDataBuffer) for the users gaze to stabilize on theexpectedWindow.
Algorithm 3 Gaze-Gesture-Detection (Sample(X,Y,t))-Gestures: an array of window sequences, each of length L0-gazeGestureBuffer: array of gaze samples, with length corre-sponding to a time interval T0-gazeGestureBuffer.getWindow: with certain error parameters*and special cases**, returns the window the user is inferredto be looking at-window: variable to hold the inferred window where the useris looking-guessGesture: if not -1, it holds the current gesture∈Gesturessatisfying the sequence of windows the user has looked at-expectedWindow: is the next window in the current guessGes-ture sequence
1: gazeGestureBuffer.add(Sample(X,Y,t))2: if gazeGestureBuffer.isFull then3: window=gazeGestureBuffer.getWindow4: gazeGestureBuffer.clear5: if guessGesture = -1 then6: if window == expectedWindow then7: if window==guessGesture.lastWindow then8: return guessGesture9: elseexpectedWindow=guessGesture.nextWindow
10: end if11: else12: guessGesture=-113: return -114: end if15: else16: if ∃G∈Gestures, window==G.firstWindow then17: guessGesture= G18: else19: return -120: end if21: end if22: end if
For choosing the values of L0, T, T0, T1, T2, E0, E1,we experimented with different possible values of each ofthe above parameters. Targeting the best accuracy, controlintuitiveness, and detection rates, as well as the lowest latency,we decided on the best-performing values to use in ourimplementation.
IV. ERGONOMICS ASPECT
The second contribution of our work is the ergonomicsaspect of our design. Our purpose is to make our systemas intuitive and easy to use as possible. These specificationscannot be easily measured, yet several aspects of our systemdesign and structure can be implemented in the aim of makingour system ergonomic.
A. Screen Division and Commands Dictionary
The main video screen displays the video feed obtainedfrom the main drone the user is currently controlling, andis divided into windows as shown in Table I. By looking

237
into any of the windows, or into a pre-defined sequence ofthese windows, the corresponding control signal is transmittedto the drone. Such a screen division has been designed togive the user the natural feeling of piloting the drone as iffrom the inside of the drone, allowing a way for an intuitiveand natural control. Associated to these windows is a setof commands that are defined in a dictionary presented inTable I. These commands can be assimilated as words in alanguage allowing the user to communicate with the drone.These commands were designed according to two principles:simplicity and reliability. First, they must be simple enoughfor the user to remember and use them effectively. Thiswas performed by proposing eye-movement commands, whichconsist of detecting a sequence of windows, based on easyand familiar shapes; such as upward and downward arrowsfor moving upward or downward. The second concern is theability for the eye-tracker to detect reliably the particular wordor command. This would give the user a fair margin of errorin sending his command since the received gaze samples fromthe eye-tracker can be subject to noise. In that way, the userwould not have to repeat the unsuccessful commands veryoften, which would be frustrating and counter-intuitive.
B. Scalability
Besides allowing the user to intuitively control a drone, wealso designed a system that will allow them to control multipledrones simultaneously, as this is a frequent situation whendealing with drones. In the perspective of keeping the controlas intuitive as possible, we achieve scalability by allowingthe user to switch between the drone they are controlling andanother one they are connected to as well. This can be doneby the user through gazing at the video feed, in the sub-videopanel, for the drone they wish to control, which will lead toswapping the selected feed with one on the main video panelalong with the drone control handlers as well. While the userhas focused on a new drone, the other one remains stable inits last position in space.
C. GUI Design
The GUI was also designed to capture the needs of the userand to establish a comfortable working environment. The mainelement to take into consideration is the sensitivity of usingones eyes as a form of control, as it can be tiring to focus on ascreen for an extended amount of time. In that perspective, thecolors used in the design should not be distractive to the eye,as to not cause discomfort and irritation for the user. We havethus chosen neutral colors, consisting of a white backgroundand black text and borders, as shown in Figure 2 below.
D. Resilience
The last ergonomics aspect of our design is the robustnessto errors and unintentional commands. In order to prevent sucherrors from occurring, we included a gaze trace, which isa bubble around the users gaze to enable the user to trackwhere they are currently looking on the screen, removingany source of confusion the user may have about the control
TABLE I: Drone Commands Dictionary
Drone Command Eye Command
Mode 1: Control Mode
Do Nothing
Move ForwardMove Backward
Rotate LeftRotate Right
Combined Commands:Forward Left
Forward RightBackward Left
Backward Right
Altitude Up
Altitude Down
Take-off
Land
Take Picture
Mode 2: Patrol Mode
Tilt Camera UpTilt Camera DownRotate Camera Left
Rotate Camera Right
General Commands
Take Picture

238
Fig. 2: GUI Design
commands they are performing and the accuracy of the eye-tracker. This prevention technique may however not be enoughin case an irregular or unintended command is detected, suchas commands like landing while the drone is moving orcommands resulting from random gazes. In these particularcases, a popup window will appear warning the user andasking for confirmation of the command.
V. CONCLUSION
In this paper, we proposed an intuitive and reliable solutionfor controlling multiple drones from a control room usinggaze only. Our major contributions are the ergonomic aspectof our design to ensure nature and intuitive control by theuser, and providing a dictionary of gaze commands alongwith eye-tracking algorithms to detect the commands. Initialperformance analysis and user testing allowed us to assesthe degree of intuitiveness and program response for eachcommand. The results proved successful and promising, andthe next phase will include conducting more thorough testing,reiterating through the algorithmic design process accordingly,and adding advanced features to our overall system.
ACKNOWLEDGMENT
The authors would like to thank Prof. Zaher Dawy for hisvaluable advice throughout this project.
REFERENCES
[1] A. Thomson, “20 commercial drone use cases andleading innovators,” VentureRadar, 2015. [Online]. Avail-able: http://blog.ventureradar.com/2015/12/29/20-commercial-drone-use-cases-and-leading-innovators/
[2] J. P. Hansen, A. Alapetite, I. S. MacKenzie, and E. Møllenbach, “Thedawn of personal drones,” ACM CHI’13, 2012.
[3] J. P. Hansen, A. Alapetite, I. S. MacKenzie, and E. Mollenbach, “Theuse of gaze to control drones,” in Proceedings of the Symposiumon Eye Tracking Research and Applications, ser. ETRA ’14. NewYork, NY, USA: ACM, 2014, pp. 27–34. [Online]. Available:http://doi.acm.org/10.1145/2578153.2578156
[4] J. M. Ettikkalayil, “Design, implementation, and performance study of anopen source eye-control system to pilot a parrot ar. drone quadrocopter,”2013.
[5] J. H. Goldberg and X. P. Kotval, “Computer interface evaluation using eyemovements: methods and constructs,” International Journal of IndustrialErgonomics, vol. 24, no. 6, pp. 631–645, 1999.
1
Firefighter Indoor Tracking System
Ahmad Al Masri Abdel Rahman Koleilat
Electrical and Computer Engineering American University of Beirut
Beirut, Lebanon [email protected] [email protected]
Abstract-Firefighters are known for their dangerous job that requires them to risk their own lives in order to extinguish fires from burning structures and help citizens that are trapped inside. In order to work in such a treacherous environment, firefighters should wear a special type of clothes and carry the necessary equipment and tools for survival against the fire. Also, it is im-portant that every firefighter’s status is kept under surveillance. It is also important for the chief firefighter to always be aware of the firefighters’ estimated location inside the building in case he needed any immediate help and backup. Lebanon is a country which sadly doesn’t dedicate its full resources to sectors that mat-ter, like the defense departments for chance. Thereby, Lebanese firefighters aren’t provided with the best equipment and technol-ogies, making it more difficult for them to be efficient in their work. Another thing worth mentioning, some firefighters can be impulsive, which would affect their decision making at crunch time. All of these are a big factor in the potential increase in the death rates of firefighters. Accordingly, it is crucial to introduce a system that tracks firefighters’ every movement and updates their current status.
I. INTRODUCTION
Firefighters everywhere suffer from lack of coordination and planning, no matter how well they are trained, one second is enough to stab them in the back. In Lebanon for example, there isn’t that much of resource allocation to defense departments of all sorts, compared to advanced countries like Germany and Japan. This signifies the decrease in effectiveness and success on the field. In many cases, they would enter the dangerous site at a fast pace without thinking about giving some prior notice to the firefighters who are near the truck and responsible for assessing the overall situation. This causes a major problem, because the firefighters who enter the fire zone quickly, leave themselves prone to more danger as they might not be acknowledged by the chief firefighter at the zone, and hence no backup will be called for them when they need it. The intense heat, smoke, and wreckage inside the apartment would prevent any oral communication between the firefighters, and so the only help would come from the rescue team. That being said, something should tell the supervising firefighter outside the danger zone that firefighter “X” needs help, or backup of any sort. As a real life example, there was this one big fire incident that happened in Zarif in Beirut, where the first fire truck came completely empty of water, and so a replacement was sent im-mediately, thus clearly showing a vital mistake a fire depart-
ment committed, probably due to one firefighter’s mishap. Another case, which was a major incentive in all of our con-cern, is when two colleagues of a civil defense volunteer we interviewed, Mr. Nabil Zantout, went inside a flaming ware-house without giving notice to their chief, and so time passed without being able to track their exact location, and they passed away.
That is sufficient to see how machines and automated sys-tems can be very helpful, by preventing fatal errors, in compar-ison to human beings. Fortunately, our design is a major step towards saving the lives of firefighters in specific, and it is worthy to note that this prototype which will be shown later is generic, in terms of the audience it serves. Specificity towards firefighters comes from the fact that the intense smoke inside buildings was taken into consideration in our design, and actu-ally was a directing factor in our implementation methods. Finally, our design encompasses an Indoor Positioning System which gives the exact live location of the firefighter in the building, observed by his chief.
II. RELATED WORK
Several works have shown the core mechanical and physical algorithms which calculate, per say, a person’s direction and distance covered, while he’s walking, running, or going up the stairs.
In this first paper we read, a portable device composed of an IMU which measures the components of acceleration, angular velocity, and static magnetic field, and of two pressure sensors, is used to evaluate the vertical jump of the person, in sports. The two pressure sensors (force sensitive resistors) are placed on the forefeet, and the IMU on the waist region, close to the center of gravity of the human being. The IMU was used to retrieve the absolute acceleration using all three components, and deriving the velocity by integration. Also, this motion ap-proximates a free fall, and so the height can be calculated using the found acceleration and free fall equations. The FSRs (pres-sure sensors) were used to find the average signals found by adding the below threshold and above threshold signals. The latter give us a graph plotting his pressure with respect to time, and thus we know his current mode of action (jumping, resting, etc.) [1].

239
1
Firefighter Indoor Tracking System
Ahmad Al Masri Abdel Rahman Koleilat
Electrical and Computer Engineering American University of Beirut
Beirut, Lebanon [email protected] [email protected]
Abstract-Firefighters are known for their dangerous job that requires them to risk their own lives in order to extinguish fires from burning structures and help citizens that are trapped inside. In order to work in such a treacherous environment, firefighters should wear a special type of clothes and carry the necessary equipment and tools for survival against the fire. Also, it is im-portant that every firefighter’s status is kept under surveillance. It is also important for the chief firefighter to always be aware of the firefighters’ estimated location inside the building in case he needed any immediate help and backup. Lebanon is a country which sadly doesn’t dedicate its full resources to sectors that mat-ter, like the defense departments for chance. Thereby, Lebanese firefighters aren’t provided with the best equipment and technol-ogies, making it more difficult for them to be efficient in their work. Another thing worth mentioning, some firefighters can be impulsive, which would affect their decision making at crunch time. All of these are a big factor in the potential increase in the death rates of firefighters. Accordingly, it is crucial to introduce a system that tracks firefighters’ every movement and updates their current status.
I. INTRODUCTION
Firefighters everywhere suffer from lack of coordination and planning, no matter how well they are trained, one second is enough to stab them in the back. In Lebanon for example, there isn’t that much of resource allocation to defense departments of all sorts, compared to advanced countries like Germany and Japan. This signifies the decrease in effectiveness and success on the field. In many cases, they would enter the dangerous site at a fast pace without thinking about giving some prior notice to the firefighters who are near the truck and responsible for assessing the overall situation. This causes a major problem, because the firefighters who enter the fire zone quickly, leave themselves prone to more danger as they might not be acknowledged by the chief firefighter at the zone, and hence no backup will be called for them when they need it. The intense heat, smoke, and wreckage inside the apartment would prevent any oral communication between the firefighters, and so the only help would come from the rescue team. That being said, something should tell the supervising firefighter outside the danger zone that firefighter “X” needs help, or backup of any sort. As a real life example, there was this one big fire incident that happened in Zarif in Beirut, where the first fire truck came completely empty of water, and so a replacement was sent im-mediately, thus clearly showing a vital mistake a fire depart-
ment committed, probably due to one firefighter’s mishap. Another case, which was a major incentive in all of our con-cern, is when two colleagues of a civil defense volunteer we interviewed, Mr. Nabil Zantout, went inside a flaming ware-house without giving notice to their chief, and so time passed without being able to track their exact location, and they passed away.
That is sufficient to see how machines and automated sys-tems can be very helpful, by preventing fatal errors, in compar-ison to human beings. Fortunately, our design is a major step towards saving the lives of firefighters in specific, and it is worthy to note that this prototype which will be shown later is generic, in terms of the audience it serves. Specificity towards firefighters comes from the fact that the intense smoke inside buildings was taken into consideration in our design, and actu-ally was a directing factor in our implementation methods. Finally, our design encompasses an Indoor Positioning System which gives the exact live location of the firefighter in the building, observed by his chief.
II. RELATED WORK
Several works have shown the core mechanical and physical algorithms which calculate, per say, a person’s direction and distance covered, while he’s walking, running, or going up the stairs.
In this first paper we read, a portable device composed of an IMU which measures the components of acceleration, angular velocity, and static magnetic field, and of two pressure sensors, is used to evaluate the vertical jump of the person, in sports. The two pressure sensors (force sensitive resistors) are placed on the forefeet, and the IMU on the waist region, close to the center of gravity of the human being. The IMU was used to retrieve the absolute acceleration using all three components, and deriving the velocity by integration. Also, this motion ap-proximates a free fall, and so the height can be calculated using the found acceleration and free fall equations. The FSRs (pres-sure sensors) were used to find the average signals found by adding the below threshold and above threshold signals. The latter give us a graph plotting his pressure with respect to time, and thus we know his current mode of action (jumping, resting, etc.) [1].

240
2
Another work quite similar to the previous paper shows how pressure sensors can be used with good resolution in time and amplitude can be used to approximate the different motion states of pedestrians wearing the sensor. Also, the number of steps taken are calculated, in addition to the pressure signal, with respect to time. The different states this system detects are walking on plain ground, and climbing up and down on stairs. Now, the human gait cycle is based on two stages, stance (ref-erence foot on the ground) and swing (reference foot in the air). Stride (step length) and cadence (stepping frequency) are two vital factors to assess the person’s motion states. This sys-tem has proven a precision between 92% and 100% in all the resulting graphs, which is relatively good [2].
In some other scheme, the IMU is used to return interactive feedback and monitoring to people undergoing therapeutic exercise. It tracks movement while doing the exercise, and then uses the obtained movement metrics as data input for the audio and visual feedback. Furthermore, an IMU exercise classifica-tion system is developed. Now, the data is collected by first calibrating the IMU, and initializing the sampling rate, storage methods, and sensor scales. In the work done in this project, the IMU has proven to have an accurate evaluation of the posi-tioning and movement performance. Filtering and other tech-niques could be used to increase accuracy of the dataset [3].
Some other work has shown how an IMU can be mounted to the foot in order to track the motion of pedestrians and be used for inertial navigation. It mentions that tracking pedestrians can enable other applications and emerging services. Also, the IMU is really cost-beneficial since it has a good performance and capabilities with respect to its cost. Nevertheless, the IMU is still not sufficient to extend the tracking procedure. Howev-er, the low price, small size, and low power consumption of the IMU allow the use of multiple IMU chips combined on the same PCB giving us an IMU array. This paper demonstrates that mounting an IMU array can actually track pedestrians and plot their path [4].
It is important to determine the velocity and the position of an individual during sports training and exercises for motion assessment. In this paper, three IMU sensors are physically installed on the thigh, pelvis, and shank, in order to measure the lower limbs kinematics. The data of the acceleration is re-fined by using an algorithm that is capable of minimizing the error. After that, we will result in an accurate velocity in 3D, and then the individual’s position can be tracked from the ve-locity. This method of tracking can be useful for daily applica-tion for both outdoor and indoor [5].
III. SYSTEM DESIGN
The system should be designed in such a way that it should give the position of the firefighter inside the building as accu-rate as possible with minimum error. Since there is a lot of smoke, fire, and debris inside the building, the only possible way to find the position of the firefighter is through tracking
his motion. Therefore, we need to devise a method to know the firefighter’s location inside the building in 3D. Therefore, a system is needed to do the following: Detect which floor the firefighter is on, create a new 2D point after each step for the corresponding floor, send this data through a reliable commu-nication module in real time, and display a map of the trajecto-ry over a mobile app interface along with a compass and direc-tions that the chief firefighter can understand. This way, if a certain firefighter got stuck inside the building in any way pos-sible, his position will be known and can be rescued.
Figure 1. Algorithm flowchart
IV. IMPLEMENTATION
A. Hardware Components An Arduino Nano will be used in our model since it’s small
in size and can be programmed easily. The microcontroller will be used to receive all the input signals from the sensors con-nected and then give the necessary output. The sensors con-nected to the microcontroller are the following: two FSR (Force Sensitive Resistors) sensors, two ultrasonic sensors, and
3
an IMU (Inertial Measurement Unit). Each FSR sensor will be placed under the boot of the firefighter that will detect the pressure exerted by the foot. This way, we are able to detect whether the firefighter is taking a step (detect if he is in motion or not). The ultrasonic sensors will be used to detect if the fire-fighter is walking up or down the stairs. One sensor will be placed on the front side of the boot and the other one will be placed on the back side of the boot with both of them facing downwards. When the firefighter is walking up the stairs, the back side sensor will give a larger reading in the distance de-tected at the edge of each step. The same thing will also occur with the front side sensor in the case when the firefighter is walking down the stairs. An IMU will be mounted on the waist area of the firefighter and can be used to determine his orienta-tion, and thus, the direction he’s moving in. The IMU is placed in such a way that the Z-axis is positioned vertically and the X-Y plane positioned horizontally with the Y-axis pointing to the front. This is because the Y-axis will be used as the direction vector of the firefighter. The prototype is shown below.
Figure 2. Prototype design with a closer look to its circuit and sensors mounted
B. Software
1) Android Interface: Based on our system design, we need to display a map containing the firefighter’s path traversed and current location with respect to the entrance, as well as other useful information, to the chief firefighter remaining in his base or outside the building. This map was implemented using the Canvas library in Android Studio. It takes the coordinates which are processed in matlab, and draws the firefighter’s path accordingly. Getting the number of steps taken by the individ-ual and multiplying this number by the average step size gives us a minimal error approximation of the total distance the per-son covered. North, east, west, and south with respect to every
floor entrance are displayed. The firefighter’s current position will be shown in a radar-like pulse lighting. Zoom in and zoom out options are available, as well as refreshing the database we are working with, which will be discussed in the wireless communication section. The languages used here are java and xml.
2) Matlab and Arduino Processing: As mentioned in the previous section, the Arduino microcontroller will read the input values of the sensors and send the required output to Matlab through serial communication. The Arduino will send four values to Matlab. The first value represents the yaw which is the rotation around the Z-axis of the IMU. The yaw will be used as the angle to calculate the Cartesian coordinates of the new point. The X-coordinate of the new point is calculated by adding the cosine of the angle with the X-coordinate of the previous point. The same thing is also done for the Y-coordinate. A new point is calculated after each step is taken by the firefighter. Now, to detect each step taken, two FSR sensors will be used as mentioned. The second value sent will act as a flag to represent the status each foot (if it has been lowered or raised). At the beginning of the program, the flag will start with a value of zero which will be the initial state. When the firefighter raises his right foot, the flag will have a value of 1. This value will remain the same until he lowers his right foot, and therefore, the flag will have a value of 3. Simi-larly, the same thing will happen when the left foot is raised and lowered with the flag having the values 2 and 4 respective-ly. The FSR sensors are situated in such a way that the flag will give a different sequence for two major cases. The first case is when the firefighter is moving (walking or running), and so, the flag will give a sequence of 1’s followed by a sequence of 2’s without giving any 3 or 4 values due to the type of motion. However, a sequence of 1’s, 2’s, 3’s, & 4’s will be given in case the firefighter is taking steps in his place without moving. This is important because the map shouldn’t continue drawing the trajectory when the firefighter is taking steps in the same position. The last two values sent by the Arduino are the dis-tances measured by the front side and the back side ultrasonic sensors respectively. These two values represent the distances measured from the boot to the ground. When the right foot is raised, Matlab will store all the distances measured in an array. And once the left foot is raised, the minimum values in the array are chosen. In order for the program to increment or dec-rement the floor number, it should first detect an increase in the distance of the back side of the front side sensor respectively which indicates that the firefighter is on the stairs. It should then detect a decrease in distance indicating that the firefighter has reached a flat surface. However, between each floor in a building, there is a small flat area between two staircases which will increment or decrement the floor number. There-fore, when the firefighter reaches a new floor, the floor number should have increased or decreased by 2.

241
2
Another work quite similar to the previous paper shows how pressure sensors can be used with good resolution in time and amplitude can be used to approximate the different motion states of pedestrians wearing the sensor. Also, the number of steps taken are calculated, in addition to the pressure signal, with respect to time. The different states this system detects are walking on plain ground, and climbing up and down on stairs. Now, the human gait cycle is based on two stages, stance (ref-erence foot on the ground) and swing (reference foot in the air). Stride (step length) and cadence (stepping frequency) are two vital factors to assess the person’s motion states. This sys-tem has proven a precision between 92% and 100% in all the resulting graphs, which is relatively good [2].
In some other scheme, the IMU is used to return interactive feedback and monitoring to people undergoing therapeutic exercise. It tracks movement while doing the exercise, and then uses the obtained movement metrics as data input for the audio and visual feedback. Furthermore, an IMU exercise classifica-tion system is developed. Now, the data is collected by first calibrating the IMU, and initializing the sampling rate, storage methods, and sensor scales. In the work done in this project, the IMU has proven to have an accurate evaluation of the posi-tioning and movement performance. Filtering and other tech-niques could be used to increase accuracy of the dataset [3].
Some other work has shown how an IMU can be mounted to the foot in order to track the motion of pedestrians and be used for inertial navigation. It mentions that tracking pedestrians can enable other applications and emerging services. Also, the IMU is really cost-beneficial since it has a good performance and capabilities with respect to its cost. Nevertheless, the IMU is still not sufficient to extend the tracking procedure. Howev-er, the low price, small size, and low power consumption of the IMU allow the use of multiple IMU chips combined on the same PCB giving us an IMU array. This paper demonstrates that mounting an IMU array can actually track pedestrians and plot their path [4].
It is important to determine the velocity and the position of an individual during sports training and exercises for motion assessment. In this paper, three IMU sensors are physically installed on the thigh, pelvis, and shank, in order to measure the lower limbs kinematics. The data of the acceleration is re-fined by using an algorithm that is capable of minimizing the error. After that, we will result in an accurate velocity in 3D, and then the individual’s position can be tracked from the ve-locity. This method of tracking can be useful for daily applica-tion for both outdoor and indoor [5].
III. SYSTEM DESIGN
The system should be designed in such a way that it should give the position of the firefighter inside the building as accu-rate as possible with minimum error. Since there is a lot of smoke, fire, and debris inside the building, the only possible way to find the position of the firefighter is through tracking
his motion. Therefore, we need to devise a method to know the firefighter’s location inside the building in 3D. Therefore, a system is needed to do the following: Detect which floor the firefighter is on, create a new 2D point after each step for the corresponding floor, send this data through a reliable commu-nication module in real time, and display a map of the trajecto-ry over a mobile app interface along with a compass and direc-tions that the chief firefighter can understand. This way, if a certain firefighter got stuck inside the building in any way pos-sible, his position will be known and can be rescued.
Figure 1. Algorithm flowchart
IV. IMPLEMENTATION
A. Hardware Components An Arduino Nano will be used in our model since it’s small
in size and can be programmed easily. The microcontroller will be used to receive all the input signals from the sensors con-nected and then give the necessary output. The sensors con-nected to the microcontroller are the following: two FSR (Force Sensitive Resistors) sensors, two ultrasonic sensors, and
3
an IMU (Inertial Measurement Unit). Each FSR sensor will be placed under the boot of the firefighter that will detect the pressure exerted by the foot. This way, we are able to detect whether the firefighter is taking a step (detect if he is in motion or not). The ultrasonic sensors will be used to detect if the fire-fighter is walking up or down the stairs. One sensor will be placed on the front side of the boot and the other one will be placed on the back side of the boot with both of them facing downwards. When the firefighter is walking up the stairs, the back side sensor will give a larger reading in the distance de-tected at the edge of each step. The same thing will also occur with the front side sensor in the case when the firefighter is walking down the stairs. An IMU will be mounted on the waist area of the firefighter and can be used to determine his orienta-tion, and thus, the direction he’s moving in. The IMU is placed in such a way that the Z-axis is positioned vertically and the X-Y plane positioned horizontally with the Y-axis pointing to the front. This is because the Y-axis will be used as the direction vector of the firefighter. The prototype is shown below.
Figure 2. Prototype design with a closer look to its circuit and sensors mounted
B. Software
1) Android Interface: Based on our system design, we need to display a map containing the firefighter’s path traversed and current location with respect to the entrance, as well as other useful information, to the chief firefighter remaining in his base or outside the building. This map was implemented using the Canvas library in Android Studio. It takes the coordinates which are processed in matlab, and draws the firefighter’s path accordingly. Getting the number of steps taken by the individ-ual and multiplying this number by the average step size gives us a minimal error approximation of the total distance the per-son covered. North, east, west, and south with respect to every
floor entrance are displayed. The firefighter’s current position will be shown in a radar-like pulse lighting. Zoom in and zoom out options are available, as well as refreshing the database we are working with, which will be discussed in the wireless communication section. The languages used here are java and xml.
2) Matlab and Arduino Processing: As mentioned in the previous section, the Arduino microcontroller will read the input values of the sensors and send the required output to Matlab through serial communication. The Arduino will send four values to Matlab. The first value represents the yaw which is the rotation around the Z-axis of the IMU. The yaw will be used as the angle to calculate the Cartesian coordinates of the new point. The X-coordinate of the new point is calculated by adding the cosine of the angle with the X-coordinate of the previous point. The same thing is also done for the Y-coordinate. A new point is calculated after each step is taken by the firefighter. Now, to detect each step taken, two FSR sensors will be used as mentioned. The second value sent will act as a flag to represent the status each foot (if it has been lowered or raised). At the beginning of the program, the flag will start with a value of zero which will be the initial state. When the firefighter raises his right foot, the flag will have a value of 1. This value will remain the same until he lowers his right foot, and therefore, the flag will have a value of 3. Simi-larly, the same thing will happen when the left foot is raised and lowered with the flag having the values 2 and 4 respective-ly. The FSR sensors are situated in such a way that the flag will give a different sequence for two major cases. The first case is when the firefighter is moving (walking or running), and so, the flag will give a sequence of 1’s followed by a sequence of 2’s without giving any 3 or 4 values due to the type of motion. However, a sequence of 1’s, 2’s, 3’s, & 4’s will be given in case the firefighter is taking steps in his place without moving. This is important because the map shouldn’t continue drawing the trajectory when the firefighter is taking steps in the same position. The last two values sent by the Arduino are the dis-tances measured by the front side and the back side ultrasonic sensors respectively. These two values represent the distances measured from the boot to the ground. When the right foot is raised, Matlab will store all the distances measured in an array. And once the left foot is raised, the minimum values in the array are chosen. In order for the program to increment or dec-rement the floor number, it should first detect an increase in the distance of the back side of the front side sensor respectively which indicates that the firefighter is on the stairs. It should then detect a decrease in distance indicating that the firefighter has reached a flat surface. However, between each floor in a building, there is a small flat area between two staircases which will increment or decrement the floor number. There-fore, when the firefighter reaches a new floor, the floor number should have increased or decreased by 2.

242
4
C. Wireless Communication In order for the android phone to receive the coordinates of
the firefighter in real-time, an online phpMyAdmin server on Godaddy web hosting is used to store these coordinates in a MySQL database which are retrieved by the prototype’s pro-cessing entity, the backpack laptop, which can be ideally re-placed by a raspberry pi. This laptop has Matlab as its pro-cessing IDE, and Matlab sends its data to the database through an ODBC connection. In other terms, the portable laptop sends data through “Mobi3G”, a portable 3G router, to the online server and stores it in a database. The android phone is pro-grammed to the web server’s IP at all times, and so wherever the phone is, as long as it is connected to the internet in any possible way, it will access the database’s stored coordinates, and display the trajectory on the map. In another direction, by long pressing on the app’s map activity screen, we can refresh this database, which would reset the whole tracking event. No-tice below the fixed website IP, and the coordinates (x,y,z), where z designates the current floor of the firefighter.
Figure 3. Online server with database
V. TESTING AND RESULTS
Testing the prototype was a non-stop event that bared many errors, as would be predicted. Testing took on many phases, but it is only appropriate to speak about the main cases tested, and their results. These cases are derived from the concept of tracking the firefighter indoors. It is worthy to note that there are videos we took that are more informative and valuable to showing the results, than just screenshots.
The first case considered was the firefighter walking slowly in the same floor, and displaying his path and related infor-mation on the phone. What was important here was that the individual would begin at a starting point (the origin of axes),
walk around all the vertices of a room, and as he returns to this same point in real-time, the app would show it was a success, due to the shape of the room being drawn quite accurately. Below, the screenshots show a demonstration of this case.
Figure 4. First test
The second case considered was the firefighter walking fast around the room’s space, then leaving the room, and going up one set of stairs, then back down. The app shows which floor the firefighter is in, total distance covered, approximate posi-tion from main entrance, and of course the corresponding tra-jectory he traversed. These below figures, placed in a sequen-tial manner, show the changes according to the individual’s motion.
Figure 5. Second test
5
Figure 6. Change in floor number and the distance during the second test
The final case recently considered builds over the second case, in the manner that if the individual stomps his feet in his place, or goes up and down the stairs, the trajectory won’t be drawn, because it shouldn’t be drawn.
VI. CONCLUSION
The testing done has shown us some successful results. The device is now capable of determining the location of the fire-fighters inside the building. However, we still haven’t tested our prototype in a real-life scenario. We hope in the future to turn our prototype into an actual product. This way, firefighters can be rescued easily and their death rate can decrease. We also hope to make our prototype more rugged and insulated taking into consideration the harsh environment the firefighters are in. In addition, more sensors can be integrated with our model to provide more functionalities and features in order to aid the firefighters. The product can also be used in other real-life scenarios and not just with firefighters. Firefighters sacri-fice their lives and put them in danger for the sake of the peo-ple; therefore, they need as much help as they can get.
ACKNOWLEDGMENT
We would like to thank our advisor Dr. Lama Hamandi for all the support and help she gave us. We would also like to thank the Civil Defense Center especially Mr. Nabil Zantout.
REFERENCES [1] M. R. Garcia, L. J. M. Guzmán, J. S. B. Valencia and V. M. Henao,
"Portable measurement system of vertical jump using an Inertial Meas-urement Unit and pressure sensors," 2016 XXI Symposium on Signal Processing, Images and Artificial Vision (STSIVA), Bucaramanga, Co-lombia, 2016, pp. 1-5.
[2] B. Ghimire, C. Nickel and J. Seitz, "Pedestrian motion state classification using pressure sensors," 2016 International Conference on Indoor Posi-
tioning and Indoor Navigation (IPIN), Alcala de Henares, Spain, 2016, pp. 1-6.
[3] D. Whelan, M. O'Reilly, B. Huang, O. Giggins, T. Kechadi and B. Caul-field, "Leveraging IMU data for accurate exercise performance classifica-tion and musculoskeletal injury risk screening," 2016 38th Annual Inter-national Conference of the IEEE Engineering in Medicine and Biology Society (EMBC), Orlando, FL, 2016, pp. 659-662.
[4] I. Skog, J. O. Nilsson and P. Händel, "Pedestrian tracking using an IMU array," 2014 IEEE International Conference on Electronics, Computing and Communication Technologies (CONECCT), Bangalore, 2014, pp. 1-4.
[5] Q. Yuan, I. M. Chen and A. Caus, "Human velocity tracking and locali-zation using 3 IMU sensors," 2013 6th IEEE Conference on Robotics, Automation and Mechatronics (RAM), Manila, 2013, pp. 25-30.

243
4
C. Wireless Communication In order for the android phone to receive the coordinates of
the firefighter in real-time, an online phpMyAdmin server on Godaddy web hosting is used to store these coordinates in a MySQL database which are retrieved by the prototype’s pro-cessing entity, the backpack laptop, which can be ideally re-placed by a raspberry pi. This laptop has Matlab as its pro-cessing IDE, and Matlab sends its data to the database through an ODBC connection. In other terms, the portable laptop sends data through “Mobi3G”, a portable 3G router, to the online server and stores it in a database. The android phone is pro-grammed to the web server’s IP at all times, and so wherever the phone is, as long as it is connected to the internet in any possible way, it will access the database’s stored coordinates, and display the trajectory on the map. In another direction, by long pressing on the app’s map activity screen, we can refresh this database, which would reset the whole tracking event. No-tice below the fixed website IP, and the coordinates (x,y,z), where z designates the current floor of the firefighter.
Figure 3. Online server with database
V. TESTING AND RESULTS
Testing the prototype was a non-stop event that bared many errors, as would be predicted. Testing took on many phases, but it is only appropriate to speak about the main cases tested, and their results. These cases are derived from the concept of tracking the firefighter indoors. It is worthy to note that there are videos we took that are more informative and valuable to showing the results, than just screenshots.
The first case considered was the firefighter walking slowly in the same floor, and displaying his path and related infor-mation on the phone. What was important here was that the individual would begin at a starting point (the origin of axes),
walk around all the vertices of a room, and as he returns to this same point in real-time, the app would show it was a success, due to the shape of the room being drawn quite accurately. Below, the screenshots show a demonstration of this case.
Figure 4. First test
The second case considered was the firefighter walking fast around the room’s space, then leaving the room, and going up one set of stairs, then back down. The app shows which floor the firefighter is in, total distance covered, approximate posi-tion from main entrance, and of course the corresponding tra-jectory he traversed. These below figures, placed in a sequen-tial manner, show the changes according to the individual’s motion.
Figure 5. Second test
5
Figure 6. Change in floor number and the distance during the second test
The final case recently considered builds over the second case, in the manner that if the individual stomps his feet in his place, or goes up and down the stairs, the trajectory won’t be drawn, because it shouldn’t be drawn.
VI. CONCLUSION
The testing done has shown us some successful results. The device is now capable of determining the location of the fire-fighters inside the building. However, we still haven’t tested our prototype in a real-life scenario. We hope in the future to turn our prototype into an actual product. This way, firefighters can be rescued easily and their death rate can decrease. We also hope to make our prototype more rugged and insulated taking into consideration the harsh environment the firefighters are in. In addition, more sensors can be integrated with our model to provide more functionalities and features in order to aid the firefighters. The product can also be used in other real-life scenarios and not just with firefighters. Firefighters sacri-fice their lives and put them in danger for the sake of the peo-ple; therefore, they need as much help as they can get.
ACKNOWLEDGMENT
We would like to thank our advisor Dr. Lama Hamandi for all the support and help she gave us. We would also like to thank the Civil Defense Center especially Mr. Nabil Zantout.
REFERENCES [1] M. R. Garcia, L. J. M. Guzmán, J. S. B. Valencia and V. M. Henao,
"Portable measurement system of vertical jump using an Inertial Meas-urement Unit and pressure sensors," 2016 XXI Symposium on Signal Processing, Images and Artificial Vision (STSIVA), Bucaramanga, Co-lombia, 2016, pp. 1-5.
[2] B. Ghimire, C. Nickel and J. Seitz, "Pedestrian motion state classification using pressure sensors," 2016 International Conference on Indoor Posi-
tioning and Indoor Navigation (IPIN), Alcala de Henares, Spain, 2016, pp. 1-6.
[3] D. Whelan, M. O'Reilly, B. Huang, O. Giggins, T. Kechadi and B. Caul-field, "Leveraging IMU data for accurate exercise performance classifica-tion and musculoskeletal injury risk screening," 2016 38th Annual Inter-national Conference of the IEEE Engineering in Medicine and Biology Society (EMBC), Orlando, FL, 2016, pp. 659-662.
[4] I. Skog, J. O. Nilsson and P. Händel, "Pedestrian tracking using an IMU array," 2014 IEEE International Conference on Electronics, Computing and Communication Technologies (CONECCT), Bangalore, 2014, pp. 1-4.
[5] Q. Yuan, I. M. Chen and A. Caus, "Human velocity tracking and locali-zation using 3 IMU sensors," 2013 6th IEEE Conference on Robotics, Automation and Mechatronics (RAM), Manila, 2013, pp. 25-30.

244
Smart Walking Cane for the Visually Impaired
Sami Kanafani
Electrical & Computer Engineering Department American University of
Beirut (A.U.B) Beirut, Lebanon
Hasan Shami
Electrical & Computer Engineering Department American University of
Beirut (A.U.B) Beirut, Lebanon
Georges Melki
Electrical & Computer Engineering Department American University of
Beirut (A.U.B) Beirut, Lebanon
Abstract– With the recent emergence of Internet of Things (IoT) concepts that allow the incorporation & interaction of devices wirelessly & without human intervention, ideas for improving societal life have transpired & put into implementation. Yet, the use of the traditional walking cane for the visually impaired is still prevalent, despite its restrictions and the possibility for improvement in light of IoT concepts. The use of interconnected devices and embedded sensors on the traditional cane would allow for expanded user mobility by providing augmented methods of obstacle detection & other functionalities. The “Smart Walking Cane for the Visually Impaired” aims to enhance the traditional walking cane that visually impaired people use to roam. This occurs by integrating it with sensors & network connectivity to better enable them to move around while detecting & avoiding obstacles, navigating to desired locations, and handling emergency situations. This enhancement would not affect the current standard of function of the traditional cane, rather only augment its performance. The enhanced cane functions within an architecture composed of three main connected components: a processor & embedded sensors on the cane, a personal smartphone, and a remote server for processing incoming traffic from all connected canes. This simple structure allows for a real-time & secure connection between the cane and the server, while maintaining portability, reliability, and user-friendliness.
Index Terms – Internet of things, Cane, Obstacles detection, visual impairment.
I. Introduction
According to the Centers for Disease Control and Prevention (CDC) the definition of visual impairment is any limitation to vision, that cannot be compensated for by glasses or medicine [1]. In 2014, the World Health Organizations (WHO) published that over 285 million people in the world are visually impaired, of whom 39 million are completely blind and 246 million have low vision [2]. Another report by the World Health Organization in 2014 indicates that these numbers will rise to an estimate of 200 million people with visual impairments and 75 million people blind by the year 2020 [3].
A visually person is highly dependent on his cane, this cane is used to guide the visually impaired person through obstacles. Although the white cane has the ability to identify low and middle-level obstacles, it doesn’t guarantee saving the visually impaired person from a lot of obstacles such as hanging objects.
The white cane doesn’t grant the visually impaired person independence since he will be always in need for help to navigate to outdoor locations, the white cane will come only in use when the blind person is navigating in an environment that he already knows.
Our project aims to enhance the traditional white cane that visually impaired people use using sensors & network connectivity to better enable them to detect obstacles they couldn’t before. Combining technologies together, a reliable, simple, & portable solution can be created for visually impaired people to be better integrated into a normal lifestyle. The motivation of this project is the boom in the Internet of things technology which will enable us to improve obstacle detection methods with the help of a remote server.

245
II.Related Works
To start the research, different Smart Canes where analyzed to know their weaknesses and strengths. The canes prototypes are
A. Assistive infrared sensor based smart stick [4] B. Guidecane [5] The article in reference [4] is proposing a new method for detecting up and down stairs using 2 infrared sensors, one oblique and the other is horizontal as shown in Figure 1. The algorithm the article is using is simple and works as follows: the controller that is controlling the cane (which is a PIC microcontroller in the case of this article) computes the average of the reflected signal of the oblique infrared sensor, if there is a negative deviation from the average, then this a downstairs, if there is a positive deviation, then this a an upstairs. The deviation from the average depends on a certain threshold that is obtained in testing. The advantage of this article is that it proposed a new easy method for detecting stairs, yet, this method can mix between a hole and a real stair.
The article in reference [5] guides the visually impaired person through the obstacles and uses a wheel to change the direction of the navigation as shown in Figure 2. This cane is using ultrasonic sensors for obstacle detection. The idea of a guiding wheel will allow for a relaxed navigation for the visually impaired, but this design lacks the ability to detect small obstacles and hanging objects, and might guide the visually impaired person to collide with such kinds of obstacles.
Figure 2: Cane design of [5]
III. Requirements
In order to match the desired needs of the visually impaired, we statistically compiled input from visually impaired people to come up with their most demanded needs. This was done through personal interviews, where open ended questions were used to identify the real problems that visually impaired people are facing. We set our requirements based on these needs, and then classified and ranked them as follows in Table 1.
# Feature % 1 Hanging Object detection 94.7 2 Audio Feedback 84.2 3 Stairs Detection 78.9 4 Navigation and Maps 78.9 5 Building Entrances 63.2 6 Emergency Contact 57.9 7 Identify Traffic Signal & its status 42.1 8 Identify Money 42.1 9 GPS Tracking on Web 36.8 10 Identify Color 10.5
Table 1: Table of Requirements
IV. Architecture
The architecture that is implemented is based on IoT technology, where every cane is linked to a central remote server that tracks the location of users, alerts related caregivers in case of emergency, and creates a map of obstacles that are encountered by users on the road.
The architecture is composed of a cane that is attached to a Raspberry Pi processor (running Linux operating system), the smartphone of the visually impaired person running the application developed for the project, and the remote server that is communicating with the phone.
Figure 1: Cane design of [4]

246
Figure 3: Overall architecture of the system
As shown in Figure 3, the Raspberry Pi processor is connected to the mobile phone over Bluetooth, and the mobile phone is connected to the server through the internet. The description of the components of the architecture is detailed below:
1. Cane: The cane is controlled by the Raspberry Pi processor. The Raspberry Pi processor is connected to 3 ultrasonic sensors connected in array that constantly read and send the processor proximity data. The sensors are placed as shown in Figure 4 in a horizontal array with an angle of 120° between each sensor, which will enable the sensors to span the entire front of the user. The sensors are situated at an angle of 50° with the ground, which is based on the technique which visually impaired people use to carry the cane. In addition, an accelerometer, oriented along the horizontal array, is used to check the orientation of the cane with respect to the direction of motion, which will reduce the amount of false positives and will maintain the hoovering method of using the traditional cane. The Raspberry Pi processor is also connected to an infrared proximity sensor that is used to detect stairs and holes. The infrared sensor is situated on the cane closer to the ground. The infrared sensor will calculate the distance to the ground and will detect if a hole or a downward stair is approaching. All sensor readings will be sent through Bluetooth to the mobile phone. RFCOMM sockets are used in Bluetooth communication between the processor and the phone in order to maintain secure, real-time, and reliable transfer of information between the mobile phone and the cane. A push button is available on the cane for emergency incidents that may occur with users in cases of solitude. When this push button is pressed, the
processor will send a Bluetooth message to the mobile application to notify the caregivers associate to the user. In addition to all the components that are connected to the Raspberry Pi processor, a speaker is also connected to generate pertinent audio messages.
Figure 4: Sensor Placement on the Cane
2. Mobile Phone: Bluetooth, Internet, and GPS should be enabled on the mobile phone in order to be able to communicate with the cane and the remote server respectively. The mobile application will start a socket connection with the Raspberry Pi processor which acts as a Bluetooth RFCOMM server. The processor will authenticate the mobile phone and will start sending information regarding obstacles detection to the mobile phone. The mobile application will start a connection with the remote server, and it will update the server about its location, obstacle detection at this location, and the type of this obstacle if detected. In order to ensure the accuracy of the system, the mobile application will obtain the speed of the user, and it will set the frequency of updating the server based on this speed. If the server responds to the mobile application with an alert about a close obstacle in the region, the mobile application will send this alert to the processor on the cane that will generate an audible message to give users a proximity warning to obstacles. If the mobile application receives the emergency alert from the cane, it will directly send a text message to the care givers to notify them of an emergency situation with the cane user. 3. Remote Server: The server contains a database of obstacles, their types, their frequency of detection, and their locations. When the sensors on the cane detect an obstacle, the mobile phone will sends the location and the type of the obstacle to the server. The server will either add that obstacle’s coordinates to its map if no detected before, or increment the frequency of

247
detection of the obstacle if its type and coordinates are already available in the database. The server will be provided with the coordinates of users from the phone’s GPS, which will be used for data analytics & possible obstacles detection. Users can opt for pre-downloading the database of obstacles beforehand to operate the cane without a constant connection to the server. In case the emergency, caregivers of users can gain access to an interface which records the exact location of the user, in case the emergency button is pushed.
V. Implementation The cane is connected to a Raspberry Pi 3 processor that is running a Linux operating system. All the scripts that are responsible for Bluetooth communication, sensor readings, and audio messages generating are written in Python 2.7. The mobile application was developed in Android Studio framework, the backend code was written in Java. The remote server was developed in PHP 6, and the database used is MYSQL. The communication between the mobile phone and the server is based on sockets to ensure the real time communication.
VI. Testing
The array of sensors showed promising results concerning the detection of hanging objects. In addition, the infrared proximity sensor gave accurate readings in detecting stairs and holes facing the cane.
A real-time connection between the mobile phone and the cane through RFCOMM Bluetooth was established without any noticeable delays.
Communication between the phone and the server adheres to the time constraints needed for the project, contingent to the speed of the internet connection on the client side. Any delay of messages between the server and the mobile application is negligible.
VII. Conclusion & Future Works
We consider this research to be a shift from the ordinary methods of detecting obstacles towards the technology of Internet of Things. The methods of detection that are proposed in this paper are reliable,
real time, and of low cost relative to the technologies available in the market.
Similar to all systems that depend on IoT, future research should be considerate of the security of the system proposed. In addition to security, more requirements (presented in Table 1) should be implemented. Some requirements, such as identifying building entrances and identifying traffic signals, are vital needs for visually impaired people that must be implemented in the future.
VIII. References
[1] “Blindness and Vision Impairment,” CDC, Atlanta, USA, February 2011. http://www.cdc.gov/healthcommunication/toolstemplates/entertainmented/tips/blindness.html [2] “Visual impairment and blindness,” WHO, 2014. http://www.who.int/mediacentre/factsheets/fs282/en/ [3] “Elimination of avoidable blindness,” WHO, Geneva, Switzerland, A56/26, April 2003. http://apps.who.int/gb/archive/pdf_files/WHA56/ea5626.pdf [4] A. A. Nada, M. A. Fakhr and A. F. Seddik, "Assistive infrared sensor based smart stick for blind people," Science and Information Conference (SAI), 2015, London, 2015, pp. 1149-1154. doi:10.1109/SAI.2015.7237289 [5] I. Ulrich and J. Borenstein, “The guidecane – applying mobile robot technologies to assist the visually impaired people,” IEEE Trans. Syst., Man Cybern., A: Syst. Hum., vol. 31, no. 2, pp. 131–136, Mar. 2001.

248
Temperature Control System for Residential Solar Water Heating Systems
Haytham Dbouk, Mohammad Ghamlouch, Rayan AlSayed Ali
Department of Electrical and Computer Engineering
American University of Beirut – Beirut, Lebanon
[email protected], [email protected], [email protected]
Abstract
The demand for solar water heating systems has increased significantly throughout the world considering that solar energy is a renewable source able to decrease the reliance on scarce resources. However, the over exposure of these solar water heating systems to sun radiations (especially during summer) has resulted in the overheating problem which reduces the unit lifespan, causes premature component failure, and reduces the system’s performance. This paper presents a design for a temperature control system that can reduce the overheating of residential solar water heating systems, thus protecting the unit. The system accounts for weather conditions and future household demand. The automated protection method controls any type or model of solar water heating systems, so that it can attain a safe desired temperature without influencing availability. The developed prototype is currently in the early stages of being tested on a real solar water heater.
I. Introduction
Even though solar heating systems are considered hi-tech systems, they are still facing serious problems which need further research and effort to be tackled. Overheating is the main problem which solar water heating systems experience. Overheating is due to the fact that most solar water heating systems produce about twice as much heat in the middle of summer in comparison with what they produce in mid-winter. System overheating can degrade heat transfer fluids, accelerate scaling, cause premature component failure, and reduce system performance. What we look for is a temperature control system that can reduce the overheating of residential solar water heating systems, thus protecting equipment and unit. This overheating protection would be implemented along weather forecasting and prediction of household’s future demand. That is, if the overheating protection control system predicts that tomorrow’s weather would be rainy, it would allow the solar water heating system, today, to reach a higher set point
temperature, so that hot water would be available for the household on both days. We aim to control any type or model of solar water heating systems so that it can attain a desired temperature limited by two set points that may change depending on the weather forecast and the prediction of demand the temperature control system does [2]. This would assure that the solar system would not overheat to an extent that threatens the equipment, components, and unit. Simultaneously, the household would be supplied enough hot water along any day, even if it is not sunny.
For the sake of protecting the solar system’s unit against overheating, an automated temperature control system is designed. The system should precisely determine the lower and higher temperature set points so that the solar system would not operate outside the safe temperature range. To the best of our knowledge whatever the model of the solar system is, our temperature control system can protect it against overheating without requiring any modification to the solar system or user intervention. Safety is highly considered in the system design, and it is accounted for in two senses: (1) the system isn’t harmful on any user who tries to access it, because it might be necessary to access the system for maintenance and this shouldn’t be harmful, and (2) the system is rigid enough so that it does not get damaged easily in the presence of strong winds.
Moreover, the designed temperature control system is considered reliable under different weather conditions and is expected to maximize its performance measure. This is accomplished by protecting the solar system and supplying the household with enough hot water simultaneously. For this purpose, two significant features were designed within this temperature control system, which are: (1) future weather prediction and (2) future household demand prediction. The temperature control system would use predicted future weather conditions and forecast future household demand and account for both when assigning the lower and higher temperature set points. Together, the predicted household demand and

249
forecasted future weather conditions are mapped through a fuzzy logic process to their appropriate temperature set points.
II. Literature review
Solar water heating systems are systems which captures sun radiations energy to heat water for households or companies [1]. Thus, the usage of solar water heater systems replaces the usage of natural gas, fossil fuels, or electricity with green, limitless, and free solar energy [1]. Solar water heaters are characterized by their high efficiency; because system collectors are able to absorb about 60% of solar radiations which reaches the roof where it is mounted [1]. In addition, since its invention solar water heater system has been used in various parts of the world; where it's domain of usage is rapidly increasing with the improvement of the technology beyond this system and the decrease of its cost [1]. In European Union, 13% of resources and emissions are saved by solar water heater systems [2]. Furthermore, solar water heating systems have various properties which make it preferable over other heating systems. Solar water heating systems uses a renewable energy source (solar radiations) causing reduction of electricity bills, thus taking advantage of new technology aspects with low maintenance costs.
Moreover, the challenge with using solar energy is that the sun is a highly variable power source. Thus, overheating of solar water heating system takes place when heat can no longer be dissipated because the maximum temperature is reached. Furthermore, overheating is likely to take place when we use the wrong system type or tilt to shallow or when lifestyle and load changes that is when you for example go for a vacation or simply reduces hot water usage [7]. In summer time water in the collector can easily approach boiling point which can cause excessive pressure and can damage the lines connected to water tanks from the collectors. Therefore, the temperature pressure relieve valve is not enough, since it can be easily damaged after successive overheating accidents and its damage is of big economic and technical cost. In addition, overheating is a series problem which can cause capacity overload for water tanks (leading to its damage), gas emanation, calcification, lowering the lifespan of the system, and high maintenance costs. All these drawbacks are secondary to the main safety concern of high water temperatures. Hence, several overheat protection methods have been implemented to solve the overheating problem. For instance, drain-back system is a method which imposes differential control with high limit function is actuated when the storage tank sensor reaches the set point. At this point, the solar collector loop pump shuts off causing the water to be drained [3]. This method has two major drawbacks: (1) the fact that it
requires redesigning of the active solar water heating systems, and (2) the fact that it is not efficient due to the waste of water it causes when it drains overheated water out of the system. Steam-back is another existing method where the pump switches off automatically, whenever the water tank reaches its maximum temperature. Once the water in the collectors starts boiling, the collector is fill with steam and all the liquid water is pushed down into the expansion tank [4]. However, this method does not protect the collectors from the very high temperature, and thereby the lifespan of the system will decrease continuously. Heat dump is another existing method where a package automatically activates when the storage tank exceeds a certain high limit temperature: a circular pump in the heat dump works on pouring the excess heat into the atmosphere using a copper coil as a heat exchanger, allowing cooler water to flow into the collector loop [3]. Nevertheless, this installed package is a secondary loop plumped into the primary collector loop, so few connections to the storage tank are made. Hence, this solution requires some modifications to the existing solar system. Controller vacation mode is another existing method where a vacation mode that is present only in some controllers monitors the temperature of the storage tank by turning on the pump at night to dump excess heat through the collector [3]. But, this method of protection is well workable only with flat-plate collectors and not with evacuated tubes that have irreversible heat pipe cycles. Hence, this protection method does not work with all types and models of solar water heating systems. Pump cycling is another existing method where the water temperature can increase to a pre-determined danger setting to increase convective heat loss [5], after the pump is stopped due to the tank’s high temperature. As soon as reaching the danger point, the pump cycles turn on to carry the heat to the tank. Heat-safe collector is a patented overheat-protection mechanism which allows excess hot air to vent, preventing overheating and the damage it can cause to the collector and fluid [6]. However, this solution causes a big waste of water. Automatic Solution is another existing method where water with high temperature moves into a finned tube radiator where the dissipation of heat into the outside air happens. After cooling, the water that entered the reservoir is reintroduced to the system [3]. This is similar to an automobile coolant reservoir [3]. Nevertheless, this cooling system will consume too much electricity, diminishing the purpose of installing a solar water heating system to reduce reliability on fossil fuel. Covering the collector is an easy, inexpensive method that is based on covering the solar water heating system manually by a cover, whenever it is overheated [3]. However, this method

250
needs a direct access to the solar system, which is dangerous on specific roofs (especially steeply pitched roofs) and under some weather conditions. Add to this that the solar system is covered manually, hence this protection method is not automated. Tilting is another existing method where the collector is tilted to latitude plus 15ᵒ. The higher the tilting angle is, the lower is the heat production [3]. Nevertheless, tilting differs between active (for tubes) and passive (for both tubes and tank) systems so it is highly dependent on the type or model of the solar water heating system. Check-Valve bypass is another existing method where a manual valve is placed in a bypass pipe in a way to stop the circulation of water in the collectors whenever the system overheats [3]. However, the valve implemented in this overheat protection method is manual, hence the temperature control system is not automated. Moreover, this method does not protect the collectors from over hot water, it only protects that storage tank. Pump shut-off at a pre-determined tank high limit temperature is another existing method where the pump shut off and don’t push water in the collectors when the temperature reaches a set point below the overheating limit [5]. Nevertheless, this method is not useful if the user didn’t use the hot water, so as the pump is off the water is still boiling in the collectors. Proprietary collector design is another existing method where passive vents open when the collector’s temperature hits a specific level, so that ambient air can enter the collector box limiting water heating and cooling the absorber by convection [3]. However, the temperature will drop slowly and this solution doesn’t protect the collectors. Pressure stagnation is another existing method where a higher pressure is in the collector glycol loop, which allows an increase in the water temperature and delays boiling at the same time [5]. Nevertheless, this doesn’t work in countries falling on the equator where the day is long and the sunlight is strong. III. Implementation
Thus upon an innovative temperature control system concept is implemented at three different levels: mechanical, electrical and software. The system was designed to fit “Deema 200” solar water heating system, taken as a sample for testing.
A. Mechanical implementation
This is the level at which the appropriate material needed for the accomplishment of the full system design are chosen. The full system design is built using the following materials:
Stand: the stand of the temperature control system is totally composed of galvanized steel. This material was chosen
based on a research done concerning the manufacturability of the system. The stand is composed of two rods, one of them is used as a shaft that allows the DC motor to control the shade placement, and the other is needed to identify the full covering/ uncovering of the solar water heater through accessing the corresponding limit switches. In addition to these rods, two pipes are used to allow the up/down movement of the shade to cover/uncover the solar water heater. Moreover, a case is also designed for the sake of protecting the shade when the solar water system is uncovered, and protecting the Arduino along with its power and control circuit. The temperature control system is combined and fixed over the solar water heater using screws and nuts.
Shade: an appropriate shade is used to cover/uncover the solar system and is capable of preventing 80-90% of the sun radiations upon covering the system.
DC motor: an appropriate DC motor capable of producing the necessary torque needed to spread and fold the fabric upon covering/uncovering of the solar water heater is used.
Arduino along with its power and control circuits: this is
the control unit of the temperature control system. It is composed of an arduino-uno along with its Ethernet shield, photovoltaic cell along with a rechargeable 9v battery, a voltage divider circuit (responsible for continuously feeding the Arduino microprocessor), and an Arduino control circuit ensuring feasibility of the temperature control system features (future weather prediction and demand prediction).
B. Electrical implementation
This is the circuit needed to ensure that the shade covers/uncovers the solar collectors, taking into consideration lower and upper temperature thresholds read by the NTC temperature sensor. Thus when temperature falls below the lower temperature threshold, the shade uncovers the collectors, and when temperature hits the higher temperature threshold, the shade covers the collectors. Figure 1 represents the full electric and control circuit.
Figure 1: Electric and Control Circuit

251
This electric and control circuit is composed of the following components:
6 Volts PV panel (used as the electric and control circuit’s power source).
5/6 Voltage divider using resistors (used because the Dc motor needs 6 v while the Arduino needs 5v).
4[2N2222 BJT] (used in the buildup of the H-bridge power divider circuit).
3 watts' rechargeable battery (used to continuously feed the Dc motor and the Arduino).
Arduino Ethernet shield/ Arduino Uno (used as the
control unit for the temperature control system, where the Arduino Ethernet shield is connected on top of the Arduino Uno, so that the sensors’ pins are directly connected to the shield’s input/output pins).
NTC temperature sensor (used for measuring solar water heater temperature).
2 push buttons (used to disconnect the DC motor from the power supply when the shade is completely closed/ opened. The two limit switches will set the output D1 or D2 to 0 if pressed).
C. Software implementation
This implementation level is the manufacturing step capable of generating the algorithms required for demand and future weather predictions. Moreover, the algorithms implementation is the part ensuring the automation and independence of the temperature control system due to the serious criterion of "learning" the system will have. Hence the software implementation process is composed of:
Future weather prediction:
Future weather conditions are classified into possible fuzzy sets, taking into consideration the domain of each variable weather condition. Weather conditions variables are: (1) today’s min-weather temperature, classified into three different domains ([-10, 15[, [15, 30[, [30, 45]), (2) today’s max-weather temperature, classified into three different domains ([-10, 15[, [15, 30[, [30, 45]), (3) today’s weather current state, classified into four discrete values ( sunny, rainy, snowy, cloudy), (4) tomorrow’s min-weather temperature, classified into three different domains ([-10, 15[, [15, 30[, [30, 45]), (5) tomorrow’s max-weather temperature, classified into three different domains ([-10, 15[, [15, 30[, [30, 45]), and (6) tomorrow’s weather current state, classified into four discrete values ( sunny, rainy, snowy, cloudy). Moreover, for the ease of decision and implementation and to avoid dealing with a huge
number of combinations, the processes of setting inference rules is accomplished using layering along with divide and concur techniques. That is, all possible combinations of today's weather conditions will be listed in the form of (today's min-weather temperature, today's max-weather temperature, today's weather current state) triplets and classified into the appropriate group; each group corresponding to one of the three values (low, medium, high) of today state variable. The same is done for tomorrow’s weather conditions to generate three values (low, medium, high) of tomorrow state variable.
Demand Prediction:
The system counts the number of sudden drops in temperature throughout the day and uses this frequency to update the running average of frequencies at the end of the day. The updated value of the average frequency will be used to predict the household demand on the same day one week later. This will be done through mapping the average frequency value to one of the following three states that describes demand. The three states are: (1) low demand, (2) medium demand, and (3) high demand.
All together, the demand state, today state and tomorrow state are mapped through a fuzzy logic process to the appropriate temperature set points. Figure 2 represents the implemented fuzzy logic controller.
Demand state, today state and tomorrow state are the fuzzy algorithm inputs; thus noticing the domains corresponding to today state, tomorrow state and demand conditions inputs along with their classification; all possible combinations of the input values are scattered into groups according to the ones which results in the same output values (the appropriate set points).
In addition, input possible combinations will be listed in the form of (today state, tomorrow state, demand state) triplets and classified into the appropriate group; each group corresponding to certain output.
Where appropriate temperature set points are classified into possible values each corresponding to a group of combinations. Thus within this state a certain type of membership function is developed over the output variables possible ranges resulting in the rules consisting the fuzzy algorithm. Moreover, the defuzzifized output consist of pairs of (lower set point, upper
Figure 2: Fuzzy controller composition
Where, F: Fuzzification, I: Inference rules and D: Defuzzification

252
set point) specifications for the opening/closing mechanism observing its dynamic environment.
Thus there exist 3 distinct pairs of resulting output each related to a group of input combinations through one of the fuzzy algorithm rules, these rules are:
Rule 1: If the input combination belongs to group 1, then the corresponding output pair is (70, 80).
Rule 2: If the input combination belongs to group 2, then the corresponding output pair is (50, 60).
Rule 3: If the input combination belongs to group 3, then the corresponding output pair is (40, 50).
IV. Experimental Results
After setting a detailed design schematic and listing all needed materials several levels of testing are required before establishing final prototype for the temperature control system.
A. Fabric testing
To verify the chosen design, we conducted several tests to quantify the fabric quality, efficiency compared to cost, and percentage of sun radiations preventing. Two tests were conducted to obtain the shading sunlight preventing percentage.
1) Test 1:
This test is conducted using LDR (light dependent resistor). First the LDR should be calibrated, where calibration is ensured when the LDR reads 0 Ω in total obscurity. Testing starts by placing a source of light at a fixed distance from the LDR it indicates 200 Ω; the fabric is then introduced in front of the LDR thus lowering the reading to 85 ohms.
Taking into consideration the linear relationship between resistance and the inverse of light intensity:
𝑅𝑅 = 500𝐿𝐿𝐿𝐿𝐿𝐿 (1)
where Lux is the light intensity, and R is the LDR read resistance, the percentage of light sunlight passing through the fabric was found to be:
% of sunlight passing the fabric = R with fabric / R without fabric = 80/200 = 40%. Thus % of sunlight reduction = 60%.
2) Test 2:
This test is conducted to assure the exact fabric sunlight preventing percentage. Thus the test uses the previously installed LDR which is connected in series with a 330 kohm resistor, and a 5V power supply.
By substituting equation (1) in the voltage divider equation, we arrive at the following relation:
Lux= 2500𝑉𝑉𝑜𝑜
−500
3.3 (2)
Moreover, the light source is placed at a certain fixed distance from the LDR then voltage across the LDR is measured before and after inserting the fabric. Results are:
VLDR1 = VLDR before inserting the fabric=1.05 V.
VLDR2 = VLDR after inserting the fabric= 1.5 V.
Thus, Lux1 = 569.98, Lux2 = 216.45, and hence % of reduction= 62.02%. Upon repeating this experiment for 5 iterations, percentages ranged between 57.8 and 62.02%. Thus fabric sunlight preventing is 60%. Figure 3 shows the circuit used for this test.
Figure 3: Test 2 circuit
B. Prototype Testing To accommodate the full system testing the first iteration prototype was designed and built to simulate real application conditions as accurate as possible. Thus several steps where followed to reach the required prototype before the testing, these steps are:
a- Fabric casing (this is series simulation of the required casing for fabric to resist various weather risks)
b- Adding a shaft for the DC motor c- Cascading the cascaded fabric along with the motor
with shaft part d- Manufacturing the needed tracks for the fabric to
rollup/roll down e- Putting all parts together
After designing the full prototype system testing was conducted, where the material used on the testing process are:
1) The manufactured prototype 2) A 10 v supply (a variable power supply was used to
supply the motor with 10 v and approximately 1 A, so that the motor is capable of rolling up/rolling down the fabric to cover/uncover the collectors).
Figure 4 shows the prototype testing environment.

253
Figure 4: Simulation where fabric is rolled down
C. NTC Sensor Testing The temperature and voltage of the NTC temperature sensor were recorded at different instants. The resulting set of data was then plotted on excel so that an explicit relation between temperature and voltage was established. Figure 5 represents the developed relation between the NTC voltage and the corresponding temperature.
This relationship is:
V=-42.84ln (T) +65.361 (3)
D. Full system Testing Figure 6 shows the finalized temperature control system mounted on “Deema 200” solar water heating system placed on RGB’s roof at AUB, taken as a sample for testing.
Figures 7 and 8 shows the results of the full system testing, collected between 19/8/2016 and 25/8/2016.
V. Conclusion and Future Work
The designed and implemented temperature control system is a 150-200 dollars' system capable of solving the problem that all solar water heating systems suffer from, the overheating problem. This would accomplish the aim of protecting residential solar systems reliably under different weather conditions without the need of accessing them. Once, the temperature control unit is installed, it will automatically protect the system (with accuracy of control ± 5 degree Celsius) even if household members aren’t present at home. What makes this temperature control system important, is that it apply the overheat protection along weather prediction and future household demand prediction. This protecting system is always aware of the solar water heating system’s temperature. Hence, once the solar system attains a dangerous temperature that threatens the unit, the temperature control system will automatically initiate protection without any user intervention. Future work in this problem will consider modeling the fuzzy logic algorithm inputs establishing a mathematical characterization capable of identifying the overall system. VI. Acknowledgements
This work is supported partially by “Dawtec” by MR. Wissam Daou ([email protected]) and by the American University of Beirut by Prof. Imad El-hajj ([email protected]).
VII. References
[1] M. Azzouzi, "Control of solar water heater design", Environment and Electrical Engineering (EEEIC),2011 10th International Conference on. Pages:1-5, DOI: 10.1109/EEEIC.2011.5874684. [2] S. Yousfi, "L'energie solaire en Algerie", Quotidien national El- Khabar, Algiers, 2007. [3] C. Marken,” Overcoming Overheating”, April 2011 [4] F. Mueller, “Steamback Shows Promise for Solar Water Overheating”, August 2011 [5] Solar rating and certification corporation, “Assessment of Overheat & Freeze Protection Mechanisms”, February 2013 [6] Enerworks solar heating and cooling, 'Enerworks’, [Online]. Available: http://enerworks.com/products/. [Accessed: 12-Sep-2015]
[7] F. Bautista, J. Aguilar, J. Ortega, F. Rivera, M. Gonzalez, M. El-Halwagi, “Optimal design of domestic of water heating solar systems", Clean Technologies and Environmental Policy, March 2015, Volume 17, Issue 3, pp 637-656.
Figure 6: Finalized full system design
Figure 7: Water temperature monitoring (50% covered collectors)
Figure 8: Water temperature monitoring (100% covered collectors)
Figure 5: Temperature as a function of NTC Voltage

254

255
DEPARTMENT OF MECHANICAL ENGINEERING

256
258 Theopile Abdallah, Anothony Al Haddad, Dalal Rik Al Bakhour, Omar El Alami
A Bio-Inspired Design of a Non-Pneumatic Tire
263 Ragheb Raad, Wassim Lababidi, Ola Baajour, Ali MansourA Computational Model for Tumor-Induced Angiogenesis
266 Ali Al-hadi KobaissyA Crystal Plasticity Based Model for Severe Plastic Deformation in FCC Metals
274 Lidia Al-Zoghbi, Ibrahim Assi, Hani Itani, Hussein DarirAutonomous Operation of a Robotic Cleaner of Structural Glass Facades
280 Ahmad KouraniContinuous Wave Simulation Setup for a Potential High-Resolution Wave Forecast for Lebanon
282 Fouad Abiad, Mohamad Omar Naja, Ibrahim El Bojairami, Mohamad Chehab, Rime Moustafa Design, Build, and Test Desiccant Cooled Ceiling for Latent Heat Removal in Space
285 Mohammad Ali FakihDetection and Assessment of Flaws in Friction Stir Welded AZ31B Magnesium Plates Using Lamb Waves
291 Khairallah Atwi Equilibration Timescales of Secondary Organic Aerosols Under Dry and Humid Conditions
297 Amane Abdel Samad Experimental Testing of a Novel PCM-Desiccant Packet for Use in Cooling Vests in Hot and Humid Conditions
303 Anthony Hadwan Fluid Structure Interaction Modeling of Human Coronary Arteries
307 Rayan Mouwafak, Ahmad Najia, Makram Imad, Amjad Kiwan High Impact Properties of Bio-Inspired Structures
312 Raja Serhal, Ghassan Atallah, Georges Khalil, Imad Shaer, Sebastian Ayoub Numerical and Experimental Investigation of Heat Transfer in Ovens
CONTENTMECHANICAL ENGINEERING

257
317 MohamadRachid,AmrYafi,WaficAriss,MohamadEzzedine Optimizing the AUB Supermileage Vehicle to Achieve Maximum Fuel Economy
323 Alain Sadaka, Rosalie Matta, Kathlyn Mouawad, Doaa Fayad Ruggedized PV Modules: Integration Within the Infrastructure
328 AdnanEl-Kawas,MohammadRaficCambris The Development of a 3D Printed Myoelectric Upper Limb Prosthesis
332 Marwa Traboulsi, Joanna Akl, Mohammad Tuqan, Zahi Ismail Using Harvested Rainwater to Generate Energy from Piezoelectric Transducers via an Intermediate Mechanism

258
A Bio-inspired Design of a Non-Pneumatic Tire
Anthony Al Haddad, Dalal Rek El Bakhour, Omar El Alami, Theophile Abdallah Mechanical Engineering Department
American University of Beirut Bliss, Beirut, Lebanon
[email protected], [email protected], [email protected], [email protected]
Non-pneumatic tires are tires with no air pressure inside them. Several companies have tried designing and manufacturing airless tires, however their designs are not yet implemented on real vehicles. Each design has faults which stand in the way. Non-pneumatic tires have several advantages which include withstanding high loads. Moreover, non-pneumatic tires can neither be deflated nor blown out. This results in much fewer maintenance and tire change required and in a much safer driving experience. Non-pneumatic tires have some disadvantages in terms of rolling resistance, weight and other constraints. The aim of this project is to design a bio-inspired non-pneumatic tire which could be mounted on vehicles. We have decided on a design, structure and materials which need further simulation and testing.
I. INTRODUCTION
A journalist from NBC news surveyed 2000 car owners and reported that 60% of the United States drivers can’t change a flat tire [1]. Most of them think that changing a tire or changing the oil of the car is a thing of the past. In case of accident, 50 % of the drivers would stop the car and call the insurance company for help. Another survey done in the United States alone reported that 7 tires punctures occur every second that would result in approximately 220 million flat tires per year. Global OEM which is a company that manufacture tire repair kits, showed that the number of run-flat tires in a certain population has increased in three years from 17% to 24.7%. The main reason behind this increase is that the car manufacturers companies are using cheap tires in their production [2]. Most of the car companies are trying to add advanced tire repair kits in all the new cars. They are even providing some cars with a tool that seal a punctured tire so that the user will not need to replace the entire tire [2].
For now, there is no pneumatic tire that does not require
maintenance. That is why, a non-pneumatic tire that does not need maintenance has to be available in the market to eliminate flat tires. Big tire companies like Michelin, Bridgestone, Goodyear and many more are currently trying to design a non-pneumatic tire. Michelin is the only company that was able to design in 2005 an airless wheel called “Tweel” that is available in the market. However, this non-pneumatic wheel was not designed for regular commercial cars. It was only designed for machinery cars for use on skid steer loaders that need a lot of stability and friction [3].
In addition to car tires, 10 million tons of bike tires are discarded every year [4]. Therefore, a company called “Tannus” [5] invented in 2012 an airless bicycle tire that never go flat. The tire is designed to last on average 5000 miles. The tire is made of polymers blends that gives resilience and durability. In addition to the problem discussed previously, the pneumatic tire needs to be changed with every season. For instance, during winter, the car needs tires that can provide better traction, more stability and better stopping power. However, during summer, the tires should have more rubber thickness in contact with the ground and the tread patterns should be specialized with less grooving [6]. Since the non-pneumatic tire is not supported by air pressure
The disadvantages of the non-pneumatic tire designed by the companies are that the tires have high rolling resistance, that is why they are only used for heavy equipment. Furthermore, the airless tire is heavier than the normal one so the rolling resistance is high in non-pneumatic tires.
In this project, we will design a bio-inspired non-pneumatic tire and try to reduce or eliminate if possible all the disadvantages that the companies are facing. Besides the challenge of comping up with the design, structure and material, we aim at designing a tire which could be mounted on a regular vehicle.
II. MATERIALS AND METHODS
A. Review of Literature The car companies that already studied and tried to
implement a non-pneumatic tire were reviewed. The structure of the tire, the material composition alongside the advantages and disadvantages of every tire were studied. The 7 companies reviewed were Bridgestone, Yokohama, Tannus, Michelin, Hankook, Goodyear, and Polaris.
Tires with different matrices structures were researched.
The honeycomb and spokes matrices were the two main matrices under study as well as the mountain goat horn matrix. The mountain goat horn can withstand extreme impact forces and last for a long period of time, so it was the matrix chosen to be implemented. The matrix consists of hard outer shell with soft porous material on the inside. The pores start with relatively large size and decrease on the microstructure. [1]

259
Figure 1: Horn porous structure
B. Design After reviewing the literature, details of the design were
discussed. The design needs to be capable of handling static and fatigue loading as well as impact. The outer layer of the tire will consist of rubber. The material after the rubber will be a stiff shear beam which will act as a shock absorber and will keep the structure intact and decrease deformation. It needs dissipate energy and attenuate a wave efficiently. Several ideas were researched to replace the rim such as having light weight material with pores which decrease in sized as the radius decreases, having springs, and using a honeycomb structure. Later it was discussed to use high density foam as an impact absorber and having the foam as very light material, the weight of the tire will decrease. Furthermore, foam acts as an elastic-plastic material and capable of regaining its shape after the load has been applied. If needed, a layer of aluminum with a honeycomb structure (to reduce material and still have a good compressive strength) might be added between the two layers of foam to provide additional stiffness. The material would be placed in radial layers inside the tire in place of air. The matrix of the tire will mainly include pores similar to the ones found in mountain goats where it has tough material from the outside and soft material in the inside.
C. Material Properties The material properties for the steel and aluminum can be
found in Table 1.
Table 1: Steel and Aluminum Material Properties
Material
Yield Tensile
Strength (MPa)
Ultimate Tensile
Strength (Mpa)
Elongation at
break
Modulus of
elasticity (Gpa)
Fatigue strength (Mpa)
Aluminum 6061-
T6 276 310
12 or 17 %
(depending on
thickness)
68.9 96.5
AISI Steel
Type 304 215 505 70% 193-200 241
Material
Fracture Toughness
(Mpa-m1/2)
Shear Modulus
(Gpa)
Brinell Hardness
Poisson's ratio
Thermal Conducti
vity (W/mK)
Aluminum 6061-
T6 29 26 95 0.33 167
AISI Steel
Type 304 228 81 123 0.29 16.2
As for the foam material, it was ordered from Divinycell, due
to financial capabilities, with material properties found in Figure X.
Figure 2: Foam Material Properties

260
D. Foam Testing
The Foam was subjected to force up to 1000KN with a constant strain of 0.025 mm. The sample was 20mm breadth, 50mm width.
E. Simulations Using Creo a preliminary design was simulated, the design
consisted of a steel layer and a foam layer. The parameters of the design, the thickness of each layer, will be decided by simulation but the total thickness will be constrained by the height of the rubber of the tire. Following that, using ABAQUS, simulations will be carried out to simulate the effect of the force on every layer individually followed by the entire tire assembled. The maximum force that might induce failure is the impact force. The impact force will be simulated to study the propagation of force in the materials as well as the material’s response under extreme loading. The tire will be subjected to dynamic loading for it is the type of loading the tire will be subjected to mainly in real
life. A Dynamic Implicit step will be used since our loads are cyclic and the internal forces need to be computed and be in equilibrium.
(Details about the force applied, and simulation details.)
F. Impact Tester
In order to validate our results, an impact tester will be used on a small sectional area of the tire. It consists of a plate having a mass of 14 kg. At the bottom of the machine the specimen will be placed, where under the specimen there’s an accelerometer that measures the stress wave through the foam and steel. After pressing the plate with the spring it travels a distance of 1 meter and then impacts the specimen.
III. RESULTS AND DISCUSSION A. FOAM SIMULATION
The foam was imported from Creo to Abaqus. An elastic low density foam was assigned to the model which has a density of 60 kg/m3. The elastic properties were taken from a paper in which they applied a compression test on the foam H60[7]. The young modulus was found to be 60 MPa and the Poisson’s ratio was 0.3. A pressure was applied on top of the foam with a value of 470 KPa to test the foam under compression. The bottom of the foam was fixed. Then a dynamic implicit step was applied on the foam with a time period of 20, an initial increment size of 0.001 with a minimum of 0.0002 and the load variation with time was ramp linearly over step. Finally, a mesh was applied on the foam. It was divided into 196640 elements. After running the test, the results presented in figure 3 and 4 showed the von-mises stresses. they show that the maximum stress is approximately 2.87e02 psi. As seen in the figure, the stresses are high in the second set of circles. This shows that the design of the foam is effective. It absorbs the shock and dissipates through the foam.
Figure 5: Von Misses Stresses at an early time period
Figure 6: Von Misses Stresses at a time period of 20 unit
020000400006000080000
100000
0 5 10 15 20 25
Forc
e (N
)
Displacement (mm)
Force vs. Displacement
Figure 3:Force vs Displacement diagram for the foam sample
0
20
40
60
80
0 0.2 0.4 0.6 0.8
True
Str
ess (
MPa
)
True Strain
True Stress vs. True Strain
Figure 4: True stress vs True strain diagram for the foam sample

261
The deformation of the foam was also found using Abaqus. Figure 5 shows that the deformation was high approximately 0.31 in at the top surface of the foam where the pressure is applied. The deformation decreased when moving down the foam. The second set of circles showed a deformation of 0.18 in and the third set of circles showed a maximum deformation of 0.052 in. This also confirm the effectiveness of the foam design which is mainly a good shock absorber.
Figure 7: Deformation of the foam
B- Steel Simulation The drawing of the steel was imported to Abaqus. A density of 8000 kg/m3 was assigned to the part. Elastic part: Young’s modulus= 196000 MPa, Poisson’s ratio=0.27. For the plastic part, the Johnson-Cook technique was used and the following properties were assigned: A=280, B=802.5, n=0.622, m=1, melting temperature 1673 K and transition temperature 1000 K. A load of 2000 KN was applied on the top of the steel and the bottom was fixed. A dynamic implicit step was used. In addition, an amplitude was added with these following values:
Time/Frequency Amplitude 1 0 0 2 2 1 3 4 0
Figure 8 & 9 show the Von Mises stresses and the deformation of the steel. The maximum deformation was around 9 mm and the maximum Von Mises stresses was approximately 7.965e+01 MPa.
Figure 8: Von Mises Stresses of Steel 304
Figure 9: Deformation of Steel 304
C- Assembly Simulation The next step was to assemble the steel, foam and rubber and to run a simulation on them as one model.
IV. CONCLUSION
The purpose of our project is to tackle the problems faced with pneumatic tires. We aim to deliver a non-pneumatic tire which is much safer than a pneumatic tire and requires less maintenance. Due to numerous accidents occurring each year due to tire blow out or punctures, we find it crucial to design a tire which doesn’t contain air. Moreover, time saving has become one of the most essential target for people during their daily life. For this reason, non-pneumatic tires are a must. For the remaining part of the semester, our main focus will be on simulations and testing of the design, structure and materials used for the non-pneumatic tire.
ACKNOWLEDGMENT
We would like to thank Dr. Mu’tasem Shehadeh for believing in this project and for giving us the chance to do it. With his expert advice and constant encouragement, we were able to overcome several obstacles and challenges which stood in our way. We would also like to give a special thanks to Dr. Ramsey Hamadeh for making it easy for us to accomplish this project through his lectures, clear deadlines and organized templates.
REFERENCES
[1] N. Spector, "America's Car Confidence," NBC News, 27
September 2016. [2] C. Reports, "Consumer Reports," 13 March 2015. [Online].
Available: http://www.consumerreports.org/cro/news/2015/03/what-brands-make-the-best-tires/index.htm. [Accessed 2016].

262
[3] Michelin Company, "Michelin: A better way forward," Michelin, 2016. [Online]. Available: http://www.michelin.com/eng.
[4] L. Bowman, "Say goodbye to punctures with these airless bike tyres that can never go flat," Metro Newspaper , 11 November 2016.
[5] Tannus Company, "Tannus: A revolution in cycling," 2016. [Online]. Available: http://www.tannus.com/.
[6] Bridgestone, "Summer Tires vs All-Season Tires," Bridgestone Tires, 2016.
[7] Tita, V., Francisco, M., Angelico, R. A., & Canto, R. B. (2012). Experimental Analysis of the Poly(vinyl Chloride) Foams Mechanical Anisotropic Behavior. Polymer Engineering and Science, 2654-2663.
[8] Keyan Wang, B. Eng (2016). Calibration of the Johnson-Cook failure parameters as the chip separation criterion in the modelling of the orthogonal metal cutting process. McMaster University, March 2016.

263
A Computational Model of Tumor-Induced Angiogenesis
Wassim Lababidi, Ragheb Raad, Ola Baajour, Ali Mansour
Department of Mechanical Engineering American University of Beirut
Hamra, Bliss Street, Beirut, Lebanon [email protected], [email protected]
Abstract— In cancer progression, a tumor grows to a point
where the oxygen and nutrients that it is receiving become insufficient for its survival. This tumor will therefore send signals to blood vessels that will stimulate the formation of new blood vessels from the pre-existing ones. Those new branches will subsequently migrate towards the tumor in order to provide it, through the blood circulation, with the oxygen and the nutrients it needs. This process is called angiogenesis. Angiogenesis is an essential step in the tumor’s transition from a benign state to a more dangerous malignant state. This paper uses a computational model to describe the process of tumor-induced angiogenesis by modelling the formation of the new vessel branches. The model would create a better understanding of the angiogenic process, and would provide experts with the ability to predict it and manipulate it, knowing that upon completion of angiogenesis, the patients’ survival rate drops dramatically. The results are achieved using the Cellular Potts model and a transient diffusion equation in 2D. The Cellular Potts model divides the domain into lattices and uses statistical mechanics and Monte Carlo methods to study the neighborhood of the cells’ lattices. The model is initiated before the activation of the cells’ migration and takes into account the effect of different matrix fibers. Keywords—cancer, angiogenesis, blood vessels, cellular Potts,
I. INTRODUCTION This paper discusses the development of a computational
model of tumor induced angiogenesis. Cancer refers to a malignant growth or tumor resulting from the division of abnormal cells with the ability to spread in any part of the body. This is known as metastasis, which refers to a tumor that has reached a level of sufficient growth and has connected itself to the rest of the body through networks known as vasculature. For this connection to occur, new blood vessels should be formed from preexisting ones in a process called angiogenesis. A computational model describing the tumor-induced angiogenesis will provide experts with a quantitative framework that will aid in a better understanding of the process, and how it can be hindered or controlled. This model will describe the diffusion, decay, and uptake of tumor secreted growth factors. It also incorporates the Cellular Potts Model, which describes the migration, growth, and division of the endothelial cells in addition to the migration’s effects on the extracellular matrix (ECM).
A. Tumor Induced Angiogenesis The formation and development of blood vessels can be
categorized into two processes: Vasculogenesis and Angiogenesis. Vasculogenesis is the development of a vascular
network from stem cells, it occurs primarily in the embryonic stage. Meanwhile, angiogenesis refers to the creation of new vascular networks from existing ones [1, 2]. The main role of Angiogenesis is in the adult life as a method of vascularization of hypoxic and other types of tissues. However, when the underlying control mechanism of angiogenesis is disrupted, it may become Toxic as in the cases of degenerative disorders.
Finally, angiogenic progression is a pivotal transition phase in the development of cancer where it marks the shift from benign solid tumor growth to a more progressive and potentially fatal stage of cancer beyond which cancer becomes extremely difficult to treat [3]. In order to be able to develop an accurate model of the process, a thorough understanding of the angiogenic process is required. Angiogenesis, which refers to the creation of new vascular pathways from already existing ones, can occur through two different types of processes: sprouting and splitting. For the purposes of this paper, and since tumor-induced angiogenesis is of a sprouting form, the emphasis will lie there. Sprouting Angiogenesis is triggered when tissue cells, deprived of oxygen and/or nutrients, mange to gather in their nuclei a threshold value of hypoxic growth factor (HIF-1). This leads to, and through selective binding to DNA, a regulation in the concentrations of various angiogenic growth factors including vascular endothelial growth factors (VEGFs) [4,5]. These VEGFs bind to receptors on the endothelial cells that form the external walls of neighboring blood vessels (capillaries) to simulate the loosening in their adhesive connections. The activated endothelial cells are then able to migrate chemotactically towards the hypoxic tissues. The activated endothelial cell is then called the tip cell. This tip cell then, through the production of enzymes, manages to degrade the basal lamina and the extracellular matrix allowing it to migrate. The specific extension of new vascular sprouts from one tip cell is allowed through different mechanisms in phenotypic differentiation of the ECs, namely tip cell selection and lateral inhibition. Tip cell selection occurs after the activation of VEGFR-2 receptors signaling a concentration of VEGF greater than the threshold value which leads to up-regulation of ligand D114[6]. D114 in turn activates Notch1 receptors on the neighboring cells, which down regulates their VEGFR-2 receptor expression. These cells assume the role of the stalk. Tip cells are often separated by one or two stalk cells. Throughout the angiogenic progression, tip cells drive through the extracellular space, due to their ability of producing degrading enzymes, while stalk cells sustain branch growth by continuous divisions along the direction perpendicular to the sprout

264
extension. The last phase of the angiogenic process includes the formation and adaptation of the capillary lumen, the formation of new perivascular ECM and the arrival of pericytes and sometimes of muscle cells [7]. Even though the fundamental processes that form angiogenesis are well established, there remains some ambiguity regarding the biochemical and biomechanical mechanisms that control the vascular development. This has led to the many efforts in experimental research on advancing the understanding of these mechanisms in hope of coming up with therapies for against angiogenesis. However, these experimental attempts developed some discordant data. A computational model would serve as a margin to which these results can be compared.
II. MATHEMATICAL MODEL This model is based on many hypotheses that account for
cellular behavior and biochemical cascades and they are as follows:
• The distinctions between veins and arteries are disregarded.
• Areas of the cell become hypoxic by simple dependence on the local partial pressure of oxygen.
• A hypoxic tissue naturally produces VEGF upon turning hypoxic, the modes of production of VEGF are disregarded
• VEGF activity induces a dose-dependent activation of the endothelial cells on the external walls of the vessels.
• Tip cell selection and stalk cell lateral inhibition are included without explicitly modelling the signaling pathways: each tip cell is separated by two stalk cells by default.
• The tip cell responds to VEGF by chemotactically moving while the stalk cells only proliferate to sustain the sprout growth.
• A tip cell can be a stalk cell and a stalk cell can be a tip cell the only identification is concentration dependent [13].
• Oxygen cannot flow through immature vasculature
III. DIFFUSION EQUATION As mentioned above, this model, incorporates simultaneous branching, and this occurs by activation of endothelial cells that are placed in the sprout along with other cells at the capillary level. Activation as mentioned above occurs when the concentration of digested VEGF-A inside the endothelial cell crosses a threshold value. In order to accomplish this the concentration of VEGF-A should be computed at every step at every point in the domain. Storing the concentration of digested VEGF-A along the way. In this model we use the equation governing the distribution of VEGF-A adopted by (Bauer et al.) given below: !"!#= 𝐷𝐷∇𝑉𝑉 𝑥𝑥, 𝑦𝑦, 𝑡𝑡 − 𝜆𝜆𝑉𝑉 𝑥𝑥, 𝑦𝑦, 𝑡𝑡 − 𝐵𝐵(𝑥𝑥, 𝑦𝑦, 𝑡𝑡) (1)
Where, V(x,y,t) is the concentration of VEGF-A at any point at a given time t, D is the diffusivity of VEGF-A within the extracellular matrix. Here, it is noteworthy to mention that since the extracellular matrix includes various components
that will be discussed later, this diffusivity coefficient is taken to be the weighted average of diffusivity in all constituents. 𝜆𝜆
is the rate of decay of VEGF-A and B is a function that incorporates production and absorption of VEGF-A.
Where 𝛽𝛽 denotes the concentration at a certain point at a certain time and V denotes the maximum internalization rate of an endothelial cell. This equation is solved via the Finite Volume method by imposing the following conditions are applied at the boundary: 1- V(x,y,0)=0 2- V(0,y,t)=0 3- !"
!#𝐿𝐿, 𝑦𝑦, 𝑡𝑡 = 𝑆𝑆
4- V(x,0,t)=V(x,L2,t) where L2 is the height of the domain. toolbar.
IV. CELLULAR POTTS MODEL In order to simulate cellular behavior, the Cellular Potts method is used. The cellular Potts Model (CPM) has become a common method of simulating cellular patterns. It describes cellular systems based on the assumptions that follow. (1) Cells are spatially extended but are internally structure-less. (2)Cells and associated fields are discretized onto a lattice. (3) It describes most cell behaviors and interactions in terms of an effective free energy E.\\ The Cellular Potts Model has been developed by Glazier and Graner (1992). It follows the assumption of the differential adhesion hypothesis (DAH), which has been mainly the work of Steinberg. The differential adhesion hypothesis states that cells can ergodically explore all possible configurations they can take, and will therefore choose the configuration that will minimize their free energy. This is similar to the second law of thermodynamics, where a system will pick the configuration that will minimize the free energy, and therefore maximize its entropy. The DAH has been proved mainly through experimental results. The VEGF flux is biasing the cells migration towards the tumor. The time evolution is divided into discrete steps of one hour. At each time step, an optimization problem is solved where the energy is minimized to its global minimum, and the configuration that is consistent with this energy is carried out to the next time step. This is similar to the bias that is created by a fan on air particles: as the fan is pushing the air towards a specific direction, the air will still try to reach the configuration that will maximize its entropy. In this model, the VEGF flux is assumed to bias the cells migration in slowly, allowing the cells to reach their equilibrium position at each time step.

265
The CPM divides the domain into square lattices, where each square is filled by a number that represents the type of body that is occupied by it, taking into consideration that a single body generally occupies more than one lattice. The model studies the interactions between the endothelial cells and their neighboring ECM constituents, which can be the interstitial fluid, tissue specific cells or matrix fibers. The domain could be thought of as a city, and the square lattices represent buildings, and the models tries to model the interactions between a building and its neighboring buildings. This interaction is modelled through the adhesion energy of the endothelial cells. After dividing the domain into lattices with n by n number of sites, each site is labeled by its integer x, this labeling is denoted as 𝜎𝜎(𝑥𝑥) Each site has a neighborhood of various neighbors each denoted as x’ and thus the neighbor is denoted by 𝜎𝜎(𝑥𝑥′) where the whole neighborhood is denoted by Ωx. The entire vascular cell is denoted by Σx where all cells have identical 𝜎𝜎(𝑥𝑥). A vascular cell can have 3 types 𝜏𝜏(Σx): (1) 𝜏𝜏= T denoting Tip cell type, (2) 𝜏𝜏= S denoting Stalk cell type and (3) 𝜏𝜏= Q denoting that it is neither. On the other hand, the tumor cell can have two types (1) 𝜏𝜏= H denoting hypoxic and (2) 𝜏𝜏= O denoting Oxygenated. It should be noted that, the lattices structure Σx will be defined as follows e,m,t,f = 1,2,3,4. The Algorithm used in CPM simulations is adapted from Metropolis algorithm, which is one of the simplest and most popular algorithm used in Monte Carlo simulations. The algorithm is as follows: 1- Randomly select a lattice site I. Call this site the candidate site. 2- Randomly select a site among the possible unlike neighboring sites. Call this the target value I? 3- Calculate the change in energy ΔE resulting in changing the site value from I to I’?. 4- Accept the site value modification with probability = min
(1,𝑒𝑒<=>? )
5- Increment the number of copy attempts a- If number of attempts less than the total number of
lattice sites go to step 1 b- Else, move in time
In the model, endothelial cells will move to promote stronger over weaker adhesive bonds, shorter over longer cell boundaries, and toward regions of higher chemical concentrations. Only endothelial cells are allowed to grow, move and invade. Where:
Where J is the adhesion energy between two sites, 𝛾𝛾 is the membrane elasticity corresponding to the cell of type 𝜏𝜏
,the term (as- 𝐴𝐴BC ) corresponds to the energy change due to the change in the system occurring due to the change of volume of the cell, where as corresponds the initial volume and the term 𝐴𝐴BC corresponds to the volume of the cell if the change is accepted. Finally. 𝜇𝜇 is < 0 and corresponds to the effective chemical potential where (x,y) and (x',y') are the locations of the candidate and target sites.
A. Model Domain and Geometries The space between the tumor and the vasculature is occupied by interstitial fluid, tissue specific cells and matrix fibers. Since the focus is on sprout formation and migration, the constituents of the extra-cellular matrix are accounted through the different amount of energy needed for the tip cell to break them down. It is important to mention that in reality different fibers need different amounts of energy to be broken down, that also applies to tissue specific cells. However, in this model, a single energy is assigned for all matrix fibers, and another for tissue specific cells. This might be modified later to obtain greater accuracy. Tissue specific cells are taken to be the same size of an endothelial cell, of 10 micrometers in diameter. The matrix fibers are of various sizes, so as a simplification and since they appear in bundles, each bundle is assumed to be of 0.3 micrometers in length and of a thickness (width) varying from 100 to 1000 nanometers. These bundles constitute 37 \% of the domain while tissue cells constitute 13$\%$. The matrix fibers are placed randomly in the extra-cellular matrix at randomly generated angle between 0 and 180 degrees. Tissue specific cells are also placed randomly. It is noteworthy that in this model, tissue cells can overlay with fibers, however this might be modified later. Experimental data suggests that the maximum distance between any hypoxic tissue and a neighboring vasculature is around 100 micrometers. thus by applying a factor of safety, the width of the domain was derived to be 165 micrometers, while the length was chosen to be 106 micrometers. Symmetry was utilized, since as mentioned above, the angiogenic process ends by the linking of various sprouts coming from neighboring vasculature. Hence the domain has the vasculature on one edge and the tumor at the other, this could be changed in the future.
V. DICUSSION
A. Progess The diffusion equation was solved using the finite volume
method and the tridiagonal matrix algorithm (TDMA). The domain is set and finalized. The coupling between the solution of the diffusion equation and the discrete model is currently at its final stages. The only remaining step is the successful implementation of the model and the code. Results will be incorporated in the project’s full paper. Domain pictures Attached at the end of the paper show Domain with certain constituents missing since the simulation will be run on each seperatly in order to observe the effects of these constituents by comparing the progression of the endothelial cell in each simulation.

266
B. Results The diffusion equation was solved using the tridiagonal
matrix algorithm. The lattices of the domain represented the discretization of the domain in space. The VEGF concentration was therefore found at each lattice. At the beginning, the concentration was solved in the x-direction, treating the y-direction components as constants. Then, the concentration was solved in the y-direction using the results achieved while solving the x-direction. While setting the domain, 37% of the ECM was filled randomly with extracellular matrix fibers. The architecture of the ECM can affect heavily the morphology of the created sprout.
C. Conclusion Angiogenesis is a crucial stage of cancer. Even though this
stage has been well studied, many of its backgrounds remain unsolved, like the coordination between the migration and proliferation of the endothelial cells, and the detailed role of growth factors in initiating the process. A cell-based model of this process was used in this paper to model the formation of the new vessel branches in 2D. The model followed the assumption of the differential adhesion hypothesis (DAH) which assumes that cells choose the configuration that will minimize their free energy.
The VEGF flux can affect heavily the sprout morphology, similarly to the extracellular matrix’s constituents. All of this shows the complex and dynamic nature of the tumor microenvironments where multiple interactions need to be accounted for. Future research can try to incorporate other growth factors that are also present during angiogenesis, like the platelet-derived growth factor (PDGF) and the basic fibroblast growth factor (bFGF), and see how will they affect the sprout morphology, the coordination between cell migration and proliferation, and the time for the full sprout to form.
D. Figures and Tables 1) Table 1 below shows the various parameter values
considered in both the continuous and discrete problems. These values have been mentioned above in the equations for calculating the Free Energy and the partial differentail equation governing the Concentration.
TABLE I. PARAMETERS TABLE
Fig. 1. Figure of Domain with all Constituents
Fig. 2. Figure of Domain without Tissue Specific Cells

267
Fig. 3. Figure of Domain without Matrix Fibers
Fig. 4. Figure of Domain with only Interstitial Fluid
ACKNOWLEDGMENT The team would like to thank Dr. Fadl Moukalled, Dr. Jihad
Touma, Dr. Diana Jaalouk, Dr. Dohna Schnobi, Ms. Selina Sfeir and Mr. Iyad Fayssal for assisting them during their project.
REFERENCES [1] K. Bentley, C.A. Franco, A. Philippides, R. Blanco, M. Dierkes, V.
Gebala, F. Stanchi, M. Jones, I.M. Aspalter, G. Cagna, S. Weström, L. Claesson-Welsh, D. Vestweber, H. Gerhardt, The role of differential VE-cadherin dynamics in cell rearrangement during angiogenesis, Nat. Cell Biol. 16 (2014) 309–321. \\
[2] F. Bussolino, M. Arese, E. Audero, E. Giraudo, S. Marchio, S. Mitola, L. Primo, G. Serini, Biological aspects in tumor angiogenesis, in: L. Preziosi (Ed.), Cancer Modeling and Simulation, Mathematical Biology and Medicine Sciences, Chapman and Hall, CRC, London, UK, 2003, pp. 1–16. \\
[3] A. L. Bauer, T. L. Jackson, and Y. Jiang, "A cell-based model exhibiting branching and anastomosis during tumor-induced Angiogenesis," Biophysical Journal, vol. 92, no. 9, pp. 3105–3121, May 2007.\\
[4] F. de Smet, I. Segura, K. de Bock, P.J. Hohensinner, P. Carmeliet, Mechanisms of vessel branching: filopodia on endothelial tip cells lead the way, Arterioscler. Thromb. Vasc. Biol. 29 (2009) 639–649. \\
[5] C. Gaudet, W.A. Marganski, S. Kim, C.T. Brown, V. Gunderia, M. Dembo J.Y. Wong, Influence of type I collagen surface density on fibroblast spreading, motility, and contractility, Biophys. J. 85 (2003) 3329–3335. \\
[6] Z.J. Liu, T. Shirakawa, Y. Li, A. Soma, M. Oka, G.P. Dotto, R.M. Fairman, O. C. Velazquez, M. Herlyn, Regulation of Notch1 and Dll4 by vascular endothelial growth factor in arterial endothelial cells: implications for modulating arteriogenesis and angiogenesis, Mol. Cell Biol. 23 (2003) 14–25. \\
[7] M. Scianna, E. Bassino, and L. Munaron, "A cellular Potts model analyzing differentiated cell behavior during in vivo vascularization of a hypoxic tissue," Computers in Biology and Medicine, vol. 63, pp. 143–156, Aug. 2015.\\
[8] M. Durand and E. Guesnet, "An efficient cellular Potts model algorithm that forbids cell fragmentation," Computer Physics Communications, vol. 208, pp. 54–63, Nov. 2016.\\

268
A Crystal Plasticity Based Model for Severe Plastic Deformation in FCC Metals
Ali Al-Hadi Kobaissy Mechanical Engineering Department
American University of Beirut Riyadh El-Solh, Beirut, Lebanon
Abstract:
One of the industrial processes that have been used to enhance the mechanical properties of metals is equal channel angular pressing (ECAP). In this process, a billet is subjected to severe plastic deformation (SPD) that leads to grain refinement and fragmentation. Understanding the process of grain fragmentation under such processes is of great importance in many engineering applications. In this work, a novel crystal plasticity (CP) based model is proposed to predict the mechanical response and microstructure evolution of a polycrystalline Aluminum subjected to ECAP. This model assumes that geometrically necessary dislocations (GNDs) are induced by grain boundaries that restrict the free deformation of a grain and result in an increase of stresses leading to the size reduction of the grain. In our model, each grain allowed to split into 256 new smaller grains which subsequently lead to grain size reduction and strain hardening. The grain refinement procedure is triggered when the misorientation threshold between subgrains is exceeded. Accordingly, a grain fragmentation scheme is implemented into a Taylor based polycrystal plasticity model coupled with the continuum dislocation dynamic (CDD) model. Furthermore, the model is applied to a reference volume element in which the grains are distributed and assigned a position. A parameter sensitivity study showed that the proposed model texture and grain size results exhibit a dependency on the position of the grains. The model parameters were identified on the tensile stress-strain response at different strain rates of an Aluminum.
Keywords: geometrically necessary dislocations, grain refinement, crystal plasticity, continuum dislocation dynamics, severe plastic deformation.
I. INTRODUCTION
Aluminum is one of the well-known materials that possesses outstanding mechanical properties such as good ductility, extrudability, and excellent corrosion resistance. It is involved in a wide range of applications in Aerospace and automotive industries to manufacture fuselages, wheels and other structural components [1]. Different methods can be utilized
to acquire the versatility of Aluminum properties: alloying and thermo-mechanical processes.
One of the essential thermo-mechanical processes that have been used widely to improve the mechanical properties of metals is equal channel angular pressing. In this process, a billet is pressed between two channels having equal cross sections and intersecting at a die angle ϕ. This billet is subjected to severe plastic deformation leading to grain refinement and texture development. By applying several passes of the ECAP process to the material, a large strain and high dislocation densities are attained. ECAP can control several properties such as texture strength, crystal orientations, and microstructure evolution through different parameters like the number of passes, deformation routes, and the presence of back pressure [2], [3]. A lot of studies have been conducted to analyze the influence of ECAP on texture and microstructural development in Aluminum [4]–[7]. Regarding the deformation mechanisms during ECAP, it is known that the dislocation slip mechanism is the dominant one at room temperature [8]. However, at high temperatures, several studies [9], [10] reported that nucleation of deformation bands and grain boundary sliding are the main deformation mechanisms.
Understanding the process of grain fragmentation during ECAP is of great importance in order to model such mechanisms. Various attempts to design the material microstructure and texture evolution with ECAP have been performed. Thus, several frameworks guided by crystal plasticity have modeled the process of grain refinement and studied the development of texture during ECAP. Crystal plasticity is one of the effective approaches that are used to tackle the problem of grain fragmentation during SPD. To understand the concepts of crystal plasticity, a detailed review is presented by Asaro [11] where the complex slip phenomena including localized plastic flow and non-uniform crystallographic texture were analyzed. A finite element analysis based on crystal plasticity carried out by Raabe et al. [12] concludes that the development of the

269
deformed crystallographic texture is dependent on the grain-grain interaction. Another study presented by Toth et al. [13] proposes a physically-based model reliant on the evolution of the lattice curvature. The model involves the contribution of geometrically necessary dislocations in the total dislocation density evolution which accommodate for the development of the lattice curvature. Another crystal plasticity-based model proposed by Kowalczyk-Gajewska and Frydrych [14] assumes that each grain can be divided into several grains after a threshold misorientation value is attained.
To better describe the effect of the grain size, strain-gradient theories are used instead, since the classical crystal plasticity theory does not take into consideration the internal length scale. These models developed by Zbib et al. [15], Fleck et al. [16], and Abu Al-Rub et al. [17] depend on dislocations as main contributors for material hardening. These dislocations are divided into two types; statistically stored dislocations (SSDs) or randomly trapped dislocations, and geometrically necessary dislocations or dislocations formed between grains.
The literature above lacks the consideration of crucial aspects of grain fragmentation since it does not take into account the influence of the grain position and the effect of its grain neighbors. In the current work, a novel model is proposed to simulate the ECAP process accounting for the effect of neighboring grains and the position of the grains. The proposed model uses the continuum dislocation dynamics model coupled with the crystal plasticity model and accounts for the GNDs accumulation near the grain boundaries. In order to homogenize the polycrystal, a Taylor scheme [18] is applied as a transition from the micro to the macro scale. Within the model, two states of deformations and stresses are calculated, one within the grain and the other at the boundary of the grain. A misorientation angle resulting from the difference of the two states leads to grain refinement when a threshold value is attained. As a result, the grain splits into smaller grains having new crystallographic orientation and new grain size.
The paper is organized as follows. After this brief introduction, the CP-CDD theory and the methodology of grain refinement are described in section 2. Then, in section 3, the model is used to investigate the mechanical behavior of Aluminum subjected to both tensile loading and ECAP.
II. METHODOLOGY
A. Crystal Plasticity-Continuum Dislocation Dynamic Model Crystal plasticity has been used to understand the microstructure of materials at different deformation modes such as tensile, compression and shear. Since the main
deformation mode in ECAP is described by simple shear as proposed by Segal [19], [20], the crystal plasticity model is adopted to model this mode at the micron scale. The polycrystal, by definition, is an aggregate of crystals where each crystal is represented by its grain size and its crystallographic orientation. To homogenize the polycrystal response, a Taylor scheme is used to average the stress response of all the grains. The crucial assumption of the Taylor scheme considered by Asaro and Needleman [21] is that all grains have equal volume and each grain has a homogenous local deformation gradient that is identical to the macroscopic deformation gradient. Thus, the constitutive equations can be written as:
( ) *( )
1
1 Nk k
k
T w TN
(1)
T is the volume averaged stress and N is the total number of crystals forming the polycrystal. *( )kT and ( )kw denote the Cauchy stress and the weight density in the kth grain respectively.
The stress in each grain can be calculated by
* . eT E (2)
where is the stiffness tensor and eE is the elastic Green-Lagrange deformation gradient.
To introduce the contribution of dislocations during plastic deformation, a CDD scheme is integrated into the CP model. The existing dislocations in the CDD model are of two types: mobile dislocations that move when the applied resolved shear stress overcomes their critical resolved shear stress, and immobile dislocations that play a critical role in the hardening mechanism. To describe the shearing rate as a function of dislocations, the Orowan [22] relation replaces the phenomenological power law of the shearing rate. The shear rate becomes:
s s sm gbv (3)
where 𝜌𝜌𝑚𝑚𝑠𝑠 is the mobile dislocation density in slip system “s”, b is the magnitude of the Burgers vector and 𝑣𝑣𝑔𝑔𝑠𝑠 is the dislocation glide velocity on system “s”.
Several mechanisms for the evolution of the dislocation densities are present such as the multiplication and the generation of mobile dislocations, the annihilation of two mobile dislocations, the transition from mobile to immobile and vice versa, the contribution of cross slip mechanism, etc…
The mobile and immobile evolution equations can be written as:

270
21 2 3
*4 5 6
2 ( )s s s s s s sm m g c m g m g
Nrs s s s s s s s
i g m g c m i g
v l R v v l
v l p v l R v
(4)
*3 4 6
rs s s s s s s s si m g i g c m i gv l v R v (5)
In equations (4) and (5), (𝛼𝛼1 − 𝛼𝛼6) are material parameters that can be obtained from discrete dislocation dynamics (DDD) [23], 𝑙𝑙 is the dislocation mean free path, Rc is the critical radius of annihilation, and 𝜏𝜏∗ is the threshold stress.
B. Grain fragmentation model To account for the grain size effect, GND densities are involved in the mean free path 𝑙. GNDs are dislocations that accommodate the lattice curvature. They contribute to the hardening behavior since they act as obstacles limiting the movement of dislocations [24].
In order to model the grain refinement process during ECAP, the influence of neighboring grains on the parent grain and the grain position are taken into account. During ECAP, smaller grains are usually reproduced with new orientations and new grain sizes. Under severe plastic deformations, the grain boundaries are affected by the presence of GNDs. In the model, two states of deformation gradients are calculated. First, we assume that the grains deform without any effect from their neighbors (free of GNDs) as in Fig.1 (a). However, in the second state, the influence of GNDs, i.e. the effect of grain neighbors, is considered as in Fig.1 (b). The difference in deformation gradients resulting from these two states leads to a misorientation between the subgrains located at the center of the grain and the subgrains located at the grain boundaries. When a threshold misorientation value is attained, the subgrains are considered as new grains having new grain sizes and new orientations.
III. RESULTS
A. Experiments and model parameters identification The parameters of the presented model have been identified by fitting the numerical results on the tensile loading response of an Aluminum 6061 performed by Texas A&M University laboratory at Qatar. The tensile tests are carried out at two different strain rates 10−4 𝑠𝑠−1 and 10−2 𝑠𝑠−1 at room temperature. The identified parameters have been used to simulate the ECAP process. The stress-strain curves of the experimental and modeling results are compared in Fig.2, and a good agreement in yielding and hardening regions is observed. Since the tensile tests are conducted at room
temperature, the stress-strain response shows very small strain rate sensitivity. Therefore, the strain rate sensitivity parameter is selected equal to 10−2.
B. Texture Since the mechanical properties of the material are dependent on the initial texture, the model needs to have the appropriate texture of the as-received Aluminum. This texture can be obtained either through X-Ray Diffraction (XRD) or Electron Back-Scattered Diffraction (EBSD). The XRD method provides the orientations of the grains in the Kocks form taking into consideration the weight factor of each orientation which represents the percentage of grains that have this orientation. However, the EBSD method is performed in order to find the Euler angles of the texture and the size of each grain. For our texture, it is found that the average initial grain size for the as-received material was about 82.5 microns while the texture is formed of 144 orientations in Kocks form. To study the evolution of texture after ECAP via route A, the model has been run to a shear strain of 100% to mimic the imposed strain of ECAP after one pass.
(a)
(b)
Figure 1. Stress and strain states (a) without including GND contribution and (b) with including GND contribution.

271
The initial and deformed textures are displayed in Fig 3. It is worth mentioning that the ideal texture orientations in ECAP can be related directly to those in simple shear, assuming that the shear plane is the plane of intersection of the two channels [19].
(a)
(b)
Figure 2. Stress vs. strain response for experiments and CP-CDD simulations for Aluminum at different strain rates (a) 10−2 𝑠𝑠−1 and (b) 10−4 𝑠𝑠−1.
(a)
(b)
Figure 3. Pole figures obtained from MTEX for (a) the initial texture, and (b) the predicted texture after deformation to the strain of 100%.
C. Effect of grain position After identifying the model parameters and knowing the texture of the material, several simulations are carried out to model the ECAP process. First of all, the effect of the grains’ positions during the ECAP process is studied. Two simulations having the same input texture, but with different grain distributions, are conducted. The results show that the grain refinement process is affected by the grain position as illustrated in Fig. 4. Fig 4 (a) represents the initial grid of the texture where each box denotes a certain orientation and has an initial dislocation density. As explained in section II, the grain tends to split according to its orientation, its neighboring grains’ orientations, and the GNDs located on the boundaries. When randomizing the distribution of the orientations, it is shown in Fig. 4 (b) and Fig 4 (c) that the rate of the refinement process varies and a difference of 350 grains (10% difference) is revealed. In addition, this effect can be explained by the existence of different grains on the parent grain’s boundaries which means that the GND contribution differs and affects the rotation of the grain boundary after deformation.
D. Effect of GND density A crucial parameter that can affect the fragmentation process is the GND density. This parameter hinders the grain boundary rotation, thus leading to a higher misorientation angle between subgrains. Hence, the probability for the grain to subdivide increases leading to a higher rate of refinement. To investigate this effect, two simulations are performed with (ρGND = 1014m−2) and without ( ρGND = 0) considering the effect of the GND. As can be seen in Fig. 5, the existence of GNDs results in an increase in the total dislocation density from 8*1e14 to 16*1e14 m−2. Similarly, both the mobile and the immobile dislocation densities are doubled. This means that a higher probability of grain fragmentation is associated with an increase in dislocation density. This may be attributed to the role of the SSDs in differently rotating the subgrains located at the grain’s center.
0
20
40
60
80
100
120
0 0.05 0.1 0.15 0.2 0.25
Stre
ss (M
Pa)
Strain
10e-2
experiement
modeling
0
20
40
60
80
100
0 0.05 0.1 0.15 0.2
Stre
ss (M
Pa)
Strain
10e-4
experiment
modeling

272
(a)
(b)
(c)
Figure 4. (a) Initial texture grid consisting of 144 grains, (b) grid with texture distribution 1 after deformation consisting of 4755 grains, (c) grid with texture distribution 2 after deformation consisting of 4395 grains.
(a)
(b)
Figure 5. Comparison of dislocation densities when 𝜌𝜌𝐺𝐺𝐺𝐺𝐺𝐺 = 0 (indexed by 1) and 𝜌𝜌𝐺𝐺𝐺𝐺𝐺𝐺 = 1014 𝑚𝑚−2 (indexed by 2) (a) immobile dislocation densities and geometrically necessary dislocation density (b) mobile and total densities.
IV. CONCLUSION
In this paper, we presented the framework of a model that combines the continuum dislocation dynamic and the Taylor polycrystal plasticity models. The model scheme accounts for the effect of the neighboring grains to calculate the misorientation between the subgrains. The model compares the orientation of subgrains located at the center of the grain that is supposed to be GND free, to the orientation of the subgrains located at the boundary. Furthermore, the resulting texture and average grain size are found to be dependent on the positions of the grains, as different grain arrangements result in different neighboring grains. To implement the deformation mechanisms induced by several plastic deformations as induced by ECAP, it is assumed that the grains are square-shaped and each grain can split up to 256 times. The results show that the model is able to predict the mechanical properties of the uniaxial tension experiments of Aluminum.
0
4E+13
8E+13
1.2E+14
1.6E+14
0 0.2 0.4 0.6 0.8 1 1.2
Den
sity
( /m
2)
Strain
Immobile1GND1Immobile2GND2
1.0E+12
4.0E+14
8.0E+14
1.2E+15
1.6E+15
2.0E+15
0 0.2 0.4 0.6 0.8 1 1.2
Den
sity
(/m2)
Strain
Total1Mobile1Total2Mobile2

273
ACKNOWLEDGMENT
The financial support provided by American University of Beirut and Qatar National Research Fund are gratefully acknowledged. The author gratefully appreciates Prof. Georges Ayoub and Prof. Mutasem Shehadeh for supporting and advising this research. Special thanks to Texas A&M University Laboratory for providing the experimental results of tensile and ECAP processes.
REFERENCES
[1] H. Agarwal, A. M. Gokhale, S. Graham, and M. F. Horstemeyer, “Void growth in 6061-aluminum alloy under triaxial stress state,” Mater. Sci. Eng. A, vol. 341, no. 1–2, pp. 35–42, 2003.
[2] I. J. Beyerlein and L. S. Tóth, “Texture evolution in equal-channel angular extrusion,” Prog. Mater. Sci., vol. 54, no. 4, pp. 427–510, 2009.
[3] Y. T. Zhu et al., “Producing bulk ultrafine-grained materials by severe plastic deformation . JOM Producing Bulk Ultrafine-Grained Materials by Severe Plastic Deformation,” no. APRIL, 2006.
[4] P. L. Sun, P. W. Kao, and C. P. Chang, “Effect of deformation route on microstructural development in aluminum processed by equal channel angular extrusion,” Metall. Mater. Trans. A, vol. 35, no. 4, pp. 1359–1368, 2003.
[5] W. Z. Han, Z. F. Zhang, S. D. Wu, and S. X. Li, “Response to comments on ‘Influences of crystallographic orientations on deformation mechanism and grain refinement of Al single crystals subjected to one-pass equal-channel angular pressing,’” Scr. Mater., vol. 59, no. 4, pp. 385–386, 2007.
[6] Y. Fukuda, K. Oh-ishi, M. Furukawa, Z. Horita, and T. G. Langdon, “Influence of crystal orientation on ECAP of aluminum single crystals,” Mater. Sci. Eng. A, vol. 420, no. 1–2, pp. 79–86, 2006.
[7] N. Q. Chinh, P. Szommer, T. Csanádi, and T. G. Langdon, “Flow processes at low temperatures in ultrafine-grained aluminum,” Mater. Sci. Eng. A, vol. 434, no. 1–2, pp. 326–334, 2006.
[8] H. J. Frost and M. F. Ashby, Deformation-mechanism maps, Pergamon Press, Oxford. 1982.
[9] I. Mazurina, T. Sakai, H. Miura, O. Sitdikov, and R. Kaibyshev, “Effect of deformation temperature on microstructure evolution in aluminum alloy 2219 during hot ECAP,” Mater. Sci. Eng. A, vol. 486, no. 1–2, pp. 662–671, 2008.
[10] U. Chakkingal and P. F. Thomson, “Development of microstructure and texture during high temperature equal channel angular extrusion of aluminium,” J. Mater. Process. Technol., vol. 117, no. 1–2, 2001.
[11] R. J. Asaro, “CRYSTAL PLASTICITY.,” J. Appl. Mech. Trans. ASME, vol. 50, no. 4 b, pp. 921–934, 1983.
[12] D. Raabe, Z. Zhao, and W. Mao, “On the dependence of in-grain subdivision and deformation texture of aluminum on grain interaction,” Acta Mater., vol. 50, no. 17, pp. 4379–4394, 2002.
[13] L. S. Tóth, Y. Estrin, R. Lapovok, and C. Gu, “A model of grain fragmentation based on lattice curvature,” Acta Mater., vol. 58, no. 5, pp. 1782–1794, 2010.
[14] K. Frydrych and K. Kowalczyk-Gajewska, “A three-scale crystal plasticity model accounting for grain refinement in fcc metals subjected to severe plastic deformations,” Mater. Sci. Eng. A, vol. 658, pp. 490–502, 2016.
[15] H. M. Zbib and E. C. Aifantis, “On the gradient-dependent theory of plasticity and shear banding,” Acta Mech., vol. 92, no. 1–4, pp. 209–225, 1992.
[16] N. A. Fleck and J. W. Hutchinson, Strain Gradient Plasticity, vol. 33, no. C. Elsevier Masson SAS, 1997.
[17] R. K. Abu Al-Rub and G. Z. Voyiadjis, “A physically based gradient plasticity theory,” Int. J. Plast., vol. 22, no. 4, pp. 654–684, 2006.
[18] G. I. Taylor, “Plastic Strain in Metals,” J. Inst. Met., vol. 62, pp. 307–324, 1938.
[19] V. M. Segal, “Materials processing by simple shear,” Mater. Sci. Eng. A, vol. 197, no. 2, pp. 157–164, 1995.
[20] V. M. Segal, “Equal channel angular extrusion : from macromechanics to structure formation,” Mater. Sci. Eng., vol. A271, pp. 322–333, 1999.
[21] R. J. Asaro and A. Needleman, “Overview no. 42 Texture development and strain hardening in rate dependent polycrystals,” Acta Metall., vol. 33, no. 6, pp. 923–953, 1985.
[22] E. Orowan, “Problems of plastic gliding,” Proc. Phys. Soc., vol. 52, no. 1, p. 8, 1940.
[23] D. Li, H. Zbib, X. Sun, and M. Khaleel, “Predicting plastic flow and irradiation hardening of iron single crystal with mechanism-based continuum dislocation dynamics,” Int. J. Plast., vol. 52, pp. 3–17, 2014.
[24] H. Gao and Y. Huang, “Geometrically necessary dislocation and size dependent plasticity,” Scr. mater., vol. 48, pp. 113–118, 2003.

274
Autonomous Operation of a Robotic Cleaner ofStructural Glass Facades
Hani Itani, Hussein Darir, Ibrahim Assi, Lidia Al-ZogbiDepartment of Mechanical Engineering
American University of BeirutBeirut, Lebanon
Email: [email protected], [email protected], [email protected], [email protected]
Abstract—Facade cleaning processes are still performed byworkers with minimal safety measures, if any, thus posing life-threatening risks. Several solutions have been proposed, includingautomated methods that perform the cleaning tasks safely andefficiently. Present solutions are either designed for continuousglass buildings or require prior equipment and preparationswhich make them building specific. A proof of concept of ageneral solution was demonstrated last year with Gravity 1.0.This year, an enhanced design is presented in which the majorflaws of the earlier design are addressed, and the autonomousmode is further investigated to be implemented. The robotadheres to the vertical glass panes or roof solar panels usingconfigured active suction cups designed to withstand lateralmovement while maintaining enough adhesion force. The cleaningis done while moving using an integrated two-staged cleaningsystem. The robot consists of two bodies connected with two rigidlinks that will allow it to overcome window frames or similarstructures between adjacent panels and move along the differentbuilding faces. Implementing autonomous operation requires thegeneration of a time optimal path for cleaning within the framesof a pane and transitioning from one pane to an adjacent one.A controller is devised for the robot to track the trajectory withthe robot location being the feedback. Therefore, a localizationmethod is used to keep track of the robot location for thecontroller to act accordingly.
I. INTRODUCTION
Using human labor to clean glass facades carries with itsignificant danger to workers lives. Since refraining fromcleaning the outer surfaces of skyscrapers is not suitable,using glass cleaning robots becomes a very attractive option.Indeed, considerable research has been conducted to developrobotic window cleaners. A robot based on vacuum suctionhas been developed, but having a single body, it can onlyclean continuous glass facades [1]. Other cleaning robotsmainly use roof installed cranes, which can be difficult toinstall especially when considering skyscrapers [2]. All currentrobotic cleaning systems lack any sort of mechanism that canhandle crossing edges or frames, which imposes limits ontheir applicability. Therefore, an innovative robot is proposed.The robot adheres to skyscraper glass panes or roof solarpanels and cleans them using brushes and water supplied froma roof station. After finishing from one pane or panel, therobot transitions to an adjacent one without interference withwindow frames or similar structures. It also has the ability tomove from one building face to another. The robot operation isautonomous with possible minimal human intervention only at
the beginning of the process. The robot consists of four mainsubsystems: adhesion, locomotion, cleaning, and transition.The adhesion to the facade is achieved using active vacuumsuction cups, where the vacuum pressure is provided by apump. The robot uses high grip wheels that provide thenecessary friction with glass surfaces for locomotion. Cleaningis done using brushes and water provided from a water tank. Awiper and a water suction mechanism are also included. To beable to cross edges between panels, the robot consists of twobodies connected by two links that can be actuated to raiseone of them. This mechanism allows the robot to overcomean edge one body at a time.
II. ADHESION SUBSYSTEM
A. Overview
The adhesion to the panel surface was achieved using activesuction cups powered by a vacuum pump. Suction cups areconical shaped compartments made of flexible rubber witha sealing lip at the bottom, and a profile that allows forlateral movement. Adhesion is produced as a result of apressure gradient ∆P between the atmospheric pressure Patm
and the pressure inside the cup’s sealed compartment Pcomp
(kPa). A thin film of air at the surface contact allows airinto the compartment, while the low pressure is maintainedby continuously pumping the air out of the compartment ata rate that maintains a constant pressure gradient. The robotconsists of two bodies, each with six suction cups. The cupswere arranged to provide the largest foot print constrainedwith the dimensions of each body (Fig 1.B) This allows for auniform distribution of adhesion power over the robot’s lengthand width.
B. Specifications and Calculations
The adhesion provided by one body should be able tothe mass of both bodies in both the horizontal and verticalconfigurations. To determine the value of the pressure gradient,the following equations were considered:
ΣF = fcups + fwheels −m× g = 0 (1)
NAllCupsµcup +NAllWheelsµwheel = m× g
Fvacuum = NAllCups +NAllWheels = ∆P ×Aeff (2)

275
Where f is the friction force (N), N is the normal forcecomponent (N), Fvacuum is the force of adhesion (N), m isthe mass of the robot (20kg), g is the gravitational acceleration(9.81m/s2) and µ is the static friction coefficients taken onwet glass µwheel = 0.4, and µcup = 0.1. Aeff is the effectivecircular area sealed by inner radius (rinner = 3cm) of the cup(m2), and Kcups is the number of cups per body (Kcups = 6).Since the modulus of elasticity of the wheels is much less thanthat of the cups, it is safe to assume that the major normal forcewill be taken by the wheels with a factor of five (NAllWheels =5×NAllCups).
Respectively, equations (1) and (2) reduce to:
NAllCups =m× g
5× µwheel + µcup≈ 93.5N
∆P =6×NAllCups
KcupsAeff≈ 33.1KPa
A factor of safety ε = 1.5 is introduced to the obtainedpressure gradient, and a value of ∆P = 50KPa is used forwhich NAllCups = 141.5N .
C. Further Considerations
The vacuum pump is connected to a pressure gradientregulator that allows its variation as needed. The regulator isfollowed by a solenoid valve that branches the input into twooutputs that are, in turn, connected to the two separate bodies.A solenoid valve acts as a switch to disconnect the pressureon each of the two bodies when transition is required. Thecups are then connected to each other in a circuit of tubes andconnectors to ensure a confined volume. Once the pressuregradient at the main node of one body is achieved, all othernodes of each cup in that specific body will follow. At thesame time, if the pressure gradient was lost at any of the cupsdue to loss of contact, the pressure gradient will then be lost atall nodes. To solve this problem, check valves were mountedat each cup node. Check valves allow flow in one direction,so any air flow from a node out of a cup is blocked (1.A).
Fig. 1. Adhesion Subsystem of Gravity. A) Vacuum system connectionsincluding the pump, solenoid valve, and cup nodes B) Proposed vacuum cupsarrangement
III. LOCOMOTION SUBSYSTEM
A. Overview
The proposed locomotion subsystem is wheel based, whereeach body has six rubber treaded wheels. The robot is drivenusing four geared motors, where each side of a body isactuated separately. Each wheel has a sprocket that is in meshwith the driving motor using a chain as shown in figure 2. Themain consideration when addressing the locomotion subsystemwas achieving a high enough grip to move while maintainingadhesion. As mentioned earlier, the friction of the cups andthe wheels is proportional to the adhesion force as shown in(2) that is in terms of ∆P , meaning that a very high pressuregradient might stall the motors.
Fig. 2. CAD drawing of the locomotion subsystem, showing wheels andmotors configuration
B. Specifications and Calculations
The calculations of the locomotion motors were done as-suming the robot is moving upwards along a vertical surface.All other configurations are less challenging in terms oflocomotion power. The maximum acceleration for the robotwas set to be aMAX = 0.5m/s2. NAllCups is calculatedtaking the pressure gradient calculated earlier including theassumed safety factor (∆P = 50KPa,NAllCups = 141.5N).The same NAllCups was used because it assumes the mostchallenging operation conditions. A single body should be ableto move both bodies in terms of locomotion power to accountfor the transition action.
ΣF = Ftraction − 2× fcups −mg = maMAX (3)
Ftraction = 2×NAllCupsµcupMAX +m(g+aMAX) = 376N
τmotion =Ftractionrw
2= 9.4N.m. (4)
Introducing a safety factor of 1.5, each motor should be ableto supply 14.1 N.m. No torque step up ratio will be introduceby design (one to one ratio).

276
C. Further Considerations
The wheels are initially not in contact with the ground.Upon suction action, the wheels touch the ground, but theamount of normal force on the wheels is dependent on theposition regulation of the suction cups. The position of thesuction cups and the amount of normal force needed for thewheels to grip to the glass were determined experimentallyduring implementation.
IV. TRANSITION SUBSYSTEM
A. Overview
The transition mechanism was designed to overcome theseparators between the adjacent panels. Additionally, themechanism was designed to be able to move across theadjacent faces of the same building. The mechanism is basedon one revolute joint extending over the width of the robot.It consists of two rigid links welded to a shaft supportedby bearings on both ends. This allows free and frictionlessrotation at a pivot point. The other ends of the links arerigidly attached to the second body. The shaft is driven bytwo mechanically synchronized high torque motors coupledwith a one to five sprocket ratio. The transition process isdemonstrated in figure 4.
Fig. 3. CAD drawing of the transition subsystem in action.
B. Specifications and Calculations
Overcoming a panel separator is done through a sequence offive steps repeated twice, one for each body, per one transitionoperation:
1) Disconnect the pressure gradient on one body2) Lift the body by actuating the shaft3) Move with the adhered body until the lifted body is
beyond the separator4) Lower the second until the cups become in contact with
the glass5) Connect back the pressure gradient
Calculations were done assuming transition is done on aplane horizontal surface on which the opposing torque atthe revolute will be due to the whole weight component.The distance dg between the pivot and the center of gravityof the lifted body will be considered constant dg = 0.4m.Practically, the moment arm dM is reduced as the body islifted at an angle θlift, from the horizontal, by a factor ofcos(θlift) (dM = dg cos(θlift). The arm is considered to be ofconstant length to be able to initiate the lifting action from thehorizontal, and account for the scenario in which the momentarm is increasing instead of decreasing (dM = dg = 0.4m)).Furthermore, the maximum acceleration of the lifting motionalift will be limited to 0.1m/s2 in the following calculations.
ΣM = 2× εstepτlift − dgmlifted × (g + alift) = 0 (5)
εstepτmotor =≈ 20N.m.
Where τlift is the torque supplied by one motor (N.m.), εstepis the torque step up ratio, and mlifted is the mass of thelifted body (mlifted = 10Kg). Introducing a safety factor of1.5 to the obtained value, the motors along after the step upfactor should be able to support 30 N.m. It is reasonable touse a sprocket ratio of εstep = 5, then the torque τmotor =6N.m.. When the robot is adhered to a vertical panel in thehorizontal configuration, no moment opposes the motors dueto the weight. Instead, the weight is opposed by the bearings’lateral reaction forces, while the acceleration contribution ofequation (5) remains.
C. Further Considerations
As mentioned earlier, the solenoid valve acts as a switchcontrolling the presence of suction action in each of the twobodies. Also one body should be able to support the massof both bodies in terms of adhesion and locomotion power.The lifted body will always be at the same angle of thelinks due to the rigid connection. This guarantees that allsuction cups are at the same level when lifting or lowering thebodies. Note that the whole sealing lip of the cup should bein contact with the goal surface to adhere. The chosen motorshave the self locking feature (worm gear based) that allowstransition at multiple angles depending on the height of thefacing separator. The revolute joint will be used mainly in thefirst and second quadrant angles (±90 deg). A full assemblyof the robot in transition mode is demonstrated in figure 4.
V. CLEANING SUBSYSTEM
The cleaning system consists of water sprinklers, brushes, awiper, and a water suction slit. The components are distributedamong the two bodies. The first step during cleaning isspraying water using the sprinklers assembled on the frontbody, where the water is provided by a roof station. Afterthat, the brushes scrub the wet glass facade. The brushes aremounted in a row along the width of the front body, and theyare driven by a motor using pulleys and a belt. On the secondbody, a suction slit collects the dirty water on the facade. Theslit is connected to a vacuum pump for suction, and a water

277
Fig. 4. Gravity, in transition mode, installed on one of Irani Oxys windows
separator is used to prevent the water from entering the pumpand damaging it. At the end, a mounted rubber wiper removesany remaining water.
VI. MATHEMATICAL MODELING
A. Motion Modeling
The motion model of the robot is derived based on that ofa differential drive robot that consists of two actuated drivingwheels and an all-direction castor wheel. The driving wheelsare actuated independently giving it the ability to steer. Thisassumption holds true for Gravity because wheels that arelocated on either side of the robot are actuated with a singlemotor as mentioned earlier. The castor wheel stabilizes therobot in a regular differential drive robot, and it does notimpose any kinematic constraint. Therefore it is safe to assumethat Gravity has two driving wheels with a point contact withthe surface and a coefficient of friction equivalent to thatof three regular wheels. Furthermore, the no slip conditionis used to further simplify the model. The validity of theseassumptions were re-visited upon implementation and testing.The linear velocity u and the angular velocity w in the robotframe are calculated as follows:[
uv
]=
[r2
r2
r2l
r2l
] [ψR
ψL
](6)
Where r is the radius of the wheel (r = 0.05m), l is equal tohalf the wheel base that is the distance between the wheelson the opposite sides of the robot (m), ψ is the angularvelocity of the wheel (R refers to right, L refers to left),and θ is the relative orientation of the robot frame relativeto the inertial frame. The following kinematic equations areintroduced from the non-holonomic constraints that impose nolateral movement along the axis of the wheels upon motion.
xy
θ
=
cos θ 0sin θ 00 1
[uw
](7)
The Euler-Lagrangian approach is used to model the motionof the system. It is based on using the kinetic and potentialenergies of the system referenced in the inertial frame.
L(q, q) = T (q, q)− U(q) (8)
d
dt(∂L
q)− ∂L
q= ui (9)
Where T is the sum of all linear and rotational kinetic energiesin the system and U is the summation of potential energiesas function of the state variables. ui are the external forcesperforming work on the system. In the presented model,ui corresponds to the torque supplied by the motors oneach side denoted by τR and τL. Note that equation (10)is independent of ψR and ψL which further simplifies themodel. The potential energy changes can be considered as stepdisturbance for the model of variable magnitude depending onthe altitude of the robot which simplifies the derivation of themodel.
L(ψR, ψL) = 0.5mRV2R + 3mW (V 2
RW + V 2LW )+ (10)
0.5IRθ2 + 3IW (ψR
2+ ψL
2)
Where mR is the mass of the robot, VR is the linear velocity,mw is the mass of one wheel. VRW and VLW are the linearvelocity of the wheels. IR and Iw are the moment of inertiaof the robot and wheels respectively. To apply equation (10),take the partial derivative of (11) with respect to ψR and ψL:
d
dt
∂L
ψR
= AψR +BψL = τR (11)
d
dt
∂L
ψL
= AψL +BψR = τL (12)
A = (r
2l)2IR +mR(
r
2)2 + 6IW + 6mW r2W
B = mR(r
2)2 − (
r
2l)2IR
Substituting the angular velocities with their robot frameequivalent velocities, solve for v and w:
ψR = lwr + v
r and ψL = − lwr + v
r
v =r
2(A+B)(τR + τL) (13)
w =r
2(A−B)× l(τR − τL) (14)
Introduce the model of a direct current (DC) motor to obtain2 more equations from the right and left motors:
U = Ldi
dt−Ri− Eemf (15)
ki =τki
and Eemf = kvψ
Where U is the voltage supplied to the motor, L is theinductance, R is the internal resistance, and Eemf is theinduced electromotive force (emf). ki and kv are the torqueand back emf constants.
dτ
dt=
kiLU − R
Lτ − kikv
Lψ (16)
Evaluating (16) for the right and left sides, the equations of˙τR and ˙τL are obtained:
˙τR =kiLUR − R
LτR − kikv
L(lw
r+
v
r) (17)

278
˙τL =kiLUL − R
LτL − kikv
L(− lw
r+
v
r) (18)
Finally, formulating equations (13,14,17,18) in a state spacerepresentation:
C1 = r2(A+B) and C2 = r
2l(A−B)
C3 = kikv
Lr and C4 = kikvlLr
vw˙τR˙τL
=
0 0 C1 C1
0 0 C2 C2
−C3 −C4 −RL 0
−C3 C4 0 −RL
vwτRτL
+
0 00 0ki
L 0
0 ki
L
[UR
UL
]
B. Link Modeling
To model the link dynamics, only regular operation sce-narios were considered. This includes a transition to adjacentpanels in horizontal manner and vertical downwards manners,each modeled separately. Note that the robot has to performlifting twice, once per each body, and the moment arm fromthe revolute to the center of gravity dCG is the same by design.Case 1, horizontally adjacent:
ΣM = 2× ετlift −mliftedd2CG × θlift = 0 (19)
dCG = dM cos θlift
Case 2, vertically adjacent, the moment due to weight isintroduced:
ΣM = 2× ετlift −mlifteddCG × (dCGθlift − g) = 0 (20)
dCG = dM sin θlift
DC motor model of equation (15) can be used to obtain arelation between τlift and θlift and , the angular velocity atwhich the body is being lifted.
VII. CONTROLLERS
A. Motion Controller
The motion controller is a path following tracker using areference trajectory. It is a time variant controller based onerror dynamics where the goal is to minimize or eliminate thedeviation from the desired planned path. The desired positioncoordinates are defined in the inertial frame as a functionof time[3,4]. One should take into account the response ofthe studied system to choose a proper sampling time. Thereference trajectory is defined as a sequence of coordinatesof small increments as function of time xr(t) and yr(t). Thedesired heading angle θ is then obtained by taking the localtangent at the current point on the trajectory computed as:
θ = ATAN2(xr, yr) + kπ (21)
Where k ∈ 0, 1 which defines the sign of the velocity inthe robot frame. k = 1 would result in a backward motion.Respectively, the reference linear and angular velocities aregenerated in the robot frame as:
vr = ±√x2 + y2 (22)
wr =yrxr − xryrx2 + y2
(23)
Note that if vr = 0, wr becomes undefined. It is alsoimportant that the desired paths are twice differentiable. Thetransformation from the robot frame coordinates to the inertialframe coordinates is given by a rotation matrix Rz,θ such that:
xyθ
= Rz,θ
xR
yRθR
=
cos θ − sin θ 0sin θ cos θ 00 0 1
xR
yRθR
(24)
The deviation from the desired path in the robot frame isdefined as a vector e that includes error components in x,y,and θ of the reference frame:
e =
e1e2e3
= RT
xr − xyr − yθr − θ
(25)
To arrive to the error dynamics, the derivative of each compo-nent of vector e is taken as a function of time, and the inertialvelocities are substituted by robot frame velocities using (25).A transformation is needed such that a linear system inerrors is obtained. The following non-linear transformation isintroduced
v = vr cos e3 − u1 (26)
w = wr − u2 (27)
The objective is to minimize the deviation error from the desirepath, along which error vector e and input vector u goes tozero. Note that the small angle approximation assumption isvalid given the slow variations in coordinates that also dependon the chosen sampling time. The system is then reduced toa linear state space representation in terms of error dynamics:e1e2e3
=
0 wr(t) 0−wr(t) 0 vr(t)
0 0 0
e1e2e3
+
1 00 00 1
[u1
u2
]
A linear state feedback controller is then proposed in literature[2,3] in which:
u1 = −k1e1 (28)
u2 = −sign(vr)k2e2 − k3e3 (29)
Where k1, k2, and k3 are the controller gains selected soas to satisfy desired specifications related to the robustnessof the controller and its transient response. This is doneby comparing the closed loop characteristic equation to thedesired one. Note that the proposed controller is time variantand depends on vr(t) and wr(t). When one body is lifted,the model structure would still be the same, but with differentparameters.
B. Link ControllerThe link should be controlled to lift one body to a specific
height at a certain angular velocity. Feedback for the controlleris obtained through an ultrasonic sensor pointing towardsthe surface. This distance can also be used to measure theelevated lift angle by noting that dlift = dCG sin θ. The link iscontrolled through a time based sequence of controls obtainedfor the different separator dimensions.

279
VIII. AUTONOMOUS OPERATION
A. Path Planning
A coverage path planning algorithm was developed toensure that all glass panels on all sides of the building arecleaned. It is more efficient to perform the cleaning processin a downwards manner to minimize the number of times therobot has to move against its weight. For cleaning purposes,the U-shaped pattern was found to be the best option in termsof time and power efficiency. The pattern starts at the topcorner and proceeds to a lower corner through a sequenceof shifted horizontal passes. The pattern is generated basedon user defined parameters that include the dimensions ofthe building, the dimensions of one single panel, location ofthe separators, and the starting orientation of the robot (rightto left, or left to right). The most common height of panelseparators was found to be around 5-8 cm. The aim is toclean each window panel separately and then cross to thehorizontally adjacent panel depending on its location. Anotherpossible scenario is to cross to the lower adjacent panelthrough a vertical transition cycle. The robot has to reinitializeits location relative to each panel to define a local frame ofcoordinates on the panel. Ideally, the origin of the system isone of the top corners depending on the starting orientationchosen. Only one path pattern is required if the buildinghas similar panel dimensions. The coverage path planning isgrid-based, and each grid corresponds to the dimensions ofthe robots front body with the brushes. An example of thegenerated path for regular panels is presented in figure 5.
Fig. 5. Path planning for regular window panels
B. Localization
In order for the robot to follow the desired generatedtrajectory, the location of the robot is tracked in real time.The location is used as a feedback to the controller for itto ensure proper path following. Within a single pane withframes, the location of the robot is determined using readingsfrom ultrasonic sensors on all sides of the robot that givethe distance between the robot and the pane edges. This isused along with readings of accelerations in the robot frameand the heading angle obtained from an inertial measurement
unit (IMU). Localization is based on generating a point-cloudof particles by spreading potential locations of the robot’scenter of gravity based on kinematics alone disregarding anyexternal disturbance that affects its motion. The probabilityof each potential particle is then evaluated given the readingsof the ultrasonic sensors. Particles with very low probabilitiesare eliminated, and the average of the most probable pointsis taken as the true location. Furthermore, a more reliablesystem would be on a global scale where the robot location isdetermined with respect to the whole building map. To achievethat, a robot navigation system is utilized. The system is basedon stationary beacons on the corners of a building face anda mobile receiver on the robot. The location of the robotis determined from the time between sending and receivingsignals between the stationary and mobile beacons.
IX. CONCLUSION
A glass facade cleaning robot has been developed. Thefunctionality of the robot was demonstrated on Irani OxyEngineering Complex in the American University of Beirut.Rather than just being able to clean a continuous facade, it alsohas the ability to cross over edges that are commonly used asseparators between glass panels. This is achieved using thetwo-body design that gives this robot greater potential andmore applicability than other robotic glass cleaners. The robotaims at making glass cleaning procedures safe, efficient, andautonomous. In the future, computer vision can be used forbetter navigation of the robot on building facades.
X. ACKNOWLEDGMENT
We would like to sincerely thank our advisor Dr. NaseemDaher for his continuous support and encouragement. Healways provided us with the needed motivation to drive thisproject to completion. We would also like to acknowledgethe efforts of Mr. Joseph Nassif and the machine shop staffmembers for providing us with their technical expertise in themanufacturing process of Gravity 2.0.
REFERENCES
[1] Y. Zhao, Z. Fu, Q. Cao, and Y. Wang, ”Developmentand applications of wall-climbing robots with a single suctioncup,” Robotica, vol. 22, pp. 643-648, 2004.
[2] Z.Y. Qian, Y.Z. Zhao, Z. Fu, and Q.X. Cao, ”Design andrealization of a non-actuated glass curtain wall-cleaning robotprototype with dual suction cups,” The International Journalof Advanced Manufacturing Technology, vol. 30, pp. 147-155,2006.
[3] Luca, Alessandro De, Giuseppe Oriolo, and MarilenaVendittelli. ”Control of Wheeled Mobile Robots: An Exper-imental Overview.” Ramsete Lecture Notes in Control andInformation Sciences (2001): 181-226. Web.
[4] Canudas de Wit C, Khennouf H, Samson C, Srdalen O J1993, Nonlinear Control Design for Mobile Robots. In: ZhengY F (ed) Recent Trends in Mobile Robots. World ScientificPublisher, pp 121-156.

280
Continuous Wave Simulation Setup for a Potential High-Resolution Wave Forecast for Lebanon
Ahmad Kourani Mechanical Engineering Department
American University of Beirut Bliss St., Ras Beirut, Beirut – Lebanon
Abstract-Wave forecast is an essential element in the marine
safety. Lebanon, with its wide marine interface still lacks a local wave simulation model that serves its real needs. This work summarizes the implementation procedure of a continuous parallel wave simulation setup at the American University of Beirut that makes it possible to perform local efficient wave simulations and forecast with universal data format.
I. KEYWORDS Simulation setup, Wave model, forecast, Lebanon, SWAN.
II. INTRODUCTION Wave forecast and wave energy assessment are of vital
importance for all marine and near-shore activities, such as marine navigation, fishing, and costal constructions.
Lebanon with its large marine interface and its diverse and still expanding marine activities, is still relying on foreign wave forecasts to predict the sea state for its water.
Wave forecast is available for the Eastern Mediterranean sea basin by means of simulation coupled with measurements from various sources like buoys and satellites [1]. Energy assessment for this region showed that the mean monthly wave power is relatively low but stable in summer season and peeks in winter. In general the variations of wave period is low. Zodiatis et al. in [2] found significant kurtosis values in the Eastern Mediterranean region, which indicates a higher impact of possible extreme values. This triggers the need for higher resolution studies, which is now possible using the high resolution bathymetric data provided by the National Council for Scientific Research (CNRS).
In a previous study at the American University of Beirut [3], a wave model for the Lebanese water was developed using unstructured grid and the Simulating WAves Nearshore (SWAN) software. Fig. 1 summarises the process of the wave simulation, which was performed with the SWAN third-generation wave model with unstructured grid applied. The important features in that study were the wave height, period, and direction. However, the model still needs to be improved for a continuous reliable outcome.
The aim of this work is to provide a complete continuous setup for a potential high resolution wave simulation of the Lebanese water, which is of a national interest in improving the wave forecast in Lebanon as well as the marine safety. This study is also vital for any wave energy harnessing project and useful for the potential oil exploration and extraction projects.
In this paper, the main steps for setting the softwares with the correct configurations to efficiently run the model on a multicore machine with support of the scientific data formats are described.
III. Fig. 1 Wave simulation process schematic
IV. METHODOLOGY Running a continuous wave simulation and forecast usually
requires a high computational effort. In addition the data used
and produced by the software should be universal. This fact requires a carful choice and use of the available computation recourses, and the appropriate softwares to manipulate the data and present it in the correct form. A. Computation Resources
A 64-core AMD machine with a speed of 1.4 MHz and 128Gb RAM is available. B. Softwares
The main wave simulation software is SWAN. It solves the spectral density equation over all the wet region of study. This software has the capability to be run in parallel on a distributed memory system, which makes the most use of the computational resource, though the use of the Message Passing Interface (MPI) is required. The SWAN software has two options for meshing: structured and unstructured meshes. A Structured mesh is relatively simpler to handle and decompose over all the available cores, but an unstructured

281
grid requires special pre-processing. For that purpose SWAN uses the infrastructure of the ADCIRC software, (a (parallel) ADvanced CIRCulation model for oceanic, coastal and estuarine waters), which is another fluidic simulation tool [4]. A special effort has been done to link the two softwares in coupled simulations.
The build of ADCIRC is more straightforward using an Intel compiler, so it was installed prior to the compilation of ADCIRC. However, since the available processor is AMD, a flag needs to be changed in the compilation process, namely the use of the -axSSE4.2 flag instead of -xSSE4.2.
Building ADCIRC includes two main executables: parcirc, and adcprep. The compilation of the first will produce the object files required for an parallel run, and the second will do the pre-processing for the unstructured mesh.
In the field of continuous scientific data, it is important to use an efficient and universal data format. SWAN can output its results in the Network Common Data Form (netCDF) data format, which is a famous data format in this field [5]. Although input data should be in a SWAN specific format, its generation from base netCDF file is simple using some MATLAB or Python scripting. Since SWAN is Fortran based, the netCDF Fortran libraries should be installed after installing its C libraries.
netCDF needs its own infrastructure too. Zlib and HDF5, which are also libraries concerned with data storing and management [6]. netCDF can also be built with HDF4 support, but it is recommended to use the upgraded HDF5version. HDF5 can be built in MPI, which increases the performance of files generation on a multi-core machine.
To give netCDF the ability to communicate with a remote machine, Curl lib should be available.
The final build of SWAN can be identified by parallel unstructured SWAN (punswan) with netCDF support.
Some directories should be added to PATH, and some variables need to be defined for the software to work in full capabilities. For this purpose, and since no root access was available for the remote machine, a bash file was created that will automatically perform these steps prior to the software use.
SWAN can also be installed without support of parallel unstructured mesh. The installation can then be simplified and the ADCIRC is excluded. To perform SWAN MPI compilation with the Intel compiler, the use of the mpiifort command should be forced in the SWAN Makefile, otherwise mpif90 compiler will be used, which is not compatible with the Intel Fortran compiler for MPI builds for the current release. The softwares required for the complete build are summarized in Table I.
TABLE I
SOFTWARES REQUIRED FOR THE COMPLETE BUILD OF SWAN Software Description
Parallel studio Intel Fortran compiler Curl DAP Zlib
Data management HDF5 netCDF-C
netCDF-Fortran PADCIC Parallel run for unstructured grid SWAN Wave simulation model
V. RESULTS For a structured parallel run on a distributed memory
system, the simulation can be executed by the following command:
./swanrun -input [filename] -mpi [n] where filename is the name the SWAN input file and n is
the maximum number of processor involved in the simulation. It is also important to specify the distribution of the job over the processors. For that purpose, MPI uses a machinefile where the nodes and the allocated processors are define, and in our case, using 52 cores over four nodes, while keeping 10 free cores, that file includes:
node1:13 node14:26 node27:39 node40:52
For an unstructured run, the simulation domain needs to be divided by running ADCPREP before executing SWAN.
REFERENCES [1] L. Cavaleri, “The wind and wave atlas of the Mediterranean Sea – the
calibration phase,” Advances in Geosciences, vol. 2, pp. 255-257, 2005. [2] G. Zodiatis, G. Galanis, A. Nikolaidis, C. Kalogeri, D. Hayes, G. C. Georgiou,
P. C. Chu and G. Kallos, “Wave energy potential in the Eastern Mediterranean Levantine Basin. An integrated 10-year study,” Renewable Energy, vol. 69, pp. 311-323, 2014.
[3] A. Kourani and M. Liermann, "Wave Simulation of Lebanese Near-Shore Region with SWAN and Unstructured Grid", in Proc. of the 3rd Asian Wave and Tidal Energy Conference, vol. 1, pp. 300-303, 2016
[4] "ADCIRC"[Online]. Available: www.adcirc.org [Accessed 20 March 2017] [5] "NetCDF"[Online]. Available www.unidata.ucar.edu/software/netcdf/
[Accessed 20 March 2017] [6] "The HDF Group"[Online]. Available: www.hdfgroup.org [Accessed 20 March
2017]

282
Design, Build, and Test Desiccant Cooled Ceiling for Latent Heat Removal in Space
Ibrahim El Bojairami, Fouad Abiad, Mohamda Omar Naja, Rime Moustafa, Mohamad Chehab1
Department of Mechanical Engineering American University of Beirut
Beirut, Lebanon [email protected], [email protected], [email protected], [email protected], [email protected]
Sponsors: European Commission and Lebanese National Council for Scientific Research as part of the ERANETMED Project
This project aims to experiment on and validate the model by Hout (2017) about liquid desiccant membrane system for humidity absorption and heat load removal from space.
In order to dehumidify a space, a salt-water solution is passed through a room ‘ceiling’, where the salt (calcium chloride) exhibits moisture-absorbing characteristics. The solution flows on a bed of five 20cm x 20 cm semi-permeable polypropylene membranes, which allow the absorption of water vapor into the solution through one side, and stop the solution from leaking out on the other.
These membranes are clasped together by a ceiling, which consists of a duct that isolates the solution from ambient conditions. The duct encasing negates the possibility of salt particle carryover into the ventilation system, which leads to corrosion, and into breathing air, which causes respiratory issues. Once the solution travels along the duct and absorbs moisture, the salt in it becomes less capable of absorbing anymore, requiring an additional regeneration step, where the solution is heated to lose the moisture it absorbed.
The experiment testing the liquid desiccant membrane system was operated during the month of March in Beirut, under laboratory conditions to emulate Hout’s model, which resulted in a 12% decrease in indoor relative humidity.
I. INTRODUCTION
Nowadays, as people spend roughly 90% of their time indoors [1], the use of HVAC systems is on the rise, leading to an increased energy consumption. With the development of cooling systems, artificial air took over most indoor space and as a result, HVAC systems now consume about 40% of the world’s energy usage [1]. In an attempt to offset this high consumption, our project comes into play, which consists of building, designing, and testing a desiccant cooled ceiling. The project revolves around two objectives: removing humidity and removing latent heat load from indoor space, to reduce energy consumption while maximizing thermal comfort.
A cooled/chilled ceiling, as its name suggests, consists of a chilled ceiling that is typically coupled with a displacement ventilation system, which increases heat load removal from space significantly, from 40 to 100 W/m2. Aside from this, a cooled ceiling has several advantages over a regular ceiling, namely thermal comfort, energy consumption, space saving, and noise reduction [2]. On the other hand,
dehumidifying a space eliminate discomfort, condensation, material damage, as well as reduces energy consumption.
This project merges the desiccating properties of salt to absorb humidity from space with the chilled ceiling/displacement ventilation combination, to achieve reduced energy consumption. For instance, compared to purely chilled ceiling setup, adding displacement to it increases the heat removal by 60 W/m2 [1]. Also, compared to conventional desiccant solution models which heat air to dehumidify it (before supplying into a room), then cool it so it enters the room cold, this model eliminates the cooling step and replaces it by inputting cold water instead. This model also saves up on heating as it will be heating absorbed moisture (i.e., using solar panels), rather than the entire airflow.
II. PROCEDURE
The experimental design consists of a unidirectional (not feedback) regeneration system containing the following main components: wind tunnel, humidifiers, manufactured duct, pump, cooling bath, initial tank, and regeneration tank. The duct and humidifiers are placed in the wind tunnel while the remaining components are placed outside. It is worth noting that 1) the wind tunnel was used as the experiment requires a counter-flow stream of air for satisfactory results and 2) the humidifiers, devices placed in the wind tunnel that convert distilled water into water vapor, were used to achieve the model’s ideal operating conditions. First, the desiccant solution, consisting of about 37.3% calcium chloride by mass (exactly 4.7 kg of salt and 7.9 kg distilled water), exits the initial tank, an insulated cuboidal-shaped tin box equipped with a mixing mechanism. With the aid of a pump to regulate the solution flow according to the model (7.2 L/m3), it circulates through a cooling bath where the solution is cooled down to a temperature in the range of 13-16oC, in order to achieve a cooled ceiling. Next, the solution circulates through the duct where temperature and humidity are tracked at ten and three different locations, respectively. From these, five thermocouples record the solution temperature, while the other five measure the temperature of the air incident on the membranes. This will enable us to better visualize the temperature and humidity variation profiles along the length

283
Design, Build, and Test Desiccant Cooled Ceiling for Latent Heat Removal in Space
Ibrahim El Bojairami, Fouad Abiad, Mohamda Omar Naja, Rime Moustafa, Mohamad Chehab1
Department of Mechanical Engineering American University of Beirut
Beirut, Lebanon [email protected], [email protected], [email protected], [email protected], [email protected]
Sponsors: European Commission and Lebanese National Council for Scientific Research as part of the ERANETMED Project
This project aims to experiment on and validate the model by Hout (2017) about liquid desiccant membrane system for humidity absorption and heat load removal from space.
In order to dehumidify a space, a salt-water solution is passed through a room ‘ceiling’, where the salt (calcium chloride) exhibits moisture-absorbing characteristics. The solution flows on a bed of five 20cm x 20 cm semi-permeable polypropylene membranes, which allow the absorption of water vapor into the solution through one side, and stop the solution from leaking out on the other.
These membranes are clasped together by a ceiling, which consists of a duct that isolates the solution from ambient conditions. The duct encasing negates the possibility of salt particle carryover into the ventilation system, which leads to corrosion, and into breathing air, which causes respiratory issues. Once the solution travels along the duct and absorbs moisture, the salt in it becomes less capable of absorbing anymore, requiring an additional regeneration step, where the solution is heated to lose the moisture it absorbed.
The experiment testing the liquid desiccant membrane system was operated during the month of March in Beirut, under laboratory conditions to emulate Hout’s model, which resulted in a 12% decrease in indoor relative humidity.
I. INTRODUCTION
Nowadays, as people spend roughly 90% of their time indoors [1], the use of HVAC systems is on the rise, leading to an increased energy consumption. With the development of cooling systems, artificial air took over most indoor space and as a result, HVAC systems now consume about 40% of the world’s energy usage [1]. In an attempt to offset this high consumption, our project comes into play, which consists of building, designing, and testing a desiccant cooled ceiling. The project revolves around two objectives: removing humidity and removing latent heat load from indoor space, to reduce energy consumption while maximizing thermal comfort.
A cooled/chilled ceiling, as its name suggests, consists of a chilled ceiling that is typically coupled with a displacement ventilation system, which increases heat load removal from space significantly, from 40 to 100 W/m2. Aside from this, a cooled ceiling has several advantages over a regular ceiling, namely thermal comfort, energy consumption, space saving, and noise reduction [2]. On the other hand,
dehumidifying a space eliminate discomfort, condensation, material damage, as well as reduces energy consumption.
This project merges the desiccating properties of salt to absorb humidity from space with the chilled ceiling/displacement ventilation combination, to achieve reduced energy consumption. For instance, compared to purely chilled ceiling setup, adding displacement to it increases the heat removal by 60 W/m2 [1]. Also, compared to conventional desiccant solution models which heat air to dehumidify it (before supplying into a room), then cool it so it enters the room cold, this model eliminates the cooling step and replaces it by inputting cold water instead. This model also saves up on heating as it will be heating absorbed moisture (i.e., using solar panels), rather than the entire airflow.
II. PROCEDURE
The experimental design consists of a unidirectional (not feedback) regeneration system containing the following main components: wind tunnel, humidifiers, manufactured duct, pump, cooling bath, initial tank, and regeneration tank. The duct and humidifiers are placed in the wind tunnel while the remaining components are placed outside. It is worth noting that 1) the wind tunnel was used as the experiment requires a counter-flow stream of air for satisfactory results and 2) the humidifiers, devices placed in the wind tunnel that convert distilled water into water vapor, were used to achieve the model’s ideal operating conditions. First, the desiccant solution, consisting of about 37.3% calcium chloride by mass (exactly 4.7 kg of salt and 7.9 kg distilled water), exits the initial tank, an insulated cuboidal-shaped tin box equipped with a mixing mechanism. With the aid of a pump to regulate the solution flow according to the model (7.2 L/m3), it circulates through a cooling bath where the solution is cooled down to a temperature in the range of 13-16oC, in order to achieve a cooled ceiling. Next, the solution circulates through the duct where temperature and humidity are tracked at ten and three different locations, respectively. From these, five thermocouples record the solution temperature, while the other five measure the temperature of the air incident on the membranes. This will enable us to better visualize the temperature and humidity variation profiles along the length
duct, to validate the initial model. The solution is then sent to a regeneration tank where the absorbed moisture is evaporated so the salt solution is able to absorb more vapor in the upcoming experiment runs.
III. MATERIALS
The duct design consists of a 20 cm x 102 cm x 2 cm hollow Plexiglas parallelepiped with its bottom side replaced by five consecutive membranes, where the solution will flow in this hollow cavity and air will be blowing from under the membranes. Baffles, placed sideways, were introduced to the duct for two reasons, the first is to inhibit and slow the solution flow to allow more time for the solution to absorb vapor, and the second is to fortify the membranes’ stability and to prevent their sag.
After countless attempts to achieve leakage-free conditions, the membranes were adhered to one another using black construction Silicone, the only material that does not harm the membranes and holds them tightly with no leakage, while epoxy resin was used to glue the membranes along the duct’s perimeter.
The initial, cooling, and regeneration tanks are all tin-made and wrapped by a layer of fiberglass insulation to minimize heat loses. The initial and regeneration tanks contain a mixing mechanism, made up of a rotating mixing arm and a motor to avoid frothing and salt deposition. The cooling bath contains a combination of ice cubes, ice packs, and cold water so that it cools the contents of the pipe that is immersed in this ice bath. It is worth noting that this cooling mechanism functions by conduction, where the bath box contents are weighing down on a pipe whose outer surface, now at a constant temperature, is cooling the solution flowing through the pipe through the established temperature gradient between the pipe’s surface temperature and solution flowing through. At the cooling bath’s exit is a thermocouple that measures the temperature of the exiting water, used to ensure that the solution temperature stays well within range.
IV. CONDITIONS AND IMPROVEMENTS
-The Polypropylene membranes are 20cm x 20cm square sheets, out of which we built the whole duct, proved to be quite cumbersome to handle in that size - The project’s aim is to be implemented in preferably hot and in coastal regions, where humidity levels are high. Despite trying to mimic such conditions, natural conditions are best. - In adherence to ASHRAE standards for human thermal comfort, a ventilation system is to be added in the wind tunnel with airflow speeds falling within the range of 0.12-0.2 m/s - Accurate measures of the total change in amount of added water are best done by titration (preferably HACH 8225 and 8226), to get the respective hardness levels for calcium and chloride.
Figure 1: Initial Tank and Pump
Figure 2: Humidifiers
Figure 3: Duct Top View with installed
Temperature sensors

284
Figure 4: Duct Bottom View
Figure 5: Regeneration Tank
V. CONCLUSION
In this experiment, the effectiveness of the membrane desiccant system was evaluated. Findings of the theoretical model agreed well to the experimental results. The experiment was operated over the course of two hours, which resulted in absorption of 360 ml of water vapor. Given that each of the three humidifiers converted 1000 ml of water to vapor, we get 360 / (1000 x 3) = 12% absorption of indoor relative humidity. From a chemical point of view, the concentration of the solution dropped from 37.3% to 4.7 / (7.9 + 4.7 + 0.36) = 36.3%, or a 1% decrease in calcium chloride concentration, to be verified by titration at a later stage. Given that the membranes proved to be an effective means to dehumidify air, further research is needed to optimize their performance.
ACKNOWLEDGMENT
The authors would like to thank Professors Nesreen Ghaddar and Kamel Ghali for
their cooperation and advisory The European Commission and Lebanese National
Council for Scientific Research for their generous sponsoring of this project
The AUB manufacturing shops for lending us their expertise and materials
The AUB mechanical offices for their continuous help in setups and providing us with tools
The AUB Environmental Lab personnel for their unwavering help in the chemical component of this project.
REFERENCES [1] A. Novoselac, S. Jelena, “A critical review on the performance and
design of combined cooled ceiling and displacement ventilation systems,” in Energy and Buildings, vol. 34, pp. 497-509, June 2002.
[2] X. Hao, G. Zhang, Y. Chen, S. Zou, J. Moschandreas “A combined system of chilled ceiling, displacement ventilation and desiccant dehumidification” in Building and Environment, vol. 42. pp. 3298-3309, September 2007.

285
Detection and assessment of flaws in friction stir welded AZ31B magnesium plates using Lamb waves Mohammad Ali Fakih a
a Department of Mechanical Engineering, American University of Beirut, Beirut, LEBANON; email: [email protected]
ABSTRACT Investigated is the ability of ultrasonic guided waves to detect flaws and assess the quality of friction stir welds (FSW). AZ31B magnesium plates were friction stir welded. While process parameters of spindle speed and tool feed were fixed, shoulder penetration depth was varied resulting in welds of varying quality. Ultrasonic waves were excited at different frequencies using piezoelectric wafers and the fundamental symmetric (S0) mode was selected to detect the flaws resulting from the welding process. The front of the first transmitted wave signal was used to capture the S0 mode. A damage index (DI) measure was defined based on the amplitude attenuation after wave interaction with the welded zone. Computed Tomography (CT) scanning was employed as a nondestructive testing (NDT) technique to assess the actual weld quality. Derived DI values were plotted against CT-derived flaw volume resulting in a perfectly linear fit. The proposed approach showed high sensitivity of the S0 mode to internal flaws within the weld. As such, this methodology bears great potential as a future predictive method for the evaluation of FSW weld quality. Keywords: Lamb waves, weld inspection, structural health monitoring, friction stir welding, CT scan, damage volume
1. INTRODUCTION Friction stir welding (FSW) is a novel solid state green welding process 1 invented by W. Thomas and his colleagues at The Welding Institute in the UK in 1991 2. It is being widely used in the automotive, aerospace, and naval industries. The welding process is carried out at a temperature below the melting points of the welded metals 3. The metal is thereby exposed to minimal heat, which leads to many advantages such as good steadiness of dimensions, control of weld quality, exceptional mechanical properties of the weld zone, reduction of porosity and solidification cracking, minimization of the need for surface cleaning, and reduction of environmental impact 1, 4. FSW is performed using a non-consumable rotating cylindrical tool whose pin is inserted into the adjacent edges of the sheets/plates to be joined, and it traverses along the line of the joint. The pin is slightly shorter than the required weld depth, and the tool’s shoulder is pushed down on the plates’ surfaces, causing a high frictional force while rotating. As a result, proper heating is provided to the workpiece and the flow of the material is ensured to produce the joint. The spindle speed and the tool feed both influence the quality of the produced weld, besides other variables such as the tool geometry, the tool materials, and the sheet materials. Inappropriate selection of welding parameters during the FSW process can cause one or several types of defects within the welded zone, such as worm holes, scalloping, ribbon flash, surface lack of fill, nugget collapse, and surface galling 5. Much research effort over the years has focused on improving the microstructure in FSW joints and optimizing the welding process 6-8. This optimization is crucial to reduce surface and internal defects and hence increase the integrity of the weld. Internal defects are usually difficult to detect, so that weld inspection requires the use of either destructive or advanced techniques. Moreover, monitoring the quality of welds is essential for detecting and correcting any variation in the weld conditions or for recalibrating the welding parameters when needed. Ultrasonic guided waves, especially Lamb waves, have been used as an efficient tool in structural health monitoring (SHM) systems to provide continuous monitoring of structures. They have seized researchers’ interests due to their ability to propagate for long distances in simple and complex curvatures. Over the last decades, the proficiency of Lamb waves has been proven, and they have been widely used to develop damage identification algorithms in composite and metallic plate-like structures 9-13. Santos et al. 14 investigated the ability of Lamb waves to assess FSW in aluminum plates and compared the results to weld qualities obtained through X-Ray and C-scan inspection methods. They used a pitch-catch configuration while the specimen was submerged in a water medium. The authors argued that their proposed technique is efficient in providing a qualitative classification of linear FSW in aluminum plates. On the other hand, the technique lacked the ability to detect miniature weld flaws. In a recent study, Delrue et al. 15 used an immersion setup and a pitch-catch technique to capture nonlinear features that were generated in the reflected signals due to FSW kissing bond defects. The authors used Fermat design transducers to focus and receive ultrasonic shear waves in aluminum welded plates. The signals were then analyzed using pulse inversion, and the results were validated numerically and experimentally. A Fermat surface of a transducer is the surface where the travel time of the wave is the same from any point on this surface to the point intended to be focused on; hence the Fermat transducer design depends on the tested material and its thickness. Further, the same authors 16 used an angle-beam technique for ultrasonic inspection of friction stir welded aluminum butt-joints, also in an immersion setup. After scanning the whole weld in the cross-sectional and longitudinal directions, they managed to detect and qualitatively identify the type and severity of root flaws by inspecting the backscattered energy from the underside of the weld. NDT techniques that require a structure to be totally immersed in water when inspection is needed lack the flexibility to be integrated in SHM systems that eventually aim to provide continuous monitoring. This study focuses on the development of a Lamb wave based method for weld inspection, with particular interest in friction stir welds. An assessment approach is proposed for assessing the quality of FSW in AZ31B magnesium alloy plates. Different weld qualities were achieved by varying the weld parameters, in this case the pin insertion depth. Later, Lamb waves were actuated and captured using PZT ceramics. A DI was calculated based on the amplitude attenuation of the wave’s first transmission after passing through the weld region in comparison to the non-welded plate. The resulting DIs were finally correlated with the actual damage volumes determined from the CT images of the plates.
2. EXPERIMENTAL SETUP Four plates of various weld qualities were produced by varying one of the FSW process parameters, i.e. the pin insertion depth, and a fifth non-welded plate was used for comparison. The material of the tested plates was AZ31B magnesium alloy. Each plate was 100

286
mm long, 100 mm wide, and 3 mm thick. All welds were accomplished with a turning speed of 1200 RPM and an advancing speed of 150 mm/hour, while the pin insertion depth was varied as listed in Table 1. The welded plates were randomly named as Plate 1 to Plate 4 and the non-welded plate was named as Plate 0. Two rectangular PZTs (PI Ceramics, Lederhose, Germany) of 20 mm x 5 mm x 1 mm dimensions, spaced 95 mm from each other (center to center), were mounted on either side of the weld on each of the tested specimens. One PZT wafer functioned as an actuator while the other served as a sensor. Controlling the position of the PZT wafers, the bond line, the wiring, and soldering to reduce the variation which may result from comparing signals captured from different plates, is important to improve the consistency in the results. Five sinusoidal cycles in a Hanning window, at frequencies of 150, 200, 250, 300, and 350 kHz, were generated at a sampling rate of 20 MSa/s, and fed into an amplifier using an arbitrary waveform generator (33500B Series Waveform Generator, Keysight Inc.). The signals were then amplified to 30 volts peak-to-peak using the amplifier (EPA-104 Linear Amplifier, Piezo Systems Inc.). A high-rate acquisition oscilloscope (InfiniiVision DSO-X 3024 Digital Storage Oscilloscope, Keysight Inc.) was employed to capture the wave signals from both the actuator and the sensor. Figure 1 shows a schematic of the used experimental setup.
Table 1. Specimens’ weld parameters.
Plate number Rotational Speed (RPM) Transversal Speed (mm/h) Pin Insertion (mm) 0 No weld No weld No weld 1 1200 150 2.75 2 1200 150 2.725 3 1200 150 2.85 4 1200 150 2.87
Figure 1. A schematic of the used experimental setup.
3. CT SCANS The five specimens were scanned using a high-resolution CT scanner (Philips Brilliance iCT 256) with a pixel size down to 0.335 mm. The CT images of the specimens were used to identify the imbedded defects through the welds and assess the weld qualities in the tested specimens. Further, a 3D model was constructed based on the CT images, that was used later for damage volume calculations as will be explained in section 4.3. It was recognized that the welded plates contained worm holes, but of different sizes and shapes. Figure 2 shows all the plates ordered according to their names. Each plate is shown in two cross-sectional views, one section perpendicular to the weld direction and in the middle of the plate where the PZTs were placed, and the other parallel to the surface of the plate and passing through the worm hole in its widest section. Plate 0 containing no weld is also shown to confirm the continuity in the raw material and the high quality of the CT scans. Based on the information provided by the CT scans, the specimens were arranged in descending order in terms of their weld quality, starting with Plate 0 (with no weld), Plate 4, Plate 3, Plate 1, and finally Plate 2, that was the most damaged plate.
4. RESULTS AND DISCUSSION 4.1 Wave mode selection Selection of the wave mode is critical, considering the importance of the mode sensitivity to the type of damage of interest. For this purpose, a Matlab based software “Wavescope”, developed by the Laboratory for Active Materials and Smart Structures (LAMSS) 17, was used. The group velocities, wavelengths, and strains plots were generated for the symmetric and anti-symmetric wave modes (for the magnesium AZ31B alloy plates). This helped to identify and evaluate the possible wave modes in the structure, that are suitable for this application. On that basis, five frequencies of 150, 200, 250, 300, and 350 kHz were chosen to excite only the fundamental modes (A0 and S0 modes).

287
An analysis of the collected response signals was performed based on the first transmitted wave pack. Figure 3 shows an example of normalized actuator and sensor signals captured from Plate 0 at an excitation frequency of 250 kHz. The velocity of the first wave pack was calculated based on the position of its and the input’s highest peak according to Equation (1):
V250 = Distance between the actuator and sensor PZTsTime difference between the peaks = 0.095
(2.39e−5−5.88e−7) = 4075.2 m/sec (1)According to “Wavescope”, the theoretical group velocity of the S0 mode at 250 kHz is about 5203 m/sec and that of the A0 mode is about 3036 m/sec. Due to the specimens’ small size and because of the signals’ very high velocities in metals, the signals were disturbed by their superposition with their reflections from the boundaries of the plates. Moreover, the highest peak in the output’s 1st transmission is in the fourth sinusoidal cycle, while that in the input signal is in the third cycle. This means that new peaks were built, in addition to the fact that the experimentally calculated velocity (V250) showed that the highest peak in the first transmission did not correspond to the fastest mode which is the S0 mode. Therefore, the front of the wave pack was used to capture the S0 mode of the response signals (i.e. the second cycle of the received wave pack was considered). The velocity computed from the wave front was 4587.2 m/sec. This 12% error in comparison to the S0 velocity predicted by “Wavescope”, may be referred to material imperfections, the bonding quality between the plate and transducers, or some difference between the experimentally used and the modeled piezoelectric materials. The S0 mode was chosen for data analysis due to its known sensitivity to defects in thin structures.
4.2 Data analysis The amplitude attenuation between the welded and the non-welded plate was calculated for each frequency, and a DI was proposed as stated in Equation (2):
DI = (V0 − Vp)/V0 where V𝑝𝑝 and V0 are the response signal’s wave-front peak amplitudes of the tested plate and of Plate 0 (non-welded) respectively. Figure 4 presents the DI calculated for each plate after their excitation using the five frequencies tested in this study. The horizontal axes correspond to the plate number, and the vertical axes correspond to the calculated DI. The plates’ numbers are presented in the ascending order of the weld qualities according to the CT scans (section 3). The five plots of the different frequencies (150, 200, 250, 300, and 350 kHz) show that the DI increases with increasing defect volume. Even though the defects in Plates 1 and 3 are close in size, resulting in a very small change in the signal amplitude, they were clearly distinguished using the proposed approach. The weld classification based on the calculated DI shows complete agreement with the results of the CT scans. In addition, the DIs of all the plates kept approximately constant values when calculated from waves of different frequencies.
Figure 2. CT scans of the tested plates, (a) to (e): Plates 0 to 4 respectively.
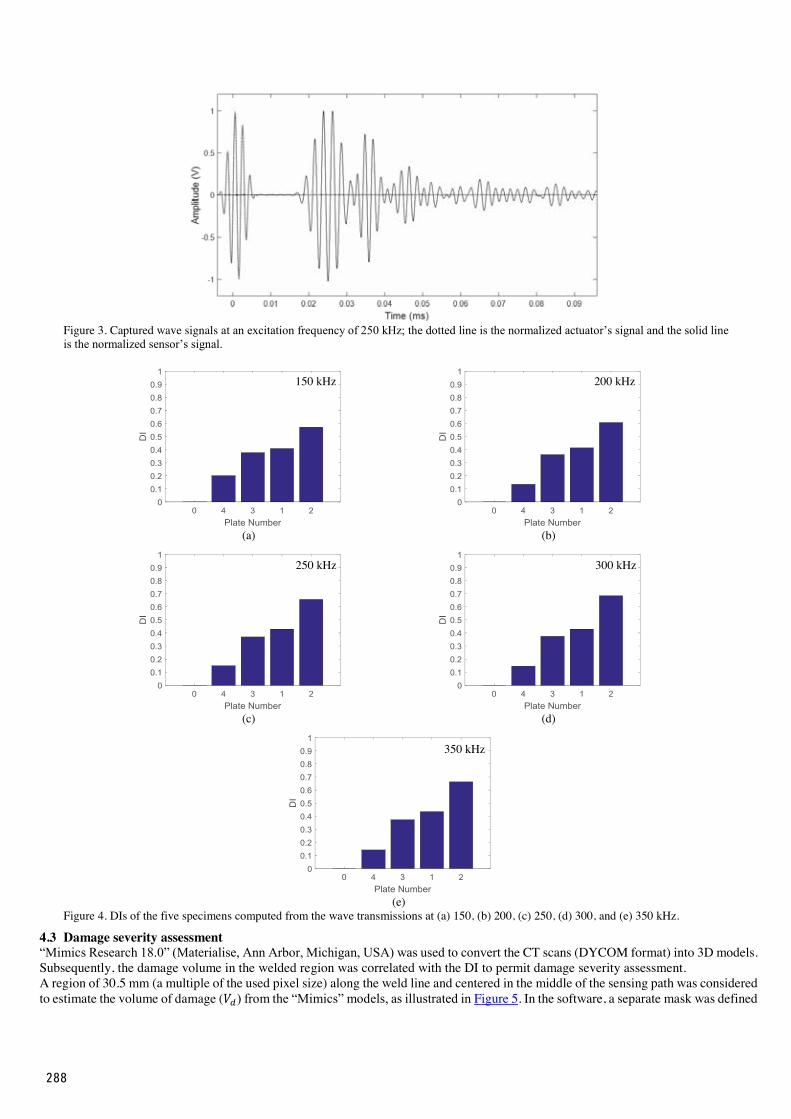
288
Figure 3. Captured wave signals at an excitation frequency of 250 kHz; the dotted line is the normalized actuator’s signal and the solid line is the normalized sensor’s signal.
(a) (b)
(c) (d)
(e)
Figure 4. DIs of the five specimens computed from the wave transmissions at (a) 150, (b) 200, (c) 250, (d) 300, and (e) 350 kHz.
4.3 Damage severity assessment “Mimics Research 18.0” (Materialise, Ann Arbor, Michigan, USA) was used to convert the CT scans (DYCOM format) into 3D models. Subsequently, the damage volume in the welded region was correlated with the DI to permit damage severity assessment. A region of 30.5 mm (a multiple of the used pixel size) along the weld line and centered in the middle of the sensing path was considered to estimate the volume of damage (𝑉𝑉𝑑𝑑) from the “Mimics” models, as illustrated in Figure 5. In the software, a separate mask was defined
150 kHz 200 kHz
250 kHz 300 kHz
350 kHz

289
for the damage region under consideration for each of the plates. The volume of the mask was then estimated based on the voxel volumes. The resulting damage volumes for all the plates are summarized in Table 2, where the plates are arranged in ascending order based on the weld quality. In fact, plate thickness plays an important role in the propagation behavior of a Lamb wave. Therefore, a generalized linear equation relating DI to damage severity is proposed in Equation (3):
DI = a× VdPlate Thickness = a×Rd (3)
where 𝑅𝑅𝑑𝑑 is the damage ratio defined as 𝑉𝑉𝑑𝑑 normalized by the thickness of the plate, and 𝑎𝑎 is a constant. The results for the DIs resulting from the signals captured after an excitation frequency of 350 kHz, were correlated with 𝑅𝑅𝑑𝑑. The scatter plot of the DIs as function of 𝑅𝑅𝑑𝑑 is shown in Figure 6. A regression line passing through the origin was fit to the data. The regression parameters were calculated using a “Matlab” built-in function, and the line is also shown in Figure 6. The equation for the linear regression was found to be as described in Equation 4:
DI = 0.0862×RdThe R squared value of the linear fit for the DIs computed from the 350 kHz response signals was 0.9968. On the other hand, the least R squared value of the linear fits from the other frequencies was 0.9569 at 150 kHz, while the others were all above 0.99 and are all listed in Table 3. This indicates the high linear correlation between 𝑅𝑅𝑑𝑑 and the proposed DI. The relation obtained in this section (Equation 4) along with the high correlation indicated by the obtained R squared values are considered highly important for damage severity prediction using the proposed method for this particular material (AZ31B). Further validation of the relation may be required; however, the obtained results conclude the promising potential of Lamb-wave-based methods to serve as effective NDTs of friction stir welded plates and structures.
Figure 5. The 3D model of Plate 1 created using Mimics.
Table 2. Damage volumes and damage ratios of the four damaged plates.
Plate Number 𝑽𝑽𝒅𝒅 = Damage Volume (𝒎𝒎𝒎𝒎𝟑𝟑) 𝑹𝑹𝒅𝒅 = 𝑽𝑽𝒅𝒅/ Plate Thickness (𝒎𝒎𝒎𝒎𝟐𝟐) 4 43.17 1.61 3 113.09 4.21 1 143.09 5.33 2 202.96 7.56
Table 3. R squared values of the linear fit between the proposed DI and the damage ratio for different frequencies.
Frequency (kHz) R squared 150 0.9569 200 0.9965 250 0.9962 300 0.9933 350 0.9968

290
Figure 6. DI versus damage ratio and the corresponding line of best fit for the 350 kHz excitation frequency.
CONCLUSION In this study, the capability of Lamb waves in detecting and quantifying worm holes in friction stir welded AZ31B magnesium alloy plates was demonstrated. Different weld qualities were obtained through control of the pin insertion depth. Piezoelectric wafers were used to excite and capture the fundamental Lamb modes. Then, a damage index was defined using the amplitude attenuation in the captured transmitted signals between the welded plates and the non-welded plate. Internal details of the welded region were captured through CT imaging of the plates to determine the actual qualities of the welds. Classification of the plates according to the calculated damage indices showed complete agreement with that determined using the CT scans. Furthermore, 3D (CT scan based) models were used to calculate the damage volumes in the welded regions. The damage volumes were later correlated with the calculated damage indices resulting in a perfectly linear trend. In conclusion, Lamb waves demonstrated high sensitivity to the presence of defects in FSW, and the suggested methodology appears promising for use in the assessment of welded structures. The clear linear relation between the proposed damage index and the damage volume in the welded region, makes the approach an effective potential NDT method for the evaluation of flaws in friction stir welded plates and structures.
ACKNOWLEDGMENTS Recognition and gratitude are addressed to the Lebanese National Council for Scientific Research (CNRS) for their Award #103085. The financial support of the University Research Board at the American University of Beirut of Award #103008 is also acknowledged. The authors thank Dr. Nayla Cortas and Ms. Salam Al Hamra at the American University of Beirut-Medical Center (AUBMC) for their help in performing the needed CT scans.
REFERENCES [1] Babu, A. S. and Devanathan, C., “An Overview of Friction Stir Welding,” Int. J. Res. Mech. Eng. Technol 3(2), 259-265 (2013). [2] Thomas, W., Nicholas, E., Needham, J. C., Murch, M., Templesmith, P. and Dawes, C., “Friction stir welding,” International patent application no.
PCT/GB92102203 and Great Britain patent application (9125978.8) (1991). [3] Muthukrishnan, M. and Marimuthu, K., "Some studies on mechanical properties of friction stir butt welded Al-6082-T6 plates," Proc. of Frontiers in
Automobile and Mechanical Engineering (FAME), 269-273 (2010). [4] Kumbhar, N. and Bhanumurthy, K., “Friction stir welding of Al 6061 alloy,” Asian J. Exp. Sci 22(2), 63-74 (2008). [5] Arbegast, W. J., “Friction Stir Joining: Characteristic Defects,” South Dakota School of Mines and Technology, (2003). [6] Ammouri, A., Kheireddine, A., Kridli, G. and Hamade, R., "FEM optimization of process parameters and in-process cooling in the friction stir processing of
magnesium alloy AZ31B," Proc. of ASME 2013 International Mechanical Engineering Congress and Exposition, V02AT02A079-V002AT002A079 (2013). [7] Ammouri, A. and Hamade, R., “On the selection of constitutive equation for modeling the friction stir processes of twin roll cast wrought AZ31B,” Materials
& Design 57, 673-688 (2014). [8] El Chlouk, Z., Ayoub, G., Kridli, G. and Hamade, R., "Intermetallic Compound Formation in Al/Mg Friction Stir Welded (FSW) Butt Joints," Proc. of ASME
2014 International Mechanical Engineering Congress and Exposition, V014T011A010-V014T011A010 (2014). [9] Fakih, M. A., Mustapha, S., Alamdari, M. M. and Ye, L., “Symbolic Dynamics Time Series Analysis for Assessment of Barely Visible Indentation Damage
in Composite Sandwich Structures Based on Ultrasonic Guided Waves,” Journal of Composite Materials, (2017) (Accepted). [10] Michaels, J. E. and Michaels, T. E., “Guided wave signal processing and image fusion for in situ damage localization in plates,” Wave Motion 44(6), 482-492
(2007). [11] Rathod, V. T. and Roy Mahapatra, D., “Ultrasonic Lamb wave based monitoring of corrosion type of damage in plate using a circular array of piezoelectric
transducers,” NDT and E International 44(7), 628-636 (2011). [12] Mustapha, S., Ye, L., Wang, D. and Lu, Y., “Debonding detection in composite sandwich structures based on guided waves,” AIAA journal 50(8), 1697-1706
(2012). [13] Pai, P. F., Deng, H. and Sundaresan, M. J., “Time-frequency characterization of lamb waves for material evaluation and damage inspection of plates,”
Mechanical Systems and Signal Processing 62, 183-206 (2015). [14] Santos, J. and Santos, M., “Lamb waves technique applied to the characterization of defects in friction stir welding of aluminum plates: comparison with X-
ray and ultrasonic C-scan,” Journal of Testing and Evaluation 38(5), 1-6 (2010). [15] Delrue, S., Tabatabaeipour, M., Hettler, J. and Van Den Abeele, K., “Applying a nonlinear, pitch-catch, ultrasonic technique for the detection of kissing bonds
in friction stir welds,” Ultrasonics 68, 71-79 (2016). [16] Tabatabaeipour, M., Hettler, J., Delrue, S. and Van Den Abeele, K., “Non-destructive ultrasonic examination of root defects in friction stir welded butt-joints,”
NDT & E International 80, 23-34 (2016). [17] Laboratory for Active Materials and Smart Structures (LAMSS)), “WAVESCOPE: Dispersion curves, group velocities and tuning for metallic structures”.

291
EQUILIBRATION TIMESCALES OF SECONDARY ORGANIC AEROSOLS UNDER
DRY AND HUMID CONDITIONS
Khairallah Atwi Mechanical Engineering
American University of Beirut Beirut, Lebanon
Abstract- The partitioning of secondary organic aerosols
(SOA) between the particle and gas phases depends on both their thermodynamic and kinetic properties. Reports of a highly viscous phase state of ambient SOA and the consequent retardation in particle mixing has led to the suggestion that evaporation and condensation may be so kinetically limited that SOA in the atmosphere could exist out of thermodynamic equilibrium. However, while previous work has investigated the effect of phase state on the evaporation kinetics, studies of the equilibration potential of SOA under ambient conditions is still lacking. In this work, SOA generated in an oxidation flow reactor (OFR) from α-pinene and gasoline engine exhaust are diluted in a smog chamber to reach ambient concentrations. The evolution of the particle size distribution (PSD) is monitored and fit to an evaporation model, allowing the estimation of the volatility and the effective evaporation coefficient. In order to investigate the effect of viscosity on evaporation, the experiments are conducted under low and high relative humidity. The volatility of the SOA exiting the OFR was found to range between 0.2 and 1.2 µgm-3, which is similar to the volatility of OA in both urban and rural environments. After dilution in the chamber, the SOA reestablished equilibrium with the vapor phase on timescales on the order of tens of minutes, exhibiting an evaporation coefficient between 0.06 and 0.24. The SOA generated under higher humidity did not exhibit faster evaporation rates, suggesting that, under ambient concentrations, lower diffusion coefficients do not significantly inhibit equilibration. In either case, the equilibrium was restored on timescales shorter than those of other atmospheric processes, suggesting that the assumption that SOA exist under thermodynamic equilibrium in the atmosphere holds under typical atmospheric concentrations.
I. INTRODUCTION
Organic aerosols have a substantial impact on climate and human health [1, 2]. The formulation of policy to regulate emissions requires that the mechanisms of their formation and aging be well understood. However, current chemical models still have trouble reproducing the observed concentration of SOA, particularly around urban areas [3].
Organic compounds in the atmosphere partition between the gas and particle phases depending on their volatility and the total concentration of condensed organics [4]. As volatile organic compounds react with OH, ozone, or other oxidants, their volatility decreases, leading to the formation
of SOA [5, 6]. In the atmosphere, chemical reactions in the gas or condensed phases further change the volatility of these compounds and thus drive them to repartition accordingly. In addition, temperature fluctuations or dilution can perturb the thermodynamic equilibrium, causing the particles to evaporate or condense.
The complexity of the processes SOA undergo in the atmosphere makes their explicit representation in chemical transport models (CTMs) highly demanding. Consequently, organic compounds are often lumped together in models according to properties such as volatility, extent of oxidation, or polarity [7-9]. The effects of chemical aging and other processes are modeled as changes to these properties. Most models then assume that the consequent change in particle-gas partitioning is immediate, in that it occurs on timescales shorter than those of the time steps used (e.g. [10]). The actual kinetics of the processes of condensation and evaporation, however, involve several steps that could be rate limiting. In particular, slow bulk diffusion within particles could significantly retard equilibration, as the diffusion of the evaporating species to the particle surface is inhibited.
Recently, several groups have reported that SOA could exist in a highly viscous state, with correspondingly low rates of particle phase diffusion [11, 12]. The slow evaporation rates of both ambient and lab-generated SOA and their disagreement with model predictions has thus been attributed to limited diffusion within the particles [13, 14]. These groups have reported that unrealistically low effective evaporation coefficients are required to describe the evaporation of these particles (α<<0.1). This could retard or inhibit the equilibration of atmospheric SOA, which would conflict with the assumption used in most CTMs. The evaporation models in these studies, however, use volatility distributions obtained from previous smog chamber parameterizations. If the SOA under study has a lower volatility than that assumed in the models, the evaporation would seem to be hindered by mass transfer limitations [15].
Approaches that constrain the volatility of the SOA are thus required to obtain reliable estimates of the evaporation kinetics. Previous work has studied the evaporation of SOA

292
generated from the ozonolysis of α-pinene [16, 17] and ambient SOA [18, 19] and found that these have relatively low volatilities but exhibit an evaporation coefficient on the order of 0.1. The evaporation kinetics of SOA generated from precursors found in engine exhaust, however, are yet to be studied. SOA produced from similar human sources for an important portion of atmospheric OA, especially around urban areas [6].
In this work, we study the equilibration kinetics of SOA generated from both biogenic and anthropogenic precursors. SOA generated inside an OFR is initially at phase equilibrium with the gas phase. Perturbed by sudden dilution in a large Teflon chamber, the SOA evaporate to reestablish equilibrium. Measurements of the response of the PSD of SOA are fitted to an evaporation model that constrains both volatility and kinetics. The importance of viscosity in determining the rates of equilibration is investigated by conducting experiments under dry and humid conditions. The SOA generated under high humidity is likely to have higher water content, leading to a less viscous phase state and higher diffusion coefficients [20, 21].
II. MATERIALS AND METHODS
A. Theory
The saturation ratio (SR) is defined as the ratio of the vapor phase concentration to the vapor concentration at equilibrium. Whenever an organic aerosol is subjected to sudden dilution, the SR drops to zero and the particles respond by evaporating until equilibrium is restored (i.e. SR=1). The rate of evaporation of single particle can be described using Maxwell’s equation, such that
ddp/dt = –4πDCm(KCsat-Cg)/ ρdp (1) Here, dp is the particle diameter and D the diffusion
coefficient of the compound in air. K, the Kelvin correction factor, is most prominent for smaller particles. In our calculations, for a given data set, K will be assumed to be constant due to the small changes in particle size experienced during measurements. Cg and Csat are the actual and the equilibrium gas phase concentrations; Cm is the Fuchs-Sutugin correction factor, which corrects for non-continuum effects in mass transfer for particles in the transition regime. Cm is given by
Cm= (1+Kn)/ (1+ (4/3α+0.377)Kn + (4/3α) Kn2) (2) In (2), Kn is the Knudsen number, equal to 2λ/dp, where λ
is the mean free path of the evaporating species in air. α is the evaporation coefficient, the ratio of the molecular flux to the maximum theoretical molecular flux. As in [22], the evaporation coefficient is determined by fitting measured evaporation rates to a model that neglects intra-particle mass transfer resistance. Therefore, the empirically
determined value is actually the effective evaporation coefficient, which lumps all mass transfer resistances together.
The evaporation of N particles of diameter dp leads to a change in the vapor phase concentration according to
dCg/dt = 2πdpNDCm(KCsat-Cg) (3) Coupled, (1) and (3) describe the thermodynamic
equilibration of a monodisperse organic aerosol. To describe that of a polydisperse aerosol, the particle diameter dp above can be replaced with the equivalent condensation sink diameter of the distribution, dcs.
It has been previously shown that if only a small change in the particle mass concentration (<20-30%) is required to restore equilibrium, then the equilibration process is approximately first-order, with SR = 1 – e-t/τ [19]. Here, τ is the e-folding time for an aerosol with condensation sink CS [23], such that
τ = 1/CS = 1/(∑2πdp,iDCm,i) = 2πdcsDCm (4)
B. Experimental Setup
Figure 1 shows the experimental setup with anthropogenic precursors. A four-stroke single cylinder gasoline engine (Honda SHX1000, displacement: 49cc, compression ratio: 8.0:1, splash lubrication) was used as the source of emissions. The engine was operated at zero external load using 98 octane rating gasoline and SAE-40 motor oil (Total). The engine exhaust was diluted using a rotating disk dilutor (Testo Engineernig, MD19-3E) and further mixing with clean air to obtain a dilution of 4000:1. This is of a similar order to the dilution 10 minutes downstream of a highway [24]. For the experiments with a biogenic precursor, a vial containing liquid α-pinene was placed inside a flask. 300 ml of clear air was pushed through the flask, carrying the evaporated α-pinene into the OFR.
The oxidation flow reactor was a 64 L stainless steel rectangular chamber equipped with a mercury UV lamp (BHK Analamp, Model No. 82-9304-03). The temperature and humidity in the reactor are monitored using a probe (Vaisala HMP60). In all measurements, the temperature in the OFR was that of the laboratory, approximately 20 °C. The SOA from the OFR was diluted in a 5 m3 Teflon chamber housed inside an enclosure maintained at 32 ± 0.2 C. The humidity in the OFR and the chamber was similar in either set of experiments.
A scanning mobility particle sizer (SMPS) (Classifier: TSI 3082, CPC: TSI 3772) was placed inside the temperature controlled enclosure and used to measure the PSD in the Teflon chamber and the OFR. The SMPS was operated with a scan time of 60 seconds, a retrace of 4 seconds, and a purge of 20 seconds. The aerosol flow rate

293
was restricted by the CPC to 1 lpm. The sheath flow was set to 4 lpm. Under these conditions, the SMPS measured particles in the range of 10-500 nm. In preliminary measurements, an aerodynamic particle sizer (TSI 3321), which measures particles in the 500nm to 20μm size range, was used to verify that the particles generated in the OFR were within the 10-500 nm measurement window of the SMPS.
SO2 calibration experiments were conducted to estimate the equivalent extent of oxidation in the reactor. Assuming an atmospheric OH concentration of 1.5x10⁶ molec.cm-3 [25], the residence time in the reactor under dry conditions was equivalent to 6.3 ± 0.9 days of atmospheric aging.
C. Experimental Matrix
Table I shows the conditions in the different experiments and the number of measurements in each. The particles are diluted to mass concentration of COA = 5μgm-3. This value is chosen in order to reproduce typical number concentrations in the atmosphere [5]. The measurements at low humidity were also conducted at a lower mass concentration in the chamber, corresponding to a higher extent of dilution, in order to verify that the particles do not cease to evaporate because they are depleted of volatile material. Experiments are conducted at two values of RH to assess the importance of viscosity in determining the timescales of equilibration. At a relative humidity of less than 10%, the particles are likely very viscous with a low diffusion coefficient [12, 21]. At RH = 60%, the diffusion coefficient is likely to be higher due to the higher water content. If particle evaporation is kinetically limited due to slow diffusion, the equilibration of the less viscous particles should proceed at significantly faster rate.
D. Experimental Procedure
The chamber is flushed overnight with dry or humid air, depending on the experiment being conducted. Experiments begin by generating the SOA in the OFR. After introducing
TABLE I
EXPERIMENTAL MATRIX AND CONDITIONS
Precursor
α-pinene Engine Exhaust
Humidity < 10% 60% < 10% 60%
Concentration (μgm-3)
5 5 5 5
Number of measurements
5 5 6 5
Dry air flow (lpm)
20.7 20.7 17 16
Humid air flow (lpm)
4 4 (Heated) 3 4 (Heated)
Precursor flow (lpm)
0.3 0.3 5 5
the precursors, the UV lamps are turned on, leading to the oxidation of VOCs. This causes their volatility to drop and SOA to begin forming. Once a steady SOA distribution is obtained inside the reactor, the filling of the chamber begins. The filling process continues until the mass concentration in the chamber reaches the desired value. The PSD is measured for 300 minutes.
E. Data Analysis
The condensation sink diameter is calculated for the entire time series and corrected for wall deposition. After dilution in the chamber, the particles evaporate until equilibrium is reached, evident though a constant drop in dcs. Throughout measurements, however, the preferential deposition of smaller particles due to electrostatic forces contributes to a growth in dcs, which, after equilibrium is reached, is exhibited as a linearly growing dcs. This was verified using ammonium sulfate aerosol. In order to correct for this artifact, the corrected condensation sink diameter is calculated according to
dcs,corrected = dcs,calculated – t d(dcs,calculated) /dt (5)
where d(dcs,calculated) /dt is the rate of growth of dcs after equilibrium has been reached.
Another uncertainty is whether the wall-deposited particles evaporate as suspended particles and contribute to the restoration of equilibrium. A wall-bound contribution factor ω is used to modify (3), such that
dCg/dt = 2πdpDCm(KCsat-Cg)(Nsus+ ωNwall) (6)
T1
T2
T3 25 LPM
Oxidation Flow Reactor
UV Lamp
1 LPM
Gasoline Engine
5 LP
M
Exhaust
Exhaust
SMPS
Teflon Chamber
Temperature Controlled Enclosure
Humidifier
Dry Air
Rotating Disk DilutorDilution Ratio ~800:1
Activated Carbon Denuder
5 LP
M
HEPA Filter
1 LPM
RH & T Probe
RH
Figure 1. Experimental Setup

294
In (6), the evaporation of deposited particles can be included or discarded by varying ω between 0 and 1, such that the total number of evaporating particles varies between the initial particle count and the suspended particle count, calculated from a fit on the measured total number concentration.
The coupled differential equations (1) and (6) describe the rate of evaporation of particles of diameter dcs as the gas phase concentration approaches its equilibrium value. The measured condensation sink diameter is fit to the model described above using a two-parameter least squares fit, where the only unknowns are the saturation concentration Csat and the evaporation coefficient α. The values assumed for the density, molar mass, and gas-phase diffusion coefficient for the SOA are ρ = 1250 kgm-3, M = 0.2 kgmol-1, and D = 5 x 10⁻⁶ m2s-1, as in [16]. A two-step approach is used to determine the optimal values. Since the final extent of evaporation is not affected by the rate of evaporation, Csat can be calculated using any assumed value of alpha. Initially, an α of 1 is assumed and the Csat that best reproduces the measured change in dcs is chosen. α is then determined by performing a least squares fit on the evaporation portion of the time series.
To estimate the effect of experimental uncertainty on the results, Monte Carlo perturbations are performed on the particle counts assuming an error of 3% [26]. The reported Csat and α are the means of the model fit to 100 such perturbations.
III. RESULTS AND DISCUSSION
A. Evaporation Kinetics at Low Humidity
Figure 2 shows a typical plot of the condensation sink diameter versus time for α-pinene or engine SOA. In all the cases, the model described earlier fits the experimental results very well, with correlation coefficients averaging 80%. The value of ω, the wall contribution factor, did not measurably affect the values of the computed Csat, α, or the goodness of fit of the model to the data. To simplify presentation of the results, the results reported below assume a value of unity ω. Table II summarizes the results from the experiments under all conditions for α-pinene and engine SOA. In experiments conducted at a lower COA (data now shown), the particles exhibited a larger extent of evaporation for both precursors (α-pinene SOA, p<0.0008; engine SOA, p<0.08). This indicates that particles were not depleted of semi-volatile material under higher concentrations. The lower significance in the case of engine SOA is likely due to the inherent variability of the emissions.
The SOA produced from engine exhaust or α-pinene after have effective saturation concentrations on the order of 10-1 μgm-3. These fall within the low volatility (LV-OOA) and semi-volatile (SV-OOA) OA bins on the volatility basis set [8] and are in agreement with the findings of others groups
investigating the volatility of SOA produced from both precursors after similar extents of oxidation [27-29]. The effective saturation concentration of the OA produced in this work is also of the same order of that dominant in urban and rural environments [18, 30].
For both a-pinene and engine SOA, the evaporation coefficient was on the order of 0.1, with equilibration occurring within tens of minutes. These values are in disagreement with the findings of [13, 31], who suggest that values of α << 0.1 are required to fit evaporation models to observations. [13] and [31], however, do not determine the volatility of the SOA, using instead an assumed volatility distribution derived from other studies. As mentioned earlier, low volatility could instead be causing the slow evaporation of the SOA. In fact, several studies constraining both volatility and kinetics have reported an evaporation coefficient on the order of 0.1, with equilibrium reached within minutes to hours. The equilibration timescales of α-pinene SOA have been previously studied inside a smog chamber [16] and using a thermodenuder [17], reporting α on the order of 0.1. [19] and [18] also similarly estimate an evaporation coefficient between 0.1 and 0.5 for ambient SOA.
B. Evaporation Kinetics at High Humidity
The effect of humidity can also be seen in Table II. For both engine exhaust and α-pinene SOA, the experiments at higher humidity exhibited a larger change in particle diameter (α-pinene SOA, p<0.001; engine SOA p<0.16) and a larger saturation concentration (α-pinene SOA, p<0.005; engine SOA, p<0.004). The less significant difference in the change in particle diameter in the case of engine SOA is compensated for by the larger number concentration in the chamber (p<0.06).
The larger extent of evaporation at high RH, however, does not reflect that the evaporation the evaporation was stalled due to the high viscosity at low RH. The SOA produced at high humidity differs in several aspects from
TABLE II
MEAN CONDITIONS AND RESULTS OF SOA EVAPORATION IN CHAMBER Precursor α-pinene
Humidity <10% 60% <10% 60%
Concentration (μgm-3)
5.2 ± 0.6 4.9 ± 0.5 5.5 ± 0.3 5.3 ± 0.6
Concentration (103 particlescm-3)
5 ± 0.4 5.5 ± 0.2 5.4 ± 0.8 13.8 ± 0.8
Initial dcs (nm) 101.7 ± 5.9
98.7 ± 3.0 100.2 ± 4.2
71.7 ± 2.3
dcs Change (nm) 6.3 ± 0.3 10.6 ± 1.5 4.4 ± 1.3 5.9 ± 1.7
Csat (μgm-3) 0.59 ± 0.04
0.94 ± 0.1 0.43 ± 0.09
0.69 ± 0.11
Evaporation Coefficient
0.13 ± 0.02
0.09 ± 0.04
0.14 ± 0.03
0.07 ± 0.02

295
that produced at low humidity, including in the extent of oxidation of its constituents and their volatilities. The higher volatility of the SOA formed at high humidity is in agreement with the findings of several groups investigating the effect of the extent of oxidation on the production of ambient and α-pinene SOA [32-35]. With larger extents of oxidation, fragmentation reactions become the dominant oxidation pathway, yielding products with lower molecular weight and higher volatility [27, 36].
The evaporation coefficient is used to assess the importance of phase state in determining the rate of equilibration. For both SOA types, α was found to be slightly lower at high humidity (α-pinene SOA, p< 0.17; engine SOA, p<0.003). This indicates that equilibration was not kinetically limited by slow diffusion at low humidity. If the diffusion of molecules to the particle surface were a late-limiting step, the lower viscosity of SOA at high humidity would have resulted in faster evaporation and a larger evaporation coefficient.
For ambient OA, the timescales of equilibration are dependent on the PSD, the viscosity of the particles, and on volatility [37, 38]. For compounds of low volatility, little material needs to evaporate to saturate the gas phase, thus decreasing the importance of particle-phase mixing in determining the rates of equilibration. This is further accentuated when a large number of particles participate in the process and when the particles are of small diameters, where particle-mixing times are inherently small. Thus, while slow diffusion may indeed retard particle mixing, the evaporation of a large number of particles of low humidity could overshadow this, leading to equilibration within tens of minutes to hours.
Figure 2. Typical plot of condensation sink diameter vs time.
Shown is the case of α-pinene SOA under dry conditions.
C. Atmospheric Implications
The equilibration timescale τ estimates the e-folding time of the saturation ratio for an aerosol system suddenly brought out of equilibrium. Using an evaporation coefficient of 0.15, Figure 3 shows the dependence of the equilibration time on both particle loading and particle diameter. In all cases, τ is under 40 minutes for typical ambient concentrations of organic aerosols (5 μgm-3 <COA<15 μgm-
3). This is well shorter than the timescales of chemical transformations in the atmosphere, which typically range between a few hours and several days [39]. Thus, our estimates of the equilibration time in the atmosphere support the assumption of thermodynamic equilibrium commonly assumed in models.
IV. CONCLUSION
SOA produced from the oxidation of engine exhaust and α-pinene had saturation concentrations ranging between 0.2 and 1.2µgm-3. Upon dilution, the SOA evaporated to restore equilibrium within tens of minutes, exhibiting an evaporation coefficient between 0.06 and 0.24. To investigate the importance of phase state in determining equilibration rates, experiments were conducted under dry and humid conditions. In both cases, equilibrium was reach under similar timescales, suggesting that the role of viscosity is diminished when there are enough particles contributing to the restoration of equilibrium. In the atmosphere, this suggests that the phase of OA is unlikely to inhibit equilibration under typical atmospheric concentrations. The timescales of equilibration are also shorter than those of chemical changes in the atmosphere. The assumption made by chemical transport models that organic aerosols in the atmosphere exist in thermodynamic equilibrium should then be valid under ambient concentrations.
0 5 10 15 2010-1
100
101
102
103
Mass Concentration (ug/m3)
Equi
libra
tion
Tim
e (m
inut
es)
d = 20nmd = 50nmd = 100nmd = 200nm
Figure 3. Equilibration timescales for aerosol
systems of different diameters and particle loadings.

296
ACKNOWLEDGMENT
I thank Professor Alan Shihadeh for his guidance and Mohammad Baasiri and Nareg Karaoghalian for their assistance in designing and building the experimental setup.
REFERENCES
1. Forster, P., et al., Changes in atmospheric constituents and in radiative forcing. Chapter 2, in Climate Change 2007. The Physical Science Basis. 2007. 2. Davidson, C.I., R.F. Phalen, and P.A. Solomon, Airborne particulate matter and human health: a review. Aerosol Science and Technology, 2005. 39(8): p. 737-749. 3. Heald, C.L., et al., A large organic aerosol source in the free troposphere missing from current models. Geophysical Research Letters, 2005. 32(18). 4. Pankow, J.F., An absorption model of the gas/aerosol partitioning involved in the formation of secondary organic aerosol. Atmospheric Environment, 1994. 28(2): p. 189-193. 5. Jimenez, J., et al., Evolution of organic aerosols in the atmosphere. Science, 2009. 326(5959): p. 1525-1529. 6. Hallquist, M., et al., The formation, properties and impact of secondary organic aerosol: current and emerging issues. Atmospheric Chemistry and Physics, 2009. 9(14): p. 5155-5236. 7. Odum, J.R., et al., Gas/particle partitioning and secondary organic aerosol yields. Environmental Science & Technology, 1996. 30(8): p. 2580-2585. 8. Donahue, N.M., et al., A two-dimensional volatility basis set: 1. organic-aerosol mixing thermodynamics. Atmospheric Chemistry and Physics, 2011. 11(7): p. 3303-3318. 9. Pankow, J.F. and K.C. Barsanti, The carbon number-polarity grid: A means to manage the complexity of the mix of organic compounds when modeling atmospheric organic particulate matter. Atmospheric Environment, 2009. 43(17): p. 2829-2835. 10. Gaydos, T.M., et al., Development and application of a three-dimensional aerosol chemical transport model, PMCAMx. Atmospheric Environment, 2007. 41(12): p. 2594-2611. 11. Virtanen, A., et al., An amorphous solid state of biogenic secondary organic aerosol particles. Nature, 2010. 467(7317): p. 824-827. 12. Saukko, E., et al., Humidity-dependent phase state of SOA particles from biogenic and anthropogenic precursors. Atmospheric Chemistry and Physics, 2012. 12(16): p. 7517-7529. 13. Vaden, T.D., et al., Evaporation kinetics and phase of laboratory and ambient secondary organic aerosol. Proceedings of the National Academy of Sciences, 2011. 108(6): p. 2190-2195. 14. Stanier, C.O., R.K. Pathak, and S.N. Pandis, Measurements of the volatility of aerosols from α-pinene ozonolysis. Environmental science & technology, 2007. 41(8): p. 2756-2763. 15. Shrivastava, M., et al., Implications of low volatility SOA and gas‐phase fragmentation reactions on SOA loadings and their spatial and temporal evolution in the atmosphere. Journal of Geophysical Research: Atmospheres, 2013. 118(8): p. 3328-3342. 16. Saleh, R., N.M. Donahue, and A.L. Robinson, Time scales for gas-particle partitioning equilibration of secondary organic aerosol formed from alpha-pinene ozonolysis. Environmental science & technology, 2013. 47(11): p. 5588-5594. 17. Saha, P.K. and A.P. Grieshop, Exploring divergent volatility properties from yield and thermodenuder measurements of secondary organic aerosol from α-pinene ozonolysis. Environmental science & technology, 2016. 18. Saha, P.K., et al., Quantifying the volatility of organic aerosol in the southeastern US. Atmos. Chem. Phys. Discuss, 2016. 2016: p. 1-36. 19. Saleh, R., A. Khlystov, and A. Shihadeh, Determination of evaporation coefficients of ambient and laboratory-generated semivolatile organic aerosols from phase equilibration kinetics in a thermodenuder. Aerosol Science and Technology, 2012. 46(1): p. 22-30.
20. Grayson, J.W., et al., Effect of varying experimental conditions on the viscosity of α-pinene derived secondary organic material. Atmospheric Chemistry and Physics, 2016. 16(10): p. 6027-6040. 21. Song, M., et al., Relative humidity-dependent viscosities of isoprene-derived secondary organic material and atmospheric implications for isoprene-dominant forests. Atmospheric Chemistry and Physics, 2015. 15(9): p. 5145-5159. 22. Saleh, R., A. Shihadeh, and A. Khlystov, Determination of evaporation coefficients of semi-volatile organic aerosols using an integrated volume—tandem differential mobility analysis (IV-TDMA) method. Journal of Aerosol Science, 2009. 40(12): p. 1019-1029. 23. Saleh, R., A. Shihadeh, and A. Khlystov, On transport phenomena and equilibration time scales in thermodenuders. Atmospheric Measurement Techniques, 2011. 4(3): p. 571-581. 24. Zhang, K.M. and A.S. Wexler, Evolution of particle number distribution near roadways—Part I: analysis of aerosol dynamics and its implications for engine emission measurement. Atmospheric Environment, 2004. 38(38): p. 6643-6653. 25. Mao, J., et al., Airborne measurement of OH reactivity during INTEX-B. Atmospheric Chemistry and Physics, 2009. 9(1): p. 163-173. 26. Kinney, P.D. and D.Y. Pui, Use of the Elecftrostatic Classification Method to 0.1 tm SRM Particles-A Feasibiiiy Study. Journal of Research of the National Institute of Standards and Technology, 1991. 96(2). 27. Chen, S., et al., Modeling organic aerosol from the oxidation of α-pinene in a Potential Aerosol Mass (PAM) chamber. Atmospheric Chemistry and Physics, 2013. 13(9): p. 5017-5031. 28. Chhabra, P., et al., Application of high-resolution time-of-flight chemical ionization mass spectrometry measurements to estimate volatility distributions of α-pinene and naphthalene oxidation products. Atmospheric Measurement Techniques, 2015. 8(1): p. 1-18. 29. Zhang, H., et al., Fundamental Time Scales Governing Organic Aerosol Multiphase Partitioning and Oxidative Aging. Environmental science & technology, 2015. 49(16): p. 9768-9777. 30. Cappa, C. and J. Jimenez, Quantitative estimates of the volatility of ambient organic aerosol. Atmospheric Chemistry and Physics, 2010. 10(12): p. 5409-5424. 31. Grieshop, A.P., N.M. Donahue, and A.L. Robinson, Is the gas‐particle partitioning in alpha‐pinene secondary organic aerosol reversible? Geophysical Research Letters, 2007. 34(14). 32. Kang, E., D. Toohey, and W. Brune, Dependence of SOA oxidation on organic aerosol mass concentration and OH exposure: experimental PAM chamber studies. Atmospheric Chemistry and Physics, 2011. 11(4): p. 1837-1852. 33. Lambe, A., et al., Effect of oxidant concentration, exposure time, and seed particles on secondary organic aerosol chemical composition and yield. Atmospheric Chemistry and Physics, 2015. 15(6): p. 3063-3075. 34. Tkacik, D.S., et al., Secondary organic aerosol formation from in-use motor vehicle emissions using a potential aerosol mass reactor. Environmental science & technology, 2014. 48(19): p. 11235-11242. 35. Ortega, A.M., et al., Real-time measurements of secondary organic aerosol formation and aging from ambient air in an oxidation flow reactor in the Los Angeles area. Atmospheric Chemistry and Physics, 2016. 16(11): p. 7411-7433. 36. Kroll, J.H., et al., Measurement of fragmentation and functionalization pathways in the heterogeneous oxidation of oxidized organic aerosol. Physical Chemistry Chemical Physics, 2009. 11(36): p. 8005-8014. 37. Shiraiwa, M. and J.H. Seinfeld, Equilibration timescale of atmospheric secondary organic aerosol partitioning. Geophysical Research Letters, 2012. 39(24). 38. Mai, H., et al., Under What Conditions Can Equilibrium Gas–Particle Partitioning Be Expected to Hold in the Atmosphere? Environmental science & technology, 2015. 49(19): p. 11485-11491. 39. Donahue, N., et al., Why do organic aerosols exist? Understanding aerosol lifetimes using the two-dimensional volatility basis set. Environmental Chemistry, 2013. 10(3): p. 151-157.

297
Experimental Testing of a Novel PCM-Desiccant Packet for Use in Cooling Vests in
Hot and Humid Conditions
Amane Abdulsamad, Michel Abisaber, Natalie El-Khatib, Rana Bashnak, Serge Haladjian, Mariam Itani Mechanical Engineering Department
American University of Beirut Beirut, Lebanon
[email protected] [email protected] [email protected] [email protected] [email protected] [email protected]
Abstract-Outdoor workers in hot environments suffer from high climate temperatures and sun exposure subjecting them to discomforts and heat stresses, thus affecting their productivity. Cooling vests that incorporate phase change material (PCM) in the form of packets that cover a high percentage of the human torso have been used to provide cooling and improve the thermal comfort of outdoor workers. PCM packets maintain a relatively low and stable body temperature while absorbing the heat from the human body and protecting it against the hot environment. Previous studies confirmed the cooling effectiveness of the vest and the improvement of thermal sensations, however, a counteractive effect was observed in the PCM cooling vest. Sweat accumulation in the microclimate region between the skin layer of the human body and the PCM packet was reported, which lead to uncomfortable conditions with the high PCM torso coverage area. In addition, sweat evaporation from the human skin was hindered, which is a means of cooling the body in hot conditions.
A novel design of the PCM packet is introduced, where a solid desiccant is integrated with the PCM to provide a solution to the issue of sweat blockage. The solid desiccant would adsorb the moisture from the microclimate region of the vest, thus providing dryer conditions and improving thermal and skin wetness sensation of workers in hot humid environment. An experimental setup is proposed to test the performance of the PCM-Desiccant packet. The experiment involves testing the packet on a wet clothed heated cylinder under two scenarios, where (1) a PCM-only packet and (2) a PCM-Desiccant packet are used. Temperature of the microclimate air region and its humidity content are measured. Temperatures of the PCM and solid desiccant were also measured for the two scenarios. Results of the experiments showed a dryer microclimate region through a decrease in the humidity content of the microclimate air in the presence of the solid desiccant
from 21.23 to 19.74 g/kg dry air. An increase in the microclimate temperature by 0.6 °C was also observed due to the solid desiccant.
KEYWORDS: PCM-Desiccant experimentation; phase change material; solid desiccant; cooling vest
I. INTRODUCTION
Passive cooling specifically on a personal level have been introduced as a tool to cool the human body while being active in the outdoors hot environments. PCM packets, which stands for phase change material packets can be implemented in a cooling vest design that can help cool the workers performing activities outdoors in a hot and humid environment [1]. When PCM packets are implemented in textiles, they are able to protect the workers against the hot conditions due to the PCM’s latent heat and its ability to absorb heat from both the hot environment and the workers themselves. Different melting temperatures of PCMs can be used in order to enhance comfort and the duration in which the PCM can be used [2]. The choice of PCM cooling vests is described by its affordability, cheap price and portability [3-5].
Findings show that having a lower PCM melting temperature is effective for cooling especially in hot environments [6-8]. The PCM cooling vest has been designed in order to increase the efficiency of workers and other labor working on sites by decreasing the heat stress and making it a comfortable environment for them to increase their productivity [9-11].
On the other hand, the effectiveness of such vests were limited due to the hot humid conditions that is
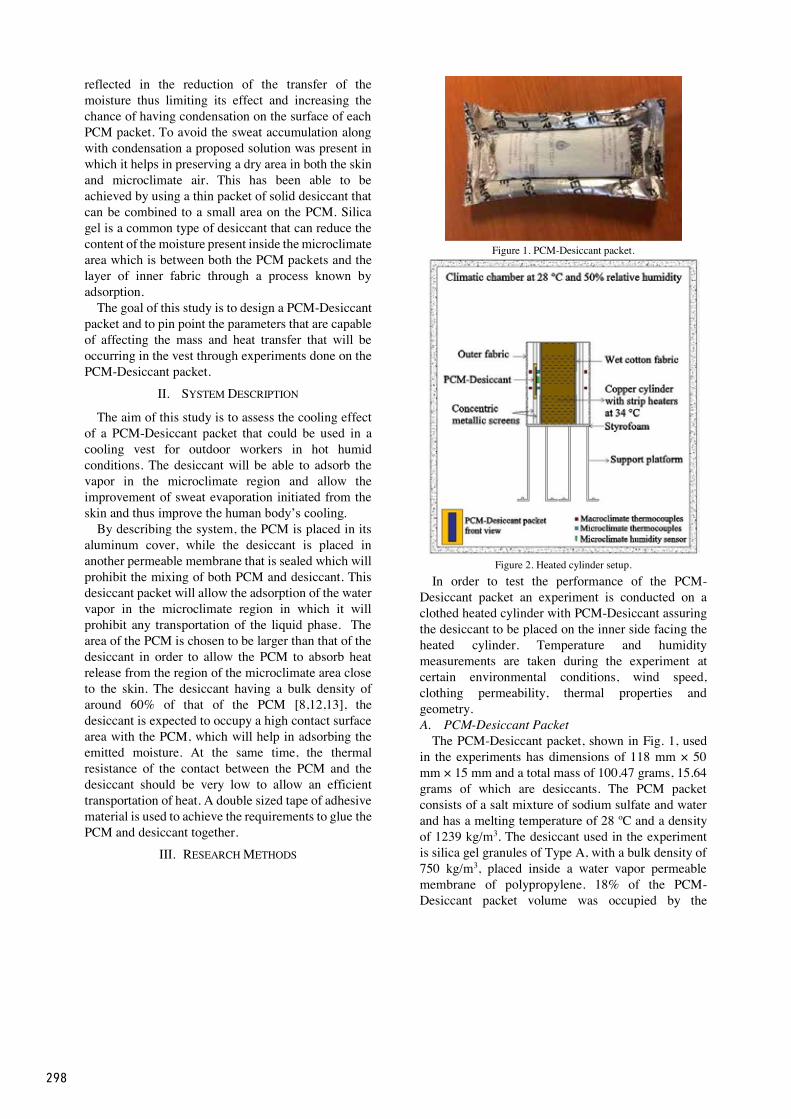
298
reflected in the reduction of the transfer of the moisture thus limiting its effect and increasing the chance of having condensation on the surface of each PCM packet. To avoid the sweat accumulation along with condensation a proposed solution was present in which it helps in preserving a dry area in both the skin and microclimate air. This has been able to be achieved by using a thin packet of solid desiccant that can be combined to a small area on the PCM. Silica gel is a common type of desiccant that can reduce the content of the moisture present inside the microclimate area which is between both the PCM packets and the layer of inner fabric through a process known by adsorption.
The goal of this study is to design a PCM-Desiccant packet and to pin point the parameters that are capable of affecting the mass and heat transfer that will be occurring in the vest through experiments done on the PCM-Desiccant packet.
II. SYSTEM DESCRIPTION
The aim of this study is to assess the cooling effect of a PCM-Desiccant packet that could be used in a cooling vest for outdoor workers in hot humid conditions. The desiccant will be able to adsorb the vapor in the microclimate region and allow the improvement of sweat evaporation initiated from the skin and thus improve the human body’s cooling.
By describing the system, the PCM is placed in its aluminum cover, while the desiccant is placed in another permeable membrane that is sealed which will prohibit the mixing of both PCM and desiccant. This desiccant packet will allow the adsorption of the water vapor in the microclimate region in which it will prohibit any transportation of the liquid phase. The area of the PCM is chosen to be larger than that of the desiccant in order to allow the PCM to absorb heat release from the region of the microclimate area close to the skin. The desiccant having a bulk density of around 60% of that of the PCM [8,12,13], the desiccant is expected to occupy a high contact surface area with the PCM, which will help in adsorbing the emitted moisture. At the same time, the thermal resistance of the contact between the PCM and the desiccant should be very low to allow an efficient transportation of heat. A double sized tape of adhesive material is used to achieve the requirements to glue the PCM and desiccant together.
III. RESEARCH METHODS
Figure 1. PCM-Desiccant packet.
Figure 2. Heated cylinder setup. In order to test the performance of the PCM-
Desiccant packet an experiment is conducted on a clothed heated cylinder with PCM-Desiccant assuring the desiccant to be placed on the inner side facing the heated cylinder. Temperature and humidity measurements are taken during the experiment at certain environmental conditions, wind speed, clothing permeability, thermal properties and geometry. A. PCM-Desiccant Packet
The PCM-Desiccant packet, shown in Fig. 1, used in the experiments has dimensions of 118 mm × 50 mm × 15 mm and a total mass of 100.47 grams, 15.64 grams of which are desiccants. The PCM packet consists of a salt mixture of sodium sulfate and water and has a melting temperature of 28 ºC and a density of 1239 kg/m3. The desiccant used in the experiment is silica gel granules of Type A, with a bulk density of 750 kg/m3, placed inside a water vapor permeable membrane of polypropylene. 18% of the PCM-Desiccant packet volume was occupied by the
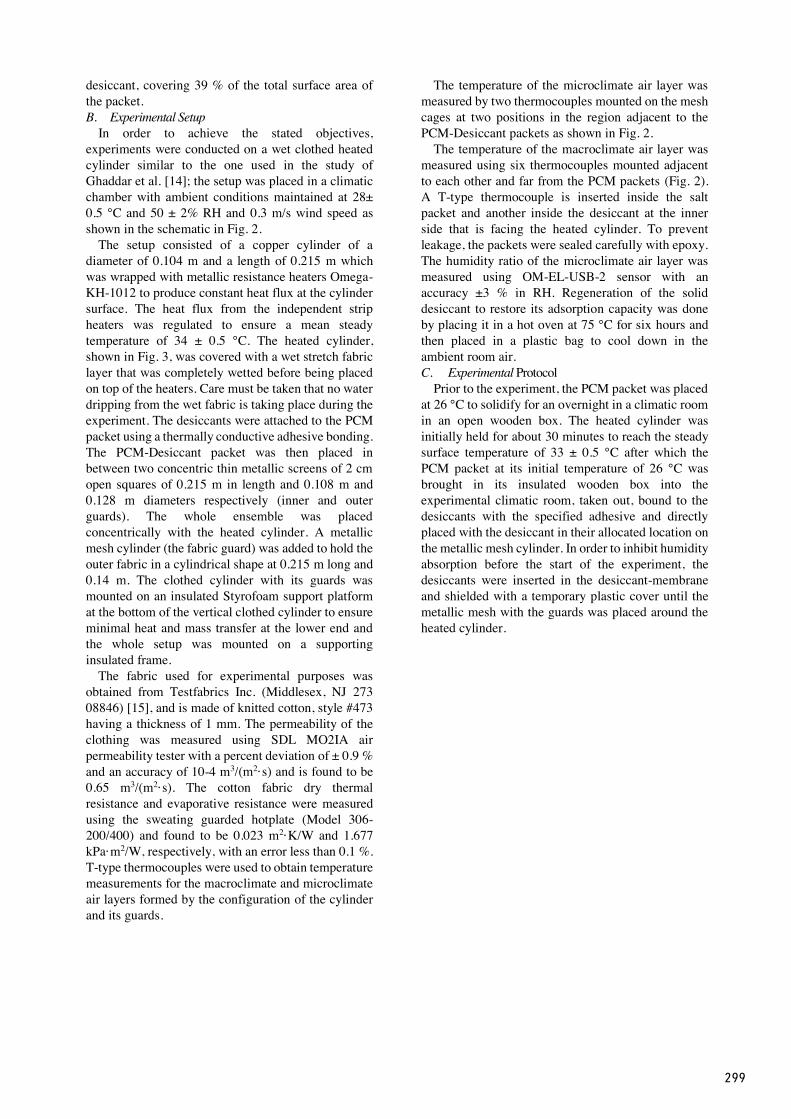
299
desiccant, covering 39 % of the total surface area of the packet. B. Experimental Setup
In order to achieve the stated objectives, experiments were conducted on a wet clothed heated cylinder similar to the one used in the study of Ghaddar et al. [14]; the setup was placed in a climatic chamber with ambient conditions maintained at 28± 0.5 °C and 50 ± 2% RH and 0.3 m/s wind speed as shown in the schematic in Fig. 2.
The setup consisted of a copper cylinder of a diameter of 0.104 m and a length of 0.215 m which was wrapped with metallic resistance heaters Omega-KH-1012 to produce constant heat flux at the cylinder surface. The heat flux from the independent strip heaters was regulated to ensure a mean steady temperature of 34 ± 0.5 °C. The heated cylinder, shown in Fig. 3, was covered with a wet stretch fabric layer that was completely wetted before being placed on top of the heaters. Care must be taken that no water dripping from the wet fabric is taking place during the experiment. The desiccants were attached to the PCM packet using a thermally conductive adhesive bonding. The PCM-Desiccant packet was then placed in between two concentric thin metallic screens of 2 cm open squares of 0.215 m in length and 0.108 m and 0.128 m diameters respectively (inner and outer guards). The whole ensemble was placed concentrically with the heated cylinder. A metallic mesh cylinder (the fabric guard) was added to hold the outer fabric in a cylindrical shape at 0.215 m long and 0.14 m. The clothed cylinder with its guards was mounted on an insulated Styrofoam support platform at the bottom of the vertical clothed cylinder to ensure minimal heat and mass transfer at the lower end and the whole setup was mounted on a supporting insulated frame.
The fabric used for experimental purposes was obtained from Testfabrics Inc. (Middlesex, NJ 273 08846) [15], and is made of knitted cotton, style #473 having a thickness of 1 mm. The permeability of the clothing was measured using SDL MO2IA air permeability tester with a percent deviation of ± 0.9 % and an accuracy of 10-4 m3/(m2·s) and is found to be 0.65 m3/(m2·s). The cotton fabric dry thermal resistance and evaporative resistance were measured using the sweating guarded hotplate (Model 306-200/400) and found to be 0.023 m2·K/W and 1.677 kPa·m2/W, respectively, with an error less than 0.1 %. T-type thermocouples were used to obtain temperature measurements for the macroclimate and microclimate air layers formed by the configuration of the cylinder and its guards.
The temperature of the microclimate air layer was measured by two thermocouples mounted on the mesh cages at two positions in the region adjacent to the PCM-Desiccant packets as shown in Fig. 2.
The temperature of the macroclimate air layer was measured using six thermocouples mounted adjacent to each other and far from the PCM packets (Fig. 2). A T-type thermocouple is inserted inside the salt packet and another inside the desiccant at the inner side that is facing the heated cylinder. To prevent leakage, the packets were sealed carefully with epoxy. The humidity ratio of the microclimate air layer was measured using OM-EL-USB-2 sensor with an accuracy ±3 % in RH. Regeneration of the solid desiccant to restore its adsorption capacity was done by placing it in a hot oven at 75 °C for six hours and then placed in a plastic bag to cool down in the ambient room air. C. Experimental Protocol
Prior to the experiment, the PCM packet was placed at 26 °C to solidify for an overnight in a climatic room in an open wooden box. The heated cylinder was initially held for about 30 minutes to reach the steady surface temperature of 33 ± 0.5 °C after which the PCM packet at its initial temperature of 26 °C was brought in its insulated wooden box into the experimental climatic room, taken out, bound to the desiccants with the specified adhesive and directly placed with the desiccant in their allocated location on the metallic mesh cylinder. In order to inhibit humidity absorption before the start of the experiment, the desiccants were inserted in the desiccant-membrane and shielded with a temporary plastic cover until the metallic mesh with the guards was placed around the heated cylinder.

300
Figure 3. Experimental setup, components and sensors used. The average value of each of the two air layer
temperatures recorded by the thermocouples are computed. The temperatures are sampled at 1 reading/10s and logged by the OM-DAQPRO-3500 data logger shown in Fig. 3.
IV. RESULTS AND DISCUSSION
In order to test the effectiveness of adding desiccant packets, it was necessary to perform two experiments on the heated wet cylinder: one with PCM packets alone, and another with PCM-Desiccant packets. After that, the temperature and humidity of the microclimate in both experiments are compared.
For the case when no desiccant is used, the temperature of the PCM is initially around 26 °C. It starts to rise as the PCM gains heat till it reaches its melting temperature (28 °C) after about 35 mins from the start of the experiment as shown in Fig. 4. As for the microclimate, its temperature increases directly at the beginning of the experiment because it is being subjected to a high temperature from the heated cylinder as shown in Fig. 5. It stabilizes at 32 °C after 15 minutes from the beginning of the experiment. The microclimate air humidity ratio at the beginning of the experiment was measured to be 16.8 g/kg dry air. It increased to reach 21.23 g/kg dry air at the end of the experiment.
Figure 4. Plot showing the variation with time of the PCM temperature in the experiment when only PCM was used.
Figure 5. Plot showing the variation with time of the microclimate
temperature in the experiment when only PCM was used. As for the case in which the desiccant packets are
added, the temperature of the PCM, shown in Fig. 6, is also initially at 26 °C. It increases to reach its melting point after 22 mins. It continues melting at constant temperature. During the PCM transient phase, the temperature of the desiccant was higher than that of the PCM. This is mainly due to the thermal contact resistance between them, as well as the heat of adsorption released.
The temperature of the microclimate and that of the macroclimate showed a sharp increase at the beginning due to their exposure to the high temperature of the heated cylinder, as represented in Fig. 7. They then stabilized after 20 mins from the experiment. It is important to note that the temperature of the microclimate was greater than that of the macroclimate because it was closer to the heated cylinder. The humidity ratio was initially at 16.9 g/kg dry air. It increased to reach 19.74 g/kg dry air at the end of the experiment. This value is less than that attained at the end of the experiment when no desiccant was used. This verifies the effect of the desiccant in reducing the humidity ratio. It was also noted that the microclimate temperature was higher in the case when PCM-Desiccant packets were used, therefore indicating that the desiccant increased the temperature of the microclimate.

301
Figure 6. Plot showing the time variation of the PCM and desiccant temperatures corresponding to the PCM-Desiccant experiment.
Figure 7. Plot showing the variation with time of the microclimate and macroclimate temperature in the PCM-Desiccant experiment.
Figure 8. Plot showing the variation in the microclimate air relative
humidity in both experiments. Fig. 8 shows the results for the microclimate relative
humidity, which is decreasing with time in both experiments, while the moisture content is increasing. However, in the second experiment, when a desiccant packet was added, the relative humidity of the microclimate decreased more than it did in the first experiment, when only PCM packets were used. In the first experiment, it reached 70% at the end of the experiment, while in the second experiment, it reached a slightly lower value of 65%. As for the humidity ratio, it reached 21.23 g/kg dry air in the first experiment, and 19.74 g/kg dry air in the second experiment. This indicates that the desiccant helped in reducing the humidity content of the microclimate, thus achieving the desired purpose.
After analyzing the experimental results, it was shown that the problem of blockage of transport of the water vapor along the PCM packets could be solved by using desiccant packets that allow a reduction in the humidity of the microclimate, keeping a high surface of contact between the skin and PCM at the same time. Therefore, no sweat accumulation will occur on the PCM packets, and better thermal comfort is attained. The study of Itani et al. [11] has set certain environmental restrictions on the use of the PCM packets to avoid condensation. When the ambient temperature is 28 °C, 35 °C or 45 °C there should be an upper limit of the ambient relative humidity at which the cooling vest can be used, which is at 80%, 53% and 31%, respectively. However, when desiccant packets are added to the vest, it can be used in more regions with higher relative humidity since the risk of condensation decreases. In order to attain similar results in cooling as the previous PCM-vest, it is suggested to add more PCM packets thus increasing the mass of the vest. Another suggestion could be using PCM packets alone in some places of the vest, and PCM-Desiccant packets in other places. This will attain a good performance of the vest in HH environments. These design suggestions will be studied in future work in order to design an optimal PCM-Desiccant vest which uses the most appropriate combination of packets, weight, and melting duration of the PCM.
V. CONCLUSION
In this study, a novel idea is proposed incorporating a cooling vest made from phase change material and desiccants. The aim was to find the state of the microclimate air and its moisture content under the influence of using a PCM-Desiccant packet in which good thermal comfort is provided for the person wearing the vest and subjected to physical effort. The idea entails using a solid desiccant in addition to a PCM packet to maintain dry skin and microclimate air layers, prevent condensation responsible of decrease of performance of the PCM and enhance sweat evaporation from the skin. Experiments are conducted on a clothed wet heated cylinder with two cases considered: the first with PCM alone and the second with PCM-Desiccant combination to show the effect of adding the desiccant to the PCM packet. Microclimate air temperatures and relative humidity as well as PCM and desiccant temperatures were measured experimentally. The results showed a desired effect, which is the decrease in the humidity content of the microclimate air from 21.23 g/kg dry air to 19.74 g/kg dry air in the presence of the solid desiccant. Higher microclimate temperature by 0.6 °C

302
was attained when using the PCM-Desiccant packet instead of the PCM packet.
Future work will address optimized design of PCM-Desiccant cooling vest for best combination and placement of PCM-Desiccant and PCM packets taking into consideration human thermal response to local cooling and dryness. Experiments on a thermal manikin can be done to better validate the efficiency of the cooling vest.
REFERENCES [1] Johnson JK. “Evaluation of Four Portable Cooling Vests for
Workers Wearing Gas Extraction Coveralls in Hot Environments.” Graduate Theses and Dissertations, University of South Florida, United States, 2013.
[2] Sharma RK, Ganesan P, Tyagi VV, Metselaar HSC, Sandaran SC. “Developments in organic solid–liquid phase change materials and their applications in thermal energy storage.” Energy Conversion and Management 2015;95:193–228.
[3] Kamon E, Kenney WL, Deno NS, Soto KI, Carpenter AJ. “Readdressing Personal Cooling With Ice.” Aihaj 1986;47:293–8.
[4] S. R. Coleman, “Heat Storage Capacity of Gelled Coolants in ice Vests,” Aihaj, vol. 50, no. 6, pp. 325–329, 1989. .
[5] Kenny GP, Schissler AR, Stapleton J, Piamonte M, Binder K, Lynn A, et al. “Ice Cooling Vest on Tolerance for Exercise under Uncompensable Heat Stress. Journal of Occupational and Environmental Hygiene” 2011;8:484–91. doi:10.1080/15459624.2011.596043.
[6] Qiu Y, Jiang N, Wu W, Zhang G, Xiao B. “Heat Transfer of Heat Sinking Vest with Phase-change Material.” Chinese Journal of Aeronautics 2011;24:720–5. doi:10.1016/s1000-9361(11)60084-8.
[7] Hamdan H, Ghaddar N, Ouahrani D, Ghali K, Itani M. “PCM cooling vest for improving thermal comfort in hot environment.” International Journal of Thermal Sciences 2016;102:154–67. doi:10.1016/j.ijthermalsci.2015.12.001.
[8] Itani M, Ouahrani D, Ghaddar N, Ghali K, Chakroun W. “The effect of PCM placement on torso cooling vest for an active human in hot environment. Building and Environment” 2016;107:29–42. doi:10.1016/j.buildenv.2016.07.018.
[9] Shim H, Mccullough EA, Jones BW. ‘Using Phase Change Materials in Clothing.” Textile Research Journal 2001;71:495–502. doi:10.1177/004051750107100605.
[10] Chou C, Tochihara Y, Kim T. “Physiological and subjective responses to cooling devices on firefighting protective clothing.” European Journal of Applied Physiology 2008;104:369–74. doi:10.1007/s00421-007-0665-7.
[11] Itani M, Ghaddar N, Ghali K, Ouahrani D, Chakroun W. “Cooling vest with optimized PCM arrangement targeting torso sensitive areas that trigger comfort when cooled for improving human comfort in hot conditions.” Energy and Buildings 2017;139:417–25.
[12] Narayanan R, Saman W, White S, Goldsworthy M. “Comparative study of different desiccant wheel designs.” Applied Thermal Engineering 2011;31:1613–20. doi:10.1016/j.applthermaleng.2011.01.043.
[13] JIAYOU Q. “Characterization of silica gel-water vapor adsorption and its measurement facility” Master dissertation, National University of Singapore, Singapore, 2004.
[14] Ghaddar N, Ghali K. “Effect of Moisture Transport on Mixed Convection in Vertical Annulus of a Heated Clothed Vertical Wet Cylinder in Uniform Cross Wind.”
2010 14th International Heat Transfer Conference, Volume 7 2010. doi:10.1115/ihtc14-22342.
[15] Testfabrics. http://www.testfabrics.com/products.php?catID1=TWpBPQ&%3BcatID2=1; [accessed 04.01.17].

303
Modeling of Human Coronary Arteries Fluid Structure Interaction
Marc Bassil
Department of Mechanical Engineering American University of Beirut – A.U.B.
Beirut, Lebanon [email protected]
Karl Moukarzel Department of Mechanical Engineering American University of Beirut – A.U.B.
Beirut, Lebanon [email protected]
Karim Msann Department of Mechanical Engineering American University of Beirut – A.U.B.
Beirut, Lebanon [email protected]
Anthony Hadwan Department of Mechanical Engineering American University of Beirut – A.U.B.
Beirut, Lebanon [email protected]
Abstract — The main aim of this report is to describe how to construct an innovative computational model of a human coronary arterial structure for hemodynamic analysis. The model will permit distinguishing transient and spatial hemodynamic supply in human vasculature. This is solely based on numerical analysis mainly conducted on software such as MATLAB, ANSYS, etc. In fact, by the end of this project, it is expected to deliver a 3D CAD of the human coronary arterial system. Moreover, a detailed literature review on heart function, modeling history of blood flow, necessity of modeling numerical models, and fluid structure interaction is elaborated throughout the semester. In addition, a 3D computational model is provided by the adviser based on a real patient’s data. This structure simulating human arterial system using computational fluid dynamics (CFD) is to be combined with a lumped model at the boundaries.This model is crucial to the development of cardiovascular science. Since many preliminary heart tests and surgeries involve invasive procedures, developing a more accurate diagnosis method is a great asset to the medical field.
Index Terms— Coronary Artery, Fluid Structure Interaction, FSI, Pressure, Velocities, Lumped Model, Boundary Conditions, Heart, Modeling, Blood.
I. INTRODUCTION a. Modeling History of Blood Flow
In the 17 - century, Human dissection became allowed in England despite the previous Church oppositions. Based on William Harvey’s medicine studies, he gave a lecture about the circulation of blood is initiated from the heart through the arteries in a continuous cycle in which he contradicted the Galen assumptions that were applied and approved during the last centuries regarding the blood being produced in the liver. In the end of the 17 - century, scientist Isaac Newton wrote the book “the Principia Mathematicia” about flow motion and interaction of a fluid. Later on, arterial blood pressure could be measure for the first time by Stephen Hales. It could also determine the elasticity of the arterial tree as well as its crucial matter of initiating flow. After that, the conservation of energy
principles regarding fluids was determined by Bernoulli, which was used on problems in the blood flow of arteries. But it did not take into account a term in the equation regarding the energy due to viscous forces. That only can be applied on zero viscosity fluids. In 1845, the Navier- Stokes equation was found considering all the necessary terms. Later on, Poisseuille proved through many experiments that the pressure in the aorta and in all the arterial branches is always equal. He then defined an inverse proportional relation between pressure drop and the radius of the artery, which confirmed the necessity to study blood flow at the arteries. Womersley defined a number in his own name called Womersley number that is a non-dimensional number, which defines pulsatile stream in the Navier- Stokes equation applied on a tube. Despite the fact that these arrangements are useful, they are excessively basic, making it impossible to be of much advantage in researching reasonable blood circulatory issues. These days, we have reached a point where Computational numerical methods are being applied through advanced software in every scientific research field in which it is required to solve complex equations and procedures. The exactness of these methods relies on upon how well the conditions portray the issue being considered. The difficulty and complexity of applying this investigation in realistic blood vessels should be considered. This process called Discretization occurs on mathematical algebraic equations while taking into account that the solution is found at a limited number of repetitions and location.Thus, multiple favorable benefits come from numerical computational methods such as cheap cost, high speed, detailed data at every area of intrigue, simulation of difficult geometries, and the capacity of a complete optimization. However, sometimes there are some inaccuracies in the representation in the model of equation, which is not very precise regarding the actual issue being explored.
b. Necessity of Numerical Models

304
Nowadays, cardiovascular diseases (CVD) are the main causes of death in industrial countries. Due to the very high hemodynamic loads applied on the left ventricle, there is a very high risk for cardiovascular diseases to initiate and propagate. For instance, arterial diseases such as ‘atherosclerosis’ (also known as Plaque deposition) are one of the most crucial causes of death in the western countries of the world. These plaques deposits (made up of cholesterol mostly) are formed on the inside wall of the artery and can lead to a decrease in the blood flow and ultimately lead to heart attack (Quarteroni, 2001). It is possible to reduce the mortality rate and prevent the cardio vascular diseases to propagate by clinical diagnosis and prognosis. However, most of the factors of CVD cannot be well identified during clinical examinations. In 1970s, the only way to analyze cardiovascular blood flow was through animals’ experiments or in vitro. Also, there was the appearance of this invasive tool called ‘catheter’ that measures the blood flow and the pressure. However, this method is hard to perform during which many complications could occur. Later on, there was the appearance of new non-invasive data-acquisition technologies such as Magnetic Resonance Imaging (MRI), Digital subtraction angiography (DSA) and Computed Tomography scanners (CT), as well as three-dimensional geometric reconstruction algorithms. Now due to the advances and progress in computational fluid dynamics (CFD) and in computer performance, there is now a promising and potential future for the research in the cardiovascular blood flow subject (Kokalari, Karaja, & Guerrisi, 2013). Thus, in order to understand the genesis and development of cardiovascular disorders, a mathematical model of the human cardiovascular system is needed using the most advanced computer software for the simulation and Lumped models are used to simulate the blood flow in arteries. The process of modeling usually begins by analyzing the images obtained from the MRI or CT scanners and then by proceeding with the building of the simulation model. These accurate numerical models could aid in clinical decision-making and help surgeons make the appropriate decision when selecting the procedure they wish to apply (Doost, Ghista, Su, Zhong, & Morsi, 2016).
c. Evolution of Simulation Methods
Computational fluid dynamics (CFD) is a crucial method used in engineering in order to crack difficult problems by creating an appropriate mathematical model. The main factors that are taken into account are the heat transfer and the fluid flow. Recently, CFD has been excessively used for the purpose of getting to the bottom of cardiovascular diseases (CVD) and especially the case of the coronary arteries diseases that are due to plaques deposition (Taylor, Fonte, & Min, 2013). CFD models simulations allow the doctors to calculate the risk and to make the adequate decision for each patient regarding the degree of the disease (Morris, 2015). The finite volume method (FVM) is a discretization method that is commonly used to discretize CFD complex mathematical equations. It works by dividing the physical area into many control volumes (CV) and then by integrating each part over each CV (A. D. Villiers,
2012). It is well used in the biomedical field especially in the case of coronary arteries diseases. The Finite Element analysis (FEA), also known as Finite Element Method (FEM), is a numerical method that provides approximate solutions to complex mathematical equations with defined boundary conditions by using partial differentiation. The geometry and the material properties are crucial criteria that should also be considered when solving. Basically, the part is divided into a finite number of very small elements, which are analyzed and solved individually by mathematical equations. One application of FEA in the biomedical field is the study of the mechanical behaviour of coronary artery stents (Auricchio & Conti, 2010). The lattice Boltzmann method (LBM) is capable of building an appropriate model for any particular flow (single and multiphase flow) having difficult geometries such as the case of the coronary arteries. This technique depends on the Navier-Stokes equation. Unlike the typical Computational Fluid Dynamics methods which deal with macroscopic parameters, LBM works over a discrete mesh at each lattice point (microscopic level) and one its main advantage is solving complex boundary conditions (Randles, 2013). The Immersed Boundary (IB) method came through to analyze flow variations especially when facing problems where an incompressible fluid passes through a wall tube with elastic properties. This IB method is represented in Euleurian form and its equations’ structure is written using a Lagrangian coordinate system. It is very useful in the case of blood flow in coronary arteries (Fogelson & Guy, 2007). Finally, the main motivation of this topic is to build a 3D model of a human coronary arterial system for hemodynamic properties.
II. METHODS
In order to develop a solution for the proposed model as well as to create simulations of the blood flow in coronary arteries, it is necessary to construct a clear and detailed path. Following precisely a specific methodology, allows the team to move faster in the realization of the final product. First, it is important to find and build a physical model of a coronary artery in order to support this topic. In fact, one of the main objectives at the beginning of the research process is to build a geometry representation of a sample of coronary artery. It can be found from real physiological data of an actual patient or by building a tube model in a more simple way. In the case of this study, Iyad Fayssal, a collaborator on this topic, provides a real physiological data. Second, after receiving the corresponding information, it is important to move forward with the meshing of the domain. Going through this step, will increase the quality, the standard, the speed and the accuracy of the solution. Moreover, it is urged to use the finite volume method (FVM) in order to divide the tube into small equal volume, where conditions applied are similar. Third, it is now the time to go through the governing equations: the Navier-Stokes equation as well as the mass balance relation. These two equations are fundamental in the solution process. However, since they represent continuous relation, it is important to transform them into district control volume in order to adapt them to the

305
previous steps and to reach a solution. Fourth, now that the equations are set, it is required to define our parameters and to get them. The pressure P and the velocity components (Vx, Vy, Vz) should be computed applying the mentioned equations. However, the expected solution at this stage is infinite, which is not acceptable. Fifth, in order to get one unique solution, a set of boundary conditions should be settled. The most relevant condition is the no slip condition at the wall. It means that the velocity of the fluid at the wall should acquire the velocity of the wall. It is also recommended to assume Newtonian flow and no fixed pressure at boundary conditions. In addition, it is mandatory to study the boundary conditions at the inlet and outlet of the sample of the coronary artery. Although the rest of the heart connections and vessels are not accounted physically, it is required to account for their effects on the blood flow and it cannot be ignored (downstream). Sixth, it is advised to test the boundary conditions on the model built. It is true that no final product should be submitted without testing and double checking. Seventh, it is urged to couple a 3D simulation with the 1D simplified model. It consists of a critical operation that will result in the final product that the team should reach at the end of the academic year. The material of the artery was created in the Engineering Data of the Transient Structural block with a density of 1120 kg/m3, a Young’s Modulus of 1.08E+06 Pa, a Poisson ratio of 0.49 and a Shear Modulus of 3.62E+05 Pa. A simple geometry was sketched and it consisted of drawing two cylinders of different diameters and subtracting one from the other using the Boolean operator. In the model of the transient structural block, the blood was to be suppressed and then meshing of the artery was done. Also named selections were created for the faces of interest. Afterwards, an FSI surface was assigned on the inner part of the artery after which inflation was added on the outlet face of the artery. Under the transient sub-block, the outer edges of the tube were chosen to be fixed supports while the Fluid solid interface was setup in the inside of the tube where there is a continuous contact between the blood and the interior surface of the artery. Moreover, the geometry built in the Transient Structural block was linked to a Fluid Flow (Fluent) block, in which the meshing of the blood was done. The blood was set to be the working fluid with a density of 1050 kg/m3. As for the viscosity, a carreau model was chosen for the set up: time constant as 3.313s, Power-Law index as 0.3568, zero shear viscosity as 0.056 kg/m-s and the infinite shear viscosity as 0.0035 kg/m-s. As for the boundary conditions, a pressure was assigned at the inlet and outlet (12100 Pa-12000 Pa) as an initial test, a fluid zone on the inside and a wall for the outside boundary. Additionally the blood mesh was chosen to be dynamic with smoothing type, as for the surface blood (wall) system coupling was assigned. Piso was chosen as scheme for pressure-velocity coupling which represent best a transient state.
Finally, a two-way coupling is needed to visualize the effect of the blood on the artery and vice versa, at each time interval. The purpose is to monitor the deformation of the artery throughout the circulation of the blood. The boundary condition at the inlet is a Pressure represented in a sine wave form that accounts for
the pressure of the blood entering the artery in our model. As for the outlet boundary condition, the MatLAB code, translated into a boundary condition code in fluent, accounts for the effect of the muscles and organs on the other end of the coronary artery. Following our initial assumptions, the effect of these organs cannot be neglected and must be taken into account. That is why the code is adaptive and responsive to the change in pressure and velocity at each time step.
III. RESULTS
IV. ACKNOWLEDGMENTS We would like first and foremost to thank Dr. Fadl Moukalled, our advisor, for choosing us and giving us the opportunity to work on this project. It is also important for us to show our gratitude for Mr. Iyad Fayssal. His guidance and support were a great asset to the advancement of our project. We couldn't have done it without him since he contributed to the organization of the analysis and the continuous progress. We would also like to thank Dr. Lama Hamandi for her help in solving the lumped and deriving the equations. Finally, we want to thank Miss. Nadine El Hajj, an EECE graduate student currently doing a PHD at AUB, for her assistance in implementing our MATLAB code.
V. REFERENCES 1 Kim, H. J., Vignon-Clementel, I. E., Coogan, J. S., &
Figueroa, C. A. (2010). Patient-Specific Modeling of blood Flow and Pressure in Human Coronary Arteries.
2 Jonasova, A., Vimmr, J., & Bublik, O. (n.d.). blood flow simulations in patient-specific aorto- coronary bypass models: the role of boundary conditions.
3 Catanho, M., Sinha, M., & Vijayan, V. (n.d.). Model of Aortic Blood Flow Using the Windkessel Effect.
4 Smith, N. P., Pullan, A. J., & Hunter, P. J. (2002). AN ANATOMICALLY BASED MODEL OF TRANSIENT CORONARY BLOOD FLOW IN THE HEART.
5 Ortiz-León, G., Vílchez-Monge, M., & Montero-Rodríguez, J. J. (n.d.). Simulations of the Cardiovascular System Using the Cardiovascular Simulation Toolbox.
6 Fogarotto, F., Conti, M., & Aurichio, F. (2010). Finite Element Analysis of Coronary Artery Stenting.
7 Kokalari, I., Karaja, T., & Guerrisi, M. (2013). Review on lumped parameter method for modeling the blood flow in systemic arteries (Vol. 6, 92-99).
8 Quarteroni, A. (2001). Modeling the Cardiovascular System— A Mathematical Adventure: Part I (Vol. 34, Ser. 5).
9 Quarteroni, A. (2001). Modeling the Cardiovascular System— A Mathematical Adventure: Part II (Vol. 34, Ser. 6).

306
10 Taylor, C. A., Fonte, T. A., & Min, J. K. (2013). Computational fluid dynamics applied to cardiac computed tomography for non invasive quantification of fraction flow reserve.
11 Villiers, A. D. (2012). Modelling blood ow in large arteries using the finite volume method.Kim, Y., Lim, S., Raman, S., Simonetti, O., & Friedman, A. (2009). Blood Flow in a Compliant
12 Vessel by the Immersed Boundary Method (Vol. 37, Ser. 5).Vimmr, J., & Jonasova, A. (2009). Non-Newtonian effects of blood flow in complete coronary and femoral bypasses.
13 Qiao, A., Liu, Y., Li, S., & Zhao, H. (2005). Numerical Simulation of Physiological Blood Flow in 2-way Coronary Artery Bypass Grafts.
14 Doost, S., Ghista, D., Su, B., Zhong, L., & Morsi, Y. (2016). Heart blood flow simulation: A perspective review.
15 Morris, P. (2015). Computational fluid dynamics modelling in cardiovascular medicine. Mader, S. S. (n.d.). Human Biology (11th ed.).
16 Randles, A. (2013). Modeling Cardiovascular Hemodynamics Using the Lattice Boltzmann Method on Massively Parallel Supercomputers.
17 Bessonov, Sequeira, Simakov, Vassilevskii, & Volpert. (2016). Methods of Blood Flow Modelling (Vol. 11, Ser. 1).
18 Nilsson, J. W., & Riedel, S. A. (2011). Electric circuits (9th ed.). Pearson.Zill, D. G. (2012). A first course in Differential equations with Modeling applications(10th ed.).
19 A. R. (2013). Electrical Engineering: Principles and Applications (6th ed.).
20 White, F. M. (n.d.). Fluid Mechanics (7th ed.). McGraw Hill.
21 Lawrence, K. (n.d.). ANSYS Workbench Tutorial Release 14 (14th ed.). SDC publications.
22 Nakasone, Y., Stolarski, T. A., & Yoshimoto, S. (2006). Engineering analysis with ANSYS software. Oxford: Butterworth-Heinemann.
23 Schobeiri, M. (2010). Fluid mechanics for engineers: A graduate textbook. Berlin: Springer. Schlichting, H., Gersten, K., Krause, E., & Oertel, H. (2017). Boundary-layer theory. Berlin: Springer.
24 Gacek, J. D. (2007). Numerical simulation of flow through a spillway and diversion structure.
25 Nahvi, M., & Edminister, J. (2004). Electric circuits. New York: McGraw-Hill.
26 Chakrabarti, S. K., & Brebbia, C. A. (2001). Fluid structure interaction. Southampton: WIT Press. Fluid structure interaction. (2010). Berlin: Springer.
27 Bungartz, H. (1997). Fluid structure interaction: 3D numerical simulation and visualization of a micropump. Munich: Mathematisches Institut und Institut für Informatik der Technischen Universität München.
28 FSI: Modeling, adaptive discretisations and solvers. (2017). DE GRUYTER.Worster, M. G. (2009).
Understanding fluid flow. Cambridge: Cambridge University Press.
29 Gilat, A. (2008). MATLAB: An introduction with applications. Hoboken, NJ: Wiley.
30 Blume, P. A. (2004). Mechanical vibrtn & intro matlab. Place of publication not identified: Prentice Hall.
31 Leibowitz, J. O. (1970). The history of coronary heart disease. Berkeley: University of California Press.
32 J., D. F., & Krestin, G. P. (2005). Computed tomography of the coronary arteries. London: Taylor & Francis.
33 Fulton, W. F. (1965). The coronary arteries; arteriography, microanatomy, and pathogenesis of obliterative coronary artery disease. Springfield, IL: Thomas.

307
10 Taylor, C. A., Fonte, T. A., & Min, J. K. (2013). Computational fluid dynamics applied to cardiac computed tomography for non invasive quantification of fraction flow reserve.
11 Villiers, A. D. (2012). Modelling blood ow in large arteries using the finite volume method.Kim, Y., Lim, S., Raman, S., Simonetti, O., & Friedman, A. (2009). Blood Flow in a Compliant
12 Vessel by the Immersed Boundary Method (Vol. 37, Ser. 5).Vimmr, J., & Jonasova, A. (2009). Non-Newtonian effects of blood flow in complete coronary and femoral bypasses.
13 Qiao, A., Liu, Y., Li, S., & Zhao, H. (2005). Numerical Simulation of Physiological Blood Flow in 2-way Coronary Artery Bypass Grafts.
14 Doost, S., Ghista, D., Su, B., Zhong, L., & Morsi, Y. (2016). Heart blood flow simulation: A perspective review.
15 Morris, P. (2015). Computational fluid dynamics modelling in cardiovascular medicine. Mader, S. S. (n.d.). Human Biology (11th ed.).
16 Randles, A. (2013). Modeling Cardiovascular Hemodynamics Using the Lattice Boltzmann Method on Massively Parallel Supercomputers.
17 Bessonov, Sequeira, Simakov, Vassilevskii, & Volpert. (2016). Methods of Blood Flow Modelling (Vol. 11, Ser. 1).
18 Nilsson, J. W., & Riedel, S. A. (2011). Electric circuits (9th ed.). Pearson.Zill, D. G. (2012). A first course in Differential equations with Modeling applications(10th ed.).
19 A. R. (2013). Electrical Engineering: Principles and Applications (6th ed.).
20 White, F. M. (n.d.). Fluid Mechanics (7th ed.). McGraw Hill.
21 Lawrence, K. (n.d.). ANSYS Workbench Tutorial Release 14 (14th ed.). SDC publications.
22 Nakasone, Y., Stolarski, T. A., & Yoshimoto, S. (2006). Engineering analysis with ANSYS software. Oxford: Butterworth-Heinemann.
23 Schobeiri, M. (2010). Fluid mechanics for engineers: A graduate textbook. Berlin: Springer. Schlichting, H., Gersten, K., Krause, E., & Oertel, H. (2017). Boundary-layer theory. Berlin: Springer.
24 Gacek, J. D. (2007). Numerical simulation of flow through a spillway and diversion structure.
25 Nahvi, M., & Edminister, J. (2004). Electric circuits. New York: McGraw-Hill.
26 Chakrabarti, S. K., & Brebbia, C. A. (2001). Fluid structure interaction. Southampton: WIT Press. Fluid structure interaction. (2010). Berlin: Springer.
27 Bungartz, H. (1997). Fluid structure interaction: 3D numerical simulation and visualization of a micropump. Munich: Mathematisches Institut und Institut für Informatik der Technischen Universität München.
28 FSI: Modeling, adaptive discretisations and solvers. (2017). DE GRUYTER.Worster, M. G. (2009).
Understanding fluid flow. Cambridge: Cambridge University Press.
29 Gilat, A. (2008). MATLAB: An introduction with applications. Hoboken, NJ: Wiley.
30 Blume, P. A. (2004). Mechanical vibrtn & intro matlab. Place of publication not identified: Prentice Hall.
31 Leibowitz, J. O. (1970). The history of coronary heart disease. Berkeley: University of California Press.
32 J., D. F., & Krestin, G. P. (2005). Computed tomography of the coronary arteries. London: Taylor & Francis.
33 Fulton, W. F. (1965). The coronary arteries; arteriography, microanatomy, and pathogenesis of obliterative coronary artery disease. Springfield, IL: Thomas.
High Impact Properties of Bio-Inspired Structures Ahmad Najia Amjad Kiwan Makram Imad
Rayan Mouwafak Department of Mechanical Engineering
American University of Beirut Riad El-Solh, Beirut 1107 2020, Lebanon
[email protected] [email protected] [email protected] [email protected]
Abstract-This paper studies the high-speed impact response of bio-
inspired structures. The structures of the Bighorn Sheep’s Horn will be examined. Relationships between structural and mechanical properties for these materials will be established and the effect of several factors on energy absorbing capabilities will be investigated. Numerical analysis will be done using finite element models developed in ABAQUS and experimental analysis will be carried out by performing high strain experiments on foam specimens using a drop weight test machine to validate the simulations. The final stage of the project will consist of trying to combine the different properties found in the bio-inspired impact absorbing materials in one unique structure that will best serve our goal.
I. INTRODUCTION
The need for protective methods for various activities is increasing nowadays, especially that high speed activities occupy a major part in our daily life such as driving cars or motorcycles at high speeds involving accidents, or on the battlefield where bullets may find a way to hit someone. In 2013, the Global Status Report on Road Safety conducted by the World Health Organization showed that “1.24 million traffic deaths occur each year – nearly triple the UN’s estimate of annual murders, and twenty times the estimated annual total of deaths in wars” [1]. A large portion of these cases were due to the absence or failure of necessary equipment. Another study that took place in the United States showed “that 1.6 million to 3.8 million of concussions occur annually as a direct result of participation in athletics” [2]. Hence, we, as engineers are highly involved in understanding and preventing these impacts to reduce the risk and harshness of these injuries. “Although helmets have been shown to decrease the rate of catastrophic head injuries, and mouth guards have decreased the risk of dental and oral injuries”, more measures and modifications should be taken either in terms of design and structure or in terms of materials [2]. Therefore, the severe need to improve the protective effect of equipment has motivated us to search for and create new structures that can withstand high transient energy levels on impact without failing or presenting minimum failure results.
Some of the most remarkable materials in terms of energy absorption and impact resistance were found to be in nature rather than being attained from human processing and
manufacturing. Previous works studied different bio-inspired impact absorbing materials. Horns have been always considered study subject when it comes to biological materials, for their ability to attack enemies efficiently in addition to sustain impact loadings caused by these attacks. The fascinating thing about horns is that are not living tissues, and thus they don’t grow back if broken, that’s why they must be resilient and highly resistant to impact.
The aim of the paper wrote by Tombolato, Novitskaya, Chen, Sheppard and McKittrick was to study the microstructure, elastic properties, and deformation mechanisms of the horns, specifically, bighorn sheep horns, in addition to the effect of rehydration on these properties. To achieve this purpose, the goal was to determine the microstructure of the horn using both optical microscopes in addition to the scanning electron microscope (SME). The result was that the horn is made of stacked lamellae in the radial direction with a thickness of 2-5 μm with tubules, ~40 x 100 μm in diameter. Another important feature was discovered: the porosity. More specifically, there is a gradient in porosity across the thickness of the horn; porosity decreases from the external surface (8-12%) to the interior surface (~0%) with an overall cross-sectional porosity of 7%. These pores have an elliptical shape and they are extended along the longitudinal direction as shown in figure 1 [3]. In this project, unlike previous works, we are aiming to mimic the structure of the bighorn sheep horn since its unique porosity gave it the ability to be highly resilient to impact rather than studying the material itself. This innovative idea in the design track would be a turning point in different fields of application: infrastructure, protection (helmets, vests, etc.) as well as in the machining and tooling industry.

308
Figure 1: Optical micrographs of the ambient dried horn.
Source [3]
II. MATERIALS AND METHODS
A. Material Properties For the experimental analysis, we will be using
Divinycell H130 foam material provided by Diab Group. Foam boards are of dimensions 5x5x2mm. The mechanical properties of this material are presented in Table 1. The decision of using foam was made because the application of the wanted material is high impact energy absorption, and the foam provides this ability. Moreover, unlike metals, foam doesn’t need very high compressive stresses to undergo noticeable deformations. Additionally, the foam can easily be implemented into various applications. Furthermore, our purpose is to study the behavior of the material according to the designed structure, not the material itself.
B. Samples Using the CNC machine, the samples were
manufactured based on the designed structures. The drill sizes ranged from 1cm to 2mm. The variable that was first tested is the gradient pore diameter. Calculations were done
to preserve the same volume fraction in each row given that the thickness of the sample was divided into 3 equal rows. Fixing the volume fraction, the number of holes and diameters were chosen, table 2.
Property Unit H130
Compressive Strength MPa 3.0 Compressive Modulus MPa 170
Tensile Strength MPa 4.8 Tensile Modulus MPa 175 Shear Strength MPa 2.2 Shear Modulus MPa 50
Shear Strain % 40 Density Kg/m3 130
Table 1. Mechanical properties Divinycell H130
Row Diameter (mm)
Number of Holes
Volume Fraction
(%)
Spacing (mm)
1 4 3 88.69 12.66 2 3 5 89.4 7 3 2 11 89.63 2.54
Table 2: Fixed volume fraction specifications To further investigate the behavior of the above
material, uniaxial compression tests were performed using UTM. After performing simulations and physical tests, another variable will be tested where the diameter is uniform.
Figure 2. Porous specimen with fixed volume fraction
between layers
C. Drop-weight Machine To validate the results obtained with finite element
analysis, a drop weight testing machine was manufactured to test the foam specimens. The machine uses a U-bar axis that weights 14 Kg and that slides on 4 cylindrical shafts of 20 mm through 4 roller bearings after being compressed using a spring. The foam specimen is placed on a metal slab located on the base of the machine. In the metal slab and beneath the specimen, an accelerometer that measures the stress wave acceleration through the foam rests in a 15mm

309
groove. After compressing the spring, the U-bar is initially 94cm away from the specimen, and is then released to travel down and impact the specimen. Through experiments, the spring was found to have a high compressive stiffness of 11.38 kN/m, and the velocity of impact was found to be 7.035 m/s. It should be noted that the machine wasn’t built based on ASTM standards, but will further be modified to conform to such standards if time allows.
D. Scanning Electron Microscope (SEM) Since crushable foam simulation model is offered by
ABAQUS, the material’s microstructure had to be observed under an SEM microscope to check whether the foam is crushable and whether the simulation model can be used validated by the results obtained with the drop weight test.
E. Finite Element Analysis (FEA) The finite element analysis is done using ABAQUS,
where the specimen was modeled as deformable body with assigning to it the Divinycell H160 foam properties, while the impactor was modeled as an analytical rigid plane, and each of the two was defined as a different instance to be assembled together in the assembly later-on. An impact step was created, as dynamic explicit step with a time period of 0.001 and NIgeom on (ABAQUS will consider the presence geometric nonlinearity during the step). The boundary conditions concerning the setup were the following: ENCASTRE (U1=U2=U3=UR1=UR2=UR3) on the base of the specimen to prevent its translational and rotational movement, as well as the impactor was constrained in the displacement field (U1=0; U3=0; UR1=0; UR2=0; UR3=0; while U2 is kept unchecked), to make sure that it will only move in the y direction. A predefined field was then specified to give the analytical rigid impactor a velocity of 7.035 m/sec in the negative y-direction, to mimic the actual drop tower mechanism. A contact interaction was assigned between the impactor and the specimen with a tangential behavior as a contact property, having a penalty friction formulation with a friction coefficient of 0.5. Only the specimen was meshed (the analytical rigid part in its functionality isn’t meshed), the mesh was a hex mesh with a medial axis algorithm and the element type was of the 3D stress family, with linear geometric order, distortion control (to decrease distorted elements) and enhanced hour glass control with enhanced hourglass control and distortion control. The overall mesh element was C3D8R: an 8-node linear brick, reduced integration, hourglass control. A job was created with parallelization with the use of multiple processors to reach the results faster.
III. RESULTS
A. MATERIALS
Having performed the UTM test, the Force (N) vs Displacement (mm) curve has been obtained as shown in Figure 3. To obtain the stress-strain curve from the initial data, the following equations have been used: 𝜎𝜎𝐸𝐸𝐸𝐸𝐸𝐸𝐸𝐸𝐸𝐸𝐸𝐸𝐸𝐸𝐸𝐸𝐸𝐸𝐸𝐸𝐸𝐸 = 𝐹𝐹
𝐴𝐴 (1)
𝜀𝜀𝐸𝐸𝐸𝐸𝐸𝐸𝐸𝐸𝐸𝐸𝐸𝐸𝐸𝐸𝐸𝐸𝐸𝐸𝐸𝐸𝐸𝐸 = 𝑙𝑙−𝑙𝑙0𝑙𝑙 (2)
A= Original Area of the specimen F= Force l= Displacement l0= Initial thickness of the specimen Then to obtain the True Stress-Strain curve from the Engineering Data, the following equations have been used, and the obtained curve is shown in Figure 4. 𝜎𝜎𝑇𝑇𝐸𝐸𝑇𝑇𝐸𝐸 = 𝜎𝜎𝐸𝐸𝐸𝐸𝐸𝐸𝐸𝐸𝐸𝐸𝐸𝐸𝐸𝐸𝐸𝐸𝐸𝐸𝐸𝐸𝐸𝐸 ∗ (1 + 𝜀𝜀𝐸𝐸𝐸𝐸𝐸𝐸𝐸𝐸𝐸𝐸𝐸𝐸𝐸𝐸𝐸𝐸𝐸𝐸𝐸𝐸𝐸𝐸) (3) 𝜎𝜎𝑇𝑇𝐸𝐸𝑇𝑇𝐸𝐸 = 𝑙𝑙𝑙𝑙(1 + 𝜀𝜀𝐸𝐸𝐸𝐸𝐸𝐸𝐸𝐸𝐸𝐸𝐸𝐸𝐸𝐸𝐸𝐸𝐸𝐸𝐸𝐸𝐸𝐸) (4)
Figure 3: Force vs. Displacement
Figure 4: True Stress vs. True Strain
The first part of the curve is the linear elasticity region where the cell walls bend. The second part which is the plateau is where the collapse occurs, the cell walls buckle, yield, or begin to fracture. Then the last part is
0
20000
40000
60000
80000
0 5 10 15 20 25
Forc
e (N
)
Displacement (mm)
Force vs. Displacement
0
10
20
30
40
50
0 0.2 0.4 0.6 0.8
True
Str
ess (
MPa
)
True Strain
True Stress vs. True Strain

310
the densification region where the cell walls crush together.
B. SEM
SEM was used to visualize the microstructure of foam material before and after applying impact loading using the drop weight machine. For the impacted specimen, images taken at three different locations, figure 5. These images have shown a reduction in the average diameter of the 3 positions in each sample, from 251.205 µm (before impact) to 190.998 µm (after impact) and transformation in the geometry of pores from circular to elliptical, thus the crushable foam model can be applied. (Figures 5 and 6)
Figure 5: SEM image of the foam before impact
Figure 6: SEM image of the foam after impact
C. FEA
The FEA done was on different variation of the uniformity of the pores in term of their diameters keeping in mind the same volume fraction (approx. 11%) throughout all the modes of the samples used. Using ABAQUS, we have reached the following results:
Figure 7: FEA of non-uniform radii of pores
Figure 8: FEA of 2 mm pored sample
Figure 9: FEA of 3 mm pored sample

311
Figure 10: FEA of 4 mm pored sample
IV. DISCUSSION
As shown in figures 3 and 4, the material has proven to be extremely tough. It can withstand high values of stress-strain before failure. It is also worthy to mention that the force-displacement test was stopped before reaching the maximum capacity of the foam material due to restrictions imposed by the experimental setup. SEM images validated the porous property of the foam material. In fact, pores were seen in both samples, before and after impact. However, after impact, we noticed a reduction in diameter and transformation in the geometry of pores from circular to more elongated, elliptical shape due to the load imposed on the sample that resulted in stacking foam layers and elongating the originally circular pores. As a result, crushable foam model is used for ABAQUS FEA simulations. Simulations using ABAQUS showed that the VON MISES stresses didn’t vary much with the different configurations of hole diameters keeping the volume fraction constant. The 2mm and 4mm samples had the lowest maximum VON MISES stresses. Our preliminary analysis is that the 2mm holes are many and thus the stress wave is greatly deflected and reduced by the number of these crushed holes, and that the 4mm pores deflect the stress wave greatly towards the edges of the due to the bigger diameter of pores. That analysis will further be consulted and modified with our advisor. FEA simulations are being carried out at the moment on samples that have different diameter configurations, combined with a gradient in volume fraction. Another variable is also introduced into new simulations where the holes’ positions in each row are shifted so that they are no longer aligned with the holes of the other rows. The next stage of our work will begin as the needed accelerometer for the drop weight testing machine arrives this week. The results produced by the FEA simulations will be validated by the experimental setup. Furthermore, if time and the remaining material allow, a final variable will be studied where the specimen will be cut into 3 rows (3 equal layers) that contain drilled holes, but these layers will be laid down on top of each other with a tilted angle between each row and assembled using a special type of glue. Then the FEA analysis and experimental tests can be carried out on that
new configuration to find the optimal tilt angle that reduces impact the most. .
ACKNOWLEDGMENT
We would like to express our appreciation to our final year project advisor, Dr. Shehadeh, whose contributions and suggestions guided us throughout the semester, organized our work and coordinated our project. Moreover, we would like to acknowledge the role of the SRB workshop personnel who facilitated our use of equipment, materials, and machines. Special thanks go to Dr. Samir Mustapha who gave us some suggestions regarding the modification of the impact testing machine and supplied us with the necessary materials.
REFERENCES
[1] GRESSER, E. (2014, JULY 16). TRAFFIC ACCIDENTS KILL 1.24 MILLION PEOPLE A YEAR WORLDWIDE; WARS AND MURDERS, 0.44 MILLION. - PROGRESSIVE ECONOMY. RETRIEVED NOVEMBER 04, 2016, FROM
[2] DANESHVAR, DANIEL H. ET AL. “HELMETS AND MOUTH GUARDS: THE ROLE OF PERSONAL EQUIPMENT IN PREVENTING SPORT-RELATED CONCUSSIONS.” CLINICS IN SPORTS MEDICINE 30.1 (2011): 145–163. PMC. WEB. 28 NOV. 2016.
[3] TOMBOLATO, L., NOVITSKAYA, E., CHEN, P., SHEPPARD, F., & MCKITTRICK, J. (2010). MICROSTRUCTURE, ELASTIC PROPERTIES AND DEFORMATION MECHANISMS OF HORN KERATIN.ACTA BIOMATERIALIA, 6(2), 319-330. DOI:10.1016/J.ACTBIO.2009.06.033

312
Numerical and Experimental Investigation of Heat Transfer in Ovens
Design and Conceptualization
Ghassan Atallah, Sebastien Ayoub, Georges Khalil, Raja Serhal, Imad Shaer Mechanical Engineering Department
American University of Beirut Bliss street, Beirut, Lebanon
[email protected], [email protected], [email protected], [email protected], [email protected] Abstract-The aim of this research is to help KARAKI industries, a local bread baking oven manufacturer in Lebanon, to improve the quality of their oven design. The finality of this design improvement would ensure that KARAKI manufacturer supplies the market with competitive ovens able to overcome their competitors on critical criterion such as the energy expended to produce bread and the quality of the bread being produced. In order to achieve this objective, it is necessary to apply a combination of Thermal Fluid disciplines such as Fluid Dynamics, Thermodynamics, Heat Transfer, Design of Thermal Systems and mainly Computational Fluid Dynamics (CFD). The core focus would be on the CFD study that will accurately describe the state of the airflow inside the oven. The analysis will be based on the drawings provided by KARAKI industries based on which the company is manufacturing its ovens.
I- Introduction
With bread being the most highly consumed cereal product among the urban population of Beirut, it is incontestably an essential integral part of every daily meals. According to a research done by Laboratoire de Toxicologie Alimentaire de France, investigating the food consumption of adult population in Lebanon, bread is the most highly consumed product: an amount of 146.2g/day of bread is consumed daily by the average adult [1]. Lebanese produce over 785,000 bags of bread a day for more than 24 million bags a month [2]. The production of bread is not slowing down anytime soon and the market for it is expanding. Furthermore, bread is consumed in the Lebanese households more as a necessity than a luxury. This comes after a study conducted by the Department of Agricultural Sciences, Nutrition and Food Sciences (of the Faculty of Agricultural and Food Sciences in the American University of Beirut) regarding budget allocation effect on the dietary plans of residents in Lebanon, showed that the increase in prices did not lead to a significant change in the budget allocation and expenditure on bread [3]. With bread consumption remaining high in the coming years, production should meet demand and the bread baking process must be optimized to provide the best product as value for the money.
In addition to that, the quality control of bread
baking is of major significance nowadays, with more restrictive health requirements and set standards. Bread quality depends on the dough mixture and on the oven used. A producer should keep in mind that in order for his product to be of good and reputable quality, it must meet renowned international standards [4]. For example, the ISO 9001:2000 international standards regarding quality management systems – requirements were established in the presence of food-borne hazards and waste at the point of production and consumption. It is important to satisfy such standards in the industry to ensure that the consumer is getting the best product possible. Standards give the product a quality label and a trust among buyers that will help the product stand out in an already saturated market. Acquiring standards certifications will elevate the product’s status and increase its sales and improve the business in general. In a competitive environment, hopes are that encouraging the respect of international standards will encourage the implementation of an optimized design that will respect energy savings, safety and quality standards [5].
The process of bread baking is closely related to its output since the qualitative qualities of the baked product are the texture, moisture content, bread surface color and structure [6]. These characteristics, while simple to obtain through careful and expert cuisine are the result of much more complex phenomena linked both to physical and biochemical reactions. Moreover, the bread baking depends much on its environment, or, nowadays, on the structure of modern oven [7]. In order to draw the broadest idea for this phenomenon, it is thus crucial to describe both the oven, or tool of baking, and the baking process itself. Bread baking can be divided into three stages [8]:
1. Partly risen dough is inserted into the oven (that has an approximate temperature of 477K). The volume of the dough increases due to fermentation where yeast present in the dough ferments and releases carbon dioxide. The first step is assumed to end when the temperature of the loaf’s interior

313
reaches 333K. At this temperature, yeast is killed thus stopping all the fermentation process. This step approximately takes a quarter of the baking time to be completed.
2. During the second and longest step (about half the baking time), starch gelatinizes and protein coagulates/denaturates. Proteins denaturation releases water whereas starch gelatinization absorbs it. This phenomenon would lead to the evolution of the dough to crumb [9].
3. In the final step, organic compounds volatilize (“phenomena known as “bake-out loss”) [7]. Browning reactions will occur improving the color of the bread and its flavor.
The formation of crust and crumb regions during the baking process is directly defined by the temperature and on the starch gelatinization where Starch gelatinization is dependent on the water content in the dough. Sluimer and Krist-Spit [10] suggested that heat and water transport is based on the Watt-principle: the water vapor condenses at the cold sections of the bread, which are towards the center, and evaporates at the hot ones which are towards the pores. Chhanwal et al. devised a two-dimensional process to predict the crumb softness of the bread and the starch gelatinization [11]. These studies are beneficial for the baking industry since it will determine the baking time of bread based on the temperature of the oven. During the bread-baking process, heat and mass transfer are dominated by the evaporation-condensation mechanism which happens following these steps [6]:
1. Water evaporates on the warmer side absorbing latent heat of vaporization.
2. Water vapor migrates through the gas phase due to vapor concentration gradient in the cell.
3. Water vapor condenses at the colder part of the cell.
4. Heat and water are transported through conduction and diffusion.
Computational fluid dynamics (CFD)
modelling and simulation manifested itself as an excellent tool to analyze the unsteady heat transfer in the oven as well as the temperature distribution within the loaf of bread. CFD is a numerical method that solves the governing equations (such as Navier-Stokes, energy conservation…) to calculate probable values of temperature, velocity, pressure [12]…
CFD approaches are widely used in the food industry since it can reliably predict the flow of
Figure 1: Oven design of Karaki Industries
the different fluids in the material. The use of FLUENT in ANSYS would also allow for a description of the airflow around the bread. The use of FLUENT will be privileged because of its ease of combination with existing CAD model, the possibility of implementing existing mass and energy conservation equations and its overhaul description of the process both inside the bread and in the air flow around the baked species [13].
In this paper, a three-dimensional (3D) CFD modeling and analysis is used to design an optimization scheme for the specific oven manufactured by KARAKI industries. In the oven manufactured by the company, the main driver of heat transfer is forced convection induced by a fan at the oven’s extremity. The oven has two distinct items: a heat exchanger and a baking chamber as shown in fig 1. As such, the conclusions could help the designer of the oven to optimize the baking process by reducing losses and ensuring a more homogeneous temperature distribution, in order to decrease the baking time thus standing out from its competition.
II- Equations
Navier-Stokes’ equations represent the motion of fluid substances. The equations are the result of combining Newton’s second law to fluid motion, the pressure term and the assumption that the stress present in the fluid is the sum of a diffusing viscous term [13]. It is required to model the motion of the materials in the bread and in the oven, justifying the use of Navier- Stokes equations.
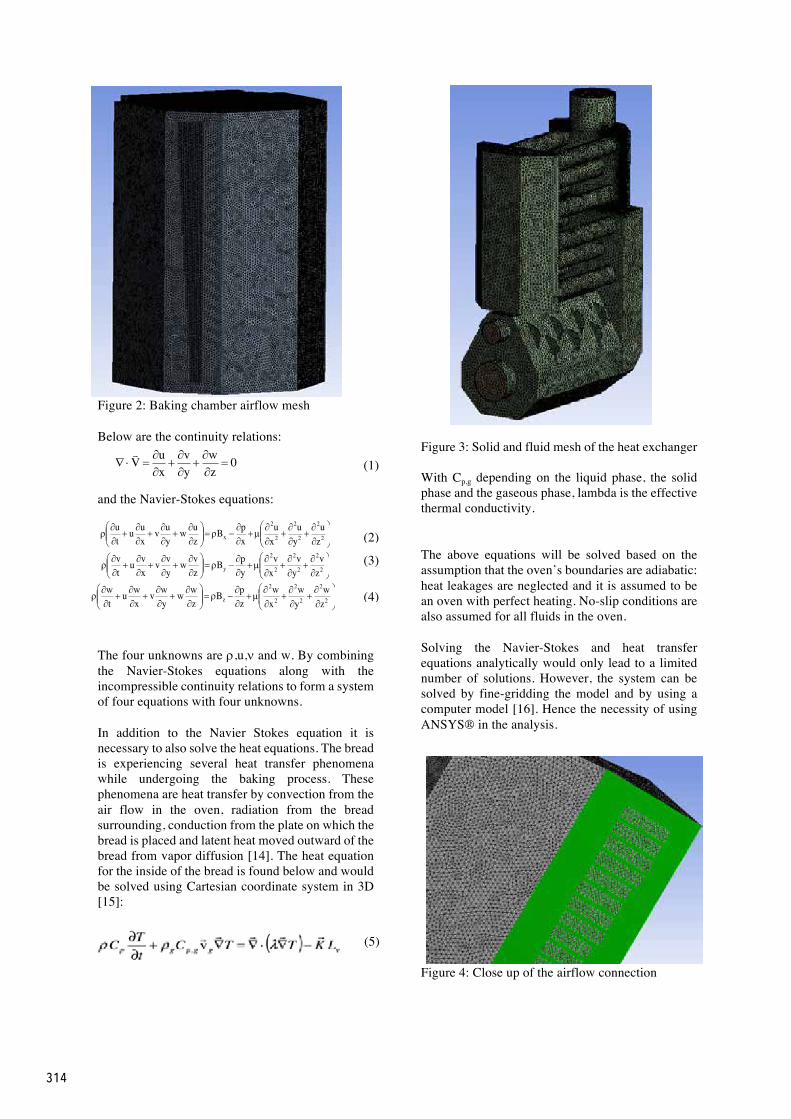
314
Figure 2: Baking chamber airflow mesh
Below are the continuity relations:
and the Navier-Stokes equations:
The four unknowns are r,u,n and w. By combining the Navier-Stokes equations along with the incompressible continuity relations to form a system of four equations with four unknowns.
In addition to the Navier Stokes equation it is necessary to also solve the heat equations. The bread is experiencing several heat transfer phenomena while undergoing the baking process. These phenomena are heat transfer by convection from the air flow in the oven, radiation from the bread surrounding, conduction from the plate on which the bread is placed and latent heat moved outward of the bread from vapor diffusion [14]. The heat equation for the inside of the bread is found below and would be solved using Cartesian coordinate system in 3D [15]:
Figure 3: Solid and fluid mesh of the heat exchanger With Cp,g depending on the liquid phase, the solid phase and the gaseous phase, lambda is the effective thermal conductivity.
The above equations will be solved based on the assumption that the oven’s boundaries are adiabatic: heat leakages are neglected and it is assumed to be an oven with perfect heating. No-slip conditions are also assumed for all fluids in the oven.
Solving the Navier-Stokes and heat transfer equations analytically would only lead to a limited number of solutions. However, the system can be solved by fine-gridding the model and by using a computer model [16]. Hence the necessity of using ANSYS® in the analysis.
Figure 4: Close up of the airflow connection
0zw
yv
xuV =
¶¶
+¶¶
+¶¶
=×Ñ!
÷÷ø
öççè
涶
+¶¶
+¶¶
µ+¶¶
-r=÷÷ø
öççè
涶
+¶¶
+¶¶
+¶¶
r 2
2
2
2
2
2
x zu
yu
xu
xpB
zuw
yuv
xuu
tu
÷÷ø
öççè
涶
+¶¶
+¶¶
µ+¶¶
-r=÷÷ø
öççè
涶
+¶¶
+¶¶
+¶¶
r 2
2
2
2
2
2
y zv
yv
xv
ypB
zvw
yvv
xvu
tv
÷÷ø
öççè
涶
+¶¶
+¶¶
µ+¶¶
-r=÷÷ø
öççè
涶
+¶¶
+¶¶
+¶¶
r 2
2
2
2
2
2
z zw
yw
xw
zpB
zww
ywv
xwu
tw
(1)
(3)
(2)
(4)
(5)

315
III- Methods The problem was first analyzed using
MATLAB® (MATLAB_R2014b). The bread baking process was then modeled and simulated on ANSYS Workbench (version 17.2). For the first part, MATLAB® was used to model and get a general idea of the process. A numerical model was developed using the basic equations and the equations of state. The MATLAB® was used to verify the assumptions taken for the initial conditions and the boundary conditions which prevented the results to diverge [18].
As for the second part of the study, CFD has proven to be crucial in the process. Ovens were not constantly available for experimentation to be conducted on. Simulation had to be done and the results will be compared to provided experimental data. Also, it was possible to simulate different models on ANSYS before deciding on the optimal model without having to manufacture each model and thereby, being more time efficient and economical.
The procedure of studying the model on CFD requires several steps. The drawing generated on SolidWorks® (version 14) was acquired from KARAKI industries. First comes the pre-processing stage where modeling and meshing will take place. Since the drawing obtained was made on SolidWorks and the study is done through ANSYS® Fluent, it was necessary to export the drawing in .IGES format to ANSYS® Design Modeler. The drawing provided was intended for industrial purposes, meaning it had several problems such as overlapping lines, extra layers, gaps between parts… Design Modeler was used to clean up the geometry and to repair the cavities. Cleaning up occurred by going over each part, identifying the overlapping lines and extra gaps, and by removing the unnecessary lines and layers. The cavities were repaired by filling them with volume. The next step was to work on the mesh where multiple trials were done to do different types of meshes with different levels of relevance. Each component was meshed alone and as shown in fig. 2,3 and 4. The different components were then joined using T-grid. Bread was modeled as shown in fig.5.
After obtaining the mesh, the model was transferred to Fluent. ANSYS® Fluent will be generating the computational results for the given data provided by KARAKI Ind. such as: boundary conditions, material compositions and further specifications (e.g. Fan speed). Following the logic of the study and the required objectives, the energy, species, multi-phase and viscous model and equations will be enabled. The simulation will run until convergence is reached for the set parameters.
After convergence is reached in the fluent model, results are exported to CFD-Post/CFX in ANSYS® for the post processing stage. Results will be displayed on the geometry in the form of
Figure 5: Mesh characterizing the bread . gradients, vectors or animations. Different CFD simulations for various parameters and models will allow the understanding and optimization of the model so that the solution and the design can be substantially improved. The CFD analysis will be compared to real-life experimental values provided by KARAKI industries.
IV- Results and discussion
Assumptions to be considered: To simplify the model computations, several assumptions had to be taken into consideration:
-The medium is homogeneous. A non-homogeneous medium would have a detrimental impact on the smoothness of the result.
-Liquid phase is not compressible. This assumption is possible and justified for water
-The gaseous phase consists of a perfect mixture of CO2 and water vapor and the ideal gas equation can be used. (Pg=Pv+PCO2)
-The moisture content will be the fraction between the liquid water content and the mass of the solid (W=ml/ms)
-Liquid water diffusion is only due to capillary diffusivity since other diffusion means are negligible
Concerning the MATLAB part, experimental data were missing thus didn’t lead to a conclusion. The code was beneficial since it allowed a better comprehension of the heat and mass transfers occurring in the oven.
V- Conclusion
The process of bread baking is much more complex than the daily life product it yields. In this initial approach, many parameters have been considered such as the suitable design of the oven and the evaporation condensation phenomena. The mathematical model implemented using FLUENT mimics the real-life bread baking process to a certain point, since the model has been simplified to

316
accommodate the technological and time requirements available. However, it is certain that this model will be sufficient for the industrial approximation since several similar studies have shown that the discrepancies between a FLUENT analysis and real experimentations are satisfying.
ACKNOWLEDGMENT Support from advisor Dr. Fadl Moukalled and PhD candidate Iyad Faysal is gratefully acknowledged.
REFERENCE [1] L. Nasreddine, N. Hwalla, A. Sibai, M. Hamzé and D.
Parent-Massin, "Food consumption patterns in an adult urban population in Beirut, Lebanon," NCBI, pp. 194-203.
[2] R. Abuzaki, "Lebanon: Give Us This Day Less of Our Daily Bread," AlAkhbar, 24 04 2012.
[3] S. Zaki, J. Chaaban, L. Nasreddine and A. Chalak, "The impact of food price increases on nutrient intake in Lebanon," Springer Link, 2014.
[4] P. Baardseth, K. Kvaal, P. Lea, M. Ellekjær and E. Færgestad, "The Effects of Bread Making Process and Wheat Quality on French Baguettes," Journal of Cereal Science, vol. 32, no. 1, pp. 73-87, July 2000.
[5] L. Manning, R. Baines and S. Chadd, "Quality assurance models in the food supply chain," British Food Journal, vol. 108, no. 2, pp. 91-104, 2006.
[6] N. Chhanwal, A. Tank, K. S. M. S. Raghavarao and C. Anandharamakrishnan, "Computational fluid dynamics (CFD) modeling for bread baking Process—A review," Food and Bioprocess Technology, vol. 5, no. 4, pp. 389-398, Jan 1993.
[7] N. Therdthai, W. Zhou and T. Adamczak, "Optimisation of the temperature profile in bread baking," Journal of Food Engineering, vol. 55, pp. 41-48, 2002.
[8] S. Y. Wong and J. H. Weibiao Zhou, "Robustness analysis of a CFD model to the uncertainties in its physical properties for a bread baking process," Journal of Food Engineering, no. 77, pp. 784-791, 2005.
[9] K. Thorvaldsson and C. Skjöldebrand, "Water Diffusion in Bread During Baking," The Swedish Institute for Food and Biotechnology, no. 31, pp. 658-663, 1998.
[10] P. Sluimer and C. Krist-Spit, "Heat transport in dough during the baking of bread," Cereals in a European Context, pp. 355-363.
[11] N. Chhanwal and C. Anandharamakrishnan, "Temperature- and moisture-based modeling for prediction of starch Gelatinization and Crumb softness during bread-baking process," Journal of Texture Studies, vol. 45, no. 6, pp. 462-476, Dec 2014.
[12] S.-Y. Wong, W. Zhou and J. Hua, "CFD modeling of an industrial continuous bread-baking process involving U-movement," Journal of Food Engineering, no. 78, pp. 888-896, 2006.
[13] R. Temam, "Navier-Stokes Equations-Theory and Numerical Analysis," 2001.
[14] V. Nicolas, P. Salagnac, P. Glouannec, V. Jury, L. Boillereaux and J. Ploteau, "Modeling heat and mass
transfer in bread during baking," in COMSOL Conference, Paris: Université de Bretagne-Sud, 2010.
[15] J. Zhang, A. K. Datta and S. Mukherjee, "Transport processes and large deformation during baking of bread," AIChE Journal, vol. 51, no. 9, pp. 2569-2580, 2005.
[16] K. Liew and T. Teo, "Modeling Three-dimensional solutions for rectangular plates," Computer Methods in Applied Mechanics and Engineering, vol. 159, no. 3-4, pp. 369-381, 1998.
[17] N. Chhanwal, D. Indrani, K. S. M. S. Raghavarao and C. Anandharamakrishnan, "Computational fluid dynamics modeling of bread baking process," Food Research International, vol. 44, no. 4, pp. 978-983, May 2011.
[18] B. Zanoni, S. Pierucci and C. Peri, "Study of the Bread Baking Process-II. Mathematical Modeling," Journal of Food Engineering, no. 23, pp. 321-336, 1993.

317
Optimizing the AUB Supermileage Vehicle to Achieve Maximum Fuel Economy
Wafic C. Ariss; Mohammad A. Ezzeddine; Mohamad K. Rachid; Amr M. Al-Yafi
Department of Mechanical Engineering American University of Beirut
Riad El-Solh / Beirut 1107 2020 Lebanon [email protected]; [email protected]; [email protected]; [email protected]
Abstract- Developing high fuel-efficiency vehicles through devising and integrating advanced technologies into their subsystems is the groundwork for future implementation in commercial automobiles. This paper is a project breakdown for the construction and optimization of the AUB Supermileage vehicle through the development of proper engineering designs and the allocation of available resources.
Maximum efficiency can be achieved by ensuring that all the vehicle systems are built and operational in optimal specifications and conditions. The general considerations taken in reengineering and optimizing the vehicle include engine modifications, aerodynamics, weight reduction, and rolling resistance minimization. The various optimized subsystems will be assembled to obtain the fully optimized Fuel-Efficient Vehicle (FEV) achieving maximum fuel economy.
Several technical and non-technical constraints hinder the reach of this project. However, by following firm engineering principles, learning from available technologies, and developing new designs, several constraints are resolved to meet the desired objective.
I. INTRODUCTION
Technological development has led to the advancement of humanity throughout history, but not without a price to pay; the environment. To be more specific, the level of fuel emission by industrial and commercial vehicles is a major contributor to the increasing levels of pollution and greenhouse gases. The rise in consumption and mining of fossil fuel to be used in vehicle transportation shows an imminent problem to the nature of the world, from local air pollution, to global warming.
Through designed structures and engineering methodologies, it is possible to reduce the emission of fuel by correspondingly reducing its consumption, through increasing its efficiency while in use.
The project presented in this writing is responsible for the development of an FEV in accordance with the SAE Supermileage 2017 Rules [1]. The objective behind this project is to perform an engineering job on the vehicle of the previous year, improving its fuel economy to ultimately traverse a total of 300 Km by solely consuming 1 Liter of fuel. The project is multidisciplinary in nature, mainly centered around mechanical engineering, but also requiring knowledge in marketing and business to obtain the necessary funds for the manufacturing of the designs. Literature review, efficient design, team based learning, resourcefulness in procurement, applied work and testing are at the core of this project.
The motivation behind this work is to showcase the potential of efficient design in making an eco-friendly vehicle, and inspire others to follow the same trend in minimizing excess consumption.
II. METHODOLOGY
A. REVISION OF PAST EFFORTS Past efforts shed light on the mistakes and improvements
made by other teams participating in the same or in similar projects. Reviewing their contribution is crucial for planning and optimizing our time, approach, and progress.
B. TESTING AND REVERSE ENGINEERING OF THE PREVIOUS VEHICLE Testing of the previous vehicle serves as a benchmark for the
development of the current project. Reverse engineering is a firsthand demonstration of the methods used in building the vehicle and the mechanisms featured in it.
C. THEORY AND DESIGN The project follows three major axioms to fulfill its goal:
Maximizing mechanical efficiency, reducing weight, and abiding by the technical and non-technical constraints. Maximizing the efficiency affects decisions related to the design of the whole vehicle and the driving strategy. Reducing weight is relevant to the choice of materials and design safety factor. The technical constraints are placed by the SAE Supermileage Rules, whereas the non-technical constraints relate to funding, time, and expertise.
D. FUNDING Once designs are ready and a general picture of the final
product emerges, a bill of materials is developed for the preparation of a funding campaign with the help of marketing-focused members of the team. Sponsors can be contacted, and funding can be obtained to move on to manufacturing.
E. MANUFACTURING AND PROCUREMENT Testing of the different materials and techniques used in
achieving the proposed design precedes the making of the final product and assembly of its parts. Procurement of the different materials and components is limited by the obtained funding, which can affect design (e.g. the use of alternate materials due to high expenditure).
Mag
netiz
atio
n (k
A/m
)

318
F. PRODUCT TESTING AND OPTIMIZATION Testing of the final assembly reveals the result, and can
potentially send the progress back to the drawing board if certain points prove unreliable and if the goal (300 Km/L) is not met.
III. DESIGN AND SIMULATION
A. Rolling Resistance In the scope of this project, rolling resistance is expressed as
the generation of friction, which resists the motion of the vehicle on the ground. It is an important aspect in this project and contributes more than 60% of the energy lost while driving the vehicle [2], thus the analysis and optimization of each component individually is crucial to minimize friction losses. Two main subsystems of this category are: steering system and wheels.
The steering system has been redesigned using an Ackermann geometry, a principle that allows all three wheels of the vehicle to rotate about the same center at independent radii from the center of rotation [3]. This reduces tire slipping when cornering, and ensures maximal grip at the desired range of steering. The steering system is optimized over last year’s car through building upon the “pivot-arm” design, similar to the rack-pinion but replacing the pinion by a rotating arm. It is based on transmitting the rotational force exerted by the driver into a linear motion of the steering rod through a pin-slot system which accommodates for Ackermann design.
The steering system design includes a constant-velocity joint, which transmits torque between two rods at an angle. This allows the driver to adjust the steering rod position while transmitting steering force equivalently to the wheels. The components of the steering system were re-designed using SolidWorks, and the optimization of dimensions, material, and weight was accomplished by simulating the stress analysis and deflections of the steering mechanism using ANSYS as well as SolidWorks.
The wheels are comprised of the following components: tires, hubs and rims. Rolling resistance in wheels is highly crucial to tackle. In tires, resistance is created by the increase in pressure within the tire tube, and thus the obstruction of rotation. Thorough research into the technologies of tire manufacturing, material, and inner ply layout resulted in valuable findings which allow the minimization of rolling resistance.
Radial tires are selected. These tires have their inner cord plies laid out radially, which forces the tire to deform along the direction of the motion, and results in a lower coefficient of friction [4].Wheel hubs, which hold the wheel onto its axis, have various specifications and advanced technologies. The typical steel ball-bearing hubs have been replaced by more efficient ceramic bearings which have a much lower rolling resistance [5]. The wheel rims are comprised of an outer circular rim, and spokes which connect the rim to the hub. Aluminum rims have been chosen for their lightweight and durability. The aluminum rims, mounted on ceramic-bearing hubs, with the use of radial
ply tires allow maximum reduction in rolling resistance, and thus allow increased mileage.
B. Engine The project features the use of an internal combustion
gasoline engine, the Briggs & Stratton Junior 206, Model 124332 Type 8202-01. The stoichiometric air-to-fuel (A/F) ratio (A/F) of combustion for the specific fuel corresponds to 14.7:1 for petrol, meaning 14.7 parts mass of air to one part mass of fuel [6].
The efficiency of engines relative to their fuel consumption is measured by evaluating the ratio of the rate of fuel consumption in grams per second (g/s) to the power output in watts (W). This measure is called the Brake Specific Fuel Consumption, or BSFC, with units of grams per joule (g/J). A larger BSFC number means that more fuel is required to produce the same amount of work, and so a larger number indicates higher fuel consumption. Gasoline engines have an air throttle valve which restricts the flow of air into the cylinder, thus reducing the flow of fuel, while maintaining the A/F stoichiometric ratio. However, at any position other than wide open throttle (WOT), the throttle creates undesired pressure drop in the cylinder due to the restriction of airflow. Thus, a portion of engine power output is wasted in order to take in more air and fuel, and thus the BSFC number increases. Hence, to maximize fuel economy, the engine should be operated at WOT [7].
Based on the SAE regulationsi, the vehicle has a particular speed range it can run at. Therefore, the application of WOT is possible when accelerating from the minimum speed limit to the maximum speed limit.
As engine speed increases, BSFC decreases, then levels off around medium engine speeds, only to increase as speed increases further, as shown in Figure 1.
Figure 1. WOT performance curve, 4BTA3.9-C130 engine [8]

319
The optimal BSFC typically occurs around the peak torque range, at medium engine speed. Consequently, the engine should be operated only around the peak torque range and at WOT to achieve maximum efficiency and fuel economy.
The Briggs & Stratton engine features a Walbro™ Round-Slide Carburetor for fuel delivery. Carburetors cannot accurately measure the amount of air induced in the cylinder, and therefore cannot allow the exact amount of fuel to achieve a stoichiometric A/F ratio; there will always be excess fuel added and therefore excessive fuel consumption. To come around this problem, an Electronic Fuel Injection (EFI) system is chosen [9] [10], which includes a complex system of sensors, ECU, fuel pump, and fuel injectors. The components work in harmony to ensure the engine operation at the stoichiometric A/F ratio.
An EFI system made by Ecotrons, designed specifically for the engine used, is chosen [11].
The stock engine starter is a recoil-starter, and while it is a lightweight and cost-effective method to start the engine, it does not accommodate for the “Burn & Coast” driving strategy of the project. Burn & Coast is as follows: during acceleration, the engine would be operating. When the maximum speed limit is achieved, the engine is turned off to save fuel while coasting. For this reason, an electric starter is installed on the engine shaft, allowing the driver to remotely turn on and kill the engine using a starting button and a kill switch.
C. Drivetrain Drivetrain design is key to ensure efficient transmission of
chemical energy into propulsion. Since the desired purpose of the vehicle is to achieve mileage on a smooth surface, the vehicle mass is unsprung. The vehicle uses a chain drive that engages a sprocket gear and the driving wheel. Chain drive provides efficient power transmission while allowing easier installation and manufacturing than spur gears oir direct drive [12]. The engine is coupled to the sprocket using a centrifugal clutch which allows the vehicle to be stationary at the idle engine speed of 800 RPM, and to transmit power starting 2000 RPM. As shown in Figure 2, and explained in B, the BSFC point of the current engine lies between 2500 and 3000 RPM, and the clutch will allow the vehicle to run in this range. The target gear ratio is 8:1, designed to achieve an average speed of 30km/h while consuming minimal fuel. The gear tooth profile is designed using SolidWorks based on ISO standards, and the gear is emptied out to save weight. The performed Finite Element stress analysis resulted in a factor of safety of 2.7, which is sufficient for any possible torque peaks or impact loading. The gear is mounted on the free wheel hub of the rear wheel, which allows the wheel to rotate forward freely independent of the gear, thus reducing the reaction momentum on the wheel and decreasing rolling resistance on the rear wheel.
Hydraulic brakes are more effective than mechanical brakes in stopping the vehicle, and therefore they stand as the better choice for the project, despite the added costs and weight, and the difficult maintenance over mechanical brakes [13].
Figure 2. WOT performance curve, stock unrestricted Briggs & Stratton Junior 206 engine [14]
Rim brakes have the braking force applied on the rim wall, while disk brakes have the braking force applied on a rotor mounted on the wheel hub, of diameter much smaller than that of the rim. Therefore, disk brakes produce a smaller torque arm on the mounting point. In addition, disk brakes have proven to be much more effective than their rim counterparts if coupled with hydraulic braking instead of mechanical braking [11], thus disk brakes are chosen.
Stopping power is highly important since the vehicle must be brought to standstill in a very short distance. Three pad materials are available on the market: organic, semi-metallic and sintered. Only organic pads fit the application because they have the highest initial stopping power [15].
D. Structure and Aerodynamics The effects of aerodynamics play a major role in both the
stability of the vehicle and the amount of air resistance it encounters. In the previous vehicle, a badly manufactured aerobody caused the structure to weigh (32.15 Kg). Although reducing air drag contributes only by 10% of the overall mileage [2], optimizing the design of the structure would ensure that the best possible results are attained.
The design of the aerobody is inspired by the teardrop shape which provides the least amount of air resistance and the lowest drag coefficient [2]. However, the current chassis dimensions limit the proper tear-drop design application. Thus, the best approach is to design the body starting off with the teardrop shape, and narrowing down to the limitations of the chassis.
To ensure the design is streamlined, simulation on ANSYS was conducted to generate the drag coefficient while traversing the path at a speed of 8m/s (~30 Km/h). The design showed a satisfying drag coefficient of 0.318 as shown Figure 4.

320
Figure 3. Graph comparing coefficient of drag vs. the number of iterations conducted
The simulation of the streamlines in Figure 4 indicates that there are no regions of increased velocities exceeding 16 m/s; this is made possible thanks to the curve-edged wheel fairings and the streamlined design of the aerobody.
The transition from the design and modeling to the manufacturing procedure presents the challenge of material selection. Composite materials provide major weight savings while delivering the needed strength, rigidity, and flexibility [16]. Fiberglass was chosen over carbon-fiber due to the affordability and local availability of the former. Fiberglass fabric is available in different layouts, out of which woven-fiber is chosen. Woven-fiber is made of fiber structures interlocked in a textile-like manner, which adds rigidity to the fiber fabric.
The car floor, which covers the chassis from below, is a non-structural element, since it only supports the driver’s lower limbs along with the electric wiring and battery. Through accounting for the driver’s combined legs weight, and ensuring an impact factor of safety, cardboard honeycomb enveloped by fiberglass was developed as flooring material. The implementation of stringers – extensions of Balsa wood covered by fiberglass layers – provides the necessary extra strength for the suspended sections of the floor.
Figure 4. ANSYS CFD Simulation for Aerobody
E. Gear Gear specs are chosen as follows: ½ inch pitch, 400mm
diameter, 96 teeth. Alumec89 is used for the gear due to strength, weight and machinability properties [17]. The gear is based on standard tooth profiles; however, it is redrawn and edited to meet desired dimensions, weight and mounting locations. The gear is machined out of a 10x500x500mm Alumec plate, using a 3-axis CNC milling center.
F. Aerobody and Floor Manufacturing The search for an appropriate material which is both
lightweight and structural enough to withstand bending led to the testing of foam, balsa wood, cardboard honeycomb, and nude-cardboard honeycomb samples (without the top and lower layers) each sandwiched with multiple layers of fiberglass.
Preliminary tests included testing the rigidity of one curved layer of fiberglass cured with a specified amount of resin-to-volume ratio (using 2% of the resin volume for the hardener) and using a foam base as the mold. The result was a solid structure that conformed to the shape of the mold.
The layers of fiberglass were placed in a 45, 0, 45 configuration to ensure resistance and increased tensile strength in all directions. Figure 5 shows the results of the curing process done for honeycomb and foam, and the case under vacuum.
Tests were performed on the samples, and as indicated in Table 1, a composite structure with a balsa wood core resulted in the best resistance to bending and the highest weight amongst the samples. The driver would step onto the structure and the weight would be evenly distributed along the structure without the risk of failure. The adhesion of the fiberglass layers to the honeycomb structure was stronger than that of the nude ones, since they resisted shearing force exhibited during the testing.
The model for the aerobody was designed using PTC Creo, and subjected to flow simulation using ANSYS. Manufacturing of the aerobody had to feature a foam mold. The foam mold would have the plastic resin and fibers laid on top of it; however, resin reacts with foam, and thus the inclusion of a layer of primer over the mold was needed to separate the two substances.
Due to the limited volume capacity of the CNC machine at AUB, it can only perform operations on 70x70x15cm blocks. This requires dividing the body into a total of 40 blocks with maximum dimensions of 50x45x15cm, which will be glued together as shown in Figure 6, c. Foam pieces are cut using the hot wire cutter built by the team, shown in Figure 6, a.
Figure 5. Sample Testing Results: a) Fiberglass Reinforced Plastic, Cardboard Honeycomb Core Sandwich Sample; b) Fiberglass Reinforced Plastic, Foam
Core Sandwich Sample; c) Manufacturing of samples a) and b)
b a c

321
Figure 6. a) Hot Wire Cutter; b) Foam Block before Machining; c) Two Foam Blocks after Machining
Table 1. Sample Testing and Results
Tested Sample Nude-honeycomb
Honeycomb Balsa Wood
Foam
Failure Force1 100N 200N 600N N/A
Density (kg/m3) 92 107 160 32-35
Composite Structure
0, 45, core 45, 0
45, 0, 45, core, 45, 0,45
0, 45, core, 45, 0
0, 45, core, 45, 0
Observations Strong resin to core adhesion
Strong resin to core adhesion
Weak resin to core adhesion
Foam sample failed, foam core melted
G. Steering System The steering system will be manufactured from a combination
of steel and aluminum components. Based on the performed stress simulations with varying input parameters on ANSYS, the kingpin (the pivot in the steering mechanism) will be manufactured from steel.
All other components: steering shafts, angle rods, brake caliper arm, and Ackermann components will be made of Aluminum, as forces are lower, and the necessary safety factors are less severe.
Steering system components require several manufacturing processes such as milling, drilling and welding. The system is connected to the chassis using screws, and 2-point supports at various locations.
H. Driver Seat Driver seat material is chosen to be Polystyrene high-density
foam. The 3D design prepared on PTC Creo is sliced into planes 5cm apart, to build cross-sections of the seat. Those sections will be cut out of 5cm foam boards using the hot wire foam cutter, and glued in sequence to form a step model of the desired shape. The model will be smoothened-out to form a continuous surface which will be covered with polyurethane foam to provide comfort. The seat includes two grooves which will allow the seat to be exactly mounted onto the chassis, and fastened for rigidity.
I. Full-Car Assembly In order to bring together a supermileage vehicle, the
optimized subsystems stated in A through H are assembled onto the vehicle’s current chassis. The assembly of all components is
1 3-Point Bending Test results using ASTM standards
accounted for in the design of the vehicle systems, in such a way that the mounting and dismantling of these systems are independent of one another and can be done with ease. The rear, driving wheel is mounted onto the chassis through a 20mm steel rod which extends between the chassis bracket and passes through the wheel hub. The driving chain is locked-in using tensioners which remove any slight excess chain length. The engine is mounted onto the chassis using an engine plate, onto which the engine is fastened. The mounting plate is itself bolted onto the chassis at 3 points, and is placed 12cm away from the chassis roll-hoop horizontally. The fuel tank is cantilevered on a circular bracket in the vertical space above the engine. The battery is placed on the opposite side of the fuel tank, and is fixed into place using zip-lock ties, due to the necessity of removing the battery for charging and replacement.
The vehicle’s electric circuitry includes the vehicle ignition-kill switch, which cuts the current between the battery, engine starter and spark plug. Another segment of the circuitry also allows engine sensor readings to be displayed to the driver through digital monitors (seven-segment display), providing real-time vehicle speed and engine RPM.
The design of the aerobody takes into consideration the steering system, battery, driver, chassis, engine, and floor dimensions. For ease of accessi, magnetic latches will be fixated on the interior of the aerobody, and onto the edges of the floor. This will provide a safety measure for the driver in case an urgent exit is needed.
The seat will be placed approximately 20 cm below the roll hoop, so that the driver’s head would be directly below the hoop for safety measures. For compliance with SAE regulations, the wheels will be covered inside the aerobody using 1mm thin aluminum plates, to protect the driver’s lower limbs from the rotating wheels and brake disks.
Since the driver will need a clear field of vision, the frontal area of the aerobody will be removed and replaced with a thin layer of transparent plexiglass will be added.
J. Testing and Comparison A variety of tests will be organized to ensure the vehicle
passes the technical rules [1] and achieves the set objective. The mileage will be measured by running the vehicle within a certain speed range, and averaging its fuel consumption over multiple runsi. The difference in the weight of the fuel tank before and after each run is a measure of the fuel consumption.
The contribution of each design consideration is assessed according to the results achieved by the previous year’s vehicle. The coefficients of fuel mileage by each subsystem are approximated based on the previous work done, as well as engineering expectations:
Electric Starter (4x), Fuel Injection (2x), Rolling Resistance (2x), Aerodynamics (1.1x), and Weight reductions (1.5x) (the “x” represents the percent contribution to fuel economy.)
These coefficients show the contribution of each sub-system on the overall achieved mileage
b c a

322
IV. TECHNICAL AND NON-TECHNICAL CONSTRAINTS
The technical constraints are extracted from the SAE Supermileage 2017 Rules [1], in which all design requirements are explained in full detail.
The non-technical constraints include time, funding, and experience.
Time: The vehicle should be built, optimized and running, in no more than eight months.
Funding: Sponsorship proposals and company search are necessary to provide funding for the necessary components, parts, manufacturing costs, and material.
Experience: whether in automotive engineering or in the manufacturing processes, available capacities are limited. Sharing of knowledge from previous teams is also limited and un-documented.
The non-technical constraints created major difficulties in the project, as human resources are limited, and difficulties are amplified when objectives are restrained to deadlines and time limitations, without the existence of aiding resources.
V. CONCLUSION
The process of optimizing a supermileage vehicle was broken down using an engineering approach, into its building blocks. The effect of the finest and smallest elements in the vehicle is a major contributor to the final mileage achieved. The design and manufacturing work performed optimizes the current AUB supermileage car within the posed limitations. The necessary future recommendations allow endless horizons of development including: monocoque design, tear drop aero-body, external wheel fairings, along with several pin-pointed engineering works that has been documented for consideration in future efforts.
By achieving a mileage of 300 Km/L, the result would show that the proper allocation of resources, materials, driving strategies, and engineering concentrations on the various components of an operating vehicle significantly increases the efficiency of fuel consumed, and therefore reducing the overall emissions while minimizing the environmental footprint.
ACKNOWLEDGMENT
We would not have been able to achieve the desired goal without the continuous help, guidance, technical and moral support of our advisor, Dr. Mohammad Harb.
Mr. Ghassan Deeb’s contribution in providing his previous experience with the project and corresponding recommendations with the necessary documentation prevented the propagation of error and facilitated our work.
It must be noted that the product achieved by the previous Supermileage team was the basis for our work.
i This has been stated in compliance with the SAE Supermileage 2017 Rules [18]
REFERENCES
[1] SAE, "SAE COLLEGIATE DESIGN SERIES," SAW, 2016. [ONLINE].
AVAILABLE: HTTP://STUDENTS.SAE.ORG/CDS/SUPERMILEAGE/. [ACCESSED 23 OCTOBER 2016].
[2] C. O. J. B. D. I. E. J.J. SANTIN, THE WORLD'S MOST FUEL EFFICIENT VEHICLE: DESIGN AND DEVELOPMENT OF PAC CAR II, ZURICH, 2005.
[3] J. DIXON, "VEHICLE STEERING," IN SUSPENSION GEOMETRY AND COMPUTATION, CHICHESTER, JOHN WILEY & SONS, LTD, 2009, PP. 99-
125. [4] C. FUXIAO, "RELIABILITY ANALYSIS OF RADIAL TIRE," IN PRODUCT
DESIGN AND MANUFACTURE: SELECTED, PEER REVIEWED PAPERS FROM THE 2011 INTERNATIONAL CONFERENCE ON APPLIED MECHANICS,
TRANS TECH PUBLICATIONS LTD, 2011, PP. 18-20. [5] S. SHIGEYUKI, "CERAMIC BEARINGS AND SEALS," IN HANDBOOK OF
ADVANCED CERAMICS : MATERIALS, APPLICATIONS, PROCESSING, AND PROPERTIES, ELSEVIER, 2013.
[6] Y. ZHAI, D. YU, R. TAFRESHI AND Y. AL-HAMIDI, "FAST PREDICTIVE CONTROL FOR AIR-FUEL RATIO OF SI ENGINES USING A NONLINEAR INTERNAL MODEL," INTERNATIONAL JOURNAL OF ENGINEERING,
SCIENCE AND TECHNOLOGY, VOL. 3, NO. 6, 2011. [7] MECHADYNE, "PART LOAD PUMPING LOSSES IN AN SI ENGINE,"
[ONLINE]. AVAILABLE: HTTPS://WWW.MECHADYNE-INT.COM/REFERENCE/THROTTLE-LESS-OPERATION/PART-LOAD-
PUMPING-LOSSES-IN-AN-SI-ENGINE/. [ACCESSED 18 MARCH 217]. [8] CUMMINS ENGINE COMPANY, INC., "4BTA3.9-C130 ENGINE
PERFORMANCE CURVE," COLUMBUS, 1998. [9] V. GANESAN, INTERNAL COMBUSTION ENGINES, NEW DELHI: TATA
MCGRAW-HILL EDUCATION, 2006. [10] W. PULKRABEK, ENGINEERING FUNDAMENTALS OF THE INTERNAL
COMBUSTION ENGINE, NEW JERSEY: PRENTICE HALL, 2004. [11] ECOTRONS, "EFI KIT FOR BRIGGS AND STRATTON JUNIOR 206 ENGINE,"
[ONLINE]. AVAILABLE: HTTP://WWW.ECOTRONS.COM/PRODUCTS/EFI-KIT-FOR-JUNIOR-206-ENGINE/. [ACCESSED 18 MARCH 2017].
[12] V. BHANDARI, DESIGN OF MACHINE ELEMENTS, 1 ED., TATA MCGRAW-HILL EDUCATION, 2014, P. 544.
[13] S. GEORGE, "BICYCLING," 14 MARCH 2016. [ONLINE]. AVAILABLE: HTTP://WWW.BICYCLING.COM/BIKES-GEAR/TIPS/WHAT-YOU-NEED-TO-KNOW-ABOUT-DISC-EQUIPPED-ROAD-BIKES. [ACCESSED 23 OCTOBER
2016]. [14] BRIGGS & STRATTON, "206 RACING CLASS STRUCTURE AND SLIDE
INFORMATION". [15] D. ARTHUR, "ROAD.CC," 27 JANUARY 2016. [ONLINE]. AVAILABLE:
HTTP://ROAD.CC/CONTENT/FEATURE/176649-ALL-YOU-NEED-KNOW-ABOUT-REPLACING-DISC-BRAKE-PADS. [ACCESSED 23 OCTOBER 2016].
[16] F. KLAUS AND A. ABDULHAKIM, "MANUFACTURING ASPECTS OF ADVANCED POLYMER COMPOSITES FOR AUTOMOTIVE APPLICATIONS,"
APPLIED COMPOSITE MATERIAL, VOL. 20, NO. 2, 2013. [17] UDDEHOLM, "ALUMEC89," 2011. [18] "SAE SUPERMILEAGE RULES & IMPORTANT DOCUMENTS," 2017.
[ONLINE]. AVAILABLE: HTTP://STUDENTS.SAE.ORG/CDS/SUPERMILEAGE/RULES/. [ACCESSED 20
03 2017].

323
Ruggedized PV Modules: Integration within the Infrastructure
Alain Sadaka, Doaa Fayyad, Kathelen Mouawad, Rosalie Matta Mechanical Engineering Department
American University of Beirut Bliss Street, Beirut, Lebanon
[email protected], [email protected], [email protected], [email protected]
Abstract- In light of the drastic increase in energy demand globally, the environment has witnessed detrimental effects, mainly global warming, associated with the use of fossil fuels as the main source for power generation. It wasn’t before few years until industrial countries became aware of their carbon footprint and the harm inflicted on the ecosystem. This marked a revolutionary era in the realm of alternative energy, solar energy, as investing in renewable energy sources became a pressing need. Harvesting solar energy which is abundant via photovoltaic panels represents a major breakthrough, however, space availability, strength, and low efficiency hinder the successful integration of the PV modules within the infrastructure. The main aim of our work is to upgrade a polycrystalline PV module into a ruggedized one which can safely withstand external stimuli such as mechanical and thermal stresses without compromising on its efficiency. In addition, the application of the PV modules as tiles necessitates an anti-slippery nature of the module’s surface. The bulk of the work includes the optimal choice of the enclosure material as well as the coating material. Tempered glass is used for the enclosure as it possesses a desirable flexural strength that accounts for the enclosure’s mode of failure. The UV-VIS spectroscopy test on tempered glass alone shows 95% transmittance for frequencies between 300nm-700nm. Different types of coating material are investigated. Full characterization of the PV module is achieved via a series of experiments conducted to test for the optical and mechanical properties of the materials used as well as the efficiency of the module post-ruggedizing. The coating with the best test results exhibits the lowest slip potential upon performing the Cof pendulum test as well the lowest percentage drop in efficiency. A 33% decrease in efficiency is observed relative to the control being the uncovered panel. The efficiency results are obtained via recording current and voltage readings, upon enclosing the module with a coated glass sample. The wheel abrasion test is performed to dictate the wear and tear as well as the expected life of the prototype. The results seem auspicious and this study resembles a building block for further development in the field with the hopes of having road surfaces covered with PV modules.
I. INTRODUCTION
In the last three decades of the 21st century, the global energy consumption increased by about two times, with the principal energy source being fossil fuels. This is mainly attributed to demographic changes and technological advancement. The elevation in energy consumption was associated with the direct impairment to the environment and
eventually the quality of life of the individuals. In an attempt to overcome this problem and preserve the ecosystem, regulators enforced laws which limit greenhouse gas emissions. This led researchers and heads of states to rely on renewable or clean energy sources, mainly solar energy. The net solar power generation is increasing by approximately 8.3% annually compared to an annual growth rate of maximum2.9% for other renewables. [1] This clearly indicates that solar is witnessing the fastest growth compared to other renewable energy sources. It is anticipated that by the year 2040, the power generation from solar energy reaches 30% of the total power demand. Consequentially, it is inevitable that the worldwide production and manufacturing of PV modules exhibit a boost. In fact, the world’s PV module production rate grew by about 78% a year between the years 2006 and 2011. [2]
In addition to their environmental value, PV modules are advantageous from an economic or cost standpoint as the sunlight is abundant and free of production charges. Economic evaluation reveals that solar energy is a cheaper alternative with the price of 0.029 cents per kilowatt hour compared to 0.06 cents per kilowatt hour for coal. [2] Moreover, the PV modules’ efficiency can be greatly enhanced so that to optimize the cost. However, one of the main limitations of PV modules is space availability. As such, the study encompasses an approach to upgrade or ruggedize an off-the shelf PV module so that it can be safely integrated within the infrastructure, i.e. used as a tile, without compromising on its efficiency. Ruggedizing PV modules is recently getting the attention of the world. Many projects are working on this idea but all of them are still under the testing phase and none of them have shared technical details about their products.
The study revolves around finding the most suitable material to fit the application. The study is multifaceted as the enclosure material as well as the coating should have desired mechanical as well as optical properties. The major specifications of the prototype are an anti-slippery surface and the ability to endure a static load of 1 kN. Series of tests are conducted in accordance with the well-known testing protocols such as ASTM and ASME. This is to validate or verify the use of a certain potential material and not the other. The necessary tests include transmittance test by the UV-VIS spectroscopy machine, efficiency test, wear test, and slip potential test. The coalition of the four mentioned tests allows the full characterization of the module.

324
II. METHODOLOGY
A. Approach We will adopt a systematic approach for solving the design project in hand. On the mechanical level, the PV module is designed to bear a static load of approximately 1000N. As such, the failure mode of the PV module will be mostly by bending, and that is when the applied stress exceeds the maximum allowable flexural strength of the material. In addition to being stress resistant, the PV module should be wear and scratch resistant, water and dust resistant, and most importantly it should be non-slippery to avoid any undesired accidents once integrated and put for use. In other words, the PV module should withstand all the external stimuli that it is prone to be subjected to upon its integration with the infrastructure; such as extreme weather conditions, mechanical and thermal stress, and dirt to name few without having its efficiency altered. On the optical level, the material used for ruggedizing should possess appropriate optical qualities such as high transmittance levels at the visible light wavelengths or spectrum (390-700nm). Moreover, the process of ruggedizing must take into consideration any possibility of partial shading which is known to drastically affect the efficiency of the PV module. Finally, as for the PV module it is going to be of the polycrystalline type because it has a relatively high efficiency compared to other available modules. The material to be used for ruggedizing is tempered glass. For coatings, we have chosen two: polyurethane with quartz, and epoxy with glass beads. Polyurethane coatings are characterized by notable physical and chemical properties, thus applying them on surfaces subjected to relatively high levels wear and tear is recommended. These coatings increase the durability of surfaces against environmental deterioration. Quartz sand, being a hard mineral, plays several key roles in improving floor characteristics. However, our main concern is using this coating to provide roughness to the surface thereby rendering it anti-slippery. Epoxy resin is a floor coating known for its excellent mechanical and adhesive strength as well as its outstanding resistance to heat. It also provides protection and wear resistance to the surface being coated. However, the glass beads are added to render the surface rough and simultaneously transmit light into the tempered glass.
TABLE I
NAMES AND DESCRIPTIONS OF TESTED SAMPLES
Name Coating Epoxy Epoxy without glass beads
Glass Beads Epoxy + Glass Beads
Poly1 Polyurethane Low Concentration
Poly2 Polyurethane Medium Concentration
Poly3 Polyurethane High Concentration
Characterization B. Transmittance Measurement: Spectrophotometer
Since the material and coatings used to cover photovoltaic cell highly affect the performance of the cell, their transmittance must be measured. The higher the transmittance, the better the performance. In order to quantify it, the V-570 UV/VIS/NIR Spectrophotometer found in the Physics Central Lab was used. A spectrophotometer consists of a spectrometer that produces light at any wavelength and a photometer that measures the intensity of the light passing through the material. Various samples of materials having different textures can be easily inserted and tested. The transmittance test is conducted within a wavelength range of 300-800 nm in which Si-based photovoltaic cells are usually responsive.
C. Efficiency Measurement: Solar Simulator Solar simulators provide a close match to the solar spectrum
using a light source. This test apparatus consists of a Xenon Lamp Power Supply providing illumination similar to natural sunlight, a Class II Pyranometer measuring the total radiant power of incident radiation from 310 to 2800nm, and a power generator to register the voltage and current. This test mainly aims at studying the efficiency of the solar panel as well as the efficiency drop in the performance when enclosure materials with different coatings are placed on top. The solar cell is placed under the solar simulator where measurements of the voltage and current are recorded using the Lab Tracer program.
D. Slip Resistance Measurement: Pendulum Coefficient of Friction (CoF) Test
Since our model is designed for outdoor applications, people should be able to move around freely and safely. Therefore, the Pendulum and CoF test is used to study the slipperiness of the material’s surface after being coated with variable concentrations of different chemical compositions. The pendulum apparatus (also found in the Geotechnical Civil Engineering Lab) consists of a swinging heel which sweeps over the material to be assessed. The pendulum test value (PTV) obtained is directly affected by the slipperiness of the surface. Through this value, the slip potential could be obtained as shown in Table 1.
TABLE II SLIP POTENTIAL CLASSIFICATION BASED ON PENDULUM TEST VALUES [4]
Slip Potential PTV
High 0-24
Medium 25-35

325
Low 36+
E. Wear Resistance Measurement: Dry Sand/Rubber Wheel Apparatus
The abrasion test is performed to determine the resistance of the coatings on the glass samples to scratching abrasion since the enclosure material will be subjected to high friction when people step on it. The dry sand/rubber wheel abrasion test consists of a test specimen pressed against a rotating wheel with a neoprene/ chlorobutyl rubber rim. Meanwhile, sand flows at an accurate flow rate to abrade the test surface such that the contact face of the rubber wheel moves in the same direction as that of the sand flow. This test method measures abrasion by recording the mass loss between the start and the end of the experiment and converting it to the volume loss.
III. RESULTS & ANALYSIS
Three Samples of every coat were prepared and tested several times to ensure accurate and precise results. The results for each test are tabulated below. As seen in Fig. 1 and Fig. 2 respectively, the clear coat was the best coat in turns of transmittance, and efficiency, but when it came to slip resistance measurements, this coat has shown to have a low pendulum test value in wet conditions (Refer to Table 4). All the polyurethane coats behaved almost the same in the slip resistance test: they had a good slip resistance under dry conditions but a bad one under wet conditions. The transmittance test showed that the light polyurethane coat has a transmittance lower than the epoxy coat but higher than all the others. (Refer to Fig 1). Referring to Table 3 The efficiency test has shown a drop of 62% for the clear polyurethane coat and a drop of 98% for the two others. Glass beads coat caused 33% of efficiency drop even though it has a 10% transmittance, and it has also a decent slip resistance (the highest test value in wet conditions). The low transmittance for glass beads is probably due to the refraction of the beam emitted in the spectrophotometer caused by the sharp geometry of the beads. The relatively high efficiency of this coat tells us that a considerable fraction of light is traversing the coat but not in a perpendicular way.
Since the safety of pedestrian is our main concern, we could not use the epoxy coat despite its high efficiency and transmittance. Polyurethane coats have a big effect on the efficiency of the solar panel and they also have a bas slip resistance in wet conditions. The best candidate was the glass beads coat which affects the efficiency of the solar cell by only 33% and has a good slip resistance.
FIGURE 1: TRANSMITTANCE MEASUREMENT

326
Figure II: CURRENT- VOLTAGE CHARACTERISTIC CURVES FOR
DIFFERENT COATINGS
TABLE 3: CALCULATED AVERAGE EFFICIENCY & EFFICIENCY DROP
Sample Average Efficiency Average Drop
Solar Cell 11.34 0%
Clear 8.66 24%
Glass Beads 7.55 33%
Light Dark 4.16 63%
Dark 0.24 98%
Medium Dark 0.26 98%
TABLE 4: SLIP POTENTIAL TEST VALUES
Sample PTV Dry Wet
Clear 71.2 12 Glass Beads 50 32.33
Dark 48.78 18.33
IV. CONCLUSION
Based on our investigation, we are able to conclude that glass beads coated on a tempered glass enclosure are a favorable set-up in fulfilling our target to attain a ruggedized solar panel. Tempered glass retains the flexural strength to withstand the weight force exerted by people walking on it. Furthermore, the efficiency test proved that an efficiency drop of 33% is expected, while the slip test rendered the set-up safe to be walked on (anti-slip). In conclusion, this prototype is a step in the right direction of integrating solar energy into our infrastructure. However, the possibility of ruggedized solar cells becoming common place still requires an extensive amount of research and testing. At the same time, one cannot but be amazed at the possibility of this becoming a reality. Perhaps, in the near future, photovoltaic solar road panels will be commercialized, and powering our green energy future will be possible.
V. ACKNOWLEDGMENT
We would like to thank our advisor Dr. Samir Mustapha for his support and guidance at every step of the way. Without him, we wouldn’t have reached our end target. We would also like to appreciate Dr. Mohammad Abiad’s assistance in test methods. Furthermore, we extend our gratitude to Mrs. Dima Al Hassanieh who aided us in test procedures and execution. Furthermore, we extend our special thanks to Pastel Paints, Colortek, and Glassine Industries for sharing their insights and experience, providing us with materials and samples.

327
REFERENCES [1] T. Werner, "Sunpower Solar Blog," 9 August 2016. [Online]. Available:
https://us.sunpower.com/blog/2016/08/09/sunpower-ceo-tom-werner-solar-industry/.
[2] K. Mathiesen, "Guardian Sustainable Business," 31 January 2016.
[Online]. Available: https://www.theguardian.com/sustainable-business/2016/jan/31/solar-power-what-is-holdingback-growth-clean-energy.
[3] V. Tyagi, N. A. Rahim, N. Rahim and J. A. Selvaraj, "Progress in solar
PV technology: Research and achievement," ElSevier, India, 2012. [4] "Assessing the slip resistance of flooring," May 2012. [Online].
Available: www.hse.gov.uk/pubns/geis2.pdf.

328
The Development of a 3D Printed Myoelectric Upper Limb Prosthesis
Adnan El-Kawas Mohammad Rafic Cambris
Department of Mechanical Engineering American University of Beirut
Riad El-Solh, Beirut 1107 2020, Lebanon [email protected]
Abstract – The field of prosthesis has been accelerating rapidly over the past few decades, going from simple static prostheses to fully functioning myoelectric prostheses. The advent of 3D printing and rapid prototyping have greatly influenced this pro-gress. The purpose of this project is to lower the cost of prosthe-sis while maintaining a useful range of functionality found in more expensive commercial offerings and while maintaining the most anthropomorphic design possible. The upper limb anat-omy is 3D printed and integrated into an electromechanically-actuated design. The motion control is based on muscle/nerve signals acquired via Myo Armband, a commercially available EMG sensing device.
I. INTRODUCTION
Motivation Why should someone be treated as a lost cause or with
less respect than anyone else based on a physical deformity? The goal of a prosthetic limb is to restore the natural move-ment of the wearer, or at least to restore a certain degree of this natural movement so that the wearer will be able to achieve his full potential.
The number of amputees is on the rise. The need for a cheap, functional prosthetic limb has never been higher. This is due to the fact that arm amputees make up 30% of the total amputee population [1], 80% of which live in developing countries [1] and therefore do not have the funds nor the in-frastructure for the functional upper limb prosthetics availa-ble on the market. To put this into context, consider the pop-ulation of Lebanon, a developing country. The population is estimated at around 5.85 million [2]. Taking the ratio of 1.5:1000 for amputees to non-amputees [1] we obtain 8,775 amputees of which 2,633 are arm amputees. Most of these amputees do not have the funds to obtain functional prosthet-ics and therefore have an innate disadvantage when com-pared to their non-amputee peers due to their inability to se-cure these funds due to, in turn, the general lack of job op-portunities for these “disabled” individuals.
Desired Needs
Functioning prosthetic limbs have become exceedingly expensive, costing upwards of 50,000$ for a single limb. This puts the large majority of amputees at a disadvantage. Our
product aims to satisfy the needs of these individuals that are at a disadvantage by giving them the option to obtain, at a greatly reduced cost, a functional prosthetic limb that allows them to level the playing field somewhat. Therefore, the product must first and foremost be cheap when compared to other prosthetics of the same type. It must be functional and easily replaceable, since children require a replacement every 6-12 months and adults require a new one every 3-5 years [3].
The amputee, should he be able to obtain this cheap pros-thetic, would be able to perform more work and begin gener-ating his own fortune upon which he can build a life. Losing a hand used to be one of the biggest obstacles a person could face. This is the problem we address in this paper.
II. METHOD
Prosthesis Design The first step of our process was to obtain scanned CT
files obtained by our predecessors for the sake of this project. After obtaining the files we could view and modify them slightly using the CAD software available and generate an stl (stereolithgraphy) file as seen in Figure 1. Of utmost im-portance to the project was the creation of a functioning hinge
Figure 1: CAD Model Obtained (Left) to 3D Printed PLA Model (Right)

329
that would serve as a connecting joint for the bones. Since, in the human body, the fingers are connected by tendons and ligaments, our solution was to create the hinge as a support for the artificial tendons and ligaments to be added later.
The process of designing the hinges went through multi-ple iterations, starting with the attempt to use living hinges, as is seen on several plastic products, and ending with the design of a unique yet familiar hinge which draws inspiration from the hinges we see every day on doors, windows, and the like. The designed hinges were then integrated into the ob-tained stl files in order to create a stronger, more durable, bond with the bone models created. After completing the pro-totype design, it was 3D printed using an Ultimaker 2+ 3D printer in order to give us our physical prototype for further testing. The printed model is shown in Figure 1.
Mechanical Actuation of the Prosthesis
The obtained hand model then had artificial tendons and ligaments added to it. These tendons and ligaments took the form of tennis racket wire and rubber bands, as shown in Fig-ure 3, simulating the pull of the muscles required for hand movement in either side. The rubber bands were attached on the dorsal side of the hand while the tennis racket wires were attached on the palmar side. Since the tennis wire is inexten-sible, pulling on it would cause the finger to bend, mimicking the natural motion of the human hand. The rubber bands lo-cated on the other side worked to return the hand to its origi-nal position once the tennis wire was released. We then at-tached five separate servo motors with 180° control to each of the fingers on the hand as shown in Figure 2. These motors would be controlled through the program generated later. One of the main design criteria was to ensure that the motors were located outside the main prosthesis to allow for easy re-placement of the motor should one malfunction. This would lower the maintenance cost in the long run. Fig. 2 shows the initial external box designed to hold the servo motors. Given that the motors would later be integrated directly into the har-ness used to strap the prosthetic to the amputee’s remaining limb, this served as a temporary solution to prove that motors can, in fact, be placed outside the prosthetic enclosure and still function as well as internal motors.
Figure 2: Servo Motors Used for Single Finger Actuation
Figure 3: Natural (Top) [4] Vs Artificial (Bottom) Muscle Placement Com-
parison Between Natural Human Finger and Simulated Prosthetic Finger
Prosthesis Aesthetics It was made clear to us at the beginning of the project that
having the hand remain in stripped down bone form would not give an elegant or user friendly experience. Therefore, we set out to create a covering for the hand that would mimic the appearance of skin. In order to do this, several ideas were put forward, including simply placing a glove over the hand to hide the inner workings and placing the entire hand inside a mould. The former idea did very little in the way of skin mim-icry while the latter would not allow the hand to have any flexibility due to the mould interfering with the contraction caused by pulling the wires. To overcome this, a middle ground was found which incorporated elements from both ideas together.
A latex glove was placed over the prosthesis, thus protect-ing the internal workings from damage. This was then placed inside a mould created specifically for the purpose of giving the hand the external look of a normal human hand.
Electrical Actuation of the Prosthesis
The prosthesis is meant to be myoelectric, hence there should be an input from the muscles in the hand. This was done by obtaining a Myo Armband from Thalmic Labs. The Myo is an EMG (Electromyography) sensor that is able to pick up the impulses from the muscle contraction through its array of sensors on all sides of the armband. The armband is connected to the central processing unit, or the brain of our project, in our case a tablet pc or laptop, via Bluetooth where it is analysed in real time to identify the specific gesture re-quested by the user. The gesture required is hardwired to an input on the keyboard. For instance, contracting the index fin-ger may be represented by an A on the keyboard. While the analysis of the EMG signals is occurring, a LabVIEW pro-gram is running in parallel at the same time, with Boolean functions corresponding to each of the gestures available. These Boolean functions are assigned to the corresponding buttons on the keyboard. When the Boolean function is in the ON position a signal is sent to the corresponding motors in the hand to perform the required rotation and give the correct hand gesture as that that was requested by the user. Figure 4 demonstrates the process of actuating the prosthetic from start to finish. For example, say the user requests the index

330
and middle finger to contract by contracting the muscles usu-ally required to perform this action. The Myo Armband picks up the EMG signals detected and transmits them via Blue-tooth to the tablet PC. There, with the LabVIEW program running in the foreground and the analysis software running in the background, the correct gesture is identified and the correct buttons are pushed on the virtual keyboard. The pushed buttons act as switches in the LabVIEW program, triggering an ON command which is sent to the correspond-ing motors, causing the index and middle fingers of the pros-thetic to contract. Similarly, when the user relaxes his hand, the virtual keyboard buttons are released, returning the switches to the OFF position and, by association, the motors to their initial position.
Figure 4: Myoelectric Actuation Process. EMG Signals Obtained from
Myo Armband [5] and Sent Via Bluetooth to Tablet Running NI LabVIEW [6] Which in Turn Sends Signal Via USB to NI MyRio [6] and Hence Ac-
tuates One or More Motors in the Prosthetic Hand.
III. RESULTS
After obtaining the completed prototype of the hand, not including the aesthetic covering, tests were carried out to val-idate our hypothesis. These tests included range of motion, freedom of motion, grip strength, and total cost and served as a proof of concept for the design. Range of motion
Our test for range of motion was composed of testing for single finger movement to close and open as well as multiple finger movement. We noticed that as more fingers were re-quested to close at the same time the synchronisation and speed of the movement slowed down. This could be caused by the usage of multiple PWM (Pulse Width Modulation) outputs in the MyRIO, which may cause slight interferences or residual noise to occur, leading to the delays. It did not, however, affect the range of motion the fingers would go through, maintaining the complete open/close cycle for every single finger. In terms of single finger motion no issues were detected, validating our assumption that single finger motion could be established.
Freedom of Motion The freedom of motion test measured the ability of the
finger to move when not exposed to any motor interference, i.e. when the setup was disconnected. This was done by dis-connecting the motors from the MyRIO, rendering them in-effective. We then applied external forces to the fingers by contracting and relaxing them in both the dorsal and palmar directions. We found that, due to the tension in the rubber bands and the tennis racket wire, the hand would always re-turn to the initial position when the hand was closed manu-ally. This also caused motion towards the dorsal side of the hand to be restricted. The side to side motion of the hands was also tested and found to be slightly restricted due to the nature of the hinges designed. These results were expected. Grip Strength
In terms of grip strength, it was found to be directly cor-related to the torque of the motors. The motors we used had a torque rating of 0.8 kg.cm which yielded a grip strength, when tested with a portable scale for its pulling force, of around 0.5 kg. This was the case for every separate finger. Therefore, a total pulling force of around 2.5 kg could theo-retically be obtained with the motors currently used. This force could easily be doubled, tripled, or more if more pow-erful motors are used. The ease with which these motors can be changed is critical since it allows for increasing the grip strength of the individual to match the average grip strength of his/her age group. Total Cost
The main goal of the project was to find a cheap, func-tional alternative to the prosthetics available today. Table 1 shows that this goal was accomplished, yielding a total cost of under 300 US Dollars, not including shipment expenses for the Myo Armband and other sourced materials.
TABLE I PRICE OF MANUFACTURE FOR PROTOTYPE
Item Quantity Price ($)
Myo Armband 1 200
Servo Motor 5 50
Rubber Bands Pack of 1 2
Tennis Racket Wire Pack of 1 5
PLA for 3D Printing 100 g 10 TOTAL: 267
IV. DISCUSSION
We have been able to produce, in a very short period of time, an anthropomorphic prosthetic limb that satisfies many

331
of the motions and gestures required by humans in their eve-ryday life. This proves that the prices on fully functioning prosthetic limbs are exceedingly disproportionate to the prices that could be achieved. This also proves that, for a small increase in price, the functionality could be very greatly improved compared to the mechanically actuated open/close models.
It is worth noting that the hand can be modified and per-sonalised to suit the individual’s specific needs, be it in terms of size, since the size is determined by the CT scan of the other limb, grip strength, since the motors can be inter-changed to give a stronger or weaker grip for the specific applications required for the prosthetic to perform, or outer covering, which could be modified to enable touchscreen usability.
The low price and functionality of the hand as well as the biomimetic design mean that the possibilities and the market for such a product are endless. It could be used as a cheap prosthetic, as is intended, but it could also be used as a project kit for those interested in signal processing and mechatronics. It could also be used as a cheap, working alternative for re-searchers studying signal conditioning. Finally, given the gy-roscopes and accelerometers imbedded in the Myo Armband, the prosthetic could be improved by adding extra motors to rotate the hand according to the arm position.
It is worth noting that, at the time of writing, the project has not reached its full potential and could require a few more months to completely eliminate any remaining issues. It does, however, serve as a proof of concept for what is possible to-day to better the live of individuals at a fraction of the cost it currently requires.
V. CONCLUSION
It has been shown that a cheap, functional prosthetic is not beyond the realm of possibilities available to us in this age. With the rapid advance of 3D printing techniques and the ma-jor steps being taken in EMG signal processing, the future of prosthetics looks very bright. The importance of the work be-ing undertaken in this field is not to be underestimated as ad-vances in this field could lead to revolutionising the way we look at the human body and handle its injuries.
ACKNOWLEDGMENTS
We would like to acknowledge Dr. Ramsey Hamade for his help and guidance throughout this project as well as Mr. Hisham Ghalayini for his insight into 3D printing.
REFERENCES
[1] M. LeBlanc, "‘Give Hope - Give a Hand’ - The LN-4 Prosthetic Hand," 2008. [Online]. Available: https://web.stanford.edu/class/engr110/2011/Le-Blanc-03a.pdf. Accessed: Oct. 27, 2016. [2] T. W. B. Group, "Lebanon," 2016. [Online]. Available: http://data.worldbank.org/country/lebanon. Accessed: Dec. 2, 2016. [3] W. Society, "The need,". [Online]. Available: http://www.lowcostpros-thesis.org/the-need. Accessed: Dec. 5, 2016. [4] L. Richards and J. Loudon, "Hand Kinesiology," 1997. [Online]. Avail-able: http://classes.kumc.edu/sah/resources/handkines/kines2.html. Ac-cessed: Oct. 27, 2016. [5]"Myo Gesture Control Armband", Myo.com, 2017. [Online]. Available: https://www.myo.com/. [Accessed: 19- Mar- 2017]. [6]"Ntional Instruments: Test, Measurement, and Embedded Systems - Na-tional Instruments", Ni.com, 2017. [Online]. Available: http://www.ni.com/en-lb.html. [Accessed: 19- Mar- 2017].

332
Using Harvested Rainwater to Generate Energy from Piezoelectric Transducers Via an Intermediate
Mechanism Joanna Akl Zahi Ismail
Marwa Traboulsi Mohamad Tuqan
Mechanical Engineering Department American University of Beirut
Hamra, Beirut [email protected]; [email protected]; [email protected]; [email protected]
Abstract – As energy depletion rises to be an increasingly significant issue of our day, the focus on renewable technologies and harvesting methods enhances. In our project, we will explore piezoelectric transducers to identify ways to exploit their potential as a future large scale renewable energy source. Specifically, we will concentrate on rainwater as an ecological source of kinetic energy that can be leveraged with the use of piezoelectric transducers. We will elaborate on why using an intermediate mechanism to fluctuate the piezoelectric material and avoiding direct contact with the raindrops will permit us to better control the frequency of the fluctuations and therefore give us a better chance at reaching the natural frequency of the piezoelectric material at which maximum voltage is generated. Ultimately, the goal of this final year project is to generate a voltage by having a water-wheel rotate when dropping rain water on it and run a mechanism that will hit the piezoelectric cell. The voltage generated is then to be maximized and stored. We will try to minimize the size of the mechanism as much as possible so that more mechanisms can be fitted in the same space and hopefully one day it’ll be incorporated in buildings and use the power generated to supplement the power provided by EDL.
I. INTRODUCTION
Piezoelectric materials, though are currently used as sensors and actuators, are being thoroughly explored and tested on as potential power harvesters. Using the kinetic energy of footsteps, for instance, one application has been to create piezoelectric sidewalks. Embedding piezoelectric materials, specifically piezoelectric Polyvinylidene Fluoride (PVDF) films, into tires is also a research field that attempts to harvest energy for electric cars. We specifically decided to focus on capturing rainfall energy to harvest power using piezoelectricity as this topic is still new and there’s much to discover. Hence, our project seeks to determine the most effective and efficient way to convert the kinetic energy of rooftop rainwater to electric energy using piezoelectric materials.
A. Rainfall in Lebanon
Since our project aims to exploit rainwater energy, it would interest any region where rainfall occurs consistently. In
Lebanon, the data suggests that we do have consistent rainfalls throughout the year, and basing the potential amount of rainfall energy collected on the average surface area of a building’s rooftop, we can see that there’s much energy to be captured [1]. The following tables provide exact details on just how much rainwater can be captured in different regions in Lebanon, based on various factors including housing type, rainfall data, population, and climatic areas.
TABLE I Average precipitation and population in the Lebanese Governorates [1].
Governorate Area Rainfall Population (km2) (mm/year) (million)
Mount Lebanon 1985 1200 1.97702 North Lebanon 2024.8 1000 0.9644 Beqaa 4280 600 0.57864 South Lebanon 1987.6 750 0.81974 Beirut 19.8 600 0.4602
Total 10297.2 4.8 To calculate the potentially harvested water (HW) for each
governorate the following equation was used:
HW= R*A*K
where R is the average rainfall in the target governorate, A is the total roof area and K is the run-off coefficient of 80%, meaning 20% losses. Also, the analysis assumes that only 50% is effectively harvested. Table 2 summarizes the results, and shows that in one year, we can collect around 2.5 million cubic meters (MCM) of rainfall.
These results will help us significantly if we decide to use rainwater to harvest power from piezoelectric materials indirectly i.e. using an intermediate mechanism. If we decide to do so directly i.e. using the direct impact of rainwater on the piezoelectric materials, then we would need an analysis of the kinetic energy of a raindrop, as presented in the Literature Review section. We would then divide the 2.5 MCM by the average volume of a raindrop to determine the number of captured raindrops, and multiply that by the kinetic energy we

333
Using Harvested Rainwater to Generate Energy from Piezoelectric Transducers Via an Intermediate
Mechanism Joanna Akl Zahi Ismail
Marwa Traboulsi Mohamad Tuqan
Mechanical Engineering Department American University of Beirut
Hamra, Beirut [email protected]; [email protected]; [email protected]; [email protected]
Abstract – As energy depletion rises to be an increasingly significant issue of our day, the focus on renewable technologies and harvesting methods enhances. In our project, we will explore piezoelectric transducers to identify ways to exploit their potential as a future large scale renewable energy source. Specifically, we will concentrate on rainwater as an ecological source of kinetic energy that can be leveraged with the use of piezoelectric transducers. We will elaborate on why using an intermediate mechanism to fluctuate the piezoelectric material and avoiding direct contact with the raindrops will permit us to better control the frequency of the fluctuations and therefore give us a better chance at reaching the natural frequency of the piezoelectric material at which maximum voltage is generated. Ultimately, the goal of this final year project is to generate a voltage by having a water-wheel rotate when dropping rain water on it and run a mechanism that will hit the piezoelectric cell. The voltage generated is then to be maximized and stored. We will try to minimize the size of the mechanism as much as possible so that more mechanisms can be fitted in the same space and hopefully one day it’ll be incorporated in buildings and use the power generated to supplement the power provided by EDL.
I. INTRODUCTION
Piezoelectric materials, though are currently used as sensors and actuators, are being thoroughly explored and tested on as potential power harvesters. Using the kinetic energy of footsteps, for instance, one application has been to create piezoelectric sidewalks. Embedding piezoelectric materials, specifically piezoelectric Polyvinylidene Fluoride (PVDF) films, into tires is also a research field that attempts to harvest energy for electric cars. We specifically decided to focus on capturing rainfall energy to harvest power using piezoelectricity as this topic is still new and there’s much to discover. Hence, our project seeks to determine the most effective and efficient way to convert the kinetic energy of rooftop rainwater to electric energy using piezoelectric materials.
A. Rainfall in Lebanon
Since our project aims to exploit rainwater energy, it would interest any region where rainfall occurs consistently. In
Lebanon, the data suggests that we do have consistent rainfalls throughout the year, and basing the potential amount of rainfall energy collected on the average surface area of a building’s rooftop, we can see that there’s much energy to be captured [1]. The following tables provide exact details on just how much rainwater can be captured in different regions in Lebanon, based on various factors including housing type, rainfall data, population, and climatic areas.
TABLE I Average precipitation and population in the Lebanese Governorates [1].
Governorate Area Rainfall Population (km2) (mm/year) (million)
Mount Lebanon 1985 1200 1.97702 North Lebanon 2024.8 1000 0.9644 Beqaa 4280 600 0.57864 South Lebanon 1987.6 750 0.81974 Beirut 19.8 600 0.4602
Total 10297.2 4.8 To calculate the potentially harvested water (HW) for each
governorate the following equation was used:
HW= R*A*K
where R is the average rainfall in the target governorate, A is the total roof area and K is the run-off coefficient of 80%, meaning 20% losses. Also, the analysis assumes that only 50% is effectively harvested. Table 2 summarizes the results, and shows that in one year, we can collect around 2.5 million cubic meters (MCM) of rainfall.
These results will help us significantly if we decide to use rainwater to harvest power from piezoelectric materials indirectly i.e. using an intermediate mechanism. If we decide to do so directly i.e. using the direct impact of rainwater on the piezoelectric materials, then we would need an analysis of the kinetic energy of a raindrop, as presented in the Literature Review section. We would then divide the 2.5 MCM by the average volume of a raindrop to determine the number of captured raindrops, and multiply that by the kinetic energy we
obtained. This would be the total kinetic energy to be converted assuming direct contact of the raindrops on the piezoelectric materials.
TABLE II Roof runoff in Lebanon [1].
Governorate Floor Area Rainfall HW (103 m2) (mm/year) MCM
Mount Lebanon 3000 1200 1.44 North Lebanon 1000 1000 0.4 Beqaa 1000 600 0.24 South Lebanon 1000 750 0.3 Beirut 165 600 0.045
Total 3165 2.425 Of course, we expect our system to have many inefficiencies,
and so not the entire kinetic energy will be converted. Ultimately, however, we hope to explore the potential of using rainwater, whether directly or indirectly, to harvest energy.
II. OVERVIEW OF PIEZOELECTRICITY
A. Piezoelectricity Piezoelectricity, from its name, means electricity from
pressure. This property is present in some naturally occurring crystalline minerals such as quartz, cane sugar and Rochelle salts [1]. Once mechanical stress is applied in the form of tension or compression to these non-centrosymmetric materials, an electric charge is observed. This effect is called the direct piezoelectric effect. Conversely, the inverse piezoelectric effect induces a mechanical strain once an electric charge is applied to the material. Vibrational motion, as expected, results in the direct piezoelectric effect, and the resulting output power depends on various internal and external factors [2]. B. Types
Generally, there are three types of microfabricated piezoelectric materials, natural materials (such as Barium Titanate), piezoelectric ceramics (PZT), and polymer-films (PVDF) [4].
Some natural piezoelectric materials such as Lead Magnesium Niobate-Lead Titanate exhibit higher sensitivity than PZTs, but have a lower Curie temperature, making them more suitable for certain applications [4].
Though PZTs still have high sensitivity, it diminishes over time, and this is usually correlated with high environment temperatures. PZTs are also brittle and have a low tensile strength, indicating in our research that these materials may not be the best for rain harvesting applications since they’d be exposed to the risk of fatigue failure due to cyclic loading [4].
PVDF films demonstrate the best qualities among the three. Their Young’s modulus is around 1/12th that of aluminum, meaning that they’re much more suitable for applications that make use of bending or torsion, and they’re easily shaped to fit any base structure. Despite having a low piezoelectric coefficient, PVDFs have low material density and high sensitivity, and are still 10 times more mechanically tough than
PZTs. However, ceramics are still stronger electromechanical transmitters at resonance [4].
There is a 4th type also called Macro-Fiber Composite (MFC). “The MFC Actuator is an encapsulated, high-performance, inplane, piezoelectric fiber composite strain device. The MFC actuator consists of rectangular piezoelectric fibers sandwiched between layers of adhesive and electrode polyimide film. MFCs are similar in concept to Active Fiber Composites (AFCs), differing in the use of rectangular piezoelectric "fibers" diced from PZT sheets [6].”
“The MFC design incorporates easier-to-handle macrofibres in a simple and repeatable manufacturing process, and places these fibers close to the electrodes to reduce voltage requirements. Thus, the advantages of the fiber's high strain energy, directional actuation, conformability, and durability are retained. When embedded in a surface or attached to flexible structures, the MFC actuator provides distributed, solid-state deflection and vibration control [6].” C. Comparison of the Types
Below we summarize the pros and cons of all three types of piezoelectric materials from our literature review.
TABLE III Comparison of PZT, PVDF, and MFC.
Pros Cons PZT Have high sensitivity.
Sensitivity diminishes over time -correlated with high environment temperatures. Brittle. Have a low tensile strength.
PVDF Their Young’s modulus is around 1/12th that of aluminum, meaning that they’re much more suitable for applications that make use of bending or torsion. They’re easily shaped to fit any base structure. PVDFs have low material density and high sensitivity. They are 10 times more mechanically tough than PZTs.
Have a lower piezoelectric coefficient.

334
MFC The MFC is extremely flexible, allowing it to be bonded to structures that have curved surface without fear of accidental breakage or additional surface treatment as is the case with monolithic piezoceramic materials. MFC uses interdigitated electrodes that capitalize on the higher d33 piezoelectric coupling coefficient, allowing it to produce higher forces and strain than typical monolithic piezoceramic materials.
It was found that the MFC performed inadequately as a power harvesting medium. The electrical output from the MFC contained a very large voltage component but an extremely low current. It may be thought that the power would still be the same even if the voltage was large and the current was low, but for the case of the MFC the power generated is about a factor of ten smaller.
We decided to test MFC and PZT in our application to
experimentally determine which one will give us a higher output.
III. BEAM MATERIAL COMPARISON AND SELECTION
We compared the relevant mechanical properties of the two beams provided for our testing (Stainless Steel 304 and Aluminum 3003) in order to get an idea about which is the most suitable for our application.
Since we are working in a wet environment it seemed relevant to compare the corrosion rate of each material. The corrosion rate is the speed at which a metal deteriorates in a certain environment. So, the less the corrosion rate, the better. [7]
We also desire our beam to be able to deflect and return to its original shape. Therefore, plastic deformation is to be avoided and the material selected should have a high yield strength, a high elongation percentage and a high modulus of elasticity.
And since our beam is subjected to cyclic loading it also seemed important to compare the fatigue limit of both materials. The material selected should have a higher fatigue limit in order to tolerate the application of cyclic stresses without causing mechanical failure. [8]
And since the piezoelectric transducer is to be implemented directly on the beam, it will be beneficial that the metal selected be a relatively poor conductor of electricity. Therefore, it also seemed relevant to compare the electrical conductivity of both materials.
TABLE IV Comparison of material properties for Stainless Steep 304 and Aluminum 3003.
Stainless Steel 304 showed to be the most suitable for our application.
As for the beam structure, in K. G. Chua, Y. F. Hor, and H. C. Lim’s "Raindrop Kinetic Energy Piezoelectric Harvesters and Relevant Interface Circuits: Review, Issues and Outlooks," it was concluded that using a cantilever design would allow us to obtain the maximum output of energy for each raindrop. The various structures compared at displayed in Figure 1 below.
Figure 1. Various design structures of raindrop experiments with piezoelectric materials [5].
IV. CIRCUIT SELECTION
As for the kind of circuit to be used, there are ample circuits previously used by researchers. The piezo cell moves in both directions and therefore it outputs an oscillatory waves (AC) and to store the electricity generated in a DC battery we will be using a standard wave rectifier circuit shown to the right. [7]
This is a standard circuit that transforms an AC voltage input to a DC voltage output and that will allow us to store the energy harvested in a battery.
The full bridge rectifier circuit will be used only to give us a somewhat smooth DC voltage output, however we still need a low pass filter to attenuate noises generated from the piezo and capacitor and an amplifier circuit. These two new circuits will need to be specially designed for our application and therefore we will not be relying on standard circuits used in other research.
The amplifier circuit will also be a standard circuit that takes in low amplitude DC voltage and amplify it in order to store it in a high voltage DC battery.
Therefore, the AC voltage generated by the piezo cell will pass by the full bridge rectifier circuit, go through a low pass filter and then through the amplifying circuit and afterwards it will get stored in the battery. Hence, in our model, the only
applicable standards that will be used are the cantilever
Stainless Steel 304 Aluminum 3003 Corrosion Rate (µm/yr) 14.6 15.24
Ultimate Tensile Strength (Mpa) 621 160 0.2% Yield Strength (Mpa) 290 120
Elongation % in 2’’ (50.8 mm) 55 6.4 Brinell Hardness (HB) 201 40 Fatigue Limit (MPa) 240 60
Modulus of Elasticity (GPa) 193 69 Electrical Conductivity (% IACS) 8-12 44
Cost ($/tonne)
2253 1300

335
structure that proved to be the most efficient at transmitting impact among many other structures, the full bridge rectifying circuit that transforms an AC voltage input to a DC voltage output and the amplifying circuit that will amplify the voltage so it can be stored in a battery.
Figure 2. Standard full bridge rectifier circuit AC to DC.
V. MATERIAL AND PIEZOELECTRIC CELL SELECTION
MECHANISM SELECTION
In this phase, we sought to determine which structural material and which piezoelectric cell are the most suitable for our project needs.
Based on our literature review, we already identified that the cantilever beam is the most effective design structure. As for selecting stainless steel as our beam material, this was because it resists corrosion, rusting and staining in wet environments, tolerates significant deflection, withstands bending, fits our project’s needs, and it available in SRB labs.
However, when it came to selecting the piezoelectric material, our research did not help us answer the question. Though we learnt that, theoretically, PVDF is the best candidate due to its various attributes including flexibility, mechanical strength, high sensitivity, etc. the previously conducted experiments discussed in the literature were not reliable because their results depended on the available materials. Hence, we decided that the best way to select our material would be by testing what was available in the lab – PZT and MCF. The test included comparing candidates for both material selection (Aluminum vs Stainless Steel) and piezoelectric cell selection (PZT vs MFC).
Test results showed us that despite a lower force applied, the MFC yet generated greater power than the PZT.
V. MECHANISM SELECTION
In designing our mechanism, we first considered using the direct impact of rainwater on the piezoelectric material to produce energy. However, after our literature review it quickly became clear to us that we wouldn’t be able to convert the kinetic energy of a falling raindrop into electrical energy directly and optimally since we are unable to control which part of the beam each raindrop hits, and it would be immensely complicated to achieve the resonant frequency of the beam with many hits of rainfall per second on the various modes of the beam.
Hence, our thought process proceeded to consider how we could capture the raindrops and control how often they fall and where they impact the beam. This seemed logical, until we saw
that at 50.8 Hz, or in other words, 50.8 raindrop impacts per second, we would not be able to achieve this. 50.8 Hz of raindrops would produce a string of water and hence an almost constant force on the beam, which would ultimately bend it. Also, we don’t want a constant force on the beam, but rather impulses at a frequency of 50.8 Hz.
Our design consists of:
1. Water will be accumulated in a tank 2. From an outlet in the tank, water will flow down to the
Pelton wheel buckets 3. The weight and force of impact of the water on the
Pelton buckets will cause the Pelton wheel to rotate 4. The Pelton wheel is connected to a shaft and its
rotation will cause the shaft to also rotate 5. The rotation of this shaft will cause another parallel
shaft to rotate with the use of a system of belt and pulleys
6. On the second shaft is also attached the hitter component which will hit the cantilevered beam enough times to cause it to vibrate at its natural frequency
The advantages of this design are that there is no direct contact between water and beam which is safer for circuitry and material conditions, and that controlling the frequency of the hit and thus the frequency of the vibration of the beam is quite straightforward (requires only manipulation of the mechanism).
VI. CIRCUIT SELECION
As previously stated, the circuit that needs to be used in our application is a rectifying circuit that converts the AC voltage outputted by the piezoelectric cell to DC voltage that will be stored in a battery, or used to power a device. Fortunately for us, there are ample of rectifying circuits we can choose from, but since we are trying to maximize efficiency of the piezoelectric cell, we need to choose the circuit with care. Each circuit has its strength and its shortcomings and therefore we need to see which one suits our needs, and will be able to operate well at the AC frequency that we will output.
After narrowing the options down, we were left with a couple circuits that will fit our systems perfectly. Choosing one of these circuits will require actual testing. We will be dropping a hammer on the piezoelectric cell and hitting it with a constant force, and we will transform the AC voltage outputted to DC voltage with the help of each of the circuits. The circuit that will give us the higher DC output will be the circuit that we will implement in our mechanism.
The two circuits will be considered and we will test both. The first one is a rectifying circuit that relied on diodes to guide the current in a certain direction, no matter the polarity of the voltage input. A capacitor is used to store energy and then release it when the AC voltage drop, in order to smoothen the signal and make it almost constant. The second circuit, to the right, is also a rectifying circuit that relies on diodes to convert the AC voltage into DC, but with a small difference.

336
The AC voltage inputted is amplified or reduced, depending on the transformer in use. In the picture, the voltage input is 120v and it is reduced to 8.5v and then fed into the rectifying circuit. The amplification of the circuit might come in handy since the voltage output of the piezo is in mV, and therefore we will need passive amplification in order for us to store that voltage into a battery.
Now that we know the circuit that we will need to use, we still need to figure out the resistor and capacitor values that will give us the optimal voltage output. The right resistor needs to be chosen so we can have the best current output, and the capacitor to be used need to smoothen out the signaling while at the same time not use too much energy and thus lower voltage output.
RESULTS
To be determined in the coming month.
REFERENCES [1] P. S. Dineva, D. Gross, R. Müller, T. Rangelov, and R. Muller, Dynamic
fracture of piezoelectric materials: Solution of time-harmonic problems via BIEM. Switzerland: Springer International Publishing AG, 2014.
[2] A. R. Reserved and A. International, "Principles of piezoelectric energy
harvesting,"www.inamericanpiezo.com, 2016. [Online]. Available: https://www.americanpiezo.com/blog/piezoelectric-energy-harvesting/. Accessed: Oct. 23, 2016.
[3] "Piezo systems: Piezoelectric terminology and definitions," in Piezo.
[Online]. Available: http://www.piezo.com/tech1terms.html. Accessed: Oct. 23, 2016.
[4] A. Pye, "Piezoelectric materials - prospector knowledge center,"
in Plastics, Prospector Knowledge Center, 2015. [Online]. Available: http://knowledge.ulprospector.com/2689/pe-piezoelectric-materials/. Accessed: Oct. 24, 2016.
[5] K. G. Chua, Y. F. Hor, and H. C. Lim, "Raindrop Kinetic Energy
Piezoelectric Harvesters and Relevant Interface Circuits: Review, Issues and Outlooks," Sensors and Transducers, vol. 200, no. 5, pp. 1–15, May 2016.
[6] “Macro-Fiber Composite (MFC) Actuator,". [Online]. Available:
https://technology.nasa.gov/patent/LAR-TOPS-209. Accessed: Dec. 5, 2016.
[7] “Corrosion Rate Calculator, how to calculate the rate of corrosion in metals?”. [Online]. Available: https://www.thebalance.com/corrosion-rate-calculator-2339697. Accessed: Dec. 5, 2016.
[8] “Fatigue properties and endurance limits of stainless steels” [Online].
Available: http://www.bssa.org.uk/topics.php?article=104. Accessed: Dec. 5, 2016.

337
DEPARTMENT OF CHEMICAL AND PETROLEUM ENGINEERING

338

339
340 Estelle Nasr, Reina Kassem Youssef, Lea Farah, Pamela Assaf, Alma Abou Saad
Production of Butyl Butyrate from Waste
344 Yasmine Baghdadi, Ghina Hneini, Hind Arab, Elie Berbari, Vincent El Ghoubaira
Production of ETBE from Biomass
352 Mohamed Kotaish, Christy Kehdi, Michael Serhan, Elias Moubarak, Ryana Mouawad
Production of Polyethylene from Naphtha
CONTENTCHEMICAL AND PETROLEUM ENGINEERING

340
Production of Butyl Butyrate from Waste
Alma Abou Saad | Pamela Assaf | Lea Farah | Reina Kassem Youssef | Estelle Nasr Department of Petroleum and Chemical Engineering
American University of Beirut Bliss Street, Hamra
[email protected] | [email protected] | [email protected] | [email protected] | [email protected]
Abstract- Butyl butyrate is an ester widely used in the food and
beverage industry as a flavor additive. Due to its pleasant fruity aroma, it is usually used to imitate the flavor of pineapple. The purpose of this research paper is to develop an environmentally friendly and novel process for the production of butyl butyrate from waste. The production of butyl butyrate requires an esterification reaction between butyric acid and butanol. Hence, it was found that, the hydrolysis of biomass to obtain glucose and then the fermentation of glucose, using Clostridium tyrobutyricum ATCC 25755 as a catalyst, produces butyric acid. The fermentation process yields 0.83 g butyric acid/ g glucose when it is performed in a continuous bioreactor at a temperature of 37˚C and pH of 6.8. The butyric acid then undergoes a one-step hydrogenation-esterification process whereby the butanol needed for the esterification reaction is formed as an intermediate product by hydrogenation of the butyric acid with which it reacts to give butyl butyrate in a single step. This method requires the presence of a bi-functional catalyst which can be used for both esterification and hydrogenation reactions. It was found that ruthenium metal on a carbon matrix catalyst –which can also be obtained from waste- gives the highest conversion to butyl butyrate as compared with other heterogeneous catalysts. The one step hydrogenation-esterification reaction occurs in a packed bed reactor at a temperature of 260 ˚C and a pressure of 60 atm. The butyl butyrate produced is then separated from the other components and is finally obtained with a mass purity of 93%. Moreover, the design and sizing of the units used were calculated to obtain the optimal production of butyl butyrate.
I. INTRODUCTION
Esterification reactions generate esters with low molecular mass enough to make them volatile, therefore capable of producing pleasant fruity scents, which interests many industries, particularly the food industry for artificial flavorings. While esters exist in nature, the amount of esters extracted from nature source could not fulfill the vast demand in the market. Butyl butyrate is an ester formed by the esterification of butanol and butyric acid and provides a sweet fruity flavor of pineapple. Due to this property, synthesis of butyl butyrate has a high demand for flavoring in the food, beverage and pharmaceuticals industry. In addition, butyl butyrate is a naturally hydrophobic biofuel component which mixes well with biodiesel giving the potential to support the use of biofuel as an alternative to fossil fuels.
In 2015, Lebanon went through a major garbage crisis, which severely affected the environment as a whole. Primarily, the landfills of Naameh were accumulated with approximately 10 million tons of trash; thus, the municipalities decided to temporarily dump the garbage in areas with open spaces, forests and rivers such as Broumana, Dekwaneh and Nahr Beirut. The
scattered garbage causes numerous threats to our environment throughout the year. For instance, on hot summer days the trash could possibly catch fire; thus, emitting harmful chemicals. During fall, rainstorms cause garbage to scatter and seep through the soil until it reaches underground water, which drastically increases risks to the surroundings. Additionally, the garbage is burnt to get rid of the waste; however, even if this method contributes to ridden the streets from waste, it leads hazardous and detrimental health conditions.
Fortunately, the biomass of this excess waste could be processed to produce a chemical compound called butyl butyrate. This report investigates the production of butyl butyrate from biomass through an environmentally friendly process. Biomass is converted through a hydrolysis and fermentation process to produce many organic compounds, of which carboxylic acids (butyric acid) and alcohols (butanol) are of particular interest to this study. Butyric acid and butanol then undergo an esterification reaction to produce butyl butyrate with the presence of a catalyst.
Traditionally, homogeneous catalysts such as sulfuric acid have been used to catalyze esterification reactions in the industry. The use of homogeneous catalysts provides many advantages, including their general availability and low price as well as their usability, meaning that handling of these catalysts is easier because they occur in the same phase as the reactants. However, one of the main drawbacks of sulfuric acid is its highly corrosive nature. Alternatively, a new generation of heterogeneous catalysts has been developed in recent years and is gaining popularity in the market. These solid catalysts are based on carbon and can be created from wastes which can be otherwise difficult to dispose of, making them eco-friendly. Moreover, carbon-based solid catalysts can be regenerated and reused thus providing additional cost cuttings and operational advantages.
This report also focuses on a one step hydrogenation-esterification process whereby the butyl butyrate extracted from biomass is converted to butanol as an intermediate for the production of butyl butyrate. By combining the hydrogenation and esterification reactions in a single step, the alcohol is indirectly handled thus saving costs. However, since the process employs both a hydrogenation and an esterification reaction in one step, it requires the use of a bi-functional catalyst that can be operated for both reactions.

341
II. PROCESS DESCRIPTION
The first section of this project consists in dealing with biomass components. This part of the process involves pretreatment, saccharification and fermentation, which are simulated on Aspen Plus. The necessary reactants needed for the one-step hydrogenation esterification reaction i.e. butyric acid and hydrogen are produced by the aforementioned processes. The second section of the process which includes the OHE reaction and the separation of the various products obtained is to be modeled on Aspen HYSYS.
For the pretreatment process, the biomass obtained from organic waste is mixed with a solution of sulfuric acid to form a slurry at standard conditions. The composition of biomass by weight percent is: 42.03% cellulose, 28.8% hemicellulose, 20.61% lignin, 2.68% acetate and the rest is ash. It is assumed that all the hemicellulose if made up of xylan.
The slurry obtained is then pressurized and enters a 2.5 m3 continuous stirred tank reactor (CSTR) where dilute acid pretreatment occurs at constant temperature. The effluent from the reactor is pumped and heated to enter another 37 m3 CSTR where the saccharification of cellulose operates at harsher conditions of high temperature in order to achieve the hydrolysis of cellulose. The operating temperature in the second CSTR was chosen to be 230˚C. At this temperature, satisfactory conversion of cellulose to glucose is achieved and minimal amounts of byproducts such as HMF and furfural (resulting from the degradation of sugars) are formed. Xylan is converted to xylose and cellulose to glucose in both reactors. These products are then sent to a solids separator whereby a separation of a 100% of the solids from the slurry is obtained. At this point, the liquid stream has an acidic pH of 2.97 and needs to be increased to a neutral pH for the fermentation reaction to take place. Therefore, the stream is neutralized inside an RStoic reactor with NaOH at standard conditions. Note that the RStoic reactor is used for the purpose of the simulation only and in practice, there is no need for the reaction to take place in a reactor; the stream is simply neutralized by mixing it with the strong base. The reaction of NaOH and H2SO4 is a strong acid-base reaction that can be assumed to have a conversion of 100%.
After the neutralization, a flash separator is used to remove the excess of water and the by-products furfural and acetic acid that were formed during the pretreatment and saccharification phases. This separation occurs at a constant pressure of 1 atm while the temperature is increased to 190˚C inside the separator.
The fermenter is operated at a temperature of 37°C where two fermentation reactions occur in a 128 m3 CSTR using the enzyme Clostridium tyrobutyricum. Both Xylose and Glucose are converted to butyric acid with a conversion of 96% and 92%, respectively. The resulting products go through a series of flash separators in order to obtain a liquid stream consisting only of butyric acid and water and a vapor stream consisting of hydrogen, carbon dioxide and water. Now that butyric acid has been produced by the fermentation of glucose and xylose, the next step is to produce butyl butyrate, the final desired product, through a series of hydrogenation and esterification reactions both occurring in a packed bed reactor using metal catalyst. Since the mentioned reactions require high
temperature and pressure conditions of 260C and 60atm, the conditions of the two reactants, butyric acid and hydrogen, are adjusted accordingly.
The liquid stream enters a flash separator in order to separate the water for the butyric acid. On the other hand, hydrogen present in the gas stream needs to be separated from the other gas components, namely carbon dioxide and water vapour. The water is removed by reducing the temperature of the stream and then flashing it inside a separator. Next, the removal of the carbon dioxide requires amine washing in an absorption column using monoethanolamine, or MEA, as the amine scrubbing agent. The carbon dioxide dissolves into MEA and they both come out of the bottom stream. The amine is regenerated in a stripping column, where the carbon dioxide comes out from the top and the amine, coming out from the bottom, is recycled back into the absorber column. A hydrogen stream, with a 99.62% purity, exits from the top of the absorption column. It is cooled to a temperature of 260C and compressed to a pressure of 60atm and then mixed with the butyric acid stream. These reactants are fed to a 30 m3 packed bed reactor (PBR) where the one step hydrogenation esterification reaction occurs as follows.
𝐶𝐶3𝐻𝐻7𝐶𝐶𝐶𝐶𝐶𝐶𝐻𝐻 + 2𝐻𝐻2 → 𝐶𝐶4𝐻𝐻9𝐶𝐶𝐻𝐻 + 𝐻𝐻2𝐶𝐶 (1)
𝐶𝐶3𝐻𝐻7𝐶𝐶𝐶𝐶𝐶𝐶𝐻𝐻 + 𝐶𝐶4𝐻𝐻9𝐶𝐶𝐻𝐻 → 𝐶𝐶3𝐻𝐻7𝐶𝐶𝐶𝐶𝐶𝐶𝐶𝐶4𝐻𝐻9 + 𝐻𝐻2𝐶𝐶 (2) The reactions taking place are hydrogenation of butyric acid
to yield butanol and water with a conversion of 45.28% (1) and esterification of butyric acid with the produced butanol to obtain butyl butyrate and water with a conversion of 44.59% (2). The amount of butyl butyrate obtained is 9,998 kg/h. The outlet stream is then cooled and goes into a flash separator to remove the un-reacted hydrogen and recycle it back into the reactor. The liquid stream from the flash separator, containing the rest of the components, is fed into a three phase separator to remove the excess of hydrogen in the light phase, the water in the heavy phase and the rest of the organic components in the light phase. The light phase is then pumped to atmospheric pressure into a distillation column, where butanol and any water residue emerge from the distillate stream and the butyric acid and butyl butyrate come out from the bottom stream. The butanol is recycled back into the packed bed reactor.
As for the butyric acid and butyl butyrate stream, due to the close boiling point ranges and k-values of these two components, a distillation column on its own will not suffice to separate them. For this reason, a liquid solvent, sulfonane, is added to the stream. Butyric acid is miscible in sulfonane whereas butyl butyrate is not. At this point, the stream enters a distillation column where the separation becomes possible yielding, from the distillate stream, a flow of 10,730kg/h of butyl butyrate with a purity of 93%. Whereas, the sulfonane and butyric acid mixture leaves from the bottom stream and then enters another distillation column where a 100% regeneration of the sulfonane solvent occurs. This solvent is then recycled back to be mixed with the mixture of butyric acid and butyl butyrate that needs to be separated. The obtained butyric acid obtained is then recycled

342
back into the packed bed reactor. A block flow diagram of this process is provided in the Appendix.
III. COST AND PROFITABILITY ANALYSIS
In this section a detailed analysis is performed to know if the simulation is profitable or not.
First of all, the total cost equipment was calculated according to the cost index which was found to be 560 in 2016. Note that there in total 17 heat exchangers, 16 pumps, four distillation columns, one absorber, one PBR (packed bed reactor), three CSTRs (continuously stirred tank reactors), five compressors. The costs of these equipment were calculated according to their specific types using appropriate equations. The table below shows the calculated cost in addition to the fixed cost investment (FCI) and total cost investment (TCI).
TABLE 1
CAPITAL INVESTMENT COSTS
Capital expenditures occur once during the life of a project
but operating expenses are recurring expenses and, as such significantly affect the cash flow and profitability of a venture. These costs can be grouped under operating costs. These include the direct operating costs, which take into account the costs of utilities, raw material, labor and maintenance, as well as indirect costs which are represented by property taxes, insurance, overhead and administration. These are listed in the following table.
TABLE 2
OPERATING COSTS
ITEM RATE ($/YEAR) DIRECT OPERATING COSTS RAW MATERIAL 2,960,000,000 UTILITIES 584,600,000 LABOR 3,896,000,000 SUPERVISION 584,000,000 MAINTENANCE AND REPAIR 7,716,000 LAB SUPPLIES 67,830 OPERATING SUPPLIES 1,157,000 TOTAL DIRECT 8,037,000,000 INDIRECT OPERATING COSTS PROPERTY TAXES 2,200,000 INSURANCE 1,100,000 OVERHEAD 4,940,000 ADMINISTRATION 90,400 DEPRECIATION 6,470,000 TOTAL INDIRECT 14,800,000 ANNUAL PRODUCT COST 8,052,000,000
Revenues are obtained from selling the butyl butyrate product
at a price of 122 $/kg and obtaining biomass at the price of 147
$/ton. In total, the expected sales would sum up to $15,200,000,000. In order to estimate the profitability of such a venture, indicators such as the return on investment (ROI) and the payback period are found to be useful. The following table summarizes these important profitability measures.
TABLE 3
RESULTS OF PROFITABILITY ANALYSIS
IV. CONCLUSION
First, the biomass is pretreated to remove lignin and hemicellulose then it is hydrolyzed to give the simple sugar glucose which is fermented using Clostridium tyrobutyricum ATCC 25755 as a catalyst to produce butyric acid. Note that glucose sugars along with xylose sugars are the chosen sugars from which butyric acid can be obtained because it gave the highest selectivity and yield in the presence of the mentioned catalyst as compared to other simple sugars. The key part in the production process of butyl butyrate is the one step hydrogenation and esterification (OHE) which allows for the direct production of butyl butyrate from butyric acid without the direct handling of butanol. This process requires the presence of the bi-functional catalyst Ru/C +ALSI, which gives the highest conversions to butanol and butyl butyrate as mentioned previously. A detailed study for the design and simulation of the butyl butyrate production plant has been investigated. The results obtained experimentally by Aspen Hysys were relatively close to the literature review done. The final selling product is of 84.69 wt % purity with a rate of 79843 tonnes per year. Finally, this process is feasible and highly profitable.
REFERENCES [1] Severini, F. (2016). Development of Heterogeneous Catalysts for
Butyl Butyrate Production (Ph.D). University of Limerick. [2] Sigma Aldrich shop. Retrieved December 4, 2016 from
http://www.sigmaaldrich.com/catalog/product/aldrich/281964?lang=en®ion=LB. [3]
[3] Sigma Aldrich shop. Retrieved December 4, 2016 from http://www.sigmaaldrich.com/catalog/product/aldrich/t22209?lang=en®ion=LB
[4] Sigma Aldrich shop. Retrieved December 4 from http://www.sigmaaldrich.com/catalog/substance/aceticacid60056419711?lang=en®ion=LB.
COST ($/YEAR) 8,052,800,000
TOTAL SALES ($/YEAR) 15,200,000,000
GROSS EARNING ($/YEAR) 7,151,200,000
NET EARNINGS ($/YEAR) 4,290,000,000
ROI (%) 33
PAYBACK PERIOD 1 year
EQUIPMENT COST ($) DISTILLATION COLUMNS 9,630,000 ABSORBER 671,000 PLUG BED REACTOR 246,000 HEAT EXCHANGERS 1,875,000 COMPRESSOR 4,675,000 PUMPS 300,000 CONTINUOUS STIRRED TANK REACTORS
213,000
TOTAL COST 17,610,000 COST WITH INDEX 19,730,000 DELIVERED EQUIPMENT COST
21,700,000
FIXED CAPITAL INVESTMENT 110,230,000 TOTAL CAPITAL INVESTMENT
129,500,000

343
APPENDIX
Figure 1. Block Flow Diagram of the process

344
Production of ETBE from Biomass
Hind Arab, Yasmine Baghdadi, Elie Berbari, Vincent El Ghoubaira, Ghina Hneine Department of Chemical and Petroleum Engineering
American University of Beirut Beirut, Lebanon
[email protected], [email protected], [email protected], [email protected], [email protected]
Lebanese municipal solid waste is mostly made up of organic
material. To be exact, 1.34 million tons of organic waste was produced in Lebanon in 2015. This waste can be used as raw material in the production of ethyl tert-butyl ether; a chemical compound used as an oxygenate additive to gasoline to increase its octane number. The aim of this study is to design an ETBE production facility which employs bioethanol and isobutylene as raw materials.
Municipal solid waste in Lebanon can be divided into three main categories: food, paper, and greens. The main feed has a flow rate of 76,484 kg/hr, half of the Lebanese organic waste, and is mainly composed of glucose, cellulose, xylan, lignin and water. The first step is the acidic pretreatment of the feed using diluted sulfuric to treat the hemicellulose and lignin. Next, the stream enters dilute acid hydrolysis to help break down the remaining cellulose.
The stream is now mainly composed of glucose and xylose along with traces of other sugars and lignin. NaOH is added to the mixture to neutralize the acid and lignin is removed by decantation. Five CSTRs in the presence of a microorganism called Z. mobilis are used to convert glucose and xylose into bioethanol. This process is followed by a flash separator to exhaust CO2 and a nanofiltration system to remove Na2SO4. After that, a pressure swing system is added to bypass the azeotropic ethanol-water mixture and produce a stream with 96% ethanol.
After thorough research, it was decided to buy isobutylene at a price of $0.141/L from Evonik Industries AG in Amman, Jordan. Having both ethanol and isobutylene the reactants are mixed and entered into a packed bed reactor in presence of Amberlyst-15 as a catalyst. The system produces 71.86 m3/hr of ETBE.
NOMENCLATURE
qp,max Overall maximum specific ethanol utilization rate (g.g-1.h-1)
s Substrate concentration (g.l-1) p Ethanol concentration (g.l-1) pm maximum ethanol concentration (g. l−1) pi threshold ethanol concentration (g. l−1) r’ETBE Rate of ETBE production ksi Rate constant aEtOH Activity of ethanol aIB Activity of isobutylene k Equilibrium constant for ETBE ki substrate inhibition constant (g. l−1) ks substrate limitation constant (g. l−1) kEtOH Equilibrium constant for ethanol
I. INTRODUCTION
As the Lebanese population is increasing, the quantity of waste produced is constantly on the rise. Due to unresolved social and political issues, large amounts of unsorted waste is being dumped on the streets or disposed of in unsanitary landfills. Putting an end to the municipal solid waste crisis in Lebanon is crucial; the accumulation of waste on the streets and in unsanitary landfills leads to numerous diseases and creates severe environmental issues including the emission of greenhouse gases and the pollution of underground water.
Waste should not be perceived as a burden; it may be used to manufacture valuable products such as ETBE. ETBE, ethyl tert-butyl ether, or 2-ethoxy-2-methyl-propane is characterized by the chemical formula C6H14O and is used as an oxygenate additive to gasoline fuel to raise its octane number and reduce the pollution from the exhausts of cars. Adding ETBE to gasoline reduces the discharge of carbon monoxide, carbon soot and compounds such as polyaromatic hydrocarbons and nitrated PAHs created during the burning of fuel in cars’ engines. Hence, mixing ETBE with gasoline has a positive impact on the environment and on human health [1].
ETBE can be produced from the organic fraction of waste which accounts for 52.5% or 1.34 million tons of the total mass of solid waste produced in Lebanon in 2015 [2]. This organic waste can be fermented to bioethanol which then reacts with isobutylene to give ETBE [1].
According to a study done by the Lebanese Ministry of Energy and Water Resources, 1,625,587 tons and 279,787 tons of premium unleaded gasoline 95 and 98 were consumed in 2015 [4], respectively. With densities equal to 0.740 g/cm3 [4] and 0.750 g/cm3 [5] at 15˚C for the premium unleaded gasoline 95 and 98 respectively, this means that, 196,739 m3 and 373,049 m3 of premium unleaded gasoline 95 and 98 were consumed in Lebanon in 2015, respectively. According to European standards, this means that in total 385,468 m3 of ETBE must be manufactured per year to meet the demand of the Lebanese market.
II. PROCESS DESIGN AND SIMULATION
After performing a thorough literature review of existing processes to produce ETBE, it was found that organic biomass must undergo pretreatment and acidic hydrolysis prior to its fermentation into ethanol. Then, ethanol is purified and reacted

345
Figure 1. Process block flow diagram with isobutylene to produce the final product. Figure 1 shows a simplified block flow diagram of the process under study.
Aspen Plus was used to simulate the designed process and compare the results to theoretical hand calculations.
A. Pretreatment
According to a research paper by Aiduan Li, 57.4% of waste in London is biodegradable. Among these, 23.6% are paper and cardboard waste, 26.1% are kitchen organic waste and 7.7% are green organic waste which is mostly grass [6].
In Lebanon, 1.34 million tons of organic waste are produced yearly and constitute 52.5% of the total waste composition. This means that every hour around 153,000 kg of organic waste is produced. For this project, 76500 kg/hr or half of the quantity of organic waste was taken as the main feed. The organic waste feed composition was then calculated based on the composition of the organic municipal solid waste in London and plugged into the simulation.
The waste composition is shown in Table I. The hemicellulose in the process was assumed to be xylan since it is the main hemicellulose present in most of the biomass composition. It is entering the process at a temperature of 45 and a pressure of 1 atm.
Since the simulation is dealing with polar components that dissolve in water, the selected fluid package was NRTL in Aspen Plus.
Pretreatment is done to make the cellulosic biomass more prone to enzymatic conversion. It improves the formation of sugars and increases the yield of the preceding hydrolysis process. One of the most used methods of pretreatment in industry utilizes dilute sulfuric acid since it is inexpensive and effective [6].
TABLE I
ORGANIC WASTE COMPOSITION Paper (kg/hr) Green (kg/hr) Food (kg/hr)
Glucose 0 0 11805 Cellulose 18042 3476 3698
Xylan 4354 2029 1801 Lignin 5665 3513 3210 H2O 1537 1531 13108 Ash 1760 82 872
In the pretreatment process, several reactions take place:
Cellulose + H2O Cellobiose (1) Cellulose + H2O Glucose (2) Xylan + H2O Xylose (3) Xylan Furfural + 2H2O (4) Lignin Soluble Lignin (5)
In the process, the biomass enters at 45 and 1 atm at a flow
rate of 76,484 kg/hr. It is mixed with water which is coming from the recycle stream at 99.9 and 1 atm to decrease the solid fraction. The 2 streams are mixed with a 5% mole fraction sulfuric acid entering at 25 and 1 atm. The resulting stream is pumped to increase the pressure to 12.1 atm.
To increase the temperature to the required value, the stream is mixed with high pressure steam which is a saturated vapor at 4237 kPa and 254. The reaction took place in a CSTR at a temperature of 190 and a pressure of 12.1 atm with a residence time of around 1.5 minute. The pretreatment in this process converted most of the hemicellulose Xylan into its monomer Xylose which is used in the fermentation to produce ethanol.
B. Dilute Acid Hydrolysis
Dilute acid hydrolysis is the second step in the ETBE production process. It is the use of a dilute acid to hydrolyze hemicellulosic material.
In the process, a flow of 113,332 kg/hr exits the pretreatment stage with H2SO4 at 1.1 wt%. The same acid concentration will be used at this stage but at different conditions. Therefore, it enters a valve to decrease the pressure to 4.85 atm then a heat exchanger which cools it down to 150 with a 0.35 atm pressure drop.
At this stage, all the conditions are set for the acidic pretreatment where the following reactions take place:
Cellulose + H2O Glucose (6) Glucose HMF + 3H2O (7) Xylan + H2O Xylose (8) Xylose Furfural + 3H2O (9)
The reactions take place in a CSTR and the resulting stream
is mainly composed of glucose and xylose. Figure 2 shows a process flow diagram of the pretreatment and hydrolysis steps.
Figure 2. Process flow diagram for the acidic pretreatment and hydrolysis
processes.

346
C. Fermentation The acid (H2SO4) should be removed from the mixture prior
to the fermentation process. The neutralization of the acidic mixture can be achieved by the addition of a base, namely sodium hydroxide (NaOH). A 2085 kg/hr stream containing 30% mol NaOH is pumped to 1.78 atm and 30. This stream will be used to neutralize the main stream to be fermented.
The main stream exiting the hydrolysis stage is depressurized to 1.78 atm using a valve. It is then mixed with a stream of recycled water. The reaction between the acid and the base results in the production of salt and water: Na2SO4 and H2O.
Cooling water is used in the first heat exchanger to make the mixture a saturated liquid. The mixture goes in at 118°C and 1.78 atm with a 0.01 vapor fraction and exits at 116°C and 1.68 atm with vapor fraction of zero. Similarly, cooling water is used in a second heat exchanger to complete the phase change of the main stream. The mixture exits at 76°C and 1.34 atm as a saturated liquid. The last heat exchanger aims to decrease the temperature to 40°C and 1 atm.
The decanter is used to separate lignin from the main stream. The lignin goes out of the decanter at 40°C, 1 atm and a flowrate of 16953 kg/hr while the remaining mixture exits at the same temperature and pressure with a flow of 198464 kg/hr.
Traditionally, fermentation is performed in the presence of Saccharomyces cerevisiae or yeast. However, for this design, Zymomonas mobilis is used because it was found to have a higher uptake and ethanol yield (up to 2.5 times higher than yeast).
It also has a higher ethanol tolerance up to 16% (v/v) and does not require the controlled addition of oxygen during fermentation [7,8].
After reaching the adequate operating conditions for fermentation (40 °C and 1 atm), the flow is split into five equal flows. This split is done due to the high flow rate such that a smaller fermenter is more practical and easier for the bacteria to attack the sugars. This split is also crucial to achieve a minimum residence time of two hours [9]. Therefore, five flow rates are undergoing the same set of reactions in parallel reactors. In the CSTR, the two main fermentation reactions are occurring [10].
C6H12O6 2 C2H5OH + 2 CO2 (10) 3 C5H10O5 5 C2H5OH + 5 CO2 (11)
Since the role of the bacteria can be analogous to a catalyst,
the kinetic model representing these reactions is chosen to be the LHHW model in Aspen Plus. The rate is affected by the uptake rate of sugars and the equilibrium constants [10]. The rate of ethanol production is given by the following equation.
r = q,
. 1 −
.
(12)
Where s is the sugar concentration and p is the ethanol
concentration. The rest of the constants are given in Table II, Appendix A.
Figure 3. Process flow diagram for the neutralization, lignin removal, and
fermentation processes The flow entering the reactors contains mainly water, glucose
and xylose with some traces of unbroken polymers. Both reactions reach 99% conversion in a 90,000L reactor. Ethanol concentration in the stream exiting the reactors is equal to 12% since a higher concentration will inhibit bacterial activity.
To proceed with the purification of ethanol it is required to separate the gases, especially CO2 from the remaining liquid stream. In order to do that, a flash distillation column is added. The flash separator runs at 40 and 1 atm. It exhausts 22719 kg/hr of CO2 along with 1253 kg/hr of ethanol and 726 kg/hr of water vapor. Figure 3 shows the process flow diagram of neutralization, lignin extraction, and fermentation processes. D. Separation and Purification
After neutralization of the stream at the end of the hydrolysis, sodium sulfate is formed. Removal of sodium sulfate is a common process in wastewater treatment. Two main methods for salt removal were researched: removal through membrane separation and removal by salt precipitation through ion exchange [11].
Nanofiltration is a membrane water treatment technique with wide applications in wastewater and industrial water treatments. The NF membranes characteristics are between reverse those of osmosis (RO) and ultra-filtration (UF). Compared to RO membranes NF membranes have a loose structure, therefore higher permeate fluxes and lower operating pressures [12]. Moreover, the salts (Na2SO4 NaCl, and CaCl2) rejection of this membrane is greater than 90% [13]. Therefore, NF membrane is chosen to be applied in this process. The membrane removes about 14,458 kg/hr of water containing Na2SO4.
At this stage, the stream is mainly composed of water and ethanol (82.6 and 14.41% respectively) along with 2.9% traces of impurities. The stream enters a distillation column at 40 and 1 atm. The column bottom stream is 96.7 wt% pure water. This stream will be recycled for use at the beginning of the process.
Figure 4. Process flow diagram for the process of ethanol purification

347
Aspen plus showed that at a temperature of 78 the ethanol-water mixture exhibits an azeotrope when the composition of the mixture becomes 8.73 mol% water and 91.27 mol% ethanol. Therefore, and to bypass the existing azeotrope, a pressure swing is required.
At this point a pressure swing distillation system is set up to bypass the azeotropic mixture and reach an ethanol purity of 96 mol% [14]. 25032 kg/hr of which 91% is ethanol enter the first distillation column where the pressure is reduced to 0.1 atm and using 30 stages 2125 kg/hr of water are exiting from the bottom while the remaining azeotropic mixture in the distillate is pressurized using a multi stage pump (4 pumps each with a pressure ratio of 3.76) and entered a second distillation column in which the pressure is 20 atm.
The column distillate is then depressurized and recycled back to the low-pressure column while the bottom stream is 96 mol% ethanol. Figure 4 shows the process flow diagram of the pressure swing.
E. Main Reaction
The reactants are needed to be set the operation conditions of 90 and 20 atm to produce ETBE. So, ethanol stream and the isobutylene stream are both cooled down to around 90 using cooling water with temperature of 30 . Isobutylene is also compressed to 20 atm by a series of compressors.
Both reactants are mixed together in a packed bed reactor in the presence of the catalyst Amberlyst-15. The main reaction is as followed:
C2H5OH + i- C4H8 → (CH3)3COC2H5 (13)
The Langmuir-Hinshelwood-Hougen-Watson (LHHW)
formalism is chosen as the kinetic model for this reaction. The rate is based on the activity instead of the concentration of the components due to the non-ideal nature of the mixture.
r'ETBE= ksi(aEtOH
2aIB-aEtOHaIBK )
(1+KEtOHaEtOH)3 (14)
The activity of component i is related to the mixture molar fraction and its activity coefficient that is calculated by using the UNIFAC method ( = ). is the rate constant which is expressed based on Arrhenius equation (14).K and are the ETBE synthesis equilibrium constant (15) and the adsorption equilibrium constant of ethanol (16) that are both depending on temperature.
ksi=2,060,555,556 exp(-60.4×10⁶ J
kmolRT
) (15)
lnK=10.387+4069.59
T-2.89055 lnT-1.91544×10⁻²T
+5.28586×10⁻⁵T2-(5.32977×10⁻⁸)T3 (16)
ln KEtOH=-1.707+ 1,323.07T
(17)
The amount of catalyst needed for the reaction is 0.96 kg cat/ kmol/h of isobutylene. The amount of isobutylene fed to the reactor is equal to 493 kmol/hr resulting in 470 kg of catalyst for the packed bed reactor (PBR). The void fraction of the catalyst Amberlyst-15 is 0.42 and the PBR in this process is adiabatic.
Ethanol has a high conversion around 99.9 % producing 490 kmol/hr of ETBE. The product stream then enters a distillation column at 90oC and 19.7 atm to purify the ETBE and to recycle the remaining reactants. In the bottom of the column, ETBE is obtained at a purity of 98.8% weight which is above the minimum purity needed as a gasoline additive.
F. Waste Management In the production of ETBE, large quantities of waste are
produced as a side effect and is needed to be treated. Of the wastes produced, the lignin stream has a flow rate of around 17000 kg/h of which 12300kg/hr is pure lignin, and the rest is composed of water, ash and other solid components. Industrially, most of the lignin produced is incinerated to produce electricity due to its high calorific value of 26.5MJ/kg. The lignin flow rate of 12300 kg/hr and an efficiency of 21% produces 68500 MJ/hr or 19 MW of energy produced enough to power up the plant and its machines. The moving grate will be used to incinerate the lignin which can handle up to 35 metric tons of lignin per hour and run for 8000 hours per year.
In the process, large amounts of water are used where they come from the biomass, the added acid and the high-pressure steam. Part of this water is used in the pretreatment and the hydrolysis however most of it remains after the production of ethanol. This impure water is first stripped from Na2SO4 using a membrane separation and then is separated from the ethanol stream along with other impurities and most of it is recycled back into the process where the unrecycled water is cooled and treated to be used in other domains.
III. EQUIPMENT SIZING
A. Distillation Columns Four distillation columns are used in this process. The first
one (C1) separates water from ethanol up until the mixture’s azeotrope. This column is followed by two other towers (C-2 and C-3) which, through a pressure swing, overcome the azeotrope and allow further separation of ethanol from water. The last column (C-4) separates the product (Ethyl tert-butyl ether) from the remaining raw material (Isobutylene) in order to get a stream of 98% (molar) pure ETBE which can then be sold.
The design of the distillation columns follows the following procedure. First, the relative volatility of the components is obtained in order to compute the minimum number of stages required in each column. From this value, the actual number of stages in each column is found. Afterwards, the column reflux ratio is calculated, and this allows the calculation of the actual reflux ratio of each column. At this stage, the feed point location can be estimated and the diameter, height, thickness, and pressure drop in the column are found.

348
The design of the plates in the column is also important. Specific correlations for the plates helps determine the number of holes in each tray which achieve best separation.
The values obtained for the different parameters related to the distillation columns is summarized in Table V of Appendix B.
B. Packed Bed Reactor
The feed into the reactor is a mixture of ethanol and isobutylene. Bioethanol produced from the preceding process enters at 88.5, 20 atm with a flow rate of 22851 kg/hr whereas the purchased isobutylene is compressed to 20 atm and 89. The resulting mixture is at 90.
The most efficient catalyst for the reaction discussed above is Amberlyst-15. This catalyst has a void fraction of 0.42 and the reaction needs almost 0.96 kg of the catalyst per kmol/hour of isobutylene used. This means that the process needs a total of 470 kg of Amberlyst-15.
After performing the required design calculations, it was deduced the main flow is to be divided into 15 PBR units in parallel. Each unit has a diameter of 18 cm and a height of 1.89m.
C. Continuous Stirred Tank Reactors
In this process, three types of continuously stirred reactors are needed for pre-treatment, hydrolysis and fermentation. The reaction conditions in each reactor are stated in Table III, Appendix B. Based on the resulting environment each reactor is designed and the material is chosen. The pre-treatment and hydrolysis reactors are made of Hastelloy-30 due to the presence of the acid [15] whereas the fermentation reactor from stainless steel 316L due the presence of the microorganisms [16].
In the pre-treatment and hydrolysis, the impeller used is a A310 Hydrofoil Style Impeller since the reacting environment contains solid particles [18]. In the fermenter, Rushton turbine is implemented which is capable of breaking up the air stream entering through a sparger and providing oxygen for the reaction [15].
D. Heat Exchangers
Several streams in the process require cooling and heating to the operating temperature of each. So, 11 heat exchangers were installed where 10 are for cooling and one for heat integration. First the sludge is heated using the hot isobutylene to reduce the amount of high pressure stream used to heat the stream to the required temperature for pretreatment of 190. Then the second heat exchanger is used to condense the gases in the stream before hydrolysis. A series of heat exchangers are then used after the hydrolysis and the recycle stream to cool down the stream to 40 for the fermentation to take place. Heat exchangers are then used to cool down the ethanol and the isobutylene stream to 90 respectively to produce ETBE. Finally, the last set of heat exchangers were used to cool down the ETBE flow for storage. The specifications were calculated by iterations and the material were chosen based on the fluid inside the shell and tube. They can be found summarized in Table VI Appendix B.
Figure 5. Schematic of NF90-4040 membrane
E. Nanofiltration Membrane
The process stream in need of filtration is flowing at 40 and 1 atm. The mass flow rate is almost 173667 kg/hr with 1813.37 kg/hr Na2SO4. This implies that the feed to the filtration unit contains 10,441.64 ppm of the salt is to be removed.
Research shows that the spiral wound design of a NF membrane is the most efficient for the removal of sodium sulfate. Therefore, it was decided to use NF90-4040 model from Dow Filmtec. One nanofiltration unit can withstand almost 16 gpm equivalent to 23000 gpd. The process under study requires the filtration of almost 1152635 gpd of water. Therefore, almost 52 units are needed to remove the salt from the process flow. Figure 5 shows the unit dimensions, where A=1.016m, B=0.027m, C=0.019m, D=0.099m.
The permeate flow rate is almost 2500 gpd and the applied pressure is 4.8 bars.
IV. CONCLUSION
Considering the current Lebanese waste crisis and the market demand for ETBE, this research paper proposed the design of a facility that produces ETBE from organic waste. The production line is composed of several stages: pretreatment and hydrolysis of biomass, fermentation to produce ethanol, and production of ETBE and numerous unit operations are involved in the overall process.
It was found that the four distillation columns used in the process have sieve trays and were made of stainless steel 304. The columns’ heights ranged from 3.5m to 33.5m with an average reflux ratio of 3. The packed bed reactor used to accomplish the main reaction between isobutylene and bioethanol contained the catalyst Amberlyst-15. It was deduced that 15 tubes with a diameter of 0.18m and a height of 1.89m were needed to reach above 90% conversion.
For the heat exchanges, the number of tubes ranged from 150 to 1400 tubes operating in a counter-current manner. A CSTR is used on the acidic pretreatment, hydrolysis, and fermentation stages of the process. They were designed taking into account the presence of H2SO4 and fragile microorganisms in the fermentation process. Finally, it was found that an NF90-4040 nanofiltration system composed of 52 units is used to remove sodium sulfate from the process flow to prevent fouling and corrosion in later stages.

349
ACKNOWLEDGMENT
First and foremost, we would like to thank our advisor Dr. Mohammad N. Ahmad for his supervision and guidance throughout the completion of the project and Mr. Adnan Itani for his advice and support.
Furthermost, we thank our professors in The Department of Chemical and Petroleum Engineering, namely Dr. Joseph Zeaiter for guiding us through the control and optimization steps of the plant, Dr. Fouad Azizi for his advice regarding the simulation and design process, and Dr. Belal Jum’Ah Abu Tarboush for his assistance in designing the membrane units.
REFERENCES [1] Technical Product Bulletin: ETBE. 2006. [2] Bank BB. Solid Waste Management in Lebanon. August 2015. [3] Resources; BLMoEaW. An Estimation of Crude's Bill According to the
Average Prices of 2015. [4] Material Safety Data Sheet of Premium 95 gasoline. In: LTD UPP, ed2012. [5] Material Safety Data Sheet of Premium 98 Gasoline. In: LTD UPP, ed2012. [6] Aiduan L. (2008). Bioconversion of Biodegradable Municipal Solid Waste
(BMSW) to Glucose for Bio-ethanol Production. London: Departement of Civil. Environmental and Geomatic Engineering.
[7] He MX, W. B. (2014). Zymomonas mobilis: a novel platform for future biorefineries. Biotechnology for Biofuels, 1-15.
[8] Park S, B. J. (1991). Comparison of ethanol production by Zymomonas mobilis from sugar beet substrates. Applied Microbiology and Biotechnology, 251-260.
[9] Najafpour G, Y. H. (2004). Ethanol fermentation in an immobilized cell reactor using Saccharomyces cerevisiae. Bioresource Technology, 251-260.
[10] Leksawasdi N, J. E. (2001). Mathematical modelling of ethanol production from glucose/xylose mixtures by recombinant Zymomonas mobilis. Biotechnology Letters, 1087-1093.
[11] R, B. (2004). A review of sulfate removal options for mine waters. Precedings of Mine Water, 75-88.
[12] Gawaad R, S. S. (2011). Comparative study of Nano and RO membrane for sodium sulphate recovery from industrial wastewater. ARPN Journal of Engineering and Applied Sciences.
[13] Krieg H, M. S. (2005). Salt rejection in nanofiltration for single and binary salt mixtures in view of sulphate removal. Desalination, 205-215.
[14] Iqbal A, A. S. (2016). Pressure swing distillation of azeotropic mixture – A simulation study. Perspectives in Science, 4-6.
[15] Lillo TM, Delezene-Briggs KM. Commercial alloys for sulfuric acid vaporization in thermochemical hydrogen cycles: Citeseer; 2005.
[16] Chandrashekhar H, Rao JV. An Overview of Fermenter and the Design Considerations to Enhance Its Productivity.
[17] Patel Nikunj S, Bhabhor A. Design and analytical calculation of reactor pressure vessel. 2013.
[18] Pinelli D, Nocentini M, Magelli F. Solids distribution in stirred slurry reactors: influence of some mixer configurations and limits to the applicability of a simple model for predictions. Chemical Engineering Communications. 2001;188(1):91-107.

350
APPENDIX A TABLE II
PARAMETERS FOR THE RATE EQUATIONS For Glucose For Xylose
qp,max 5.12 1.59 Ksp 6.32 0.03 Pmp 75.4 81.2 Kip 186 600 Pip 42.6 53.1
APPENDIX B TABLE III
REACTION CONDITIONS Pre-treatment Hydrolysis Fermentation
Residence time (min) 1.5 45 120
Temperature (°C) 190 150 40 Pressure (atm) 12 4.5 1
pH Acidic Acidic Neutral
TABLE IV SPECIFICATIONS FOR THE CSTRS
Pre-treatment Hydrolysis Fermentation Height, H (m) 5 8 8
Diameter, D (m) 1.5 3 4 Thickness17, t
(mm) 8.5 7 3
Impeller Diameter, Da (m)
0.5 1 2
Number of impeller blades
2 3 6
Distance between blades (m)
2 2 2
TABLE V SPECIFICATIONS FOR THE DISTILLATION COLUMNS
Parameter C-1 C-2 C-3 C-4
Feed Flowrate (kg/h)
53,692.1 121,431 119,306 53,688
Distillate flowrate (kg/h)
3,114.1 119,306 96,399 3,114
Bottom Flowrate
(kg/h)
50,578 2,125 22,907 50,575
Reboiler Temperature
(°C)
99.9 38 181 208
Condenser Temperature
(°C)
78.2 29.3 108 106.5
Reboiler Pressure (atm)
1 0.1 20 19.66
Reflux Ratio 3.3 3 2.9 2.8
Column Material
Stainless Steel 304
Stainless Steel 304
Stainless Steel 304
Stainless Steel 304
Column Diameter (m)
1.2 2.5 2 0.85
Column Height (m)
7.5 20.1 16 3.5
Column Area (m2)
1.13 4.9 3.1 0.57
Number of Trays
15 67 32 7
Trays Type Sieve Sieve Sieve Sieve
Material Stainless Steel 304
Stainless Steel 304
Stainless Steel 304
Stainless Steel 304
Feed Point Location (1st stage at top)
10 37 17 4
Number of Holes
4,300 19,000 12,160 2,196
Hole Diameter (mm)
5 5 5 5
Hole Pitch (mm)
15 15 15 15
Pitch Pattern Triangular Triangular Triangular Triangular
Plate Thickness
(mm)
3 3 3 3
Column thickness (in)
0.05 0.15 0.21 0.09
Tray Spacing (m)
0.5 0.3 0.5 0.5
Downcomer Area (m2)
0.14 0.59 0.38 0.07
Pressure Drop (Pa)
1,108 733 1050 708.9
Residence Time (s)
14 8 9 15
Flow Arrangement
Cross Flow (Single Pass)
Reverse Flow
Cross Flow (Single Pass)
Cross Flow (Single Pass)
TABLE VI SPECIFICATIONS FOR THE HEAT EXCHANGERS
Number of tubes
Number of
passes
Tube inner
diameter
Tube outer
diameter
Baffle spacing
Overall Coefficient
U (kJ/h.m2°C)
1 350 4 36mm 38mm Ds/3 650 2 470 4 36mm 38mm Ds/3 733 3 150 1 36mm 38mm Ds/5 725 4 1400 4 14.8mm 16mm Ds/2 300 5 500 4 36mm 38mm Ds/5 300 6 730 2 14.8mm 16mm Ds/2 300 7 700 2 18mm 20mm Ds/3 300 8 1300 4 18mm 20mm Ds/3 300 9 650 2 18mm 20mm Ds/5 300
10 400 2 36mm 38mm Ds/4 500

351
APPENDIX C

352
Production of Polyethylene from Naphtha Christy Kehdi, Mohamed Kotaish, Ryan Mouawad, Elias Moubarak, Michael Serhan
Department of Chemical and Petroleum Engineering American University of Beirut
P.O.Box 11-0236 | Riad El-Solh / Beirut 1107 2020 Lebanon [email protected], [email protected], [email protected], [email protected], [email protected]
Abstract - This report focuses on the preliminary design of a
petrochemical plant that produces 100,000 tons/year of polyethylene (PE) from 352,000 tons/year naphtha. The project includes three sub-processes: steam cracking, solution polymerization and free radical polymerization. Steam cracking converts naphtha into a mixture of low molecular weight hydrocarbons having two to five carbon atoms. This mixture undergoes drying, acid gas removal and a series of distillations to obtain ethylene. Solution polymerization of ethylene using Ziegler-Natta (ZN) catalyst and hexane solvent produces 44000 ton/year of High Density Polyethylene (HDPE) and 29000 ton/year Linear Low Density Polyethylene (LLDPE) with a 99.4% purity each. Free radical polymerization uses Di-tert-butyl-peroxide (Di-TBP) to produce 27000 tons/year of Low Density Polyethylene (LDPE) with a 99.94% purity. The steam cracking and polymerization processes are simulated using Aspen HYSYS and Aspen Plus respectively. After simulating the process, equipment design and sizing is performed. The design phase is followed by process optimization through heat and mass integration. In the final stage, an economic analysis is conducted to assess the profitability of the simulated process. The analysis shows that the plant requires a total capital investment of $99.6 million and a breakeven period of 6 years.
NOMENCLATURE
CSTR Continuous Stirred Tank Reactor
DEA Diethanolamine
DGA Diglycolamine
DIPA Diisopropanolamine
Di-TBP Di-tert-butyl-peroxide
FCC Fluidized Bed Catalytic Cracking
HDPE High Density Polyethylene
HPS High Pressure Steam
LDPE Low Density Polyethylene
LLDPE Linear Low Density Polyethylene
MDEA Methyldiethanolamine
MEA Monoethanolamine
PE Polyethylene
PFR Plug Flow Reactor
ROI Return on Investment
TCI Total Capital Investment
TEA Triethylaluminum
WC Working Capital
ZN Ziegler Natta
I. INTRODUCTION
In the past decade, the demand on PE has increased significantly and is predicted to rise 4% every year to exceed 100 million metric tons by 2018. In order to cope with this growth, many processes have been implemented to produce a high-yield of PE. Financial reports show that PE is considered to be the most demanded plastic in the world and that three types of PE are extensively produced: HDPE, LDPE and LLDPE. In 2015, more than 90 million metric tons of PE were produced due to its diverse applications in food and shopping bags, dustbins and buckets, detergent bottles, water pipes, and bucket bowls [1].
The purpose of the project is to design a process to produce PE from naphtha which is a crude oil derivative. This process aims to satisfy the market demand of the Lebanese and Middle East markets. This report explores the different processes available in industry and select the most technically feasible. It also thoroughly explains the chosen processes and present their corresponding flowsheets which are simulated on Aspen HYSYS and Aspen Plus.
Most of the PE-producing companies are specialized either in LDPE production or HDPE and LLDPE production. However, the designed plant incorporates a combination of two industrial polymerization processes that produce all three types of PE, and this is the case of only three industrial companies worldwide.
The common initial step for production of PE is converting naphtha into ethylene. The selected process involves the treatment of naphtha with steam in a furnace to break down large chain hydrocarbons into smaller ones. The obtained hydrocarbon mixture is fed to an absorber to purify it from hydrogen sulfide (H2S) and carbon dioxide (CO2), and is later dried. After the drying stage, the mixture undergoes a series of distillations to extract ethylene. The obtained ethylene is split between solution polymerization and free radical polymerization processes to produce HDPE/LLDPE and LDPE respectively. The flow diagram of this process, sketched on VISIO software, is attached in the Appendix B.

353
II. BACKGROUND INFORMATION
A. Naphtha
Naphtha is a mixture of highly volatile and flammable hydrocarbons. It exists in two forms: light and heavy. The former contains hydrocarbons with a maximum of six carbon atoms per molecule and can be totally recovered at a final boiling point below 140oC. On the other hand, the latter contains hydrocarbons with a minimum of six carbon atoms per molecule and can be totally recovered at temperatures higher than 200oC. For petrochemical purposes, light naphtha is more favored since it provides higher ethylene yield when exposed to cracking [2].
The characteristics of naphtha produced by several oil refining companies are examined to determine the optimum source that will provide the highest yield of ethylene in the most economically feasible method. The two major characteristics are paraffin and sulfur content. The desired naphtha must have a high paraffinic content since paraffins, which are straight chain hydrocarbons, can easily form ethylene [2]. Moreover, a low sulfur content is favored since this minimizes the yield of H2S which is a corrosive compound. Therefore, a cracked stream with low sulfur content facilitates the treatments of the generated acid gas. B. Polyethylene
PE is a mixture of ethylene chains of different molecular weights. It is commonly produced in three different forms which are HDPE, LLDPE and LDPE. These types exhibit different physical-chemical properties such as tensile strength, impact strength and melting point [3]. This variability allows PE to be used in multiple applications as previously mentioned. Table 1 summarizes the major features and physical properties of the aforementioned PEs.
III. METHODOLOGY
The steam cracking and polymerization processes are simulated using literature data related to the kinetics and the operating conditions. The simulation is designed using Aspen Plus and Aspen HYSYS software packages developed by Aspen Tech®. The process can be divided into two major sub-processes: ethylene production from naphtha and polymerization of ethylene.
TABLE 1 FEATURES AND PHYSICAL PROPERTIES OF PE TYPES [3]
Property/Feature HDPE LLDPE LDPE
Density (g/cm3) 0.941-0.965
0.919-0.925
0.91-0.925
Tensile strength (N/mm2) 0.2-0.4 0.25-0.35 0.25-0.4
Melting point (oC) 126 119 110 Degree of branching low moderate high
Major Application Piping Film packaging
Food film packaging
IV. ETHYLENE PRODUCTION FROM NAPHTHA
A. Steam Cracking The first stage of PE production from naphtha is the cracking
of the large hydrocarbon chains present in the process mixture. This can be achieved through three processes: steam cracking, fluidized bed catalytic cracking (FCC), and hydrocracking. Since the desired product is PE, the technique with the highest ethylene yield is the most suitable for this process. In fact as shown in Table 2, steam cracking has the highest ethylene yield of 26%.
Steam cracking is a thermal cracking technique that involves breaking the chains of the large hydrocarbons present in naphtha into smaller ones, in the presence of steam. Light naphtha requires between 0.4 and 0.8 kg of steam per kg of naphtha. The cracking reactions are highly endothermic and must occur at a temperature of 800oC, therefore a continuous supply of heat must be supplied. For this reason, the cracking process is modeled as a furnace (F-100) in series with a bank of tubular plug flow reactors (PFR) as shown in Fig. 1. The furnace is divided into two sections: convection zone and radiation zone. The convection zone is used for pre-heating the mixture of naphtha and steam with flue gases before sending it to the reactor. However, the radiation zone is the lower part of the furnace, where the combustion reaction takes place [4]. In this process, 352,000 tons/year of naphtha is fed to the furnace. The cracking reactions follow the free-radical mechanism, and the elementary steps of each reaction are shown in Table 3.
Moreover, an important parameter to calculate for the PFR is the residence time which is the amount of time that a fluid can spend inside a reactor. This parameter is important since operating at low residence times will result in unreacted species. On the other hand, operating at high residence times will allow the recombination of the cracked species. The optimal space time is between 0.7 and 1 seconds.
The residence time can be computed using (1)
∫ 𝑑𝑑𝑑𝑑𝜏𝜏
0= ∫ 𝑑𝑑𝑑𝑑
𝑞𝑞𝑣𝑣
0 (1)
Where 𝑑𝑑 is the residence time (s), 𝑑𝑑 is the PFR volume (m3) and 𝑞𝑞 is the volumetric flow rate (m3/s).
If the volumetric flow rate is measured at different positions inside the reactor, Simpson’s Rule as shown in (2) can be used to calculate the residence time.
∫ 𝑓𝑓(𝑥𝑥)𝑑𝑑𝑥𝑥 = ℎ3
𝑏𝑏
𝑎𝑎[𝑓𝑓(𝑥𝑥0) + 2 ∑ 𝑓𝑓(𝑥𝑥2𝑗𝑗) + 4 ∑ 𝑓𝑓(𝑥𝑥2𝑗𝑗−1) +
𝑛𝑛 2⁄
𝑗𝑗=1
𝑛𝑛 2⁄ −1
𝑗𝑗=1 𝑓𝑓(𝑥𝑥𝑛𝑛)] (2)
TABLE 2 ETHYLENE YIELD FROM DIFFERENT PROCESSES [4]
Process Ethylene Yield (wt.%) Steam Cracking 26 FCC 1.5 Hydrocracking 3.5

354
TABLE 3 ELEMENTARY STEPS FOR CRACKING REACTIONS
Elementary step Equation
Chain initiation CnH2n+2CmH2m+1+C(n-m)H2(n-m) +1
Chain propagation
CnH2n+2+CmH2m+1CnH2n+1+ CmH2m+2 CnH2n+1CmH2m + C(n-m)H2(n-m) +1
Chain termination
CnH2n+1+CmH2m+1CnH2n+CmH2m+2 CnH2n+1+CmH2m+1CnH2n+2+CmH2m CnH2n+1+CmH2m+1C(n+m)H2(n+m)+2
B. Quencher The gas leaving the furnace must be quenched immediately
after cracking to avoid side reactions. The gas enters a spray tower where it is quenched with water. Cooling is achieved by direct contact between the hot stream and the quench water. Unlike heat exchangers where a wall separates the cold utility from the hot stream, the direct contact in the quench tower achieves higher rates of heat transfer.
The quench water condenses the heavy hydrocarbons and the steam present in the cracked naphtha. Therefore, water and low quantities of heavy hydrocarbons will exit from the bottom of the quencher. The remaining light hydrocarbons will exit as a cooled vapor mixture from the top of the quencher [5, 6]. C. Acid Gas Removal
The obtained quenched gas contains H2S and CO2 at low concentrations. H2S and CO2, known as acid gases, have an affinity to react with water which will lead to the corrosion of pipelines and other pieces of equipment. Therefore, acid gases and water should be removed before sending the cracked naphtha into the distillation stage [4].
The removal of acid gases is achieved in an absorption column. The absorption column is a unit operation where one or more components of a gas stream are removed through absorption by a non-volatile solvent. Absorption can be conducted in tray, packed, bubble or spray towers. For an optimal performance, the operating pressure of the feed streams is high and the temperature is low. These operating conditions minimize the stage requirements, the absorbent flow rate and the column volume. However, the pressure should not be too high and the temperature should not be too low as to condense the feed gas [7].
Two types of absorption techniques are commonly used: chemical and physical. Physical absorption is based on the solubility of the removed component(s) in the solvent. On the other hand, chemical absorption is the absorption process in which a chemical reaction occurs between the solvent and the removed component(s). In most cases, the chemical reaction that takes place in the absorption tower is reversible; this will allow the regeneration of the solvent in a subsequent unit [7].
Chemical absorption is usually preferred over physical absorption because of the low solubility of most gases [7]. For
the acid gas removal stage, chemical absorption requires low acid gas partial pressures. On the contrary, physical absorption is suitable for removal of acid gas with high partial pressures in the feed stream [8]. Given the fact that the output stream from the quench tank contains acid gas at low partial pressure, a chemical solvent is selected for the removal of H2S and CO2.
The chemical solvents used for acid gas removal are amines such as diethanolamine (DEA), monoethanolamine (MEA), methyldiethanolamine (MDEA), diisopropanolamine (DIPA) and diglycolamine (DGA), as well as alkaline salts such as potassium carbonate. These bases react with H2S and CO2 to form compounds with weak chemical bonds. To recover the solvent for reuse, the weak bonds are then broken by heating. All the previously mentioned amines have almost similar selectivity for H2S and CO2. For this process, MDEA was selected since it is the least corrosive amine. In addition, MDEA has a low heat of reaction which implies low regeneration energy [8].
MDEA is a tertiary amine with the chemical formula CH3N(C2H4OH)2. General reaction schemes of MDEA with H2S and CO2 are represented below.
R2NCH3 + H2S ↔ R2NHCH3HS
R2NCH3+CO2↔ R2NHCH3HCO3
where R= C2H4OH Finally, once the absorption is achieved, the stream rich in
amine and acid gases is treated to recover the MDEA and recycle it back to the absorption tower. D. Drying
In addition to the acid gas removal unit, a drying unit should be implemented to remove the water. Drying is crucial to increase the efficiency of the separation of hydrocarbons in the subsequent distillation columns [4]. It is achieved in a flash distillation unit. Flash distillation is a unit operation in which the feed stream consists of a mixture of vapor and liquid at equilibrium. Once the feed stream enters the flash tank, the vapor and liquid phases are separated; the vapor phase exits at the top of the tank and the liquid phase is drained from the bottom [7].
In the ethylene production process, the feed stream to the flash tank consists of multiple hydrocarbons and water. Most of the hydrocarbons are more volatile than water. Therefore, when water is removed by flash distillation, it is expected that the liquid phase will contain pure water. E. Distillation
The step following drying is the separation of the hydrocarbons to achieve a stream of pure ethylene for polymerization. Since the stream is a mixture of paraffins (alkanes), olefins (alkenes) and aromatics, several distillations are required to obtain the ethylene. The order of the compound to be distillated is determined from the relative volatilities where components with the highest relative volatilities are separated first. For instance, as shown in Fig. 1, the first distillation column (T-101) is implemented to separate 1-butene

355
and 1,4-pentadiene given that their relative volatility is large. Moreover, the operating pressure, the feed-tray position and number of trays of the distillation column are dependent on the desired purity of the separated components in the vapor (distillate) stream and liquid (bottom) stream.
The order of distillations is also chosen depending on whether the separated components can produce more ethylene by further processing or not. For instance, in the second distillation column (T-102), ethane and propene are separated from each other. It is important to mention that this separation could have been achieved in the first distillation column, however, this order of separation has been chosen to obtain a stream having propene and butene only since they can be further processed to produce ethylene.
Furthermore, a hydrogenator reactor (R-101) is used to convert acetylene to ethylene and therefore enhance the yield of ethylene. Even though ethylene can undergo hydrogenation as well to produce ethane, a selective catalyst, Palladium, can activate the hydrogenation of acetylene while inhibiting that of ethylene. The weight percent of the catalyst is 0.005%; therefore, the void fraction can be neglected since the catalyst is present in minimal amounts [9].
The stream leaving the hydrogenator is sent to a third distillation column (T-103) to separate methane and ethylene. The distillate obtained consists of the remaining hydrogen and methane, which are recycled back into the packed bed reactor, whereas the bottoms contains only ethylene and ethane. The bottoms is fed to a fourth distillation (T-104) for the final separation of ethylene and ethane. The desired product ethylene is obtained with a purity of 99.98% and at the preferred conditions of pressure and temperature for polymerization. It is noteworthy that ethylene must have a minimum purity of 99.97% to be used in polymerization. The product is split between the solution polymerization and the free radical polymerization processes.
V. Polymerization Processes
A. Solution Polymerization Solution polymerization process transforms ethylene into
HDPE and LLDPE. It is known for its higher yield of PEs and its ability to produce both HDPE and LLDPE and not just the former. Therefore, it has been chosen instead of other polymerization techniques such as gas phase polymerization and slurry polymerization. The polymerization reaction occurs in the solution phase as opposed to the gas and slurry polymerization techniques where the reaction takes place in the gaseous and slurry phases respectively.
In the simulated process, ethylene feedstock undergoes a series of compression and heating stages to reach the operating conditions of 200 bar and 160 oC for HDPE and 140 oC for LLDPE. The feedstock is split between two primary continuous stirred tank reactors (CSTRS), one for HDPE (R-300) and the other for LLDPE production (R-302) as shown in Fig.1. Each primary CSTR is connected with a secondary one in series to achieve a higher conversion of ethylene into HDPE and LLDPE. The CSTRs are equipped with a heat removal unit
since the polymerization process is exothermic. Hexane solvent is added to dissolve the ethylene gas and therefore produce PE. Moreover, in order to control the polymer chain size, hydrogen gas is fed to the CSTRs.
The primary CTSRs are also supplied with Ziegler Natta (ZN) catalyst and Triethylaluminum (TEA) cocatalyst to initiate the polymerization reactions. ZN catalyst is a Titanium-based catalyst that is commonly used in industry for polymerization processes. TEA is used to activate the catalyst and consequently start the reaction. The aforementioned catalyst and cocatalyst are selected due to their high selectivity, ease of regeneration and market availability.
The kinetics of reactions involved in solution polymerization depends on several parameters such as the number of catalyst active site available, the maximum site concentration and the operating temperature. Even though the mechanism of ethylene polymerization is well understood and established, few studies have been conducted to determine the kinetics of the reactions involved. The kinetics used in the simulation were obtained from Kamal Al-Malah paper where polymerization occurs at four active sites of the catalyst with a maximum site concentration of 0.001 kg/m3 [10]. The obtained PE from each CSTR passes through a catalyst removal unit to extract the ZN catalyst and TEA cocatalyst. The unit is an ion exchanger with silica packed in the column. This method is proved to be effective in extracting catalyst having a transition metal which is the Titanium in the ZN catalyst [11]. The catalyst free streams are flashed to separate the PEs from the unreacted ethylene and hexane solvent. After flashing, the 44000 tons/year HDPE and 29000 ton/year LLDPE streams are obtained each with a purity of 99.4 %. The unreacted ethylene and hexane solvent are recycled back to reduce raw material cost and minimize environmental impact. B. Free Radical Polymerization
Free-radical polymerization transforms ethylene into LDPE. LDPE is transparent and clear and is widely used in food packaging films. The reaction occurs under severe conditions of temperature (≈ 170⁰C) and pressure (≈ 2000 bars) in the presence of initiators. It takes place in solution where the monomer is in excess. Organic peroxides, such as Di-tertiary-butyl-peroxide (Di-TBP), are suitable initiators for the free-radical polymerization process and their role is to initiate the formation of the polymer. In the simulated process, Di-TBP at ambient conditions undergoes a series of compressions before being mixed with the ethylene feedstock at 40 bars. The mixed stream is furtherly compressed to 2000 bars, then heated to 170⁰C prior to going into PFR (R-200). The PFR is a tubular reactor having a length of 1 km and a diameter of 60 mm, and is equipped with a heat removal unit since the polymerization process is exothermic and the temperature must be kept constant to control the formation of LDPE. Free-radical polymerization proceeds via a chain mechanism, which consists of different types of reactions involving free radicals. From

356
these reactions, initiation, propagation and termination are adequate to describe the mechanism [3, 12]. The kinetics of these reactions depend on temperature and pressure.
The product stream goes into a separation stage including a high-pressure flash tank followed by a low-pressure one. In this stage, LDPE is isolated from unreacted ethylene and Di-TBP. A flow rate of 27000 tons/year of LDPE is obtained with a purity of 99.94%. The unreacted material is recycled back after being properly processed to meet the temperature and pressure conditions at the mixing point.
VI. EQUIPMENT DESIGN
After simulating the process on ASPEN Plus, a detailed equipment sizing and design is performed to determine the dimensions and configuration of the equipment. A thorough design is conducted for several units such as heat exchangers, CSTR, PFR, distillation column, quencher, and absorber. Moreover, the material of construction is selected for every unit depending on the operating temperature and pressure in addition to the corrosiveness of the components involved. The design parameter of the aforementioned units are tabulated in Appendix A.
VII. PLANT LOCATION
Several factors should be taken into account to identify an appropriate site for the plant. The location choice can affect the cost related to labor, maintenance, log
istics and licensing. Due to the absence of refineries in Lebanon, the naphtha feedstock must be transported from the supplier by ships. Therefore, the plant must be implemented in a coastal area near ports in order to facilitate shipment of naphtha and reduce the shipping cost. The suggested coastal areas are Tripoli, Beirut, Sidon, Jounieh and Tyre since they present adequate geography for plant implementation and material transportation. To determine the feasible option among these cities, other requirements must be examined. The plant must be close to a river or sea since it requires high water input for generation of steam and for MDEA solution. A river is favored since the high salinity in the sea water could corrode the equipment. However, since the rivers in Lebanon have a low flowrate and therefore are insufficient to meet the plant’s water demand of about 160 m3/hr, the plant can only meet its water necessity from the sea. Moreover, it should be implemented in a location where land price is reasonable since the plant would occupy a large space. It should also be distant from residential areas, agricultural lands and touristic destinations.
Therefore, upon investigating the aforementioned requirements, Tripoli is the most suitable location since the port can be used for receiving imports of naphtha. In addition, the land price is considered acceptable and affordable compared to the other locations since it is not a touristic destination. Moreover, sufficient costal land is present which can be used for construction of the plant.
VIII. ECONOMIC ANALYSIS
A detailed economic analysis is performed to assess the economic feasibility of the plant. This analysis takes into account two costs, the initial cost (equipment and land cost) and the operating cost (raw material, utilities and labor cost) in addition to the revenue generated from the PE.
After determining the design and the material of construction of the process units, the total cost of equipment (E) including shipment is estimated to be $16.8 million. This estimate is used to calculate the total capital investment (TCI) of the petrochemical plant. The TCI includes both the fixed capital cost (FCI) and the working capital (WC) which are estimated to be equal to 504% and 89% of E respectively [13]. Therefore, using these approximations, the TCI is $99.6 million.
The operating cost is calculated on the assumption that the plant operates for 8000 hours per year. The operating cost is composed both direct (labor, raw material, utilities and maintenance) and indirect (property taxes, insurance…) cost and it is $95.7 million per year. The operating cost is high since naphtha, MDEA and methane prices are costly and attribute to more than 90% of the operating cost. However, the revenue generated from the sale of HDPE, LLDPE and LDPE is $114.8 million. The major operating costs and revenues are summarized in Table 4.
The annual gross earnings, excluding taxes, are determined by taking the difference of the total annual revenue and the annual operating cost and it is therefore equal to $19.1 million. However, after accounting for the taxes and assuming that the Lebanese central bank imposes a 15% taxes, the net annual profit is approximately $16.2 million. Consequently, the return on investment (ROI) is calculated by taking the ratio of the net earnings and the TCI and it is equal to 0.162. The obtained number implies that 16.2 % of the initial capital investment is gained every year. In other words, the petrochemical plant requires about 6 years to return all of its capital investment.
A breakeven period of five or six years is usually desired by investors and therefore the six-years-ROI-period reflects that the plant is economically feasible. This project will also attract
TABLE 4 PLANT ANNUAL MATERIAL COST AND REVENUES
Raw Material
Usage (ton/year)
Price ($/ton)
Cost ($/year)
Naphtha 352,000 75 26,400,000 MDEA 235,200 102.92 24,206,784
Methane 35,570,157 (Gallons/year)
1.074 ($/gallon) 38,202,349
HPS 796,480 8.65 6,889,552 Total Material Cost ($) 95,698,685
Products Production (ton/year)
Price ($/ton) Revenue
HDPE 45,000 1,117 49,148,000 LLDPE 29,000 1,095 31,737,480 LDPE 27,000 1,250 33,890,000 Total Revenue ($) 114,865,480

357
investors since it will be the only petrochemical plant in Lebanon and one of the few plants in the Middle East. Consequently, given that PE is a desired product for diverse application, this plant will have a significant market share in the Middle East region. In addition, since that the oil and gas companies are still suffering from the oil crisis, they are selling most of the produced naphtha to petrochemical plants. Therefore, this plant has the potential to prosper while making use of relatively cheap naphtha.
IX. CONCLUSION
This project explains the preliminary design of a petrochemical plant that converts naphtha into HDPE, LLDPE and LDPE by steam cracking and two polymerization processes. The plant produces 47000, 29000 and 27000 tons/year of HDPE, LLDPE and LDPE from 352,000 tons/year of naphtha based on the simulation conducted on Aspen HYSYS and Aspen Plus software packages. Commonly, petrochemical companies implement only one polymerization technique to produce either HDPE and LLDPE or LDPE. However, this work examined the possibility of combining two polymerization processes to produce the three types of PEs which is only applied in three industrial plants worldwide. In this process, naphtha is cracked in a furnace using steam that breaks down the C4-C9 hydrocarbon chains to C2-C5. The cracked gas undergoes acid gas removal, drying and a series of distillations to obtain ethylene with a purity of 99.98%. The ethylene produced is split between solution polymerization and free radical polymerization processes in order to obtain HDPE, LLDPE and LDPE. The economic analysis performed for the whole process shows that the plant is economically feasible with a breakdown period of 6 years. Even though the plant requires a high TCI, the three produced PEs are highly demanded and generate high profits that can cover the invested capital. Moreover, the plant has the potential to have a high market share in the Middle East share especially that only few industrial plants for PEs are established in this region. Consequently, the plant can attract investors especially that petrochemical plants are the main target for the oil companies.
ACKNOWLEDGMENT
The authors of this paper would like to extend special thanks to Dr. Ali Tehrani and the chairman of the department Dr. Mohammad Ahmad for their guidance throughout the project. The team would also like to acknowledge Dr. Fouad Azizi for his valuable information and advice concerning the simulation.
REFERENCES
[1] F. Gliden, "Polyethylene," University of York, 2015. [2] W. Borden, "Cracking and Related Refinery Processes," University of
York, 2014. [3] D. B. Malpass, Introduction to Industrial Polyethylene, Canada: John
Wiley & Sons,Inc, 2010, pp. 115-121.. [4] R. A. Meyers, "ABB LUMMUS Global SRT® Cracking Technology
For The Production Of Ethylene," in Handbook of Petrochemicals Production Processes, McGraw-Hill, 2005.
[5] Emerson Process Management, "Ethylene Production," 2010. Available:http://www.documentation.emersonprocess.com/groups/public/documents/book/d103417x012.pdf?_ga=1.96580575.1977058919.1474970355.
[6] M. Firdaus and A. Dwijayanti, "Ethylene Quench Water Tower," 2014. [7] P. Wankat, Separation Pocess Engineering, New Jersey: Pearson
Education, 2011, pp.107-109. [8] J. Dyment and S. Watanasiri, "Acid Gas Cleaning using Amine Solvents:
Validation with Experimental and Plant Data," 2015. [9] L. Cerveny, "Palladium Catalysts in Hydrogenation reactions," in
Chemical Engineering Communications, 1 ed., vol. 83, 1989, pp. 31-63. [10] K. Al Malah, Aspen Plus: Chemical Engineering Applications, John
Wiley & Sons, 2015, pp. 105-110. [11] R. H. Lamberth, S. J. Pederson, M. Baranoski and A. M. Rawlett,
Methods for removal of residual catalyst from polymers prepared by ring opening metathesis polymerization, vol. 48, Maryland: Wiley & Sons, 2010, pp. 5752-5757.
[12] A. Shamiri, M. H. Chakrabati, S. Jahan, M. A. Hussian, W. Kaminsky, P. V. Aravind and W. A. Yehye, "The Influence of Ziegler-Natta and Metallocene Catalysts on Polyolefin Structure, Properties, and Processing Ability," Materials, pp. 5069-5108, 2014.
[13] C. Branan, "Process Evaluation: Economics," in Rules of Thumb for Chemical Engineers, Oxford, Elsevier, 2005, pp. 269-273.

358
APPENDIX A: DESIGN PARAMETERS
TABLE 5 DESIGN PARAMETERS OF HYDROGENATOR
Design Parameter Unit Value Volume of tube m3 0.019
Diameter of tube m 0.05 Length of tube m 3.15
Number of tubes 24 Shell Diameter m 0.482 Tube thickness m 0.003
TABLE 6
DESIGN PARAMETERS OF HEAT EXCHANGER
Design Parameter for Unit Value Log mean temperature
difference °C 251.2
Correction factor 0.9575 Mean temperature °C 240.532 Heat transfer area m2 9.636
Heat exchanger length m 2.44 Number of tubes 33
Tube pitch m 0.0238 Bundle diameter m 0.197 Shell diameter m 0.285 Baffle spacing m 0.114
Shell side cross sectional area m2 0.0065 Overall heat transfer
coefficient W/m2. °C 62.86
TABLE 7 DESIGN PARAMETERS OF QUENCHER
Design Parameter Unit Value Heat kJ/h 1.53*107
Cross sectional Area m2 0.69 Diameter of tower m 0.94
Log mean temperature difference
⁰C 300.5
Height of tower m 5.1
TABLE 8 DESIGN PARAMETERS OF ABSORBER
Design parameter Unit Results
Type of packing Intalox saddles ceramic - Size: 2 in
Material of construction
Stainless steel
Diameter m 1.2
Pressure drop kPa/m of packing 0.204
Height of column m 12.1
TABLE 9 DESIGN PARAMETERS OF CSTR
Design Parameter Unit Value Volume of CSTR1 m3 19.089 Volume of CSTR2 m3 6.467 Reactor diameter m 2.53
Reactor height m 3.8 Impeller diameter m 0.843 Baffle thickness m 0.21
Distance from center of blade to reactor bottom m 0.843
Blade width m 0.168 Blade length m 0.21
Wall thickness mm 12 Minimum stirrer speed rev/s 0.41
TABLE 10
DESIGN PARAMETERS OF DISTILLATION COLUMN
Parameter Unit Parameter value
Recommended range
Minimum number of trays 5 -
Minimum reflux 0.157857 - Actual number of
trays 14 -
Feed point location 6 - Tray spacing m 0.5 0.15-0.9 Total length m 8.05 - Material of
Construction SS-304 -
Operating pressure kPa 1000 - Pressure drop per
tray Pa 37.77 -
Overall pressure drop Pa 528.81 -
Tray type Sieve trays Valve trays or Sieve trays
Plate thickness mm 3 1.9-4 Valve diameter mm 5 2.5-12.5
Hole pitch mm 15 (2.5-4)*Hole Diameter
Weir height mm 50 40-90
Weir length m 0.95 (0.6-0.8) *Column Diameter
Column diameter m 1.572 - Tower thickness mm 8.2 -
Flooding percentage 87.95 80-85

359
VS-300
C-301
R-300
R-302
VS-301
C-300
VS-302
VS-303
R-301
R-303
VS-304
VS-305
P-302P-301
P-303
V-307
E-301
E-304
E-303
V-308
V-311
E-305
V-312E-306
E-300
P-300
C-302E-302
Hexane
HD
PE
LLDPE
V-300ZN
& TEA
V-301
V-304
V-313
V-310
V-309
V-305
V-302
V-306
V-303
P-100P-101
Naphtha
E-100
Steam
F-100
AirM
ethane
R-100
Q-100
V-101E-101
E-102
VS-100
C-100E-103
VS-101
E-104
VS-102
T-101T-102
V-100
E-108
C-101R-101
C-102
T-103T-104
Flue gas
T-100
V-102
V-103
P-102
P-104
P-103
P-105
VS-103
VS-104
E-107
E-105
E-106
V-105V-104
Regenerated MD
EA and Water
V-106V-107
Makeup M
DEA
Makeup W
ater
Flashed water
Recycled MDEA &
Water
V-108E-109
V-109
P-200P-201
P-202
P-205P-204
P-203
E-200
V-205
E-201
VS-200
VS-201
E-202
V-203
V-204
E-203E-205
E-206
V-201V-200
V-202
C-200
E-204
E-207R-200
C-202
LDPE
H2
Di-TBP
Free-radical polymerization
Solution Polymerization
Steam Cracking
C-201
LegendFeedstockProductRecycleSubprocess
Process StreamU
tility StreamEnergy Stream
Done By
Christy KehdiM
ohamed Kotaish
Elias Moubarak
Ryan Mouaw
adM
ichael Serhan
Quench W
ater O
ut
Quench
Water In
APPE
ND
IX B
Figure 1. Process Flow D
iagram

360

361
INDUSTRIAL ENGINEERING AND MANAGEMENTBIOMEDICAL ENGINEERING AND PETROLEUM ENGINEERING

362

363
364 Ghady MoussaEPQ with Credit Facility on Raw Material
369 Maher GhalayiniMethods to Evaluate and Reduce Data Overload in Electronic Medical Records
375 Hussein El Hajj Optimal Time and Cost Balance in Project Risk Management
383 Rafic El Itani Optimization of Piezoelectric Wafers Network for Structural Health Monitoring Based on Mixed Integer Non-Linear Programming Approach
409 Maysaa JaafarPricing and Inventory Decisions in an EOQ Setting Under Logit Demand
416 Maya Jalloul Standardized Cargo Network Revenue Management with Dual Channels
425 Adnan El Tannir TheErgonomicBenefitsofaLaterally-TiltedOperatingRoomTableandFriction-Reducing Devices when Laterally Transferring Patients to Stretchers
CONTENTINDUSTRIAL ENGINEERING AND MANAGEMENT

364
EPQ with Credit Facility on Raw Material
Ghady Moussa Department of Industrial Engineering and Engineering Management
American University of Beirut Beirut,Lebanon
Abstract
The inventory models presented in this paper are based on the classic Economic Production Quantity (EPQ) analysis. In the first base model, we determine the optimal production policy by accounting for the inventories of the raw material and the finished product. The production policy consists of setting of number of batches of raw material to order for multiple identical production cycles, in addition to the optimal production quantity in each cycle. In a second model, we assume that the supplier of the raw material allows a fixed credit facility period for settling the procurement cost. We develop the optimal production policy under this assumption, which seems to have been ignored in the literature. One interesting aspect of our analysis is the tacit effect of raw material trade credit on the financing cost of the finished product inventory. In addition to incorporating the effect of trade credit of raw material in the EPQ, our results could aid manufacturers in deciding on different supplier offers related to delays in payment.
1. Introduction
The traditional economic ordering quantity (EOQ) formula
was first presented by Harris in February 1913 to determine the economic ordering lot size. Then, five years later, Taft introduced the economic production quantity EPQ formula to determine the economic manufacturing batch size. Since then, thousands of papers were published to extend these theories. However, rare are the papers that studied the EPQ model while taking into consideration the raw material. The paper published by Goyal in 1977 is the foundation of this track. The model studied in this paper is based on Goyal’s model and aims at getting the minimum total cost per time per ordering cycle while taking into consideration raw materials in the calculations. However, some assumptions taken by the classical economic order quantity (EOQ) model are sometimes not valid. In fact, the model assumes that the retailer must pay for the items as soon as the items are received. Nevertheless, this assumption is not always applicable. In fact, in most business transactions, suppliers allow a certain fixed credit period to settle the account. This will lead to a win-win situation in which the supplier promotes his commodities and the retailer accumulates sales revenue and earns interest. Goyal (1985) was the first to develop an economic order quantity model under the conditions of allowable delay in payments. Then, Chand and Ward questioned Goyal’s paper and obtained different results. After that, papers
were published based on their assumptions. Indeed, many authors extended Goyal’s model to account for deteriorating items such as Aggarwal and Jaggi (1995), . Jamal et al. (2000), Sarker et al. (2000). Others assumed that shortage is permitted to occur such as Jamal et al. (1997), Chen and Ouyang (2006), Chung and Huang(2009). Chung and Huang (2003) talked about economic production quantity (EPQ) inventory model for a retailer when the supplier offers a permissible delay in payments by assuming that the selling price is the same as the purchase cost. Then, Teng and Chang (2009) investigated the optimal retailer’s replenishment decisions with two levels of trade credit policy in the EPQ framework. Many other authors considered EPQ models under credit facilities such as Huang (2004), Huang(2007), Goswami et al. (2010), Mahata (2012). Each of the papers mentioned above concerning EPQ models with delay in payment took different assumptions into considerations. However, to the author’s knowledge, none of them have studied EPQ models taking into consideration both raw materials and delay in payments. Therefore, this paper’s aim is to fill this gap.
2. EPQ model with Raw Material:
Figure 1:EPQ model involving raw material and finished products
The EPQ model studied in this paper takes into consideration both the finished products and the raw material. In this model, each time raw material are ordered, they are ordered for n production cycles. In the model, the production rate and
0246810
0 1 2 3 4 5 6 7 8 9 10

365
consumption rate are assumed to be deterministic and lead time is assumed to be zero. No shortage, on either raw materials or finished products, is also assumed. The objective of this model is to determine the optimal amount of raw material that should be ordered and the optimal number of ordering cycles . After obtaining the former two quantities, the minimum total cost will be found. Below is a list of the acronyms that will be used in the model.
• t1= time to accumulate Z units of finished products at the rate (𝛼𝛼 − 𝛽𝛽) units/unit time =time to produce y units of finished products at the rate 𝛼𝛼 units/unit time
• 𝛼𝛼 = production rate of finished products= depletion rate of raw material ( y=𝛼𝛼*t1)
• t2 =time to consume Z units of finished products at the rate 𝛽𝛽 units/unit time
• t0 = time to produce y units of finished products at a rate 𝛽𝛽 and consume them at a rate 𝛽𝛽 (𝑡𝑡& =
()
)
• 𝛽𝛽 = demand rate of finished products (Z=𝛽𝛽*t2)
• h=holding cost of 1 product for 1 unit of time • h0= holding cost of raw material for 1 unit of time • Z =maximum inventory of finished product
𝑍𝑍 = 𝑦𝑦(1 − ).)
• 01= Average finished product inventory over the period
(t0) • y= maximum inventory of raw material • (
1= Average raw material inventory over t1
• Z0 = Average raw material inventory over the period (t0) 𝑍𝑍& =
21∗ 45
Total cost per ordering cycle: TC(y) = production cost+ cost of ordering raw material +variable cost+ holding costs of finished products + holding costs of raw materials TC(y) =n*K+K0 + n*C*y + n*h*(6
1)*t0 + n*h0*(Z0)*t0
TCU (y)= 78(2)9∗:&
=9∗;9∗:&
+ ;&9∗:&
+ 9∗8∗29∗:&
+9∗=∗>∗?@A9∗:&
+ 9∗=&∗0&∗:&9∗:&
TCU(y) =;∗4
2+ B&∗4
9∗2+ C ∗ β +=∗0
1 + h0*Z0
à TCU(n,y)=𝐊𝐊 ∗ 𝛃𝛃𝐲𝐲+ 𝐤𝐤𝐤𝐤∗𝛃𝛃
𝐧𝐧∗𝐲𝐲+ 𝐂𝐂 ∗ 𝛃𝛃 + 𝟏𝟏
𝟐𝟐∗ 𝐡𝐡 ∗ 𝐲𝐲 ∗ 𝟏𝟏 − 𝛃𝛃
𝐚𝐚+h0*
( 𝐲𝐲∗𝛃𝛃𝟐𝟐∗𝛂𝛂
+ 𝐧𝐧Q𝟏𝟏 ∗𝐲𝐲𝟐𝟐
) (1)
Then, equation (1) is derived with respect to y to get the maximum inventory that will give the minimum total cost :(y*) dTCU(y)
dy= 0
Q;∗42A
+ Q;@∗49∗2A
+ W1∗ h ∗ 1 − 4
Y+ h0* (
41∗5
+ 9QW1
)=0
à y*(n) = 𝐧𝐧∗𝐊𝐊∗𝛃𝛃Z𝐊𝐊𝐤𝐤∗𝛃𝛃𝐧𝐧𝟐𝟐 𝐡𝐡∗ 𝟏𝟏Q𝛃𝛃
𝛂𝛂 Z𝐡𝐡𝐤𝐤∗( 𝐧𝐧Q𝟏𝟏 Z𝛃𝛃𝛂𝛂)
(2)
After that, equation (2) is replaced in equation (1) that is then derived with respect to n to give the optimal number of ordering cycles (n*) TCU(n,y*(n))= K ∗ 4
2∗+ B&∗4
9∗2∗+ C ∗ β + W
1∗ h ∗ y∗ ∗ 1 −
4Y+h0* (
2∗∗41∗5
+ 9QW ∗2∗
1)
à TCU(n,y*(n))= 2 ∗9∗;∗4Z;@∗4 ∗ =∗ WQ]^ Z=@∗
]^ Z=@∗(9QW)
9
+C*β dTCU(n, y ∗ (n))
dn= 0
à 𝐧𝐧∗= 𝐊𝐊𝐤𝐤∗𝛃𝛃∗ 𝐡𝐡 𝟏𝟏Q𝛃𝛃𝐚𝐚 Z𝐡𝐡𝐤𝐤∗
𝛃𝛃𝛂𝛂 Q𝐡𝐡𝐤𝐤∗𝐊𝐊𝐤𝐤∗𝛃𝛃
𝐡𝐡𝐤𝐤∗𝐊𝐊∗𝛃𝛃 (3)
Many papers have discussed ways to find the optimal number of cycles that lead to a minimum total cost but none have found a closed form expression for it as the one obtained above. Note: to make sure that TCU(n,y*(n)) had only one minimum, we had to study its convexity. The function turned out to be quasi-convex which means that the function has only one
Numerical example:
Example: For the following data:
K0 5000 K 50 C 40 H0 4
H 8 ALPHA 1200 BETA 800

366
à n*= ;@∗4∗ = WQ]^ Z=@∗
]a Q=@∗;@∗4
=@∗;∗4=5.77
so for n=6 à
• y*(n) = 9∗;∗4Z;@∗4bA =∗ WQ]
a Z=@∗( 9QW Z]a)
=236.2
• TCU(6,y*(6))=
2 ∗9∗;∗4Z;@∗4 ∗ =∗ WQ]^ Z=@∗
]^ Z=@∗(9QW)
9+
Cβ=37983.68
We can get TCU(n*,y*(n*)), by plotting TCU(n,y*(n)) for all n>0 since it was proven to have one optimum.
n TCU(n,y*(n))
1 385652 381713 380524 380045 379876 379847 379898 38000
9 3801410 38031
11 3804912 3806913 3809014 3811115 3813316 3815617 3817918 3820219 3822520 3824821 3827222 3829523 38319
Figure 2: graph of TCU(n,y*(n)) with respect to n
3. EPQ model taking into consideration both raw material and credit facilities:
Now, the same model will be used but we will add to it the concept of delay in payment; the assumptions will be the same , we just add to them the hypothesis that the buyers will pay for the products after a certain time of the purchase. The objective of this model is to get the minimum total cost taking into consideration both the raw material and the credit facility which have been ignored in previous papers. Three general cases are studied in this model. The formulas of Total cost per unit time per cycle were derived and will be shown below. The study is still ongoing and will continue until we get to the optimal production policy. Then, the results obtained will be analyzed to see whether it is profitable to consider credit facilities or not. The same nomenclature will be used, we will add to them the following: • T :the time to pay • j: last cycle in the cut • hc: storagecostofrawmaterial • ℎst: 𝑠𝑠𝑠𝑠𝑠𝑠𝑠𝑠𝑠𝑠𝑠𝑠𝑠𝑠𝑐𝑐𝑠𝑠𝑠𝑠𝑠𝑠𝑠𝑠𝑜𝑜𝑜𝑜𝑓𝑓𝑓𝑓𝑓𝑓𝑠𝑠ℎ𝑠𝑠𝑒𝑒𝑝𝑝𝑠𝑠𝑠𝑠𝑒𝑒𝑝𝑝𝑐𝑐𝑠𝑠𝑠𝑠 • ic0 :financing cost of raw material • v+ i𝑐𝑐&: 𝑜𝑜𝑓𝑓𝑓𝑓𝑠𝑠𝑓𝑓𝑐𝑐𝑓𝑓𝑓𝑓𝑠𝑠𝑐𝑐𝑠𝑠𝑠𝑠𝑠𝑠𝑠𝑠𝑜𝑜𝑜𝑜𝑓𝑓𝑓𝑓𝑓𝑓𝑠𝑠ℎ𝑠𝑠𝑒𝑒𝑝𝑝𝑠𝑠𝑠𝑠𝑒𝑒𝑝𝑝𝑐𝑐𝑠𝑠𝑠𝑠 • h0:holding cost of raw material/unit time/unit cycle= i𝑐𝑐& +
hc • h :holding cost of finished products/unit time/unit cycle=
i𝑐𝑐& + hcÇ + 𝑣𝑣 • AR.M =area of raw material at t<T • Af.p. = area of finished products at t<T
37900
38000
38100
38200
38300
38400
38500
38600
0 10 20 30
TCU(n,y*(n))
TCU(n,y*(n))

367
Case 1:
T<nt0 :For production stage:
TC(y) =n*K+K0 + n*C*y + n*h*(61)*t0 + n*h0*(Z0)*t0 - interest
from sales
TCU (y)= ÑÖ(()Ü∗á&
= 9∗;9∗:&
+ ;&9∗:&
+ 9∗8∗29∗:&
+9∗=∗>∗?@A9∗:&
+ 9∗=&∗0&∗:&9∗:&
- interest from sales
TCU(y) = ;∗42
+ B&∗49∗2
+ C ∗ β +=∗01
+ h0*Z0 – interest from sales ;∗42
+ B&∗49∗2
+ C ∗ β + hcÇ + 𝑣𝑣 Z + âä@Üá@
𝐴𝐴 − 𝐴𝐴s.ç. + hc * Z0
+ âä@Üá@
𝐴𝐴 − 𝐴𝐴é.è -iRMc0.ARM
TCU(y)= 𝐊𝐊∗𝛃𝛃𝐲𝐲
+ 𝐤𝐤𝐤𝐤∗𝛃𝛃𝐧𝐧∗𝐲𝐲
+ 𝐂𝐂 ∗ 𝛃𝛃 + 𝐡𝐡𝐬𝐬𝐬𝐬 + 𝐯𝐯 𝟏𝟏𝟐𝟐𝐲𝐲 𝟏𝟏 − 𝛃𝛃
𝛂𝛂+ 𝐡𝐡𝐬𝐬 ∗
𝐲𝐲∗𝛃𝛃𝟐𝟐∗𝛂𝛂
+ 𝐧𝐧Q𝟏𝟏 ∗𝐲𝐲𝟐𝟐
+ 𝐢𝐢𝐜𝐜𝐤𝐤𝐧𝐧𝐭𝐭𝐤𝐤
𝐲𝐲𝐧𝐧𝟐𝟐 − 𝟐𝟐𝐲𝐲𝟐𝟐𝐧𝐧 + 𝟐𝟐𝐲𝐲𝐧𝐧 + 𝟐𝟐𝐲𝐲𝟐𝟐𝟐𝟐 −
𝟐𝟐𝐧𝐧𝛃𝛃𝟐𝟐 − 𝟐𝟐𝐲𝐲𝟐𝟐 + 𝛃𝛃𝟐𝟐𝟐𝟐𝟐𝟐
𝐲𝐲–𝐢𝐢𝐑𝐑𝐑𝐑𝐜𝐜𝐤𝐤 𝟐𝟐 − 𝟏𝟏 𝐲𝐲∗𝐭𝐭𝟏𝟏
𝟐𝟐+ 𝟐𝟐Q𝟏𝟏
𝟐𝟐∗ 𝟐𝟐 𝐧𝐧 −
𝟏𝟏 − 𝟐𝟐 − 𝟐𝟐 ∗ 𝐲𝐲𝐭𝐭𝐤𝐤 + 𝐧𝐧 − 𝟐𝟐 ∗ 𝐲𝐲 ∗ 𝟐𝟐 + 𝟏𝟏𝟐𝟐∗ (𝟐𝟐 − (𝟐𝟐 − 𝟏𝟏)𝐭𝐭𝐤𝐤) ∗
𝐲𝐲 + ((𝟐𝟐Q𝟏𝟏)𝐭𝐭𝐤𝐤Z𝐭𝐭𝟏𝟏)Q𝟐𝟐𝐭𝐭𝟏𝟏
∗ 𝐲𝐲 (4)
Case 2:
T<nt0 :For consumption stage:
TC(y) =n*K+K0 + n*C*y + n*h*(61)*t0 + n*h0*(Z0)*t0 – interest
from sales
TCU (y)= ÑÖ(()Ü∗á&
= 9∗;9∗:&
+ ;&9∗:&
+ 9∗8∗29∗:&
+9∗=∗>∗?@A9∗:&
+ 9∗=&∗0&∗:&9∗:&
– interest from sales TCU(y) =;∗4
2+ B&∗4
9∗2+ C ∗ β +=∗0
1 + h0*Z0 - iRMc0.ARM
= ;∗4
2+ B&∗4
9∗2+ C ∗ β + hcÇ + 𝑣𝑣 Z + âä@
Üá@𝐴𝐴 − 𝐴𝐴s.ç. + hc * Z0
+ âä@Üá@
𝐴𝐴 − 𝐴𝐴é.è - iRMc0.ARM
TCU y =Kβα
+βK0ny
+Cβ+ hs.f+v12
y 1-
βα
+hsyβ2α
+(n-1)y
2+
ic0
nt0-2yβα
+2yβα
2
-Tβ+Tβ2
α+αTj-αT2 β
y-
j2αyβ
+Tjα+jαyβ
-Tα-Ty+n2y-jyβα
+yβα
-2njy+j2y+2ny-nTβ+jTβ -
iR.Mc0 jyt1
2+ 2 n-1 -(j-2) yt0+(n-j)yj (𝟓𝟓)
Case 3: T<nt0
TC(y) =n*K+K0 + n*C*y + n*h*(6
1)*t0 + n*h0*(Z0)*t0 – interest
from sales
TCU (y)= ÑÖ(()Ü∗á&
= 9∗;9∗:&
+ ;&9∗:&
+ 9∗8∗29∗:&
+9∗=∗>∗?@A9∗:&
+ 9∗=&∗0&∗:&9∗:&
– interest from sales TCU(y)= 𝐊𝐊∗𝛃𝛃
𝐲𝐲+ 𝐤𝐤𝐤𝐤∗𝛃𝛃
𝐧𝐧∗𝐲𝐲+ 𝐂𝐂 ∗ 𝛃𝛃 + 𝐡𝐡𝐬𝐬𝐬𝐬 + 𝐯𝐯 𝟏𝟏
𝟐𝟐𝐲𝐲 𝟏𝟏 − 𝛃𝛃
𝛂𝛂+ 𝐡𝐡𝐬𝐬 ∗
𝐲𝐲∗𝛃𝛃𝟐𝟐∗𝛂𝛂
+ 𝐧𝐧Q𝟏𝟏 ∗𝐲𝐲𝟐𝟐
-iRMc0 𝐧𝐧𝐲𝐲𝐭𝐭𝟏𝟏𝟐𝟐+ 𝐧𝐧Q𝟏𝟏 ∗𝐧𝐧
𝟐𝟐𝐭𝐭𝐤𝐤𝐲𝐲 (6)
4. Conclusion
This papers studies two main issues in inventory. At first, it considers a system of an EPQ model with raw material ordered for n cycles. In this section, formulas for the optimal number of ordering cycles and for the optimal production quantity in each cycle were derived. Knowing these two quantities, the minimum total cost can be easily attained. Then, the assumption of delay in payment was added to the former model. The study of this part is not done yet. However, The aim of it is to develop the optimal production policy under the assumption of credit facilities. References: . 1 A. Goswami, G. C. Mahata and Om Prakash, Optimal replenishment
decisions in the EPQ model for deteriorating items with two levels of trade credit financing, Int. J. Math. Oper. Res. 2(1) (2010) 17–39.
. 2 A.M.M. Jamal, B.R. Sarker, S. Wang, An ordering policy for deteriorating items with allowable shortage and permissible delay in payment, J. Operat. Res. Soc. 48 (1997) 826–833.
. 3 A.M.M. Jamal, B.R. Sarker, S. Wang, Optimal payment time for a retailer under permitted delay of payment by the wholesaler, Int. J. Prod. Econ. 66 (2000) 59–66.

368
. 4 B.R. Sarker, A.M.M. Jamal, S. Wang, Supply chain model for perishable products under inflation and permissible delay in payment, Comput. Oper. Res. 27 (2000) 59–75.
5 E.W. Taft, The most economical production lot, Iron Age 101 (1918) 1410–1412.
. [6] F.W. Harris, How many parts to make at once factory, Mag. Manage. 10 (1913) 135–136. and 152
.
7 G. C. Mahata, An EPQ-based inventory model for exponentially deteriorating items under retailer partial trade credit policy in supply chain, Exp. Sys. Appl. 39 (2012) 3537–3550.
8 J.T. Teng, C.T. Chang, Optimal manufacturer replenishment policies in the EPQ model under two levels of trade credit policy, Eur. J. Operat. Res. 195 (2009) 358–363.
9 K.J. Chung, Y.F. Huang, The optimal cycle time for EPQ inventory model under permissible delay in payments, Int. J. Prod. Econ. 84(2003) 307–318
10 K.J. Chung, C.K. Huang, An ordering policy with allowable shortage and permissible delay in payments, Appl. Math. Modell. 33 (2009) 2518–2525.
11 L.H. Chen, L.Y. Ouyang, Fuzzy inventory model for deteriorating items with permissible delay in payment, Appl. Math. Comput. 182 (2006) 711–726.
12 S. Chand, J. Ward, A note on economic order quantity under conditions of permissible delay in payments, J.Operat. Res. Soc. 38 (1987) 83-84.
13 S. Chand, J. Ward, A note on economic order quantity under conditions of permissible delay in payments, J.Operat. Res. Soc. 38 (1987) 83-84.
[14]S.K. Goyal, Economic order quantity under conditions of permissible delay in payments, J. Operat. Res. Soc. 36 (1985) 335–338.
. [15]S. K. Goyal, “Integrated Inventory Model for a Single Supplier-Single Customer Prob-lem,” International Journal of Production Research, Vol. 15, No. 1, 1977, pp. 107-111.
[16]S.P. Aggarwal, C.K. Jaggi, Ordering policies of deteriorating items under permissible delay in payments, J. Operat. Res. Soc. 46 (1995) 658–662.
[17]Y. F. Huang, Optimal retailer replenishment policy for the EPQ model under supplier trade credit policy, Prod. Plan. Contr. 15 (2004) 27–33.
[18] Y. F. Huang, Optimal retailer’s replenishment decisions in the EPQ model under two levels of trade credit policy, European J. Oper. Res. 176 (2007) 1577–1591.
.
.
.
. .
.
.
.
.
. .
.

369
Methods to Evaluate and Reduce Data Overload in Electronic Medical Records
Maher Al Ghalayini
Department of Industrial Engineering and Management American University of Beirut Bliss Street, Beirut, Lebanon
Abstract-Electronic medical records (EMRs) provide physicians with several important functions that help improve hospital operations. However, the introduction of EMRs has also resulted in unforeseen delays in operations and new types of medical errors. These problems have been found to largely stem from the poor design of the EMR interface, and in particular from the issue of data overload. Nevertheless, it is still unclear how best to evaluate an EMR in order to minimize data overload and optimize physician performance. To this end, the goal of this research study was to compare the benefits and limitations of a range of interface evaluation methods for their ability to reflect the performance of physicians using an EMR. The application domain for this research was the American University of Beirut (AUB) Department of Family Medicine. This research will contribute to the literature on interface evaluation and will help usability professionals develop EMRs that maximize safety and efficiency.
INTRODUCTION
Data overload, or the presence of high data density in an interface, is a problem that negatively affects operators in a variety of domains, such as aviation [1], driving [2], and medicine [3]. The concern about data overload stems from its negative effects on attention and performance [4]; namely, slowing down visual search [5]. In particular, data overload in the medical domain can have severe consequences on patient safety and well-being [3]. The most prominent example of data overload in medicine is in the Electronic Medical Records (EMRs) – i.e., digital medical charts – used by physicians [6]. However, to date, researchers have not been able to determine the best way of detecting and measuring data overload in the medical domain. Several methods and metrics have been proposed in the literature, such as subjective assessment [7] and image processing[8]. Nevertheless, it is still unclear which of these measures is best suited to the medical domain. On the other hand, there are alternative metrics whose potential for measuring clutter has not yet been fully assessed, such as the number of mouse clicks during an operation and various eye tracking metrics [9]. Thus, the overall goal of this research was to systematically and critically compare the benefits and limitations of different metrics to measure data overload in EMRs. The application domain for this research will be the AUB Medical Center (AUBMC) Department of Family Medicine (FM), who have
developed an in-house EMR that they use for patient assessment. In addition, a new display has been developed where the elements of multiple pages have been grouped onto one page, with the aim of reducing mouse clicks. This, however, has resulted in a page with a high data load. The presence of these two systems present a unique opportunity to test the effects of data overload on what is essentially the same system. The aim of this research is thus to conduct a controlled experiment to gather and evaluate the different suggested metrics – performance, subjective, and eye tracking - in order to identify the most appropriate ones for evaluating data overload. This work is expected to result in improved guidelines for the evaluation and assessment of data overload in EMRs. In turn, this will allow for increased efficiency and, more importantly, safety at AUB and other medical environments.
BACKGROUND
A. EMR EMRs are considered digital equivalents of patient medical charts and store a wide variety of medical information [10]. EMRs can thus help make medical operations faster and more efficient, which benefits medical providers and patients alike. However, a recent study estimated the number of deaths related to preventable medical errors at 440,000 per year [11], up from the previous estimate of 98,000 in 1999 [12]. Increasingly, there is a growing realization that errors involving EMRs are not due to a lack of training or negligence on the part of the doctors, but rather stem from poor EMR display design [13]. Design-related issues can thus present a considerable threat to the efficient operation of hospitals and, more importantly, to the health and well-being of patients. Several factors can contribute to the poor usability of EMRs; however, primary among these is the problem of data overload [10], which is the focus of this study. B. Data Overload Data overload, often also referred to as display clutter, can be defined as the presence of a high density of poorly-organized data that leads to negative performance decrements [14]. In the medical domain, data overload has figured most prominently in the EMRs used by physicians [6]. EMR data overload can take on many forms, such as a high density of

370
alerts [3] or simply a large amount of poorly-organized, irrelevant medical information [15]–[19]. The concern about EMR data overload is related to its negative performance effects. It has been shown to prevent physicians from quickly and accurately extracting EMR information, which can compromise both efficiency and safety in the hospital [3], [14], [20]. For example, research has shown data overload to lead to increased EMR use time and difficulty finding relevant information [21], [22]. C. Methods for Assessing Data Overload Despite the negative effects of data overload in EMRs, it is still unclear how best to evaluate data overload in a given display or set of displays. Several different approaches have been used, the most prominent of which rely on subjective input and feedback from physicians. In one study, for example, a survey was used to determine whether practitioners thought there were too many medical alerts in the EMR [3]. In other cases, interviews with physicians were carried out to obtain their insight on data overload [23]. In addition to the more prominent subjective methods, researchers have also occasionally used other techniques. Image processing algorithms (pixel-based algorithms that provide a measure of display usability) have sometimes been used, such as the redundancy measure of Zhang et al. (2011). Only rarely have researchers gathered performance measures such as response time and error rate as a measure of display usability [18], [21], [22]. Despite this attention to EMR usability, there are significant gaps and limitations in the existing literature. The opinions of users, while certainly beneficial and informative, can often be biased and misguided [24]. Rather, from a user-centered or human factors perspective, what matters most when evaluating or rating interfaces is the performance of users. However, relatively few studies have focused on performance measures. At the same time, performance measures alone are vague and can only suggest whether a display is potentially useful, but not where the problems within the display are. In addition, performance metrics need to be calculated through an experiment, whereas other metrics, such as image processing algorithms, may be calculated without the need for an experiment to be set up. However, there has not been, to our knowledge, a systematic evaluation of which other measures and approaches are most suitable evaluating EMRs. There is a need to determine which measures correlate best to performance and, crucially, can provide additional information about the problems within a display. These measures will then form a framework for the systematic and objective evaluation of EMRs. The proposed measures for evaluating data overload that will be investigated in this study are eye tracking, mouse clicks, and subjective measures. These can then also be used to create a model of data overload in EMRs that is based on multiple factors. Eye tracking. Eye tracking is a non-invasive, infrared-based technique that is used to trace where a person is looking
on a screen [25]. Eye tracking has several advantages as a display evaluation technique. In particular, it is a non-invasive and objective measure [26]. Eye tracking also makes it possible to trace changing information access strategies over time at a fine-grained level of analysis [27]. Moacdieh and Sarter were the first to use eye tracking to systematically evaluate the effects of EMR data overload on physician performance while making diagnoses (2015). They suggested a number of eye tracking metrics that proved to be very beneficial, such as convex hull area and spatial density [28]. However, it is not certain if these metrics generalize to all EMR displays. These metrics will thus be further tested in this research. Table 1 contains the full list of the different eye tracking metrics that will be used in this research.
Table 1 List of Eye Tracking Metrics that will be tested Name Explanation Location Metrics
Total Fixations (count) Total number of fixations
required to complete a given task.
Convex Hull area (pixels2) [29]
Minimum convex area which contains the fixation points.
Spatial density [30]
Number of grid cells containing gaze points divided by the total number of cells.
Nearest neighbor index [31]
The ratio between (1) the average of the observed minimum distance between points and (2) the mean random distance expected if the distribution were random.
Directness Metrics
Scanpath length (pixels) The sum of the lengths of
all saccades in a defined period.
Scanpath Ratio
Length of the distance from the center of screen to the target, divided by the scanpath length.
Backtrack rate (/sec) [28]
The backtrack is defined as an angle between two saccades that is greater than 90o.
Rate of transitions (/sec) [28]
Rate of transitions between equal grid cells.
Duration Metrics
Mean fixation duration Mean duration of all
fixations within a defined period
Total Fixations Time The sum of the fixations time

371
Mouse clicks. In addition to eye tracking, data overload may also be analyzed by the number of mouse clicks needed to finish a task. Researchers have used the number of mouse clicks to assess the usability of an interface and have concluded that the larger the number of mouse clicks the less usable this interface would become [32]. Although assessing mouse clicks has proven to be useful in evaluating displays in some applications, there has not been any study for measuring data overload using the number of mouse clicks. The predicted outcome from such a study is that the larger the number of clicks required to finish a task the more the information are present and the more time needed to finish the task.
METHODS A controlled experiment was conducted to gather and evaluate the different suggested metrics in order to identify the most appropriate ones for evaluating data overload. Participants. The participants in this study were 13 residents (6 males and 7 females) from the FM Department at AUBMC. Their average age was 29 years (standard deviation (SD) = 2.68) with an average of 2.46 (SD = 1.00) years of experience in the FM Department. Participants had self-reported normal or corrected to normal vision; contact lenses and glasses were allowed. The eye tracking data of one participant was not collected due to problems with the eye tracker software, resulting in a count of 12 residents for the eye tracking results. Participants’ self-ratings of proficiency had a mean of 4 (SD = 0.39) on a scale of 1 (poor) to 5 (excellent). This study was approved by the AUB Institutional Review Board. Experiment setup. The location of this experiment was the Cognitive Psychology and Human Computer Interaction Lab of the Psychology Department at AUB (Jessup Hall, Room 107), which contains a Tobii T120 eye tracker. The eye tracker is embedded in the computer screen of size 17 inch with a resolution of 1280 x 1024 pixels. Participants were seated at a distance of about 60 cm. Experiment design. The independent variables were the amount of data (low vs. high) and the type of task (a total of 4 different tasks, as determined a preliminary phase). The low-data condition refers to the case where relatively little medical data is present on the display. In this study, this corresponds to the original EMR system. On the other hand, the high-data level condition refers to displays that contain a relatively large amount of poorly-organized and irrelevant data. The high-data display in this study will be the new EMR design. For this experiment, participants had to perform a set of 48 tasks that represent typical patients’ cases in the FM Department. These tasks were one of four types: Task 1 asked participants to review past medical history of the patient, Task 2 asked participants to read previous progress notes, Task 3 required participants to check previous patients’ blood pressure and weight, and finally Task 4 asked participants to check patients’ vaccination reports. Of those 48 tasks, 24 were
performed in the case of low-data display (in other words, with the original EMR system), and 24 were performed in the high-data display case (with the new system). There were six trials of each task (i.e., each task was repeated for six different patients’ scenarios), for a total of 24 scenarios per experimental condition. Each task took a maximum of two minutes. Patients’ names and personal information were fictitious but the actual patient data was real (the data were devoid of any names or identifying information). The order of presentation of the trials was counterbalanced because the same patient was used for the first three trials and to eliminate the learning effect among trials. For each trial of each task, physicians were given some background information on the patient that is relevant to the task at hand. The tasks that were used in this experiment are the ones determined earlier. The first trial of the four tasks is present in Table 2. For each trial, there was one patient to do all four tasks on. The name of the patient associated with each trial is also included.
Table 2. Tasks for trial 1 Tasks for Trial 1: John Doe
1 Before you ask the patient to come into the room,
you want to find his chronic diseases. List his problems.
2
Your patient is presenting for dysuria; when you started to prescribe an antibiotic; he reports that few months ago, around May-June he had similar episode and the doctor gave him medication that caused itching. He did not report it to the clinic. He is afraid to take it again. Please find the antibiotics he was prescribed.
3
The patient is worried about high blood pressure today. Check his previous readings in the clinic. Give examples of previous BP readings and their dates.
4
It is winter time and you want to give him flu vaccine and pneumococcal vaccine. He does not recall if he took them ever. Please check his vaccinations status.
The dependent measures in this phase were response time, error rate, the number of mouse clicks recorded while performing the different tasks, and the various eye tracking metrics listed in Table 1. Physicians had to give their answers orally during the experiment. The time to complete a task, the number of mouse clicks, and the raw eye tracking data were obtained through the Tobii Studios eye tracking system. The eye tracking metrics of Table 1 were then calculated using MATLAB.
Experiment procedure. When the participants arrived to the lab to perform the experiment, they were first given an overview of the experiment and asked to read and sign the consent form. Next, participants were shown the new EMR page and explained how to use it. They were then given the instructions for the experiment and told what the experiment tasks would entail. Each participant was next asked to do a practice scenario with both the original and new EMR pages to

372
become familiar with the experiment process. After this step, the eye tracker was set up and calibrated. This first part of the experiment took around 10 minutes. Once calibration was complete, the experiment started. Participants carried out 24 tasks that corresponded to one of the two data-levels conditions. When all the tasks on that one interface were done, participants were given a 5-minute break and then continued the experiment with the other data overload condition. At the end of the experiment, participants were given a questionnaire in which they were asked to rate the amount of data they perceived on each display, as well as providing ratings of mental workload, among other performance assessment questions.
RESULTS
A. Subjective Measures The subjective metrics were collected for 13 participants using a debriefing post-experiment questionnaire. The results of this questionnaire were analyzed using a Wilcoxon Exact sign test for ordinal data. Results showed that there was no significant difference in participants’ ratings of the amount of data in the two displays (Z = -586, p =0.558), with means of 3.84 (standard deviation (SD) = 0.688) and 3.61 (SD = 1.04) for low-data and high-data displays respectively, on a scale of 1 (poor) to 5 (excellent). On the other hand, results showed that there was a significant difference in the mental workload (Z = - 2.04, p = 0.041) with means of 3.3 (SD = 1.3) and 2.46 (SD = 0.877) for the low-data and high-data displays, respectively on the same scale. Other than the amount of data and the mental workload required for both displays, participants were asked to point out which display was easier to handle. All except two participants indicated that the high-data display was easier to work with. Of the remaining two, one indicated that the low-data display is easier and the other indicated that they were both the same. B. Performance Measures As for the performance measures, the studied metrics in this research were the response time, error rate, and number of mouse clicks needed to complete each task. Error rate was omitted as all participants performed their tasks correctly. The other performance measures were averaged across the six trials for each participant and each task. The performance data was analyzed using a repeated-measures analysis of variance (ANOVA). The assumptions for the ANOVA procedure were tested for each response measure and each task. Note that since every task has its own display and its own procedure, the differences between measures across the tasks were not compared. The ANOVA results that showed significant difference can be found in Table 3. C. Eye Tracking Metrics Finally, for the eye tracking metrics, they were collected for 12, rather than 13 participants, due to complete eye tracker device failure for one participant. Due to tracking and recording problems, for 2 participants, a total of 10 entries were excluded.
As with the performance measures, the data was analyzed using a repeated-measures ANOVA.
The results of the ANOVA procedure for the metrics that showed significance can be seen in Tables 4.
Table 3. Performance metrics ANOVA results for all the tasks
Performance Metrics
Low-Data Display
Mean (SD)
High-Data Display Mean (SD)
Effect of Task level
Task 1
Response Time (sec)
6.39 (1.69)
4.76 (2.24)
F (1,12) = 5.546,
p = 0.038 0.313
Mouse clicks (count)
0.40 (0.098)
0.69 (0.16)
F (1,12) = 9.836,
p = 0.009 0.45
Task 2
Mouse clicks (count)
14.78 (4.74)
8.85 (4.58)
F (1,12) = 10.717,
p = 0.007 0.472
Task 3 No significant results Task 4
Mouse clicks (count)
2.68 (0.60)
2.26 (0.40)
F (1,12) = 7.081,
p = 0.021 0.371
Table 4. Eye tracking metrics results
Eye Tracking Metrics
Low-Data Display
Mean (SD)
High-Data Display Mean (SD)
Effect of Task level
Task 1 Mean
Fixation Duration (millisecond)
126.57 (68.73)
96.66 (37.87)
F (1,11) = 0.447,
p = 0.025 0.378
Task 2 Mean
Saccade Length (pixels)
58.37 (18.90)
50.75 (13.70)
F (1,11) = 5.263,
p = 0.042 0.324
Convex Hull Area (pixels^2)
280855.43 (47459.28)
226138.60
(66561.86)
F (1,11) = 5.266,
p = 0.042 0.051
Task 3

373
Scanpath Ratio (pixels/sec)
55.53 (19.85)
42.93 (21.98)
F (1,11) = 5.058,
p = 0.046 0.315
Mean Saccade Length (pixels)
70.86 (21.24)
63.17 (20.13)
F (1,11) = 5.887,
p = 0.034 0.349
Task 4 Mean
Saccade Length (pixels)
71.65 (21.96)
65.31 (17.63)
F (1,11) = 4.744,
p = 0.049 0.301
Convex Hull Area (pixels^2)
204511.69 (20855.20)
183652.55
(25531.58)
F (1,11) = 5.1,
p = 0.045 0.317
DISCUSSION AND CONCLUSION
This study represent work in progress, with the results currently being further analyzed in order to determine which of these metrics best correlates and predicts performance. However, even at this early stage, the results suggest several findings. First, it appears that the new and supposedly higher-data interface is the one that physicians prefer, according to the subjective ratings of workload, although in both cases the ratings of workload were very low. Moreover, physicians picked out the high-data display as easier to work with, which suggests that any negative effects of clutter are counteracted by the ease of use.
This finding was supported in part by the mouse clicks. In two tasks, mouse clicks were significantly less in the high-data display than in the low-data display. For Task 1, the mouse clicks were too few to be able to obtain much information. Finally, the eye tracking metrics were also consistently lower in the high-data display, indicating that that display is more efficient and easy to use. There did not appear to be any negative effects of data overload. The next step in this research is to correlate these different metrics to the ground truth of response time in order to determine which of them is best suited for evaluating data overload in EMRs and other complex displays. At this point, they have already proven useful in pointing out that what seems to be a high-data display is actually more usable and beneficial than initially expected.
REFERENCES
[1] A. L. Alexander, E. M. Stelzer, S.-H. Kim, and D. B. Kaber, “Bottom-up and Top-down Contributors to Pilot Perceptions of Display Clutter in Advanced Flight Deck Technologies,” Proc. Hum. Factors Ergon. Soc. Annu. Meet., vol. 52, no. 18, pp. 1180–1184, 2008.
[2] K. Yang, S. Member, E. Y. Du, S. Member, E. J. Delp, P. Jiang, and Y. Chen, “A New Approach of Visual Clutter Analysis for
Pedestrian Detection,” 16th Int. IEEE Conf. Intell. Transp. Syst. (ITSC 2013), vol. 1, no. Itsc, pp. 1173–1178, 2013.
[3] H. Singh, C. Spitzmueller, N. J. Petersen, M. K. Sawhney, and D. F. Sittig, “Information Overload and Missed Test results in Electronic Health record-based Settings,” Jama, vol. 167, no. 2, pp. 187–188, 2013.
[4] C. D. Wickens and V. Schons, “Visual Separation and Information Access in Aircraft Display Layout,” 1993.
[5] M. R. Beck, M. C. Lohrenz, and J. G. Trafton, “Measuring search efficiency in complex visual search tasks: global and local clutter.,” J. Exp. Psychol. Appl., vol. 16, no. 3, pp. 238–250, 2010.
[6] H. L. Farley, K. M. Baumlin, A. G. Hamedani, D. S. Cheung, M. R. Edwards, D. C. Fuller, N. Genes, R. T. Griffey, J. J. Kelly, J. C. McClay, J. Nielson, M. P. Phelan, J. S. Shapiro, S. Stone-Griffith, and J. M. Pines, “Quality and safety implications of emergency department information systems,” Ann. Emerg. Med., vol. 62, no. 4, pp. 399–407, 2013.
[7] A. L. Alexander, D. B. Kaber, S.-H. Kim, E. M. Stelzer, K. Kaufmann, and L. J. Prinzel, “Measurement and Modeling of Display Clutter in Advanced Flight Deck Technologies,” Int. J. Aviat. Psychol., vol. 22, no. 4, pp. 299–318, 2012.
[8] R. Rosenholtz, Y. Li, and L. Nakano, “Measuring visual clutter,” J. Vis., vol. 7, no. 2, pp. 17.1–22, 2007.
[9] N. Moacdieh and N. Sarter, “Clutter in Electronic Medical Records: Examining Its Performance and Attentional Costs Using Eye Tracking,” Hum. Factors J. Hum. Factors Ergon. Soc., vol. 57, no. 4, pp. 591–606, 2015.
[10] S. Zakaria and M. K. A. Ghani, “The Impact of EMR User Interface Design on Doctor Satisfaction,” e-Proceeding Softw. Eng. Postgraduates Work., p. 94, 2013.
[11] J. T. James, “A new, evidence-based estimate of patient harms associated with hospital care.,” J. Patient Saf., vol. 9, no. 3, pp. 122–8, 2013.
[12] L. Kohm, J. Corrigan, and M. Donaldson, “To err is Human: Building a Safer Health Care System,” Inst. Med., pp. 26–48, 2000.
[13] B. T. Karsh, M. B. Weinger, P. A. Abbott, and R. L. Wears, “Health information technology: fallacies and sober realities,” J Am Med Inf. Assoc, vol. 17, no. 6, pp. 617–623, 2010.
[14] N. M. Moacdieh and N. B. Sarter, “Eye Tracking Metrics: A Toolbox for Assessing the Effects of Clutter on Attention Allocation,” Proc. Hum. Factors Ergon. Soc. Annu. Meet., vol. 56, no. 1, pp. 1366–1370, 2012.
[15] F. Bobillo, M. Delgado, and J. G??mez-Romero, “Representation of context-dependant knowledge in ontologies: A model and an application,” Expert Syst. Appl., vol. 35, no. 4, pp. 1899–1908, 2008.
[16] K. W. Hammond, E. N. Efthimiadis, and R. J. Laundry, “Efficient de-identification of electronic patient records for user cognitive testing,” Proc. Annu. Hawaii Int. Conf. Syst. Sci., pp. 2771–2778, 2011.
[17] C. R. Weir, J. J. R. Nebeker, B. L. Hicken, R. Campo, F. Drews, and B. LeBar, “A Cognitive Task Analysis of Information Management Strategies in a Computerized Provider Order Entry Environment,” J. Am. Med. Informatics Assoc., vol. 14, no. 1, pp. 65–75, Jan. 2007.
[18] Q. Zeng, J. J. Cimino, and K. H. Zou, “Providing Concept-oriented Views for Clinical Data Using a Knowledge-based System: An

374
Evaluation,” J. Am. Med. Informatics Assoc., vol. 9, no. 3, pp. 294–305, 2002.
[19] R. Zhang, S. Pakhomov, B. T. McInnes, and G. B. Melton, “Evaluating measures of redundancy in clinical texts.,” AMIA Annu. Symp. Proc., vol. 2011, pp. 1612–20, 2011.
[20] L. Wu, Z. Zhu, H. Cao, and B. Li, “Influence of information overload on operator’s user experience of human–machine interface in LED manufacturing systems,” Cogn. Technol. Work, 2015.
[21] G. Duftschmid, C. Rinner, M. Kohler, G. Huebner-Bloder, S. Saboor, and E. Ammenwerth, “The EHR-ARCHE project: Satisfying clinical information needs in a Shared Electronic Health Record System based on IHE XDS and Archetypes,” Int. J. Med. Inform., vol. 82, no. 12, pp. 1195–1207, 2013.
[22] D. R. Murphy, B. Reis, D. F. Sittig, and H. Singh, “Notifications Received by Primary Care Practitioners in Electronic Health Records: A Taxonomy and Time Analysis,” Am. J. Med., vol. 125, no. 2, pp. 209.e1–209.e7, 2012.
[23] T. T. Van Vleck, D. M. Stein, P. D. Stetson, and S. B. Johnson, “Assessing data relevance for automated generation of a clinical summary.,” AMIA Annu. Symp. Proc., pp. 761–5, 2007.
[24] A. D. Andre and C. D. Wickens, “When Users Want What’s not Best for Them,” Ergon. Des. Q. Hum. Factors Appl., vol. 3, no. 4, pp. 10–14, 1995.
[25] A. Poole and L. J. Ball, “Eye Tracking in HCI and Usability Research,” in Encyclopedia of Human Computer Interaction, 2006, pp. 211–219.
[26] K. K. E. Ellis, “Eye tracking metrics for workload estimation in flight deck operations,” ProQuest Diss. Theses, vol. 1467693, p. 115, 2009.
[27] G. J. Zelinsky and D. L. Sheinberg, “Eye movements during parallel-serial visual search.,” J. Exp. Psychol. Hum. Percept. Perform., vol. 23, no. 1, pp. 244–262, 1997.
[28] J. Goldberg and X. Kotval, “Computer Interface Evaluation Using Eye Movements: Methods and Construct,” Int. J. Ind. Ergon., vol. 24, no. 6, pp. 631–645, 1999.
[29] M. Hegarty, K. De Leeuw, and B. Bonura, “What do spatial ability tests really measure,” in 2008, November.
[30] L. Cowen, L. J. Baht, and J. Delin, “Usability,” 2002. [31] F. Di Nocera, M. Camilli, and M. Terenzi, “A Random Glance at the
Flight Deck: Pilots’ Scanning Strategies and the Real-Time Assessment of Mental Workload,” J. Cogn. Eng. Decis. Mak., vol. 1, no. 3, pp. 271–285, 2007.
[32] A. J. DeWitt and J. Kuljis, “Aligning usability and security: a usability study of Polaris,” SOUPS ’06 Proc. Second Symp. Usable Priv. Secur., pp. 1–7, 2006.

375
Optimal Time and Cost Balance in Project Risk Management Hussein El Hajj Abstract- In almost all real-life projects, activity durations are not known with certainty. Therefore, adopting a schedule that ensures the successful completion of a project on time with a high probability is critical. This often requires, starting the project activities as soon as possible, while abiding by precedence constraints, as advocated by the classical methods of CPM and PERT. However, from a cost control and financing prospective, performing an activity in early stages of a project may not be the best course of action. On the contrary, the present worth criterion advocates starting activities as late as possible, to save on financing costs. The present research is aimed at determining the optimal start time of activities in a project network while accounting for both time value of costs and the risk of scheduling delays. A mathematical program is developed to find the optimal starting time of each activity under different structures of the project network topology, while assuming that the activity durations approximately follow independent normal distributions. For “simple” networks, involving parallel non-overlapping paths, a fully tractable expected cost model was developed that gives the project present worth as a function of the start times of different activities. For these parallel-path networks, this paper establishes the quasiconvexity of the cost function, and develops bounds on the optimal delay of each activity. This allows determining the optimal schedule easily in practice, using, for example, basic spreadsheets. For more complex networks, with paths having common activities and experiencing “merge-bias,” this paper proposes an extension of the classical PERT method to carry the desired analysis. PERT-X, where the distribution of the maximum path in the project is approximated based on a well-calibrated normal distribution, which depends among other things on the path covariance matrix. The remainder of the analysis then proceeds in a similar manner to more simple networks.
1. Introduction and Motivation “Time is money” as Benjamin Franklin said. In project management, this quotation is supported by the Triple Constraint Triangle shown in figure 1 [13]. Time, Cost and Scope constitute these constraints that every project should meet to some extent for it to be a successful project. Keeping scope aside and assuming infinite resources, time and cost are negatively correlated. In other words, to be on time, some costs need to be sacrificed since starting an activity late will decrease the expected present value of activities cost, it will however increase the risk of delaying the
project. Reciprocally, starting an activity too early will increase the expected present value of the cost, but it will minimize the delay risk. This makes finding the optimal start time a challenging problem that has been largely ignored in the project management literature. Finding a simpler approach to measure the amount by which each activity should be delayed would be a great contribution to project management. Therefore, this paper discussed such method starting with simple network compromising parallel activities and activities in series. Then the PERT-X was discussed, as to facilitate the computation of the probability of being late for networks with correlated paths. Finally, this paper described such network and how to approach them.
Figure 1
2. Literature Review 2.1. Pert Variations Project scheduling is a key for the success of any project. Critical Path Method and Project Evaluation and Review Technique are the two major tools in project scheduling. PERT is an improvement of CPM, since it is a probabilistic approach for activity durations, [3]. While both tools focus on the critical path, PERT assumes activity durations that follow PERT-Beta distribution based on three PERT times; minimum(a), maximum(b) and most likely(m). The mean and variance of each activity could be computed as follows: Mean ( 4 )/6a m b and
2 2( ) /36Variance b a , [11]. The expected time and the variance of a path are the sum of the expected time and variance of all activities on this path. The path with the longest duration is considered the critical path and is used to compute the probability of being late, thus, PERT assumes that this path follows a normal distribution with mean and variance as the sum of the means and variances on this specific path, [4]. One major drawback of PERT is that it underestimates the real completion time of a project, since it neglects the fact that some noncritical paths may become critical. Many previous attempts were made to improve the outcome of PERT by introducing the multivariate normal distribution. Some of them used simulation techniques to compute the probabilities like [6]. Others expressed a formula to compute the probability, [7]. Some others expressed a mean and a variance for the whole network, as did [5]. On the other hand, [8] claimed a new method to compute the

376
probability of being late without using multivariate distributions. 2.2. Time-Cost Trade-Off Previously, multiple papers aimed to find an optimal way to maximize the net present value of a project without taking into consideration duration uncertainty, [10]. On the other hand, some took into consideration this uncertainty but without giving much importance for the probability of being late. In their paper [9] they discussed how to find the optimal starting time of each activity assuming exponential distribution, showing the importance of delaying an activity and how to compute the duration in which each activity was delayed and what is its NPV. They assumed continuous compounding and assumed that activities follow exponential distribution.
3. Project with Two Parallel Paths 3.1. Formulation The network discussed in this section is represented in figure 2. The duration of both activities A and B are assumed to be normally distributed with (T )E i i and
2Var(T )i i for ,i A B . The cost of each
activity is C i and it is paid at the beginning of the activity. The objective is to minimize the expected present value of the costs. Therefore, the more an activity is delayed the smaller the present value is. For this Project the Expected present value is computed as
follows: ,
rd rd rdi A BP C e C e C ei A Bi A B
, where
r is the annual rate of return and id is the delay time of activity I or in other words it is the start time of activity I for this simple network. the optimization problem of this network is formulated in the following
manner:
(
min : E,
s. :) ( )0 0
rd rd rdi A BP C e C e C ei A Bi A B
d dA A B Btt t
A B
where is the probability that the project is
completed without any delay and 0t is the assigned time to complete the project.
Figure 2
3.2. Solution Method
The completion time iPT of a specific path Pi is
assumed to be normally distributed with mean
(P )i i iE d and variance 2Var(P )i i .
Theorem 1: for any two parallel paths network
300
10 t
t d tA A A A AB
B
Proof: The empirical rule of normal distribution tells us that 99.7% of the data falls within 3 standard deviations of the mean. Therefore, it can be stated that
the maximum time required to complete Pi is 3di i i . Since the present value of an activity costs
decrease if this activity was delayed, therefore, 3 0d ti i i and equivalently 30d ti i i . In
addition, since ( ) ( )0 0d dA A B BA B
t t
therefore, it can be stated that Ad and Bd are negatively correlated. Thus, it can be stated that the maximum
value for Ad is when Bd is zero. Back to the optimization problem, [14] provided an approximation to the normal distribution CDF as
follows: 1.31.2( ) 1 0.5 zZ e , it can be generalized to
( )0( )
1.31.2
1 0.50di i
di i ie
tt
i
. Lemma 1
gives proof that the constraint is binding, therefore, using Lemma 1 and the approximation described above it can be stated as
11.3
1 ln 20 1.2 ( ) 1.31.2
0.5 0 20
. 5
d A A AdB
Be
tt B
therefore, obtaining an unconstrained optimization with objective function
11.3
1.31.2
0.
1 ln
5 0.
20 1.2 (02
)
5
r A AdB B
Be
rdBP C e C eA B
tt
.
A convexity proof is found in Lemma 2, therefore in
Start Finish A
B

377
order to solve the optimization problem, 0P
dB
should be computed, and find the optimal solution of dB and d A . 3.3. Example As an example, the values in table 1 were assigned for
activity A and activity B. Also 300t and 10%r . Table 1
Activity Mean Variance Cost A 2 1 15 B 20 4 10
The upper and lower bounds for the delay along with the optimal value of the delay as described in section 2.2, are found in table 2. Note that path 1 contains activity A with its delay and path 2 contains activity B with its delay. The optimal cost was found to be 6.34 and the probability of being on time was 0.95. Table 2
Path Mean Variance Lower Upper Optimal 1 27.91 1 25 26.36 25.34 2 26.3 4 4 6.71 6.64
4. Projects with One Path for Multiple Activities In this section, we will deal with a single path for multiple activities as shown in figure 3.
Figure 3 Theorem 2: for multiple activities in series, the delay should be placed at the beginning. Proof: the expected value and the variance of the path are independent of the place of the delay, but the net present value of the cost will decrease if this delay was placed at the beginning of the path. In this network, all the activities will be treated as a single activity of mean and variance, that is the summation of the means and variances of all activities Ai to compute the probability of being late. Using the
Moment Generating function of a normal distribution and the fact that the activities are assumed to be normally distributed, the optimization problem can be formulated in the following manner:
1 1 2 20.51 1 1min :
1
1 1s .
1
0:
i ir d rA AJ AJn j j
P C eAiin
dA Aii
i
t
t nAi
5. Projects with Multiple Parallel Paths for Multiple Activities each 5.1. Formulation In this section, a combination of section 2 and 3 will be treated, where the network has multiple parallel pathes and on each path, there are multiple activities in series as shown in figure 4. As stated in theorem 2, for each path, all the activities can be replaced by one. Therefore, the optimization problem can be formulated in the following manner:
Figure 4
1 1 2 20.511 1min :
1
1 1s .
1
0:
i ir d rK KN n J KJj jP C eAik A i
ndk kiN i
nk AKi
i
tt
5.2. Solution Method Let
1i
n
k ki
and 2 2
1i
n
k ki
, theorem 1 can be used
to compute lower and upper bounds for the delays.
1
1
00 03
( )k k k k ki
ii k
tt
d t
,
again, using the approximation of normal CDF and the constraint above as well as Lemma 1 it can be stated that
1 ln 20 1.2
11.3
1.3111.2
0.5 0.25
( )0d A A A
dk k
k
tt
k Ae
replacing 1
d A in the unconstrained objective function
and solving numerically to find the optimal solution for the delays, convexity is proven in Lemma 2.
Start Finish A1 A2 ....
An
Start Finish A1 A2 .....
An
...
.. B1 B2 Bn
N1 N2 .....
Nn
.
.
.
.

378
5.3. Example As an example, the values in table 1 were assigned for
all activities in the network. Also 350t and 10%r . Table 3
Path Activity Mean Variance Cost 1 A1 2 1 15 1 A2 20 4 10 2 B1 1 1 5 2 B2 5 2 8 2 B3 8 3 14 3 C1 3 2 4 3 C2 6 4 9 3 C3 1 1 3 3 C4 9 4 12 4 D1 18 5 15
The upper and lower bounds for the delay along with the optimal value of the delay as described in section 4.2, are found in table 4. Table 4
Path Mean Variance Lower Upper Optimal 1 30.31 5 6.29 9.32 8.31 2 29.09 6 13.65 16.97 15.09 3 28.01 11 6.05 10.54 9.01 4 29.57 5 10.29 13.32 11.57
The optimal expected net present value of the cost was found to be 26.01 and the probability of being on time was 0.95.
6. PERT-X 6.1. Formulation In their paper, [12], expressed a method to compute the expected time of a digital circuit. This method consists of finding the expected value of maximum and minimum of correlated Gaussian random variables. However, since PERT assumes normality of paths, applying this approximation in a network to compute the probability of being late would be a great contribution. This implementation works as follows: first compute the mean and variance of each path, then choose a specific loop in this network. Define all the paths that contain this loop and specify the covariance between these paths. This loop will vanish and each two correlated paths that contains it will turn into one path having the following mean and variance.
1 2 2 1 1 2( ) 1 2E X
2 2 2 2 21 2 2 11 1 2 2
1 21 2
E X
Mean = ( )E X and variance = 22E X E X .
Where i and 2i are the mean and variance of path i,
2 2 2 1 21 2 continue with the same steps until ending up with a single path. The reason of the choice of this method is the ease of its computations and that it provides a mean and variance which facilitate solving the optimization problem later-on. 6.2. Example As an example, the network in [1] will be discussed. Table 5 summarizes the network. Table 5
Path Name Mean Variance 1 ABCDGHM 40 11.22 2 ABCEHM 31 9.67 3 ABCEFJKN 43 8.00 4 ABCEFJLN 44 9.00 5 ABCIJKN 41 7.56 6 ABCIJLN 42 8.56
Loop JKLN was chosen to start with, this loop is found in the two pairs of paths (3,4) and (5,6). Therefore, these two pairs will be converted into two paths named 3’ and 4’ resulting in a network of 4 paths only. Next step would be loop CEIJ, this loop is found in the pair of the newborn paths turning them into a single path named 3’’. Paths 2 and 3’’ have in common the loop EHMN. Similarly, these two paths are combined into path 2’. Finally left with loop CDEH, path 1 and 2’ are combined into a single path 1’ which summarize the network. This path 1’ has a mean of 44.26 and a variance of 8.32. For each step, the mean and variance are computed as described in the previous section. To verify the results of this method, the probability of being late for different project, the assigned time was compared between PERT-X results, the results from the simulations and the results using one of the methods that [8] proposed. The results are summarized in table 6. Table 6
t Simulation PERT-X PERT IA Pert-IA 40 0.94 0.93 0.91 1.00 0.92 42 0.77 0.78 0.75 0.98 0.78 44 0.53 0.54 0.50 0.82 0.55 46 0.26 0.27 0.25 0.46 0.28 48 0.10 0.10 0.09 0.16 0.10
7. General Network 7.1. Formulation Till now only networks with independent paths were discussed, this section will be dealing with a network of two correlated paths as shown in figure 5.
Figure 5
Start Finish B
C A D

379
To formulate the optimization problem, the moment generating function was used to compute the expected net present value of the costs in a similar way as section 3. Furthermore, to compute the probability in the constraint it is necessary to find the mean and the variance as stated in section 5.1, this section is also used in the objective function as will be shown in the following section. The optimization problem can be stated as follows:
2 2 2 2( ) ( )
2 2min : E( )
2 2,( ( , ) )2
( , )0 1 2s . :,1 2
r rA Ar d d r d dA A B A A CrdAP C e C e C eA B C
rT TAB ACr E T T dAB AC DC eD
t E T TtT T
Where 1 2( , ) ( )1 2 1
2 1( )2
1 2
d d d d d dA B D A C DE T T d d dA B D
d d d d d dA C D A B Cd d dA C D
d d d d d dA B D A C D
1T , 1 and 21 are the total time, mean and variance of
the first path compromising activities A, B and D.
2T , 2 and 22 are the total time, mean and variance of
the second path compromising activities A, C and D.
2 2 2 1 2( , ) ( )1 2 1 1
2 2 2 1( )2 2
1 2( ) ( )1 2
d d d d d dA B D A C DE T T d d dA B D
d d d d d dA C D A B Cd d dA C D
d d d d d dA B D A C Dd d d d d dA B D A C D
( , ) ( )'
( )'
'
d d d dA B A B A C A CE T T d dAB AC A B A B
d d d dA C A C A B A Bd dA C A C
d d d dA B A B A C A C
2 2 2 2( , ) ( )'
2 2 2( )'
( ) ( )'
d d d dA B A B A C A CE T T d dAB AC A B A B A B
d d d dA C A C A B A Bd dA C A C A C
d d d dA B A B A C A Cd d d dA B A B A C A C
22 2( , ) ( , )1 2 1 2,1 2E T T E T TT T
222 , ,, E T T E T TAB AC AB ACT TAB AC
7.2. Solution Method To solve this network, it is necessary to find a way to simplify the long computations. Therefore, the following theorem was proven Theorem 3: in any network, where the activities taking the parallel form and making a loop, only the activity with the highest mean is delayed. Also, in the activities taking the series form without making any loop, only the first activity should be delayed. For this network, activity D should not be delayed and either B or C should be delayed (the one with the highest mean).
Proof: First Assume d aA , d bB , d cC , d dD
and B C , then assume d a b dA , 0dB ,
d c bC , 0dD . ( , )1 2E T T , 2( , )1 2E T T ,
,E T TAB AC and 2,E T TAB AC
are not affected, but
the expected net present value of the cost decreased.
Therefore, since 0dB and 0dD , and based on the constraint function it can be found that
1 ( )0 , 11 2
( )2
dB C Cd tA T T
d dC C B B C CdC
Thus, if the value of d A is replaced in the objective function, an unconstrained single variable optimization problem is obtained. 7.3. Example As an example, the values in table 7 were assigned for
the activities of the network in figure 5. Also 300t
and 10%r . Table 7
Path Activity Mean Variance Cost 1,2 A 4 1 10 1 B 10 4 8 2 C 6 2 5 1,2 D 5 2 12
The optimal delay of activity A and C were found to be 6.61 and 2.95 and the optimal expected net present value of the cost was 10.71.
8. Real-Life Project 8.1. Formulation In this section, a real-life complex network with multiple correlated paths suggested by [15] is discussed. As per sections 3 and 5.1 the optimization problem can be formulated in the following manner:
2 2
min : E( ) 2
0s . :
rTirE TiP C eii
t Et
Where iE T and 2iT are the mean and variance of
the total time till the starting date of activity i, iC is the cost of activity i. E and are the mean and standard deviation for the total duration of the project. 8.2. Solution Method Using PERT-X iE T , 2
iT , E and were computed
for all activities as well as the entire project.

380
Let id be the delay of activity i, then activities P,Q and R have higher mean than activity O, activities M and N have higher mean than activity L, activity I has higher mean than activities H and J, activity E has higher mean than activity C and finally activity B has higher mean than activity D, therefore, according to theorem 3, activities B, E, I, M, N, P, Q and R should not be delayed. In addition, activities F, G and K are in series with activity A and other loops therefore should not be delayed. Thus, only activities A, C, D, H, J, L and O can be delayed. Similar to section 7, Adcould be computed in terms of all other id and could be replaced in the objective function to obtain an unconstrained optimization problem. 8.3. Example
Taking 500t , 10%r and 12i iC , the following
optimal delays were found and summarized in table8. Table 8
Activity id Activity id Activity id
A 3.28 G 0.00 M 0.00
B 0.00 H 9.06 N 0.00
C 2.64 I 0.00 O 6.01
D 0.84 J 9.00 P 0.00
E 0.00 K 0.00 Q 0.00
F 0.00 L 5.09 R 0.00 The optimal net present value of the project was found to be 121.27.
9. Conclusion This paper showed first the importance of delaying activities while maintaining a certain probability of being on time. Furthermore, a method used in circuits was applied in project management to facilitate the computation of the probabilities. In addition, this paper presented a new method to compute the optimal delay for each activity in different types of networks. Moreover, it is to note that the different methods presented in this paper could be combined to solve more complex networks. This paper’s results are sought to make a useful contribution in understanding the trade-off between time and cost in project risk management. Additionally, the analysis of PERT-M and PERT-X, while not completely novel, constitutes a side-contribution to project schedule risk analysis, which offers computational improvements on the commonly-used Monte Carlo simulation. References [1] Hillier, F. S., & Lieberman, G. J. (2005). Introduction to operations research (8th ed.). Boston: McGraw Hill, pp. 472-514.
[2] Bazaraa, M. S., Sherali, H. D., & Shetty, C. M. (2006). Nonlinear programming: Theory and algorithms (3rd ed.). Hoboken, N.J: Wiley-Interscience, pp.97-159. [3] Paul, A., & Banerjee, A. (2008). On path correlation and PERT bias. European Journal of Operational Research, 189(3), 1208-1216. [4] Robillard, P., & Trahan, M. (1977). The completion time of PERT networks. Operations Research, 25(1), 15-29. doi:10.1287/opre.25.1.15 [5] Sculli, D., & Shum, Y. W. (1991). An approximate solution to the pert problem. Computers and Mathematics with Applications, 21(8), 1-7. doi:10.1016/0898-1221(91)90046-7 [6] Sculli, D. (1989). A simulation solution to the PERT problem. IMA Journal of Management Mathematics, 2(3), 255-265. doi:10.1093/imaman/2.3.255 [7] Anklesaria, K. P., & Drezner, Z. (1986). A multivariate approach to estimating the completion time for PERT networks. The Journal of the Operational Research Society, 37(8), 811-815. doi:10.1057/jors.1986.140 [8] Hmadh, M. A., & American University of Beirut. Faculty of Engineering and Architecture.Department of Industrial Engineering and Management.PERT-IA: A new heuristic for schedule risk analysis in project management [9] Buss, A. H., & Rosenblatt, M. J. (1997). Activity delay in stochastic project networks. Operations Research, 45(1), 126-139. doi:10.1287/opre.45.1.126 [10] Elmaghraby, S. E., & Herroelen, W. S. (1990). The scheduling of activities to maximize the net present value of projects. European Journal of Operational Research, 49(1), 35-49. doi:10.1016/0377-2217(90)90118-U [11] Davis, R. (2008). Teaching project simulation in excel using PERT-beta distributions. INFORMS Transactions on Education, 8(3), 139. [12] Nadarajah, S., & Kotz, S. (2008). Exact distribution of the Max/Min of two gaussian random variables. IEEE Transactions on very Large Scale Integration (VLSI) Systems, 16(2), 210-212. doi:10.1109/TVLSI.2007.912191 [13] Haughey, D. (2011, December 19). Understanding the Project Management Triple Constraint. Retrieved March 10, 2017, from https://www.projectsmart.co.uk/understanding-the-project-management-triple-constraint.php [14] Zogheib, B., & Hlynka, M. (n.d.). Approximations of the Standard Normal Distribution. [15] Stevenson, W. J., Nsakanda, A. L., & Ozgur, C. (2009). Introduction to management science with spreadsheets (1st ed.). Toronto: McGraw-Hill Ryerson, pp. 362-373.
Acknowledgments: I would like to express my special thanks of gratitude to Prof. Bacel Maddah, who provided me with all the support while conducting this research.

381
Appendix Lemma 1
,rdiP C ei
i A B
and
( )0i
iZ rd
rC eid
.
Therefore, Z is strictly decreasing with respect to di .
Assume *di are the optimal solution s.t: *( )0 i i
ii
t d
then, equivalently
*( )0*( )0
1
1 11
1
t d
t di iii
i
Let and
1.31 11.2
*
*0
1( )
1
t d
X e
. Using the
normal distribution CDF approximation by [14]: 1 3
0.
( )1.20 5) 1 0.( i i
i
d
i i
i
td et
therefore, *1 0.5 1 (0
1
*)X i it d
iii A
Let
*2'* 11 1XX
thus, *'*1 ( )00.5 1 i iXii
t
i
d
A
,
also let
1.31 11.2
'*(0* 1
)'1
t d
X e
.
Now * 01 0.5 1X since it is a probability, therefore,
equivalently * 21X , * *1 21 1X X ,
*2* 1
1 1X
X
and finally * '*1 1X X . Then it can be
shown that 1.3 1.3* '*
1 1 1 11.2 1.21
( ) ( )011.2 1.2
0d d
e ee e
t t
* '*1 1( ) 1 1 )01 1
(0t td d
and '* *1 1d d . Thus,
'* * * *1 11 1
1 1
rd rd rd rdi iC e C e C e C ei ii i
i i
Which
contradicts the fact that 𝑑𝑑1∗ and 𝑑𝑑2∗ are the optimal solutions. Therefore, the constraint can be switched to:
*( )0 i iii
t d
.
Lemma 2
Let ( )0
1.31.2
( ) 0.5 0.25
t dB BBf d eB
, therefore,
1.31.20.3
1' ( ) (0.25)(1.2)(1.3
)0
)
(( )0
dB Bd BB Bf d eB B
t
B
t
and ( )0
1.31.22 0.7
1'' ( ) (0.3)(0.25)(1.2)(1.3)
212 2(0.25)(1.2) (
( )0
( )1. 03)
dB Bd BB B
ttf d eB B
dB BB
t
B
B
Assume 0.611 and ''( ) 0f dB , therefore, equivalently
(1.3
1 5. )2 00 dB BB
t
0. 810 2dB B Bt
. According to section 5.2 it can be stated that
( )0
10d tB B B i
i
t
i B
because of the upper-
bound discussed previously. Thus, for '' ( ) 0f dB to hold the following inequation should hold
1 0.280 0(1
)0t B B B BdA A
A
tt
Equivalently ( )00.611
dA At
A
, this statement will
hold if 0.611 , since a probability is always less than 1. Therefore, it can be concluded that
( )01.3
1.2( ) 0.5 0.25
t dB BBf d eB
is concave.
Since,
1.31.2
0.5 0
( )
. 50
2
t di iie
is concave and
ln(x) is a non-decreasing concave function therefore
per [2],
1.31.2 ( )
ln 0.5 0.20
5
t di iie
is concave.
In addition, the sum of concave functions is concave.

382
Thus,
1.31.2
ln 0.
( )05 0.25
di iie
ii A
t
is
concave. Since, xe is a non-decreasing function,
therefore,
1.31.2 ( )0
0.5 0.25
di iie
ii A
t
is
quasiconcave, any concave function is also quasiconcave and since it is the product of probabilities the it is positive. Therefore, it can stated
that 1.1
( )03
1.20.5 0.25
di iie
ii A
t
is
quasiconvex. In addition, the negative of a quasiconvex function is quasiconcave therefore,
1.31.2
2( )
250
0.5 0.
t di iie
ii A
is
quasiconcave. It follows that
1.31.2
0.5 0.2
ln 2)0
5
( di iie
iA
t
i
is
quasiconcave. Therefore, According to [2], the following can also be considered quasiconvex,
1.1
3ln 2
1.1.2
0.5 0.25
2 ( )0 di iie
i
t
i A
. In
addition, 1
1.3( )f x x is a non-decreasing function, combined to a quasiconvex function provide a quasiconvex function, according to [2], thus,
1.31.2
0.5 0.25
11.3
1 ln 21.2 ( )0 di i
iei
i
r At
A
is
quasiconvex. xe , is a non-decreasing function, thus
1.31.2
11.3
1 ln 20 1.
0.5 0.25
2 ( )0t
tr A A
di iie
ii A
C eA
is quasiconvex. Since the sum of 2 quasiconvex functions is quasiconvex, therefore,
11.3
1 ln 20 1. 1.31.2
0.5 0.
2 (
2
)05
r A Adi i
iei
i ArdiP C e C eiA i
i
tt
A
is quasiconvex.

383
Optimization of Piezoelectric Wafers Network for Structural Health Monitoring Based on Mixed Integer Non-Linear
Programming Approach
Rafic Itani1
1 Industrial Engineering and Management, American University of Beirut, Beirut, Lebanon
Abstract
This paper presents a novel approach for network optimization of piezoelectric elements towards the application in the field of structural health monitoring. A mixed integer nonlinear program is formulated and tested on plates of different geometries. The objective function of the proposed algorithm was to maximize the coverage of the area understudy described by a set of control points. The control points should be covered with a user defined number of PZT wafers through the optimization of the PZT wafer locations along the area of interest. Streamlined Modelling for Real Optimization (AMPL) has been used to code the algorithm and selected simulation cases have been executed to demonstrate the efficiency of the proposed optimization algorithm. The proposed algorithm was capable of optimizing PZT wafer networks over convex surfaces. The algorithm introduced new optimization parameters such as coverage Levels 2 and 3, in addition to areas of concentrated coverage, varied problem solving computational time and the flexibility of changing a wide range of problem parameters such as the number of piezoelectric wafers, their coverage range and the number of control points studied while providing very robust solutions via the Bonmin solver. The tractability of the model proposed was improved by feeding the solver an initial solution that made the branch and bound technique less extensive. Data fusion was conducted and normalized for the areas having the control points in order to determine the coverage areas provided by the optimized PZT wafer locations and scrutinize the efficiency of the proposed approach. The proposed algorithm was afterwards validated by comparing the performance of the optimized PZT wafer network distribution to previous optimization cases in the field using a different optimizer.
Key words: Structural health monitoring, PZT wafer network optimization, coverage rate, data fusion, piezoelectric wafers.

384
2
1. Introduction Complex engineering systems such aerospace, mechanical and civil structures constitute
the basis of our everyday economy. Manuals of codes and standards have been compiled for numerous regions to ensure the safety of these facilities and their serviceability. Nevertheless, design codes have not been sufficient to predict the damage of engineering structures upon exposure to severe environmental conditions. Recent seismic activities have revealed the real vulnerability of these civil structures to damage during catastrophes like earthquakes. Having these risks taken into consideration, engineering communities have pushed further to innovate and implement proactive sensing technologies that aim to rapidly detect the onset of structural damage in instrumented structural systems. Hence, the process of estimating the state of structural health by combining damage detection algorithms with structural monitoring systems known as structural health monitoring process (SHM) [2]. In general, an SHM system is a mimic of the human nervous system by which a group of PZT wafers act together as one sensing network to detect and localize faults within a surface. It is a continuous monitoring process that aims to detect anything from ambient vibrations, wind and live loadings on the structure to large scale vibrations, earthquakes and severe damages [3]. An advanced overview of the applications of SHM technology in Asia is presented in Annamdas et al. [4]. Conventional SHM systems installed in tall buildings have been reported in literature to cost excess of 5000$ per sensing channel [5]. This means these systems costs grow at rates faster than regular linear rates upon increase in the structure’s size. A tradeoff exists between SHM feasibility and SHM system costs. For instance, a decent SHM system for a bridge can cost more than $8 million (USD) [6]. On the other hand, small numbers of PZT wafers may struggle to detect structural damage, the fact that provoked PZT wafer network optimization. A more detailed overview of the SHM process can be found in Farrar and Worden [7].
Several PZT wafer placement techniques have been demonstrated in the field of SHM. Many scholars have focused on determining the minimum number of PZT wafers required to achieve full structure coverage without providing a tool for PZT wafer allocation. Others have developed algorithms that follow an information based approach that depends on the experimental conditions of each PZT wafer. Also, genetic algorithms and geometric approaches have been presented in previous work. The demonstration of the various optimization approaches in literature is summarized in this section.
Iterative Optimization
Iterative Optimization is also known as the “trial and error” optimization approach. The process starts with a fixed number of PZT wafers distributed over the entire network. Then it eliminates one PZT wafer at a time and assesses the new coverage. An opposite approach for the iterative optimization method starts by finding the optimal 1-PZT wafer patterns over the plate surface and evolves by adding PZT wafers and evaluating the optimal coverage in each

385
3
case [8]. In some experiments, for instance, the analysis starts by having 20 PZT wafer locations distributed over the plate. Afterwards, one PZT wafer is removed and the remaining 19 PZT wafers are left with 20 possibilities. The 20 PZT wafer locations are tested and the 19th PZT wafer distribution having the best fitness measure is selected. The PZT wafer location that was not selected is permanently deleted and a similar assessment is carried out for the following PZT wafer distribution. This has proven to be more computationally effective and results in a lower number of PZT wafers and lower probability of error. Evaluation of the effectiveness of the iterative optimization approach is defined by a measure of fitnessthat can be considered as the normalized mean square error (MSE) between the desired network responses and the initial network training responses. K. Worden [8] in his experiments on iterative optimization incorporates two factors into the fitness measure and evaluates the fitness based on a scoring method. For instance, a PZT wafer distribution to be considered optimal, had to have the lowest score resulting from the sum of the average MSE and the maximum MSE for each PZT wafer network distribution. Having two factors defined in the fitness measure makes it less subject to local minima problems. Successful patterns demonstrate lowest average error and lowest maximum error and with no misclassifications.
Combinatorial Optimization: Information-Based Approach
Combinatorial optimization is usually expressed in forms of Quadratic Non-linear programs. A traditional information-based approach for a PZT wafer placement problem places PZT wafers near the anti-nodes of the low frequency vibration modes of the system. The distribution of PZT wafers is assessed in terms of the covariance matrix [C]. The covariance matrix is the inverse of the Fisher information matrix [F]. Usually, minimizing [C] maximizes [F] and the outcome is the determinant of matrix [F]. PZT wafers location process is guided by a Finite Element (FE) model and the PZT wafers are located according to their Average Driving Point Residue (ADPR) [9]. PZT wafers with the highest ADPR are selected and contribute to high mode shapes. A very recent non model based approach for damage identification using measured mode shapes is presented in Xu and Zhu [10]. A second approach is the Guyan model reduction, where master PZT wafer locations are selected by the algorithm and are deleted until the required number of PZT wafers is reached. The objective function is related to the degrees of freedom of the master nodes and their moments of inertia. Both methods illustrated earlier can be either assessed with the Modal Assurance Criterion (MAC) or the condition number of the mode shape matrix that measures the extent of linear dependence between mode shape vectors [8]. Sequential deleting of the PZT wafers leaves behind the PZT wafers producing the highest off diagonal matrix. A third information-based approach for the PZT wafer optimization problem is the Effective Independence (EI) [11]. It is based on the EI distribution vector E. The optimization process is iterative, terms in E are sorted and the least important PZT wafer is deleted and the determinant of the Fisher information matrix is maintained.

386
4
Genetic Algorithms Genetic algorithms are optimization algorithms that work by encoding the sets of possible
parameters in a solution space as a gene [8]. Usually, genes are represented as binary strings e.g.: 01001001, each gene represents a case of PZT wafer allocation pattern in which the 0 describes the absence of PZT wafer allocated and 1 its presence. The optimization starts by randomly generating a set of possible solution genes and selects the fittest genes based on a predefined fitness function usually the inverse of the probability of misclassification. Then it evolves, in a Darwinian manner, by which the genes selected in the earlier phase are crossed over to produce the next generation of genes. Crossing over occurs by selecting a specific position along a gene pair and switching of the following substrings. Afterwards, the fitness of the genes is compared against the sum of fitness of all genes of the population. The higher the fitness factor, the higher is the probability of selection. Genes with very high fitness scores are probably to be selected several times for mating and thus are isolated initially from mating and kept for advanced crossover stages in order to guarantee optimal PZT wafer allocation solutions in a process called elitism, a good demonstration of elitism is presented in Junghans and Darde [12]. On the other hand, new genes can also be introduced to prevent the population from stagnating. The process of mating continues until few elite genes dominate the population.
A good demonstration of the GA approach work mechanism is presented by Shiyuan et al.[13] in which a population of genes is defined along with crossover and mutation rates. The population of 80 PZT wafers undergoes crossing over to produce 800 new generations and the fittest genes are sorted out according to a predefined fitness function that focuses on minimizing the communication distance between PZT wafers after dividing the plate into numerous clusters. This approach has demonstrated a good coverage results yet seems to utilize a high number of PZT wafers in order to minimize the transmission distance and energy loss, the fact that makes it an expensive approach as demonstrated in Celebi [5].
Simulated Annealing
Most PZT wafer network optimization techniques tend to move downwards with the objective function in an attempt to reduce the number of PZT wafers needed; therefore, there is a great possibility that the optimization converges to a local minimum. Optimization with Simulated Annealing (SA) is very similar to the concept of metal annealing by which a metal is heated and left to cool down and tends to increase and decrease the objective function instead of strictly decreasing it to avoid local minima [14]. A good example of optimization via SA is presented in Kannan et al. [15] in which the optimization starts with a fixed number of 200 nodes and a cost function is defined as the difference between the anticipated distance (usually the transmission distance) and actual distance between an anchor node and a non-anchor node. More than 200 nodes are randomly spread out at first and SA evolves by shifting the locations of non-anchor nodes while maintaining a distance equal to the transmission distance between

387
5
PZT wafers and with a probability of 80% of accepting a bad uphill move if needed. Iterations are carried out for sets of nodes to attain equilibrium for each and minimal cost function. The advantage of this approach is that it outperformed regular GA approaches and was capable of achieving global solutions for complex objective functions. For instance, SA can deal with n- PZT wafers and achieve optimality levels of 99.5% correct classification [8, 16]. Nevertheless, this approach is very time consuming and needs numerous iterations to achieve global optimality. The performance of GA along with a hybrid algorithm mix between GA and SA is presented in Junghans and Darde [12]. They demonstrated that GA alone may not achieve global optimality and they proposed a new hybrid algorithm that highlights the importance of using SA in thermal building optimization problems.
Several classes of optimization problems exist depending on the type of constraints and their order. For instance, mixed-integer nonlinear programming (MINLP) problem constraints are characterized by having continuous and discrete variables simultaneously along with non-linear functions. Methods for coding and solving MINLPs started developing during late 1990s. A good demonstration is presented in Grossmann [17]. In general, MINLP problems are challenging due to the nature of their nonlinear functions along with their discrete variables and non-convexity. MINLP is very efficient in modeling optimization problems yet can become very complex and very hard to control its tractability due to its wide applications in the field of optimization with minimal coding restrictions. Applications of MINLP problems exist in a wide range of fields including OR, Chemical engineering, Operation Management, etc. [18] .
In this paper, MINLP was proposed as an advanced optimization approach for PZT wafer network allocation and a finite set of control points were selected along the surface of the plate. The objective function of the algorithm was to maximize the coverage provided to these control points (to a predefined level of coverage). The algorithm was tested on plates with convex surfaces of different shapes in addition to PZT wafer networks of different coverage levels and number of control points. The algorithm was also tested for optimizing PZT wafer networks with actuator-sensor pairs having varied coverage. In these cases, the coverage of the PZT wafers was assumed to be rectangular shaped along the actuator PZT wafer path and having a width of 40 mm or 20 mm depending on the type of PZT wafers used. The results of the aforementioned cases were validated against an efficient PZT wafer network optimizer and data fusion was carried out to translate the findings of our optimization algorithm to coverage areas across the differently shaped plates.
2. Methodology The proposed optimization algorithm evolves by measuring the coverage on a finite number
of control points. A mathematical program was developed having an objective function of

388
6
maximizing the number of points covered. The problem is complex due to its non-linearity and is constrained by the distance between the actuator-sensor path and the control point itself that should not exceed the coverage range of the actuator-sensor. Another important constraint is the level of coverage required and is characterized by the number of actuator-sensor paths covering each control point. Other constraints including the plate‘s geometry and the number of PZT wafers available were taken into consideration. The problem was coded as a Quadratically Constrained Mixed Integer program and is considered to fall under Mixed Integer non-linear problems (MINLP).
The general form of MINLP is as following:
Min 𝒇𝒇(𝒙𝒙, 𝒚𝒚)
𝑺𝑺𝒕𝒕:
𝐜𝐜𝒊𝒊(𝐱𝐱, 𝐲𝐲) = 𝟎𝟎 ∀ 𝒊𝒊 ∈ 𝑬𝑬
𝐜𝐜𝒊𝒊(𝐱𝐱, 𝐲𝐲) ≤ 𝟎𝟎 ∀ 𝒊𝒊 ∈ 𝑰𝑰
𝒙𝒙 ∈ 𝑿𝑿
𝒚𝒚 ∈ 𝒀𝒀 Integer
Each c𝑖𝑖(x, y) is a mapping from Rn to R, and E and I are index sets for equality and inequality constraints, respectively. Typically, the functions 𝑓𝑓 and c𝑖𝑖 have some smoothness properties, i.e., once or twice continuously differentiable [19],[20] and [21].
MINLP problems are difficult to solve since they combine the difficulties of both Mixed Integer programming and Nonlinear Programing problems. Several approaches for PZT wafer network optimization discussed in literature have been demonstrated earlier in this paper, however there are other geometric approaches presented in literature for determining the level of coverage in a PZT wafer network and aim to provide a tool for PZT wafer network assessment and not optimization. The geometric approach presented by Huang and Tseng [22] is based on allocating PZT wafers randomly and assumes that the covering parameter of each PZT wafer is a circular disk of a given radius “r” according to its coverage range. Then the assessment proceeds by defining the areas and points that fall within one or more transmission parameter of PZT wafers and classifies their coverage into levels accordingly. This method was translated into a computerized interface that is capable of highlighting the coverage characteristics of the various areas of the plate by identifying the redundancy of coverage parameters of various PZT wafers but does not optimize the exact location of PZT wafers to achieve optimal coverage nor the ability to manipulate the problem parameters such as the minimum number of PZT wafers

389
7
needed and the designated coverage levels, but rather iterate the PZT wafer locations for a large number of nodes.
For our proposed optimization algorithm, the problem is formulated as a MINLP with an objective function of maximizing coverage with a given number of PZT wafers while being constrained by a set of constraints that are demonstrated in details below:
Parameter Notation
𝐾𝐾: Set of Control points
(𝑥𝑥𝑘𝑘, 𝑦𝑦𝑘𝑘): Coordinates of control point 𝑘𝑘, 𝑘𝑘 ∈ 𝐾𝐾
𝑁𝑁: Set of PZT wafers to be placed
𝑀𝑀: A large number
(𝑥𝑥𝑖𝑖, 𝑦𝑦𝑖𝑖) ∈ 𝑋𝑋, the geometry of the plate
Decision Variables
𝐶𝐶𝑘𝑘 = 1 𝑖𝑖𝑖𝑖 𝑐𝑐𝑐𝑐𝑐𝑐𝑐𝑐𝑐𝑐𝑐𝑐𝑐𝑐 𝑝𝑝𝑐𝑐𝑖𝑖𝑐𝑐𝑐𝑐 𝑘𝑘 𝑖𝑖𝑖𝑖 𝑐𝑐𝑐𝑐𝑐𝑐𝑐𝑐𝑐𝑐𝑐𝑐𝑐𝑐0 𝑐𝑐𝑐𝑐ℎ𝑐𝑐𝑐𝑐𝑒𝑒𝑖𝑖𝑖𝑖𝑐𝑐 , 𝑘𝑘 ∈ 𝐾𝐾
(𝑥𝑥𝑖𝑖, 𝑦𝑦𝑖𝑖): Coordinates of PZT wafer 𝑖𝑖, 𝑖𝑖 ∈ 𝑁𝑁
𝐶𝐶𝑖𝑖𝑖𝑖𝑘𝑘 = 1 𝑖𝑖𝑖𝑖 𝑐𝑐𝑐𝑐𝑐𝑐𝑐𝑐𝑐𝑐𝑐𝑐𝑐𝑐 𝑝𝑝𝑐𝑐𝑖𝑖𝑐𝑐𝑐𝑐 𝑘𝑘 𝑖𝑖𝑖𝑖 𝑐𝑐𝑐𝑐𝑐𝑐𝑐𝑐𝑐𝑐𝑐𝑐𝑐𝑐 𝑏𝑏𝑦𝑦 𝑝𝑝𝑖𝑖𝑐𝑐𝑝𝑝𝑐𝑐𝑐𝑐𝑐𝑐𝑐𝑐𝑐𝑐𝑐𝑐𝑐𝑐𝑖𝑖𝑐𝑐 𝑒𝑒𝑤𝑤𝑖𝑖𝑐𝑐𝑐𝑐 𝑐𝑐𝑖𝑖𝑐𝑐𝑐𝑐 (𝑖𝑖, 𝑗𝑗)0 𝑐𝑐𝑐𝑐ℎ𝑐𝑐𝑐𝑐𝑒𝑒𝑖𝑖𝑖𝑖𝑐𝑐 , 𝑖𝑖 ∈ 𝑁𝑁, 𝑗𝑗 ∈ 𝑁𝑁, 𝑘𝑘 ∈ 𝐾𝐾, 𝑖𝑖 < 𝑗𝑗
𝑐𝑐𝑖𝑖𝑖𝑖 = Distance between PZT wafer 𝑖𝑖 and piezoelectric wafer 𝑗𝑗, 𝑖𝑖, 𝑗𝑗 ∈ 𝑁𝑁, 𝑖𝑖 < 𝑗𝑗
𝑐𝑐𝑖𝑖𝑖𝑖𝑘𝑘 = Distance between PZT wafer line (𝑖𝑖, 𝑗𝑗) and PZT wafer 𝑘𝑘, 𝑖𝑖 ∈ 𝑁𝑁, 𝑗𝑗 ∈ 𝑁𝑁, 𝑘𝑘 ∈ 𝐾𝐾, 𝑖𝑖 < 𝑗𝑗
𝑐𝑐𝑖𝑖𝑘𝑘 = Distance between PZT wafer 𝑖𝑖 and control point 𝑘𝑘, 𝑖𝑖 ∈ 𝑁𝑁, 𝑘𝑘 ∈ 𝐾𝐾 𝜏𝜏𝑖𝑖𝑖𝑖𝑘𝑘: Positive variable between 0 and 1 to calculate the distance between the PZT wafer pair (i,j) and control point k,
Coverage Levels Chi-Fu Huang and Yu-Chee Tseng [22] have demonstrated that the coverage provided by the different PZT wafers of the network can be categorized under multiple levels depending on the number of coverage disks overlapping at a given region. In this work, it is possible to classify coverage into levels and most importantly optimize

390
8
PZT wafer networks for designated coverage levels according to the number of actuator-sensor paths providing coverage to every control point. The control point is not considered to be covered unless the required coverage level is achieved.
Level-1 coverage is considered to be the first step of PZT wafer placement optimization problems and aims to recognize the presence or absence of a defect along the available actuator-sensor pair paths. For Level 1 coverage, each control point is covered by at least one actuator-sensor pair.
Level-2 coverage is known as localization coverage providing the ability to localize defect through the intersection (data fusion) of two or more actuator-sensor paths.
Level-3 coverage is used for “assessment” since it evaluates the severity of the damage by providing improved coverage of three or more actuator-sensor paths to every control point and hence is considered to provide more robustness to the PZT wafer network. Huang and Tseng [22] stated that accurate localization of damage requires coverage of three PZT wafer paths, according to triangulation protocols. In this paper, level “n” will be referred to the case of coverage by “n” actuator-sensor pair.
Problem Formulation
𝐦𝐦𝐦𝐦𝐦𝐦 ∑ 𝑪𝑪𝒌𝒌𝒌𝒌∈𝑵𝑵
𝒔𝒔𝒔𝒔:𝑑𝑑𝑖𝑖𝑖𝑖
2 = (𝑥𝑥𝑖𝑖 − 𝑥𝑥𝑖𝑖)2 + (𝑦𝑦𝑖𝑖 − 𝑦𝑦𝑖𝑖)2 ∀ 𝑖𝑖 ∈ 𝑁𝑁, 𝑗𝑗 ∈ 𝑁𝑁, 𝑖𝑖 < 𝑗𝑗 (1)𝑑𝑑𝑖𝑖𝑖𝑖
2 = (𝑥𝑥𝑖𝑖 − 𝑥𝑥𝑖𝑖)2 + (𝑦𝑦𝑖𝑖 − 𝑦𝑦𝑖𝑖)2 ∀ 𝑖𝑖 ∈ 𝑁𝑁, 𝑘𝑘 ∈ 𝐾𝐾 (2)𝑑𝑑𝑖𝑖𝑖𝑖𝑖𝑖 ≤ 1 + 𝑀𝑀(1 − 𝐶𝐶𝑖𝑖𝑖𝑖𝑖𝑖) ∀𝑖𝑖 ∈ 𝑁𝑁, 𝑗𝑗 ∈ 𝑁𝑁, 𝑘𝑘 ∈ 𝐾𝐾, 𝑖𝑖 < 𝑗𝑗 (3)
𝑑𝑑𝑖𝑖𝑖𝑖𝑖𝑖2 ≥ (𝜏𝜏𝑖𝑖𝑖𝑖𝑖𝑖𝑥𝑥𝑖𝑖 + (1 − 𝜏𝜏𝑖𝑖𝑖𝑖𝑖𝑖)𝑥𝑥𝑖𝑖 − 𝑥𝑥𝑖𝑖)2 + (𝜏𝜏𝑖𝑖𝑖𝑖𝑖𝑖𝑦𝑦𝑖𝑖 + (1 − 𝜏𝜏𝑖𝑖𝑖𝑖𝑖𝑖)𝑦𝑦𝑖𝑖 − 𝑦𝑦𝑖𝑖)2
(4), ∀𝑖𝑖, 𝑗𝑗 ∈ 𝑁𝑁, 𝑘𝑘 ∈ 𝐾𝐾, 𝑖𝑖 < 𝑗𝑗
𝜏𝜏𝑖𝑖𝑖𝑖𝑖𝑖 ≤ 1 ∀ 𝑖𝑖 ∈ 𝑁𝑁, 𝑗𝑗 ∈ 𝑁𝑁, 𝑘𝑘 ∈ 𝐾𝐾, 𝑖𝑖 < 𝑗𝑗 (5) 𝑑𝑑𝑖𝑖𝑖𝑖 − 𝑑𝑑𝑖𝑖𝑖𝑖 = 𝑎𝑎𝑖𝑖𝑖𝑖𝑖𝑖
+ − 𝑎𝑎𝑖𝑖𝑖𝑖𝑖𝑖− , ∀𝑖𝑖 ∈ 𝑁𝑁, 𝑗𝑗 ∈ 𝑁𝑁, 𝑘𝑘 ∈ 𝐾𝐾, 𝑖𝑖 < 𝑗𝑗 (6)
𝑑𝑑𝑖𝑖𝑖𝑖 − 𝑑𝑑𝑖𝑖𝑖𝑖 = 𝑏𝑏𝑖𝑖𝑖𝑖𝑖𝑖+ − 𝑏𝑏𝑖𝑖𝑖𝑖𝑖𝑖
− , ∀ 𝑖𝑖 ∈ 𝑁𝑁, 𝑗𝑗 ∈ 𝑁𝑁, 𝑘𝑘 ∈ 𝐾𝐾, 𝑖𝑖 < 𝑗𝑗 (7)
𝑎𝑎𝑖𝑖𝑖𝑖𝑖𝑖+ ≤ 𝑀𝑀(1 − 𝐶𝐶𝑖𝑖𝑖𝑖𝑖𝑖) , ∀𝑖𝑖 ∈ 𝑁𝑁, 𝑗𝑗 ∈ 𝑁𝑁, 𝑘𝑘 ∈ 𝐾𝐾, 𝑖𝑖 < 𝑗𝑗 (8)
𝑏𝑏𝑖𝑖𝑖𝑖𝑖𝑖+ ≤ 𝑀𝑀(1 − 𝐶𝐶𝑖𝑖𝑖𝑖𝑖𝑖), ∀ 𝑖𝑖 ∈ 𝑁𝑁, 𝑗𝑗 ∈ 𝑁𝑁, 𝑘𝑘 ∈ 𝐾𝐾, 𝑖𝑖 < 𝑗𝑗 (9)

391
9
∑ ∑ 𝐶𝐶𝑖𝑖𝑖𝑖𝑖𝑖 ≥ 𝑛𝑛𝑖𝑖∈𝑁𝑁:𝑖𝑖<𝑖𝑖𝑖𝑖∈𝑁𝑁 𝐶𝐶𝑖𝑖 , ∀ 𝑘𝑘 ∈ 𝐾𝐾, 𝑖𝑖 < 𝑗𝑗 (10)
∑ 𝐶𝐶𝑖𝑖𝑖𝑖𝑖𝑖 ≤ 1𝑖𝑖∈𝑁𝑁:𝑖𝑖<𝑖𝑖 , ∀𝑖𝑖 ∈ 𝑁𝑁, 𝑘𝑘 ∈ 𝐾𝐾, 𝑖𝑖 < 𝑗𝑗 (11)
∑ 𝐶𝐶𝑖𝑖𝑖𝑖𝑖𝑖 ≤ 1𝑖𝑖∈𝑁𝑁:𝑖𝑖<𝑖𝑖 , ∀𝑗𝑗 ∈ 𝑁𝑁, 𝑘𝑘 ∈ 𝐾𝐾, 𝑖𝑖 < 𝑗𝑗 (12) (𝑥𝑥𝑖𝑖, 𝑦𝑦𝑖𝑖) ∈ 𝑋𝑋 , ∀ 𝑖𝑖 ∈ 𝑁𝑁 (13)
𝑑𝑑𝑖𝑖𝑖𝑖, 𝑑𝑑𝑖𝑖𝑖𝑖𝑖𝑖, 𝑑𝑑𝑖𝑖𝑖𝑖, 𝜏𝜏𝑖𝑖𝑖𝑖𝑖𝑖, 𝑎𝑎𝑖𝑖𝑖𝑖𝑖𝑖+ , 𝑎𝑎𝑖𝑖𝑖𝑖𝑖𝑖
− , 𝑏𝑏𝑖𝑖𝑖𝑖𝑖𝑖+ , 𝑏𝑏𝑖𝑖𝑖𝑖𝑖𝑖
− ≥ 0 (14) 𝐶𝐶𝑖𝑖𝑖𝑖𝑖𝑖, 𝐶𝐶𝑖𝑖 Binary Variables (15) Equations (1) and (2) calculate the distance between PZT wafers i and j and the distance between PZT wafer i and the control point k respectively according to the Euclidean distance equation between two points. In equation (3), for a specific control point k to be covered (𝐶𝐶𝑖𝑖 = 1), the distance between the PZT wafer-actuator path and this control point 𝑑𝑑𝑖𝑖𝑖𝑖𝑖𝑖 must be less than unity which is considered to be the coverage distance of all actuator-sensor paths in this problem. This parameter is a user defined attribute which can be altered to fulfill the problem requirements. In this current form, the 40 mm coverage of the PZT wafer path is scaled to 1, for PZT wafer paths with 20 mm coverage, the coverage of the path is scaled to 0.5 and equation (3) is modified accordingly. Equations (4) and (5) calculate the distance between the PZT wafer path (i,j) and the control point k. Equations (6), (7), (8) and (9) represent the triangular inequality equations between an actuator-sensor pair and a control point. These equations ensure that the control points covered fall within the actuator-sensor pair path. Equation (10) aims to optimize the level of coverage provided at each control point of the problem to a predefined level. For a control point k to be covered (𝐶𝐶𝑖𝑖 = 1), the summation of coverage provided by the different actuator-sensor paths should be greater than a constant multiplied by 𝐶𝐶𝑖𝑖 , this constant defines the optimization level of coverage and is currently set for Level n coverage by which n actuator-sensor paths are required for the equation to hold and can be defined to any coverage level needed at the expense of longer computational time. Equations (11) and (12) have demonstrated the ability to improve the performance of the model. These equations state that the summation of actuator-sensor path for a given PZT wafer and a given control point to all other PZT wafers should not exceed one path. This prevents the code from overlapping PZT wafers and covering a control point by two lines along the same PZT wafer. Equation (13) defines the plates’ dimensions. Equation (14) ensures that the listed variables are positive and Equation (15) defines 𝐶𝐶𝑖𝑖𝑖𝑖𝑖𝑖 and 𝐶𝐶𝑖𝑖 as binary variables. M is a positive number greater than the largest distance existing in the plate. Therefore, for a square 10x10 unit plate and a right isosceles triangular plate with a 10 unit leg and 10√2

392
10
hypotenuse, M should be greater than the diagonal distance 10√2 as identified in equation (3). As for circular plates, M should be less than 10, i.e. the diameter of the plate.
After identifying the nature of the problem and formulating it, prolonged search and testing of convenient solvers capable of solving non-linear and non-convex problems suggested that the Open Source Non-linear Mixed Integer Programming Solver (Bonmin) was one of the most efficient solvers for this type of problems and has been used thoroughly in literature [23]. Bonmin is a hybrid solver for mixed integer non-linear programming based on an outer-approximation-based branch-and-cut-based algorithm and a pure branch-and-bound algorithm [19],[20] and [21]. Bonmin defines a node search tree and branches on its variables solving for feasible and optimal solutions. It implements six different algorithms in solving MINLPs highlighted in the Bonmin User Manual [24]. Additional details regarding the non-linear branch and bound approach and its different types can be found in Belotti et al. [25]. Problems solved with Bonmin can be coded in AMPL; a computer based language used for solving large scale optimization problems and is capable of supporting a wide range of solvers. Detailed description of the design and implementation of AMPL is provided in Fourer et al. [26].
In general, there is no generic global optimizer for MINL problems. These problems have demonstrated lack of performance efficiency and insufficient numerical robustness and a good example is highlighted in Ausen [27]; however, The following were implemented to increase the tractability and robustness of the model:
I. The initial approach to the problem was to relax the coverage of the PZT wafer path 𝐶𝐶𝑖𝑖𝑖𝑖𝑖𝑖 and solve for PZT wafer locations, then to feed the preliminary results of the relaxed problem as a preliminary solution to the actual problem, hence requiring less computational time for solving.
II. The plate understudy was divided into a definite set of control points in order to enhance the computational efficiency of the solver by reducing the processing time required. The actual coverage of these control points provided by the proposed optimization approach was assessed separately after each run with higher number of control points to validate the robustness of the results. It was observed that the optimizer had provided consistent optimization results for various PZT wafer network problems.
III. Another key factor for enhancing the model’s robustness is integrated within the solver itself. In dealing with MINLP, Bonmin offers two options within the branch and bound tree at root and at node for solving the root node or each node of the tree, respectively, with a user-specified number of different randomly-chosen starting points, saving the best solution found.
IV. Bonmin provides the option of allowing continuous branching even if the solution value to the current node is worse than the best-known solution. Hence exploring all possible

393
11
solutions of the problem, the fact that overcomes the local optimality dilemma in regular optimization approaches.
3. Simulation Cases The proposed algorithm was developed according to the geometric characteristics of the
plate understudy and is capable of optimizing convex PZT wafer networks. Therefore, the assessment was carried out on several cases to evaluate the efficiency and performance of the optimization algorithm including square, circular and triangular plates for Levels 2 and 3 coverage. The aim behind the optimization of PZT wafer networks of different shapes is twofold:
1) To demonstrate how the optimization algorithm will accommodate for the allocation of the PZT wafer network along various geometric shapes having different boundaries.
2) To study how the optimization behavior varies as the pattern of the control point distribution changes. Level 3 optimization cases are also studied to highlight the effect of increasing the number of intersecting actuator-sensor paths on the coverage of the plate itself and hence improving fault localization chances.
It is also essential to study the change in the optimization behavior when higher coverage levels are required with low number of PZT wafers available. Coverage of a PZT wafer path was initially assumed to be 40 mm from each side of the path and cases are demonstrated in earlier work such as Mustapha et al. [28]. The case of 20 mm coverage for each PZT wafer path is also considered to demonstrate the flexibility in choosing the PZT wafer types and the effect of each on the optimization process as the required number of PZT wafers to achieve complete coverage differs. The case of adding control points to the plate understudy is also considered in order to demonstrate how increasing the control points in a selected area of the plate increases the coverage of this area. In addition to studying the effect on the computational time for processing the problem and on the precision of coverage provided by the PZT wafer locations determined. The majority of our cases optimized were tested on triangular plates mainly due to the lack of symmetry of these plates. Therefore, a preliminary solution chosen is not intuitive and strongly depends on common engineering sense. Since most irregular shapes can be divided into triangular areas, optimization of irregular shaped PZT wafer networks with triangulation produces high quality results.
The general distribution of control points for every plate type are represented in Figures 1– 3. Tables 1 and 2 summarize the simulation cases tested on each of the plates. Details on the problem parameters as well as the coverage of the preliminary PZT wafer network (initial solution) and the optimized coverage are provided. The results of the optimized coverage will
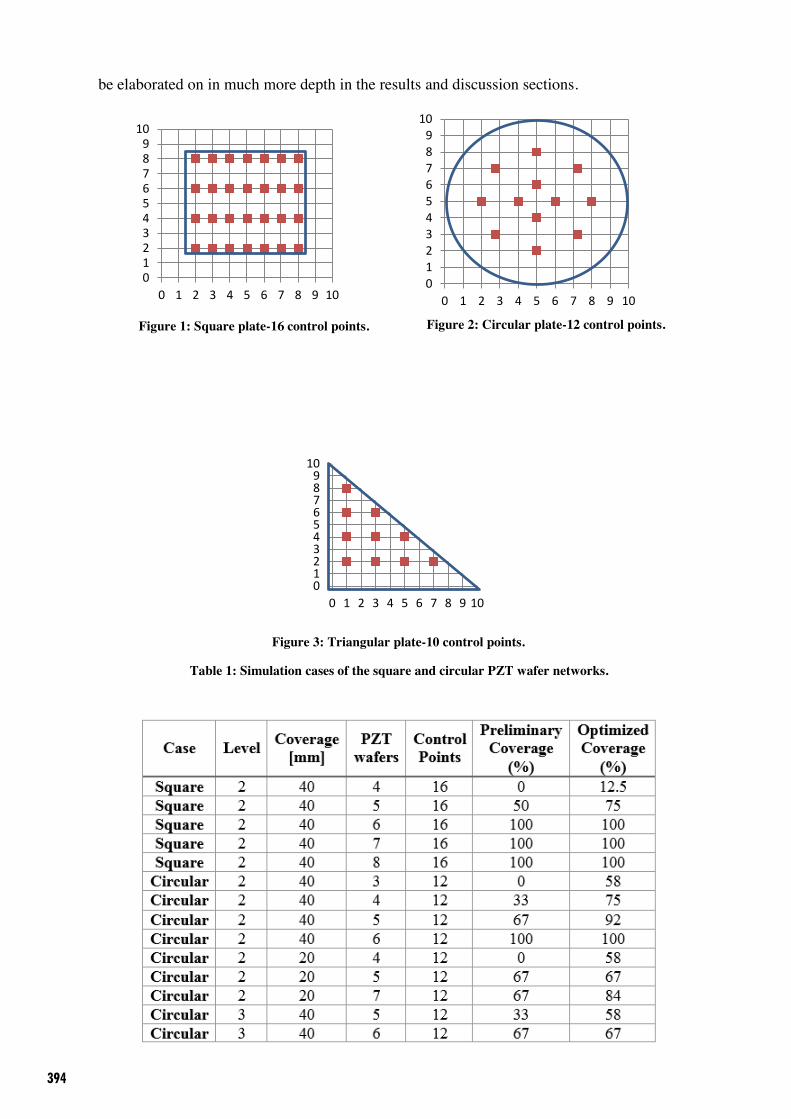
394
12
0123456789
10
0 1 2 3 4 5 6 7 8 9 100123456789
10
0 1 2 3 4 5 6 7 8 9 10
be elaborated on in much more depth in the results and discussion sections.
Figure 3: Triangular plate-10 control points.
0123456789
10
0 1 2 3 4 5 6 7 8 9 10
Figure 2: Circular plate-12 control points. Figure 1: Square plate-16 control points.
13
Table 1: Simulation cases of the square and circular PZT wafer networks.

395
14
Table 2: Simulation cases for the triangular PZT wafer networks.
* 32 is scaled for comparison with Flynn and Todd [1]

396
15
4. Results and Discussion
4.1 PZT wafer Network Optimization-Level 2 Initially, PZT wafer network optimization testing was conducted on different shaped plates to confirm the robustness of our proposed optimization algorithm in handling different geometries. Later, a thorough investigation was completed using the triangular shaped plates. The results of the optimization versus the preliminary random allocation of PZT wafers are demonstrated in Figures 4 to 6 in terms of coverage (C) and number of PZT wafers needed.
Figure 4: Optimization results of sensor networks on square plates.
0
2
4
6
8
10
0 2 4 6 8 10
Preliminary 6-Sensor Network
Sensors
Ck
C=100%
0
2
4
6
8
10
0 2 4 6 8 10
Preliminary 5-Sensor Network
Sensors
Ck
C=67%0
2
4
6
8
10
0 2 4 6 8 10
Optimized 5-Sensor Network
Sensors
Ck
C=92%
Figure 5: Optimization results of sensor networks on circular plates
0
2
4
6
8
10
0 2 4 6 8 10
Optimized5-Sensor Network
Sensors
Ck
C=75%0
2
4
6
8
10
0 2 4 6 8 10
Preliminary 5-Sensor Network
Sensors
Ck
C=50%
0
2
4
6
8
10
0 2 4 6 8 10
Optimized6-Sensor Network
Sensors
Ck
C=100%
0
2
4
6
8
10
0 2 4 6 8 10
Preliminary8-Sensor Network
Sensors
Ck
C=100%0
2
4
6
8
10
0 2 4 6 8 10
Optimized 8-Sensor Network
Sensor
Ck
C=100%

397
16
Based on the above sets of experiments carried out on plates of different shapes, it can be observed that the optimized PZT wafer network produces higher coverage rates than the preliminary PZT wafer network allocated (for the same number of PZT wafers). In general, when the number of PZT wafers is large, both preliminary and optimized solutions tend to provide complete coverage to the plate understudy, however, as the number of PZT wafers becomes scarce and the decision of allocation becomes more critical, the output of the optimization code becomes more valuable by outperforming the regular allocation process. A good example facilitating the role of the optimization process is that for a low number of control points, a primitive solution of 3 PZT wafers allocated on the corners of a triangle produces 10% coverage whereas a much stronger solution of 70% is achieved by the optimization code. Another interesting remark observed is that when the number of PZT wafers decreased the optimization code tends to allocate 2 PZT wafers close to each other, the purpose of this allocation was to achieve the Level 2 coverage for the maximum number of points possible. Hence it can be concluded that the optimization algorithms prefered quality coverage of small number of control points rather than poor coverage to a greater amount of points.
0
2
4
6
8
10
0 2 4 6 8 10
Optimized 6-Sensor Network
Sensors
CK
C=100%
0
2
4
6
8
10
0 2 4 6 8 10
Optimized 5-Sensor Network
Sensors
CK
C=90%
0
2
4
6
8
10
0 2 4 6 8 10
Preliminary 6-Sensor Network
Sensors
Ck
C=100%
0
2
4
6
8
10
0 2 4 6 8 10
Preliminary 5-Sensor Network
Sensors
Ck
C=60%
Figure 6: Optimization results of sensor networks on triangular plates.

398
17
4.2 PZT wafer Network Optimization-Level 3 Chi-Fu Huang and Yu-Chee Tseng [22] demonstrated in their work that the accurate
localization of faults requires Level 3-coverage, in other words, control points should be covered by 3 or more actuator-sensor pair paths in order to accurately localize damage according to triangulation based algorithms. In this study, localization coverage (Level 3) is reached by setting the coverage parameter to 3. As mentioned earlier, the level of coverage in equation (9) of the PZT wafer network optimization model is a user defined attribute that can be manipulated to achieve higher levels of coverage at the cost of longer computational time. This method provides improved coverage and a defect detection accuracy to the plate understudy. For the sake of demonstration, optimization of a Level 3 PZT wafer network for a triangular plate was studied with 5 and 4 PZT wafers respectively as shown in Figure 7 below.
In the experiment of Figure 7, the optimization behavior becomes more complex and the optimization tends to place PZT wafers in symmetry with the plate’s center and in pairs in order to achieve Level 3 coverage for specific control points rather than to disperse the PZT wafers throughout the plate area, this can be resolved by relaxing the binary variable 𝐶𝐶𝑖𝑖𝑖𝑖𝑖𝑖 .
0
2
4
6
8
10
0 2 4 6 8 10
Preliminary 5-Sensor Network
Sensors
CK
C=40%0
2
4
6
8
10
0 2 4 6 8 10
Optimized 5-Sensor Network
Sensors
CK
C=80%
0
2
4
6
8
10
0 2 4 6 8 10
Preliminary 4-Sensor Network
Sensors
Ck
C=20%
Figure 7: Optimization results of sensor networks on triangular plates.
0
2
4
6
8
10
0 2 4 6 8 10
Preliminary 4-Sensor Network
Sensors
Ck
C=70%

399
18
4.3 PZT wafer Network Optimization-20mm Coverage The coverage of the actuator-sensor pair was reduced to 20 mm from each side. This is
equivalent to half unit coverage for the scaled optimization model and the case of optimizing the PZT wafer network on a triangular plate was studied. A triangular plate having 6 PZT wafers with 20 mm coverage was investigated and the number of PZT wafers was increased afterwards and the coverage was re-assessed until full plate coverage was achieved as demonstrated in Figure 8. The aim behind these sets of experiments was to be able to demonstrate the flexibility in integration of the problem parameters including the actuator-sensor path coverage characteristics, in addition to highlighting how the behavior of the optimizer varies as the coverage distance becomes less.
The use of 6 PZT wafers provided a full coverage to the triangular plate with 40 mm coverage of PZT wafer path but provided only 50% coverage of the plate for the case of 20 mm coverage. Hence the number of PZT wafers was increased to 7 PZT wafers and 80% coverage was achieved. The use of an 8-PZT wafer network for the triangular plate produces 100% Level 2-coverage. The same procedure was repeated for 20 mm and 40 mm PZT wafer networks with
0
2
4
6
8
10
0 2 4 6 8 10
Optimized 6-Sensor 40 mm Network
Sensors
CK
C=100%
0
2
4
6
8
10
0 2 4 6 8 10
Optimized 6-Sensor 20 mm Network
Sensors
Ck
C=50%
0
2
4
6
8
10
0 2 4 6 8 10
Optimized 7-Sensor 20 mm Network
Sensors
Ck
C=80%0
2
4
6
8
10
0 2 4 6 8 10
Optimized 8-Sensor 20 mm Network
Sensors
Ck
C=100%
Figure 8: Optimization results of 20 mm sensor networks on triangular plates-level 2.

400
19
Level 3- coverage. It was observed that 8 PZT wafers were needed for the 40 mm PZT wafers and only 12 for the 20 mm PZT wafers as shown in Figure 9.
Nevertheless, it was clear that the coverage demonstrated by the data fusion Figures 15D-H of both the 20 mm and 40 mm PZT wafer networks assures that a higher level coverage with improved uniformity is provided by the 40 mm PZT wafer network. This is fairly justified by the increased aggregation of actuator-sensor paths covering larger areas despite the allocation and number of PZT wafers used in each problem. The advantage of the optimization algorithm is that it acts as a PZT wafer allocation tool providing efficient coverage with lower number of PZT wafers.
4.4 Validation Flynn and Todd [1] have developed a genetic algorithm that is able to optimize the PZT wafer placement process allocate PZT wafers on plates of various shapes and dimensions based on the distribution of Bayes risk of PZT wafer networks as a fitness function and assigning penalties to false alarms and missed detections. The algorithm also incorporates PZT wafer characteristics and surrounding network noise and is considered to be a top performer reaching 99.8% optimality levels. The authors experimented on a right isosceles triangular plate of 125 cm side dimension and studied the capability of the algorithm in determining the location of 8 piezoelectric wafers to obtain the optimal locations for full plate coverage. In our study, a comparison was undertaken to evaluate how our code performed against Flynn and Todd’s algorithm for PZT wafer network optimization on a triangular plate having to scale-dimensions and similar geometric characteristics while using the same number of PZT wafers. The simulation results shown in Figures 10 and 11 demonstrated that both optimization methods achieved full plate coverage and tended to allocate the majority of the PZT wafers near the peripherals of the plate. It was also noted that only one PZT wafer was allocated at the inside in both cases the fact that validated our approach in PZT wafer network optimization.
0
2
4
6
8
10
0 2 4 6 8 10
Optimized 8-Sensor 40 mm Network
Sensors
Ck
C=100%
0
2
4
6
8
10
0 2 4 6 8 10
Optimized 12-Sensor 20 mm Network
Sensors
Ck
C=100%
Figure 9: Optimization results of 20 mm sensor networks on triangular plates-level 3

401
20
4.5 Data Fusion of Results Data fusion of PZT wafer networks is the process of aggregation of the coverage generated by every actuator-sensor pair path along the plate surface. Data fusion is carried out for the paths generated by the optimized PZT wafer network in order to assess the levels of coverage at the selected control points. For the 8 PZT wafer network shown in Figure 12 for example, 56 sensing paths are available.
If the dual function of the PZT wafers is considered and redundant paths are neglected, only 28 sensing paths remain. This value can be easily found by computing the number of possible combinations of 2 elements from a set of 8 distinct elements ( 𝐶𝐶 = 288
2 distinct paths). The remaining significant paths are employed to construct a coverage image that highlights the levels of coverage at the different regions of the body understudy. Highest level of coverage is
Figure 10: Optimized 8-sensor network with Flynn and Todd [1] genetic
algorithm.
Figure 11: Optimized 8-sensor network with our proposed approach.
0
2
4
6
8
10
0 2 4 6 8 10
Figure 12: Sensor paths generated by 8-sensor network

402
21
achieved at the areas with the highest intersection of paths Afterwards, construction of the coverage image is accomplished by dividing the monitored zone into uniform 1 mm2 square-shaped grid points, where the coverage of each cell is evaluated by merging the perceptions of the coverage measures from all the sensing paths. The influence of the coverage of the actuator-sensor paths is considered in the shape of a normal distribution function having a maximum effect on the path and decreasing away from it and is defined as [28]:
𝑓𝑓(𝑧𝑧) = 1𝜎𝜎√2𝜋𝜋 𝑒𝑒
−(𝑧𝑧−𝜇𝜇)22𝜎𝜎2 𝑓𝑓𝑓𝑓𝑓𝑓 − ∞ < 𝑧𝑧 < +∞ (16)
Such that μ is the mean of the normal distribution model and σ is its standard deviation. For our experiments, μ and σ were fixed at 0 and 40 mm respectively then σ was changed to 20 mm later on for comparison purposes.
Further, 𝑧𝑧 was determined by assigning the same effect of damage for all the grid points that were equidistant from the path. This was conducted by considering a rectangular affected zone for each sensing path during the fusion process where 𝑧𝑧 was defined as the normal distance separating the grid point from the 𝑗𝑗𝑡𝑡ℎ sensing path.
To visualize the coverage of the used network for the grid, all the sensing paths were given similar weights instead of the anomaly values, and data fusion was applied for image reconstruction as explained earlier. The assessment was conducted along with proper normalization of coverage to the area of interest as represented in Figure 13 and an example of data fusion of a single actuator PZT wafer path is shown in Figure 14. Additional information regarding the mechanism of the damage detection process can be found in Ihn and Chang [29]. The data fusion results are shown thoroughly in Figure 15.
Figure 13: Area of coverage assessment.
Figure 14: Data fusion of one sensor path.

403
22
A-Preliminary 5-sensor network level 2.
B-Optimized 5-sensor network level 2.
G-Optimized 8-sensor 40 mm network level 3.
H-Optimized 12-sensor 20 mm network level 3.
C-Optimized 5-sensor network level 3.
D-Optimized 6-sensor network level 2.
E-Optimized 6-sensor 20 mm network level 2.
I-Optimized 8-sensors 10 control points network.
J-Optimized 8-sensors 16 control points network.
F-Optimized 8-sensor 20 mm network level 2.
Figure 15: Data fusion results.

404
23
4.6 Discussion After presenting the proposed optimization algorithm for PZT wafer network placement,
the algorithm was tested on several cases. The first set of experiments was conducted on plates with varying geometry having a predefined number of control points and were demonstrated in Figures 4, 5 and 6. The control points assessed for coverage were selected in a manner simulating the geometry of the plate understudy. The first observation was that as the number of control points increased the computational time for solving the optimization problem increased exponentially. The triangular shaped PZT wafer networks were optimized faster than the square and circular networks due to their non-symmetric geometry and fewer control points. Furthermore, coverage levels were defined and Level 3 coverage was experimented on triangular plates and the results shown in Figure 7 demonstrated that additional PZT wafers were needed especially for the control points along the peripheral of the plate. Control points at the center of the plate were naturally covered by several actuator-sensor paths due to the spider web structure of the PZT wafer locations that demonstrated highest overlap levels at the center. Validation of the proposed algorithm was experimented on a triangular plate with 8 PZT wafers against an existing top performer for PZT wafer network optimization and both algorithms converged to optimality with very similar PZT wafer distributions and the results were demonstrated in Figures 10 and 11. Data fusion was carried out to evaluate the actual coverage produced by the optimized PZT wafer locations after aggregation of the coverage produced by each actuator-sensor path. For adequate number of PZT wafers, Level 3 coverage was achieved and data fusion results presented in Figures 15-B and 15-C demonstrated enhanced uniformity between the coverage of the control points throughout the plate. Meanwhile, lower number of PZT wafers used left areas of the plate uncovered while having areas completely covered the fact that described the algorithm behavior focusing on quality coverage of smaller areas rather than poor coverage of larger areas.
Additional experimentation on the behavior of the PZT wafer network optimization algorithm confirmed that the optimization tends to determine new positions of PZT wafers used in the PZT wafer networks when subject to any change in one of the formulation parameters such as the coverage distance, coverage levels, number of PZT wafers and number of control points studied. For instance, the PZT wafer locations determined for an 8-PZT wafer network are completely different and independent of the optimized locations of a 7-PZT wafer network. Networks with same number of PZT wafers and same number of control points produced different PZT wafer locations when optimized for coverage of Levels 2 and 3 respectively (Figures 7, 8 and 9). Furthermore, the optimization behavior was tested with PZT wafers having 20 mm coverage and the results demonstrated that new PZT wafer locations were determined for the same number of PZT wafers and control points used. Even though additional PZT wafers were needed in the 20 mm cases to achieve equivalent coverage to the 40 mm PZT wafer networks however the number of additional PZT wafers needed was reduced to more

405
24
than half indicating the efficiency of the optimizer. PZT wafer locations are shown in Figures 8 and 9 and the data fusion results are demonstrated in Figures 15-D, 15-E and 15-F for Level 2 coverage and 15-G and 15-H for Level 3.
The case of adding control points (Figures 15-I and 15-J) was also studied for triangular PZT wafer networks and the optimization behavior was highlighted. It was shown that new PZT wafer locations were determined along the triangular plate understudy when the number of control points was increased. The new PZT wafer locations when tested have demonstrated improved coverage with increased uniformity keeping in mind that both cases have demonstrated full plate coverage. It was concluded that increasing the number of control points, is capable of producing better coverage with higher uniformity levels along the plate. The key contribution of this attribute is that it provides a tool to achieve improved coverage to specific and critical areas of the plate understudy. Nevertheless, this option has also demonstrated increased computational time when solving and thus is to be used with limitations in the number of control points analyzed.
There exist multiple optimal solutions to the infinite PZT wafer locations along the x and y axis. Nevertheless, several measures were followed to guarantee the robustness of the optimization results as mentioned earlier. In general, few optimization tips can be concluded including spreading PZT wafers around the designated study area and not at center. For localization coverage, Levels 2 and 3 for example, it is recommended to closely allocate PZT wafers in pairs across plate ends. For symmetric plates, symmetric PZT wafer allocation along plate sides performs well as an initial solution to the optimization problem.
This approach proposed allows PZT wafer network optimization on convex surfaces such as pipes and air plane wings but does not accommodate currently for non-convex surfaces such as T-sections since the formulation of the algorithm does not recognize the discontinuity in the surface of the plate and allocates PZT wafers based on the Euclidean distance equations between the actuator-sensor pair and the control points. Hence, the future work in this area is to introduce an advanced optimization algorithm that maximizes areas covered rather than selected points, in addition to PZT wafer failure, non-convex surfaces and other types of solvers.
5. Conclusion An advanced optimization method for PZT wafer network placement has been presented
in this paper. The research introduced a Mixed Integer Non-linear approach capable of optimizing PZT wafer network efficiency in terms of improving coverage level and fault localization. The optimization algorithm focused on maximizing the coverage of control points by allocating PZT wafers at optimal positions. Simulation cases have been optimized for plates

406
25
of different geometries while defining levels of coverage to the areas understudy. Most optimization cases have been tested on triangular plates to avoid symmetric and intuitive PZT wafer locations. The optimization algorithm has been also validated by comparing PZT wafer locations to previous optimization results of similar cases in the field and the main approaches for PZT wafer network optimization presented in literature have been demonstrated also.
Coverage Level 2 and 3 have been defined and tested to evaluate their effect on the behavior of the optimization algorithm in terms of number of PZT wafers needed and their distribution. For the same number of PZT wafers and higher coverage levels, the optimization was capable of finding new PZT wafer distributions that met the coverage requirements. Another important case study presented was the comparison between the use of 20 mm and 40 mm PZT wafer networks. The goal behind this comparison was mainly to assess the algorithm’s efficiency in reducing the number of PZT wafers needed in achieving full plate coverage and to demonstrate the flexibility in handling any change in the coverage parameters. The research also introduced the option of defining areas of concentrated coverage. This contribution can be applied to critical areas or sub-areas of the object understudy by adding control points where needed. A case study for concentrated coverage confirmed that improved coverage can be provided to specific areas for the same number of PZT wafers while maintaining complete plate coverage.
Normalized data fusion of the optimization results within the area of control points have also been presented and have demonstrated improved coverage with higher uniformity levels when compared to the results of preliminary PZT wafer networks. Data fusion has allowed the translation of coverage points to coverage areas and has confirmed the efficiency of the optimizer for the different cases tested. More work is proposed in the near future in order to enhance the performance of the model in terms of computational time and accommodation for non-convex surfaces.

407
26
References
1. Flynn, E.B. and M.D. Todd, Optimal placement of piezoelectric actuators and sensors for detecting damage in plate structures. Journal of Intelligent Material Systems and Structures, 2010. 21(3): p. 265-274.
2. Lynch, J.P. and K.J. Loh, A summary review of wireless sensors and sensor networks for structural health monitoring. Shock and Vibration Digest, 2006. 38(2): p. 91-130.
3. Kim, S., Wireless Sensor Networks for Structural Health Monitoring. 2005: p. 10-11. 4. Soh, C., V. Annamdas, and S. Bhalla, Applications of Structural Health Monitoring
Technology in Asia. Structural Health Monitoring 2015, 2015. 5. Celebi, M., Seismic Instrumentation of Buildings (With Emphasis on Federal
Buildings). 2002, United States Geological Survey: Menlo Park, CA. 6. Farrar, C., Historical overview of structural health monitoring. Lecture notes on
structural health monitoring using statistical pattern recognition. Los Alamos Dynamics, 2001.
7. Farrar, C.R. and K. Worden, An introduction to structural health monitoring. Philosophical Transactions of the Royal Society of London A: Mathematical, Physical and Engineering Sciences, 2007. 365(1851): p. 303-315.
8. Worden, K. and A. Burrows, Optimal sensor placement for fault detection. Engineering structures, 2001. 23(8): p. 885-901.
9. Glassburn, R.S. and S.W. Smith, Evaluation of sensor placement algorithms for on-orbit identification of space platforms. 1994.
10. Xu, Y. and W. Zhu, Non-model-based damage identification of plates using measured mode shapes. Structural Health Monitoring, 2017. 16(1): p. 3-23.
11. Kammer, D.C., Sensor placement for on-orbit modal identification and correlation of large space structures. Journal of Guidance, Control, and Dynamics, 1991. 14(2): p. 251-259.
12. Junghans, L. and N. Darde, Hybrid single objective genetic algorithm coupled with the simulated annealing optimization method for building optimization. Energy and Buildings, 2015. 86: p. 651-662.
13. Jin, S., M. Zhou, and A.S. Wu. Sensor network optimization using a genetic algorithm. in Proceedings of the 7th world multiconference on systemics, cybernetics and informatics. 2003.
14. Ingber, L., Simulated annealing: Practice versus theory. Mathematical and computer modelling, 1993. 18(11): p. 29-57.
15. Kannan, A.A., G. Mao, and B. Vucetic. Simulated annealing based localization in wireless sensor network. in Local Computer Networks, 2005. 30th Anniversary. The IEEE Conference on. 2005. IEEE.
16. Optimal Sensor Placement for Fault Detection. Dynamics and Control Research Group,School of Engineering, The University of Manchester, 2000: p. 895-897.
17. Grossmann, I.E., Review of nonlinear mixed-integer and disjunctive programming techniques. Optimization and engineering, 2002. 3(3): p. 227-252.
18. Bussieck, M.R. and A. Pruessner, Mixed-integer nonlinear programming. SIAG/OPT Newsletter: Views & News, 2003. 14(1): p. 19-22.

408
27
19. Czyzyk, J., M.P. Mesnier, and J.J. Moré, The NEOS server. IEEE Computational Science and Engineering, 1998. 5(3): p. 68-75.
20. Dolan, E.D., NEOS Server 4.0 administrative guide. arXiv preprint cs/0107034, 2001. 21. Gropp, W. and J. Moré, Optimization environments and the NEOS server.
Approximation theory and optimization, 1997: p. 167-182. 22. Huang, C.-F. and Y.-C. Tseng, The coverage problem in a wireless sensor network.
Mobile Networks and Applications, 2005. 10(4): p. 519-528. 23. Bonami, P. and M.A. Lejeune, An exact solution approach for portfolio optimization
problems under stochastic and integer constraints. Operations research, 2009. 57(3): p. 650-670.
24. Bonami, P. and J. Lee, BONMIN user’s manual. Numer Math, 2007. 4: p. 1-32. 25. Belotti, P., et al., Mixed-integer nonlinear optimization. Acta Numerica, 2013. 22: p. 1-
131. 26. Fourer, R., D.M. Gay, and B.W. Kernighan, A modeling language for mathematical
programming. Management Science, 1990. 36(5): p. 519-554. 27. Ausen, H., A Study in MINLP-class Optimization Problems for Simulated Petroleum
Production. 2012, Institutt for teknisk kybernetikk. 28. Mustapha, S., et al., Evaluation of barely visible indentation damage (BVID) in CF/EP
sandwich composites using guided wave signals. Mechanical Systems and Signal Processing, 2016. 76–77: p. 497-517.
29. Ihn, J.-B. and F.-K. Chang, Pitch-catch active sensing methods in structural health monitoring for aircraft structures. Structural Health Monitoring, 2008. 7(1): p. 5-19.

409
Pricing and Inventory Decisions in an EOQ Setting under Logit Demand
Maysaa Jaafar
Industrial and Engineering Management Department American University of Beirut
Beirut, Lebanon [email protected]
Abstract: We consider pricing and inventory decisions of a product under logit demand model. The logit demand model is adopted as it accurately mimics the consumer choice process. On the supply side, we adopt the framework of the Economic Ordering Quantity (EOQ) model. Our analysis proceeds sequentially. For a given price, we determine the optimal order quantity that maximizes the profit. We then analyze the resulting corresponding profit at this optimal inventory level, as a function of the price. In doing so, we develop simple bounds on the optimal price, and then establish that the profit function is unimodal (pseudo-concave) over the range defined by these bounds. Post-optimality analysis includes comparative statics results that analytically establish the monotonicity of the optimal price in several of the model parameters (such as the unit holding cost and fixed holding cost). We also investigate the effect of the supply-side on pricing by (analytically) comparing our optimal price to the classical equilibrium price, adopted in marketing and economics studies, that ignores inventory costs. Numerical results are presented to obtain further insights
I. Introduction:
The most important decisions a retailer has to make include the pricing of the products he is selling and its inventory decisions. When a customer enters a store, major factors that will affect his choice is the retailer’s price: A low price item will have a big market share, but a low profit margin per unit. The retailer’s inventory policy also affect his profit: the retailer has to balance the holding cost and the ordering cost. For that reason, it is beneficial to decide on inventory and pricing jointly. The Economic Ordering Quantity (EOQ) model is the most fundamental model in inventory management. The main objective of this model is to find the ordering quantity that minimizes the total system cost per unit time, which is a tradeoff between the ordering cost and the inventory cost.
II. Literature Review: The logit model, introduced first by Luce (1959), which has received much attention from researchers in several field including marketing, economics and operations management since it accurately mimics the consumer choice process (Li and Huh, 2011). This model is among the most popular consumer choice models (Anderson et al., 1990; Anderson and De Palma, 1992) and has been used extensively in the context of joint inventory and pricing decisions (Aydin and Porteus, 2008;
Maddah et al., 2014; Li and Huh, 2011; Akan et al., 2013). Recent works on the joint pricing and inventory decisions can be further classified based on their solution methodology; some utilize mathematical programming (MP), and others utilize stylized models. In the mathematical programming approach, most authors examine at most two of the three decisions (namely pricing, inventory, and assortment planning) by optimizing on a data-driven model with the exception of Ghoniem and Maddah (2015) who study three decisions simultaneously. Example of works that utilize the MP approach include Dobson and Kalish (1993) and Subramanian and Sherali (2010). The main difference between the MP approach and the stylized model approach is that in the first, authors seek an exact solution for large data-driven models whereas, authors utilizing stylized models are more concerned about gathering insight on the behavior of the profit function and the parameters affecting the profit. Furthermore, the MP approach takes on fewer assumptions. Examples of works that utilize stylized models include Aydin and Ryan (2000); Hopp and Xu (2005); Ryzin and Mahajan (1999); Li and Huh (2011); K¨ok and Xu (2011) and K¨ok and Xu (2011). In this research, we use the stylized approach described earlier where the demand follows the multinomial logit model (MNL) in an EOQ inventory setting where the planning horizon is assumed to be infinite with continuous review. Pricing, Inventory and assortment decisions will be decided on jointly.
III. Model and Assumptions:
Estimation of demand has been an important issue since it answers questions regarding market power based on pricing strategies. One of the main methods to calculate the demand of products is the logit model for consumer choice, introduced by Luce (1959), describes the decision process of customer selecting a product among a set of horizontally differentiated ones. This model was used by researchers in several areas including marketing, economics and operations management. The logit demand model is the best way for demand calculation since the model can be easily estimated from quantity purchased, quality and market-level price because it deals with the endogenous prices. In addition, the logit demand model is able to mimic consumer choice processes making it close to the real world.

410
The following list summarizes the notation used in formulating the model α:mean reservation price r: price D: demand for single item M: total market share h: holding cost c: variable ordering cost K: fixed ordering costs y: order size
i. Single Product Consider a manufacturer and supplier at the same time offering single product .In the logit demand model the customer will associates a utility with product offered
defined by i i iU u , where i i iu r (Maddah and
Bish 2007) with i being the mean reservation price and ir
denote the price of product , and i
are random variables which are independent and identically distributed following a Gumbel distribution. Note that the utility of the no purchase
option isU , where is also a Gumbel random variable, which is independent of .
Next, we use i ir to represent the attractiveness of product. The demand function which is sensitive to price will follow a logit model with being the demand of purchasing product i where M is the total market share given by:
( )1
br
br
eD r Me
. (1)
ii. EOQ with Stochastically Proportional Supply In our model the supply follows the Economic Ordering Quantity Model (EOQ) .The main assumptions of EOQ are: a deterministic and constant demand rate, a fixed setup cost per order, a fixed holding cost per item per unit, and no shortages are allowed (Zipkin, 2000). Consider the single-item EOQ model.Placing an order of size y with ordering cost K+cy dollars, where K and c are the fixed and variable order costs. Holding inventory incurs a unit cost h ($/unit/unit time) which is proportional to average inventory level
Figure 1: illustrates the on-hand inventory sample path of an EOQ model
( ) yT rD r
. (2)
The holding cost per cycle
2
2yh
D r. (3)
Revenue per cycle=
ry Cost per cycle=ordering cost+ holding cost + investment in quality cost
2
2yK cy h
D r . (4)
The objective is to determine the ordering policy y that maximizes the expected profit
2
( )2
yr ry K cy hD r
. (5)
The precise formula for u is derived using the exact method which is the renewal theory. The expected profit per unit time is given by the renewal reward theorem as follows:
2
2= =
Tu
y hry cy KD r
yD r
.
( ) ( )2u
K hyrD r cD r D ry
. (6)
Differentiating implies that
2 2
u KD r hy y
.
2
2u
y
= 3
20
KD ry
. (7)
Therefore we notice as in 7 u is concave in y, so the optimal
order quantity that maximize profit per unit time u is found by
setting the first derivative equal to zero.
2KD ry
h . (8)

411
Substitute y in u
( ) 2 ( )u D r r c KhD r . (9)
IV. Analytical Results:
u
u
i) Theorem 1: (r) positive for r m,rotherwise negative Proof .see Appendix ATheorem 1 states that profit function (r) has two roots at points r and r where r 0,m m>c and r c, .This interval defi
ne the range of reasonable price for which our profit function is positive.Theorem 1 faciltates the search for optimal price r .Then it follows that in order to find the optimal price r we should res
trict our
search to the interval m,r .Theorem 1 make a contribuation to the pricing of productsin EOQ model which indicates that price optimization can be carried out with ease even when the demand st
u
ructure is complex but realistic as our logit demand model Lemma 1:The profit function (r)is unimodal in r for r m,r Proof .see Appendix BTo find the optimal price r the following observation ha
u
s been made: Observation 1 : The profit function (r)is unimodal in r for r m,r .Observation 1 implies thatto find r ,a simple line
search can be made in m,r . We start our analysis by simplifyingt
he profit function and using theorem 6.9 in avriel page 156 we were able to reach the results we made.
ii) Comparative statics
In this section, we analyze the properties of the optimal price
r , while focusing on how it is affected by inventory
considerations. The effect of inventory costs and market share
in magnitude of r .We also study the relation between
optimal price r and “riskless” price, 0r , where the latter
leads to the maximum expected profit when inventory costs are
ignored. The riskless case can be seen as the expected profit of
a make-to-order retailer who carries no safety stock. Formally,
in the riskless case the expected profit function in reduces to:
0 ( )( ).D r r c (10)
The following result, adapted from Li and Huh (2011),
indicates that 0 ( , )p k is a unimodal function in r
r is:
(i) increasing in variable cost c
(ii) increasing in holding cost h
(iii) increasing in fixed cost K
(iv) decreasing in the market share M
Proof .See Appendix D
In the following, we do analytical analysis in studying the
effect of inventory costs on r through studying the sign of
double derivative of the of profit function with respect to the
cost and the price which give the interpretation of the effect of
cost on optimal price r . Then in studying the effect of market
size in r we use the comparison we did between the risky
price, r , with the riskless price 0r . This comparison is an
important question in the literature on the single-product EOQ
model. In our case where our demand is logit we prove that
0 *r r by simplifying the profit into this form:
0 2 ( )Kh Mq r (11)
Then we differentiate the above function with respect to
riskless price 0r and obviously the first term equal to zero so
we left with cost function ˆ ( ) 2 ( )C r KhD r where we
prove that cost function is decreasing in r so the profit function
is increasing in 0r

412
V. Numerical Results:
In our numerical analysis we consider a single item follow an EOQ model .Where Marker share M=1000, our variable cost c=5, fixed ordering cost K=20, b=1, mean reservation price α=5 i) Example for profit function is unimodal in r
Figure3: profit function is unimodal in r
ii)Example shows the effect of inventory costs and market size
in r
Figure2: software analysis shows that r is increasing in variable cost holding cost h, in fixed cost K, and decreasing in the market size M
iii)The General formula of demand function: 1
1
1( )1
b r
b r
M eD rae
In our analysis we took a=1
r( ) D r( ) r c( ) 2K D r( ) h Tal Avinadav, Avi Herbon and Uriel Spiegel consider in their
paper" Optimal ordering and pricing policy for demand functions
that are separable into price and inventory age" a special case of our demand function (in the analysis of their profit function:
1 r T( ) T D1 r( ) r c( )h D1 r( ) T2
2 K
Using Mathcad we verify under the special case of demand function ( 0 ) the two profit functions
give the same price that maximizes profit
References
Akan, M., Ata, B., and Sava¸skan-Ebert, R.C. (2013). “Dynamic pricing of remanufacturable products under demand substitution: a product life cycle model.” Annals of operations research, 211 (1), pp. 1–25. [1]Anderson, S.P. and De Palma, A. (1992). “The logit as a model of product differentiation.” Oxford Economic Papers, 44 (1), pp. 51–67. [2]Anderson, S.P., de Palma, A., et al. (1990). The logit as a model of product differentiation: further results and extensions. Center for Mathematical Studies in Economics and Management Science, Northwestern University. [3]Aydin, G. and Porteus, E.L. (2008). “Joint inventory and pricing decisions for an assortment.” Operations Research, 56 (5), pp. 1247–1255.

413
[4]Aydin, G. and Ryan, J.K. (2000). “Product line selection and pricing under the multinomial logit choice model.” In Proceedings of the 2000 MSOM conference. Citeseer. [5]Dobson, G. and Kalish, S. (1993). “Heuristics for pricing and positioning a product-line using conjoint and cost data.” Management Science, 39 (2), pp. 160–175. [6]Ghoniem, A. and Maddah, B. (2015). “Integrated retail decisions with multiple selling periods and customer segments: optimization and insights.” Omega, 55, pp. 38–52. [7]Hopp, W.J. and Xu, X. (2005). “Product line selection and pricing with modularity in design.” Manufacturing & Service Operations Management, 7 (3), pp. 172–187. [8]K¨ok, A.G. and Xu, Y. (2011). “Optimal and competitive assortments with endogenous pricing under hierarchical consumer choice models.” Management Science, 57 (9), pp. 1546–1563. [9]Li, H. and Huh, W.T. (2011). “Pricing multiple products with the multinomial logit and nested logit models: Concavity and implications.” Manufacturing & Service Operations Management, 13 (4), pp. 549–563. [10]Luce, R.D. (1959). Individual choice behavior: A theoretical analysis. Courier Corporation. [11]Maddah, B. and Bish, E.K. (2007). “Joint pricing, assortment, and inventory decisions for a retailer’s product line.” Naval Research Logistics (NRL), 54 (3), pp. 315–330. [12]Maddah, B., Bish, E.K., and Tarhini, H. (2014). “Newsvendor pricing and assortment under Poisson decomposition.” IIE Transactions, 46 (6), pp. 567–584. [13]Maddah, B. and Jaber, M.Y. (2008). “Economic order quantity for items with imperfect quality: revisited.” International Journal of Production Economics, 112 (2), pp. 808–815. [14]Ryzin, G.v. and Mahajan, S. (1999). “On the relationship between inventory costs and variety benefits in retail assortments.” Management Science, 45 (11), pp. 1496–1509. Subramanian, S. and Sherali, H.D. (2010). “A fractional programming approach for retail category price optimization.” Journal of Global Optimization, 48 (2), pp. 263–277. [15]Zipkin, P.H. (2000). Foundations of inventory management, volume 2. McGraw-Hill New York. [16]Avriel, M.(2003)Nonlinear Programming and Analysis and Methods ,Dover, New York, NY
Appendices:
Appendix A: u (r) positive for r m,r
Proof: ( ) 2 ( )u D r r c KhD r
let
1 , 2 2 , 1 2uK c K Kh D r r K D r K ,
Set ( ) 0u r to get its intersection with x-axis
1 2D r r K K
Let G r = 1D r r K , 2G r K
2 21G r D r r K
( )u r intersection with x-axis is equivalent to:
2 221 2G r D r r K K
Assuming that: 2 20 2 ( )K G r
( )1br
MD re
, where 3M K
22 1
1br
r KG r
e
Recall: 1
2
( )( )( )
h rrh r
1
2
( )( )( )
h rrh r
2
11h r r K Is convex non-positive function
2( ) 1brh r e Is positive and convex function
This implies according to condition 3 in theorem 6.9 in Ariel p
156 that ( )r is pseudo convex
( )r = 2G r is pseudo concave function
22 1
1 0 1r br
r KLimit G r
e

414
2
2
2 2 0r brLimit G rb e
This implies that 2G r 22K has two roots such that
: 220 2K G r so basically profit function has two
roots in its intersection with x-axis.
Appendix B: The Profit Function is a Unimodal in r
Proof: 2u D r r c D r Kh
2KhD r r cD r
Let 2A Kh
rearranging the equation we get:
u D r r c A D r
D r 1
br
br
eMe
1 1
br br
br br
e MeM r c Ae e
11 1 1
br br br
br br br
Me Me er c Ae e e
1
1
br br br
br
Me r c A Me e
e
(Multiply the numerator and denominator by bre )
u = 1
1
br
br
br
M eM r c A
ee
u = 1
2
( )( )
h rh r
2( ) 1brh r e Is negative concave function
1( )h r 1 br
br
M eM r c A
e
Let y= 1 br
br
M ee
And z= M r c (where r-c>0, since our analysis is based
on positive profit margin)
1/ 2
2
112
br br br brbr
br br
b e e b e eM eye e
1/ 2
12
br
br br
M e bye e
2 * 1br br
M bye e
y' is clearly increasing in r so y''>0 hence y is convex in r
1( )h r z Ay
z is linear function and y is convex 1( )h r is a nonnegative
concave function
2 ( )h r Is negative concave function
This implies according to condition 4 in theorem 6.9 in Ariel p
156 ( )r is pseudo convex
( )r = u is pseudo concave function
Appendix C: comparing our optimal price to the classical
equilibrium price, adopted in marketing and economics studies,
that ignores inventory costs.

415
0 ( )( )Mq r r c
0 2 ( )Kh Mq r
0 0
0
0
0
2
2 ( )
0
ˆ ( ) 2 ( )
( )1
ˆ ( ) 21
r r r r
r r
br
br
br
br
Kh Mq rr r r
rC r Kh Mq r
eq re
C r beKhMr e
0 ( , )p k is a unimodal function (Li and Huh (2011))
0
0
0
0
2
0 *
0
0 21
0
r r
br
r r br
r r
rbeKhM
r e
rr r
Therefore In our EOQ model where the demand logit
demand 0 *r r .
Appendix D: Study the effect of inventory costs and market
size on optimal price *r : r c( ) D r( ) r c( ) 2K D r( ) h
Sign of 2r equivalent
c c r
D(r) decreasing in r so -D(r) increasing in r
Implies r is increasing in c
r h( )M e b r
1 e b r
r c( ) 2K D r( ) h
Sign of 2r equivalent
h h r
2
( , ) ( )2
( , ) ( )( )2 2 2 ( )
r h KD rh h
r h K K D rD rh r r h h D r
2 ( ) 0D r and ( )D r is decreasing in r
( )2 2 ( )K D rh D r
≥0
Implies r is increasing in h
r K( )M e b r
1 e b r
r c( ) 2K D r( ) h
Sign of 2r equivalent
K K r
2 ( ) 0D r and ( )D r is decreasing in r
2 ( )2 ( )
h D rK D r
≥0
Implies r is increasing in K
*
0
0
2
( , ) ( )( ) 2 ( )
( , ) ( ) ( ) ( ) 2
2
( , ) ( ) ( ) ( )
( ) ( )( )( )( )22
( )( )( ) , ( )( )
22
2 2
0 (r r
r M Mq r r c Kh Mq r
r M Mq r r c Mq r Kh
Kh
r M Mq r r c Mq r
q r q r r cMq r r cM Mq r
Mq r r c Mq r r cMM
M M M
M r r
001) ( )
2 2M M r
*
2 0010 ( ) ( )
r rM r r M M r
0 *r r (Proof: see Appendix B)
*
2
0r rM r
Implies r is decreasing in M

416
Standardized Cargo Network Revenue Management with Dual Channels
Maya JalloulDepartment of Industrial Engineering and Management
American University of BeirutBeirut, Lebanon
Abstract-One of the most complex problems that cargo managers face is making decisions regarding the acceptance of cargo requests under stochastic and time-dependent demand. In this paper, we consider a practical and realistic model of this problem which accounts for different request types (contracts and spot requests). Although time-dependent demand is realistic and practitioners are aware of the inefficiencies of ignoring time-dependent demand, the advantages of accounting for time-dependency are offset by the added computational complexity. We consider time-dependent and stochastic demand and provide an efficient approach to analyze and optimize such systems. Monte Carlo simulation is applied to create realistic demand patterns. We use dynamic programming to find the optimal solution for small to medium-sized problems and we provide several computationally efficient heuristics as an alternative to the computationally prohibitive dynamic programming approach.
I. INTRODUCTION
Cargo revenue management has been gaining importance over the years as it is one of the areas under operations research where little to no additional effort can result in big changes in total profits. The study of the stochastic nature of demand and the application of dynamic programming can help the cargo managers make more well-informed decisions. As we will see in the literature review, extensive research has been done for the shipment of merchandise, looking at different sides of the problem. In our paper, we consider two demand types, bids and spots to be transported over a network. We assume that profits and required capacity for bid products is known so the cargo manager should choose among a set of bid requests. As for spot products, requests arrive over time which requires studying the probability of arrivals. Another factorthat adds to the complexity of the problem is the variability of demand over time; we are assuming that demand increases with time. When the maximum capacity is exceeded, an offload cost is incurred.
II. LITERATURE REVIEW
In L. Moussawi's paper, Optimal solution for a cargo revenue management problem with allotment and spot arrivals, demand was considered to be of two types as well, spots and bids [1]. Requests were studied based on weight and volume where a limit was set to each dimension and the problem was solved using dynamic programming [1]. Unlike our proposed research, Moussawi's paper studied the optimization problem over a single leg.
In X. Wang's paper, Optimal Allocation of Limited and Random Network Resources to Discrete Stochastic Demands
for Standardized Cargo Transportation Networks, the problem is formulated as a stochastic integer programming model [2]. Capacity is assumed to be random and two types of containers of different sizes are considered [2]. The merchandise is also transported over a network but, unlike our case, Wang only studies the spot market and attempts to find an integral quantity of booking requests to be accepted for each product to maximize the expected profit [2]. It is worth noting that, unlike our study, Wang determined the values of the decision variables ahead of time and not as time passes. Obviously, accounting for intermediate events results in higher precision in the results.
III. PROBLEM FORMULATION
For now, the detailed formulation is written at the end of this paper.A. Model• m: number of resources• v: number of spot products• w: number of bid products• n: total number of products (n= v + w)
IV. NUMERICAL RESULTS
Rigorous analysis of the outputs of the dynamic program has allowed us to confirm its accuracy. We observed the changes in the value function upon modifying revenues for spots and bids, offload costs, accepted bid products and other parameters. We noticed that the value function increases with the increase in revenue for spots or bids, it increases with time and with the increase of accepted bid products. It decreases with the increase in offload cost or currently occupied capacity. And finally, the value function is not affected by the revenue from bids if no bids are accepted and is not affected by currently occupied capacity when the offload cost is negligible. We noticed that a maximum of 3 legs in the network is acceptable to limit the computation time as the precision in the formulation imposes high computational complexity.
V. CONCLUSIONS
The numerical analysis is still in progress, but until now, we have been able to solve small problems using the DP approach. We will soon test a realistic problem to check its computational complexity. It seems that the DP approach is computationally efficient when demand, available capacity and number of legs

417
Standardized Cargo Network Revenue Management with Dual Channels
Maya JalloulDepartment of Industrial Engineering and Management
American University of BeirutBeirut, Lebanon
Abstract-One of the most complex problems that cargo managers face is making decisions regarding the acceptance of cargo requests under stochastic and time-dependent demand. In this paper, we consider a practical and realistic model of this problem which accounts for different request types (contracts and spot requests). Although time-dependent demand is realistic and practitioners are aware of the inefficiencies of ignoring time-dependent demand, the advantages of accounting for time-dependency are offset by the added computational complexity. We consider time-dependent and stochastic demand and provide an efficient approach to analyze and optimize such systems. Monte Carlo simulation is applied to create realistic demand patterns. We use dynamic programming to find the optimal solution for small to medium-sized problems and we provide several computationally efficient heuristics as an alternative to the computationally prohibitive dynamic programming approach.
I. INTRODUCTION
Cargo revenue management has been gaining importance over the years as it is one of the areas under operations research where little to no additional effort can result in big changes in total profits. The study of the stochastic nature of demand and the application of dynamic programming can help the cargo managers make more well-informed decisions. As we will see in the literature review, extensive research has been done for the shipment of merchandise, looking at different sides of the problem. In our paper, we consider two demand types, bids and spots to be transported over a network. We assume that profits and required capacity for bid products is known so the cargo manager should choose among a set of bid requests. As for spot products, requests arrive over time which requires studying the probability of arrivals. Another factorthat adds to the complexity of the problem is the variability of demand over time; we are assuming that demand increases with time. When the maximum capacity is exceeded, an offload cost is incurred.
II. LITERATURE REVIEW
In L. Moussawi's paper, Optimal solution for a cargo revenue management problem with allotment and spot arrivals, demand was considered to be of two types as well, spots and bids [1]. Requests were studied based on weight and volume where a limit was set to each dimension and the problem was solved using dynamic programming [1]. Unlike our proposed research, Moussawi's paper studied the optimization problem over a single leg.
In X. Wang's paper, Optimal Allocation of Limited and Random Network Resources to Discrete Stochastic Demands
for Standardized Cargo Transportation Networks, the problem is formulated as a stochastic integer programming model [2]. Capacity is assumed to be random and two types of containers of different sizes are considered [2]. The merchandise is also transported over a network but, unlike our case, Wang only studies the spot market and attempts to find an integral quantity of booking requests to be accepted for each product to maximize the expected profit [2]. It is worth noting that, unlike our study, Wang determined the values of the decision variables ahead of time and not as time passes. Obviously, accounting for intermediate events results in higher precision in the results.
III. PROBLEM FORMULATION
For now, the detailed formulation is written at the end of this paper.A. Model• m: number of resources• v: number of spot products• w: number of bid products• n: total number of products (n= v + w)
IV. NUMERICAL RESULTS
Rigorous analysis of the outputs of the dynamic program has allowed us to confirm its accuracy. We observed the changes in the value function upon modifying revenues for spots and bids, offload costs, accepted bid products and other parameters. We noticed that the value function increases with the increase in revenue for spots or bids, it increases with time and with the increase of accepted bid products. It decreases with the increase in offload cost or currently occupied capacity. And finally, the value function is not affected by the revenue from bids if no bids are accepted and is not affected by currently occupied capacity when the offload cost is negligible. We noticed that a maximum of 3 legs in the network is acceptable to limit the computation time as the precision in the formulation imposes high computational complexity.
V. CONCLUSIONS
The numerical analysis is still in progress, but until now, we have been able to solve small problems using the DP approach. We will soon test a realistic problem to check its computational complexity. It seems that the DP approach is computationally efficient when demand, available capacity and number of legs
in the network is low, but we need to use the suggested heuristics for medium to large problems.
ACKNOWLEDGMENT
I would like to thank my thesis advisors Professor Walid Nasr from the Department of Industrial Engineering and Management and Professor Lama Moussawi from the Suliman S. Olayan School of Business. The door of Prof. Nasr and Prof. Moussawi has always been open for any questions I have and they always give me constructive feedback for my work.
REFERENCES
[1] L. Moussawi, "Optimal solution for a cargo revenue management problem with allotment and spot arrivals", Ph.D, American University of Beirut, 2014.
[2] X. Wang, "Optimal Allocation of Limited and Random Network Resources to Discrete Stochastic Demands for Standardized Cargo Transportation Networks", Ph.D, Mississippi State University, 2016.

418
Standardized Cargo Network Revenue Management withDual Channels
1 Model
• m: number of resources.
• v: number of spot products.
• w: number of bid products.
• n: total number of products (n = v + w).
• p(1,v)
: price vector for spot products.
• r(1,w)
: price vector for bid products.
• A(m,v)
: spot resource utilization matrix - A(i, j) number of resources i used by spot product j
and 0 otherwise, for i = 1, . . . , v, j = 1, . . . ,m.
• B(m,w)
: bid resource utilization matrix - B(i, j) number of resources i used by bid product j and
0 otherwise, for i = 1, . . . , w, j = 1, . . . ,m.
• αt(v,1)
: time-dependent demand rate vector for spot products at time t ≥ 0.
• βt(w,1)
: time-dependent demand rate vector for bid products at time t ≥ 0.
• xt(m,1)
: capacity vector at time t - xt(i) available resource for bid i, i = 1, . . . ,m.
• ut(xt,p): decision variable - ut(j;xt,p) = 1 if product j is loaded at time t, for j = 1, . . . , v+w.
• b(w,1)
: decision variable denoting which bids to accept.
A bid item with b(i) = 1 has to be loaded regardless of the incurred cost, whereas a bid item
with b(i) = 0 is no longer a potential customer, for i = 1, . . . , w.
A spot item which arrives can be loaded or refused service depending on the current resource
capacity and point in time. We define the decision variables s(i) = 1 if spot item is a desirable
item at time 0 and s(i) = 0 if it is not a desirable spot item at time 0, for i = 1, . . . , v.
1

419
Notice that the decision variables b and s are determined at the start of the time horizon
(at time 0), the decision as denoted in b is binding throughout the time interval [0, T ]. The
decision as represented by s is not binding and can spots can be denied demand or accepted
depending on the current resource capacity and the current point in time.
2 The Time-Dependent Demand Process
st(v,1)
: Decision variable denoting which spots to accept at time t ∈ [0, T ].
The demand processes for spot and bid items over the time interval [0, T ] are assumed to follow a
Non-homogeneous Poisson Process (NHPP).
For t ∈ [0, T ] let,
λt = αt 1 denote the arrival rate of spots at time t and,
µt = βt1 denote the arrival rate of bids at time t.
The time interval [0, T ] is divided into θ consecutive and non-overlapping time intervals of duration
∆ = T/θ. In section 2.1 we consider the probability distribution of the demand process over the time
intervals of duration ∆. In Section 2.2 we consider the probability distribution of the total demand
over the time interval [0, t] for 0 < t < T .
2.1 Time-Dependent Demand Distribution
Let Dτ be the random variable representing the realization of the type of demand product over the
ith time interval of duration ∆ for i = 1, . . . , θ. Consider the following possible realizations of Dτ for
τ = 1, . . . , θ,
Dτ =
0 if no demand is realized over the τ th time interval,
k if demand for bid of type k is realized over the τ th time interval for k = 1, . . . , w,
w + k if demand for spot of type k is realized over the τ th time interval for k = 1, . . . , v.
The probability distribution of Dτ for τ = 1, . . . , θ,
Prob(Dτ = 0) = e−(λt+µt)∆ ≈ 1− (λt + λt)∆, where t = (τ − 1)∆, (1)
Prob(Dτ = k) ≈
βt(k)
λt + µt∆ for 1 ≤ k ≤ w and t = (τ − 1)∆,
αt(k)
λt + µt∆ for w + 1 ≤ k ≤ w + v and t = (τ − 1)∆.
(2)
2

420
2.2 Time-Dependent Demand Distribution
Define the mean value function by time t ∈ [0, T ],
αt(v,1)
where αt(j) =
∫ T
tαt(j) dt, for j = 1, . . . , v.
βt(v,1)
where βt(j) =
∫ T
tβt(j) dt, for j = 1, . . . , w.
• Jt(i) is the total requested utilization of resource i over the time interval [t, T ] if all the spot
products arriving in the time interval [t, T ] are loaded.
• Rt(i) is the total requested utilization of resource i over the time interval (t, T ] from all the
bid products arriving in the time interval [t, T ].
The random variable Jt(i) at time t ∈ [0, T ] is a Compound Poisson Process where the Poisson arrival
process has a mean of∑v
j=1 αt(j). Let Mt(i) be the reward per arrival at time t for i = 1, . . . ,m,
E[Mt(i)] =v∑
j=1
A(i, j) s(j) Γs,t(j), (3)
E[M2t (i)] =
v∑j=1
(A(i, j) s(j))2 Γs,t(j), (4)
where Γs,t(j) is the probability an arrival is of type j at time t,
Γs,t(j) =αt(j)
αt(j) + βt(j)for j = 1, . . . , v. (5)
The mean and variance of Jt(i) for i = 1, . . . ,m,
E[Jt(i)] = E[Mt(i)]
v∑j=1
αt(j), (6)
Var(Jt(i)) = E[M2t (i)]
v∑j=1
αt(j). (7)
Similarly, the random variableRt(i) is a Compound Poisson Process where the Poisson arrival process
has a mean of∑w
j=1 βt(j). Let Nt(i) be the reward per arrival at time t > 0 for i = 1, . . . ,m. The
first two moments of the reward per arrival at time t for i = 1, . . . ,m,
E[Nt(i)] =
w∑j=1
B(i, j)b(j) Γb,t(j), (8)
E[N2t (i)] =
w∑j=1
(B(i, j)b(j))2 Γb,t(j), (9)
3

421
where Γb,t(j) is the probability an arrival is of type j at time t,
Γb,t(j) =βt(j)
αt(j) + βt(j)for j = 1, . . . , w. (10)
The mean and variance of Rt(i) for i = 1, . . . ,m,
E[Rt(i)] = E[Nt(i)]
w∑j=1
βt(j), (11)
Var(Rt(i)) = E[N2t (i)]
w∑j=1
βt(j). (12)
3 Service Level
Let S(i) = c(i) − R0(i), where R0(i) is the total requested utilization of resource i over the time
interval (0, T ], for i = 1, . . . ,m. For a service level ε,
Prob(S(i) < 0) < ε, for i = 1, . . . ,m. (13)
Prob(S(i) < 0) = Prob(R0(i) > c(i)) ≈ Prob(Z > c(i)), (14)
where Z is Norm (E[R0(i),Var(R0(i))). The mean and variance of R0(i) for i = 1, . . . ,m,
E[R0(i)] = E[N0(i)]
w∑j=1
β0(j), (15)
Var(R0(i)) = E[N20(i)]
w∑j=1
β0(j). (16)
The objective is to take as many bids as possible while satisfying the service constraint.
4 Phase 1
The objective function for Phase 1,
Φ(b, s; c) =
w∑j=1
r(j)b(j) β0(j) +v∑
j=1
p(j) s(j) α0(j)
−m∑j=1
hj E[max(R0(j) + J0(j)− c(j), 0)]
(17)
4

422
The integer programmaxb,s
Φ(b, s)
S.T. Prob(S(i) < 0) < ε, for i = 1, . . . ,m
5 Phase 2
Expected Cost Function,
Vt(xt) = E[r(Dt)b(Dt) + Vt+1(xt −B[Dt]))
]
+E[maxu
p(Dt)ut(Dt) + Vt+1(xt −A[Dt] u(Dt))
]
=
w∑k=1
ProbDt = k(r(k)b(k) + Vt+1(xt −B[k]))
)
+w+v∑
k=w+1
ProbDt = k(maxu
p(k − w)ut(k − w) + Vt+1(xt −A[k−w] ut(k − w))
)
(18)
VT (x) = hx−, where x−(i) = −x(i) if x(i) < 0 and 0 otherwise.
6 Heuristic
At any point in time t ∈ [0, T ],
Φt(b, s;xt) =w∑
j=1
r(j)b(j) βt(j) +v∑
j=1
p(j) s(j) αt(j)
−m∑j=1
hj E[max(Rt(j) + Jt(j)− xt(j), 0)]
(19)
6.1 Spot acceptance criteria
If spot j is realized at time t ∈ [0, T ] and the system is in state xt for j = 1, . . . , v, then the spot is
loaded if the following inequality is satisfied,
5

423
Φt(b, s;xt −A[j]) + p(j)− Φt(b, s;xt) > 0
=⇒ −m∑i=1
hi E[max(Rt(i) + Jt(i)− xt(i)−A(j, i), 0)] + p(j)
+m∑i=1
hi E[max(Rt(i) + Jt(i)− xt(i), 0)] > 0
=⇒m∑i=1
hi
(E[max(Rt(i) + Jt(i)− xt(i), 0)]
−E[max(Rt(i) + Jt(i)− xt(i)−A(j, i), 0)]
)< p(j)
(20)
If spot j is realized at time t ∈ [0, T ] and the inequality is satisfied then xt = xt −A[j]. If bid j is
realized at time t ∈ [0, T ] then xt = xt −B[j] for j = 1, . . . , w,
δt =
m∑i=1
hi
(E[max(Rt(i) + Jt(i)− xt(i), 0)]− E[max(Rt(i) + Jt(i)− xt(i)−A(j, i), 0)]
)
Let Yt(i) = Rt(i) + Jt(i) for i = 1, . . . ,m,
=⇒ E[Yt(i)] = E[Mt(i)]v∑
j=1
αt(j) + E[Nt(i)]w∑
j=1
βt(j), (21)
and Var(Yt(i)) = E[M2t (i)]
v∑j=1
αt(j) + E[N2t (i)]
w∑j=1
βt(j). (22)
δt =
m∑i=1
hi
([E[Yt(i)]−xt(i)+Var(Yt(i))
f(γ1)
1− F(γ1)
]−[E[Yt(i)]−xt(i)−A(j, i)+Var(Yt(i))
f(γ2)
1− F(γ2)
])
=⇒ δt =
m∑i=1
hi
(A(j, i) + Var(Yt(i))
( f(γ1)
1− F(γ1)− f(γ2)
1− F(γ2)
)), (23)
where γ1(i) =−(E[Yt(i)]− xt(i))
Var(Yt(i))and γ2(i) =
−(E[Yt(i)]− xt(i)−A(j, i))
Var(Yt(i)),
and the probability and cumulative distributions of the standard Normal are denoted by f and F,
respectively.
7 Decomposition Heuristic
We decompose the problem into m single resource problems, each of which is solved independently.
Then the total value function is approximated by
6

424
Vt(x) =m∑i=1
Vt(xi), i = 1 · · ·m (24)
where the single resource value function Vt(xi) is given by
Vt(xi) = E[r(Dt)b(Dt) + Vt+1(xi −Bi [Dt]))
]
+E[maxu
p(Dt)ut(Dt) + Vt+1(xi −Ai [Dt]u(Dt))
](25)
VT (xi) = hx−i , where x−i = −xi if xi < 0 and 0 otherwise.
Theorem 1 Let xi be the remaining capacity for resource i . Then, Vt(x) ≤∑m
i=1 Vt(xi), for
t = 0 · · ·T .
As a result of Theorem 1, the total expected profit has the following upper bound
V =
m∑i=1
V0(Ci). (26)
7
References
[1] R. Hellermann. Capacity options for revenue management: Theory and applications in air cargo
industry. Springer, 2006.
[2] L. R. Weatherford and B. E. Pfeifer. The economic value of using advance booking of orders.
Omega, Vol. 22, No.1, pp. 105-111, 1994.
8

425
The Ergonomic Benefits of a Laterally-Tilted Operating Room Table and Friction-Reducing
Devices when Laterally Transferring Patients to Stretchers
Adnan El Tannir
Industrial Engineering and Engineering Management American University of Beirut
Beirut, Lebanon [email protected]
Abstract- The nursing profession continues to have one of the
highest injury rates relative to other occupations – more than construction, manufacturing, and mining. Nurses perform various physically demanding tasks while handling patients. A commonly performed task is the lateral transfer of a patient from one surface to another (e.g. operation room table, stretcher, or hospital bed). This task is classified as one of the most hazardous nurse activities that poses high risk for the development of work- related musculoskeletal disorder (WMSD). Therefore, this research proposes an alternative manual method for performing lateral transfers, which is hypothesized to be safer for the nurse’s well-being. The ergonomic benefits of tilting the operating room (OR) table when transferring patients from the OR table to a stretcher will be examined. The objectives of this research are: (1) to examine the effects of the OR table’s lateral angle (flat vs tilted) on the physical load acting on the nurse, using an electromyography (EMG) device and subjective ratings of perceived exertion; and (2) to compare three types of friction- reducing devices at both table angles and determine the most- effective combination for reducing physical load on nurses. Fifteen healthy participants will be recruited, including nurse assistants, registered nurses, and student nurses. Participants will perform lateral transfers at both bed angles using three different friction-reducing devices. During the experimental tasks, EMG data will be collected from eight muscles from the back, shoulder, and neck regions. After each task, they will be administered a Borg-scale to rate their overall perceived physical exertion and a discomfort scale to rate their level of discomfort at different body regions. The time to perform each task will be measured to determine the most efficient combination of bed angle and friction-reducing device. This research is currently at the initial steps of the data collection phase with only one experiment completed so far. The results showed that the tilted OR table reduced the muscle loading by 28.9% at the trapezius muscle, 58.0% at the latissimus dorsi muscle, 24.5% at the erector spinae muscle, 52% at the posterior deltoid muscle, and 63% at the sternocleidomastoid muscle. The results are promising, showing that the redesign of the job can significantly reduce the physical loads on the musculoskeletal system.
I. INTRODUCTION
The nursing profession continues to have one of the highest rates of injuries relative to other occupations – more than
construction and manufacturing. The Bureau of Labor Statistics 2015 [1], reported that, in 2014, the annual injury and illness rates per 10,000 full-time workers requiring days away from work to recuperate was 309.7 for construction laborers, 250.7 for maintenance and repair workers, 209.8 for automotive service technicians and mechanics, while nursing assistants had an annual rate of 372.5. Of all the injury and illness cases that occurred to nursing assistants that year, work- related musculoskeletal disorder (WMSD) cases accounted for 54%. Nurse assistants had the highest WMSD incidence rates when compared to all other occupations, reporting an incidence rate of 199.8 [1]. A major cause of injuries and WMSDs among nurses are the physically strenuous tasks required of them, such as repositioning a patient in bed, sitting the patient on the side of the bed, transferring patients between a wheel-chair and a bed, and pulling a patient from one bed to a stretcher [2-3]
A commonly performed task among nurses is the lateral transfer of a patient from one surface to another (e.g. operation room table, stretcher, or hospital bed; Figure 1). These transfers are either performed manually by one or two nurses or with lifting-aids, such as a ceiling-lift or a friction-reducing device [4]. However, even with the availability of lifting aids, nurses tend to rely more on manual transfers to avoid searching for equipment and/or because the manual transfer is more time- efficient. A study by Evanoff in 2003 revealed that only 34% of nurses working in 30 nursing units of four acute care facilities reported using mechanical lifts [5]. The mechanical lifts were avoided for the following reasons: required high physical effort; difficult to maneuver especially in small spaces; more time consuming; and lack of adequate training [6].
In a recent survey conducted in Lebanon of 39 short term hospitals, it was found that 71% of nurses reported having a WMSD. Also, about 88.5% of nurses reported unavailability of patient handling equipment at their place of work [7].Furthermore, the limited space in patient rooms often does not permit the use of patient handling equipment or makes it difficult to maneuver.

426
Since PHTs are often performed manually, this research proposes an alternative manual method for performing lateral transfers, which is hypothesized to be safer for the nurse’s well-being. This research proposes to investigate the ergonomic benefits of tilting the operating room (OR) table when transferring patients from the OR table to a stretcher. The tilted-table will have the advantage of gravity, allowing the patient to slide down to the stretcher with less effort from the nurse. Another benefit of this method is that it can be performed with the current resources in the hospital with no need to acquire new equipment. The objectives of this research will be: (1) to examine the effects of the OR table’s lateral angle (flat vs tilted) on the physical load acting on the nurse, using an electromyography (EMG) device and subjective ratings of perceived exertion; and (2) to compare three types of friction-reducing devices at both table angles and determine the most-effective combination for reducing physical load on nurses.
II. METHODOLOGY
A. Participants Two different sets of participants will be recruited to serve
as nurses and patients. Concerning the nurse group, a total of 15 male participants in good health will be recruited. This sample size is common in ergonomics research and will be sufficient for data analysis. The participants will be nurse assistants, registered nurses, or nurse students from the American University of Beirut – Medical Center (AUB-MC). Another 15 participants in good health will be enrolled in this study to act as the patients. These participants will primarily be college students from both genders. The nurse and patient participants will be compensated with $20 and $10 for every hour of participation, respectively. Nurses will be paid at a higher rate considering their professional position and because their tasks will be more physically involved.
The experimental procedures and the demands of the testing will be explained to all participants and their signatures will be obtained on informed consent forms approved by the AUB institutional review board (IRB). The Physical Activity Readiness Questionnaire (PAR-Q, British Columbia Ministry of Health) will be used to screen participants for cardiac and other health problems, such as dizziness, chest pain, or heart trouble [8]. Any participant who answers yes to any of the questions on the PAR-Q will be excluded from the study. Basic demographic information of the participants will be collected,
including their gender, age, weight, height, and years of experience as a nurse.
B. Tools and Equipment Electromyography (EMG) system. A Tringo wireless EMG system (Delsys Inc., Boston, MA, USA) will be used to measure the electrical activities of the shoulder, neck, and back muscles. Eight rectangular (37mm x 26mm x 15mm, 14g) Ag/AgCL sensors will be used. The Trigno electrode has a band-pass filter of 20–450 Hz and a common mode rejection ratio of 80 dB. Unlike other EMG systems, the Tringo system does not require the use of a reference electrode. The EMGworks software will be used for processing and analyzing the collected data.
Borg scale. The Borg CR-10 (category ratio; Figure 2) scale will be used for subjective evaluations of the overall physical exertion associated with the patient-handling tasks [9-11].The scale ranges from “nothing at all” to “very very difficult.” A zero means that there is no exertion at all involved with the physical exercise. A ten means “very very difficult,” indicating that the exercise is the strongest physical task ever experienced. An exertion falling between the two extremes is rated with any number between zero and ten. Perceived exertion using a Borg scale has been proven useful in estimating the actual intensities of exertions [12].
Discomfort scale and body map. A body map adopted from [13] will be used (Figure 3) for participants to rate their perceived level of localized musculoskeletal discomfort (LMD) at the neck (1), shoulders (2), upper back (5), mid back (6), and lower back (7). The LMD method [14] was based on the Borg category ratio (CR-10) scale. The LMD method uses both numbers and verbal intensity descriptors to rate the level of discomfort. Ratings of discomfort range between 0 and 10, where 0 means “no discomfort at all” and 10 mean “extreme discomfort, almost maximum.” Except for the rating of 0.5 (extremely little discomfort), only round numbers will be presented. However, participants will be free to choose any intermediate number using decimals.
Stopwatch. A stopwatch will be used to time the experimental tasks to determine the efficiency of each lateral transfer method.
OR table and stretcher an adjustable OR table will be used at AUB-MC. The table will be adjustable in height and the level of lateral tilt. Also, a stretcher will be used to simulate the patient-handling task (PHT) of transferring a patient from an OR table to a stretcher.

427
Figure 1: Borg CR-10 scale.
Friction-reducing devices Three types of friction-reducing devices will be compared. A
description of each device and the technique on how to use it is provided below: Blanket (B): Before the lateral transfer, a blanket sheet would already be laid under the patient. To transfer the patient, one nurse will pull and slightly lift the blanket from one side and an assistant from the other side would push and slightly lift the blanket. This is the traditional and more common approach used in the OR unit at AUB-MC. Plastic bag (PB): Similar to the above method, except a plastic bag will be used instead of the blanket. The plastic bag is expected to have less friction with the OR table and the stretcher, making it easier to slide the patient across the two surfaces. Sliding board (SB): A sliding board of low friction will be slipped almost halfway beneath the blanket and the patient. The board will cross over the sides of the OR table and the stretcher, making the blanket method easier to perform with the reduced friction.
C. Experimental Task The experiment will involve six different PHTs of a patient
by a nurse and an assistant. The experimenter will act as the assistant. The six tasks are as follows: Flat OR table with blanket: Nurse will perform a lateral transfer of a patient with the OR table flat using the blanket method. Flat OR table with plastic bag: Nurse will perform a lateral transfer of a patient with the OR table flat using the plastic bag method. Flat OR table with sliding board: Nurse will perform a lateral transfer of a patient with the OR table flat using the sliding board method. Tilted OR table with blanket: Nurse will perform a lateral transfer of a patient with the OR table tilted using the blanket method. Tilted OR table with plastic bag: Nurse will perform a lateral transfer of a patient with the OR table tilted using the plastic bag method. Tilted O R table with sliding board: Nurse will perform a lateral transfer of a patient with the OR table tilted using the sliding board method.
A couple of variables will be controlled in the experiment. Firstly, the assistant will be the same person (the experimenter) in all experiments to maintain a consistent level of assistance across all participants. Also, the bed height will be set at the nurse participant’s waist level to control the effect of bed height in the experiment.
D. Experimental Design A two-factor repeated measures design will be used. The
independent variables in this research will be the OR table
Figure 2: Discomfort Body Map (Corlett and Bishop, 1976; Van der Grinten and Smitt, 1992).

428
angle (flat or tilted) and the type of friction-reducing device (B, PB, and SB). Therefore, participants will perform a total of six trials (tasks). The order of the experimental tasks will be randomized for each participant. The dependent variables in this research will be the time to complete the transfer, Borg- ratings, discomfort ratings, and maximum EMG activities of the left and right erector spinae, latissimus dorsi, posterior deltoid, and upper trapezius muscles.
E. Data Collection and Processing Orientation Each participant will be given an orientation, introducing them to the equipment, data collection procedures, and specifics of the experimental tasks. After the orientation, they will be asked to sign the IRB form. Following that, demographic information (age, height, weight, gender, position title, and years of experience in that position) of the participants will be recorded. Then the participants will undergo a three to five minute warm-up session with different stretches for the joints involved in the experiment.
EMG Preparation Subsequent to the warm-up session, preparations will be made to ready the participants for EMG data acquisition. Any hair on the skin will be removed at the right and left upper trapezii, posterior deltoids, latissimus dorsi, and erector spinae muscles. Also, the same areas will be cleaned with alcohol to remove dead skin cells, dirt, and sweat. After cleaning the skin, EMG surface electrodes will be attached to the muscles of interest parallel to the muscle fibers. The following electrode locations will be adopted: Upper Trapezius: the electrode will be placed 2 cm lateral to the midpoint between C7 spinous process and the posterolateral border of the acromion [14,16,17] Posterior Deltoid: in the prone position with the shoulder abducted to 90o and the elbow flexed to 90o, the electrode will be placed 2 cm below the lateral border of the scapular spine in an oblique angle towards the arm (i.e. parallel to muscle fibers) [14]. Latissimus Dorsi: the electrode will be placed at an oblique angle (~25o) approximately 4 cm below the inferior tip of the scapula and midway between the spine and lateral edge of the torso [14]. Lumbar Erector Spinae: the electrode will be placed 2 cm lateral to the L3 spinous process parallel to the muscle fibers [14]. Comparison of EMG between and within participants will require normalizing the EMG data. To do this, participants will first perform a series of maximum voluntary contractions (MVC). The MVC exertions will be performed for each investigated muscle separately against manual resistance from
the examiner. The following MVC techniques will be used for the muscles of interest: Upper Trapezius: participants will perform a form of resisted shoulder abduction [15].In this technique, the arm will be abducted 90o while the neck is laterally flexed to the same side, rotated to the opposite side, and extended. Resistance will be applied at the elbow against further arm abduction and at the head against further neck extension. Figure 4a illustrates the starting position and the direction of resistance (red arrow) and force production (blue arrow) in this test. Posterior Deltoid: participants will be asked to lie in the prone position with the shoulder abducted 90o and the elbow flexed 90o. Shoulder extension will be performed against manual resistance at the distal end of the humerus[14][18][19] . Figure 4b illustrates this MVC technique along with the forces of the experimenter and participant. Latissimus dorsi: participants will perform a chest- supported shoulder extension [20].This technique begins in a standing position with a flexed back, while resting the chest on an examination table. Maximal shoulder extension is performed against manual resistance at the elbow. Figure 4c illustrates this MVC technique along with the forces of the experimenter and participant. Erector spinae: participants will perform hip extension [21]. This test is performed with participants lying prone with their upper trunk strapped to the examination table. The legs will be extended horizontally off the table end. At the signal, participants will attempt to raise their legs and extend the hips against manual resistance at the knees. Figure 4d illustrates this MVC technique along with the forces of the experimenter and participant.
Figure 3: MVC techniques for the: (a) upper trapezius, (b) posterior deltoid, (c) latissimus dorsi, and (d) lumbar erector
spinae muscles.

429
The maximum EMG activities in the MVC exertions will be used for normalizing the EMG data collected in the experimental tasks. Each MVC exertion will be repeated three times. To avoid muscular fatigue, repetitions will be separated with 30 to 60 seconds of rest and MVC sets will be separated with 2 minutes of rest. T h e maximum EMG activity of the three repetitions will be used for normalizing the EMG data. During MVC exertions, EMG data will be collected for a period of 15 seconds, giving participants enough time to reach their maximum exertion.
Experimental Trials After the MVC exertions, participants will perform the
experimental tasks (see Section 2.3) in random order. They will be instructed to perform the lateral transfer with a gradual increase in force exertion to avoid straining a muscle. At least three minutes of rest will be provided between trials [22], and if requested, they will be given more time to rest. EMG activity will be recorded throughout each trial bilaterally from the upper trapezii, posterior deltoids, latissimus dorsi, and erector spinae muscles. EMG data will be collected at a sampling rate of 2000 Hz and processed using the root mean square (RMS) method with a time window of 0.125 s and an overlap of 0.0625 [23-24]. The peak activation of each muscle in each trial will be normalized with respect to the maximum EMG activity of its corresponding MVC exertion. Thus, results for each muscle will be reported as a percentage of the muscle’s MVC (%MVC). The time to complete each trial will be recorded. Also, after each trial, participants will be asked to rate their perceived exertion on a Borg CR-10 scale and to rate their LMD at the neck, shoulders, and the entire back. All the participants will be provided with a brief explanation on how to use both scales. They will be instructed to base their ratings solely on how they personally perceive the PHT to be without considering the thoughts of others.
G. Statistical Analysis Repeated measures analysis of variance (ANOVA) will be
used to assess the effects of OR table angle and the type of friction-reducing device on the Borg-ratings, discomfort ratings, maximum EMG activities, and the time to complete the task. The experiment will be replicated 15 times. The replicates will serve as blocks within which experimental conditions will be randomized. For all significant effects, post hoc analyses in the form of Tukey tests will be performed to determine the source(s) of the significant effect(s). The significance level (α) will be set at 5%. Statistical significance will be based on calculated p-values.
REFERENCES
[1] The Bureau of Labor Statistics (2015) [2] Ellegast, R. P., Kraft, K., Groenesteijn, L., Krause, F., Berger, H., & Vink,
P. (2012). Comparison of four specific dynamic office chairs with a
conventional office chair: impact upon muscle activation, physical activity and posture. Applied ergonomics, 43(2), 296-307.
[3] Vieira E, Kumar S. Safety analysis of patient transfers and handling tasks. Quality and Safety in Health Care 2009; 18:380-384.
[4] Lloyd J., Baptiste A. (2002). Biomechanical evaluation of friction-reducing devices for lateral patient transfers.
[5] Evanoff, B., Wolf, L., Aton, E., Canos, J. and Collins, J. (2003), Reduction in injury rates in nursing personnel through introduction of mechanical lifts in the workplace. Am. J. Ind. Med., 44: 451–457. doi:10.1002/ajim.10294
[6] Garg, A., & Owen, B. (1992). Reducing back stress to nursing personnel: an ergonomic intervention in a nursing home. Ergonomics, 35(11), 1353- 1375.
[7] L. Younan, personal interview, December 7, 2016 [8] Pandolf, K. B. (1983). Advances in the study and application of perceived
exertion. Exercise and sport sciences reviews, 11(1), 118-158. [9] Borg, G. (1970). Perceived exertion as an indicator of somatic stress.
Scandinavian journal of rehabilitation medicine, 2(2), 92. [10] Borg, G. A. (1982). Psychophysical bases of perceived exertion. Med sci
sports exerc, 14(5), 377-381. [11] Gagnon, M., Sicard, C., & Sirois, J. P. (1986). Evaluation of forces on the
lumbo-sacral joint and assessment of work and energy transfers in nursing aides lifting patients. Ergonomics, 29(3), 407-421.
[12] Chen, M. J., Fan, X., & Moe, S. T. (2002). Criterion-related validity of the Borg ratings of perceived exertion scale in healthy individuals: a meta- analysis. Journal of sports sciences, 20(11), 873-899.
[13] Corlett, E. N., & Bishop, R. P. (1976). A technique for assessing postural discomfort. Ergonomics, 19(2), 175-182.
[14] Kasman, G. S., Cram, J. R., & Wolf, S. L. (1998). Clinical applications in surface electromyography: Chronic musculoskeletal pain. Aspen Publishers.
[15] Ekstrom, R. A., Soderberg, G. L., & Donatelli, R. A. (2005). Normalization procedures using maximum voluntary isometric contractions for the serratus anterior and trapezius muscles during surface EMG analysis. Journal of Electromyography and Kinesiology, 15(4), 418-428.
[16] Mathiassen, S. E., Winkel, J., & Hägg, G. M. (1995). Normalization of surface EMG amplitude from the upper trapezius muscle in ergonomic studies—a review. Journal of electromyography and kinesiology, 5(4), 197-226.
[17] McLean, S. G., Huang, X., Su, A., & Van Den Bogert, A. J. (2004). Sagittal plane biomechanics cannot injure the ACL during sidestep cutting. Clinical biomechanics, 19(8), 828-838.
[18] Daniels, L., & Worthingham, C. (1986). Muscle testing: techniques of manual examination. WB Saunders Company.
[19] Kendall, D. M., Riddle, M. C., Rosenstock, J., Zhuang, D., Kim, D. D., Fineman, M. S., & Baron, A. D. (2005). Effects of exenatide (exendin-4) on glycemic control over 30 weeks in patients with type 2 diabetes treated with metformin and a sulfonylurea. Diabetes care, 28(5), 1083- 1091.
[20] Chatrchyan, S., Khachatryan, V., Sirunyan, A. M., Tumasyan, A., Adam, W., Bergauer, T., ... & Frühwirth, R. (2014). Measurement of the properties of a Higgs boson in the four-lepton final state. Physical Review D, 89(9), 092007.
[21] Vera-Garcia, F. J., Moreside, J. M., & McGill, S. M. (2010). MVC techniques to normalize trunk muscle EMG in healthy women. Journal of Electromyography and Kinesiology, 20(1), 10-16.
[22] Gallai, N., Salles, J. M., Settele, J., & Vaissière, B. E. (2009). Economic valuation of the vulnerability of world agriculture confronted with pollinator decline. Ecological economics, 68(3), 810-821.
[23] Carlo J. De LucaThe Use of Surface Electromyography in Biomechanics 1997
[24] Konrad, P. (2005). The abc of emg. A practical introduction to kinesiological electromyography, 1, 30-35.

430
Abbas, Rany
Abdallah, Theophile
Abdel Samad, Amane
Abdelnour, Jessy
Abdul Khalek, Hussam
Abdul Nabi, Mohammed
Abiad, Fouad
Abou Ali Modad, Bassel
Abou Saad, Alma
Aboul Hosn, Jad
Adaimi, George
Adaimi, Rebecca
Ajami, Bassel
Akhras, Haissam
Akl, Joanna
Al Abed, Mazen
Al Ghaly, Omar
Al Haddad, Anthony
Al Jajeh, Mohamad Fares
Al Masri, Ahmad
Al-Zoghbi, Lidia
Alaiwan, Walid
Alameddine, Sara
Alsayed Ali, Rayan
Ammar, Dania
Arab, Hind
Ariss, Wafic
Assaf, Pamela
Assi, Ibrahim
Atallah, Ghassan
Atoui, Yasmine
Atoui, Yasmine
Atwi, Khairallah
Ayoub, Sebastien
Baajour, Ola
Baghdadi, Yasmine
Baydoun, Zeina
9925829791
20699
28220634020620020071
22033291
10525822023927415963
2481513443173402743124545
291312263344184
INDEX

Berbari, Elie
Bizri, Ruba
Boubess, Sawssan
Cambris, Mohammad Rafic
Chahine, Anthony
Chaptini, Jad
Chehab, Mohamad
Chehadi, Amenah
Dankar, Abdul Rahman
Daouk, Haisam
Darir, Hussein
Dbouk, Haytham
El Alami, Omar
El Baba, Issam
El Bojairami, Ibrahim
El Boustany, Michel
El Feghali, Mario
El Ghoubaira, Vincent
El Hajj, Ali
El Hajj, Hussein
El Hajj, Mohamad
El Hakim, Nizar
El Itani, Rafic
El Khatib, Ahmad
El Khoury, Alehandro
El Khoury, Freddy
El Marj, Nicolas
El Mustapha, Reina
El Noamani, Mustafa
El Rassi, Chaouki
El Rifai, Ghia
El Soufi, Riad
El Tannir, Adnan
El Zaatari, Shirine
El-kawas, Adnan
Ezzeddine, Laura
Ezzedine, Mohamad
Fakih, Mohammad Ali
Farah, Lea
Fathallah, Omar
Fayad, Doaa
Fouani, Nadine
Gebran, Tarek
Gebrayel, Anthony
Ghalayini, Ahmad
Ghalayini, Maher
Ghalayini, Rania
Ghamlouch, Mohamad
Habiby, Boulos
Hachem, Marc
Haddad, Kamal
Haddad, Marcelle
Hadwan, Anthony
Hallal, Mohamad Mahdi
Hamdan, Mohammad
Hawa, Elias
Hazimeh, Ahmad
Hneini, Ghina
Hoyek, Camille
Imad, Makram
Ismail, Zahi
Itani, Alaa
Itani, Hani
Itani, Ibrahim
Itani, Mohamad
Itani, Tarek
Jaafar, Maysaa
Jalloul, Maya
Jammal, Nada
Kabalan, Mostafa
Kaddoura, Anas
Kalash, Walid
Kanaan, Riwa
Kanafani, Sami
28534022032315113720023436914324879
1212101843031712165671
344105307332171274113192113409416171143159216143244
3446363
32821016728217711315927424825811328212112134479
37523415938383
18479
13712971
16714391
425225328151317
431

432
Karaki. Ali
Karam, Ebrahim
Karam, Robert
Karam, Serge
Kareh, Elie
Kassem, Kareem
Kassem, Nazih
Kassem Youssef, Reina
Kassir, Saadallah
Kazzi, Roy
Kehdi, Christy
Khalil, Georges
Kharoubi, Yara
Khayat, Tarek
Khraich, Nada
Kiwan, Amjad
Klink, Rida
Kobaissy, Ali Al-hadi
Kobeissi, Mahmoud
Koleilat, Abdel Rahman
Kotaish, Mohamed
Kourani, Ahmad
Lababidi, Wassim
Lahoud, Christian
Lattouf, Fares
Mallak, Rawad
Mansour, Ali
Matta, Rosalie
Melki, Georges
Merhebi, Ahmad
Mouawad, Kathlyn
Mouawad, Ryan
Moubarak, Elias
Moussa, Ghady
Moussawi, Abdallah
Moustafa, Rime
Mouwafak, Rayan
9923016713779
22519234023479
35231215111312930710526810523935228026313712956
263323244129323352352364210282307
Naja, Mohamad Omar
Najia, Ahmad
Nakouzi, Kamal
Nasr, Estelle
Nasrany, Rawad
Nassar, Rami
Naufal, Georgette
Nsair, Sumaya
Nseir, Michel
Oueidat, Kareem
Ounsi, Karim
Raad, Mohammad
Raad, Ragheb
Rachid, Mohamad
Rahhal, Karim
Ramadan, Bassam
Ramadan, Rawan
Rawadi, Carl
Rik Al Bakhour, Dalal
Ruzz, Mustafa
Saad, Abdul Salam
Saber, Chaoul
Sadaka, Alain
Sader, Majed
Said, Farah
Sakr, Tony
Salam, Mohammad
Saleh, Kamel
Saleh, Noor Al Hoda
Salem, Jihan
Sari Ad Din, Samir
Serhal, Raja
Serhan, Michael
Shaer, Imad
Shaer, Nader
Shami, Hasan
Shoukini, Batoul
28230712934056
10521617712119256
2302633177199
17191
25871
1591373231219963
1778383
14383
312352312192244151

433
Sinno, Marwa
Sleiman, Marie-jeanne
Suwan, Qusai
Tabbara, Leen
Taktouk, Ziad
Toukan, Mohamad
Traboulsi, Marwa
Tuqan, Mohammad
Yafi, Amr
Yammine, Mariam
Yassine, Joud
Yatim, Fayssal
Yehya, Emad
Zakharia, Waseem
Zalghout, Ali
Zein, Samia
Zogheib, Alessio
17791
22517716719233233231718418440
2306383
17156