fb51.3.pdf - Scientific Publications Office
133
. . . UNITED STATES DEPARTMENT OF THE INTERI9R, J. ,A. Krug, Stfcrtftary ,FISH AND WILDLIFE SERVICE, Albert M. Day, Director' ECOLOGICAL AND PHYSIOLOGICAL STUDIES OF· .' . . , , THE EFFECT OF SULFATE PULP MILL WASTES , ' ON OYSTERS IN THE YORK RIVER, VIRGINIA By PAlJL S. GALTSOFF, WALTER ,A. CHIPMAN, Jr., JAMES B. ENGLE and HOWARD N. CALDERWOOD Fishery Bulletin 43 From Fishery Bulletin of the' Fish and Jrildlzfe Service 1;1 U NIT E D STAT ES G0 V E; RNM E-N T PRI NT ING 0 F FIe E 1947 For sale by the Superintendent of Documents, U. S. Government Printing Office, Washington 25, D. C. . . Price 50 cents
-
Upload
khangminh22 -
Category
Documents
-
view
3 -
download
0
Transcript of fb51.3.pdf - Scientific Publications Office

. .. UNITED STATES DEPARTMENT OF THE INTERI9R, J. ,A. Krug, Stfcrtftary
,FISH AND WILDLIFE SERVICE, Albert M. Day, Director'
ECOLOGICAL AND PHYSIOLOGICAL STUDIES OF·.' .. , ,
THE EFFECT OF SULFATE PULP MILL WASTES, '
ON OYSTERS IN THE YORK RIVER, VIRGINIA
By PAlJL S. GALTSOFF, WALTER ,A. CHIPMAN, Jr., JAMES B. ENGLE
and HOWARD N. CALDERWOOD
Fishery Bulletin 43
From Fishery Bulletin of the' Fish and Jrildlzfe Service
VOLUM~ 1;1
U NIT E D STAT E S G 0 V E; R N M E-N T P R I NT I N G 0 F FIe E 1947
For sale by the Superintendent of Documents, U. S. Government Printing Office, Washington 25, D. C.. . Price 50 cents

CONTENTS
121
Pm;e
606161'64666769
·7172788182899595969699
103107109109110112112113114116117118liS
121
131132134
.142143149
149ISS159
163169169P4
123125125126127129130
. ..,;
.' .
Plan of investigation . . . . .Descriptk,n c,f the Y(.rk River.
Geographical and gcologicalTides and currents. •••Silting •. ' •••••. '.'Pollution . . • • • • . • ; . . .. • "
History of the York River oyster industry.. .Physical and chemical conditions of the waters of the York and Piankatank Rivers.
Observations on currentsTemperature •••..••Turbidity. • • : ; • . .Salinity .••••••. '.Dissolved oxygenH vdrogen-ion concentrationPliosphorus • . . . . • • . . . .• .
Accumulation of pulp-mill efHuent in tile York River ...•.The rate of discharge of pulp-mill efHuents at West.Point .... , , , ..Concentration of the pulp-mill efHucnt in the tidal waters of the York River..
Plankton content of the York and Piankatank Rivers •...• '. :. Effect of plllp-inill effluents on growth of Nitz.fChicl culture
Condition of the oysters of the York- and Piankatank Rivers. .Shells of the York River oysters . . .
Shape, area, and weight of shells.Pathological studies . • .'. . . . .
Structure of shell. • .'. . .' .. •MicrQscopic examination of the tissuesInfection with Nemat(.psis spores
Metal content of the York River oysters. . • . •• •.........Quality of York River oysters as determined b), the so-called" condition factor"Glycogen content of oysters . • • • . . . • •.•.. . . • • . '. '. • • . . . . . . . . • . .
Cycle in the oysters of the York and Piahkatank Rivers ..••••...........Changes· in glycogen content of James River seed oysters transplanted to the York and
Piankatank Rivers . . . . • • • • • • • . • . • . . . . . . .. . . . . . • . .'Glycogen changes in oysters transplanted from the upper York River to the lower York
and the upper Piankatank River ..••.. ; ..• '••.. ~ ..... '... '.. '"Vater content of the oysters of. the York and Piankatank Rivers and of the various transplanted
oysters ••.•••••...••.•....Biology and cultivation of the oyster in the York River.
Gonads •••.••• ; .••.••..••••Spawning alid occurrence of larvae. • • • . • • .Setting of oysters ~l\ 1936 • . . . • • . . • • . . . . . . . . "
I Organisms found in association with oysters in the York River ..•......•..••..Experimental studies • • . • • • .'. '. • . . . • • ; '.' . . . . . . .... . . . . . . . . . .
Description.of the processes employed by the Chesapeake Corporation and location and descriptionof the various sewer outlets.. • • . . . • • . • • • • • • . . . • . . . • . • . . • ...
Physiological effect of river water containing pulp- and paper-mill wastes .•... -..•...Effect of pulp- and paper-mill efHuents added to sea water on the time that oysters remain openEffect of pulp- and paper-mill effluents on the water filtration of oysters. . . . . . • . • . .
Experiments using the carmine-cone method. • .'. • ; • • • . .'. • • . • . • . . .Experiments using the drop-counting method •...•..••. \ .Effect of pulp-and paper-mill effluents on the rate of pumping of water by intact oysters (rubber-
.. apron method) . . •.. • . . • • • • . . . . . • . . .'. . . • • • • . • . . . .Physiological effects of various materials contained in the pulp-mill efHuent . . . . '. . . . . .Changes in effectiveness of pulp-mill effluent.s under storage and oxidation, . . . . . . .. . . .Chemical nature of weak black liqilor and kraft soaps and response of oysters treated with fractions
of these materials • . • . . . . . . • • • . . . ". , . . . . . . . . . .Chemical nature of the physiologically active materials in sulfate pulp-mili efHuents.
Discussion and conclusions . . . . • . . . . . . . . . . . .•Literature cited • . • • • . . . . . • . . . . . . . .

Studies ofPulp ·Mill'the York..
Physiological'of , Sulphate..
In
Ecological andthe ,EffectWastes ,on OystersRiver,l Virginia
For more than a quarter of a century the oysterindustry of the York River in Virginia has expe-,rienced a gradual decline resulting from poor qualityof thee oysters, particularly from the upper section.This decline in the yield of oyster. bottoms hasbr~ught severe losses and hardship to many people'dependent on this industry for a' means of livelihood.Numerous requests were made from time to time forthe former United States Bureau of Fisheries, now apart of the Fish and Wildlife Service of the Department of the Interior, to determine the ca'use of thepoor quality of t,he oysters. _ The first request wasmade in December 1916, when many of the oysterplanters of the York River drew up, a resolutionexpressing their belief that the' discharge of wastesby a paper mill establ,ished at West Point, Va., in1913, was damaging their oysters. They urged thatthe Federal Government investigate the cause of the'failure of their oysters to grow and fatten. 1;1response to this request, the first survey of the YorkRiver oyster bottoms was made in S~ptember 1917by L. H. Almy, fish pathologist of tile' Bureau ofFisheries. After determining the salinity, alkalinity,and' the' dissolved oxygen content of the water atthree stations near West Point, he arrived at theconclusion ,that the pulp mill was not at that timepolluting the river "with any material which can inahy mann~r affect the growth of oysters." He admitted, however, that som'e subtle change had takenplace in the York River, the extent and nature ofwhich could not be determined.
In 1918, another investigation was inade by E. P.Churchill and J. S. Gutsell of the Bureau of Fish
, eries, in cooperation with W. W. Skinner a'nd J. \V.~ale of the Bureau of Chemistry, Department ofAgriculture. In the course of these studies three
I Approved for publication October 11. 19.f6. ~'ishery Bulletin 43.
trips ~ere made~ in winter, spring, and late summer,to collect samples of water, mud, and oysters atdifferent stations. So far as' the solution of theproblem is concerned, -the investigation producednegative results for it failed to arrive at al~y definiteconclusion. ,No heavy metals which may be toxic tooysters were found in the samples of water, and thepresence of sulfites and sulfides, which may exertdeleteriQus effects on oysters, was not demonstratedin th~ etRuenrs, presumably because no field testsfor these oxidizable substances were carried out and,the samples were examined only in the laboratory.
,The investigators suspected, however; th~t extractive matter of t.he pulp-mill efIluent'may have contributed indirectly to the destruction of oysters.They also stated that "the appearance of the condition of ohters * * * suggests the possibility ofa depleted food supply and that rhe oysters areactually starving" but "are not being directly 'injuredby the effluents from the mill."
It was obvious from the results of the two surv<;ysthat the York River conditions presented a verydifficult and, complex problem which could not be,solved by casual ecological observations or, byanalyses of the samples of oyster-meats, mud, ar.dwater collected incidentally 'from a few stations.
.The solution of the pr~blem called for well-plannedand long-continued field and laboratory studies onthe biology and physiology of the York River'oyster,and' chemical investigations into the nature, of thepulp-mill wastes. An investigation of ,this 'typeinvolves systematic ecological observations, phy'sio-'.logical' experimentation, and chemical studies. A,well-equipped shore laboratory, special field equip-'ment, and suitable boats are lieeded for the cond'uctof such a research ,problem.
Funds for the York River i~vestigationswere made,
59

60 FISHERY BULLETIN OF THE FISH AND WILDLIFE SERVICE
available in 1935 by a special allotment from thePubli~ Works Administration. Continuation of theproject was illade possible by regular allotments bythe Bureau of Fisheries and apprC(priations froln theCommonwealth of Virginia through its Commissionof Fisheries. In October 1935 a laboratory was'established at YorktOWli, Va., where a satisfactorysupply of sea water was available for physiologicalstudies' on oysters. A boat suitable for the fieldobservations \\o~as supplied by the Virginia Commission of Fisheries. Studies of the chemical nature ofthe pulp-mill effluents were carried on from July1938 to July 1940 at laboratories made available by~he College of Williain and Mary. '
The general plan of the investigation was outlinedby Dr. Paul S. Galtsoff, who is responsible also fordeveloping the technique of bioassays employed in
'testing the effects of pollutants on thl' rate 0fpumping of'V\'ater by oysters. The largest part ofthe laboratory and field, work was carried out "byDr. Walter A. Chipman, J~., in cooperation withDr. Arthur D. Hasler, who participated in thisproject from October 1935 to June 1937: JamesB. Engle was engaged from June 1936 to July1937 in field ohservations on methods of oyster cultivation employed by local oyster growers, and participated in other ,routine laboratory and field, work.Dr. Howaru N. Calderwood, who joined the staff inJuly ,1938, conducted chemical studies of the pulpmill effluents and was responsible for the fractionation of the pollutant and preparation of extracts usedin' the bioassays. Pathological studies of the YorkRiver oysters and analyses of experimental data onthe., effect of the pollutant on the physiology of theoyster were made by Dr. Paul S. Galtsoff with theassistance· of Mrs. Dorothy H. Algire, formerly ajunior zoologist of the Service. The authors areind~bted to Dr. Chester 1. Bliss for his advice regarding the evaluation of experimental data: apd to Dr.L. B. Tuckerman of the National .Bureau of Standards, for the computation of the possible accumulation of the pollutarlt in the York River tidal basiil.
The 'York of establishing the laboratory and installing a sea-water syste'm and other equipment wasacco'mplished by Dr. Nelson A. Wells during thefirst- few months of the investigation. In the c'ourlleof the labbratory and field work, assistance wasgiv~n also by Lloyd R. Garriss, Robert O. Smith,L. Winder Lane, and Alfred R. Armstrong. Valuable cooperation was rendered by the late RichardArmstrong, commissioner of the Virginia Com-
mission of FIsheries, and his successor, the late-G.'Walter Mapp, and the staff of the commission.To H. A. Ivlarmer and other members of the UnitedStates Coast and G~odetic Survey the authors areindebted' for the use of s~me of the instrumentsneeded for hydrographic observations, and analysesof the data of tidal-current observations in the York..River. The oysterinen of the vicinity 'have beenextremely helpful in giving information regardingmethods of oyster culture and in permitting theexamination of their' 'books and records. Officialsof the Chesapeake Corp. have been verv kind insupplying information a~d providing s~mples ofpulp-rnill wastes to the investigators. The authorsalso \vish to thank J. J. Dirzulaitis, of the UnitedStates Geological Survey, for the loan of equiprilent,and Ste}¥art Richardson and W. L. Howlet!! fortheir assistance, in obtaining water and oystersamples. ' , .
PLAN OF INVESTIGATIONAn ,investigation into the causes of the decline in
the productivity of shellfish grounds should takeinto consideration various possibilities.. Abnormalchanges in the appearance,' growth, and chemicalcomposition of shellfish may be due to a functionaldisease, the presence of pathogenes, or infestationby parasites or commensals; they may be a 'resultof adverse cO~lditions caused by sewage pollution,the presence of poisons, in the water, or some othererivjronmental factor. On the other hand, an indirect effect brought about by m.an's activitiesshould not be overlooked. Changes in ecologicalconditions of the river,. and consequently in theproductivity of its bottom, may be caused by deforestation o(its drainage area, increased sedimentation, dredging of channels, and other 'improvernentsfor navigation:. To provide a basis for conculsions,observations made in waters suspected to be ~ffected
by pollution should be compared ~vith those madesimultaneously in another body of water which isknown to be free of pollution. These controlobservations may be of great use in eliminatingfrom consideration the factors present in bothstreams and in determining those which are primarily responsible for th'e decline of the fishery.,'
. Furthermore; the decline may be the result ofdepletion of natural resources due to lack of management and unsatisfactory methods of cultivation.All these possibilities have 'been taken into"consideration by the investigators.

EFFECT OF PULP-MILL WASTES ON YORK RIVER OYSTERS 6 I .
In the present investigation attempts were made tofollow the natural course of events in the York Riverby observing seasonal changes in temperature, salinity, pH, Qxygen content, currents, phosphates, andplankton. 'Parallel observations were carrie,d out inthe Piankatank River, which was selected' for itsproximity and similarity to the York River' from theecological point of 'view. By conducting these observations it was expected that a comparative studyof the pr-incipal ecological factors operating in the tworivers might reveal the, existence of some distinctdiffererices, such as deficiency of food, lack of oxygen,etc., which would explain the poor condition of theYark River oysters.
The biology of the oyster in the York River wasstudied in detail with special attention to the timeand intensity of ,spawning and setting and ~o glycogen accumulation in oysters grown in various sections of the river. A number of field tests wereconducted to determine the changes in glycogencontent of York River oysters removed from t'hepolluted area and in the seed oysters from JamesRiver planted in polluted and nonpolluted sectionsof the York River and in the Piankatank.'
Since the official statistics of th'e oyster fisherycover large administrative ~reas and therefore' arenot available for the York River separately, specialefforts were made to obtain authentic data fromindividual oyster planter-s and dealers who consented to submit their records and books for examination. By analyzing and separating these datait was possible to report on the condition of theoyster industry in the York River during the last 30years.
,Thorough exaI;nination of abnormal oysters wasmade for evide?ce of ,disease, p.arasitic infestation,'or other pathological conditions that might be foundfrom detailed microscopic study of the various~rgan's and tissues. Because of the abnormal condition of the shells, detailed examination was madeof the structure of the shell material.
Laboratory investigations consisted in determiningthe direct physiological effect of pulp-mill wastes on'oysters and on the growth of a diatom Nitzs.dlia,which is used br. oysters as food and is frequentlyfound ori oyster grounds., Using the techniquedeveloped in previous work, records were obtainedof the shell movement, efficiency of ciliated epithelium, and rate of filtration of water through the gillsin clean water and in water .containing knownamounts of pulp-mill w~stes.
Observations made during' the first year of thesestudies showed that the pulp-mill effluent has a distinct physiological effect on oysters. In the following years attempts were made by Dr. Calderwoodto explore the chemical nature of these complex,materials with the view of isolating, if possible, thes'pecific compound or compounds producing thisphysiological response, determining their chemicaland phy~ical properties, and rendering them harmless. This chemical investigation was closely coordinated with the experimental ~tudies of the effect of
.various fractions of the pulp-mill effluent on thepliysiology of the oyster.
DESCRIPTION OF THE YORK RIVERGEOGRAPHICAL AND GEOLOGICAL
The York River system, composed of the YorkRiver and its two chief tributaries, the Pamunkeyan~ Mattaponi, together with their tributaries, issituated in central Virginia between the watershedsof the Piankatank ang Rappaha'nnock Rivers on thenorth,'and the James Basin on the south. Thedrainage area of the York River'system is shown onthe map in figure 1. According to the United States~ngine_ers (1930), the total drainage area is. 2,663square miles, of which about 90 percent, 2,386 squaremiles, are drained by the two rivers, the Pamunkeyand the 1Vlattaponi, whose confluence forms the York'River at West Point. The two chief tributaries of thePamunkey River a~e the North and South AnnaRivers, which have their origin in the foothills of theBlue Ridge and flow in a southeasterly directionthrough the Piedmont Plateau to, the fall line and intothe coastal plain, joining to form the' Pamunkeya short distance from Ashland: The MattaponiRiver is composed of the union of a ~umber of smallbranches originating in Sp9tsylvania County. This
, river dra!ns the eastern portion of the area and joins~he Pamunkey at West Point.~'. Within the flat coastal plain the rivers are in broadvalleys, the lower reaches of which meander throughmany miles of low country flanked by marsh landsfrom }~ to 2 miles wide on either side. .Almostone-half of the watershed li~s within the PiedmontPlateau and is characterized by an irregula~ roilingtopography with the streaIllS confined, to. narrowvalleys. -
The York 'River (fig. 2) is a brackish estuary,' anarm of the Chesapeake Bay" noteworthy for its verydee,P channel and the directness of its course. At

62 FISHERY BULLETIN OF THE FISH AND WILDLIFE SERVICE
DRAfNAGE AREA
YORK RIVER SY'STEM
10 S 0
OF
SCALE OF MILES
10 20 30 -
N
wrLLrAMS~URG
PORTSMOUTH
FIGURE 1.-Drainai(e area of the York River system. Reproduced from Document 54. Seventy-first Congress, United States Houseof Representatives, Pamunkey River, Va., York River system, figure 1: 1.
West Point the width of the river is 1% miles, and inits southeastward course of 26 mir"es to Yorktown the"average width is 1.7 miles. Below Yorktown, thecourse is eq.sterly for 7 miles and then southeasterlyfor another 7 miles, the river emptying into theChesapeake Bay about 20 miles from the AtlanticOcean and 15 miles north' of Hampton Road"s." Asfor depth, it has a navigable depth of 30 feet to within9 miles of West Point and 35 feet to Yorktown~
Improvements by" the Federal Government, starte"Qin 1881, allow_a navigable depth of 22" feet at lowwater at West Point, and depths of 6}6 feet for 33miks in the Mattaponi, and of 7 feet for 50 miles in"the Pamunkey. '. .
The creeks draining i,nto the\"ork River are smalland inconsequential. Their: presence, however, aidsin the forination of the "food supply for the oysterswhich are planted in beds in the shallow water bordering the river" banks: The banks of t.he river. are
nea~ly parallel, and the few bays and inlets are oflittle importance." Purtan Bay, on the left shore,comprises about 275 acres and has a semistiff bottom'used" for the cultivation of oysters. Three smallcreeks enter Purtan Bay. Poropotank Bay, on thesame side of the river about 3 miles above, is formedby the widening of the Poropotank River al}d .issomewhat· smaller. This. bay is :llso used for thegrowing of oysters.
The oyster grounds of the York River arc found 'on the flats on both sides of the river froni the mouth
, to" the head and, in a few instances, in deeper waterwhere, the bottom is of suitable nature. The largestpart cif the oyster-producing bottom is leased fromthe State by private interests. There ~re, however,about 800 acres of natural "rocks" owned by theState and open.to the "public for tonging. The namesand locations of these "rocks" are: Green Point Rock,from Gloucester Point to Green Point; Pages Rock,

EFFECT" OF PULP-MILL WASTES ON YORK RIVER OYSTERS
N
SCALE OF NAUTICAL MILES
FI ELD STATIONS
4
RIVER
SCALE OF NAUTICAL MILES
·PIANKATANK
o
4
RI'VERSPIANKATANK
VIRGINIA
o
YORK a
N
Restricted Shellfish
Area 3
F1GURE 2.-The York and Piankatank Rivers. Sampling stations are indi~ated by numbers in circles.

FISHERY BULLETIN OF THE FISH AND WILDLIFE SERVICE
from Green Point to Aberdeen Creek; Navy MineRock, off ,the Naval Mine Depot; Bell Rock, in thevicinity of Bell Rock Light; and Pig Rock, aboveBell Rock.
The river bottom varies from soft mud to hard'sand and shell' grayel. Over the oyster beds it rangesfrom stiff mud to gravel. In the deep chanl).els softmud pred9n~inates. ,
Geological1y the York River B,asin is similar tothe basins of adjacent strean:s. It is typical for thesections lying in the coastal plarn and the Piedl)10ntPlateau. ]\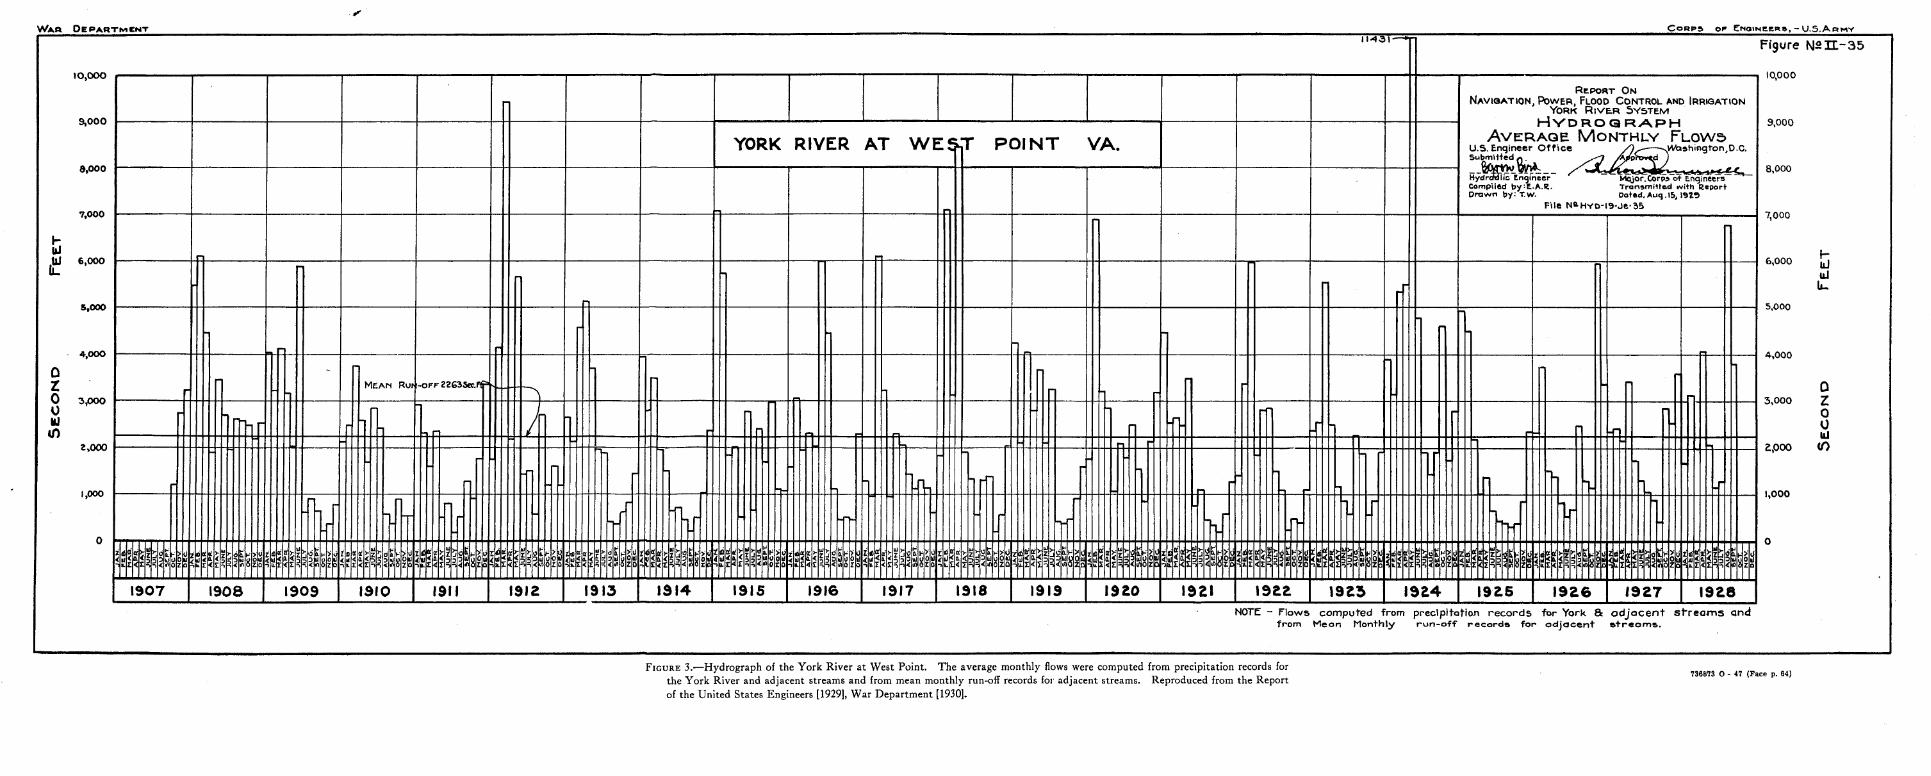
YORK RIVER AT WE~~T POINT VA.
CORP~ 0" ENOINe.e....... - U 5 ARMY
Figure N2II-35
10,000
RI!.PORT ONN"VlaATION. PoWfR. FLOOD CONTROL AND IRRIGATION
YORK RIVE.R 5V5TEM
HVDROGRAPH ~o
AVERAGE MONTHL.Y FLOW~u.s. fnqineer Office ./J 4~Wa~hiA9ton,o.c.
:~~~__ /~~",,",,!o.~'~ 8,000HYd~Jafi~~r.n9Ineer MQjor.Corp.. ot E.ngineerscomplied by:f..A.!l.. Tron"miHed with RellOdDrawn by: T. w. Ooted. Auq . I!), \'!I'l.'!l
File Nil HYO-19'Je' 357,000
6,000 I-IL.IIL.It...
5,000
4,000
MEAN Ru -OFF 22G3~.1'1'fT'H-H-t-,
I3,000
2,000
1,000
ozoouJ
Cf)
1908 1909 1910 1911 1912 1913 1914 1915 1916 1911 1918 1919 1920 1921 \923 1924 192.5 192.6 192.7 1928
o
NOTE - Flows computed from preclpitotio.n records for York 8: adjacent streams andf ...om Mea.. Monthly run-off ... ecorda fo... odjacent at ...eom....
FIGURE 3.-Hydrograph of the York River at West Point. The average monthly flows were computed from precipitation records forthe York River and adjacent streams and from mean monthly run-off records foJ' adjacent streams. Reproduced from the Reportof the United States Engineers [1929], War Department [1930].
736873 0 - 47 (Face p. 64)

EFFECT OF PULP-MILL WASTES ON .YORK RIVER OYSTERS 65
rythmical motion of 'the tidal waters. In order tound,erstand these changes it is necessary to c~ll1sider
what effects are brought about by this motion andhow the sea and the fresh water moving down theriver interact to vary the environmental conditions.
Tidal movement is of two types, vertical rise andfall and horizontal forward and backward movement, both forming parts'of the same phenomenonresulting from the tidal forces of sun and moon.The hQ.rizontal movement of the tidal current generally has considerable velocity in entrances to baysand rivers. It continues in one direction for a periodof about 6 hours and then reverses and flows in theopposite direction for the next period of about thesame duration.
In rivers the tidal current IS influenced by thenontidal movement of water. Generally speaking,the ~ontidal movement affects the rectilinear' tidalcurrent by making both- the periods and velocitiesof. flood and ebb unequal and by changing the timeof slack water. It does not affect the times of floodand' ebb strengths. The,speed with which the particles of water move past ariy point depends uponthe volume of water that must pass this point andthe cross section of the channel at that point. Fromthe product of timc and the average' velocity duringthe interval of-time, the distance can be determined.
Observations of tides and current~ in the YorkRiver and its tributaries have been made at varioustimes from 1857\to 1928. The results of these surveys have been' summarized by Haight, Finnegan,and Anderson (1930), who state (pp. 53-54):
The observations show that the' high water interval increasesfrom 8.5 hours at York Spit Lighthouse to about 9 hours at Gloucester Point, and to about 10.8 hours at West Point. It is notedthat the time of high water is earlier in the Mattaponi River thanin the Pamunkey for equal distances from West Point. Theduration of rise shows a slight decrease in value between YorkSpit Light and West Point. There is also a decrease in the duration of rise from West Point up the Mattaponi River. There isan apparent increase in the duration of rise in the PamunkeyRiver from 5.68 hours at West Point to 5.89 hours at NorthburyLanding.
The range in the York increases from abollt 2.2 feet at'the entrance to about 2.5 feet at Gloucester Point and to about 2.8' feetat West Po.int. The range in the Mattaponi River increases fromabout 2.8 feet at West Point to abqut 3.9 feet. at Walkerton.The range in the Pamunkey River increases from about 2.8 feetat West Point to about 3.3 feet at Northbury'Landing. In theupper reaches of the latter two rivers the range decreases rapidly.
Observations ,of tide at West Point for' 't day in1857 showed the high-wat~r interval to be 10.23hours. The duration of rise was found .to be 5.81
hours. The low-water interval was 4.42 hours, andthe mean range of tide 3.36 feet. For a' period of150 days in 1911-12 the high-water interval wasfound to be 10.79 hours, and the low-water interval5.11 hours. The duration of- rise was 5.68 hours.The mean range of tide was 2.82 feet. Observati~lls
for 3 days in 1918 showed the high-water interval tobe 11.65 hours, the low-water interval 5.92 hours, theaverage duration of rise 5.73 hours, and the meanrange of tide 3.65 feet.
From the data for 21 current stations, Haight et ,al.summarize results as follows (pp. 107-108): '
. Two stations off Tue Point at the mouth of the ri,ver and a thirdabout 3 miles above the mouth show current velocities at strengthof slightly less than 1 ,knot. Observations in mid-channel between Gloucester Point a~d Yorktown show an average. velocityof 1.4 knots at strength of flood and 1.8 knots at ~trength of ebb.Two stations nearby, one near each side of the channel, give.strength velocities of about 1.2 knots for both flood,and ebb inthese locations. Velocities from three stations between Yorktownand West Point range from' 1.1 to 1.4 knots for strength of floodand from 1.5 to 1.7 knots for strength of ebb. .
At the bridge over the. Mattaponi River near West Pointvelocities of 1..~ knots for the flood and 1.4 knots for the ebbstrengths were indicated by the observations. At a station belowMattaponi the flood and ~bb strengths were 1.4 and 1.7 knots;respectively. At Walkerton the observed flood and ebb strengthswere slightly less than 1 knot. At Aylett the current did notflood during 10 hours of observation, the milximum ~'e1oeity bcingabout 1 knot in an ebl) direction.
Flood and ebb strengths of 1.7 and 1.9 knots. respectively, wereobtained from observations at, the bridge over the PamunkeyRiver near West Point. Below White House one day of observations gave a flood velocity of 1.2 kn,:ots and an ·ebb velocity 0(1knot. Farther up the river about half way between White Houseand Bassett Ferry a similar series gave flood and ebb str~ngths of0.5 knot and·1.3 knots respectively. At a station a short distan("eabove Bassett Ferry during 7 hours of observation the current didnot flood, the maximum ebb velocity being abollt 1 knot.
Inspec~ing the time relations for the York River some roughnessappears i'n the observational values, but from a general consideration of the results the following approximate relationships arederived. From the mouth of the river to Yorktown the strength"of flood occurs about 1 hour before high water at Old PointComfort. Above Yorktown the current becomes lat~r, thestrength of flood in the general vicinity of Ferry Point beingsimultaneous with high water at Old Point Comfort.
Results of 'obsen'ations at the two bridges near West Pointsubstantiated by observations near by, indicate that at the bridgeover the Pamunkey River the current is 0.8 hour later than atthe bridge over the Mattaponi River. Above West Point in thelVlattaponi River the current becomes progressively later. AtWalkerton, observations during one day show that strengths offlood occur almost 2% hours after high water at Old Point Comfortor 3.}~ hours after the ("orresponding phase of the current at themouth of t'he York River.
Similarly the current becomes later in the Pamunkey River,observations at statiClns below White House and about half· way

66 FISHERY BULLETIN OF THE FISH AND WILDLIFE SERVICE
between White House and Bassett Ferry. indicating strengths, offlood apparently 2~ hours and 4 hours respectively after highwater at Old Point Comfort.
In the York River the current and tide'!Ippear to advance up'the river at about the same rate, each movement requiring abouttwo hours to travel from the mouth of the river to West Point.Above 'West Point in the Mattaponi and Pamunkey Rivers thecurrent becomes progressively earlier with rcspcc~ to the tide.
SILTING
Deposition of silt in the tributaries of York Rivertakes place principally at the time o( floods. Inthe lower sections of these tributaries this process isexpedited by the, holding back of flood water bytidal action. Silting is also responsible for fillingin the estuaries and gradual formation of mud flatsand bars. The process is offset, however, by tidalor ,flood currents' and by the sinking of the coast line.
Some studies of the silting of" the upper York'River estuary have been made by th~ U'nited StatesEngineer Corps in the course of their work ofmaintaining the channel for ,navigation purposes.According to their reports, prior to 1880 th'ereexisted two bars obstructing navigation of the river'for vessels of, large draught. One of these \yassituated below 'West Point, and the other oppositePoropotank River. Both bars were formed over aperiod of many ye'ars and were composed principallyof fine black sand, blue mud, and broken shells.
The still existing project for improvement ofnavigation in the York River, adopted by the Riverand Harpor Act of June 14, 1880, and modified in1884 and 1887, provides for dredging through thebars a chann~l 22 feet deep at mean low wat~r 'and400 feet wide, and a basin of the same depth at thewharves at West Point on the Pamunkey River side.The project 'includes the construction of a dike onthe right bank, of the York River at \Vest Point toassist in maintaining the channels.
The project was about 75 percent completed in1899; the part not completed' was the dredging of thechannels to the full width of 400 feet, which was notconsidered necessary at that time. Subsequently,the amount of navigation on the York River has not
, justified the completion of the project. In 1899 apile and timber dike, 10,412 feet in' length, was builtparallel to the right shore of the river, a short distance below West Point. The dike is now in poorcondition although still of value in channel rectifica- 'tion. Dredging on the project has been confined tothe bar below vVest Point, the turning basin at'theWest Point wharves in the Pamunkey River, and thebar at the mouth of Poropotank River.
Poropotank Bar has been dredged only once, fromDecember 28, 1880, to March 31, 1881. An examination made in January 1890 of the channel at this bardisclosed a deposit of between 2 and 3 feet accumulated during the period of 9 years. This rate of silting was much less rapid than that observed at "VestPoint. Examinations of the controlling depths atPoropotank Bar, made in July 1905, November1927, March 1929, NovemQer 1934, and June 1936,showed that shoaling .on the bar took place onlyduring the first few years after dredging. From thattime until the present the bar has not shol1.led to anyappreciable extent.
To meet the, specifications of the project and tomaintain the desired depth, extensive dredging hasbeen carried out at'the vVest Point Bar and at theturning basin. Tl;1e rate of silting in this area was sogreat that in .1 year (1890) from 2to 3 feet of sediment accumulated in the bar. Construction of thedike in 1893-94 aided in transferring the siltingact,ion farther down stream, 'and except for thedredging in 1901, all subsequent maintenance operations have been restr'icted to the removal of thematerial from the turning basin' at \Vest Point.
A controlling depth of at least 20 feet was reportedafter dredging in 1901. The controlling depths a,t thechannel reported after this last dredging are:
Year:, Feel
~~~~~ ~ ~ -_._-_-.-_~~~-_ -. -_-_-_~~~ ~ ~ ~~ ~ ~ ~ ~~~~ ~"~ ~ ~ ~ ~ ~ ~ ~~ ~ 18-i~1929_. '_ .. .. .. ___ 21. 51934 . .___ 21
1936_~--------.~----.,------ ... ---- .. - .. -------- 19.5
During the fall of 1938 an investigation of sedimentation in the York River estuafY was made bythe Section of Sedimentation Studies, Division ofResearch,' Soil Conservation Service, of the UnitedStates Department of Agriculture. The preliminaryreport (Brown, Seavy, and Rittenhouse, 1939) dealschiefly with ~he comparative survey data and doesnot consider the character of sediment on the bottomor discuss the causative factors of sedimentation." '
The method adopted in this study consisted il~comparing' the water depths in 1938 with waterdepths in 1857, 1911, and 1918, as shown on UnitedStates Coast and Geodetic Survey charts. Thi"s'
I ..
comparison was made within the 20 upper miles ofthe York River along the 13 ranges across the estuary,and, the amount of fill, or scour, was' computed.
_From f857 to 1911 the cumulative volume ofsediment deposited was 5,591 ac;re-feet as com-
EFFECT OF PULP-MILL WASTES ON YORK RIVER OYSTERS, ,
pared with 15,293 acre-feet accumulated between1911 and 1938. Thus, for the fj.rst period of 57years there was an accumulation of 104 acre-feet peryear. For the following·27 years the net accumulation was 566 acre-feet per year. The water volumefor this segment of the river was computed t9 be206,896 acre-feet in 1938. In 1911 jt was 222,189acre-feet, and in 1857'it was 227,780 acre-feet.· Theannual loss of water volume was at the rate of 0.05percent per year from 1857 to 1911 and 0.25 percentper year from 1911. to 1938.
From 1857 to 1911 there were two main areas ofheaviest silt accumulation, one at the head of the·estuary between West Point and Fillbates Creek, andone in the upper middle estuary between Ware Creekand lower Purtan Bay. There ·was anarea of scourat Bell Rock separating them. A larger are.a of sco~r .was below Purtan Bay. During the period from 1911to 1938 there were also two areas of fill and two ofscour. The point of greater accumulation in thisperiod, however, had moved downstream below lowerPu~tan Bay along Capahosic almost to Jones Cre~k.Also during this period scour occurred in' the areabelow West Point where fill had occurred from 1857to 1911. The annual rate of ~ccumulation duringthe latter 27:-year period was more than five times therate during ~he preceding 57-year period.
Comparisop. made between the two periods ofdifferent durations raises a question of the significance of the diffe'rence in the rate of sedimentationcomputed by the investigators. They qualify, however,' their conclusion by. stating (p. 9), "the fillinghas not been a continuous process between thesedates" (1857, 1911, 1938). ."Ther~ appears, how-
, ever, to be some orderly 'relation of scour and filla~ the various ranges."
The selection of the above-mentioned dates was. governed by the availa,bility of three sets of hydrographic charts of the Unite'd States Coast andGeodetic Survey used. for comparison. It is fortunate, however, that the second period (1911-J.8)almost coincides with the operations' of the pulpmill, which was organized' in 1913.'
The auth,ors' conclusion regarding the "downstream migration of the locus of most active sediment deposition" is of particular interest in theI?resent investigation, for it throws some light on aprobable distribution of a pulp-mill pollutant inthe river. Discussion of this question is given onpage 171.
POLLUTION
The York River receives domes'tic sewage andindustrial waste, nearly all of vi'hich are emptied atthe head of the river at West Point, Va.
Pr~vious to 19}5 the greater part of th~ sewagefrom the city of Williamsburg, Va., was dischargeduntreated i!lto the headwaters of Queens Creek,
• which enters the York River from the right side about8 ,miles above Yorktown. As a result of this, thecreek was highly polluted and restrictions were madeby the Virginia Department of Health on the sale ofshellfish from the creek. In ~he early part of 1935,the city of Williamsburg installed two sewage pumpstations and a plan,t for complete treatment of thesewage from the city. Since that time all sewagefrom the city is being discharged ,into College Creek,a tributary of the James River. On April 8, 1935,after shoreline surveys indicated that all unsanitaryconditions had been ,corrected, and bacteriologicalsamples showed safe water conditions, the restriction was -lifted ahd Queens Creek was no longerclassified: as a restricted shellfish area.
At the confluence o(the Pamunkey and MattaponiRivers the York River receives raw, untreated />ewagefrom the city of West Point. Because of this pollution the' Virginia Department of Health prohibitsthe sale of shellfish taken from the upper' YorkRiver. This order, issued October 5, 1~29, outlinesthe restricted area as "that portion of the York Riverlying above a line drawn in a northeast.erly directionfrom the ,point of !-and at Mount Folly through RedSpar Buoy No. 10 to the shore near Roane; thatportion of the. Mattaponi and Pamunkey Riverslying below a line drawn' at right angles, to the King\Villiam County l?hores two miles from their pointsof entrance into the York River." The lower limitof this area 2 is shown in figure 2.. The only import'ant source of indust~ial pollution I
of the Yark River arises from the effluents of a pulpand paper mill located abo~t IX miles upstream fromthe head of the York River on the outskirts of thecity of West Point. This mill was ~stablished in1913 as the Chesapeake Pulp & Paper Co. and was:reorganized in 1918 as the Chesapeake Corp. In
, 1930 it absorbed the plant of the Albemarle-Chesa-peake Co. which converted the pulp to paper andpaperboard. At present the finished products of themill are pulP. and unbleached paperboard us'ed in the
210"194-2-45, the sewa!i:c p:'JlIution in the York River grrat.ly increased owingto the establishment of miiitar}' camps. Consequent}r. the restricted areahas been extended and covers at prC'sent a large portion of the' ('I}"ster bottomsin the lower pa"'rt of tHe river.

68 FISHERY BULLETIN OF THE FISH AND WILDLIFE SERVICE•
o19
o------.;.----::.
,20
omo
THE CHESAPEAKECORPORATION
>z:.:::EooWlI::...J.~ :::e..:::E<[lila:ww:re..0'<[
we.....Ja:,<[
:::EwIII...J<[
. FIGURE 4-.-General arrangement of buildings and sewer outlets of the Chesapeake Corporation pulpmill and the Albemarle Chesapeake Company paper mill in January 1936. The buildings arenumbered from 1 to 19, and the sewer outlets are lettered f~om A t~ J,' inclusive•.
Buildings
1. General office.2. Old Qoard mill.3. Screening building.4. Diffuser building.5. Chip conveyor.6. Digester building.7. Barking drums.8. Chipper house.'
. 9. Evaporat')~ building.10. Recovery room.1I. Lighter slip.12. Log conveyor.13. Bark boiler.14. 'Slacker house:15. Causticizing building.16. Kiln.17. Steel building.18. Power house.19. Wharf.
SeW"SA. IS-inch sewcr from paper mill.B. 14-inch sewer for drips, leaks, cooling water, etc.,
from power house.' ,C. 4-inch blow-down line from power house.D. 39-inch sewer from recovery room.E. 14-inch salt water retum froIJI .vacuum jet.F. lO-inch sewer from slacke~ h~use.G. 2~'2-inch blow-down line from boiler.H. 30-inch sewer from diffuser building.I.' Small drain from old board mill.J. 15-incli sewer from'evaporator building.

EFFECT OF PULP-MILL WASTES ON YORK RIV~R OYSTERS
,manufacture of containers. The combined plantshave been increasing, their facilities rapidly and theproduc'tion has kept pace with the expansion.
Data on annual production, supplied by the Chesapeake Corp., are shown in table 1. There has beena steady increase for each year except 1930 and1934. Starting in 1~i30, the increase in productionhas been much more'rapid. The drop in 1934 wascompensated by an' increase in 1935 sufficient tobring the productioq figure back in line with, theincreases for other years.
The processing oLpulp and paper requires largequantities of water, which this plant obtains fromdeep wells. Inform~tion furnished by the plantchemist gave the approximate quantity of water usedby the Chesapeake Corp. in 1936 as 9,500 galloilsper ton of pulp. 11;1 comparison with other millsthis is a surprisingly.~inall amount (Hagenauer 1937).In 1919 the plant pumps were said to have a capacityof 600 gallons per miQute, or nearly a million gallonsdaily. At present t:he maximum amount of waterdelivered per minute: by the pumps is 4,510 gallons,and daily delivery has reached 4,874;400 gallons.
TABLE 1.-.4111Iual productioll of pulp by tIle Chesapeake Corp.,West Point, ra.
Year Tons Year Tons Y"a~ Ton. Year Tons
---- ---- ---- ----1919 4-,884- 1924- 19.714- 1929 37,090 1934- 71,64-11920 10.862 1925 23.19.1 1930 36.779 1935 86,8441921 13, ~70 1926 25, 883 1931 50,990 1936 95,0751922 IS. 127 1927 29,910 1932 61.608 ' 1937 1OI,~4-1923 18.064- 1928 34-, 808 1933 72,666
Although the mill uses every effort to reduce to aminimum the water needed in both the washing ofpulp and the making of paper, much 6f the processwater finally reaches a condition where it is no longerreusable and' is discharged into the sewers andreleased into the river.
An approximate lay-out of the buildings and sewersof the plant (fig. 4), obtained from an official of themill, in January t936, shows 10 sewers discharginginto the Pamunkey River ,directly or throughditches which flow ipto this 'river. The sewer lineshave been labeled ,:~~phabetically in' order of theiroccurrence from south to n<:>rth.. Ai that time theestimated flow of the main sewers was as follows:sewer A, 200 gallons per minute; sewer D, 150 gallonsper minute; and sewers J and H, ·1,200 gallons' perminute. Thus, the total amount" of mill water discharged at that time into the river was 1,550 gallonsper minute, or 2,232,000 gallons a day.
69'
HISTORY OF THE YORK RIVEROYSTER INDU~TRY
The history of the oyster industry of the YorkRiver was compiled from a variety of sources.Records' of oyster dealers handling York River oysters were examined and' interviews were held with30 oyster planters of the river and with State oysterinspectors 'and others associ~ted with the industry.
In former years the upper York River produ'cedoysters of excellent quality. This opinion is substantiated by the fact that in 1904 A. F. Smither,one of the oyster packers at Wes.t Point, was awardeda silver medal for the excellency of the oysters grownin the upper part of the York River and exhibited atthe LouisiaI,la Purchase Exposition in St. Louis, Mo.
Further evidence of the good quality of the oystersproduced il~ the upper York River in earlier yearsand their subsequent decline is found in the booksof the local oyster dealers. Their records showingamount of business, prices of shucked oysters, andother data reveal" a marked decrease in the 'quantities of oysters handled and the fall in prices resulting from poor quality. It seems that the downward,trend, which began in 1916-18, has continued untilthe present time (1939).
A typical example of the,falling off in the industrycan be found in the records of A. L. Van Name, whokept a detailed account of his operations. Hisgrounds, covering 206 acres~ are located about 9miles belm,;, West Point. For the first 13 years,1901-13, the total profit of this company was$38,577.85, 'averaging $2,967.33, annually.' Duringthe following 23 years, from 1914 to 1936, the totalprofit was only $11,181.30, or $486.14 a year.Because of rhe small returns, or in many cases actualloss, the planting of oysters was discontinued bythis company in 1931.
Complete information as to, the number of bushelsof oysters,marketed from the York River fr~m yearto year is impossible to obtain. A decline, hbwever,can be 'seen from the records of oysters bought byM. D. Shiel'fs Qf Dandy, Va., who operated two 75foot oyster boats each holding from 400 to 500bushels. Figure 5 shows the number of'ibushels of,upper York River oysters bought by hil"\l by yearsfrom 1920 to 1935. This decline resulted from theinability of this dealer to obtain good marketable'oysters from this area. '
The condition of tqe oyster industry in the upperYork River can be readily understood when it is

FISHERY BULLETIN OF THE FISH AND WILDLIFE SERVICE
realized that one of the f(;>ur ,oyster shucking housesat "Vest Point was forced out" of business in 1920,another in 1925, another went into bankruptcy' inthe spring of 19~7, and the fourth ran it's businessat a loss until 1938. In ail cases, the chief cause of
50
IIIoJIII:I:III:>lD
ILoIIIoZCIII:>o:I:..
FIGURE 5.-The number of bushels of oysters bought in theupper York River by M. D. Shields from 1920 to 1935,inclusive.
failure was the refu'sal of the shippers and dealers to.buy the oysters because of pqor quality.
Info'rmation from the York River oyster planters,obtained through'interviews imd correspondence, issummarized i;l table 2, in which the lessees are arranged in geographical order, starting from WestPoint. One can notice that the line of demarcationbetween the sections prodJ.lcing oysters of goodquality and those producing oysters of inferior quality can be roughly drawn about 15 miles below WestPoint, near Claybank. The year when poor oysterswere first noticed by the planters is given in column·7. In case no definite answer was received to this'question, the statement of the planter is quoted inthe footnote.
Because most of the planters kept meager records,of 'oysters handled, and because of the diversifiedmethods of transporting them to market, it 'is impos~ible to trace the fluctuations in the total pr~
duction of the river over a' period of two or threedecades. Several of the dealers and State oyster in-'spectors, when asked to give alJ approximate estimateof the quantity ?~ seed oysters planted and the ,vol-
TABLE 2.-S~'I/"IIl<lr'Y of illformatioll obtai.ud from the l"ork Rit'er oystfrnull through illtervieu''s allJ questio~llaires, J
Miles belowWest Point, Side of ri ver Lessee Acres Ch....cter 01 bottom
Bu.hel.plantedper acre
Year b.doysters first
nDticedLaot
planting
2 E.SL .~ Rich.rdson. G, W '______ 40 Broken t • • 1.0002. West Towsend. R________________________ 4!·~ Hard .__________ 600-8008 E.oL R",ne. C__________________________ 149 SOIL __ ._______________ 1,4008 do_____ _____ _ ___ Allm"nd, J :_ 1ni d,,__ ____ \, 2469 .. .. d,, Van N.me, A_______________________ 200 do_________________ 600-S0010 d,, E.otweod:E. C-____________________ 22 Stiff ._______ 80010 West' , d,, ~______ 8 d,,_________________ ' 80011. EasL S".nbll. J. E_______________________ 175 do_________________ 6001I. ___ ___ __ Weot, - - - - --- - - - - - c__ do __ - -- - -- - - - _- - - -- -. - -- - 156· ~ot.,lfft -_' --__-_- - -_-__• __ -_-_- 8_U_0__12. E.st Twylnrd, F. P______________________ 38 ~
B:::::::::::: '#.::tt :::::::~:::::::: rrr,~~:~: t r.C::::::::::~::::::::: fJ SoIL_________________ 1,21013. do Allme,nd. W, \Y..___________________ 15 ~~~~e_n ::::::::~:::::': l:,U~
g:::::::::::: }r.es~t_- :::::::::::::::: ~~~~~'~d~~~-C:C::::::::::::::::::: ~ ~~tt:: :::::::::::::::: I, t~
it~: ~~~~~~~~ :f:a;;~f~~~~~~~~~~~~~~~~ ~ ~?]t:~.E~~;~~~~~~ ~ ~~~~.~ ~ ~ ~~~:_ ~ ~ ~~; l~g~'l t~:~e~~~~:::::::::::::: l;i!815H Stiff___________________ 52214 L____ __ _ WesL do . 21. do '___ ___ 1,45214 .. E.... Puller, R. F. ~_.. 18 do_________________ 1,45214_ __ _ We.L do "___ 48 do____ _____ __ 1.45214 c E.SL Stubblefield, R c .m 70014 West , d,,_____________________________ 12 .,1,00016 . do Newman, A. H - 41 -Sti-If =:::::::::::::::: 826
it:~::::::=: }~~ ~~~~~~~~~~~~~~~~~~~~~ ,~::~e~~.E~~:::: ::~::::~:::::::':: ~~~ ~~~~~~:~~~~~~,~~~~~~~~ ~~~ 6O~~:17 ._._. ,do {Hansford, J. D______________________ 85 Solt.__________________ 1,000
Il~~l~~l~~l~~[~~,,~~~~l~~~l~-l~~~l~~it~4~\jlj~lll~-l~~ll~j~j~l~-----,~--l~~~-j:~~.-~l~~l~~~l--:~i-
1917-1819161916
1916-171915-16
1925l'n51920193019201928
1929.-30191719171928(')1928
1926-2719281928
1921-231921-23
19201920
11918(.)(0)
1917-18(7)(S)
1935lS)(S)
, lS)(S)ll)
1923192319231926,1931192819281931193119311931193119311~311928193019_;11927192719271927,
1929-301929-30
--i92~jO
(.),(.)
(.)
(')(')(.)(I)(.)(.)(.)l')
1 or various degrees of consistency.2 "Not many years ago.":I Freeze."• Net affected.
S Still planting:o"When pulp mill ....rted on large Icale."7 "Weakened in last few years."S No change. "

EFFECT OF PULP-MILL WASTES ON YORK RIVER OYSTERS
forms by controlling their growth and propagationor they may ex~rt indirect, but nevertheless important, action by influencing the abundance, distribution, and sequence of changes in the populationsof microscopic organisms upon which other formssubsist.
Reproduction and growth of the oyster or of anyother ·organism which obtains its food by filteringwater are often limited by the deficiency in the typeof food neeoed by them. Thus, the productivecapacity of an oyster bottom is determined by theavailability of the microorganisms necessary tosupport the Jife of the oyster' during its hirval andadult stage. Observations of various investigato.rsindicate that diatoms, dinoflagellates, and othergroups constituting phytoplankton, comprise theprincipal items of an oyster's diet. It is possiblethat bact,eria also have a part in the feeding ofoysters, although convincing evidence on the subjectis still lacking. The abundance of phytoplankton,"estimated indirectly by Harvey's method of pigmentunits, can be accepted only as a .more 'or less generalindication of the abundance 'or 'scarcity of oysterfood in water, for the nutritive value of various formscomprising the phytoplankton has not yet, beenascertained.
Althpugh most of the studies in this paper deal\vith' conditions of the York River, a n~mber ofparallel observations were made in the PiankatankRiver: Situated a short distance north of the YorkRiver, ,the Piankatank is also one of the tributariesof the Chesapeake Bay. With' respect to the character of the bottol'll, water conditions, tides, and otherhydrographical features; it resembles the York River,but it is not contaminated by domestic or industrialpollution. The river is known to produce excellentoysters. For these reasons; observations made in it .are considered as controls for those carried out inthe York River.
A number of sampling stations for physical, chemical, and biological observations were established atrather regular distances from the mouth of the YorkRiver to localities above West PC?int in the Pamunkeyand Mattaponi Rivers, and at., two localities in thePiankatank River, one in the lower portion and onein the upper. Many of these stations were alsoused for experimental oyster planting and for regularexamination of the oysters. Locations of the station~ are shown in figure 2 and described in, table 3.Other substations were established for special needsand are described in the text as discussed.
CHEMICAL CON~
WATERS OFPIANKATANK
ANDTHE
AND
PHYSICALDITIONS OFTHE YORK
, RIVERS
No study of the biology of any waters would becomplete without a consideration of the physicaland chemical conditions undei which the organism'sare living. Physical and chemical factors of,·,the
, environment may have either direct effect on living
ume of oysters' marketed, agreed that, before'l92S,the planting was in excess of 200,000 bushels an;mally and that the annual production of market oy~
ters was about 400,000 bushels. This activity necessitated the employment of about 500 tongersandthe use of about 30 locally owned boats to plant seedoysters and to carry the oysters to market. In morerecent years only about 50,000 bushels of 'oystershave been marketed annual!y:
An early method of oyster culture in the York'River consisted of transplanting oysters from thelower and middle sections of the river to bedsextending to about 5 miles below West Point. Inrecent years the process has been reversed, notbecause of the closing of restricted oyster groundsof the upper York River by the Health Departm~nt,
but because of the failure of oysters to grow andfatten in that section. Although the marketabilityof oysters from the upper and m.iddle river is subjectto great seasonal variations, it can be said that as ageneral rule oysters from the upper and middlesections of the river, have to be moved to the lower
. York River, or out of the river entirely, in order toobtain a, satisfactory marketable product.
Official records, in the office o'f the Virginia Commission of Fisheries show that in June 1937 therewere 5,971.41 acres of oyster bottom under lease inthe York River. This figure has fluctuated fromyear to year as the parcels of bottom have been givenup or leased again. 'As all of the leas~d parcltlsprobably are not cultivated every year, the totalacreage of leased bottoms does not necessarily represent the total num1Jer of acres under cultivation.The bottoms cultivated by the oystermen whoconsented to supply information regarding their.business cover 1,864.75 acres, or about one-third ofthe acreage under lease. They represent' a goodproportion of the bottoms in the sections of the riverseriously affected by poll~tion.

FISHERY BULLETIN OF THE FISH AND WILDLIFE SERVICE
TABLE 3.-LOC<lliOIl alld characler Of llydrograplzic slaliolls i'lI IheJ·ork alld Piallkatallk Rifl.-rs
OBSERVATIONS ON CURRENTS
Although the tide tables issued by the Coast andGeodetic Survey and the paper by Haight, Finnegan,and Anderson (1930) give essential informationregarding the tides and surface currents in the YorkRiver, it 'was considered necessary to obtain moredetailed knowledge regarding the velocity of currentsat 'different depths and at different stages of thetide. These data were particularly needed forevaluating the river discharge (the excess of thedischarge d}uing the entire' ebb period over theentire Hood period) and for computing the velocityof the resultant current of the river.
For the observation of tides a .st~tion was establish~d on the Texas Oil Co.'s dock on the MattaponiRiver.at West Point.. According to the specifications'of the United· States Coast and Geodetic Survey(1935), a tide house was constructed over a woodenfloat-w~1l formed by joining four 2-inch by 14-inchplanks into a.box. After th~ establishment of benchmarks, a standard autom~tic tide gage, loaned bythe Coast and Geod~tic Survey, was installed andput into operation. Observations were continuedfrom August 25, 1936 to May 5, 1937.
'Measurements of the currents ~f the York Riverwere made during the fall, winter, and spring of1936-37 as follows: August 10-11; September 16-17and 23-26; October 28-30; November 18-20; December 17-19; January 18-20; February 8-10;
March 8-10; April 13-14 and 29. The stationsoccupied were arranged in a line across the river atPj.lrtan Island (fig. 2) so that a relatively completecross section of the river was made. This sectionwas chosen because of the straightness of the channelat that point. Depths of w#er on this line wered.etermined by soundings made at regular intervalsand the position determined by angles at eachsounding. The contour of the bottom at this section is shown in figure' 6. St~tion 1 was located inthe deepest water of the channel and was occupied
. and observations were'made continuously whenever,any measurements of flow were determined at· anystation. This served as a reference station for stations 2, 3, 4, and 41\, where observations were madefor shorter periods of time.
The procedure of observations was patterned afterthat· described by Zeskind (1926). The boat was.brought up on station and anchored from the bow byas short a cable as was practical. It was found inconvenient to anchor fore and aft, and for this reasonposition angles were determined by sextant each houras the boat swung with the tide. The Price currentllieter suspended by the electric cable and weightedto insure a verticai position 6f the cable, 'was loweredto a level of two-tenths of the t~tal depth. Therevolutions were then counteq for 1 minut~ with theuse of a stop watch. Following this, the meter waslowered to five-tenths of the total depth and observa~
tions were' made. After this the .meter was againlowered and observations were made at eight-tenthsof the total depth. A second set of observations wasmade at eight-tenths, five-tenths, and two-tenths ofthe total depth as the meter was raised.
. Immediately after the met~r readings were' completed, obst:rvations were mad.e o.f the current velocity by using the current pole floating vertically' in thewater. The graduated line was allowed to run outfor 1 minute and the distance. the pole traveledrecorded. The direction of the pole from the boatwas then determined either by a pelorus or by sextant angles. The wind velocity and direction as wellas the ship's head by compass were also noted.
These observations were continued every half houras long as the station was occupied. The time variedfrom 13 hours to 3 days, a 13-hour complete tidalcycle· being the minimum period of observation.With interruptions, the current meter studies wereconducted between A~gust 1936 and April 1937.
The results of the measureinents of current velocities at each station are shown in table 4. All of the
Do.
Character of bouom
J-iard. sand.Do.
Soft. m"d.
j.9 i\'[o;:dium. Miff mud :lnd, hell.'
D..,.H::l.rd. shell. oy!oter rock.Hard. s.,nd ,..ilh Iiltle
mud.Haru, mllollnd s:md.Medium. mud and ,hell..
. Soh, stiff mud.Soft, mud. liltle shdl.Soft. mu·d.
7.3 Medium, "itT mud. ,hell.4.2 Hard, sand and .hell.
H.UJ.9:111(1-IVledium. uitT. mud and
shell. .4-.6 l\·Iedium. mud and sand.
shell.
Hi, ~4. I
15.0
5.2B.b12. -l
Deplh (,fwater in
feetLocation
YORK'RIVER
Yorkt..:.wn. Stc:'alllh")~ll Duck__ _ 14-N:.,-al Miue Dep':" Dock______ 11\Vest Point. Hruc.:e Memurial _
Bridge.5 01£ Allmouds,·ille _
6 Below Sdmmin(1 Cn:ek __ . _8 Rell Rock Lighlhouoc.. _9 Middle Gre.und bdow' West
Poillt.H OtT Carmin.s Island. _15 Aho\"c Queens Crcek. _16 Off Roanc3 PoinL_~ . :..17 OtT Ware Cleek _18 Pal11l1nkc)' River abo\'e \Vest
Point.1.9 1\1anaponi River ab(.,ve \Vest
Point.20 Off SanJb.)X, abo"e Bull Creek.22 Inside Purtan Bay; _
23 AbO"e C1a)'bank _
PIANKATANK RIVER
5, OtT Ferr)' Clock.• _~5 Off lIon Poin'- ' _
SlOtlon·

EFFECT OF PULP-MILL WA'STES ON YORK RIVER OYSTERS 73
EaltSllerl5500
I
J
5000i
Sta~4
4500I
Sto.-'
G
4000pi
F
3500i
o
3000
~ta!22500
I
B
2000
~ta.'"31500
A
1000
II
- ~"'- J
III I~--------------1I I1 • E . I 1- __I ~ ,
I I II I K
-----------~-1 II 1I H L __: ,, I, 1MI I
'--------,, 1I ,, 1I ,I I
III
" I1I
500i
40
2
10
15
30
·25•...
w..tShore
" 0Flet I
Half-TidlLeVI'
FIGURE 6.-Approximate cross-section of York River (Purtan Island) for determination of river flow basec! on current observationsmade in 1936-37. The depths and widths are approximate values derived from dilta obtained fro"m the United States Coast andGeodetic Survey hydrographic sheet 3311 showing the results of a survey in this area in'l911. The approximate area of each section in square"feet follows: A~4,500; B-5,OOO; C-5,125; D-lO,OOO; E-S,750; F-ll,625; G-9,OOO; H-9,750; 1-7)75; J3,750; K-2,130; L--,-I,600; M-2,6SS.
data were analyzed by the United States Coast andGeodetic Survey and summarized as follows:
StllfI readings corresponding to the different localtide planes as dete,rnlined by compariso~ with thestandard station' at the Naval Operating Base,Hampton Roads, sho,~ed 4.57 feet" at mean high,vater, 3.07 f~et at half-tide level, and 1.57 feet atmean l?w water. The mean range of tide was 3.0feet. High waters occur, on the average, 1.86 hourslate~ than at the Naval Operating Base, and low';\vaters 2.32 hours later. The average duration of risewas 5.62 hours, ang the average duration of fall 6.80
" hours.One of the purposes of current-It:J.eter observations
at the section of the York River at Purtan Bay wasto obtain estimates of the total flow at flood and ebb....periods. These data can be computed if the" cross-sectional area and the changes in the velocity of
736873--47--2
current at various d.epths across the river duringvarious stages of tide are known. To aid in the computation, the .entire cross section of the river wasdivided into several small sections (A to M,flg. 6),the limits of which are outlined wholly or in part bydashes. The area of each small section is indicated inthe figure. The depths and widths sho~p. in ~his
diagram represent approximate values derived fromdata obtail1ed from United States Coast and GeodeticSurvey hydrographic sheets 3311 showing the resultsof a survey made in 1911. The upper limit represents the half-tide level of the river. On the basis ofthese data, the cross-sectional area of the river atthis point ",,-as found to be equal to 81,293 square feet'at half-tide level. In 1938" at our request, G. L.Evans, a surveyor of the Chesapeake Corp., determined the width of the river at Purtan Bay and madea ~eries of careful squndings. Compu~ed.on the basis

-74 FISFl,ERY BULLETIN OF THE FISH AND \VILDLIl;£ SERVICE
TABLE 4.-CUTrellt measureme1its in tile York RivfT ill 1936 and 1937.[Referred to times of predicted tides at H;lmpton R'Xtds, Va.]
ReCl,ultant lornomidalClirrent
. ,2.0 do _I. 75 .10 _2.0 010 _1.5 010 _U.S· 01,, _
~:::.::::::: .=~: ~67 . __ -3.077 . __ -3.277 -2 70
1936
Aug. 10 to 1L_~ _Sept. 16to 17 _gept. 2.; to 26~ .Oct. 28 to 30 __ " _Nov. 18 to 2U _D«. 17'to 19 ._
1937
Dd)Y1.01.03.0
.2.02.0
.2.0
Meter ____ 010 _~ __ do ~_
___ 010 ____ do ____do _
Fut4 to 7 _7 _7 _7 _7 _7 : _
l/ 1Ft-,. ,0-2.80-1. ~~O
-3.12-3.1l.-2. ~1Q
1/11'+-0.30-0..10-0.07-0.40+0.50+fJ.fJ2
-0.17+0.48+0.35-0.43+0.20
LII+-3.95-_1.45-3.66-3.60-2.78-:.05
-.;.90-3.40-3.22-.l.tii-3. ~O
L11"+-1.50+0.05+0.06+0.02+U.38=-0..10
-0.15+0.U3-0.22+0.23-U. SO
KplOtsI. 201.10I. 35I. 85I. 40I. 48
I. 70I. 72I. 601. ~}7
O. ~O
K,lots0.85I. 30I. 18
U~I. 50
1. ';51.97I. 78I. "01.60
I. 100.961.430.75I. 17I. 03
I. 01I. 011.100.77I. 16
/\'!011I. 30I. 05I. 89I. 391.64I. 52
I. 721.741.77I. 540.99
Allots0.951.251.72I. 3~)
1.711.501,
I. 67I. ~'9I. 95I. 37I. 79
NouTS5.695.6')5. .185.866.686.1y
5.295.646.195.945. Ii
/lQllrs6.73 '6.736.846.565.746.23
7.136.786.236.487.28
Anotr-0.06+0. I.!+U.f13+0.07-0.04+0.01
+0.14+0.19+0.06
O.OU+0.39
20 do 18 _1:.75 01,, 18 _2.0 .10 I~ _1.5 010 18 _0.5 • __do 18 _
0.75 I 10O.~ 0.94O.?!, U3I. ..,. 0.751.00 1.17I. 08 I. 03
I. 06 6.290.85 6.04I. 62 5.67I. 24 6.041.50 6.89I. 40 6.99
1936
Aug.10to 11.." _S.p,. 16 to 17 _Sept. 2.; to 26 _Oct. 28 to .~O_~· _Nov. 18 to 20 _Dec. 17 to 1') __: _
1937
lan. 18 LO 20 __ ~ _I'eb. 8 to 10 __ -' _Mar. 8 to 10__ •· _
'Apr. t' to 14__ ~--Apr. --'-----7-----
1936
Aug. 10 to II._~ _S.pt. 16 to 17_, _Sept. 13 to 26_: _Oct. 28 to .10 _Nc,v. 18 to'~O _Dec. 17 to 19 . __
1937
1.01.03.02.02.02.0
1.01.03.02.02.02.0
___ cl.o ____ 010 _• __ do ____ 010 _
~::~~:::::
~ __ d(l ____ do __ • __• __ 010 ____dn ____do ____ 010 _
14 to 16__ ._18 _I~ __ -_-----18 _IS • _18 _
16 [0 2'.~ _29 -"_30 _28 _31) _2~ _
':'3.75-3.00~2.9t
-3.12-3.30-3.60
=}6~-3.40-3.30-3.50
-.'.75-5.10-2.86-3.20-3.42-.1.63
-0.10-0.40-0.10-0. .~O+0._10-0.15
-0...3-0.25-0.58-0.3.t
U.OO
-0.55-0.40-0.30-0.05-0.07-0.35
-3.80-3.30-3.60-3.42-2.75-2.95
-3,92-3. l~g
-3. 3~~
-3. 7.~
-t.OO
=t~~-~.6~-.,.4,:.-2.78-3.08
-0.95-0.20
0.00+0.28+042-O.H
-0.55-043-u 20-0.23
·-0.70
-0.85-0.,80-O.H+U.30·+0.35-0.25'
1. 20.O.WI. 3~I. 8S1..45I. 68
I. 80I. ~2I. 651. O.~
I. SO
0.85 .U.70I. 37I. 78I. 201.22
O. '.150.901.10I.M:I. 28I. 35
1.'35I. 63I. 60I. ~31.60
1.100.94I. 430.75I. 17I. 03
I. 011.011.100.771.16
I. 310.751.901. 44I. {;7I. 73
I. 82I. ~4I. 81I. 57I. 75
0.930.65I. ~7I. .'8I. 39I. 25
I. 37I. (.5I. 761.47I. 85
0.830.85I.HLU5I. 1~l
1.11
5.645.69'6.365.915.84
6.446.095.546.096.9x6.89
6.136.386.756.385.535.43
6.786.736.066.516.58
5.98'6. .l36.886.335.445.53
-0.U9+0.05-0.02-U.03-0.15-0.23
-0.05+0.0.'-0.04+0.03+0.09
-0.05+0.07-0.06-U.OQ-0.15-0.11
2.0 __ :do __ , __ 28 __ : -3.821.75 do 30 -3.202.0 dc, '28 .-3.681.5 010 29 -3.500.5 do ,_ 29_________ -4.15
+0.30 -3.40 -D.20
=?:A8 -:":3::50- :!:g:~g1.60 ·i.oo1.40 2.302.10 2.10
+0.07+0.31+U.26+0,42
-0.21+0.08-0.05-0.U5
·+0.05
6.786.986.286.88
5.645.-1-16.145.54
1.87I. 752.Ul2.03
1.0J 6.24 60181.28 5.52 6.901.08 6.30 6.121.00 .6.17 6.251.60 6.59. 5.83
1.871.251.221.03
1.560.811'.J6·1.02
0.911.140'.75
1.01 1.681.01 1.331.10 1.220.77 1.171.16 ; 1..10
1.102.101.802.00
1.021.270.981.331.40
1.671.321.121.501.10
+0.20 1.20-0.10 11.60-0.10 1.00":'0.90 1.00
-0.·10-0.10-0.40-0.60-0.09
-4.10-3.70-3.3U-4.3U
-.1. 92'-4.02-3.72'-3.67-3.90
":'U.60-0 ..'0-0.55-0.40-0.90
-1 :OU-0.60+0.20-0.20
___ do 5_.· -3.40___ do 4 -2.80___ do 5. -3.10___ do 4 -3.50
_:_do 5__________ -2.80___ 010 5 -2.70___de' 4 -3.20,
0.50.50.5
0.50.50.50.5
t".'i;. ~8t~01~~~:::::Mir. 8 to 10 _Apr.. 13 to 14 _Apr. 29 _
1936
·2 . Sept. 24 "_Oct. 28 _No\·. 18 to 19 "_D"c.17 _
1937
Feb. 10 _Mar. 9 -"_Apr. 13 _
1936
2g~~~'2~~-_~~:::::::No\". I~ to 19 _Dec. 17 _
0.50.50.50.5
___ 010 12 : __ -3,40_"_do . 10 -2.70___ 010 12.________ -3.00___ 010 11. -" -3.5U
-0.60-0.40
0.00-0.20'
-3.90-3.65-3.00-3.~·'O
+0.10+0.10
0.00--;0.80
1.20 0.90 1.561.40 1.60 0.811.15 1.40 1.161.00 1.60 1.02
1.79 1.491.12 1.321..'5 \1.601.03 1.63
5.845.396.345.94
6.587.036.086.48
-0.06+U.19+0.06+0.23
1937
Feb. 10 __ : _Mar. 9 _Apr. 13 _
1936
0.50.50.5
__ .do , 12. -3.2U_..co, __ -"_ 12 '-3.30___ do •. , 10. -3.10
+0.10-0.10-,-1.00
-3.50
-3.30
-0040-0.40-0.40
1.60 1.50lAO 1.801.90 '1.90
0.911.140.75
·1.461.611.42
1.36 6.04 6.38 0.06
U~ -6:i~- -6:is- ----0:00
-IUO -4.20 0.00
-S:1i8 -:":3:50- =8jg
0.60 1.56 1.451.30 0.81 0.871.00 1.16 1.001.10 1.01 0.62
1.01 5.54 6.88 +0.10
U~ -6:5~- Taa- --:":o:oi
2 Sept. 24 _Oct. 18 : _No\'. 18 to 19 _D.c..17 _
, ·1937
F.b.IO _Mar. 9 ••Apr. 13 ._
0.50.50.50.5
0.50.50.5
___ do 20 ~_ -4.00___ co 16_________ -2.70___ do 18 -3.20.:_,do, 18 -3.50
__'_do 20.· ->.40__ .d,' 19. -3.20_._do 16. : __ -3.70
-0.50-0.20+0.25-0.3U
-4.00-3.65-2.80-3.80
-,0.10 1.000.00 1.100.00 0.85
-0.10 0.60
1.001.101.30
1.101. 201.40
0.91I.H0.75
0.911.260.96
1.051.071'.151.12
6.34 6.085.39 7.0.'6.74 ~.~~6.04 6 ...8
-O.IJ+0.16
0.00+0.17

EFFECT OF PULP-·MILL·WASTES. ON YORK RIVER O'YSTERS 75
TABLE 4.-CllrNlIl meaS'IITelllellls il!.III; l"ork River i'lI 1936 Qlid 1931-Continued
-3.80 +0.10 -4.20-2.10 I 1.10 0.80 1.51 1.58 ·1.28 5.94 6A8 \-0.07
-3.30 . -0.60 -4.0 -O.SO 1.40 0.70 0.71 1.11 0.41 5.6-1 6.78 -0.16
-3.90 -0.10 -4.20 -1.50I. 20 I 0.80 1.51 1. 71 1. 31 6.04 6.38 -0.11
-3.30 -0.80 -.1.80 -0.70 I. 20 1.00 0.72 0.89 0.69 5.84 6.58 -0.02
-3.55 -0.30 -4.00 -0.80 0.90 0.80 1.51 1.3.1 ].2.\ 5.89 6.53. 0.00.,.3.30 -0.90 -3.~O -0.60 1.00 0.70 9. 72 0.76 U.46 5.84 6.58 -0.0';'
1937
Da,e
S~p,. 23 _Oc'.29 _
StationNo.
I I I · Current interv:lls Observed c.)rre.~tcd.. vel- ~:tv Cor- "\"'locit\· Durdti01l Ref.uh-
LeI1:s~h. o~1~~s~~_ Average -----1----1-------- ---~-- reC- -~--~-- .------- .'!nt lor(If sen~s .vation depth Slack Strength Slack Strenlith r ti~~ I . .1!(lntid:d
. '. bfl~_:~e ,,r flo.:>d b:~obe of ebh Flood Ehb fador FIe'oJ Ebb FI<-od Eb~ .current
-':-I---;~~----:-: ~ete:~~---;:-- 1I"~ ~w+-I~~~~~~~-:~:~~ ~~:t~ ---I~=~:~~ '::r~ ::'r~.~~,-:3 Aug. 10 to 11.._.__ 1.0 do 0.8'0 U -4.00 -O.-I-U -4,40 -1.80 0.90 0.75 1.10 0.~'8 0.83 5.<)4 6,48 -0.02
Sep'.25__________ 0.5 do : 1.7 : 1-3.50 -1.20 -4.80 0.70 ,______ 5.04 7.38 _.Oc'.29___________ 0.5 do 1.5'02.0 -3.ilO -0.5U -4.10 1.00 1.00 0.72 0.72 0.72 6.14 6.18 +0.01No,'. 19___________ 0.5 d,, 1.4 -3.80 -4.50 -1.70 0.70 0.90 1.19 U.85 1.05 5.6-1 6.78 +0.11Dec. 18 :_____ u.s __ .d,, 1.6. -4.10 -0.90 -4.60 -1.6Q O.~O 0.80 1.04 0.83 0.83 5.H 6.58 +0.03
m~.~o~~~======= gJ .,==j~=::== tL===~j =U8 _~~::~_, =U~ =U3 0.80 ng _~:~:J~:~:_,-~:~=- ~:U u.~ L~~:~~Apr. 14 .__ 0.5 do_. 2.6 ._ -2.80 -0.30 -.\.90 -1.60 1.30 lAO 0.79 .1.0211.12 5.14' 7.18. +0.17
1936
3 ~~~... ~t~_I_I_-_-~::: A:~ ::=~~=:==: ~:t~_~·~~:= =n~ =A:~. =Ug _~~:~~_ g:~3 __~:~~_I_~:~~' __~:~~_I'~:~~_ U~ 1j~ --~~:~~Oc'.29___________ 0.5 do 5.2!L' 7.3 -4.10 -U.80 -4.00 0.90 0.80 0.1. 0.(,;' 0.,;' 6.44 5.98 -0.005Nov. 19.__________ 0.5 do 5.6. -3.40 -0.90 -4.50 -1.10 0.8U 0.90 1.19 0.% 1.06' 5.24 7.18 +0.12Dec. 18___________ 0.5 d,, 6.4 -4.40 -1.10 -3.90 -1.(11) 0.60 0.90 1.04 U.63 0.93. 6.84 05.58 +0.005
K1~~.~;~;~======: g:~ ==:~~=::::= ~:L===::: =U3 -0.50 '=US =S:~ _~:~~J 3:~31_~:~~ __~::J~::~_ t~ h~ __ ~~:~~Apr. 14___________ .0.5 do IIOA -3.30 +0.10 -.\.80 -1.30 1.10 1.00 0.79 0.88 0.78 5.84 6.58 +0.01
. 1936
4 Sept:23, , 0.5 dO / (. _Oct. 29___________ 0.5 do .. _ 5 _
1936
4 'Sept. 23._________ 0.5 d,' 116 _Oc'.29___________ 0.5' d,"- 11 _
1936.0.5 d" 125 :_~ __0.5 do ._ 20_· _
. I
'4A Apr. 29 _Apr. 29 _Apr. 29 _Apr. 29_, __ ~------1
'0.5 Pole _____ 2__ ~ _______ -2.80 ~0.40 -4.90 -1.90 0.60 0.90 1.161 0.72 1.02 .1. 24 8.18 +0.250.5 Meter .. ___ 2. _. ____ ___ -2.40 -0.50 -4.60 -1.80 0.70 1.00 1.16 0.84- 1.14 414 8.18 +0.280.5 ___do _____ 5__________ -2.80
:':0::50- -4.W -1.80 0.90-i:itJo:;;i"" -0:9i- 4.48 7.94 --+0:200.5 __ .. do_ .. ___ 8__________ -2.60 -4.60 -2.20 O.GO 0.80 4.34 8.08
I I I I I
j'dean values as deri\·:ed [Will the entire series
, I I,
I I I. < .I Aug. 10, 1936. '0 .4.0 Pole _____ 7______·____ -3.10 -0.21 -.\.77 -0.22 1.66 I. 78
Apr.·29. 1937. 19.0 Metf:l" ____ 7___________ ~2.9& -0.01 -3.45 -U.l1 1.54 l.S619.0 ___ do_____ 18_________ -3.24 -0.22 -3 AS -0.16 1.62 1.4219.0 ___dv_____ 29 _________ -3.44 -0._\5 -3.54 -0.27 I.B 1.\0
'2 Sept. U. 1936. to 1.5 Pol~_____ L _________ -2.70 ':"0.20 -.\.87 -0.13 1.60 I. 73~pr. 0. 1937. 3.5 Me'er____ 5__________ -3.07 -0.28 -.\.71 -0.16 1. ~~6 1."3
3.5 ___ do _____ ll _________ -3.19 -0.26 -.1.56 -0.26 1.35 1.533.5 ___ do __ ___ 18_________
-::\.3~ -0.18 -3.66 -0.09 0.98 I.JO3 Aug. 10. 1936. '0 2.0 Pc,le_ . ___ 2___________ -3.40 -0.87 -4.25 -1.50 0.85 0.80
Apr. 14. 1937. 4.5 Meter .. ___ . 2___________ -3.74 -0.63 ~4.18 -1.M 0.8Y 0.954.5 ___do_____ 7__________ -3.74
I-0.71 -4.10 , -1.27 0.78 0.80
I4 Sep,. 23 1<' Oc'. 29. 1.0 Me'er____ 6 __ ~ ______ ~ -3.6.\ -0.25 -4.10 -1.45 I. 25 n.751936. LO ___do _____ 14_. _______ -3.70 -0.45 -4.00 -1.10 I. 20 0.90
1.0 I---do-----22 _________
-.\ ..17 1 -0.60 I -3.90' -0.70 0.95I
0.75I',
I0.98 1.631.02 1.571.02 1.651.02 1.351.01 1.620.9" 1.340.9" 1.340.99 0."70.,,3 0.7"I.(lQ 0.891.00 0.780.98 1.23U.98 1.180.98!.0.Y3.
U~ U~ II U~ II1.45 ',.13 ".2"1.12 ... 2-1 6.18
1
1. 75 5.17 7.251.41 5.70 b.72J .52 5.97 /,,451.0'l ,•. 07 b.350.7-115.49 6."3g:~g, Ug nJ,0.?3._\ ~.87 q~0.~8 ".04 0 ..'&0.73 5.91 \6.51
+0.13+0.10-0.05.,..0.08+0.22+0.27.
.+0.09+0. 115+0.05+006+0.0;-0.12 .-0.08-0.04
~ A plus (+) sign denc-,tes downstream and a minu6 (-) sign denotes llps~ie.l.m resultant or nl:.ntid.'l.1 curr~nt.
of this recent survey, the cross-sectional area was-.found by the authors to be equal to 77,308 squarefeet at me1!-n low water, and 92,718 square feet atmean high' water. These figures give satisfactoryagreement,wit~ the ~omputations based on the 1911survey.
From th~ current-meter observations at fourstatio~ls across the river, the stream flow for flood and
ebb tide was estimated by computing the average. velocity of current, which is equal to the velocity atthe strength of the tide multiplied by 0.637, and bythe duration of flood or ebb t,ide. The resulting·nontidal current, or the excess of ebb- over flood tide,was then calculated for each section. In sections Aand L the yelocities and durations were estimated.By summing all the areas, the following final figures."'

FISHERY BULLETIN OF THE FISH AND WILDLIFE SER.vI<;:E
CURRENT AT WEST POINT
Latitude 37°32', Longitude 76°48'
CURRENT H MILE BELOW WEST POINT 9 '
Latitude 37°31', Longitude 76°481
I D3t.a were obuinec1 from the Tide Tallles, Ada.ntic Ocean, and Current,Table., Atlantic Ocean. Nonh America. published by the U. S. Coast andGeodetic Survey. . ,
r,l(uity, inTime knots
~~U ::~: ------TsU1 ~:~: -------n
rdodty, inTim, knots6:16 a.m. • _
10:42 a.m. 2.12:11 p.m. _4:58 p. m.' 1.5
IHtight, in
Timt - ! ftit
5:!8a.m.! . 2.911 :.,5 a.m. 0.85:49 p,.m. 3.2
Tidt
~;~~;~~t:bb~~~~:::~: ::~:~:'::::::~:~::::::: ::~Low~water slack_~ ~. ~. __ • _Greatest flood .-: • • _
TiJ.High-water slack • • _Greatest ebb ... ~ _Lo\y-water slack__ ~ ~ ~ -'_. ~ ~ _Greatest fIood. • • _
High water. _-- -- _. .r.~J~__ ._~ ...---- -,- __ .1
1hY;hv:::::;~~:::::::::.::::::: :::::::::::::::::
At high-water slack 10 floats were released offthe unloading platform at the mill. Three were lostimmediately, probably as a result of sinking cau~ed
by improper adjustment of the sand. Visibiltty inthis area was poor at this time, because of the steaming of the water. The river n:ear the mill \vas brownwith mill effluent and felt hot. A surface ·thermometer showed that the water of this area had atempera'ture of 76° F., ...~hile that of the river elsewhere had a 'temperature of 640 F. The water 'Yasdiscolored brown with the effluent for a distance ofabout 1% miles, as far down as West Point Bar. Theremaining bottles separated; four went slightly offshore and upstream with the last of the flood tidethat was still running in the channel, and'three wentd~wnstream with the first of the ebb tide runningalong the shore, whe,re they became entangled ~ithbarges tied along the shore and had to be taken outand started again in the channel. From the, plac~
Nepp tides oc'curred during this perio,d, the moonbeing in' the last quarter. The predicted times oftides and currents are given in table 5. The weatherwas clear with almost no wind all day so that thewater was perfectly smooth. A dense fog settleddown for a period of about an hour and a half in thelate forenoon.so that visibility was poor during thattime. The course of the bottles during the ebb andflood tides is shown OQ the map presented in figure 7.
TABLE 5.-Tllt prdifttJ time; of titks and furr..,;ts of the upper, York River all Oct. 17, 1938I, ,
TIDE AT WEST POINT
were obtained. Total flow 'of the river at P.urtan:t3ay during flood period amounted to 2,235',4{6,OOOcubic feet; duriQ.g' ebb period, 2,484,875,000 cubic·feet; ebb excess, 249,459,000,cubic feet. By dividing,the excess ~bb flow by the area of the cross section
, rimltiplied by tidal cycle (12.42 hours, or 44,712seconds) we obtained the value of the nontidalcurrent, which was found to be eq~al to 0.0686 foot
. per"second, or 0.04 knot, downstream.As to the distance traveled by a particle during' a
tidal cycle, this can be computed for any station by'making use of the fact that a current curve approximates a cosine curve, and on a cosine curve it isknown that the ratio of the mean ordinate to the
'maximum ordinate is 2-+-11", or 0.6366. Since thestrength of the. tidal current· corresponds to the
- maximum ordinate, it follows that during any givenflood or ebb' period the average current will be thestrength of the current multiplied by 0.6366. Thehorizontal distance traveled by a particle or floatingobject, therefore, would be given by multiplying theaverage velocity during any flood or ebb period bythe corresponding duration of flow.
It should be noted that this formula can gfve onlyapproximate results, for the use of ~he co.sine relationship gives only an approximate val~e of theaverage current. Furthermore, even more seriousis the assumption made in 'the formula that thefloatip.g object during the various s,tages of itsjourney will experience the same changes in velocitywhich occur at the point where it started.
In order to determine the direction' that effluentsleaving the pulp mill at West Point would take on anebb 'tide and the'; distance th~t a particle would traveldownstream, a study was, made using floats rele~sed
off the pulp m,ilI at high-water slack on October 17,1938.
Each float consisted of two citrate bottles fastenedone above the other by cord so thl.tt the total heightwas 24 inches. 'Sand in the bottles was adjusten sothat they would float with less than a half inch of thetop of the upper bottle exposed to the air. Visibility o! the floats was increa'sedl;,y the use of smaUflags' made from bicycle, spokes to which werefastened small pieces of white cloth. The floatswere followed by boat, and observations of the positio!l of the floats were made at half-hour intervals
, during a complete' change of tide on October 17,1938, starting at high-water slack at 6:30 a. m. offthe pulp mill at West Point. Observations werecontinued to high-water slack late that afternoon.

EFFECT OF PULP-MILL WASTES ON YORK RIVER OYSTERS 77
COURSE OF FLOATS
.CARRIED BY TI DEIN
UPPER YORK RIVEROctober 17, 19 3 8
ROANE
,
.. .i·
-
SCALE OF NAUTICAL MILES
I 1/2 0e - -s+ij!
" ,~ ,
\\~
.... ," BELL R0li.K L.H......... .,
.... ,~ , .... ~
"'" '""L \
\
«' 0
o
N
FIGURE 7.-Coul"se of floats carried by the tide in the upper York River on October 17, 1938.

FISHERY BULLETIN OF THE FISH AND WILDLIFE SERVICE
of release they floated along the shore past WestPoint and curved in across West Point Bar nearly-to the channel of the l\'!attaponi River, then, turningback, joined the others coming down the right edgeof the channel of the Pamunkey River. Frain thispoint all the bottles kept well together and passeddown the river just inshore ~f the black buoys on theright edge of the channel to the bell buoy at BellRoc~. Here they went across the channeland continued down the left edge of the channel to a pointabout half way between BelJ Rock Light and RoanesPoint Beacon. The lowest point reached on thistide was about 5% miles from the place of releaee.
On the following flood tide the floats !llOved slowlyup the river; they crossed the channel toward theleft shore of the river, going in the water from 6 to10 feet deep, al1d passed well insho're of Bell, Rock'Light. Whel~ the tide s'Iacked off -and further observations were discontiriued, they had reached thepoint just above Robinson's Creek., It 'is of interest to 'note that on October 19 'one of
1the floats. was recovered 5 miles above West Pointin the Pamunkey River.. This float must have become e~tangled with the barges at the start and thentravelea upstream on a flood tide..
TEMPERATURE '
Temperature observations of the bottom water ofthe York River at' Naval J~dine Depot juh above'Yorktown were made continuously by means of agas-operated recording thermome,ter. The sensitivebulb was held just off the bottom, placed \\,ith itscable inside a capped galvanized pipe. Slots alongthe sides of the pipe in the vicinity of the bulb allowed a ready interchange of the water. The depthof water at the . location of the instrument 'was 12
, feet at meCJ.n low water: Observations were st~rted'
on October 19, 1935. The water temperature foreach hour from midnight of one day to midnight ofthe next was taken from the chart, and the minil.num,maximum, and mean for the day noted.
Observations of surface-water temperatures of thePamunkey River at Bruce IVlemorial Bridge at WestPoint were made by use of an ordinary mercurytpermometei' at high and low water each day starting May 1, 1936. With the deep-sea reversing thermometer, readings were made at high and low wateroff the steamboat' dock at Y(Jrktown, three, times aweek at hoth surface' and bottom. Water temperatures at the various hydrographical 'stations in theYork and Pianka'tank Riv~rs v"ere ascertained at
various times. Observations of water temperatureswere also made" in studies of isohalines and tidalcycles at various places and times throughout theinvestiga tion.
The climatological conditions of the area of theYork and Piankatank Rivers were unusual in manyrespe,cts during the time of the ilivestigati'ons.Unusually cold weather with considerable snow characterized the first winter. December 1935 was nextto the coldest December on record, while Jal1l,Iaryand f<:bruary 1936 were the fourth and eighth coldest on record. Unusual ice conditions prevailed withconsiderable portions of the York and PiankatankRivers frozen. J\1arch 1936 was unusually warm, andair ~emperatures from :May to October of that yearaveraged above llOrmal with many record-breaking',maxima observed during June and July. The winterof 1936-·37 was mild~ and air temperatures duringJanuary 1937 ,were unusually high, being the nexthighest on record. .
JVIinimum' and maximum air temperatures weretaken from the records of t\1e nearest meteorologicalstation at Williamsburg, Va., as reported in theClimatological Data, United States Department ofAgriculture, Virginia section. These were averagedfor 5-day periods and are shown in figure 8. Themaximum temperature during' the period from'October 1935 to July '1937 occurred ,on June 30,1936, with an air temperature 'of 102° F. (38.9° C.)"and the minimum occurred on February 1, 1936 .with a temperature of 0° F. (-17.8° C.).
Considering the records obfained at the NavalMine Depot station, shown in figure 8, the watertemperature fluctuated but slightly fror-n day today. There was a general rise in the spring andsummer arid a drop in late summer ~nd fall, Starting October 1'9, 1935, the records show a drop fromtemperatures of about 20° C. Unusually coldweather in. 'December 1935 and again the las~ ofJanuary 1936 resulted in exceptionally low-watertemperatures. The lowest temperature occurred onFebruary 7 and 8, 1936, when readings of -1.5° C.
, were observed. At this time' much of the river wascovered with ice, even as far down as Yorktown.The water temperature rose rather rapidly and continu<;d to rise until July and August. The maxi'mumof the summer occurred on August 25 and 26, 1936,when a temperature of 29.5° C. was, recorded. Thedrop in water temperature following the maximumwas rather regular until January 1937, when ,there\"as a very marked rise which reflected the unusualJy

~FFECT OF PULP-MILL WASTES ON ·YORJ.; ·RIVE-R OYST.E~S.
WATER TEMPERATURE
PIANKATANK- RIVER OFF FERRV CREEK. ";BOTTOM SAMPLES
...... -,,...
-79 -
-10
..50
20
.10 :~ I
!V\0: ~
\." ~\ ,.\J ~ /''"1I' ~: . ~
.' ,I' . I
" \\."
~.
'" ,/\ ,.: ....\,'f..~ /"\ ,", "........ ..!\ : .... v.... 01 ~! I.":~ !' : ....:'..../ .' V....II, & """''',.1
~ : ~ :~ "\; ,.' :"", V~. ... I ..'\"'· ... ~ .. ~ "
',,'" I : .. I'~ ,",,' ~. ,:~: ~ r1'1. :., "'-.,' ',,:'. .... \ ~I " I • II "
" '.... I,' "',,' I II:.,' 1.1\ ... ~' .J'
,/\f'/ "' .... \,'1 I'
I I • II'
~/\..' WATER. TEMPERATURE ~: \ '1'
YORI( RIYE~ AT MINE DEPOT ;: \ ,.J ~I'
AND I "'.,,' •
AIR TEMPERATURE AT WILLIAMSBURG ~.
---- AIR MAXIMUM AND MINIMUM.
- WATER
• 20 L.L-II-L-'-2+--'-.....:.L..-L-4....L.--'-.-L-7-L-e....L.-'9:-'--:'O....L.--'--:'2+-:--'-:-L...:5:-'-:"4....L.7'-'-:-'.....
,1935 193. 1951
F,GURE S..-Seasonal ~hanges in air and water temperature in the. York and Piankatank Rive, ••. The plotted points represent 5-day,averages.
high air temperatures. The minimum for th'e ""interof 1936-37 occurred on March 1, when 3.5 0 C. "vasrecorded. Agra,dual increase in the water temperatllre followed during the' spring.
It will be noted from the comparfson of \\'ater andair temperatures in figure 8, that the water warmed
more slowly th~n the air during the spring and cooledmore slowly during the faiL
Similar seasonal chariges in water temperature.were observed at \-Vest Point, a'lthough the records·were not so complete. The observed water temperatures a! high water and low water.. grouped in 5-day

80 FISHERY BULLETI-N OF THE FISH AND WILDLI·FE SERVICE
SURFACE SAMPLES
--- UPPER YORK ISTA. 9)
- LOWER YORK ISTA. 20)22
~ 20c: 18..z...u
Ul......0:..III<>
8
4
2
0L.-...I...--1-':'...I...--1_...I...--1_...I...--L_..L---L_..L---L_...1....--L_...L..--I._.L-J
BOTTOM SAMPLES
- - - UPPER YORK ISTA. 9)
- LOWER 'YORK ISTA. 20)
oL.:-:~--:-....L.-=--'-'::'3...L-4~L.....:5--1.-:-6"""'--:7--1.-:-8
....L.~9:---l---:10::--1-"";1":"1-1..-:-12:-+--:-1.....L.~2--1.--:3...L-4~--J
1936 1937
28
26
2
22
24
... 20<>c~ 18
i=z 16
'"uUl 14
'"~ 12..'"<> 10
F:igure 9.-Water temperatures ,in the l~wer (station 20) and upper (station 9) parts of York River.
periods, are shown in figure 8. Starting May 1,1936, with temperatures of 18° C. ~t low ~ater and20° C. at high water,' there was a gradual warmingof the water during the spring and· early summer.The maximum temperatur.e of 29° e. was recordedJuly 14 and 18, 19~6, arid again on August 22, 1936.Following this, the water cool~d during the falL A
. marked rise occurred during the warm weather ofJanuary 1937. The minimum was 5° C. on Febru-
ary 11 and 12.. The following spring the waterwarmed gradually and reached 29° C. on June 21,1937. ,
The water temperature at Yorktown foliowed thesame seasonal changes. Observations made threetimes a week at high water' and low water at thesi.ITface and bottom are shown in the curves in"figure 8. During the period from March 26, 1936,to July 1, 1937, the minimu~ water temperature

EFFECT OF PULP-MILL WASTES ON YORK RIVER OYSTERS 81
was 4.1 0 C. on March 1, 1937, and the maximum29.60 C. on August 25, 1936.
Similar seasonal changes were observed in thePiankatank River (fig. 8) and at other statigns at .which temperature of, the water was measured(tables 6-20, pp. 177-186).
As for the horizontal distribution of water temperatures in the York River, it was observed thatthere was but slight variation throughout its length..The'upper portion of t.he river had a slightly warmertemperature during the spring and summer than thelower, but dl,uing the winter this situation' was reversed. The changes, however, were reniarkablyslight. The amouilt of fresh water entering !heYork River from above appears to' have but slightinfluence in warming the water in the summer and.'cooling it in the winter. Figure 9 shows a comparison of the water temperatures at station 20 inthe lower York and station 9 in the upper Yor~
R'iver~. It will be noted that, although the differences in water t;emperature were' very slight, theupper river warmed earlier in the spring and waswa~met than the lower during the summer. " Therewas little difference during the late summer andfall. In the winter the lower river was slightlywarmer than the upper. This was due to theinfluence of the warmer sea water of ChesapeakeBay at that·tim~ of year.'
Differences in the vertical' distribution of watertemperature were nearly absent except at the deeperstations. It will be seen that the curves showingwater temperatures at high water at the surface andbottom (14 ft.) at. Yorktown are almost identical(fig. 9). The surface water warmed mort: quicklythan the bottom water during the spring.
Tidal effects on water temperature werel unim-.portant. A comparison of water temperatures atYorktown an~ West Point at high water and at lowwater throughout the season (fig. 8) .shows almostno differences at those stages of tide. Observationsmade of changes throughout tidal cycles show thatthe effect of time of day on water temperature was'more important than the stage of tide.
)"
rURBIDITY
D'ata on the relative turbidity of the water at thevarious stations'in the York and Piankatank Riverswere obtained throughout the time of observations.M~asJ.lrement.wasmade through the use of a Secchi .disk, 6 inches in diameter, which was lowere~ andthen raised, t.he depth at which it disappeared on
lowering and reappeared on raising being determinedby several trials and recorded ·to the' closest tenth ofa meter. The obse~vationsfor two stations,' station9 of the upper York and sta tion 20 of the lower York,are compared in figure 10. The results of measurements .at all stations are given in tables 6 to 20(pp. 177-186).' .
Precipitation conditions have an important bearingon the turbidity of the water. Precipitation records,from the Climatologic~lData, United 'States WeatherBureau, for the period from October 1935 throughJune 1937 at stations on the York watershed arepresented in the graph in figure 10.
During September 1935 there was considerablerainfall in the area of the York watershed, and manyof the streams were at flood stage. January, March,and December 1936 were unusually wet month~,
January exceeding all former records. " Dry weathercharacterized the period fronl May to August 1936,the amount for May being the next to the least onrecord. The year 1937 was the wettest year onrecord, and in January 1937 there occurred the'greatest precipitation ever recorded for that mont-poApril and August \\'ere the third wettest, whileMarch was unusu'ally dry. Noteworthy' floodsoccurred throughout the streams of the area duringApril 1937. .
There was an increased turbidity throughout thespring of the year 1936. This was followed by a decreasing turbidity through the summer and fall, thesurnmer of this year being particularly- dryas wellas being the time of year of least run-off. Inc;reasedrainfall during January 1937 brought about an increased turbidity, which' was continued throughoutthe fbllowing spring. Unusually high rainfall in .April 1937 caused a marked increase in turbidity, thewater appearing brownish red even below Yorktown.
. The water of the upper part of the York River wasconsistently more turbid tlian that of the low~r section where fluctuations in turbidity were more pronounced. Di~k readings at station 9 of the upperriver ranged from 0.2 meter to 1.0 meter, and averaged 0.47 meter. 'In the lower York at ~tation 20 therange was from 0.7 meter to 2.0 meters, and the.mean was 1.39 meters.o The Piankatank River was clear throughout thetime of the investigations. The disk could be seenclearly on the bottom in the lower river at eachsampling. The upper part of the river was ~ore
turbid than the lower but still much less turbid thallthe York River. The readings at station 53 in the

82 ' . FISHERY BULLETIN OF THE FISH AND WILDLIFE SERVICE
upper Pianka tank ranged from 0~5 meter to 2.2meters, or bottom, the mean being 1.44'meters.
SALINITY
The salinity in a tidal river is in a state of unstableequilibJ;"ium which, for each given point, is detern)ined by its distance from the mouth, the stage'of thetide, and the river discharge. Under these conditions
, daily and seasonal fluctuations are to be expected.Furthermore, from the head of the river tow?rd itsmouth, there must 'be a definite salinity gradient,which also changes with the river stage. Observations made in the York and the Piankatank Riversshow these conditions.
Samples for salinity were taken' by means of theEckman bottle and transferred to citrate bottles withpatent stoppers for transportation to the laboratory.In a few instances the salinity was computed fromspecific gravity detenpiilatioris made by the use ofstandardized hydrometers; but in most cases thesamples were'titrated for chloride by the Knudsenmethod as described by Oxner (1920), and the salin
.ity computed by the use of hydrographic tables(Knudsen 1901). ,
Observations of seasonal changes in salinity weremade at the surface and the bottom fOl' both high
,and low water three, times a week from the steamboat,dock at Yorktown, and for the su'rface at each tideat the Bruce Memorial Bridge at West Point. Salinity of the water was also determined at the varioushydrographi~ stations' of the York and PiankatankRivers at regular intervals. Ot1:ler observations included studies of the horizontal distribution ofsalinity at one tidal s~age in the York and PiankatankRivers, and studies of the. changes in salinity'of thewater throughout tidal cycles at various localities.Seasonal changes in salinity at Yorktown and "VestPoint a,re shown in' figure 10. Observations at all the'statiq.ns are reported in tables 6-20 (pp. 177-186).
At Yorktown during the period from March 1936to July 1937 the salinity ranged from a minimum of'5.46 parts per thousand on May 5, 1937, to a maximum of 23.96 parts per thousand on October 15,1936. When the observations were started inMarch 1936 the salinity was about 11 parts perthousand. There was a steady incr:.ease in salinitythroughout the spring and summer. ' The 'salinityremained at a relatively high figure during the falland early winter, dropping markedly in January 1937as a result of considerable precipitation. During the
-following spring the salinity change was slight until
the flood conditions of April 1937, when there was' asharp drop. This was followed by a rapid rise during J\tlay and June 1937.
.Ch.anges in salinity at \-Vest Point were much,more abrupt. The range was from 0.08 part perthousand on January 22, 1937, and May 2, 1937, to18.10 parts per thous'and 'on October 27, 1936. .
Observations made at station 53 off Ferry Creekin the Piankatank River -from November 1935 tol\1ay 1937 show a minimum of 5.54 ,parts per thousand on May 6, 1936, and a maximum of 17.90 parts'per thousand Oil November 10, 1936. _
In general, it may be said,t~at the seasonal changesin salinity followed the seasonal conditions of run-off,being high at the time of least run-off in the summer
I and fall, and low during the time of greatest rim-off inthe spring, flood conditions being reflected by markeddrops in salinity. The summer of 1936 being unusuaJly dry, as well as being the season of'least runoff, the salinity of the water was rather high. 'Therelationship between salinity and precipitation canbe seen by comparison of the curves in figure 10.The flood conditions of January and April 1937 areparticularly marked in the resulting low salinity ofthe river at those times.
It is noteworthy that the range of salinity atYorktown was 18.50 parts per thousand and atWest Point was 18.02 pa~ts per thousand.
Differences between' surface and' bottom salinitieswere very slight except at times of extreme floods(fig. 10). In general, the surface, salinity wasslightly less tha'n the bottom salinity because of theflowing of the fresher water on top of the sea water.
The horizontal distribution of salinity of the YorkI
and Piankatank Rivers was studied at various times,samples being taken as nearly as possible at thesame stage of tide throughout the river length. Theresults are presented in figures 11 and 12.,
There was a gradual, decrease in salinity from themouth toward the head, depending on the amountof fresh water brought down the river from above'and the inflow of salt water from Chesapeake Bay.
,In the York River on March 17, 1936, at the lastof ebb tide, the rang~of salinity was from 14.60parts per thou~and above Yorktown to 1.44 parts perthousand off Fillbates' Creek.. On December 15,1936, the range at the last of flood tides was from21.92 parts per thousand 'off Sandbox, below Yorktown, to 14.20 parts per thousand 'at a statio~ inthe pamunkey River 1% miles ab'ove the bridge atWest Point. Oil. January 16, 1937, the range of
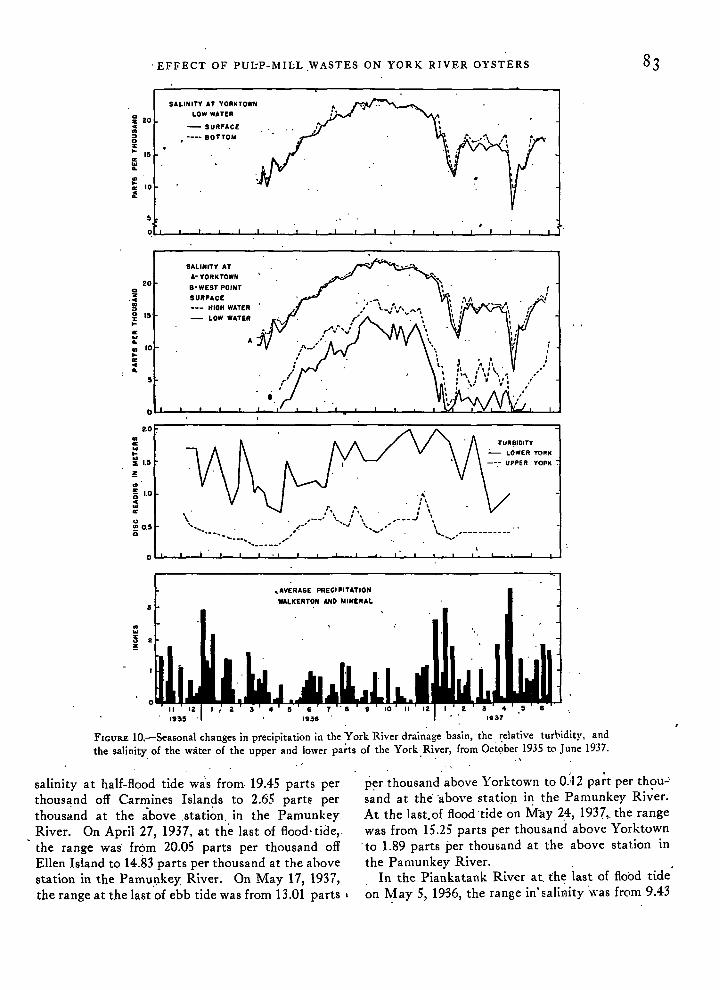
. EFFECT OF PUJ.;P-MILL WASTES ON YORK RIVER OYSTERS
20
15
Ie0: 10:.
SALINITY AT YORKTOWN
LOW WATER
- SURFACE
, -- ..... BOTTOM
A
SALINITY AT
A'YORKTOWN
B'WEST POINT
SURFACE
--- HIGH WATER
- LOW WATER
20az
·4..::>a 15'
"0-
0:..Go.. 100-Il:4..
5
..II:..0-
;: 1.5
i!;
co~ 1.04..0:
...
.. 0.5o
2.0C-------..:....------.....:...---------------.
Ou...--L_L..-...&--L--L........L..-...&--L...-J_.L..................L~L....__'_ ..............L_L...._...........J...___L.J
.AVERAGE PRE" PITATION
WALKERTON AND MINERAL3
....~ 2i!;
o
FIGURE 1O.-Seasonal changes in precipitation in the York River drainage basin, the relative turbidity, andthe salinity of the water of the upper and lower parts of the York River, from Oct9ber 1935 to June 1937.
. . . . \
salinity at half-flood tide was from 19.45 parts perthousand off Carmines Islands to 2.65 parts perthousand at the ~bove .stati~n. in the PamunkeyRiver. On April 27, 1937. at the last of flood-tide,.the range was' from 20.05 parts per thousand offEllen Island to 14.83 parts per thousand at the abovestation in the Pamu,nkey River. On May 17, 1937,the range at the last of ebb tide was from 13.01 parts I
per thousand above Yorktown to 0::12 pa;t per thou-'s~nd at the' "above station i~ the Pamunkey Ri~er.At the last.of flood "tide on M'ay 24, 1937•. the rangewas from 15.25 parts per thousand above Yorktown
.to 1.89 parts per thousand at the above station inthe Pamunkey River.. In the Piankatank River at. the last of flood tideon ¥ay 5, 1936, the range in' saliHity 'was from 9.43
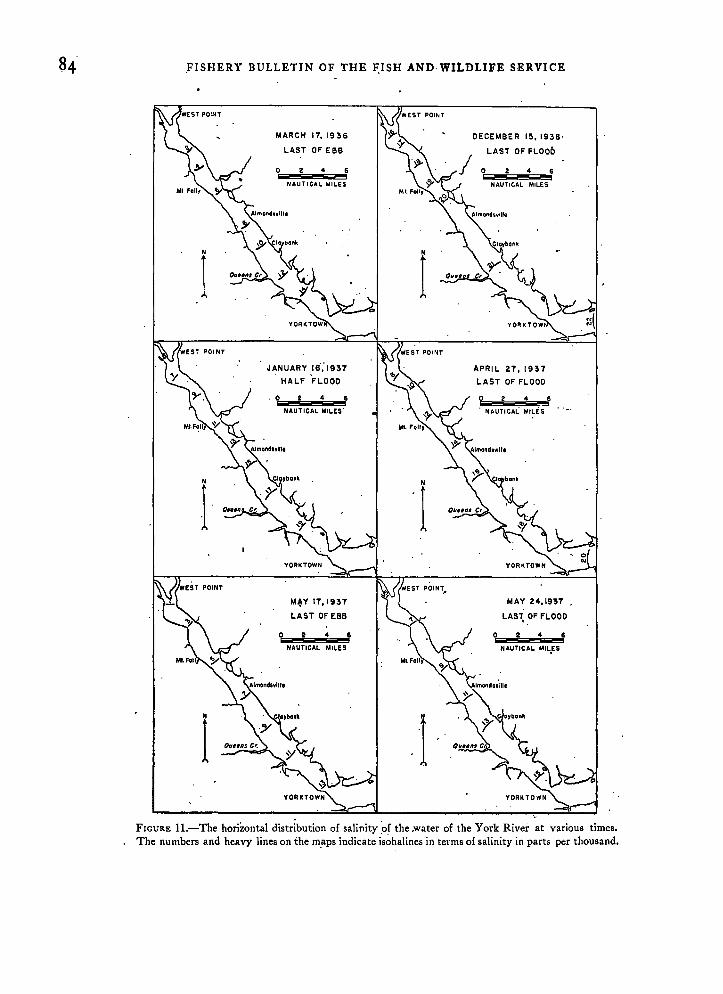
8 .. 4 .FISHERY BULLETIN OF THE F:ISH AND· WILDLIFE SERVICE
APRIL 27,1937
LAST OF FLOOD
6
6:s
MAY 24,1937
LAS~ OF FLOOD
NAUTICAL MIL.ES
o
NAUTICAL MILES
o
DECEMBE R IS, 1936·
LAST OF FLOOD
/ O,"-!!!!!!!!ii;;;oI!!!!!!iL~E!!l~6NAUTICAL MILES
t
I
MARCH 17, 1936
LAST OF EBB
0ioz!!!5;;;;o!!!!!5;~NAUTICAL MILES
. O'-'!!!!5;;;;;I!!!!!i4iii!!!!!5NAUTICAL MILES·
JANUARY 16',' 1937. .
HALF FLOOD
POINT
1
1
1
FIGURE H.-The horizontal distribution of salinity 'of the .water of the York River at various times.The numbers and heavy lines on the m.aps indicate i's~halines in terms of salinity in parts per thousand.

EFFECT OF PULP-l\HLL WASTES ON YOR~ RIVER OYSTERS 8S
4
SCALE OF NAUTICAL MILES
MAY 5,1936
4
Sc;ALE OF NAUTICAL MILES
NOVEMB"ER" II, 1936"
N
I
N
I
N
1APRIL 22, 1937
0 "3 4
SCALE OF NAUTICAL MILE S
o
FIGURE 12.-The horizontal distribution <;:>f salinity of the watt;r of the Piankatank River at various times. Observations weremade during the last of flood tide on "the dates indicated. The numbers and heavy lines on" the maps indicate isohalines interms of salinity in parts per thousand.

86 FISHERY BULLETIN OF THE FISH AND WILDLIFE SERVICE
parts per thousand at the mouth to 3.60 parts perthousand 'at Freeport. On November 11, 1936, atthe last of flood tide, the salinity· ranged from 20.08parts per thousand at the· mouth to 15.99 parts perthousand at Freeport. On April 22; 1937, at the lastof flood tide the range was 'from 15.18 parts pertho~sand at the mouth to 10.90 parts per thousandat a station .off Bland ·Wharf. below Freeport.
The influence· of tide on salinity ~'as observed .atvarious times at stations at Yorktown, Purtan Island,Bell Rock Lighthouse, and.WestPoint. The results
• of the~e studies are shown in figures 13 to 20.Figure 13 represents the tidal changes in salinity
and temperature at Yorktown on February 24 and 25,1936. It will be not~d that.at the bottom the highestsalinity occurred 1% hours after high water and the10~'est salinity occurred approximately one-half hour,after low water. At the surface the highest salinity
.occurred 1'~' hours after ~igh water and the lowest
1.. 7.
7.• .p
..........--_ . ............_.- ......-.-
•IX hours after low water. The salinity changes dur-ing this time were relatively small, varying from1-2.99 parts per th~usand to 16.24 parts per thousand~t the surface, and from 14.78 to 19.11. parts per
I
t.housand at the bottom. The 'difference in salinitybetween high and low water was !ib0ut 4 parts perthousand at the bottom and about 3 parts per thousand at the surface. .
At a station just below West Point (fig. 14) onFebruary 25 and 26, 1936, more marked differencesbetween high and low water occurred. The salinityranged from 0.59 part per thousand at low water to .6.53 parts per thousand ~t high water at the bottom,and from O.il to ~.31 parts per thousand at the surface. The surface salinity dropped more markedlyafter high water than did the bottom salinity, andthe ·change of tide took place at the s~rface first atthe start of ebb tide, and at the bottom first at thestart of flood tide. The highest salinity at' the sur-.............. t
pH ..... •••••• ~
- SURFACE .'. .-- 10TToII .
, ! " , ,
TEMPERATURESURFACE
-- lorTOM
SALINITY- SURFACE-- 10TTOII
i ...: -'. II i····..
.•••:..•.:. .. !I..... : •! ...... 0 •
r -. • ...'" ; ......\;
':::
. H.W.S.
P. M.
:\.!\ A" '. .- ..: '.. ..•..........: ~ .........i .
r···'.j -'.,. .
I ••••••••
....
\..\ :.. V
I.
il
=17..OJ
"'0z.. 16
"'....OJ IS.."'....
TIME OF DAY
FIGURE 13.-Tidal changes in the temperature, salinity, and hydrogen-ion concentration of the water of the York River atYorktown on February 24, and 15. 1936. ·Arrows indicate the stage of tide. L. W.=low water; L. W. S.=low water slack;H. W.=high water; H. W. S.=high water slack. 1.

EFFECT OF PULP-MILL WASTES ON YORK RIVER OYSTERS.
~ -..; ••••.•••••••••••••••••••• pH •
"- SURFACE•••• BOTTOM, , , ,
.. I6
cz..on:>~ 4..0:
~
~ 3
~..
2.5..c..~t= 2.0z~on: 1.5~..c
1.0
.~
"'\.. \_.-..'
TEMPERATURE- SURFACE- ••• BOTTOM
SALINITY- SURFACE•••• BOTTOM
LW, LWS.
o .1
H.• H.•.5.
3 5P.III.
5 7A.II.
9 II
TIlliE OF DAY
FIGURE 14.----:Tidal changes in temperature, salinity, and hydrogen-ion concentration of the water of the York River justbelow West Point on February 25 and 26, 1936. Arrows indicate stage of tide. L. W~-low water; L. W. S.-low waterslack;.H. W.-high water~ H. W. S.-high water slack. ' I
face occu·rred approximately 2 hours after high waterand at the bottom 2}f hours after high water. Thelowest" salinity' occurred abqut 2 hours after lmvwater.
Salinity changes "during a tidal cycle at Yorktownon May' 20, 19~6, are shown in figure 15.. Veryslight differences were observed' in salinity at highand low ·water, the range of salinity at the surfacebeing on:ly from 13.63 to 15.61 parts per thousand,and at the bottom from 14.36 to 16.04, parts perthousand. The highest salinity occurred one-halfhour after high water and the lowest occurred 2hours after 10\'V water. o'
Figure 16 shows the tidal changes in the PamunkeyRiver at West Point on May 21, 1936. The range
.of salinity was from 3.55 parts per thousand to 7.94
parts per thousand' at the surface, and from 3.86 to'&.26 parts per thousand at the, bottom. There wasvery little c!ifference between surface' al~d bottomsamples. The 'highest sali'nity occurre.d about 2%hours after high water and the lowest approximatelyO~ hours' after low water.
Salin.ity changes at Yorkto~n during a ti~al cycleOIl September 24, 1936 (fig~ 17) show a range f~om
18.75 parts' per thousand to 20.26 parts per thousand for f.he surface water and from 19.47 parts perthousand to"20.95 parts per thousand for the bottomwater. The highest salinity' occurred' about 2}~
hours after high water at the surface arid 2% hoursafter" high water at the bottom.. The lowest salinitywas observed '2}6 hours after low water. ,
During the tidal cycle studied at Yorktown on

88 FISHERY BULLETIN OF TH~ FISH AND WILDLIFE SERVICE
16
~ 15....;; 14c..
..0:W..W,. 3,
3 'H.w. H.W.S.
9 10
A.II.II 12
TillE .OF OAYP. II.
FWURE IS.-Tidal changes in temperature and salinity of the water of the York River at Yorktown on May 20, 1936.Arrows in'dicate stage of tide. L. W.-Iow water; L. W. S.-Iow water slack; H. W.-high water; H. W. S.'-high waterslack.
October 29, 19'36 (fig. 17), it was observed that thesalinity range of the water at the surface was from19.00 to 20.91 parts per thousand. At the bottomthe raQge was from 19.63 to 21.24 parts per thousand.The highest sal~nity at the surface occurred 1% h9ursafter high water and at the bottom 2}~ hours afterhigh water. At the surface the lowest" salinity was
.found 3% hours after low water and at the bottom2% hours after low water.
Figure IS shows .the resuits of observations ofsalinity of the surface water during a tidal cycle offPut:tan Islarid on February 10, and April 13; 1937.The salinity on February 10 ranged from 11.62 pat:tsper thousand to 13.62 parts per thousand. The highest salinity was observed 1}6 hours after high water,a~d the lowest salinity occurred approximately 2hours after low water. '\
On April 13,'1937; the salinity of the bottom waterduring a tidal cycle 'bff Purtan Island varied from7.16 parts per thousand to 11.04 parts per thousand.On this day the highest salinity occurred one-halfhour' after high water and the lowest one-half hourafter low water.
Figure 19 snows the,data of tidal studies made atYor-ktown on April 23, 1937. It is difficult to placethe time. of highest sal}nity in relation to time of highwater in, this series. The observations were started
, at high water in the morning and continued to ,highwater in the evening.. The salinity was decreasing ,atthe time of the start of observations and was increasing when the measurements were ended. Thelowest salinity, occurred abo~t 1% hours after lowwater on the bottom and 2 hqurs after low wa~er atthe surface. The range of saJinity at Yorktown during this tidal cycle was from 15.61·parts per thousandto 17.45 parts per thousand for the surface samplesand from 15.68 to·18.51 parts per thousand for thebottom samples.. The results of tidal studies at Bell Rock Lighthouseon M'ay 20, 1937, are presented in figure 20. Thegreatest salinity occurred one-half hour ~fter highwater and the lo»,est salinity. occurred 1% hoursafter low water. The surface salinity varied. from3.91 to 7.41 parts per thousand and the bottom salin~
ity from 4.13 to 7.99 pa,rts per-thousand. .
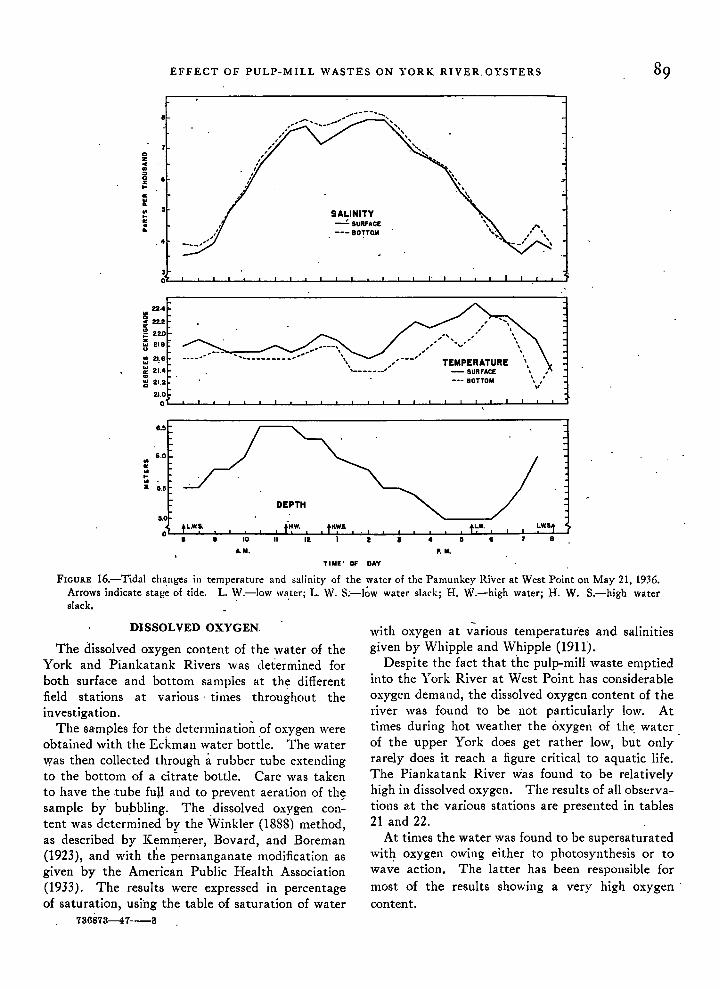
EFFECT OF PULP-MILL WASTES ON YORK RIVER. OYSTERS
'"zc..::l
li! 6..'"~on..'"c..
.4
SALINITY--!. SURFACE
--- BOTTOM
3O~~~-L.--l..--I.--l'--J.-..L-~-L.--l..--I.--,......J.-..L-...I-....I:.......L---l--l'--L-..L...L..,.J--,--J
TEMPERATURE- SURFACE-_. BOTTOM
",,' ...,'-
,---', ,-,,-------,
22.4·l!l~ 22.2
~22D:5 218·u
:: 21:6
~ 21.4co~ 21.2
21.0Ol..-.L-...I--'-....L--L.....L.......L--L--l---''--'--.L-...I--'-....L-L.-L--L--l---''-;-L..-l...-..l.-..J--'-..J
&.5
&.0..'"w..w:II 5.5
5.0
TIME' OF DAY
FIGURE I6.-Tidal changes in temperature and salinity of the water of the Pamunkey River at West Point on May 21, 1936.Arrows indicate stage of tide. L. W.-Iow wa.ter; L. W. S;-Iow water slack; H. W.-high water; H. W. S.-high waterslack.
DISSOLVED OXYGEN.
The dissolved oxygen content of the water of theYork and Piankatank Rivers was determined forboth surface and bottom samples at the differentfield stations at various' times throughout theinvestigation.
The samples for the detenninatioii of oxygen wereobtained with the Eckman water bottle. The waterwas then collected through it rubber tube extendingto the bottom of a citrate bottle. Care was takento have the tube fuU and to prevent aeration of thesample by' bubbling. The dissolved oxygen con:tent was determined by the Winkler (1888) method,as described by Kemmerer, Bovard, and Boreman(1923), and with tl;e permanganate modification asgiven by the American Public Health Association(1933). The results were expressed in percentageof saturation, using the table of saturation of water
736873-47--3
with oxygen at various temperatures and salinitiesgiven by Whipple and Whipple (1911).
Despite the fact that the pulp~mill waste emptiedinto the York River at West Point has considerableoxygen demand, the dissolved oxygen content of theriver was found to be not particularly low. Attimes during hot weather the oxygen of the. waterof the upper York does get rather low, but onlyrarely does it reach a figure critical to aquatic life.The Piankatank River was found to be relativelyhigh in dissolved oxygen. The results of all observations at the various stations are presented in tables21 and 22.
At times the water was found to be supersaturatedwit~ oxygen owing either to photosynthesis or towave action. The latter has been responsible formost of the results showing a very high oxygen'content.

FISHERY B·ULLETIN OF T.HE FISli AND WILDLIFE SERVICE
SAl:INITYSEPT. 24. 1938
SURFACEBOTTOM
.....- ............... _- .......-......."
....._--- ......
..........~ ............ ~ ...-~-_ ..,.,,,.'
•...._- --------_..•.....•...-----..~ 19
~
~ 21..-------------------------,-----------------<=i:.,.. 20..~
O,L...L--'-----'-----'_L-..L-...L--'-----'-----'_L-..L-...L--'-----'-----'_L-..L-...L....L....J...--<_'-..L-..J....--'-----'-----'--.J
TEMPERATURESEPT. 24. 1936
H.W.S
6P. M.
....._------------_ ..L.W 5
II 12• M
~25.r----------------------------------------..,~24.
~24..uZ4.
:242
~24:;:..
..z:I 21
"...,..: 20.......: 19
,.r----------,__... O~:;I:'I~:....... SURFACE'\ -- BOTTOII
\ ........... .. ......"'\.,' .........._- .._...............__..----- _... " .......~----
H.W.L.W.S.
....- .....
OCT. 29. 1938SURFACEBOTTOII
TEMPERATURE
..9 16.2
~ 16;:
~I15...
::: 154..~ 15.2 H,W.s.
01"---!--L.-';!--'-:!-....L---!,0~-'---.-f;"-.l-.,.,!<-2-1'--+---L.....,!-.u..-!,----'---7--1J'--+.....L_!:-......---!!--'--~...L'-J
TIME OF DAY
FIGURE l7.-Tidal changes in the temperature and salinity of the water of the York River atYorktown on September 24 "and October 29, 1936. Arrows indicate stage of tide. L. W.-lciwwater; L. W. S.-low water sla("k; H. W.-high water; H. W. S.-high water slack..

EFFECT OF PULP-MILL WASTES ON YORK RIVER OYSTERS
L.W.1.
SALINITYFEBRUARY IO,II!?SURFACE
H.WS.
il ,.e..:>0z.. ISa:......Iii 12
:
.. •..0
7.2~..'.0;:
z.. ...u.. U.... ..~a:...."2..
II
..Z 10e..:>0
~a: 9....l!a: I:
...://,........",.-,.. ..
,............. .. .
•••••••
... TEMPERATURE •••••••••••,APRIL 13, IU7eoTtOM
.........:;;............•..
111.0
,2.1
'2.•
IRA
! IUa:~II.O
=...IOJ ILli IIA.. 1L2
• 1.0
10.1
IQ.I
I • 10A.II.
"H.w.II 12
t H.WS.
s
TillE Of DAY
• sPoli!.
t LW. tL.W.S.
I •
FIGURE lS.-Tidal changes in the temperature and salinity of the York River at Purtan Island onFebru~'ry 10 and April 13, 1937..; Arrows indicate stage of tide. L. W.-Iow water; L w.. S.low water slack; H. W.-high wa'ter; H. W. S:-high water slack.

FISHERY BULLETIN OF THE FISH AND WILDLIF·E SE·RVICE
::18,<-"L~:/:"'''''''''~'''''''''~'''''''----""",,--'~...................:0·/·~::' ~l.·.~ 8:.0. .. ."' . pH. ...: '\ :" - SURFACE
• t '-,--"":_......:~-'::.......I ~:OTT~..a
.............
SALINITY- SURFACE..... lOT TOM
T~:~~:::~~~··········· ..:..... SURFACE•••• BOTTOM
I•.•'~---------------------------------~III 15.8
! 15.4..~ 15.0
~ 14.8
i 14.2
g 13.8..a 13.4
1'.0rF-.......--'-.......--............i--'----.................- ...........'--'--'-'""'----..--'------.................~
o! 18:>
~0: 17....:?:i 16...,
5.'
5.0..... 0,.0:
:! 0.0I ..."0
a
TillE Of DAY
FIGURE 19.-Tidal changes in temperature, salinity. and hydrogen-ion concentration of the waterof the York River at Yorktown on April 23,1937.. Arrows indicate stage of tide. L. W.-lowwater; L.W. S.-Iow water slack; H. W.-high water; H. W. S.-high water slack.
TABLE 21.-Percetltage af saturatian af t"e 'U!Qter af t"e rork. River wit" dissalve~ oxygm :
Stations
D:.te20 . .14 8 9 18 19
IS 23 5 22 6 16 17 ,S'~r- 'Bot-S"r· Bot· Sur- Bot. Sur- Bot- Sur- Bot- Sur- Bot-
face tom" face tom face tonl face tom face tom race tom--------- -------- ------------ -'-'----'-----_. ----
1935Dec. L • . • .• _ 92.5 93.0 103.2 __ • . ._ • . __ •. • .:. ' ". __ • _Dec. 6.______________ 94.2 92.2. . , •.•• __ 91.7 ._._ 98.9 97.5 . I. ' ,: __ • __ c ._. _. . •• _ • _De<. 12. • 96.2 90.5 95.8 96.4 109.0 ._ 88.6. • ~_. , .• • .~ __ : to • __ - • _
g:~: B::::::::::':::: -iio:s --96:8 :::::: :::::: :::::: :::::: :::=::' :::::: ~::::: ._~:~ :::::: :::::: :::::: _._~~~~ __~~:~ __~~:~ -.~:~ __~~:~ _.~~:~1936 .
Jan. 3... ._ . __ • ._ 96.8 97.4 97.6 ,94.1 "~ __ ,. .:. •. ._._ • • • __ • ~ •. • , _
!~~J~:::~m~~~~~~~~~ ~~~~~ ~~~~~ ~~m~ ~.~~m ~~~:~ ~~~~~~ ~~i~~~ :~~m ~~::~~ ~~fm ~~~~:~~ ~~~:':~ ~~m~ ~~:~~: ~~:~i ;;~;~i ;;~;~i ~~~m ~~~mFeb. 21. •• . , • . ._. ._ • , 88.3 87.4 __ •• •• to. •• _. __ • • • •
H:iJii::::::::::::: :~~~:~ :~~:~ -i~~:: 'i:::: :~~:~ :::::: -i~;:; :::::= :::::: :i~:~':::::: :::::: :::::: ::~~:~ ::~~:~ :::::: :::::: :~:::: ::::::Mar. 19 ._._. • . • to • .__ 73'.8 • .____ 80.2 86.2 55.1 52.7 86.1 85.7
~;:-t~~:::::::::::::_~~~:~ _~~~:~ :::::: :::::: .~~~:~ :::::: __~:~ :::::: :::::: __~:~ --sf3 :::::: :::::: --76:7 --SO:3 --77:6 -'7i:3 --9i:7 --78:8~~~: ~t:-:::::::::::: ::~~:~I::~:~ ::~~:~ -~~~:~ --=:~ :::::: -i~;:~ :::::: ::::::I::~~·:~ :~~:~I:::::: :::::r~:~ :~~:~ ::~~:~ ::~~:~ ::~~:~ :~~~:~Apr. 28_ ••• ~ • . . to • • __ • __ " 95.1 __ . ~6.1 82.01 85.2 83.9 80.3 77.U 90.0 ~2.9
fE~ ~~::::::::::::::::~~:~i:::::::::::: :::::: :~~~:~ :::::: :i6;:6 :::i:: :::::}i6i:;.-~::~::::::: ::::::::ii~:~ :i6~:; :::::: :::::: :::::: ::::::

EFFECT OF PULP-MILL WASTES ON YORK RIVER OYSTERS 93TABLE 21.-PcrCe11Iage of salrlration of Ihe waler of tire York River fllitlr dissolved oxygen-Continued
.Sur- Bot- Sur- Bot-face tom face tom
D,te 20 14
15 23
Stations
8 9 18 19
22 6 16 17Sur- Bot- Sur- Bot- 'Sur- Bot- Sur- Bot-face tom face tom face tom face tom
, .-------1-- ------------------- -------------------
J~~: ~(C-_-_::::::::::-io6:9 -m:S :::::: -ioo:J -i6i:o :::::: --9i:s :::::: :::::: :::::: :::::: :::::: :'::::: :::::: :::::: _~~~:~ _~~~:~ __~~:~ __~::~
!~ ~:~~~:_~~~m~: ;m-l ;~m: ;~ml ;~ml ;~m1 ~~;i~~ _:~_' :~~~' ~:~:j ~~~-i :;~:i ~~~m ::~~j ::~:; ::~:j ::~_i :;~_1 ::~~; ::~:jAug. 28 :____ 85.0 89.8 59.0 62.3 95.6 83.3 76.8 77.0Aug. 31______________ 92.8 88.2 106.0 _Sept. 9 : lOLl 106.0 90.6 ' _
Im~ lt~~~~~~~~~~~~~ ~~'~t~~ ~~~~~~ ==~i~i ==~~~~ ==~~~~ ==~~~~ :::~i ==~~~~ =~~~~~==~~~~ =~TI~~ ~~~~~~ ;~~~~~ ;;~~~ ;;~~~~ ;;~~~~ ;;~~~~ ;;~~~~ ;;~~~~Oct. L . ~_ 84.0 83.3 _Oct. 2 93.8 97.7. :_____ 93.5 69.8 %.6 86.6 91'.7 •Oct. 21. :___ 74.2 88.5 115.5 120.2 83.0 91.2 104.8 96.8 97.4 92.5 84.3 " ~'c • __Oct. 22 • • " • • 81.4 65.0 83.6 81.6 76.4 68.6 79.3 78.4Nov. 4 • -" ._____ 83.3 88.2 85.5 82.9 81.4 76.8 75.1 74.9 84.4 83.4Nov. 5•• 92.5 93.7 91.0 102.8 93.2 96.3 c • • ._. • __Nov. 6_______________ 92.0 95.6 . _. • • ~ • _
1~7 •
J:~: ~~::::::::::::::: --~~:~ -_~~:~ :::::: --S7:9 --96:s --s9:i --S7:3 --sn --S6:4 :::::: :::::: ::~::: :::::: :::::: :::::: :::::: :::::: ::::':: ::::::Jan. 27.______________ 83.6 84.7 84.7 81.1 74.8 70.6 57.7 54.7 62.8 68.8Mar. 3. __ • . . .__ 84.2 88.2 85.1 83.8 78.3 75.2 68 ..1 77.0 69.1 53.4Mar.4 • • 101.8 94.8 91.7 92.4 98.1 96.3 %.0 94.8 93.1 • • ._Mar. 30 . .__ 99.4 100.0 91.3 98.5 _.____ %.9 95.3 95.0 89.4' 91.5 89.6M;ar.31. 105.5 104.0 105.4 107.2 103.9 106.7 • • • . __Apr. 23. • 100.2 102.1 111.8 107.3 105.9 112.3 99.2 ': , - --- __ :Apr. 26_______________ 96.8 90.7 " .. _Apr. 27 • .___ 90.9 107.9 87.3 81.7 84.5 77.9 71.1 75.0 75.5 70.6May 17 ' • •• ~ ._____ 65.8 '65.3 _
Ave'rage : "'99.l 97.7 97.7 98.6"98.S 93.9 96.0 %.1 95.5 --ss:s 92.2 85.0 83.9 86.4 83.679.if'7u 83.. 2"'78.3... .
TABLE 22.-Percelllage of salUrallpll of Ihe roaler of lire PiankaladRiver with diiso[flcd Q.\-yg.·n
'Changes in the dissolved oxygen content of thewater during a tidal cycle in the upper York River
at Bell Rock Lighthouse on May 20, 1937, are shownin figure 20. It will be i:J.oted that fluctuations in 'the oxygen tension were ·following the time of dayrather than the tidal cycle.
The horizontal distribution of dissolved oxygenin the water of the York River on the last Qf ebb,tide on May 17, 1937, is shown in figure 21. It willbe see~ that there was less oxygen in the upperYork than in the lower. The fact that the upperYork was ,consistently lower in dissolved oxygenthan'the lower York can be seen from examinati?nof figure 22, which show8 ·the average percentage ofsaturation at the various stations.
A~alysis of the data presented in table 21 shows,a v,ery' definite decrease iIi' the per~entageof ~atura
tionJrom the 'mouth of the river (stati01~ 20) towardsit·s. head (stations 9· and 19r The annual: ,meanvalues, which are more significant than single observatiQns~ show that in surface water samples; takenbet\yeen these two points, the percentage of dissolved oxygen gradually decreases from 99.1 to 83.2.The figures for bottom samples, as one would expect, ,are lower, ranging at:the same stations from 97.7 to78.3 percent. ' For the Piankatank River the annual
78.0101.8105.0113.5
92.3
92.499.475.797.898.493.976.077.982.666.8
101.697.494.0
100.8
100.797.4
86.7106.2105.3117.7
97.0
53
Surface Bottom
Stations
101.4
55
99.299.2
1lJ.6111.4
99.7
97.0 91.2108.6 _7.U 75.8
102.9' _
18n -----!iiX90.3 96.191.9 _87.7 79.8
106.5 110.3%.0 100.497.6' 105.896.4 92.6
112.2 9~.1
Date
Average ~ .... __ ...... ~
1935Dec. 10. • _
1936Jan. J1 • _Mar..1 _Mar. 12 _Apr. 3_; • • _Apr. 16 . . _May 6 _
j~r; t~:::::::::::::::::::::::::':::::::AUI!. 3. _Aug. 2L _
g~;~l-__~~::::::::::: :.:::::::::::::::::Oct. 26_ • ~ _Nov. 10 _
1937Feb. 2 _Feb. 16 _Apr. 6 _Apr. 2I. _
1---1·---1----
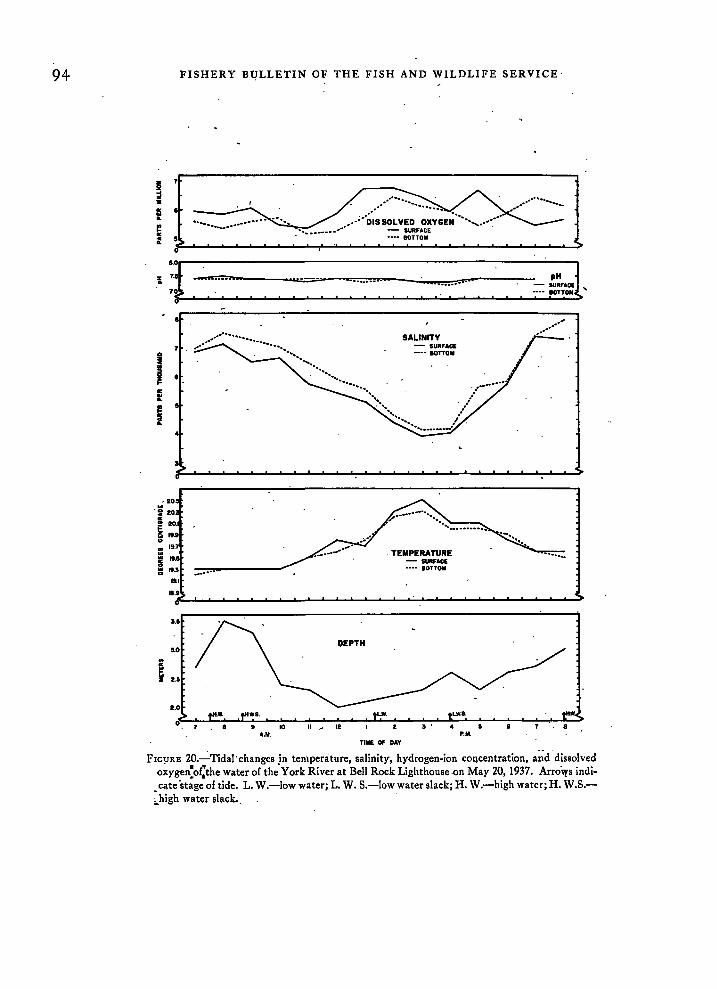
94 FISHERY Bt!LLETIN OF THE FISH AND WILDLIFE SERVICE·
•......... pH iSURFACE .......... BOTTOM, ,
SALINITY- SURfACE......- IOTTOM
.........,.
.................
••••••-..... . TEMPERATURE- SURFACE...... 10TTOil
,20.'... ~ 20.5
0:
~ 20.1
.. 11.9..en 19.7
1:1 .1.~:0: 11.3 -••~••~••:;.-----_...-
II.I
18.'11'-..L..-I.........-'---'--.......................-'--"'--L....................10..-,.;".""a,-'O"...............""-I.-'O"........-.....""-I...;>
•.8
2.0
10 II"" 12 .. 8A.M. P.M.
TIllE OF DAY
FICyRE 20.---':'Tidal'changes in temperature, salinity, hydrogen-ion co~centration, and dissolvedoxygen:of:the water of the York River at Bell Rock Lighthouse ·on May 20, 1937. ArroVys indi-
o cate 'stage of tide. L. W.-Iow water: L. W. S.-low water slack: H. W.-high water; H. W.S....high water slack..

EFFECT OF PULP-MILL WASTES ON YORK RIVER OYSTERS 95
POINT
10
Z900
j:Cl:II:;;;)
I- eoCl:Ul
I-Z
70IIIUII:IIIlL
60
WHARF I
"HORIZONTAL DISTRIBUTION
OF DISSOLVED OXYGEN
IN THE
YORK RIVERON
MAY !7, 19:57
STATIONS
FIGURE 21.-Horizontal distribution of dissolved oxygen in the water of the York River on the last of ebb tide on May 17, 1937.
means vary between 99.7 and 97.0 percent for surfacesamples. The mean for bottom samples at station53 is 92.3 percent. -
HYDROGEN-ION CONCENTRATION
.Sanlples of water collected at the various stationsin the York and Piankatank Riyers were tested fortheir hydrogen-ion concentration, using Hellige comparator and standard ·indicators. In nearly allinstances cresol red was used, but in a few casesbrom-thymol blue was employed. The observedvalues were corrected for salt error according to thecorrections given by Ramage and Miller (I92S).The hydrogen-ion cO~lcentration of all water samplestested is given in terms of pH in tables 6-20 (pp.177-186) and figures 13, 14, and 19.
The fluctuations in the pH of water were foundto be rather extensive, varying from 6.9 to 8.4· inthe York River and between 7.1 and 8.6 in thePiankatank. In both rivers there was a. gradualdecrease in the pH from the mouth to the head.This was due to· the 'greater 'proportiQn of freshwater ~t the head of each stream. The lowest value,
pH 6.9, was observed only once at the time of.highwater slack near \-Vest Point (stat.ion 9, Februar.y 20,1936). The water was almost fresh having a salinityof only 0.86 part per thousand. Slightly acid water,pH 6.7' to 6.91, was encountered several times in theMattaponi and Pamunkey rivers about 1}6 or 1%miles above the bridge at West Point (tables 17and 18)'-
As a general rule lower pH values occurred duringtimes of freshets. Other seasonal and' d.aily changesin the hydrogen-ion concentration were probablyassociated with the intensity of photosynthesis andother biochemical processes in the river.
.PHOSPHORUS
Among the'. phytoplankton nutrients the phosphates feature importantly as the constituents of thesea water necessary for the growth of the .algae. Inthis investigation biweekly samples of water. weretaken at va~ious stations in the two rivers forphosphorus analysis. The cycle of phosphorus wasfollowed from January 1936 to April 1937, using the

FISHERY BULLETIN OF THE FISH AND WILDLIFE SERVICE
P'OINT
100
Iz 90 I I0..
"1 ..· ·1cII::::).. 80 I HORIZONTALC ALMONO'S WHARF
DISTRIBUTION
CI) I OF DISSOLVED . OXYGENIN THE.. YORK 'RIVER
z..., 700C
MEAN VALUES _
..,ca.
10
YORKTOWN ~v->rr.STATIONS
FIGURE 22.-Horizontal distribution of dissolved oxygen in the York River. Percentage of saturation based on mean values.
method of Atkins-Deniges as given by SeiwclI(1935). .'
The results. (given in tables 6 to 20) 3 show comparatively small quantities of phospi19rus in thewater of the t\-\'O rivers. During the spring andsummer months the .quantities 'were negligible. Inthe fall and winter months the phosphorus contentin t~e York River rarely reached 30 milligrams percubic meter. Unexpectedly high content of 93milligrams per cubic meter observed on January 271937, at stations 8, 9, 16, 17, was of short duration'having disappeared \vithin a fortnight. . '
Conditions similar to those found in the YorkRiver prevailed in the Pamunkey Mattaponi andP· k "Ian 'atank Rivers. Only on rare occasions did thephosphor/us content reach 30 milligrams per cubicmeter.
From these -observations conclusions can bereached that fresh water entering these tributariesof. the Chesapeake Bay contributes but very littleto ~he supply of phosphates ~eeded for the propagation of plankton.
3 Tabl•• 6 to 20 will b. round on pp. 177-186
ACCUMULATION OF PULP-MILLEFFLUENT IN THE YORK RIVERTHE RATE OF DISCHARGE OF PULP-MILL
~FFLUENTS AT WEST POINT
. Determination of the total quantity of pulp-milleffluents discharged daily into the river at WestPoint was des.in:d for evaluating the degree of pollution of the river and for computing the concentrationof the.pollutant in the river water. Unfortunately,no systematic records of the rate of flow of effluentsin the various sewer outlets were available. '
Observations had shown that the rate of flow. theappearance, and the 'specific gravity of. pulp~inilieffluents were subject to rapid and sudden changesdepending on the various stages of operation of themill. Since information on rates of flow was notavailable, observations' were made on a. number ofoccasion~ over sufficient periods to record thesevariatiO!lS and to obtain data which would serve inevaluating the degree of polliltion of the river andfor computing the concentration of the pollutant inthe river water. These' observations are presentedhere with the necessary details for such computations.
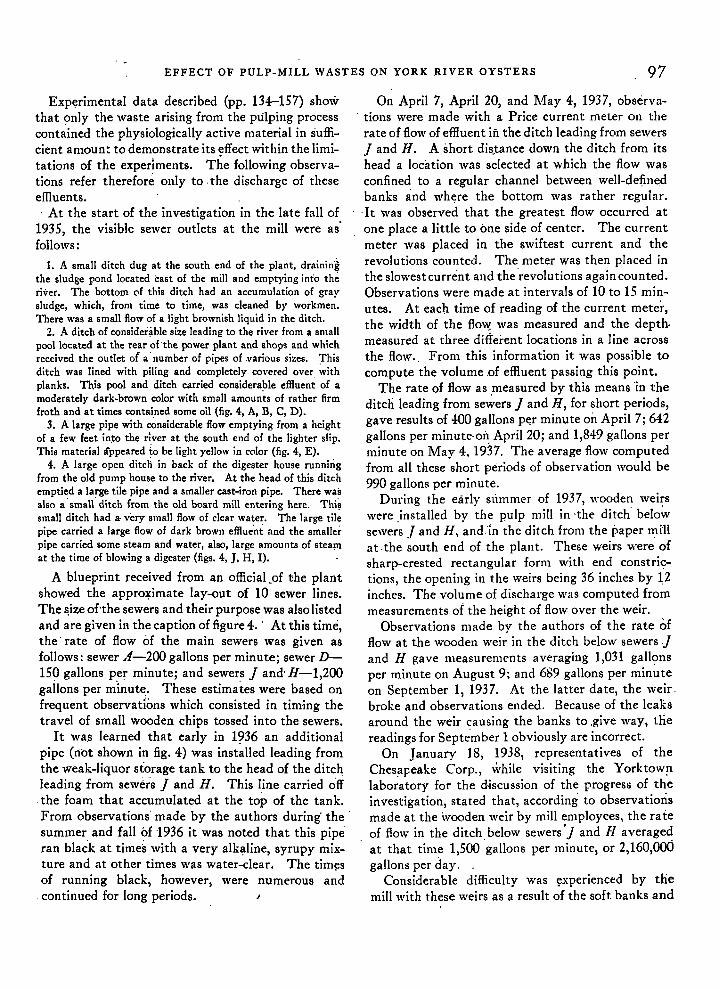
EFFECT OF PULP-MILL WASTES ON YORK RIVER OYSTERS 97
Exp~rimental data described (pp. 134-157) showthat ~nly the waste arising from the pulping processcontained the physiologically active material in sufficient a1110un~ to demonstrate its ~ffect within the limitations of the experiments. The following observations refer therefore only to ,the discharge of theseeffluents., At the start of the investigation in the late fall of
1935, the visible sewer outlets at the mill were as'follows:
1. A small ditch dug at the south end of the plant, drainin~the sludge pond located east of the mill and emptying into theriver. The bottom of this ditch had an accumulation of graysludge, which, from time to time, was cleaned by workmen.There was a small flow of a light brownish liquid in the ditch.
2. A ditch of consider~blesize leading to the river from a smallpool located at the rear of-the power plant and shops and whichreceived the outlet of a' number of pipes of -various sizes. Thisditch was lined with piling and completely covered over withplanks. This pool and ditch carried considera!>le efHuent of amoderately dark-brown color with small amounts of rather firmfroth and at times contained some oil (fig. 4, A, B, C, D).
3. A large pipe with ~nsiderable flow emptying from a heightof a few feet in~o the river at the south end of the lighter slip.This material appeared to be light yellow in color (fig. 4-, E).
4. A large open ditch in back of the digester house runningfrom the old pump house to the river. At the head of this ditchemptied a large tile pipe and a smaller cast-iron pipe. There wasalso a' small' ditch from the old board mill entering here. Thi~
small ditch had a· very small flow of clear water. The large tilepipe carried a large flow of dark brown efHue'nt and the smallerpipe carried some steam and water, also, large amounts of stea!11at the time of blowing a digester (figs. 4-, J. H, I).
A blueprint received from an official.of the plantshowed the approJ!:imate lay-out of 10 sewer lines.The ~izeohhe sewers and their purpose was also listedand are given in the caption of figure 4. ' At this time,the'rate of flow 6f the main sewers was given asfollows: sewer ..1-200 gallons per minute; sewer D150 gallons per minute; and sewers] and' H-l,200gailons per m·inute. These estimates were based onfrequent observations which consisted in timing thetravel of small wooden chips tossed into the sewers.
It wa,s learned that early in 1?36 an additionalpipe (liot shown in fig. 4) was installed leading fromthe weak-liquor storage tank to the head of the ditchleading from sewers] and H. This line carried offthe foam that accumulated at the top of the tank.From observations'made by the authors during' the'summer and fall of 1936 it was noted that this piperan black at time~ with a very alk:;l.line, syrupy mixture and at other times was water-clear. The tim~s
of running black, however, were numerous and. continued for long periods.
On April 7, April 20, and May 4, 1937, observa-, tions were made with a Price current meter all the
rate of flow of effluent in the ditch leading from sewers] and H. A short dis,:tance down the ditch from itshead a location was selected at which the flow wasconfined to a regular channel between well-de:\i.nedbanks and wh~re the bottom was rather regular.'It was observed that the greatest flow occurred atone place a little to one side of center. The currentmeter was placed in the swiftest current and therevolutions counted. The meter was then placed inthe slowest current and the 'revolutions again counted.Observations were made at intervals of 10 to 15 minutes. At each time of reading of the current meter,the width of the flm~ was measured and the depth.measured at three different locations in a line acrossthe flow., From this information it was possible tocompute the volume ,of effluent passing this point.
The rate of flow as ,measured by this means 'in theditch leading from sewers] and H, for short periods,gave results of 400 gallons p<;r minute on April 7; 642gallons per minute·onApril 20; and 1,849 gallons perminute on May 4, 1937. The average flow computedfrom all these short periods of observation would be990 gallons per minute.
During the early Slimmer of 1937, wooden weirswere ,installed by the pulp mill in ·the ditch' belowsewers] and H, and:in the ditch from the paper millat the south end of the plant. These weirs were ofsharp-crested rectangular form with end constrictions, the opening in the weirs being 36 inches by 12inches. The volume of discharge was computed frommeasurements of the height of flow over the weir.
Observations made by the authors of the rate offlow at the wooden weir in the ditch below sewers .jand H !!:ave measurements averaging 1,031 gall~:ms
per minute on August 9; and 689 gallons per minuteon September 1, 1937. At the latter date, the weir,broke and observations ended. Because of the leaksaround the weir causing the banks to ,give way, diereadings for Sept~mber 1 obviously are incorrect.
On January 18, 1938, representatives of theChes~reake Corp., while visiting the Yorktow!llaboratory for the d·iscussion of the progress of theinvestigation, stated that, according to observationsmade at the \-vooden weir by mill employees, the rateof flow in the ditch below sewers 'J and H averagedat that time 1,500 gallons per minute, or 2,160,000galIons per clay. ,
Considerable difficulty was ~xperienced by themill with these weirs as a result of the soft banks and
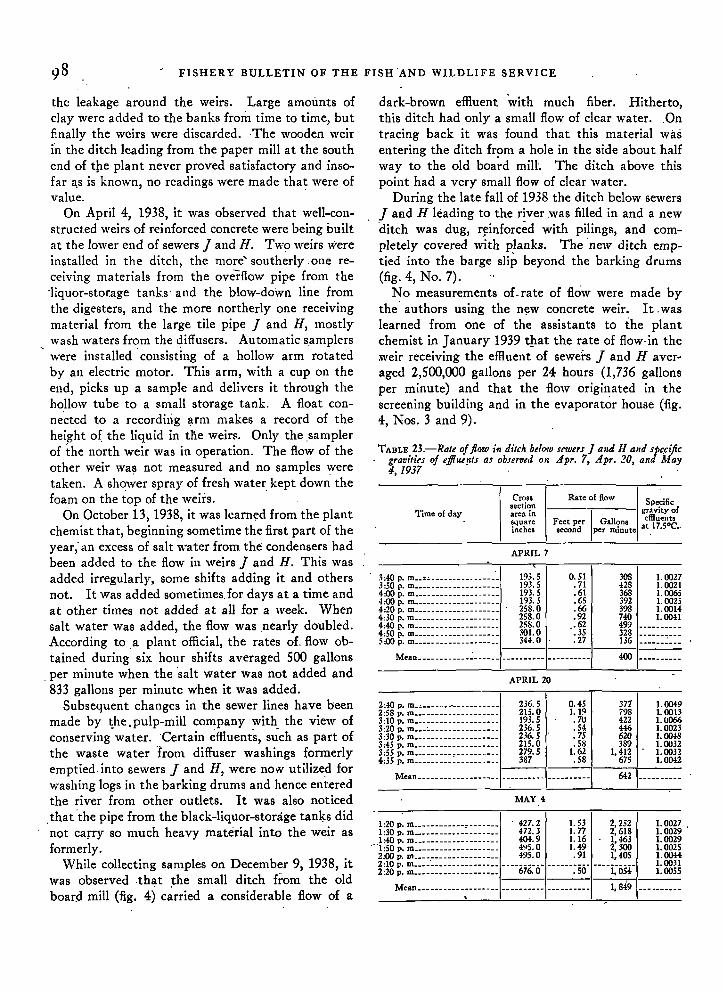
98 FISHERY BULLETIN OF THE FISH 'AND WILDLIFE SERVICE
TABLE 23.-Rate of flow in ditch belofo mUCTS ] ami H alld sp~cific
. gTavifirs of .iflur!lts as obsCN'ed OIl ,1pT. 7, ApT. 20, alld May~WH, . '
1. 00271. 00291.00291.00251.00441.00311.0055
308 1. 0027ol28 1. 0021368 1. 0065392 1. 0025398 1. 0014740 1. 0001149~ ----------328 ----------136 ---- ..-----
400 ----------
371 1.OM9;98 1.0013422 1. U066446 1. 0023620 1. 00018389 1. 0032
1.412 1.0032675 1.0W2
642 ----------
0.51.71.61.65.66.92
J~.27
Rate of flo,,, Specific
Igravity of
Feet p~r Gallons eflluenotssecond per minute at .17.5 C.·
193.5193.5193.5193. 5258.0258.0258.0301. 0Hol.O
Crosssectionarea insquareinches
APRIL 7
Time of day
Mean ~ _
3:40 p. m __.' . ---- __3:50 p. m _4:00 p. m _4:00 p. m . _4-:20 p. m _4:30 p. m · _4:ol0 p. m _4:50 p. m _5:00 p. m _
1---1---11---1---
MAY 4
dark-brown effluent 'with much fiber. Hitherto,this ditch had only a small flow of clear water. ,Ontracing back it was found that this material wasentering the ditch fr?m a hole in the side about halfway to the old board mill. The ditch above thispoint had a very small flow of clear water.
During the late fall of 1938 the ditch below sewers] and H leading to the river was filled in and a new'ditch was dug, r~inforced with pilings, and completely covered with planks. The 'new ditch emptied into the barge slip beyond the barking drums(fig. 4, No.7).
No measurements of-rate of flow were made bythe' authors using the n~w concrete weir. It .waslearned from one of the assistants to the plantchemist in January 1939 tItat the rate of flow·in theweir receiving the effluent of sewers] and H aver~
aged 2,500,000 gallons per 24 hours (1,736 gallonsper minute) and that the flow originated in thescreening building and in the evaporator house (fig.4, Nos. 3 and 9).
APRIL 20
2:ol0 p. m_. ·___________ 236.5 0.452:58 p. m____________________ 215.0 1. 193:10 p. m____________________ 193.5 .7U3:20 p. m c________________ 236.5 .543:30 p. m____________________ 236.5 .753:ol5 p. m____________________ 215.0 .583:55 p. m .__________ 279.5 1.624:iS p. m ,__3_8_7_1.__._58_1 1 _
Mean _
1:20 p. m ._______ '427.2 1. 53 2,2521:30 p. m .__________ 472.3 1.77 2,6181:40 p. m____________________ 4Ool.9 1.16 1.463
"1:50 p. m____________________ ol"5.0 1.49 2,3002:00 p. m____________________ 4-95.0 .91 1,4052:10 p. m ' ----. _2:20 p. m____________________ 676.0 .50 1,054
Mean___________________ 1,849
the leakage around the weirs. Large amounts ofclay were added to the banks from time to time, butfinally the weirs were discarded. ,The wooden weiri"n the ditch leading from the paper mill at the southend of tpe plant never proved satisfactory and insofar a.s is known, no readings were made that were ofvalue.
On April 4, 1938, it was observed that well-constructed weirs of reinforced concrete were being ouiltat the lower end of sewers] and If. Two weirs ",,-ereinstalled in the ditch, the more' southerly one receiving materials from the overflow pipe from the'Iiquor-storage tanks' and the blow-do\.vn line fromthe digesters, and the more northerly one receivingmaterial from the large tile pipe] and If, mostlywash waters from the diffusers. Automatic s.amplerswere installed' consisting of a hollow arm rotatedby an electric motor. This arm, with a cup on theend, picks up a sample and delivers it through thehollow tube to a small storage tank. A float connected to a recordilig ~rm makes a record of theheight of the liquid in the weirl1. Only the ,samplerof the north weir was in operation. The flow of theother weir was not measured and no samples weretaken. A shower spray of fresh water kept down thefoam on the top of the weirs.
On October 13, 1938, it was Icarn~d from the plantchemist that, beginning sometime the first part of theyear,' an excess of salt water from the condensers hadbeen added to the flow in weirs] and H. This wasadded irregularly, some shifts adding it and othersnot. It was added sometimes.for days at a time andat other times not added at all for a week. Whensalt water was added, the flow was .nearly doubled.According to.a plant official, the rates of. flow obtained during six hour shifts averaged 500 gallons
, per minute when the salt water was not added and833 gallons per minute when it was added.
Subsequent changes in the sewer lines have beenmade by t;he, pulp-mill company with_ the view ofconserving water. 'Certain effluents, such as part ofthe waste water "from diffuser washings formerlyemptied into sewers] and H, were noW" utilized forwashing logs in the barking drums and hence enteredthe river from other outlets. It was also noticed
.that 'the pipe from the black-liquor-storage tan~s didnot carry so much heavy material into the weir asformerly.
While collecting samples on December 9, 1938, itwas observed ,that ~he small ditch from the oldboard mill (fig. 4) carried a considerable flow of a

EFFECT OF PULP-MILL WASTES ON YO~K RIVER OY.STERS 99
TABLE 24.-Wat" capacity of various s~g1l!m.ts of tlu York 'Rit,tr,dt/(rlllilled by the scdillllf1ltation S1lrfl~Y of Oct. 25 10 Nov. 25, 1938,made by the Soil ConseNJatioll St:rviu, U. S .. Departtiullt of.1gricultttre
.Acru1,0791,288. 9951,2161,5782,1571,2161,5761,6352,1452,0304,748
21,663
.4eu-Jttl7,8989,7469,1339,553
11,71718,81612,63415 ,51615,13121.26721,61453,871
206,896
I. Water I Surfacecapacity areaBOItnding ranp:es
6-7 • • ._ .7-8 , " .'. __8-9 • • •. •9-10 • _10-11 • • • • '__11-12 .,. • _12-13 • c • _13-14 '.: c _•• _14-15 •• • •_. _. _. _15-17 • _17-18 • : • _18-19 • :
1----1--...:--Total. ' _
house, published in the Report on Investigation ofSilting in the York River (1939). Table 1" ot' thisreport gives estimates of the water volume of theriver of 222,189 acre-feet in 1911 a~d 206;896 acrefeet in 1938. For the purpose of the present work the.miqdle value of the two figures, namely 214,542 acrefeet, has been used. In determining the volumeof water in the York River, Brown, Seavy, andRittenhouse (loc. cit,y obtained the cross-sectionalareas of water below mean:low water and measuredthe corresponding surface by planimeter usirig theUnitel States Coast and Geodetic Survey ChartNo. 495, publi~hed in 1931. From these data thevolume of water was calculated for each segment byusing Dpbson's formula for r~servoir capacities(Dobson 1936). The length of the York Riv~r ~as
,divided irito 12' segments shown in figure 23 which'represents a reproduction of the Sedimentation Survey chart. Unpuhlished data received from theSoil Conservation Service give the water capacitiesfor each segment separately (table 24). If the twolower segments (11 and 12, figure 23), located in thepart of the river in -which the oysters are not' affectedby pollution, are excluded, the volume of ~hat partof the river in which oysters show abnormal symptoms (segments 1-10 inclusive) can be estimated asequal to 131,411 acre-feet.,
The proportion of the' pulp-mill effluent in the, river basin can be calculated by using .the formulasuggested by Prof. H. Hotelling, then of StanfordUniversity, and employed in the studies cond)lctedby the former United States Bureau of Fisheries onthe effect o(red liquor (waste from the sulfite pulpmill process) on Olympia oysters, Ostrea luridd (Hopkins, Galtsoff, and MacMillin, 1931, 183-184).
As many changes were made in the arrangement ofthe sew'er outlets from time to time, and the woodenweirs constructed did not prove satisfactory andoften washed out, the authors employed for theircalculations o~ly the observations which they'niadepersonally by usi~g th~ ~urrent meter. The data ofthe rate of discharge through sewers G and Haresummarized in table 23. '
For the computation of the concentration of theeffluent the mean of the three series observations.reported in, table 23 were used. The estimated' rateof influx of this effluent of 963.6 gallons per minuteappears to be conservative compar.ed to othersobtained at different times by the authors and bypulp-mill representatives. Converting it into feetper acre the value of 4.26 feet 'per' acre per day isobtained. This' value has been used in the subsequent computations.
CONCENTRATION OF THE PULP-MILL EFFLUENTIN THE TIDAL' WATERS OF TI;IE YORK RivER
If the material discharged by the pulp mill isstable and is not immediately destroyed by 'riverwater, one would expect that a steady influx of it
:: over a period of seve.ral years wpuld result in buiIding up a definite concentration in a tidal basin.Since the rate of destruction eof the effluent in theriver is not' known and no chemical method is available_ at present for its quanti~ative determination,we must consider a theoretical case, assuming firstthat there ·is no 'destruction of the effluent and thatthe effluent is thoroughly mixed and is uniformlydistributed in the'cross-sectional area of the stream.Under these conditions the dilution of the effluentover the oyster grounds would depend on two variable factors, namely, the rate of its dis'charge by thepulp mill, and the river flow. The resulting concen~
tration of the pollutant and the time required, forreaching an equilibrium can be computed.
It has been shown above that 4.26 acre-feet per day may be:: considered a conservative rate at whichIi physiologically active pulp-mill, effluep.t is discharged into the head of York River at West Point.
From the observation on currents at the ,crosssectioned area of. the River opposite Purtan Island,described in de~ail on pages 72-78, it has been deter,mined that the iriflux of tidal water into the rive~ba~in is equal to 11,054.54 acre-feet per day. '
An estimate of the volume of. the river basin isavailable from the data.of Brown, Seavy, and Ritten-

100 FISHERY BULLETIN OF THE FISH AND WILDLIFE SERVICE
Accordillg to Hotelling's formula--'-
p=~[1-( l-a+b)'l
a+b '. V
where p- is the proportion of pulp mill effluent in:basina-the rate of discharge of pulp milt effluent in acre-feet
per day . .b-the rate of influx of water into the basin in acre-feet
per dayr- ~otal volume of the river basin1- time i!1 days since the pollution started.
The problem of computing the concentration ofpulp-mill effiuent in the York River was presentedthis time to Dr. L. B. Tuckerman, 'Assistant Chief,Mechanics and Sound Division, Nation~l Bureau ofStandards, who was kind enough to prepare a'memorandum which is quoted in part.
Let a';" rate of discharge of poisonous pulp liquor at the pulp millin acre-feet per day ,
b=the rate of influx of water into the river bllsin in acre-feetper day. This includes the influx of wate;' from the riverabove the mill and the daily influx of tidal watcr
r= total volume of the river basinp=proportion of poisonous pulp liquor in bay
p",,=liniit which proportion of poisonous pulp liquor in bayapproaches after a longtime
t=time in days since the pollution started.
Assuming that these processes are continuous, and that themixing of the poisonous liquor with the water of ~h.e bay is practically instantaneous the daily efflux of poisonous liquor- from thebay will be equal to p .(a+b) so that the total rate at which thepoisonous liquor in'creases in the bay is:
d(lJlT) ( +b)--at=a-p a
which gives the linear differential equation for p as
The solution of this differential equation, under the terminalcondition
p._.=O
readily is found to be:
p= p",,(1-e-k l)
where
a a+bp",,= a+b' and k=,--y
The difference between this solution and the solution
P=a'~b[1-( l-a~b)']=p""[I-('l-~)ll
given by Rotelling, lies in the fact that in this solution the influxof poisonous liquor and water and the efflux of the mixcd.. f1uid ofconcentration, p, are assumed to be continuous 'while Rotellingassumes that the influx and efflux occurs discontinuously once a
day. These two solutions'indicate -the same value for the limitingvalue of p
but differ in the rate at which this liinit is approached. Rowev:er',a+b . '
for small enough v:alul:s of"k=---v- these two rates are practically
identical, since
and if k is small enough the terms
HkL %k3+make little difference.
The maximum difference between thc concentration calculatedfrom the two formulas will occur at a time given by
t _log [log (1--:;- k){log e-k ]
- log [e k{(I-k)]
or approximately for k small in co~'parison with I,
If a=4.26 acre-feet per'day, b= 11053.54 acre-feet per day, and
V = 214542 acre-feet
a+b :,k=-V=0.05154
1'- k = 0.94846
and e- k =:=.,0. 94976
For these data the maximum difference between the concentrations calculated by the two formuias will then occur at about
1/=0.05154(1-0.0129)=19.2 days,'
. This was checked by computing (l-k)1 and r kl and thcirdifference for 1=19.0, 19.2 and 19.4: days.
1DUllS (l-k)' (-1:1 (l-k)'-t-·' ,
19.0 .634-11 i30 ' .62442122 .0096900819.2 .63796324- .92817291 .,0096903319.4, .64177463 .63208510 .00968953
The computations were carried :to 8 decimal places since overthi~ range the difference was consunt to 6 decimal places. Theseresults show,clearly the existence ()f a maximum difference betweenthe two ,formulas of less than 1 'percent in the· neighborhood ofl=19.2 days. ' .. '
In view of the broad assumptions made in formulating theprciblem this difference is wholly'insign·ificant. Since Rotelling'sformula uses somewhat simpler calculations, it is to be preferredif estimates are to be made upon assumptions such as those usedhere.
Either formula gives,for the final concentration
'" 4.26 'p",,= a+b = 11057.8=0.000385

'EFFECT OF PULP-MILL WASTES ON YORK RIVER OYSTERS 101
Below are calculated bOy Ho£eIling's formula the values of
L=l-(l-k)'PaJ
for a number of days up to 100:
which has not yet been removed, or destroyed at th~t station.Since the regi~e is assumed to be steady
b... -0bt-
and
1 " ~ " 0.0522 .1003 ~ .1474 ~ .1915 .2326 .2727 , ~310
8 .3459 .379
10 :______ .41115 .54820_____________________________________ .65325 .7~4
30 ~_~_________________ .79635 .84340~ .88045 .90850 ~ .92960 .95870_____________________________________ .97580 .985
90_____________________________________ .991100 .995
The formula :aJ= l-~t' would 'give 0.990 for 90 days and
0.~94 for 100 days which emphasizes again how little choice thereis between the two form~las. As can be seen the final limit ofpaJ =0.000385 is practica.!ly (within 1percent) reached in 90 daysafter the start of the poll~~ion. " •
These assumptions are ~f course inadequate to give any picture'of the decrease of pollutioii ~ith increasing distance down the bayfrom the mill.
There seems to be no reasonable way to attack this problem solong as the concentration at any station is assumed to vary withthe time. However, after, a relatively short time, say 100 days,compared with the total dine of pollutio'n, several years, it may beassumed that at each'station along the river a practically steadyregime has been reached/: Some idea of the law, but not the magnitude of that decrease, 'may then be gained from the followingf~rther assumptions.
Assume that p has re,ached its limiting value paJ=a~b
throughout the basin. Assume further that the flow of fluid downthe basin is uniform acros~ the. stream bed. Then the tiinerequired for any given volume of polluted water to flow from themill to any lower station will be proportional to the total volume,fI, of water lying between that station and the mill, i. e., /=CfJ,
where, is some constant. .If it is further assumeq that there is some process acting which
removes or destroys the poisonous constituents in any given portion of the poisoned water at a certain rate per day, the poisonouseffect of the water at any station in the basin may be represent~d
by ...paJ' where ... is the fraction of the poisonous constituent
reduces to
... =8-·-"-which gives
where ," is still another constant.According to'this the poisonous effect will diminisl;J. exponen
tially with'vohime of water between the station and i!;c mil1 butwill be present'to some extent throughout the whole' basin andout into the Iiay beyond. '
Dr. Tuckerman's computations show two important facts: first, that at the rate of discharge of 4.26acre-feet per day the final concentration is about
_0.0004. This figure is very close to the threshold concentrations observed in laboratory tests (see pp. 134157) which showed that pulp-mill effluent is physiologically effective in the concentration between 1: 1000and 1: 2000. It is significant that the concentrationcomputed on a theoretical basisis of the same degree
the water will be wholly innocuous.The second ~ssumption leads to the equation
0... =-cc"...Ofl
where " is sO,!,le other constant.This gives 11'=1-"'11
so that below a certain station given by
0...{)1I=-cc'
1v=cc'
Two different assumptions as to the rate of removal or destruction of the poi~~nous constituents suggest thems~lves.
1. The time 'rate of decrease of the concentration of the poison-ous ,./f"'!,t at any station '
bll'paJ = -c'bt
is proportional to its concentration (a monomolecular reaction).
The first assumption leads to t11e equation
bll'p .ot aJ =c"II'PaJ
is a negative constant (a constant rate, ,', of supply of the removingor dest:roying agent). '
2. The time';rate of decrease of the concentration of poisonouscharacter" at any station
"P--l-(l-k)lPlD
IDay.

102 FISHERY BULLETIN ali THE FISH .AND WILDLIFE SERVICE
2%00018000
...... .,.... ".
11
SCale in Feet. LEGEND
o-IH-o Silt Range.® Sei.."t Numbe,•
o
USED IN
SEDIMENTATION SURVEYBY
~.S. DEPARTMENT OF ~GR/CUL TURE. SOIL CONSERVATION SERVICE
Reproduction of Figure IBrown, Seav,. end Rlttenhou•• (1939)
.IO,ggg,
FIGUR.E 23.-Silt ranges of York River used in sedimentation survey by Soil Conservation Service, United States D.~partment
of Agriculture. Reproduction of figure 1 of the report by Brown, Seavy, and Rittenhouse (1939). .

. EFFECT OF PULP-MILL WAsTE.s ON YORK RIVER OYSTERS
of magnitude as the physiologically effective COIF
centration determined· experi~nentally.. It can beeasily seen that with:the slightly increased rate ofdischarge of about ,1,500 gallons per "minute or 6.63acre-feet per day 4' which has bee'n frequentlyrecorded by the pulp-rnill officials, the final conc~n
trati~n in, the river eq~als 0.0006 or 1":1666.The second import~nt conclusion revealed by the
computations is "that, :assuming there is no destructiO~l of the effluent, the equilibrium is 'reached in·about 90 days after the beginning of the pollution.If we consider only the'upper two-thirds of the riverbasin, the volume of which is 131,411 instead of214,542 acre-feet us~d in the computation, the
final, concentration, p=a~b will be reached in
a correspondingly shor~er time. 'Dr. Tuckerman's suggestion that the to?,ic effect
will diminish exponent"ially with the volume of waterbetween the source of pollution and a given pointalong the river is 'very valuable for further'research:Condition of oysters in the York River clearly sh9wthat at present no' toxic effect is- noticeable, in the"lower part of the river:, ' '
PLANKTON CONTENT OF T,RE-YORKAND PIANKATANK RIVERS
A study of seasonal changes in the plankton content of the waters of the York and the PiankatankRivers 'was especially pertinent a~ there was the possibility that a scarcity of available oyster food mightbe responsible for the poor condition of the 'oystersin the upper York River. '
By means of a Birge-Juday pla~lkton trap· biweekly sampJes were obtained ,of the"surface water(0.5 meter) overlying oyster bottoms at stations20, 14; 5, 16, 17, and 9 in the York River, and 55
. and 53 in the Piankatank River. At 'stations 20,14, 9", and 53., where the depth was greater than 2meters, a sample of water just off tp.e bottom wasalso taken. '
Two liters of the water sample were passed througha Foerst-Juday centrifuge rotating at 20,000 revo
·lutions· per minute. The centrifugate was thentransferred to a IS-millimeter tube, and centrifugedfor 5 niinutes in' a clinical centrifuge. The waterwas decanted and 10 milliliters of 80-percent acetoneadded :to the sedimelit in the bottom of the tube.After shaking, the tube was set aside for 15 minutes, '0,,< acr<-foot .quaI~ 325,851 gallo"s.
for ex~raction of the green coloring matter and wastl{en again centrifuged for another 5 minutes. Comparis9n of the color was then made with the Harvey(1934)· standards of nickel s4lfate and potassiumchromate, and the results expressed in pigment unitsper liter of original sample. Each unit was equivalent to approximately 10,000 organisms' (diatomsand dinoflagellates). .,
In addition, 500 milliliters of the sample werelikewise centrifuged and the sediment preserved invials'-with formalin. for identification and counting.
The reliability of Harvey's method has beenchecked by the authors by comparing the values ofthe pigment units with the total number of diatomsand dinoflagelllJ,tes found in the same sample. Theresults, plotted in ,figure, 24, show that in general thetwo curves follow the same trend and with the exception of the first observation (February 1936) are illagreement. As we may expect, the pigment unitcurve is less jagged than the curve of the totalnumber of forms. The pigment unit technique is,therefore, very useful in following the seasonalfluctuation in the abundance of phytoplankton. Itcanpot be used, however, in case it is necessary to
, determine the amount of living matter produced inthe form of plankton. ', Results of the observations of the amount ofplankton present at the various stations' are givenin table 23. ,The averages for the entire periodhave been plotted on the n~aps in figure 25.
:Mean plankton conte,nt in the York River computed' from all the obs'ervations was equivalent to
·48.7 pigment units as compared with 31.9 units inthe Piankatank. Th~ means' computed separ~tely
for the lower and upper parts of the York River(table· 25) are 47.4 and 50.0, ,respectively. Obviously, the difference between the plankton pro-
• duction in the lower and upper parts of the river isinsignificant. 'A 'colilparison with the PiankatankRiver, which is known to produce good oysters,shows that there is no deficiency ,in the phytoplankton productivity in the York River. Evidence'from plankton studies points rather to an oppositedirection suggesting that the 'potential supply of·plankton is qJ.ore abundant in the York River thiinin the Piankatank, 'where 'the, annual mean of pig-ment units per liter was 31.9 .
A study' of the seasonal distribution of plankton atdifferent stations (table 25) shows that throughoutthe major part of the year' the upper part of theYork River was slightly. ri::her in plankton than the

1°4 FISHERY BULLETIN OF THE FISH AND WILDLIFE SERVICE
700
600
500
<II400::E
<II~
-0:Z'"cr'"",-0: ....0
0: 300
'"ll....0
<II0
o:Z",cr 200<IIco:>::EO:::>%zt:
100
1,107.0BO
t +BB3.BOOI' •,I II" 'I"" I'I ~ I:I, III II IJ I'/. ,J II II I,I . IJ III IiI I, II ,
I I
I IIIIIII,I
Y ~IIIIIII,II, I
\ IIII
-- PIGMENT UNITS
----NUMBER OF ORGANISMS
140
120
0:
'"100 =...
0:
'"A-
BO <II...Z:::>
...z
60 '"::E'"Go
z·40 0...
><zcr...ll.
20
d--.........---'-----::2-''-3''''·......L.-4--'--5,...--JL...-6-'----7-''-'-B,...--J'-9-'---'0---'-1-1...l 0
1936
F":IJRE 24.-Comparison of the' results of counting. using the plant-pigment method forquantitative determination of the plankton in the York River,. 1936.
lower part. Sta tiOl! 17 ill the upper part of theriver was especially rich in plankton. In April 1937the plankton cont~nt reached here the highest markof 240 units, equivalent to over 2 million organismsper liter. Such a density of phytoplankton has notbeen encountered at other stations.
A comparison of the cyclic changes in the planktoncrop based· on pigment unit determinations at stations in the York and Piankat'ank Ri~ers is presented'in figure 26. It· was found that in both rivers the·maximum occurred at the usual vernal period, Marchto April. Slight increases noted in July, August,November, and December were insignificant in comparison with the spring maxim,a. Throughout thesummer the amount of plankton remained relativelylow. The increased spring production of planktonin the York River occurred between temperatures of
-so to 16° C. in 1936, ,and .the amount of plankton- decreased rapidly 'after the temperature rose above
i6° C. During the spring of 1937 the maximumwas like,wise reached at a t~.~lperature of 8° C. Intile Piankatank River the same situation was recorded, the maximum vernal crop having occurredat 8° C. in 1936 and at 13° C. in 1937.
The results of cOllnting the predominant forms in'phytoplankton samples collected from December1935 to, November 1936 at stations 20 and 17 inYork River are shown in tables 26 and 27. Thegenus Nitzschia exceeded any group of diatoms inthe river but was not the most abundant organismthroughout the year, for the summer months broughtthe genus Rhizosolmia to the maximum at station20, while Tlialassiothn:,' 'was most abundant duringthe -summer at station 17.' With the exception of

EFFECT OF PULP-MILL WASTES ON YORK RIVER OYSTERS 1°5TABLE 25.-P/ankI01l pigllllllt units per. /iter of waler itl 1M York and Piatlkatank Riflers.
[Stationa 20, 14, 15 are lorated in the lower part or the river; atations 5, 16, 17. and 9, in its upper part)
York River
Vate Stations in lower part Stationa in upper partPiankatank River
• 20 14 15 Mean 5 16 17 9 Mean 55 53 Mean---------------1--- --------------- ------------ --- ---
----.-W ----oil" ----i9:0-----38- -----55- ----46:5-----70- ----iio- ·----90:0·
10 10 10.0
-----io- -----io- ----io:o10 12 lUI5 10 7.5o - 18 9.0
10 16 13.05 5 5.0
10 14 12.0-----io- -----i5- ----in
32 20 26.0.10 15 12.518 25 21.5
14.534.351.5
103.8122.563.343.566.259.248.737.321.039.550.023.021.511.718.023.522.527.526.033.8
10302l6565452430521042102850371517202425352240
1542.
140200.1655055
1201007S654245705528102535
18502485
1305065657555
5276045o
18102225
-----35- -----i5~
32 2530 45
15152065
130-110
3050·1055
------5-2535o
25105
10'20152520
13.058.330.360.7SO.O
123.3104.798.310.016.032.05.0
12.52.5
16.012.034.723.315.043..125.028.315.7
·11552552
130200190751028
-----ifi1680201580455020
17303020
----ioo1002010103255
.5- 51012351550122510
1936Jan. 21-23 - 11feb. 19-20_________________________________ 90
~:~: ~tK::::::::::::::::::::~::::::::::: dgMar. 30-Apr. 1.____________________________ • 30~pr.t
j9ili
- ~~
~;i~ ~f~~~!~~::::::::::=:=:::::::::::~:=: 2?8J~~: t;:;'i9::::::::::::::::::::::::::::::::: ----_~~_
.i~rJf~{t~~~~~~~~~~~~~~~~~~~~~~~~~~~~~~~~ ~jA~u,t 26-31. ~ ~__________ 10
~:~~: ~~,;t:-i_::::::::::::::::::::::::::::: aOct. 20-22__________________________________ 15
~:;~~2~:::: :::::::::::::::::::::::-:::::: 1~Dec. 3-9_____ __ ___ __ __ __ ____ 10Dec. 14-23._ 17
1937Jan. 4-8 "_________________________ 10 15 160 61.7 40 60 4.~ 45 47.5', 20 25 22.5
~~b·.1t:.~~-_-:::::::::::::::::::::::::::::::~ ~~ ~b ~~ ~U ~~ ~~ ~~_.. ',_ H ~U }~ f<l ~UM ... 3-4___________________________________ 2U .10' 37 29.0 7 60 uv 20 44.2 40 45 42.5
~~~: }5::rpr~-C::::::::::::::::::::::::::: ~gg 2ig m m:~ ng --::20li" ----240- .----220- (H8:8' .1~ ml t~8:gApr. 23-27 100 10 100 70.0 90 90 90 90.0 20 20 20.0
Mean: . -41:2~~~~48.969.l~.so.u----u:4~I~
POINTAVERAGE PLANKTON
OF THEII: YORK a PIANKATANK.......~
70II:.....
60fit...i~
50
...Z...• 40•i:
30
5....~
Z 20C~..
HILL
IIII
GLOUCESTER PT.
'--r. ~
.....-.~STATIONS
FIGURE 25.-Average plankton content of the York and Piankatan~ Riyers in 1936 and 1937.736873--47----4 .

FISHERY BULLETIN OF THE FISH AND WiLDLIFE SERVICE
. PIANKATANK RIVER
WATER TEMPERATURE.STATION 53
,
I . 3.
1937
- YORK RIVERWATER TEMPERATURE
STATION· 20
YORK RIVER, PLANKTON-STATION 17
--ITATION 20,
PIANKATANK' RIVER,PLANKTON
-STATION 53
-- STATION '5
io6
50
20....II!:ll '0a
0....!:200oJ
'150.'10..i.. '"0
icoE 10
zl!I 40:l....a
50c..!!.. -..u 10
::I· 10::a
00:
l!! 24:;
: 100......i '"0:>
..:I '20....
'F;
I
! '"..c~
FIGURt: 26.-Seasonal changes 'in plankton content in York and Piankatank Rivers in 1936 and 1937.Pigment-unit method.
ThallUsiotllr/x and RhJzoso!;/!-ili the diatoms listed inthe'tables are frequently fou.nd in the stomachs ofthe oysters and apparently. constitute their normaldiet.,
The low <;ounts of dinpflagellates may be due in'part to the fact that these organisms disintegratevery rapidly in preserved samples (Martin 1923).Th~ plant-pigment method, since it is based on the'fresh sample, undoubtedly include.s these organismsand in this respect is probably Inore reliable thanthe counting of individual forms. '
The differences in the number of organisnl.s perliter as determined by planktoil counts in the samples
from these two stations do not appea.r to be significant. .
Because the nutritive, value of ~arious planktonorganisms has not yet been determined and 'we doIlot know which of them are being utilized by theoyster, the quantitative plankton data gave us ilO
direct reply to the question whether there was anadequate supply of o)'ster food in: York Rive~. Itis, howey,er; reasonable to infer that since general ..productivity of river plankton was not impaired bypollution or other adverse factors, the supply.of foodneeded by the oysters was adequate;' Slightlyincreased plankton production in the, upper part of

EFFECT OF PULP MILL WASTES ON YORK RIVER OYSTERS
TABLE 26.-Number OJ plal/klon orgal/isms per liltr at slation 17 iI/ Iht York Ri~tr
GENERA OF DIATOMS
1°7
Date I· Ie. d'Nitzschia Skeleton~ma OS~:~ lS~ Rhizo&olenia Pleu rosigma Navicula Thalassiothrix
1935Dec. 6 __ • • _ 3.9lJ() 1.980 984
1936 .1.n. 7 • • • ._. •• __ • . 9,840 _.• . .. • ._. _
~:~: 19::::::::::::::::::::::::::::::::::::::::'::::::::::: ~~6:ggg. ------9.-840- -----39:000- _. ~~~~ .. _~~~~~. ----'i9'-800- ~:::::::::::
~~ar:f:::::::: :::::::::::::::::::::::~ ::::::::::::::::::: m:~ :::::::::::: iHgg :::::::::::: :::::::::::: ::~:: ~~=~: _. __._~~~.~~,m~ :~':-~:::::::::'::::::::::::::::::::::~:::::::::::=::::: ----~~:-:- :::::::::::: :~~~~_ :::::::::::: ~~~~~~~~~: f~:! :~~~~J~l;' h::::::::::::::::::::::::::~::::::::::::::::::::::::: ~~:ggg. :::::::::::: ~~:~ -:::::::::::: -----i9.-000- -----59.-000· ~~:ggg1 uly. L •• • • • .• __ __ __ _ __ 19,000 • • _. ._ __ _ 78,000
~~;. ~It::::::::::::::::::::::::::~:::::::::::::::::::::: 1~H~~ ~::::::::::~ -----~~:-:-. :::::::::::: -:--t~~:m- :::::~~':~~: ~~:!Oct. L .. • • • . .____ 71.000 _.__________ .15.000 __ ._. ._Oct. 2l._4 ~ ~ ~_. .____________ ]9.680 19.680 -:-_______ 19,680 53,000
Tvto!. • • ••. ~ ._. .___ 4,320,580 31,500 555,824 9,840 573,520 274,480 69.1,000
TABLE 27.-'NI£mber of pial/klan orgal/isms ptr Iii" at s(atiol/ 20 itl the York Rit·tr
GENERA OF DIATOMS
Date. Nitzschia Skelelonema
Coscinodiscus
Rhizosolenia
Pleuro- IN' I I Thalassi-sigma I aVICli :I othrix
Asterionena Fragilaria Dinoflag
ellates
1935Dec. 6 • _Dec. 23 , _ 7,900 37.0lJO
63, 000 . 5, 900I,%U2,900 ~~t ---"1:970' :::::::::: .. __ ~~~~~_ ----5.-900- ~::::::::: ::::::::::
1936Feb. 28________________________________ ,4-10.000 .__ 29,000 .. . • . . .______ 19,700 _Mar.4. ._______________________ .443,000 78,500 .______ 29,000 __ ._. • .________ 29,000 __ . . _Mar..10. • . . 1.180.UUO . __ ._. _._. • .___ 118.000 26l.Uoo : __ . _
265.000 __ • .• • • .. _648.000 ._.__ __. • • ._. __ • .. •. • _
------._-- -.~----- ..__ ~ ••• • • • a a _
'1"'101... • .____________ 3,264,588 IV, 368 109,564 -4-95-,-30-4-1--I--I,-6-38-j 40,968 BO,460 298.900 19,700 -\i8.2tiO
the river was very likely due to the fertilizing effectof pollutants which contain considerable amounts ofcarbohydrates and other organic compounds. Laboratory experiments with Nilzsch i" culture describedbelow show that reproduction of .this diatomis stimulated by low concentrations of pulp-milleffluent and therefore confirm this conclusion.
EFFECT OF PULP MILL EFFLUENTS ON GROWTH. OF NITZSCHIA CULTURE
The effect of pulp-ni"ilI effluents on ~he propagationof diatoms was studied in the laboratory with the useof a nlarine species, Nitzschia closteri1t1ll, commonlyfound in estuaries and kn9wn to he used by the oy.steras food. A vigorous culture of a single species has
been ~ainta'ined in the laboratory for several yearswithout showing any signs of degeneration. Theculture was kept in round lSO-milliliter pyrex flaskswith Miquel solution containing a small amount ofsterile soil extract. The flasks were placed in a glasscabinet provided with a temperature control capableof keeping the temp~rature between 15° a.nd 170 C.Each side of the cabillet 'was uniforhlly and contimiously illuminated by nine 2S-watt Mazda lampsmounted on two adjustable.stands and: provided with·reflectors: Details of t.he arrangement have beenfully described by Galtsoff (1937: 34-35) and neednot. be repeated here. 'The densities of Nitzschiapopulation in different flasks. were determined bymeans of a Weston photoelectric cell and a sensitivemicroammeter. In order to convert the readings of

FISHERY BULLETIN OF THE FISH AND WILDLIFE SERVICE
FIGURE 27.-G~owthof Nitzschia culture in Miquel solution containing sterile and raw pulp-mill ~ffluent in the concentrationof 1: 1,000. Experiment A (solid circles), sterile effluent;experiment B (open circles), raw effiuent. Temperature
. 15°-17° C.
perished. Because of this difficulty, it was' imprac- .tical to continue the tests with raw effluent for morethan 28 days. .
Analyses of experimental. records clearly show thatthe' addition of effluents in concentrations not exceeding 1: 1,000 has no adverse effect on the growthof Nitzschia culture. As shown by figure 27, experiment A, the growth'in the control culture and iii themedium containing sterile effluent is almost identical.The difference is; however,' apparent 'when raweffluent is added in the same concentration (fig. 27,'experiment B). Stimulating effeCt of the effluent
, also' is shown by a more rapid propag~tion. ofNitzschia, the difference between the test flasks andtheir controls becoming' more pronounced as thepopulation densities increase.
Table 28 gives. a summary of all the tests withst~rile (series A) and raw effluent (series B) addedin concentrations of 1: 1,000, 1: 10,000, and 1: 100,000. With the exception of one test, B7 (concentration 1: 10,000), the final densities of Nitzschiacultures grown in flasks" with raw effluent weregreater than in the'controIs. This.difference wasnot observed when sterile effluent was used.. Raw effluent added in concentrations of 1: 100inhibits the growth' of Nitzschia, as can be dearlyseen from table 29, which summarizes these tests.
.. 40
.-. EX PER. A • "1000 ...._-. CONTROL FOR A0--0 EXPER. B a 1'10000---0 CONTROL FOR.
15 20 25DAYS·
'0
. 1400...:E
20
11:'...lL
'"... '000......U...o 800
'"az:: 100~
oz:too: 400
'000
the instrument into the number of cells per' milliliter, a calibratiort table and a curve were preparedby counting the number of Nitzschia in various dilutions of stock culture and plotting the results againstthe readings of the instrument. Intermediate valueswere obtained through interpolation. Using thistechnique, which has been. already described, inprevious publications (Galtsoff ct al 1935), a seriesof experiments were cairied out with the effluentarising from the pulping process (sewers. ] and H)added to Miquel solutions in concentrations of1: 1000, 1: 10,000. and 1: 100,000. In each experim'ent an equal number of flasks, varying from 2 to 6were used for the control and for the test. Everyday the content of each flask was stirred to avoidsettling of the Nitzschia on the bottom and. theposition of the test flask al).d its control was interchanged to equalize the possible differences in theintensity of illumination. The initial density ofNitzschia culture varied between 5,000 and 7,000cells per milliliter hut was always identical in th~test flask and its control.
In a first series of experiments, the sample of pulpmill effluent was sterilized for 15 minutes at 15 poundspressure. In.a second series of tests, raw effluent,stored in the refrigerator, was used.
The growth of Nitzschia culture in Miquel solutioncontinues at a definite rate until a maximum population density is reached. After that the slope of thecurve gradually flattens and the density of the culture remains more or less con!ltant for many days,or begi,ns to declin'e probably due to exhaustion offood material and accumulation of metabolites. Intesting the effect of pulp-mill effluent, the cultureswere usually maintained as long as it was pr~ctical,
and. readings were made ·at regular intervals. Someof .the tests lasted as long as 77 days. During theseprolonged tests, the population of Nitzschia, afterreaching its maximum of about 1,900,000 cells permilliliter, remained constant for at least 2 .weeks.It has been noticed that, in several instances, the.longevity ~f cultures kept in the media containingraw pulp-mill effluent was shorter than in the controls or in the flasks with sterile effluent. Thedegeneration of the cultures was always associatedwith a sudden increase in bacterial growth, flocculation of Nitzschia cells, and their rapid settling on tliebottom. "In 'several cases the cultures to which· raweffluent was added became badly ~ontaminatedwithlarge and fast-moving Spirillac and all Nitzschia

EFFECT OF PULP-MILL WASTES ON YORK RIVER OYSTERS
IThe ('(:.ncentratk,n used was 1: 100 and the period (If growth was 20 da:r$J
------------------------- ---:----
CONDITION OF THE OYSTERS OFTHE YORK AND PIANKATANKRIVERS'
SHELLS OF TH~ YORK RIVER OYSTERS
The majority of oysters from the upper part of theYork River had thin, fragile shells. I~l various degrees of inten~ity this condition prevailed among theoysters growll above .Claybank, and was especiallypronounced in the speci;nens taken at stations 9 (at
I
Goff Point), 22 (Put'tan Bay), and 23 (betweenAllmondsville. and Claybank). Similar conditionswere observed in the oysters brought by J. K Scanlonand other oyster growers to the shellfish labor~tory
in Washington in the spring of 1934, before the initiation -of the present investigation.
Adult York River oysters varied from 3% to 4%inches in length and from 1% to 3}~ inch~s in width.Long and narrow oysters were more abundant in theupper part of the river, whereas wide and rounded~pecimens predominated in its lower part (fig. 29).
The condition of the oyste'rs in the York Riverwas care.fully followed throughout the time of investigation. There wer.e, of course, fluctuations .in
. the condition of all the oysters at the differentseasons of the year and in different years. Determinations of the glycogen content and of the percentage of water in the meat confirmed .the generalimpression, gained by inspection, that, regardless ofthe season, the oysters of the York River above'Claybank were poor, while those below it and in thePiankatank River were generally good. The oysters
. on the right shore of the York River were usually inbetter condition than' those on the' left shore, andi"n some resp~cts the oysters in the vicinity of BellRock and above were a little bett~r than those justbelow. The poorest oysters were found on thegrounds from just below Bell Rock Lighthouse to apoint just above Claybank Wharf, and particul~rly
on' grounds off Poropotank and Purtan Bays.The meats of the poor oysters were found to be
watery and emaciated, with brownish or greenishdiscoloration of the mantle, gills, and labial palps.The shells of ~hese oysters were very thin and fragileand often 'contained mud' vesicles. Aside from thepoor quality of the meat, the shell condition was a .factor that made the oysters of this area unmarketable, or marketed with great .difficulty. In manyinstances there was a failure of gonad development.
8?11.028
998l,lIU
998I,OU
1.7501.6101,7751,7751.9001,7-101.7401.8001,9001.755I; 800I•.1.l01,183
1.175~2~
1.II''llr,75(,8\1~5
1,225900"1,
I,02S1,025
775
Control
Control
425442435416404396
I•.1701.2751.6001,6001,3001,7551,755
953·1.9001,7501,7101.9001,6lU
1.7501.1511
I 1,2351,100t.1I751.0.151.07.1
955t.11SI, .IOUI, ~301.025
Raw·effiuent
Sterilee~uent
Thousauds or Nilt.rchiain I milliliter
Thousands of Nitzuld,4'i'.l 1 milliliter
Effluent
40406060776060777777777777
'I252514141422
"25'212116
Dars "fgrowth
1:1.0001:1,0001:1,0001:1,0001:1,000
1:10,000I: 10. 000I: 10. 0001:10.000
1:100.0001:100,000I:IOO.OOU1:100,000
1:1,0001:1.0001:1,000J :I,OllO1:I,OllOI :·I,UI)(l
1:10.000I: 10. 0001:1O.0UU
1:100.0001:100.0001:100,000
Concentration ofeffluent
Experiment
Bl. . • _B2_. •• •B.l __ • . . .-B4 • _•• _B5 . - __86 • _B7 _88 . , _B9 _BIO.•_:. • : ~ _B11 • _B 12 __ • ••c _
. Experiment No.
A1 • _A2 .- • ' •A3 •• ~
A4 .A5 ', _Ab _A7 • _A8 _A9 • _AIO. • _A 11 • __ •• _A12 • _AB. _
ExpC'rimellt No.
TABLE 29,-/llkibition of Nitzsdlia g'rowih in s/r~lIg cOllull/rationof raru pulp-IIIi'll eJiluetlt .
Thousands (If Ni/'ZSt'hiain 1 milliliter
TABLE 28.-DCIlsitics of Nitzsrhia rulturi'S at /he rlld of /(Sts illMiquel solution (roll/rol) alld ill Mrlous collcrll/ratiolls of pulpmill d!l'tellt
[T.oto AI to AB mad. with ot.ri1••ffluent; teots BI to B12. with row effluent,In all tests, figures given in the table represent the densities {If populationsbelor. ther began to dedine] .
Concentrations le'ss than 1: 100,000 have little or nostimulation as compared ·with. the controls.
The laboratory experiments demonstrate that low. concentrations of pulp-mill w~ste stimulate thegrowth of Nitzschia culture. They are in acco~d
with the field- observations, which disclosed greaterabundance of .phytoplankton in the upper YorkRiver, polluted with pulp-mill effiuents, than 'in itslower part where pollution is not n~ticeable. .
1. . -- --- -" . _2_. • • __ • _
• 3 • • __ • _4 • : ,5_. " • _6_. _

110 FISHERY ~ULLETIN OF THE FISH AND WILDLIFE SE~VICE
. -So thin were the shells ()f many spec'im~ns obtainedfrom the upper part of the 'york River ·tliat thevalves, when examined in a transmitted light, weretransparent. The shells of these oysters. were.sofragile that they crumbled under a slight pressure of.a finger. Cases of infestations by mudworms..(Polydora) and b.oring sponge ~v~re frequent. In
several instances, the shells of live oysters were almost completely destroyed by the bo~ing sponge.
.There were, however, many specimens that wereentirely free' from infestation, ·yet had extraordinarily'fragile and thin shells. This· abnormal condition of
/the shells suggested either a deficiency of calcium inthe sea· wa ter or some morbid sta te of the orgailism,which mig\1t; have resulted from a functional disturbance or an infectjonal disease interfering withthe calcium metabolism.
The first possibility ,vas explored by determiningthe amount of calcium in the sea water.. It was
latter vary from 0.02112 to 0.02266 (Th. G. Thompson and R. J. Robinsl;m 1932:119), the "best" value'according' to' Lyman and Fleming (1940) being0.02106. Since the calcium-chlorinity ratio in theYork River did not significantly differ from thevalues usually 'e~countered 'under normal ~onditions,further obseI:vations along this line were discontinued.
There was no evidence that defects in the calcification. of shells of York River' oysters could be'correlated with the disturbance of the calciumequilibrium in the' water; it is reasonable to suspectthat they were due to the functional failure "of the'lime-depositing organs.
Shape. Area; and Wei~ht of Shells
Field examinations of a large number of samplesfrom the upper part of the. river indicated that thepoorest oysters were' invariably those with long,
FIGURE 28.-Cross section of the left shell.of an oyster from the upper part of York River. The section is made at the level of ·themuscle scar; the cloacal side is on the left. ' Noti~e the large cavities' either empty or filled with, loose chalky deposit; magnified'3% times. .
considered possible that sulfates and lignin, foundin considerable quantities in the pulp-mill effluentdischarged at the 'head of the river, had a tendencyto precipitate calcium carbonates a'nd 'upset theionic equilibrium 'of sea water. If this were the case,.the analyses of samples of sea water Collected fromthe upper and lower parts of York River would haverevealt;d the relative degree of Ca depletion. Determinations made according to the method of MelocheaBC! Sette~q4ist '(1933) gave:the following re,sults:
CalciunJ Chlr),intMilli.~r""1! Milli,rdm.< Cd
Stau"."1 fur lit'" 1'er lita 7:716 (upper part) 102.1. 4,610 0.0221514 (lower p;lrt) ______________ 204. 0 S, 630 .02363
The difference in the concentration of Ca in thetwo sets of samples depends, of course, on the salin-'ity of water. hut the ratio of Ca:Cldoes not sho~ a
- significant difference between the upper and lowerparts of the' river.. 'The values of Ca: Cl· ratios,representing the averages of four samples, are slightlygreater than the Ca: Cl ratios calculated from thedata available for' v~rious parts of the. ocean..' The
narrow, and vcry thin shells (fig. 29). It ,,,,"as therefore of interest to compare' the areas and weights ofshells. of the oysters from the polluted area withthose from t.he lower part of the river and from theadjacent areas ,vhich are -free from poilu tion.
.Opviously, such a comparison should be made between oysters of the sam~e age that grow for' the samelength of time in the river. This, however, presented considerable .;lifficulty because of the changesin the oyster populations on various grounds causedby oyster-farming operations. During the time ofobservations, and in the preceding years, oystermenwere transplanting their stock from one ground toanother and occasionally were bringing in oystersfrom the outside. Fortunately, there were severa].areas .of aband~ned' bottoms which still containedfairly· large numbers' of oysters. By making' athorough inquiry, the authors wer<o able to avoid thebottoms that were recently planted and takesamples from the areas which contained only socalled native oysters. The latter term is used hereonly·for the sake of convenience and denotes oysters

EFFECT oy PULP-MILL WASTES ON YORK RIVER OYSTERS l"JT
-------._----:----- ------ ----- ---;--~...- ----
DitTeren<e_______________ . 0.2'; , __T,Jld!.____________ 107 __ c___________ .195.7%
TABLE 3J.-COIllPtVi.<OII of thf 1II,'OIlS of wfighrof shdl.< pa square. illeh of oy.<lt-rs of the upper l"ork River (B) alld ilu 10ft'er l"ork
Rif'CT (1lla the Pial/l"la.llk Riroer (.!)
TABLE.30.-COlllparisoll oj th.. 'I!lra;,.[ of .rltrftg.. (jreas 0.( shdls. ofoystt'r,r from tlu ltppfr }·ork RW"r (B), alld: the Iowa} ork Rillaalld th,' PiOllk"t,1IIk Rir.cr (.!) ..... -
Sum of~quares
S1JlIar~-iFjrh(S
48 ,7.>8±1.6S· 15').81659 7.6-l±1.28· 23.1.980
48.~9
4~ .(.()
4960
Number D('~ree~ "If IVIe-an weight Sum (IfZ'hC'lIs freC'd(\ll~ peri~~I~,lr~ s'luart's
Nl1ml~er of IDegrees ~f I .lVfean ··~'f sur·shells free-dam .. face areaGroup
Group
GramJUA3±0.50 ;594 ..169_IOAO±0.28 271.>17
Difference . .. __ --------~- -------'--- 3.031 _T,)td!.____________ 107 • .- 865.686
A ~' ·.. : __'B _
A_·, _B , ~ _. _
·The weight or" shell pet' square i1ic.h of area issignificantly higher in the oysters fr(;lm the unpolluted section' (group A). than i"n:. those' from thepolluted area of the York Riv~r (gr()up B), the me~ns
being 13.43 ±O.SO and 1O.40±0.78, respectiv.ely.The test of significance (table 31) gives the' valueof t=5.63 showing that the difference'fa'r exceeds theprobability of random sampling. .
From the analyses of areas and weights of shells',an inference can be made that, 'with respect to themean area of 'shells, the two groups of oysters do not,differ from each .other, although they can 1:>e easilydistinguished by their shape.. As to the weight of'shells, oysters from' the upper part of York Riverare unquestionably lighter than those from its lowerpart and from the Piankatank River. It is' naturalto suppose that the .difference ·is brought about· by aslower rate of calcium depositi"On in these oysters.Light weight of Clyster shells from the 'upper part ofthe York River is due to their thinness, and to thepresence of large cavities filled with loose chalkymaterial instea't of more· compact, and therefore
There appears to be no significant difference in theareas of shells in the two groups of oyst"ers, the meansfor groups A and B being 7.38 ± 1.68 :aiJ.d 7.64± 2.28,respectively.
The test of significal)ce and the~eces~ary statistics'given in table 30 show"that the "t" :value is 0.722 andthe difference between the two 'mea:ns"is: therefore,
-entirely within the probab.ility of randd'i1:i sampling.• a '.
\vhich remained in the York River not less than four. ,
years. Undoubtedly, some oysters grew from localset, but the major!ty were planted as seed from theJames River. On October 11 and 12, 1938,.samplesof these oysters were collected from eight stations inthe upper part of the York River above Claybank.Three weeks later, on October 31, samples wereobtai'ned at :five stations distributed in the lower partof the' York River, in its !llouth, and in' the Piankatank River. Oysters comprising the second groupwere taken from waters not affected by pulp-mill'pollution: and appeared to be in every respectnormal. Unfortunately, the exact age of these
. oysters could not be ascertained. Examination ofplanting records of local oystermen convinced us,however, that.oystet:s collected. from various s~ations
in the lower' part of the York River and vicillitywere at least 5 years old.. Oysters from the upper.part of the river, 'where planting operations ceasedlong ago, were probably not less than 6 or 7 years old.
. The purpose of our comparison was to. determinewhether there was a significant difference in theweight of the shells in oysters' from different stationswhich may have suggested th,!t th~ deposition ofcalcium carbonate and growth of shell was affectedby local conditions. Unfortunately, a number of
.specimens obtained at' variou~ stations had to berejected because their .shells were riddled by. theboring sponge and the determination of t~ei. weightwould have been ..misleading. This so reduced thenumber of oysters available for measurements thatno more than eight specimens could be accepte'd from'each station. The comparison has to' be made,therefore, only between the two larger groups ofshells, one. from the upper York River (group B) andone from the lower York and Piankatank Rivers(group A). After removing the encrusting organismsan:d dirt, the shells were dried at 600 C. for 24 hoursand 'both valves of each'oyster ~'Veigheci to the neare~tdecigram. The area' of the shell then was deter-
. mined by placing the left valve, which is usually the'largest, on a sheet of thin paper and obtaining its'contour and measuring the area with a planimeter:The results were expressed as ·total areas, in squareinches, and as a weight ~f both valves per squareinch of shell area. Fortunately, oysfers of t4is'section have rather flat shells without the pronoUl~ced
ridges which sometimes are conspicuous in the shellsfrom other sections. of the c9ast. Consequently, ithas been assumed that an error due to the unevemiessof the shell surface was insignificant.
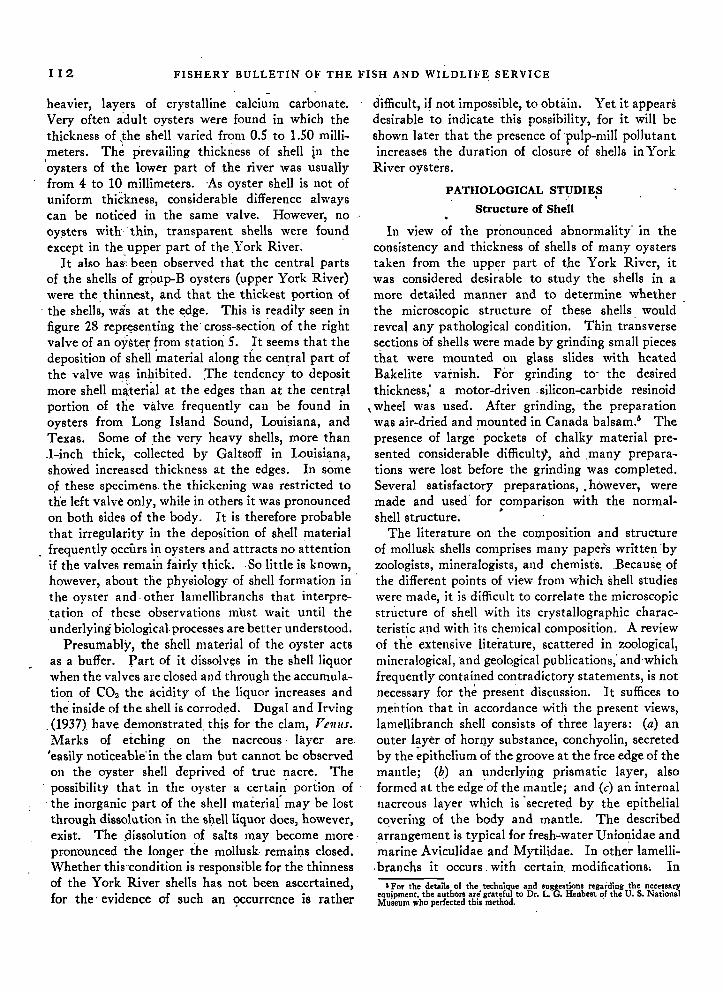
I 12 FISHERY BULLETIN OF THE FISH AND WILDLIFE SERVICE
-heavier, layers of crystalline calcium carbonate.Very often a'dult oysters were found in which thethickness of Jhe shell varied from 0.5 to 1.50 millimeters. The prevailing thickness of shell in the'oysters of the lower part of the river was usuallyfrom 4 to 10 millimeters. As oyster shell is not ofuniform thickness, considerable difference alwayscan be notiCed in the same valve. However, no0Y!ilters with thin, transparent shells were foundexcept in the upper part of the .York River: .
It also ha~;: been observed that the central partsof the shells of grpup-B oysters (upper York River)were the. thinnest, and that the thickest portion of
. the shells, was at the edge. This is readily seen infigure 28 repJ:'~senting the' cross-section of the rightvalve of an oy$ter from station 5. It seems that thedeposition of shell 'material along the cen~ral part ofthe valve wa\! inhibited. The tendency to depositmore shell m~terial at the edges than at the centr!!lportion of the valve frequently can be found inoysters from Long Island Sound, Louisiana, andTexas. Some of the very heavy shells, more than.I-inch thick, collected by Galtsoff in Louisiana,showed increased thickness at the edges. In someo,f these specimens the thickening was restricted tothe left valve only, while in others it was pronouncedon both sides of the body. It is therefore probablethat irregularity in the deposition of shell materialfrequently occurs in oysters and attracts no attentionif the valves remai~ fairly thick. ·So little is known,however, about the physiology of shell formation inthe oyster and. other lamellibranchs that interpretation of these observations m'u5t wait until theunderlying biological-processes are better understood.
Presumably, the shell material of the oyster actsas a buffer. Part of it dissolves in the shell liquorwhen the valves are closed and through the accumulation of CO2 the acidity of the liquor increases andthe inside of the shell is corroded. Dugal and Irving
. (1937) have demonstrated this for the clam, remls.Marks of etching on the nacreous· layer are·'easily noticeable'in the clam but cannot be observedon the oyster shell deprived of true nacre. Thepossibility that in the oyster a certain' portion of
. the inorganic part of the shell material" may be lostthrough dissolution in the sl:J.ellliquor does, however,exist. The .dissolution of salts may become more·prorrounced the longer the mollusk remaiJ;ls closed.Whether thiHondition is responsible for the thinnessof the York River shells has not been ascertained,for the' evidence of such an occurrence is rather
difficult, if not impossible, to obtain. Yet it appearsdesirable 'to indicate this possibility, for it will beshown later that the presence of 'pulp-mill pollutantincreases the duration of closure of shells in York
River oysters.
PATHOLOGICAL STUDIES
Structure of Shell
In view of the pronounced abnormality" in theconsistency and thickness of shells of many oysterstaken from the upper part of the York River, itwas considered desirable to study the shells in amore detailed manner and to determine whetherthe microscopic structure of these shells. wouldreveal any pathological condition. Thin transversesections of shells were made by grinding small piecesthat were mounted on glass slides with heatedBakelite varnish. For grinding to- the desiredthickness; a motor-driven. silicon-carbide resinoid
\ wheel was used. After grinding, the preparationwas air-dried and mounted in Canada balsam.6 Thepresence of large pockets of chalky material presented considerable difficultj, and .many preparations were lost before the grinding was completed.Several satisfactory preparations,. however, weremade and used' for comparison with the normal-shell structure. •
The literature on the composition and structureof mollusk shells comprises many papers written 'byzoologists, mineralogists, and chemist's. .Becaus~ ofthe different points of view from which shell studieswere made, it is difficult to correlate the microscopicstnicture of shell with its crystallographic characteristic and with its chemical composition. A reviewof the extensive literature, scattered in zoological,mineralogical, 'and geolQgical publications,' and·whichfrequently contained contradictory statements, is notnecessary for the present discussion. It suffices tomention that in accordance with the present views,lamellibranch shell consists of three layers: (a) anouter l~yer of horny substance, conchyolin, secretedby the epithelium of the groove at the free edge of themantle; (b) an underlying prismatic layer, alsoformed at tile edge'of the mantle; and (c) an internalnacreous layer which is 'secreted by the epithelialcovering of the body and mantle. The describedarrangement is typical for fresh-water Unionidae andmarine Aviculidae and Mytilidae. In other lamelli
,branchs it occurs. with certain, modifications. InI For the details 01 the technique and suggeRtions regarding the neces.ary
equipment, the authors are' gratelul to Dr. L. G. Henhest of the U. S. NationalMuseum who perfected this method. .
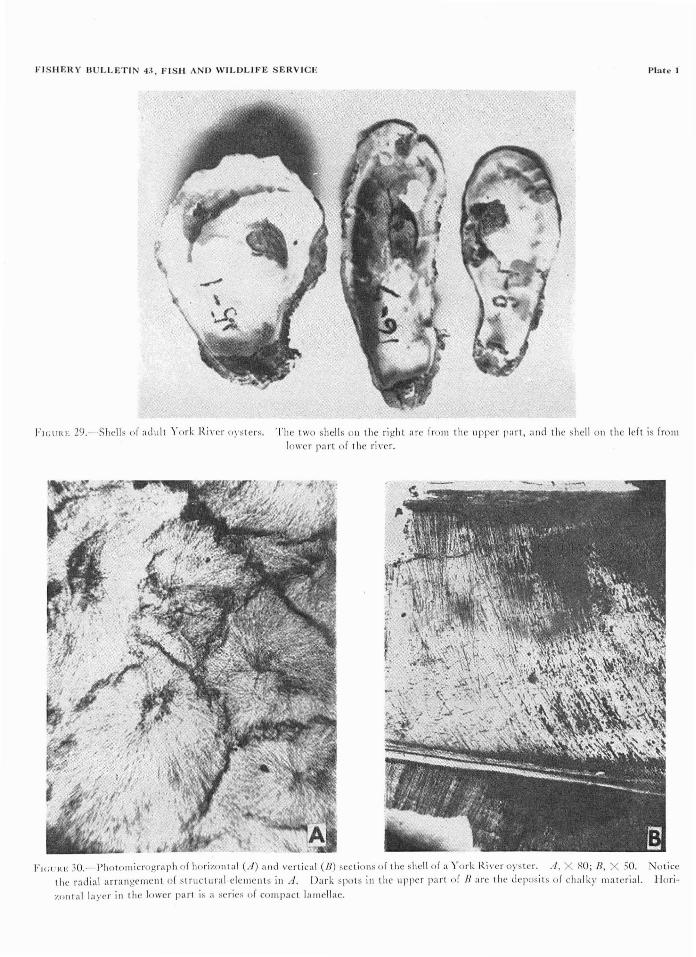
FISHERY nULLETI 4:\, FISH A D WILDLIFE SERVICE Plat" 1
FIGURE 29.-·Shells of adult York Ri\'cr n~'stcrs, The two shells all the right are from t.hc upper part, alld t.he shell all t.hc left is froIlllower part. of the ri\'cr.
1"1(;\11<1-: 30.-I>hoIOl1licrograph of horizontal (/1) all I vcrtical (8) sectinns of the shell of a York Ri"cr oyster. A. X 80; 13, X 50. Noticet.hc radial arrallgelnCIlL of stmcLural c1cmcllt.s ill A. I)ark spnts ill the upper part f If arc thc deposits of chalky material. l-Jori
"ollull laycr ill the lower p:trt is a series of compact 1'llIlcllac.

Plate l
FISHERY BULLETIN 43, I'ISI1 AND WILI)L1FE SERVIC,E
.. :,....' .....
FIGURE 31._Plwtomicrogra
ph ,A the adductor muscle fixed in relaxed state. lr.-,n haenlate,xylin-eosin. Vertical section.
slight\~. >wollen dark area>. .' 2:;0.
Note::
,".•":It + •
.;. ...t,po ~ +
·<tolt .... ••".+:I":/bo" A.. :~~~ ..
;; .~~.~ ;.:
{~;.::::.: t:-iE:=::F:~;,:+~ ~t;c": ~:~;·:Z';;;·:'ff;:::t:;:~; =:: ~; ',:: ;t ~: :::::;::::;,~) ;';;~;:',: ;:; '::: h~:' :;~! :.
~:~: ~:.~;r·: ~T~: ~ ;~::: ~ ~t" ... "t:i.¥ • ." .... ,,: • ...,.y;
*~~i~rM"'",.:"'ibo
~1l'bo , y~ •
• < ''1'
~.::""
~"n.-... ,...E.~
"fIGUIU, n._Photomicrograph of a cros> section of the nwntle infected with N<"I"!llop.<i.< >!'.:orc>; haematoxylin-co>in. ',' 11:;.
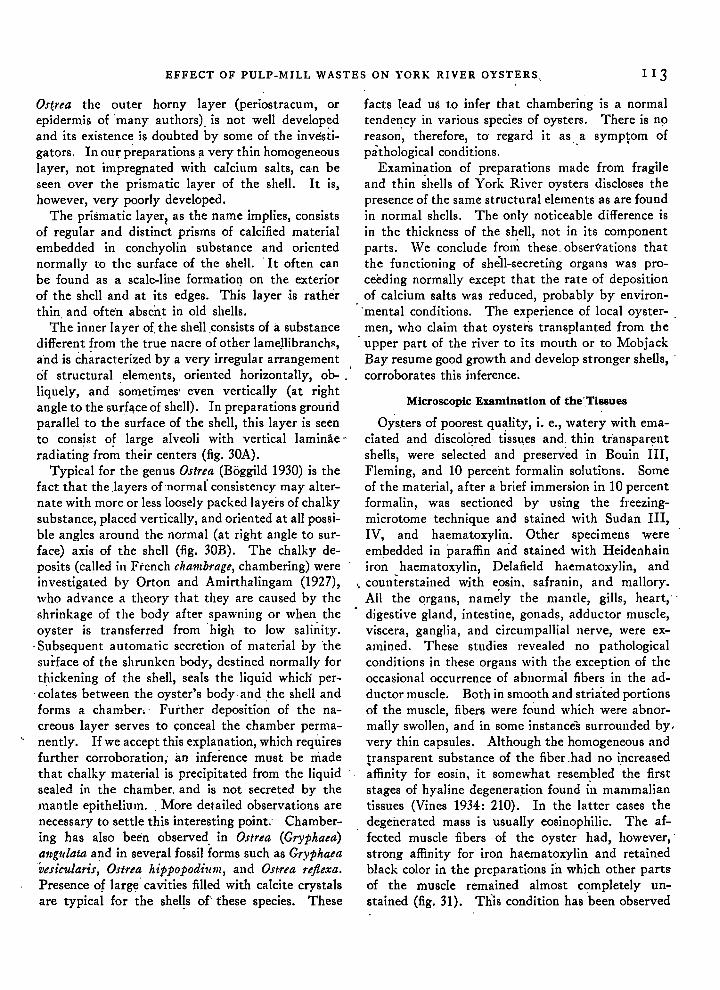
EFFECT OF PULP-MILL WASTES ON YORK RIVER OYSTERS" 113
Ostrea the outer horny layer (periostracum, orepidermis of 'many authors). is not well developedand its existence is doubted by some of the investigators. In our p~eparationsa very thin homogeneouslayer, not impregnated with calcium salts, ca-n beseen over the prismatic layer of the shell. It is,however, very poorly developed.
The prismatic layer, as the name implies, consistsof regular and distinct prisms of calcified materialembedded in conchyolin substance and orientednormally to the surface of the shell. 'It often canbe found as a scale-line formatio!). on the exteriorof the shell and at its edges. This layer ,is ratherthin and ofte'n absent in old shells.
The inner layer of. the shell ,consists of it substancedifferent from the true nacre of other lameJIibranchll,a'nd is ch~racterized by a very irregular arrangementof structural .elements, oriented horizontally, ob-.liquely, and sometimes' even vertically (at rightangle to the surf~ceof shell). In preparations grouridparallel to the surface of the shell, this layer is seento consist of large alveoli with vertical laminae"radiating fro~ their centers (fig. 30A).
Typical for the genus Ostrea (Boggild 1930) is thefact that the .layers of 'normal consistency may alternate with more or less loosely packed layers of chalkysubstance, placed vertically, and oriented at all possible angles around the normal (at right angle to surface) axis of the shell (fig. 30B). The chalky deposits (called in French chambrage, chambering) wereinvestigated by Orton and Amirthalingam (1927),who advance a theory that they are caused by theIlhrinkage of the body after spawning or when theoyster is transferred from 'high to low salinity.
.. Subsequent automatic secretion of material by thesurface of the shrunken body, destined normally forthickening of the shell, seals the liquid whicli per
'colates between the oyster's body, and the shell andforms a chamber.' Further deposition of the nacreous layer serves to <;:onceal the chamber permanently. If we accept this explanation, which requiresfurther corroboration, an inference must be madethat chalky material is precipitated from the liquidsealed in the chamber. and is not secreted by themantle epithelium. ,More detailed observations arenecessary to settle this interesting point; Chambering has also been observed, in Ostrea (Gryphaea)a1~glllata and in several fossil forms such as Gryphaeavesicularis, Ostrea hippopodilllll, and Ostrea reflexa.Presence of large' cavities filled with calcite crystalsare typical for the shel!s of these species. These
facts lead us to infer that chambering is a normaltendency in various species of oysters. There is noreason', therefore, to regard it as a symptom of'. ,pathological conditions.
Examination of preparations made from fragileand thin ~hells of York River oysters discloses thepresence of the same structural elements as are foundin normal shells. The only noticeable difference isin the thickness of the shell, not in its componentparts. We conclude fTOn~ these, observations thatthe functioning of shell-secreting organs was procd:ding normally except that the rate of depositionof calcium salts was reduced, probably by environ'mental conditions. The experience of local oyster- ,men, who claim that oysters transplanted from theupper part of the river to its mouth or to MobjackBay resume good growth and develop stronger shells, 'corroborates this inference.
Microscopic Examination of the'Tissues
Oysters of poorest quality, i. e., watery with emaciated and discolqred tiss~es and, thin tr'ansparentshells, were selected and preserved in Bouin III,Fleming, and 10 percent formalin solutions. Someof the material, after a brief immersion in 10 percentformalin, was sectioned by using the freezingmicrotome technique and stained with Sudan III,IV, and haematoxylin. Other specimens wereembedded in paraffin and stained with Heidenhainiron haematoxylin, Delafield haematoxylin, and
'. counterstained with eosin, safranin, and mallory.All the qrgans, nam~ly the mantle, gills, heart;·digestive gland, intestine, gonads, adductor muscle,viscera, ganglia, and circulllpallial nerve, were examined. These studies revealed no pathologicalconditions in these organs with the exception of theoccasional occurrence of abnormal fibers in the adductor muscle. Both in smooth and stria'ted portionsof the muscle, fibers were fo'und which were abnormally swollen, and in some instances surrounded by,very thin capsules. Although the homogeneous andvansparent substance of the fiber .had no increasedaffinity fol' eosin, it somewhat resem,bled the firststages of hyaline degenera~ion found in mammaliantissues (Vines 1934: 210). In the latter cases thedegenerated mass is usually eosinophilic. The affected muscle fibers of the oyster had, however,'strong affinity for iron haematoxylin and retainedblack color in the preparations in which other parts'of the muscle remained almost completely unstained (fig. 31). This condition has been observed

114 FISHERY· BULLETIN OF THE FISH AND WILDLIFE SERVICE
by Prytherch (1940) in the ml.!scles of oysters infected by Nnnatopsis. In our preparations,..abnormal m)Jscle fibers ·werc found both in the infectedand non-infected specimens. Muscular degeneration in weak, European oysters (so-called ','hockley"oysters) was described by Orton (1924), who found.microscopic spindle-shaped bodies throughout thetissues remote f~om the adductor muscle. His experiments with' healthy oysters, 'the shells of whichwere bored and the adductor muscles pierced,showed that the spindles could be produced artificially. He "thinks that these spindles may arisefrom the degenerat.ion of the muscles of the inantle.No spindles answering Orton's description were'found in the York River oysters. The' abnormalfibers of York River oysters were much longer andwider than those described by Orton and were foundonly in the adductor muscle. So .little is knownabout the' muscular degeneratiOli in mollusks, andin lamellibranchs in particular, that no interpretation of the observed conditi';)l1 is at present possible.
Careful examination of other ti~sues, i. e., mantle,gills, labial palps, digestive gland, nervous ganglia,intestines, heart, and excretory organs, 'revealed nopathological or degenerative conditions. ,The connective tissue of the body wall and mantle containedlarge numbers of pigment granules insoluble in
. alcohol and xylol, but similar granules; although insmaller number, occur in other oysters. . In thepreparations fixed with osmic acid, large blackglobules were abundant in' the mantle and in the. .body wall, occupying almost the entire space insidethe vesicular cells. Sections of fresh material, madewith the freezing microtome an:d stained with SudanIII and IV, proved without any doubt the fattynature of the globules. No traces of these globulescould be found in the prepara~ion treated with ethylalcohol or other fat solvents. Similar globules werefound in healthy oysters from Onset, Mass., Milford,"Conn:, and Beaufort, S. C. Apparently infiltrationof. connective tissue ,,~ith fat is a normal phenomenonnot noticeable in the preparation dehydrated witl}alcohol.
Infection with Nematopsis Spores
In the course of the histological examination, itwas noticed that many specimens were infected withspores 'of a gregarine Nelllatopsis. This microorganism was first described by European protozoologists (Schneider, 1892, Leger and Duboscq,.1903, 1913; and Hatt, 1931) who found it in various
lamellibranchs, such as Cardium, .Mytilus, Ano'mia,T~pes, Solen., and Ostrea. In the United Statesthe spores of Nematops·is were first report~d in 1930by Prytherch (1940) in the oysters of Mobjack Bay,Va" and later recorded by him from North Carolinaand Louisiana. The life cycle of this 'protozoan wasdescribed by Kudo (1939) and Prytherch (1940).Since the initiation of the York River investigations,the distribu.ti(Jn of N e·matopsis in the lower Chesapeake Bay and adj"acent waters was studied byGaltsoff and Engle, who were able to extend theirobservations to other coastal States including Connecticut, New York, Delaware, Alabama, and Texas.In 1941 Galtsoff (unpublished report, Fish andWildlife Service) found that Texas oyster~ froniAransas Pass, Mesquite Bay, Karankawa Reef,Lap Reef, Jordan's Pass, and Borup Reef wereheavily infected with Nematopsis spores. In someinstances, oyster tissues contained countless numbersof cysts, especially in the mantle, gills, and in theheart. There was no unusual mortality among theinfected oysters and' the appearance of their bodiesvaried from fair to good. Only in cases of extremelyheavy infection were oyster meats' poor. In 1941the Louisiana Department of Conservation (unpublished data: collec;ted b'y G~wariloch and Kavanaugh) reported that Nt'matopsis was present onnearly all oyster grounds within the State's waters,in many instances, infecting all the oysters on thereef. The State investigators were unable to findany correlation between the intensity of Nematopsisinfection and the mortality which occurred at thattimt: on some of the grounds.
Oysters heav:ily infected by Nem.atopsJs were collected in 1943 by Engle (1945) in Mobile Bay in the,area of Dauphin Island (Mississippi Sound). Theinfection was so heavy that the gills of the specimenexamined by Galtsoff appeared to be full of cystswhich could be easily washed off by shaking thetissues in water. Although these oysters were inpoor condition, they:were not dying, and )10 reportswere received later of any notiCeable mortalityamong them.
In 1942-43 Galtsoff found that oysters on publicseed-grounds and on planted bottoms in the DelawareBay were infected with Nt11~atopsis cysts. Sinceit was known that during the preceding year some oft.he infested seed oysters were shipped to Connecticutand New York for planting in Great South Bayand in Long Island Sound, attempts were made to
,locate them. Some of the oysters grown from this

'EFFECT OF PULP MILL WASTES.ON YORK RIVER OYSTERS
TABLE '32.-Fr~qutllcy ~j oc~~rrfllct of Nematopsis itl variousorgalls of J14 lIlffCled o)'slers fr01ll York Rirler
~pproxi-
Station mate Percent-
No. distance Date Condition . age Intensity offrom West infected infection
Point
-------llliliJ 1936
9 2.0 july 31 Poor_ .. ____ .. __ .. 88 Heavy.8 4.S AIlR. 17 Very poor_____ ~ ___ S6 Medium.
17 5.S june 19 Poor.. ___________ 71 Light.16 6.5 Aug. 5 .... _do ___________ 16 Do.6 8.S Nov. 10 Very poor.._... ___ 12 Do.
22 10.5 july 16 Poor_. ___________ 96 Do.22 10.5 Nov. 24 _____do__ • _____ .;_ 56 Do•
221937
10.5 jllly 6 ____ .J". ______.__ .. lao Heavy.
15 I1936
16.5 Aug. 27 Good.• ________ • __ 87 Medium.14 23.0 july 27 ____ .do___________
48 Light.20 29.0 JUlie 2
_____do__________ •0
which the' number of cysts was always' small. Th~gills ,:~re found to 'be ~nlected only in 10:5 percent ofparasitized oysters. This low percentage is rathersurprising, for one may have expected that ·theorgans engaged in the pumping of water in which thegymnospores of Ne1llatopjl:S are suspended wouldhave a greater opportunity to be invaded by themicro:..organism. .
The infec~ion with Nnllatppsis can naturally besusp~c~ed as o~e of tl~e 'possible causes of the poorcondition of ): ork RI\(er oysters. An attempJ toanswer this question was made by recording thecondition of oysters examined 'for the presence ofNelllatopsis spores. The results of the observationsare summarized in' ta~le 33, which shows the date ofcollection, the distance of the st~tion from West
. Point, condition of the oysters, percentage of infected:specimens in the sample; and intensity of i~f~ction.The ·Iatter is expressed in the following arbitrary'
. terms:. heavy-widespread infection, number ofcyst~ m the m.antle exceeding 1,000 per squarecentlmet.er; medIUm-cysts in two or three organs,number of cysts in -'mantle less than 1.,000 persquare centimeter; light-occasion~1 cysts in one or
. two organs.
TABLE 33.-Jllfecfioll of York Riv;r oyslfrs fllitll Neinatopsis120 oysters were examined at each stationJ
Number of
whi~h~~f~~~on Percentagewas fQund
(,(l.541.225.4.13.210.5oo
69472915
.15o
Illfected organs
~i~~!~\~mmm~mmm~~~~m----------- -- -------- ~ ~ - ------ ...---
~e.e~ 'were collected for examination and found lightlymfected. Planters report~d no unusual mortalityamong this stock which gre,,:_ and fattened in anormal way. . .
The range· of distribution·of Ne11latopsis, as shownby these observations, extends from Texas toDelaware Bay with occasional infection of oystetsin Great South Bay and Long Island Sound. So farNC11Iotopsis has not bee'n found in waters of RhodeIsland, M"ssachusetts,. New Hampshire, or on thePacific coast. .
Infection with this ·microorganism can natuJ"allybe suspecteq as one of the possible causes of the~athological condition of York River oysters. Ananswer to this question is given by the results of'asystematic examination of oysters collected atvarious sections of. the river. At each samplingstation, 20 oysters were obtained for microscopicexamination of their organs and tissues. Eachspecimen was dissected and preparations were madeof the mantle, gills, labial 'palps, heart, and bothparts of the adductor muscle. The highest infectionwas found to occur in the mantle.
Examination of 200 oysters collected at varioustimes during the year of 1936 at 10 different stationsbetween W~st point and Yorktown shows that '86specimens, or 43 percent of them, were not infected.In this examination the following technique wasused: a piece of tissue or organ, about 1 centimetersquare, was cut from the body and placed betweentwo slides which ,vere strongly pressed together andheld in that position with a pair of self-closed forceps.Very strong illumination and a magnification of 250\\'ere employed. By llsin.g a mechanica:I stage, theentire slide, representing 1 square centimeter of theoriginal section of the tissue, was examined and thetotal number of 'cysts found in it recorded. No
.counts were made when the number of cysts exceeded200 per field. In several cases of very heavy in-fecti.~n of the mantle, the number ofcysts per squarecentimeter was estimated to exceed 5,000. In ~therorgans it varied from 0 t~ 30. In order 0f thefrequency of infection, the. organs can be listed as .follows: mantle, adductor muscle, heart, labial palps,and gills.. No cysts were fo'und .in the digestive.gland, gonads, and' excretory organ. A summaryof these. examinations is given in table. 32. .
. In 29 percent of those with infection of the mantlethe number of cysts was very great, exceedi~ng 200per square centimeter. Next in the frequency ofinfection was the adductor muscle (41.2 percent), in

116 FISHERY BULLETIN OF THE· FISH AND WILDLIFE SERVICE
If the infection of oysters with Nematopsis is theprimary cause of their poor condition, one shouldexpect the poorest oysters to' be those the mostheavily infected. Observations, however, do notsupport this conclusion. The poorest oysters of theentire section, found at station 6 (table 33), showeda rather low percentage of infection, and those found'in fairly gopd condition (station 15) were more heavily infected. Furthermore, a decrease in the per-
, centage of infected oysters from 96 to 56, as observedat station 22, was not accompanied by any noticeableimprovement in their quality. Convincing evidencethat the primary source of trguble is not a parasiticinfection was the observation that the condition ofthe meats of the heavily infected oysters ·from stations 6 and 22 was not worse than the condition of. -
the meats of the noninfected specimens collected atthe same time from the same stations. This observation eliminates Ne11latopsis as ,a factor responsiblefor the poor quality of the. York' River' oysters andindicates that their pathological condition is due to some other cause. This inference is further corroborated by the fact that spores found in tissues are
. inactive, i. e., they do not propag~tewithin the bodyof the oyster.'. Microscopic examination of infected tissues (fig.32) reveals ,no inflammatory or other pathologicalprocesses in the infected organs. The mesenchymetissue of the mantle and the pallial nerve in the immediate vicinity of the encapsuled -cysts were normal. Likewise, no pathological conditions wereobserved. in the adductor muscle infected with cysts.As stated, abnormal muscle fibers were found bothin the in"fected and noriinfected muscles and therefore the condition could not be' attributed tQ thepresence of the parasite.. It would be reasonable toexpect some pathological reaction if the tissue weresuffering from the presence of spo1'"es. From themicroscopic study one may conclude that the en'capsuled spores do not affect the host organism,except possibly in extreme cases, such as encounteredby the authors in only two Alabama oysters, wherethe water tubes and passages of the gills'were cloggedwith millions of spores. Even in this case there wasno mortality among infected oysters.
METAL CONTENT OF THE YORK RIV~R OYSTERS
The presence of blue or greeni~h discoloration inthe tissues of oysters suggests the accumulation of ianexcess of copper. In order to determine this, anaiy-
ses were'made during' the summer of 1937 of copper,iron, manganese, and zinc ~ontent of oysters collected 'a~ station 22 in the upper part and station 1~ in thelower part of the York River. In preparing the samples for analyses; the following procedure was followed; one to two grams of -the dried sample were
.w~ighed into a silica, crucible, charred over' a lowflame, and then ashed in the muffle at a temperatureof 500° C. for 3 to 4 hours. The sample was cooled,and moistened with water. Then 1 milliliter Qf concentrated HNOa was adc;led, and the sample evaporated to dryness on the hot plate and returned to .the muffle for one hour at a temperature of 400°, C.Ashing was usually completed after one application.'of HNOa., The cooled ash was dissolved in IS, milliliters of 1: 1 HCl. Then 10 drops of 30 percent H 20 2
were added to the solution, which was then 'heateduntil the oxygen cea!led to be liberated. The samplewas' then transferred to a 100-milliliter volumetricflask and diluted to the mark. The water used insolutions and reagents was redistilled in pyrex containers and was frequently tested for copper and ironand found to be free'from traces of these metals .
Copper was determined as a ·thiocyanide-pyridinecompound using Biazzo ,method with modificationsdescribed by Elvehjem, and Lind?w, (1929) andElvehjem and Hart (1931). Kennedy's thiocyanatemethod (1927) was used for Fe determination. Manganese was determined by the periodate method ofWillard and Greathouse, modified by Richards(1930). All colorimetric determip.ations were madeby comparing the unknown with standards in aDuboscq colorimeter. Zinc was determined as potassium'zinc ferrocyanide using a Duboscq nephelometerfor turbic;limetric estimation (Birckner 1919).
The results of the analyses (table 34), expressedin milligrams of metal per kilogram of dry meat,show considerably higher ,cont~nt of all four metalsin the oysters of the upper part of the river than those'taker. from its lower section. The last three lines .ofthe cable are introduced for'comparison to show the
. , metal content of the three samples of oysters collected
TABLE 34.-Metal content of York Rifler alld Norfolk oysters in,/I illigra"!S per kilo, dry basis '
Source Date Iron Copper, Manga- Zincnese
Station 22- _______ July 23,1937 1.210 782 59.9 9,240Station 14 ________ _____do_______ 452 326 25.7 6, 120Near Norfolk ______ October 1931 _ 495 299 19,5 ------Do. __________ _____do_______
322 164.3 14.9 ------Do___________ _~. __do_______ I.MO 135.6 22.4 -- .. -.-
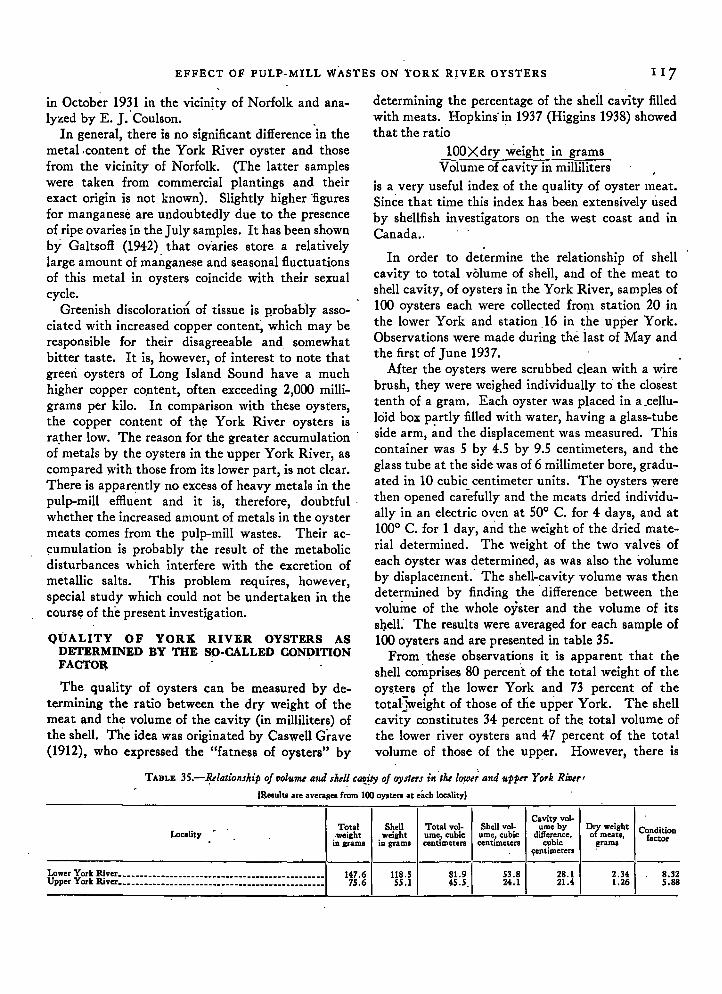
EFFECT OF PULP-MILL WASTES ON YORK RlVER OYSTERS I 17
in October 19~1 in the vicinity of Norfolk and analyzed by E. J. Coulson.
In general, there is no significant difference 'in themetal ,content of the York River oyster and thosefrom the vicinity of Norfolk. (The latter sampleswere taken from commercial plantings and theirexact origin is not known). Slightly higher 'figuresfor manganese are undoubtedly due to the presenceof ripe ovaries in the July samples. It has been shownby Galtsofl (1942) that ovaries store a relativelylarge amount of manganese and seasonal fluctuationsof this metal in oysters coincide with their sexualcycle.
Greenish discoloratio~ of tissue is p'robably associated with increased copper content~ which may beresponsible for their disagreeable and somewhatbitter taste. It is, however, of interest to note thatgreeri oysters of Long Island Sound have a muchhigher copper co.ntent, often exceeding 2,000 milligrams per kilo. In comparison with these oysters,the copper content of the:: York River oysters isra.ther low. The reason for the greater accumulationof metals by the oysters in the upper York River, ascompared with those from its lower part, is not clear.There is apparently no excess of heavy metals in thepulp-mill effluent and it is, therefore, doubtful,whether the increased amount of metals in the oystermeats comes from the pulp-mill wastes. Their ac~umulation is probably the result of the metabolicdisturbances which interfere with the excretion ofmetallic salts. This problem requires, however,special study which could not be undertaken in thecours~of the present investigation.
QUALITY OF YORK RIVER OYSTERS ASDETERMINED BY THE SO-CALLED CONDITIONFACTO~ .
The quality of oysters can be measured by determining the ratio between the dry weight of themeat and the volume of the cavity (in milliliters) ofthe shell. The idea was originated by Caswell Grave(1912), who expressed the "fatness of oysters" by
determining the percentage of the sheil cavity filledwith meats. Hopkins' in 1937 (Higgins 1938) showedthat the ratio
100Xdry weight in gramsVolume of cavity in milliliters
is a, very useful index of the quality of oyster meat.Since that time this index has been extensively usedby shellfish investigators on the west coast and inCanada..
In order to determine the relationship of shellcavity to total volume of shell, and of the meat toshell cavity, of oysters in the York River, samples of100 oysters each were collected from station 20 inthe lower York and station 16 in the upper York.Observations were made during the iast of May andthe first of June 1937.
After the oysters were scrubbed clean with a wirebrush, they were weighed individually to" the closesttenth of a gram. Each oyster was placed in a _celluloid box p~rtly filled with water, having a glass-tubeside arm, and the displacement was measured. Thiscontainer was 5 by 4.5 by 9.5 centimeters, and theglass tube at the side was of 6 millimeter bore, graduated in 10 cubic centimeter units. The oysters -yverethen opened carefully and the meats dried individually in an electric oven at 50° C. for 4 days, and at100° C. for 1 day, arid the weight of the dried material determined. The weight of the two valves ofeach oyster was determined, as was also the volumeby displacement.' The shell-cavity volume was thendetermined by finding the'difference between thevolume of the whole oyster and the volume of itssQell: The results were averaged for each sample of100 oysters and are presented in table 35.
From thes'e observations it is apparent that theshell comprises 80 percen't of the total weight of theoys,ters 9f the lower York and 73 percent of thetotal]weight of those of the upper York. The shellcavity constitutes 34 percent of th~ total volume ofthe lower river oysters and 47 percent of the totalvolume of those of the upper. However, there is
TABLE 3S.-~e[ationshipof flo[unle a'id shell ca'!..~ty of oysters in'the [or-oe; and upper York Rifler'
IResults are averaRes from 100 oyster. at each locality)
Total Shell Total vol- Shell vol-Cavity vol·
Localityume by Dr weight Condition.weight weight ume, cubic ume, cubic difference, a meats. factorin grams in grams centimeters centimeters cubic grams
~eDtimeters
b"wer tork River•••••••_._•••••••••_..... _-_ .. - ..--- ....._--- - ....------ 147.6 118.5 81.9 53.8 28.1 2.34 8.32pper ork River_. __ • ___ • __ • ___._._.___••__ • ___ • _______ • ________ 75.6 55.1 45.5 24.1 21.4 1.26 5.88

118 FISHERY BULLETIN OF THE FISH AND WILDLIFE SERVICE
29 percent more meat in the cavity of the oysters ofthe lowe'r York, if we compare the factors obtainedby dividing the dry weight by the volume of the'cavity, thus:
, L 'V k R' Dry weight of meatsower J.or Iver: . =0.08318 gm./cc.
Volume of cavity. Dry weight of meats
Upper York River: V If' . 0.05885 gm./cc.o ume 0 cavity
These data confirm the obst;rvations that ~he shellsof the upper York River oysters are thinner thanthe shells of those from the lower. part of the river.The shell cavity of the oyster of the upper YorkRiver is, however, greater than that in the oysterof the lower part, but the greater volume of shell
,space contains le~s meat because of the higher watercontent of the oysters in the upper part of the river.
GLYCOGEN CONTENT OF OYSTERS
The glycogen 'content of the oyster fairly expressesthe quality of its meat and furnishes a possibilityof e~aluating the condition of the oyster in definitequantitative terms. The purpose of the .observations described in this section was, first, to study theglycogen cycle in native oysters found at differentstations in the York and the Piankatank Rivers;second, to determine the effect of ttaqsplantation ofJ ames River oysters, known to be in good conditionand 'growing in areas of good environment, to theYork 'Rive'r; and third, to determine the effect ofthe removal of oysters from the badly affected areasof the upper York River and their- transplantation'to areas iiI the lower part of the York and thePiankatank Rivers, known'to be favorable to goodoyster production. It' was expected that· the' proposed studies, if carried on over a sufficiently longperiod, would provide definite answers to the following questions: Is the upper York River environment decidedly adverse to newly planted healthyoysters? Will removal from the upper part of theYork River to a better environment restore thenormal conditions of the affected oysters?
Cycle in the Oysters of the York and Piankatank Rivers
For a 'study of the glycogen cycle of the oysters'of the York Ri~e,r, a sample of 25 oysters was takeneach month from native beds at designated stations.These stations were selected as being more or lessevenly spaced up' and down the river and werelocated on 'both sides. From November 1935 toAprii 1937 samples were procured from stations.20?14, 5; and 9 in the York River and frorri stations 55and 53 in the Piankatank River. After July 1936,
samples from stations 23, 6, and 8 in the York River, were added.
After the oysters were brought to the laboratory,they were carefuily opened and the meats 'allowedto drain on a double thickness of paper toweling for15 minutes. The meats' were then passed twicethrough a, food grinder, and a sample of approximately 10 grams of the ground mea~s was taken andcarefully weighed in a covered dish. The glycogen
,content was then determined according to themethod of Pfliiger (1906), as describ.ed in detail inthe handbook of methods, Association of Agricultural Chemists (1935) and with the titration ofsugar' according to the method of Hagedorn andJensen (1923). Computation of the glycogen fro"mthe sugar titration was made by the usual conversionfactor of 0.9. Th~ results were expressed in percentage of glycogen of the sample on a wet-weight basis.
During the course of these studies the method ofglycogen determination in oysters was criticallystudied by Calderwood and Armstrong, who suggested several valuable modifications that ,greatlyexpedite the procedure and increase the accuracy ofthe results. The suggested modifications ared~scribed in a separate paper (Calderwood andArmstrong 1941).
In table 36 are shown the results of the analyses fornine stations in the York and the Piankatank Rivers.During the winter of 1936-37 it was impossible toobtain certaip. samples in January and Februarybecause of the extremely; cold weather and the factthat mu<;h of the upper parts of the rivers, were coveredwith ice. " '
The data for three stations in the York River wereselected for graphic presentation in figure 33.Station 20 represents the lower York Rive!;" station5 the middle York River, and station 9 the upperYork River. Seasonal fluctuations in the glycogencontent of the oysters of the Piankatank River atstations 53 and 55 are shown in figure 34:
It will be ~een that the curves for the York al~dPiankatank Rivers follow the same trend, differingonly quantitatively. The data show that throughoutthe year the oysters of the Piankatank Rivermain:tained a higher glycogen content than those ofthe York River. Curves in figure 33 show also thatthe glycogen content' of the York, River oystersdecreases from the mouth of the river toward itshead. The process is reversed in the Piankatank,where oysters from the upper part of the 'river arericher in glycogen ,than those from the lower part,

EFFECT OF PULP-MILL WASTES ON YORK RIVE~ OYSTERS
TABLE 36.-:-Glycogen cOlltent oj-oysters ill the York and the Pia,nkatank Ri~ers
[G10cogeo io perceolage is 00 a wet·weight basis)
York River Piankatank RiverDate
St.tion 20 Station 14 Station 23 Statioo 5 Station 6 Station 8 Station 9 Station 55 Station 53--------------1----------------·1-,--·--1----,- ----- -----'1--:--- 1----
5.05 4.644.92 6.25
4.70 6.033.65 4.445.59 \ 4.833.93 5.112.90 6.04I. 70 3.00
.67 1.691.31 1.542.25 2.822.72 4.134.06 5.21
3.013.58
2.59 2.12 1.47 1.88 '-""'5:94- ------'"5:442.84 2.17 1.98 1.762.67 1.60 1.11 1.73 2.40 3.832.35 ------------ 1.43 1.65. 2.84 2.97
2".21 1.69 1.12 1.63 3.35 4.24
3.30
2.522.10
1.492.88
2.853.744.612.79
3.66 _. . __ •• _.
3.56
4.954.88
Average•• _. _. •_. __ • _
1935November_~ • .:. .December • _'_ •• ._.
/036 . ,1.nu.ry._._•••• __ • __ ~ ,_, , __ ,, ._. ._. __ ._ •• _. • ,_,_,_" __ ,, _._. __ ••••• __ , __ , , _M.rch__ :_ •• • ._______ 2.67 2.84 _•••• _•• 2.22 • ._ •••• ._._. __ •• 1.48ApriL•••• _. ._______________ 2'.59 2.62 _._._._._.__ 2.78 _._ •• •• _. • ._ 1.52M.)" ._. __ ._' • •• 4:35 3.88 •••• 3.26 _._ •• •••• ._.__ 1.50].\IQe_. ._ •• :_____ 3.80 2.20 __ ._ •• _.____ 1.91 __ •• ._._•• ••• L79lul)" •• ._. .___________ 3.04 2.29 1.12 1.56 1.0.1 0.68 1.38A\I~ust---.----------------.-.---- 2.15 2.26 1.53 L15 1.83 .89 1.27September. • • .______ 2.40 1.49 .44 .67 L25 _•• ._.__ .41October __ •• ._________________ 2.91 2.58 1.48 1.43 .56 .73November_. ._•• 2.75 2.69 1.67 .________ 2.09 :61 1.12December. __ •__ • •• • - 3.95 2.77 1.02 1.45 '_" ' __ " •• __ •• _ 1.21
1937
t;~:£~~~=============::::=::::::: ------.f~-ApriL•• _. __ • __ •• -" c_ _ 5.28
6
• LOWER 'YORK (STATION 201
Cll MIDDLE YORK (STATION 5)
61 UPPER' YORK (STATION 9)
5
z...''''o~, 4oJ
'"..z
'w. ~ 3...
lL
2
J&'0 ,,•
o L-~II:--"'"'1:'=2--!--~2-,-3!:--!4--5:!-.-!6:---:!:7-.-':!--!9:--"'"":'=0--!1':-1-"'12:--.......--!:2---!:-3--!4'--'
1935 1936 1937
FICURE 33.-GI)'cogen content of York River oysters from the lower, middle, and upper" parts of the river. Glycogen in percentage is on a wet-weight basis.
although the difference is less pronounced than inthe York River.
A direct correlation between the -distance fromWest Point (upper part of the river) al1d the increasein glycogen content can be seen also in figure 35,
" which represents a 9-months' average (July 1936 toMarch 1937) of the glycogen content of oysters atvarious stations in the York and Piankatank Riv_ers.
Despite the fact that the average figures used inthis diagram tend to diminish the ,extent of verticalfluctuations of the curve, it is quite apparent thatoysters in the upper half of the river, above Clay-,bank, are decidedly lower in glycogen. Markedimprovement in oyster-quality occurs 'in the YorkRiver'at· stations 14 and 20 and in the PiankatankRiver.

120 FISHERY BULLETIN OF THE FISH AND WILDLIFE SERVICE
• LOWER PIANKATANK (STATION 55)
o UPPER PIANKATANK (STATION 53)
9,1"\
, ,, ,j \ 1", ,
\ II ,-, ,I 'I dI ,
\ '\ /I ,\ ,\ I
q\ p'\ '/
"."b__!/,'-'0
5
2
6
z...'"o0'
~4
'"..Z...,,30:...II.
o L_,LI
-...lIZ---...l.--...l.2--...l.3--.J4L.-l5-----I.6--...l.7--aL.--19L.-.l.IO--IJ.'--ILZ-...L-.l.2-----I.3--4.1-..1
1935 1936 1937
FIGURE H.-Glycogen content of oysters from 'the lower and the upper PiankatankRiver. Glycoge,n in percentage is on a wet-weight basis.
AVERAGE G!-YCOGEN CONTENT
OF .OYSTERS IN YORK AND
PIANKATANK RIVERS.
z...oo....-3...z...oar::~2
II
IIIII J
III
I
-ck-STATIONS
FIGURE 35.-Average glycogen content of the oysters at the various stations in the York and the Piankatank Rivers from July 1936 to March 1937, iuclusiv~. Glycogen in percentage is on a wet-weightbasis.

" EFFECT OF PULP-I\ULL WASTES ON YO:RK RIVER OYSTERS 121
Changes in the Glycogen Content of James River SeedOysters Transplanted to the York and PiankatankRivers
J ames River seed oysters \vere selected for transplanting experiments for their good quality" and"because "they are, generally used by the oyster growers in Virginia for planting on private bottoms." InDecember 1935 and January 1936 these oysters wereplanted at stations 20, 14, 15, 5, 16, "17, and'9 in theYark River and at stations 55 and 53 in the Piankatank River. At monthly intervals 10 oysters were"tonged from each station and analyzed for glycogencontent: Th~ results of these determinations forthe various stations are shown in table 37.
Differences in the trend of the glycogen cycles ofthese oysters became apparent only 6 months afterplanting. This is clearly evident in figure 36, representing the seasonal changes in glycogen content ofJames River seed oysters transplanted" to the' lowerYork River (station 20), to the upper York River(station 9), and to the upper Piankatan.k River(stati0I!- 53). The low glycogen content at the upperYork River station during the winter of 1936-37stands "in contrast to the high glycogen level attainedby oysters planted in the lm.ver part of the Yorkand Pialikatank Rivers.. A direct correlation between the increases in glycogen content of the planted Qysters in the York
. River" and the distarice from West Point is apparentin figure 37, which represents averages for 15 monthsat the different stations. The curve is almost identi-
cal with that: based on the analyses of native oysters"(fig. 35), with the difference that decided improvement in the condition of oysters becomes apparentat station 15, near Queens Cre·ek. The difference
. may be easily attributed 'to the different locationsof statiol).s used in the two sets of observations. Incontrast with the York, we again find the highestglycogen content at the upper station in the Piankatank River. " ; "
Glycoge~ Changes in Oysters Transplanted from theUpper York River to the Lower:York and the UpperPiankatank Rive-rs
Low glycogen values, as illustrated by a~alyses ofthe upper York River oysters, suggested a trans-
.planting e~periment to determine whether the' glycog~n content "would increase and reach a normallevel when the oysters are removed from the unfavorable environment. If. the poor' condition of theoysters in the upper part of the river is primarilythe result of their "weakened or diseased state, onewould expect them to remain poor for some timeafter transplanti~g. On the other hand, .markedimprovement in the meats upon transplanting theoysters to good waters would indicate that the causeof. their poor condition is the unhealthy environment.
In March 1936 oysters were tonged at station 22in Purtan Bay and transplanted downstream atstation ~O at the mouth of the· river, and at station53 :in the upper Piankatank River. Monthlysamples consisting of 10 oysters each were taken
TABLE 37.-Glycogell cOllfrnt of James River .rred oy.rfers Ira1/spl'l/lfed fo l1Ie }'ork a!,d II" Piankafad Rivers
IGI}"cogen in percenluge ilio on :1 wt't-weighl ba!'is]
York River Piankatallk RiverD,te
St.tion 20 St,tion 14 Station 15 Station 5 Station 16 Station 17 Station 9 St.tion 55 Station 53-------------------------·1----------------------------
1935December:- _ 12.70 12.70 12.70 ._. __ • _ 12.70 ._
1936JanU3I"r.· - - - _February • _. _March • • .ApriL _
t~;~:==: ==== ==========: === === :== =July __ •. - - -. - ----August • _September ~ _October_' • _Novemb.:r _
. Decembf'r _
2.242. ~7
". 2.212.30I. 981. 852.622.622.402.604.315.27
2.. 18 I 2..~3 12.33 I 2.3.1 12.60 12.602.88 2.99 -------j:~i- 2.85 -------i.-97"
-------i:7S- 2.96 3.392.07 1.71 2.74 1. 76 2.21 2.74 3.201. 70 2.66 2. 6~ 2.34, 2.28 2.41 2.80 3. 121. 63 2.18 ~.H I. 78 3.26 1. 97 2.76 3.321. 41 2.06 -------i.-i;.i- 2.H 3.26 1. 49 3.72 .l.382.6~ .I. ~9 .-10 .97 1. 51 I. 20 1. 792. l.l 1. 85 .89 1.06 .99 1.24 2.04- 2.192.36 2.02 . 8~ 1. 34 A6 .41 1.4-5 1. 432.64- 2.4-6 2.34 2.47 2.00 1.77 1. 88 ------;-nii2.83 3.90 -------i.-40- 1. 69 1. 92 I. 17 .l. 21 .2.2U ------------ 1.31 ~A5 1..86 2.60 5.93
4.42'"3.674.073.03
3.29
3.50 -------pii- 3.105.66 4-.244-.32 .85 3.864-.35 2.98 4-.76
3.16 2.58 2.97
1937Janll'r1' •• • 2.07 1.47 1.00 1.32 3.90Febru.rr.________________________ 2.78 2.50 ,1.92 2.4-3 _
March - - - --- - -. - - - - --- ----------- - --- - --~- '.":'4-1- ---. - ----1':" 2
8
-6
2
' -1- -- ----3-
1
,." 4
9
-4
5
-- -. -------11..-6
66
.5- - =======2=.=~-=:ApriL. . .". _-----11----1----1----"1------,--
Average _
I At time of transplanting.
736873-47--.5

122 FISHERY BULLETIN OF THE FISH AND WILDLIFE SERVICE
•• ~A.n R'VU TO UPPER
4
•..·o·'u....
• 5..•..UI<.... z
•o LOWER
PIANIATAN. RIVER
YORK RIVER
iI
I?.., ., ,, ., ,, .., ., ', ,, .., ,, b-----o ST. 20
ST. 55
4 •.1,. • • 10MONTHS
II '2 2 5.117
4
FIGURE 36.-Glycogen content of James River seed oysters' transplanted to"the upper Piankatank Riverand to the upper and lower sections of the York River. Glycogen in percentage is' on a wet-weightbasis.
AVERAGE GLYCOGEN CONTENTOF' TRANSPLANTED OYSTE·RS
CRICKET HILL
z...CDoo)...CD
~3z...oII:....11. 2
STATIONS
FIGlIk¥ 37.-Average glycogen content of James River seed oysters planted at various statiohs in theYork and Piank"atank Rivl:1'·s.. Glycogen in percentage is on a wet-weight hasis.

EFFECT OF PULP-MILL W!\STES ON Yo'RK RIVE-R OYSTERS
• PURTAN BAY OYSTERS
o TRANSPLANTED TO LOWER YORK RIVER
S. UPPER PIANKATANK RIVER
123 '
4
z
~so"..-'..
4
p,,,,, ,,, \ . /
I \ ,
I " I, t:S ',9 A" I '\" I"/ I
1\{' ,!If.. f.'-I: '\ I \ ff'd \ i \ i
f \( , \ If \i
" f\t
FIGURE 38,---':Glycogen content of Purtan Bay oysters transplanted to the lower York andthe upper Piankatal,lk Rivers. Glycogen percentage is on a wet-weight basis.
from all 3 localities for analysis. The results of theobservations extending from March 1936 to April1937 are shown in figure 38. Almost an immediateimprovement is noticeable in the condition of dieoysters after their removal from Purtan Bay. During the summer months the difference dis~ppear's,
only to become more pronounced in the following.fall and winter.
The results of the experiments show definitely tha~
the factors that retard glycogen formation in theYork' River oysters inflict no permanent injury tothe organism. The action is that of a general depressant \nhibiting the carbohydrate metabolism.Apparently there is no accumulation of toxic substances in the body and no ·irreparable injury isinflicted on the oysters kept in the upper York River,fo'r recovery after ,transplanting is very rapid., Theimprovement in the condition -of the' oyster is notrestricted to the increase in glycogen content; it isaccompanied by an increased. rate, of growth, thedeposition of shell material, and the disappearanceof both the greenish color and the strong or acridtaste of the meat. '
from the pra'ctical point of view, the results (If,the transplanting experiments point, to. the possibility of a partial solution of the oyster-culturalproblem in the upper York River.
WATER CONTENT OF T~E OYSTERS OF THEYORK AND THE PIANKATANK RIVERS AND OFTHE VARIOUS TRANSP!-:ANTED O,,"STERS
As samples of oyst~r ~le'ats were being preparedfor glycogen determination, a portion of t~e' groundmeats was dried and the percentage of water determined. As previously mentioned, the Ineat's,after removal from the shell, were allowed to drainfor 15 minutes on a double thickness of paper 1;Pweling and then passed tw'ice through a food chopper.Approximately 30 grams of" the ground meats wereplaced in a previously weighed container and thew~ight of the me~ts comp\lted. Then, they weredried in an ele'ctric oven at" 500 C. for 24 hours andat 100° C. for another 24 hours. The sample' wasallowed to cool in a desiccator and then reweighed.
The water content of the oysters of the York andthe Piankatank Rivers was' determine~ from the
,ground meats of 25 oysters taken each month fromnative' beds at designated ~tations. From November 1935 to April 1937. samples were obtained fromstations 20, 14, 5, and 9, in the York River andstations '55 and 53 in the Pian1<atank River. AfterJuly' 1936, stations 23, 6, and 8 in the, York Riverwere added. The results of these observations areprese'nted in table. 38.

124 FISHERY BULLETIN OF THE FISH AND WILDLIFE SERVICE
TABLE 38.--:-Percentage of fllater/11 oyster. meats frollf dijJcrent stationS" in the York and the Piankatank Riflers
York River Piankatank RiverDate
Station 20 Station 14 Station 23 Statio" 5 Station 6 Station.8 St.tio~ 9 Station 55 . Station 53-------------I---~-I----- ·1------1---- 1-----,,---1----·1--------------
1937Janu,lry_________ ....... _____"_______ . 88 ..1 83.2 84.3 91.2 9\.6 85'.5 83.. 6Febru.r)'______.___________________ 83.-1 83.0 8-1.\ 83.3 85.2 8-1.2 8.t.7March _. _____ , ___________________ 83.7 82.3 86.5 86.\ 87.8 87.0 ~6.9ApriL ___________ • _______________ 83.\ 86.2 88.7 85.7 86.5 88.5 86.8
A\'er:l~e____ ...... ___ ........ ____ .... 82.4 82.0 83.4 84.9 86.4 85.8 84,8
1936
lA~~h:~:::::::::::::::::::::::~: -------siT :::::::::::: :::::::::::: -------SO:,5" :::::::::::: :::::::::::: ::::::::::::ApriL____________________________ 84.\ 83.\ .---- 87.0 __ . 88.8M,y_____________________________ 82.2 82.2 8.1.\ ._______ 87:7 87.4June .______ 82.6 79.7 8\.7 .__ 79.0July .-·-------- 77.9 78.9 78.9 82.4 81.6 79.6 82.1.1Allgus'--_________________________ 79.9 79.0 8-1.8 ~5.\ 87.9 86.5 . M.O
b~~~b~~_e~:::::::::::::::::::::::: ~U ·~U ~n ~~~:. -------85:i- -------85:7" ~U
~~~:.~t::~::::::::::::::::::::::: ~U ;n ~~:~ -------s6:i- ~g ~U ~U
1935 .November .. __ .... .......... .. ._Decenlbc:r .... .. _....... ..
8\.6 • • •.__80.8 ._____ 8.1.8 82.5 82.0
8\.7 79.3
81.1 79.281.5 79.881.-1 82.98.1.3 80.982.8 79.383.3 82.086.2 82.286.4 8·1.781.0 82.881.2 77.-180.7 79.0
83.9 i9.\81.7 8.1.083.6 82.\84.\ 82.8
82.7 8\.1
It can readily be seen that the oysters of the upperYork River were more watery than those of thelower, the oysters i\i the low~r ayeraging about 82percent water and those of the upper about 86 percent.. It will be noticed that the oysters of theupperPiankatank had a slightly smaller water cont~pt than those of th~ lower river, but the upperPiankatank River (station· 53) oysters were verymuch less watery' than those of the upper York(stations 5; 6, 8, and 9).
These al"\alyses of water content of the oysters ofthe vario~s localities 'are in harmony with the general observ;ltions of oyster conditions at the various
places and with the "fatness" of the oysters as measured by their glycogen content. The areas ~aving
oysters of higher glycogen content also had oysterswith a smaBer water content.
The percentage of water found i.n the James Riveroysters transplanted to the various stations i~ theYork and the Piankatank Rivers is give\! in table 39.These analyses are based on samples of 10 oysterseach taken monthly from JanUliry 1936 to April 1937.- It will be seen that the water content of the oysters
varied in accordance with the location in'which theywere planted. T,he oysters planted at the variousstations in the York and the Piankatank Rivers be-
.' TABLE 39.-Percelllage of roater ill Jallles River sud oysters tra/ls"pla'lled to f.ariolls stations 'i,l the York a;/ld the Piankatank Rivers.. I. ."
York River Piankatank RiverDate .
Station 20 Station 14 Station \5 Station 5 SI,tion \6 Station \7 Station 9 Station 55 Station 53
, 1935.Decenlber ~ .. . .. _ 182.5 182.5 '82.5 • _ 182.5 ••_. __
.87.6 '187.2 -------88T '87.2 187.2 -------88:6- 187.4 187.483.9 86.9 86.5
---'---SS~7-84.6 84.5
8<1.5 83.3 86.4 88.4 88.7 85.3 85.78-1.8 85.9' 88.6 88.6 88.6 86.3 85.6 85.889.0 85.4 85.4 86.5 86.7 86.3· 85.3 83.883.2 81.5 8\.1 88.3 88.6 86.4 82.\ 86.678.7 80.3 78.'1 8-1.7 82.2 83.7 76.5 84.98\.5 78.4 84.6 86.1 8-1.2 83.2 84.9 82.98\.4 8\.2 86.6 85.7 85.4 86.5 86.4 85.\.83.5 84.2 80.4 83.0 83.6 84.2 87.7 8\.778.5 79.7 ------·s5T 84.9 85.2 82.2 80.2 79.681.3 80.\ 84.5 87.2 81.9 84.0 79.4
8\.7 82.7 90.9 85.3 86.7 91.2 84.2 8\.082.4 8-1.5 83.3 84.0 86.0 83.7 ------------ 83.88\.1 8\.8 85.3 86.\ 84.6 86.2 ------------ 83.284.3. 82.2 8-1.4 86.5 85.4 86.5 ------------ 82.8
83.0 82.5 85.0 85.9 86.0 85.7 83.9 83.~
85.088.\83.\90.785.092.673.080.779.18\.579.880.9
87.380.980.782.5
83.2
1931January • _
g~:~h~~::::::=:::::::::::::: ::~ .ApriL: _
1----1.. Average _
1936Januar)' _
r;~::h?:::::~:::::::::::::::::::~:~I----~~::: :::::::::::::::::::::::June ~ • ._
Jull' - - -------- -- _----- -------_. --AURust • _
3~~~b~~~e~~:==::::::::::::::: :::.::NlJvember _December _. _
. I At tim~ or transplanting. .

EFFECT OF PULP-M ILL WASTES ON YORK RIVER OYSTERS J25
IAt time of ;ransplanting.
TABLE 40.-Cha1lges ill foater collte1lt of oysters trallspla1lted from'statioll 22 ill the uppa York Rirler to the {o'U'er }'ork alld the IIpperPiallkata1lk Riflers
came similar in water con"tent to the oysters alreadythere. The oysters planted in the upper York Riverbecame much' mote watery than the oysters plantedelsewhere. It will be noticed that in the PiankatankRiver the oysters had nearly the same water contentas those in the lower York, and that the oystei's of thelower Piankatank were slightly more watery thanthose from the upper part.
In order to observe the. effect of transplanting pooroysters to areas known to produce good oysters, thefollowing expedment was carried oUJ. In March1936, oysters were tonged from station 22 in PurtanBay and transplanted downstream at station 20 atthe mouth of the river and at station 53 in the upper.Piankatank River. Monthly samples consisting of 10oysters each were taken from all 3 localities foranalyses. The results of observations of watercontent from March 1936 to April 1937 are shown intable 40.
The results show an improvement i.n the watercontent of the oysters after their removal fromPurtan Bay. Those remaining in the original bedwere much more watery throughout the time ofobservations than those removed to a differentenv.ironment. This improvement is in line with theimprovement in general condition and in glycogencontent as pr~viously noted.
Transplanting experim~nts show that with respectto general condition, water content, and glycogencontent, the transplanted oysters within a short timeacquire the characteristics typical of native oysters.
GONADS
OFTHE' YORK.. .
BIOLOGY AND CULTIVATIONTHE 'OYSTER INRIVER '
Observations on the development of· the gonadswere started at the end of June 1936 and continue'dto June 1937. Oysters in the lower part of the riverripened earlier than. those above. During Jun~
; 1936, fr9m 80 to 100 percent of the oysters examinedat stations 14 and 20' had fully developed and ripesex products, while the oysters at tqe stations fartherup the river showed a lesser degree of ripeness. In1937 an examination made during the last week ofMay' disclosed, in general, the same situation, with60 to 80 percent of the oysters of the lower part of
Studies of the biology and cultivation of the oysterin the Yqrk River were carried out in 1936 and 1937for the purpose of determining practical proceduresthat might be helpfui" in overcoming the increasingdifficulties of the oyster growers. The history ofthe. industry of this area indicates that the YorkRiver is primarily an oyst,er-growing area that· produces but iittle natural set. The, many bushels 6fmarket-oysters harvested in the past from this river'came principally from'plantin'g seed oysters obtai.nedelsewhere, mqstly in the James River. The densi.tyof planting varied from 500 to 1,500'bushds an acre,depending on the type of bottom and the size of the
. seed. According, to stateme,nts made by local oystermen still engaged in the business of grow-ingoysters in the York River, the yield in the upperpart of the river prior to 1918 varied. from 1 to 3bushels for each bushel planted. Most of thegrounds at the tiri1e of this investigation 'did notproduce more than one-half 1;>ushel for each bushelof seed plarited. The period required to grow theseed ,to marketable size varied from 18 months to 3years, depending on the location of the planting andthe size of the seed when plarited.
The continued poor condition of' the oysters andtheir unmarketability had discouraged the plantingof .seed, with the result that, at the tin-ie of thesestudies, old oysters were predominant on the groundswith only small numbers of spat or seed ,present.
The last set of oysters of commercial value, according to the planters, occurred in 1933. Marketable oysters were. harvested only in the lower partof the river where some planting operations were
. still continued.
Not trans-Transplanted
pl.ntedUpper York Lower York Upper Pian-(station 22) (notion 20) ka..nk
(station 53)
86.9 186.9 186.985.6 83.4 8~,~84.1 83, R 8". to83,3 82.9 8.l.7
I 82.5 77.5 84.684,5 81. 0 ~U. 287.7 112. I 86.5t'5. :, 81. 2 81.485,6 81.4 78.583.4 81. 4 79.5
91'.8 88.5 81. 089.8 83.0 83.085.9 83.2 83,182.0 ------------ 82.8
85.5 82.4 82.9
Date
Average _
1936Mareh •• •• • _April • ._. _May • • _June. - - - -. - - -._ - - - -- - _. _July • - ---- • ~_. _. _August. . _Septemb.._. • _Oetober • _•• • • ._November ~ .Deceolher _
193iJanuary ._ .. _February • • ._March ._._. • •ApriL • ._
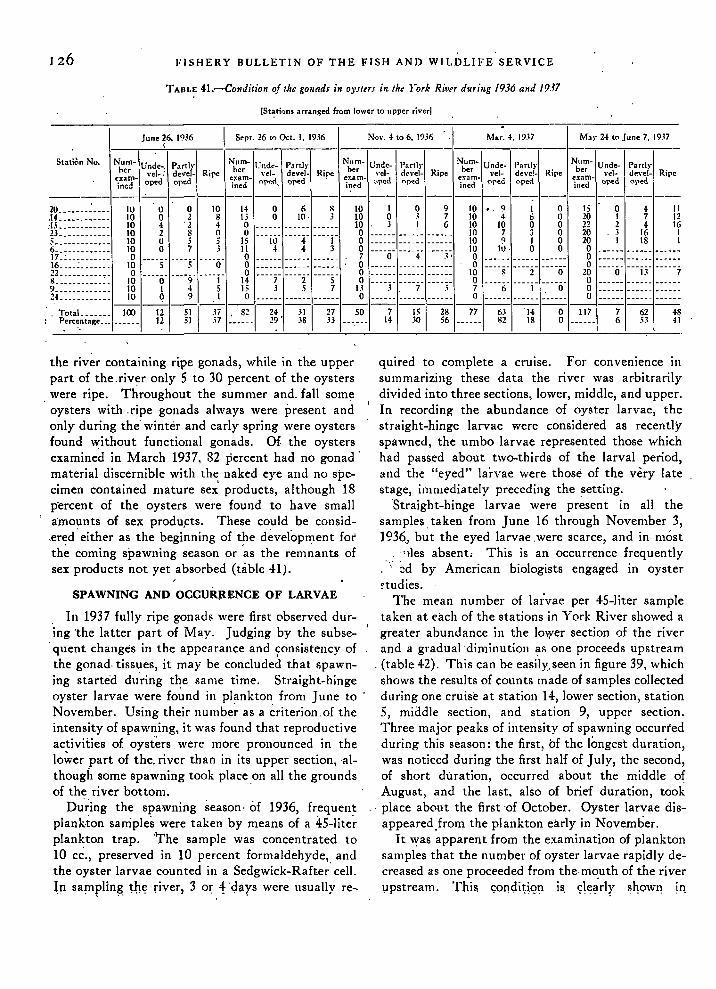
126 FISHERY BULLETIN OF THE FISH AND WILDLIFE SERVICE
TABLE 41.-ConJition of the gOl/ads in o)'surs in tlu J·ork Rifler during /936 and 1937
ISt~tions arranged from lower to upper river)
_~ne ~6. 19.16__I~ePI. 26~o oc~~~~_ No". 4 106. 19.16 _~.r. 4.:...~~___ Mar 24 to June 7, 19,;7
St~ti"'" No, Num'\unde-. partlrl INum'Il.'lld<·1 partlrl Nbum- Unde· parllrl Nb~m-Iullde. Partir ~~';" unde·1 Partirber "c!.: devel. Ripe her vel. devel. Ripe er "c!. devel· Ripe r "e1. deve!· Ripe m vel- devel· Ripe
examR d d exam- rl d . exam- d"" exam· -l' d exa - d d. incd ope ore I inea nT'r.. ope il,\t'd ~)PC npe\..· incd I Ore\.1o (:·re illed ope Ql'e.________ -,- 1 - _
2U...•... :.... IU 0 0 10 14 0 6 10 1 0 9 10., 9 I 0 15 0 4 II.14 . R 10 0 2 8 13 0 10· 10 0 3 7 10 4 6 0 10 1. i 12
:H:::::::::::: :8 ~ '~ ~ 3 :::::: :::::: :::::: 18 ~. _. __ ~ _.~. m I~ ~ 8 ~6 ,~ I~ 1~L::::::::::: :8 g ~ H I~ t ~ 8 -.. IS 1~' ~ 8 28 ._.. ~ ~~. _ ~17.: .. _._._... 0 __ •.• _." ._.... 0 _ 7 ----ii· "'-4' --··3·' 0 ._._.. 0 •...• _ ..•. _ _.~~.._.:....... 18 '5" 5 0 g --. ""'- 8 :::::: :::::: :::::: 18 g. --··2· ·--·ii· 28 ----ii· '--if -····7ii::::::::::::: 10 -'--ii' -'--9" '-"i' 14 --'"7" '--"2" '--T 0 0 U __ .. _ .9 __ 10 1 4 5 15 j 5 7 1.l ---T ----7· ----3· 7 ----ii· ----i· ·--·ii· 0 ._ """ •...•.24 .. _IU O_, _Q_, _._1 _0_:..:.::..:.:.: :..:.:..:.:..:.::.:..::.:..::_O_:..:.::..:.:.::..:.:..:.:..:.:..:.:..:.:..:._O_::.:..::.:..::::.:..::.:..::::.:..::.:..:: __U:..:.:..:.:..:.::.:..::.:..:::..:.::..:.:.:
, ,TotaL...... 100 12 51 I .i7 ,8! 24 .II I 27 50 7 15 1 2S 771 6.; I 14 0 117 7 62 48: ~erce.ntage-.T..... 12 51 .i7 • __ .__ !:' .;S ,lj •.•••• 14 .i0 56 _..... 82 18 0 ... __ • 6 .1.1 41,
the river containing ripe gonads, while in the upperpart of the .river only 5 to 30 percent of the oysters
, were ripe. Throughout the summer and. fall someoysters with .ripe gonads always were present andonly during the' winter and early spring were oystersfound \\:'"ithout functional gonads. Of. the oystersexamined in March 1937, 82 percent had no gonad'material discernible with the naked eye and no specimen contained mature sex' products, although 18p'ercent of the oysters were found to have smallamounts of sex produ,cts. These could be consid.ered' either as the beginning of the development forth~ coming spawning season or 'as the remnants ofsex products not yet absorbed (table 41).
SPAWNING AND OCCURJ,tENCE OF LARVAE
In 1937 fully ripe gonads were first observed during ·the latter part of May. Judging by the subse-
,quent changes in the appea rance and ~onsistency ofthe gonad, tissues, it may be concluded t.hat spawning starte'd du'ring t~e sa me time. St.raight-hingeoyster larvae were found in plankton from June toNovember. Using their nUl11be~ as a criterion,of theintensity of spawning, it. was found that reproductiveactivities of oysters. were more pronounced in. thelo~er part of the, river than in its upper section, 'although some spawning took place on all the groundsof the river bottom.
Du'~ing the spawning season· of 1936, frequentplankton samples were taken by means of a 45-lite~
plankton trap. 'The sample was concentrated to10 ce., preserved in 10 percent formaldehYde" andthe oyster larvae counted in a Sedgwick-Rafter cell.In samplin~ ~hy river, 3 o~ 1- '<;lars were usually re-
quired to complete a cruise. For convemence JI1
summarizing these data the river was arbitrarilydivided into three sections, lower, middle, and upper.In recording the abundance of oyster larvae, thestraight-hinge larvae were considered as recentlyspawned, the umbo larvae represented those whichhad passed about two-thirds of the larval period,and the "eyed" lai-vae were those of the very latestage, immediately preceding the setting.
"Straight-hinge larvae were present in all thesamples, taken from June 16 through November 3,]936, but the eyed larvae ,were scarce, and in most
, .'lIes absent: This is an occurrence frequently. ",: ~d by American biologists engaged in oyster~tudies.
The mean number of lal:vae per 45-liter sampletaken at each of the stations in York River showed agreater abundance in the Imyer section of the riverand a gradual 'diminution as one proceeds upstream
,(table 42). This can be easily. seen in figure 39, whichshows the results of counts made of samples collectedduring one cruise at station 14, lower section, station5, middle section, and station 9, upper section.Three major peaks of intensity of spawning occurredduring this season: the first, of the longest duration,was noticed during the first half of July, the second,of short duration, occurred about the middle ofAugust, and the last, also of brief duration, took
" place about the first 'of October. Oyster larvae disappeared,from the plankton early in November.
It 'Yas apparent from the examination of planktonsamples that the number of oyster larvae rapidly decreased as one proceeded from the,m~uth of the river1lpstream. Thi!; <;ondi~\q~ is. c;le~rlr sl1owl1 jn,

EF,FECT OF PULP-MILL WASTES ON YORK RIVER OYSTERS ..127
UPPER YORK100 STAT ION •
TABLE -n.-Mean number of free Sfllitllllli7lg larvae per 45-litersalllpitl ill the York Rit.tlr
previously as c'ultch., It was certain; therefore, thatany spat, or scars showing the place of the attachment of spat, had attached or been formed duringt~e period of exposure of the shells at the selectedstations. Bags were taken out and replaced hy newones at intervals o'f 2 to 4 weeks. Fifty shells, take~from each of the bags, were examined with a dis-
, secting microscope and the number of spat on theinner surfaFe of the shalls counted. ,From the datathus obtained, the number of spat per bushel ofshells was coniputed. Because the interval betweentpe observations someti'mes was too long to determine the exact time of 8etting, the approximate timewas estimated by measuring all spat found on theshells, and plotting an age-distribution curve forthe period of the exposure of the bag of shells'. Using,this method, first suggested by Hopkins (1931), theapproximate times of major setting-periods, weredetermined and plotted (fig. 41). '
The first collectors were placed on June 11 atseveral stations in the lower and middle parts of the
. river. The first set appeared about July 15 at stationIf opposite Yorktown. After this date, setting ofvaried intensity occurre~ throughout the summeruntil October 19. In the lower part of the river, twoperiods of relatively heavy setting were recorded(fig. 41), the first during the lasfhalf of July and theearly part of August, and the second about the middleof September. The latter setting was the heaviestand was almost of commercial importance. Eachof the two peaks of heavy-"setting periods occurredapproximately two weeks after the correspondingperiods of abundance of the oyster larvae•.
The setting of oysters in the upper section of the
LOW ER YORK
STATION 14
0'800..'".... 600....>
'".. 400....
14 24 3OCT.
FIGURE 39.-Seasonal occurrenc-e of oyster larvae at three stationsin the York River, 1936
~ MIOOLE YORK.. ZOO STATION 5.....,~ °r...J..O......L..,.II.-...............AJ'-:--'-.l.J...--JL..-...l--L.LL....IL....---J
figure 40 representing the mean number of larvae insamples collected throughout the season at threesections of the river. The number of samples collected at each section was as ,follows: in the lowerpart, 31 samplc::s at 3 stations; in the middle part, 32samples at 4 stations; and in the upper part, 37samples at 4 stations. The decrease in the number'ofoyster larvae was probably due to some abnormalcondition of the environment in the upper part of theriver because spawning and setting in tidal watersfrequently takes place in water of reduced salinity.
l.owC'r ri\"er Middle ri '.'cr lll"pe r river---------' -------- !-----.------.-.,...--
.....>
'::i 100....
Ol..---;-;~~~I~·1.0WER MIOOI.[ UPPER
YORK YORK YORK
FIGURE 40.-Comparative abundance ofovster larvae in the three sections ofthe York River. The column's represent' the mean number of larvae persample, for the period from June l£ilO Nove!11l>~r 4, 1936.
'".... 200
400
.........:: 300..
I Pamunker River.t Mattaponi River.
!;. tat,'Qn Nb.'r"nn-r Num- S Nllm- Num . Num- Nb r tation ber of b f Stat.ioll ber of b I1m-rNo. j;am- Ier 0 No. sam- er 0 No. sam- er 0pIes arvae pIc!' larvae pies larvae
20_=1-~-:; 23.. .•.~ --;~~=~-;-,~.14________ b 273 5 •• __ 9 16.1 17______ ~ 9015_' __ ' 1 9 230 22... '8 175 8_______ 8 7~
6__ •••• _ 7 50 9_______ 12 5018______ 17 1419 ._ • 7 .18
SETTING OF OYSTERS IN 1936
During the summer and fall of 1936, wire bagsfilled with shells were placed at several stations inthe York River to obtain information on the period
, and intensity of oyster setting. The shells, obtainedfr91Tl ~ loc;~l shuckin~ h01,lse, had not been used

FISHERY BULLETIN OF THE FISH AND WILDLIFE SERVICE
eo 400
FIGURE 4-l.-The occurrence of larvae and setting of oysters attwo stations in the York River, June to October 1936.
II 21 31 10 20 30 9JULY AUG. SEPT.
21
LOWER PIANKATANKSTATION 'SS
SPAT =LARVAE 0
UPPER PIANOATANOSTATiON 63SPAT _
LARVA[ •
o 0. __ •
.. 400...~f/l
~ 300
~i 200
III..!;j0. 100f/l
55 53PlANK. RIVER
STATIONS
FIGURE 42.-Number of oyster spat per bushel ~f oysters andshells taken from the bars in the York and the PiankatankRivers at the end of the setting season, 1936.
FIGURE 4-3.-The occurrence of larvae and setting of oysters attwo stations in the Piankatank River, June to October 1936.
200
season ·there was no material difference between thenumber of spat in the two parts of the river (fig. 42) ..
Although the spat survived better in the upperpart of the river, the intensity of setting there wastoo low to be of commercial value. The loss of spatin the lower part was primarily caused by the depredations of the screw borers or oysters drills, Urosalpill."C and E1/.pleura, which abounded on the barsof the lower sec'tion of the river but were not foundin its upp~r part. Pr~duction of seed oysters on acommercial scale appears to be feasible in the lowerpart of the river only if effective drill controlmeasures are employed;
Piankatank River
The c~ndition of gonad development, spawning,and setting in the Piankatank River resemble thosein the lower and middle York River. The number
• 1000............. ~"' ..:~ 800
"' .......... ",. :;cn.n~ 600•
'"0: ..
~ ..111 1- 400, !:. .c" ....
100
0 .......:IEc....
1100 .....::i....
1000 ..........c>
'"c...
LOWER YORKSTATION 14
SPAT _LARVAE 0
UPPER YORKSTATION 9
SPAT _
LARVAE 040 -
...~ 240",......o 200......'"..it .10
'"...A-
tCAOIl
York. River during 1936 was' conside.rably less thanthat in the lower part, and of shorter duration. Thefirst setting was rec,orded during the early part of
,August and extended through September. Station9, near West Point, Va., was 1:he uppermost locationwhere shell bags were pla~ed. Some of them werelost but enough were recovered to show that theintensity of setting was insignificant and could not·provide a natural replacement of oyster populationson the bars used for commercial fishing. At station.9 ~cattered setting occurred during August andSeptember and the period of heaviest setting tookplace during the latter part of August and early inSeptember (fig: 4l). Again the peak of larval occurrence preceded the heaviest· setting by about 2weeks. At station 14 the total number of spat per"season per bag was 1,402; at station 22, near PurtanBay, 660; and at station 9, only 226.
Data resulting from the examination of shell bagsshow that the setting in the York Ri'ver decreasedfrom the mouth to the head of the river. A differentresult was obtained, however, from an examinationof natural shells and oysters on the- bars of the river.In checking the number of spat per bushel of bottommaterial, it was found that the mortality' among thespat in the lower part of the river was so great thatthe advantage of heavier setting in the lower partwas lost. Consequently, by the end of the setting

EFFECT OF PULP-MILL WASTES ON YORK RIVER OYSTERS 129
of larvae found in the. plankton samples, was smallerand varie<;l less than in the York River. The larvaereaching setting stages were more numerous withthe consequent higher rate of setting (fig. 43).
Examination of plankton. samples 'and of shellbags were conducted at station 55, 'near the mo'uthof the' river, and station 53, several lililes from themouth.. The setting of oysters at each of thesestations could be considered of commercial value.
. .. ORGANISMS FOUND IN ASSOCIATION WITH
OYSTERS IN THE YORK RIVER
No attempt was made to collect and identify allthe forms that may be inhabiting the York River.Attention was paid, howeve~, to the presence andabundance of organisms intimately associated withthe oyster or· constituting a definite danger to theoyster industry. .
Sponges most common on the oyster beds in theYork River were the sulfur sponge, Cliona ulata,red bearded sponge, Microciona prolifcra, and oneunidentified· species of siliceo~s sponge occurring inthe' lower part of the York River. The sulfur orboring sponge was very thickly. spread in the lowerriver and caused considerable damage to oysters byweakening the shells. .It was found as far up theriver as statiOli 9, which was probably the extremerange of its distribution in brackish water. Therange and abundance of Microciona was the same as.that of the sulfur sponge. M-icrociona constituteda nuisance to the oystermen because occasionally itcaused a painful rash on the hands and arms of themen handling oysters.
Hydroids, Thuiaria sp., called by local watermen"moss," were abundant in the lower and middle partsof the York River. .
Among other coe!l::nterates the most common werethe three genera of jellyfish, Dactylomctra quinqllc-
.cirrha, the most abundant, the red-colored Cyallcasp.; and A urcNa sp. The first two species, foundonly occasionally, were distributed throughout thewhole river,' while the last was confined mostly tothe middle and lower parts. Sea anemones wereseen on ma ny of the shells and oysters brought in .
·from all parts of the river.. Several species or'Ctenophores were present, some
times in enormous numbers. The identity of onlyone of them was established as Mncm-iopsis gardm-i.
An unknown turbellarian worm was found inrather great numbers on oyster shells and on oystersin the middle an,d lower parts of the York River.
The nemertean worm, Ccrcbratulus lactcus, wascommon in the river below Yorktown.' It was foundboth in the shallow waters inshore and among theoysters in deeper water, fragments being brought upfrequently in the oyster dredge.
:aryozoan colonies "encrusted the shell~ of oystersand other animals in all p~rts of the river. Theyfouled the. shell surfaces to such an extent that spaceavailable for setting of oyster larvae was greatlyreduced. Undoubtedly, they were responsible inpart for the light set of oysters during the summerof 1936.
The clam worm (Nerc"is limbata, Ehlers) wascommon throughou.t the river. The tube!> of anotherannelid, tentatively identified as Hydroides luxagonus, often were found on the shells of oysters fromall parts of the river.' One planter reported thatin 1935 the tube worm ·was thick enough to form acrust on the oysters in certain parts of the upper I
river. Another annelid frequently found on oystershells was a bright red terebelIid, Polycirrus cxinuis .L~idy.
The shells of the oysters contained numerous mudblisters, averaging five per shell, made by variousspecies of Polydora. Live Polydora could be foundfrequently: Examination of the large number ofoysters collected on July 25, 1940, along the entirelength of the river showed 'that about one-third ofthe blisters contained live worms which were identified by Dr. Olga HaTtman as Polydora ligni Webster,most comm~n in the sample, Polydora calea Webster,and Polydora sp., probably anacltlata Moore. SincePolydora blisters were found both in good and verypoor oysters, it was impossible to correlate theirpresence or absence with the condition of the oyster.
In. view of the reports by Kudo, (1939) and Pryt~erch (1940) that mud crabs are primary hosts ofthe gregarine N cmatopsis and are responsible for thedistribution of this parasite'on oyster beds, a surveywas made of the occurrence of these crabs (familyXanthidae) in the York River. The distributionof the various species,6 is presented in table 43,which shows the stations and the number of specimens found in a bushel of bottom debris.
The blue crab, Callincctes sapidus, which also maybe one of the hosts of Ncmatopsis, occurred in allparts of the' York River, but was more abundant inthe lower section.
Filling the shells of gastropods were many hermitcrabs. Their distribution was limited to the middle
• Dr. Mary ]. Rathbun kindly identified the.e species.

13° FISHERY RULl.ET.lN OF THE FISH AND WILDLIFE SERVICE
INumber of crah~ ("1111..:1 per hushcl of hottom debrisl
20 • _14. • _
·15. __ •••••• _23 •• _•• •05 _22 _. _• _06 • .: _16_ •••• • __ •• _08 •••• .:09••••• _" __ ._. _
TABLE 'l3.-DiJlribulioll of mud crabJ (Family );."alllllidae) inl"ork RiflC1, ra. 1
Eury- Panopell llo hcrhllotii Neo- Rhithro-
Station ~:,n?pC:ll~& ----,.---- ~:;~~: Ph~~ri:Ns__. '_~~~,~rica Simr,nn~_,_",_an_a__: _
15 'I 1 ---.------. 17 --.- ••• ---.11 1 10 • •• _•• _I .. :;
1!_~:::_::i~ :::::::~:-, ::_::::_:~I::::::::;lI The samples were canec,ed in ,he ran of 1936 from Oct. 7 to Nov. 6, An
(Irater dredge catching about H hushel to a .drag, and a pair of tongs catchingabout ~i of a bushel to a grab. were used to gather the bottom material. Thenumber of crabs were counted in the material brought up and the amount ofmaterial dosely estimated.
and lower parts of the river. Spider crabs, Libilliad11bia, and L. ·emarg£lIata were often seen in the dredgeloads taken in the lower parts of the York. Along'the low banks from the ·mouth to the head of theriver were fiddler and sand crabs. The sand· crab,Ocypode albicans, was mo~e abundan~ on the shoresbelow Yorktown than in the upper part of the river.
Barnacles were widely distributed thelengthoftheriver and in many places completely encrusted theshells of oysters. However, they did not constituteany serious menace to the oyster indust~y.
The oyster crab, P.innotheres ostreU1n Say, wasobserved many times in the mantle cavity of oystersopened in the course of the inyestigation. Thesecrabs were found on all oyster grounds, butwere more abundant in the lower part of the river.On one occasion 575 oysters were examined and 17were found infested by crabs. .
Gastropods were numerous with the greatestvariety of species found in the lower part of the river.The mud ~nail, Nassa sp., abounded in the river' predominating in its lower half. On the pilings and sidesof moored barges in the vicinity of West Point, periwinkles, L£tt"orhza sp., were occasionally seen. Thesemay have been brought in by the barges carryingpulp wood to the Chesapeake Corporation plant at\Vest Point. No oyster drills, Urpsalp£nx sp. or Eupleura sp., were found in the upper river, but bothspecies were present and constituted a serious menace in the lower part of the river. Other gastropodscommon in the lower· part included the sand collar,Polynices sp., th'e con<;:hs, Busycon carica, a~d B.canaliwlatU1ll; Purpura ,sp.; and several species ofCrepidula. One of the horse mussels, Modt'olus dem£ssus, was abundant on the oyster beds from the mouth
to the head ~f the York River. The edible mussel,lvlytilus cdulis, was common in the lower part of theriver. Fairly abundant in the vicinity of Yorktown
-. was the razor clam, Ellsis dirertus. .Several shells ofoysters dredged from the lower river were founddrilled by boring clam Diplothyra sp. This clam onlyrarely was found and did not constitute an ·oystermenace in Virgini·a waters.
It might be mentioned that only one specimen ofstarfish, .1st.:rias forbest', was taken within the lowerpart of the river. At the mouth of the river, however,starfish occurred in exceptional abundance in thespring of 1937 and later disappeared.
The tunicate, Molgula sp., occurred throughoutthe river. It was found growing in such thick cluster~
at some locations in the lower river that it cqmpletelyhid the oysters to which it was attacli~d.
In resume, ecological observations failed to disclose the predominance of any predatory' or commensal organisms which might have been respon:sible fOr the poor quality of the oyster~. The animals found in York River frequently occur on oysterbottoms and can be considered as constituting anormal community of organisms inhabiting these·bottoms.
EXPERIMENTAL STUDIESPulp-mill effluents emptied into the upper York
River in large quantities constitute the only industrial pollution of the river. Physiological experiments carried out at the Yorktown laboratory were, .therefore, primarily concerned with the effect ofthese wastes on oysters and on oyster food-organisms. 'Simu·ltaneously with these observations,studies ·were made on· the chemical nature of p~l...luting effluents and their fractions. Physiologicaleffect of each of the effluents and lateran various fractions of them, prepared by the chemist, were testedindividually or in combinations. These studies included observations on thc effect of pollutants on theadductor muscle (determination of the number ofhours the shells remain open), studies of the changesin the activity of the ciliated epithelium of the gill(drop-counting method), and determinations of therate of water filtration of oysters kept in variousconcentrations of pollutants.
Although. the literature on water pollution bypulp- and paper-mill wastes is very voluminous, theeffluents from' the sulfate pulping process have often·been dismissed with 'the statement that sulfate millsdo not' discharge a waste liquor to pollute wa,ter

EFFECT OF l>ULP-l\1IU: Wf\STES'ON YORK RIVER OYSTERS 13 1
(Kobe 1937)-.c As early as 1908 European workersbegan studies on th.e toxicity of sulfate pulp-milleffluents upon fish life (Ahlin 1908) and within thepast decade extensive studies have been made'uponthe resin acids present irl sulfate pulp-miH effluents.This recent work (Ebeling 1930, 1931, 1932; Va.1lin1935; Hagman 1936; Jarnfelt 1936; Bergstrom andGederquist 1937; Vestergren 1938; Erdtman 1939)has been carried out chiefly in .Sweden and Finlandupon the' finned fishes inhabiting fresh waters. Allof the work has been upon the wash waters from thesulfate pulping process which contained a sufficientquantity of· the ,resin acids to be injurious to theanimals tested.
Jn the United States some toxicity studies havebeen made with the alkyl mercaptans (Cole andWarrick 1935; Cole 1935) known to be formed in thesulfate. pulping process. These studies wen; alsoconducted on fresh-water fishes.
With possibly a single exceptiOJl (Anon., 1910)'110 record' was found of the effect of sulfate pulpmill effluents upon either marine fishes or sea water.The publication in question was confined to a reporton the study of the toxicity of ,alkali metal sulfideson fishes. ,
As far as could be ascertained no investigationsother than the work reported here and presented in 'apreliminary report (Galtsoff, Chipman, Hasler, andEngle, 1938) has been made with reference' to theeffect of sulfate pulp-I~ill effluents upon oysters.
DESCRIPTION OF THE PROCESSES EMPLOYED BYTHE CHESAPEAKE CORPORATION AND LOCATION AND DESCRIPTION OF THE VARIOUSSEWER OUTLETS
A description of the processes employed in nlanufacturing pul'r and paper appears to' be essential foran understanding of the nature of the effluentsentering the York River and of the samples usedin testing.
The mill makes its pulp from wood by the sulfateprocess using chiefly loblolly pine (Pinus laeda L.).In this process the pine chips' are cooked atelevated temperatures and pressures' in a watersolution containing sodium sulfide and causticsoda. These chemicals dissolve the noncellulosicportion of the chip leavi~g the cel,lulose as a fibrouspulp which is separated from the cooking liquor andthen purifieg. The separated liquor, after beingfortified with, chemicals from the recovery house, isreused in the cooking operation,
Before going to the paper-making machine the rawpulp from the digester is purified by counter-currentwashing in a diffusion apparatus. This method reduces the volume of water needed and gives increasedrecover)' of the chemicals used for cooking the chips.The first wash water, richest in chemicals, is designated "weak-black liquor" and is sent to the recoveryhouse for reclaiming. The last wash water, althoughdark in color, is too poor in' chemicals for profitablerecovery and is discharged into the river. Theintermediate wash waters are' reused, being fin'allywithdrawn from the circuit as weak-black liquor.After removal ,from the diffusers the pulp is subjectedto screening and further washing with paperma'chine waste water, which contains very smallamounts of chemicals:
The weak-black liquor, after' filtration to removesuspended fibers, is concentrated in multiple effectvacuum evaporators until the "sulfate soap" beginsto separate. After removal of the soap, concentrat.ion of the liquor is continue,d until it.becomes combustible and it' is then sent to the incinerators.Prior to incineration, the chemicals lost in the pulpwash waters are replaced ,by, the addition of "saltcake," sodium acid sulfate. If the sulfate soap,removed during concentration of the black liquor,cannot be sold, it also goes to the incinerator. •
During incineration the noncellulosic constituentsof the wood, present as soluble substances in theblack liquor, burn and pass out of the smokestackas gases and vapors, leaving an ash composed chiefly'of water-soluble s~bstances, sodium carbonate andsodium suffide; derived froin the sodium compoundspresent originally in both the black liquor and thesalt cake. The ash is dissolved ana this solution istreated with quicklime which changes the sodiumcarbonate of the ash to caustic ~oda and leaves thesodium sulfide unaltered. The quicklime changesto calcium carbonate, which being insoluble, settlesout as a sludge and is removed, leaving the clearsolution of caustic soda and sodium sulfide' to beused for cookihg the wood chips. •
The calcium-carbonate sludge contains appreci-'able ,amounts of the above-mentiOl~ed chemicalswnich are removed by a system of counter-currentwashing and filtration. These wash waters are usedfor dissolving the ash, while the washed calciumcarbonate is convert~d illto quicklime. Prior to1935 the calcium:'carbonate sludge was pumped ,intoa fresh-water swamp, now about one-third to onehalf mile from the P;l,m\m~ey R!ver~ but since 'th~n

13 2 FISHERY BULLETIN OF THE FISH AND WILDLIFE SERVICE
all of the calcium-carbonate sludge, after beingwashed, has been reburned to quicklime, supplyingfrom 90 to 95 percent of the quantity needed forcausticizing the ash.
Due to the limited supply of process waters thefiber losses,.as reported by the mill chemist, are very·small. With adaily output of 350 tons of pulp, thelosses are usually less than ~OO pounds per day, and
·only rarely exceed 500 pounds per day.T,he efHuents from the mill are carried in various
sewer lines. Their location, size, and nature ofmaterial carried have been given in figure 4, andgescribed in pages 97-99.
Based Qn the nature of the chief efHuent carried,the samples taken from the ditch" receiving efHuentsfrom pipes] a'nd H are spoken of in this paper aspulp-mill effiuents, those taken from the ditchreceiving the effluents from pipes A, B, C, and D,as paper-mill effluents, and those taken from theditch draining the sludge pond as" sludge:-pond .' .effluent.
PHYSIOLOGICAL EFFECT OF RIVER WATER"CONTAINING PULp· AND PAPER-MILL WASTES
The first problem encountered in a study of theeffect" of industrial wastes on aquatic organisms isth~ determination of the concentration of the pollutant in the water. This presents little difficultyin'cases of metallic salts, acids, or other substanceswhich can be detected and quant.itiltively determined by available chemical methods. In the caseof pulp,-mill effluents, consisting of a complex mixture of various organic compounds and mineral salts,such a direct approach is impossible because of theabsence of specific reactions. The situation isfurther complicated by the fact that the chemicalnature of the toxic component or components of thesulfate-mill erffluents is not known.6
In ~earch -of some method, it was first thoughtpossible to apply the Falin-Dennis ~eaction forphenol, as~ many' phenolic compounds in sulfa,tepulp-mill waste produce a blue c"olor when allowed toreact with this reagent. Many tests were made onsamples of water collected at various distances fromthe pulp-mill in the York River, at many locations inthe Piankatank River, and frOm a number of placesthroughout the general area of the lower ChesapeakeBay. The procedure used was that of Vorce (1925),who applied this test to water analysis. The results
o A nitrosolignin teot. Pearl and Benson (1940), successfully used by Benson.Kobe, and Scott (l9~1) in determining the concentration of sulfite waste liquorin sea water. had not been published at the time the Yor.k River studies weremade.
were, however, inconsistent and unreliable for anestimation of the concentration"of sulfate-mill wastein the sea water because it was apparent, and confirmed by supplementary t~sts, that besides ligninand other components of pulp-mill waste, the watersof the river contain a number of other substances;not derived from the industrial waste, which give ablue color with the Folin-Dennis reagent.
Although it was impossible by chemical determination to obtain accurate measurements of theamount of pulp-mill effJuents present in the YorkRiver, it was obvious that the upper river containedthis material in considerable amounts. The presence of the physiologically active material of theeffluents in the river in relatively high concentrations was demonstrated in two types of biologicaltests and observations on oysters. One of theseshowed the effects of river water of the upper YorkRiver on the rate of water filtration of oysters aridthe other the effect of this water on the time oystersremain open.
Frequently, pulp-mill effluents containing largeampunts of black liquor were discharged into thePamunkey River off the city of West Point. On themorning of the sampiing, the river was brown withthe effluent and a large area was covered with foamand froth. At this tim"e two 5-gallon bottles of riverwater were taken at the bridge across the PamunkeyRiver just above its junction with the Matta'poniRiver to form the York. J '
After being brought to the laboratory, the samplewas filtered through a double thickness of cheese-
"cloth to remove the larger pieces of fiber. In orderto avoid subjecting the ,oysters to sudden changes' insalinity, the samples were adjusted to the approximate salinity of the. laboratory supply ,of sea waterby the addition of sea salts. These salts were~btained by evaporation of laboratory sea waterafter centrifuging with the Foerst" highspeed centri-
. fuge to remove the larger plankton forms, and dryingthe residue. The salinity of the sample was found tobe 10.28 parts per thousand and the laboratory seawater 21.28 parts per thousand. Sea salt was addedto the sample so that the salinity, when tested, was21.94 parts per thousand. The difference betweenthe sample and the laboratory sea water in whichthe oysters were 'acclimated was less than normaldaily ~uctuations in the salinity of the water atYorktown.
The observations consisted in determining theiat"e of water filtration by the gills of normal oy~-

EFFECT OF PULP-MILL WASTES ON YORK 'RIVER OYSTERS 133
ters using the drop-counting method described byGaltsoff et al. ,(1935). Oysters were placed both inthe laboratory supply of sea water and in the seawater collected in the upper York and adjusted toYorktown salinity. The method, in general~ consists of measuring the amount of water pumped by "an oyster in a' flowing salt 'water system. By meansof an electric drop counter, the amount of water isrecorded automatically on a kymograph ,drum.Because of the limited amount of test material, thesolution w:as recirculated. In analyzing the kymograph records, the average number of drops persecond was determined for each lO-second intervalduring the entire period of counting, which usuallylasted from 2 to 2}6 minutes. For convenience inplotting, the figures thus obtained were multipliedby 60 to represent the mean number of drops perminute. The results of these tests are presented infigure 44. The periods preceding and following thetreatments may be considered as controls, indicatingthe rate of filtration in unpolluted river water.
The findings clearly show that, at times, the river"water at West Point contained sufficient pulp- and
paper-mill wastes to exert a very strong physiologicalac~ion on oysters. When the normal oysters wereexposed to this water containing large amounts ofthese wastes, they immediately changed their rateof pumping, the ·rate dropping to a very low level, orthey stopped pumping completely. Even when thiswater was diluted lO times with unpolluted seawater, there was a marked reduction in the ciliaryactivity of the oysters exposed to it. "The effectswere not permanent and the oysters filtered waterat their nor!TIal rate once the test material wasremoved.
As the "live oyster must keep the shell open a considerable part of the time, any agent in the waterthat would reduce the hours per day op,en must beregarded as injurious to .the oyster, for it would interfere with its feeding and respiration. For a studyof the possible effect of pulp-mill effluents in the waterin the upper York River 'on oyster~, observationswere made of the time oysters in the river remainedopen at West Point below the pulp mill, atAllmondsville which is about half way between West Pointand Yorktown, and at Yorktown.
.....::>zia:.....en...oa:o
RIVER WATEROYSTER RWi
1'10 RIVER WATER
OYStER RW-3
1:10 RIVER WATER
,9YSTER RW-4
EXPERIMENTAL TIME IN HOURS
FIGURE 44:.-Effect of river water polluted with pulp-mill effluents on th~ r~te of pumping of water by the gills of the oyster. Dropcounting method. Samples of water used in this experiment were collected at the Pamunkey River Bridge.
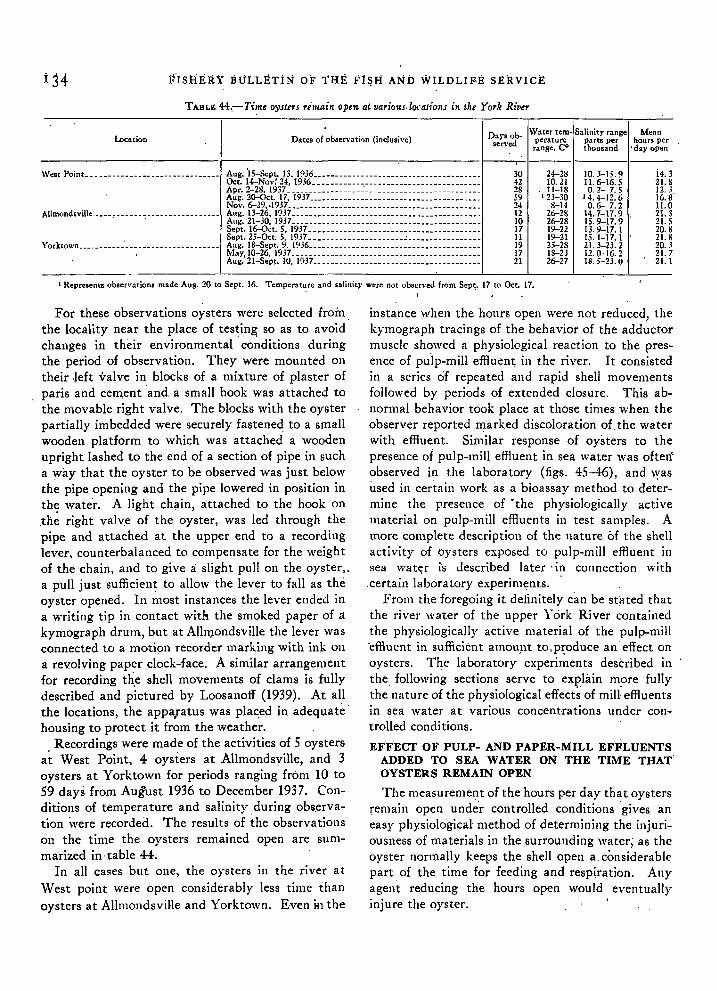
i34 F'ISHERY BULLETIN OF 1'HE FI~H AND WILDLIFE SERVICE
TABLE «,-Time oysters remaill open at lIarious,locatiolls ill the York Rit'er
Loc3tion Dates of observation (inclusive)
West Point. ~ __ ~ • _
Allmond.ville. , , _
\'orktoy,·n " - - _-- _
Aug. ·15-Sept. 13. 1936 _Oct. I4-Nov: 2-l, 1936 _Apr. 2-28. 1937 ~ _
~~~.: ~~.c.~·9~~: !:!?~~~~~======= ~=: ~======: :== === =======: =::Aug. 13-26. 1937 • • • __Aug. 21-30, 1937 • '" _Sept. 16-0ct. 5. 1937 -- _Sept. 25-0ct. 5. 1937 , _Aug. 18-Sept. 9.1936 • _
~~'i,~?=~~pr't~._i9J7::=:===:::====:=:=::========::=:=======
304228592-l12101711191721
24-2~
10.21. 11-18123-30
8-H26-2826-2819-2219-2125-281S-2.l26-27
10.3-15.9II. 6-16. 50.2- 7.5
14. -l-12.60.6- 7.2
14.7-\7.915.9-17.913.9-17. I15.1-17. I21.3-23.212.0-16.218.5-23. U
i4-.321. 812. _~
16.8II. 02\.:'21. S20. S21. 820.321. 721. I
1 Represents observOltions m3dc Aug. 20 to Sept. 16. Temperat~re and salinit)' were n.)[ observed from Sep~. 17 to Oct. 17.
For these observations oysters were selected froin,the locality near the place of testin~ so as to avoidchanges in their environmental conditions duringthe period of observation. They were mounted ontheir .left valve in blocks of a mixture of plaster ofparis and cem,ent 'and, a small hook was attached tothe movable right valve. The blocks with the oysterpartially imbedded were securely fastened to a smallwooden platform to which was attached a woodenupright lashed to the end of a section of pipe in sucha way that the oyster to be observed was just belowthe pipe opening and the pipe lowered in position inthe wate'r. A light chain, attached to the hook on.tli~ right valv,e of the oyster, was led through thepipe and attached at the upper end to a recordinglever, counterbalanced to compensate for the weightof the chain, and to give Ii slight pull on the oyster,.a pull just sufficien~ to allow the lever to fall as theoyster opened. In most instances the lever ended ina writing tip in contact with. the smoked paper of akymograph drum, but at Alln)ondsville the lever wasconnected to a motion recorder marking with ink ona revolving paper clock-face. A similar arrangementfor recording tli.e" shell movements of clams is fullydescribed and pictured by Loosanoff (1939). At allthe locations, the appa.ratus was pla~ed in adequate'housing to protect it from the weather.
Recordings were made of the activities of 5 oystersat West Point, 4 oysters at Allmondsville, and 3oysters at Yorktown for periods ranging from 10 to59 days from August 1936 to December 1937. Conditions of temperature and salinity during obs,ervation were recorded. The results of the observationson the time the oysters remained open are summarized in' table 44.
In all ca~es but one, the oysters in the river at\-Vest point were open considerably less time thanoysters at AllmondsviHe and Yorktown. Even in the
instance when the hours open were not reduced, thekymograph tracings of the behavior of the adductormuscle showed a physiological reaction to the presence of pu'!p-mill effluen~ in the river. It consistedin a series of repeated and rapid shell movementsfollowed by periods of extended closure. This abnormal behavior took place at those times when theobserver reported marked discoloration of, the waterwith effluent. Similar response of oysters to thepresence of pulp-mill effluent in sea water was oftenobserved in the laboratory (figs. 45-46), and wasused in certain work as a bioassay meth~d to det~rmine the presence of 'the physiologically activematerial on pulp-mill effluents in test samples. Amore complete description of the nature of the shellactivity of oysters exposed to pulp-mill effluent insea wat<;r iii described later' in connection with,certain laboratory experiments.
From the foregoing it definitely can be stated thatthe river water of the upper York River containedthe physiologically active material of the pulp-mill'effluent in sufficient amou]1t to, p~oduce an' effect onoysters." The laboratory experiments described inthe following sections serve to explain more fullythe'nature of the physiological effects of mill: effluentsin sea water at variou~ concentrations under controlled conditions.
EFFECT OF PULP- AND PAPER-MILL EFFLUENTSADDED TO SEA WATER ON THE TIME THAT'OYSTERS REMAIN OPEN
The measuremel!t of the hours per day that oystersremain open unde'r controlled conditions 'gives aneasy physiological-method of determining the injuriousness of materials in the surrounding water; as theoyster normally keeps the shell open a, considerablepart of the time for feeding and respi,ration. Anyagen"t reducing the hours open would eventuallyinjure the oyster. '

EFio'ECT OF PULp-MiLL WASTES ON Y9RK RIVER 6tSTERS
EII'"''''A......:I
, C t
Vo
chamber through la' siphon tube connected to a container floating in the constant-level sea'water supply.In this way t4e. uniform rate of deliver:yof the solution was maintained. By controlling the rates ofHow of sea water and of test solution supplied to themixing chambers, it was possible to adjust the dilution of the material in the floating chamber 'so thatthe desired concentratiOl~ would r~ach the oysters.In each test one oyster, used as a control, was keptin a chamber receiving unpolluted laboratory seawater delivered at the same rate as the water containing the kl~own concentration of pollutant wasdelivered to two experimental oysters kept in anadjoining chamber.' Thus, during each test, thecontrol oyster was kept in identical conditions oftemperature, salinity, and rate of flow as the twoexperimental specimens. .
The kymograph tradngs of shell movements of ,
A
B
E
FIGURE 45.-Kymograph records showing the shell movement ofnormal oysters and an oyster exposed to pulp-mill effluent at aconcentration of 1:10. The base line is marked in I-hourintervals. A and B demonstrate normal activity of oysters insea water. C sho~s the immediate response to the addition ofpulp-mill effluent, which is followed by extended periods ofshell closure D and E preser;tt tracings showing continuedshell closure with brief periods in which the oyster is open anda weakening of the adductor muscle. The writing pen is in
I the uppermost position when shells are closed•.
F
..,.,-------------"-""'--~
The oysters employed for these tests were obtainedfrom the, lower York River. They were from 3 to4 years old and in good condition. Preparatory to
the experiments, they were brought into the labora:'tory and held for severaL days for I acclimatizationin tanks of running sea water.
The equipment used for the observations of theshell movement was .essentially similar to that employed by Hopkins et al. (1931). The oysters were
, .fastened to sinall cement blocks by their left valves.Light threads, attached to their right valves, wereconnected to levers which recorded the opening andclosing of the shells on a slow motion kymograph.The oysters were piaced in chambers receiving sea
.water, or a mixture of se~ water and test material,running in from mixing chambers having a series ofbaffle plates. Test solution was ~dded to a mixi~g
If·
_~ ..._,_---.J'.J'-'---.J'-.....
K_~__~_____' """-__......._
FIGURE 4:6.-Kymograph records showing the effects of prolongedexposure to pulp-mill effluent on the shell movement of anoyster. The tr~cings represent later periods in continuationof figure 4:5. Fand G show the weakening of the addlictormuscle with the oyster unable to hold the shell closed. H, I.and J give the record of the 'gaping of the shell, with feebleattempts of the oyste~ to close the valves. K repre.sents thefinal gaping of the shell with the death of the oyster. Thewriting pen is in the uppermost position when shells are closed.

FISHERY BULLETIN .OF THE FISH AND WILDLIFE SERVICE
the' oysters were marked off into hours and analyz~d
as to the number of hours during each day theoysters were open. The duration of. the experimentsvaried from 6 to 30 days during which shell movements were recorded continuously. Because eachof the tests required many days, the experimentswere made during the entire year at different rangesof temperature \and salinity. The temperature ofthe solution in which the oysters were immersed wasobserved and recorded every morning and night.The' salinity ~f th~ laboratory sea water was measured daily.
In analyzing the tracings of shell movement ofthe oysters, one must ~ear in mind that strongpoisons frequently produce complete paralysis ofthe. adductor muscle which results in the cessationof movements and gaping of the valves. Thus thenumber of hours per day the oyster remains opencan be considered as an index of a normal behavior
only if the curve of shell movement remairls normaLFigures 45 and 46 representing normal behavior andthe shell movements of an oyster affect~d by toxic
,substance illustrate this point. ' One can notice inthe experiments with high concentrations of effluent(1 :10), that after several days of treatment,' the'adductor muscle of tl~e oyster became paralyzed andthe shells remained completely open. The muscular contraction. of these oysters were similar tothose described by Hopkins et aI. (1931) in his workon the effect of sulfite liquor on Ost-rea lu-rida. Inanalyzing the data, the records that showed paralysis of the adductor niuscle were not taken into consideration for determining the time the oystersremained open. The tests are summarized in table47 which gives in a condensed form the conditionsof each experiment and presents the results as themeans of the number of hours per day the oysterremained open. The ranges of tempel:ature ,and
TABLE 45.-Eifecl of pulp-mill 41l,unl 011 the time Ille 0'Yslcrs remain opm
Hours per cl,y open
Concentra[ion of °N~.er \Vater temperature S3Iinit.)· range pnrts Euffient Specific D,teeffluent Experi-
D:Hes of test (inclusive)range °c. per t hOUS3 nd No. gravit}r 3t cullecled
Control 17.5· C.mental
"
I : 10. __________ { 15-1 21.7 2.3 }Nov. 6to 12, 1936_____________ 12.5 to 17.1.______ 23.32 to 22.74 _______ 6 1.0012 Sept. 8. 1~:lG.15-2 21.7 7.8I: 100___________ { CB-S 22.3 8.0
}MaY II to 17, 1936____________
r:t.l22.3 9.022.4 8.6
15.4 to 23.6_______ IJ.17 to 16.08:______ 3 1.0029 May 11.1936.CB-2 22.4. 12.8
I-I 23.1 14.8}M:lY 25 to 30,1936________ • ___1 : 200 _______ • __ 1-2 23.1 10.5 16.4 to 23.8 _______ 14.81 to 16.20_______
1-3 21.9 11'.2 -------- --~------- --~~---------
1-4 21.9 14.88-3 19.2 14.2 }JlIly 30 to Allg. 6.1936_________ 20.5 to 27.1. _____ 20,43 to 21.62 _______ 4 1.0021 June 14.19.16.8-4 19.2 IS .3
· ""----------1
5-1 21.3 10.8}JlIIY 5 to 12, 1936_____________5-2 21.3 17.4 U.I to 28.2.______ 19.27 to 20.10_______ 3 1.0029 M"l'II,1936.5--4 20.5 IS .9
5-5 20.5 14.97-1 20.0 14.1
}JUIY 16 to 25, 19.16_'___________7-2 20.0 12.4 25.3 '027.2 _______ 19;72 to 20.G8_______ 4 1.0011 Juno 14,1936.7-3 24.0 14.0),7-4 24.0 10.02-1 21.3 9.8
}MaY25 to 30,1936·____________2-2 21.3 10.7 16A to 23.8 _______ 14.81 t.1 16.20_______ 3 1.0029 Mal" 11, 1936,-2-3 21.2 11.42-4 21-2. 14.0
12-1 21.2 22.2}oct. 19 to 27,1936. ___________
1 : 1,000_________ 12-2 21.2 17.5 17.3 to 20.7_______ 21.83 to 23.57_______ 6 1.0012 Sept. 8,1936.12-3 21.3 13.012-4 21.3 15.718-1 20.4 '10.5 }Mor. 10,to I?, 1937____________ 3.8 to 10.6________ IG.20 to 17.29_______ 11 1.0039 Feb. 25,1937.18-2 20.4 9.2
104 20.7 14.6 June IS to 27, 1938____________ ----- -- - - -- --- - - -- -. ~ -- -- ------------- 51 1.0014 June I3 .1938,
1: 2,000_________ {6-1 18.7 16.4
}JlIoe 16 to 25, 1936____ ~ _______,6-2 18.7 19.1 25.3 to 27.2_______ 19.72 to 20.68_______ 4 1.0021 June 14,19.16,6-3 18.8 . 17.16-4- 18.8 18.8
1 :4,000_________ {4-1 21.9 22.3
}JlIne 7 to 17.1936___ . _________4-2 21.9 21.7 21.2 to 25.2_______ 17.41 to 17.90~______ 3' 1.0029 Mal" II ,1936.4-3 22.7 22.34-4 22.7 15.8
-·-,,..._--------\14-1 21.7 21.0 }Nov. 7 to 27, 1936_____________ 6.3 to 16.1._______ 21.UO to 23.75. ______ 6 1.0012 Sept. 8.1936.14-2 21.7 22.719-1 21.3 19.1 }Mar. 12 to 26,1937____________ 4.2 to II.L. _____ 15.37 to 17.77_______ II 1.0039 Feb. 25,1937,19-2 21.3 13.125-1 22.4 19.7 }Apr. 26 to May 5.1937_. ______ 12.6 to 16.2_______ 15.46 to 18.57_______ 17 1.0053 Apr. 20,1937.25-2 22.4 19.8
1 : 10.000___ ••••.~ {3-1 22.1 22.0 }June 2 to 29,1936_____________ 19.4 to 27.0_______ 16.09 to 19.94_______ 3 1.0029 May II, 1936.3-2 22.1 22.8
17-1 20.1 18.1 }M.ar. 12 to Apr. II, 1937_______ 4.2 to 13.3._______ 15.37 to 17.90_______ II 1.0039 Feb. 25,193717-2 20.1 20.5
.

EFF,ECT OF PULP-MILL,WASTES O.N YO~K RIVER OYSTERS 137
salinity are written in the order of their occurrenceto indicate the trend of the change experienced duringthe tests.
Physiological factors controlling the spontaneousmuscular movements of the oysters are not wellunderstood. It··· is known, however, that undernormal conditions the oyster has a" tendency to keepits shell open. for ~ery lo'ng periods of time, fre-·quently exceedin.g 24 hours (Galtsoff 1928).
A summary of ·these data referring to the conditions under wHich each set of observations wereconducted, as well as the nature of the test effluent;'are shown in tab'I'e 45. The observations were madeusing samples of mill effluents flowing into the river
II
•4
14
10
II
.. IIc0
•II:III
4..
•4
from the pulping pro~ess (sewers] and H), from thepaper mill (sewer A), and from the sludge pond.The specific gravity and the color of the effluents werenoted immediately upon collecting and the samplewas stored in 5-gallon bottles which were wellcorked and kept in the laboratory room.
Records of shell ~l1ovement were obtained for74 oyst~rs. Of these; 49 oysters were treated with·various concentrations of the mill effluents' and 25were used as controls. Th~ results of all the experiments. are give~l in.figures 47 to 50 which. show thehours p.er day that each oyster \\'as open during theperiods of observation,
The effectivenes~ofthe various samples of effluent,
....._~••••"'8,.~ r" o' , •
'~':-:-~. .,~.'o .
1:10,000PULP MILLEFFLUENTSAMPLE 3• CONTROL C-4• OYSTER 3-1o OYSTER 3-1
,., :c{. .fJ." ,.P......\ "X \ ....:.. ''o..:V ~;q
... " ' 0'" l/ " ....,"d\. 'O• ..lo, " \ I ,'b-
\: \~ 'tI ,1:10.000 ,
PULP MILL "-EFFLUENTSAMPLE II• CONTROL C-17-1• OYSTER 17-1o OYSTER 17-1
1:5000PULP MILL'EFFLUENTSAMPLE I ,• :CONTROL 'C-14-"• OYSTER 14-1'o OYSTER 14-1 -
14
- II
. II
•4
, \
" \, \
Il.',.'"'.
\ ~··o~. JI'\...~:\i
•~ ,
: \~.., 1\ /'.! ~ : .~... '
! 1~5000 \!PULP MILL i :~
.0 EFFLUENT :: \, .... SAMPLE 11/$ :
\1 • CONTROL C-19-1 \
::~~:~~: :::~ \b·o
,,'.R,\ ,'P
) ,1/ \.'.:,/.." r .,
, b-•••",-:{ l:i.1:5000.
PULP MILLEFFLUENTSAMPLE 17 •• ,CONTROL 1;-25-1• OYSTER 15-'o 'OYSTER 15-2
I 4 I • ~ ~ ~ 0 2 4 I III. ·18 10 II 14 21 30
TIME IN OAYS
FIGUB.E H.-Effect of pulp-mill effluent OIl the time the oysters remain 0P~Il. Concentrations:. 1 : 10,000 and 1 : 5,000.
736813-41--6

FISHE·RY BULLETIN OF THE FISH AND WILDLIFE' SE"RYICE
12
•4
1:4000PULP "MILLEFFLUENTSAMPLE S
• CONTROL C-5• OYSTER 4'1o OYSTER 4-2
~-_/..~.Q... ...·... - ...1.. ....~~ !'.....~... : \ :.'<-S
\ I \, !'"~~; \ ~:~~~~N~
... ; ., • CONTROL C-I\ \] • OYSTER 4-1
g 0 OYSTER 4-4
14
20..12
•4
'1:2000PULP MILLEFFLUENTSAMPLE 4
• CONTROL C"I"2• OYSTER .-1o OYSTER ."4
~~..
•••T;r.... ),": ••• 0... ••
. ~ ... '. "'0'. •, ,1:2000 -, I
PULP MILL " . " _EFFLUENT .\.-....SAMPLE 4
• CONTROL C-I-I• OYSTER I-Io OYSTER .-2
1:100'0 ....'tJ...
PULP MILLEFFLUENTSAMPLE 51
• CONTROL 104-Co OYSTER 104
O'•••"fi•
--q, ....."t', It
" ~.,' \ ~1:1000 , "j • • 1\ r
PULP' MILL ,. ,". I f,: I .'
EFFLUENT ',I .~ \" '.., .,..SAMPLE II ~ ... I 'II / !' ., / ' .
• CONTROL C-NH \1/'" ... / ! \ i,!....• OYSTER 1.-1 a.\ ~/.A f·o OYSTER 18-2 '0" ~. \1 :
~~p• ' •• 'C>..~".-<>' \. ~.
\ " :\'. :
1:1000 ,Q. !PULP MILL' '. _._ .., !.EFFLUENT ., ':SAMPLE • 'e' '(
• CONTROL C'12-2 1>.•••0'.,.0 "
• OYSTER 12"1 •o OYSTER 12"44
4
•
•
12
III
..
14
20
10
z
~:~:. '\ . f1.'1 \~.~ -I . PU~I~O:ILL• :12 ,. I '... ~ , i r, EFFLUENT.. .;. t i ,".SAMPLE I
• \ I:' • CONTROL C-S.. \. 'f': •OYSTER 2-S
: 4 \·A: oOYSTER.2-4
o .: ':z 14t-=-7'"'--=----1'--....lI.""'O::--..J...-----+--:o-~.:;.-:.,..J...---.-.-...------I'---~~ ~ / .,- _-~.:-~-.......~.. ,r
.\,L~ ~. V ~ --:'v"" \.~'IilO~.... • . •
\'~ "A ,Ii 1:1000 1:1000 \, .Q /\•••
i ,rf'· ... ' PULP MILL PULP .MILL\ ~ f f \ /',' EFFLUEN~ EFFLUENT 'j,'. ~ f ~ ! I SAMPLE I SAMPLE •'. • I ,., ! r • CONTROL C"I • CONTROL C"12-1\ f~: ~ii .. • OYSTER 2"1 • OYSTER 12-1'if \: .~' 0 'OYSTER 2-2 0 OYSTER 12-2
"
Concentrations:
0'....-'::2-..J-4:--'::.:----:.:--;;10:---:1I;;-L-':':14:--.L--.--;;:2---~4:-..-.I.'::.:----:.:---;;10:;---:12;:--':':I4:-...uTIME IN DAYS'
FIGURE 4S.-Effect of pulp-mill effluent on the time the oysters remain open.1-: 4,000, 1 : 2,000, and 1 : 1,000.

EFFECT OF PULP.MII:.L \-VAS'rES ON YORK RIVER OY.STERS ij9
1:400PULP M"ILLEFFLUENTSAMPLE 5
• CONTROL H• OYSTER 5-4o OYSTER 5-5
1:400PULP MILLEFFLUENT'SAMPLE 5• CONTROL 5-5• OYSTER 5-1o OYSTER 5-2
4
II
:r=~-,.-(J"--::A~==-----,-/-::'Q:-\-.,-.-----,-,.-::~:-..-.-,-.-~-"\-~-----A-n
---,_-_-----'~
-;-' \" _ ":'0-...0 '01, rl'''.''''\~~~/\~,,\ l , '"' ~. \ \ ,,)".•.0,\': I roo \ It '" to...,,1>-,.<1 ' " "'b \ '. I" ,. b ,~ , t
'. ,.... ~ ....... ai" ~ t...........,' 41 tf····() \ :
"'- f t "~ ~ #
~ .
14
CI-4ce-5C8-6
II10
1:100PULP MILLEFFLUENT
·SAMPLE 5• CONTROL• ·OYSTERo OYSTER
864
• • • • • • • • • I.
Iil..~......
\~ "II ,\. \" ,.....\~ '\ '1:400
" '., I PULP MILL
'., r .. ~: ""I ,~~~~~~N~
\!~tv :miT:'rr~~-.~- -'-'~/.~'\. Vi -'\........ ~' ... \. .11 . \
• \"~ .,.. .....\ :f" .•'? \ '~" ' .1 1:200: " .. !.... \ / i PULP MILL\ • I' "~ .' /' EFFLUENT'\! "''0••, SAMPLE 5: i • CONTROL Co.\ I • OYSTER ~I\ i 0 OYSTER I-I!. i '
,~\~~.\~.\ ,
, ' \... • $>... ." .~1t.::i:'.,"\ ,/ r··., "" I:I!OO~: PULP MILLl. I EFFLUENT.. ' I SAMPLE 4
\ , • CONTROL C-\: • OYSTER 8-5
• 0 OYSTER 1-4
II
1:10PULP MILLEFFLUENTSAMPLE 6• CONTROL C~IS-I• OYSTER IS-Io OYSTER IS-I
10'
1:200PULP MILLEFFLUENT
_ SAMPLE 5CONTROl C8-5
• OYSTER C8-1o OYS TER C8-1
1,",.
'. /1 I:I!OO" .,... PULP MILLt,-' EFFLUENT, SAMPLE 5
• CONTROL C-I!• OYSTER 1-5o OYSTER 1-4
8
~\hw
1:400 \tt !\PULP MILL .. \' ,,!.. ,.EFFLUENT \\ .. \ \ "'SAMPLE 4 \., f.... /• CONTROL C-7-1 \'1 ,/' •••~•••• OYSTER 7-1 /1' 0."'-0".0
o OYSTER 7-1! .
~'~ ".~~~\'-':i':~,\ ./. \ . .'\: 1\ , .'0 It:V'I \• \ : r""I : - '.',
.t i II"'"\ \ j~ \b""J~\ : I ~'~ \ I
~A
)'\
• i, ,\I, , t., ''N'!\" : III" ~
4
•
16
II
20
14 ITIME III DAYS
FIGURE 49.-Effect of pulp-mill effluent on the ti'lle the oysters remain open. Concentration.:, 1 : 400, 1 : 200, 1 : 100, and 1 : 10.
M
20
16
12
8
4
~
eM..c lOIIIL 16
zIII II!
,L
08
'"c 4'"0z
M
eo
1
II!
8
4

FISHERY BULLETINOF THE FISH ·AND WILDLIFE SERVICE
collected at different times' from' the same seweroutlet, did not remain constant but was subjectto change, associated with variations in the deg~ee
of dilution of the effluent, and changes in its charac:'tel'. The latter depended on conditions within :themill and also were associated with different stagesof the 'manufacturing process. As these changesoccurred suddenly and frequently, .the time of flowof an effluent having a particular specific gravity,color, and other characteristic was of brief duration.For this reason the material used-for ~est.ing consistedalways of composite samples of the :effluent collectedat IS-minute interval~ over a period of S hours.
Experiments reported later (pp. 159-163), sho\\edchanges in the physiological effectiveness of theefHuents after storage and oxidation and aftervaried forms of treatment. There is.no doubt, therefore, that the effectiveness of the effl~ent used in theexperiments on the shell movements 'of oysters varieddepending on its specific gravity, chemical composition, and age. Because the chemical nature of t!"tephysiologically active component of the effluent was.unknown, it was decided not to.adjust the effluentto an arbitrary specific gra'vity by evaporation. Suchan adjustm~nt, it was thought, might have producedchanges in the effectiveness which would invalidatethe tests. The various concentrations used in' theexperiments, were prepared from the compositesamples of effluent regardless of their speci'fic gravity.There is no doubt that fluctuations ,in the romposition of the efHuent to a certain extent were respon:.sible for thf; variability in the results, especially inthe exper-iments in which low concentrations of theeffluent were used, It is our opinion, howev'er, thatdespite this .variability, the experiments clearly showthat the presence of the effluent in the river water.calis~s the ~eduction in the number of hours theoyster remains open.
Laboratory experience shows, however, "that in asample of an oyster population several oysters arealways present which, when placed in water and adjusted to the new environment, 'remain open for amuch shorter period' of time than the others. Because of this situation single te.sts are of little significance. It is necessary to have a large number ofobservations and 111ake cOlr-pa~ison between themeans computed for each series of tests. A glancethrough table 45, shows· that the daily mean numberof hours the control oyster remained ',open underdifferent temperature and salinity ranges variedfrom 18.7 to 24.0, Analyses of individual recordsmad~Jor each day separately shows that occasionallysome 'were open only from 12 to 15 hours per daybut, in the majority of cases, the oysters.stayed openfrom 21 to 24- ,hours a, day. It can' be noticed easilythat. the addition of p-iJlp-mill effluent. reduces thenumber of hours open as the concentration of theeffluent is increased. This negative c~rrelation isapparent fr9m examination of table 46 showip.g thefrequency distribution of the number of hours openin various concentrations. Vertical columns givethe' total number of days the oysters were open forthe specified number of hours indicated in the firstcolumn. The totals given at the bottom of thetable cannot be used for direct comparison becau~e
..the number of days for which the muscular activitywas recorded in the controls and for the two lowestconcentrations (l: 10,000 and 1: 5,000) were muchgreater than for other dilutions of the effluent. Experiments with the lower concentrations were continued for longer periods of time with the expectationthat an adverse effect of a pollutant may be cumulative and would become'apparent only after a prolonged exposure. On the other hand, in the tests withhigher concentrat;ions (l: 100 and 1: 10), pronouncedtoxic actio.n was noticeable in a few days. In several
TABLE 46.-F~~quetlcydistribution of" 1l0u~s open" in rJa~ious cOllctnt~atiollsof pollutant
Figures in the boar of the table indicate the number of days during Wilich 'oysters remained open for a number of hours shown in the first column. Total number ofoysters used: in controls (0 concentration)-24: in tests--49. Duration 01 the'experiments Irom 6 to 30 days; lor details see table ~51
. Concerit~ations of p~lIutant in sea waterHours open
11
1/10
---------i.226
14'
1/1004 2 _5· _
20 1 _
17 1II 17 22 36 4
1/2001/4.000 1/2,000 1/1,00<) 1/400---~---
31 8 15 45 9 10 93 19 9 12I I 11 102 3 14 6
--------2- --_.------ 9 9-------.-- 4 2
---------- ---------- 7 ---------.
44 40 I 79 l 521I
51189552I2
93115 I261
b
TotaL. ' _
1/10.0<10 1/5,000----------.:....----- ---- ---- ----·1------'-1-----

EFFECT OF PULP-MILL WASTES ON YORK RIVER OYSTERS
cases, oysters used in" the latter experiments weredead or dying by the end of the experiment. Theexperiments with the dilutions of pulp-mill effluentthought likely to occur in the York R.iver wereperform.ed on a' greater number of oysters: and forlonger peri.ods of' time than those with strOngerconcentrat\ons. "
Summary of observations of- the time the oysterswere open·in various concentrations of the effluentare given ifl figures 47 to 49, while temperature andsalinity data; referring to these experiments, togetherwith the specific gra~.ity of the samples of pulp-milleffiuent can·be found in table 45 .. In the concentration of 1 : 10,000 no significant reduction in the hoursopen was noticed by the end of the tes:t lasting 30days (fig. 47) and the shell movements of the oystersremained normal. Tn oysters 3-1 and 3-2, slightreduction in hours open occurred on the twenty-fifthday and continued for 4- days. It was, however, of "temporary .na~ure. \Ve may infer from these datathat a continuous .exposure to the concentri;ltion1 : 10,000 lastillg for one month produces no noticeable effect in the number of hours the oysters remain. " .open. "It is, of course, possible that an adverseeffect may become apparent later; but because ofthe lack of space in the temporary laboratory atYorktown, it was impractical to prolong a singleexperiment beyond the 31-day period.
Of the six oysters usC';d 'in the tests with the.concentration of 1 : 5,000, two oysters expos~d for25 days w~re not affected by the pollutant; in threeoysters the mean number of hours open during an11-day period was slightly reduced, namely from21.7 and 21.3 in the controls to 19.1 and 19.8 inthe experiments, and one oyster was open only 13.1hours as compared with 21.3 hours for the control.It is reasonable to assume that the toxicity of theeffluent, sample 6, used in treating the first p~ir ofoysters was. less than that of samples 11 and 17 usedin the other "tests, because the specific gravity ofsample 6 was only 1.0012 as compared with 1.0039'and 1.0053- of samples 11 and 17, respectively.
With the increase of concentration to 1: 1,000(fig. 48), the effe~t of the effiuent is apparent within1 or 2 days after the beginning of the t.est, andbecomes more and more pronounced as the concentration increases.
Variability in the results of the test can be attrib~
uted chiefly to" the changes in the toxicity dJ.!e· tothe dilution of the effluent by wash water and itsdegree of o~idation. Despite these" conditions, the
general tendency of the oyster to redu~e the numberof hours open as the concentration in~reases is quiteclear. '.
High concentrations varying from 1: 400 to 1 : 10have a mpre pronounced effect as can be easily seenfrom the examiriation of figure 49. In the case ofthe latter concentration (see loweddt of figure) rapidincrease in the hours open recorded after the fourthday of exposure was due to the pa,ralysis of theadductor muscle.
Relationship between the number of hours theoysters are closed and the concentration of theeffiuent can be seen clearly by plotting the meannumber of hours the oysters stay closed against thelog of concentnition of the effluent. In making·thisplotting, the mean values were computed' for eachconcentration us~d in the experiments listed in table45. The values of means with their "standard deviation and standard errors are given in table 47. Forconvenience in plotting, ,the concentrations are expressed in parts per 10 liters. The line was fitted byinspection. As can be seen from figure SO, there isa definite relation between the number of hoursclosed a!ld log-concentration. As the plot 6f (:~,
log y) approximates a straight line, the set of the'experimental data may be represented by _an expo-
"nential equation of the form of y=aebx• Constants"Q and b, determined by the method of averages, a,reas follows: a=0."~814 and b=0.4234. The numerica,l value of e is, of course, 2.718. Thus, the equationrepresenting the ~ean number of hours the YorkRiver oysters remained closed in a given concentration of the effluent can be written in the followi"ngform:
log 1'+0.5504-x= -._--....-;;=--.0.1839
TABLE 47.-M,al! va/un oj hours open (111) and c/o_'ed (M 1) illvarious cOlleen/ril/iolls oj pulp-mill eJfluent
(N=number of O)'stC'rB under observations. N'=number of oyster-days, x=numher of hours closed computed from equation y=ath when J'=is concentrationin parts per 10 liters. a~.0.2814,. b=0.4,234" b.=dilference between the "bservedand computed values. a=standard deviation of hours open, S.E.=standarderror]
Concentrati".n in M " " S.E. M I INN I • Aparts pe, 10 hte.. ::I::
--------------------------1,0011. __________ 5 ------ -------- 19.U 2 11 19. .I -0.3100_____________
R5 ------ -------- 15.5 2 14, 1.1.9 +1.650______________12.8 2. -1-0 0.85 11.2 8 12 12.2 -·1.025 ______________ 13.7" .,2.52 0.89 10..1 8 52 10.6 +0. .110______________13.5 .1.89 1.17 10.5 11 7Q 9.0 "~~O~5_: _____________ 17.9 ' 1. 29 0."65 6.\ 4, 40 6.82.5 _____________ 20.5 " 3. 15 I. 57 3.5 4 44, 5.2 -1.72.0_____________19.2 : I. 63 0.67 4.8 6 ?I 4.6 +0.21.0_____________ 20.9 2.06 I. 03 3. I 4 II.I .1.0 +0.1U_______________2\.3 I. 29 0.26 2.7 25 261 ------
== ... ._--- -_.

l'ISHERY BULLETIN,OF THE FISH AND WILDLIFE SE'RVj'CE
TABLE 48.:.c,..Ej[fCls oj paper-mill al/d oj sl,;dgc-po,ld dfluel/I 011 the liitle Ihe oyslers rmlail/- OPfl/
H~u n rer day open
Concentration ofeffluent .
O)'oterNo.
Contrd Expt?rimental
D:ttcs of tcst (inclusive) \Valer tem"geraturer:tnge C.
Salinit}, rangeparts per thousand
~~er-mill r.mll~ntl------ ----- -----~----------.--------------------'----
I : 200 __________ J 8-1 19.9 12.2 }J uly 29 to Au~. 6, 1936________ 20.S '027.1-- _____ 20.43 to 21.62 _______ SA July 14,19.16\ 8-2 19.9 14.7 ----------J
22-1 21.1 22.2 tMar. 24 ,n Apr. 3. 19,17 ___'_____ 6.5 '0'11.1.,. _____ 9.85 to 13.7.1._______ 13 Mar. 12,19.171
: 500 __________ 22-2 22.1 22.2 --Tiiiiij-I 10.1 20.8 19.4
PUll" IS 10271957. _____________ -- ----- --- -- ---- --- _. -_ .. -- ---- ----. ---- 52 June 3, 1937
I 20-1 2J .1 21.7 }l\br. 10 '0 19; 1~37_______'. ____ 5.~ to 9.8____ : ____ 16.20 to 17.29_______ 12 1.0018 Feb. 25.1937I : 1.000.. _______ 20-2 22 I 21.7I 101 22,1 22.3 June 3 to 10, 1938_____________ -------- --- -- -- --- ._ .... -._._--_ .. -._- 49 1.0049 May 31. 1938
Sindge-pondeffluent
I : 500 __________105 17.2 18.3 June 18 to 22,1938 __ ._,----.----- . ----------------- -----_. ---_. -_ .. - .. - 53 -------.--. June 13.1938
a.o
2.5zo
!; 2,0or:..z...li: 1.5ooC!I 1,0o-'
0.5
o 10 15 20HOURS CLOSED
FIGURE Sa.-Relation between the hoursthe oysters' are closed and log con
, ceiltration of pulp-mill effluent discharged into York River.
The, reliability of the equation' can be judged bycomparing the observ'ed and the computed valueof.\" in table 47.
Physico-chemical basis of the equation cannot beevaluated at present because of the lack of under:stan'ding of the chemical nature of the physiologically active component of the pulp-mill effluent andof its effect on the neuromuscular syste~ of theoyster. The type of the expo'nential equationsl\ggests, however, that probably' the mass law isinvolvt:d and the reactions responsible for the pro~
longed contraction of the adductor muscle depend on'the effective concentration of. the reacting materials.
Physiological effect of the pulp-mill effluent isshov.vn also on the type of muscular activity of theoysters.' There was a marked change in the shellmovements of oysters subjected to' solutions containing 'pulp-mill wastes' in ~(lnc;:c::ntriltil)!1s of 1 : 1,000
or stronge~. Irritating effect of the effluent wascharacterized by rapid and frequent shell closuresat the time the effiuent was addel Th~se' changesare clearly noticeable on the' kymograph records reproduced in figure 45C.
The periods of high activity were followed by longperiods. in which the oysters remained tightly closed.In the stronger concentrations, the periods of closurebecame less frequent and as the adductor muscleweakened,·the oysters were unable to hold the valvestogether for any length of tin}e. In a conceiltrationof i: 10 the amplitude of the movement of the adductor muscle, during the brief periods of attemptsto close the sheil; became less and less, and finally
.__ the shell remained open alid the oyster died (fig.46J and K). Under the conditions of the experiment, death of the 'oysters occurred only 'in con'centrations in 1: 10., In comparison with the pulp-mill waste, the paper'mill effluent is much less toxic. Tests performed'with the latter show that -its eff~ct becomes notice:able only i,n the concentration of 1:200 (table 48).
, Only one experiment was performed with the effluentfrom the sludge pond.. No effect was observed in thedilution of sludg~ water at 1 : 500 (fig., 51).
EFFECT OF PULP- AND. PAPER-MILL EFFLUENTSON THE WATER FILTRATiON OF OYSTERS
Pumping of water by the oyster for feeding andrespiration is dependent on the combined -activitiesof the ciliated epithelium of the gills, the adductormuscle, and .the mantle. The cilia,ted lining of thegills provides a mechanical force which drives thewater through a system of water pores and tubes,\','hereas the contractions 'of the adductor muscleand the mantle control the':flow of water by regulating the' open'ing and closing 'of the mantle chamber

EFFECT OF PULP-MILL WASTES ON YORK lOVER OYSTERS
24 '~:"'o'~_~ /\ .~ ~.:o..~
20 . ,''0
16
12
8
4
tlOOOPAP.Eft. MILLEFfLUENT
.SAMPLE 4.• aONTROL 101-0'.0 OYSTER 101
1:100SLUDGE POND
EFFLUENTSAMPLE 53• aONTROL los-ao OYSTER 105
. 1:1000PAPER MILLEFFLUENT
SAMPLE II• aONTROL 0-10-1• OYSTER 10-1° OYSTER 10-1.
1:500PAPER MILLEFFLUENT .
SAMPLE III• aONTROL 0-11-1• OYSTER 12-1o OYSTER 11-1
r.SOOPAPER MILLEFFLUENT
SAMPLE SI• CONTROL lOll-ao OYST-ER lOll
4
8
12
z... II
'"o 8
...eMo
",20... "'18
~. 1\'.'--\~• '0,. ...... , I '.. "'0 " I I ....-........
'. \ .9·J.o...' 0 .Q• " ! I .-o·"\" ···.0···... 1:200\ ", j' \ .~.., \ PAPER MILL\ \, :'- I V'" .'. EFFLUENT
\ 0 ; • a~~~~~~ ~~8-1\ I • OYSTER· 8"1\ I 0 OYSTER S-I\ I
I.0~""-:1~~4:-----!:8~~8--'--=10:--'-.L.1=1-a,;~1!=4;"'.L.-L........~I:-L-'.~4:-'-!:.'~~8--'--=1O:--'--=12"""'.L.14~~
TIME IN DAYS .
FIGURE 51.-Effect of"paper-mill and ~Iudge-pond effluents on the time the oysters remain open.. , .
. .to provid'e for a greater or lesser 'access of the outsidewater t;" the gills~ To obtain a clear understandingof the functions of these organs in the preseqce ofthe poll~ta'nt, three sets of experiments wereconducted.
The effect of various concentrations.6f the pulpmill effluents on the ciliated epithelium 'of the gillwas studied by using the two methods previousl ydeveloped by Galtsoff (1928, 1935) generally knownas the carmine-cone method and the drop-countingmethod. ' For a study of the 'effect of pollutaIj.ts onthe. entire feeding mechanism of· the oyster a combination of Nelson's apron method (Nelson 1936)and Galtsoff's constant-level tank (1928), einployedin the drop-counting method, was used. In' theapron m~thodcontinuous records of the' pumpingof the watel' by the intact oyster were obtained forp~riods lasting from .several days to about a fortnight.
Experiments Using the Carmine-Cone MethQ.d
NorIlla,l adult oysters, collected' from the' vicinityof the laboratory, usually from the lower York River,
were employed. They'were bFought to the labora~
tory in lots of a half to 1 bushel'as needed' and stored·in a tank of flowing laboratory sea water.
On the morning of testing, oysters were selected-from the stock supply, and the valves .carefully.pried ajar' without injuring the adductor muscleand a small glass rod inserted. The valves werethen ~ired to prevent any further' opening. Asmall rubber tube was then inserted into the Cloacaand 'the remaining space berween the valves on theexcurrent side filled 'with wet cotton.' After removing any air bubbles trapped in the. valves andtube by means of a bulb pipt;,tte, the oy"ster wasplaced in an enamelware tray conta~niilg 8 liters ofsea water. A stream -of bubbles passing througha tube in the tray ~irculated the water.. The rubbertube was then ~onnected to one arm of a glass ".i"tube onto which had been attached a glass tubemarked with two marks 15 centimeters apart. Theupright arm :of" the ".i" tube was· connected. to a_small thistle tube containing a light carmine suspension held in tne tube by' a ':Day's pi~chcock.damp. By releasing a small amount of carmine by

144 FISHERY BULLETIN OF,THE FISH AND WILDLIFE'SERVICE
slight pressure on the claillp-"the sU5penslO1~ joiningthe water being pumped by the oyster formed ared cone, the tip of which was timed by a stop watchas it pass,ed between the two marb. ,
After allowing the oyster ti111e to recover fromshock, the rate of pumping in plain sea water wasde,termined, 10 readings in succession being averaged.Usually,ol)e investigator could test three oyste'rs,two experimental. and- one control. After readingsat half-hl)ur intervals had shown the oyster to bepumping at a regular rate, the test solution wasadded from a pipette in an amount sufficient tobring the concentration to the desired strength. Anelectric "stirrer was then turned on for 10 minutes.Using this technique two sets of experiments wereperformed. In the first series of tests, the concentration of the effiue'nt was gr:~d~ally increased andreadings were made 15 minutes after each additionof effluent. In the second series, oysters were keptfor several hours in a given concentration of effluent:during the first 2 hours readings were made everyhalf hour, then at greater inter~als.
In th'e tests which were conducted in the slImn{erof i936, oysters were subjected to gradually increasing concentrations of a composit~ sample of effluenttaken from sewers] and H. The specific gravityof sample No.3 .was1.00285. To eliminate variations of salinity and temperature in anyone experiment, the tests wer~'designed to be completed withina 24-hour period. -In no experiment did the temperature vary' more ,than 2" C. lVloreover, there was noappreciable-change in salinity in any experimentsexcept in those where the concentration of effluentexceeded 30 parts per thousand and the sea waterwas noticeably diluted by the pollutant. Thehydrogen-ion concentration was taken into consideration. Significant increase in pH varying fr~:ml Q.3 to
'0.4 occurred only when the concentration of theeffluent reached 30 parts per thousand and above.
Each experiment was adequately control1ed, i. e.,control was observed simultaneously with two experimental oysters: The percentage of the depression w.as computed by considering as 100 percentthe rate cif flow of each test oyster before the additionof the effluent. The controls served as a checkagainst, any possible decre~se in the ra'te' of flowresulting from fatigue, changes in temperature, andother factors. Since there was no actual distinctionin the cont~ols between the p~riods,before',andduringtreatm'ep.t, ,separation 'has tC2 ,~~ ~f~~ arbitrarily
on a time basis. One -hour p'riar to treatment, atleas"t two series of readings were n~.ade at 3D-minuteintervals; A similar number of readings was madeat the end of each test period which, on differentoccasions, varied from 5 to 26 hours. Ari.inspectionof the rat:es of flow of the controls showed that 12out of 13 oysters increased their, r'ate of pumpingduring the te~t period. This indi~ated that anydepressive effect observed in the' test oyster couldnot be attributed to the condition 6f the experimentand was due to the presence, of pollutant. The pulpmill effluent -was " added in gradually increasing
.amounts that resulted in, the following concentr!l-tions: 5, 10, 20, 30, 40, and 50, parts, per thousand.The results, computed alpneans of all the observa-
,tions for a given concentration; are presented infigure 52. They show a definite relationship between the increase in the concentration of t,he pulpmill efRuent and its physiological effect on ciliatedepithe\.ium. Using the same technique, numeroustests were made in 1937 and 1938 with differentsample~ of pulp-mill and paper-mill effluents. Theresults of some of these experil';;"ents, presented infigure ,53, show considerable variation i~ the physiological effectiveness of various samples, a fact already
. noticed in other tests (pp. 137-:140). if, however,the same. sample of the pollutant was used to test
::I::>:::;100..----------------,...~
\ iL...~ 80:;:~u...0 60......;;0:u0(... 040ozQ
~~ 20e;Q
....zl:l~ 0 CO:?CEN1RA1~ON IN PAR~~' PER THO~SAND 50
FIGURE 52.-Effect of increased ,concentration .9fPillp-ni.ill effiueilt (sample 3. specific ,gravity1.00285) in depressing the activity of the ciliatedepithelium of the' gill measured as a velocity ofthe ,cloacal current. Carmine-cone method.'E'ach point repre~ents mean. of observations onnine oysters. Samples collect~d May II. 1936.Tests performed between MaY,14 and 20, 1936.,
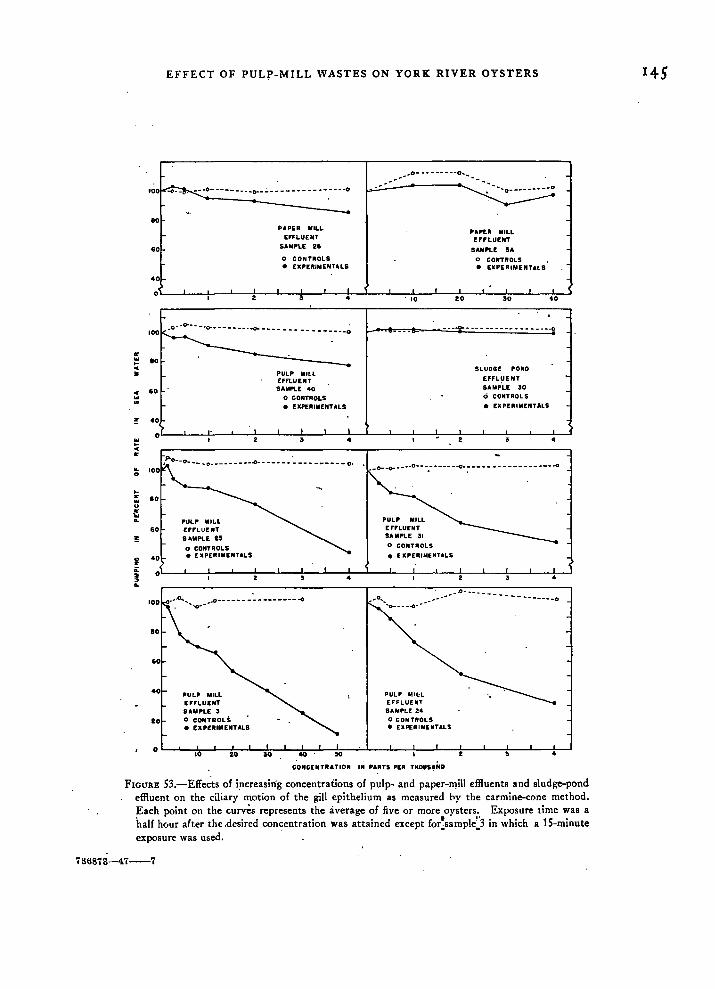
EFFECT OF PULr-MILL WASTES ON YORK RIVER OYSTERS 145
..........0--.----- ...0.......
.. -.o------ ...o-_~_ .. __ .. _ ....... -- "'·"0
80
60
'APEIf: MILL.EFFLUENT
SAMPLE 26
o CONTROLS• EXPERIMENTALS
PAPE.R MILLEFFLUENT
SAMPLE 5A
o CONTROLS• EXPERIMENTAL5
.0
OL-...L---!--L--+----L---l3f--.L..-~.!---l--L--. .l,O--L--Z::l0=--L--.J3LO--l.----'.LO-.:l
SLUDGE POND
EFFLUENTSAMPLE 30o CONTROLS
• EXPERIMENTALS
.. __ ••0- -_ .. -- -- - ~ "'.0
....PULP MILLEFFLUENTSAMPLE 40
o CONTROLS• EXPERIMENTALS
80 .:..
.. 100~.----------_••~
= eo ...•
! 40
Ol-_L.._.JI:-__'_-!:_----L_~-...L-..:.L....L-...L-...L-.l::----!----L--.J"---'-----l--:J
..~.o- ~-~ ~--- -------0
•
PULP MIL:L[FFLUENTSAMPLE 24
o CONTROLS• EXPERIMENTALS
PULP MILLE 'FLUENTSAMPLE 51
o CONTJlOLS
• E XPERIMENTALS
•
PULP MILLE'FLUENTSAMPLE 3o CONTROLS• EXPERIMENTALS
.... .0......... "0........0--- -_ .... - -- _... ------0
,P.O--o. __ .. 0- - JJ -- - _ _ .. - _ o .
80
20
.0
l;;80..
u
~.. PULP lULL80 EFFLUENT
!! SAMPLE 25
o CONTROLS
i .0 • EXPERIMENTAL'
i:0..
"..
..o
~....
o L..-J'-...,1:!:0:_...L----:2~0:_.L.-=30L:--l.-~40I:--.L-~50=---''-oI.--I-_~-...L-~:_-L---:!3---'-.L..-+.....J
CONCENTRATION IN PARTS PIER TH~So!'ND
FIGURE 53.-Effects of increasing concentrations of pulp- and paper-mill effluents and sludg-e-pondeffluent on the ciliary motion of the gill epithelium as measured by the carmine-cone method.Each point on the curves represents the average of five or more oysters. Exposure time was ahalf hour after the .desired concentration was attained except for:sample) in which a I5-minuteexposure was used. .
7<16873-4.7--7

FISHERY BULLETIN OF THE FISH AND WILDLIFE SERVICE
its effectiveness In various concentrati0Il:s, therelation between the degree of depression of ther~lte of pumping and concentration followed the samegeneral trend shown i~ figure 52.
From the point of view of toxi~ological studies,the method in which.. the conce'ntration of toxicrilaterial is being gradually built up is open tocriticism becau~e under this c'onditic;>n the responseof the organism may result from proJonged exposure,to low concentration of a- physiologically active substance plus. the additional effect of stronger concentrations. On the other h,and, oysters locatednear the source of pollution are frequently subjectedto gradually increasing concentrations of pulp-milleffluent, which is being discharged at a greatly
variable rate. The laboratory tests to a certainex;tent reproduce these conditions.
The-results of. tests in which a given concentrationof the effiuent was kept constant are shown in figure54 which sum'marizes the observations' made withvaril;ms, samples of pulp- and paper-mill effiue~ts.
From the examination of the curves, it is appalient 'that physiologically active material, which depre~ses
ciliary activity 'of the gills, is present in varyingamounts in different samples. Thus, sample 5 :waseffective only in a relatively high concentration ofl: 100, samples 3 and 6 were effective in dilution of1 :200, and the effect of sam'ples 23 and 24 was verypronounced in rather low concentrations of 1:2;OCOand even 1:4,000. Details of these and other
110
PULp· MILLEfFLUENTSAMPLE I
.10 I.PERIMINTAL'4 CONTROLS
------- .....
",.................
" 1:200
4'
~::'~~~;:,='C',:_:-__:--::c-=---=-=::.-~-=--=--=-c:-=-=-c:-:=.:-:.::--=-==--=--=--=-=-~---""-;::_::_::_::_::-:_:-:_:::_::_:-:_~_::-_:_:_=-~-====::.:_::_:_-~-~-:~;IOO~~'\ ,
10 \ .............\ ..._-
70 \'.. \
~ Ie \.• 50 \ 1:100
..:: :so
4 . a • • • 10 II I. I. III' I. 'I' .. ...
GONTROLI---1:400
'.ULP MILLEFFLUENT
. SAMPLI '.10 EI,IRIIII.IITALIS CONTROL.
\
\: \......I ....,I .. 1:200L__ - ..
UIOO
",_TROLS
PULP MILLEFFLUENT
SAMPLE I
• EXPERIMENTALSa CONTROLS.0
!!
..: lie .!:~2.O".
.. 1OCl~-----------o Be "-
........ 1:100
~ ..z:: 7C
~ eo
4'ao
0,.......-l--l.--t-~4t--j.l--i:.-~7r----l.i-..,..f.-~0~---:f-~2-.-+I--::4i--i:--.~-i!--;!.:-, --!o.-oJ
o
PULP MILLEFFLUENT,.MPLE 14
EXPERIMENTALaCOlT lOll
•I
__-1.100CONTROLS
o• 0
PAPER MILL PAPER lULL ; ..,.. MILLEFFLUENT EFFLUENT .,'LUIN'
·SA"PLE .1 S~IIPLE " ••WLI U
4 EXPERIMENTALS • IXPERIMENTALI • IXPERI.UTALa2 CONTROLI oS a-ONTROlI • CONTROL.
o
CONTIllOLSL__, __.......;-,·~.IC:4000
\ '\ ,,"1=1000, ...IIII,I,\:........_ ...... 1.'00
PULP MILLEFFLUENT
SAMPLE 21
:J I.PIERIIiENTALSI GONTROLS
•o
EXPOSURI TIIiI IN HOUR.
FIGURE 54.-Effects of exposure to various concentrations of pulp- and paper-mill effluents on theciliary m,?tion of the gill epithelium as measured by the carmine-cone method. The plotted pointsrepresent the averages for the number of oysters indicated in each block of the graph. Duringeach test the concentration of effluent indicated on the graphs remained unchanged.

EFFECT OF PULP-MILL WASTES ON YORK RIVER OYSTERS 147
- '--;----
I~pt:cific Iconcentra-I Salinity, . . 0 • .." Sea water Solution
Sample No. gravl~Y at tion tested Date of lest parts per". \Vater temperature range. C. . pH pH. ' " 17.5 ' C. thou.and . '
-----------------------------------------------------------
I: 100
1:,2001:5001:1001:400I: 1001:2001:400
1:1,0001:5001:2,0001:4,~
1,500 -------ii:i7'.97.97.97.98.07.97.97.9
~~-:~~II
3. ____________ 1.0029 {5 _____________ 1.0013 I6 _____________
1.0016
23. ___________ 1.0035
U ____________1.0043 {
I U ___________ 1.0043
Pap.er-millemu~nt
{June 4,1936, July 27,1936
{May 28, 19.16May 25,1936May.26.1936Aug. 21,1936Aug. 17,1936Oct. '15,1936Oct. '20,1936Oct. 21,1936
fSept. 3,1937ISept. 8.1937Sept. 16,1937Sept. 24,1937Sept. 27,1937
{Sept. 29,1937Oct. 6,1937
jS.Pt.30,1937Oct. 1,1937Oct. 2,1937
1:1.000 Oct. 3,1937Oct. 4,1937Oct. 5,1937
I ., 000, fact. 7,1937.-, lOct. 8,1937
16:017.714.114.1IS .3
, 21.321.4
-----22T22.819.919.617.021.721.129<7
---'--2ii:82S.52S.725.725.5
17.6 to 19.2 .~ .________ 8.1 8.127.6 to 27.9 ._______ _ 7.8 _24.9 to 19.6___________________________________________________ 7,9 7.924.9 to 19.6 · • __ ._· '__________ 7.9 7.921.3 to 2.1.0 :_____________________________ 7.9 7.927.7 to 28.8 '_________________ 7.8 _27.3 t027.6 ,_______________ 7.8 7.821.5 to 21.9 • ' • ; __18.5 to 20.4. ·_______________________________________ 7.9 _
~~:~ ~~ ~g}:::::::~:::::::::::::::::::::::::::::::::::::::::: U -------8:123.2 t023.4 • __: ,__________ 7.9 ' 7.922.0 to 23.2___ ___ ____ __ ______ ___ _____ ___ _________ _ 8.1 _
~g:~ :~ ~~}:::::::::::::::::::-::::::::::::::::::::::::::::::: ~:t -------8:118.2 to 19.5 .. : :________________________________________ 8.023.9 to 24.8___________________________________________________ l;.119.0 to 20.4____________________ __ ____ __ _ 7.920.7 to 21.0___________________________________________________ 7.~
21.6 to 22.5 '_ __________ __ __ ____ ___ __ 7.922.3 to 22.8 .. ; ___ __ _ 7.922.6 to 23.0 .. ; _____ __ _________ 7.922.8 to 24.9____ __ ___ ___ __ __ __ __ __ ___ ____ _ 7.9
~~:t :~ ~~t::::::.:::::::::::::::::::::::::::::::::::::::::::: ~: ~
52 : 1.0013
'57 _
62 _
I Tests at Beaufort. N. C.
1:500
1:500
1:500
{June 14,1938June IS ,1938
{fune 16,1938une17,1938
I. unc 22,1938'[June 2.1,1938June U,I938
17.9 21.7 to 22.4 _18,6 22.6 to 23.5 : -, _18.9 21.2·to 22.2 ~ _, ~ •19.5 23.8 to·24.8 _18.5 24.0 to 24.6. _18.7 U.8 to 24.4 _18.3 25.3 10 26.4. : _
7-.9 7.98.0 8.07.9 8.08.0 7.97.9 7.9
~:g ------T9
',experiments in which fixed concentrations of pulp, and paper-mill effluents were used. are given in table'49. All samples of paper-mill effluent tested con. tained no physiologically active material.
"Analysis of the experimental data shows that with. the exception of high concentrations of 1 :100 and1 :200 the depression caused by a given concentrationof pollutant 'remains fairly constant for several hoursand does no~ increase with the duration of the test(fig. 54). The inference can be made that, under theconditions of these tests, there was no cumulativeeffect of the pollutant on the ciliary mechanism of theoyster. Neither was there any indication that oystersbecoine adapted to a given concentration and develop greater tolerance. This i.s of interest because. it has been s~own that, in chlorinated water, oysterseasily develop tolerance to relatively high_ concentrations of free chlorine (Galtsoff 1946).
.. ' In order to obtain a better understanding of the, relationship betwe~n the depressing effect of the
pulp-mill effluent .and its concentration and to avoidt~e difficulty caused by wide fluctuation ill the Spt;- ,cific gravity and toxicity of va,rious sa.mples, a series
of tests was made using one sample (No. 24) whichproved t'? be highly toxic. The sample was collected on September 19, 1937,'and was stored in wellstoppered bottles. Its specific gravity WilS 1.0043and the color of the liquid 'was dark brown. Inconducting the .tests, e!ich oyster was exposed only'onc'e'to a given concentration, in which it was keptfor one' and a half hours, and the velocity of the
, cloacal current measured at half-hour" intervals. Therate of pumping before the pollutant was added wasconsidered as representing the normal rate. Thus, theconqitions of these tests were entirely different fromthos~ of the experiments summarized in figure 52.Namely, each oyster was left in the pollutant forone and a'half hours instead of 15 minutes and wassubjected to Qnly one concentration instead of beingexposed ~o the cumulative effect of gradually in-creasing concentrations. ,
The results, expressed in percentages of thenormal rates of pumping, show a definite relationshipbetween the concentration of the sample and its depressing effect (table 50). This relationship approximates 'a straight line (fig. 55). A comparison with

FISHERY BULLETIN OF THE FISH AND WILDLIFE SERVICE
the results of other tests summarized in figure 52shows that the depressing effect of sample 24 wasmore than ten times greater than that of the s~mplesused in previous experiments.
of the pulp-mill effluent was divided into two portions and a series of bioassays was made simultaneously at Yorktown, Va., and a.t the United StatesFisheries laboratory at Beaufort, N. C. Details of.
TABLE SO.-Deprns;rm of the rale of filtratio/l callsed by pulp-millejJIuelll (sample 24)
--------,~-----'------'--_----!_._-
C.ollcentration, parts per Numher Percent- Standard de Percentageage of nor- •.•. - ofliter of O}"Sl:crs mal fate VI::Itlon. depression
[Specific gravity 1.00·B. Carmine-cone method. Figures express means of per~cenlages of normal'"rate. J·:i.tch oyster was exposed to one con'entration of theeffluent for 1~i hours. Three sets of readings wt"re nlade at hOtlf-holir intervals]
60z~<II<IIIIIIII: 40a-lii0
...z...u 20III:IIIa-
0'--"""'---'0="".5::---'--:''-=.0-----:'''-:.5---:2=-'.0=--.....
CONCENTRATION IN PARTS PER THOUSAND
FIGURE 55.-Percentage of depression in ciliary motion of the gillepithelium, as measured by the carmine-cone method, causedby various concentrations of pulp-mill effluent (sample 24,specific gravity 1.0043).
o0.8
10. ~22.263.5
9~~~ ---:j.~37±ii~87-~~.2 8.21±1.9077. ~ S. 83±1. 12>6.5 5. 65:l::1. 4(,·
2161~
21IS
It was though t that oy'sters in the .lower part ofYork Rivet, being exposed for a·long time to verylow concl;ntrations of pollutant, may have developeda certain degree of tolerance and become less sensitive to pulp-mill effluents than oysters living inunpolluted w,ater. To test this possibility sample 24
0 • _.25. _.5 .
I. O. __ • _2.0 • _.
____----- I: 4000
c..........C0:
ILo
..z...~40.....
---=~ --r:zooo-- ----- _ -1:2000""'-~-~- ,
-------- --1:1000
PULP MILL EFFLUENT
SAMPLE 24
TESTS AT TORKTOW-- TESTS U BEAUFORT
':500
..zi 20:>..
'-------- --1:500'
OL----'O'!;.5.------:l:o.O,..------:l:,5:-.-----:!2'::0-----;2~5.------:3!-:0:----1
EXPOSURE TIME IN HOURS
FIGllRE 56.-Co·mparison of the effects of time of exposure of various concentrations of pulpmill effluent on the rate of water filtration of oysters in tests carried on at Beaufort, N. c.,and at Yorktown, Va.. Tests were run at the same time at each locality and with the samesample of effluent. Two oysters and a control were observed for e.~.ch concentration.
EFFECT OF PULP-MILL WASTES ON YORK RIVER OYSTERS 149
the two sets' of experiments are given in table 49.As can be seen from figure 56, the be'havior of theoysters from Beaufort, that had not been in contactwith pulp-mill waste, was no different from thebehavior of the oysters from the lower part. of theYork River, which for several years might have beensubjected to very low concentrations of the pullutant.
From numerous observations with the carminecone method, we conclude that the presence of'pulp-mill effluent exerts a definit~ depressing action6n the ciliary epithelium of the gill and reduces itsefficiency, the reduction in rate being proportional.to the concentration of the physiologically activecomponents of the pollutant. . The effect is, hO\vever,temporary and the normal ra~e is restored soon after,fresh sea water is supplied the oyster. There is noevidence that several hours of exposure to the con- .centrations used in the tests produce irreparablechanges in the gill epithelium.
Experiments Using the Drop-Counting Method
This method (p. 133), differs. from that of thec'armine cone in two essential points. First, theoyster is kept in running sea water, which preventsthe accumulation of the products' of metabolismand, second, the rate of flow of the current producedby the gill epithelium is recorded automatically
. without disturbing the animal. It was' thereforepossible by using this method ~o obtain numerouSrecords of the activity of the oyster in natural seawater and in various concentrations of test materials.As in the experiments previouslY discussed on theeffects of tiver water of the upper York River onthe ciliary activity of oysters, the kymographrecords showing the number of drops of water discharged through the cloaca were- analyzed for eachto-second il].terval of the period of recording, which.usually lasted from 2 to 2X minutes.. The averagefigure thus obtained was multiplied by 60 to give.~he number of drops per minute. The temperature,pH, and salinity of- the sea water were observedduring -the periods of 'testing' and are recorded intable 51. Each experiment lasted from 4}' to 6'hours. In these experiments there was nQ recir;c~lation of the test material :as there· was i~ theexperiments desc~ibed on page 133 in which theamount of test material available was small.
Material for testing comprised 11 different samples~f pulp-mill effluent collected fi-om sewers] and II~nd one sample of the material draining from thesludge pond.· The results of the experiments ·are
presented graphically in figures 57, 58, 59, and' 60.They confirm the findings obtained with the carminecone method that the effluents arising from the pulping process depress the ciliary activity of the gillepithelium. The drop-counting records clearly showthat, in physiologically active solutions, the effectis immediate. As the water containing .!ptilp-milleffluent is turned on, the number of drops of waterdischarged through the gills decreases almost immediately. The normal rate is restored, howev'er, assoon as the delivery of the pollutant is ~topped.
This can be easily noticed in figures 57 to 60 inwhich 'the beginning and end of each treatment areindicated by vertical black arrows.
Recovery after treatment is complete and, inmany instances, the rate of pumping of waterthrough th~ gills after the removal of the effluent isgreater than it was before the tre~tment. We :mayconclude that the ciliated epithelium of the gillssuffers no irreparable damage due to the presence ofpulp-mill eijhie'nt, which apparently acts as a de-
" pressing or ~arcotizing agent. As soon as the latteris removed from the environment, normal functionof the ciliated epithelium of the gills is fully restored..
Effect of Pulp- and Paper-Mill Effluents on the. Rateof Pumping of Water by Intact Oysters (RubberApron Method)
The object of employing this method was, toobserve the effect of pulp- and paper-mill effluen'tson the Pllmping activity of'intact oysters exposedover long periods to' various concentrations of thepollutants. While the ,carmine-cone and drop-,counting methods are well adapted for the study ofone isolated mechanism of feeding, the rubber-aprontechnique is suitable for determinilig the combi,nedaction of all the mechanisms which control the rate'of water filtration by the oyster, namely, th~t of theciliated epithelium of the gills and their ostia, themantle, and' the adductor muscle.
By using a constant-level tank (Galtsoff 1928)sim~ltaneous records were obtained of the. wateroutput of experimental oysters subjected to. pulpand paper-mill effluents and of the control oysteridnunpolluted sea water. Nelson's method (Nelson1936). for pt~paring an oyster for such observationwas used with modifications. which permitted thegathering of continuous records of the rate of Pl!mping and the shell movements. A piece of rubberdam was patterned to forin a conical shape whenwrapped a·round an oyster, the cone leading away

. Fl.SHERY BULLETIN OF THE FISH AND WILDLI FE SERVICE
TABLE SI.-Ei!ect orpulp-m~lleffluellt (sewers] alld H) and sludge-polid effluellt of/lhe rate of discharge of wal" II/rough tke gills (drop-. COUIUj'lIg teclll/ique)
ISee figs. 58, 59, 60, and 611
Sampl. No.Sp.cific
gravitr at17.5· C.
Concentration Effect on rate of pumping Experiment
No.Date ITe~~~ra~ Salinity
.C. ·'00 pH
Pulp.milleffluent3 • , •
b •• • •
1'1_. __ • :._
1.00291.00121.0028 {
I :200 D.pre•••d • _. • '••• •• . 8c ~ .'.1:400 do • __ • ••.• .• ____ __ Be __ . •.1:200 __" do •• _. .• :. RF12 , ••1:500 _. __ .do ••• • ••. • RF ~ '. _
/936June 5Nov. 12Aug. 12Aug. IS
23.315.621. 421. 2
16.722.331.2
.36.9.
S.28.0
35 ____ • ___ •••• 1.0038 1:500
40 ____ • _______ 1.0040 1:500
42_••• __ • ___ .~ 1.0020 1:500
50. _____ •• ____ 1.0022 1:500
1:500
. 1:500
8.18.1 '8.0S.O8.18.18.08.08.07.97.97.97.98.08.18.18.18.18.18.17.97.97.97.97.9
8.08.1S,I8.1'8 1';8f8.1'8.17.87.87.9.7.9'7.97.9
19.4N.420.520.521.021.020.420.420.017.116.616.617.118.117.417.417.417.417.417.417.917.917.918.318.3
18'.6'14.616.,916.817.41S.2 ..17.2IS. 119.1IS.818.6IS.6IS .117.6
21.421.322.522.722.422.4 ,22.222.121.~
20.820.1 .20.220.622.524.124.222.922.822.822.922.422.222.225.625.6
24.2IS .016.1·IS .2IS .4IS .315.615.620.720.520,720.7
, 20.320.1
/937
(,,'," t¥£m::~:m:m ~::: ~~~:m::m:~ ::~ -:: :::,~~:: E::~:::~:: ~£ '!J D.pr••••d 7__ ._. •• No,-. 7
1: 2 ,000 C: :~~:::::::::::::::::::::::::::::::::::::::::::::: k:::::::::: ~~~: I ~
J
1:500, "__ do••• _. •• __ :. ••• : 17 • Dec. ,13J D.pr••••d, 19_ •• •• D.c. 14
I::::: f~ig~~~i~.~l~-~~~~~~~~~~~~~~~~·~~~~~~~~~m~~m~~~~~~ H~~~~~~~~~~~ -g~~'-;i-/938
25_ ••• ._ F.b. IS24 •• do _40 __ • Mar. 841 __ ••• do •42 Mar. 94.1. do _44 • Mar. 104S. • __ ~ do _46 • Mar. II74 •• Apr. 2072 • Apr. II ,73. __·• do. _75_. Apr. 2U90 June 691. Jun. 792 . do _93. __ • : Jun. 894 • ._ .do _95 .. . __ do. _96 •. • __ do _100.••. Jun. 14101. __ • do_. _102. do __112 Jun. 24113. do _
1.0014
1.0013
1.004.1
,1.0025
51. • _
63, _
H . __ .. .
'25_. ._
Sludll• ...:..pondeffluent
56 _ 1.0026 1:500
/938105 Jun. IS106 do••• __107 Jun. 17109 do _110•• June 21111.. do_ •• __
23.023.023.523.523.523.5
18.618.619.519.5
, 17.417.4
8.18.18.08.07.97.9
I T.s.. at 'Woods Hoi•.
from the out-current side. The rubber dam ,wascemented. tightly to the oyster with sufficieIJ,t 'slackat the posterior end to allow the valves to part freely'and without obstruction. Into this slack regionwas inserted a plug of cotton to 'prevent any water
.e~caping to the in-current side. The pyster, equippedin this manner, will; when .feeding, discharge allwater into the apron.
The' oyster was then placed in a constan.t-level'chamber and the end· of the rubber .cone, fir~1ly
attached t~- an outlet .trough about I~ 'inches' indiameter. The water pumped by the oyster wascollected and measured by. mea,ns of a dumping
vessel which,' automatically· discharged when thewater reached the d~sired level. Each dumping wasrecorded on 'a slow-motion kymograph. Full description of this method with detailed diagrams i.sgiven in ~he paper of Galtsoff (1946), Reaction ofOysters to Chlorination.. ' "
By using this method, ~he rate'of water filtration:'was measured in oysters kept in' various dilutionsof pulp-mill effluents for a period of time varyi;~g
from I.to 13 days. In each experiment two oysters~ere observed: one of them w~s kept in unpollut~d-water and served as a control, the other \yas placedin a known concentration of the pollutant which was

EFFECT. OF PULP-MILL WASTES ON YORK RIVER OYSTERS
6
1:2000PULP MILL
EFfLUEN·T 24EY,PER. 9
1:400PULP MILL
EFFLUENT 6EXPER. 13C
11000.PULP MILL
EFFLUENT 24EXPER, 15C
140
180
200
6
6
4
1"2000PULP MILL
EFFLUE~l 24EXP£R. 7
1·200PULP MILL
EFFLUENT 3EXPER. 8C
'"1060PULP MILL
EFfLUENT 24EXPER. 2
80
0:
2~ - t t.. 6 ..... 1·500..0 110 PULP MilL0: EFFLUENT 19c . EXPER. -RF8
4 6.
OBSERVATION TIME IN HOURS
FIGURE S7.-:-Effect of variou; saniplcs of pulp~mill effluent on the rate of. filtration of water by oyster gillsmeasured by the drop-counting method. Concentrations: 1:2;000; 1:1',000; 1:'SOO; 1:400,' and 1:200.
flowing through the' cham1?er at the same rate as theunpolluted water that was delivered to the control.Records of the temperature and' salinity of waterwere m:aintained. In every respeCt the control. and'
. test oysters received ide,?-tical treatment except "thatthe water supplied the control contained no pollutant.All of the oysters used were normal healthy specimensta~e'n, in most cases, from the lower Yo~k" River.
Before' the beginning of each" test, continuousrecbrd of the rate of pumping 'and <;>f muscular ~ovement of both oysters were obtained:' In the majorityof 'cases, this preliminary period 'lasted 2 or 3 days.'Only in one instance was the test started 24 hours
after the oyster was placed in 'the tank and in twoinstances the oysters were kept for *and 6 days'before the .pollutant was added. Numerous obser-.vations performed by Galt~off at the Woods Hoielaboratory in connection with a study of tp.e phys{.:ology of feeding show that oysters wrapped in ru~-'ber-dam ;1prons and kept in constant-level tanl,:'ssuffer no ill effects caused by their abnormal siuia-"ti<;m. U temperature and ·other· conditions of wat¢rremain unchanged; the rate of pumping procee,fsat a very constant rate. This can be seen also fromthe fact that by the end of the tests, some of whichlasted as long as a fortnight (fig. 62), the rate of

15 2 FISHERY BULLETIN OF THE FISij AND WILDLIFE SERVICE
O,L.......L.--!!-......-4-.l.-L-+....J
OBSERVATION
100.
II4
1'500 1,500 I· 500PULP MILL PULP MILL PULP MILL
EFFLUENT 40 EFFLUENT 40 EFFLUENT 40EXPER. 44 EXPER.45 EXPER.46
14
4 6 4 6 0 4 II
11500 I-SODPULP MILL PULP MILL
EFFLUENT 40 EFFLUENT 40EXPER. 41 220 EXPER. 43
1·500PULP MILL
EFFLUENT 40EXPER.42
6 4 6 6
1·500 1·500 1500.. PULP MILL PULP MILL PULP MILLEFFLUENT 35 EFFLUENT 35 EFFLUENT 40... EXPER. 25:::l EXPER.24 EXPER.40
Z
i'g:........ 140...0g:
6 0 0.. 6 6
12000PULP MILL
EFFLUENT 25
IBO EXPER. 13
160112000
140 140 PULP MILLEFFLUENT 25
120 120 EXPER.III
100 100
II 0 0 4 •I· 500 1·1000 11 1000
PULP MILL PULP MILL PULP MILLEFFLUENT 25 EFFLUENT 25 EFFLUENT 25
210EXPER. 17 'IBO EXPER. 19 EXPER.21
FIGURE 58:-Effect of various samples of pulp-mill eRluent on the rate or' filtration. of water by oyster gi1ls measured by the drop-counting method. Concentrations: I: 2,oooj.
1: 1,000j and 1:500.. .,

EFFECT OF PULP MILL WASTES ON YORK RIVER o.YSTER'S 153
'--ll.----!~....IL~-.L...,·.6!-..J 6
I· ~OOPULP MILL
EFFLUENT "42
EXPER./
1 f .oL....ll._L-....L....L
4L-....L--l"L-..J
160
200
220
'80
1·500PULP MILL
EFFLUENT 42EXPER. 72
O,L...JJL--'Z_....L......L..L---'--6.1----.J
OBSERVATION IN HOURS
'90
6
,. 500PULP MILL
EFFLUENT 42EX.PER. 74
F'IGVR~; 59.-Effect of various samples of pulp-mill effluent on the rate of filtration ofwater by o)'ster' gills measured by the drop-counting method. Concentration I: SOU.
736873-4';--7

'154 FISHERY BULLETIN OF THE FISH AND WII.DLlFE SERVICE
160
'·500SLUDGE PONDEFFLUENT 56
EXPER. III
160"~
140
4 6
I: 500SLUDGE PONDEFFl:UEN156. E.~PER. 10.6
I: ~OOPULP MILL
EFFLUENT 63()ePER 112
1,500SLUDGE PONDEFFLUENT 56
EXPER. 110
o
160
140 - t
oL-L-I-l2
160
'40
200
IS0r\, ~160" ""'d ~
200
1'500SLUDGE PONDEFFLUEN T 56"
EXPER 105
1·500SLUDGE PONDEFFL;UENT.56
EXPER. 109
20
180 -
140
180 -
'20
160
o 1--'-""2!--'-L~,-L-~
OBSERvATION TIME IN HOU~S
6
1,500SLUDGE PONDEFFLUENT 56
EXPER. 107160
4
~ 10
~'::(' - -, ~O: 16e,..~~ _~~~tMILL
IIE'",- EFFLUENT 63
: 160 t 1EXPER. 113
~ 0 4'0,IE'0"
FIGURl, 60.-Effect of various samples of -pulp-iliill and sludge-pond effiuents, on the", rate of filtration of water by oyster gills measured by c~np.ille-cone method. - Con
centra tion 1: 500,' ,
pumping of water"in the control oyster was approximately at the same level as at the 'beginning of theexperiment.
,Obviously, the larger oysters pump greateramounts of wa.ter than smaller ones, but besides thedifferences in size, the rate 'of pumping is dependentalso on the physiologi'cal condition's or'the needs ofthe organism. These conditions cannot be ascertained in advance. A study of the effect of an external factor on the .rate of pumping must be made,therefore,' by determining tilis decrease or increase incomparison with a certai~l know'"l,l level of activity.This basic rat'e of pumping, which was consideredas 100 percent, was de~ermined for each experimental oyster by analyzing its record of activityduring the preliminary period, i. e., when the test
specimen was kept in plain sea water. Duration ofthese'periods are given in column 8, table 52. Fromkymog'raph records the- rate of pumping was determined for each hour the' shells of the oyster wereopen and the mean rate for the entire period whenthe oyster was active was considered 'its basic rate.T.he mean ra.te of puil'lping in' various conce!ltrationsof pollutant was computed in a similar way for theentire period of exposure, counting only the hourswhen the shells were open, and compared with thebasic 'rate of the same specimen. Figures in thelast column of table 52 give the percentages of thebasic original' rates. As can be seen from theexamination of figures 61 and 62, the initial rates ofpumping 'in the majority of oysters varied from 6 to12 liters per hour. The purpose of the control

EFFECT OF PULP-MILL WASTES .ON YORK RIVER OYSTERS
oysters was to demonstrate that' no .significantvariation in the rate of flow could be attributed tos'ome unexpected. change in the sea water or to theinjury.of the oysters caused by the conditions of the
.experiment. Examination of the curves, marked infigures by solid circles, shows that the rate of pumping in the control remained fairly constant and, inmany instances, w~s higher at the end of the testthan at its beginning.
Concentrations of 1:200 and 1:400 of the pulpn{ill effluent gave, immediate and marked effects,depreS"sing the water output to a small fraction of itsrate observed before treatmellt. In the tests employing the concentration of I: 200 of sampLes 3 and 5;oysters filtering originally over 10 liters per hour, de-
creased the rate to a fraction of a liter (fig. 61). Theeffect of this effluent in .concentrations of 1: 770 andl:I,OOO was less pronounced. ,Some of the oysterswere almost unaffected while others showed a .markeddrop in the rate of flow. Sample No.6 decreasedthe pumping a'ctivity of one,oyster at a concentrationof 1: 770 but did not appreciably alter the rate ofanother oyster kept in' the same concentration.Of the six samples of the effluent tested at a concentration of 1: 1,000, sample No.6, which hadthe lowest.. specific gravity of· the group, was theonly one that did not produce a reduction. in' therate of flow. .
There was no change in the rate of pumping inthe tests in which the paper-mill effluent (sewer A)
161:1000
PULP MILLEFFLUENT
SAMPLE 5
• CONTROL 6
o onTER 3
12
..
..,,.\\\\\
" ,/0'0.--0---- -d
1:1000 .
PULP lULLE"LUEIT
~, .., " -.() :A::~:RO'L'
.. /Y' . '.. .,' 0 ovlTIR I0" •.ci" ....'0-... ~
. "
1:770
PULP MILLEFFLUENTSAMPLE 6
• C.ONTROl •o OYSTER II
I: 770
PULP lULLEFFLUENT
~SAMPLE 8
• CONTROL ,.
o OYSTER 12-"'I. \ .. .
,,, .\ (>~------
·o,t---'--------'------<--t--.....JL..«.-----'---- --1
" '2.L
w..c
"
'2
1:400
PULP MilL
~EFFLUE.HT
• . SAMPLE' G
.0---<1.",,, \ • CONTROL 5
0" , 0 OYSTER B\\
\\
\00_.0-·--0-·-0
I: 400PULP lULLEFFLUENT·
SAMPLE 8• CONTROl:- 5
o OYSTER •
II
12 ..~.",..,'" : PULP MILL
0-.-------0'" ~ EFnUENT,.I 'SA.YPlE ,
: '. CONTROL: 0 OYSTER
I
~ "A,,_I ....d .\
.1>-<10-- \
.\lACT ",
1:200 .PULP "MILLEFFLUENTSAMPLE is
• CONTROL.o OYSTER I
TIME IN DAYS
FIGURE 61.-Effe~t of the pulp-mill efHuent in concentrations from i : 200 to 1 : 1.000 onthe rate of water filtration of oysters. Rubber-apron method. The. period hetween arrowsrepresents the period of treatment. 'Conditions of the experiments are given in tahle 52.
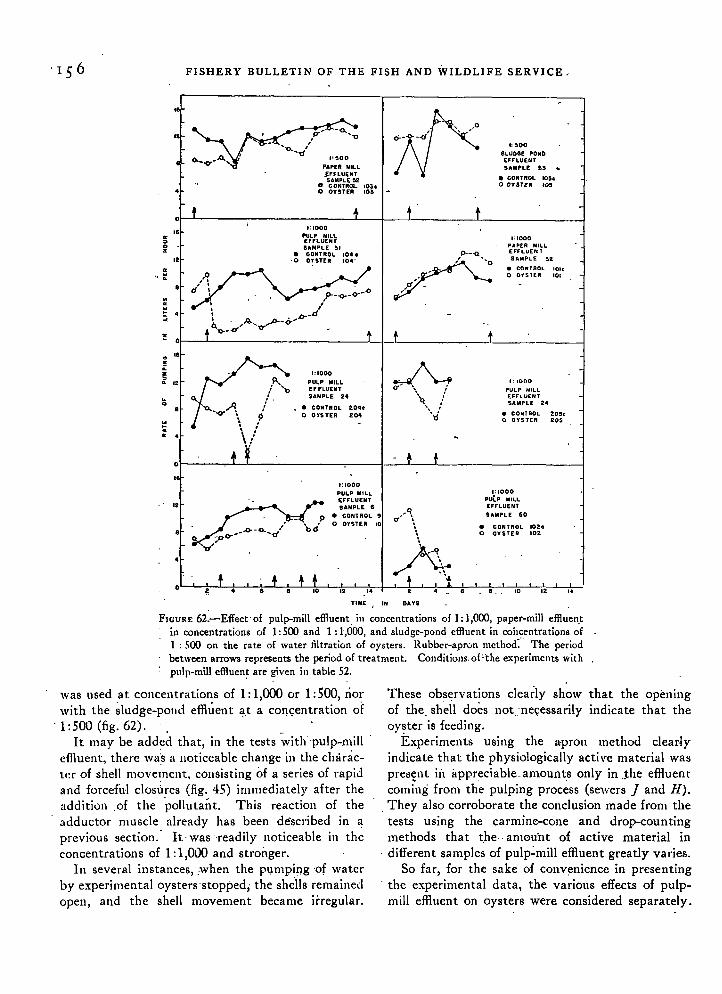
FISHERY BULLETIN OF THE FISH AND WILDLIFE SERVICE.
I.
1:500
PAPER MILL,J:FFLUENTSAMPLE !l2
• CONTROL 103co OYSTER 103
o-.~_-<i'''''O7\j' 1:500
SLUDGE PONDEFFLUENTSAMPLE 1:5 "-
• CONTROL 105eo OYSTER '05
';1000PAPER MILL[FFLUEN TSAMPLE 52
• CONTROL IDleo OYSTER 101
1:1000PULP MILLEFFLUENTSAMPLE !II
• CONTROL 104 c·0 OYSTER 104'
..IEW~ .:;
I.I<
"0z I.IE
'. ~
:!: Ol---'------------"-l-t------f----------l: .6
;;:
'"".. I.
w~CI< •
1:'000PULP MILLEFFLUENTSAMPLE 24
• CONTROL 204co OYSTER 204
~0-" .. •'\ I'''q :'
""'oJ'
I: .ClClO
PULP MILL[FFLU[HYSAMPLE 24
• CONTROL ta5ee" OYST[R 205
ol-----,-.1.-.J------,---l-=-1--f ----I
,.
II.
1:'000PULP MILL[FFLUENT
SAMPLE !flO
• CONTROL 102eo OYSTER 102
1:'000PULP MILLEFFLUENTSAMPLE 6
• CONTROL 9o OVSTER .0
.-'1,
A• '\1
oL......L-~~--'__:!c_L.-1_-'-+--'---+..---'-_!;I.;---''---;,~. -+-',~---'-"---;!--'--;-~ ~,'o "2
TIME IN DAYS
FIGURE 62.-Effect'of pulp-mill effluent, in concentrations of 1: 1,000, paper-mill effluen.tin concentrations of 1: 500 alld 1: 1,000, and sludge-pond effluent in coh~.entrations of1 : 500 on the rate of water filtration of oysters. Rubber-apron method: The periodbetween arrows represents the period of treatment. COllditiollS, of'the experiments withpulp-mill effluen~ are given in table 52.
was used at concentrations of 1:1,000 or 1:500, norwith the ~ludge-polld effluent ~,t a COI')<;entration of
. 1: 500 (fig. 62). . .,It may be added that, in the tests with pulp-mill
effluent, there wa's a 1I0ticeable change in the characU:r of shell movement, consisting of a series of rapidand forcefu'l closures (fig. 45) immediately after theaddition .of the ·pollutain. This reaction of theadductor muscle already has been described in aprevious section." It'was'readily noticeable in theconoentrations of 1: 1,000 and stroilger.
In several instances, ;when the p~mpiI).g 'of waterby experimental oysters'stopped; the shells remainedopen, and the shell movement became irregular.
These observations cleady show that the openingof the. shell does not'ne<;essarily indicate that theoyster is feeding.
Experiments using the a·pron method clearlyindicate that the physiologically acti ve material waspres<:nt ill appreciable_amounts only in Jhe effluent:coming from the pulping process (sewers] and ll).
, They also corroborate the conclusion made from thetests using the carmine-cone and drop-countingmethods that t,he- amou'nt . of active material indifferent samples of pulp~mill effluent greatly varies.
So far, for the sake of convenience in presenting, the experimental data, the various effects of pulp
mill effluent on oysters were considered separately.
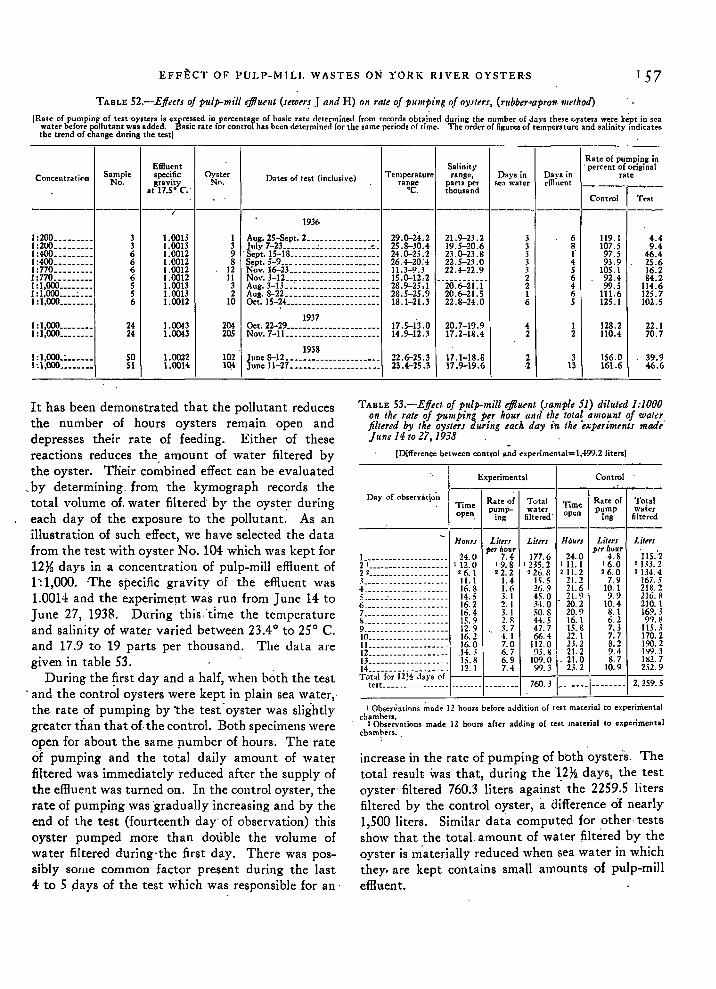
EFFECT OF PUl.P-MILl. WASTES ON YORK RIVER OYSTERS
TABLE 52.-EfftetJ of pulp-mill til/Ue/lt (Jew,,! J and H) on role of pumping of ny.rlrTJ, (rubber"opro1/. lIlrllrocl)
IRaie of pumping of test oysters is expressed in percentage of basic rate determined from recorda obtained during the number (If days these oysters were k~pt in seawateT before pollutant was added. Basic rate for control has been determined for the same periods of time. The order of figures of temperature and salinity mdicatesthe trend of change during the test]
Concentra1 if'ln SampleNo.
Effluentspecificgravity
at 17.5· C'
OysterN("J. Dat.es of test (inc.lush-e)
Salinity ITemperature range, Days in
TanJitc paru pe-T !Ota water·C. thousa nd
Da~'s incfHucnt
Rate of pumping in. percent of original
rate
Control Trost---------------,-------- ----------------- ------- ------- ------ --------------
19361:200_________ 3 1.0013 I Aug. 25-Sept. 2_________________ 29.0-24.2 21.9-23.2 3 6 119.1 4.41:200_. _______ 3 1.0013 3 .~:~:~f!;~-~::::::~::::::::::::~: 25.8-30.4 19.5-20.6 3 8 107.5 9.41:400. ________ 6 1.0012 9 24.0-25.2 23.0-23.8 .1 r 97.5 46.41:400_________ 6 1.0012 8 26.4-20:4 22.5-23.0 .1 4 93.9 25.61:770_________ 6 1.0012 12 Nov. 16-23 _____________________ 11.3-9.3 22.4-22.9 3 5 105.1 16.21:770_________ 6 1.0012 11 Nov. 3-12 ______________________ 15.0-12,2 --io:6-=-ii:i- 2 6 92.4 84.21:1,000________ 5 1.0013 3 Aug. 3-0 __ ~ ___________________ 28.9-25,1 2 4 99.5 114.6I :I,OOO____ ~ ___ 5 1.000 2 Aug. 8-22. _____________________ 28.5-25.9 20.6-21.5 1 6 111.6 125.71:1,000________ 6 1.0012 10 Oct. 15-24______________________ 18.1-21.3 22.8-24.0 6 5 125.1 102.5
19371:1,000________ 24 \.0043 204 Oct. 22-29______________________ 17.5-13 .0 20.7-19.9 4 I 128.2 22.11:1,000________ 24 1.0043 205 Nov. 7-1 L _____________________ 14.9-12.3 17.2-18.4 2 2 110.4 70.7
19381:1,000_:______ 50 1.0022 102 lune 8-12 ______________________ 22.6-25.3 17.1-18.8 2 3 156.0 39.91:1,000________ 51 1.0014 10:lune 11-27 _____________________
23.4-25.3 17.9-19.6 ·2 13 161.6 46.6
---c-----l-·-·------------------
(Difference between control and experim<lItal=I.499.2 liters)
I Observations ~i1de 12 hQurs before addition of test material to experimental
ch:Og:~~atiQn5 made 12 hours after adding of test material to experimentalchambers.
Totalwater
filtercd
Control
Timeopen
Rate of Totalpump- water
ing filtered'
Experiment:tl
Timeopen.
increase in the rate of pumping of both oysters. Thetotal result \vas that, during the 12}2 days, the testoyster' filtered 760.3 liters against' the 2259.5 litersfiltered by the control oyster, a difference of nearly1 500 liters. Similar data computed for other· tests, .show that the total amount of water filtered by theoyster is n{aterially reduced when sea water in whichthey. are kept contains small amounts of pulp-milleffluent.
HOllrJ LiuTJ Liurs HOllrs Littrs Lit~rs
1.. 24.01>tT1't'I 177.6 24.0 prr~~8 115.'2
2' . 112.0 '9.8 12.15.2 'II.I 16.0 '133.22' •.. . __ '6.1 '2.2 '26.S '11.2 '6.0 '134.43 . 11.1 1.4 11.5 21.2 7.9 167..14 • 16.8 1.6 26.9 21.6 10.1 218.2.L · .. ... 14.5 .i. I 45.0 21.9 9.9 216.86 .______ 16.2 2.1 .14.0 20.2 10.4 210.1
L:::::::::::::::::: IU U ~U fg:i U I~U9. . 12.9 3.7 47.7 15.8 7.3 115..110 16.2 4.1 66.422.1 7.7 170.2\1 ._ 16.0 7.0 112.0 2.1.2 8.2 190.212 . __..14. .1 6. 7 ~5.8 21.2 9.4 1~9.3
13.. 15.8 6.9 109.0 .21.0 8.7 182.714 . __ . .. 12.1 7.4 99.3 2.l.2 10.9 252.9Tu,,1 for 12!.~ da)"s of ---------------,-te.t . .. _... _ .. _. . 760.3 . 2,.59.5
TABLE 53.-Effect of pltlp-mill effluent (Jample 51) diluted 1:100001/ the rate of pumping per Iroltr alld the lotal amounl of wal..,filtered by Ihe oyJterJ during rach day in tire txpeTi1/u1/tJ lIlade'JUlie 1410 2i, 1938
It has been demonstrated that the pollutant reducesthe number of hours oysters remain' open anddepresses their rate of feeding. Either of these
. reactions reduces the. amount of water filtered bythe oyster. Tlieir combined effect can be evaluated
_by determining. from the kymograph records thetotal volume of. water filtered by the oyste.r duringeach day of the exposure to the pollutant. As anillustration of such effect, we have selected the datafrom the test with oyster No. 104 which was kept for12% days in a concentration of pulp-mill effluent of1': 1,000. The specific gravity of the effluent was1.0014 and the experime!1t was run from June 14 toJune 27, 1938. During this.·time the temperatureand salinity of water varied between 23.40 to 25 0 C.and 17.9 to 19 parts per thousand. The data aregiven in table 53.
During the ~rst day and a half, when both the test. and the control oysters were kept in plain sea water,.the rate of pumping by'the test'oyster was slightlygreater than that of. the control. Both specimens wereopen for about the same pumber of hours. The rateof pumping and the total daily amount of waterfiltered was immediately reduced after the supply ofthe effluent was turned on. In the control oyster, therate of pumping was 'gradually increasing and by theend of the test (fourteenth day' of observation) thisoyster pumped more than double the volume ofwater filtered during·the first day. There was possibly some common factor present during the last4 to 5 pays of the test which was responsible for an·

FISHERY BULLETIN OF THE FISH AND WILDLIFE SERVICE
PHYSIOLOGICAL EFFECTS OF, VARIOUS MATERIALS CONTAIN~D. IN THE P,ULP-MILLEFFLUENT
, As all the pulp- and papei--~ill effluents whichexert a marked physiological effect on oysters wereobtained from the outlet of the sewer connected withthe pulping process, the physiological action of the
.various materials entering this sewer-ditch weremaqe the object of investigation. The effl'uent of thisditch contains the following mill wastes: the lastdiffuser wash; sea water from the condensers; blQwdo~~ condensate; wea'k-black liquor; sulfate soaps;and "burnt cooks."
rhe first three are the normal compone'nts discharged through this sewer, while the last threeeni:~r:at irregular interval's because of errors in the
, operation of either the 'digester house, or of the recovery, house: Before describing the manner in.whi~h these latter wastes' find access to the sewersit is necessary to clarify-the designations applied' tosome of these'wastes.
The character of both the last diffuser wash andthe weak-black liquor were given in connection withthe description of the mill and its process, while thesea water is self explanatory. ' '
The blow-down condensate arises as follows: afterthe ~ooking 'process 'has completely disintegrated thechips in the digester, the l.iberated cellulose fibers
..are released with the digester contents, to the firstcell of the diffusion battery. As lthe cooking liquorpasses from the elevated. temperature and pressureof the digester to· the atmospheric pressure of thediffusion cell, it 'liberates great quantities of steam..This steam, which carries with it a large volume ofvapors of volatile substanc~s that are either liberatedfrom or deriv:ed from ,the 'chips during the cookingprocess (Klason 1908; Klason and Segerf~lt 1910;Bergstrom and Fagerlind 1909; Rinman 1911) ispassed through a condenser in order to recover theturpentine present. After separation of the latter,the condensed water, or blow-down condensate, isdischarged as a waste product into the weir.
The sulfate ·soaps.'may be described as follows:the species of wood used by this mill contain oleoresins '(Herty andiDi'cksol;' 1908) together with acertain quantity of the tru~ fa"ts (Carpenter 1937).During the pulping process the alkali of the liquorreacts with both the fats and the resin acids of theoleoresin; converting 'them into their respectives~dium. salts, which are ordinarily called soaps.These'soaps, being but ~Iightly soluble in the alka-,
line cooking liquor, tend to separate as an upperlayer. That formed on the weak black liquor isknown as "weak soap" while that separated in theprocess of concentrating the black liquor for incineration is called "strong soap." Despite their stro'ngdetergent power, these soaps are of little ~larket
value because of their dark c()lor ill1d disagreeableodor. '
In most pulp .mills there are occasions 'when,through some faulty procedure, the charge of chipsin the digester undergoes, at the cooking temperature,'a partial charring that results in a product called a"burnt cook," which makes the pulp obtained difficul"t to purify. Whenever the amount of ·charredmaterial present is so great that .the cost of purifi-cation exceeds the value of the usable pulp, t,he
.entire 'contents of the digester are usually discarded.As black liquor, sulfate soap, and burnt cooks do
not enter the sewer when the mill is operating properly, a description of their mode of entry is necessary,as all of them contain substances which exert aphysiological effect upon oysters. Located in thearea between the chip conveyor and the recoveryhouse, but not shown in the plant lay-out in fj,gure 4,'are several covered steel- tanks of, different sizeswhich are used for the storage of blaok liquor duringthe various stages of its recovery. In the largesttank, about 30 feet in diameter, the filtered weakblack liquor is stored as feed for the evaporators.The air vent of this tank is connected to a 15-inc,hcast-iron 'pipe emptying into, a weir in ditches ]and H. The liquid i,1.1 this ,tank is ,usually coveredwith a froth of weak soap which sometimes, if the
'tank is nearly full, can be seen escaping through thevent and flowing into the weir. On some occasionsthe' weak-black liquor has been collected at theoutlet of this pipe. Another, even more frequent,mode of entry of weak soap into th'e sewers] andH is the "froth fro·m. the ,veak-black-liquor filter.This filter is qn top o(one of the sin~ller steel tankslocated just outside the north end of building 9 infigure 4. This filter is fully enclosed, but fittedwith' a 4-inch vent' pipe which discharges into an0Pf:n sump beneath it. The position of this sump isabout at the place in figure 4 where sewer I changes'from a due north to a northwesterly direction. Onalmost every visit to the mill during the time of thisinvestigation, this vent pipe' was discharging a
, mixture'of weak-soap froth and pulp fibers into thesump.
The strong sulfate soap gets into the sewe~s only

-EFFECT OF PULP-MILL WASTES ON YORK RIVER O-YSTERS: 159
TABLE Sol,-Faria/iolls in millfral COllstitum/s of mill fJ!{,tflltsalld mill Hquors
CHANGES IN ,EFFECTIVENESS OF PULP-MILL., EFfLUENTS UNDER STORAGE AND OXIDATION
The usual effl"ueqts from th<;' sulfate processfreshly collected, have been shown to contain substances having a- marked physiological action onoysters and contai.n substances toxic to finned fishes(Hagman 1936). Since the materials are known tobe oxidized (Bergstrom and Trobeck 1937) exposureof the p~lp-mi1l effluents to the air for any appre-
Dc:nfloit},"
Pcrcelltage by weightSample 25° c. ---------- SOLI rce of sample
No. 25° C,NaOH Na:CO, Na:S
--------------------------'70A 0.999 0.013 0.15 0.tl68 Outlet '"f IS-inch ripe (easl
'weir of ditches J and H);
- weir full of froth.7m 1:018 I. 54 .54 .251 Weak-black liquor,
73 I. 078 I. 49 ,64 .078 Do.75 I. on 1.4 .67 . 112 : Do.
.88 0.998 0.73 .Il .045 Outlet·of IS-inch pipe (eastweir or ditch) and Nt .
89L 1.056 0.57 .20 .13 Vent of 3D-foot wea k-hl.ck-. . liquQr "tank.
90 I. 079 I. 8~ .60 . 11 Weak-black liquor.92 I. 099 2.74 .98 . 15 Do.94 I. 007 0.57 .23 .57 Outlet of IS-inch ripe (e:lst
weir of ditches J aue Il),
95 1.086 'I. 53.., .44 .57 Weak-black liquor,97 I. 193 4.41 I. 08 I. 65 CO[l,.:e-ntrated black liquor.'18- I. 083 I. 86 .62 . 74 Weak-black liquol.'99 I. 015 . 2.20 .095 .071 EfI\"ent of west weir of
, ditches J :lnd H,
at very infrequent intervals, but the quantity enter- of sea water by oysters were observed using theing at such a time is usually quite large. This strong carmine-cone technique as previously described, withsoap, having been skimmed from the black liquor increasing concentration of test material. Theduring concentration of the latter, is stored in one of results are presented in figure 63.the steel tanks previously mentioned. Steam coils' From these results it will be seen that the materialsin this tank keep the soap liquid so that it" can be effective in reducing the pumpi·ng.activity of oysters
_ pumped to either the shipping dock or to the'incin- are contained iii the black liqu'or and soaps. Theseerators. The latter meansof disposal- requires -high same materials, of course, are ·'.present in the lastpressure in the pipe·line and occasionally there occurs washings of the diffusers but here they are presenta break in the line spilling the soap on the ground in in greater dilution and in only on,e,of the experimentsthe vicinity of these tanks. Between July 1 and, was this effluent sufficiently strong to produce aNovember 1, 1938, 'no less than ~hree suc;h accidents slowing down of the rate of pliniping. It must beoccurred. Each' time the spilled'"s'oap' covered-·an.·' "bornelli. mind, however, tha"t the method of bioassayarea of more than a thousand square feet"to an aver- was such that the effective inate6als must produce,age depth of 'about 6 inches and extended' to the their action within a ~O-minute :exposure time. Nosump. This soap, having ve'ry little value, IS left on answer has been obtained, as. 'to 'what action thesethe groUli'd until. washed into the sump by ra'ins, physiologically active materials would exert on thefinally getting into the river.. In the three cases oyster iIJ.dilute concentrations over·a period of time.observed it was apparent that at the time of the It will be readily seen, however;' that these activeaccident a large amount of soap had flowed into the materials do enter the. river at·.tin~es in very highsump.. concentration as a rt:sult: of faufty operation of the
, Notwithstanding the claim that burnt cooks are equipment used in the recovery process. Some ofnot discarded, appreciable quantities of pulp ar,e the variations in the characteristics of both thefrequently found ,on the ground adjoining the weirs pulp-mill effluents and 'mill liquors are given inof sewers] and H. On one occasion, after the ditch table S'4.carrying effluents from these sewers had been changedto Ii. coVered aqueduct, a' pile of 'pulp 2 or 3 feet indiameter and 18 to 20 inches in height was found on'the plank cover of the aqueduct whl;re it connectedwith the weirs. The position of this pile of pulp inrelation to the IS-il~ch cast-iron pipe \vhich enteredthe weir, and, the distance of the pile, more than 6,feet from the end of the pipe, indicated that the pulphad been discharged from the pipe with considera':ble force. Thest: particles had a charred app,earance typical' of burnt cook, and were too black to be .the shives usually .fo\lnd., A few hours before ,this pile, of pulp was examined,two,'S-g~l1on ~amples of water, collected at the highway bridge over the Pamunkey Riyer, about onehalf mile down stream from the location 'of the out-'let of the aqueduct' carrying the effluent from thispip~, ,showed a marked' physiological effect uponoysters and also contained con'siderable quantities ofvery.black pulp.'
For examination of the physiological effect, testswere made of strong so.ap, weak soap, weak-blackliql:lor, last diffuser wash, and blow-down condensate, from samples collected as these materials actuallywere being added to the effluent of the pulp mill.For these te~ts the c'hanges in the rate of pumping
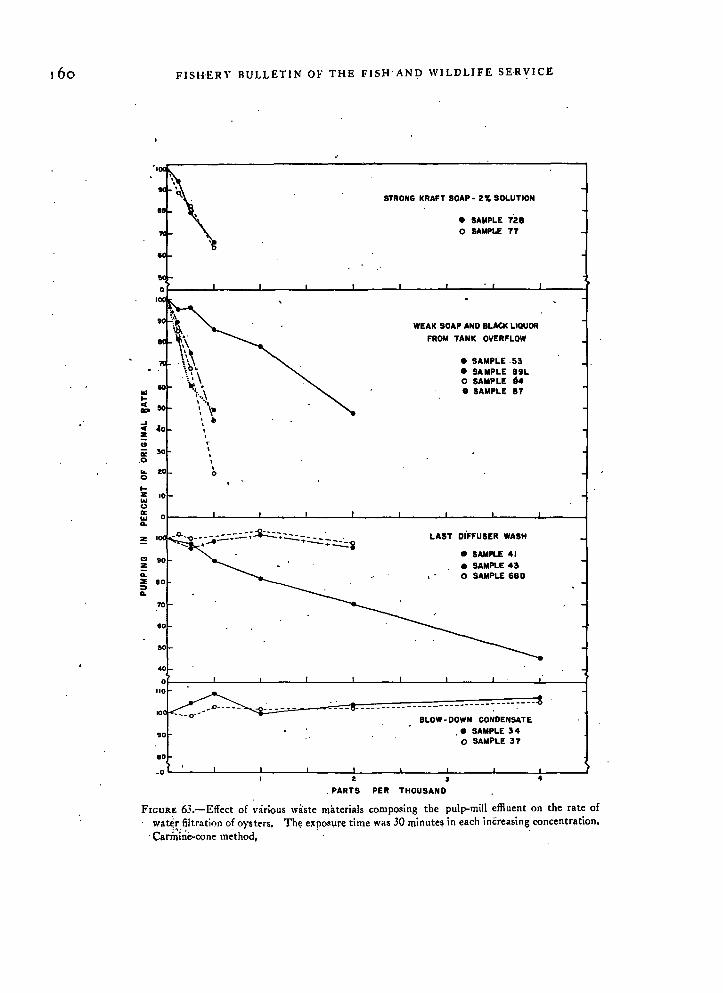
160 FISHERY BULLETIN OF THE FISH'ANI;> WILDLIFE SE-RVICE
III10
l-e 110.......
~oezC!I "30
,... ,.0 ,... 20
,0 0..Z 10...UIt:
0......!: 1
C!I 90Z...:IE 80~...
70
eo
50
40
90
80
STRONG KRAFT SOAP- 2" SOLUTION
• SAelPLE 7'2Bo SAMPl.E 77
WEAK SOAP AND BLACK LIQUOR
FROM TANK OVERFLOW
• SAMPLE ,53• SAMPLE 89Lo SAMPLE 94
• SAMPLE B7
LAST DIFFUSER WASH
• SAMPLE 41• SAMPLE 43o SAMPLE SBD
_____ ~ ~----o
BLOW-DOWN CONDENSATE
• SAMPLE 34o SAMPLE 37
_0 '---__.L.-__-!-__.l-__-!--__..l-__..l-__...L-__-!--__...123 4
, PARTS PER THOUSAND
FIGURE 63.-Effect of various waste n)aterials composing the pulp-mill effluent on the rate ofwat~r filtration of oysters. The e)(pOS\lre time was 30 minllte~ in each increasing concentration•
. CarJ~irie-cone method, . .

EFFECT OF PULP-MILL WASTES ON YORK RIVER OYSTERS
O'---'----L----'------I.2----JL--.L.
3---l--
4L--.J
PARTS- PER THOUSANO ,
FIGURE 64.'--Effect of storage and drying of pulp-mill effluent onits effectiveness in changing the rate of !'Vater filtration ofoysters. Carmine-cone method with increasing concentrationsat half-hour intervals.
-_:::::-~:--.---~ .
"~o"""-..,........ """-.,............. ...,: ----.~
PULP MILL EFFLUENT .......... .,..SAMPLE 25 "'0"'_ ... _
• FRESH •o STOPPERED I MONT'"• OPEN I MONTH
-~':'~:';--=::Q:'="_._"':"::':":~:::"::: =~~ =-=-- - - - - --0
"'-"'~e
40 •
60
...!Ca: PULP MILL EFFLUENT:;: 60 .. SAMPLE 31
~ • FRESHri 0 ASHEDo • DRIED AT 35-~ 4
1:
~ 800:
'"::>..
80
65), storage, under hydrogen completely preventedthe loss in effectiveness of the sample for' a period of11 months. In sample 71E the loss in effectivenesswas somewhat reduced, but the toxicity of the liquorwas still pronounced after 14 weeks of .storage(fig. 66).
In like manner, tests were made at intervals usingportions 0f one of these samples stored in the labora~
tory in open vessels: The loss in potency withstorage of the sample exposed to the ai,r is seen in thedifferent curves of figure 67. ,
On the day of its collection, a 2S0-milliliter portion of one of the samples was placed in a SOO-milliliter flask; the ~uperincumbentair was displaced withoxygen (99.5 percent purity) and the closed flask
: attached to a reservoir containing a known volul1lp.of oxygen. The flask and its contents were shakenfor 90 hours. The absorptioJ;l was at a pres'sure of 1meter, .vater gage, and the oxygen consumption,not corrected to standard conditions, was 2,750nlilliliters. Physiological tests with this portionshowed that the potency had been completely destroyed by the treatment with oxygen. Agraphicpre~entation of these data is given' in figure 68.
·From all the experiments performed, it is evidentthat by oxidation a great part of the active materialof the effluent can be rendered' physiol~gically ineffective. This material, however, is not readilyoxidized. Storage in air for periods as long as eight
ciable fength of time' m:ight be expected to alter'thecharacter of the constituents. present. As a consequellce, experiments were performed to determine the changes in physiological effectivenesscaused 'by the storage of the effluents and the effectof gases upon their toxicity: '_
A sample of effluent from pulp-mill sewers] and .H was' tested as to its effectivenes's in reducing therate of pumping of water by oysters. One portionof this sample was kept in a stoppered bottle andanother in an unstoppered bottle 'open to the airfor a period of 4 weeks., At the eild of this periodthe stored portion was tested as to its ac.tion onoysters. The re~ults, ,given in the curves of figure64, show that storage under these conditions did notappreciably alter the physiological action of thissample. ,
Another sample of effluent from pulp-mill ~ewers
] and H was collected and tested as to its action onoysters. One portion of this sa.mple was dried at35° C. in an open dish in an electric oven, andanother portion was evaporat(:d to dryness over abunsen burner and then ashed. Both of thetreated portions were then taken up in distilled
, water to their original volume and tested as to theirphysiological activity on oysters. The results areshown' in the upp~r part of figl.!-re 64. Within the.limits of these experiments, dr'ying the samplegreatly reduced its potency and ashing completelydestroyed its activity.
Since the toxicity of the mill effluents was seen tobe correlated rather definitely with the amount ofweak-black liquor present, samples of weak-blackliquor· taken directly from the line supplying theevaporators were tested.', The samples were collected into hx:drogen-filled flasks. The flasks werecorilpletely filled with the hot liquor; then a rubberstopper con'nected to a hydrogen reservoir wasinserted. After the stopper had been tied in' piacethe connection to the hydrogen reservoir wasopened. In this series of experiments, tpe stocksamples were kept under hydrogen and for all withdrawals the liquid removed was displaced byhydrogen.
On the day of its collection ~ portion of this material was, withdrawn in _the manner describedand tested as to its effectiveness in reducing the ,rateof pumping of .oysters with increasing concentrations of the test mat"erial. At intervals, samplesfrom the supply kept under hydrogen were withdrawn and tested. In the case of sample 90 (fig.

162 FISHERY BULLETIN OF THE FISH AND WILDLIFE SERVICE
III~
ClII:
..JCZi;
~ 60II.o~
ZIIIUlII:
1l!40
• PRESH
o 4 MONTHS• 10·•. 14
'.-.
O'---.....L..---!---L__.;-_--l..,,..--_.l-_--L-'--_.l-_--.L__..L----l2 3 4 5
PARTS PER TEN THOUSANO
FIGlIRE 65.-Effect of storage under hydrogen on the effectiveness of weak-black liquor (sample90) in reducing the rate of water filtration in oysters. Carmine-cone method; half-hour ex-posures to each of the increasing concentrations. .
80
IIIlelII:
..Je 60z!!!lII:oII.oI-Z 40....U
'"...Do
20
• FRESHo 2 WEEK"• 4 •.
• I... .• 14 •
0'----.L....--f---.l.---*"Z---I.----!-3---I.----];4--:-.--.L-.:..--i:5.......--...J
PARTS PER TEN THOUSANO
FIGURE 66.-Effect of storage under hydrogen on the-effectiveness of weak-black liquor (sample7lE) in reducing the rate of water filtration'in oysters. Carmine-cone method; half-hour ex~
posures to each of the increasing concentrlltions.

EFFECT OF PULP-MILL WASTES ON YORK RIVER OYSTERS
..................-'.
" ··~··o
---.~. -'---~·cD
--.
80
~~.. ~.-- •..Q'l-- ..~-- .····r . --------d>100 <~-''-@)~'_'~ "'""'"- __
'0. '" . •. . ............", ~ ............
" '- ..............0..., ...... ~_....... ... , --0--.'..... -'-,....... .~.---..
'0 "'-.-'- ......--"--'''---.. .......... --- .. --.. .._.
'0_. • .-'-'
....c 60z;;iioII.o
III..CII:
..z 40III<)II:...II.
• FRESH
02 WEUSC9 4 ..
." 20 @) eCD 8 "
o '---'----L----!---...l----:2!------L--. ...,3~----L--_r--......--5:-----J
PARTS PER TEN THOUSAND
FIGURE 67.-Effect of storage in open vessels on the effectiveness (if weak-black liquor (sample7lE) in reducing -the rate of water filtration in oysters. C~rmine-cone method; half-hour exposures to each (,f the increasin'g concentrations.
weeks did not completely destroy its efl"ectiveness inreducing·the rate of \vater filtration cif oysters 'underthe experimental conditions. .
CHEMICAL NATURE OF WEAK BLACK LIQUORAND KRAFT SOAPS AND RESPONSE OF OYSTERSTREATED WITH FRl\CTIONS OF' 'THESE .MATERIALS
Despite an extensive literature on sulfate" blackliquor very little of it deals with a careful determination of the organic constituents. Most of the publications are devoted to technical discussions of theprocesses .advqcated or· in use for 'recovery of thealkali values from the liquor., The most frequentlycited publications (Kiason, '1893; Klason and Segerfelt, 1910)· report lignin, ether solubles, formic,acetic, resin, and lactone acids together with phenolsas the organic componerits. A similar paper (Klein,1908) adds to the list but does not mention anysulfur compou nds. In a discussion devoted chieflyto an improved pulping' process, Rinman (1911)proposes a new classification of the' gross organicconstituents. In some fractionation' experiments(Cirves, 1930) a refationship is so~ght ·between 'thepentose and ,hexose .sugars and the oxyacids and
humic acids of the' black liquor. In a .fairly recentpaper (Heath, Bray, 'and Curran, 1933) attention iscalled to black liquor undergoing changes on storage.
A search (Holzer 1934) by the color-curve absorption method for. the blac'k-liquor constituents responsible for the dark color of sulfate pulp revealeda single, sulfur-containing, primary unit, whichshowed the r~actions of phlobotaQnins, as being"the source of the color. While the sulfur conipounds'in the stack gases from the incineration of the concentrated black liquor have .givep rise to nu'merouspublications, there is only one '(Kress'and MacIntyre,1935) in which attempts to prepare a sulfur balancefor the sulfate-pulping process was made, but thispaper gives no .information about organic sulfur
-compounds in the black liquor.The literature on sulfate soap is in a condition
similar to that for black liquor, the principal'topics being the development of refining processes'which will enable .the sulfate soap to be marketedin competition with soaps from the usual sources.:The sulfate soaps from .European. sulfate mills have
. been studied by sev.eral workers, but; because of the. difference in the tree species, the European d~ta are

FISHERY BULLETIN OF THE FISH AND WILDLIFE SERVICE
__ -----------o-----------~----- __..0-------0- ------0
100 __ -0---
10
II.o
!E 40IIIC)
'"IIICl.
20
• FRESH,
o OXIDIZED
"
O'----'---~--J..--~--I---L----l...---'----l...---'----l2 5. 4 6
PARTS PER TEN THOUSAND
FIGlIP.E 68.-Effect (,f treatment with pure oxygen on the ejfectiveness of weak-black li~1UOr
(sample 7lE) in reducing the rate of water filtration in oysters. Carmine-cone method; halfhour exposure to each of the increasing concentra tions.
of little value to the present problem., Three publi- -,cations (MCNee and Blengsli, 1936; Wallach, 1937;and Pollak, 1938) dealt with the composition of thesulfate soaps obtained in pulping American' wood.The most comprehensive paper was that of l\1cKeeand Blengsli, who isolated from the soap acids agasoline-insolubl.e substance which wa~ not examinedfurther than i~s classification. as an organic acidproduced by oxidation of the resin acids. .
During the cour;;e of the pre~ent investigationsfractionation was mad~ of a,sample,of strong sulfatesoap (sample 77) scooped from the ground in the areabetween the structures designated by the numbers 5,9, and 10 in figure 4. During the night of October30,1939, the pipe line carrying the'melted soap to theincinerators broke and ·spilled the soap on th~
ground. The total qua,ntity of material spilledcannot be determined, but at 6 a. m. on October 31the material covered an area of about 1,200 square
, feet and was still. dropping to the ground from thebroken pipe. At 11 a.' m. the break had bee'n re~
paired but the layer of soa'p had an average depth ofabout 8 inches over the area and remained there
until rains carried it into the sump emptying'intosewers ] and H. At the time of the accident anunknown amount of this soap had also' enteredsewers ] ~nd H through the sump, for two sides of itwere'bordered by the spilled material. As shown infigure 63, a 2-percent solution of this soap produced'a'marked physiological action on oysters when addedto the sea water in increasing concentration from1 : 32,000 to 1 : 2,000. The sample was fractionatedusing methanol and ethanol in accordance with thescheme shown in figure 69, and the various fractionstested at like concentrations as the origi~al sample77 as to their effectiveness in reducing the J;'ate ofwater filtration of oysters using the carmine-conetechnique.· The results of the bioassays ,of each_fractio'n are indicated in figure 69. In control experiments· it, was learned 'that at the concent~ations
used with the sulfate soap fractions,. both methanoland ethanol were found to have no physiologicaleffect upon the oysters.
A studY: of the results shows that toxic substancesare in that, portion of the soap "having the greatersolubility in these solvents.' The separation obtained

EFFEC! OF PULP-MILL WASTES ON YORK RIVER OYSTERS
even with repeated fractionation was not 'capable ofisolating the toxic substances in a highly concentrated form.
While treatment with strong alkali caused improvement in the color of the sulf\lte soap in agreement with the findings of Wahlberg (1924), it did notremove the toxic substances. Control experimentsshowed sodium hydroxide was physiologically ineffective except w4en present in nigh concentrations.
Ahhough the strong sulfate soap contains materialwhich has a physiological effect upon oysters, the concentrated black l,iquor after removal of the soap wasfound to be also eff~ctive.
As sulfate soap rarely-flowed. into' the sewers itsexamination was discontinued in order to investigatematerials that were discharged into sewers withgreater frequency.
D~ring the collection of the sample of soap justdiscussed ~ thick froth 'was being discharged from
. the vent and overflow of the weak black-liqu~rstorage tank. Part of this material was droppiilgfrom the vent onto· the ground and part was flowingfrom the outlet of the IS-inch cast-iron pipe in one
of the weirs of sewers] and H. Two 10-quart pailswere filled with material dropping from the vent(sample 89) and a 10-gallon tub was filled with thefroth coming from the IS-inch pipe (sample 87).After· standing, the greater part of the froth hadliquefied. Sample 89 yielded about 1 liter (89L)and sample 87 about 6 liters. Each of these liquidswhen added to sea water in increasing concentration from 1: 32,000 to 1: 2,000 caused a physiologicalresponse in oysters as shown by a reduction in therate of pumping.
Because of tpe small quantity available no attempts were made to fractionate sample 89L, butsample 87 was given an extensive examination whichis recorded' in figure 70. The various fractionsobtained were tested at like increasing 'concentrations as to their effectiveness in reducing the rate ofwat.er filtration by oysters. The results of theseobservations are included in figure 70.. From each of these samples there remained a certain qu~ntity of .froth which had not liquefied evenafter standing for 48 hours. In the case of sample87 this noncondensable foam when conlpacted
~77~1ICD()/~d ,,,o·C .
Is·srl-c '40H
Ht/II
~77-10
E"'flt:I.d92/1,S
£,htlnll'
"
.Isa7,1'1-77
,::,J,• T,.."".",.
FIGURE (l9.-Scheme of fractionation of strong Kraft soap (sample 77). Thephysiological effectiveness of the fractions is indicated by solid ·circles. Noneffective fractions are n;arked by open circles.

166 FISHERY BULLETIN OF THE FISH AND WILDL·IFE SERVICE
FIGURE 70.-Scheme of fractionation of weak soap' (sample 87). The phy:siological effectiveness of the fractions is indicated by' solid circles for effective, andempty circles for noneffect,ive.
amounted to over 30 grams.' Th.is powder wasextra.cted with ethanol in a' Soxhlet apparatus.The sample was largely fine fib~rs and the extractdid not yield fractions that were physiologicallyactive. This fractionation, and its result~ whentested on oysters, is shown in the lower left sectionof figure 70. .
Since concentration in vacuo of the liquefied portion of sample 87 was prevented by the excessivefoaming due to the sodium soaps present, some ofthe liquid portion was evaporated to dryness in openvessels on a ~team bath. The evaporation residuewas then subjected to the fractionation shown in the'upper left section of figure 70.. It was shown in apreceding sectiQn -that treatment of physiologicallyactive mill effluents with gaseous oxygen destroyedthe active principle and there was considerable like-
lihood that exposure of the original liquiq materialof sample 87 to air .during evaporation might alsobring about some oxidatio~ of the active principle.This exposure to air during evaporation occurredwith only the original material. ·All extractions of
"the evaporation residue and all subsequent evaporations as ;hown 'in the diagrammatic outline' werecarried out u;lder hydrogen.
A portion of the liquefied material frotn sample 87was saturated with salt in order to precipitate thesoaps present and thereby enable evaporation to becarried out under reduced pressure and with theexclusio'n of air. The .salt treatment precipita.tedthe soaps as a finely divided suspension, but theaddition of sulfuric ether caused them' to concentrate in the 'Upper .layer. The products obtained asa result of. the C9lllbined salt and ether treatments

EFFECT OF PULP-MILL WASTES ON YORK,RIVER OYSTERS
of the liquefied portion of sample 87 were thenfractionated in accordance with the scheme showndiagrammatically' in the right-hand section of figure70. As the results obtained supplied an importantclue to the na:tu're 'of the physiologically activematerials present in the mill liquors, a detaileO discussion of this fractionation will be given. Whenever possible the manipulations ~rere performed· inan atmosphere of hydrogen.' .
The combined treatments with salt and etheryielded three fractions. The precipitate consistedlargely of" soaps but it also contained other substances and some fine fibers. The ether layer wasdark brown and contained the physiologically activematerials, while the aqueous layer, besides beingsaturated with salt, contain~d materials which"imparted. a deep-red color to the' liquid. Theaqueous layer, after removal of the precipitate andthe ether solution, was given two additional ext~ac
tions with ether and was then concentrated withoutdifficulty, under reduced' pressure, to about one-·third of its original volume. This concentrationprecipitated a large quantity of the salt, which wasrerriovted .by filtration and washed 'twice with ether.These ether washings were now used to extract theresidual liquor from the concentration of the aqueouslayer an~f then ~ombined with the other ether extractions of that layer. This residual aqu~ous solution and the original aqueous layer were bioassayedas fractions 87-110D and 87-101, respectively. "The v~rious ether :extracts of the aqueous layer (87101) .and its fractions were combined and evaporated
'to' dryness leaving aslight amount of a dark brownresidue. When the residue from the evaporation ofthe ether extracts was treated with water, a smallquantity of an insoluble oil arose to the surface.Filtration through a moistened filter separated theoil from the aqueous solution. Salt was the onlymaterial that could be isolated from the latter.The oil was treated with' methanol giving an insoluble portion too small for further work and thefraction 87-105 of figure 70.
The salt precipitate, labeled "brine precipitate" infigure 70, was filtered frOln the ether required forcoagulation and then given two additional extractions with .ether. These two latter extractions,87-106A and 87-106B i~ figure 70, were later combined with ·the ether solution from t~e coagulationtreatment and the entire mixture was bioassayed. asfraction 87-106A. The ether ,insoluble portion ofthe salt precipitate was now extract~d with ethanol
in a Soxhlet apparatus. After this treatment, thereremained a sma:,Il quantity of insoluble material consisting of fine wood-fibers .. The ethanol extract 'wasbioassayed as fraction 87-102B of figure 70.. When treated with water th,e ether residues87-106A and 87-106B formed a light-gray emulsion.After ~oriH~ preliminary titrations. a 10 percent salt.solution was added in the proportions 6:10 breaking
· the emulsion and forming a gray precipitate whichwas separated and then leached with boiling metha-
· nol, leaving a grayish-brown iesidue soluble only inboiling toluene. Due to th~ insolubility in water ofboth the fraction and the solvent no bioassays weremade. The methanol.leac.hings were clear 'at firstbut on standing deposited a few crystals. As filtra-
... tion and further standing yielded a few more crystals, the methanol solution was evaporated to about
· one-half .its· original volume and cooled, .whereupon· anothef small crop of crystals' appeared. Filtrationand, further concentration of the filtrate gave a·fourth deposit of crystals. These last were yellowwhereas the earlier deposits had been white, but arecrystallization from methanol yielded a' productsimil~r to th'e others. These four deposits had a 'total weight of 0.09 grams; an amount too small forbioassay.
When the mother liquor from these crystals wasdiluted to· four vol4mes with water, 87-112B, itcau&,ed a pronounced physiological action on oysters.'Even after a further ten-fold dilution this material,
· 87-11.2C, still greatly. reduced the rate of waterfiltration of oysters.. The quantities of these samples x:emaining after the biological and chemical testshad been made were insufficient for further refining
.and testing, and the quantity of sample 87 on hll-ndwas too sn.1all to permit a repetition of the fractiona-.tion.. The method of salt precipitation used so successfully for separating the toxic portion: of sample 87'met with sev~ral obstacles when applied to samplesof weak black liquor.. Due to the black liquor containing larger percentages of the constituents insoluble in the salt brine, the use of even larger volumesof ether did not effect a "distinct separation betweenthe brine and the precipitate. Filtration of sucl:J. amixture, using air-tight vessels filled with hydrogen,required several days and resulted in the loss of muchof the ether from evap·oration. Drying the materialby storage over calcium chlOI;ide in hydrogen-filleddesiccators required several weeks and caused thematerial to lose its physiological activity. When

168 FISHERY BULLETIN OF THE FISH AND WILDLIFE SERVICE
Isa~PI·r10
S"II••d
£11'"
FIGURE 71.-Scheme of fractionation of weak-black 'liquor (sample 90). Thephysiological effectiveness of the fractions is indi~ated by solid circles for effectiveand open circles for noneffective. •
placed in ,an evaculated desiccator the freshly. precipitated 'material at once overflowed its .containerand filled the entire desiccator with froth. Partialdrying over c~lcium chloride' in a hydrogen-filleddesiccator followed by the application of su~tion
caused a sudden efflorescence of the precipitate and, its loss by dispersion throughout the vessel. Despitecontinuous and vigorous shaking for 48 hours withmuch more salt (han was 'needed to completelysaturate the black liquor" a single treatment did notfully precipitate the toxic substances. Afte,r filtration, two further shakings with salt, each followedby i1ltration, were required to obtain. a nontoxictil,trate from weak black liquor. These precipitatesalways retained a considerable quantity of theoriginal black liquor taken for treatment because oftheir gelatinous character. .
In view of the difficultiel; described, the followingpro~edure was used in preparing precipitate forextraction. The weak liquor was shaken for 24
hours with salt and ether, then, filtered as rapidly aspossible under hydrogen. This process was re':peated for a total of three treatments: It ~vas
ne~essary to have ether present during the precipitation because the precipitates formed in its absencewere so hydrophilic that the sol·vent could not "wet"them enough to effect solution of the toxic substances. The toxic mat~rials in these precipitateswere isolated by continuous ether extraction forseven days in. a hydrogen-filled Soxhlet apparatus.The details of the f·ractionation and the results of thebioassays of the various fractions isolated from weaksulfate black liquor are given. in figure 71. Increasing con<;entrations from 1 : 32,000 to 1 : ,2,000were employed in the physiological tests on oysters.
No extensive discussion will be gi:ven of thevarious fractions siilce it would parallel very closelyth~t already given for sample 87. Only thefraction 98-20-2 needs comment. To conserve timethis fraction was prepared from black liquor sample

~.FFE(:T.Of: P\)L.P.-"1'\;tIt,L WASTES..ON YORK RIVER OYSTERS'
.. .
Studies of the cycles of temperature, salinity, cur-rents, oxygen content, pH, and. plankton, describedin the first part of this report, show that froman.
. ecological point of view, the conditions in the YorkRiver follow the seasonal changes commonly encountered in tidal waters of the Atlantic coast. Noabnormal deviation in these factors has been noticeqduring the course of the studies. It is true that theoxygen content was somewha't diminished in theupper part of the York River but the decrease wasinsignificant and cannot be considered as affectingoysters which are known to tolerate low oxygentension (Galtsoff and 'Whipple 1931). The potentialfood supply for oysters, measured by the total pro-:duction of plankton, was greater in the York Riv(,:rthan in the Piankatank River. Thus, an assumption that the lack of food for oysters was responsiblefor their failure to fatten in the York River cannot becorroborated by the evidence and, therefore, mustbe discarded.
Observations on glycogen cycles in the York Riveroyster and field experiments in transplanting oystersfrom the upper part of the river to its lower part anq(pp. 118-123) indicate the existence in the upperpart of York River of an environment decidedlyharmful to oysters. This harmful effect is mani- ..fested in the failure of oysters to accumulate glyc9gen,in a generally emaciated condition of theirmeat, and in the disturbance of the calcium metabolism which results in the abnormal condition of theshell.
Further proof that the upper part of YorkRiver provides an unhealthy environment is givenby the results of the field tests in which the James.~iver seed oysters, planted simultaneously in theupper and lower York River and in the PiankatankRiver' (fig. 36), fattened much more rapidly in thelast two localities.
Recovery of oysters taken from the upper part of .the York River and transplanted t<? other watersindicates the presence of some toxic factor in the
" upper York River which does not occur in adjacentlocalities. If the poor condition of the oysters inthe upper part of York River was due to infection byN~n/(itopsis spores, disease, or to degeneration of thestock, one would not expect their rapid recoveryafter.they were ·removed from the grounds and.planted in the lower part:c;>£ the York River or -in thePiankatank River. The question naturally aril?es·
98 .and ~ested wh.ile "tp.e cprr~sponding fractionpfsample 90 was undergoing the further' fracti.onationshown·. ·Whil~ the resl,llts ·6bta.in~d. wit,h the" weakblack liquor 'are ilOt as clear'cut as' ~hose obtainedwith sample. 87, they do. lead to "the same gen'eralconclusion.
CHEMICAL NATURE OF THE "PHYSIOLOGICALLYACTIVE MATERIALS IN SULFATE PULP-MILL
.EFFLUENTS
"A study of the specific sulfate pulp-mill productswhich exert a physiological effect upon oysters leadsto the conclusion that the toxic material tends toconcentrate in the soap portion of the mill products.European investigators (Ebeling 1930, 1931, 1932;Bergstrom and Cederquist 1937; Bergstrom andTrobeck 1937; Bergstrom and Vallin 1937; Hagman1936, 1937; -]arnefelt 1936; Vallin 1935; Vestergren1938)"have arrived at similar conclusions concerning'the toxicity of sulfate pulp-mill wastes to finnedfishes, ascribing th~ toxic action to' the resin acidsand their sodium and calcium salts.
It has been found, however, in the work reportedhere ~hat the sulfate soaps precipitated" from millliquors by salt were not toxic after treatment withether, whereas the ether extracts of these soaps didcontain the harmful material. This indicated thatthese soaps, wh~n precipitated from aqueous sa"lutionby salt, adsorbed the toxic substance of the millliquors. The necessity of repeat~d trea'tment of theblack liquor with salt, before complete removal ofthe toxic substance was effected, is a .further indication that its presence in the soap is due to adsorptionby the latter of material "salted out" of the blackliquor by the treatment with salt.
The sodium compounds in the black liquor willproduce an effect similar to the action of the salt.Sample 87 also gave corresponding results, althoughto a lesser degree; in that the ether extract (87-105)from the concentrated salt brine also contained toxicmaterial.
The exact nature of. the toxic material has notbeen 'determined, but the readiness with which ether.removes it from the soap leads to the· opinionthat we are dealing with a constituent of the unsaponifiable portion. I t .h~s been shown definitelyby Erdtman (1939) that the toxic substance in thecase of. the. European pine, Pinus sybestris, is adioxystilhene present in the heartwood of the tree.No such work has ever been under.taken upon theloblolly pine, Pil/us taeda, although the durability ofits heartwood has b~e.I!-.:recorde~:by'- Moh.r.(1897).... .
736878-47-8
DISCUSSION AND
.J~9
CONCLUSIONS

FISHERY BULLETIN OF THEFJSH AND WILDLIFE SERVIcE
whether the presence of foreign' substances introduced in large quantities with t!le pulp-mill effluentsat the head of the river at West Point is responsiblefor the pathological condition of the oysters. Directevidence of the harmful effect of the pulp-milleffluent is provided by the physiological experimentswhich prove its toxicity. The deleterious action ofthe effluent is manifested by its effect on the adductor~1Uscle, on the ciliary epithelium of the gills~ and onthe complex pumping mechanism of the oyster. Bydecreasing the number of hours the oyster staysopen, the presence -of the effluent in the water reduces the time normally used by the organism forfeeding. Furthermore, the rate of feeding is alsodecreased because of the depression of the ciliarymovement and reduction in the pumping capacity ofthe organism, due to the presence of the pulp-milleffluent.
The toxic agent in the effluent of the pulp millprodlices a general depressing effect which inhibitsthe principal functions of the organism and resultsin its failure to accumulate glycogen and probablyis responsible for the stunted growth of the oystersin the polluted area. This effect is apparently noncumulative, since under the conditions of the experiments; the oysters showed remarkable recoveryimmediately after their removal to unpolluted water.Their glycogen content increased to the normallevel, shells were strengthened by deposition of lime,and growth wa.s resumed.
The second question is whether the -pulp-milleffluent occurs in York River iil concentrationswhich were found to be effective in laboratory experi':nients. No chemical test is available at present forthe detection and quantitative determination of thepulp-mill waste in natural waters. A nitrosoligninreaction developed by Pearl and Benson (1940) forsulphite waste. liquor was not known at the the timethe investigations were carried on in York River.Even if this method were known, its application indetermining the concentration of pulp-mill effluentin York River would be of doubtful help because ofthe possibility that some of the nitrophenols whichIJ"roduce specific ~olor reaction may be normallypresent in .river water. Direct proof that harmfulsubstances -'are present in the water of the YorkRiver was obtained by collecting samples of waterin· the upper part of York River at the time when acOllsiderable area of the river was discolored by wasteproducts· discharged from the sewers of the pulp-
nlill plant at West Point, arid using these for bi6~
assays (p. 132). .Judging by the condition of the oysters ·in the
lower part of York River and' their ability t'o accumulate substantial amounts of glycogen, the deleterious effect of pulp-mill effluent extends downthe river as far as Allmond's Wharf. It is, of course,of great interest to determine what concentration ofpulp-mill effluent may actually occur in the upperhalf of the river and whether this concentration isof the same degree of 'magnitude as that whichproved effective in the laboratory experiments.The problem presented considerable difficultiesbecaus'e of the great fluctuations in the rate of thedischarge of the pulp-mill effluent and the changesin its specific gravity, presumably as a result of thedegree of its dilution, chemical composition, and age.Using a conservative figure for the rate of discharge,based on personal observations, ·alid knowing theresulting rate of flow of the river, it was possible tocompute this concentration. Calculations made byusing Hotte1ing's formula or employing the formulaproposed by Tuckerman (p. 101) gave comparableresults showing that either formula may be appliedin such a problem.
In order to arrive at the mathematical solution ofthe problem, it was necessary to. assume that thepulp-mill effluent is being discharged at a uniformrate, that it is rapidly and thoroughly mixed withthe wa ter, and is uniformly distributed in the river.It is realized that these assumptions deal- with amore or less theoretical case and that, under naturalconditions, the pulp-mill effluent is not dischargedat a uniform rate' and is not thoroughly mixed i;lthe river but probably follows a· definite path alongthe river axis. The above-mentioned assumptionshave'to'be made;·however, in order to solve themathematical problem. It appears significant thattheoretical calculations of the final concentrationof the pulp-mill effluent in the polluted· part ofYork River give a figure of 0.0004 or 1 : 2,500,which is of the 'same degree of magnitude as thethreshold concelitration determined by various laboratory tests. Thus, it has been shown that with'the existing flow of the river and the observed rateof discharge of pulp-inill effluent effective concentration of the effluent may be expected to occurin the York River. Furthermore,. the computationsshow that with a given rate ofdischarge of pulp-milleffluent at about 4.26 acre feet per day, this finalconcentration is're'ached within 100 days.
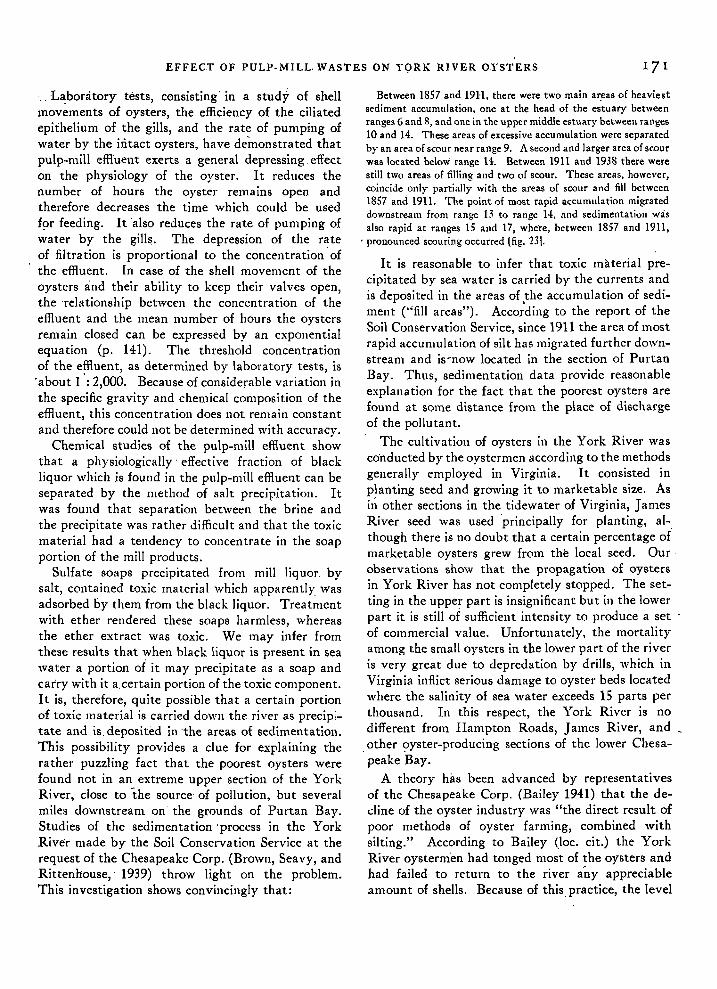
Between 1857 and 191-1, there were two main areas of heaviestsediment accumulation, one at the head of the e;tuary betweenranges 6 and 8, and one in the upper middle estuary betweeu ranges10 and 14. These areas of excessive accumulation were separatedby an area of scour near range 9. A second and larger area of sc.ourwas located below range B. Between 1911 and 1938 there werestill two areas of filling and two of scour. These areas. however,coincide only partially with the areas of scour and fill between1857 and 1911. The point of most rapid accumulation migrateddownstream from range 13 to range H, and sedimentation wasalso rapid at ranges 15 and 17, where, between 1857 and 1911,
. pronounced scouring occurred lfig. 231.
It is reasonable to infer that toxic material precipitated by sea water is carried by the currents andis deposited in the areas of the accumulation of se&·ment ("fill areas"). Acco;ding to the report of theSoil Conservation Service, since 1911 the area of mostrapid accumulation of silt has migrated further downstream and is~now located in the section of PurtanBay. Thus, sedimentation data provide reasonableexplanation for the fact that the poorest oysters arefound at some distance from the place of dischargeof the pollutant.
The cultivation of oysters in the York River wasconducted by the oystermen according to the methodsgenerally employed in Virginia. It consisted inplanting seed and growing it to marketable size. AsiII other sections in the tidewater of Virginia, JamesRiver seed was used 'principally for planting, although there is no doubt that a certain percentage ofmarketable oysters grew from the local seed. Our·observations show that the propagation of oystersin York River has not completely stopped. The setting in the upper part is insignificant but in the lowerpart it is still of sufficient intensity to produce a setof commercial value. Unfortunately, the mortalityamong the small oysters in the lower part of the riveris very great due to depredation by drills, which inVirginia inflict serious damage to oyster beds locatedwhere the salinity of sea water exceeds 15 parts perthousand. In this respect, the York River is nodifferent from Hampton Roads, James River, and _
,other <?yster-producing sections of the lower Chesa-peake Bay.
A theory has been advanced by representativesof the Chesapeake Corp. (Bailey 1941) that the decline of the oyster industry was "the direct result ofpoor methods of oyster farming, combined withsilting." According to Bailey (Ioc. cit.) the YorkRiver oysternlen had tonged most of the oysters andhad failed to return to the river any appreciableamount of shells. Because of this,practice, the level
EFFECT OF PULP-MILL. WASTES ON YQRK RIVER OYSTERS
., La:bonitory tests, consisting' in a study of shellmovements of oysters, the efficiency of the ciliatedepithelium of the gills, and the rate of pumping ofwater by the iii.tact oysters, have demonstrated thatpulp-mill efRuent exerts a general depressing. effecton the physiology of the oyster. It reduces thenumber of hours the oyster remains open andtherefore decreases the time which could be usedf~r feeding. It 'also reduces the rate of pumping ofwater by the gills. The depression of the rateof filtration is proportional to the concentration 'ofthe efRuent. In case of the shell movement of theoysters and their ability to keep their valves open,the -relationship between the concentration of theefRuent and the mean number of hours the oystersremain closed can be expressed by an exponentialequation (p. 141). The threshold concentrationof the effluent, as determined by laboratory tests, is'about 1 : 2,000. Because of considerable variation inthe specific gravity and chemical composition of theeffluent, this concentration does not remain constantand therefore could not be determined with accuracy.
Chemical studies of the pulp-mill effluent showthat a physiologically' effective fraction of blackliquor which is found in the pulp-mill effluent can beseparated by the method of salt precipitation. Itwas found that separation between the brine andthe precipitate was rather difficult and that the toxicmaterial had a tendency to concentrate in the soapportion of the mill products.
Sulfate soaps precipitated from mill liquor bysalt, contained toxic material which apparently wasadsorbed by them from the black liquor. Treat~lentwith ether rendered these soaps harmless, whereasthe ether extract was toxic. 'vVe may infer fromthese results that when black liquor is present in seawater a portion of it may precipitate as a soap andcarry with it a,certain portion of the toxic component.It is, therefore, quite possible that a certain portionof toxic material is carried down the river as precip;tate and is, deposited in 'the areas of sedimentation.This possibility provides a clue for explaining therather puzzling fact that the poorest oysters werefound not in an extreme upper section of the YorkRiver, close to "the source' of pollution, but severalmiles downstream on the grounds of Purtan Bay.Studies of the sedimentation' process in the YorkRiver made by the Soil Conservation Service at therequest of the Chesapeake Corp. (Brown, Seavy, andRittenhouse,' 1939) throw light on the problem.This investigation shows convincingly that:

FISHERY BULLETIN'OF THE FTSH':AND WILDLIFE SE.RVICE
of the existing oyster bars was lowered and increasedsilting 6f the river covered them with soft mud.
Silting and poor management of oyster reefs isoften responsible for the destruction of productiveoyster grounds. Examples of such conditions can befound in the depleted natural oyster grounds inSouth Carolina, Georgia, and Texas. If the. fa'ilureof the York River oyster industry resulted from acombination of these conditions one would expect tofind a, gradual decrease in the acreage available for~ultivation. We know, however, that the principaldifficulty in,the York River was the poor quality ofoysters, very low yield in pints of shucked oystersper bushel, discoloration' of oyster meats, and un~
pleasant flavor. These conditions are not found onthe grounds depleted through overfishing. It isreasonable to expect that they are due to some abnormal condition of"the environment and are not theresult of mismanagement o'r defects in the methods'of oyster culture.
There is no doubt that because of deforestationand cultivation of land, soil erosion has greatly increased with the corresponding increase in sedimentation of our rivers. The condition is general for theAtlantic coast and is not unique for the York River.We know, however, that oyster grounds in JamesRiver' continue to produce good oysters and up to·the present provide the principal source of seed forVirginia oyster growers. Likewise, there are nosigns that oysters in the Piankatank River areabnormal or poor. Observations and experimentsdescribed 'in this report show that the difficulty wasconfined to the upper part of the York River andthat there was a rapid recovery of York River oystersafter removal from the polluted waters. Bailey'sreport fails to mention the peculiar condition ofoysters or the fact that the York River receives largequantities of pulp-mill effluents, but blames theoyster industry for its poor practices and lack ofconservation. He all!o states that "the freshets thatbrought down the silt also caused fluctuations in thesalinity of the upper river, and with this change insalinity and silt conditions came new conditions aswell as new pests." Soine of the pests he mentions,namely, the oyster drill (Urosalp£nx ci1lerea) andthe' starfish (Aster£as forbes£) are so sensitive toI~wered salinity of water that the latter constitutesa barrie~ protecting 'the upstream oyster groundsagainst the depredation by these pests. It is a well~stablis~ed fact that the lowered salinity cannot be
responsibl,e for bringing these enetniest;o. the 'oystergrounds., In order to 'demonstrate that low oyster-production is not ..the result of pollution, the ChesapeakeCorp. acquired a large percentage of the leases and:put into operation a plan of growing oysters on trayssuspended or placed above the bottom. Thegrounds' selected for this purpose are located in thelower part of the river below Claybank wharf andat the mouth of Queens Creek. As shown in thepreliminary report (Galtsoff et al., 1938), and in thepresent paper, these grounds have no~ been affectedby pulp-mil1 pollution. The results of raisingoysters on platforms have not been disclosed by theChesapeake Corp. in detail with the exception ofMr. Bailey's statement (p. 7, loc. cit.) that "Whilethe primary purpose of the experiment was to demonstrate that an abundance of oysters of high
- quality could be produced in the York River whenplanted on hard bottoms or raised above the smothering silt deposits that prevail over a greater portionof the river bottom, the tray project, as carried onby the Chesapeake Corp., is on a practical basis inwhich money is only invested with the prospect of afair return." As the method requires a large investnlent of capital amI can be carried out only in thelocalities well protected against strong wind andwaves, it obviously cannot be used by local oyster-:men lacking large financial support and havingleases in the exposed areas of the river and in thebay. Furthermore, the method in which oystersare 'exposed at low tide is unsuitabl~ for Virginiawaters and in other localities where low winter temperature might kill them by freezing. To be appli-'cable to Chesapeake Bay and other waters north,the platform should be placed below low-water level.
During the course of the present studies, the'Chesapeake Corp. carried on a parallel investigationof. the physiological effect of pulp-mill effluent onoysters. The results of these studies were not described in detail in any technical journal but abrief sumnlary was published in a popular. articleby May (1943) which appeared in the February 1943issue of the magazine Travel. According to the de-:scription given in this article, the Corporation conducted a series of tests in which a number of trays'containing 2-year-old oysters were placed at sevenstations over a distance of 19 miles along the river,from 1% miles below West Point to Queens Creek.At each of these stations four trays with 2-year-old

, '
EFFECT OF PULP-MILL WASTES ON YORK RIVER OYSTERS
oysters were placed on the bottom and four trayssuspended 18 inches above the bottom. .The experi- .ment iasted 11 months. How often the trays wereexamined is not known, but May states (p. 90,loc: ,ch,) that "these guinea-pig mollusks were _watched almost breathlessly by the experimenters."
At the end of the eleventh month it" was found' thatthe oysters placed at the four stations located in theareas of greater sedimentation ("fill" area's) showeda "composite" survival of 65 percent in susp'endedtrays and 22 percent survival on the muddy bottom.At the three stations in the "scour" areas the nlortality was about the same for both the top a'nd bottombaskets. (Unfortunately,- the author fa·ils to disclose the exact figures of mortality.) The investigators of the Chesapeake Corp. draw .. from thesedata a conclu;>ion that "the entire test shows thatsilt· caused 40 percent death in the 'fill' areas,against practically no mortality b~cause of silt inthe 'scour' area." In the absence of a detaileddescription of the experiment' and because of theomission of essential data showing 'separately themortality ,at each of the stations, .it is difficultcorrectly to evaluate the results of 'the test. Onefact, however, appears to be significant. The reported cumulative mortality of 35 percent of t,he,oysters in the suspended baskets, and of 78 percentof those in bottom baskets, placed in the fill areas,far exceeds the normal annual mortality of the oysterpopulation which, according to our 'observation,usually does not exceed 10 percent. \ It is obviousthat either the experimental. technique was defectiveor the conditions in York River were deleteriousto oysters. Probably the latter assumption is correct; certainly, it is in accord with the findings of thisreport which have demonstrated the toxi~ effect of,the pulp-'mill effluent on the physiology of theoyster. High mortality. rate among oysters, reported by the Chesapeake Corp. and not observed
, by the authors of this report, was probably due tothe crowded condition of oysters_ .kept in trayssuspended in polluted water, to injuries caused bytransplanting them, and in taking up and loweringthe trays for inspection, and,. possibly, to other
. factors involved in the experiment. The fact thatthe death rate was higher among the oysters placedin' lllud than among those suspended abov~ it isnot surprising. Soft mud is not a healthy habitatfor oysters. In the York River this environment iseven less favorable because the toxic fraction of the
136873-47--9
black liquor is p'robably precipitated in pa'rt by saltwater and is deposited in the areas of the fill.
To prove that pulp-mill effluent has no deleteriouseffect on oysters the Chesapeake Corp. conducted asurvival experimen~, the details of which are notdisclosed. It is stated, however, by May (p. 30,loco cit.) that the experiment conducted from November 9, 1938 to May 18, 1939, consisted in keepingoysters in glass tanks filled- with water from Piankatank River to which' the pulp-mill effluent was addedin doses "beginning with the average percentage forYork River and increasing up to 77 times, Thelatter concoction was the color of cre1!mless coffee."Three duplicaJ;e tan~s with pure sea water were usedas controls. It is not stated how often the water wasrenewed. At the conclusion of the experiment,writes Mr. May, "there was a momentous oysteropening atteI;lded by all the important personnel ofthe milL There was' also present Mr. J. R. Nelso~who had spent much of hi's life in oyster culture who
. presided as an official observer." Death of oneoyster in the' control was recorded.
Final conclusion from the experiment conductedby the Chesape'ake Corp. is formulated as follows:
, ,
The experiment proved that 77 times the normal percentagewould not bring death to a York R.iver bivalve, probably becausethe carbohydrates or other ~ugary compounds. the salty compounds such as sodium carbonate and the ordinary. vegetablematter in ,effluent are natural shi::Jlfish foods although little ofthem might reach down river oysters in the widely flowing andrather deep York * * *. In general the more effluent inthe test tanks the fatter and happier the oysters appeared.
It is not clear whether this was only a personalconclusion of l\1ay or that he expresses a concensus ofopinion of all who were present at a "momentousoyster opening:" . Professional scientists would notventure to ascertain the "happiness" of the oysterand therefore disregarded this part of the conclusion.As to the effect of the pulp-mill effluent on fatteningof oysters the results of the experil~lent, if they arecorrectly presented, contradict all the observationsdescribed in detail in the present report. If May'sstatement be considered seriously, one would betempted to infer that increased pulp-mill pollution:of water in the York River should be encouraged forit would cause oysters to fatten and make them"happy."
It has been shown in the present study that thespecific gravity and toxicity ohhe pulp;-mill effluentwere subject' to great fluctuations. A certain decrease in toxicity took place after considerable

FISHERY BULLETIN OF THE FISH AND WILDLIFE SER VrCE
~mprovement in the dispo~al of the effluent wasmade at the pulp-mill plant. Furthermore, chemical and toxicological studies described in the report'showed that the toxicity of the pulp-mill effluentcould be greatly reduced' by oxidation (p. 164, fig.68). This suggests a method o.f treating the effluentwhich .would render it harmless before it is dischargedinto tidal waters. It is considered, however, th.atworking out a purely technical problem of the processof treatmen~ to be used at the mill is beyond thescope of the present investigation. The data obtained by the authors demonstrate that the physiologica( effect of the pulp-mill pollutant can be madeharmless through oxidation. It must be pointed out,however, that oxidation pr,oceeds rather slowly sincethe physiological effectiveness of the samples ofpulp-mill effluent· was' destroyed only after vigorous,treatment' with pure oxygen. One may expect,th~refore, that oxidation \n the river may be a slow
process ·and that the depressive action of pulp-milleffluent may remain effective for a long time. Experiments with samples of river water collected atWest Point (p. 132) corroborate this inference.
The results of several years of intensive study,carried out by the authors and described in detailin this report, have been presented here with thehope that they will be useful to the pulp-mill industryand to State conservation agencies in working outa practical solution to the problem of treatment andsafe disposal of pulp-mill 'wastes. It is the authors'strong belief that the calise of the conservation ofour seafood 'resources in coastal waters can best -beserved by preventing further inroads from pollutionand that through cooperation and mutual understanding of the problems involved a way may befound for the coexistence of the pulp mill and theshellfish industries, both valuable and necessary forthe welfare of our Nation.
LITERATURE CITEDAHLIN. ALBf:RT.
1908. Wie konnell die Unannehmlichkeiten verhindert werden,die eine Sulfat-Zellulosfabrik fiir die Nachbarn derselben unddie in del' Niihe befindlichen WasserJaiife mit sich brine-t? •Del' Papierfabribnt 6 ]ahrg.: 2373-2374; und US5-2487.~
AMERICAN PUBLIC HEALTH ASSOCIATION.1933. Standard methods (or the' examination of water and
.' sewage. Edition 7, 180 pp. New York.ANONYMOUS. "
1910. Del' Einflus5 del' Ab"wasser del' Sulfat-Zellulosfabriken.aus die Fischerei. Der Papierfabrikant 8 Jahrg.: 61.
ASSOCIATION OF AGRICULTl..JRAL CHEMISTS.1935. Official and, tentati"e methods of analysis. Revised
July 1, 1924. Edition 2, 535 pp., illus., Washingt<?n.BAILEY, ]OHN W. '
1941. Growing oysters in the York River. Addi'ess at themeeting of the Virginia Academy 0f Sciences, April .1941,Richmon~ (~i!Ueogr.aphed) 7 pp.
BENSON, H. K.; KOBt:, K. A.; and Sco'''' R. H.1941. Chemical studies of sulfite waste liquor pollution of sea
water. Pacific Pulp and Paper Industry 15: 29-47BERGSTROM, H. .
1939. Vattenfororeningar fran sulfatcellulosafab"riker. SvenskPapperstidn. 42: 223-228.
BERGSTROM, H., and CEDI,RQlIIST, K. N. '1937. Hartssyrorna forekomst i svartlut och trattvatten.
. Svensk Papperstidl). 40: 112.BERGSTROM, H., 'and FAGERLIND.
1909. 'Nebenproducte bei der Herstellung von Nat,ronzellulose.Del' Papierfabrikant 7 ]ahrg.: 7-27,78,104, 129.
BERGSTROM, H:, and ..TRoBECK, K. G. . ,1937. Bestiimning IIV mangden hartssyor i avloppsvattell fran
sulfatfabriker: Svensk Papperstidn. .40: 554-.BERGSTROM, H., and VALLIN. S. _ . - '_
1937.. Vattenfororening. Kungl. Lantbruks, No. 13.BIRCKNER, VICTOR. .
1919. The zinc content of some {,....)d products. ]our." BioI.Chem. 38: 191-203.
BOGGILD, G. B..1930. The shell structure of the mollusks. D. kg. Danske
Vidensk, Selsk. Skrifter, Naturbidensk.og mathem. Afd.,9 Raekkt>, 11,2: 233-325.' .
BROWN. CARL B.; SEAVY, LOUIS IVI.;.and RITTENHOUSE,GORDON.-1939. Advance report on an investigation of silting in the York
River, Virginia. U. S. Dept_ Agr., Soil Conservation Serv.,Sedimentation Study No. 32; 12 pp., 7 figs., Washington.
CALDERWOOD, H. N., and ARMSTRONG, ALFRED R..1941. Determination of glycogen in oysters. Jour. of Amer.
Assoc. Off. Agr. Chem. Feb. 1941: 154-165. '
CARPENTER,CHARLES H. .1937. A study of the ether soluble material in sulfite pulp from
southern pine. Paper Trade Jour. 105, T.' S.: 224.CIRVES, F. ].'. ,
1930. General lIJ.1alysis of black liquor. Paper Trade Jour. 91:55-56.. .
CIRVES, F. ].1930. ,An investigation of sulfate, w:iste liquor. Paper Trade
Jour. 91: 56-58. .
COLE. A. E.1935. The toxicity of methyl mercapta'n for fresh water "fish.
Jour. Pharmacol.and Expt. Therap. $4: 448-453.
COLE, A. E., and WARRICK, L. F.1935. Water pollution studies in Wisconsin. Effects of Indus
trial (pulp and paper mill). wastes on fish. Sewage Works]our.7: 280--302. . .
Cox, RICHARD F: B. - .1940. Constituents of wood rosin: 3, 5-Dimethoxystilbene.'
Jour. Amer. Chem. Soc; 62: 3512-3513." ,
,DOBSON, G. C. ' "'1936. A formula for cap,acities of reservoirs. Soil Conservation,
vol. l,-pp. 7-9.
DUGAL, L. P., and, IRVING, LAURENCE.1937. Secretion of calcium carbonate by the hermetically sealed
clam, rfllUS lIIlTcfllaTia. Comptes Rendues, Soc. Bio!. 124:526-528. '
EBE'L1NG, GEORG.1930. Untersuchung del' oberschleisischen Oder im Winter
i928-29. Zugleich ein Beitrag zur Frage der fischereilichenSchiilichkeit yon Zellstofflibrikabwassern. Zeit. f. Fisch. 28:221.
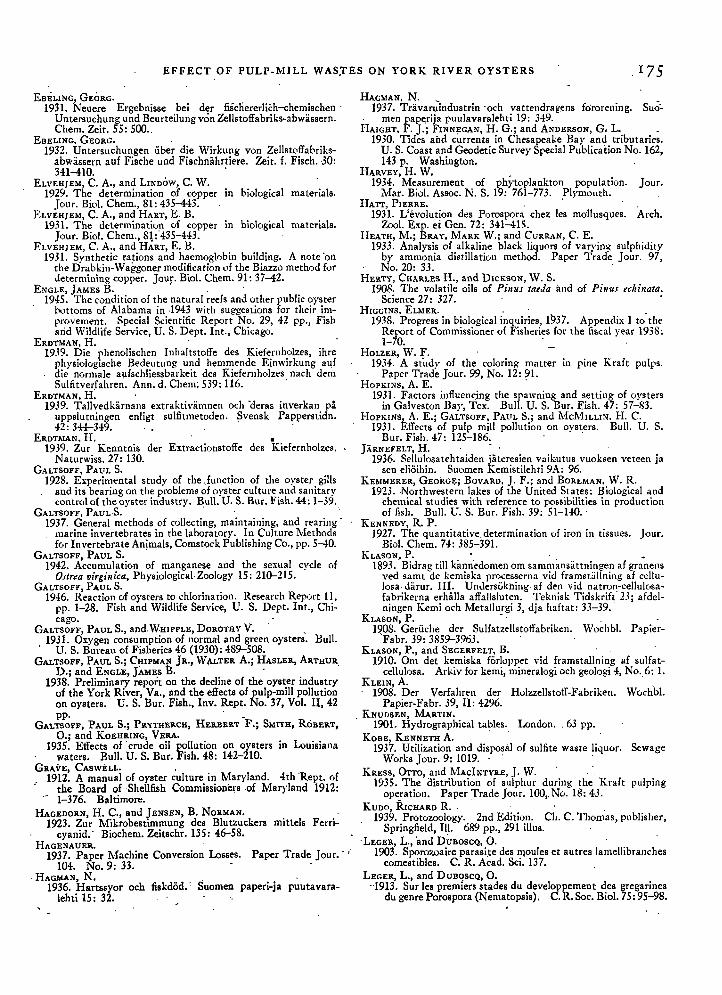
EFFECT OF PULP-MILL WAS:rES ON YORK RIVER OYSTERS
EBELING, GEORG. .1931. Neuere Ergebnisse bei del' fisthererlich-chemischen·
Untersuchung und Beurteilung von Zellstoffabriks-abwiissern.Chem. Zeit. 55: 500..
EBELING, GEORG.1932. Untersuchungen iiber die Wirkung von Zellstoffabriks
abwassern auf Fische und Fischnahrtiere. Zeit. f. Fisch. JO:341-410.
ELVEHJEM, C. A., and LINDOW, C. W.1929. The determination of copper in biological materials.
Jour. BioI. Chem., 81: 435-443.ELVEHJEM, C. A., and HART, E. B.
1931. The determination of copper in biological materials.Jour. BioI. Chem., 8\ :·435-443.
ELVEHJEM, C. A., and HART, E. B.19.11. SYnthetic rations and haemoglobin building. A note 'on
the Drabkin-Waggoner modification of the Biazzo method fordetermining copper. Jour. BioI. Chem. 91: 37-42.
ENGLE, JAMES B. ..1945. The condition of the natural reefs and other public oyster
. bottoms of Alabama in ·1943 with suggestions for their improvement. Special Scientific Report No. 29, 42 pp., Fisharid Wildlife Service, U. S. Dept. Int., Chicago.
ERDTMAN, H.1939. Die phenc,lischen Inhaltstoffe des Kiefernholzes, ihre
physiologische Bedeutung und hemmende Einwirkung auf. die normale aufschliessbarkeit des Kiefernholzes nach dem
Sulfitverfahren. Ann. d. Chem; 539: 116.ERDTMAN, H~
1939. Tallvedkarnans extraktivamnen och "deras inverkan pauppslutningen enligt sulfitmetoden. ~vensk Papperstidn.42: 344-349. .
ERDTMAN, H. •1939. Zur Kenntnis del' Extractionstoffe des Kiefernholzes.
Naturwiss. 27: 130.GALTSOFF, PAUL S.
1928. Experimental study of the .function of the oyster gills. and its bearing on the problems of oyster culture and sanitary
control of the oyster industry. Bull. U. S. Bur. Fish. 44: 1-39.GALTSOFF, PAULS. '. ..
1937. General methods of collecting, maintaining, and rearingmarine invertebrates in the laboratory. In Culture Methodsfor Invertebrate Animals, Comstock Publishing Co., pp. 5-40.
GALTSOFF, PAUL S. .1942. Accumulation of manganese and the sexual cycle of
OJ/rea virgilzica, Physiological· Zoology 15: 21D-215.GALTson', PAUL S.
1946. Reaction of oysters to chlorination. Research Report 11,pp. 1-28. Fish and Wildlife Service, U. S. Dept. Int., Chi-cago. .
GALTSOFF, PAUL S., and.WHIPPLE, DOROTHY V. .1931. Oxygen consumption of norma·l and green oysters. Bull.
. U. S. Bureau of Fisheries 46 (1930): 489-508.GALTSOFF, PAUL S.; CHIPMA!I JR., Wi\.LTER A.; HASLER, ARTHUR.
D.; and ENGLE, JAMES B. .1938. Preliminary report on the decline Qf the oyster industry
of the York River, Va., and the effects of pulp-mill pollutionon oysters. U. S. Bur. Fish., Inv. Rept. No. 37, Vol. II, 42pp. .
GALTSOFF, PAUL S.; PRYTHERCH, HERBERT OF.; SMITH, ROBERT,0.; and KOEHRING, VERA.
1935. Effects of 'crude oil pollution on oysters in Louisianawaters. Bull. U. S. Bur. Fish. 48: 142-210.
GRAVE, CASWELL. .. 1912. A manual of oyster culture in Maryland. 4th ·Rept. of. the Board of Shellfish Commissioners .of MaiTland 1912:
1-376. Baltimore.HAGEDORN, H. C., and JENSEN, B. NORMAN. .
1923. Zur Mikrobestimmung des Blutzuckers mittels Ferricyanid." Biochem. Zeiuchr. 135: 46-58.
HAGENAUER. .1937. Paper Machine Conversion Losses. Paper Trade Jour.. ,
104. No.9: 33. . ".·HAGMAN, N.
1936. Hartssyor och fiskdiid.: Suomen paperi-ja puutavaralehti 15: 32.
HAGMAN, N. _1937. Triivaruindustrin 'och vattendragens fcirorening. Su';~
· men pap~rija puulavaralehti 19: 349.HAIGHT, F. ].; FINN~GAN,H. G.; and ANDERSON, G, L. _
1930. Tides and currents in Chesapeake Bay and tributaries.U. S. Coast and Geodetic Survey Special Publication No. 162,143 p. Washington.
HARVEY, H. W. .1934. Measurement of phytoplankton population. Jour.
Mar. BioI. Assoc. N. S. 19: 761-773. Plymouth.HATT, PIERRE. . '
1931. L'evolution des Porospora chez les mo-Ilusques. Arch.Zool. Exp. et Gen. 72: 341-415.
HEATH, M.; BRAY, MARK W.; and CURRAN, C. E.1933. Analysis of alkaline black liquors of varying sulphidity
by ammonia distillation method. Paper Trade Jour. 97,No. 20: 33. .
HERTY, CHARLES H., and DICKSON, \V. S.1908. The volatile oils of Pillus tarJ<l and of Pit/us rel/ill<lta.
Science 27: 327. .HIGGINS, ELMER.. .
1938. Progress in biological inquiries, 1937. Appendix 1 to theReport of Commissioner of Fisheries for the fiscal year 1938:1-70. .
HOLZER, W. F.1934. A stildy of the coloring matter in pine Kraft pulps.
Paper Trade Jour. 99, No. 12: 91.HOPKINS, A. E. .
1931. Factors influenc;ing the spawning and setting of oystersin Galveston Bay, Tex. Bull. U. S. Bur. Fish. 47: 57-83.
HOPKINS, A. E.; GALTSOFF, PAUL S.; and iVfcMILLIN. H. C.1931. Effects of pulp mill pollution on oysters. Bull. U. S.
Bur. Fish. 47: 125-186.JARNEFELT, H. . " . .
1936. Sellulosatehtaiden jiiteresien vaikutus vuoksen veteen jasen eliiiihin. Suomen Kemistilehti 9A: 96.
KEMMERER, GEORGJ;:; BOVARD, J. F.; and BOREMAN, W. R.1923. -Northwestern lakes of the United States: Biological and
chemical studies with reference to possibilities in productionof fish. Bull. U. S. Bur. Fish. 39: 51-140.'
KENNEDY, R. P.1927. The quantitative. determination (,f iron in tissues. Jour.
BioI. Chem. 74: 385-391.KLASON, P. . . •
1893. Bidrag till kannedomen om sammansattningen af granensved sanlt de kemiska pro~esserna vid framstallning af cellulosa darur. III. Undersokhing. af den vid natron-cellu1c,safabrikerna erhalla affallsluten. Teknisk Tidskrift 23; alde!ningen Kemi och Metallurgi 3, dja haftat: 33.,..39..
KLASON, P. - .1~08. Geriiche del' Sulfatzellstoffabrikeu. Wochbl. Papier-
Fabr. 39: 3859~3963. .KLASON, P., and SEGERFELT, B.
1910. am det kemiska fiirloppet vid framstallning af sulfatcellulosa. Arkiv for kemi, mineralogi och geologi 4, No.. 6: I.
KLEIN, A.· 1908. Del' Verfahren del' Holzzellstoff-Fabriken. Wochbl.
Papier-Fabr. 39, II: 4296.. KNUDSEN, MARTIN.
1901. Hydrographical tables. London.. 63 pp.KOBE, KENNETH A. '.
1937. Utilization .and disposal of sulfite waste liquor. SewageWorks Jour. 9: 1019. . . .
KRESS, OTTo, and MAcINTYRE,]. W.1935. The distribution of sulphur during the Kraft pulping
operation. Paper Trade Jour. 100" No. 18: 43.KUDO, RICHARD R.. . .
1939. Protozoology. 2nd Edition. Cli. C. ThoIl1aS, publisher,· Springfield, Ill. 689 pp., 291 illus. .·LEGER, L., 'and DUBOSCQ, O. . '
1903. Sporozoa ire parasi.te des nloules et autres lamellibranchescomestibles. C. R. Acad. Sci. 137.
LEGER, L., and DUBQscQ, O."1913. Sur les premiers stades du deve10ppement des gregarines
du genre Porospora (Nematopsis). C. R. Soc. BioI. 75: 95-98.

FISHE'RY BULLETIN OF THE F.ISH AND WILDLIFE SERVICE
LIANDER, H.1938. Om alkaliforlusterna i sulfatfabrikernas sodahus. Svensk
Papperstidn, 4-1: 267.LOOSANOFF, V,CTOR L...· 1939. Eff~ct of temperature upon shell movement of clams,
r~llus mawlaria (L). Bio\. Bull. 76: 171-182.Ll'MAN, JOHN, and FLEMING, RICHARD H.
1940. Composition of sea water. Jour. of Marine Research 3: .134-146.
MARTIN, GEORGE "V. . .1923. Food of the oyster. Botanical Gazette 75: 143-169.
MAY, EARL CHOPIN.1943. Harvesting oysters in Virginia. Travel, Feb. 1943: 22-21
and 30. R. M. McBride & Co., East Stroudsburg, Pa.McKEE, RALPH H., and BLENGSLI, H. L.
1936. A new meth(,d of refining tall oil. Paper Trade Jour.. 103, No. 14: 33.. . .
.l\kKEE, RALPH H., and BLENGSLI, H. L.1936., Historical development of the tall oil industry. Paper
Trade Jour. 103, No. 12: 34..MELOCHE, V. W., and ~ETTF.RQUIST,T.
1933. The determinatk.n of calcium in lake water and lake.water residues. Trans. Wis. Acad. of Sci., Arts and Letters,28: 291-296.
.I\'10HR, CHARLES.1897. Timber pines of the southern United States. U. S.
D~pt. Agr., Forestry, Bqll. 13, 176 pp., Washington.NE;LSON, THURLOW C.
1936. Water filtration by the oyster and a new hormone effectupon rate of flow. Proc. Soc. Exper. Bio\. Med. 34: 189-190.
ORTON, J. H. .1924. An account of investigations into the cause or causes of
the unusual mortality among oysters in English oyster bedsduring 1920 and 1921, Part 1. Ministry of Agriculture andFisheries, Fishery Investigations. Series II. 3, No.3: 1-199.
ORTON, J. H., and AJI,IlRTHALINGAM, C.1927. Notes on shell depositions in oysters with a note on the
chemical composition of ., chalky" deposits' in shells of O.edulis by Bill, H. O. Jour. Mar. Bioi. Assoc; N. S., 14:935-954.
OXNER, M,EZCYSLAW.1920. Manuel pratique de I'analyse de Peau de mer. r. Chlo
ruation par la methode de Knudsen. Bull~tin de fa Commission Internationale pour I'exploratioil scientifique de la MtrMedeterranee. 3: 1-36. . .
PEARL, IRWIN A., and BENSON; H. K.1940. A nitrosolignin colorimetric test for sulphite waste
liquor. in s,:a' water. Paper Trade Jour.; Oct. 31., 1940.2 pp.
PFLUGER, EDWARD.1906. Eine neue Methode der Glykogenanalyse. Pfluger's
Archiv. 114: 231-247.POLLAK, A. . .
1938. Fatty acids frpm pulp mill wastes. Oil and Soap 15,No.2: 33.
PRYTHERCH, HERBERT F.1929. Investigation. of the physical' conditions controlling
spawning of oysters and the occurrence, distribution, andsetting of oyster lan'ae iIi Milford Harbor, Conn. Bull.Bur. Fish. 44-: 429-503.
PRY"l'HEKCH. HERBERT F.1938. Life cycle c,f a spor('zaan parasite of the oyster. Science
. 88: 451-452. :.PRYTHERCH, HERBERT F. .
1940.· The life cycle and morphology of N,·malop.,is 0.<lr,·arIl1ll,sp. llOV., a gregaTine parasite of the mud crab and oyster.
· . JO\lr.·of Morphology, v. 66: 39--65. '.RAMAGE, W. D., and MILLER C.
1925. 'The salt error of cresol red.. Jour. Amer. Chem. Soc. 47,WQ-1235.
R,CHARDS, M. B.1930. The colorimetric determination of manganese in bio· . IOl;;ical material. Analyst, 55:; 554-5.60.
R,NMAN, E. L.. .1911. Framstaiining af .cellulosa ur ved enligt natronluteller
sulfat-method med samtidig utvinning af vedens ofrigabesra.ndsler i form af vardefulla biproductor. Svensk kemisktidskrift 23: 16:3. .
SCHMIDT, W. J. .1938. Studien iiber Pinnaperlen I. Mitteilung ueber Prismen
perlen von Pinna nobilis. Zeitschrift flir Morphologie und. Oekologie der Tiere, 25: 235-277; II, 278-287. .SCHNEIDER, A.
1892. Signalement d'un nouveau spol"Ozoaire. Tab\. Zool. 2.SEIWELL, H. R.. 1935. The annual organic production and nutrient phosphorc'us
requirements in the tropical western North Atlantic J. duCons. Inter. pour l'Explor. de Ja Mer 10: 20-32. .
THOMPSON, T. G., and ROBINSON, R. J.1932.. Chemistn· of the sea. Bull. Nat. Research Council.
No. 85 : 95-203, Washington .TKOBECK, KARL B.
1939. Undersokninger av svartlut. Svens». Papperstidn: 42:554-557.
TlTLLBERG, TYCHo.1882. StlIdien iiber den bau und das Wachsthum des Hummer
panzers und der MoJluskenschalen. Kon. Svenska Veten.Ak. Handlinger, Ny. Foljd, 19 (1881) No.3: 1-57, 12 pis.Stockholm.
U. S. COAST AND GEODETIC SURVEY.1935. Manual of tide (.bservations. U.·S. Coast and Geodetic
Survey, Special Publication No. 196; 82 pp., ill us. Washington.'
U. S. ENGINEERS. .1930. Pamunkey River, Virginia (York River System). House
Doc. N(). 54, 71st. Congress, 2nd Session, H2 pp., illus.'INashington.· .
VALLIN, S.1935. Cellulosafabrikerna och fisket. Kung!. Lantbruks,
IvIed. f. Statens undersoknings:..och forsoksanstalt for sotvat-tenfisket, No.5. -
VALLIN, S.1939. Vattcnfc,roreningar fran sulfatcellulosaf"briker. Svensk
Papperstidn. 42: 251-256.VES1'ERGREN. J.
1938. Teknik och vetenskap inom pappers-och cellulosaindustrien under senaste tid. Sv.::nsk Papperstidn. 41:463. .
V,NES, H. W.1934. Green's Manual of Patbology. 15th Edition, London,
928 pp.VON EULER, A. C.
1921. Nagra forsok att skilja fett-och hartssvrorna i s. k.flytande harts fran sulfatfabrikerna. Arkiv 'kemi, min. 0,
-geo!: 8 No.4: 1. 'VORCE, LOZAN R.
1915. Determination of minute amounts of phenols in pollutednatural waters. Industrial and Engineering Chemistry 17:751. .
WAHLBERG, H. E.. 1924. Forsok med sulfatsiipa cch sulfatolja (" Flytande Harts").
S.vensk Papperstidn: 27, 168.WALLACH, J. A.
1937. Fatty acids from pine wood. Soap 13, No. 3:31-73.WEGNER, N.
1930. Berakning av svartlutens torrsubsubstansmangd vidkokning av kraft papp.::r. Sv.::nsk Papperstidn, 33: 51'9.
WHIPPLE G. c.. and WHIPPLE, M. C.- .1911. Solubility of oxygen in sea water. Jour. Am. Chem:
Soc. 33: 361.WINKLER, L. W.
1888. Die bestimmung des in \Vasser gelosten Sauerstoffes.Berichte d. deutschen chemischen Gescllschaft, 21: 2843-2854. Berlin.
ZESKIND, L. .l\/I.1926. Instructions for tidal current smveys. U..S. C~ast
and Geodetic Survey, Special Publication No.. 124, 48 pp.,ill us., Washington.

EFF:ECT OF PULP-MILL WASTES ON YORK RIVER OYSTERS 177TABLE 6.-11yclrogrophic dalc~f(Jr slalioll 20 ill Illr IO!l'er York Rill.., off Salld"o.~
[Average deplh 10.5 feel]
Percent.1g~
saturation with. dhsSQ\ved oxygen
}'hr,sphOfUSpHSalinity
TimeI \Vater temperature
.. Turhid~
~t:I"Uille TiJc~ 1 itr disC'r«,din/:. I I
___~~ . . SlJrf3~'e Bc,tt(l=- Surface . Bot~.)n:' ~~~C~. Bolto=- ~face Botwm ~.~race ';'Bott')ln
Date
Milti- Alilli:[03J ParIs p~r PelTIJ per gTclPIIS pfT gr(lm3 'JIlT
10:30 •. m~.____I1Ifl'" o C. o C. tl'OUS.I"i thQ,iJ,lIId cubicmtlcr cubic me.~tr
Dec. 6 4 I.E 1.7 6.6 6.5 20.23 20.37 7.9 7.9-----.~-- -.------- 94.2 92.2
12 1:45 p. mo. ____ 5 l·.E 1.7 6.7 6.8 20.59 20.84 8.0 8.0 -- .. ---.-. -~------~96.2 90.5
23 2:40 p. m•• ____ 6 LE 1.7 3.4 3.6 21.53 21.49 7:9 7.9 ---_._-~- --------. 110.8 96.8
1936
Jan. 4 9:20 •. mo._. __ 7 LE 1.1 1.6 1.6 21.08 21.08 7.9 7.9 --- .. _--- --'-'1'r:- 95.1 94.121 10:25 •. m_ ••. __ 8 FE 1.7 2.4 2.4 11. sr, 11.60 7.7 7.7 'Tr.
----9~:5- ·-··-9j:§Feb. 19 iO:35 a. In ••• _._ 9 I.E .8 .5 .7 13 .35 15.68 7.9 7.9 16.0 16.028 9:55 a. m•• _. __ 11 FF 1.1 2.6 2.5 14.83 1-1.96 7.9 7.9 Tr. Tr. .._------- --- ... ----
M:lf. 4 1:50 p. m___ . __ 12 !"E 1.8 4.9 3.9 12.93 12.39 7.8 7.7 Tr. Tr. --'ioiT ---- iM:716 10:30 a. In __ • ___ 14 ]2E 1.3 8.8 7.1 12.88 15.7U 8.1 8.t" 3.0 Tr.23 3:10 p. m.. _••_ . 16 FE 1.0 8.6 8.3 13.M 13 .98 -'--'8T ----·s:i- Tr. -.---1'.::: ---ii~:4" '--~ii~:630 3:.J.$ ~"'. !JL _____ 17 LF 1.1
I12.7 12.1 11.26 12.29 Tr.
Apr. 8 9:10 ~I. 111 ______ 18 HWS 1.0 10.3 10.1 12.71) 12.68 8.1 8.1 Tr. Tr. --------- ---------I-l 9:45 •. m_____ • 20 LE .8 11.6 11.1 10.28 10.54 8.0 8.0 0 0 99.7 %.5
l\·l~y 1 9:20 a. m~ __ • __ 21 I.E .7 15.9 15.4 1.1.01 13.84 8.-1 8.4 ."fr. Tr. ---- --~-- ---~-----
12 ~:45 a. m______ 22 J~F 1.5 19.7 19.2 13.87 14.09 8 . .1 8.3 Tr. Tr. --------- --.~----.
28 10:,0 a. m______ 23 ~oE 1.1 21.5 21.4 . 15.25 ---i3:89- --------- 3.0 1.0 .94.3 --------.June 27 9:20 ~. nL_____ 28 LE 1.2 ----2sT U.5 ---17:;;.i' --·--S:03- -"-.-;;:4" -.. _---.~ --------- ---i06§ ----iin30 2:05 p. m__ •___ 29 LWS 1.1 24.9 18.22 -----1';: ----.'T;:July 6 1:40 p. m_____ . 29:l. !oE
I,1.1 25.5 25.8 18.50 ---i;i:9t5- -"--n- -"--"7:8' ~-- ... -._- ------ .. -
15 1O:~5 •. m__._._ 30 LE 1.1 26.7 26.5 19. "6 6.2 6.2 ---iioj- ----ioi:i27 1O:3U a. m______ 3l LE 1.8 26.4 26.1 21.00 21.08 7.7 7.9 4.0 .1.1Aug. 1-1 12:30 p. m__ • ___ 33 LE 1.5 27 ..1 27.0 20.82 20.82 7.9 7.9 6.2 6.2 ---ios:03- ----Ioi:o26 2:30 p. m __ ~_ •• ·H
t-i\ff.~1.8 29.3 28.3 21.92 21.92 8.1 8.1 6.2 6.2
Sepl. 14 W:15 •. m. ____ • 35 1.5 25.2 25.3 23.39 23.42 7.6 7.7 ----30:0- ----i~T84.8 88.4
Oct. 2 9:45 a. In_. __ ._ .16 LF 1.5 21.4 21.3 2~.M 23.68 7.8 ·7.9 - 93.8 97.720 9:30 •. m. __ •• _ 37 J~F 1.7 20.1 20.0 23.40 23.51 8.1 8.1 12.4 12.4 74.2 88.5
Nov. 6 8:45 a. m.• __ ._ 38 LWS 1.9 14.9 14.6 2.1.13 2.1.22 8.1 7.8 12.4 12.4 92.0 95.624 2:20 p. m.•••• _ 39 FF 2.0 9.7 9.7 22.91 20.1-1 8.0 8.1 30.0 18.6 --- .... _~- _____ .a_.
Dec. 8 10:30 •. m. _____ 40 J.WS 1.6 5.1 5.2 22.6$ 22.66 8.0 8.0 Tr. Tr. --- .. _--- ---.-._--1-1 10:30 •. m_. __ ,_ 42 FE 5.7 5.7 21.~'1 21.~6 7.9 7.9 6.2 Tr.
---~----- --_. ----.[937.
Jan. 4 2:2.1 p. m.•• ___ 43 LF 2.11 7.7 7.4 21.02 2\.13 7.9 7.9 Tr. Tr.
:::f~i:;r::;J;I:25 2:30 p. m_ .. ___ 45 LE 1.8 10.5 10.1 16.82 17.14 8.1 8.1 Tr. Tr..
Feb. 15 10:50 a. m._. __ • 46 HWS 1.2 5.5 5.5 18.37. 18.37 7.8 7.9 ----isT ----io:o-Mar. 5 9:-15 a. m___ • __ 47 LWS 1.9 -1.4 4.2 16.83 17.48 8.1. 8.131 9:45 a. m_. ___ , 49 LF .7 7,7 7.7 17.21 17.21 S.4 8.4 .Tr. Tr.
Apr. 26 3:35 p. m••_•• _ '50 LE 1.0 13.6 ILl 18.30 18.57 8.1 8.1 6.2 6.2 96.81 90.7
I LWS=Low.waler slack; HWS';'High waler slack; LE=Lasl of ebb; Lf=L;fl 01 flood; FF=First of flood; elc.2 Tr.=Trace.· .'
TABLE 7.·-Hyclrograpllicdola for .rfalioll J.t. ill llif J"ork Ri~er bflrko Carll/illfS /slollds
[A,-erage depth 8.3 leetl
PercentageWater temperature Salinitr pH Phosphorus saturation with
Dale -Time .Cruise T"rbid· dis50lved 6.y~en
____1" 1___ Tide 1.. ~7.d~~; Surf~ce I Botlom_ Surf~ce Botlom S",fa<c I Bottom Surlace. Boltom ...:.:.::.. Bottom '.
. Milli- Alit/i-ParlJ ptr Paris ptr grtlms per grams per
Mf/'" ·C. o C. thQluonJ thouJanJ rubittntttr cubicmrt"4 LE "--iT 9.3 9.2 20.63 20.-16 7.7 7.7 -----".--- --------- 92.5 9.1.05 FE 6.4 6.6 20.26 , 20.30 8.0 8.0 ._._-.--- ---_.-.-- 95.8 96.4
[935
Dec. 2. 10:30 "' m_••• _.12 12:45 p. 111 ••
[936__ •• •• • 96.8 97.4
'Tr. Tr. __ • __ ••• __ • _._._._._. 12.4 •• 93.4
• Tr. • .____ 96.6 .85.6Tr. Tr.. __ • __ ._. • _
103.5 109.0
Jan. 3 2:40 p. m__ .__ 7 FF .7 2.4 2.2 20.70 20.77 8.0 8.021 12:lOp.I11__ .__ 8 LE 1.0 3.2 3.2 13.12 .13.57 7.7 7.7
Feb. 19 12:50 p. m..... 9 LWS .7 __ • .__ .7 •••• _._._ 10.03 __ ••_••• _ 7.727" -1:00p. m_____ 11 HE _ 3.8 3.6 13.44 13.30 7.9 7.9
Mar. 4 3:15 p. m__ .__ 12 LE --'-i::i 6.2 6.1 10.23 10.32 7.7 ,7.718 11:45a.m._____ 14 ~'E 1.2 8.7 8.4 13.68 14.76 8.1 8.124 8:50 a'.m••_._·_ 16 hF .6 8.8 8.5 16.22 12.52 7.9 8.0 "'--'T'::- -- ....'T;:
Apr. 8 11:45.a. m_•••_. 18 FF .7 10.5 10.-1 12.16 12.09 7.9 7.9 Tr. Tr. -.- ------- ••14 10:45 a. m.__••• 20 LWS .7 12.3 11.9 7.83 9.54 7.8 8.0 0 O' 92.3' _100.027 10:00 a. m._••__ 21 FF .7 ••• 12.7 14.16 ••• 8.6 •• __ • __ • Tr. 117.5
May 12 10:50 a. m__••__ 22 'LF 1.1 21.1 20.1 --'li:77- 13.78 8.2- 8.2 Tr. Tr.28 1:29 p. m._... 23 FF.7 22.9 15.26 •••••• ._._____ Tr.
I LWS=Low waler .Iack; HWS=High water slack; LE",Last of ebb; LF=Last of'flood; FF=Firsl of flood; etc.I Tr. =Trace. .
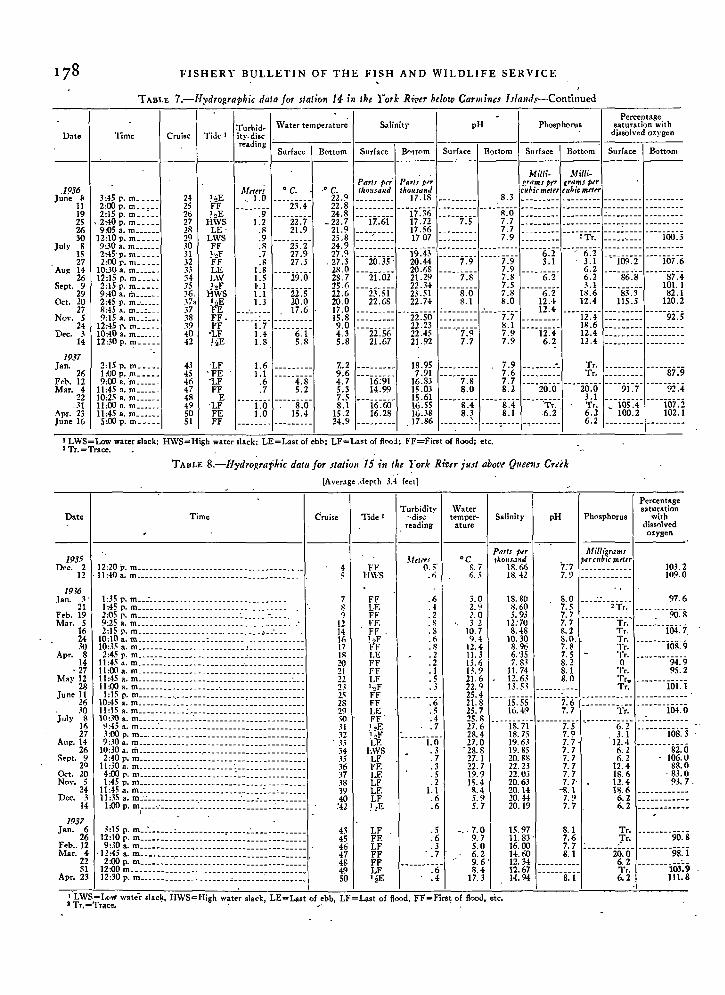
FISHERY BULLETIN OF THE FISH AND WIl.DLIFE SERVICE
TABI.E 7.-11yarographic data for Jlalion 14 in the l"ork Ri,'er belot!> Carlllinu hlall.l.r-Continued
3:45 p. m _2:00 p. m _2:15 p. m __ : __
,2:40 p. m _9:05 a. m _
12:10 p. m _9:30 a. m _2:45·p. m_· _2:00p.m _
10:30 a. m _12:15 p. m _2:15 p. m _9:40 a. m ~
2:45 p. m_· _~:45 a. m __ , _9:15 a. m __ , _
12:45 p. m _10:40 a. m _12:30 p. m _
.1936June ~
1119252630
Jull' 81527
Aug 1426
Sept. 929
Oct. 2027
No\". 524
Dec. 314
PercentageTurhid.. \Vater temperature Salinity pH PhQltphorus r;aturati.)n with
Date Time Cruise Tide I . d" dissolved oxygen
. . .- __. ':~~di~~ Surface \ Bottom Surface I Bottom Sllr~ace I B'Jttom Surface Bottom· Surface _I Bottom
. . . Milli- Mil/i-. . I.. ~H!t~h~s"r £r4mS~!WmJ~'
A/tltrs 0 c. .0 c. tJ,QIUdlltl thousdnd Cllbit"lntur cltbic mtttTH I;,E ,1.0 ll.? 17.18 8.3 _
H ~~S ----;J ----:;:;- JH ===i;.:~i= ---inr -----;:~- ----Tf ::::::::: ::::::::: =:::::::: :::::::::2R LE· .8 21.9 21.9 17.56 7.7 : _
}~ WS :~ ----25:2- 5U 1707 ---------. 7.9 --------- 'Tr. -----.---- 100.3
n !;f :~ ~n .~n ===i6:i~~ ---~i:ll- =====;:~= =====;:~= ----Tf ---cIf :~=i~:i= ====i6;:~~{h~ U 29.0 ~U ---ii:iii- ~n~ 7.8 U -----6:2" ~J ----s6T -----S7:4~~. J~fs U ----iiT ~U --Ti:5i- ~Ut -----s:6- U -----6:2" ItA ----S3:3" IgU
~~' ff. 1.3 i~:g. IH ---~~:~~- ---~~:;:- ~----~:~- -.----;:~- tU ----~~:~- ---~~~:~- ----~~~:;~g. -n: ----iT ==:::~:i= U 22.56 ~U~ ----·"7:9- n ----i2:4" tU ===:===== =========42 .I'E 1.8 5.S 5.8 21.67 21.92 7.7 7.9 6.2 12.4 _
/937Jan. 2:15 p. m _____ 43 LF 1.6 --------- 7..2 18.95
26 1:00 p. m _____ 45 'FE 1.1 -----4:8- 9.6 ---ii;;iii- 7.91Fel>. 12 9:00 a. ·m ______ 46 -LF .6 4.7 16.83Mar. 4 11 :45 a. m______ 47 FF .7 5.2 5.3 14.99 15.03
22 10:25 a. m ______ 48 E ----i:6" -----8:6" 7.5 ---ii;:i;ij" 15.61.31 11 :00 a. 111. _____ 49 'LF 8.1 16.55
Apr. 23 11:45 a. m ______ 1 50 FE 1.0 15.4 15.2 16.28 16._\8June 16 5.00 p. m __·___ 51 FF -------- --------- 24.9 17.86
j:~: --------- -----S7:9
I LWS=Low water slack; HWS=High water .lack: LE=Last of ebl>; LF=Laot of fl~oj; FF=First of flood; etc.2 Tr. =Trace.
TABLE 8.-Ih'drof,r,lphic dalll for slalioll15 in Ihe York Rifler jfl.rl abat'! QU&I!llJ Cr"ek
[Average .•l<pth .l.4 feetl
Turl>idity Vv·a.terPercentagesaturation
Cruise Tide I ~·disc temper- Salinity pH Ph~.phoru. withreading ature dissolved
oxygen
Parts 1''' Milll~r",nrAlcur! ·C tllOUJ,lnd
'1.'7ptr.(lIbu' rn(~,r
4 1'1' O. " S. i IS. if>.~-~--------
103.2S I-IWS .6 6..\ 18.42 i.9
-----~------1119.0
7 FF .6 3.0 18.80 8.0 -------;Tr-.- 97.68 LE .4 2.9 8.60 7.5 ----.- --90:8'J n- 02 1.0 5.93 7.7 ------------.
12 FE .8 3 2 12:71) 7.7 Tr. -------i6,n14 FF .8 10.7 8.48 8.2 Tr.).; '"F .6 9.4 10.30 S.O Tr. -------i08:917 H' .8 12.4 8.% 7.8 Tr.18 I.E .2 II. 3 6:35 7.5 - Tr.20 FF .2 13.6 7.83 8.2 0 --------94.-921 FF .1 13.9 JI. 74 8.1 Tr. 95.222 l.F .5 21. 6 12.63 8.0 Tr. -------i6i:i2.; l..F .3 22.Q I.UJ .--------. Tr.2.~ FF 25.4 ----i5:SS- -----"7:(; -~.--------- ---------.--28 FF .6 21. 8 --------1';.- -------i6.j:ii29 LE · S 25.7 16. 4'.~ 7.7,0 FF' .4 25.8 ---'is:7i- -----"7:f -·-------6T .. ---.------.11 '.E .7 27.6 -. -----i6idn '.F -----Tri- 28.4 18.75 7.9 .1. 1.'.' LF. 27.0 19.6.1 7.7· 12.4 --------si:ii34 I:.WS • .3 . 28. 8 19.85 7.7 6.2.15 LF .7 27.1 20.88 7.7 6.2 106.036 FF. ·~ 22.7 22.23 7.7 12.4 88.0:17 I.E .5 I'}.~ 22.U3 7.7 18.6 . 83.038 LF .2 15.4 20.63 7.7' 12.4 93.7.39 LE 1.1 8,4 20.14 -oR. 1 18.6 ---.--------40 LF .6 5.? 20.44 7.9 6.2 --_.-------.:42 I.E .6 5.7 20.19 7.7 6.2 ------------
Time
1:.15 p. m __ :_. . _1:45 p. m . . . ·.2:05 p. m . · ._ ..- _9:25 a. m ~_ .. . .... . __·_2:15 p. m . . ,_: ..
10:10 a. m . : .. _10:.\5 a. m . , . _
lU~~: ::=:~==:=:====:=::========:=:=:==::====:11 :00 a. m • _11:45 a. m · _J1:00 a. m · _
IU~ i: ~~:=====::.=:=:====::=:====:====:====:==:J1:15 a. m ~ _10:30 a. m : _9:45 a. m : .. _. _.1:00 p. moo. _9:.10 a. m _
:Hg~: ;:::::::::~:::::.::::::::::::::::::::::::4:00 p. n'- : _1:45 p. m _
~U~:: :=::==========~:=:========.==:=~.===~=====:1:00 p. m, " : : _
Date
193JDec. 2 12:20 p. m . ._._12 . 11:40a. m . ... ...
/936.1.n. :I'
21Fel>. 19Mar. 5
1624.10
Apr. 814
.. 27M.y 12
28June II
26.10
J,,1)' 8\l'i27
A\I~. 14-26
Sept. ?2Q
Oct. 20N~\·. 5
24Dec..1
14
15.9711.83 .16.0014.6012.3412.6714.94
8.17.67.78.1
------sT
.t~: --------96:8-------i6:6- --------9s:i
6.2 :_Tr. 103.96.2 111.8
I LWS-I.c:.w water .Iack, HWS=High water .Iack, LE=La.t of ebb, LF=La.1 of flood. FF=First of flood, elC.2Th=fu~ .. ~ ..

EFFECT OF PULP-MILL WASTES ON YORK RIVER OYSTERS
TABLE 9.-H).drograpllic data for stotioll 23 i1/ tile York Rifler ObOflf Cloybollk
[A"crage depth 4.6 recti
Date Time Cruise Tide ITurbidity
,,-liRereading
Watertemper
atureSalinity pH
Percentagesaturation •
Pho,;phorus withdissolvedoxystell -
---------------1·---11---·1----1----1-.--- ---1----11----
----ili:44- ------'i:6" ============ ::::===:====
lUI ------'i:~- IU ~~:~19.16 7.7 12.4 92.820.41 7.6 6.2 90.6
~UI ------'i:8" IU &U20.72 7.7 12.4 91.019.79 7.9 18.6 _20.88 7.7 12.4 _21.5S 7.9 6.2 _
1936'Jllne 26Jllly 8
1629
AuI'. "3Jl
Sept. 929
Oet. 21No,'. 5
UDec. 3
H
. ..11:05 a. m :- _I I :40 a. m _10:30 a. m _lO:Su a. m . _10:IS a. m • _2:20 p. ·m _3:IS p. m • _
12:40 p. m -' ~ _10:CO a. m _10:45 a. m .11 :10 a. m __ • _12:30 p. -m: : _
1:40 p. m :
2B30313233343536H38394042
M'l""0.5.5.6.5.8.9.8.3
1.0.S
1.1.9
J.I
• C.22.926.127.3
-28.126.926.325.322.719.4-15.6
8.16.05.8
ParlJ 'Prr,h~,u.rdPl:J
14.40
Milligram../JrrCI(bicmtur7.5 _. ~ .... _
1937Jan. 6
26Feb. 12Mo<. 4
31Arr. 23Jllne 7
4:00 p. m • _11:30 a. m : _10:10 a. m _
1:15 p. In · _12:45 p. In _
1:10 p. 111 : _12:00 m : _
43 - I.F45 FI~46 J.F47 '-oF49 "t}-SO 1.,r.'51" 9~
\.2.7.3.4.B.5
7.29.64.75.98.3
16,426.8
I(,.IB12.54H.l.I9.94
IS .1212. ',IS
7.87.67.67.9B.38.3
_______ ~~r~_ -----:--s9:i---'---i5~ii- --------96:3--------6:2" I&n
I LWS=Low water slac~, HWS=High woter slack, LE=Last of ebh, LF=Last of flood, FF=First of flood, etc.2Tr.=Tr:lce. . ~ .
TABLE to.-Hydrogrophic data for station Sin tile 1Ilidd/~ York Riller just obo'IJe Allmollds WIlar!
_____________:..... -;-_..:l'--A_,'.::.;erage depth 3.9 feetl
Date Time Cruise Tide I
".
Turbidilydisc
reading
Watertemper"
:lturepH Phosphorus
PercentageS3tllratioll
withc.lis~o've.:l
o.:trgeu
- J./iiligramsptr cubic m~teT
-_._~----- ------------ --.------~~_.~
-----"7."8" ::====:===== --------ejD7.8 88.6
Parts per,hDltsa"rJ
18.2817.2114.()616.51
----i'i.-.li· ------'i~5- --------6.-i- ===:=:=:=:==16..1.1 _ 3. I 90.6J(,.5B ---- -7. ') 6.2 _
- 18.08 7.7 12.4 8i;~218.98 7.7 6.2 . 96.521:\1 . 7.9 6.2 .8B.1,
: 19.24 : 7:9· lB.6.104.S19.0~" 7.~1 18.6 .102.8
, 1').18' 7.9 .. 18.6 .19.98 7.7 12.4 _18.78 7.7 6.2 _.
1.2'I
d7.0
II. 210.613.2
• C.17.916.85.86.2
s:~.7.4.6.4
Ill"ffS
17.63 7>' .___________ 94.1
~: ~~ ~: ~ =======:::=: --------ej5~ii7. H 7. j 'Xr. 93.5ri.'J3 7.5 Ir. _i.29 7.9 101. I
U~ n i/' --------90~'i·, 6. G4 - 7. S Tr. _ _
-------.-4------in- .1.64 7.6 Il -B9'-1.· (, 11.2 9.54 8. I 'rr. 11.1. 8..1 22.6 10.(>4 7.6 Tr. __.2 • 21.6 11.3S 3.0 107:0.3 23.0 .. 7.8 _
-------::~- ~n ----B:~r ----:Tf :=:::;::;1;;': ===:=:~=§i~i.~ 26..1· S 27.9..\ ·28.1.8 28.6.4 26.U.8 25..1.7 22.7
).2" 18.6 ...5 1.1.4· 4 ~. 4.3 5.7
I. 0 5.8
------0."5".6
LrFE
4 LF.5 LF
7 FI's FI::
.<j~f:II
12 n:14 LI':16 lor17 FFIS LE20 FF21 LF22 HWS23 I~E
U 'FE2S' FJo'28 F!"2'1 !.~E.10 LF31 n:32 Fl'H . LJ~:
.14 LI': ...~.~ LE36 . ~~1':
37 FF.~8 LI'.19 FE40 HWS42 hE
2:30 p. m : _1:20 p. m _J:35 p. m : _
10:40 a. m " _
12:35 1'. m _12:15 p. m _10:30 a. mo. _2:35 p. m _
lidO •. m • _2: 10 p. m • _
11:15 •. m . _II :SO a. m . _3:30 p. m. • _1:00 p. m _1:00 p. m . _
12:4S p. m _II :4U •. m _2:IS p: m _
12:00 m _II :25 a. m · _10:20 •. m ~ • _12:30 p. m _10:50 a. m '- __12:00 m _2:4S p. m _
12:00 m - - : =
ILH ~: :::::=======:===========:=:==:::======:~=10:45 a. m · , _1:00 p. m . '- · --. _
10:00 a. m - - -- -- _- - - _- - - - - - - - - - __
tV&~: ::::======:======:==:========:====~=======
1935Oct. 17No\". 1IDec 6
12
.1936Jan l~Feh. 20
27. Mar. 5
182430
Apr. 8I~
27.May·12.Il1ne I
8II26.10
JlIly 816'9
Au.:. L~30
Sept. 10N
Oct. ii1\'('I\". 5
24Dec. 3
H
:r.~: --------S7."3--------5:ii- --------%~ii
1937'Jan. 8 3:4S p. m_______________________________________ 43 FF .7 8.9 9.38 7.8
26 11:1.\ •. m_______________________________________ 4S FE .6 9.9 7.88 7.4Feb. 12 10:45 a. m ~____________________ 46 LE 4.3 13.57 7.7Mar. 4 1:45 p. m_______________________________________ 47 hF .5 7.2 10.86' 7.9
22 11:45 a. m .__ 48 LE 8.2 1I.44 .1.1 ------------30
1
10:20 a. m c______________________________ 49 l..F .3 8.4 12.47 8..1 Tr.· 99.4Apr. 23 1:30p. m ~------------------ 50 hiF. .6 17.0 12.39 8.3 6.21 105.9
June'l~ ~:r.?~: :::=================:=:=====~============= ~~a ~'i ========== ~~: ~ ----i3~i'i~ :========.= __ • ~~~=_ ===========:
I I.WS=Low water slack, HWS=.High water slack, I.E-Last of ebb, LF~Last of flood, FF=First of flood, etc,t Tr.-Trace.
FISHERY BULLETIN OF THE FISH AND WII..DLIFE SERVICE
TABLE It.-Hydrograpllic dalajorslalion 22 if! Ill, York Rivu inside Purlall Bay
IAverage depth 4.1 feet)
Date Time Cruise Tide'Turbidity
discreading
Watertemper
atureSalinity pH Phorphorus
Percentage .saturation
withdissolved('IxYJ:ten
-------iii6~ii
98.384.096.893.2
• Tr. _Tr. 85.5
-------is:ii" --------9~~S
3.1 _Tr. 100.06.2 112.3
M ilIi~,.msper,uhlcmttt'T
7.6 _8.1 ._ •• •• _7.7 _
7.87.37.67.8
------s~j
8.3
8.557.68
13.419. .t3
II. 0912.1612.11
---:i6~35- ------7T -=--=---==== =====-------16.53 7.7 - -- ---3. 1 -'--9ii~3
17.27 7.8 8.118.26 7.9 12.418.89 7.7 6.221.22 7.7 62. \l19.29 7.9 30.019.89 7.7 18.618.91 7.9 18.6 _19.45 7.7 12.4 _19.61 7.9 6.2 _
Par's perthous.nd
----T7(jD.87
Milrrs o C.18 LE 0.2 10.821 FF .4 19.926 FE .4 24.930 . FF .3 26.8~H 'oE .5 28.332 FF .3 28.533 I.E .6 27.834 I.E .7 26.4.~5 I.E .7 25.4.16 "E .4 22.337 FF
-------~3·19.3
38 LF 15.339 FE .4 8.440· Y.E .4 6.242 !;E .6 5.8
43 LWS .6 8.645 HWS .5 lO.u46 HWS .3 3.947 LF .4 6.448 I.E -------X 9.349. LF 8.450 ~?E .6 16.550a LWS ._-------- 28.4
3:25 p. m "10:45 a. m ; "_11 :00 a. m _2:00 p. m : · _
12:30 p. nt _10:35 a. m _
1:45 p; m ." _2:15 p. m , _
3:45 p. m .' --3:55 p. m .
12:30 p. m _1:15 p. m _
II :30 a. m , _1:45 p. m _
11:30 a. m _1:25 p. m . c __
11:35 a. m_c _3:45 p. m _
11:10 a. nt _12:45 p. m _10:15 a. m _4:35 p. m _2:30 p. m ~ , __
1936Apr. 8
3UJune 19july 8
1629
Aug. 1331
Sept. 10Oct. I
21No,'. 5
24Dec. 4
14
1937jan. 8
26Fe!">. 12Mar. 4
2230
·Apr. 23jUlle 7
I I.WS=Low water slack, HWS=High water slack, LE=Last of ebb, LF=Last of flood, FF=First of flood, etc.2Tr.=Trace.· ,
TABLE l2.-Hydrograpllic dalajor slation 6 in tlle York Rilla jllst below Ta,rkillas Creek
[Average depth 5.2 feell
Date Time Cruise Tide ITutbidity
discreading
Watertemper
atureSalinity pH
Percentagesaturation
Phosphorus "ithdissolved.
. oxygen
.4 8.2 8.12 7.8 Tr. --------sin.5 9.9 6.96 7.4 Tr.
.2 4.6 9.85 7.4 3.2 ------------..; 6.2 1O.3U 7.7 10.0 93. I
.2 8. I 10.52 8.3 .1.1 91.3
.3 17.4 9.60 8. , ~.2 . 99.2
----i·5~si- -----T-i- ---------~-- ------------15.61 7. 8 --------6~i- --------87~6
16.06 7.8 6.2 _17.41 7. 7 6.2 115. 122.45 7.9 6.2 93.519. U 7.9 12.4 97.417.83 7.6 18.6 %.318.30 7.!l • c .
18.93 7.712.72 7.7 -------''i;.- ===:========
1936Jurie 19
26Jul!, 10
1629
-Au~. 13Sept. 10Oct. I
21. No,'. 5
24Dec. 4
2.1
19.17Jan. 8
26Feb. IIMar. 4
30Apr. 2.1
12:00 m _12:00 m . - _1:15. p. m _
12:15 p. m _12:50 p. m _2:30 p. m _1:15 p. m _
10:15 a. m ._II :30 a. m : _
lA:~g ~: :::: :=~=======:=====: ==================::=:4:00 p. m ~ _11:40 a. m _
3:UO p. 1J1-----------:---;--------------------.---10:15 a. m ' _2:15 p. m : : . _2:20 p. m : _
II :00 a. m ~
2:20 p. m - -- - - - - --.-; _~c,- --7 -~ - - - - - - - - -. ~~,: --
26 LF28 H30 'if3132 FF33 I.E..~5 FF36 HWS37 FF38· FF39 FE4\l n:·42 I.E
4.1 I.E45 HWS.46 !~E47 LF49 LF50 I.E
lUrttrS. 0.·1
.3
.2
.2
.4
.5
.6
.4
.6
.1
.3
. .;
.3
o C.24.822.627.728.828.328.526.021.618.214.8R.35.6
P.rlS 1>"th.Qusand
14.7212.56
IIIil/i.,am,'P" cl,b" mttt'7.8 _
7.7 _

EFFECT OF PULP-MILL· WASTES ON YORK RIVER ·OYSTERS·
TABLE 13.-H~.drographicdata for slation 16 in the York River off Romics Point
[Average depth 4.2 feet)
Date Time Cruise Tide·Turbidit)"
discreading
Watertemperatur~
Salinity pH Phosrho~us
Percentagesaturation
withdissolvedoxygen
• C.Parts prr Milli~rams
1935 Meurs thollJQlId ptrCUbfCtntttr
De<. 6 2:45 p. m______________________ . ____ . ___________ 4 LE 0.5 6.4 12.11 7.7 ------------ 98.913 12:25
p. m __________________________ • ____________5 LF .3 6.6 16.60 7.8 ------------ 80.5
1936 12 :00 m_______________________.__________________Jan. 7 7 FE .4 2.0 7.34 7.7 --------.--- 95.3
23 11 :20 •. rn _______ • __________________ • ____________ 8 FE-'-----~j-
1.6 5.97 7.2 -------'1';,' ---------_.:..Feb. 21 11:10a. m___________________________ • ___ • _______ 9 FE 0.2 6.19 7.4 88.3Mar. 5 12:45 p. m. ______________________________________ 12 LE .3 5.3 6.29 7.3 Tr.
-------ioo~618 3:25 p. m ____ ___ ________________________________ 14 LWS .3 11.1 ----Tfi" 7.2 --------1';.-24
IB8 ~:~~~~::::::: :::::::::::::::::::::::::::::16 ·FE .6 II.! 7.3
--------9li~i31) 17 FF •.. 6 14.5 1.96 7.3 Tr.Apr. 9 18 l;)F ..I 11.4 3.51 7.4 --------1';.- --------9i~616 12 ,()I) n\ _________ -- -- -- -- -- ___ -r. _________ - -. ____ 20 LE .2 15.7 3.21 7.5
29 11:05 a. m _______________________________________ 21 I.WS .3 18.0 5.41 7.8 Tr. 95.1May 14 10:45 a. m ____________________ ~ ___ _____________ __ 22 Hf .3 20.8 7.30 7.4 Tr. -----·--iliDJune I
lU~ ~: :::::::::::::::::::::::::::::::::::::::::: 23 .5 22.5 . 10.41 ---------- Tr.19 25
i~.3 25.6
4
13.10 7.6 Tr. ------------25
:~j}i ~~ ~~~~~~~m~m~m~~~m~~~m~~mm~~26 .4 25.7 12.67 ------7T ----------~. ------------
26 28 FF .6 23.3 11.82 --------1';.- --------76~030 29 JoE .3 25.9 13.06 7.4July 17 31 'F-E .3 29.0 14.79 7.3 . 3.1 --------66:931 32 FE .3 25.5 17.32 7.5 6.2Aug. J.l lU~ ~: :::::::::::::::::::::::::::::::::::::::::: 3.1 I.E .5 28.3 14.89 7.9 ll..l, ----c---s.fo28 34 FE .7 27.0 17.81 7.7 12.4Sept. 10 12:20 p. In_____ . _________________________________ 35 LE .5 25.8 16.46 7.6 6.2 96.1Oct. I 10:4U a. m ______________________________________ ~ 36 HWS .5 21.9 2U.'11 7.8 12.4 69.8
2112 :50 p. m_______________________________________
37 LF .5 20.0· 17.55 7.8 12.4 92.5Nov. 4
"1:15 p. m______________________________________ ,38 1"1" .1 15.8 18.15 7.7 3.1 8.1.3
194:35 p. m_______________________________________
39 FE .7 8.3 17.20 7.7-------i8~b-
------------Dec. 4
1U8 ~: :::::::::::::::::::::::::::::::::::::::::: 40 l'lF .3 5:6 18.33 7.7 --------. ---Dec. 13 42 LE .4 3.9 12.43 7.7 Tr. ------------
1937
1~:~~ :.:':::~:::::::::::::::::::~:::::: ::::::::::::Jan. g 43 I.E .4 8.1 6.51 7.6 Tr. ------------
27 45 1.1" .3 9.1 5.88 ----"7:5- 93.U 83.6Feb. II 1:30 p. m___________ • ________________ • __________ 46 FE .3 5.2 10.77
--------6~.2" --------84~2Mar. 3t:~ ~: :~:::::::::::::::::::::::::::::::~::::::: 47 LF .2 504 9.80 7.9
22 48 I.WS -------X 10.2 8.35 ------8:.5" --------0[;,- -------:9S~530 11:20 a. m______________________ • ________________ 49 LF 9.0 11.35Apr. 27
12 :20 p. Ill __ • ____________________________________50 LF .4 15.5 9.65 7.6 3.2 90.9
June 1612 :30 p. m___ , _____ • _____________________________
51 I.WS ---------- 26.4 ·10.05 ---------- 12.4 ------------
J LWS=Low water slack. HWS=High water slack, LE=La.t of ebb, FE=First of ebb, FF=First of flood, etc.ITh=~«. . .. .. .

"182 FISHERY BULLETIN OF THE FISH AND WILDLIFE" SERVICE
TABLE 14.-Il)'drograpllic dOlO for slali011 .Ii in 111.' l"ork River off Ware Creek
[Ayerage depth 3.9 rect)
Time Gruise ·1
ITide'
Turbiditydisc
rf!ading
Watertemper
atureSalinity '1 Phosphorus
I .Percentagesaturation
withdissol\'f"doxyg("n
IQ35.Dcc. (,
1936Jan. 7
Feb. ~iMar. 6
1925
Apr. I9
1629
Mav 14June 1
1119
July. 217.11
A"g..1728
Sept. 10Oct.. 1
21Nov. 4
19Dec. 4
23
1937Jan. 8
. 27Feb. 11Mar. 3
. 30Apr. 27
3:15 p. m •• • ._: • _
11 :-cl0 a. m . • __10:30 a. m • , , _. _. _10:30 a. m ... •• __ •• __1:-cl5 p. 111_. _'. _
11:30 a. m •• ... __ .. __ • __ • _10:15::t.ln 4 •• •• __ • _
10:00 a. m __ ~ ••• • ._. _10:-!O a. m • ._._ •• _LIO p. m . • _
11:-cl5 •. m •• _ • _10·:55 a. 111 • .: .. _
1:.10 p. m_. -----------------------.---11:00 a. 111 . • , _
10:-1-5 •. m •.. • __ ._._ .. _. __ • _12:30 p. m ...... _•• __ • _2:20 p. m •• _••• __ ••.. _•• , _
12:10 p. m • • • • .~ _2:10 p. m • ....__ • • __ , _
11:30 •. m ••• ... __ ._. _12:45 p. m •• _... _._ ••• ••• _11:10 a. m ._. • __ • __ .. • _1:10 p. m •• • ._. ...... _
12:45 p. m . ..
ng~: :::::::::::=::::::::::::::::::=::::::~::::::11 :20 a. 111_. __ ~ : _
r :-clS p. m • _10:50 a. m _1:15 p. m • _3:10 p. m ' • .. _
12 :05 p. m . . _12:40 p. m __ . , • •
4
78.19
121-cI1617
• 18202122232526.2':"·31323334353637:;s:;94042
4-34546474950
Mrtrrs ·,C.PartJ' 'Ptr Milligram;thousllnd prr CI(bi, mt'ftr
I.WS 0.4 6.2 11.67 7.7 ------------ 97.5
FE .6 2.2 7.72 7.7 ---.-------- 87.7HWS -------T ·0.6 3.87 7.2 ------------ --~~--~--.. --HWS .1 6.91 7.4
--. --'-TrY \: :::::::::::FE .2 5.9 5.21 7.2l;;,E ---'---:i- 10.3 3.75 7.6 3.0 73.8l.;F 1l.3 2.61 7.3 'Tr. ____"_____ .. __'oE .1 13.2 2.86 7.S Tr. 82.3J.lF· .3 11.2 4.29 7.4 - -··----Tr~- -"--"i60:8'y}' .2 IS .2 3:04 7.4FF .1 18.2 6.31 7.9 Tr. 108.3JoE .0 21.0 6.55. 7.4 Tr. --·----i09:4-I.E .2 22.6 1l.40.
--------~-·Tr.
FF ------_.-- 25.0 ----12:86- .... ·-7:6" ------------ ------~.----
I.;F A 25.0-----·-·Tr~- --------84:5l~E .1 25.6 13 .21 7.4
F-E .2 29.1 14.90 7.4 3.1 ·-··----77:9'FE .3 25.3 15.95 7.5 .1. 1FE ..~ 28.1 15.97 7.7 30.0 102.6I.E .5 26.9 16.62 7.8 6.2 m.8LE .4 25.8 15 .97 7.7 6.2 100.5FF .5 22.0 20.81 7.8 6.2 96.6I.F .3 22.0 15.90 7.8 12 ..4 84.3FF .1 15.6 17.48 7.7 3.1 88.2FE .3 8.4 16.89 7.6 --·----24:8- -----._--.--~:!F .4 5.7 17.56 7.7 ------------'~2E .1 4-.3 12.88 7.7 Tr. _.-_._------
I.E .4 7.6 7.07 7.7 1'... ----·---84-:7LF .2 9.3 4.65 7.4 93.0FE .2 5.3 10.57 7.3 --------6:0- -------·88:iif .2 5.4 8.31 7.6
.3 8.4 -----9:66- ---------- Tr.-------i07:.~LF .5 15.0 7.3 3.1
Ill.\VS=Low water slack, HWS=High water slaok, LE=Last of ebb, FE=Fir51 of ebb, FF=l'ir51 of flood, ctc.2 Tr.=Trace. -'
TABLE IS.-Hydrographic dOlo for slali01l 8 in IIIe wpper York Rio" i11S!lore of BfU R.ork Lig!ll!loIlJe
[AYer,,~e depth 13.6Ieet)
SlJrface BottOIJ1
. Dat< Time Cruise
, I I' .. Percentage
\Vater".temperature Salinity pH Phosphorus I saturation withTurbid~ • ~ diss.:.I\"ed o..xygpnit)" discre::ldin~· -----;---.- -----_---;-- --------------------,----
Surface Bottom Surface B....ttom Surface Bottom Surface B"ttilm-----_._--- ----- ---- ---- ------------- ----- -----------------------. ..
82.0'--86.1
----s~T "--'8i:i----ss~i- ----·s3:8----s7T -·---Si:7
n.93.0
Tr.
Tr.3.1
Milli.graPn!
plr cubicm,/u
Tr.9.l.0
Tr.8.0Tr.3.1
!Ifilli·grams
fltr cubicltuUr
7.37.5
Pflft! prrthou!llnd
-cI. -cI.1. 7.3'12.92 • _
5.73 11.60 7.6 7.75.12 6.35 7.2 7.2
13.55 14.05 7.6 7.6X- 11. 7.85 7.5 7.5
---Ti7- -·-"9:78." ::=:::::: .:::::=:=:
-~-i7:0:i
17.6511. 31
::::::::: ---i:i:ii' .. --.--.- ---·-7:S- ::::::::: ::::::::: c:::::::: ::::::::: -It ~~ --------- ..--"7:9- -...----- 3.2 --.---.-:- ~~: ~ .16.96 7.7 -.-.--.-- -- ..~6:i- ::::::::: 101.1
_•• ,_ ... _ .20.73 7.7 6.2 8.1 ..119.24- 7.9 12.4 81. -cI 65.017.83 7.6 3.1 85.5 82.9
g:~~ U n ~---i2X ----i8~6: =:::::::: :::::::::12.03 7.7 7.7 2 Tr. Tr. ••
Pa;" fit<tho.;aM
3.69
7.19..14.94.68.5
14.3
·C.13.3
. 23.927.72~. I26.027.826.221. 7·19.31,.68.65.2·4.3
7.09.05.65.48.9
15,6
.'. C.15 . .,
----i9T15.7.8.55.34.2
1936 il'e"ttr!Apr. 2~1 12:25 p. m__ • __ 21 FF 0.2June 26 12:50 p. m ____ , 28 FF .6July 10 12:00 m ________ 30 FF " ,;
17 2:00 ('. m _____ 31 . ~'I': .331 12:50 p. hl _____ 32 J.E . 3
Aug. 17 2:00 p.-m _____ :U ·FE. .3Sept. 11 11:50 •. m_. ___ :;5
~ilf .-cIOct. 1- 1:00 p.-m _____ 36 .5·
22 11 :00 a. m_·. ___ 37 FF .5Noy; 4 12:00 m_____ ;_·_ 38 FF . 7
19 4:10 p. m ___ ._ 39 Fg .7Dec. 4 2:30 p. m ___ ._ 40 F£' .4
23 11:05 p. m____ • 42 .':i£ • g
193iJan. g 12:.10 p. 01_. ___ 4-.l LE .4
27 11 :20 •. m_____ .. 45 LF· .3Feb. 11 12:-cl5 p. 01 _____ 46 FE .4Mar. 3 2:00 p. m _____ 47 H .4
30 12:-cl0 ('. m _____ 49 LF • -cIApr. 27 12:5S p. m--.'__
j50 LF .6
I LWS=Low water slack; HWS=High waler slack; LE=L.st of ebb: LF=Last of flood; FF=First"of flood: etc.2T~=~~ . .

EFFECT 0I:PULP-MILL WASTES ON YOR K RI VER OYSTERS
TABLE 16.-/{ydrograp/'ic dolo jor slalioll 9 ill I/,e upper fork Rill.., 011 I/,e middle grolmd just />dor/l WeJt Pojllt
[Average depth 12.4 feet)
Percentagesaturation with
dissol,·ed oxrgcnPho.phoru.pHSalinity
TimeDateTurbid- \Vatcr temperature
Crui6~ Tide 1 it}" discreading ---·-:----1------;-----1-------.---- I
________~ ' Surface Bottom Surface_ Bottom Surface Botto.:-_ Surr~ce !ouom_ Surface_ Botto"m_
Mil/i- Mil/i-Paris per Parts prr grams'!',r grams p~r
193J Alrl,rs o C. o c. tl'Oll1d7ld t/lou!tl71d cubic meltr cubic mllerOct. 22 10:20 a. 111.. _____ P2 FE 1~.1 18.0 9.89 12.61 _______ M_ --------- --------- ------~-- ---------
29 8:55 a. m______ P3 FF 16.9 16.6 11.13 B.02 -----i--- --------- --------- --------- ---------Nov. 8__ 9:15 a. m ______ 2 LF ----oT 16,4 16,4 14.34 14.47 -----7:6" -----7T --------- --------- --------- ---------Dec. 3__ 3:50 p. m__ ~___ 4 )1E 8.1 8.2 11.53 B.89 --------- --------- ----s9T -----Sn13 11:30 a. m ______ 5 J'!iF .5 6.4 6.3 1.1.04 D.04 7.7 7.7 --------- ---------
1936Jan. 7___ 10:45 a. m______ 7 HWS .4 1.9 1.8 3.87 8.62 7.4 7.6 --------- --------- 88.8 90.3
22 12:45 p. m______ 8 '<lE .4 3.2 3.0 5.01 8.13 7.4 7.5 ---.----- -------------~?:9" -----86~iiFeb. 20_ 2:05 p. 111 ______ 9 'J;i!: .2 .4 0.3 1.96 7.83 7.1 7.3 ----_ .. _- ---------
27 12:15 p. m__ ._ •• 11 HWS .3 2.9 2.7 0.86 2.30 6.9 '7.1 'Tr. Tr. 85.2 n.3Mar. 5__ 2:00 p. m______ 12 LE .3 5.2 4.8. 3.35 5.55 7.2 7.3 Tr. Tr. ----soT -----S6~219 12:00111____ ._ •• 14 I~E
-·-·--~2-10.8 10.9 1.21 3.95· 7.3 7.3 ·8.0 Tr.
25 l1:UO ". m__ • ___ 16 l:F 11.2 11.3 1.64 .1,42· 7.2 7.3 . Tr. Tr. ----76:7" -----sojApr. 1._ 10:45 a. m______ 17 np .2 12.2 12.9 2.54 5.01 7.1 7.3 Tr.· Tr.9 11:15 a. m______ 18 72 .2 11.7 11.7 -----:39- 2.11 7.2 7.3 6.2 Tr.
----94~3- ----i06~S16 1:00 p. m_____ • 20 LWS .2 13.2 13.2 2.50 7.1 7,4 12.4 Tr.29 1:40 p. 111 ______ 21 FF .2 16.3 15.6 2.02 2.88 7.1 7.3 6.2 6.2 85.2 83.9
Mar 14_ 11:30 ". m ______ 22 !;E .3 21.7 2\.6 4.51 5.73 7.3 7.3 Tr. 0 --_._~_.- ---------june 3
8- 11:45 a. m·____ ._ 23 LF .5 23.1 22.8 1O.n 10.73 ------_ .. ----"7:9- 3.0 2.0 114.9 108.712:00 m________ 24 U- .5 2.1.1 23.2 11.98 11.49 7.9 -----1';.- -----0--- ---_ .. _-- ---------
16 12:15 p. m______ 25 !-fE .6 24.8 24.2 11.24 12.30 ----"7:s- -----7:S- ---------19 10:10 a. m____ ._ 26 !H -----~6-
24.8 24.8 11.55 11. 78 --------- ---------26 1:30 p. m______ 28 _ 23.1
----i4~6-18.15 ---i4:09- 7.4
-"-'7~4- '---ij~ii- -----'1';. - ----97:i- -----s7~iJuly 2___ -11:45 a. m______ 29 ~~E .6 25.2 11. 78 7.6. 1U 11:00 a. m______ 30 FF :6 28.3 27.2
---i3~.i.r ---ii~94- -----7X ----"7:s- -----G~i- ---'iiX --------- ---------17 1:30 p. m______ 31 FE .8 29.9 28.2 ----S3X --'--Sn31 1:15 p. 111 ______ n !·"f~ .6 26.3 26.1" 13.77 16.28 -----7:9" -----n- 6.2 3.2
·Aug. 17 _ 1:00 p. m ______ 33 1.1' .5 27.7 27.5 14.33 14.49 30.0 12.4 96.7 89.128 12:30 p. 111 ______ J4, I.E .8 28.0 27.9 15.90 17.11 7.5 7.5 12.4 6.2 59.0 62.3
Sept. 11. 12:30 p. m______ 35 .LE: .5 26.0 25.9 15,44 16.4~l 7.7 7.7 3. \ 3.1 90.2 87.3Oct. 1 1:30 p. m______ 36 FE .4 21. 7 21.5 18.93 18.86 7.8 7.8 6.2 6.2 86.6 91.7, 22 11:45 a. m______ 37 FF 20.2 19.6 14.65 14.11 7.8 7.8 12.4 12.4 83.6 81.6Nov. 4 11 :30 a. m_ •• ___ 38 LWS .6 15.7 15.6 14.52 IS .23 7,4 7.5 3.1 3.1 81.4 76.8
19 3:40 p. m______ 39 HWS .6 8.7 8.7 17.07 17.09 7.6 7.7----jo~o- ----i2~4-
--------- ---------Dec. 4 1:.10 p. m______ 40 FF .6 5,4 5.2 15.81 15.99 7.7 7.7 --------- - ... -------
15 ·3:35 p. m______ 42 ME 1.0 5.0 5.0 14.76 16.51 7.8 7.8 6.2 6.2 --------- _.. -------1937
jan. 5 12:35 p. m_ .. ____ 43 LE .4 6.6 7.0 4.85 8.77 7.3 7.4 Tr. Tr. ----74T -----70~627 11 :45 '" m__ • ___ 45 LF .3 8.9 9.4 2.54 4.24 7.2 7.2 93.0 93.UFeb. 11 12:10 p. m______ 46 HWS .4 5.6 4.1 11.\7 12.12 7.6 7.6 Tr. Tr.
----78~.i- -----7S~2Mar. 3 11 :40.1. m__ • ___ 47 LWS .4 5.3 4.6 3.26 4.78 7.2 7.3 6.2 3.130 ]:00 p. m____ .. -49 U· .4 8.5 8.3 10.86 10.7.1 8.3 8.4 Tr. Tr. 96.9 95.3
Apr. 27 1::15 p. 111_.____ 50 LF .4 15.\ 14.3 7.47 8.73 7.4 6.2 6.2 84.5 77.9june 16 10:50 a. m. _____ 51 I.E 23.4 23.4 6.40 9.06 --------- --------- 12.4 12.4 --------. ---------
I LWS=Low water slack. HWS=Hi~h water slack, LE=Last of ehb, L1'=LaSl 01 flood, I'F=Firsl 01 flood. elc..2: Tr.=Tracc. .

FISHERY BULI.ETIN OF THE FISH AND WILDLIFE SERVICE
TAHI.E 17.-Hyd~ographicdata for station 18 in lite Palllllllkey River abol'e bridge at Wesl Point
IAverage del'th 29.5 feetl
Salinity pHPercentage
Turbid-\Vater temperature Phosphorus saturation with
Date Time Cruise Tide I it)· disc dissolvcd ox":,,geli
reading
Surface-ISurface Bottom Surr~ce BOll')1l1 Bottom Surfa~e Bottom Surfsce Bottom
------ ------ --- --- ---.------ ._-- --- ---Milli- Mil/i-
• C.Paris per ParIs per gram.r ptr gramJ ptr
1935 MeltTS • C. thOIUQPld thousand (rchic mlttr c"bi, flltttrDec. 3 1:35 p. m _____ 4 FF 0.2 8.4 8.4 I. 17 6.26 7.3 7.3 --------- ._---~--- -- '-SO'-9- ---------
13 10:25 a. m______ 5 FF .6 6.4 6.3 7.12 9.07 7.6 7.6 --_. ----- ~--------80.8
1936Jan. G 2:35 p. m _____ 7 I.E .2 1.3 1.3 .51 I. 28 7.1 7.1 --------- --------- 76.0 77.1
1) 3:15 p. m _____ 8 I.E .2 3.4 3.1 .26 2.09 6.9 7.1 --------. ---------Feb. 20 3:15 p. m _____ Q I.E .2 .2 .2 .14 .11 6.7 6.7 --------- ----87~i- -----s7~i
Mar. G' 10:05 a. m ______ 12 I.F .2 5.4 5..l 1. 31 1. 67 7.U 7.,0 ''1'... --·--f;.-----o505~i- -----052:719 1:15 p. m ____ . 14 LWS
-----~2-10.7 10.5 .2'> .17 7. I 7.2 6.0
2'> 12:45 p. m __ ~ __ 16 HW8 11.8 11.7 .25 .2.1 6.9 6.9 Tr. Tr.--'--77~6- -----7i~~Apr. 1 12:30 p. m______ 17 I·,E .0 I.!. 6 13.5 .2.1 .21 7.0 7.0 Tr. Tr.
9 12:55 p. m _____ 18 I:F .2 12.2 12.2 .05 .12 7.1 7.0' 4.;,4 6.2 ----s7.-i- -----99.-216 2:30p.nL ____ 10 FF .2 1.1.5 13.5 .05 .12 7.1· 7.0 12,4, 12.4-29 4:45·p. m _____ 21 FF .1 15.8 '15.5 .28 .28 7.0 7.0 8.0 80.3 77.0
May 14 12:25 p. m _____ 22 ] .... .3 21.9 21. 8 .52 . 61 7.2 7. I 1'..... 2'·,-----2~0- ---ioiX ---------
June 3 11:50 p. m _____ 23 FE -----T 24.7 21.9 6.04 8.28 ----Ti- ----Ti- Tr. 86.6July 2 10:45 a. m ______ 29 FE 25.5 25.3 10.12 11. 12 6.2 6.2 78.3 72.3
17 12:40 p. m _____ 31 FE .5 29.3 28.3 11. 08 12.94 7.0 7.1 3.1 3:1----S~X ---·-78.-431 2:30 p. m_. ___ 31 I.E .6 27.1 26.9 9.69 10.61 7.1 7.1 6.2 6.2
Aug. 17 12:2U p. m. ____ 33 LF .2 27.6 27.2 11.35 12.27 7.7 7. i 311.0 30.0 78.3 M.2. 28 2:15 p. m _____ 34- FF .7 28.3 28.4- 11. 58 11. 43 7.4- 7.1 12.4 12.4 95.6 83.3
Sept. H 2:20 p. Dl _____ 35 LE .6 26.2 25.6 II.H 12.57 7.2 7.2 3. I 3.1 84.6 69.0Oct. 21 12:20 p. m ____ • 37 FF .8 20.2 19.7 9.58 10.03 7.8 7.8 12.4 12.4- ;6.4 68.6Nov. 4 '10:15 a. m _____ 38 LWS .5 15.8 IS. 7 10.28 10.7:1 7.1 7.2 3.1 3.1 75.1 74.9
19 3:10 p. m. ____ 39 LF .5 9.3 9.1 14.25 14.38 7.6 7.5 -----il.'2' -----f;.- --------- ---------Dec. 4- 12:15 p. m _____ 40 LWS' .6 5.8 5.7 10.63 11. '>6 7.5 7.5 ---------
5 2:30 p. m. ____ 41 FE .6 5.0 4.7 11.29 14.20 7.7 7.7 6.2 12.4- ---------1937
Jan. 5 2:4-5 p. m _____ '43 FF .. 1 6.3 6.5 .60 3.32 7.2 7.3 68.2 Tr.----o57~7- -----o5n27 1:00 p. m _____ 45 HWS .1 ~. 5 8.5 .21 .58 6.9 7.0 12.4 12.4-
Feb. 11 10:40 a. m ____ '_ 4-6 1.1' .2 5.8 5.0 4. -1-5 6.8.\ 7.3 7.3 Tr. Tr, .Mar. 3 ~:~O p. m ___. __ 47 FF .2 .'.0 5. U .15 .24 7. I 7.1 8.0 ~. 0 ----6S~j- -----77."0
302:~g~: :====: 4-9 HWS .4 9.3 8..1 7.34 K77 ~. 2 ~. 2, 1'r. 'fr. ~5.0 89.4-
Apr. 27 50 HWS .3 15.7 15.0 3.19 4.89 7.2 ----oil:§' Tr, Tr. 71. 1 75.0May 17 3·00 p. m _____ 50a u· 19.7 19.9 .12 .12 6.7 --------- 65.8 65.3
I LWS=Low water slack, HWS=High watei slack, LE=Last of ebb, LF=Last of flood, FF=First of flood, etC.t T,. =Trai:e. . '

EFFECT OF PULP-MILL WASTES ON YORK RIVER OYSTERS
TABLE IS.-Hydrographic data for itatioll 19 ill tI,e Mattapolli Rillet' abOlle the bridge at lYei! Point
[Average depth 15.0 feetl
Percentage
Turhid-Water temperature Salini!y pH Ph9sphorus saturation with
Date Time Cruise Tide " ity discdissolved oxygen
reading
Surface Bottom Surface Bottom Surface Bottom Surface Bottom Surface Bottom
------ --- ------ --- --- --- --- --- ---Mil/i- Milli-
1935PaTtI p£., Pa,'s.l'ir granlJ pa grlltlls 1'''
It-lttc,°rs • C. • C. thousand thousand (llbicmtttr cubicmtttrDec. 3 2:50 p. m _____ 4 FF 0.6 8.3 8.1 3.91 4.78 7.3 7.3 --------- --------- ----sLj- -----Si~9- 13 9:25 a. m______ 5 FF .7 6.3 6.2 4.,29 6.96 7.3 7.6 --------- ---------
1936Jan. 6 3:35 p. m______ 7 I.E .2 i.2 1.1 .07 .07 7.2 6.7 --------- -----Tr:- 82.3 71.3Mar. 6 11:10 a. m______ 12 FE .2 5.7 5.3 1.69 1.98 7.0 7.0 2Tr.
----s6~i- -----iin·19 12:30 p. m _____ 14 I.E-----~i-
10.8 10.5 .04 .04 7.1 7.2 ----To- ---------25 12:00 m________ 16 LF 11.7 11.6 .10 .08 6.7 6.7 Tr. ----9iT -----7S~SApr. I 11 :35 a. m. _____ 17· !-:iE .2 13.8 13.7 .10 .10 7.0 6.9 . Tr. T ...9 11:50 a. m. _____ IS I.F .2 12.2 12.2
-----~07- -----:07- 6.9 6.9 92.4 12.2----9~:0- ----iO):s16 1:30 p. m _____ 20 LWS .4 13 .1 13.0 6.9 6.9 15.0 12.4
29 2:40 p. m _____ 21 H' .2 16.3 15.5 .. 10 .10 6.8 6.7 12.4 12.4 90.0 82.9June 3 11:30 p. m _____ 23 HWS .6 24.1 22.8 6.46 6.73 -----7:i- -----7:)- Tr. Tr. 81.1 87.9July 2 10:00 a. m______ 29 FE .6 .25.5 25.4 9.49 10.14 6.2 6.2 83.8 76.8
17 11 :25 a. m______ 31 FE .6 28.7 27.9 12.H 12.52 7.1 7.3 3.1 3.1 ----s6T -----61:4'31 3:30 p. 111 _____ 32 LE .6 27.1 26.7 7.23 9.86 -----7T -----7T 12.4 0Aug. 17 11 :15 a. 111 ______ 33 l.F .5 27.2 27.2 10.75 n.35 30.0 30.0 93.5 69.7
28 3:00 p. m_____ 34. FF .8 28.5 28.1 11.76 11.91 7.2 7.2 12.4 12.4 76.8 77.0Sept. II 1:05 p. 111 _____ 35 LE .5 26.2 25.9 11.33 11.82 7.0 7.2 3.1 3.1 86.5 83.8Oct. 22 1:40 p. m_____ 37 Fl' .7 19.9 19.7 12.25 12.32 7.9 7.8 12.4 12.4 79.3 78.4Nov. 4 9:30 •. m______ 38 LWS .6 15.7 15.5 9.81 10.55 7.2 7.1 3.1 3.1 84.4 ·83.4
19 2.:45 p. 111 _____ 39 J..F .7 9.2 9.2 13.44 14.02 7.6 7.6 -----6:i- -----6:2" --------- ---------Dec. 4 11 :25 a. m______ 40 LWS .7 5.7 5.5 10.48 11.91 . 7.6 7.6 - -------- ---------
15 3:15 p. 111 _____ 42 FE 1.1 5.2 4.9 11.98 12.86 7.7 7.6 6.2 6.2 --------- ---------i937
Jan. 5 2:00 p. m ____ : 43 FF .3 6.4 6.3 .96 1.56 7.1 7.1 - 74.4 12.4 -----6S:S27 12:15 p. m _____ 45 HWS .2 8.9 8.9 .19 .40 6.9 6.8 12.4 12.4 ----6iTFeb. 11 10:00 a. 111 ______ 46 Ll' .2 4.9 4.5 3.57 4.87 7.2 7.3 Tr. Tr. ----69:1" -----S):4Iv!ar. 3 12:30 p. 111 _____ 47 LWS .2 5.2 5.0 .12 .12 6.9 6.8 8.0 8.0
30 2:15 p. 111 _____ 49 HWS .4 9.1 8.7 6.17 7.29 8.2 8.2 Tr. Tr. 91.5 89.6Apr. 27 3:00 p. m ____ • 50 FE .3 . 16.1 15.9 2.67 3.73
--------~ ---- .. ---- Tr. Tr. 75.5 70.6.I LWS=Low water slack, HWS=High water slack. LE=Last of ebb, LF=Last of flood. FF=l'irst of flood, etc.
2 Tr.=Tracc:. .
TABLE 19.-Hydrogr<lpltic data for it,ltiOll55 ill tI,e lower PialLkatallk Riller off Irati Poi~lt
[Average depth 4.2 feetl
Turbidity WaterPe:rcent~gesaturation
Dolle Time: enlise Tide I disc temper- Salinity pH Phosphorus withreading ature dissolved
oxygen
Parts 1ur OMiltigrams1935 Mil"s • C. Ihousand ptT cubic meter
Dec. 10 1:50 p. m___ ~ ~ ~ _~ ~ ~ _~ ________ .. _.. ________________ 2 J2E 'B 6.6 17.56 8.1 ------------ 101.4
1936 I
J.n. 1112 :25 p. m___________ • ______•• _______________ • ___ 3 FF B 2.2 13.75 7.9 ------------ 97.0
M". 3 1:30. p. m___________ • ____________________·• ______ . 4 1'1' B 4..; 11.17 8.1---'---iT~-
108.612 2:00 p. m_______________________________________ 5 FE ----13---; 7.0 11. 73 7.9 73.1
Apr. 3 10: IS a. m________________________________ " ______ 6 LE 11.9 10.14 8.3 Tr. 102.916 10:30 a. m___________________________________"___ • 7 I.E B 13.2 8.42 8.4 Tr.. 106.7
May 6 9:25 a. m________ • ______________________________ 8 LF n -18.8 8.06 8.3 Tr. 103.3JUlie 4 11:00 a. In_______________________________________ 9 FE B 23.2 10.86 ------7:7" 92.0 90.3
16 10:00 a. m______________ . _. ______________________ 10 ~'E H 24.5 1I. 7_1 3.0 ------91:9July 1 10:00 a. 111 _______________________________________ 11 .7'2E B 25.0 12.67 8.1 3.021 10:40 a. pl---_":.- ---- --- -- - - - - -- -- - - ~. - - - -- - - - - - -. 12 FE B 27.2 14.22 7.4 6.2 ----·---S7:7Aug. 3 10:30 a. 111 ____ __ ____________________ • ~ ____ ~ ______ • 13 J:iF B 25.7 16.04 7.8 8.021 10:15 :1. m _______________ ~ _______ ~ ______________ . H LF ---------- 28.0 1/).46 7.9 12.4 106.5
Sept. 3 9:15 a. m___ .'________________ . ___ . ______ ~ ______ ~ 15 HWS ----13---- 25.2 18.01 7.7 6.2 96.0Oct. 6 10:30 a. nl __ • __________________"_______ • _____ • ____ 17 HWS 21.0 18.57 7.9 3.1 97.6
26 1I:-l5 a. 111 ___ • ______________ ~ _____ • _ ~ _. _______ ~ __ 1~ );1' H 19.0 19.05 7.9 3.1 96.4NlW. 10 10:30 a. nl ___ • ______________ • _____________ • _ ~ _ ___ 19 FE U 13.7 19.40 8.0 -------Ti- 112.2Dec. 1 10:15 a. 111 ________________ ~ _ ~ ________________"____ 21 HWS B 5.3 19.67 8.0 ------------
1937J:OI1. 12 10:30 a. 111 __ • ___ • ___ ~ ____________________________ 2l FE B 8.1 17.32 8.1 Tr. --------99:2l,'eb. 2 10:10 a. moo ___ ~ ____ ~ ____________"___________ .. _____ 24 LE B 6.7 0.64 7.6 Tr.
IG 9:45 a. In~_ ~ _____________________________ • ______ 25 ~2F ----B---- 5.4 12.43 7.8 -------i4:S" 99.2Mar. 2 10:30 a. 111 __ ~ __ _____ .. _____ ~ ______________________ 26 I.E 3.9 12.57 7.9
~-----------
23 9:30 a. m ____ . __________________________________ 27 r'E B 8.1 11.35 ------S:6- 3.1 ------------Apr. 6 10:15 a. m•• _____________________________________ 28 FE B 10.7 13.15 5.0 113.6
21 9:-l5 a. 111 _____ ~ _________________________________ 29 HWS B 15.1 13.37 8.6 ------------ 111.4
'LWS=Low water slack, HWS=High water slack, LE=L.st of ebb, FE=First of ebb, FF=First of flood, etc., B=On the bottom.I Tr.=Trace.

186 FISHERY BULLETIN OF THE FISH AND WILDLIFE SERVICE
TABLE 20.-Hydrographic data for statio1153 ill the upper Pia1lkatallk RilJer off Ferry Creek
[Average deptb 7.3 .feet)
Water temperatlire Salinity pH Pbosphorus·Percentage
Turbid-saturation with
Date Time Cruise Tide I ity discdisso\ved o:,ygen
readingSIld.ce Bottom Surface Bottom Surrare Bottom Surrace Bottom Surrace Bottom
------------------------------------MiIIi- Milli-
1935 Altlers • C. • C.Parts 1"r Paris P" {,rams'Pu trams pertho"ldnd thousand cubic tiuttT c,.bicmtttr
Nov. 13 2:40 p. m______ 1 I"E--~-i:i-
17.4 16.8 13.33 14.5\ -----8:0- -----8:0- ------.-- --------- ----97:4" ----ioo:7Dec. 10 11 :30 a. m______ 2 HWS 7.1 7.1 13.33 13.73 --------- ... _-------1936
l1n. 11 11 :20 a. m______ 3 FF 1.8 3.0 2.5 7.48 12.00 7.8 7.8 --------- --------- ·91.2 92.4ar. 3 11 :40 a. m______ 4 FE 2.2 -----9:2" 5.1 ---Tii" 6.11 ----"7:6- 7.5 ----;Tr:- -----Tr:- ----7.,ST 99.4
12 12:45 p. m_____ 5 HWS 1.3 9.1 7.27 7.6 , 75.7·Apr. 3 12:10 p. m_____ 6 LE 1.3 12.9 7.18 7.9 Tr. --------- 97.8
16 11 :45 a. m______ 7 LE -------- ----io:2" 14.9 ----n-i- 5.63 -----8:0- 8.1 -----Tr:- Tr. ----9iX 98.4May 6 11:00 a. m______ .8 LF 1.2 19.7 6.00 8.0 Tr. 93.9June 4 12:30 p. m_____ 9 ~E 1.2 24.3 24.4 9.60 9.43 -.------- -----7T 6:2 3.0. 96.1 76.0
,16 11 :00 a. m______ 10 FE -------- --------- 25.3 9.65 6.2 --------- -----77:9July 1 11 :30 a. m______ 11 LE -----T ----i7:7" 25.8 ---i2:-i8- 10.75 ----"7:i- . 7.6 -----6:2" Tr.21 12:40 p. m___ :_ 12 FE 27.9 12.70 7.2 6.2 ----79T -----8i:6. Aug. 3 12:00 m ________ 13 u· .5 27.3 26.3 14.16 14.67 7.5 7.5 4.0 6.221 11 :20 a, m_____ . 14 LF 28.6 27.5 13.26 15.25 7.9 7.7 12.4 12.4 110.3 66.8
Sept. 3 11 :45 a. m______ 15 LE ----i:o- 26.0 25.4 16.04 16.26 7.7 7.8 6.2 6.2 100.4 101.6Oct. 6 1l:00 m________ 17 FF 20.8 21.3 16.80 17.09 7.9 7.8 3.6 6.2 105.8 97.4
2611~~f~.m.;:: ::: 18 LF ----i:O- 18.9 18.9 17.45 17.34 7.9 7.8 3.1 3.1 92.6 94.0
Nov. 10 19 FF 14.1 14.1 17.90 17.88 7.9 7.9 --------- --------- 98.1 100.8Dec. 1 12:30 p. m_____ 21 FE 1.6 4.2 4.3 17.57 17.57 8.u 7.9 3.1 3.1 --------- ---------
19378:9Jan. 12 2:30 p. m______ 22 LWS 1.7 8.9 12.25 12.47 7.9 7.9 Tr. Tr. ----86:7- -----78:0
'C" Feb. 2 11 :50 a. m______ 24 LE .7 6.2 6.1 7.14 7.05 7.5 7.1 T,. Tr.16 11 :00 a. m______ 25 ';F 1.7 5.9 5.7 8.33 8.28 7.5 7.7 --------- ----i-iT 106.2 101.8
Mar. 2 12:00 m________ 26 FF 1.8 -----8:9" 3.8 ----9:i6- 7.85 --------- -----j:i- --------- ---------23 10:45 a. m______ 27 FE 2.0 8.8 10.23 -----8:4" -----8T 6.2 ---iosT ----io,S:oApr. 6 12:00 m________ 28 ~.E 1.0 13 .1 12.7 9.02 9.07 5.0 5.021 10:45 a. m______ . 29 FE 1.4 16.1 14.1 10.35 B.46 8.6 8.6 --------- ---- ..---- 117.7 113.5
. 1 LWS=Low water slack, HWS=Higb water slack, LE=L.st of ebb, LF=Last or flood, FF=First or flood, etc.'Tr.:=Trace. . .
o