
Favourable areas for expansion and reintroduction of Iberian lynx accounting for distribution trends...
14
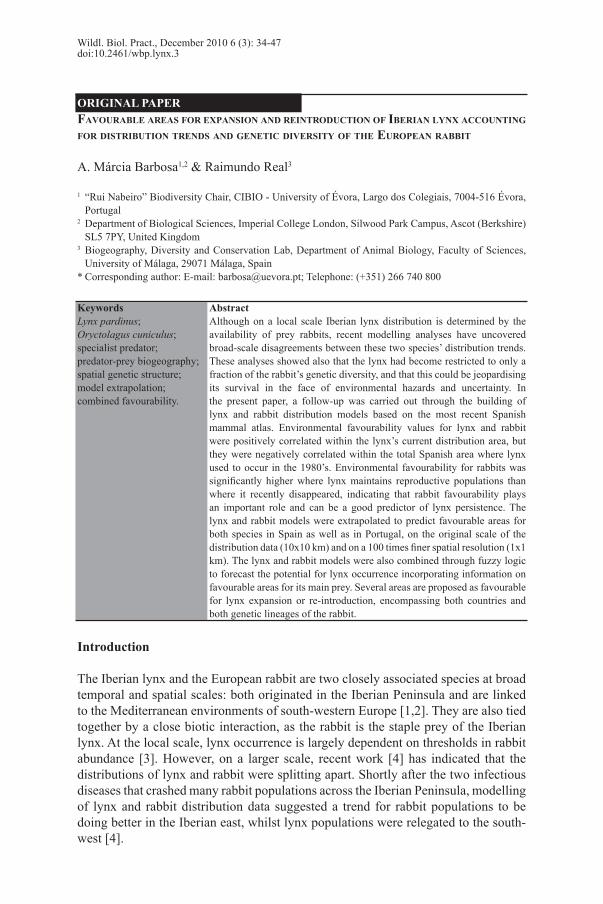
ORIGINAL PAPER Wildl. Biol. Pract., December 2010 6 (3): 34-47 doi:10.2461/wbp.lynx.3 FAVOURABLE AREAS FOR EXPANSION AND REINTRODUCTION OF IBERIAN LYNX ACCOUNTING FOR DISTRIBUTION TRENDS AND GENETIC DIVERSITY OF THE EUROPEAN RABBIT A. Márcia Barbosa 1,2 & Raimundo Real 3 1 “Rui Nabeiro” Biodiversity Chair, CIBIO - University of Évora, Largo dos Colegiais, 7004-516 Évora, Portugal 2 Department of Biological Sciences, Imperial College London, Silwood Park Campus, Ascot (Berkshire) SL5 7PY, United Kingdom 3 Biogeography, Diversity and Conservation Lab, Department of Animal Biology, Faculty of Sciences, University of Málaga, 29071 Málaga, Spain * Corresponding author: E-mail: [email protected]; Telephone: (+351) 266 740 800 Keywords Lynx pardinus; Oryctolagus cuniculus; specialist predator; predator-prey biogeography; spatial genetic structure; model extrapolation; combined favourability. Abstract Although on a local scale Iberian lynx distribution is determined by the availability of prey rabbits, recent modelling analyses have uncovered broad-scale disagreements between these two species’ distribution trends. These analyses showed also that the lynx had become restricted to only a fraction of the rabbit’s genetic diversity, and that this could be jeopardising its survival in the face of environmental hazards and uncertainty. In the present paper, a follow-up was carried out through the building of lynx and rabbit distribution models based on the most recent Spanish mammal atlas. Environmental favourability values for lynx and rabbit were positively correlated within the lynx’s current distribution area, but they were negatively correlated within the total Spanish area where lynx used to occur in the 1980’s. Environmental favourability for rabbits was significantly higher where lynx maintains reproductive populations than where it recently disappeared, indicating that rabbit favourability plays an important role and can be a good predictor of lynx persistence. The lynx and rabbit models were extrapolated to predict favourable areas for both species in Spain as well as in Portugal, on the original scale of the distribution data (10x10 km) and on a 100 times finer spatial resolution (1x1 km). The lynx and rabbit models were also combined through fuzzy logic to forecast the potential for lynx occurrence incorporating information on favourable areas for its main prey. Several areas are proposed as favourable for lynx expansion or re-introduction, encompassing both countries and both genetic lineages of the rabbit. Introduction The Iberian lynx and the European rabbit are two closely associated species at broad temporal and spatial scales: both originated in the Iberian Peninsula and are linked to the Mediterranean environments of south-western Europe [1,2]. They are also tied together by a close biotic interaction, as the rabbit is the staple prey of the Iberian lynx. At the local scale, lynx occurrence is largely dependent on thresholds in rabbit abundance [3]. However, on a larger scale, recent work [4] has indicated that the distributions of lynx and rabbit were splitting apart. Shortly after the two infectious diseases that crashed many rabbit populations across the Iberian Peninsula, modelling of lynx and rabbit distribution data suggested a trend for rabbit populations to be doing better in the Iberian east, whilst lynx populations were relegated to the south- west [4].
Transcript of Favourable areas for expansion and reintroduction of Iberian lynx accounting for distribution trends...
ORIGINAL PAPER
Wildl. Biol. Pract., December 2010 6 (3): 34-47doi:10.2461/wbp.lynx.3
Favourable areas For expansion and reintroduction oF iberian lynx accounting For distribution trends and genetic diversity oF the european rabbit
A. Márcia Barbosa1,2 & Raimundo Real3
1 “Rui Nabeiro” Biodiversity Chair, CIBIO - University of Évora, Largo dos Colegiais, 7004-516 Évora, Portugal
2 Department of Biological Sciences, Imperial College London, Silwood Park Campus, Ascot (Berkshire) SL5 7PY, United Kingdom
3 Biogeography, Diversity and Conservation Lab, Department of Animal Biology, Faculty of Sciences, University of Málaga, 29071 Málaga, Spain
* Corresponding author: E-mail: [email protected]; Telephone: (+351) 266 740 800
KeywordsLynx pardinus;Oryctolagus cuniculus;specialist predator;predator-prey biogeography;spatial genetic structure;model extrapolation;combined favourability.
AbstractAlthough on a local scale Iberian lynx distribution is determined by the availability of prey rabbits, recent modelling analyses have uncovered broad-scale disagreements between these two species’ distribution trends. These analyses showed also that the lynx had become restricted to only a fraction of the rabbit’s genetic diversity, and that this could be jeopardising its survival in the face of environmental hazards and uncertainty. In the present paper, a follow-up was carried out through the building of lynx and rabbit distribution models based on the most recent Spanish mammal atlas. Environmental favourability values for lynx and rabbit were positively correlated within the lynx’s current distribution area, but they were negatively correlated within the total Spanish area where lynx used to occur in the 1980’s. Environmental favourability for rabbits was significantly higher where lynx maintains reproductive populations than where it recently disappeared, indicating that rabbit favourability plays an important role and can be a good predictor of lynx persistence. The lynx and rabbit models were extrapolated to predict favourable areas for both species in Spain as well as in Portugal, on the original scale of the distribution data (10x10 km) and on a 100 times finer spatial resolution (1x1 km). The lynx and rabbit models were also combined through fuzzy logic to forecast the potential for lynx occurrence incorporating information on favourable areas for its main prey. Several areas are proposed as favourable for lynx expansion or re-introduction, encompassing both countries and both genetic lineages of the rabbit.
Introduction
The Iberian lynx and the European rabbit are two closely associated species at broad temporal and spatial scales: both originated in the Iberian Peninsula and are linked to the Mediterranean environments of south-western Europe [1,2]. They are also tied together by a close biotic interaction, as the rabbit is the staple prey of the Iberian lynx. At the local scale, lynx occurrence is largely dependent on thresholds in rabbit abundance [3]. However, on a larger scale, recent work [4] has indicated that the distributions of lynx and rabbit were splitting apart. Shortly after the two infectious diseases that crashed many rabbit populations across the Iberian Peninsula, modelling of lynx and rabbit distribution data suggested a trend for rabbit populations to be doing better in the Iberian east, whilst lynx populations were relegated to the south-west [4].

35
Furthermore, this disagreement might be related to the phylogeographic structure of Iberian rabbit populations [4]. Rabbits exist in two clearly divergent genetic lineages that are geographically segregated, one occurring mainly in the Iberian south-western quarter, and the other predominating in the remainder of the rabbit distribution range [1]. Recent work has emphasised that the regression of the Iberian lynx over the last decades, caused mainly by human persecution and changes in land use [5], confined it to areas that happened to hold rabbits of only one genetic lineage [4]. The risk of a predator depending so strongly on a single prey species was aggravated by its dependence on only a fraction of that prey’s intra-specific genetic diversity.The latest atlas of Spanish mammal distributions [6] revealed an expansion of the area of recorded rabbit occurrence in relation to the previous mammal atlas, especially in western Spain [7]. This expansion reflected, in part, an increase in rabbit surveying coverage, though it was also a result of the recovery or reinforcement of some rabbit populations, aided in some cases by habitat management actions [8]. In the present paper, these updated distribution data were modelled to assess current environmental favourability for the rabbit across the Iberian Peninsula. This model was then combined with another model of favourability for Iberian lynx, in order to define favourable areas for expansion or reintroduction of this predator taking into account not only environmental determinants but also the spatial trends of its main prey.In some circumstances, distribution models can be extrapolated to predict favourable areas for species occurrence outside the region from where modelled data were taken, at least when the environmental characteristics of the extrapolated territory fall within the range of values computed by the model. This has been done successfully with another Iberian mammal species [9]. Therefore, the distribution data available on the Spanish atlas of mammal distributions [6] can be modelled to predict favourable areas for lynx and rabbit in both Spain and Portugal.Models can also be downscaled to predict local-scale distributions from coarser-resolution data, as demonstrated for two other mammal species in the Iberian Peninsula [10, 11]. Thus, models can better indicate local variations in species occurrence potential, as well as the existence of appropriate connectivity corridors between favourable areas.In this paper 1) lynx and rabbits models were calibrated in Spain using the most recent Spanish atlas of mammal distributions; 2) these models were then extrapolated to predict favourable areas for both of these species in the entire Iberian Peninsula, both at the original resolution of the distribution data (10x10 km) and at a 100-times finer resolution (1x1 km); and finally 3) we propose favourable areas for lynx expansion and reintroduction in Spain and in Portugal, taking into account not only environmental factors but also the availability of rabbits and their spatial genetic structure.
Methods
Potential predictive variables for lynx and rabbit distribution were gathered from several sources and included climatic, topographic, human, and spatial factors (Table 1). Many of these variables may not affect the species directly although they may be strongly correlated to direct variables or resources [12]. Such indirect broad-scale predictors are more easily measured and usually represent a straightforward replacement of a combination of direct variables [13]. Also, they usually act as

36
surrogates for more local causal factors [14]. The inclusion of spatial variables allows accounting for distribution trends, that are not related to the spatial structure in the environmental conditions [15-17], but rather to historical events or species’ dispersion dynamics [18-20].
Table 1. Variables used to model the distributions of Iberian lynx and European rabbit. Variables are presented in alphabetical order of their codes.
Code VariableAET Mean annual actual evapotranspiration (mm) (=minimum(PET, Prec))Alti Mean altitude (m) [21]DFro Mean annual number of frost days (minimum temperature ≤ 0ºC) [22,23]DHi Distance to the nearest highway (km) [24]DPre Mean annual number of days with precipitation ≥ 0,1 mm [22,23]HJan Mean relative air humidity in January at 07:00 hours (%) [22,23]HJul Mean relative air humidity in July at 07:00 hours (%) [22,23]HRan Annual relative air humidity range (%) (=|HJan-HJul|)Inso Mean annual insolation (hours/year) [22,23]Lati Latitude (degrees N) [24]Long Longitude (degrees E) [24]MP24 Maximum precipitation in 24 hours (mm) [22,23]PET Mean annual potential evapotranspiration (mm) [22,23]Prec Mean annual precipitation (mm) [22,23]RMP Relative maximum precipitation (=MP24/Prec)Slop Slope (degrees) (calculated automatically from Alti)SRad Mean annual solar radiation (kwh/m2/day) [22,23]Temp Mean annual temperature (ºC) [22,23]TJan Mean temperature in January (ºC) [22,23]TJul Mean temperature in July (ºC) [22,23]TRan Annual temperature range (ºC) (=TJul-TJan)U100 Distance to the nearest town with more than 100,000 inhabitants (km) [24]U500 Distance to the nearest town with more than 500,000 inhabitants (km) [24]
The maps of variables and territorial units [9,10], in the Universal Transverse Mercator (UTM) coordinate reference system (European Datum 1950, zone 30N), were managed in GRASS (Geographic Resources Analysis Support System) [25] through the Quantum GIS 1.4 [26] interface. Data handling and statistical analyses were carried out in R 2.8.2 [27].Distribution data of lynx and rabbit, based on presences and absences on UTM 10x10 km grid cells, were taken from the most recent Spanish mammal atlas [6] and include records gathered between 1980 and 2007. A relatively long study period is necessary to ensure that most of the study area was actually covered by sampling, especially in the case of the rabbit, which has not been the subject of a wide-scale specific survey over a shorter period of time. Furthermore, because rabbit populations naturally fluctuate (and these fluctuations have been further enhanced by diseases), using distribution data that span over a considerable period of time avoids computing momentary absences as unsuitable territory. By using data collected since the 1980’s we ensure that all places proven capable of holding rabbit populations are included in the model as presences.

37
With respect to the lynx, the atlas distinguishes the areas that still hold reproductive populations today (Fig. 1). Although the current lynx distribution is now much more restricted than it was in the beginning of the eighties [6], the relationship between lynx distribution and the analysed variables can also be better gauged by modelling all lynx presences recorded since the 1980’s. This is because the lynx’s sharp recent regression was not due to these variables, as their values have not changed appreciably over the last decades: geographic and topographic variables remained invariant along the study period; climate data have been averaged among several (generally around 40) years between 1956 and 1999, and are considered to still represent current climatic conditions [22,23]; the location of the major urban centres has also been the same since the 1980’s; and although some of the highways were built recently, they were already major roads before highway construction. We used the urban centres and highways of an intermediate moment of the period from which species distribution data were taken.The lynx distribution data modelled here are essentially similar to those reported in the previous mammal atlas [7] and modelled in an earlier paper [4]. However, the model built here, besides including some new presences and absences [6], is also different in that it includes only variables whose values are available for the entire Iberian Peninsula. This was done so that predictions could be extrapolated to forecast potential lynx areas in Portugal as well. The rabbit model was also based on variables that allowed extrapolation to Portugal, and was additionally different from the one based on the previous distribution atlas [4,7] in that the recent rabbit occurrence data [6] reflect a noticeable increase in its recorded distribution area, especially in western Spain.The algorithm used to model lynx and rabbit distributions was the environmental favourability function [28], a generalised linear model that accounts for species prevalence to eliminate its effect on the magnitude of the predicted values. Generalized linear models have been shown to outperform more complex modelling techniques [29], providing a good trade-off between model complexity and performance. They have also proven to be robust to transferability in both space [9,30] and resolution scale [10,11]. More importantly, with the favourability function, prediction thresholds for all models are levelled according to the species’ prevalence in the analysed dataset. A model output value of 0.5 represents neutral favourability (i.e., species presence is as likely as its prevalence within the modelled data) and can be used as threshold for all models, even when they are based on uneven presence/absence datasets [28,31]. In this way, model predictions are directly comparable for different species [4], regions [9], spatial resolutions [11], or moments in time.Generalised linear models are sometimes criticised for explicitly incorporating absence data, some of which can be due to insufficient sampling effort. However, profile methods such as Maxent and Ecological Niche Factor Analysis, often presented as the alternative and wrongly referred to as presence-only modelling techniques, use absence data as well – they compare presence localities to the “background”, which includes the presences and the rest of the study area (i.e. the “non-presences”). Even truly presence-only techniques, such as overlap analysis and Mahalanobis distance, are affected by false absences, as they miss the presences that are not computed as such. As long as sampling effort is not spatially biased, models that explicitly account for absences may have better descriptive and predictive potential, as they compute valuable information on conditions that are indeed unfavourable for the species [4,9].

38
To avoid a spurious effect of the area of the UTM cells, which can vary along study area borders and along the unions between UTM zones, only complete 100 km2 squares (n=4443, with 302 lynx and 3270 rabbit presences) were used for model building. Models were then evaluated on the complete set of Spanish UTM squares (n=5167).Variables were included in the models in a stepwise manner using Akaike’s information criterion [32] for variable selection. In case any non-significant variables remained in a model after this procedure, the model was further updated by removing them step by step, starting with the least significant variable [33]. The increase of type I error under repeated testing (i.e., the family-wise error) was minimised by controlling the false discovery rate [34,35]. In this way, final models included only variables which were informative in a parsimonious way and which had a significant multivariate effect on the target species’ distribution. Stepwise selection maximizes predictive efficiency in an objective and reproducible way and is useful when the individual importance of the predictors is not known a priori [36].Although some of the analysed variables are correlated, the selection procedure adds at each step only variables with a significant additional contribution to the model, and drops variables when this does not significantly decrease model fit. Moreover, correlations between predictors affect the significance of coefficient estimates, but not the predictive ability of the models, which can actually profit from including correlated variables [37]. The accuracy of model predictions was here considered more important than the significance of particular predictor variables.Evaluation of model predictions was based on their overall correct classification rate, their sensitivity and specificity (proportions of correctly classified presences and absences, respectively), and the Area Under their receiver operating characteristic Curve (AUC). The latter was calculated with the R verification package and measures the ability of the models to discriminate between observed presences and absences across all possible classification thresholds [38]. A relatively low AUC may reflect a widespread distribution of the modelled species rather than a low quality of the model [39]. Consequently, Mann-Whitney-Wilcoxon tests were used to check that the AUC of each model was significantly different from 0.5, indicating that the predictions were significantly different from random [40].Predicted environmental favourability values for lynx and rabbit were compared using Kendall’s rank correlation coefficient, considering the whole study area, the lynx occurrence area in the 1980’s, and the current reproductive range of the lynx. Predicted favourability for rabbits was also compared between the areas from where lynx has disappeared after the 1980’s, and the areas where lynx has maintained stable populations since then [6] (Fig. 1).Because lynx occurrence depends not only on environmental variables but also on rabbit abundance [3], and because environmental favourability for a species can be an indicator of abundance [4,41,42], a combined favourability for lynx and rabbit was calculated using fuzzy intersection, i.e., the minimum between rabbit and lynx favourability for each UTM square [4,28,43]. This provides a measure of favourability for the lynx that takes into account the potential availability of its main prey.The lynx and rabbit favourability models, as well as their combination, were extrapolated to predict favourable areas for both species in Portugal, where the values of the modelled variables fall within the ranges computed in Spain [9]. They were also

39
downscaled in the entire Iberian Peninsula to a 1x1 km resolution, with the r.mapcalc GRASS module. A change in resolution scale introduces further uncertainty in model predictions, but similar downscaling procedures on two other Iberian mammal species have shown good performances and validated with independent fine-scale field data [10,11]. This procedure allows detecting the existence of connectivity corridors between current and potential populations on a more appropriate scale to assess the possibility of species movements.
Results
The lynx model included 15 significant variables (Table 2) and achieved an overall correct classification rate of 78.8%, with 89.3% correctly classified presences and 78.1% correctly classified absences in Spain. The rabbit model included 13 significant variables (Table 2) and had a correct classification rate of 66.3%, with 70.6% correctly classified presences and 55.2% correctly classified absences. The AUC of the lynx model was 0.919, while for the rabbit it was 0.683; both were significantly different from 0.5 (Mann-Whitney-Wilcoxon tests, p<0.001), indicating non-random discrimination between presences and absences.
While the lynx model (Fig. 1) is essentially similar to that previously published using Spanish predictor variables and a slightly different distribution dataset [4], the rabbit model shows a visible increase in favourability compared to that based on the previous mammal atlas [4], particularly in western Spain (Fig. 1). Environmental favourability for lynx and rabbit according to the present models are positively correlated if we consider either the entire peninsular Spain (tau-b=0.230, p<0.001, N=5167) or the area where reproductive lynx populations still occur nowadays
Table 2. Variables included in the lynx model and the rabbit model and their coefficient estimates with significance levels (***p<0.001, **p<0.01, *p<0.05). Variables are ranked in their order of entrance in the models. Variable codes as in Table 1.
Lynx RabbitVariable Coefficient Variable CoefficientSRad 8.759 *** Inso 0.0009917 ***Long -0.846 *** U100 -0.0114286 ***PM24 0.0301 *** HJan -0.0448602 ***VTem 0.347 *** AET 0.0023433 ***RMP -12.0600 ** Prec -0.0007294 ***DHi 0.0123 *** U500 0.0052838 ***Prec -0.00503 *** HJul -0.0290442 ***U500 0.00978 *** Long 0.1250852 ***Slop 0.202 *** Slop -0.0634851 **DFro 0.0559 *** Lati -0.1891538 ***Alti -0.00211 *** DPre 0.0077640 *PET 0.00796 *** PET -0.0047401 ***DPre -0.0301 ** Temp 0.1511150 ***Inso -0.00360 *** (Intercept) 13.0057654 ***AET 0.00326 **(Intercept) -51.600 ***
40
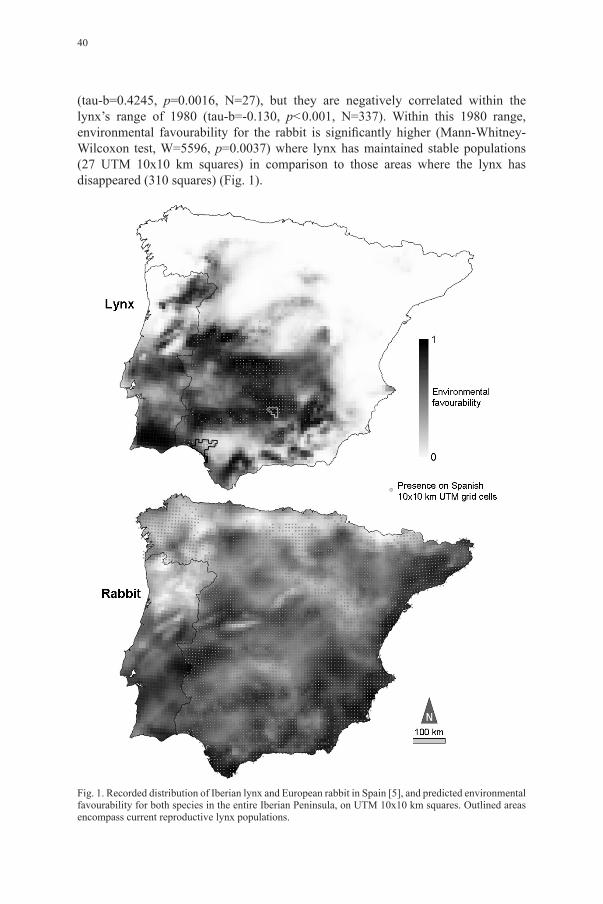
(tau-b=0.4245, p=0.0016, N=27), but they are negatively correlated within the lynx’s range of 1980 (tau-b=-0.130, p<0.001, N=337). Within this 1980 range, environmental favourability for the rabbit is significantly higher (Mann-Whitney-Wilcoxon test, W=5596, p=0.0037) where lynx has maintained stable populations (27 UTM 10x10 km squares) in comparison to those areas where the lynx has disappeared (310 squares) (Fig. 1).
Fig. 1. Recorded distribution of Iberian lynx and European rabbit in Spain [5], and predicted environmental favourability for both species in the entire Iberian Peninsula, on UTM 10x10 km squares. Outlined areas encompass current reproductive lynx populations.

41
Extrapolation of the models to Portugal shows that there are highly favourable areas for the lynx also in this country (Fig. 1 and 2). Relatively large continuous areas of high favourability for lynx in Portugal are predicted for the Algarve and Southern Alentejo, the São Mamede mountain range, the region just south of Malcata, and part of the Douro valley (Fig. 2).
Fig. 2. Predicted environmental favourability for Iberian lynx and European rabbit in the Iberian Peninsula downscaled to 1x1 km pixels. Relatively large continuous areas of high favourability for lynx in Portugal are indicated.
42
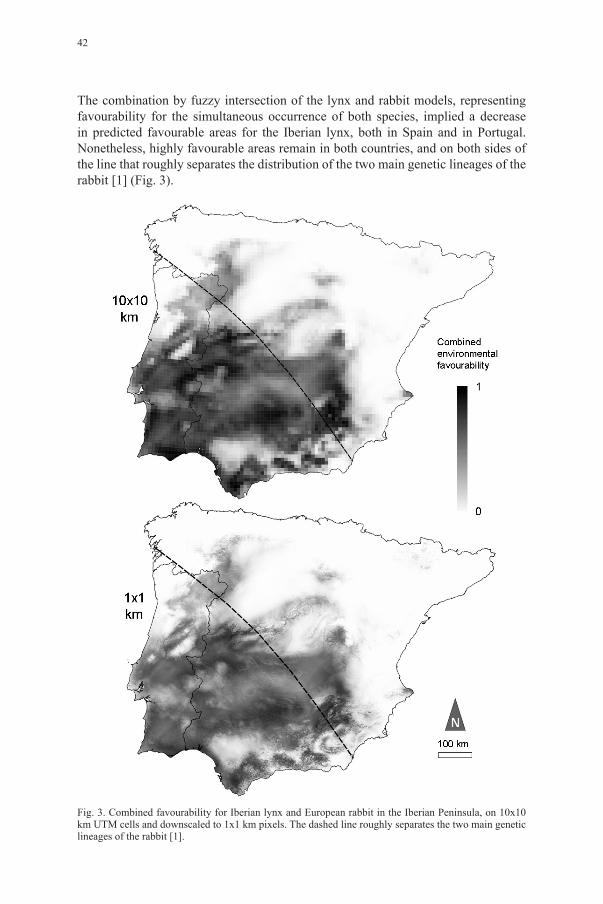
The combination by fuzzy intersection of the lynx and rabbit models, representing favourability for the simultaneous occurrence of both species, implied a decrease in predicted favourable areas for the Iberian lynx, both in Spain and in Portugal. Nonetheless, highly favourable areas remain in both countries, and on both sides of the line that roughly separates the distribution of the two main genetic lineages of the rabbit [1] (Fig. 3).
Fig. 3. Combined favourability for Iberian lynx and European rabbit in the Iberian Peninsula, on 10x10 km UTM cells and downscaled to 1x1 km pixels. The dashed line roughly separates the two main genetic lineages of the rabbit [1].
43
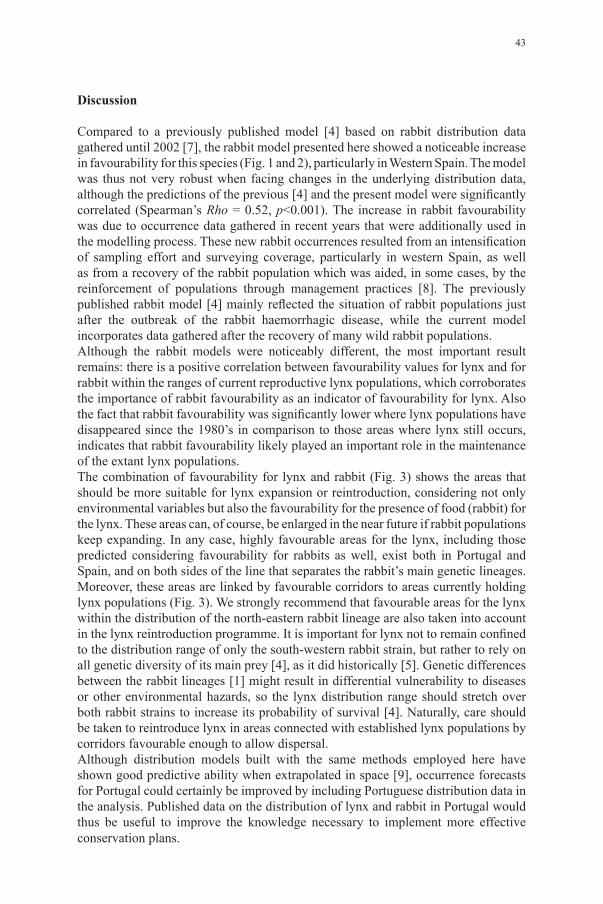
Discussion
Compared to a previously published model [4] based on rabbit distribution data gathered until 2002 [7], the rabbit model presented here showed a noticeable increase in favourability for this species (Fig. 1 and 2), particularly in Western Spain. The model was thus not very robust when facing changes in the underlying distribution data, although the predictions of the previous [4] and the present model were significantly correlated (Spearman’s Rho = 0.52, p<0.001). The increase in rabbit favourability was due to occurrence data gathered in recent years that were additionally used in the modelling process. These new rabbit occurrences resulted from an intensification of sampling effort and surveying coverage, particularly in western Spain, as well as from a recovery of the rabbit population which was aided, in some cases, by the reinforcement of populations through management practices [8]. The previously published rabbit model [4] mainly reflected the situation of rabbit populations just after the outbreak of the rabbit haemorrhagic disease, while the current model incorporates data gathered after the recovery of many wild rabbit populations.Although the rabbit models were noticeably different, the most important result remains: there is a positive correlation between favourability values for lynx and for rabbit within the ranges of current reproductive lynx populations, which corroborates the importance of rabbit favourability as an indicator of favourability for lynx. Also the fact that rabbit favourability was significantly lower where lynx populations have disappeared since the 1980’s in comparison to those areas where lynx still occurs, indicates that rabbit favourability likely played an important role in the maintenance of the extant lynx populations.The combination of favourability for lynx and rabbit (Fig. 3) shows the areas that should be more suitable for lynx expansion or reintroduction, considering not only environmental variables but also the favourability for the presence of food (rabbit) for the lynx. These areas can, of course, be enlarged in the near future if rabbit populations keep expanding. In any case, highly favourable areas for the lynx, including those predicted considering favourability for rabbits as well, exist both in Portugal and Spain, and on both sides of the line that separates the rabbit’s main genetic lineages. Moreover, these areas are linked by favourable corridors to areas currently holding lynx populations (Fig. 3). We strongly recommend that favourable areas for the lynx within the distribution of the north-eastern rabbit lineage are also taken into account in the lynx reintroduction programme. It is important for lynx not to remain confined to the distribution range of only the south-western rabbit strain, but rather to rely on all genetic diversity of its main prey [4], as it did historically [5]. Genetic differences between the rabbit lineages [1] might result in differential vulnerability to diseases or other environmental hazards, so the lynx distribution range should stretch over both rabbit strains to increase its probability of survival [4]. Naturally, care should be taken to reintroduce lynx in areas connected with established lynx populations by corridors favourable enough to allow dispersal.Although distribution models built with the same methods employed here have shown good predictive ability when extrapolated in space [9], occurrence forecasts for Portugal could certainly be improved by including Portuguese distribution data in the analysis. Published data on the distribution of lynx and rabbit in Portugal would thus be useful to improve the knowledge necessary to implement more effective conservation plans.
44
The predicted favourable areas should also be further filtered by taking into account possible conflicts between lynx and human activities, and by assessing habitat quality on a more local scale [3]. Another potential issue to take into account is the climatic change predicted for the Iberian Peninsula [44], which might displace the environmentally favourable areas for the lynx [M. B. Araújo, unpublished data]. The conservation of this species in the long term might be conditioned by such changes. Nevertheless, a species with such a restricted current distribution has more possibilities of range expansion based on the availability of new unoccupied favourable areas and the modification of extinction and dispersion rates, than on projected changes in climate [45]. Moreover, the uncertainty associated to these future climate projections advises caution in basing conservation programs on such projections, rather than on what we know now.The fragmented spatial structure of the predicted favourable areas for the lynx (Fig. 3) suggests the potential for a metapopulation dynamics [46-48]. In this situation, the availability of unoccupied favourable territories is the key for the overall viability of the metapopulation [45,46]. According to the epidemic threshold theorem, even a small increase in the number of susceptible areas near but outside the range edge of a species can expand its distribution limits [45]. Our model indicates the existence of favourable areas for the lynx outside the species’ range, which in addition to a perceived halt in local extinctions and the prospect of a human-mediated increase in effective dispersion rate, achieved through the reintroduction programs, could help to turn the tide of Iberian lynx viability.
Acknowledgments
We thank L.J. Palomo and all fieldworkers who provided species distribution data. We are also thankful to F. Ferri and A. Estrada for very useful R tips. This work was partly financed by project CGL2009-11316/BOS from Ministerio de Educación y Ciencia, Spain. A.M.B. is supported by fellowship SFRH/BPD/40387/2007 from Fundação para a Ciência e a Tecnologia, Portugal.
References
Branco, M., Ferrand, N. & Monnerot, M. 2000. Phylogeography of the European rabbit (1. Oryctolagus cuniculus) in the Iberian Peninsula inferred from RFLP analysis of the cytochrome b gene. Heredity 85: 307-317.
doi:10.1046/j.1365-2540.2000.00756.xJohnson, W.E., Godoy, J.A., Palomares, F., Delibes, M., Fernandes, M., Revilla, E. & O’Brien, S.J. 2. 2004. Phylogenetic and phylogeographic analysis of Iberian lynx populations. J. Hered. 95: 19-28.
doi:10.1046/j.1365-2540.2000.00756.xPalomares, F., Delibes, M., Revilla, E., Calzada, J. & Fedriani, J.M. 2001. 3. Spatial ecology of Iberian lynx and abundance of European rabbits in southwestern Spain. Wildl. Monogr. 148: 1-36.Real, R., Barbosa A.M., Rodríguez A., García F.J., Vargas J.M., Palomo L.J. & Delibes M. 2009. 4. Conservation biogeography of ecologically-interacting species: the case of the Iberian lynx and the European rabbit. Divers. Distrib. 15: 390-400.
doi:10.1111/j.1472-4642.2008.00546.xRodríguez, A. & Delibes, M. 1992. Current range and status of the Iberian lynx 5. Felis pardina Temminck, 1824 in Spain. Biol. Conserv. 61: 189-196
doi:10.1016/0006-3207(92)91115-9

45
Palomo, L.J., Gisbert, J. & Blanco, J.C. 2007. Atlas y libro rojo de los mamíferos terrestres de España. 6. [Atlas and red book of the terrestrial mammals of Spain]. Dirección General para la Biodiversidad – SECEM – SECEMU, Madrid.Palomo, L.J., & Gisbert, J. 2002. Atlas de los mamíferos terrestres de España. [Atlas of the terrestrial 7. mammals of Spain]. Dirección General de Conservación de la Naturaleza-SECEM-SECEMU, Madrid.Delibes-Mateos, M., Ferreras, P. & Villafuerte R. 2009. European rabbit population trends and 8. associated factors: a review of the situation in the Iberian Peninsula. Mamm. Rev. 39: 124-140.
doi:10.1111/j.1365-2907.2009.00140.xBarbosa, A.M., Real, R. & Vargas, J.M. 2009. Transferability of environmental favourability models 9. in geographic space: the case of the Iberian desman (Galemys pyrenaicus) in Portugal and Spain. Ecol. Model. 220: 747-754.
doi:10.1016/j.ecolmodel.2008.12.004Barbosa, A.M., Real, R., Olivero, J. & Vargas, J.M. 2003. 10. Otter (Lutra lutra) distribution modeling at two resolution scales suited to conservation planning in the Iberian Peninsula. Biol. Conserv. 114: 377-387.
doi:10.1016/S0006-3207(03)00066-1Barbosa, A.M., Real, R. & Vargas, J.M. 2010. Use of coarse-resolution models of species’ distributions 11. to guide local conservation inferences. Conserv. Biol., in press.
doi:10.1111/j.1523-1739.2010.01517.xAustin, M.P. 1980. Searching for a model for use in vegetation analysis. Vegetatio 42: 11-21.12.
doi:10.1007/BF00048865Guisan, A., Weiss, S.B. & Weiss, A.D. 1999. GLM versus CCA spatial modeling of plant species 13. distribution. Plant Ecol. 143: 107-122.
doi:10.1023/A:1009841519580Post, E. & Forchhammer, M.C. 2002. Synchronization of animal population dynamics by large-scale 14. climate. Nature 420: 168-171.
doi:10.1038/nature01064Borcard, D., Legendre, P. & Drapeau, P. 1992. Partialling out the spatial component of ecological 15. variation. Ecology 73: 1045-1055.
doi:10.2307/1940179Diniz-Filho, J.A.F., Bini, L.M. & Hawkins, B.A. 2003. Spatial autocorrelation and red herrings in 16. geographical ecology. Global Ecol. Biogeogr. 12: 53-64.
doi:10.1046/j.1466-822X.2003.00322.x Kühn, I., 2007. Incorporating spatial autocorrelation may invert observed patterns. Divers. Distrib. 17. 13: 66-69.Legendre, P. 1993. Spatial autocorrelation: trouble or new paradigm? Ecology 74: 1659-1673.18.
doi:10.2307/1939924Barbosa, A.M., Real, R., Márquez, A.L. & Rendón, M.A. 2001. 19. Spatial, environmental and human influences on the distribution of otter (Lutra lutra) in the Spanish provinces. Divers. Distrib. 7: 137-144.
doi:10.1046/j.1472-4642.2001.00104.xReal, R., Barbosa, A.M., Porras, D., Kin, M.S., Márquez, A.L., Guerrero, J.C., Palomo, L.J., Justo, 20. E.R. & Vargas, J.M. 2003. Relative importance of environment, human activity and spatial situation in determining the distribution of terrestrial mammal diversity in Argentina. J. Biogeogr. 30: 939-947.
doi:10.1046/j.1365-2699.2003.00871.xU.S. Geological Survey. 1996. GTOPO30. In: Land Processes Distributed Archive Center. United 21. States Geological Survey, Denver. Available from http://www.etsimo.uniovi.es/~feli/Data/Datos.html. Cited 19 October 1999.Font, I. 1983. Atlas climático de España. [Climatic atlas of Spain]. Instituto Nacional de Meteorología, 22. Madrid.

46
Font, I. 2000. Climatología de España y Portugal. [Climatology of Spain and Portugal]. Ediciones 23. Universidad de Salamanca, Salamanca.I.G.N. 1999. Mapa de carreteras. Península Ibérica, Baleares y Canarias. [Road map. Iberian 24. Peninsula, Balearic and Canary Islands]. Instituto Geográfico Nacional and Ministerio de Fomento, Madrid.GRASS Development Team. 2009. Geographic resources analysis support system (GRASS). Open 25. Source Geospatial Foundation, Vancouver, British Columbia. Available from: http://grass.osgeo.org. Cited 19 January 2009.Quantum GIS Development Team. 2009. Quantum GIS. Geospatial Foundation, Vancouver, British 26. Columbia.
Available from: http://qgis.osgeo.org. Cited 19 January 2009.R Development Core Team. 2009. R: a language and environment for statistical computing. R 27. Foundation for Statistical Computing, Vienna.
Available from: http://www.r-project.org. Cited 19 January 2009.Real, R., Barbosa, A.M. & Vargas, J.M. 2006. Obtaining environmental favourability functions from 28. logistic regression. Environ. Ecol. Stat. 13: 237-245.
doi:10.1007/s10651-005-0003-3Meynard, C.N. & Quinn, J.F. 2007. Predicting species distributions: a critical comparison of the most 29. common statistical models using artificial species. J.Biogeogr. 34: 1455-1469.
doi:10.1111/j.1365-2699.2007.01720.xRandin, C.F., Dirnböck, T., Dullinger, S., Zimmermann, N.E., Zappa, M. & Guisan, A. 2006. Are 30. niche-based species distribution models transferable in space? J. Biogeogr. 33: 1689-1703.
doi:10.1111/j.1365-2699.2006.01466.xJiménez-Valverde, A. & Lobo, J. 2006. 31. Distribution Determinants of Endangered Iberian Spider Macrothele calpeiana (Araneae, Hexathelidae). Environ. Entomol. 35: 1491-1499.
doi:10.1603/0046-225X-35.6.1491Akaike, H. 1973. Information theory and an extension of the maximum likelihood principle. In: 32. Petrov, B. N. & Csaki, F. (eds.), Proceedings of the Second International Symposium on Information Theory. Akadémia Kiadó, Budapest, pp. 267-281.Crawley, M.J. 2007. The R Book. John Wiley & Sons, Chichester (UK).33.
doi:10.1002/9780470515075Benjamini, Y. & Hochberg, Y. 1995. Controlling the false discovery rate: a practical and powerful 34. approach to multiple testing. J. R. Stat. Soc. B. 57: 289-300.García, L.V. 2003. Controlling the false discovery rate in ecological research. Trends Ecol. Evol. 18: 35. 553-554.
doi:10.1016/j.tree.2003.08.011Hosmer, D.W. & Lemeshow, S. 2000. Applied Logistic Regression (2nd ed). John Wiley and Sons, 36. New York.
doi:10.1002/0471722146Legendre, P. & Legendre, L. 1998. Numerical ecology (2nd ed). Elsevier, Amsterdam.37. Fielding, A.H. & Bell, J.F. 1997. A review of methos for the assessment of prediction errors in 38. conservation presence/absence models. Environ. Conserv. 24: 38-49.
doi:10.1017/S0376892997000088Lobo, J.M., Jiménez-Valverde, A. & Real, R., 2008. 39. AUC: a misleading measure of the performance of predictive distribution models. Global Ecol. Biogeogr. 17: 145-151.
doi:10.1111/j.1466-8238.2007.00358.xMason, S.J. & Graham, N.E. 2002. Areas beneath the relative operating characteristics (ROC) and levels 40. (ROL) curves: statistical significance and interpretation. Q. J. R. Meteorol. Soc. 128: 2145-2166.
doi:10.1256/003590002320603584

47
Araújo, M.B. & Williams, P.H. 41. 2000. Selecting areas for species persistence using occurrence data. Biol. Conserv. 96: 331-345.
doi:10.1016/S0006-3207(00)00074-4Barbosa, A.M., Segovia, J.M., Vargas, J.M., Torres, J., Real, R. & Miquel, J. 2005. 42. Predictors of red fox (Vulpes vulpes) helminth parasite diversity in the provinces of Spain. Wildl. Biol. Pract. 1: 3-14.
doi:10.2461/wbp.2005.1.2Estrada, A., Real, R., & Vargas, J.M. 2008. 43. Using crisp and fuzzy modelling to identify favourability hotspots useful to perform gap analysis. Biodivers. Conserv. 17: 857-871.
doi:10.1007/s10531-008-9328-1I.P.C.C. 2007. Climate Change 2007: Synthesis Report. Summary for Policymakers. 44. Intergovernmental Panel on Climate Change, Geneva.Carter, R.N. & Prince, S.D. 1981. 45. Epidemic models used to explain biogeographical distributional limits. Nature 293: 644-645
doi:10.1038/293644a0Levins, R. 1969. Some demographic and genetic consequences of environmental heterogeneity for 46. biological control. Bull. Entomol. Soc. Am. 15: 237-240.Hanski, I. & Simberloff, D. 1997. The metapopulation approach, its history, conceptual domain, and 47. application to conservation. In: Hanski, I. & Gilpin, M. (eds.), Metapopulation biology: ecology, genetics and evolution. Academic Press, San Diego, pp. 5-26.Muñoz, A.R., Real, R., Barbosa, A.M. & Vargas, J.M. 2005. Modelling the distribution of Bonelli’s 48. Eagle in Spain: Implications for conservation planning. Divers. Distrib. 11: 477-486.
doi:10.1111/j.1366-9516.2005.00188.x