Farmer attitudes and evaluation of outcomes to on-farm environmental management
222
Farmer attitudes and evaluation of outcomes to on-farm environmental management IF01114 Final Report Countryside and Community Research Institute Food and Environment Research Agency Centre for Rural Policy, Exeter University January 2013 i
Transcript of Farmer attitudes and evaluation of outcomes to on-farm environmental management

Farmer attitudes and evaluation of outcomes to on-farm environmental management
IF01114
Final Report
Countryside and Community Research Institute Food and Environment Research Agency Centre for Rural Policy, Exeter University
January 2013 i
Summary of Project Project Title: Farmer attitudes and evaluation of outcomes to on-farm environmental management Client Reference: IF01114 Start Date: January 2011 Finish Date: January 2013 Duration: 24 months Project Manager (Research Team) Jane Mills Research Team: Pete Gaskell Matt Reed Chris Short Julie Ingram Nigel Boatman Naomi Jones Simon Conyers Peter Carey Michael Winter Matt Lobley Date of Report: January 31st 2013 University of Gloucestershire Oxstalls Lane Gloucester Gloucestershire GL2 9HW www.ccri.ac.uk
When quoting this report use the following citation:
Mills, J., Gaskell, P., Reed, M., Short, C., Ingram, J., Boatman, N., Jones, N., Conyers, S., Carey, P., Winter, M., and Lobley, M (2013) Farmer attitudes and evaluation of outcomes to on-farm environmental management. Report to Department for Environment, Food and Rural Affairs (Defra). CCRI: Gloucester
ii

Executive Summary The Countryside and Community Research Institute (CCRI), the Food and Environment Research Agency (Fera) and the University of Exeter were commissioned by the Department for Environment, Food and Rural Affairs (Defra) in December 2010 to explicitly explore the link between mainly arable farmers’ attitudes to environmental management, their subsequent behaviour, and the perceived and observed environmental benefits.
Aims and objectives
The key objectives for the research were to: i. explore mainly arable farmers’ attitudes and associated behaviour towards
environmental management, and identify the factors driving environmental activities; ii. examine how land-managers perceive and evaluate the outcomes of environmental
management; iii. compare the management and environmental benefits of informal provision relative to
that under cross-compliance, agri-environment schemes (AES) or contributing to the CFE; and
iv. consider how management activities and the provision of environmental benefits interact with agricultural production and the farm business.
There were 5 main elements to the research project: i. A comprehensive review of the literature exploring farmers' environmental behaviours
and actions. ii. An analysis of the Countryside Maintenance and Management Activities module of the
Farm Business Survey (FBS) providing evidence of the general pattern across the farming population of the factors that influence the farmer’s ability to adopt environmentally beneficial farm practices and the motivations behind these activities.
iii. Telephone interviews with 10 expert farm advisors identifying their views on farmers’ attitudes to environmental management and the importance of different external and internal drivers affecting farmer behaviour.
iv. 60 in-depth, face-to-face interviews with case study farmers to identify the psychological and physical motivations or barriers to environmental management activities.
v. Environmental assessments undertaken on the 60 case study farms to assess habitats and features of environmental value in relation to farmland birds, wider biodiversity and resource protection (soil and water).
A scoring system was developed which enabled comparison of the farmers’ perceived scores of the environmental benefits of their activity based on their experience and observations with those of the scores from the scientifically-based environmental assessment. This enabled the researchers to develop and understanding of: i) any mismatches between the perceived environmental benefit scores for individual features provided by farmers and the observed environmental benefits identified in the field assessment. ii) the link between farmers’ overall willingness and ability to undertake environmental management activities and their environmental management practices: and. iii) any differences in scores between AES and informal management activities on individual farms where both activities existed.
iii

Findings and policy recommendations Key drivers of environmental activity • The research showed that no single factor is responsible for driving farmers’ attitudes to
the environment, but this is based on a complex set of factors. Farmers are not solely driven by financial motivations, other factors play a part such as personal interest in environment, game shoots, a sense of social responsibility or farming self-image. The research suggests that the key to ensuring long term farmer behaviour change is to change farmers’ mindsets so that they are willing to adopt environmental management practices. This requires internalisation of the values underpinning environmental management activities and it would appear from the farmer interviews that there is an increased acceptance within the farming community of the need to demonstrate their environmental credentials. Farmers generally appear to have a much greater sense of social responsibility for the environment than previous generations, sometimes resulting in intergenerational divergence of opinion on the farm. Policy-makers should continue to encourage and reinforce a sense of civic responsibility for environmental management amongst the farming community, particularly given the emerging discourse about the need to maximise food production to counter the threats of food security. Policy-makers have a role to play in communicating that environmental management and productive agriculture are not mutually exclusive.
• Alongside the mainstreaming of environmental management/awareness, there is still a
small group of farmers who are resistant to the environmental message and who are not engaging with positive environmental practices. These farmers tended to hold strong views about maximising production from their land or are fearful of outside interference and loss of control of their management. Policy-makers should consider the cost-effectiveness of bringing these farmers into the agri-environmental fold. Further targeted advice and incentives may help change the attitudes of some of these resistant, “productivist” farmers. However, an increasing recognition of the need for a greater quality of agri-environmental management rather than simply an ever increasing quantity suggests that efforts might be best directed to those who have embraced the concept of agri-environmental management (for whatever reason).
• When discussing their personal interest in the environment, farmers referred to the
impacts on the higher species that are clearly visible on their farms, such as birds, hares, deer, butterflies. In promoting environmental activities, policy-makers should focus on articulating the benefits to those species that resonate with farmers’ experiences. Also those farmers undertaking minimum tillage practices felt that they were benefitting the environment in ways that were not always recognised by policy-makers or AES.
• A number of factors were shown to restrict farmers’ ability to adopt environmental
management activities, raising equity issues. Small farms felt disadvantaged by AES as their options for achieving the required ELS points were more limited than larger farms and meant more land had to be taken out of production. Also it is easier for some farms to leave areas of unproductive land due to the location of existing features and nature of the farm type. Compare a fenland farm with straight boundaries and few environmental features to a mixed farm with woodlands. Policy-makers should consider a points system that accounts for small field sizes and farms with few existing environmental features.
iv

Benefits of individual environmental management activities • Farmers particularly value game strips as an environmental activity, which were also felt
to benefit smaller wild birds. There was evidence of experimentation with seed mixes and a holistic approach to locating these strips across the farm. However, the wildlife benefits of these strips were often limited as they were only sown to maize. There is the potential for policy makers to capitalise on farmers’ enthusiasm for game strips by promoting more diverse seeds mixed for game strips and finding ways to link game strips to providing other wider wildlife benefits.
• Farmers contest some AES prescriptions, and particularly those relating to the rotational
cutting regimes for hedgerows. Some farmers undertaking positive environmental management practices on their farms strongly believed that the 2 to 3 year rotational cutting negatively impacted on hedge structure. This issue needs to be explored further as it is deterring some farmers from not only entering hedges as an option in AES, but also taking up the schemes.
• Difficulties experienced in establishing pollen and nectar strips meant that some farmers
were disillusioned with the option. Their experiences of implementation did not match their vision of margins filled with wildflowers. Policy-makers should provide additional advice and guidance to help achieve successful establishment of these strips.
• A distinct view emerged that environmental activities should take place at the periphery
of productive land and many farmers were in favour of environmental management on the margins of the farm where it would have least impact on agricultural production. For this reason many farmers, even those who have embraced agri-environmental management, remained resistant to the idea of in-field options. It might be argued, that as few arable farmers are willing to undertake in-field options, funds and advisory efforts are best devoted elsewhere. By removing the need for in-field options, farmers may even embrace boundary and margin management more fully and enthusiastically. Conversely, it could be argued that whilst many farmers implement environmentally beneficial management of boundary and margin features on a voluntary basis, funded agri-environment schemes may be essential in persuading farmers to adopt more challenging in-field options which have been developed to benefit a different group of species, such as skylarks.
• Minimum tillage was one practice that was undertaken outside of any agri-environment
scheme and was viewed as providing significant environmental benefits. Concern was expressed that current AES options did not fully incorporate direct drilling practices. Consideration should be given to further integrating direct drilling practices into current AES options in order to achieve maximum environmental benefits.
• A strong view emerged that introducing livestock onto arable farms would significantly
enhance the environmental value of the land to a much greater extent than trying to introduce individual environmental activities into arable fields. Policy makers should consider promoting more mixed farming in arable areas to improve environmental benefits.
Interaction between formal and informal • Reasons given for undertaking environmental activity outside of a scheme were mainly
agronomic. Margins, in particular, were undertaken informally as this offered greater flexibility in terms of locating the features around the farm and in terms of management,
v

such as vehicular access. This finding suggests the need to promote environmental activities that also accommodate farm management practices.
• Whilst the CFE has raised the profile of the importance of informal activities in delivering
environmental benefits, the research identified very few new activities that were implemented in response to CFE. Much of what was recorded as CFE activity was either previously managed informally or was previously within an AES. Also there was little evidence that farmers in CFE were following the CFE guidelines and a general reluctance expressed to follow guidelines for activities that are managed informally. Of greater importance to farmers is the flexibility to manage the features to fit in with their farm management, such as vehicular access or flexible cutting times on margins. If a policy objective is to improve the quality of informally managed land, then alternative mechanisms, other than guidelines are required to disseminate this information.
• The evidence from the research points to widespread informal agri-environmental
management, some of which ultimately ends up being incorporated into formal schemes. This however, should not be taken as grounds for cutting agri-environmental spending based on the assumption that farmers will continue with informal management. Some would and some would not, but as the environmental assessment has shown it is likely that the quality of management would suffer with the withdrawal of the financial incentive for due care and attention. Also environmental management under AES offers some level of permanence in management, which cannot be guaranteed with informal management activities. Despite a general increase in environmental awareness that are still some farmers who would bring areas of informal activity back into production should commodity prices rise.
vi

Contents
1 INTRODUCTION ................................................................................................................................... 1
1.1 AIMS AND OBJECTIVES ................................................................................................................................. 1 1.2 STRUCTURE OF THE REPORT .......................................................................................................................... 3
2 LITERATURE REVIEW ON FARMER ATTITUDES TO ENVIRONMENTAL MANAGEMENT ............................ 4
2.1 INTRODUCTION .......................................................................................................................................... 4 2.2 STUDIES OF ATTITUDE IN CONTEXT ................................................................................................................ 5 2.3 FARMING ATTITUDES: QUESTIONS I, II AND III ‐ THE ‘WHAT’ AND ‘WHY’ AND ‘HOW’ OF ATTITUDES .......................... 7 2.4 ENVIRONMENTAL BEHAVIOUR AND ACTION: QUESTION IV ‐ THE ‘SO WHAT’ OF ATTITUDES ................................... 11 2.5 UNPACKING THE ENVIRONMENT ................................................................................................................. 20 2.6 CHANGING ATTITUDES AND BEHAVIOUR: QUESTION V ‐ THE ‘WHAT IF’ QUESTION. .............................................. 21 2.7 CONCLUSION AND KEY POINTS .................................................................................................................... 24 2.8 REFERENCES ............................................................................................................................................ 27
3 FARM BUSINESS SURVEY ANALYSIS .................................................................................................... 35
3.1 INTRODUCTION ........................................................................................................................................ 35 3.2 THE FBS SAMPLE ..................................................................................................................................... 36 3.3 RESPONDENT CHARACTERISTICS .................................................................................................................. 37 3.4 ENVIRONMENTAL FEATURES UNDERTAKEN COMPARED BY MANAGEMENT GROUPING ............................................. 43 3.5 REASONS FOR UNDERTAKING ENVIRONMENTAL MANAGEMENT ACTIVITIES ........................................................... 46
4 TELEPHONE INTERVIEWS WITH EXPERT ADVISORS ............................................................................. 51
4.1 INTRODUCTION ........................................................................................................................................ 51 4.2 ENVIRONMENTAL AWARENESS (IF NOT ACTUAL MANAGEMENT) IS BECOMING MAINSTREAMED ................................ 51 4.3 CONTINUED EXISTENCE OF FARMERS UNINTERESTED OR UNWILLING TO ENGAGE IN ENVIRONMENTAL MANAGEMENT ... 52 4.4 MIXED VIEWS ON CFE ............................................................................................................................... 52 4.5 LEVEL OF INFORMAL AGRI‐ENVIRONMENTAL ACTIVITY ...................................................................................... 54 4.6 BUFFER STRIPS ......................................................................................................................................... 54 4.7 CROSS‐COMPLIANCE – SOIL PROTECTION REVIEW .......................................................................................... 55 4.8 IN‐FIELD OPTIONS ..................................................................................................................................... 56 4.9 IMPORTANCE OF AGRI‐ENVIRONMENT PAYMENTS ........................................................................................... 57 4.10 CONCLUSIONS ......................................................................................................................................... 58
5 FARMER FACE‐TO‐FACE INTERVIEWS .................................................................................................. 59
5.1 INTRODUCTION ........................................................................................................................................ 59 5.2 METHODOLOGY ....................................................................................................................................... 59 5.3 FINDINGS FROM ANALYSIS OF FARMER INTERVIEWS ......................................................................................... 62 5.4 ATTITUDES TO INDIVIDUAL ENVIRONMENTAL FEATURES .................................................................................... 76 5.5 ATTITUDES TO CAMPAIGN FOR THE FARMED ENVIRONMENT (CFE) .................................................................... 87 5.6 INFLUENCE OF PREVIOUS AES EXPERIENCE ‐ LEARNING .................................................................................... 92 5.7 INTERACTION BETWEEN AES AND INFORMAL ACTIVITIES .................................................................................. 93 5.8 FARMERS’ PERCEIVED SCORES .................................................................................................................... 94
6 ENVIRONMENTAL ASSESSMENT ......................................................................................................... 96
6.1 INTRODUCTION ........................................................................................................................................ 96 6.2 ANALYSIS OF ENVIRONMENTAL QUALITY ‐ METHODS ........................................................................................ 97 6.3 ANALYSIS OF ENVIRONMENTAL QUALITY – COMPARISON OF DIFFERENT MANAGEMENT APPROACHES ...................... 100 6.4 GENERAL CONCLUSIONS FROM ENVIRONMENTAL ASSESSMENT ........................................................................ 109
7 COMPARISON OF FARMER OBSERVED BENEFITS AND ENVIRONMENTAL ASSESSMENT ......................112
7.1 FARMER WILLINGNESS AND ABILITY TO ADOPT ENVIRONMENTAL MANAGEMENT ................................................. 115 7.2 COMPARISON BETWEEN OBSERVED AND FARMER PERCEIVED BENEFIT SCORES ON INDIVIDUAL FARMS ...................... 119 7.3 COMPARISON BETWEEN OBSERVED AND FARMER PERCEIVED SCORES FOR FEATURES ON FARM ............................... 122
vii

8 OVERVIEW OF RESEARCH FINDINGS AND POLICY IMPLICATIONS .......................................................127
8.1 FACTORS DRIVING ENVIRONMENTAL ACTIVITIES ............................................................................................ 127 8.2 THE PERCEIVED AND OBSERVED ENVIRONMENTAL BENEFITS OF ENVIRONMENTAL MANAGEMENT ACTIVITIES ............. 133 8.3 THE BALANCE OF ENVIRONMENTAL MANAGEMENT ACTIVITIES AND BENEFITS ACCRUING FROM FORMAL AND INFORMAL
PROVISION ......................................................................................................................................................... 137 8.4 THE INTERACTIONS BETWEEN LAND UNDER FORMAL AGREEMENTS AND LAND OUTSIDE OF AGREEMENTS .................. 139 8.5 KEY IMPLICATIONS FOR POLICY MAKERS ..................................................................................................... 140
APPENDIX 1: WEIGHTING THE RESULTS OF COUNTRYSIDE MAINTENANCE AND MANAGEMENT ACTIVITIES MODULE ...................................................................................................................................................143
APPENDIX 2: FACE‐TO‐FACE INTERVIEW SCHEDULE ..................................................................................144
APPENDIX 3: METHODOLOGY FOR FIELD ASSESSMENT AND SCORING OF HABITATS AND FEATURES OF ENVIRONMENTAL VALUE ..........................................................................................................................155
List of Tables TABLE 2.1 FACTORS INFLUENCING AES PARTICIPATION ....................................................................................................... 9 TABLE 2.2 FACTORS INFLUENCING ENVIRONMENTAL MANAGEMENT UPTAKE (ABILITY) ............................................................ 25 TABLE 2.3 VALUES, BELIEFS, ATTITUDES (WILLINGNESS) ................................................................................................... 25 TABLE 2.4 MOTIVATIONS FOR UNDERTAKING ENVIRONMENTAL MANAGEMENT ..................................................................... 26 TABLE 3.1 MODULE ‘O’ CODES ................................................................................................................................... 35 TABLE 3.2 SUMMARY OF FARM AND FARMER CHARACTERISTICS BY ENVIRONMENTAL MANAGEMENT ACTIVITIES ........................... 43 TABLE 3.3 GROUPING OF REASONS FOR UNDERTAKING ENVIRONMENTAL MANAGEMENT ACTIVITIES .......................................... 46 TABLE 3.4 REASONS FOR NOT INCLUDING ACTIVITY IN AES ................................................................................................ 48 TABLE 5.1 ENVIRONMENTAL MANAGEMENT CATEGORIES .................................................................................................. 60 TABLE 5.2 FARM SIZE CATEGORIES ............................................................................................................................... 60 TABLE 5.3 REGIONAL CATEGORIES ................................................................................................................................ 60 TABLE 5.4 FARM TYPES .............................................................................................................................................. 61 TABLE 5.5 FARM TENURE ............................................................................................................................................ 61 TABLE 5.6 MEAN PERCEIVED ENVIRONMENTAL SCORES FOR INDIVIDUAL FEATURES ................................................................. 95 TABLE 6.1 SCORING CRITERIA FOR BUFFER STRIPS AND GRASSY FIELD MARGINS ...................................................................... 97 TABLE 6.2 SUMMARY OF THE RANGE OF OBSERVED (ENVIRONMENTAL ASSESSMENT) SCORES FOR INDIVIDUAL FEATURES ............... 99 TABLE 6.3 OBSERVED ENVIRONMENTAL SCORES FOR INDIVIDUAL FEATURE TYPES UNDER DIFFERENT MANAGEMENT CATEGORIES WITH
HIGH MEDIUM AND LOW CATEGORIES BASED ON THE RANGE OF SCORES FOR EACH FEATURE TYPE AT THE FARM LEVEL ......... 101 TABLE 6.4 PROPORTION OF FEATURES IN THE HIGH, MEDIUM AND LOW CATEGORIES FOR EACH MANAGEMENT TYPE. ................. 102 TABLE 6.5 MEAN ATTRIBUTE SCORES FROM THE OBSERVED ENVIRONMENTAL ASSESSMENTS FOR FEATURES UNDER DIFFERENT
MANAGEMENT CATEGORIES .............................................................................................................................. 106 TABLE 7.1 OVERALL ENVIRONMENTAL BENEFIT AND WILLINGNESS AND ABILITY SCORES FOR CASE STUDY FARMS ........................ 113 TABLE 7.2 FARMS SCORING HIGHEST FOR WILLINGNESS & ABILITY TO UNDERTAKE ENVIRONMENTAL ACTIVITIES ........................ 116 TABLE 7.3 FARMS SCORING LOWEST FOR WILLINGNESS & ABILITY TO UNDERTAKE ENVIRONMENTAL ACTIVITIES .......................... 118 TABLE 7.4 MEAN PERCEIVED AND OBSERVED ENVIRONMENTAL SCORES FOR INDIVIDUAL FEATURES .......................................... 122 TABLE 8.1 MEAN PERCEIVED AND OBSERVED ENVIRONMENTAL SCORES FOR INDIVIDUAL FEATURES .......................................... 133 List of Figures
FIGURE 1.1: ANALYTICAL FRAMEWORK FOR UNDERSTANDING LINK BETWEEN FARMER ATTITUDES TO ENVIRONMENTAL MANAGEMENT
AND SUBSEQUENT FARMER BEHAVIOUR AND OUTCOMES ............................................................................................. 2 FIGURE 3.1 PERCENTAGE OF FARMS BY ENVIRONMENTAL MANAGEMENT ACTIVITY ................................................................. 37 FIGURE 3.2 PERCENTAGE OF ENVIRONMENT ACTIVITY UNDERTAKEN WITHIN AN AES OR INFORMALLY ........................................ 38 FIGURE 3.3 ENVIRONMENTAL MANAGEMENT ACTIVITIES BY SLR AND MANAGEMENT GROUPING .............................................. 38 FIGURE 3.4 ENVIRONMENTAL MANAGEMENT ACTIVITIES BY FARM TYPE AND MANAGEMENT GROUPING ..................................... 39 FIGURE 3.5 ENVIRONMENTAL MANAGEMENT ACTIVITIES BY TENURE AND MANAGEMENT GROUPING .......................................... 40 FIGURE 3.6 ENVIRONMENTAL MANAGEMENT ACTIVITIES BY FARM BUSINESS INCOME AND MANAGEMENT GROUPING ................... 40
viii

ix
FIGURE 3.7 ENVIRONMENTAL MANAGEMENT ACTIVITIES BY FARMER AGE AND MANAGEMENT GROUPING ................................... 41 FIGURE 3.8 ENVIRONMENTAL MANAGEMENT ACTIVITIES BY FARMER SEGMENT AND MANAGEMENT GROUPING ........................... 42 FIGURE 3.9 NUMBER OF ENVIRONMENTAL ACTIVITIES PER FARM AND MANAGEMENT GROUPING ............................................. 42 FIGURE 3.10 ENVIRONMENTAL FEATURES UNDERTAKEN BY MANAGEMENT GROUPING ............................................................ 43 FIGURE 3.11 PROPORTION OF FARMS WITH UNCROPPED LAND BY FARM TYPE AND MANAGEMENT GROUPING ............................. 44 FIGURE 3.12 PROPORTION OF FARMS WITH UNCROPPED LAND BY SLR TYPE AND MANAGEMENT GROUPING ............................... 44 FIGURE 3.13 PROPORTION OF FARMS WITH UNCROPPED LAND BY TENURE AND MANAGEMENT GROUPING ................................. 45 FIGURE 3.14 PROPORTION OF FARMS WITH UNCROPPED LAND BY FARM BUSINESS INCOME AND MANAGEMENT GROUPING .......... 45 FIGURE 3.15 PROPORTION OF FARMS WITH UNCROPPED LAND AREA BY FARMER AGE AND MANAGEMENT GROUPING ................... 46 FIGURE 3.16 PRIMARY REASONS FOR UNDERTAKING ACTIVITIES UNDER AES ......................................................................... 47 FIGURE 3.17 PRIMARY REASONS FOR UNDERTAKING INFORMAL ENVIRONMENTAL ACTIVITIES ................................................... 47 FIGURE 3.18 PRIMARY REASONS FOR NOT INCLUDING ACTIVITY IN AES BY ENVIRONMENTAL ACTIVITY ........................................ 49 FIGURE 6.1 SUMMARY OF THE RANGE OF SCORES (MAX/MIN) FOR INDIVIDUAL FEATURES ASSESSED ........................................ 100 FIGURE 6.2 DIFFERENCES IN ENVIRONMENTAL SCORES BETWEEN MANAGEMENT TYPES. DIFFERENT LETTERS DENOTE MEANS THAT ARE
STATISTICALLY DIFFERENT. ................................................................................................................................. 102 FIGURE 7.1 PERCEIVED AND OBSERVED BENEFIT SCORES AND WILLINGNESS AND ABILITY SCORES FOR ALL FARMS ........................ 115 FIGURE 7.2 DIFFERENCES IN OVERALL PERCEIVED AND OBSERVED SCORES ........................................................................... 119

1 Introduction The Countryside and Community Research Institute (CCRI), the Food and Environment Research Agency (Fera) and the University of Exeter were commissioned by the Department for Environment, Food and Rural Affairs (Defra) in December 2010 to explicitly explore the link between mainly arable farmers’ attitudes to environmental management, their subsequent behaviour, and the perceived and observed environmental benefits. The role of the farmer and land manager in delivering environmental benefits (e.g. biodiversity, soil and water protection) is well recognised. There has been a long-standing public commitment to the provision of environmental benefits through a system of capital and management payments along with statutory responsibilities. For example, environmental and welfare standards are a requirement of cross-compliance for farmers receiving direct payments from Common Agricultural Policy (CAP) support schemes1; environmental regulations such as Nitrate Vulnerable Zones have led to the adoption of specific management practices through Catchment Sensitive Farming2; and Defra, in partnership with delivery agencies, provides support through a number of incentivised agri-environment schemes, such as Entry Level Stewardship (ELS)3. Finally, there has been an increasing emphasis on voluntary industry-led provision through the Campaign for the Farmed Environment (CFE)4. This research is intended to improve the understanding of the effectiveness of different intervention options for the delivery of environmental objectives on mainly arable land, and identify those factors that govern success and deliver positive outcomes. In particular, the study seeks to identify the additionality between these different approaches and any informal environmental management activities (defined as management activities that are not part of a scheme and are therefore not managed according to a set of prescriptions). It is recognised that farmer attitudes to environmental management and their subsequent evaluation of outcomes may impact the balance of formal and informal provision, the type of formal provision adopted, and the environmental benefits provided. By providing a better understanding of the link between attitudes, activities and outcomes, the right regulatory, incentivised and voluntary approaches can be used to achieve and maintain environmental benefits on farmland.
1.1 Aims and objectives
This research aimed to explore farmers’ attitudes and associated behaviour towards environmental management, and identify the factors driving environmental activities. It also examined how land-managers perceive and evaluate the outcomes of environmental management. The research sought to establish the extent to which informal provision occurs and compare the management and environmental benefits of informal provision relative to that under cross-compliance, regulatory requirements, agri-environment schemes or contributing to the CFE. The research also considered how management activities and the provision of environmental benefits interact with agricultural production and the farm business To summarise, the key objectives for the research were to identify: 1) The factors (attitudinal, financial, etc) driving environmental activities; 2) The perceived and observed benefits (environmental, other) of environmental management activities; 1 http://www.defra.gov.uk/foodfarm/farmmanage/singlepay/furtherinfo/crosscomply 2 http://www.defra.gov.uk/foodfarm/landmanage/water/csf/index.htm 3 http://www.naturalengland.org.uk/ourwork/farming/funding/es/els/default.aspx 4 http://www.cfeonline.org.uk/x42296.xml
1

3) The balance of environmental management activities and benefits accruing from formal and informal provision; and 4) The interactions between land under formal agreements and land outside of agreements. The analytical framework used to assess the key objectives of the research is presented below.
Perceived/observed benefits
Observed benefits Perceived benefits
Informal environmental activities
Formal environmental activities
Farmed land
Farmer attitude
Knowledge & advice
Farming philosophy
Personal interest
Efficacy of actions
Social responsibilit
Willingness to adopt
Farm type & environmental endowment
Markets
Farmer & farm household characteristics
Finance
Ability to adopt
Tenure
Farm size
Farmer behaviour
Outcomes
Environmental benefits - eg species,
habitats, resource
Other benefits – eg farm business, social, personal
Figure 1.1: Analytical framework for understanding link between farmer attitudes to environmental management and subsequent farmer behaviour and outcomes
2

1.2 Structure of the report
The remainder of the report is divided into seven chapters. Chapter 2 provides a comprehensive review of the literature exploring farmers' environmental behaviours and actions. Chapter 3 presents an analysis of the Countryside Maintenance and Management Activities module of the Farm Business Survey (FBS) providing evidence of the general pattern across the farming population of the factors that influence the farmer’s ability to adopt environmentally beneficial farm practices and the motivations behind these activities. Chapter 4 summarises the findings of telephone interviews with 10 expert farm advisors identifying their views on farmers’ attitudes to environmental management and the importance of different external and internal drivers affecting farmer behaviour. In Chapter 5 the detailed findings from 60 in-depth, face-to-face interviews with case study farmers are presented. The findings from the environmental assessments undertaken on the 60 case study farms are discussed in Chapter 6. The environmental benefit scores derived from the face-to-face interviews and the environmental assessments are analysed in Chapter 7. Finally, Chapter 8 provides an overview of the key findings drawing on all the evidence in the proceeding chapters and drawing out some key implications for policy-makers.
3

2 Literature Review on Farmer Attitudes to Environmental Management
2.1 Introduction
This literature review contributes primarily to the first main objective of the research project, by examining the factors driving environmental activities on mainly arable farms. In particular, it focuses on farmers’ attitudes to environmental management, their subsequent behaviour, and the perceived and actual environmental outcomes or benefits. The review aims therefore to examine these links by reviewing relevant published research and grey literature. ’Attitudes’ may be thought of as favourable or unfavourable dispositions and can be measured in abstract and qualitative terms. Hogg & Vaughan (2005) define an attitude as "a relatively enduring organization of beliefs, feelings, and behavioural tendencies towards socially significant objects, groups, events or symbols" (p. 150). In considering the significance of attitudes, characterised in this way, to environmental management, it is important to keep in mind three important observations about the link between attitudes and action in this context. First, attitudes do not just appear sui generis. They are formed or constructed, and the factors that influence the formation or construction of attitudes are of as much interest to social scientists as the attitudes themselves. In other words, the adoption of attitudes is a process, and Hoggs and Vaughan’ conception of attitudes as ‘relatively enduring’ implies some possibility of attitudinal change. Secondly, while the focus here is on environmental management, farmers will hold attitudes across a wide range of issues. Wilson (1996), for example, distinguishes direct attitudinal variables relevant to the environment (feelings and beliefs towards the environment) and indirect attitudinal variables (farming philosophies i.e. utilitarian, neutral or conservationist). Thus, a farmer’s attitude to environmental management will sit alongside his or her attitude to the needs and priorities of the farm business and farming in general. Gauging environmental attitudes has to be done in this wider context if it is to make a meaningful contribution to understanding the link to action and behaviour. This brings us to the third point, which is that attitudes do not necessarily translate into behaviour. ‘Attitude-behaviour inconsistency’ or the ‘value-action gap’ (Barr 2004) has been widely observed in studies of environmental behaviour, such as recycling, in the general populace. It is clear therefore that considerable challenges face researchers in this area. The requirement is for research to:
i. uncover attitudes (the ‘what’ question); ii. understand why such attitudes are held (the ‘why’ question); iii. understand how attitudes on environmental issues interact with other attitudes to
form a wider outlook or worldview (the ‘how’ question); iv. explore the implications of such attitudes for environmental behaviour and action (the
‘so what’ question); v. understand the possibilities and processes relevant to attitude change (the ‘what if’
question). Very few research studies attempt to examine all of these questions within a single programme or publication but, equally, few studies are confined to just one question. The challenge, therefore, is to piece together an account from different and overlapping sources which covers each of these and the literature review attempts to do this.
4

2.2 Studies of Attitude in Context
There are, it is true, many relevant studies that do not use ‘attitude’ as an organising concept at all. The language of ‘attitude’ derives from social psychology; it crosses over rather uneasily into some branches of sociology and human geography, but hardly at all into anthropology or political economy. Other terminology comes into play in various disciplines to describe the relevant cognitive and behavioural processes, and we have already slipped into using two in this introduction – ‘values’ and ‘worldview’. Others spring readily to mind – ‘norms’, ‘motivations’, ‘beliefs’, ‘goals’, ‘identity’, ‘culture’, ‘ideology’, etc. It is not the purpose of this review to enter into terminological debate over the use and appropriateness of these various terms. However a few introductory comments are needed. ‘Values’ refer to ideals and desired outcomes to be striven for and tend to be stable over time and, like ‘norms’, they are socially and culturally conditioned. They are cognitive constructs that explain an individual’s preferences in life goals, principles, and behavioural priorities (Rokeach, 1973). ‘Beliefs’ are essentially convictions; they tend to originate from values but are not necessarily always based on reflection and conscious objective thinking. Values and beliefs can inform and influence motives and attitudes. Rokeach (1973) suggests that ‘attitudes’ are subsystems of beliefs and values with the entire set of attitudes a person holds constituting a ‘belief system’. Thus to understand attitudes it is necessary to understand beliefs and values. Attitudes are thought to be susceptible to transient influences and changing contexts than values and are therefore not entirely permanent nor static and are recreated each time an individual responds to a question, a behaviour or a specific occurrence. Thus, argue Ahnstrom et al. (2008), to conclude that a farmer has a certain attitude when it comes to management of the farm and nature is too simplistic. Ahnstrom et al. (2008) define attitudes as a readiness to act or a mindset that is used by an actor to act and judge in situations of decision making. Vogel (1996) has distinguished different sequential attitudinal components. For many academics, the conceptualisation of attitudes is problematic, some take an individualistic approach and regard farmers’ attitudes as influenced by psychological characteristics while others emphasise the cultural and social construction of meaning and socialisation. Siebert et al. (2006) for example argue for a wider conceptualisation of attitudes that refer to social identity, social pressures, values and ideas (see Reading University, 2006; Siebert et al., 2006 for a full discussion). Thus for Siebert et al. (2006) ‘attitude’ is understood to be a combination of subjectively perceived factors that influence the farmer such as interests, values, norms, problem awareness and self-perception – as these collectively can explain willingness to undertake environmental activities. Evidence suggests that individuals can hold multiple situational dependent attitudes towards a given object (see Burton, 2004). Others (Van Woerkum, 2000) similarly argue that the concept of attitude assumes a relatively constant and sustainable inclination to react in the same way to an 'object' but in reality people often show different attitudes depending on the context and their concept or definition of the 'object'. For this reason, and because of the criticism about relying on attitude as predicator of behaviour and the general debate about what constitutes ‘attitude’, academics have expanded the notion of attitude to include social norms and identity. It has been argued that attitudes cannot be studied as only personal parameters as they depend on the context, and especially social factors. As such the attitudes of the farmer are thought to be dependent on the norms that exist in the group/s that the farmer identifies with. For example Ahnstrom et al (2008) found from a literature review that it seems to be a part of the farmers’ norm (or social identity) to claim to be a steward of the land who cares for nature. These social norms are standards of behaviour based on shared beliefs about how individuals should act and are constituted when members in a group, such as farmers, have expectations of how other members in the group think, believe, know and act.
5

Identity or ‘self-concept’ together with habit and moral obligation have been noted as variables which contribute to the relationship between attitude and behaviour (Burton, 2004). Farmers not only have a social identity (in line with social norms—what social group the actor identifies with and thus what norms should be followed), they have their own unique personal value system and worldview based on their own experiences and moral values. Thus a farmer has his own view on what is ‘good farming’, his own set of convictions and opinions that function as an internal frame of reference and this determines his perception of external factors and his own preferences (Schoon and Grotenhuis, 2000). In the same way McHenry (1997) argues that there is a need to examine how individuals conceptualise and interpret their world, in particular their view of conservation/sustainable farming. She argues that farmers negotiate the notion of conservation to fit their constructions of farming and suggests that local constructions of nature and environment amongst farmers are most likely to be important determinants of the propensity to engage with agri-environmental policies. Other researchers have similarly shown that farmers and conservationists view the ‘conservation problem’ very differently; they have different reference points and thus different motivational orientations (Carr and Tait, 1991; Burgess et al., 2000). Farmers’ attitudes to environmental protection and conservation have been shown to diverge significantly from those held within government, its agencies and in environmental NGOs (Beedell and Rehman, 1999; McHenry, 1996, 1998). ‘Motivations’ reflect the reasons why a person follows their aims and desires and are the primary driving force for doing something such as joining an agri-environment scheme. The orientation of motivation concerns the underlying values, attitudes and goals that give rise to action. There is a distinction between intrinsic motivation, which refers to doing something because it is inherently interesting or enjoyable, and extrinsic motivation, which refers to doing something in response to external pressures, or rewards. Attitude is a significant intrinsic motivational determinant, but not the only one. The interdependence of these concepts (attitudes, values, beliefs, motivations, etc) is evident and in many agricultural studies the nuances of these differences are not made clear and the terms are commonly used interchangeably. There is equal variation in the methodological approaches used to identify, conceptualise and measure farmers’ environmental attitudes and often this prevents comparisons between studies. There are methodological difficulties also in measuring and explaining attitudinal shifts over time. The validity of questions asked in surveys and the Likert type scaling used have been criticised as crude (Wilson 1996). We have tried in what follows to be faithful to the terminology deployed by the various writers whose work we are examining, only interrupting the flow of the discussion with further points of definition or clarification where absolutely necessary. Some would argue that notions of attitudes, values, beliefs and so forth unduly privilege the importance of individual cognition in determining behavioural outcomes given the importance of external constraints or inducements to action such as policy and financial pressures. Indeed, some commentators contend that there is a need to understand farmers’ behaviour primarily within a broader structural context as reflected in the political economy of agriculture, where macro-level systemic forces (market, national laws, regulations and subsidy programs) provide the context for the decision environment of farmers (Ward and Lowe, 1994; Ward et al., 1998). They argue that a focus on attitudinal factors alone is insufficient given the significance of these wider drivers in constraining or enabling farmers’ actions (Ward et al, 1998). Ward and Lowe (2001) and Lobley et al. (2002) identify a range of external drivers operating at different spatial scales, from global to local, that impact upon farmer decision making. These include globalisation through the concentration of vertically integrated markets for farm inputs and products, international trade agreements, sterling
6

exchange rate fluctuations, environmental pressures, new technologies and changes in economic and social processes. In recent decades these external drivers have combined at the farm level to create concerted pressure on farm incomes. For the agricultural sector as a whole it is clear that the industry has responded to these drivers by adopting capital-intensive technologies, shedding labour, reducing the number of independent businesses and increasing farm size. As well as responding to external economic pressures on their income, farm businesses also have to respond to internal family pressures. Farmers have developed a variety of ‘coping strategies’, which involve making compromises between, on the one hand, ensuring family continuity and retaining independence and, on the other, generating capital to fund the expansion necessary to ensure the economic survival of the business (Marsden et al., 1989). Most researchers attempting to understand farmers' environmental behaviours and actions will seek to take into account both internal (attitudinal) factors and this external context. Some, usually deploying a social psychological or behavioural approach, will tend to privilege the internal factors; others deploying a more sociological or political economy perspective will give greater weight to the external drivers. But most would agree that it is the interplay of different factors that really matters and that this will vary in different contexts. Perhaps somewhat surprisingly, there is a relative paucity of recent research covering generic attitudes, designed to build up a picture of farming in the round, as opposed to attitudes to specific issues, such as the environment. In other words, questions i and ii are less thoroughly dealt with than ii, iv and v. Moreover, we can see that i and ii were dealt with more thoroughly in the past, in work from the 1960s and 1970s, than in more recent work that has tended to focus on iii-v, i.e. the specifics of environmental attitudes and outcomes. The reason for this change of emphasis lies in both changing policy priorities and academic fashion. The switch from policies for expanding agricultural production to an agri-environmental policy focus shifted research away from a broad understanding of what motivates farmers to a narrower conception of what motivates farmers to act environmentally. During roughly the same period the social science interest in farmers shifted from community studies via occupational sociology to issue-based investigations. To simplify greatly, a social scientist interested in farming in the early 1960s would have undertaken a community study examining the lives of farmers in their local cultural context, deploying ethnographic methods to do so. Just a decade later he or she would have been more likely to study famers as an occupational group across a wider geographical area and deploying a social survey methodology. By the 1990s, whilst the survey method might well still be deployed, the emphasis had shifted from studying farmers per se to sub-populations of farmers (e.g. organic or participants in agri-environmental schemes) or to specific issues facing the agricultural industry such as water quality or biodiversity loss. This rough characterisation of intellectual trends is not meant to imply that any one of these phases of research is any better or worse than another. However, it may be argued that the lack of a broader general understanding of attitudes (i and ii questions) can reduce the effectiveness of more issue-based research (iii, iv and v questions), especially where un-tested assumptions about the changing worlds of farmers influence research, such as with the baleful influence of so-called post-productivism on a decade or more of rural research (Evans et al 2002).
2.3 Farming Attitudes: Questions i, ii and iii - The ‘What’ and ‘Why’ and ‘How’ of Attitudes
The 1970s saw a burgeoning interest in the sociology of agriculture and a small number of pioneers of modern rural studies sought to develop accounts of farmers’ relations with their
7

employees and with the wider rural community. Such studies built up a picture of farming as an occupation characterised by values of self-reliance and independence (Gasson 1973, 1974, Newby 1980). Although environmental attitudes, per se, did not figure highly in these studies some of the attitudes and ‘orientations’ uncovered were strongly suggestive of potentially contrasting approaches to the environment. For example, Newby et al (1978) developed a four-fold typology of their Suffolk farmers, based on market orientation and degree of direct involvement in husbandry, which characterised four ideal types as ‘gentleman farmer’, ‘agri-businessman’, ‘family farmer’, and ‘active managerial farmer’. Farmers in the first group were more likely to be interested in hunting and/or shooting and were more engaged in and placed more value on local community activities. Burton and Wilson (2006) also derived a four part typology (agricultural producer, agribusiness person, conservationist, and diversifier) to investigate whether identity could explain different degrees of engagement with environmentally friendly (multifunctional) farming. They recognise that farmers may maintain all identities simultaneously and, where the situation arises, express the most suitable identity with its expression of beliefs, roles and attitudes. They argue that this view might explain the inconsistencies previous researchers (e.g. McDowell and Sparks, 1989; Wilson, 1996) have found between farmer’s expressed attitudes towards conservation and their actions towards the environment. Other more generic research on farmers’ behaviour has tended to focus on rather static ideal types and more on the trajectories of farmer behaviour when facing external challenges and opportunities. Thus some have focussed on the courses of actions, including broad attitudinal components, farmers may adopt when faced with a reduction in farm incomes, (Winter and Gaskell 1995; Evans, 2009; Gaskell et al., 2010). These courses of action, known as adjustment strategies, are of five main kinds: • Adjustments in the use of on farm recourses: Conventional agricultural enterprises;
agricultural diversification; tourism and recreation; use of ancillary buildings and land. • Adjustments in the use of off-farm resources: Off-farm employment; off-farm business
opportunities; off-farm pension and investment income. • Asset realisation: Sale or land, buildings, shares or other assets. • Make no change: Accept a lower standard of living. • Leave farming: Retirement; enter another sector of the economy
The adoption of such adjustment strategies is not mutually exclusive and farm businesses may include more than one at any time, and as a farm business develops it may change from one strategy to another as circumstances change. The type of strategy or strategies adopted by farmers will help to determine the management decisions regarding both formal and informal environmental management on the farm. A recent research project in Scotland explored drivers and factors that influence decisions about rural land use and identified six types of driver: environmental, demographic, economic, technological, policy and institutional and socio cultural, each with elements which can direct, enable or constrain, or are proximate causes of change (Miller et al., 2008). The research examined how land mangers translate the potential drivers of change into actual changes, using qualitative interviews with key informants and a quantitative telephone survey of 600 land use decision makers across Scotland. The results showed that there were different decision making processes depending on whether the decision is made by an individual, a household or a large body. The questions elicited respondents’ attitudes and priorities for land use, and five types of land use decision maker was identified: ecological and stewards, economic land stewards, multi-functionalist, community stewards and other (a passive group). The research found that, as with other research, land managers typically did not seek to fulfil optimally one goal but trade-off multiple goals in different circumstances. Most seek economic success before acting on other motivations and no type emphasised
8

economic priorities in isolation from environmental or social attitudes. Responsibly for the environment was very important, as strong as economic in respondents’ priorities, the significance of the community also emerged as strong. Drivers such as local planning and incentives for collaboration in managing land enabled community concerns to have more value. Grants also have enabled, but not driven, change in land use. Respondents reported constraints due to regulations and the effects of climate change was noted as being a driver in the future. Smithers and Furman (2003) and Wynn et al (2001), inter alia, have sought to group the drivers of behaviour into the following categories (see also Giovanopoulou et al, 2011): • personal, social and situational characteristics of farmers and household • physical farm factors and the farm operation including structural characteristics such as
farm size, tenure, gross receipts (situational characteristics of the farm) • farm, farming system and business factors • nature and qualities of the scheme, practice or innovation • policy environment- and communication or extension strategies
The first three can be characterised as internal (farm and farmer centred) and the last two as external. Table 1.1 provides some examples of key research papers against this framework and in the context of factors that influence participation in agri-environment schemes (AES). For a recent review covering some of the same material see Riley (2011). Past research has indicated that aspects of farm structure such as farm size, farm type, tenure, dependency on farm income, amount of non-intensively used farmland, the bio-geographical conditions of the farmland, endowments of natural habitat and farm household characteristics can have a significant effect upon participation in AES (see- Ilbery, 1978; Brotherton, 1989; 1991 McDowell and Sparks, 1989; Morris and Potter, 1995; Potter, 1998; Wilson, 1992, 1996; Friends of the Earth, 1992; for the United Kingdom context; Brouwer and Lowe, 1998; Brouwer and van Berkum, 1997; Buller et al, 2000; Wilson and Hart, 2000 for the European context). Whilst it is generally understood that larger, freehold and more economically buoyant farms are more likely to enter AES, there are exceptions to the rule and results from a number of studies seeking to explain participation in terms of single farm factors do not support each other. Farmer and farm household factors that are generally considered to be of importance to farmer decision-making include, for example, education (McDowell and Sparks, 1989; Wilson, 1996,1997a), succession status (Potter and Lobley, 1992; 1996), age and length of residency (Wilson, 1996). The role of the farm household (rather than just the farmer) has been shown to be important (Roberts and Hollander, 1997; Dwyer et al., 2007). Many of these factors such as age and succession, and education, experience and length of residency interact and cannot be viewed in isolation. Psychological factors have been included amongst these socio-economic factors with attitudinal factors playing a key role; this is examined in more depth in the following section. Table 2.1 Factors influencing AES participation Sets of interacting factors • Attitudinal and situational variables (Black and Reeve, 1992). • Physical farm factors, farmer characteristics, business factors, quality of
information and peer pressure (Wynn et al., 2001). • Opportunity (farm structural issue), inclination (farmers attitudinal issue) and
incentive (scheme design issue) (Davies and Hodge, 2007). • Characteristics of the farmer, situational characteristics of the farm and farming
9

system, nature and qualities of the innovation, communication or extension strategies (Smithers and Furman, 2003).
• Factors affecting farmers’ willingness to participate; those factors affecting farmers’ ability to participate; more general social influences and the effect of policy (Siebert et al., 2006).
Internal farm and farmer factors • Farmer and household characteristics (Brotherton, 1989; Wilson, 1996; 1997a;
Bonnieux et al., 1998; Delvaux et al., 1999; Drake et al., 1999). • Farm (size, crop portfolio, etc.) and individual farmer (age, education, etc.)
(Vanslembrouck et al., 2002). • Landholder demographics and the nature of the land tenure, farmer knowledge
and awareness of the programme, financial circumstances, and perceptions of financial and other risks and benefits of the programme itself, including incentives and compensation (Kabii and Horwitz, 2006).
• Social structure, age, education, income, barriers and incentives, attitudes, social participation and communication (Jacobson et al., 2003).
• Farming context (Ahnstrom et al., 2008). External factors • Programme (type of measure, compensation paid, application costs, etc.) and
market (food and environment demand) characteristics (Vanslembrouck et al., 2002).
• Policy environment, institutional and advisory structures (Clark, 1989). • External factors such as policies and scheme payments and internal factors such
as attitudes towards schemes (Wilson, 1996). • Negotiating skills of advisor and importance of neighbour networking (Skerratt,
1994). • Extensions services, advisors, project officers (Wilson and Hart, 2001; Juntti and
Potter, 2002). • Scheme factors including ability of the scheme to fit into existing patterns of farm
management, the level of payments and the scheme duration (Brotherton, 1989; Brouwer and Lowe, 1998; Vanslembrouck et al., 2002).
• Broader agro-economic drivers of change including consumer demand, markets, technology and International and national agricultural policy (Ward and Lowe, 1994; Winter and Gaskell, 1995; Ward et al., 1998: MAFF, 2000; Haines-Young and McNally, 2001).
Innovation/scheme factors can often constrain the ability to adopt a new practice/scheme. These include payments offered, the scheme duration (and the time lag involved in scheme renewal), logistics (information flow; follow up and monitoring) and eligibly (Brotherton, 1991; Whitby, 1994, Wilson 1994; 1996; Vanslembrouck et al., 2002). In a number of studies non-participation has been found to reflect practical considerations such as lack of compatibility with existing management plans and the severity of change in farm management required; financial reasons, lack of information about the schemes, eligibility requirements, perceived complexity and comprehensiveness (e.g. the ability to participate on a limited basis) (Ilbery and Bowler, 1993; Morris and Potter, 1995; Wilson, 1996; Lobley and Potter, 1998; Wilson and Hart, 2000). Many of the studies reviewed looking at farm, farmer and scheme characteristics as determinants of AES participation have shown that whilst certain patterns have been revealed, there are also contradictory results and ambiguities making any conclusive remarks concerning the relationship between certain factors and AES participation
10

impossible. As such researchers agree that explaining farmer behaviour in terms of single factors is too simplistic, instead they emphasise the interaction between them. In recent years a number of writers, reflecting on various rather narrow studies of the relationship between attitudes and environmental behaviour have placed a renewed emphasis on the extent to which values, goals and objectives that contribute to the attitudes of individual farmers are embedded in the wider farming culture and community, which in turn is situated within the norms and expectations of wider society (Siebert et al., 2006). While some have suggested that this interest in wider social and cultural influences exposes the weakness of early studies (Burton, 2004), it also exposes something of a lack of attention to other even earlier studies, such as those referred to already by Gasson and Newby, or to more recent studies within anthropology, notably the work of Gray (1996, 1998, 2000). In order to understand this juxtaposition of individual attitudes and wider societal forces some researchers have given particular prominence to the notion of identity, arguing for the need for a holistic approach to a farmer’s self-conception in the context of a diverse range of drivers both internal and external to the farm business. The term life-world has also been used to delineate a similar approach (Schneider et al 2010).
2.4 Environmental Behaviour and Action: Question iv - The ‘So What’ of Attitudes
There is a long and rich tradition of research in the UK examining the significance of attitudinal variables to the adoption of environmental management practices, in other words action, particularly in the context of agri-environment schemes (AES) (e.g. Morris and Potter, 1995), with researchers showing that, although farmer attitude can be a key determinant of behaviour (Potter and Gasson, 1988; Battershill and Gilg, 1997), it is not always possible to demonstrate a direct relationship between AES participation and a positive interest in the environment. This is attributed to the influence of structural factors (policies, financial pressures, family structure, eligibility for scheme) which are equally influential. This has led researchers to examine the relationship between the willingness to adopt (attitude of farmer towards the scheme and towards profit) and ability to adopt (economic status of farm and compatibility with farming system) a central theme in a distinct body of research in the 1990s (Gasson, 1973; Potter and Gasson, 1988; Brotherton, 1991). Section 1.3 examines the significance of attitudes and values in explaining behaviour and the relationship between attitude and structural factors. Motivations, the reasons for carrying out an action, have also been the subject of research into farmers’ environmental behaviour. Whilst studies looking at attitude attempt to relate attitudes to behaviour or intended behaviour, studies looking at motivation examine the reasons or driving force behind farmers’ particular behaviours or actions that have already been undertaken. Whilst there has been a focus on attitude being one of the main motivational determinants, other motivations are considered. As with the ‘willingness and ability debate’, the main interest has been on the balance between extrinsic motivations (responding to rewards such as AES payments) and intrinsic motivations (responding to environmental interest or commitment). Clearly, the picture is complex. There is a consensus that farming is heterogeneous and therefore that the context and outcome for decision-making in relation to the environment will vary greatly spatially. As Siebert et al. (2006) point out, willingness and ability to co-operate in biodiversity objectives is not reducible only to the location of a holding, the attitudes or
11

values of farmer or wider social and economic factors. There is an intricate interaction of agronomic, cultural, social and psychological factors. Each of these factors plays interwoven roles in each national, regional and specific farm context. These in turn affect the individual farmer’s response to biodiversity-promoting policies for agriculture. Studies looking at motivational elements of behaviour have stressed that the decision to act in a certain way is affected by the ‘balancing’ of a number of these factors or influences. Attitude towards the environment is most commonly studied as an indicator of farmers’ anticipated behaviour. This has often involved measurement using Likert style questions (attitudinal scaling) in a survey or interview, asking farmers about their feelings towards the environment. Positive attitudes towards the environment are usually shown to be underpinned by certain sets of values and underlie intrinsic motivations. A number of studies have shown that positive attitude of farmers entering government schemes is a critical determinant of the level and quality of environmental benefits obtained (i.e. farmers were not behaving just as profit maximisers) (McDowell and Sparks, 1989; Wilson 1992, 1996; Potter and Gasson, 1988; Battershill and Gilg, 1997; Willock et al., 1999). Despite the large amount of research conducted on farmers’ environmental attitudes, there is considerable debate about the extent to which attitude is a reliable predictor of behaviour and a direct relationship between participation and a positive interest in, or concern for, the environment is not always clear cut. This is often because attitudinal and structural factors combine and interact to influence behaviour (as explored in more detail below). Researchers have found many inconsistencies between what people believe or say and how they actually behave with regard to the environment (Lichtenberg and Zimmerman, 1999; Brennan, 1992). Carr and Tait (1991), for example, demonstrate that general attitude is a poor predictor of specific behaviour, as, even when sympathetic to conservation ideals, farmers are still motivated by productivity and efficiency goals. Vanclay and Lawrence (1994) showed that farmers in Australia were concerned about conservation but they also reported that other factors, in this case economics, challenged the conservation concern. In a study by McCann et al. (1997), organic and conventional farmers in Michigan varied in their adoption of conservation practices, but they shared a common concern for the environmental impact of agriculture Wynn et al. (2001) found that there was no clear picture concerning conservation interest and entry in ESA in Scotland, although conservation interest did affect the speed of entry rather than the long term probability of entry. They suggest that those with conservation interest, rather than being predisposed towards the scheme, simply had greater access to information for example through specific advice providers. It is suggested that the results reflects the fact that the ESA does not necessarily require farmers to be strongly motivated towards conservation to want to join. In Wilson’s (1997a) study, participants in the CM ESA did not associate the ESA scheme with conservation, only a small minority claimed to have joined the scheme for conservation reasons. The study also found that the positive attitude farmers expressed towards heather was attributed to the fact that ESA participants could be paid for this habitat separately under the scheme rather than to any sincere interest in the habitat. In support of using attitude as an indicator of (intended) behaviour, evidence has been put forward to support the link between belief and attitude and action. Fishbein and Ajzen (1975) demonstrated a link between attitudes and behaviour with the theory of reasoned action (TRA) and later the improved theory of planned behaviour (TPB) (Azjen and Fishbein, 1980). The main assumption of the theory is that that behavioural intentions of an individual are directly related to his/her attitude and that people behave rationally in accordance with the beliefs they hold and that the person’s behaviour is a function of the information or beliefs he/she has (these may be based on experience or facts).
12

In recognition of the weakness in using attitude alone, the TPB incorporated additional determinants of behaviour including social influences (Azjen and Fishbein, 1980). Thus the TPB attempts to predict and understand behaviour by measuring the underlying determinants of that behaviour: personal attitudes (behavioural beliefs), subjective norm (social influences) and perceived behavioural control (perception of ease or difficulty of carrying out the action). Incorporating these other elements strengthened the theory significantly. This theory has been widely applied in rural and agricultural studies in general terms (Ilbery 1982; Gasson 1973) and for specific behavioural investigations (Brotherton 1991; Beharrell and Crockert 1992; Wilson, 1996). For example, Beedell and Rehman (1996, 2000) provide a useful classification of farmers’ attitudes towards the environment and AESs, based on personal attitude or behavioural beliefs (the farmer’s evaluation of environmentally friendly behaviour); perceived behavioural control or control beliefs (the extent to which AESs are perceived as easy or difficult to adopt) and subjective norms or normative beliefs (the perceived social pressure to behave in an environmentally friendly way). In a study of Bedfordshire farmers’ hedgerow management they found that the more conservation minded farmers (FWAG members) regarded the conservation benefits of hedgerow management more likely to be true, and valued them more highly than other farmers (non FWAG members). They also concluded that these farmers were responding to greater social pressures. In Willock et al.’s (1999) research using TPB, data were collected from 245 Scottish farmers and environmentally orientated behaviour was found to be associated with several attitudinal factors (openness to new ideas, status) as well as some structural variables such as size of farm. One of the main conclusions from the analysis is that farmers’ behaviour can only be explained when attitudes are considered. However, whilst establishing the important influence of psychological factors on farming behaviour, the researchers acknowledged the need to link such models to specific decision domains (such as adoption of alternative enterprises, responses to specific policies, etc.), which would be more amenable to predictive modelling than the more general behaviours (i.e. environmentally orientated behaviour) that formed the basis of their own work. TPB was also used in studies by Reading University (2006) and Continental Research (cited in Defra, 2008) to identify behavioural types or segments, as described in section 2.3.5. Attitudes become more or less significant under different circumstances. Negative factors such as incompatibility and financial constraints have been shown to be mediated by attitudes, hence farmers more predisposed to a favourable view of a scheme will be more willing to overlook potential barriers to participation (Wilson, 1997a; Lobley and Potter, 1998). In other studies those with positive attitudes towards conservation objectives of the scheme and/or those perceiving financial benefits were found more likely to participate (Morris et al., 2000). Conversely evidence that the more highly constrained farmers are those with the lowest attitudinal disposition for entering schemes shows how farm business and scheme factors can influence attitudes and perceptions (Potter and Gasson, 1988; Brotherton, 1989). Wilson (1997a) found that on farms in the Culm Measures ESA of marginal eligibility, environmental attitudes become more important because participation becomes a tight calculation between economic benefit and wildlife protection and farmers with conservation oriented attitude are more likely to join than those with a utilitarian (profit seeking view). This is demonstrated by the low correlation between environmental attitude and behaviour in high cost situations and high correlation in low costs situations identified by Vogel (1996). Similarly where transaction costs are perceived to be high, attitude can tip the balance either way with regard to entry. It is clear from the AES studies undertaken that structural factors (financial, business, farm household) interact with attitudinal factors in decision making. The balance between the two, often characterised as the outcome between ability and willingness, has been central to many attitudinal investigations, often with differing outcomes. For example, while Brotherton
13

(1991) suggested that the effect of attitudes is generally subservient to the power of financial attractiveness, Battershill and Gilg (1997) found that farmers’ attitudes in south-west England seem to dominate structural (financial) constraints. This reflects the trade-offs between extrinsic and intrinsic motivations as discussed in Section 2.4. Whilst most studies look at attitude towards the environment, usually with farmers questioned about their attitudes towards conservation or the environment, some studies have examined attitudes towards new technology, government policies and the future of the agricultural sector (which all impinge on farmers attitudes towards AES and decisions about a participation) (Gorton et al 2008; Visser et al., 2007; Davies and Hodge 2006). More recently Davies and Hodge (2006) identified three sets of attitudinal factors in their study of farmers’ views of cross compliance. Firstly level of confidence in conventional intensive farming; secondly farmers’ orientations concerning conservation ethic; and thirdly the relative priority they assign to profit. In a survey of 102 arable farms in East Anglia they investigated the level of support for the principle of cross compliance for biodiversity objectives. They found two attitudinal factors; stewardship orientation and technological beliefs were the most significant in determining the acceptability of cross compliance with structural and socio-demographic factors being less important. The way that farmers perceive government policies, consumer and public concerns influences farmers’ views and responses towards environmental protection as well, this was revealed in research undertaken for Defra looking at the influences on farmer environmental behaviours using four case studies (Dwyer et al., 2007). Attitudinal types Research relating attitudes to AES engagement has sought to 'typologise' attitudes and practices around discrete land-manager types. Measures of attitudes have been used to construct farmer typologies distinguished by their approaches to farming. The methodologies used in the research tend to employ surveys and interviews with Likert style questions. These studies have revealed that there are differing motivations and levels of commitment for participation or non-participation in AES. Typically the studies distinguish a spectrum of (non) participation based on motivation/attitude and suggest different policy mechanisms for improving engagement with each type. Morris and Potter (1995) developed a typology of (non) participation based on attitude following an analysis of results from a survey of 101 farmers in south east England. They sampled a cross section of adopter and non-adopter farms in the South Downs (SD) ESA and compared their responses with those of farmers in the North Downs (an area outside an AES scheme) to a hypothetical ESA situation. Focusing on motivational aspects they found wide levels of variation in the level of commitment and sympathy with the objectives of AES and devised a participation spectrum ranging from most resistant non-adopters to most active adopters. They identified four types as follows. Resistant non-adopters (63% of non-adopters) were very opposed to the scheme because of the insufficient level of payment, the restrictive nature of the contract; they were also cynical about such short term political measures. Conditional non-adopters (37% of non-adopters), although they had similar reasons for not joining, said they would consider joining in the future. Passive adopters (51%) joined for financial reasons (demonstrating extrinsic motivations) while Active adopters (49% adopters) showed a more positive attitude (demonstrating intrinsic motivations). This research suggests that many of those with land enrolled in ESAs the “passive adopters” were motivated by the potentially high financial rewards while only a smaller proportion were concerned with the environmental aspects of participation. Other researchers have built on this work. Lobley and Potter (1998) for example used a similar typology to argue that different schemes will appeal to different constituencies of land
14
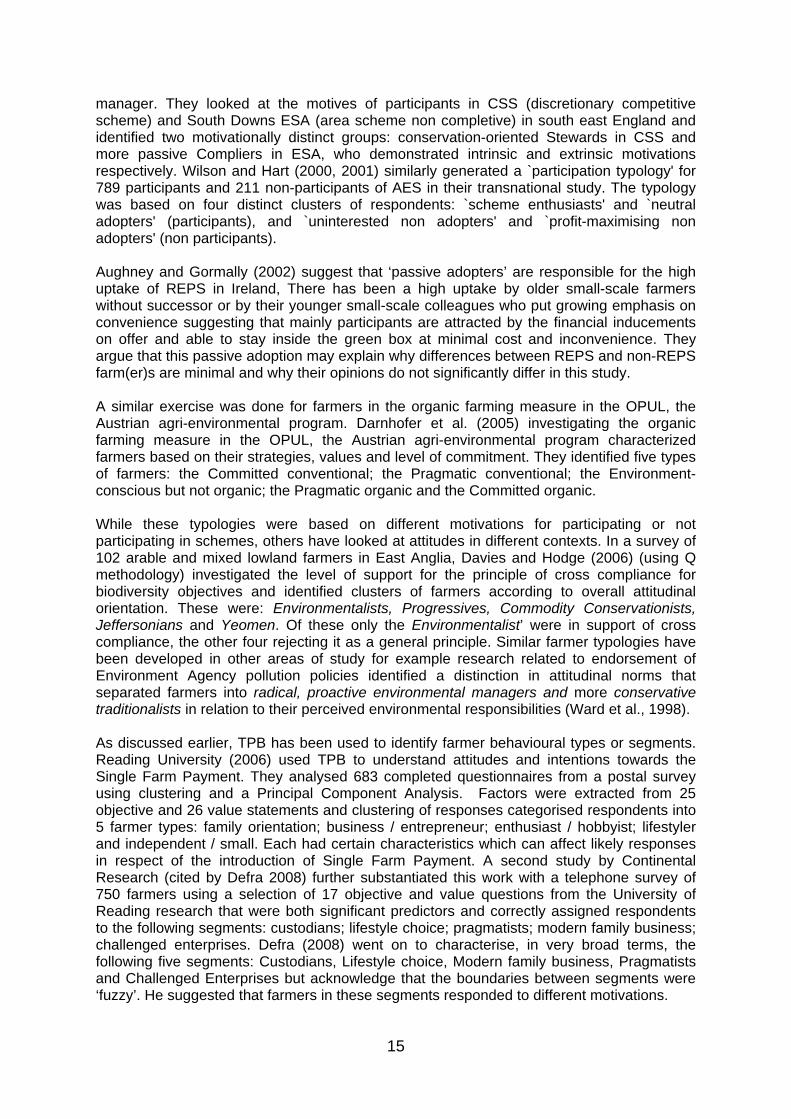
manager. They looked at the motives of participants in CSS (discretionary competitive scheme) and South Downs ESA (area scheme non completive) in south east England and identified two motivationally distinct groups: conservation-oriented Stewards in CSS and more passive Compliers in ESA, who demonstrated intrinsic and extrinsic motivations respectively. Wilson and Hart (2000, 2001) similarly generated a `participation typology' for 789 participants and 211 non-participants of AES in their transnational study. The typology was based on four distinct clusters of respondents: `scheme enthusiasts' and `neutral adopters' (participants), and `uninterested non adopters' and `profit-maximising non adopters' (non participants). Aughney and Gormally (2002) suggest that ‘passive adopters’ are responsible for the high uptake of REPS in Ireland, There has been a high uptake by older small-scale farmers without successor or by their younger small-scale colleagues who put growing emphasis on convenience suggesting that mainly participants are attracted by the financial inducements on offer and able to stay inside the green box at minimal cost and inconvenience. They argue that this passive adoption may explain why differences between REPS and non-REPS farm(er)s are minimal and why their opinions do not significantly differ in this study. A similar exercise was done for farmers in the organic farming measure in the OPUL, the Austrian agri-environmental program. Darnhofer et al. (2005) investigating the organic farming measure in the OPUL, the Austrian agri-environmental program characterized farmers based on their strategies, values and level of commitment. They identified five types of farmers: the Committed conventional; the Pragmatic conventional; the Environment-conscious but not organic; the Pragmatic organic and the Committed organic. While these typologies were based on different motivations for participating or not participating in schemes, others have looked at attitudes in different contexts. In a survey of 102 arable and mixed lowland farmers in East Anglia, Davies and Hodge (2006) (using Q methodology) investigated the level of support for the principle of cross compliance for biodiversity objectives and identified clusters of farmers according to overall attitudinal orientation. These were: Environmentalists, Progressives, Commodity Conservationists, Jeffersonians and Yeomen. Of these only the Environmentalist’ were in support of cross compliance, the other four rejecting it as a general principle. Similar farmer typologies have been developed in other areas of study for example research related to endorsement of Environment Agency pollution policies identified a distinction in attitudinal norms that separated farmers into radical, proactive environmental managers and more conservative traditionalists in relation to their perceived environmental responsibilities (Ward et al., 1998). As discussed earlier, TPB has been used to identify farmer behavioural types or segments. Reading University (2006) used TPB to understand attitudes and intentions towards the Single Farm Payment. They analysed 683 completed questionnaires from a postal survey using clustering and a Principal Component Analysis. Factors were extracted from 25 objective and 26 value statements and clustering of responses categorised respondents into 5 farmer types: family orientation; business / entrepreneur; enthusiast / hobbyist; lifestyler and independent / small. Each had certain characteristics which can affect likely responses in respect of the introduction of Single Farm Payment. A second study by Continental Research (cited by Defra 2008) further substantiated this work with a telephone survey of 750 farmers using a selection of 17 objective and value questions from the University of Reading research that were both significant predictors and correctly assigned respondents to the following segments: custodians; lifestyle choice; pragmatists; modern family business; challenged enterprises. Defra (2008) went on to characterise, in very broad terms, the following five segments: Custodians, Lifestyle choice, Modern family business, Pragmatists and Challenged Enterprises but acknowledge that the boundaries between segments were ‘fuzzy’. He suggested that farmers in these segments responded to different motivations.
15

Most recently Sutherland et al. (2011) presented analysis of land mangers’ attitudes towards land use in Scotland. They identified five idealised types of land mangers: ecological land steward, economic land steward, multi-functionalists, community stewards and ‘other’. Unlike other studies, where the typologies are constructed by combining attitudes, values and beliefs with holding characteristics and business structure, this study (as with Gorton et al., 2008) developed the typology solely on the basis of attitudes but described the characteristics of the land manager types in terms of common structural and demographic characteristics. It is clear that these studies have all identified very similar types. There have been criticisms of these typologies. Burton (2004) for example queries the relevance of a typology based on attitudinal measures when the assumed attitude-behaviour relationship is questionable. Others argue that much of the work on typologies, which tends to construct a view of individual land managers as highly coherent, is flawed and that attitudes and practices should not be easily contained within a single descriptor. For example, Fish et. al. (2003) argue that modes of uptake are not necessarily associated with specific land-manager types but instead with ‘styles of participation and non-participation’ which are not mutually exclusive, that land managers frequently take different approaches with respect to different parts of their farms and different types of landscape feature. Through analysis of the qualitative interviews of 100 land managers, they identified four styles of participation in the ESA and CSS schemes and four styles of non-participation. Changes in individual farmer attitudes over time Some commentators have suggested that farmers’ environmental attitudes and motivations for involvement in conservation schemes serve as a key influence on the prospect for sustained behavioural change (Morris and Potter, 1995; Potter and Gasson, 1988). An increasing body of research has evaluated agri-environmental schemes for delivering durable changes in farmers’ attitudes and behaviour (Morris and Potter, 1995; Curry, 1997; Beedell and Rehman, 2000; MacDonald and Johnson, 2000 Visser et al., 2007). Here, distinctions have been made between intrinsic and extrinsic motivations (DeYoung, 1993) (see Section 4), where intrinsic are thought to be more enduring and extrinsic forms of thought to be more transitory in their effects. This would suggest that where farmers behavioural change in response underlying positive attitudes and values seeking personal rewards and satisfaction will be more enduring. A study by Wilson and Hart (2001) found that focusing on attitude change showed important differences between individuals, and that the less demanding schemes like ESAs had a low potential for attitudinal ‘value added’ compared to more demanding schemes such as Countryside Steward Schemes (CSS). However, the CSS participants although showing an improved attitude, often only showed it towards the CSS parts of the farm. Looking at the ability of REPS to deliver durable changes in farmers’ attitudes, Aughney and Gormally (2002) concluded from a survey of REPS and non-REPS farmers in Western Ireland that both groups had a general lack of understanding of the nature conservation value of their own farms and that REPS had not (yet) made any difference in that respect. This was attributed to the large extent of passive adoption in the scheme. Funding through federal programs in the USA was the trigger to start conservation efforts but it did not change the farmers’ conservation attitudes. If the farmers’ attitudes toward conservation had been negative, then funding had minimal and short-term impacts on their actions. However, funding was claimed to be good because it introduced farmers to new ways of doing things and to new people, to learning about what nature could do to solve a production dilemma, and learning how to live with social pressure after using less conventional management (Trout et al, 2005). Ryan et al. (2003) similarly showed that subsidies alone were neither enough to create a willingness to join conservation programs in
16

the USA, nor did they create a long-term and useful conservation ethic; again suggesting that participation due to extrinsic motivations do not bring about attitudinal change. Studies have also pointed to the difficulties of measuring change in attitude (Skerrat 1994; Morris and Potter, 1995) and the fact that studies generally only measure attitude at one point in time (Wilson 1996). Also as Ahnstrom et al. (2008) point out there can be a huge time lag between ideas and actual change in behaviour, as attitudes can change relatively fast but the farming practices will be much slower to follow. There is debate about the extent to which attitude can be changed by advice and lead to a behavioural change. One view, a premise of Rogers (1975) diffusion-adoption model, is that once positive attitudes are formulated about specific alternatives, farmers will act by adopting desirable behaviour. Thus awareness raising and information provision are thought to be key to changing behaviour. The critical element it is argued is the formation of positive attitudes. For example, Napier et al. (1988) found that, once aware of the problem through information campaigns and the solution, farmers were willing to participate in soil conservation in USA. Some also consider that attitudes can be changed though enhanced social capital (Sobels et al., 2001; Mathijs, 2003; Pretty and Smith, 2004). The work on typologies suggests that there is a reservoir of potential participants who would consider joining a scheme if attitudes were changed and that attitudes might be changed if scheme characteristics changed, if bureaucratic demands relaxed, or if advice improved. In effect it is argued that policy changes can act to push a farmer along the spectrum from non-participation to participation. However, it has been argued that, because of the questionable link between attitude and behaviour, any effort to change attitude can only have limited results because farmers are prevented from behaving in a manner consistent with their attitudes by other constraints such as macro-economic and macro-social flows. Others question the simplicity and naivety of research which concludes that changing a single belief of attitude to the environment will result in more appropriate environmental behaviour (McHenry, 1997). Burton (2004) argues for example that models like Morris and Potter’s (1995) assume that only changes in attitude are needed to push a farmer along a spectrum are inherently weak because of their reliance on attitude alone. Motivations To be motivated means to be moved to do something and motivation reflects the reasons why a person follows their aims and desires and is the primary driving force for doing something such as joining an AES. The orientation of motivation concerns the underlying values, attitudes and goals that give rise to action. The most basic distinction is between intrinsic motivation, which refers to doing something because it is inherently interesting or enjoyable, and extrinsic motivation, which refers to doing something because it leads to a separable outcome and is in response to external pressures, or rewards. Aarts and van Woerkum (2000, p. 27) identify compulsion and voluntariness as essential psychological principles of control, whereby voluntary behaviour is distinguished according to extrinsic and intrinsic motivation. There has been recognition of the importance of motivation, and especially the source of motivation, in attempting to explain farmers’ voluntary behaviour such as their inclination to adopt conservation practices and participate in environmental schemes and practices (Black and Reeve, 1992; Potter and Gasson, 1988; Wilson and Hart, 2000, 2001; Ryan et al., 2003; Smithers and Furman, 2003). Extrinsic motivations Those who demonstrate extrinsic motivations respond to rewards, in the context of AES these can be direct rewards, in the form of payments to the farm business, either for
17

investment or to enhance income, or indirect rewards through recognition from their peers and from society. Many studies emphasise the importance of financial incentives for participation. Early studies of conservation behaviour concentrated on farmers’ economic motivations (e.g. Brotherton, 1991). These tended to show that the behaviour of farmers towards conservation was dominated by the over-riding interests of the farm business (Newby et al., 1977). The assumption here was that farmers behave as profit maximising agents responding in uncomplicated ways to the financial incentives on offer. More recently a survey of ESA participants in Scotland by Wynn et al. (2001) found that the predominant motive for joining was to increase farm income (supported by Crabtree et al., 1999). Economic motivations relate to the instrumental values identified by Gasson (1973) where financial rewards and security are highly valued. Wilson and Hart (2000, 2001) also noted in their extensive transnational study that most farmers surveyed were driven in their participation decisions primarily by financial motivations. On the basis of responses given by 789 participants in the ten countries under investigation, economic considerations were the primary driving force for farmers to participate in AES (79% gave financial reasons; 64% a secure source of income). This mirrors findings from other national and international studies that have highlighted the financial imperative behind scheme participation in most EU AES (for example, Brouwer and Lowe, 1998; Buller et al., 2000; Whitby, 1994; 1996; Wilson, 1996; 1997a). Many analyses reviewed by Siebert et al. (2006)5 also show that the economic incentive is a prime factor for farmers to adopt policy measures. Results from case studies done by Deffuant (2001) and the OECD (1998), as well as several comparative studies (Drake et al., 1999; Schramek et al., 1999a, 1999b), also emphasise farmers’ economic reasons for participating in agri-environmental measures or in other programmes with environmental conservation objectives. A review of the literature related to farmers’ adoption of conservation practices in North America similarly finds a heavy emphasis on economic incentives (Camboni and Napier, 1993). More recently in a survey of farmers in Lough Melvin in Ireland the majority of farmers surveyed (71%) said that increasing income was the most important factor when deciding to take part in an AES (compared to 19% who said that the most important factor was environmental benefit) (pers. comm.). It should be noted, however, that economic motivations are expressed in various terms, such as profit maximisation, security, long-term farm viability and/or risk minimisation, capital investment (Schramek et al., 1999a,b cited in Siebert et al., 2006). Tir Gofal agreement holders agreed that financial benefits were the primary reason for joining the scheme, however, payment for boundary works rather than money per se, was the deciding factor in many cases (WAO 20076; Ingram et al., 2009). Several participants also spoke of the longer-term perspective; the Tir Gofal scheme was appealing because it provided a degree of security in a context of volatile market prices and reducing subsidies from other sources. This interest in financial security, has been echoed in a number of other studies (Gould et al., 1989) and links to the notion of motivation being aspirational in terms of securing the family future and its continuity (Siebert et al., 2006) rather than being purely a response to a short term financial incentive (Farmar-Bowers and Lane, 2008). Other extrinsic motivations, such as community image and regulation (fear of penalty) can explain farmer environmental behaviour. This corresponds to what Gasson (1973) called a
5 The results of the study are based on the assessment of about 160 publications and research reports from six EU member states (Finland, Germany, Hungary, The Netherlands Spain and the UK) and from international comparative research 6 The Wales Audit Office (WAO)) held three focus groups with agreement holders and applicants to discuss their experience of Tir Gofal. They invited participants on the advice of the CCW to cover a broadly representative range of locations, farm types and experience of the scheme.
18

social value. Standing within the community and respect amongst peers, as well as recognition in a wider society can motivate farmers to farm in a more environmentally friendly manner and participate in schemes (Dwyer et al., 2007). This relates to the discussion about the influence of social norms in Section 5. Intrinsic motivations. Intrinsic motivations are those which reside in the values, beliefs and environmental sympathies of the individual (Vinning et al., 1992) and are reflected in a personal sense of environmental responsibility and accountability. Commitment and interest in the environment can be a clear intrinsic motive. Berentsen et al. (2007) using a survey looked at factors that motivate or de-motivate farmers to participate in on-farm nature conservation in the northern Netherlands. The survey revealed that the farmers' commitment to their natural environment strongly motivates farmers to get involved in on-farm nature conservation schemes. Similarly expressed interest in wildlife has been found to positively correlate with willingness to undertake wildlife-friendly measures (e.g. Herzon and Mikk, 2007). In an evaluation of the whole farm scheme, Tir Gofal, in Wales although most agreement holders identified conservation reasons as a secondary motive (after financial motives), some had entered the scheme expressly to improve the landscape and enhance the wildlife features of their farms and several mentioned how much they valued the ability to return to traditional farming practices such as hedge laying (WAO, 2007; Ingram et al., 2009). A study of what motivated woodlot landowners to retain and manage their forests in an agricultural watershed in the Midwestern (USA) also revealed intrinsic environmental interests (Erickson et al., 2002). The results of a survey of 112 woodlot owners suggested that aesthetic appreciation was the strongest motivator for retaining woodlots, especially by non-farmers. Protecting the environment also seemed to be important for both farmers and non-farmers, while economic motivations were significantly less important. Similarly, higher levels of participation in Environmental Farm Plan (EFP) in Ontario were found among those farmers who indicated a concern for wildlife and natural areas’ preservation (Smithers and Furman 2003). In other studies farmers have been found to be motivated by this ethic to maintain and enhance their historic and cultural value of landscape features. In a study of the uptake of covenants by landholders in Australia Kabii and Horwitz (2006) also found that landholder philosophies and values underpin or mediate the decision-making processes. Fish et al. (2003) in their study of CSS and ESA found that farmers describe an emotional attachment to nature and often feel a duty to maintain or protect it. Some studies have found that in some situations farmers are more intrinsically motivated than extrinsically motivated. For example, Ryan et al. (2003) found that farmers are more intrinsically motivated to practice conservation along riparian zones in the US mid West than extrinsically motivated by economics. Different types of motivations were explored by Smithers and Furman (2003) who, in a survey of 123 EFP participants in Ontario, found that farmers’ stated motivations for participation favoured ‘intrinsic concerns, which related to farmers’ attitudes towards soil and water quality, considerations of human health and farmers’ desire to gain more knowledge of the farm environment’. These were deemed more important than extrinsic motivations relating to community image, fear of penalty and financial reward. These results are consistent with findings in related research in the UK, where AES participants have a demonstrated tendency to be motivated by intrinsic concerns (expressed as positive environmental attitudes) for environmental quality and improved management rather than ‘consequence avoidance’ (e.g. Battershill and Gilg, 1996; Beedell and Rehman, 2000). The balance between extrinsic and intrinsic motivations Studies have shown a predominance of economic motivations demonstrated by farmers, however, researchers have proposed that the adoption of conservation behaviour, in
19

general, is not solely explained by extrinsic motivation but by a range of intrinsic motivations (De Young, 1993). Economic reasons for participating in schemes or demonstrating conservation behaviour are nearly always accompanied by or superseded other motivations and explanations and this has been widely demonstrated in the AES participation literature. It is common for participants to explain their reasons for joining schemes in both environmental (intrinsic) and financial (extrinsic) terms. For example in the Scottish AES survey (Manley and Smith, 2007) RSS and CPS participants reasons for joining were dominated by environmental reasons, including both increasing the variety of biodiversity and improving the landscape, as well as the financial benefits of annual and capital payments. The extent to which farmers are driven respectively by extrinsic and intrinsic motivations has interested researchers investigating AES participation. Almost all studies related to motivational elements of behaviour have stressed that the decision to act in a certain way is affected by balancing or weighing of a number of influences (Beedell and Rehman, 1999). This has parallels to the studies that examine the interactions and balance between structural and attitudinal factors. Chouinard et al. (2008)7 for example investigated the trade-off agricultural producers face between profits and stewardship activities when selecting farm practices. They hypothesised that there are farmers that are willing to forego some profit to engage in stewardship farm practices, their empirical study showed that that some farmers are indeed willing to make this sacrifice. Although studies appear to focus on the tensions between these different motivations, it has been argued that intrinsic (conservation) and extrinsic (economic) motivations need not be mutually exclusive and can be integrated. Wilson and Hart (2000, 2001) suggested that, contrary to many previous studies which have tended to view financial imperatives as separate from conservation concerns, economic and pragmatic considerations for AES participation are not necessarily incompatible with environmental reasons for joining schemes, that the financial imperative for participation does not necessarily exclude an often equally important concern for the environment.
2.5 Unpacking the Environment
Hitherto this review has tended to focus on the environment as a generic category whereas in reality the impact of farming on the environment may be sub-divided into many different categories. In this section we examine some of the available evidence on farmers’ attitudes to features within the landscape, such as game crops, hedgerows, in-field management options, and particular environmental issues such as pollution of water courses. This kind of work is important in the context of both the design of agri-environmental schemes and issues of compliance with regulations and directives, such as the Water Framework Directive. The issue is not new, it has long been recognised that farmers are likely to be more sympathetic to some kinds of environmental actions than others. The maintenance and management of features, such as farm woodlands that might have benefits for game shooting and/or hunting as well as wildlife is an important example (Lawrence et al, 2010). By contrast, AES options that include managing land within the crop itself are particularly unpopular with many farmers in England (Butler et al, 2007), even when ‘in-field’ options are known to have clear and substantial benefits for biodiversity.
7 Instead of the profit-maximisation framework, they modelled producer behaviour in an expanded utility framework, built on production technology, and including two utility components: self and social interests. This framework introduced inherent heterogeneity and social environmental motivations into farmer behaviour.
20

2.6 Changing Attitudes and Behaviour: Question v - The ‘What If’ question.
The issue of a positive perception, and a positive experience, leading to beneficial environmental actions has been considered in depth by researchers. As Smithers and Furman (2003) point out, an abiding question in many specific analyses of factors influencing AES participation is whether the awareness of and positive attitude towards environmental issues fosters environmental action or whether the participation in programmes leads to a heightened awareness of and concern for environmental issues which translates into specific action. Clearly measuring attitudes alone can mask complex interdependencies.
Perceptions about environmental management
With respect to positive perception leading to environmental actions and AES participation, positive attitude and willingness to learn were central determinants in adoption of AES (as already discussed) as has been shown for other activities, such as soil conservation schemes in the USA (Ervin and Ervin, 1982). One view is that farmers consider the efficacy of a new scheme or practice when deciding about participation and studies have confirmed linkages between farmers’ beliefs and actions, demonstrating a greater likelihood of adoption by farmers who believed that a problem existed and could be improved. In Ohio, for example, farmers, who believed that environmental problems were important, were more likely to use soil conservation practice (Lovejoy and Napier, 1986). More recently Macgregor and Warren (2006), using results from a qualitative socio-economic study of the motivations and management practices of 30 farmers located within the Strathmore and Fife Nitrate Vulnerable Zone, found that farmers did not believe that they were responsible for any water quality problems. Nor did they believe that there was a link between catchment and coastal zone management. Ahnstrom et al., (2008) in their review point out the farmer has to account for how he or she perceives the farm being affected by the change caused by the entry in agri-environmental schemes, and suggest the following questions that should be asked: • How the farm economy is affected by the change; what are the financial risks of joining;
and how big a risk is he or she is willing to take? • How the change will affect relations in the family, with other farmers and with
neighbours. • Does the farmer have enough knowledge to perform the management changes and
whether or not he or she can judge the consequences of the changes for the farm? • Can the farmer get access to the technology needed for the change in management?
The nature of the scheme and how it is understood is important to the perception as well. Garrod et al., (2008) in their evaluation of the Voluntary Initiative found that the scheme may become more acceptable to farmers and better understood as it becomes incorporated into existing farm assurance schemes. Perceptions about the ease or difficulty of carrying out an action were recognised as underlying determinants of behaviour and the TPB (as described in Section 3) incorporated perceived behavioural control into the model to help predict behaviour.
Experience leading to a positive perception - observed outcomes of environmental management
With respect to experience of schemes leading to a positive attitude, it has been shown that participation in AES can increase the conservation interest and knowledge of some participants and instil learning and help to acquire knowledge. In a survey of 2095 farmers in
21

Austria, Vogel (1996) derived an attitude-behaviour pathway model incorporating different attitudinal components (proposing a sequential set of variables starting with a personal value system and ending in behaviour) and found that problem based knowledge and environmental attitudes as a farmer (e.g. farming based attitude in the immediate sphere of the activity of the farmer as opposed to general attitude to environment) were central to the relationship. He argued that this is because personal experience (knowledge based learning) of environmental problems leads to a better understanding and positive action. The individual’s own experience reinforces appropriate behaviour following the cycle that behaviours reinforce experience, which reinforces attitudes derived from experience. Thus his model confirmed that the components associated with personal experience of environmental problems have direct influence on environmental behaviours. This has implications for any long term behavioural and attitudinal change associated with AES. There is evidence that participation in conservation programs in the UK led in many cases to increased awareness of environmental issues. In cases where biologists/ conservationists in the UK had taken time to show and name species made the farmer proud and more willing to take conservation actions because he or she knew what was being protected (Battershill and Gilg, 1997). Fish et al. (2003) in their study of CSS and ESA found that those who expressed views associated with the Enthusiastic style of participation (34 out of 100 surveyed) appreciated the fact that they had gained knowledge about the nature and management of their landscapes through the scheme; others thought that the scheme instigated good discipline in the maintenance and enhancement of landscape features. In their comparative study of farmers in Finland and Estonia, Herzon and Mikk (2007) found that farmers with agri-environment contracts targeted specifically at biodiversity enhancement were more knowledgeable about practical on-farm activities favouring wildlife, and were more willing to employ them than other farmers. The farmers could name some biodiversity-benign practices, quoted almost exclusively management options supported under the respective agri-environment programmes as the way to enhance biodiversity. Farmers tend to appreciate environment improvements. A review of Tir Gofal found that there was a strong consensus amongst agreement holders attending focus groups that the scheme had a positive impact overall on the environment. Some participants had noticed how bird and wildflower populations had increased on their farms and they valued this aspect (WAO, 2007; Ingram et al., 2009). In the Scottish AES survey (Manley and Smith, 2007), RSS and CPS participants showed a general and strong consistency of agreement that there had been an increase in biodiversity, that the appearance of the landscape had been positively improved and that the schemes had increased their environmental knowledge. A very high number of both scheme participants added further comment indicating an increase in specific species, generally high profile and easily recognisable vertebrates, mainly songbirds and raptors. OAS participants also indicated increased biodiversity and that participation had increased their environmental knowledge. In a study in Ireland (Van Rensburg et. al., 2009), REPS farmers did exhibit a higher degree of awareness of the degraded state of commonage land than did their non-REPS peers, though the percentage willing to admit the severity of the environmental damage was still low. REPS farmers show a greater willingness to break with past practices than do non-REPS farmers as evidenced by their attitudes towards the future management of commonage. In Smithers and Furman (2003) study in Ontario, they found that In the majority of cases, participation in the EFP resulted in a significant outcome, even for those who had failed to complete the entire process. It appears that most farmers did leave the process having at
22

least completed an environmental appraisal of their farming operation, which was considered a challenging feat. Over 90% of respondents indicated that participation in the programme had increased their awareness of potential environmental issues relating to farming. In addition, many others actually went on to prepare an environmental farm plan of some kind. In support of this it is recognised that schemes like ELS have a beneficial effect by introducing farmers to the possibility of engaging for the first time in the agri-environment programme and signing whole farms up to a basic level of environmental management (Hodge and Reader, 2007). In Somerset, the awareness-raising of FWAG (together with the threat of non-compliance action from the Environment Agency) has helped the farmers to change their attitude and practices to reduce soil erosion. Whereas in the past farmers thought erosion was caused by heavy rainfall and thus beyond their control, advice and support helped the farmers acknowledge their responsibility to prevent soil erosion by changing their farming practices (Posthumus and Morris, 2006 ). In this case there was an underlying threat of regulation, the same was found with the Voluntary Initiative (VI) where farmer attitudes to the VI appeared to be influenced by the belief that the UK government will, eventually, introduce some form of pesticide tax regardless of the outcome of the VI (Garrod et al., 2008). However, negative experiences can equally lead to negative attitudes. This has been evident in cases where farmers’ experiences of the efficacy of particular AES prescriptions are not favourable. In a survey of SSSI agreement holders in Wales (ADAS, 2004)8, concern about the prescriptions was voiced in terms of achieving conservation. Several farmers felt that the floral diversity of hay meadows had deteriorated and noted scrub and rush encroachment. The findings from a CCW survey provide some evidence to support many of these concerns. When farmers’ local knowledge is marginalised this can lead to poor acceptance of imposed management, particularly when it does not accord with their experiences and practices (see for example McEachern, 1992; Wilson 1997a; McHenry, 1997; Burgess et al., 2000; Riley 2006, 2008). With respect to practices to prevent diffuse pollution, an evaluation of ECSFI showed that as a result of advice, and attending events, farmer had improved their knowledge of water pollution, but the majority still do not believe that agriculture makes a contribution to diffuse pollution. Despite a large number taking action and introducing new practices they were not convinced that it made much defence to water pollution, however those farmer that had engaged with the programme were more likely to believe they had benefited from it, for example with capital grants, advice, regulatory assistance. The extent of learning and increased awareness clearly depends on the extent to which the farming system has changed under AES participation. For example for some farmers it is suggested that the ESA merely facilitated a continuation of already established farming practices (Skerratt, 1994; Wilson 1997a). Where limited change has taken place it is most likely also the case that limited benefits will accrue, it is also anticipated that there will be minimal opportunity for a shift in attitude and awareness. More recently, Burton et al (2011) have taken a very different approach to agri-environmental scheme suggesting that they may even be counter-productive claiming that their success “is being increasingly questioned”, citing, for example, work by Macdonald and
8 This report presents results of the ADAS socio-economic evaluation of CCW’s SSSI management agreements and provides an assessment of their impact at farm level and within the context of the broader rural economy. The main information source for this study was an interviewer administered questionnaire survey. A sample of approximately 10% of all the management agreement holders in Wales was selected for the survey
23

Johnson (2000) as finding little evidence that farmers’ attitudes had changed despite almost two decades of engagement (see also de Snoo et al in press). However, other recent commentators have taken a more positive view on the potential of agri-environment schemes (e.g. Mills, 2012). A RELU project over six years based on a longitudinal study of the impact of training on farmers’ environmental orientation and actions is also particularly instructive in this respect. Much of the output from this project is yet to be published but preliminary findings suggest that training created positive attitudes towards ELS management, and its impact can be seen both in technical aspects of management and in farmers’ attitudes and a sense that they can do a better job on environmental management. For some farmers unlocking the ‘why’ was important as the ‘how’. These positive farmer responses to training led through to large impacts on the quality of the habitats they produced, which could be linked back to information the farmers received.
Observed outcomes of environmental management for the farm business
CRER and CJC Consulting (2002) in their economic evaluation of agri-environment schemes in England emphasise the important role of the effects of participation on the farm incomes and businesses. Marsden et al. (2002) suggest that Tir Cymen payments enabled farmers to farm more profitably as a result of improved stock management and, when farm incomes fell, Tir Cymen payments were greatly valued and enabled farmers to remain in business. Similarly the WAO report (2007) suggests that Tir Gofal has not led to an increase in income for most agreement holders but benefited them by contributing towards the cost of farm assets (especially boundary works) and by providing revenue when farmers use their own labour to meet the terms of their agreements. There is evidence for fodder crop farms in Germany and for dairy farms in The Netherlands that participation in AESs brings economic benefits and that net farm income is higher among participants than among non-participants (Siebert et al., 2006). There is evidence that farmers accrue agricultural benefits carrying out boundary improvements for example under Tir Gofal boundaries provided stock proofing and protection from extremes of weather for stock (Agra CEAS Consulting, 2005; WAO, 2007) while overall the scheme helped with cross compliance and in keeping the farm tidy (Dairy Development Centre, 2008).
2.7 Conclusion and Key points
This project aims to explore the link between farmers' attitudes to environmental management, their subsequent behaviour, and the perceived and actual environmental benefits. This literature review has revealed that there is a link between attitude and behaviour in the context of farmers’ environmental decision-making, although attitude is mediated by structural or constraining factors whether these are situational (related to the household or farm), or external drivers such as policy or markets. The trade–offs and balances between these factors and individual farmers’ values and attitudes is therefore of particular interest, this is characterised as the outcome between ability and willingness. The face to face interviews aim to capture this balance by asking questions about farmer and farm structural barriers and about farmer attitudes and values towards environmental management.
Factors affecting environmental management uptake
The factors set out below (Table 2.2) have been identified as influencing farmers’ behaviour generally by constraining or acting as a barrier to farmers’ ability to undertake environmental management. Previous research has shown that explaining farmer decision-making in
24

relation to the environment and their holdings is not reducible to single factors so it is proposed that there is no attempt to relate behaviour to single factors, such as farm size or type in this project. Instead the research will aim to analyse the interaction between the many influential factors and drivers (including attitudinal factors which influence willingness) that affect farmers. Table 2.2 Factors influencing environmental management uptake (Ability) Farm household characteristics: personal, social and situational characteristics of farmers and household • Education • Succession status • Age • Length of residency
Farm structure: physical farm factors and the farm operation (farming system and business factors) including structural characteristics • Farm size • Farm type • Tenure • Dependency on farm income • Amount of non-intensively used farmland • Bio-geographical conditions of the farmland, endowments of natural habitat
Innovation/scheme factors: nature and qualities of the scheme, practice or innovation • Payments offered • The scheme duration (and the time lag involved in scheme renewal), • Logistics (information availability and flow; follow up and monitoring) • Eligibly • Lack of compatibility with existing management plans and extent of adjustment required • Perceived complexity, comprehensiveness and effectiveness
Values, Beliefs, Attitudes
The review has shown that there is considerable debate about the extent to which attitude is a reliable predictor of behaviour and a direct relationship between participation and a positive interest in, or concern for, the environment is not always clear cut. There are, however, some key aspects concerning attitude that can be revealed in an interview which affect the farmers’ willingness to undertake environmental actions, these are listed in Table 2.3. In particular, taking a broad understanding of attitude is necessary. The link between attitude and behaviour or intended behaviour is much stronger when other determinants of behaviour, such as subjective norm and perceived behavioural control are incorporated in the analysis reflecting the importance of social norms and identity and perceived ability to participate. Questions about how the farmer thinks he/she will be affected by a change in management are important. As indicated above, questions were developed for the interview which allow exploration of the balance between ability and willingness to undertake environmental management and aim to understand the significance of attitude under different circumstances.
Table 2.3 Values, Beliefs, Attitudes (Willingness) • Direct attitudinal variables, (feelings and beliefs towards the environment); intrinsic
values and motivations • Indirect attitudinal variables (farming philosophies i.e. utilitarian, neutral or
conservationist) • Orientations: stewardship, technological beliefs or profit maximisation
25

• Openness to new ideas • Subjective norms or normative beliefs (the perceived social pressure to behave in an
environmentally friendly way) • Personal attitude or behavioural beliefs (the farmer’s evaluation of environmentally
friendly behaviour) • Perceived behavioural control or control beliefs (the extent to which AESs are perceived
as easy or difficult to adopt) • Belief in efficacy of their actions (level of confidence in conventional intensive farming
and in environmental actions)
Motivations
Motivations, reasons for undertaking environmental behaviour, are underpinned by values, beliefs and attitudes. Although extrinsic and intrinsic motivations can be distinguished often these combine and are not mutually exclusive. The interview aims to capture how these motivations interact by asking farmers the reasons why they are undertaking or not undertaking particular activities, referring to the key points outlined in Table 2.4. It is important to explore in depth the reasons behind financial motivations as these often relate to farm continuity rather than economic gain per se.
Table 2.4 Motivations for undertaking environmental management Extrinsic motivations • Financial incentives • Profit maximisation, • Security, long-term farm viability and/or risk minimisation, securing the family future
and its continuity • Capital investment • Community image, standing within the community, respect amongst peers, • Regulation (fear of penalty) • Recognition in wider society
Intrinsic motivations • Personal sense of environmental responsibility and accountability • Commitment and interest in the environment • More durable than extrinsic
The interview explores how household and structural factors, attitude and motivation change over time. Rather than capture just a snap shot of the farm, the questionnaire aims to understand the dynamic context of the farm.
Outcomes: Durable change and learning
With respect to bringing about durable changes in attitude, there is evidence that AES participation can instil awareness, learning and positive attitudes However, the reasons for participating in the first place are key, if motivations are extrinsic (responding to financial incentives) they are often less enduring than if motivations are intrinsic (seeking personal satisfaction). Perceived outcomes of environmental management are important in guiding behaviour, especially establishing a link between the action and its efficacy. Observed outcomes and experiences reported from scheme participants reveal that they can benefit both in terms of environmental knowledge but also with respect to their farming operation and business. Where respondents have participated in a scheme these aspects can be examined in the interview.
26

Most of these observations are from research undertaken in the context of more formalised voluntary actions (e.g. AES participation) where financial incentives are available. Arguably farmers’ positive attitudes would play a greater role in behaviour in less formal situations where there are no financial incentives. However, farmers do respond to other motivations such as the threat of regulation and the reactions and acceptance of their peer group and do need to consider the transaction costs of implementing a new practice.
2.8 References
Aarts, N., Woerkum, C.v., 1999. Communication and nature policies: the need for an integral approach to policy design, in: Leuwis, C. (Ed.), Innovation in agriculture and resource management. Mansholt Institute, Wageningen, pp. 33-49.
Agra CEAS Consulting, 2005. Socio-Economic Evaluation of Tir Gofal. Countryside Council for Wales and Welsh Assembly Government.
Ahnstrom, J., Hockert, J., Bergea, H.L., Francis, C.A., Skelton, P., Hallgren, L., 2008. Farmers and nature conservation: What is known about attitudes, context factors and actions affecting conservation? Renewable Agriculture and Food Systems 24, 38-47.
Ajzen, I., Fishbein, M., 1980. Understanding attitudes and predicting social behaviour. Prentice Hall, Englewood Cliffs,, New Jersey.
Aughney, T., Gormally, M., 2002. The nature conservation value of lowland farm habitats on REPS and non-REPS farms in County Galway and the use of traditional farm methods for habitat management under the Rural Environmental Protection Scheme (REPS). . Irish journal of agri-environmental research 2, 1-14.
Barr, S. 2004. Are we all environmentalists now? Rhetoric and reality in environmental action. Geoforum 35, 231-249.
Battershill, M.R.J., Gilg, A.W., 1997. Socio-economic constraints and environmentally friendly farming in the Southwest of England. Journal of Rural Studies 13, 213-228.
Beedell, J., Rehman, T., 2000. Using social-psychology models to understand farmers' conservation behaviour. Journal of Rural Studies 16, 117-127.
Beedell, J.D.C., Rehman, T., 1996. A meeting of minds for farmers and conservationists: some initial evidence of attitudes towards conservation from Bedfordshire. Farm Management 9, 305-313.
Berentsen, P.B.M., Hendriksen, A., Heijman, W.J.M., van Vlokhoven, H.A., 2007. Costs and benefits of on-farm nature conservation. Ecological Economics 62, 571-579.
Black, A.W., Reeve, I., 1992. Participation in landcare groups:the relative importance of attitudinal and situational factors. Journal of Environmental Management 39.
Bonnieux, F., Rainelli, P., Vermersch, D., 1998. Estimating the supply of environmental benefits by agriculture: a French case study. Environmental and Resource Economics 11, 135-153.
Brotherton, I., 1989. Farmer participation in voluntary land diversion schemes: some observation from theory. Journal of Rural Studies 5, 299-304.
Brotherton, I., 1991. The Cost Of Conservation - A Comparison Of Esa And Sssi Payment Rates. Environment And Planning A 23, 1183-1195.
Brouwer, F., Lowe, P., 1998. CAP and the Rural Environment in Transition: A Panorama of National Perspectives. Wageningen Pers, Wageningen.
27

Brouwer, F., van Berkum, S., 1997. CAP and Environment in the European Union: Analysis of the Effects of the CAP on the Environment and Assessment of Existing Environmental Conditions in Policy. Wageningen Pers, Wageningen.
Buller, H., Wilson, G.A., Holl, A., 2000. Agri-environmental policy in the European Union. Aldershot Ashgate
Burgess, J., Clark, J., Harrison, C.M., 2000. Knowledges in action: an actor network analysis of a wetland agri-environment scheme. Ecological Economics 35, 119-132.
Burton, R.J.F., 2004. Reconceptualising the behavioural approach in agricultural studies: a socio-psychological perspective. Journal of Rural Studies 20, 359-371.
Burton, R.J.F., Wilson, G.A., 2006. Injecting social psychology theory into conceptualisations of agricultural agency: Towards a post-productivist farmer self-identity? Journal of Rural Studies 22, 95-115.
Burton, R. J. F., Paragahawewa, U. H. Creating culturally sustainable agri-environmental schemes, Journal of Rural Studies 27, 95-104.
Butler, S.J., Vickery, J.A. & Norris, K. 2007. Farmland biodiversity and the footprint of agriculture. Science, 315, 381–384. Camboni, S.M., Napier, T.L., 1993. Factors affecting use of conservation farming practices in
east central Ohio. Agriculture, Ecosystems & Environment 45, 79-94.
Carr, S., Tait, J., 1991. Differences in the attitudes of farmers and conservationists and their implications. Journal of Environmental Management 32, 281-294.
Centre for Rural Economics Research and CJC Consulting, 2002. Economic Evaluation of Agri-Environment Schemes. Centre for Rural Economics Research and CJC Consulting, Oxford and Cambridge pp. 1-149.
Clark, H., 1989. Conservation advice and investment on farms: a study in three English counties. University of East Anglia.
Crabtree, J.R., Thorburn, A., Chalmers, N., Roberts, D., Wynn, G., Barron N., Barraclough, F., Macmillan. D., 1999. Socio-economic and Agricultural Impacts of the Environmentally Sensitive Areas Scheme in Scotland, Economics and Policy Series 6, Economics and Policy Series 6. Macaulay Institute, Aberdeen.
Dairy Development Centre - Farming Connect and the Welsh Assembly Government, 2008. Dairying and the Environment, pp. 1-53.
Darnhofer, I., Schneeberger, W., Freyer, B., 2005. Converting or not converting to organic farming in Austria:Farmer types and their rationale Agriculture and Human Values 22, 39-52.
Davies, B.B., Hodge, I.D., 2006. Farmers' Preferences for New Environmental Policy Instruments: Determining the Acceptability of Cross Compliance for Biodiversity Benefits. Journal of Agricultural Economics 57, 393-414.
Davies, B.B., Hodge, I.D., 2007. Exploring environmental perspectives in lowland agriculture: A Q methodology study in East Anglia, UK. Ecological Economics 61, 323-333.
Defra, 2008. Understanding Behaviours in a Farming Context: Bringing theoretical and applied evidence together from across Defra and highlighting policy relevance and implications for future research. Defra Agricultural Change and Environment Observatory Discussion Paper, October 2008 pp. 1-29.
Deffuant, G., 2001. Improving agri-environmental policies: a simulation approach to the cognitive properties of farmers and institutions. Final report of the FAIR3 CT 2092 project. .
28

Delvaux, L., Henry de Frahan, B., Dupraz, P., Vermersch, D., 1999. Adoption dメune MAE et consentement a` recevoir des agriculteurs en re´ gion wallone. Economie rurale 249, 71-81.
de Snoo, G.R., Herzon, I., Staats, H., Burtion, R.J.F., Schindler, S., van Dijk, J., Lokhorst, A.M., Bullock, J.M. Lobley, M., Wrbka, T., Schwarz, G., Musters, C.J.M. in press Towards effective nature conservation on farmland: making farmers matter, Conservation Letters,
De Young, R., 1993. Encouraging environmentally appropriate behaviour: the role of intrinsic motivation. Journal of Environmental Systems 15 15, 281-292.
Drake, L., ,, Bergström, P., Svedsäter, H., 1999. Farmers' attitude and uptake, in: Huylenbroeck, G.v., Whitby, M. (Eds.), Countryside stewardship: farmers, policies and markets. Elsevier Science, Oxford, pp. 89-111.
Dwyer, J., Mills, J., Ingram, J., Taylor, J., Burton, R., Blackstock, K., Slee, B., Brown, K., Schwarz, G., Matthews, K., Dilley, R., 2007. Understanding and influencing positive behaviour change in farmers and land managers. CCRI, Macaulay Institute,.
Erickson, D.L., Ryan, R.L., De Young, R., 2002. Woodlots in the rural landscape: landowner motivations and management attitudes in a Michigan (USA) case study. Landscape and Urban Planning 58, 101-112.
Ervin, C.A., Ervin, D.E., 1992. Factors affecting the use of soil conservation practices: hypotheses, evidence, and policy implications Land Economics 58, 276-292.
Evans, N., 2009. Adjustment strategies revisited: Agricultural change in the Welsh Marches. Journal of Rural Studies 25, 217-230.
Evans, N., Morris, C., and Winter, M., 2002, Conceptualizing agriculture: a critique of post-productivism as the new orthodoxy. Progress in Human Geography 26, 313-332.
Farmar-Bowers, Q., Lane, R., 2009. Understanding farmers' strategic decision-making processes and the implications for biodiversity conservation policy. Journal of Environmental Management 90, 1135-1144
Fish, R., Seymour, S., Watkins, C., 2003. Conserving English landscapes: land managers and agri-environmental policy. Environment And Planning A 35, 19-41.
Fishbein, M., Ajzen, I., 1975. Belief, Attitude, Intention, and Behaviour: An Introduction to Theory and Researc. Addison-Wesley, Reading, MA, USA.
Garrod, G., Garratt, J., Kennedy, A., Willis, K., 2007. A mixed methodology framework for the assessment of the Voluntary Initiative. Pest Manag Sci. 63, 57-70.
Gaskell, P., Dwyer, J., Jones, J., Jones, N., Boatman, N., Condliffe, I., Conyers, S., Ingram, J., Kirwan, J., Manley, W., Mills, J., Ramwell, C., 2010. Economic and environmental impacts of changes in support measures for the English Uplands: An in-depth forward look from the farmer’s perspective. Final report to the Defra Agricultural Change and Environment Observatory programme.
Gasson, R., 1973. Goals and values of farmers. Journal of Agricultural Economics 24, 521-542.
Gasson, R., 1974, Socico-economic status and orientation to work: the case of farmers: Sociologia Ruralis 14, 127-141.
Giovanopoulou, E., Nastis, S.A., and Papanagiotou, E., 2011, Modeling farmer participation in agri-environmental nitrate pollution reducing schemes: Ecological Economics, v. 70, p. 2175-2180.
29

Gorton, M., Douarin, E., Davidova, S., Latruffe, L, 2008. Attitudes to agricultural policy and farming futures in the context of the 2003 CAP reform: A comparison of farmers in selected established and new Member States. Journal of Rural Studies 24, 322-336.
Gould, W., Saupe, W.E., Klemme, R.M., 1989. Conservation tillage: the role of farm and operator characteristics and perception of soil erosion. Land Economics 65, 167-181.
Gray, J., 1996, Cultivating farm life on the borders: Scottish hill sheep farms and the European Community: Sociologia Ruralis 36, 27-50.
Gray, J., 1998, Family farms in the Scottish Borders: a practical definition by hill sheep farmers: Journal of Rural Studies 14, 341-356.
Gray, J., 2000, At home in the Hills: sense of place in the Scottish Borders: Oxford, Berghahn.
Haines-Young, R., McNally, S., 2001. Drivers of Countryside Change, Final Report. Centre for. Ecology and Hydrology, Huntingdon.
Herzon, I., Mikk, M., 2007. Farmers' perceptions of biodiversity and their willingness to enhance it through agri-environment schemes: A comparative study from Estonia and Finland. Journal for Nature Conservation 15, 10-25.
Hodge, I.D., Reader, M., 2007. Maximising the Provision of public goods from future agri-environment schemes. University of Cambridge, Department of Land Economy, Cambridge pp. 1-225.
Hogg, M., Vaughan, G., 2005. Social Psychology, London: Prentice-Hall.
Ilbery, B., Bowler, I., 1993. The farm diversification grant scheme: adoption and non-adoption in England and Wales. Environment and Planning C:Government and Policy 11, 161-170.
Ilbery, B.W., 1978. Agricultural decision-making: a behavioural perspective. Progress in Human Geography 2, 448-466.
Ingram, J., Short, C., Gaskell, P., Mills, J., Lewis, N., Clark, M., Dennis, E., Fisher, R., Owen, I, 2009. Entry and exit from agri-environmental schemes in Wales. Final report. Report for Welsh Assembly Government.
Jacobson, S.K., Sieving, K.E., Jones, G.A., Van Doorn, A., 2003. Assessment of farmer attitudes and behavioral intentions toward bird conservation on organic and conventional Florida farms. Conservation Biology 17, 595-606.
Juntti, M., Potter, C., 2002. Interpreting and reinterpreting agri-environmental policy: communication, trust and knowledge in the implementation process. Sociologia Ruralis 42, 215-232.
Kabii, T., Horwitz, P., 2006. A review of landholder motivations and determinants for participation in conservation covenanting programmes. Environmental Conservation 33, 11-20.
Lawrence, A., Dandy, N., Urquhart, J., 2010. Landowners’ attitudes to woodland creation and management in the UK, Forest Research, Alice Holt, Farnham.
Lichtenb erg, E., Zimmerman, R., 1999. Information and farmers attitudes about pesticides, water quality and related environmental effects. Agriculture. Agriculture, Ecosystems and Environment 73, 227-236.
Lobley, M., Errington, McGeorge, A., Millard, N., Potter, C., 2002. Implications of Changes in the Structure of Agricultural Businesses: Final Report. DEFRA.
30

Lobley, M., Potter, C., 1998. Environmental stewardship in UK agriculture: A comparison of the Environmentally Sensitive Area programme and the Countryside Stewardship Scheme in South East England. Geoforum 29, 413-432.
Lovejoy, S.B., Napier, T.L., 1986. Conserving Soil: Insights from Socioeconomic Research. Soil and Water Conservation Society Press, Ankeny, IA.
Macdonald, D.W., Johnson, P.J., 2000. Farmers and the custody of the countryside: trends in loss and conservation of non-productive habitats 1981-1998. Biological Conservation 94, 221-234.
Macgregor, C.J., Warren, C.R., 2006. Adopting sustainable farm management practices within a nitrate vulnerable zone in Scotland: the view from the farm. Agriculture, Ecosystems & Environment 113, 108-119.
Manley, W., Smith, G., 2007. Agri-Environment Schemes in Scotland: A Survey of Participants and Non-Participants. Royal Agricultural College, pp. 1-59.
Marsden, T., Munton, R., Whatmore, S., Little, J., 1989. Strategies for coping in capitalist agriculture: an examination of responses of farm families in British agriculture. Geoforum 20, 1-14.
Mccann, E., Sullivan, S., Erickson, D., De Young, R., 1997. Environmental Awareness, Economic Orientation, and Farming Practices: A Comparison of Organic and Conventional Farmers Journal of Environmental Management 21, 747-758.
McDowell, C., Sparks, R., 1989. Multivariate modelling and prediction of farmers' conservation behaviour towards natural ecosystems. Journal of Environmental Management 28, 185-210.
McEachern, C., 1992. Farmers and conservation: conflict and accommodation in farming politics. Journal of Rural Studies 8, 159-171.
McHenry, H., 1997. Wild flowers in the wrong field are weeds: Examining farmers' constructions of conservation. Environment and Planning A 30, 1039-1053.
McHenry, H., 1998. Wild flowers in the wrong fields are weeds! Examining farmers constructions of conservation. Environment and Planning A 30, 1039-1053.
Miller, D.R.S., G.; Sutherland, L.A.; Morrice, J.G.; Aspinall, R.J.; Barnes, A.; Blackstock, K.L.; Buchan, K.; Donnelly, D.; Hawes, C.; McCrum, G.; Matthews, K.; Miller, D.; Renwick, A.; Smith, M.; Squire, G.;Toma, L.,, 2009. Rural land use study 1: Drivers and decision-making.Research Findings No.8. RERAD, Scottish Government, November 2009
Mills, J., 2012. Exploring the social benefits of agri-environment schemes in England. Journal of Rural Studies 28 (4) p. 612-621.
Morris, C., Potter, C., 1995. Recruiting the new conservationists: Farmers' adoption of agri-environmental schemes in the U.K. Journal of Rural Studies 11, 51-63.
Morris, J., Mills, J., Crawford, I.M., 2000. Promoting farmer uptake of agri-environment schemes: the Countryside Stewardship Arable Options Scheme. Land Use Policy 17, 241-254.
Napier, T.L., Thraen, C.S., Camboni, S.M., 1988. Willingness of land operators to participate in government-sponsored soil erosion control programs. Journal of Rural Studies 4, 339-347.
Newby, H., 1980, Green and Pleasant Land? Social Change in Rural England: Harmondsworth, Penguin.
Newby, H., Bell, C., Sanders, P., Rose, D., 1977. Farmers' attitudes to conservation. Countryside Recreation Rev 2.
31

OECD, 1998. Co-operative approaches to sustainable agriculture. OECD, Paris.
Oreszczyn, S., Lane, A., Carr, S., 2010. The role of networks of practice and webs of influencers on farmers’ engagement with and learning about agricultural innovations. Journal of Rural Studies 26, 404 -417.
Posthumus, H., Morris, J., 2006 CAP-reform and controlling water runoff from farmland in England and Wales. . COST 634 conference 1-3 October 2006 Wageningen, the Netherlands.
Potter, C., 1998. Conserving nature: agri-environmental policy and change., in: Ilbery, B.W. (Ed.), The Geography of Rural Change. Addison Wesley Longman, Harlow, pp. 85-105.
Potter, C., Gasson, R., 1988. Farmer participation in voluntary land diversion schemes: some predictions from a survey. Journal of Rural Studies 4, 365-375.
Potter, C., Lobley, M., 1992. The conservation status and potential of elderly farmers: results from a survey in England and Wales. Journal of Rural Studies 8, 133-143.
Potter, C., Lobley, M., 1996. The Farm Family Life Cycle, Succession Paths and Environmental Change in Britain's Countryside. Journal of Agricultural Economics 47, 172-190.
Pretty, J., Smith, D., 2004. Social Capital in Biodiversity Conservation and Management. Conservation Biology 18, 631-638.
Reading University, 2006. Research to Understand and Model the Behaviour and Motivations of Farmers in Responding to Policy changes (England) Reading University Reading
Riley, M., 2006. Reconsidering conceptualisations of farm conservation activity: The case of conserving hay meadows. Journal of Rural Studies 22.
Riley, M., 2008. Experts in their fields: farmer - expert knowledges and environmentally friendly farming practices. Environment and Planning A 40, 1277-1293.
Roberts, R., Hollander, G., 1997. Sustainable technologies, sustainable farms: farms, households and structural change, in: Ilbery, B., Chiotti, Q., Rickard, T. (Eds.), Agricultural Restructuring and Sustainability: A Geographical Perspective. CAB International, Wallingford, pp. 55-57.
Rogers, E.M., 1995. Diffusion of Innovations, 4th ed. Free Press, New York.
Rokeach, M., 1973. The Nature of Human Values. Free Press, New York.
Ryan, R., Erickson, D., De Young, R., 2003. Farmers' Motivations for Adopting Conservation Practices along Riparian Zones in a Mid-western Agricultural Watershed Journal of Environmental Planning and Management 46, 19-37.
Schneider, F., Ledermann, T., Fry, P., and Rist, S., 2010. Soil conservation in Swiss agriculture - Approaching abstract and symbolic meanings in farmers' life-worlds, Land Use Policy, 27, 332-339.
Schoon, B., Grotenhuis, R., 2000. Values of Farmers, Sustainability and Agricultural Policy Journal of Agricultural and Environmental Ethics 12, 17-27.
Schramek, J., Biehl, D., Buller, H., Wilson, G.A., eds 1999a. Implementation and effectiveness of agri-environmental schemes established under Regulation 2078/92. Volume 1. Main Report Institut für ländliche Strukturforschung, Frankfurt/Main.
Schramek, J., Biehl, D., Buller, H., Wilson, G.A., eds 1999b. Implementation and effectiveness of agri-environmental schemes established under Regulation 2078/92. Volume 2. Annexes Institut für ländliche Strukturforschung, Frankfurt/Main.
32

Siebert, R., Toogood, M., Knierim, A., 2006. Factors Affecting European Farmers' Participation in Biodiversity Policies. Sociologia Ruralis 46, 318-340.
Skerratt, S.J., 1994. Itemized payment systems within a scheme—the case of Breadalbane, in: Whitby, M. (Ed.), Incentives for Countryside Management: The Case of Environmentally Sensitive Areas CAB International, Wallingford, pp. 105-134.
Sligo, F.X., Massey, C.,, 2007. Risk, trust and knowledge networks in farmers’ learning. . Journal of Rural Studies 23, 170-182.
Smithers, J., Furman, M., 2003. Environmental farm planning in Ontario: exploring participation and the endurance of change. Land Use Policy 20, 343-356.
Sobels, J., Curtis, A., Lockie, S., 2001. The role of Landcare group networks in rural Australia: exploring the contribution of social capital. Journal of Rural Studies 17, 265-276.
Sutherland, L., Barnes, A., McCrum, G., Blackstock, K., Toma, L., 2011. Towards a cross-sectoral analysis of land use decision-making in Scotland. Landscape and Urban Planning 100, 1-10.
Trout, S.K., Francis, C.A., Barbuto, J.J., 2005. Impacts of the North-Central Region SARE grants, 1988-2002. Journal of Sustainable Agriculture 27:, 117-137.
van Woerkum, C., 2000. Interactive Policy-Making : The Principles
Journal of Agricultural Education and Extension 6, 199 - 212.
Vanclay, F., Lawrence, G., 1994. Farmer rationality and the adoption of environmentally sound practices: a critique of the assumptions of traditional agricultural extension. Journal of Agricultural Education and Extension 1, 16.
Vanslembrouck, I., van Huylenbroeck, G., Verbeke, W., 2002. Determinants of the willingness of Belgian farmers to participate in agri-environmental measures. Journal of Agricultural Economics 53, 489-511.
Vinning, J., Linn, N., Burge, R.J., 1992. Why recycle? A comparison of recycling motivations in four communities. Environmental Management 16, 785–797.
Vissera, M., Morana,J., Regana, E., Gormallya, M., Skeffington M., 2007. The Irish agri-environment: How turlough users and non-users view converging EU agendas of Natura 2000 and CAP. Land Use Policy 24 24.
Vogel, S., 1996. Farmers' Environmental Attitudes and Behaviour A Case Study for Austria Environment and Behaviour 28, 591-613.
Ward, N., Clark, J., Lowe, P., Seymour, S., 1998. Keeping matters in its place: pollution regulation and the reconfiguration of farmers and farming. Environment and Planning A 30, 1165-1178.
Ward, N., Lowe, P., 1994. Shifting values in agriculture: the farm family and pollution regulation1. Journal of Rural Studies 10, 173-184.
Welsh Audit Office, 2007. Tir Gofal. National Assembly for Wales pp. 1-67.
Whitby, M., 1994. Incentives for Countryside Management:The Case of Environmentally Sensitive Areas. CAB International, Wallingford.
Willock, J., Deary, I.J., Edwards-Jones, G., Gibson, G.J., McGregor, M.J., Sutherland, A., Dent, J.B., Morgan, O., Grieve, R., 1999. The role of attitudes and objectives in farmer decision making: Business and environmentally-oriented behaviour in Scotland. Journal Of Agricultural Economics 50, 286-303.
Wilson, G.A., 1992. A survey on attitudes of landholders to native forest on farmland. Journal of Environmental Management 34, 117-136.
33

Wilson, G.A., 1994. German agri-environmental schemes - 1. A preliminary review. Journal of Rural Studies 10, 27-45.
Wilson, G.A., 1996. Farmer environmental attitudes and ESA participation. Geoforum 27, 115-131.
Wilson, G.A., 1997a. Factors Influencing Farmer Participation in the Environmentally Sensitive Areas Scheme. Journal of Environmental Management, 67-93.
Wilson, G.A., Hart, K., 2000. Financial imperative or conservation concern? EU farmers' motivations for participation in voluntary agri-environmental schemes. Environment and Planning A 32, 2161- 2185.
Wilson, G.A., Hart, K., 2001. Farmer Participation in Agri-Environmental Schemes: Towards Conservation-Oriented Thinking? Sociologia Ruralis 41, 254-274.
Winter, M., Gaskell, P., 1998. The Agenda 2000 debate and CAP reform in Great Britain: is the environment being sidelined? Land Use Policy 15, 217-231.
Wynn, G., Crabtree, B., Potts, J., 2001. Modelling Farmer Entry into the Environmentally Sensitive Area Schemes in Scotland. Journal of Agricultural Economics 52, 65-82.
34
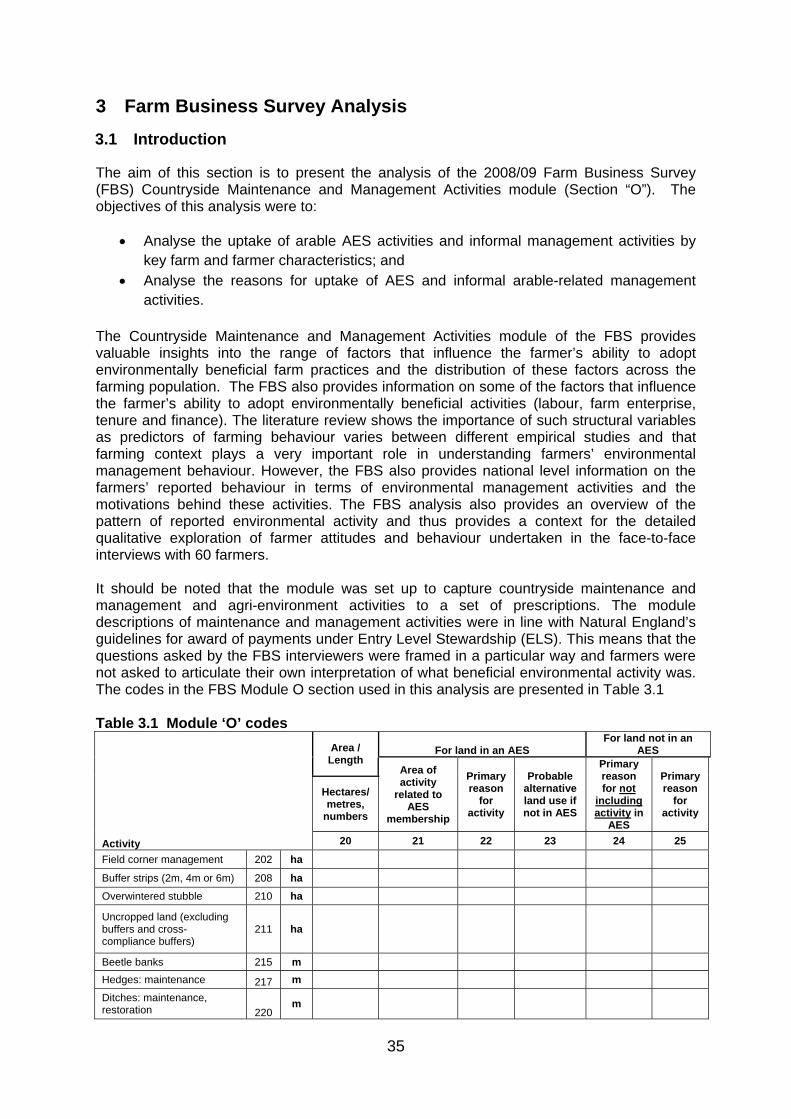
3 Farm Business Survey Analysis 3.1 Introduction
The aim of this section is to present the analysis of the 2008/09 Farm Business Survey (FBS) Countryside Maintenance and Management Activities module (Section “O”). The objectives of this analysis were to:
• Analyse the uptake of arable AES activities and informal management activities by key farm and farmer characteristics; and
• Analyse the reasons for uptake of AES and informal arable-related management activities.
The Countryside Maintenance and Management Activities module of the FBS provides valuable insights into the range of factors that influence the farmer’s ability to adopt environmentally beneficial farm practices and the distribution of these factors across the farming population. The FBS also provides information on some of the factors that influence the farmer’s ability to adopt environmentally beneficial activities (labour, farm enterprise, tenure and finance). The literature review shows the importance of such structural variables as predictors of farming behaviour varies between different empirical studies and that farming context plays a very important role in understanding farmers’ environmental management behaviour. However, the FBS also provides national level information on the farmers’ reported behaviour in terms of environmental management activities and the motivations behind these activities. The FBS analysis also provides an overview of the pattern of reported environmental activity and thus provides a context for the detailed qualitative exploration of farmer attitudes and behaviour undertaken in the face-to-face interviews with 60 farmers. It should be noted that the module was set up to capture countryside maintenance and management and agri-environment activities to a set of prescriptions. The module descriptions of maintenance and management activities were in line with Natural England’s guidelines for award of payments under Entry Level Stewardship (ELS). This means that the questions asked by the FBS interviewers were framed in a particular way and farmers were not asked to articulate their own interpretation of what beneficial environmental activity was. The codes in the FBS Module O section used in this analysis are presented in Table 3.1 Table 3.1 Module ‘O’ codes Area /
Length For land in an AES
For land not in an AES
Area of activity
related to AES
membership
Primary reason
for activity
Probable alternative land use if not in AES
Primary reason for not
including activity in
AES
Primary reason
for activity
Hectares/ metres,
numbers
Activity 20 21 22 23 24 25
Field corner management 202 ha Buffer strips (2m, 4m or 6m) 208 ha Overwintered stubble 210 ha Uncropped land (excluding buffers and cross-compliance buffers)
211 ha
Beetle banks 215 m Hedges: maintenance 217 m Ditches: maintenance, restoration 220
m
35

3.2 The FBS sample
The main FBS survey is based on a sample of 1,875 farm businesses, carefully balanced so as to represent all the farm businesses in England with a minimum Standard Labour Requirement (SLR) of 0.5 units. The following analyses are based on a subset of the main sample, including around 1,345 FBS farm businesses that responded to the section on countryside maintenance and management and the results have been re-weighted to take account of non-responses, so as to represent the overall FBS target population9. 95% confidence intervals are shown as error bars around the percentages presented in the figures. These identify the range of values that may apply to the figures. They mean that we can be 95% confident that the true value lies within this range either side of the estimate. They are based on the Standard Errors (SE) multiplied by 1.96 to give the 95% confidence interval (95% CI). The standard errors only give an indication of the sampling error. They do not reflect any other sources of survey errors, such as non-response bias and interviewer errors. The countryside maintenance and management module of the FBS questioned farmers about 27 types of environmental activity, but the analyses presented here focus on 7 activities that relate specifically to arable production and had a sufficient number of responses to conduct significance tests. These environmental activities were:
• Field corner management • Wild bird /pollen and nectar mixture • Buffer strips • Overwintered stubble • Uncropped land • Hedges: maintenance • Ditches: maintenance, restoration
The FBS provides two measures of the level of activity taking place. First, it quantifies the number of activities and second, it quantifies the length/area of each activity. Both measures are used in our analysis. The main farm and farmer characteristics selected for analysis were:
• Farm size • SLR group • Farm type • Tenure type • Farm business income • Farmer age • Farmer segment
The environment management groupings used in the analysis refer to all respondents within the FBS module O who have undertaken some form of environmental management activity. It excludes anyone not undertaking any environmental activities. The definitions of the management groupings used in the analysis are given below: • AES only – those respondents whose environmental management activities listed above
were recorded as only occurring within an AES. This relates to column 21 of the module O data (Table 3.1 - Area/length of activity related to AES membership).
99 A description of the weighting procedure is provided in Appendix1
36

• Informal only – those respondents whose environmental management activities only occurred outside AES. This is calculated by subtracting column 21 from column 20 (Table 3.1 - Total area/length of environmental activity)
• AES & Informal – those respondents whose environmental management activities included activities occurring both within and AES and those outside and AES.
3.3 Respondent Characteristics
This section analyses the uptake of AES activities and informal management activities by the key farm and farmer characteristics which may influence farmer’s ability to adopt environmentally beneficial farm practices. Here we analyse the influence of these factors on farmer’s formal and informal environmental management activity. Figure 3.1 provides a breakdown of the number of respondents that are undertaking their environmental management activities. Four out of five farmers (79%) were members of an AES, while two thirds (66%) undertook environmental management activities on an informal basis. This shows the participation in AES and informal environmental management activity is widespread at a national level. The most common category was to undertake environmental management activity both as part of an AES and informally (45%). It was less common for farmers to undertake environmental management activities exclusively as part of an AES (34%) or informally (21%). Figure 3.1 Percentage of farms by environmental management activity
AES only34%
Informal only21%
AES & Informal45%
In Figure 3.2 the data were analysed by the number of arable environmental management activities undertaken either within an AES or informally. This shows that just under three quarters (72%) of the environmental management activity takes place within an AES and only 28% informally. In contrast to the participation rates shown in Figure 3.2, it is clear that the majority of environmental management activities take place within an AES.
37

Figure 3.2 Percentage of environment activity undertaken within an AES or informally
AES only72%
Informal only28%
AES only
Informal only
Overall, we can conclude that participation in AES and informal environmental management activity is widespread in terms of the level of activity taking place with roughly two thirds to three quarters is undertaken within an AES and a quarter to a third is undertaken informally (i.e. outside an AES).
3.3.1 Farm size - Standard Labour Requirements
Farm business size in the United Kingdom is measured in Standard Labour Requirements (SLR) expressed in terms of full-time equivalents. Five size groups are defined for this report: • Part-time (greater than 0.5 FTE and less than 1.0) • Small (greater than or equal to 1 less than 2) • Medium (greater than or equal to 2 less than 3) • Large (greater than or equal to 3 less than 5) • Very large (greater than or equal to 5 FTE) Figure 3.3 Environmental management activities by SLR and management grouping
0
10
20
30
40
50
60
70
80
90
100
Part‐time Small Medium Large Very large Total
% of farms
SLR type
AES
Informal
AES & Informal
38

Using SLR, the analysis revealed that farms combining both AES and informal environmental management activity constituted the most frequent management category across all farm sizes. Those working part-time (28% (±5%)) were more likely to be undertaking their environmental activities solely on an informal basis compared to those with large SLRs (13% (±3%)). Conversely, those with large SLRs were more likely to undertake their environmental management activities solely within an AES (42% (±4%)) compared to part-time SLRs (30% (±5%)) (Figure 3.3).
3.3.2 Farm type
Figure 3.4 shows that there were some notable differences between farm types. A high proportion of environmental activity on pig, general cropping and cereal farms is undertaken exclusively through AES (49% (±19%)), (43% (± 7%)) and 40% (±6%)), respectively. There is also a significantly lower proportion of informal only activities on cereal farms compared to AES activities (16% compared to 40%). Conversely, a high proportion of environmental management activity on horticultural and pig and poultry farms is undertaken informally (59% (±16%)), and 58% (±10%)), although the high confidence intervals for these farm types means that these numbers should be treated with caution. It would appear that on farm types where AES options are limited e.g. horticulture, poultry and dairy farms there is likely to be a greater proportion of informal environmental management activities. Figure 3.4 Environmental management activities by farm type and management grouping
0
10
20
30
40
50
60
70
80
90
100
% of farms
Farm type
AES
Informal
AES & Informal
3.3.3 Tenure
Analysis of the presence of environmental management activities by farm tenure revealed that farms combining both AES and informal environmental management activity constituted the most frequent management category across all tenure categories. Owner occupiers were more likely to undertake environmental activities solely on an informal basis (25% (±3%))
39

compared to tenants (11% (±3%)) and conversely, tenants were more likely to undertake these activities solely within an AES (42% (±5%)), compared to owner occupiers (33% (±3%)) and mixed farms (33% (±3%)) (Figure 3.5). Figure 3.5 Environmental management activities by tenure and management grouping
0
10
20
30
40
50
60
70
80
90
100
Owner‐occupied Tenanted Mixed Total
% of farms
Tenure
AES
Informal
AES & Informal
3.3.4 Farm business income
Data on farm business income was divided into quartiles to provide four farm business income bands. Looking at presence of those undertaking environmental management activities by farm business income, reveals that those with a farm business income of more than £71,600 were less likely to undertake environmental management activities solely on an informal basis (9% (±2%)) compared to those of the lower income groups (27% (±4%)) (Figure 3.6). Figure 3.6 Environmental management activities by farm business income and management grouping
0102030405060708090
100
% of farms
Farm business income
AES
Informal
AES & Informal
40

3.3.5 Farmer Age
Analysis was undertaken to identify whether the age of the decision maker or nominal head of the farm had an impact on farmer’s engagement with AES or informal environmental management activities. As Figure 3.7 shows, the 44-55 years of age group were the least likely to undertake environmental management activity informally, although there was little significant different between the age bands. Figure 3.7 Environmental management activities by farmer age and management grouping
0
10
20
30
40
50
60
70
80
90
100
< 44 45 ‐ 55 56 ‐ 65 66+ Total
% of farms
Farmer age
AES
Informal
AES &Informal
3.3.6 Farmer segments
Analysis by farmer segments revealed that there was little significant difference, with the exception of the challenged enterprises where those who undertook environmental management activities were least likely to be doing this within an AES (14% (±12%)), although the high confidence levels for this group mean these figures have to be treated with caution . This supports our understanding of this segment of the farming population where farming is a burden and they are often more isolated without a successor and perhaps the least likely to commit to an AES (Figure 3.8). In contrast, the modern family business is most likely to undertake their environmental management activities within an AES, rather than informally, 41% (±6%) compared to 13% (±4%). This segment tends to be more focused on business planning, financial management and growth and profit opportunities than the other segments.
41

Figure 3.8 Environmental management activities by farmer segment and management grouping
0
10
20
30
40
50
60
70
80
90
100
Custodians Lifestyle Pragmatists Modern family business
Challenged enterprises
Total
% of farms
Farmer segments
AES
Informal
AES & Informal
Finally, Table 3.9 identifies the percentage of farms undertaking a given number of arable environmental activities. Those farms that are undertaking just one arable environmental activity are most likely to be undertaking this informally. In contrast, those with a higher number of activities on their farm are likely to be undertaking these within an AES or a combination of AES and informally. Figure 3.9 Number of environmental activities per farm and management grouping
0
10
20
30
40
50
60
70
80
90
100
1 2 3 4 5 6 7 Total
% of farms
No. of activities/farm
AES only
Informal only
AES & Informal
To summarise (Table 3.2), it would appear that the key characteristics of those farms undertaking arable environmental management activities informally, rather than within an AES are: small farms where the SLRs are part-time; the farm business incomes are low (less than £12,300); where the farmer is in the oldest age group; and those which fall within
42

the challenged enterprise segment. In contrast, the key characteristics of farms which are most likely to undertake their environmental management activities within AES are: large farms; with high incomes over £71,600; within the 56-65 age category; and part of the modern family business segment. There also appears to be some tenure effect, with the owner-occupiers more likely to undertake environmental activities informally, whilst those who are tenants are more likely to undertake these activities within a scheme. Table 3.2 Summary of farm and farmer characteristics by environmental management activities AES Informal Farm type General cropping Horticulture SLR Large Part-time Tenure Tenanted Owner-occupied Farm business income >£71,600 <£12,300 Farmer age 56-65 66+ Farmer segment Modern family businesses Challenge enterprises
3.4 Environmental features undertaken compared by management grouping
Figure 3.10 shows that when comparing the area or length of different arable environmental activities, a higher proportion of uncropped land is undertaken informally, than in an AES. A greater proportion of the other activities are more likely to be undertaken within an AES, particularly field corners, buffers strips and wild bird/pollen and nectar mixes. Figure 3.10 Environmental features undertaken by management grouping
0
10
20
30
40
50
60
70
80
90
100
%
Environmental management activity
AES
Informal
3.4.1 Uncropped areas
Uncropped land appears to be an anomaly in that a greater proportion of this feature is managed informally rather than within an AES, compared to the other features. This may represent areas of former set-aside land that have not been brought back into production
43

once the set-aside scheme finished. As this feature stands out from the others, it is interesting to look at the farm and farmer characteristics of those managing uncropped land both within an AES and informally (Figure 3.11). Analysis of the presence of uncropped land by farm type reveals that a high proportion of uncropped land on dairy farms occurs within an AES (78% (±9%)). The converse is true of horticultural farmers where the majority of the uncropped land is managed informally. Figure 3.11 Proportion of farms with uncropped land by farm type and management grouping
0102030405060708090
100
Dairy Cereals General cropping
Mixed Horticulture
% of farms
Farm type
AES
Informal
Figure 3.12 shows that a high proportion of informally managed uncropped land occurs on farms with part-time or small SLRs. Figure 3.12 Proportion of farms with uncropped land by SLR type and management grouping
0
10
20
30
40
50
60
70
80
90
100
Part‐time Small Medium Large Very large
% of farms
SLR type
AES
Informal
44

Looking at the proportion of farms with uncropped land by tenure (Fig. 3.13), informally managed uncropped land is most likely to occur on owner-occupied or mixed farms, whereas uncropped land managed within an AES is more likely to occur on tenanted farms. Figure 3.13 Proportion of farms with uncropped land by tenure and management grouping
0
10
20
30
40
50
60
70
80
90
100
Owner‐occupied Tenanted Mixed
% of farms
Tenure
AES
Informal
As Figure 3.14 shows informally managed uncropped land is most likely to occur on farms with low farm business incomes, whilst conversely most uncropped land managed within an AES occurs on farms with the highest income. Figure 3.14 Proportion of farms with uncropped land by farm business income and management grouping
0102030405060708090100
<£12,300 £12,300‐£32,300 £32,300‐£71,600 >£71,600
% of farms
Farm business income
AES
Informal
There is no clear pattern of the management of uncropped land by farmer age (Figure 3.15). At the lower end of the age bracket, uncropped land is more likely to be managed within an AES and at the upper end, it is most likely to be managed informally. This is in contrast to Figure 3.7 where within the 56-65 age band environmental activities were most likely to be undertaken within an AES.
45

Figure 3.15 Proportion of farms with uncropped land area by farmer age and management grouping
0
10
20
30
40
50
60
70
80
90
100
<44 45 ‐ 55 56 ‐ 65 66 + Total
% of farms
Farmer age
AES
Informal
Overall, it would appear that those who are more likely to manage uncropped land informally are the small to medium sized farms, with part-time or small SLR. As well as those that are at the lower end of the farm business income spectrum, of owner-occupied or mixed tenure status and are older.
3.5 Reasons for undertaking environmental management activities
The Farm Business Survey asks respondents for the primary reason for undertaking particular environmental activities. These responses were grouped into 5 main reasons as presented in Table 3.3. Table 3.3 Grouping of reasons for undertaking environmental management activities General group FBS Questionnaire reason Financial 2 Maintain capital value of farm/appearance of farm
5 Contributes to overall business e.g. shooting, open farm 6 Financial benefits of scheme membership 7 Other Financial reasons
Environmental 1 Safeguarding environmental features for future generations 3 Interest in agri-environment management 4 Good for long term sustainability of the farm
Agronomic 11 Ground conditions/Wet Autumn 13 Stock keeping 14 Part of rotation 15 Provides a natural means of controlling pests
Outside farmers control 8 Cross compliance 9 Feature has always been there 10 Landlord/owner likes it/condition of tenancy agreement 12 Legal Requirement
Other 16 Other
46

These responses were analysed looking at the reasons for mainly arable activities being undertaken within AES and outside of schemes (Figure 3.16). Figure 3.16 Primary reasons for undertaking activities under AES
0 20 40 60 80 100
Field corner management
Wild bird /pollen and nectar mixture
Buffer strips
Overwintered stubble
Uncropped land
Hedges: maintenance
Ditches: maintenance, restoration
% of responses
Financial
Environmental
Agronomic
Outside farmers control
Other reasons
Unsurprisingly, respondents were most likely to undertake all arable environmental activities within AES for financial reasons. Those who were managing wild bird / pollen and nectar seed mixes were more likely to cite environmental reasons for doing this compared to the other activities. Activities more likely to be undertaken for agronomic reasons were over winter stubble and uncropped land. Activities more likely to be undertaken for reasons outside of farmers control were ditch management and buffer strips. This is likely to relate to cross-compliance requirements and requirements for Local Risk Assessment for Pesticides regulations (LERAPs) and ditch maintenance. Figure 3.17 Primary reasons for undertaking informal environmental activities
0 20 40 60 80 100
Field corner management
Wild bird /pollen and nectar mixture
Buffer strips
Overwintered stubble
Uncropped land
Hedges: maintenance
Ditches: maintenance, restoration
Financial
Environmental
Agronomic
Outside farmers control
Other reasons
47

The reasons for undertaking environmental activities informally (Figure 3.17) are more diverse compared to those activities undertaken within AES. A striking difference in the responses in Figure 3.17 is the extent to which agronomic and environmental reasons are of greater importance. The agronomic reasons are particularly important for informally managed overwintered stubbles and uncropped land. Environmental reasons were given in particular for undertaking field corner management, wild bird / pollen and nectar seed mixes and buffer strips informally. Also of interest are the financial reasons for undertaking some environmental activities informally. This reason was particularly important for informally managed wild bird / pollen nectar mixture which is likely to relate to management for commercial game shoots and for ditch management which is likely to be associated with drainage maintenance. Figure 3.18 shows the primary reasons for not including a mainly arable environmental management activity in AES. The responses were grouped into 5 main reasons as presented in Table 3.3 Table 3.4 Reasons for not including activity in AES General group FBS Questionnaire reason
Disengaged 2 Not wanting to commit to time constraints /requirement for length of scheme
9 Unaware that able to enter scheme 13 Not interested Engaged 3 ELS points already met 8 Application pending Too burdensome 4 No economic benefit/not cost effective 5 Schemes are too bureaucratic 6 Insufficient time Outside farmers control 1 Not eligible (unable to accumulate sufficient points) 7 Other statutory prescriptions (e.g. designated SSSI) 10 Landlord refused to co-sign agreement 11 Holding or area too small to bother Other 12 Other
As Figure 3.18 shows, a common response for not including an activity in AES was that either their ELS points had already been met or their application was pending. This was particularly the case for overwintered stubbles (56%). A large proportion of the reasons for those not entering their field corner management (31%) or hedge maintenance (29%) into AES was not wanting to commit to the time constraints/requirements for length of scheme. Of all the activities, the uncropped land was considered the most burdensome (34%), the main reason given was that there was no economic benefit/not cost effective.
48

Figure 3.18 Primary reasons for not including activity in AES by environmental activity
0% 20% 40% 60% 80% 100%
Field corner management
Wild bird /pollen and nectar …
Buffer strips
Overwintered stubble
Uncropped land
Hedges: maintenance
Ditches: maintenance, restoration
% of responses
Disengaged
Engaged
Too burdensome
Outside farmers control
Other reason
In summary, the analysis of the FBS Module ‘O’ section reveals that: • Overall, participation in informal environmental activities is widespread with around two
thirds (66%) of farmers undertaking some form of environmental management activity on an informal basis. In addition, around four out of five farmers (79%) farmers are members of an AES. The most common category was to undertake environmental management activity both as part of an AES and informally (45%)
• Roughly two thirds to three quarters of the actual environmental activity related to arable
farms is undertaken within an AES, whilst a quarter to a third is undertaken informally (i.e. outside an AES).
• Those farms that are most likely to manage their environmental activities informally
(outside of an AES) are the small size farms, where the SLRs are part-time, the farm business incomes are low (less than £12,300), the farms are tenanted and which fall within the Challenged Enterprise segment.
• Those farms that are most likely to undertake their environmental management activities
within AES are the large farms which are owner occupied, with farm business incomes over £71,600, within an older age category and part of the Modern Family Business segment.
• Those farms that are undertaking just one arable environmental activity are most likely
to be undertaking this informally. In contrast, those with a higher number of activities on their farm are likely to be undertaking these within an AES or a combination of AES and informally.
• When comparing the area or length of different arable environmental activities, a higher
proportion of uncropped land is undertaken informally, than in an AES. A greater proportion of the other activities are more likely to be undertaken within an AES, particularly field corners, buffers strips and wild bird/pollen and nectar mixes.
49

• Those farms that are more likely to manage their uncropped land informally are the small to medium sized farms, with part-time or small SLR, that are at the lower end of the farm business income spectrum, are of owner-occupied or mixed tenure status, are in the older age group and are Custodians or Pragmatists.
• The primary reason given for undertaking environmental activities under AES were
financial. Those who were managing wild bird / pollen and nectar seed mixes were more likely to cite environmental reasons for doing this, whilst activities undertaken for agronomic reasons were stubble and uncropped land and undertaken for reasons outside of farmers control were ditch management and buffer strips.
• With informally managed activities, agronomic reasons were particularly important for
undertaking informally managed overwintered stubbles and uncropped land. Environmental reasons were given in particular for undertaking field corner management, wild bird / pollen and nectar seed mixes and buffer strips informally. Financial reasons were cited for undertaking ditch management activities informally which would relate to drainage issues and also wild bird/pollen and nectar mixes which is likely to be connected to running commercial game shoots
50
4 Telephone interviews with expert advisors 4.1 Introduction
This section of the report presents the results of 10 telephone interviews with a range of expert advisors (who between them had well over 150 years collective expertise of environmental advisory work). Average interview duration was 50 minutes, ranging from 30- 90 minutes. The aim of these telephone interviews was to draw out the advisors’ views on farmers’ attitudes to environmental management; the importance of different external and internal drivers affecting farmer behaviour and to look for evidence of wider impacts. The analysis is structured around a number of key themes that emerged from the interviews.
4.2 Environmental awareness (if not actual management) is becoming mainstreamed
The mainstreaming of environmental awareness was a common theme and often contrasted to the resistance of “fundamentalist” farmers (see below):
“Slow but perceptible change. The 80:20 rule applies: 20% are never going to change but 70% of arable land is now under stewardship”
The mainstreaming of environmental awareness was seen to result from several factors, including the environmental ‘PR’ campaign and the introduction of ELS:
“There’s been a slow burn. There has been a change to being prepared to consider and embrace some environmental issues. People take it on board. The PR campaign brings farmers to the realisation that this is an issue out there.”
“The introduction of ELS was a bit of a turning point. A lot of people not involved in the other schemes got involved at that point.”
In addition to the impact of awareness raising campaigns, respondents argued that attitudes have changed, for some, because of the financial value of guaranteed agri-environmental payments, while some also see the importance of the environmental benefits:
“It depends on how they view their business and what level they were at before. The guaranteed income is seen by progressive farmers as a steady income stream. They can take all the rubbish bits out and meet agri-environment requirements. So some do it as it makes good business sense.”
“Farmers are more embracing of it, even in the last few years. They are seeing the financial and environmental benefits e.g. pollination of crops.”
“The whole environmental aspect …. has become in many cases an important part of the running of the farm. It’s one of the few guaranteed cheques for a farmer but also there is the whole awareness of the issues. It’s become mainstream”
51

4.3 Continued existence of farmers uninterested or unwilling to engage in environmental management
Alongside the mainstreaming of environmental management/awareness, there was widespread recognition of a small group of farmers who are resistant to the environmental message. This is for a number of reasons, including the hassle factor (i.e. don’t want to join a scheme and be exposed to more inspection), not wanting to be told what to do, and being entirely production focused. On the other hand, those that have embraced agri-environmental management were often seen to be predisposed due to existing conservation or sporting interests.
“There are fundamentalist farmers that believe that they need to farm every inch and assume that the yields on margins are just as good as the rest of the farm. Farmers not engaging with ELS or CFE may change when they get the message that if environmental management is not embedded it may be forced on them.”
“Some people are adverse to red tape and regulations and don’t like being told how to run their business. A lot of people who have ‘naturally’ done this work are already predisposed to that way of thinking.”
“Some are hell bent on farming every square inch of land that they can. Others want habitat for nesting birds – maybe linked to shooting.”
“Some are just stubborn but often it’s due to a misunderstanding of the schemes, the options available. Can usually turn them around through advice and explaining the scheme but some just don’t want the hassle and potential for additional inspection.”
“The resistors are dyed-in-the-wool food producers and they have a perception that they know best about the environment. They are old school, high producing and don’t recognise that some of the land they are using for production isn’t producing good yields and could be used for environmental management.”
“The more professional businesses are happy to take it on as they have better knowledge of the payments and are forward looking and think they will have to do it anyway so might as well do it now and get paid. Those not involved don’t want to have to deal with any more forms and don’t want any other officials on their land.”
4.4 Mixed views on CFE
Respondents had quite mixed views about the impact of CFE. Several thought that it is probably having an impact on awareness but were less confident that this is being translated into action on the ground. The most positive comments on CFE were that its impact was:
“Very good. It has really raised the bar; increased awareness”
“CFE has firmly put conservation management on the map and shown to farmers that they should not just be producing crop but that they should demonstrate that they are custodians of the countryside.”
52

There was “also lots of implementation of guidelines” and
“the theme packages are making people think about doing stuff at the margins of their fields”
Others voiced concerns that CFE is being negatively influenced by changes in organisational infrastructure and moves in global commodity prices:
“Slow but improving. It’s been set back by high grain prices and changes in Defra and NE. Won’t meet the designated area targets”
Several respondents thought that progress was slow and that targets would not be met. In part, these comments reflect the need for the passage of time in environmental management but they also revealed a frustration with the perceived emphasis on the area under management (as an indicator of success) rather than the quality of that management:
“It is getting people to all face in the right direction - seeing that the environment is important - and starting to move in the right direction but doing it at different speeds.
“Probably not going to meet targets but it is moving ELS options at renewal and changing hedge management. It can lead to a significant increase in points for ELS. The impact of changing commodity prices, renewing ELS and CFE – it’s just another piece of paper in the system.”
“It’s a move in the right direction but too slowly. It’s not taking land out that is important but what you do with it. The quality of delivery and habitat will do more for wildlife than the hectares taken out of production.”
“It’s encouraging farmers to take more note of the environment. It has emphasised the point that you need to get in-field but too early to tell if it’s having much influence”
“It’s having a definite impact but need to recognise that CFE has only been working on the ground since Feb 2010, when local co-ordinators were appointed. It’s about behaviour change, building trust, partnerships and so on. There are environmental gains but it all takes time. … It’s a long term process. Farmers are starting to learn how important it is. It takes a long time to get the message across and change behaviour.”
On the other hand, another interviewee thought that the message about quality had been received by farmers:
“Will struggle with some targets, such as ELS and uncropped land. … Even if the target is not met there has been a shift in message to the quality of management not the quantity of land in environmental management.”
One respondent was particularly unconvinced about the impact of CFE, stating several times that it was “minimal” and that:
53

“In reality I’m sceptical that it's had much impact. People still don’t understand it and ask how much they are going to be paid. Agri-environmental schemes have created an expectation of being paid. … Farmers are engaging more with in-field options for ELS, or at least it’s showing why they are more valuable. It is possibly having an impact at ELS renewal but difficult to separate the impact of CFE from the impact of the advisor. Also, now crop prices are good farmers are not engaging with in-field options.”
4.5 Level of informal agri-environmental activity
Despite some of these concerns, there was general agreement that there is a considerable amount of informal agri-environmental activity. Inevitably, some of this becomes incorporated into formal AES participation, but in other instances it remains informal because of the benefits (of flexibility) that this offers the farmer:
“It’s probably underestimated how much is done voluntarily. … Lots of farmers have corners and corridors but the bulk are part of schemes. Lots of features in schemes were originally managed already, such as field corners and buffer strips, so just because they are now part of a scheme doesn’t mean that they weren’t managed voluntarily.”
“Some do a tremendous amount, especially those keen on shooting and field sports. Some naturally do it – they are always planting hedges, doing woodland work, etc. others do very little. It goes back to protecting water courses perhaps combined with grass tracks for access but it does vary a lot. Farmers are not probably putting every last acre in to a crop and there are corners that are not cropped. I would say 70-80% of grass margins are in a scheme anyway but lots would have been done informally before.”
“There’s lots that they do but 70-75% is as part of a scheme. Those that hunt, shoot and fish do informal stuff that doesn’t fit with schemes and they want flexibility and sometimes never even thought of doing it as part of a scheme. … They want the flexibility and don’t want to bother with a scheme or to be visited by a regulator”
Although there was widespread agreement that there is considerable informal activity, it was also clear that this tends to be restricted to the easier and more convenient types of agri-environmental management:
“Field corners are often managed on informal basis – taken out years ago e.g. as part of SA and never brought back in. Things like conservation headlands take more effort and tend not to be done informally. Bigger things tend to need management and tend not to be done informally. The simpler the option the more likely it is to be done on unpaid basis.”
4.6 Buffer strips
In terms of important things that farmers have learned, several interviewees pointed to farmer recognition of the importance of buffering water courses. This is probably due to a
54

combination of measures (LERAPs, CFE, various AES, past and present, and cross-compliance):
“They understand the need for buffers next to watercourses but not so much for hedgerows.”
“What has been taken on board is the protection of water courses. Many of them have recognised that they need to protect watercourses from ingress of fertilisers, agricultural chemicals, etc and that putting in buffers strips is a good way of doing it.”
“Where there is a water course they will have a buffer against it, particularly where they can have a track as well.”
“There’s an increased awareness of the importance of buffering water courses. It’s another message that gets to farmers.”
4.7 Cross-compliance – Soil Protection Review
If the message about the importance of buffering water courses emerges from the interviews as a success story, then aspects of cross-compliance, in particular the soil protection review (SPR) can be regarded as a failure in the sense that interviewees questioned farmer understanding of and adherence to cross-compliance requirements:
“Most farmers couldn’t even name half of the x-compliance rules off the top of their head. Many misunderstand or are not really clear why the rules are there.” “Those that bother to find out do understand it. They think the SFP is their due. They think “it’s mine” but x-compliance is asking them to do something for it. It’s seen as interference in what they’d do anyway. 50% is probably done right and 50% is not. The soil protection review is often not done. RPA inspection is just 1%. Many do as much as is ok so they’d get let off if caught. Others do everything.” “…There’s better understanding than there ever was but I believe that less than half actually know that they comply with everything.”
“…..the soil protection review. It has evolved but farmers get confused and it is one of the greatest areas of non-compliance. Evidence on the ground is that fundamentalist farmers are not doing x-compliance.” “The soil protection review – they have to do it and there is a significant financial impact if it is not done but it is just a paper exercise that is meaningless on the ground. Most farmers do what they want to do anyway without referring to the soil review, at least in the way Defra wants them to.” “The majority of arable farmers will not have completed their soil protection review. They see it as a pointless, demeaning regulation. They don’t engage
55

because they don’t see the value of it. There’s lots of educating to be done to prove it has value and worth.”
“The soil protection review is teaching grannies to suck eggs. It’s just seen as a box ticking exercise.”
4.8 In-field options
The other area of agri-environmental management that has enjoyed least success, and which the results of the interviews indicate will continue to be unsuccessful, is that of encouraging farmers to engage in in-field options. There was a difference of opinion regarding whether farmers recognise the environmental benefits of in-field options but regardless of that there was general agreement that farmers are not keen on in-field agri-environmental management:
“Their attitude is ‘you can have the edges of my farm but you can’t have the middle’”
Various explanations for this attitude were offered:
“They don’t want to take out productive land from the middle of the field” “There’s got to be very big payments or something in it for the farmer. They’re looking for ease, convenience and understanding. In-field options make life very difficult.” “There is a general aversion to anything in the field. Skylark plots are best paid but people don’t want the inconvenience. They want to farm 100% in the middle of the field and do the environment on the outside.” “You need an enthusiast to do skylark plots and some of the other options. That’s a step up in terms of environmental management. … They don’t want to interfere with the profit base other than doing corners and things like pollen and nectar” “Generally not keen on interfering with in-field management. Lots don’t quite get the environmental benefit of some of the options and don’t see why there is a need to leave patches for skylarks or the use of beetle banks in field.”
“Static in-field options are not worth it. They don’t want to tie up productive land and would rather do anything than give up productive land. They don’t want to be tied to a contract, especially with increasing prices.”
Finally, one respondent neatly summed up the multiple factors deterring farmers from engaging in in-field options. In explaining why farmers have not taken up such options he pointed to financial, management and cultural barriers:
“[It’s] their understanding of the financial ‘hit’ and the practicality side of managing the features. In field features require more thought about
56

management. Also there’s quite a lot of pride in farming so people don’t like to be seen to have what would be seen as a poor crop.”
There were a few examples of farmers undertaking in-field agri-environmental management where it made good sense in terms of best farming practice. For instance,
“Maybe stubbles to some extent in areas where spring cropping makes good agricultural sense.” “Maybe pollination plots. In-field fallow as part of weed control. EF22 (Enhanced stubbles) helps with black grass control. It’s an easy option that is good for management.”
4.9 Importance of agri-environment payments
The last theme considered here is the importance of agri-environmental payments. Although considerable informal (and therefore unpaid) agri-environmental management was recognised, it is clear from the interviews that the withdrawal of agri-environmental funding would impact on both the quantity and quality of agri-environmental management. As one respondent put it
“Someone needs to pay for the environment. The farm is a business and we forget that at our peril.”
At the farm level the withdrawal of payments would have a complex impact that is difficult to map from this distance as opinion amongst the interviewees was somewhat mixed. One respondent argued that boundary feature management is:
“…highly dependent on funding. The landscape of 5 years ago was very different to the landscape now and that proves the impact of ELS funding”
while also arguing that in the absence of funding, margin management:
“wouldn’t necessarily stop but would be managed differently. Others would be left alone rather than actively managed.”
Another also reasoned that a withdrawal of funds would not have a drastic impact on certain types of margin management, stating that in the absence of funding farmers.
“Would keep field corners where they’d squared-off fields and they won’t get any crop off that anyway and it saves them money. Old set aside is sometimes just left because it was easier not to farm it. I’ve not seen a big move to bring it back into production. Some small fields are just left where the machinery is too big to manage it.”
The more common view is that the withdrawal of funding would have a noticeable impact:
“If it costs money to manage it for environmental benefit and the money is taken away some would have to stop doing it. If you reduce the money to environmental delivery you will reduce the environmental delivery. The
57

supplement for sowing native wildflower seed for HLS has been removed so no one does it now.”
One respondent felt that farmers might retain:
“some of the smaller buffer strips but some hedges would go back to annual cutting. It probably wouldn’t change significantly perhaps because farmers have changed their attitudes a bit.”
Another pointed to the influence of commodity prices:
“Some hedge management practices and uncropped field corners [would remain] but other than that much would depend on grain prices. Intensification would continue but with farmers becoming more aware of the need to protect on-farm resources such as soil. Stubble for weed control may continue. What has happened on former set-aside land is a good indicator of what would happen if funding removed.”
There was also evidence that the withdrawal of funding would impact on management input and “care and attention”:
“In areas where there are not good crop yields they’d be much more likely to keep it. They wouldn’t just immediately crop it all but would go for natural regeneration and minimum management input.”
“The larger part would probably go back to what they were doing before. The more funding reduced the more the care and attention wouldn’t be there. The environmental schemes are treated as another enterprise.”
4.10 Conclusions
The interviews with expert advisors have revealed a mixed picture regarding agri-environmental management. The situation is certainly much improved compared to the early days of AES but some farmers are still resistant. The evidence from the interviews points to widespread informal agri-environmental management, some of which ultimately ends up being incorporated into formal schemes. However, despite over 20 years of AES, many farmers, even those who have embraced agri-environmental management, remain resistant to the idea of in-field options.
58

5 Farmer face-to-face interviews 5.1 Introduction
Face-to-face interviews formed a key part of the research project. In-depth, face-to-face, qualitative interviews were necessary in order to identify the psychological and physical motivations or barriers to environmental management activities. To understand farmers’ behaviour there is a need to consider the different contexts in which farmers operate, the local conditions in which farmers make their decisions, and to understand the role of farming culture, focusing beyond the individual. This includes: • Farmers’ situations – their needs, opportunities and constraints; • Behaviours, and how these may have changed over time; • How attitudes have influenced decisions made, and vice-versa (learning by experience);
and • Perceptions and opinions of different drivers and how these affect environmental
decision-making. A ‘narrative approach’ in which the interviewee is led through questions was developed with the aim of providing a deeper understanding of farmers’ attitudes to environmental management and to explore the on-farm decisions taken over the farmers career and, where relevant, in relation to any formal environmental agreements and initiatives (e.g. the duration of agri-environment scheme agreements). During the period April 2011 to June 2012, 60 face-to-face interviews were conducted with a wide range of mainly arable farmers across different regions in England. The aim was to interview a cross-section of farm businesses with a range of social, economic and environmental farming management characteristics.
5.2 Methodology
5.2.1 The farmer interview sample
The interview sample was selected from the 2011 CFE postal survey dataset10. The cross-section for sampling was based on the following 3 variables:
• Combinations of formal and informal environmental management activities • Farm size • Region
5.2.2 Environmental management, farm size and region
It was possible to identify from the CFE postal survey and AES datasets held by Defra those farms with environmental activities undertaken within an AES, as part of CFE voluntary measures and unpaid activities outside of CFE. The combinations of formal and informal environmental activities fell into the 8 categories, presented in Table 5 .1. The aim of the selection process was to get good coverage of the different combinations of formal and informal environmental management activity. However, at the interview stage it became clear that the farmer accounts of their environmental management activity did not always match CFE postal survey and AES datasets. The farmer interview survey found that more
10 As part of the formal monitoring programme for the CFE, Defra undertook a farmer survey to record any land under unpaid environmental management in 2010/11 crop year, including any actions taken as part of the CFE.
59

farmers than expected were undertaking informal environmental management activity and fewer than expected were part of CFE than recorded on the survey forms. Table 5.1 Environmental management categories Environmental management Categories Nos. selected Nos. interviewed No AES/CFE/Informal 8 1Informal only 10 20CFE/informal 5 5AES only 8 4AES/CFE 8 3AES/informal 7 17AES/CFE/informal 8 10CFE only 6 0Total 60 60 Farms with AES 31 34Farms with CFE 27 18Farms with informal 30 52 Within each of the 7 environmental management categories at least two of each of the 3 farm size categories (small, medium, large) were selected (Table 5.2). During some interviews it became apparent that the assigned farm size did not always match the situation on the farm. The main discrepancies related to the farms classified as small which transpired to be larger enterprises, either incorporating several CPH numbers or as a result of renting in additional land that was farmed alongside the main holding. Table 5.2 Farm size categories Farm size Nos. interviewed >=10 and <100ha Small 18 >=100 and <200ha Medium 20 >200ha Large 22 60
In addition, the sample tried to ensure that the cross-selection covered each of the 8 regions, although we were not looking for an even distribution across the regions as the study is focused on arable areas. As Table 5.3 shows a greater proportion of the interviews were undertaken in the predominantly arable regions of England (Eastern and East Midlands) than the pastoral areas of the country. Table 5.3 Regional categories Region Nos. interviewed North East 4North West & Merseyside 3Yorkshire & The Humber 7East Midlands 10West Midlands 6Eastern 12South East & London 9South West 9 60
60

5.2.3 Farm types
Although farm type was not used as a sampling criteria, when selecting the sample we did try to aim for a variety of farm types. As Table 5.4 shows the sample has delivered a very good cross-section of farm types with a varied mix of enterprises and also a good mix of tenure situations (Table 5.5). Table 5.4 Farm types Farm type Nos. interviewed Mainly cereals 24 Mixed 23 Mainly dairy 5 Mainly horticultural 4 Mainly livestock 2 Other 2 Total 60
Table 5.5 Farm tenure Tenure Nos. interviewed Mainly Owner occupied 34Owner & tenant 14Mainly tenanted 12Total 60
5.2.4 Face-to-face interviews
The methodology for the farmer interviews was based on a semi-structured questionnaire (presented in Appendix 2). This was comprised of a fairly open framework which allowed for focused, conversational communication. This type of questioning allowed the interviewer to probe for details or discuss particular issues as they arose. A few farm managers were interviewed, but the majority of those interviewed were the principal farmer, often a second or third generation farmer on a family farm.
5.2.5 Re-visit interviews
In addition to the main interviews, re-visit interviews were undertaken with 16 previously interviewed farmers from the first year. The revisit interview was conducted using the same CCRI interviewer who had undertaken the original interview. The selection of these 16 farmers was randomly based and the interviews focused on discussions in 3 main areas: • The scores derived from field surveys, to ascertain the extent to which the interviewees
agreed with the environmental assessment • Any changes in environmental management which may have been prompted by the
previous interview. • More in-depth discussion on the impact of the Campaign for the Farmed Environment
61

5.3 Findings from analysis of farmer interviews
The interview was divided into four sections. In the first section the discussion focused on gaining an understanding of how the farm was managed and the farmer’s attitudes and motivations with respect to farm business and environmental management decisions on the farm. The second section investigated the impact of environmental schemes and policies on the way the farm was managed. The third section looked at the farmer’s experiences with specific environmental management practices and was based around a mapping exercise whereby the farmer annotated a map identifying activities being undertaken as part of AES, CFE or on an informal basis. The final section elicited the views of the farmer on the environmental benefits resulting from their management activities. The farmer interviews were recorded and afterwards a written summary of each interview was prepared using the recording and the completed interview schedule. These data were then analysed using the Nvivo9 qualitative data analysis software programme. The structure of the analysis is based on the analytical framework for understanding the link between farmer attitudes to environmental management and subsequent farmer behaviour and outcomes presented in Figure 2.1. Direct farmer quotations and extracts from the interview summaries are used throughout the report to emphasise the farmers’ perspective on different issues. However, to maintain farmer confidentiality, some of the detail has been omitted in places.
5.3.1 Willingness and ability to undertake environmental management activities The interviews revealed a diverse mix of reasons for undertaking environmental management activities both within a scheme and informally. Clearly the picture is complex and reflects the heterogeneity of farmers and the differences in their decision-making in relation to the environment and their holdings. Their willingness and ability to undertake environmental management activities is based on a complex interaction of factors affected by locality and specific context, such as agronomic, cultural, social and psychological factors. It should also be noted that usually no one factor determined their attitudes to environmental management rather there was an overlap in the decision to act in a certain way which was affected by the balancing of a number of these factors or influences.
5.3.2 Factors influencing the willingness to undertake environmental management activities
There is general consensus in the literature on environmental decision making that a farmer’s willingness to undertake an action results from a combination of subjective norms, belief and values. The analytical framework identifies four factors that have a major influence on a farmer’s willingness to undertake environmental management activities: • Personal interest • Farming philosophy • Social responsibility • Efficacy of actions
Personal interest An interest in the environment and wildlife appears to be a clear intrinsic motive. Where farmers have an interest in the environment, which can often be deep-seated it can be a trigger to undertaking beneficial management activities on their farms. The interview survey
62

found that farmers expressed their interest in the environment in different ways. For some the interest was lifelong and could be traced back to childhood and growing up on a farm:
“I’ve been interested in the environment since my childhood. Both me and my wife enjoy walking in the countryside. You look for things. I don’t go around with a pair of binoculars, twitching. It is nice to see the wildlife about. It’s nice to see the swallows; we never had those in years gone by. We have Canada geese coming on to the pond which we never had before, not that they are an endangered species. There are lots of bits and bobs. We also have black-headed gulls, when I’m ploughing I’ve had up to 7 herons following me down the fields picking up worms, which never happened before. This year for the first time ever I had a big tawny owl following me. There are barn owls on the farm. We have snakes on the farm. For some reason they like living down by the lake. I think they are grass snakes. They swim across the lake.” (Informal only, medium, arable, owner occupied farm in East Midlands region) “I have always been interested in the environment, even as a boy, especially birds and wildflowers.” (Informal only, medium, mixed, owner occupied farm in West Midlands) Mr. B. says he’s always had an interest in the environment and an understanding of the impacts of farming on the environment. He enjoys learning about the science involved. He has had students on his farm looking at its ecology, the absorption of water in peaty soils and ground water pollution. He has also allowed Defra to conduct a number of studies on his farm. (AES/informal, medium, arable, tenant farm in Yorkshire region)
Some farmers expressed an interest in wildlife, and particularly birds and this seemed to motivate them to leave areas of land for the benefit of the wildlife. They were particularly keen on undertaking some bird-friendly management activities. These farmers also tended to be more observant of changes in species occurrence and abundance on the farm. However, they viewed wildlife from a fairly narrow perspective, focusing on the higher species and not the less conspicuous species which are not part of everyday life.
“It creates a bit of habitat and some seeds for the birds, creatures, or whatever over winter. And I feel good about myself when I do that sort of thing.” (AES only, small, dairy owner occupied farm in Yorkshire)
“I’m keen on birds. I’ve always had that interest. The only thing we haven’t got is an owl box. We ought to have an owl box. We have loads of owls.” (Informal only, large, horticultural, tenant farm in East Midlands region) “When you are driving around on a tractor all the time you see a lot. I was driving the tractor last week and I had 13 buzzards following me. The most I have had is 33. Last year I had 20 something and 2 red kites. They must be getting short of food to be after the worms. That has only happened in the last 10 years as the numbers have increased. We don’t mind, it is nice to see the birds of prey. The red kites are beautiful, it is nice to see them up close. When you are sat on a tractor you can be 10 or 20 yards away and they don’t mind, you get out and they have gone, the same with the buzzards. You can get really close to them. They get used to the tractors.” (Informal only, medium, mixed, owner occupied farm in West Midlands region)
There was another grouping of farmers who articulated an interest in the environment in terms of resource management and protection. Interestingly, this group included farmers
63

who had converted from conventional arable farming, based on ploughing, to direct drilling. Here the focus of discussion tended to be on soil management rather than wildlife.
Mr. Q. talked enthusiastically about the environmental benefits of direct drilling. He feels that there is very little research into the economic and environmental benefits of no till systems and would like it to be taken more seriously by Defra... “I’m frequently digging holes looking for worms and beetles and this sort of thing and I can now see a dark layer on the soil surface. I don’t think many farmers get a fork or a spade out to look at the soil really. “(AES/Informal, large, arable, tenant farm in East Midlands region)
Nearly half of the farmers interviewed had game shoots on their farms, most of which were informal for the use by friends and family. There was a strong belief that the game cover had not only benefitted the game birds, but also the smaller birds. Often these farmers when describing the benefits of the various environmental activities undertaken on the farm made reference to the benefit to the game birds. Their view of nature very much related to the game birds as the following quotes illustrate
“The game cover is brilliant, it helps everything as long as you can keep it clean. It is not just for the game birds, but also for finches and other birds”. (AES/informal, small, arable owner occupied farm in Eastern region)
“They (overwintered stubbles) definitely benefit the game birds. It gives them a bit of cover. It also benefits the little birds” (No AES/CFE/Informal, medium, horticultural, tenanted farm in North West).
,. “I like to see the birds in the winter time. I was brought up saying if you have got pheasants you have got other birds”. (AES and informal, small, arable, owner occupied farm in Eastern) Mr. L had put in 0.4 ha of game crops because a friend of his son is interested in shooting. He had planted artichokes for partridges last year and previously tried a variety of things, including sunflower. He thinks it will be of some benefit to wildlife. He did not undertake the activity as a result of CFE and was not sure if it is managed according to CFE guidelines. (AES/CFE, small, dairy, owner occupied farm in Eastern region)
Mr G is keen on shooting. “There is a small shoot on the farm and there is wild bird cover, which is only a very, very small affair, corners strips are planted down with wild bird cover”. He believes this brings a lot of benefit into the environment. (AES/CFE/Informal, large, mixed, mixed tenure farm in West Midlands)
However, the interview also found farmers who did not link game shoots with environmental benefits:
“We don’t have a shoot, a lot of farmers round here shoot, ours is a safe haven from shooting… They kill them all [hares and birds], we don’t believe in it… Because it’s so flat around here it’s not really fair game to go out shooting them. We don’t have any shooting; we just keep it for ourselves.” (Informal only, medium, mixed, owner occupied farm in East Midlands)
64

“We don’t shoot. That is one thing I can’t stand is the country way of shooting everything that moves. Where we have got buzzards and red kite, they’ve suddenly are noticing they are disappearing. They are disappearing because they are taking all the chicks. They are putting down thousands of chicks for the shoot and these birds are eating them. As soon as they release the chicks these birds are coming in. There has to be a balance.” (No AES or informal, large, mixed, owner occupied farm in East Midlands)
Farming philosophy A farmer’s willingness to undertake environmental management activities can also be influenced by their farming philosophy which in turn is underpinned by their values and beliefs. The literature shows that farming philosophies are often related to the farmer’s self image of what constitutes being a ‘good’ farmer and how this provides a justification for their land management. This can depend on the importance given to issues such as land stewardship, farming productivity, profitability, retaining independence and family and business continuity. Farming philosophies are also influenced by social pressures from the farming community and wider society and changing social norms. During the farm interview survey, farmers were asked to describe themselves and tell the interviewer what sort of farmer they were. They were then asked to describe their overall approach to farming. A major theme emerged from this line of questioning concerning the relationship between production and environmental management. The structure of the interview schedule and the advance documentation sent for the research project meant that farmers were well aware that the research was investigating nature and extent of environmental activity being undertaken on their farms and the reasons behind their environmental decision-making. This set a context for the interview where environmental management issues were placed at the forefront of the discussion and it is perhaps not surprising that farmers commonly referred to the importance of the environment when discussing their approach to farming. This is not to say that the farmers were not being genuine in the discussion but that environmental management activity provided the context for the interview. It was common for farmers to talk about the need to find a balance between production and environmental management. Here, production and environmental management were seen as legitimate activities and farmers talked about the challenges of doing both. The importance of stewardship and handing over the land in good heart to the next generation was emphasised in some of the interviews:
“I’ve always been conscious of the wildlife around me. My father was a big believer in that we’re only farming for a very short period of time in the global thing, so we’re only borrowing the land and when you borrow anything from anybody, whether its land or you next door neighbour’s car, lawnmower or kettle or whatever, when you borrow anything you always put it back as good or better as when you got it. That’s deep inside me with everything, with everything I do… That applies to the land just as it does with your next door neighbour’s kettle.” (AES only, large arable tenant farm in East Midlands)
(Interviewer) “What sort of farmer are you?” (Mr. A.) “Conscientious, proud, what’s the word I’m looking for? I want to give something back. I want to leave this farm looking better than when I found it… We are borrowing the land, very much so. I’m a custodian of the countryside… I’m forward looking, I’ve no blinkers. I look around and see what’s going on
65

and take out the parts that I like.” (AES only, large, arable, tenant farm in East Midlands)
The need felt by farmers to balance production and environmental management is illustrated by the following quotes:
Mr C said that while the farm had to make a profit and be productive he was also taking care of the land and looking after it. “I mean you’re only a caretaker for the land really, aren’t you, at the end of the day. If you look after it, it will look after you. (No AES or informal, large, mixed, owner occupied farm in East Midlands)
“My overall policy, to put it simply, is to try and maintain the balance of nature. We have these various areas which we are looking after and that I see as very much part of my overall environmental management efforts.” (Informal only, medium, arable owner occupied farm in Yorkshire)
He feels that not farming the land too intensively and maintaining and restoring his hedgerows has environmental benefits but he is not farming primarily for the environment. The benefits are a consequence of good farm practice. (AES/CFE, small, dairy, owner occupied farm in East Midlands) Mr J. talked about good farming practice being good for the environment but that there was a need for farmers to grow food. (Informal only, small, arable, mixed tenure farm in East Midlands)
Balancing production and environmental management was not always seen as a challenge. The farmer interviews uncovered examples where farm practice and environmental management were seen to be essentially the same and not in conflict. This was particularly the case on some of the farms that had replaced conventional ploughing with direct drilling systems.
Mr.Q. said that environmental benefit in terms of wildlife was a by-product of his interest in resource management.
“I didn’t go into direct drilling on wide rows particularly for the skylark, but it happened to be a benefit we hadn’t, eh, an unexpected consequence in a way. But these things add up, don’t they. When you see the worms and different things, the worms should be good for everything shouldn’t they.” (AES/Informal, large, arable, tenure farm in East Midlands)
For other farmers the main issue was balancing profitability with sustainable production:
“I’m a family farmer and we’ve all to be progressive, you can’t stand still in business you’ve got to try things and they don’t always work. And profit that has to come into the equation, but it has to be a balance, it has to be sustainable, there is no point in making a big profit one year and killing off the profit maker. We’ve got to try to be a little more self-sufficient and cut out some of those these costs – fertilizes, diesel, if we can cut down that a bit. (AES only, large, mixed, mixed tenure farm in South West)
When farmers reflected the changes that had taken place over their lifetime it became clear that in some cases the balance between production and environmental management had changed and that more emphasis was being given to the environment.
66

“I was always brought up to believe that the rubbish, the weeds, the diseases came from the edge and worked their way into the middle of the field so I would plough nearly down the bank side. I would use chemicals to control the weeds in the bottom of the ditches. All that sort of thing was perfectly accepted practice in the 70s. It was only as time went on that we gradually developed into the system we have now. By the 90s we weren’t using chemicals in the ditches we were using mechanical means. Part of the farm is in an SSSI and a guy from Nottingham University used to come and look at the plants in the ditch and he persuaded me back in the 80s not to clean out the ditch every year before we were in any scheme. So we were conscious from then about that type of thing and we gradually developed into what we do now…. We said we can do that, If it’s going to help we can clear out the ditches every third year.” (AES/Informal, medium, arable, tenant farm in Yorkshire) “I like to see a bit of nature, we have some flag iris in one of the dykes. When I first came here I ruined the farm really because we were in the Farm Business Management scheme which was spread over 5 years. We used to have a lot of grassland. There used to be 6 fields in the one field, we used to have 4 or 5 acres fields. There used to be pits and a well and water hole for cattle and I filled them all up and over-drained it. The last 5 acre field of grassland we ploughed up Dad said “I don’t want that ploughed up” we used to have a Roman settlement in it. When I got back to the Ministry they said if I didn’t complete my 5 year scheme I wouldn’t get my payments. They compulsory made me plough it up and now they are paying me to put it back!” (Informal only, small, arable, owner occupied farm in Eastern region) He said that during his time on the farm the way in which he farms has been transformed. In his father’s day they used to plough up to the hedges, now they direct drill. This brings many environmental benefits. (AES/Informal, large, arable, tenant farm in East Midlands)
The interviews also identified a strong production orientated farming philosophy was present on some of the farms. In these cases environmental management was often depicted as a constraint on production and therefore had to be kept away from the productive parts of the farm or avoided altogether. It was clear from the interviews that some farmers held strong views on what different parts of their farms were for. The fields were for production which should not be subject to management constraints while the unproductive parts of the farm, often described in terms of boundary features, margins and field corners could be given over to conservation. Farmers holding these views were particularly critical of the in-field options within AES.
“The only distinction we would have is that we are not very keen on low-input cereals, wild seed crops, in other words as soon as we put a crop in then we want it to do it as effectively as possible. There is no half way house.” (AES/Informal, small, arable, owner occupied farm in Yorkshire)
Some farmers have an inherent deep-seated belief that agricultural production should be maximised on productive land. In fact, for one farmer this was considered a moral issue in relation to global food shortages. He cited a large area of productive agricultural land close to his farm.
“The world is short of food, full stop, end of story. To take land out of production and let somebody starve, morally is that right? Who is the prime species? Is it human or is it wildlife? It’s a balancing act… There is a vast area of land, thousands of acres being taken out of production. Now this is prime
67

vegetable growing land which is being taken out of production for the butterflies and the birds. Now morally is that right? There are areas in the country that can’t produce a good crop…. Let the poorer land go for the birds and the butterflies” (AES only, large, arable, tenant farm in East Midlands)
Similarly, another farmer argued that:
“The world needs food and this here two metre margin amounts to a lot of land in a big field and that could be producing food that the country needs, well the world needs. Its round thousands and thousands of acres and it mounts up… We seem to be more interested in wildlife than we are people… That’s my feeling.” (Informal only, small, arable, mixed tenure in East Midlands)
In contrast to the production orientated farming philosophy the survey also found examples where farmers managed their farms primarily for environmental reasons. In the example below the farmer came from a non farming background and was not reliant on conventional farming enterprises to provide an income:
The main reason for us is the environmental aspect of it. We’ve spent a fortune putting the farm back together again... We never make any money out of it because any penny is spent putting it back in. We look at farming and the environment in a different way to most farmers. We have people coming for their holidays here. They love the orchards and they love the woods and they have other areas where they can just wander... Farmers want to make lots of money, where as we just pay our bills. I have no big flash 4 by 4. We see a lot of people with huge vehicles, top of the range. It is how much you want to make I think. We could do a hell of a lot more to make money, but we prefer to see the birds, the environment, what we live in. If you go wandering around our farm it is not open fields, everything is there, that is what we like. (AES//Informal, medium, arable, owner occupied farm in South East)
Social responsibility and social pressure Some farmers referred to a personal sense of environmental responsibility and accountability. In particular, they were concerned about leaving a legacy for future generations, especially if a successor for the farm had been identified. It was common for farmers to talk about ‘doing their bit’ for the environment when discussing their reasons for joining an AES or being part of CFE:
Mr. Q. went into ELS this year as he felt he should do his bit, so it was a political decision as much as anything: “Felt I should do my bit, a political decision really and now the contract arrangement has settled in it is easier. It’s good for buffering the water courses, so makes the contractors paperwork easier when spraying and which ones he can choose.” (AES/Informal, medium, owner occupied farm in South East)
There has been a shift and CFE has made farmers more aware, that is the general impression I get. Some still not get it but few and far between now. (AES/Informal, large, mixed, owner occupied farm in South East)
Other motivations, such as community image and regulation (fear of penalty) can help to explain farmer’s environmental behaviour. It appears that standing within the community and respect amongst peers, as well as recognition in a wider society can motivate farmers to
68

farm in a more environmentally friendly manner. This is illustrated by one farmer’s reason for placing a wide margin against a watercourse
“It is easier to have the margin because on the other side of the ditch the land belongs to an ecological trust and they have trees and fancy grass and bird boxes and all that and I thought it might look like I was doing my bit as well. Also with the chemicals you have to stay that far away from the watercourse anyway” (No AES or informal activity, medium sized, tenanted, horticultural farm in North West).
It was also common for farmers to be critical of the management practices of other farmers where there was perceived over exploitation of the land and environmental damage:
One neighbour has ploughed vast grass fields up. One field that I know has I would say never been ploughed in my life time. Looking at it there were dry ditches going through it for 200-300 years and he ploughed them up. I don’t know how on earth he got permission. He said he got permission. All his land, 400 acres, is cereals. You walk across there and you don’t see a thing... “I don’t think arable farmers have done the environment any favours at all.” (Informal only, medium, mixed, owner occupied farm in West Midlands)
Community image can also have a constraining influence on the willingness to undertake environmental management activities. A common theme arising from the farmer interviews was the desire of farmers to be seen to be managing a well managed and tidy farm. These views were particularly expressed in relation to margins and some in-field activities which enabled the spread of pests and undesirable weeds and also in relation to hedge cutting regimes. The following quotes illustrate this point well:
“For others, the in-field options are hard work. Farmers are vain and neighbours might see them and think “he can’t plant his crops”. I have had no first-hand experience of them, but again where is the evidence that they work?” (AES/Informal, small, arable, owner occupied farm in Eastern region)
“It comes back to this bloody mess option, want to mow it [margins/field corners] once a year at least to control it.... Just can’t stand mess”. (AES/CFE/informal, large, mixed farm in South East region) “Also I’ve been to several of these meetings and farm walks and they are smothered in weeds and rubbish! I’ve spent my lifetime cleaning them out and when you are walking there are thistles up this high with their heads all blowing and it doesn’t appeal to me at all – I’m too tidy!” (Informal only, small, arable, owner occupied farm in Eastern region)
“Cutting hedges every two years makes a mess of them. One year’s growth these here flail hedge trimmers will cut it off like a pair of garden sheers and it looks tidy. You get two years growth it breaks it, it looks one hell of a mess. And I’m all for it looking tidy, that’s how I was brought up..... There’s a hedge up there that’s not mine… that’s just been left to go wild and quite frankly I think it looks a mess… A tight hedge, I think the birds prefer it.” (Informal only, small, arable, mixed tenure farm in East Midlands region)
Community image is a mutable concept and can change over time. One farmer suggested that what is considered acceptable farming practice within the farming community has changed over the years. This farmer when asked if he had undertaken any activities for the
69

benefit of the environment initially responded ‘no’ and that everything thing he did was just normal farming practice. Then on reflection he recounted that the situation on his farm was very different in the 1970s when they had ploughed to edge of every field, sprayed out all the hedge bottoms and ditches to keep the weeds down and cropped the hedges to very near the ground. He said that such practices were the norm then but that he farms differently now in that he has margins around every field, does not use as much chemicals and lets his hedges grow out a lot more than he used to. When asked why he did this his response was to reduce pollution and to benefit the wildlife. Another farmer explained how farming attitudes had changed over time:
Mr. A. made various comments throughout the interview about how farmers have become more environmentally aware: “[There are] lots of interesting things about hedges, people’s attitudes have changed about what they want, people’s attitudes have changed about what they like to see and when they will have it done. People are now quite happy to see us cut later in the season because of the margins next to the hedges, so we haven’t got such a tight window…”
“I like the farm to look tidy, but I know it doesn’t look anything like as tidy as it used to, as I always kept my hedges well-trimmed. I’ll admit I kept them too low but that’s the way I like to look at it, I didn’t realise that it was bad for the birds… I now let them get bigger.”
“… I like the countryside, everybody around here does it, everybody plants hedges and trees and everybody takes a pride in their farms I’ve got one particular customer and he was a real barley baron in the 70s, hardly any hedges, and even he has planted hedges, trees and has got enthusiastic in what’s there. The majority of farmers know full well how to manage the countryside.” (AES/informal, medium, arable, owner occupied farm in East Midlands region)
Efficacy of actions Perceived efficacy represents the notion that farmers must be convinced that their actions will benefit the environment in order for behavioural change to occur. There is evidence that the higher level of perceived efficacy, the more farmers are likely to persist with the new behaviour. The following quote from a contractor highlights the importance of experience in increasing perceived efficacy.
Mr. B. said that his experience of other farms through his role as a contractor has let him see first-hand the benefits of different types of environmental management. This has helped him with the management of his own farm. “A lot of people aren’t interested [in environmental management] because they probably haven’t seen the benefits of it. I can see the benefits of it, so I’ll do it.” (AES/Informal, small, arable, owner occupied farm in East Midlands)
The interviews revealed a number of activities for which there was a higher perceived efficacy of their actions, and particularly in relation to buffers against watercourses. Also there were many farmers who were not convinced of the efficacy of 2 to 3 year hedge cutting in benefiting the environment.
70

Says he leaves a larger margin than cross compliance to ensure the watercourses are protected from spraying. He keeps well away from the water. He said he has been on a lot of spraying courses and is ‘frightened’ of causing environmental pollution through spraying. He says it makes him feel more comfortable knowing had he has some leeway with the spraying because he has extra wide margins. (Informal only, small, other, owner occupied farm in Yorkshire)
Mr G did not want to put hedges in to ELS due to witnessing the damage caused by trimming hedges every 2 to 3 years. “Having seen others put hedges in and come back 2 years later and hit them with the hedge trimmer to try and get them back to somewhere where they were. When you see a hedge being decimated by a hedge trimmer. What is the idea? Is it to try and get the hedge bigger. What is the object? I have seen some terrible damage to hedges in the area; trying to get hedges back to the size they were 2 or 3 years ago. Trimming large branches 1.5 to 2 inches. Looks awful, split stems; must be opening it up to disease”. (AES/Informal/CFE, large, mixed, mixed tenure farm in West Midlands)
Loss of flexibility and control Another important view that emerged was concern about outside control impacting on farm management. Some farmers were resistant to joining AES for fear of loss of control and flexibility. For example, one farmer did not want to reduce his ability to change management on short notice. Another wanted to have the flexibility to change management practices if he felt the prescriptions were not working.
“I’ve looked at environmental stewardship a few times. We were going to do all of that, then we held off for whatever reason, then it was to do with the rules and regulations and what was going to happen in the future… I don’t want to do it all and spend a lot of money then find in two years time things are going to get changed again.” (Informal only, small, other, owner occupied farm in Yorkshire)
Mr. D said his ditch management had to be frequent because of the low-lying nature of the land. He said he needed the flexibility to cut the vegetation or there would be a risk of flooding. The farm was totally inundated in the flood of 1953 and his father remembers the devastation that flooding can bring”. (Informal only, medium, mixed, owner occupied farm in East Midlands)
5.3.3 Ability to undertake environmental management activities Farmers’ attitudes to environmental management activities are influenced by their ability to undertake these activities. A number of factors have been identified which influence the farmer’s ability to adopt environmentally beneficial farm practices. • Farm business drivers • Financial reasons • Farm size • Farm type and environmental endowment • Farmer and farm characteristics • Knowledge and advice
71

Farm business drivers The farm business drivers can exert an important influence on the level of environmental management and this was a recurring theme in discussions with farmers about their farm management. For example, on an intensive dairy/arable farm at the margins of profitability, the farmer reported that his hedges are the only wildlife reservoir on the farm because he does not have any other space if he is to stay in business. For this farmer, the intensification of production and loss of environmental features is of some regret, but it seen as a necessity if the farm business is to survive.
“When I took over the farm 20 years ago we were milking 50, 60, cows, grew a bit of corn in the rotation and had a few beef cows… With the milk prices I’ve been forced to specialize more and more. So nowadays we are producing four times as much milk from the same area of land and we have maybe doubled cow numbers. We have had to become more intensive, basically, so now I’m producing nearly 700,000 litres of milk a year as opposed to 200,000 when I took over the farm... On my farm it’s become more and more intensive, so it’s difficult that way, but there are certainly different things. I wouldn’t say that there has been an decrease or increase in wildlife it just varies. It’s different to what it was when I was a kid, when I was a kid there were skylarks everywhere in all the grass fields purely because it was old meadow land. Maybe it’s a glorified image of my childhood but there seem to be skylarks everywhere and you hardly see them now but as I say my farming system has been forced to change so I can maintain a living.” (AES only, small, mainly dairy, mixed tenure farm in Yorkshire region)
Farmers often made the link between economic pressures bearing down on the farm business and farm practice change which was environmentally damaging. There was also evidence that some farmers were able to forgo environmentally damaging changes to farm practice by adopting a range of different business strategies. For example, another 500 ha arable/beef farmer, supplying Waitrose and in the LEAF assurance scheme, could manage the farm less intensively because that is the market he was serving. Similarly, those who have diverse sources of income and are less reliant on the farm to contribute to the household income are under less pressure to make the land work so hard which enables them to farm in a more environmentally-friendly way. Financial reasons The literature shows that payment levels are often the most important factor influencing the farmers’ willingness and ability to enter AES. For those without strong environmental motives for joining schemes the financial reward can play a crucial role on whether or not the farmer joins. Some rationalised this in terms of recouping money lost from SFP, others, particularly those in ELS, saw it as “money for nowt” as it required few changes to their existing farm management practices or used unproductive areas of land.
Mr R said it was ‘money for nowt’. He could get most of the points required by entering his hedgerows and he already had a number of different cutting regimes. His agent drew up the application to be least disruptive to the farm business (AES only, small, mainly dairy, mixed tenure farm in Yorkshire) Mr S says he went into ELS for the payments. It was easy and he didn’t have to change anything. He got all his points on low input grassland. It made no difference to the way he has to farm (AES only, medium mainly dairy, owner occupied farm in the North West).
72

“I rang my agent up and said sort out my ELS application for me and he came and we walked round and we measured up the hedgerows and worked out how many more points we needed and just adjusted accordingly… 10 in-field trees yeah, yeah what else?” (AES only, small, mainly dairy, mixed tenure farm in Yorkshire)
“We went into ELS for the payments. At the time with the low price of cereals it was needed. £30/ha was attractive. We could take out some very marginal ground which probably was not producing 4t wheat/acre because it was wet and awkward”. (AES / CFE/ Informal, large, mixed farm in West Midlands)
For others, the payments were not a sufficient incentive to join:
“I considered ELS with my agent quite deeply and I could not see the benefit of spending £3,000 to do, plan and annually only get £3,000 back. Have you come against that sentiment before?” (Informal only, large, horticultural, mixed tenure farm in South East)
However, it was also common for farmers to mention that the AES payments enabled them to undertake environmental activities that they otherwise could not have afforded.
“I wanted to do something to benefit the wildlife. I always did leave corners and do things to benefit wildlife and when the Countryside Stewardship Scheme came out if you put a scheme together they would pay you for it. I was doing a little bit, but now I could do a lot more and get paid for it… I could do it better.” (AES only, large, arable, tenant farm in East Midlands)
Financial consideration was also the main reason given for undertaking minimum tillage and direct drilling as these practices saved both time and fuel costs compared to ploughing. Also the regular payments from AES helped to provide some income security, as one farmer explained.
We’ve got all of these margins that could be making more money if they were in wheat now, but you’ve have to take a sort of step back and the way I look at it now is that you can’t put all your eggs in one basket. So having the HLS means that you are going to have that lump sum every year, unless the government starts playing silly buggers - which you can never count out, so in a way it is spreading the eggs out and making sure that you are not so vulnerable to the market and in the process you are keeping all the environmental people happy too. That’s the way I look at it’ (AES/Informal, large, mixed, owner occupied farm in North East)
Farm size The interview survey found that farm size could be a factor influencing a farmer’s ability to undertake some environmental management activities. This particularly related to the loss of productive land on small farms:
“I don’t think a lot of people approve of the way I do things, but I was brought up to farm. I’m there to grow food, and although I leave my 2 metre field margins and a little corner here and there, I’m in a position where all my land has to be productive… I’m only a little farmer… and if it isn’t all growing
73

something then we can’t make a living.” (Informal only, small, arable, mixed tenure farm in East Midlands) “We looked at it [ELS], we looked at what we had to do and then we looked at the size of our farm and the size of our fields and thought it just isn’t viable to do it. Where could we do it? There were only a few fields that we’ve got where we could do it. Our agronomist says to us that we’ve got more fields than some of his [clients] who have two or three thousand acres.” (Informal only, medium, mixed, owner occupied farm in East Midlands)
“I looked at ELS… It looked as if it was going to pay me £1,000. Well the hoops I was going to have to jump through I wasn’t prepared to join for £1,000. Now had I had three times the acreage it would have come to a lot more money and probably would have been the same amount of paperwork with a big farm as a little farm.” (Informal only, small, mainly cereal, mixed tenure farm in East Midlands)
Farm type and environmental endowment Often the farmer’s motivation towards environmental management activities is influenced by the extent to which the activity aids farm management. In particular, margins and field corners that were managed informally were considered in this way because the margins allowed occasional access for machinery and field corners helped to straighten up awkward corners.
Mr J. marked an area of an isolated field (1.5 acres) that was difficult to access because it was distant from his main farm. He said he left it as ‘voluntary set-aside’. The land is next to a watercourse and the grass is not cut. Reeds are growing up and wild ducks next in it and Mr J considers it to provide significant benefits. He will continue to farm this way. (Informal management, small arable owner occupied farm in East Midlands)
Mr W. had always cropped the areas but the contractor was not keen to cultivate the land as it was stony and steep, so they agreed to leave it. (Informal management, large arable owner occupied farm in East Midlands)
The environmental endowment of a farm can have an important influence on a farmer’s ability to undertake environmental management activities.
“We took on the farm and managed it for the environment, partly because there was so much here. It was a #### managed estate and they managed it with environment in mind, there is 55 ha of managed woodland when we brought the farm. It was managed sympathetically and that is why father brought he farm”. (AES/Informal, large, arable, mixed tenure farm in Eastern region)
The farmer interview survey found that farmers referred to the range of environmental resources on their farms as a factor affecting their ability to join an AES. For some farmers the range of features present meant that it was relatively straight forward to enter a scheme.
The scheme has worked well for us. It wasn’t very difficult for us. All the hedgerows we don’t cut back so they have turned into trees. Some hedgerows are very thick. We have cut a few back just because they have said “if you could cut this section, it will thicken up” so we have been doing
74

that as they have suggested and left other areas. (AES/Informal, medium, mixed, owner occupied farm in South East)
The farmer was in CSS and went in to ELS from the start “but then we have never ploughed to the edge so thought we should get something back for not doing that.” (AES/CFE, large, mixed, owner occupied farm in South East)
For other farmers a perceived lack of appropriate features could limit their ability to join an AES without being seen to have a negative impact on their farm business:
“We looked at going into an agri-environment scheme but couldn’t get enough points. We have no hedges and most of his dykes are sheers dykes so I can’t get points on those. We could only get points if we started to take the cropping land out. We looked at re-planting the hedge along a parish boundary, but it was going to require a buffer zone on the other side of it and they would be losing a lot of land on a small field.” (Informal only, small, arable, owner occupied farm in Eastern region) “I was in the pilot ELS scheme but decided not to renew my agreement when ELS was rolled out as a national scheme because the options were changed and I would have struggled to obtain the points without affecting my profitability. My in-field trees in the grassland were no longer eligible under the new ELS scheme and I felt that the payments for winter stubble did not cover the costs of extra cultivations required after winter stubble. Also as wheat prices rose, the scheme became less financially attractive”. (Informal only, medium, arable, owner occupied farm in East Midlands region)
There are also farms where there is no capacity to leave odd corners or straighten fields. The following quote explains the situation from a fenland farmer perspective.
“The trouble with the fens is that it is all straight lines. You don’t get nasty corners in fields like you do in other parts of the country, so it doesn’t make sense to take out say an acre down the side. If you’ve got a wet hole, or a piece of land by trees, you see a lot of that when I’m going out and doing the cutting for the City Council, you can see where people are making the most of the scheme because that land never yields much. You haven’t got those features in the fens which is why for a lot of people it doesn’t stack up, where it does more for people farming in the less favoured areas. The land type also makes a difference. If you have heavy land that is not producing, the environmental schemes are the obvious thing to do”. (Informal only, medium, arable, owner occupied farm in East Midlands)
Farmer and farm household characteristics There was some evidence of differing inter-generational views acting as a barrier to adopting environmental management practices. One farmer who had recently taken over the management of his mainly horticultural farm business from his father, had difficulties in persuading his father, who undertook all the ploughing, to leave margins against hedges. This young farmer was trying to undertake more environmental activities but was facing a constant battle with his father. As he explained in relation to leaving 2 metre margins:
“The only thing I did struggle with was my Dad because he doesn’t like to leave these 2 m margins. He is totally against it; I had to threaten him
75

because he does all the ploughing. It is just a generation thing. When my Dad was brought up if they couldn’t get into the corner the ploughman used to get out and turn it over with a spade. With the hedges they used to dig under hedges to stop the weeds spreading. It goes completely against how they were brought up”. (No AES/CFE/informal, medium, mainly horticultural, tenanted farm in North West)
Also in relation to leaving the canopy area under an in-field tree uncultivated, he said.
“Because we are going into ELS I told him to leave ploughing under the canopy of the tree. He went absolutely berserk”.
A number of interviewees had also adopted more environmental management practices because they wished to reduce the intensity of their production, either because they were approaching retirement and/or they had health issues.
“In April I signed up to HLS. I’m not sure that I’ve done the right thing the way the cereal prices have increased. However, I’ve had a few health problems recently and need surgery and so I’m not sure whether I could farm more land. I’m really waiting for my son to start working on the farm but this could be a few years yet”. (AES only, large, mixed farm in West Midlands)
Knowledge and advice Often the catalyst for undertaking environmental management activities was contact with external advice. For one farmer it was contact with a University that led him to become much more aware of environmental management practices on the farm.
Part of the farm is in an SSSI and a guy from Nottingham University used to come and look at the plants in the ditch and he persuaded me back in the 80s not to clean out the ditch every year before we were in any scheme. So we were conscious from then about that type of thing and we gradually developed into what we do now…. We said we can do that, If it’s going to help we can clear out the ditches every third year.” (AES/Informal, medium, arable, tenant farm in Yorkshire)
Another farming couple became more interested in the environmental management on their farm following approaches to join CSS and subsequent surveys undertaken on the farm.
“We were approached because it was at a time when English Heritage and English Nature were trying to take control. We had a monument which had not been ploughed up in the 80,s like most of them had, and it was who was going to take control so that we could not plough it up. We were approached to go into CSS so that the monument would be protected. We weren’t that environmentally aware before we went into AES, although before that we didn’t plough up the grassland because it did seem a bit of shame. We have learnt a lot. We didn’t know that we had a 100 species of grass weeds here until people came and counted them. (AES/Informal/CFE, medium, mixed, tenant farm in Eastern region)
5.4 Attitudes to individual environmental features
76

For many interviewees, when asked to discuss activities undertaken on the farm to benefit the environment, in the first instance they referred to woodlands/tree planting and pond creation/restoration, or were linked to activities, such as shooting. Often these activities had taken place outside of any scheme.
Mr. D. said that they had planted up an old area of woodland specifically for the wildlife. This was the one activity that he said was specifically for the environment. (No AES/CFE/informal, large, mixed owner occupied farm in East Midlands)
“What I’d also like to mention is ponds, we’re getting into ponds, … We haven’t really tackled them yet, but they want cleaning out. They’re a terrific wildlife habitat as well.” (Informal only, medium, arable, owner occupied farm in Yorkshire region)
During the interview Mr. V. focused on environmental activities that were generally outside the scope of our interest. He talked about what he perceived as a bias against the inclusion of water course options in Environmental Stewardship. He is very interested in the trout stream which passes through the grassland portion of his farm. It is clear that Mr. V’s framing of the environment does not fit that closely with our arable focused study. He was quite puzzled by my attempts to bring back the discussion to the arable fields, margins and boundaries. (Informal only, medium, arable, owner occupied farm in Yorkshire region)
When discussing the environmental benefits of their activities, this was rarely expressed in ecological terms, but more in terms of the wildlife they had witnessed. The environmental benefits were not talked about in abstract terms, but in terms of their observations. They particularly referred to the higher species, such as the birds they had seen, but also mammals, such as deer and hares. Often there was evidence of a high degree of awareness of the wildlife present on the farm, which was sometimes the result of a specific survey that the farmer had initiated. The interviewees very rarely talked of benefits in terms of flora and only one referred to aphid predators.
5.4.1 Margins A theme emerged about the different ways farmers talk about the farmed land and what they see as the environmental parts. This appeared to vary greatly; some saw everything on the farm as farmland, so the hedges are part of the farmland and therefore had to be managed and kept tidy. Others, saw a distinction between the farmland and the environmental features. There was also a whole discourse on hedges and margins. Some saw hedges as nature and margins as contamination. In contrast, others saw that placing a margin against a hedge was maximising the environmental benefits and were looking for environmental synergies. There was a distinct view that environmental activities should take place at the periphery of productive land and many were in favour of environmental management on the margins of the farm where it would have least impact on agricultural production.
“You should keep the centre and edges as different entities, this limits the cross-over of weeds into field and sprays going other way. You should keep them as totally separate and look at them like that, then never overlap or pinch a bit of it”. (AES/CFE/informal, medium, arable, owner occupied farm in Eastern region)
77

Mr R. said that environmental management was now focused on making the most of the habitats surrounding the productive areas. He talked about his hedge management and the management of uncut grass strips and field corners (AES only, small, dairy, mixed tenure farm in Yorkshire region).
Margins/field corners were favoured as an environmental activity by many of the interviewees. They often talked about the agronomic reasons for locating margins/fields corners in a particular place, e.g. area shaded by woodland, straightening an awkward field or taking a wet area out of production.
“Two of the margins are next to popular trees on my neighbour’s farm which get so tall that you can’t cultivate the field. It is either wet so you can’t cultivate it or dry in the summer because the trees take all the water.” When there was compulsory set-aside I thought that these would be the best place to put it and after set-aside finished I just left it because it was difficult to cultivate” (Informal only, small, arable, owner occupied farm in Eastern region)
“Next to the woodland it is a very cold dank piece of ground, it never dries out and is fairly heavy ground you can do what you like to farm it but it never grows anything, so if it doesn’t grow anything what is the point? We seeded it down and let it go au naturale”. (AES/CFE/Informal, large, mixed, mixed tenure farm in West Midlands).
Farmers particularly understood the rationale for buffer strips against watercourse in terms of preventing water pollution and favoured these because they complemented LERAPs and helped with the LERAP form filling. One farmer, for example, talked about leaving a larger margin against watercourses than the cross compliance requirements, as he had attended a lot of spraying courses and was ‘frightened’ of causing environmental pollution through spraying. He felt more comfortable knowing that had he had some leeway with the spraying because he had established extra wide margins.
“With spraying you realise how many miles [of water course] that can contaminate, you start thinking, well for the sake of 6 meters of grass…” (No AES/CFE/informal, medium, other, owner occupied farm in Yorkshire region)
For those who had established buffer strips against watercourses, many felt that they would continue even if AES finished.
“If we weren’t in ELS we would probably still keep in the buffer strip alongside the brook. It is easy to work and it has straight lined the brook and it does form some kind of access to the brook, although you are not supposed to use it regularly. It looks good. There are a few weed issues, which can be a problem. It is not a bad thing.” (AES/CFE, large, mixed, owner occupied farm in West Midlands)
“The margins work well against the watercourse because of LERAPs. That is why they are so good and why people have taken them up. Also it is the worst part of the field because it is shaded by the woodland or hedgerows and the rabbits from the hedgebanks. It is a good practical measure and it’s slightly concerning that you hear them say that they are not quite so keen on margins anymore, which one understands, but I think you need to come up with options that work for both sides, that are appealing for farmers and appealing for wildlife. You could say that margins and hedgerows have been an easy win, but it is amazing how much management they need. At the moment we
78

have ragwort, so we have to send out a team to pull out ragwort by hand and that doesn’t work very well especially when it is dry because they break off” (CFE/informal, large, mainly horticultural owner occupied farm in South East region).
Some interviewees had wide margins which they had established informally (often for occasional access to check crops, turn machinery, move livestock or horse riding) and which they believed were benefitting the environment. There was a reluctance to place these areas in a scheme because it would reduce their flexibility of use, for example occasional vehicular access, or for moving livestock across the farm through arable fields. With those margins and fields corners established informally, there was little evidence that they were being particularly managed to enhance their environmental potential. Just their presence was considered beneficial.
“One margin has been fenced off purely for access to run sheep out of the various permanent pasture fields. It is still beneficial for the wildlife because they are only rarely grazed. The grass grows long and flowers grow in it and wildlife benefits from those strips.” (AES/CFE, large, mixed, owner occupied farm in West Midlands region)
A number of mixed livestock farms with margins in ELS agreements had difficulties in integrating the margins and fields corners with their arable/grass ley rotation. They were having to spend time fencing off margins from the livestock when the fields were in grass leys or stubble turnips.
“In ELS we were not allowed to graze the grass around the outside of the fields and were having to fence it when the fields were in leys so it wasn’t any use to the stock. If we were allowed to graze some of the margins at certain times, we would think about going back into ELS. If you’ve got to fence all the grass off to start with before letting the animals onto the grass or stubble turnips it takes a lot of time” (AES/CFE/Informal, large, mixed, mixed tenure in West Midlands region).
A few had public access issues with margins. One had a margin in a previous scheme adjoining a wood but removed it in the current schemes because too many people were using it to walk their dogs “It is defeating the object as it disturbs the birds”. Another had an informal grass margin against a watercourse but replaced it with an unharvested headland in order to deter public use.
“I leave a 3.5 m margin against an Environment Agency ditch. I don’t have to. A footpath adjoins the strip and because the margin ground was empty the public were using it as a footpath. This time I sowed the margin with corn but haven’t fertilised it or sprayed it for weeds, to see if he can stop the public walking on it, and it has worked”. (No AES/CFE/Informal, medium, horticultural, tenanted farm in North West region)
Several interviewees referred to concerns about wide margins being classed as permanent pasture after 5 years. This is the reason one farmer gave for not recording his margins in the CFE postal survey.
Mr R. has 6m margins around all the fields to allow run off for the machinery. This land was previously in set aside. He has not entered these into ELS or GA12 because he needs to control sterile broom by topping them once a year. Otherwise the weeds would put him out of business. He is afraid that Defra would class the land as permanent pasture after five if he declared it. This is
79

why he did not record the margins in the CFE survey. (AES/CFE/Informal, large, arable, tenant farm in East Midlands)
The language used when referring to margins was interesting as they were sometimes referred to as areas of “rubbish” or “contamination”. In other instances they were seen as an extension of the hedge and managed alongside this. In both cases the farmers did not mind keeping these areas of rubbish or hedge at the edge of the field but there was a great reluctance to transfer these areas into the middle of the field in the form of beetle banks or sky lark plots. Field corners As with the margins, field corners were another environmental activity favoured by farmers because they fitted in well with existing farm management systems. Again, farmers often referred to the agronomic reasons for establishing field corners. Reasons given for selecting field corners related to existing areas of unproductive land, awkward corners that were difficult to cultivate, sometimes with obstacles, such as a tree, or telegraph pole. Again those with mixed livestock farms felt penalised by the field corner options in schemes.
“We haven’t put field corners in the rest of the arable fields because if we do seed down within the 5 years then that bit of ground has to be fenced off from the livestock, which is an extra hassle and it is expensive to fence”. (AES/CFE, large, mixed, owner occupied farm in West Midlands region)
Game strips A commonly expressed reason for undertaking environmental management activities related to game shoots on the farm. These were usually small, informal shoots for which game strips had been established either within a scheme or informally. These game strips seemed to really appeal to the farmers, and several had enjoyed experimenting with different seed mixes in order to find food plants that would be most effective on their farm.
“Have tried different mixes and see more small birds around. Starting to understand what we should put on. It’s not everything that they like, as they eat that too soon, but stuff that lasts and is there when they need it. We buy readymade mixes and these are tweaked”. (AES only, large arable, owner occupied farm in South East region)
This was one activity where farmers often took a holistic view of the farm when establishing the strips. For example, one farmer referred to locating the game strips to make wildlife corridors through the farm, others had established blocks of game cover strategically around the farm.
Mr B is using the game crops to make environmental corridors through the farm using the least productive land. He thinks it works well and is brining environmental benefits. “You see what we’re trying to do? We’re linking up this woodland here with this river, with the moor… This is a bank of blow-away-sand and this is a boggy hole that never grows anything.” (AES/Informal, medium, arable, tenant farm in Yorkshire)
80

Occasionally the game cover strips were sown with maize and whilst it was recognised that this was not always liked by the conservation organisation it was still felt there would still be benefits to the environment as the following quotes illustrate.
“We put some maize in for wild birds. I realise that ELS doesn’t like maize as a game cover crop, but I think that anything is good. The strips of maize, will have wheat and barley thrown into them through the shooting season and we won’t just rely on the maize so birds will get something from that”. (AES/CFE, large, mixed, owner occupied farm in West Midlands region) Mr M has one block of game cover, with 2 adjacent strips, one is a strip of maize against the hedge and a strip of the CFE mix which is in ELS. “You have small seeds for the small birds and big seed for the big birds. A lot of them do that put a smaller mix by the maize to keep it warm. It stops the wind blowing straight through the maize which can be a bit draughty in the winter.” (AES/informal, small, arable, owner occupied farm in Eastern region)
Two farmers, including the one quoted above, had specifically used the CFE game bird mix for their strips. The only clear example throughout the interviews of farmers following the CFE guidelines. Pollen and nectar mix A number of farmers were growing pollen and nectar strips, most of these were established under HLS or ELS, although one farmer had established a strip informally in an awkward area where electricity poles had been erected 10 m from the hedge. Generally these farmers liked the idea of the pollen and nectar mixes envisaging an array of wild flowers. However, most had experienced difficulties in establishing the strip which lead to overall disappointment
“I don’t know why I did the pollen/nectar. I don’t think it really works and wish I’d taken it out when I renewed my ELS. I’ve had problems with thistles and docks ....it is all very well in theory” (AES & informal, small, arable, owner occupied farm in Eastern region)
“It has not been as good as I’d thought it would be. It sounds better than it is. I’m not an ecologist I haven’t counted the bugs. It might be a haven for these things. If I’ve seen a clutch of partridges or something then that brings it to my attention. Without that and just bugs and invertebrates, I wouldn’t have a clue”. (CFE & informal, large, mainly horticultural, owner occupied farm in South Eastern region)
5.4.2 Boundaries Hedges There were some interesting discourses on hedge management. Some farmers were cutting their hedges annually and claiming that they were not managing them for the environment, although further questioning revealed that the hedges were being left higher than when managed by the previous generation. There were some strong views about the detrimental impact on wildlife of 2 to 3 year rotational cutting. Many were not convinced of the environmental rationale for rotational
81

cutting and some thought it was actually detrimental to wildlife as this practice opened up the structure of the hedge, reducing the availability of nesting sites and making small birds vulnerable to predators.
“We cut the hedges every year. I think cutting every 2 or 3 years is wrong. If you cut every year, it is thin, it looks like a nice and tidy job and all the song birds that nest in that hedge the magpies and buzzards can’t get in. If you leave it for three years the wood is a lot stronger and when you cut it, it opens the hedge up and the big birds can get in. We have a lot of blackthorn if you cut it very year it looks lovely. If you cut them every 2 years it just looks a mess”. (AES only, medium, mainly dairy, owner occupied farm in North West region)
I don’t agree with the 2-3 year rotation cut in the ELS scheme. It is the little birds that you want to be protecting and you can’t do that in a thin hedge. Once you get a tall hedge or an uncut hedge that is what they become a thin hedge. They open up and the sparrowhawks and everything can get in. To me it just doesn’t make sense. I have a little hawthorn hedge here (at the house) and I cut it every time I mow the lawn just to trim it back. There must be 7 or 8 nests in it, because it is safe. I won’t put hedges into ELS unless I have to. (No AES/CFE/informal, medium, mainly horticultural, tenant farm in North West region)
(Interviewer): “Do you think there is any difference in the environmental benefit?” Mr. C. “I think there is absolutely none, quite frankly. I thought there was when we started and I was keen on it, but these sightlines (from gateway on to busy main road) are done twice a year, do them in January and always do them in the middle of July ready for harvest, and there’s just as many nests… there seems to me to be as there is anywhere else.” (AES & informal, large, arable, tenanted farm in Yorkshire region)
There were also concerns about the appearance of the hedges after 2 to 3 year cuts and particularly concerns about the hedges looking untidy.
“I don’t actually agree with it that much. I think that the way to do it is to trim your hedge lightly every year. I don’t actually agree with smashing it down once every three years. I think you can leave it at 2 m high and 2 m wide but I don’t think it should look like a bomb site once every 3 years which they do look like. I don’t think it as good as leaving a nice thick hedge that is trimmed every year as long as you don’t trim it after February before the berries are gone and the nests are on I can’t see you doing any damage. I think that is an incorrect one. We only do that because it is part of our scheme and that is what we have got to do. I think what Defra were worried about is that if you trimmed hedges every year you would get back to small and narrow hedges. (AES\CFE, large, mixed, tenanted farm in Eastern region)
“Having seen others put hedges in and come back 2 years later and hit them with the hedge trimmer to try and get them back to somewhere where they were. When you see a hedge being decimated by a hedge trimmer. What is the idea? Is it to try and get the hedge bigger. What is the object? I have seen some terrible damage to hedges in the area; trying to get hedges back to the size they were 2 or 3 years ago. Trimming large branches 1.5 to 2 inches. Looks awful, split stems; must be opening it up to disease” (AES/CFE/Informal, large, mixed, mixed tenure farm in West Midlands region)
82

“Cutting hedges every two years makes a mess of them. One year’s growth these here flail hedge trimmers will cut it off like a pair of garden sheers and it looks tidy. You get two years growth it breaks it, it looks one hell of a mess. And I’m all for it looking tidy, that’s how I was brought up. I can remember when all the hedges around here were cut by hand… We can make a good job if we can do them annually, but two years… they do look a mess and that’s one reason I’ve never gone into these schemes. … A hedge should be 3 foot wide and rounded. There’s a hedge up there that’s not mine… that’s just been left to go wild and quite frankly I think it looks a mess… A tight hedge, I think the birds prefer it” (Informal only, small, arable, mixed tenure farm in East Midlands region)
Several of the farmers had not put their hedges into their ELS agreements because of the rotational hedge cutting requirements and two were was deterred from actually joining ELS because of the hedge cutting requirements. Others mentioned that they would revert back to annual hedge cutting if their agreements came to an end.
I’m not in the ELS as yet because I’m basically not terribly in favour of leaving hedges to grow; I don’t buy that one…. I’m not in favour of leaving the hedges because they tend eventually to grow wild and they get so high and the growth becomes so strong that you cannot actually maintain them properly with the hedge cutters they’ve got these days… So that’s the main reason for not joining. I think I’ve also got a tidy mind as well, you have to have hedges traditionally, properly maintained.” (Informal only, medium, arable, owner occupied farm in Yorkshire region)
Hedge cutting was one environmental activity where there was often a distinct difference between the management undertaken with an AES and informally on the same farm. Two farmers commented that of greatest benefit to the environment would be to have a mix of cutting regimes on the farm, including hedges cut annually and those on a 3 year rotational cut.
“There are a range of habitats on this farm because some hedges are cut annually and some are in ELS. I think that the combined effect is good for wildlife”. (AES/informal, medium, arable, owner occupied farm in East Midlands region)
Ditches Management of ditches by interviewees was variable, some were cleaned out every year, others left longer before clearing out. The management was generally not discussed in environmental terms, but in terms of what was required to keep the ditches clear and reduce the risks of flooding. Some were not convinced of environmental benefits because they were unable to see the wildlife benefits in the water.
(Interviewer) Do you think there will be much environmental benefit? “I don’t know really because I’m guessing it’s going to be amphibians and things. In my experience it just leads to thousands of rabbits because you’ve got this unkempt area, and the bank as well, that they can do what they like in.” (AES only, small, mainly dairy, mixed tenure farm in Yorkshire region)
83

5.4.3 In-field activities The in-field activities, such as beetle banks and skylark plots were unpopular with many of the interviewees. There were a number of reasons for this: Firstly, interviewees talked about the in-field activities impacting on the most productive land. It is inserting the “rubbish” into the most productive, cultivated land, resulting in a loss of yield. There was also concern that these activities would generate weeds and pests in the middle of the fields impacting on yields.
“When you have a crop of rape for example, and you leave anything in the middle of a field empty… you will get pigeons to be honest and that can be the problem. Once they start they will work their way out.” (No AES\CFE\informal, medium, other, owner occupied farm in Yorkshire region)
“I hope the skylarks will use them but I don’t monitor the plots for activity. I’ve noticed that they attract crows/rooks and they eat the surrounding crop”. (Informal only, small, arable, mixed tenure farm in East Midlands region)
“The skylark plots are not great, they grow grass weeds and it is land taken out of production. We have the skylarks in the sugar beet and I think they prefer that. I also think that they link in with the game cover” (AES\CFE, large, arable, owner occupied farm in East of England region)
Secondly, the in-field activities were perceived to have an impact on efficiency, as they split up fields making them more difficult to manage. This was particularly cited as an issue by those with small fields.
“I have not considered beetle banks or skylark plots because I don’t think that our fields are big enough. It’s difficult particularly with the size of the machinery. One strip in a field can make the rest of the field hard work, basically it splits the field in two”. . (No AES/CFE/informal, medium, mainly horticultural, tenant farm in North West region)
Finally, several farmers were not convinced that the in-field activities worked. Some had heard on the grapevine that in-field activities, such as skylark and lapwing plots were ineffective. This view ties in with the responses given by those who had established skylark plots or beetle banks and who appeared less than convinced of their effectiveness. Skylark plots A number of interviewees had established skylark or lapwing plots both within schemes and informally. Reasons for establishing these plots differed. Some had established the plots to help maintain the existing populations. However, they were not always convinced that there were additional benefits from having the plots. Others had established plots in the hope of attracting skylarks to the farm, but had not yet been successful
“I suspect the lapwings would nest around there anyway but at least you can see that you are doing something. We do have resident lapwings which apparently not everyone has so we must be doing something”. (AES/CFE, large, mixed, tenanted farm in Eastern region)
84

“They’ve [skylarks] not been heard for years. These [skylark plots] are out of hope, more to have it there if they come back. They’re used by Linnets, Chaffinches and Bullfinch on thistles. Didn’t realise they were here. Green woodpeckers, too”. (Informal only, large, mainly horticultural, mixed tenure farm in South East region)
Beetle banks There were mixed views about the effectiveness of beetle banks all of which had been established within AES. One farmer had established beetle banks as part of a trial with an OSR seed firm and was convinced of their effectiveness in reducing pests, however, he did say he would bring them back into production if his AES ended. Two others were less convinced of their impact in reducing pest numbers, although one thought that it had benefited the partridges.
Mr. C. has done trials with and OSR seed firm on the effects of the beetle banks on crops and it showed that beetle banks were beneficial as they increased the population of predators which fed on crop pests. The trial showed that there were fewer pests close to the beetle banks than there were in the middle of the field. (No AES/informal, large, arable, tenanted farm in Yorkshire region)
“They claim that (beetle banks) helps the crop and that the further away from the beetle bank then the less benefit there is but I have not seen this. May be it is beneficial as it stops crops being attacked, but if you spray anyway because you are worried about your crop, then more beetles (both good and bad) are killed off so might be detrimental”. (AES/CFE/informal, medium, arable, owner occupied farm in Eastern region)
Minimum tillage, direct drilling A number of farmers were direct drilling and practicing minimum tillage, particularly for oil seed rape. This was done voluntary as there are no options with AES. The reasons for these activities were explained in terms of agronomic rather than environmental benefits, for example saving time, fuel costs, better “weather window”. Nevertheless, those who were practicing minimum tillage were also mostly convinced of the environmental benefits. The environmental benefits delivered were often viewed as being related to good farm practice and resource management benefits, for example preventing soils erosion, providing greater nesting opportunities for birds and bumble bees, greater food source for wildlife.
The crops are more open and this leads to a reduction in fungicide use. (AES/informal, medium, arable, owner occupied farm in East Midlands region)
There is more ‘trash’ around on the surface which he thinks should benefit ground feeding birds. (AES/informal, medium, arable, owner occupied farm in East Midlands region)
The direct drilling provides greater nesting opportunities than conventional ploughing. He said he is working with the RSPB to increase the number of skylarks. He is very annoyed that NE promote skylark plots in their AES but do not recognise, and reward, farmers who direct drill as he thinks this provides far greater benefits. He has had research done on the farm that shows the benefits for skylarks and soil fauna. (AES/CFE/informal, large, arable, tenanted farm in East Midlands region)
85

Mr. B. said another environmental benefit of not ploughing and disturbing the soils was that there were a number of bumble bee nests in the soil on his farm. “This is our fourth season [of direct drilling] and we have seen an increase in bird numbers without any doubt.” “I don’t disturb the ground at all, or very little… therefore wildlife changes with the seasons rather than man interfering and changing it… all those seeds that have fallen during the year are still there after you have drilled it, they are still there for the birds. Once [the seeds] have germinated then we kill them off because they are no good to the birds.” AES only, large, arable, tenanted farm in East Midlands region)
Some had experimented with minimum tillage, but had little success due to the type of land, others were deterred by the costs of the equipment.
“We are on very heavy land and it doesn’t work well. We did try for 2 or 3 years but ended up getting a lot of black grass” (Informal only, small, arable owner occupied farm in Eastern region)
“If the farm was going to continue into the next generation he might have considered it, but the cost of equipment makes it unviable on such a small farm and he has his own plough”. (Informal only, small, arable, mixed tenure farm in East Midlands region)
There were also a number of, particularly older farmers, whose perceptions of themselves as farmers related to their cultivation practices “We are ploughing men”, “We like to plough”, “We’re pretty standard, we plough” Overwintered stubbles Overwintered stubbles were often left for agronomic reasons, because it fitted into the farmer’s rotation and spring cropping. Much of the overwinter stubbles were done outside of AES, although some included them in AES. Again, it seems that smaller farms experienced difficulties in including overwintered stubbles in AES.
Mr B feels that small farmers are penalized under ELS because they don’t have the size to include spring crops and stubble on a regular basis due to field patterns. (AES/informal, medium, arable, owner occupied farm in East Midlands region)
There were mixed views about the environmental benefits. Some had not noticed any wildlife in the overwintered stubbles
[Interviewer: “Have you noticed any birds?”] Respondent: “I can’t say that I’ve noticed much difference, but having said that I can’t say that I go walking through it much to see if there are any birds.” (Informal only, small, arable, mixed tenure farm in East Midlands region)
Others, however, thought that overwintered stubbles were good for the birds as it provides seeds and shelter, with one commenting that they had moved endless nests from their overwinter stubble when ploughing. Grassland
86

There was some interesting narrative around grasslands and their environmental benefits within an arable setting. A number of farmers with mixed farms advocated mixed farming systems for benefitting wildlife, believing this would produce greater environmental benefits than introducing AES options into arable systems.
“To get the birds and stuff they need livestock to survive. Because midges follow livestock and the manure produces worms. I don’t know if you noticed all the swallows when you came into our yard? There are hundreds and hundreds of them”. (AES only, medium, mainly dairy, owner occupied farm in North West region)
“The Campaign for the Farmed Environment is trying to tell you that you have to be in ELS, but it is not listening to the concept of mixed farming that is my argument about it. Mixed farming would look after the environment better than all these other ideas. Economics have stopped a lot of people keeping beef cattle. Most of the farmers around here would have had a few cattle at one time grazing odd fields. Most ploughed them up and the beef cattle go.” (AES/CFE/informal, large, mixed, mixed tenure farm in West Midlands region)
A related discourse focused on the difficulties of improving the environment when the existing wildlife resource was already depleted. Some felt that the environmental benefits they were delivering were easy gains because they were already located within rich wildlife areas, predominantly grassland areas. The view was that in the large arable areas of Lincolnshire and East Anglia it is much harder to enhance the wildlife resource.
“Farms need to be mixed to really benefit the environment. It is very difficult on arable farms. It is like setting seeds that won’t grow on your fields. If it is the wrong seed it won’t grow. If you have animals that don’t want to stay there, they won’t want to stay if they don’t have the right environment. They don’t want to stay in East Anglia with nothing out there and you can park as many beetle banks as you like but there is nothing there. It is very difficult for them, what do they do, naturally they don’t want to be there, in the open country”. (AES/CFE, large, mixed, tenanted farm in Eastern region)
5.5 Attitudes to Campaign for the Farmed Environment (CFE)
A number of questions, particularly in the revisit interviews, focused on understanding farmers’ attitudes to the CFE, as this was of particular policy relevance to Defra at the time of the research. Awareness of CFE There was general awareness amongst most of the respondents that CFE was an industry-led campaign that was trying to prevent the introduction of compulsory set-aside and for some, they saw it as something that they should support as the following quotes illustrate
“I know that CFE is about voluntary putting in margins rather than being forced. The idea is that if there are enough farmers voluntarily put in the environmental things you wouldn’t have a rule that you have got to have set-aside”. (AES/CFE, large, mixed, tenanted farm in Eastern region)
87

“It [CFE] is to try and fend the Government off. To show them that we are doing something for the environment. We are certainly doing that”. (Informal only, small, cereal, tenanted farm in East Midlands region)
A number of responses suggested that CFE had raised awareness of the importance of informal environmental activities. Some respondents wanted to be interviewed as part of the research project because they were not renewing their ELS agreements for various reasons, and wanted to stress that they intended to continue managing some features informally, thereby contributing to the CFE. Knowledge of CFE requirements Only a few of the 60 farmers surveyed, whilst aware of CFE, had any detailed knowledge of the CFE requirements. The following quote, for example, shows some awareness of the guidelines.
“I began leaving a margin both sides of the watercourse before the CFE came into being. The main reason was to simplify the LERAP form filling. However the water course feeds into the fishing lakes and the margins helped to create a pleasant setting for the fishermen. The margins are being managed in accordance with CFE guidelines by my contractor”. (CFE/Informal, medium, arable, owner occupied farm in East Midlands region)
For some, the CFE requirements were thought to be straightforward and sometimes complemented their AES agreement.
“The fallow is a good option under CFE. I’ve no problem meeting the guidelines, they are the same as ES really. (AES/CFE, large, arable, owner occupied farm in Eastern region) “Winter stubbles I put under CFE as this was the only thing I could offer that was not in AES. I wanted to support it. The rules are not difficult, pretty much common sense”. (AES/CFE, large, arable, owner occupied farm in Eastern region) [Interviewer: “Is there anything that the Campaign can do to encourage you (or other farmers) to increase uptake and quality of provision?”]
Respondent: “For me I am already doing a reasonable amount. I will put the grass margins in and decrease the management time in these areas that give a reduced yield and so that is a fair trade-off. There is a better area to target the sprays. These margins have been around for a while, where is the evidence that they are working? What is next or is this enough? (AES/CFE/informal, medium, cereal, owner occupied farm in Eastern region)
Whilst some claimed they were aware of the CFE guidelines, there was a discourse about the reluctance to follow them completely, particularly as they were voluntary requirements, as the following quotes illustrate.
“The trouble is that we do a lot of things nearly right, but to be fully right it wouldn’t work. We have a lot of over wintered stubbles but they don’t comply because I feel I have to spray them before the deadline to keep the weeds under control. It’s the same with the margins, we have a lot of margins but we don’t fully comply.” (AES/CFE/informal, large, cereal, tenanted farm in Eastern region)
88

“I suppose it depends whether they are absolutely adamant about all the rules and regulations. If that’s what they want then it’s perhaps difficult for many people to comply with them. If there’s a bit more flexibility then perhaps people could go into it a bit more easily. This would apply to me, wouldn’t it?” (AES/CFE/informal, large, cereal, tenanted farm in Eastern region)
5.5.1 Attitudes to CFE
The CFE was not mentioned in the general discourse about reasons for engaging in environmental activities, which focused on AES and voluntary measures, and usually only entered into the discussion when prompted. There were very few examples given of environmental management activities that were taken up specifically in response to CFE, more usually the CFE activities recorded were already being undertaken informally or were existing options under AES..
“Possibly some of the options we have would go into the Campaign. That is what we are going to use for the Campaign. Politicians change their mind from one year to the next. I don’t really understand where they are going to get with the Campaign. I think there are quite a few people who leave corners out of fields as it is a benefit for wildlife and at the end of the day it is probably a benefit for them”. (AES/CFE, large, mixed, owner occupied farm in West Midlands region)
[Interviewer: Do you think the CFE has had a small or large impact in the local area?] Respondent: Small, not a big issue here and there has been little local impact. All the farmers here are doing stuff but not specific for CFE. Most are in AES, but some have come out. (AES/CFE/Informal, large, arable, owner occupied farm in Eastern region)
Attitudes to CFE – additional bureaucracy Specific criticism of the CFE approach related to its perceived complexity, requirements for form filling and an overlap with AES. Some interviewees were reluctant to engage with anything which they perceived as requiring more paperwork and bureaucracy, especially if this was additional to existing agri-environment scheme, cross compliance or accreditation requirements. This was the case even for those who were already managing areas of land informally for the environment.
“I understand why it is being introduced but it is quite complicated to get your head round even for someone who has had the benefit of a university education, for someone who hasn’t it must be near on impossible. They get phased out and after a while it just does not happen. I think the conservation is going on out in the fields. Farmers love wildlife because they are closer to it than anyone, but it is another form. There is a lot of support for CFE and interest in it, part of the inertia is another form on the desk to be filled in. We are all bogged down with it”. (CFE/informal, large, mainly horticultural, owner occupied farm in South East region)
“We are put off CFE because we are already spending too much time paper working and we don’t want any more paperwork. Personally, I think that it [CFE] is just a quango. We are doing it, I think we are just doing it. I can’t understand why it can’t always be done on the SFP forms. As far as I’m
89
concerned the CFE hasn’t got much hope”. (AES/Informal/CFE, large, mixed, owner occupied farm in West Midlands region).
[Interviewer: “ I see you’ve not taken part in the Campaign, why’s that?”] Respondent: “It’s more form filling, simple as that.” (Informal only, small, cereal, mixed tenure farm in Eastern region) “I believe in what the campaign is for but the body overseeing it is just doing something that the AES are doing. Seems like a needless umbrella and it is not market related so it will struggle. There are others that are needless (Combinable Crops Assurance Scheme) but you need them to sell the products. (AES/CFE/informal, medium, arable, owner occupied farm in Eastern region)
Attitudes to CFE – outside interference One farmer had land that was coming out of CSS and most of it went into ELS. He thought about putting the remaining land into CFE but thought it was too complicated and was concerned about outside interference:
“There was some of the Countryside Stewardship [and] that I didn’t enter into ELS and err... how do you go about registering it for the CFE, b*gger it, I won’t bother, I’m doing it voluntarily. I’m doing it because I want to. If people start coming round and telling me ‘thou shalt’ then I’ll plough it.” (AES only, large, arable, tenanted farm in East Midlands region)
This farmer thought that he was doing enough already through ELS and his voluntary management and did not want to be told what to do and he resented people wanting to know what he was doing.
“It’s my business what I do, no b*gger else’s.”
Interestingly, the same farmer viewed CFE as a form of compulsion as it had the threat of compulsory set-aside behind it. He thought that farmers responded best to well-targeted advice rather than compulsion.
“Under compulsion the minimum possible would be done by farmers and many environmental opportunities could be lost”.
Attitude to CFE – production losses It appears that for some, attitudes to CFE have been affected by the recent increases in cereal prices. One farmer who had a strong grasp of CFE guidelines was contemplating putting his previous ELS margins back into production due to cereal prices. The following quote suggests that this course of action would just be following the trend that other farmers are taking
“I’m going to have to make some decisions about what I’m going to do with those margins that have come out of the ELS, obviously we are in the Campaign for the Farmed Environment, but I don’t get paid for that and the way that the price of corn is.... It said in the Farmers Weekly that 26,000 ha of land have come back into production, that’s the price of wheat obviously, least 9 times out of 10 that is why… well obviously that is bad for the Campaign for
90

the Farmed Environment because it doesn’t help reach the targets or whatever”. (AES/CFE, large, arable, mixed tenure farm in North East region) Interviewer: [“How do you think that the CFE is viewed in the farming industry?”] Respondent: Not a great impact here, a necessary evil maybe. Can farmers carry on taking land out of production when wheat prices are at £150/tonne. We had a farm sell locally that was in a very poor state and it fetched £8,600 per acre. For that price taking land out for a voluntary scheme is going to struggle.” (AES only, large, arable, mixed tenure farm in Eastern region)
There appeared to be some discrepancies between what was recorded on the CFE postal survey forms and what was said in the interviews. For example, although some interviewees had ticked the box stating that they had joined ELS in response to CFE, this was often not mentioned in discussion about the reasons for joining. Also some of the voluntary management activities recorded as part of the Campaign were actually ELS/HLS options. Nevertheless, there was evidence of a considerable amount of informal environmental activity taking place on the farms. Particularly in relation to field margins, field corners and odd permanent pasture fields that has been left unfertilised for decades.
5.5.2 Attitudes to cross compliance
The majority of the respondents viewed the cross-compliance requirements as common sense and simply good farming practice. Most believed they would continue with the cross-compliance requirements if they were no longer enforced.
“Cross compliance is basically good husbandry of what you are doing. You just need to keep your eye on it” (AES/informal, large, mixed, owner occupied farm in North East) Mr Q does not have a problem with cross compliance. He understands the rules. He would continue with the measures if they were not there. (AES only, small, dairy, mixed tenure farm in Yorkshire) Mr A has no real problems [with cross-compliance] apart from the red tape. Mostly common sense and good farming practice. (AES/informal, medium, arable, tenant farm in East Midlands) Mr N said cross compliance was not a problem on the farm. It seemed to be common sense in most cases and could not think of any specific problems they had. Thinks they would just carry on as normal if cross compliance was removed, they were doing it anyway. (AES/CFE, small, dairy, owner occupied farm in East Midlands region) Does not cause any major problems. Again he found it ‘comfortable’. Mr. B. said that it would have been an issue if he was still farming like he did in the 1970s. (Controlling vegetation in ditches by spraying chemicals and ploughing right up to the hedges). But he stopped that in the 80s and 90s so cross compliance is not a big issue. (AES/Informal, medium, arable, tenant farm in Yorkshire region) [Interviewer: Would you continue with the cross-compliance measures if they were no longer a requirement?]
91

Respondent: Now we would – but not before. We keep our distance now around the edge but before went right up to the edge. If there were no cross compliance he would continue to manage the land in a similar way. He mentioned that the rules and regulations, such as for spraying, were largely based on common sense and he was doing it anyway because he is a good farmer. (Informal only, medium, mixed, owner occupied farm in East Midlands) He has had an inspection and had no problems. He feels that the regulations are not relevant to farmers who have always carried out good farming practice. He considers himself a good farmer and therefore does not have any problems fulfilling the regulations. However, he disagrees with the 2m margins around hedges as this takes valuable land out of production. (Informal only, small, arable, mixed tenure farm in East Midlands)
There appeared to be a general acceptance of the 2 m margin requirement, recognising that they provided environmental benefits as well as reducing the risk of damage to the machinery, although fears were expressed about receiving fines for margins that were accidentally too narrow. A few respondents viewed the margins as harbourers of pernicious weeds and one resented taking land out of production which could be used to feed the world.
They have hard and fast rules. There should be some more flexibility. He thinks they have eased up a bit on the 2m field margins as it is not easy to hold the machinery straight. There has to be a bit of give and take. (AES/CFE/Informal, medium, mixed, owner occupied farm in West Midlands region) Don’t really understand the 2 metre margins on hedge – what is that about, just a mess and overgrown and it grows rubbish and that is where your weeds are (Brome and black grass). Not big enough to do anything with, cost farming industry a good deal of money. Yes did plough too close and spray on edge of crop but they are a weed source. I can see 1 m on ditch and see purpose for that and like hedge cutting regs to avoid nest season as they make sense. (AES/CFE/Informal, large, mixed, mixed tenure farm in South East) He does not agree with the margins around hedgerows because they harbour thistles and weeds and they invest good grassland. He also thought that the 2m margins on arable land encouraged pernicious weeds to come out onto the cropland. Mr. V. has had problems in the past from weed infestation on his arable land. (Informal only, medium, arable, owner occupied farm in Yorkshire region)
5.6 Influence of previous AES experience - learning
On a number of occasions, respondents referred to experiences in previous AES which had influenced their options choices or management practices for new AES. One example, included a farmer who had some low input grassland fields in CSS which they discovered the sheep preferred to those that were fertilised. They have since converted all their fields to low input grassland in their current HLS schemes.
“In CSS we leant some interesting things with the sheep. We were fertilizing the grassland that wasn’t in CSS and the sheep always wanted to get back on
92

the grass that wasn’t fertilized. It is almost not like grassland, it is vetches and weird stuff and they love it. We now put less fertiliser on. It is all low input now. We try and encourage the clover”. (AES only, large, mixed, mixed tenure farm in West Midlands region)
In another example, a farmer had learnt that the pollen and nectar mixes established under CSS did not seem to take very well on his type of land so these were avoided under ELS.
Mr. B’s experience of CCS has influenced the option choice in ELS..... Pollen and nectar mixes did not take very well on his land so he decided against this option in ELS. (AES only, large, arable, tenanted farm in East Midlands region)
A number of respondents felt that they had learnt from their experiences of implementing AES prescriptions to identify the practices that worked best for their land. This often led to some frustration as the following quote in relation to establishing wild bird cover illustrates.
Mr. B. thought that on his type of land the prescriptions for the management of wild bird cover were incorrect and actually harmed wildlife. He said that planting wild bird cover on his land needed additional inputs to make it grow because the land was so poor. He had had experience of the prescriptions failing. The prescription’s needed to be tailored to local conditions. Defra/NE needed to listen to farmers and take account of their practical experience in implementing different AES options. He wanted the wild bird cover to get established as much as NE, but he was sure he knew a better way of doing it because NE’s way is not always successful. (AES/Informal, medium, arable, tenant farm in Yorkshire region)
5.7 Interaction between AES and informal activities
A recurring theme was that many of the current AES options were previously managed informally. This particularly related to margins and field corners.
“It’s probably underestimated how much is done voluntarily. … Lots of farmers have corners and corridors but the bulk are part of schemes. Lots of features in schemes were originally managed already, such as field corners and buffer strips, so just because they are now part of a scheme doesn’t mean that they weren’t managed voluntarily.”
Also it appears that margins additional to the AES requirements are being managed due to the increased flexibility that this offers the farmer.
“There were some margins that we were doing outside of ELS, because the ground was poor and it gave us the chance to alter things if we wanted to. These margins have now gone into HLS”. (AES only, large, mixed, mixed tenure farm in West Midlands region) “We have a half acre pollen and nectar mix running down the side of the margin. This is also in HLS. We have another one that is not in HLS and not paid for. I put that one in because you have to rotate them every 5 years because the cover runs out of steam so you get a year without any cover on it because you have to plough it up, so I have two. So if anyone comes round to inspect I have has another one”. (AES/CFE, large, mixed, tenanted farm in East Midlands region)
93

Also there is some evidence that some farmers have brought other margins on the farm outside of the agreement into the same management as required by their AES. In part, due to ease of management, but also recognising the overall benefits.
“We have 6 metre strips by the side of every drain… So they are totally protected from fertilizer, chemical and anything like that. And then the next 12 metres we don’t spray anything on that either after February. So any insects and grubs are totally protected… We only have to do a small acreage for the scheme but we do the whole lot, because we feel the benefits are there and we don’t lose a whole lot. You get a weed or two, you get a bit more disease in that outside but we’ve seen benefits where, for instance, aphids are less prevalent near the edge because we feel that there are predators working their way from the edge in. So if we leave that first 12 metres it’s not such a big deal for us because the predators are there as well as the problem. (AES/CFE, medium, arable, tenanted farm in Yorkshire region)
5.8 Farmers’ Perceived Scores
At the end of the face-to-face interviews farmers were asked to score individual environmental activities that they had identified on their farms on a 3 point scale reflecting the extent to which they thought, based on their experience and observations, that they benefited the environment with 1 being ‘Not Convinced Of Any Benefits’, 2: ‘A Few Benefits’ and 3: ‘Significant Benefits’. The mean perceived scores for individual features managed either within an AES, within CFE, informally or not for the environment are presented in Table 5.6.
94

Table 5.6 Mean perceived environmental scores for individual features
Perceived scores No. of farms AES CFE INF OTH AES CFE INF OTH
Margins Buffer strip - B 3 2 2 2 18 4 10 4
Buffer strips - RP 3 3 2 8 4 13
Field corners 3 2 3 1 12 3 11 1
Game crops 2 3 3 10 7 14
Pollen/nectar mix 2 2 2 7 2 1
Woodland type, edge 3 3 2 3 13 1
In-field features
In-field trees 2 3 2 5 4 5
Short-term fallow 2 2 3 3 1 2
Arable reversion 2 3 3 2 1 2
Beetle banks 2 3
In-crop fallow plots 2 3 4 1
Skylark plots 3 3 1 2
Crop types & rotation 3 3 2 3 2 1
Stubbles 2 3 2 3 6 2 9 3
Grassland 2 3 10 7
Boundaries
Hedgerows 2 3 2 20 25 6
Stone walls 3 1 2 1
Ditches 2 2 2 3 6 7
MEAN 2.4 2.3 2.5 1.7 1= Not Convinced Of Any Benefits 2 = A Few Benefits 3 = Significant Benefits
AES = Managed within an agri-environment schemes; CFE = managed as part of Campaign for Farmed Environment; INF = managed outside of any scheme; OTH = not managed for the environment
These scores are analysed in more detail in Section 7.
95

6 Environmental Assessment 6.1 Introduction
The methodology used for assessing habitats and features of environmental value was based on a scoring system derived from a literature review, which provided the basis for selecting attributes of importance in relation to the environmental benefits of interest. Habitats and features were assessed in relation to three themes: farmland birds, wider biodiversity and resource protection (soil and water). These were chosen because they are the three themes used as a focus for the Campaign for the Farmed Environment, and also encompass those identified in the project specification (habitat quality for wider biodiversity or resource protection, plant diversity, flower resources, presence of BAP species or habitats etc.). They are also related to key Government environmental policy issues. The scope of environmental issues relating to each of the themes is discussed briefly here. The full report detailing the specific attributes assessed and the scoring system developed for this study can be found in Appendix 3.
6.1.1 Farmland birds
Farmland birds require three types of resources: nesting habitat, summer foraging habitat and winter foraging habitat. Nesting habitat varies between species from those that nest on open ground away from trees or boundary structures (e.g. skylarks, lapwings) to those that nest in tall hedges or trees (e.g. bullfinch, turtle dove), an intermediate group being species that favour tall marginal vegetation close to boundaries or at the base of hedges (e.g. yellowhammer, whitethroat). Some tree-nesting species use holes, such as the tree sparrow, while some species that typically use tall vegetation in field margins or by watercourses will also nest within crops (e.g. reed bunting). Chicks of most species require invertebrate food, whereas many species of conservation concern are seed-eaters in winter. Availability of insect-rich feeding habitat is therefore important in spring and summer, but as well as having a high density of invertebrate prey, the habitat also needs to be accessible. If the vegetation is too dense, birds may find it difficult to forage in and not be able to take advantage of the food resources present. Raptors and owls require healthy populations of vertebrate prey. For the two species of conservation concern that are typical of farmland, kestrel and barn owl, small mammals are the most important food source. The assessments identified are designed to address these issues. Direct measurement of insect and seed resources is too labour intensive to be carried out in most cases, so proxy vegetation-based measures are undertaken instead. These can be interpreted in terms of food resource availability on the basis of previous studies reported in the literature.
6.1.2 Wider biodiversity
This includes plants, invertebrates and mammals. Most plants occurring on farmland are common species that are mainly of interest in terms of the habitat and food resources they provide for animals. However, a number of arable species are becoming increasingly rare and are targets for management prescriptions under agri-environmental schemes. Species-rich grasslands are BAP habitats that may be found on mixed farms and contain species of conservation interest in their own right.
96

Invertebrates include a huge range of taxa. In assessing the impact of different types of management this research concentrates on groups of conservation interest or that provide key ecosystem services, for which sufficient knowledge of habitat requirements exists, and with functional attributes that can be readily related to easily assessed habitat characteristics. Mammals of particular interest on arable farmland include the brown hare (a BAP species dependent on open farmland); also voles and mice (often referred to, along with shrews, as ‘small mammals’) which these are an important food source for raptors, owls as well as predatory mammals. As for birds, vegetation-based habitat condition measures are used as proxies for direct assessment of outcomes for wider biodiversity. However, the large literature on habitat value of different types of vegetation will allow interpretation of the results in terms of value for the taxa of interest.
6.1.3 Resource protection
Soil structure, erosion and water quality are the key elements of concern here. The Cross-Compliance Guidance for Soil Management is a useful source of reference on key issues, soil management and siting for buffer strips (RPA/Defra 2009).
6.2 Analysis of environmental quality - methods
Information on feature quality was derived from both field measurement and management information obtained from farmer interviews. For each attribute, scoring criteria were defined on a 3 point scale for each of the habitats or features to be recorded. Example scores (buffer strips) are included in Table 6.1. On each farm and for each management category, up to three examples of each feature type were assessed in the field. Scores were calculated for each individual feature and means were calculated at the farm level. Table 6.1 Scoring criteria for buffer strips and grassy field margins
Attribute Score
1 2 3 Width (in addition to cross-compliance strip)
2-4m wide 4-6m wide >6m wide
Cutting time Cut between 1 May and 31 July
Not cut between 1 May and 31 July
Not cut between 1 April and 31 August
Cutting frequency Cut annually No more than once every 2 years
2-3m near boundary no more than once every 2 years, rest cut annually
Compaction Severe compaction, permanent track-way etc.
Evidence of occasional use as track
No compaction
97

Vegetation cover - birds11
Complete cover Cover ± complete but with some open ground e.g. bare strip between margin and crop, track
>20% bare ground or very short vegetation within margin to allow foraging access
Vegetation cover - RP12
> 25% bare ground Up to 25% bare ground
Complete cover
Seed mixture Sown with simple grass mix (1-2 spp)
Naturally regenerated or sown with diverse grass mix ± 1-2 common forbs (e.g. clover)
Sown with diverse grass mix
Vegetation diversity
Dominated by grasses and/or undesirable forbs13
1-3 desirable spp forbs/m2, <20% cover undesirable forbs.
Diverse species mix, >3 forb spp/m2 on average, <10% cover undesirable spp.
Nutrient enrichment
20% or more mean cover of cleavers, dock and nettles
<20% but >10% mean cover of cleavers, dock and nettles
10% or less mean cover of cleavers, dock and nettles
For most features, a single environmental score is derived which encompasses the overall environmental quality of the feature relating to all three themes. For margins, field corners and short term fallows the observed scoring criteria are different for resource protection and birds since their requirements in terms of vegetation cover are quite different. Birds value a certain amount of short vegetation or bare ground where they can gain access to forage, whereas complete vegetation cover has greatest benefits for resource protection. Vegetation cover is an attribute within the scoring system for buffer strips, field corners and short term fallow, hence for these features two scores were calculated. All features were scored in terms of their benefits for birds, since they can potentially utilise features wherever they appear in the landscape. Resource protection scores for buffer strips and field corners are restricted to those features adjacent to a watercourse (any surface water body which regularly contains standing or running water) since this is where they will have greatest value. However, it must be remembered that resource protection benefits will not arise exclusively from land immediately adjacent to a watercourse; significant benefits, particularly to soil conservation can be achieved away from watercourses if features are suitably sited (e.g. on susceptible soil types on steep slopes). Resource protection scores have been calculated for all short term fallows, because these are largely whole fields therefore represent benefits which relate less specifically to adjacent habitats. Feature scores are based on mean scores for a different number of attributes for each feature/habitat (Table 6.2). No weighting has been applied, therefore all attributes are assumed to be equally important for the purpose of these analyses. On a small number of farms either interview or field data was missing for some features, because the surveyor was unable to conduct the interview or because features could not be located in the field. For these features, scores were based on the subset of attributes that had been recorded.
11 Appropriate next to hedges etc 12 RP = resource protection – appropriate for buffers next to watercourses. 13 Creeping thistle, nettles, cleavers, docks, ragwort, non-native spp.
98

Scores are generated differently for the different features/habitats therefore they cannot be assumed to be directly comparable between feature types. The range and mean of scores calculated for individual features are presented in Figure 6.1 and these data suggest that scores are likely to be higher or lower for some feature types. The full range of possible scores was recorded for individual ditches (1-3), whereas arable reversion scored between 1.3 and 2. These differences are likely to represent a combination of the effect of the scoring system and the environmental quality of the features. However, the scores do allow an objective assessment of differences within feature types. Table 6.2 Summary of the range of observed (environmental assessment) scores for individual features
No. of attributes
Score range
Feature type Field Int. No. of
farms Mean Low Medium High
Buffer strip - Birds 5 3 60 2.09 1.50-1.99 2.00-2.18 2.19-2.67 Buffer strips - RP 5 3 32 2.21 1.79-2.00 2.01-2.34 2.35-2.67 Field corners - Birds 4 4 38 2.23 1.75-2.00 2.01-2.49 2.50-2.75 Field corners - RP 4 4 9 2.46 2.00-2.30 2.31-2.60 2.61-3.00 Game crops 3 3 31 2.04 1.29-1.80 1.81-2.20 2.21-2.67 Pollen/nectar mix 2 2 8 1.95 1.50 2.00-2.08 2.50 Conservation headlands 2 3 3 2.01 Woodland type, edge 1 1 21 2.11 1.00-1.60 1.61-2.20 2.21-3.00 In-field trees 2 1 29 1.88 1.00-1.69 1.70-2.10 2.20-2.83 Short-term fallow - Birds 4 3 7 2.61 2.25-2.49 2.50-2.75 2.76-3.00 Short-term fallow – RP 4 3 2 2.50 2.00-2.50 2.51-2.90 2.91-3.00 Arable reversion 2 5 6 1.70 1.30-1.60 1.61-1.80 1.81-2.00 Beetle banks 4 0 2 2.50 In-crop fallow plots 2 0 7 2.10 1.50-1.99 2.00-2.49 2.50-3.00 Skylark plots 2 1 1 2.30 Crop types/ rotation 1 7 52 1.71 1.00-1.50 1.51-1.99 2.00-2.38 Stubbles 2 4 18 2.05 1.50-1.99 2.00-2.20 2.21-2.83 Grassland 3 6 50 2.10 1.30-1.95 1.96-2.21 2.22-2.78 Hedgerows 5 2 67 2.32 1.62-2.19 2.20-2.43 2.44-3.00 Stone walls 1 1 5 2.79 2.10-2.49 2.50-2.84 2.85-3.00 Ditches 2 5 37 2.29 1.50-2.10 2.11-2.47 2.48-2.93
As the range of observed scores (derived from the environmental assessments) varied for different measures, it was not possible to compare farmers’ perceived scores (which usually encompassed the full potential range of scores of 1-3) directly with the observed scores. Therefore, in order to compare perceived and observed scores (see Section 7) observed scores were assigned to high, medium and low categories, equivalent to 1, 2 and 3 scores. For each feature type, observed scores were ranked by absolute score and assigned to a category based on an even distribution of farms in each of the three categories. Therefore, for each feature type, the range of scores within each category varied (Table 6.2) but the same number of farms were allocated to each category.
99

1
1.2
1.4
1.6
1.8
2
2.2
2.4
2.6
2.8
3
Score
Feature Type
Mean
n=159
n=63
n=67n=11
n=68
n=12
n=5
n=44n=53
n=7
n=2
n=8
n=2
n=7
n=1n=52
n=23n=128
n=201n=17
n=92
Figure 6.1 Summary of the range of scores (max/min) for individual features assessed
6.3 Analysis of environmental quality – comparison of different management approaches
Table 6.3 presents mean observed environmental scores for each feature type/management combination and indicates into which category (high, medium, low) these values fall based on the range of scores for each feature type at the farm level (Table 6.2). As AES features form part of an agreement it was possible to accurately assign these to the AES category. However, the other categories, CFE, Informal and Other, are based on the farmers’ understanding of what constitutes a particular management type and therefore represent a more subjective allocation to a management category. In particular, experience from this study and other work relating to the CFE suggest that there is considerable overlap between CFE and Informal environmental management.
The mean scores suggest that for most feature types, there are limited differences in the quality of management and feature condition based on the scoring system. The overall mean score calculated across all feature types suggest that features managed under an AES are of higher environmental quality than those outside an AES and that features not managed for the environment are indeed of lower environmental quality than others. However, not all features are represented in each management category (particularly for the CFE which is focussed on in-field management) therefore these overall mean figures may be affected by the potential scores for the features assessed. For example, stone wall scores are high, but were only recorded under AES management.
Comparisons between management categories for individual features suggest that environmental quality is greater under AES (by a score of at least 0.2) compared to other management for: pollen and nectar mixes, woodland edges, short term fallow (birds and RP), arable reversion, in-crop fallow plots, overwinter stubbles, hedgerows and stone walls. At the other end of the spectrum, Other management was apparently of lower environmental benefit than the other management categories for: in-field trees, grassland and stone walls. However for some feature types, the number of farms on which a feature was assessed
100

under each management category was very low, therefore differences should be treated with caution. Field corners not managed for the environment score higher for birds than other management types, however this is based on a single farm where a single feature was left unmanaged. CFE management of buffer strips and game crops scored higher than AES management of these features, but scores for other features under CFE management were lower than AES.
Table 6.3 Observed environmental scores for individual feature types under different management categories with high medium and low categories based on the range of scores for each feature type at the farm level
Mean (Observed Scores) No. of farms AES CFE INF OTH AES CFE INF OTH
Margins Buffer strip - B 2.11 M 2.23 H 2.05 M 2.09 M 24 4 29 3Buffer strips - RP 2.23 M 2.41 H 2.17 M 12 3 17 0Field corners - Birds 2.31 M 2.20 M 2.28 M 2.50 H 16 4 17 1Field corners - RP 2.25 L 2.53 M 2 0 7 0Game crops 2.04 M 2.22 M 1.95 M 9 7 15 0Pollen/nectar mix 2.01 M 1.50 L 7 1 0 0Conservation headlands 2.01 3 0 0 0Woodland type, edge 2.60 H 2.00 M 2.00 M 5 12 4In-field features In-field trees 1.90 M 2.02 M 1.56 L 5 0 16 8Short-term fallow - Birds 2.70 M 2.50 M 4 0 3 0Short-term fallow - RP 2.75 M 2.33 L 1 0 3 0Arable reversion 1.84 H 1.30 L 1.50 L 4 1 1 0Beetle banks 2.50 2 In-crop fallow plots 2.17 M 2.00 M 5 0 1 1Skylark plots 2.33 0 0 1 0Crop types & rotation 1.72 0 0 0 52Stubbles 2.33 H 2.00 M 1.87 L 2.02 M 4 1 5 8Grassland 2.20 M 2.10 M 1.90 L 19 0 20 11Boundary features Hedgerows 2.46 H 2.29 M 2.14 L 23 0 34 10Stone walls 2.96 H 2.10 L 4 0 0 1Ditches 2.27 M 2.32 M 2.22 M 8 0 23 6Overall Mean Score* 2.30 1.98 2.14 2.03
* excludes features present in only one management category.
Where sufficient data were available across different management types (minimum of 3 farms per management type and a minimum of 15 farms in total), analysis of variance was carried out on farm scores for each feature. Fisher’s least significant difference test was used to identify significant differences between means. Sufficient data were only available for: margins (birds), margins (resource protection), game crops, woodland, in-field trees, grassland, hedgerows and ditches. There were significant differences between management types only for in-field trees and hedgerows (Figure 6.2). In-field trees managed informally scored higher than those not managed for the environment. Hedges managed under AES
101

scored higher than those managed informally or not managed for environmental benefits. The small number of significant differences between management categories may be related to the variability of scores between farms; scores for many features had similar ranges for different management.
0
0.5
1
1.5
2
2.5
3
In‐Field Trees Hedgerows
Mean en
vironm
ental score
ES
Inf
Other
ab b
a
aa
bp= 0.029
p= 0.010
Figure 6.2 Differences in environmental scores between management types. Different letters denote means that are statistically different14.
The high, medium and low scores based on farm level means by management and feature were applied to the overall mean feature scores by management category (Table 6.3). The proportion of features in each category are presented in Table 6.4, although only seven and nine features were recorded under CFE and Other management respectively. Management under AES and CFE had the highest proportion of features scoring in the ‘high’ range and fewest ‘low’ scores were recorded for AES management. No features under informal and only one feature (sampled on a single farm) under Other management were recorded in the ‘high’ range, however a much larger proportion of features under informal management scored in the ‘medium’ range compared to features not managed for the environment. This suggests that, although differences in scores were relatively small and between farm variability was high, there was some effect of management type on the quality of feature condition.
Table 6.4 Proportion of features in the high, medium and low categories for each management type.
AES CFE INF OTH
% of feature types n = 17 n = 7 n = 15 n = 9
High range 29 29 0 11
Medium range 65 43 80 44
Low range 6 29 20 44
14 Therefore ‘a’ is different to ‘b’, but ‘ab’ is not different to either ‘a’ or ‘b’.
102
6.3.1 Comparison of attributes under different management within farms
Only buffer strips, field corners (bird scores), game crops, in-field trees, grassland and hedgerows were recorded under different management categories on the same farms. Within-farm comparisons of the scores suggested relatively few differences, although the data have not been statistically analysed. Buffer strip scores were largely similar for the different management categories, although on one farm informal scores (birds) were lower than CFE scores due to more frequent cutting and compaction as a result of vehicle access. On another farm, CFE buffer strips scored lower than AES or other strips because they had low species diversity and relatively high cover of nitrophilous species. Scores for field corners could be compared on only one farm and were very similar for AES and CFE management. On two of the three farms with game crops, benefits from AES and CFE management were greater than for informal management. These differences were due to the lack of crop cover other than maize and limited cover of high value weeds on one farm. Scores for other management were higher on the third farm, again as a result of differences in high value weed species. However, scores for all three farms were based only on field assessments and, although farms were revisited in the autumn to reassess cover of crop and weeds at an appropriate time of year, the timing of assessment could have had an effect on the scores. On one farm, grassland AES scores were higher than other management scores because swards were not resown and fertiliser inputs were lower. Similarly on another farm, AES scores were higher because fields were not resown, but also because they were exclusively grazed as opposed to those under other management which were cut for silage. Comparisons of hedges under different management could be made on eight farms, although scores were different on only three. Scores for AES management were higher than informal management on one farm because hedges were cut less frequently. On another farm the AES hedge scored relatively low because it was short narrow and gappy compared to hedges in informal management. On the third farm, informal management scored lower than AES or other management because one feature was small and gappy and another example was cut annually and the cross-compliance strip was not sufficiently wide. Overall, where comparisons could be made between management categories within farms, differences in scores were limited. Where differences were apparent, the reasons were due to a wide range of factors.
6.3.2 Comparison of attributes between farms
Scores for individual attributes under different management categories are presented in Table 6.5 in order to understand which aspects are affecting overall scores. Buffer strips were wider under CFE and AES management, but were notably widest under CFE. However, AES management of 2 and 4 m buffer strips would meet the requirements of the scheme but would not score highly in the system used here, whereas CFE management requirements specify a buffer strip of at least 6 m. Margins >6 m wide score highest for this attribute. Cutting time scores were lower for AES and CFE than for Informal or Other management, however, there is no guidance on cutting time for AES 2 and 4 m buffers. Margins in Informal and particularly Other management were more likely to be used for access on a regular basis, resulting in significant compaction. Seed mixtures scored
103

highest on CFE margins. However, margins generally scored 1 if they had been sown, because most were sown with a simple grass mix, and 2 if they had been established by natural regeneration. A greater proportion of CFE margins had been established by natural regeneration than other management types. Only a small number of margins (AES and CFE) scored 3 having been sown with a diverse mix. Most buffer strips scored highly for nutrient enrichment (cover of cleavers, docks and nettles) reflecting the fact that most buffer strips were dominated by grasses. However, a small number of margins across all management types had high levels of nutrient enrichment. Field corners under Informal management were generally cut on an annual basis and a greater proportion of AES, CFE and Other field corners scored high for this attribute because they were not cut, although in the long term this lack of management would not be environmentally beneficial. Those under Informal management were most likely to be cut very early in June or July. Most features scored high for compaction, although some had evidence of occasional vehicle access. Similar to buffer strips, sown swards usually scored low, having been sown with a basic grass mix, whereas naturally regenerated swards scored higher. Diversity of desirable broad-leaved (not grass) species was generally low, but examples of high diversity were recorded on all management types except Other. Few features were treated with herbicide or were used to store manure. Game/wild bird covers were generally sown with a more beneficial mix of crop species under AES and CFE management, although some AES features included maize despite the fact that the prescription excludes this species for wild bird covers. Many features under Informal management had been sown exclusively with maize, however a small number of farms under these management categories had followed the AES prescription and achieved high scores for this attribute. Sown crop cover was higher on CFE or Informal management, but this analysis included maize cover and only a subset of farms was revisited in the autumn to assess cover at the most appropriate time of year; many of the early summer assessments would have been undertaken shortly after drilling, particularly in 2012 because of the late season. High value weed cover was similar across all management types, but again was sensitive to the time of assessment. AES and CFE bird covers were retained for longer in the spring. A greater number of AES features received herbicide application than other management categories, whereas insecticides were most commonly used on CFE features. Pollen and nectar mixes were only recorded on one farm outside an AES agreement therefore comparisons between management cannot be made. However, highest individual attribute scores were recorded for flower density, but lowest scores for desirable plant species cover. Similarly conservation headlands were only present under AES management. Higher scores were recorded for width and herbicide use, however, weed cover and fertiliser use were the lower scoring attributes. Woodland edge management under AES was much more likely to be applied to semi-natural woodland and woodland that was actively managed for environmental purposes than under other management categories. In-field trees under Informal management had better environmental scores than those under Other management for most attributes, although only five farms had in-field trees in AES. The attribute that scored lowest was cultivation; only one example of uncultivated land extending beyond the canopy was recorded (in AES) and for many trees, particularly under Other management cultivation extended under the canopy. Fallen branches were more likely to remain unmoved beneath trees under Informal management, however, there was not always evidence to assess whether fallen timber was usually moved. Scores for livestock damage were similar across the three management types. Although this attribute
104

was not relevant on exclusively arable fields, only two farms had taken positive action to limit damage by livestock. Short term fallows were only assessed on a small number of farms and information on management was not available for any of the features under Informal management. Scores for individual attributes were generally high, particularly for AES features. Vegetation diversity was greater on AES fallows compared to Informal features, with a larger number of desirable broad-leaved species present and lower cover of undesirable species. Arable reversion was only recorded on a few farms and most examples were in AES. Scores for individual attributes were variable, however, low rates of fertiliser were generally applied, whereas the sown seed mix was usually grass only, hence scores for this attribute were low and unsurprisingly almost all swards were classed as improved. In-field fallow or skylark plots were only recorded on a few farms, and individual attribute scores were variable. Cropping was recorded as ‘Other’ management on all farms because the rotation and cultivation were defined by factors other than environmental benefits, although elements of the management were considered environmentally beneficial on a small number of farms. Overall, attributes that scored high were for cultivation (a number of farmers used minimum tillage on all or part of their holding) and for organic manures (one third of farms applied manure regularly). Low scoring attributes were crop diversity (only three farms had at least five crop types in the rotation) and presence of grass leys (only one third of farmers had grass in the rotation). Overwinter stubbles were assessed on a relatively few farms, but AES and CFE scores were higher than Informal or Other management for most of the individual attributes. Similar to game/wild bird cover, not all farms could be assessed at the most appropriate time of year to assess weed cover. Herbicide use was lower on AES and CFE farms and consequently weed cover was higher. AES and CFE stubbles were cultivated later than those under other management types. Scores for the type of stubble left and removal of compaction were rather variable. Grassland scores showed differences that were sometimes small, however, for many attributes there was a trend for higher scores to be recorded on AES features, lowest on Other features, with Informal management intermediate. Nitrogen applications to grassland were lowest under AES management and highest under Other management. AES grassland was most likely to be permanent pasture that is never resown. AES grassland was most likely to include a late hay cut, whereas Other grassland was most likely to be cut for silage. Across all management categories scores for botanical diversity were low and most swards were improved, however, some fields under voluntary and particularly AES management were semi-improved or (a very small number) unimproved. There were no differences between management types for: supplementary feeding, poaching or grazing management. Hedges scored highest for structural attributes (height, width, gappiness), whereas cutting frequency and timing scores were lower overall. Hedges in AES were tallest and those not managed for the environment were shortest, however differences were small because most hedges achieved a maximum height score. Those not managed under Other were narrower than other management categories, however, two thirds of all hedges scored 3 for this attribute. The proportion of hedge gaps was slightly lower for features in AES management. Uncultivated strips adjacent to hedges managed under Other management were narrower than for AES or Informal categories, and 53% of strips adjacent to Other hedges did not meet the cross-compliance requirements compared to 20% for AES and 18% for Informally
105

managed hedges. AES hedges were cut least often and were most likely to be cut in late winter, whereas most hedges under other management were cut annually and most likely to be cut during spring or summer. Hedges under Informal management had intermediate scores for these attributes. Ditches under Informal management were cut slightly less frequently than other features. Few ditch banks were cut in late winter (and only features in AES), however features in Informal management were more likely to be cut in spring and summer than those not managed for the environment. However, ditch banks were often cut at a convenient point in the rotation, rather than for environmentally beneficial management. Generally, vegetation in the ditch bottom was cut infrequently and ditches were dredged less than once every five years. AES ditches were dredged slightly more frequently than others, but aquatic vegetation occurred more commonly in AES ditches. Overall, there was little pattern to scores, probably because many ditches across all management types received little management. Table 6.5 Mean attribute scores from the observed environmental assessments for features under different management categories Note that n numbers may be lower for individual attributes
Attributes AES CFE INF OTH Margin features
Buffer strips n=24 n=4 n=29 n=3 Width (in addition to CC) 2.07 2.95 1.86 2.11 Cutting time 1.80 1.33 2.00 2.50 Cutting frequency 1.73 2.25 1.58 1.67 Compaction 2.66 2.62 2.26 1.39 Vegetation cover - birds 1.80 2.33 2.04 2.83 Vegetation cover - RP 2.54 3.00 2.56 Seed mixture 1.57 2.33 1.54 1.50 Vegetation diversity 2.09 1.65 2.02 1.56 Nutrient enrichment 2.94 2.38 2.87 3.00
Field corners n=16 n=4 n=17 n=1 Cutting time 1.67 1.00 1.30 3.00 Cutting frequency 2.47 2.50 1.81 3.00 Compaction 2.72 2.75 2.71 3.00 Vegetation cover - birds 1.71 1.13 1.91 2.00 Vegetation cover - RP 3.00 2.43 Seed mixture 1.64 1.50 1.81 2.00 Vegetation diversity 1.89 2.00 1.94 2.00 Storage of manure 3.00 3.00 3.00 2.00 Use of herbicides 2.80 2.33 3.00 3.00
Game crops n=9 n=7 n=15
Seed mix 2.25 2.81 1.62
Crop cover 1.73 2.05 2.02
106

Weed cover 1.52 1.64 1.58
Destruction 2.50 2.33 1.82
Herbicide 2.08 2.33 2.60
Insecticide 2.08 1.67 2.78
Pollen & nectar n=7 n=1
Seed mixture 2.05 1.00
Cutting 2.00 3.00
Plant cover 1.50 1.00
Floral density 2.33 1.00
Conservation headlands n=3
Crop/sowing time 2.11
Herbicide 2.33
Management 1.33
Width 3.00
Weed cover 1.17
Woodland edges n=5 n=13 n=3
Woodland type 2.80 2.07 2.00
Management 2.40 1.87 2.00
In-field features
In-field trees n=5 n=16 n=8
Cultivation 1.83 1.50 1.25
Dead wood 2.20 2.44 1.69
Livestock 1.80 2.05 1.83
Short term fallow n=4 n=3 Cutting time 3.00
Cutting frequency 3.00
Compaction 3.00 3.00
Vegetation cover - birds 2.00 2.33
Vegetation cover - RP 2.00 1.67
Vegetation diversity 2.33 1.67
Storage of manure 3.00 3.00 Use of herbicides 2.00
Arable reversion n=4 n=1 n=1
Soil preparation pre-establishment 1.33
Seed mixture 1.00
Fertiliser application 2.50
Grazing management 2.33
107

Cutting management 3.00 2.00
Sward height (grazed) 2.00 1.00 1.00
Botanical diversity 1.00 1.00 2.00
Beetle banks n=1
Height of bank 2.00
Vegetation cover 3.00 Vegetation composition 2.50
Location (RP) 1.50
In-field fallow plots n=6 n=1
Location 2.00 3.00
Vegetation cover 2.33 1.00
Skylark plots n=1
Timing/method of creation 3
Density 1
Vegetation cover 3
Crop type/rotation n=51
Crop diversity 1.40
Crop types 1.83
Grass leys 1.38
Herbicide 1.38
Weed populations 1.88
Insecticide 1.71
Primary cultivation 2.17
Organic manures 2.04
Stubbles n=4 n=1 n=5 n=8
Type of stubble left 2.75 2.00 3.00 2.50
Herbicide 2.25 2.00 1.75 1.50
Weed/volunteer cover 3.00 1.92 2.00
Intended date of destruction 2.00 2.00 1.50 1.75
Stubble height 3.00 1.50 1.50
Removal of compaction 2.25 2.00 1.67 2.50
Grassland n=19 n=20 n=11
Fertiliser application 2.44 2.33 1.82
Grazing management 1.89 1.94 1.91
Cutting management 2.63 1.91 1.45
Resowing policy 2.87 2.61 2.10
Grassland establishment 2.00 1.88 1.83
108

Sward height (grazed) 1.55 1.76 1.75
Botanical diversity 1.42 1.33 1.00
Supplementary feeding 2.36 2.32 2.30
Poaching and erosion 2.64 2.68 2.64
Boundaries
Hedgerows n=23 n=34 n=10
Height 2.90 2.80 2.68
Width 2.62 2.60 2.26
Gappiness 2.74 2.36 2.61
Adjacent habitat 2.18 2.15 1.83
Cutting frequency 2.19 1.71 1.20
Cutting time 2.13 1.88 1.85
Nutrient enrichment 2.34 2.41 2.52
Stone walls n=4 n=1
Maintenance practice 3.00 2.00
Gaps, bulging/slumping/bellying 2.92 2.20
Ditches n=8 n=23 n=6
Bank cutting frequency 1.86 2.60 2.17
Cutting time 1.99 1.54 1.80
One or both sides 1.79 1.54 2.00
Veg in ditch bottom 3.00 2.85 2.67
Dredging frequency 2.83 2.95 2.83
Water plants 1.68 1.54 1.42
Adjacent habitat 2.67 2.61 2.44
6.4 General conclusions from environmental assessment
These results have shown some interesting differences in the environmental condition of features under different management categories, however, differences in scores were often small. Overall, there appeared to be an increase in quality of features from those not managed for the environment (Other), through Informal and CFE management, with features in AES being of highest quality. However, scores for few individual features (in-field trees and hedgerows) were significantly different between management types and there was considerable overlap between the ranges of scores under the different management. It must be remembered that this was a small sample of farms and many features were recorded on insufficient numbers of farms or across insufficient management types to allow an in-depth statistical analysis. It is more interesting to consider farms as case studies and to use the scoring system to understand more about how farmers manage features and the relative differences between scores for individual farms and different management types (see Section 7).
109

6.4.1 Impact of the scoring system
The scoring system combines a number of broad measures of feature quality (derived from field survey and management practice) into a single measure of environmental condition (although birds and resource protection are scored separately for some features). Attributes were equally weighted, hence a number of less important attributes could outweigh the significance of a single, but more critical attribute. No weighting was applied because this would have added a level of complexity and uncertainty that could not be reasonably justified for the small sample of farms surveyed. For many features, scores for some attributes were very similar across management types. Small, but potentially important differences in particular attributes could therefore be obscured in the overall feature scores.
For some attributes, such as frequency of cutting margins, scores could be high if a feature was unmanaged. In the short term, a lack of management may be beneficial because this equates to low intensity management. In the longer term a complete lack of management is likely to be less beneficial than optimum management, although the wide variety of organisms that could benefit from farmland habitats and features means it is likely that some species will benefit from an absence of any active management.
6.4.2 Differences between management types
Overall, the results suggest that there were some differences in scores, although not generally statistically significant, between management under different categories. Assessment of individual attributes and farmer interviews have suggested reasons for these differences or their absence. Comparison for individual features suggested that, in particular, environmental quality was greater under AES compared to other management groups for pollen and nectar mixes, woodland edges, short term fallow, arable reversion, overwinter stubbles and hedgerows. CFE margins and game covers were of higher quality than those under other management categories. AES features do not automatically score highest if being managed according to prescriptions for a number of reasons. Firstly, the scoring system incorporates a wider range of factors than those involved in AES prescriptions. Secondly, some of the highest scores are achieved for management that would be considered in excess of AES prescriptions for some features. For example, AES buffer strips may be two and four metres wide, but these will have fewer environmental benefits than six metre buffers. AES margins and field corners can be sown with any seed mix (although a diverse mix or natural regeneration is recommended), however, many AES features were sown with a basic mix, whereas CFE features were more often allowed to regenerate naturally and therefore scored higher. Some elements of the scoring system can be changed rapidly and are therefore likely to achieve high scores under an AES where the attribute is part of the prescription, which is associated with high scores. This is apparent in the higher scores for attributes such as hedge cutting time and frequency. However, it is surprising that AES features did not necessarily score higher than other management categories for all attributes that are easily changed and included in AES prescriptions. For example, wild bird covers in AES often included maize and scored lower than CFE for this attribute. Other elements of the scores are the accumulated effects of management over a long period of time, and therefore do not necessarily reflect the value of current management or the farmer’s perception of value since opinions may be affected by action rather than outcome. For example, a farmer may currently be careful to avoid fertiliser drift into cross-compliance strips, however, species indicative of nutrient enrichment may remain at high levels for many years as a result of previous management. Thus, although the combination of scores for a range of attributes will identify environmental quality, there are elements which are unlikely to be influenced by a change in management in the short term.
110

AES features may also score higher because, for some features at least, farmers are more likely to enter those features which are already managed according to the AES requirements and therefore are already of higher environmental quality. Botanical diversity of AES grassland was higher and fertiliser inputs were lower under AES management. However, there would be no short term relationship between diversity and inputs since species composition changes very slowly in response to reduced fertiliser inputs. Hedges entered into an AES may be of higher quality than those not entered either because they have fewer gaps (since gaps in excess of 20% of the length cannot be counted towards an AES) or because they are unmanaged, therefore the cutting prescriptions have no impact.
Conversely, features under Informal management may be of similar quality to those in an AES, where Informal management is undertaken as an extension of an AES. On some farms only a proportion of features on a holding were entered into an AES, but for environmental reasons or for simplicity of management all features were managed according to the prescriptions.
Informal management often arose as a result of agronomic convenience (margins were often left uncropped to allow access) or because of other interests on the holding (game crops were common outside an AES or the CFE). However, there were other reasons for Informal management. Some farms had not renewed their AES agreement, but had retained AES prescriptions for particular features. Although some were ‘between’ AES agreements and therefore this management contributed only temporarily to Informal environmental management, others intended to retain elements of their AES in the absence of payment, suggesting that AES had led to a permanent change in behaviour. Other environmentally engaged farmers did not have an AES because they did not want to be restricted by the prescriptions. Sometimes there was a lack of understanding about the importance of prescriptions, hence Informal management achieved less than an AES would have done. However, ELS can be very inflexible and some farmers who wanted to manage features slightly differently, but resulting in similar environmental benefit, had not entered these features into and AES. One farmer who still layed hedges was prevented from cutting the hedge sides at the bottom each year under an AES, despite the retention of a significant food source above two metres. Overall, there was a tendency for features under AES to be in better environmental condition and those not managed for the environment to have fewest benefits. However, differences between management types were small and usually not significant. There are a number of reasons for the relative similarity, including the variability between farms. Furthermore the condition scoring used includes factors not specified in AES prescriptions and those that will not change significantly within the timeframe of a single AES. Also, many farmers undertake environmental management outside AES for a wide range of reasons. Those entering AES may manage AES features according to the prescriptions but with no further environmental consideration, whereas farmers with a particular interest in the environment may manage features outside an AES to a higher standard. There was evidence that AES prescriptions were improving environmental management and that in some circumstances these benefits were retained outside an AES.
111

112
7 Comparison of farmer observed benefits and environmental assessment
This section presents an analysis of the environmental benefit scores derived from the face-to-face interviews and environmental assessments. In particular it focuses on the differences between the farmers’ perceived benefit scores presented in Section 5.8 and the environmental assessment observed scores presented in Section 6.3 The perceived and observed benefit scores do not use the same scales. The perceived benefit score is based on the farmers own assessment of environmental benefit based on their experience and observations. This assessment was made without any guidance from the interviewer as to what constituted environmental benefit. The observed environmental benefit scoring was scientifically-based on a feature and habitat assessment in relation to three themes: farmland birds, wider biodiversity and resource protection (soil and water). As part of the process to integrate the environmental benefit scores from the face-to-face interviews and environmental assessments, the research team members involved in the farmer interviews and field surveys met over 3 days to discuss each farm, case by case. The objectives of these team synthesis meetings were to: i) Develop the understanding of any mismatches between the perceived environmental benefit scores for individual features provided by farmers and the observed environmental benefits identified in the field assessment. ii) Develop the understanding of the link between farmers’ overall willingness and ability to undertake environmental management activities and their environmental management practices: and. iii) Develop the understanding of any differences in scores between AES and informal management activities on individual farms where both activities exist. The final output of the meetings was an agreement on a score, based on a 1-4 scale: an overall score for the observed quality of the environmental management practices undertaken on the farm; an overall score for farmer’s perception of the environmental benefit of their environmental benefit based on the mean of their scores; and an overall score reflecting the farmer’s willingness and ability to undertake environmental management activities based on how they responded to a number of questions in the face-to-face interviews. The discussions were recorded, transcribed and analysed using Nvivo9 qualitative data analysis software programme. This process provided a much deeper understanding of the reasons for differences in farmer’s perceived benefits compared to the benefits that are expected by following management prescriptions set externally. Table 7.1 integrates the scores for 60 farms in the sample, along with characteristics of the farm, such as farm size, farm type, tenure status and the environmental management category. Figure 7.1 shows that the majority of the scores fell within the middle score groups of 2 and 3.

Table 7.1 Overall environmental benefit and willingness and ability scores for case study farms Environmental management group
Farm size Farm type Region Tenure
Perceived score
Observed score
Willingness & ability score
No AES/CFE/Informal Small Mixed 1 North East Owner & tenant 2 1 1 Informal only Small Other 3 Yorkshire & The Humber Mainly Owner occupied 2 1 1 Informal only Medium Mixed 4 East Midlands Mainly Owner occupied 2 1 1 Informal only Small Mixed 8 South West Mainly Owner occupied 3 2 2 Informal only Medium Mainly cereal 3 Yorkshire & The Humber Mainly Owner occupied 3 2 2 Informal only Small Mainly cereal 4 East Midlands Owner & tenant 3 2 2 Informal only Large Mainly horticulture 4 East Midlands Mainly tenanted 3 2 2 Informal only Medium Mainly livestock 8 South West Mainly Owner occupied 3 2 2 Informal only Small Mainly horticulture 2 North West & Merseyside Mainly tenanted 3 1 2 Informal only Large Mixed 7 South East & London Mainly Owner occupied 2 3 2 Informal only Small Mainly cereal 6 Eastern Mainly tenanted 3 3 3 Informal only Large Mainly horticulture 7 South East & London Mainly Owner occupied 3 3 3 Informal only Small Mainly cereal 4 East Midlands Mainly tenanted 3 3 3 Informal only Medium Mainly cereal 4 East Midlands Mainly Owner occupied 3 3 3 Informal only Small Mainly cereal 6 Eastern Mainly Owner occupied 3 2 3 Informal only Medium Other 7 South East & London Mainly Owner occupied 4 N.d. 3 Informal only Medium Mixed 5 West Midlands Mainly Owner occupied 3 3 3 Informal only Medium Mainly cereal 7 South East & London Mainly Owner occupied 3 2 3 Informal only Medium Mainly dairy 8 South West Mainly Owner occupied 3 2 3 Informal only Small Mainly cereal 6 Eastern Mainly tenanted 4 4 4 Informal only Large Mainly horticulture 7 South East & London Owner & tenant 4 2 4 CFE/Informal Medium Mixed 3 Yorkshire & The Humber Owner & tenant 3 2 1 CFE/Informal Medium Mixed 6 Eastern Mainly tenanted 2 2 2 CFE/Informal Medium Mainly cereal 4 East Midlands Mainly Owner occupied 2 3 3 CFE/Informal Small Mixed 7 South East & London Owner & tenant 2 2 3 CFE/Informal Large Mixed 8 South West Mainly tenanted N.d. 3 3 AES only Large Mainly livestock 2 North West & Merseyside Mainly Owner occupied 3 2 1 AES only Small Mainly dairy 3 Yorkshire & The Humber Owner & tenant 3 2 2 AES only Large Mixed 8 South West Owner & tenant 3 2 2 AES only Medium Mixed 8 South West Mainly tenanted 4 4 3
113

114
Environmental management group
Farm size Farm type Region Tenure
Perceived score
Observed score
Willingness & ability score
AES/CFE Large Mainly cereal 1 North East Owner & tenant 2 2 1 AES/CFE Small Mainly dairy 4 East Midlands Mainly Owner occupied 2 2 3 AES/CFE Large Mixed 7 South East & London Mainly Owner occupied 4 3 4 AES/Informal Large Mixed 1 North East Mainly Owner occupied N.d 3 2 AES/Informal Small Mainly dairy 2 North West & Merseyside Mainly Owner occupied 3 2 2 AES/Informal Medium Mainly cereal 4 East Midlands Mainly tenanted 3 2 2 AES/Informal Medium Mixed 5 West Midlands Owner & tenant 2 2 2 AES/Informal Large Mainly dairy 8 South West Mainly Owner occupied 4 2 2 AES/Informal Medium Mixed 5 West Midlands Mainly Owner occupied 3 2 2 AES/Informal Small Mainly cereal 6 Eastern Mainly Owner occupied 3 3 2 AES/Informal Small Mainly cereal 3 Yorkshire & The Humber Mainly Owner occupied 3 2 3 AES/Informal Small Mainly cereal 4 East Midlands Mainly Owner occupied 3 2 3 AES/Informal Medium Mainly cereal 6 Eastern Mainly Owner occupied 3 3 3 AES/Informal Large Mainly cereal 4 East Midlands Mainly tenanted 4 3 3 AES/Informal Large Mainly cereal 6 Eastern Owner & tenant 4 3 4 AES/Informal Large Mainly cereal 7 South East & London Mainly Owner occupied 4 4 4 AES/Informal Medium Mainly cereal 3 Yorkshire & The Humber Mainly tenanted 4 4 4 AES/Informal Medium Mixed 7 South East & London Mainly Owner occupied 3 2 4 AES/Informal Large Mainly cereal 8 South West Mainly Owner occupied 3 4 4 AES/Informal Small Mainly cereal 6 Eastern Mainly Owner occupied 4 3 4 AES/CFE/Informal Small Mixed 3 Yorkshire & The Humber Mainly Owner occupied 2 3 2 AES/CFE/Informal Large Mixed 7 South East & London Owner & tenant 3 2 2 AES/CFE/Informal Medium Mixed 5 West Midlands Mainly Owner occupied 3 3 3 AES/CFE/Informal Large Mixed 5 West Midlands Owner & tenant 3 2 3 AES/CFE/Informal Large Mixed 1 North East Mainly Owner occupied 4 2 3 AES/CFE/Informal Large Mixed 5 West Midlands Owner & tenant 3 2 3 AES/CFE/Informal Large Mainly cereal 8 South West Mainly Owner occupied 3 3 3 AES/CFE/Informal Medium Mixed 6 Eastern Mainly tenanted 4 4 4 AES/CFE/Informal Large Mainly cereal 6 Eastern Mainly Owner occupied 3 4 4 AES/CFE/Informal Large Mainly cereal 6 Eastern Owner & tenant 3 4 4

Figure 7.1 Perceived and observed benefit scores and willingness and ability scores for all farms
0 4 610
29
19
34
1823
138
12
0
5
10
15
20
25
30
35
40
Perceived scores Observed scores Willingness & ability scores
No. of farms
Score 1
Score 2
Score 3
Score 4
Of particular interest are those farms where the farmers’ perceptions of environmental impact are different from the observed scores, or where their positive willingness to undertake environmental activities are not reflected in the observed scores. Through an analysis of the synthesis meeting discussions it was possible to identify the reasons for these differences in individual cases.
7.1 Farmer willingness and ability to adopt environmental management
7.1.1 High willingness and ability
Twelve of the 60 case study farmers scored high (4) in terms of their overall willingness and ability to undertake environmental management activities on their farms (Table 7.2). A closer examination of their farm and farmer characteristics identifies some of the factors influencing this positive disposition to environmental management. All but two of the farmers who scored high (4) in terms of their willingness and ability to undertake environmental management activities had joined an AES. The schemes fitted in well with the farmers views on the environment and their farming philosophy.
They went into the scheme because as a family they are keen on the environment and saw the potential of the farm to do well in it. They are knowledgeable about the environment on the farm, walking it frequently and getting advice from FWAG and the Game Conservancy about management on the farm. (AES/Informal, large, mainly cereal, mainly owner occupied farm in South West region).
Some of the farmers were experienced AES participants and had belonged to previous schemes:
They have been in CSS, and went in to ELS and now HLS, basically a natural extension of how they have been farming. Only have wintered stubbles under CFE as the rest is covered by ES... He has a good knowledge of what the
115

wildlife was on his farm as well as how the AES worked. (Extract from the interviewer summary for AES/CFE, large, mixed, mainly owner occupied farm in South East)
[Interviewer: Why did they go into the AES? ] Mr. G replied that it was a combination of being able to utilise unproductive areas and improve the environment. CSS and ELS similar and naturally moved from one to other. (ASE/Informal, small, mainly cereal, mainly owner occupied farm in Eastern region).
Table 7.2 Farms scoring highest for Willingness & Ability to undertake environmental activities
Environmental management group
Farm size Farm type Region Tenure
Perceived score
Observed score
Willingness & ability score
AES/CFE Large Mixed
South East & London
Mainly Owner occupied 4 3 4
AES/Informal Large Mainly cereal Eastern
Owner & tenant 4 3 4
AES/Informal Large Mainly cereal
South East & London
Mainly Owner occupied 4 4 4
AES/Informal Medium Mainly cereal
Yorkshire & The Humber
Mainly tenanted 4 4 4
AES/Informal Medium Mixed
South East & London
Mainly Owner occupied 3 2 4
AES/Informal Large Mainly cereal
South West
Mainly Owner occupied 3 4 4
AES/Informal Small Mainly cereal Eastern
Mainly Owner occupied 4 3 4
Informal only Small Mainly cereal Eastern
Mainly tenanted 4 4 4
Informal only Large Mainly horticulture
South East & London
Owner & tenant 4 2 4
AES/CFE/Informal Medium Mixed Eastern Mainly tenanted 4 4 4
AES/CFE/Informal Large Mainly cereal Eastern
Mainly Owner occupied 3 4 4
AES/CFE/Informal Large Mainly cereal Eastern
Owner & tenant 3 4 4
These farmers were also undertaking informal environmental management activities outside their AES agreement. For the two farms not entering land in an AES, the reasons for this decision were different. One farmer had joined ELS in 2005, but did not renew the agreement in 2010 as he was over 65 and was reluctant to be locked into another 5 year agreement for fear he would need to reimburse the money should he decide to retire. However, he still manages his stubbles as if they were in ELS and this is his contribution to CFE. Another farmer had seriously considered ELS with his agent but had decided it was not financially worth the effort. They had calculated that it would cost them £3,000 per year
116

to plan and implement the scheme, whilst only receiving £3,000 in payments. At the time of making this decision, his wife was seriously ill and he acknowledged that he may now re-consider entering ELS. Among the high scoring farms, balancing production with stewardship of the land was a recurring theme in discussions about farm management, as was the feeling that they should be ‘doing their bit’ for the environment. A number of those farms with a high positive disposition toward environmental management activity also ran large, efficient arable operations or large estates, some of which were managed by farming companies or land agents or were part of a share cropping arrangement. The positive environmental attitude was often driven by the landowners who had a particular interest in the environment, particularly birds, or game birds. On these large farms the environment is often viewed as a crop that is managed.
“Five years ago the owners were thinking ‘what is the least we can do for the money’, now they are doing joined up thinking, linking wild bird mix and pollen and nectar mixes for year round provision for bird”. (AES/informal, large, arable, owner occupied farm in South East region)
“The links to the shoot is important and the historic nature of the estate park means that the environment has always been considered from an early stage”. (AES/informal/CFE, large, arable, owner occupied farm in Eastern region)
What sort of farmer are you? Below are the responses from some of those farmers who had a high positive disposition to environmental management activity when asked the question “What sort of farmer are you?” Interestingly, a word that stands out is efficient.
Technical and efficient – aim to be business-like and cutting edge. I think the direct drilling sets us apart, also looking at trace elements and this will increase the quality of the product as well as the yield. So doing quite a bit of soil sampling at the moment. (AES/informal, large, arable, mixed tenure farm in Eastern region) Mr B would like to be efficient and technical and commercial but he has passed these aspects on to [the farming company] – that is what he was and wants to be but because of the size of his business he could not do that himself. In 2000 he recognised that he would not be that as a 289 ha farm, so delegated that to us. (AES/informal, large, arable, farming company managed farm in South East region) Responsible and efficient. Profitable too but that is a bit of a cliché. (AES/informal/CFE, large, arable, owner occupied farm in Eastern region) “Me, I’m a ploughman, that’s what I am… I love ploughing and I get a kick out of when the grain comes out of the spout on a combine it’s the same when you lamb a lamb and it’s been difficult and you think it’s dead. But the main driving force has got to be making a living, because we’re tenant farmers and what we have is what we earn with our hands. The type of farmer I am is one who is prepared to grow whatever is needed to make a living. But aside from that I’m very interested in what’s around us. Whether it be the wildlife and so on and the effect we have as farmers on the environment.” (AES/informal, medium, arable, tenant farm in the Yorkshire region)
117

“Got to be efficient or not be here now!” (Informal only, small, arable, tenant farm in the Eastern region)
“Pretty efficient and very aware of people. We’re always open, run open events and have schools round but less now because of health and safety, we give talks on water usage, we’re very strong on this as we’re very dry here. Schools are coming round and we have some animals (donkeys, alpacas, reindeer, sheep) to mingle with, feel and touch. We connect with public, give talks to garden clubs etc.” (Informal only, large, horticultural, mixed tenure farm in the South East region)
Another high scoring farm was managed by a fifth generation farmer who had been farming intensively until the point that the children were old enough to leave home. They then decided to extensify in order to reduce their workload and converted to organic and entered AES. They have excellent grassland habitats on the farm which have attracted the interested of the conversation agencies and have since become enthusiastic about natural history and happy are to engage with anyone who is interested in the farm’s environment. Strongly linked to the high scores on some of the farms is an interest in game shooting. This ranged from large estates to a small council farm which ran a rough shoot. Also a personal interest in wildlife, particularly birds and butterflies was another important driver. This group of farmers tended to be members of environmental organisations, particularly GWCT, FWAG and RSPB. The catalyst for one of the high scoring farmer’s interest in the environment stemmed from the designation of part of the farm as an SSSI and contact with a University academic who monitored the plants in his ditches and persuaded him the in 1980s to change his annual ditch clearing to every three years. He has since had a long-term association with University academics and taken part in a number of monitoring trials and enjoys learning about the science involved. He believes that, unlike some others, his thoughts towards his farm are more long-term and therefore he has a greater leaning towards the environment.
7.1.2 Low willingness and ability
Table 7.3 Farms scoring lowest for willingness & ability to undertake environmental activities Environmental management group
Farm size
Farm type Region Tenure
Perceived score
Observed score
Willingness and ability
score
AES only Large Mainly livestock
North West & Merseyside
Mainly Owner occupied 3 2 1
AES/CFE Large Mainly cereal North East
Owner & tenant 2 2 1
CFE/Informal Medium Mixed
Yorkshire & The Humber
Owner & tenant 3 2 1
Informal only Small Other
Yorkshire & The Humber
Mainly Owner occupied 2 1 1
Informal only Medium Mixed East Midlands
Mainly Owner occupied 2 1 1
No AES/CFE/Informal Small Mixed North East
Owner & tenant 2 1 1
118

Farmers scoring low in terms of their willingness and ability to undertake environmental management activity tended not to participate in AES. However, two examples existed where there was an AES agreement (Table 7.3). On one of these farms the CSS was an historic legacy which included 20 acres of margins. As the farmer was taking more control of the farm and becoming clearer about his business strategy, he was less interested in AES as a source of income. He was intending to come out of AES and to possibly plough up all his margins. Another was a fairly intensive beef producer who supplied a major supermarket and was in UELS mainly for commercial reasons. The financial circumstances of one farmer partly affected his ability to undertake environment management activities. His farm business was struggling financially and he was under considerable work pressure and did not feel that the work required to enter ELS was worth the £4,500 he would receive in payments. Similarly, a part-time farmer whose farm was not the main source of income felt that his small field sizes disadvantaged him in ELS, and any financial gain was not worth the effort involved. The environmental management activities of one low scoring farmer were explained in terms of agronomic reasons, rather than management for the environment. This farmer reported that he tried to get as much out of land as possible and was not convinced that cutting hedges biannually, or leaving 2 m margins really benefited the wildlife. The following quotes highlight one family’s view of environmental management on their farm.
[Interviewer: “Are you not interested in the schemes”?] Mr F snr: “Not really, not even at the money they are offering, no. See it’s all good land, it’s not like we’ve got banks and that, something like that yeh we would. But when it is land you can cultivate and grow crops” Mrs F: “You see farmers have been brought up to grow crops where they can grow crops, haven’t they?”
(No AES/informal/CFE, small, mixed, mixed tenure farm in North East region)
7.2 Comparison between observed and farmer perceived benefit scores on individual farms
This part of the analysis draws heavily on the synthesis meetings held to develop our understanding of any mismatches between the perceived environmental benefit scores for individual features provided by farmers and the observed environmental benefits identified in the field assessment. As Figure 7.2 shows, 32 farms had higher perceived benefit scores than observed scores, for 6 farms there were no differences between the scores and for 16 farms the overall observed scores were higher than the perceived scores. Figure 7.2 Differences in overall perceived and observed scores
0
5
10
15
20
25
30
35
Higher perceived than observed scores
No differences between scores
Higher observed than perceived scores
No. of farms
119

Higher overall farmer perceived score compared to observed score The next section looks specifically at understanding why some farmers’ perceived environmental benefit scores were higher than the overall observed benefit score for their farm. In other words, why their perceptions of how their activities benefitted the environment differed from data collected by the field surveyors. One farmer had an intensive dairy farm and by his own admission ran his cows and the land very hard, although he felt he was more sympathetic to the environment than his father and he was also in ELS. He felt that simply the presence of the environmental features on the farm: hedges, margins and winter stubble were beneficial to the environment. The field assessments, however, identified very little of ecological interest on the farm, and any environmental management undertaken met the scheme requirements, but nothing more. At the synthesis meeting it was generally felt that there was potential for this farmer to improve the environmental management of the features present on his farm. There was no evidence that the farmer was motivated to look after the environment, although he was not destroying it either. Another farmer who was under some financial pressure felt he was benefitting the environment, particularly through his margins which were former set-aside areas and some of which were very wide. However, the environmental assessment found that these margins were not delivering significant environmental benefit as they were cut too early and compacted through vehicular access. It was concluded at the synthesis meeting, however, that the farmer would have no problem meeting the requirements of ELS, but would need some good advice. One vegetable grower thought that he was benefitting the environment on his farm and particularly the birds through his game cover strips. He certainly felt that he was doing more for the environment than his father had ever done. As he had seen a large number of game birds on his margins he believed they were beneficial to the environment. However, the field surveys found that some of the margins were not wide enough to meet cross-compliance strips. He also felt that the few hedges on the farm were beneficial to the environment, although the field survey revealed that many of the hedges were relict. The farmer was in the process of applying for ELS on-line himself and was struggling with the process and seemed to require some advice. Similarly, another vegetable producer felt his activities were beneficial to the environment as he had established informally a skylark plot and margins which were not used for access. However, the field survey revealed that most of the margins were cultivated with the vegetable crop and many were no more than cross-compliance strips. Whilst there were few features of wildlife interest on the farm, as the farmer was receptive to new ideas, it was felt that there was the potential to improve the environmental value of the farm through targeted advice. One large estate run by team of professionals had someone employed specifically to manage AES agreements. The agreement was managed efficiently to meet the scheme requirements, maintain the environment and to ensure a financial return for estate. Whilst the person managing the agreement had a very positive attitude to environment, due to the scale of the operation it was felt that the micro-management detail was lost. The only way it was possible to make the management work with the teams of people involved was to standardise the operations across the estate. This resulted in a simplification and a loss of management detail. For example, although all fields had 3-4 m margin around them, they were all sown and therefore were lacking in floristic diversity.
120

Lower overall farmer perceived score compared to observed score Generally, in cases where the farmers’ perceived score was lower than the observed score, this was due to views on a particular environmental activity, rather than any significant differences across the farm. One farmer, who received a high overall observed benefit score, did not feel that his 6 m margins against a watercourse were beneficial to the environment and scored these low.
“The 6 metre margins by a watercourse where there is no hedge, they can’t be that useful. We had them in the Fens and they grow thick wet grass as there are too many nutrients there. They are not in ELS now so we’ve cut them back. I can’t see the environmental value as the land is too fertile but it would be good for buffering the watercourse but you don’t need 6 m for that”. (AES/informal/CFE, large, arable, owner occupied farm in Eastern region)
Another farmer, who also received a high overall observed benefit score, felt that his field corners and margins against the watercourses were not benefiting the environment because they were too grass-dominated. He stated a preference for pollen and nectar mixes rather than plain grass. Interestingly, the field survey revealed that the field corners were quite good botanically, containing plenty of bird food weeds. One farmer was quite sceptical about the environmental value of certain features on his farm. He had an area of wet grassland which was scored low “To be honest I’ve hardly never seen a frog in it. There are no plants of importance in it”. However, the field survey revealed that this area had the potential to be a very good wetland habitat and would probably enable the farmer to get into HLS. He had clearly engaged with some advice but then turned his back on doing anything further. His trusted advisor has told him he could be in an HLS scheme, but then the experience of an NE project officer some years ago who was very directive towards the changes she wanted to see and implicitly critical of his farming had contributed to him not taking any further action.
“This young girl come, she knew, she said but you’ve no grass here, I said no that there was a quarry where they got all the tut stone to build the village and we filled it in when we were draining and that, but there is only that much soil there (2 inches) and it burns off… I couldn’t get it into her head that there was only that much soil there. Then I said ‘now what are you writing?’, she said well there is no grass here and you’ve got to write it down. Then what did she want? She wanted hedges and trees planting, then she came to orchard, it had overgrown itself, she were going to get someone to come look at the old apple trees – but it’s gone now. There were a sycamore tree there which she wanted chopping down, and a beech tree she wanted trimming back, I said you’ve been all over farm wanting stuff planted and now you want stuff chopping down! And we didn’t see eye to eye really, anyways they turned me down. P (the trusted advisor) come around and he says how have you come on, and I says they’ve turned me down, he says don’t worry he says, I’ll go down and his words were ‘I’ll shake a big stick’ and I says ‘I don’t want to be in P’. As I says to her, we hadn’t to have troughs down, and I said to her I’m not going into this scheme for your benefit but for my benefit, otherwise, she couldn’t understand that I wanted something out of it.” (AES/informal/CFE, small, mixed, owner occupied farm in Yorkshire region)
121

7.3 Comparison between observed and farmer perceived scores for features on farm
Scores for the individual feature types based on the objective field assessment and information on management from farmer interviews are presented in Table 7.4. This table shows the mean perceived and observed scores for individual features managed either within an AES, within CFE, informally or not for the environment. Table 7.4 Mean perceived and observed environmental scores for individual features
Perceived scores Observed scores AES CFE INF OTH AES CFE INF OTH
Margins Buffer strip - B 3 2 2 2 2 3 2 2Buffer strips - RP 3 3 2 2 3 2 Field corners - Birds 3 2 3 1 2 2 2 2Field corners - RP 1 2Game crops 2 3 3 2 2 2Pollen/nectar mix 2 2 2 2 1 Woodland type, edge 3 3 2 3 2 2In-field features In-field trees 2 3 2 2 2 1Short-term fallow - Birds 2 2 3 2 2 Short-term fallow - RP 2 1 Arable reversion 2 3 3 3 1 1Beetle banks 2 3 In-crop fallow plots 2 3 2 2Skylark plots 3 3 2 Crop types & rotation 3 3 2 2Stubbles 2 3 2 3 3 2 1 2Grassland 2 3 2 2 1Boundaries Hedgerows 2 3 2 3 2 1Stone walls 3 1 3 1Ditches 2 2 2 2 2 2MEAN 2.4 2.3 2.5 1.7 2.3 2.0 2.2 2.0
1= Not Convinced Of Any Benefits 2 = A Few Benefits 3 = Significant Benefits
1 = Low benefits 2 = Medium benefits 3 = High benefits
AES = Managed within an agri-environment schemes; CFE = managed as part of Campaign for the Farmed Environment; INF = managed outside of any scheme; OTH = not managed for the environment Examination of these scores reveals a number of differences between the mean perceived scores and observed scores for a number of features. The reasons for the differences, drawing on data from the face-to-face interview, environmental assessments and team synthesis meetings, are explored in more detail below.
122

Buffer strips against boundaries Farmers’ perceptions of the environmental value of the buffer strips against boundaries were higher for those strips managed within a scheme than the observed score. By their very presence farmers often felt that the margins had an environmental value. However, these margins scored low in the environmental assessment if they were sown with a simple grass mix, rather than a diverse seed mix. Buffer strips against watercourses In nearly all cases the buffer strips against watercourses were perceived by farmers to benefit the environment due to the protection they offered watercourses from water pollution. The environmental assessment identified a number of reasons for a lower mean observed score for these features. Some were used for vehicle access or horse gallops, resulting in significant compaction, and some were mainly grass dominated resulting in poor species diversity. Field corners Field corners were generally perceived by farmers as being beneficial to the environment. However, they were viewed as a feature to be left unmanaged. As a result, many of the features under AES of CFE were left uncut, whereas field corners under voluntary and other management were generally cut on an annual basis and at an inappropriate time of year. Game crops Some farmers, who were managing game crops outside of an AES, felt that these were extremely beneficial for wildlife. However, they were often scored low in the environmental assessment because they were sown almost exclusively with maize, rather than a mix of seed types. This is an area where more advice could improve environmental outcomes. Pollen and nectar mixes Overall the pollen and nectar mixes were scored lower by farmers for their environmental benefit than other features. The farmers on the whole expressed disappointment with this feature due to the difficulties experienced with establishment. These also scored low in the environmental assessments. In-field trees Interestingly, the perceived benefit score given by farmers for in-field trees were lower for those managed under an AES than those managed informally. It appears that the environmental benefits of in-field trees are not always recognised. For example, respondents did not always understand the environmental benefit of leaving land uncultivated under the tree canopy, as the following quotes illustrate.
Mr B. does not agree with the instruction to leave the area under the canopy bare as it collects ‘rubbish’. He would cultivate the area under the trees if there was no AES. (AES/informal, small, arable, owner occupied farm in East Midlands region)
Another farmer who had scored a high positive attitude to the environment had planted game crops underneath all his in-field trees.
123

Leave the area under the canopy alone and this helps the tree but it is isolated so of limited benefit? May be it is good – not sure. More of a landscape thing than wildlife corridor? (AES/informal, large, arable, mixed tenure farm in Eastern region)
Arable reversion Farmers had a lower perception of the environmental benefits from arable reversion for those in an AES and those outside of a scheme. Some disappointment was expressed by the farmers in AES for the lack of plant diversity developed within the grassland, although the environmental assessment scored these features high for environmental benefit. A number of farmers had left arable areas to revert to grassland around certain features, such as a pond and viewed this as arable reversion. In-crop fallows In-crop fallows mainly took the form of lapwing plots. There was mixed views from farmers about their environmental benefit. Those who were managing these features under AES, saw them as beneficial. One farmer viewed his AES lapwing plots as ineffective, although the environmental assessment scored these high. Another viewed his AES lapwing plot as significantly beneficial although the environmental assessment score for this feature low with as it was inappropriately located with poor vegetation cover. Stubbles There were mixed views from the farmers about the environmental benefit of stubbles. Some had witnessed the benefits of stubbles in terms of seeing more birds and hares. However, others were not always convinced of their environmental benefit, although their negative views were also tied up with concerns about the public access on these areas.
“They definitely benefit the game birds. It gives them a bit of cover. It also benefits the little birds” (Informal only, small, horticultural, tenant farm in North West region) Mr. J. thinks the winter stubbles before he sows his spring crops are good for the birds as it provides seeds and shelter (Informal only, small, arable, mixed tenure farm in East Midlands region) He thinks they bring clear environmental benefits. He has seen the hare population and skylark population increase" (AES/Informal, large, arable, tenant farm in Eastern region) “Don’t think that’s doing anything. The only thing it is good for is the public. They see the stubble and use it to exercise their dogs”. (AES/Informal, small, arable, owner occupied farm in Eastern region) “On the stubble, although I have a respect for the environment the people with dogs haven’t. So when they see it stubble, or even when it is not stubble they will walk all over it. If you try to explain to them as politely as you can and they that they are disturbing the birds, lapwings etc. they take no notice. They call it dog poo lane!” (Informal only, medium, arable, owner occupied farm in Eastern region)
124

I don’t think it benefits the environment as much as they make out. I think maybe early on but you don’t see much later on after Christmas and New Year, you see it before. In November you see the birds using the stubble. (Informal only, medium, mixed, owner occupied farm in West Midlands region)
Generally, the stubbles managed under AES scored higher than those managed informally due to more appropriate management, in terms of herbicide usage, stubble heights, intended date of destruction and removal of compaction. Hedge management Hedge management is an activity where farmers’ perception of environmental benefit did not always match the field survey scores. The greatest concern expressed by many farmers was the detrimental impact on birds of the rotational cutting regime required under AES. It was recognised that whilst 2 to 3 year cuts would allow for berry production, creating a better food supply for birds, there was concern that it might also allow the structure of the hedge to become more open, making the bird’s nests more vulnerable to predators. A common view was that an annual cut produces a tighter cover and thus better protection for the birds. Also concerns were expressed that as hedges grew taller they become thinner at the bottom which was detrimental to wildlife. Several farmers stated that should their ELS agreement end they would revert back to annual an annual cutting regime. The follow quotes reflect these views:
I don’t agree with the 2-3 year rotation cut in the ELS scheme. It is the little birds that you want to be protecting and you can’t do that in a thin hedge. Once you get a tall hedge or an uncut hedge that is what they become a thin hedge. They open up and the sparrowhawks and everything can get in. To me it just doesn’t make sense. I have a little hawthorn hedge here and I cut it every time I mow the lawn just to trim it back. There must be 7 or 8 nests in it, because it is safe. I won’t put hedges into ELS unless I have to. (Informal only, small, horticultural, tenant farm in North West region)
“There is more area for the wildlife Whether they are thicker and kinder for nesting birds? We think cutting hedges 2-3 years opens up the hedges. These hedges as they get bigger they open up at the bottom” (AES/informal/CFE, large, mixed, mixed tenure farm in West Midlands region) Hedges were an easy option to include as it did not affect the operation of the farm business. He used to cut the hedges annually himself but now needs to employ a contractor with bigger machinery. He now appreciates that the hedges produce more berries when left uncut which perhaps he didn’t before. He is worried that the bottoms of the hedges aren’t filling in and that the long-term benefits might tail off. (AES/informal, large, arable, tenant farm in East Midlands region) I don’t actually agree with it that much. I think that the way to do it is to trim your hedge lightly every year. I don’t actually agree with smashing it down once every three years. I think you can leave it at 2 m high and 2 m wide but I don’t think it should look like a bomb site once every 3 years which they do look like. It soon fills back in again. I don’t think it’s as good as leaving a nice thick hedge that is trimmed every year as long as you don’t trim it after February before the berries are gone and the nests are on, I can’t see you doing any damage. I think that is an incorrect one. We only do that because it is part of our scheme and that is what we have got to do. I think what Defra
125

were worried about is that if you trimmed hedges every year you would get back to small and narrow hedges. I think now that the hedges have been allowed to get bigger – 2 m wide and high...”. (AES/CFE/informal, medium, mixed, tenant farm in Eastern region) “The hedgerows really need to be cut every year, I’m convinced of that and I don’t think there would be any detriment to wildlife, personally, a few less berries perhaps.” Interviewer: “Do you think there is any difference in the environmental benefit?”
Mr. C. “I think there is absolutely none, quite frankly. I thought there was when we started and I was keen on it, but these sightlines are done twice a year, do them in January and always do them in the middle of July ready for harvest, and there’s just as many nests… there seems to me to be as there is anywhere else.” (AES/informal, medium, arable, tenant farm in Yorkshire region)
The environmental assessment found that hedges managed under AES scored higher than those managed informally or not managed for environmental benefits. Overall, hedges in AES were tallest and those not managed for the environment were shortest, however, most hedges achieved a maximum height score. As the AES hedges were cut on a rotational basis they scored higher for this attribute than the informally managed hedges. Hedge structure was not an attribute assessed in the survey.
126

8 Overview of research findings and policy implications The aim of this final section is to draw on all the evidence collected throughout the research project and to identify the key themes and issues that have emerged. This section draws on the findings from the five main areas of research: literature review, analysis of the Farm Business Survey, telephone survey of advisors, face-to-face interviews with farmers and the farm environmental assessments. The section is structured around the four key objectives of the research which were to identify:
1. the factors driving environmental activities;
2. the perceived and observed benefits of environmental management activities;
3. the balance of environmental management activities and benefits accruing from formal and informal provision; and
4. the interactions between land under formal agreements and land outside of
agreements.
8.1 Factors driving environmental activities
As discussed in the literature review, a host of factors can drive farmers’ engagement in environmental activities. Intrinsic and external drivers combine to lead different motivations and clearly the picture is complex. There is a consensus that farmers are very heterogeneous and differ in their decision-making in relation to the environment and their holdings. There is considerable debate in the literature about the extent to which attitude is a reliable predictor of behaviour and a direct relationship between participation and a positive interest in, or concern for, the environment is not always clear cut. This is often because attitudinal and structural factors combine and interact to influence behaviour. The focus of this research, therefore, has been to explore the interaction between the main influential factors and drivers that affect farmer’s willingness and ability to undertake environmental management activities. Main factors influencing farmers’ willingness and ability to adopt environmental management activities
Knowledge & advice
Farming philosophy
Personal interest
Efficacy of actions
Social responsibility
Willingness to adopt
Farm type & environmental endowment
Markets Farmer & farm household characteristics
Finance
Ability to adopt
Tenure
Farm size
127

8.1.1 Key factors affecting willingness to adopt environmental management practices
This section identifies the key factors that have emerged from the research data, which influence farmers’ willingness to adopt environmental management practices.
8.1.1.1 Personal interest in wildlife Our data highlights that a long standing interest in wildlife was often a key factor influencing those with a positive attitude to the environment. This particularly related to an interest in birds. This interest in wildlife often stemmed from childhood and these farmers could recall the names of the birds of the farm. Interestingly, these farmers also tended to be more observant of changes in species occurrence and abundance on the farm. However, they viewed wildlife from a fairly narrow perspective, focusing on the higher species and not the less conspicuous species which are not part of everyday life.
8.1.1.2 Personal interest in game shoots Our data clearly shows that those with an interest in game shoots were more inclined to have a positive attitude to the environment. Some farmers interviewed had small, informal shoots for which game strips had been established either within a scheme or informally. Others, particularly those on the large estates had larger commercial shoots. The game strips seemed to particularly appeal to the farmers, and several had enjoyed experimenting with different seed mixes in order to find food plants that would be most effective on their farm. This was one activity where farmers often took a holistic view of the farm when establishing the strips. For example, one farmer referred to locating the game strips to make wildlife corridors through the farm, others had established blocks of game cover strategically around the farm. Often these farmers when describing the benefits of the various environmental activities they had undertaken on the farm made reference to the advantages to the game birds. They were frequently members of GCWT, from which they obtain much of advice. Significantly, these farmers’ views about improving environment for game birds, often extended to broader views of improving farm environment for wildlife generally.
8.1.1.3 Farming philosophies Farming philosophy is an important factor which often influences a farmer’s willingness to undertake environmental management activities. Two important themes emerged from the farmer interviews based around the concepts of custodianship and productivity. These were not mutually exclusive groups and some of the farmers said that taking care of the land was not incompatible with productive farming. However, those farmers expressing strong views on custodianship tended to be more positive about environmental management activities than farmers who emphasised the productive nature of their farming activities.
8.1.1.4 Custodianship During the farmer interviews, the concept of custodianship was commonly raised in discussions about the farmer’s approach to farming and how they perceived themselves as farmers. The importance of taking care of the land and farming responsibly was stressed as was handing the land to the next generation of their family in ‘good heart’. Food production was only one of a number of considerations that had to be taken into account when deciding on now the land should be managed. Taking care of the environment in terms of resource protection, wildlife and biodiversity and landscape protection was seen as an important and sometimes essential part of being a good custodian of the land. Farmers with a strong view on the importance of custodianship also generally had a positive attitude to environmental management activities. Good agronomic and environmental management were seen as compatible and in some cases indistinguishable. These general findings are supported in the
128

literature that also identifies the link between views on custodianship and positive environmental management.
8.1.1.5 Productivity Farm productivity was also a recurring theme among the farmer interviews. Having a productive farm and that other farmers recognised it as such, was seen as a status achievement. For these farmers productivity was the main criterion by which they and their farming should be judged. Some of these farmers had an inherent, deep-seated belief that agricultural production should be maximised on productive land. This was sometimes couched in terms of needing to make a profit, but also in terms of the need to feed world with impending food shortages. There were examples where the farmer made a clear distinction between the productive parts of the farm, where the land was ploughed and the crops planted, and other parts of the farm. In such cases, environmental management activity was often seen as of relevance to the non productive parts of the farm or not at all. Some of these farmers engaged with AES but tended to choose options that did not interfere with their in-field activities.
8.1.1.6 Social responsibility and accountability Findings from the farmer interviews suggest that generally a more positive attitude to environmental management prevails amongst the farming community than a few decades ago and many of the younger farmers mentioned that they thought they were doing more for the environment their father’s generation. There has been a cultural change affecting subjective norms and beliefs about environmental management on the farm. This change appears to stem from increased knowledge of and a greater sense of responsibility and accountability for the environment. This finding was supported by the advisors telephone interviews where it was acknowledged by the advisors that there had been a mainstreaming of environmental awareness. This was seen to result from several factors, including the environmental ‘PR’ campaign and the introduction of ELS which created a mass participation AES for the first time. The ‘broad and shallow’ approach was seen as being very important in raising awareness and understanding of environmental management activities across a significant section of the mainstream arable sector. It was also reported that awareness and understanding of environmental management activities had increased among arable farmers in the target CFE counties. Evidence of this social responsibility was even found amongst those not participating in an AES. Some had come out of AES, but were continuing some of their activities and were particularly keen to highlight that they were contributing to CFE, despite not being involved in AES. A number of farmers in the survey abutted nature reserves and this motivated them to do more for the environment. They felt under an obligation (or observation) to undertake environmental management practices, in part as it contributed positively to their community image. The influence of the farming community and broader society on farmers’ attitudes to environmental management has not been uncontested. The productivist values that dominated much of the post-war period are still an important influence on farmers. Recent discussions surrounding food security and the threat of impending world food shortages were drawn on by farmers in the interview survey to justify some of their land management practices and lack of engagement in any environmental management activities as they felt they had a social responsibility to produce as much as possible from their land. In some cases farmers reported that participation in AES was incompatible with their need to manage a productive farm.
129

8.1.1.7 Efficacy of actions The literature review identified some evidence that farmers consider the efficacy of new practices when deciding about participation and studies have confirmed linkages between farmers’ belief and action, demonstrating a greater likelihood of adoption by farmers who believed that a problem existed. This view was supported by our data from the face-to-face interviews. For example, one farmer had experienced first-hand the benefits of environmental management from his role as a contractor on other farms and this had helped him with the management of his own farm. As will be discussed later, some farmers did not believe in the efficacy of the prescribed AES hedge cutting regimes and this deterred them from not only taking up this option, but in some cases, the AES itself.
8.1.2 Key factors affecting ability to adopt environmental management practices In addition to farmers’ willingness to undertake environmental management activities, our data illustrates that there are also some important aspects that facilitate or constrain behavioural change. Key factors relate to the farmer’s financial situation, farm and household characteristics, environmental endowment, and level of environmental knowledge and advice.
8.1.2.1 Financial The FBS survey clearly showed that the primary reason for farmers undertaking environmental management practices within an AES is for financial reasons. The farmer interviews indicated that motivations for undertaking these activities were not solely dependent on financial considerations, other factors were also important such as an interest in the environment and ease with which the AES fitted in with the farming system. Also, the FBS indicated that financial motivations were not so important for those farmers undertaking environmental management activities informally. It was also clear from the interviews that financial considerations were expressed in different ways. For some interviewees, it was about profit-maximisation, whilst others emphasised the security and stability of income provided by regular AES payments. The literature survey highlighted a group of farmers, termed ‘passive adopters’ or ‘pragmatists’, who would engage with AES for the financial benefits as long as the scheme prescriptions did not impact significantly on their farming practice or their profits. Examples of this type of farmer were found in the interview survey but there was often recognition of the potential environmental benefits that scheme participation would bring. Some of the farmers in the interview survey looked upon environmental management as an subsidiary income stream. Often they viewed environmental management as a crop that was managed to the scheme prescriptions, but did not undertake any more environmental activity than was required by the scheme, unless there were clear agronomic reasons for doing so. These were often large farm businesses that placed an emphasis on efficiency and productivity. The FBS analysis revealed that those farms most likely to undertake environmental management activity within an AES were the farms with high incomes, whilst the lower income farms were more likely to undertake this activity informally. The extent to which the financial situation of the farm affected farmers’ ability to adopt environmental management practices was less clear from our interview data. Certainly, one of the low scoring farmers for environmental attitude was struggling financially and was under considerable work pressure and consequently did not feel that the work required to enter ELS was worth the payments he would have received. It might have been expected that those undertaking environmental management activities to have alternative sources of income and not to be so
130

reliant on the farm as a source of income. Around half of those farms undertaking the most environmental activity in our survey, also relied on the farm business as their sole source of income.
8.1.2.2 Commodity markets The literature suggests that commodity prices can affect farmers’ ability to take-up environmental management practices. The interviews revealed that this factor is particularly pertinent to arable farmers due to volatile cereal prices in this sector. Some farmers expressed a reluctance to tie up land in an AES in case cereal prices rise and the AES payments fail to cover the production losses encountered.
8.1.2.3 Farm size The FBS analysis revealed that informal management activity was more likely to occur on small farms compared to large farms. This concurs with the farmer interviews where 56% of small farms undertaking environmental activity where implementing this activity outside of an AES, whereas the equivalent figure for large farms was 27%. Similarly, those most likely to undertake environmental activity within a scheme were the larger farms. Some occupants of smaller farms expressed the view that their size limited their options within AES and put them at a disadvantage as to gain the required points they need to take proportionally more land out of production than larger farms. In fact, a number of those farms scoring a high positive attitude to the environment, ran large, efficient arable operations or large estates, some of which were managed by farming companies or land agents or were part of a share cropping arrangement.
8.1.2.4 Tenure The FBS analysis revealed that owner occupiers were more likely to undertake environmental activities informally compared to tenants and conversely tenants were more likely to undertake these activities within an AES compared to owner occupiers. There was little evidence from the interview data that tenant farmers were more unlikely to undertake environmental activities than owner-occupiers, although it was suggested that any environmental activities undertaken informally on tenanted farms was unlikely to be financially rewarded.
8.1.2.5 Farm type and environmental endowment One recurring theme expressed during the farmer interviews was that mixed farming systems were more beneficial for wildlife than other systems and would produce greater environmental benefits than introducing AES options into arable systems. A related discourse focused on the difficulties of improving the environment when the existing wildlife resource was already depleted. Some felt that the environmental benefits they were delivering were easy gains because they were already located within rich wildlife areas, predominantly grassland areas. The view was that in the large, arable areas of Lincolnshire and East Anglia it is much harder to enhance the wildlife resource, particularly if, as on the fenlands, there are few features and straight ditches where there is no capacity to leave odd corners, straighten fields or leave areas of poor soil quality.
8.1.2.6 Farmer and farm household The literature review identified that farmer and farm household characteristics can have an important influence on farm decision-making and the ability to adopt environmental management activity. The farmer interview survey confirmed the significance of the family life cycle and farming continuity through family succession in influencing environmental management activity on family run farms. The survey recorded a number of cases where
131

engagement with environmental management activities was dependent on changes in decision-making responsibilities between farming generations. In situations where farmers were approaching retirement and where no succession would take place the level environmental management activity was variable and often complicated by the delegation of decision-making responsibilities to contractors. Moreover, in some cases, environmental benefits were the result of benign neglect rather than active management.
8.1.2.7 Environmental knowledge/advice Clearly, there were some farmers who were lacking the environmental knowledge or advice needed to undertake effective environmental management on their farms. This is reflected in those farms that scored more highly for their positive attitude to the environment than the observed environmental benefit score. Often these farmers were receptive to new ideas and there was considerable potential to improve the environmental value of the farm through targeted advice. Those scoring high in the environmental assessments were usually well networked with advisors and often participating in monitoring work.
8.1.3 Farm business strategies
As discussed in the literature review, there is increasing recognition that farmers’ management practices are dependent on their farming philosophies which in turn influence their farm business strategies. This view was also confirmed by the telephone interview with advisors that concluded that how farmers view their business affects their attitudes to the environment. The farmer interviews identified three contrasting groups whose farming philosophies clearly influenced their willingness to adopt environmental activities: those with productivist world views; those who were on an extensification trajectory; and those operating large, efficient, sustainable enterprises.
8.1.3.1 Productivist The view of this group of farmers was that agricultural land should be used for food production. This was important for their own self-image as contributing to society more broadly, as well as running a profitable enterprise and their status within the farm community. This could be couched in terms of the importance of making a profit, which was seen as being synonymous with being productive or the need to produce food for a hungry world in the present or future. Environmental concerns were at best secondary, or possibly tertiary uses for quality farmland and generally a distraction from the project of farming.
8.1.3.2 Extensifying This group of farmers had extensified their farm businesses for a number of reasons. They often embraced agri-environment schemes as a subsidiary source of income and were more likely to have high environmental benefit scores for their environmental activities Reasons for extensifying their farm business, included: nearing retirement with no successor; and diversifying into other activities and therefore farming part-time. The financial returns from AES allowed these farmers to broaden their activities and make best use of the resources at their disposal.
8.1.3.3 Sustainable efficiency These were often large, efficient farm businesses that were productive, but saw environmental management as a subsidiary income stream. Often they viewed environmental management as a crop that was managed to the scheme prescriptions, but did not undertake any more environmental activity than was required by the scheme, unless there were clear agronomic reasons for doing so. They had sufficient management capacity
132

to engage with the schemes, as well as tailor their activities to meet the minimum prescriptions required.
8.2 The perceived and observed environmental benefits of environmental management activities
Farmers’ perceptions of the outcomes of environmental management are important in guiding behaviour, especially establishing a link between the action and its efficacy. The face-to-face interviews captured farmers’ perceptions of the level of environmental benefits achieved by their different management activities. The field surveyors identified the observed environmental benefits for different management activities. The mean scores derived for each environmental feature are presented in Table 8.1. Table 8.1 Mean perceived and observed environmental scores for individual features
Perceived scores Observed scores AES CFE INF OTH AES CFE INF OTH
Margins Buffer strip - B 3 2 2 2 2 3 2 2Buffer strips - RP 3 3 2 2 3 2 Field corners - Birds 3 2 3 1 2 2 2 2Field corners - RP 1 2Game crops 2 3 3 2 2 2Pollen/nectar mix 2 2 2 2 1 Woodland type, edge 3 3 2 3 2 2In-field features In-field trees 2 3 2 2 2 1Short-term fallow - Birds 2 2 3 2 2 Short-term fallow - RP 2 1 Arable reversion 2 3 3 3 1 1Beetle banks 2 3 In-crop fallow plots 2 3 2 2Skylark plots 3 3 2 Crop types & rotation 3 3 2 2Stubbles 2 3 2 3 3 2 1 2Grassland 2 3 2 2 1Boundaries Hedgerows 2 3 2 3 2 1Stone walls 3 1 3 1Ditches 2 2 2 2 2 2MEAN 2.4 2.3 2.5 1.7 2.3 2.0 2.2 2.0
1= Not Convinced Of Any Benefits 2 = A Few Benefits 3 = Significant Benefits
1 = Low benefits 2 = Medium benefits 3 = High benefit
AES = Managed within an agri-environment schemes; CFE = managed as part of Campaign for the Farmed Environment; INF = managed outside of any scheme; OTH = not managed for the environment
133

8.2.1 High perceived benefits A number of environmental features were particularly viewed by farmers as providing significant environmental benefits Margins against watercourses: Farmers particularly understood the rationale for buffer strips against watercourse in terms of preventing water pollution and favoured these because they helped with the LERAPs form filling. This view is also supported by the advisors’ telephone interviews. For those who had established buffer strips against a watercourse under AES, many felt that they would continue even if AES finished. This also reflects the findings from the FBS analysis where environmental reasons were cited as the primary reason for undertaking buffer strips outside of an AES. The reason for this acceptance of margins against watercourses is probably due to a combination of measures, including LERAPs, CFE, various AES, past and present, and cross-compliance. Game strips: During the interviews farmers frequently expressed a positive view of the environmental benefits of game strips. There was a strong belief that the game cover had not only benefitted the game birds, but also the smaller wild birds. Their view of nature very much related to the game birds and this was a reference point when they discussed their environmental management of the farm. Where lower scores were given, this was mainly reflected difficulties experienced in establishing the strips, rather than the perceived benefits to wildlife. Skylark plots: Those with skylark plots on their farms thought that they produced significant benefits. Interestingly, this viewed contrasted strongly with those giving reasons for not undertaking in-field activities, particularly lapwing plots (in-field fallow) and beetle banks (see below). Minimum tillage: Although not covered by the environmental assessment a number of farmers were direct drilling and practicing minimum tillage and most thought that the environmental benefits of this practice was high. This practice was done informally as there are no options with AES. The environmental benefits delivered were often viewed as being related to good farm practice and resource management benefits, for example preventing soils erosion, providing greater nesting opportunities for birds and bumble bees and greater food sources for wildlife.
8.2.2 Low perceived benefits The farmers interviewed viewed a number of features as providing no or few environmental benefits. Hedge management: Views about the environmental management of hedgerows were complex. Whilst hedgerows were positively valued as an environmental resource, there were negative views about AES hedge cutting regimes. There were particularly strong views about the detrimental impact of 2 to 3 year rotational cutting on wildlife. Many were not convinced of the environmental rationale for rotational cutting and some thought it was actually detrimental to wildlife as this practice opened up the structure of the hedge, reducing the availability of nesting sites and making small birds vulnerable to predators. There were also concerns about the appearance of the hedges after 2 to 3 year cuts and particularly concerns about the hedges looking ‘untidy’. Several of the farmers had not put their hedges into their ELS agreements because of the rotational hedge cutting requirements and two were deterred from actually joining ELS because of these requirements. Others mentioned that they would revert back to annual hedge cutting if their agreements came to an end.
134

In-field activities: In-field activities, such as beetle banks and in-crop fallows were unpopular with many of the interviewees. This finding is supported by the telephone interviews of advisors that concluded that many farmers, even those who had embraced agri-environmental management, remained resistant to the idea of in-field options. The farmer interviews revealed a number of reasons for this view. Firstly, interviewees talked about the in-field activities impacting on the most productive land. There was also concern that these activities would generate weeds and pests in the middle of the fields again impacting on yields. Secondly, the in-field activities were perceived to have an impact on efficiency, as they split up fields making them more difficult to manage, this was particularly cited as an issue by those with small fields. Finally, several farmers were not convinced that the in-field activities worked. Some had heard on the grapevine that skylark, lapwing plots etc. were ineffective. This finding ties in with the responses given by those who had established lapwing plots or beetle banks and who appeared less than convinced of their effectiveness. A further cultural barrier explaining farmers’ resistance to in-field options, identified in the telephone interview of advisors, was concern that they would be viewed by other farmers as having a poor crop. Nectar pollen mix: A number of farmers were growing pollen and nectar strips, most of which were established under HLS or ELS. One farmer had established a strip informally in an awkward area where electricity poles had been erected 10 m from the hedge, however the field survey suggested that this was a grass strip with some flowers present. Generally, these farmers liked the idea of the pollen and nectar mixes envisaging an array of wild flowers. However, most had experienced difficulties in establishing the strips that lead to overall disappointment and consequently low perceived benefit scores.
8.2.3 Differences between perceived and observed scores Buffer strips against boundaries: Farmers’ perceptions of the environmental value of the buffer strips against boundaries were higher for those strips managed within a scheme than the observed score. By their very presence farmers often felt that the margins had an environmental value. However, these margins scored low in the environmental assessment if they were sown with a simple grass mix, rather than a diverse seed mix. Buffer strips against watercourses: In nearly all cases the buffer strips against watercourses were perceived by farmers to benefit the environment due to the protection they offered watercourses from water pollution. The environmental assessment identified a number of reasons for a lower mean observed score for these features. Some were used for vehicle access or horse gallops, resulting in significant compaction, and some were mainly grass dominated resulting in poor species diversity. Field corners: Field corners were generally perceived by farmers as being beneficial to the environment. However, they were viewed as a feature to be left unmanaged. As a result many of the features under AES of CFE were left uncut, whereas field corners under voluntary and other management were generally cut on an annual basis and at an inappropriate time of year. Game crops: Some farmers who were managing game crops outside of an AES, felt that these were extremely beneficial for wildlife. They often scored poorly in the environmental assessment because they were sown almost exclusively with maize, rather than a more beneficial mix of crop species. Also generally AES and CFE covers were retained for longer in the spring. This is an area where more advice could improve the environmental benefits gained from game strips, although particularly where shooting is the principal driver, cost issues may prevent adoption of more beneficial mixes.
135

Pollen and nectar mixes: Overall, the pollen and nectar mixes were scored lower by farmers for their environmental benefit than other features. The farmers on the whole expressed disappointment with this feature due to the difficulties experienced with establishment. These also scored low in the environmental assessments. In-field trees: Interestingly, the perceived benefit score given by farmers for in-field trees were lower for those managed under an AES than those managed informally. It appears that the environmental benefits of in-field trees are not always recognised. For example, respondents did not fully understand the environmental benefit of leaving land uncultivated under the tree canopy as illustrated by a farmer who, even though he had a high positive attitude to the environment score, had planted game crops underneath all his in-field trees. Arable reversion: Farmers had a lower perception of the environmental benefits from arable reversion for those in an AES and those outside of a scheme. Some disappointment was expressed by the farmers in AES for the lack of plant diversity developed within the grassland, although the environmental assessment scored these features high for environmental benefit. A number of farmers had left arable areas to revert to grassland around certain features, such as a pond and viewed this as arable reversion. In-crop fallows and skylark plots: In-crop fallows mainly took the form of lapwing plots. There was mixed views from farmers on their environmental who were undertaking these under AES, some saw them as beneficial, whilst one in particular viewed his lapwing plot as ineffective. Stubbles: Over-wintered stubble is another activity where farmers’ perceptions of environmental benefit did not always match those of the observed benefits. There were mixed views from the farmers about the environmental benefit of stubbles. Some of the farmers undertaking the stubbles option within AES, in particular, were not always convinced of their environmental benefit, although others had witnessed benefits in terms of seeing more birds and hares. In the environmental assessments, AES stubbles scored higher than other management groupings across most of the attributes assessed, including herbicide use and weed cover, the length of time they were retained and stubble height. The observed benefits of informal stubble were low due to inappropriate herbicide usage, intended date of destruction and stubble height and insufficient weed/volunteer cover. Hedgerows: Hedge management is an activity where farmers’ perception of environmental benefit did not match the field survey scores. As mentioned above, some farmers who may have had a long history of planting and laying hedges on the farm were not keen on the hedge cutting prescription. It was recognised that while 2 to 3 year cuts would allow for berry production, creating a better food supply for birds, there was concern that it might also allow the structure of the hedge to become more open, making the bird’s nests more vulnerable to predators. Hedge structure was not assessed to this level of detail in the field survey. Generally, the hedges managed under AES scored higher in the environmental assessments than those managed informally or not managed for environmental benefits. Hedges in AES were tallest and those not managed for the environment were shortest, although most hedges achieved a maximum height score. Uncultivated strips adjacent to hedges managed under other management were narrower than for other management categories, and 53% of these strips did not meet the cross-compliance requirements compared to 23% for AES and 20% for voluntarily managed hedges. AES hedges were cut least often and were most likely to be cut in late winter (35%), whereas most hedges under ‘other’ management were cut annually and most likely (40%) to be cut during spring or summer. Hedges under informal management had intermediate scores for these attributes.
136

8.3 The balance of environmental management activities and benefits accruing from formal and informal provision
Analysis of the FBS revealed that, nationally, roughly two thirds to three quarters of environmental activity is undertaken within an AES, whilst a quarter to a third is undertaken informally (i.e. outside an AES). A greater proportion of environmental activities, particularly field corners, buffers strips and wild bird/pollen and nectar mixes are likely to occur within AES. The exception is uncropped land (excluding buffers and cross-compliance strips) which is predominately undertaken informally. This may represent areas of former set-aside land that have not been brought back into production once the set-aside scheme finished.
In general, differences in environmental scores between management types were small and often the range of scores for features on individual farms was similar for different management. Management type only resulted in statistically significant differences in overall scores for hedgerows and in-field trees. However, some individual attributes for a much wider range of features did suggest that there were actual differences in the environmental quality. Attributes assessed were a combination of management factors and field survey. Some attributes could be rapidly changed (e.g. hedge cutting time and frequency) whereas others represented the cumulative effects of indirect management over a period of many years (e.g. evidence of nutrient enrichment of cross compliance strips). Although the combination of scores for a range of attributes will identify environmental quality, there are elements which are unlikely to be influenced by a change in management in the short term.
8.3.1 AES management
A key reason for undertaking environmental management within AES, identified by both the exports advisor’s telephone interviews and the farmer interviews is the steady income stream offered by AES payments. It was also suggested that the more efficient farmers were able to place the poorer yielding land into AES, although some farms, such as fenland farms with their straight edges and lack of features, have few poor yielding areas. The environmental assessments found that overall the environmental features managed under an AES were of higher environmental quality than those outside the AES. Comparison for individual features suggested that in particular environmental quality was greater under AES compared to other management groups for pollen and nectar mixes, woodland edges, short term fallow, arable reversion, overwinter stubbles and hedgerows. Many of the attributes important in high scoring AES features related to attributes that can be easily changed (e.g. hedge cutting frequency) and those where AES prescriptions are associated with high scores (e.g. seed mix on wild bird covers). However, other attributes would not score highly if the minimum ES prescriptions were followed; for example buffer strips established with a simple grass mix (allowed under ES) would only score 1 for this attribute. These factors, combined with the fact that some attributes represent cumulative effect of management over many years, mean that meeting the minimum AES requirements does not always ensure high scores are achieved. The quality of features entered into AES can also be a factor in determining scores. For some existing features only those in higher environmental condition could be entered into an AES. Features may not qualify for inclusion below a certain condition. For example hedges, where gaps represent more than 20% of the length, are less likely to be entered into an AES because above 20%, the length must be deducted from the length declared. Alternatively, features for which management change is not required to enter AES are more likely to be entered into a scheme, but would have a higher environmental value than features not entered. Grassland is most likely to be entered into AES options if it historically received low fertiliser rates and these grasslands will support greatest diversity.
137

8.3.2 Informal management
There is clearly a significant amount of informal activity undertaken on farms. Both the telephone survey of advisors and the farmer interviews suggest that this informal activity tends to be restricted to the easier and more convenient types of environmental management. Also this type of management activity is influenced by the extent to which the activity aids farm management. In particular, margins and field corners that were managed informally were considered in this way because the margins allowed occasional access for machinery and field corners helped to straighten up awkward corners.
8.3.3 CFE management
There was knowledge amongst most of the respondents that CFE was an industry-led campaign that was trying to prevent the introduction of compulsory set-aside and for some they saw it as something that they should support. Nevertheless, very few of the case study farmers interviewed had any detailed knowledge of the CFE management requirements and only two made any reference to the management guidelines. However, it should be noted that not all the farmers interviewed were in CFE target areas where the CFE is strongly promoted through a county co-ordinator. Others were also reluctant to engage with anything that they perceived as requiring more paperwork and bureaucracy, especially if this was additional to existing agri-environment scheme, cross compliance or accreditation requirements. This was the case even for those who were already managing areas of land informally for the environment. The CFE was not mentioned in the general discourse about reasons for engaging in environmental activities and usually only entered into the discussion when prompted. On the case study farms, CFE recording was capturing existing informal management activities but CFE participation was rarely prompting additional environmental management activity. The farmer interviews also found examples where farmers were coming out of AES but were retaining some features and putting these towards their CFE contribution. Some discrepancies appeared between what was recorded on the CFE postal survey forms and what was said in the interviews. For example, although some interviewees had ticked the box stating that they joined ELS in response to CFE, this rarely, if ever, appeared to be the case. Also some of the management activities recorded as part of the Campaign were actually ELS/HLS options. The condition of features under CFE management was often similar to those managed under an AES.
8.3.4 Cross-compliance
The majority of the respondents viewed the cross-compliance requirements as common sense and simply good farming practice. Most believed they would continue with the cross-compliance requirements if they were no longer enforced. There appeared to be a general acceptance of the 2 m margin requirement, recognising that they provided environmental benefits as well as reducing the risk of damage to the machinery. A few respondents, however, viewed the margins as harbourers of pernicious weeds and one resented taking land out of production which could be used to feed the world. The advisors’ telephone interviews also suggested that the soil protection review was less than successful, questioning farmers’ understanding of, and adherence to, these requirements.
138

8.4 The interactions between land under formal agreements and land outside of agreements
The FBS analysis has revealed that over 51,000 farms, almost 90% of the population, undertook some countryside maintenance and management activities. This included almost all cereal farms (98%). Clearly, it would appear that there is considerable amount of environmental management taking place on farms. Around 45% of farmers who are undertaking environmental management activities do this in a combination of both AES and informal activities. The research explored the interaction between land on individual farms managed under formal agreements and outside of agreements.
Clearly, our data shows that the situation is quite complex. The main environmental activities where there is interaction between formal and informal management within a farm are buffer strips, field corners, game crops, in-field trees, grassland and hedgerows. Where within-farm comparisons were possible, the environmental assessment found relatively few differences in environmental quality between formal and informally managed features. Farmers often referred to managing both formal and informal features in the same way and there were a number of reasons for this occurring.
Some farmers interviewed highlighted that many of the current AES options were previously managed informally. The advisors also suggested that much of the informal agri-environmental management ultimately ended up being incorporated into formal schemes, margins and field corners. Often features, such as hedges, which were of better environmental quality, were placed into AES, whilst the poorer quality hedges continued to be managed informally. Also where hedges were part of an AES, but points were not registered on the full length, some farms simply managed all features on the holding according to AES prescriptions. Other environmentally engaged farmers did not have an AES because they did not want to be restricted by the prescriptions. Sometimes there was a lack of understanding about the importance of prescriptions, hence informal management achieved less than an AES would have done. Due to the perceived inflexibility of ELS prescriptions, some farmers who wanted to manage features slightly differently, but with similar environmental benefit, had not entered these features into and AES. One farmer, who still laid hedges, was prevented from cutting the hedge sides at the bottom each year under an AES, despite the retention of a significant food source above two metres. With margins in particular, it appeared that some of these features were additional to the AES requirements but were being managed to the prescriptions due to the increased flexibility that this offered the farmers. Having these additional margins provided the flexibility to change the location of these margins across the farm if necessary, or in the case of a nectar/pollen mix acted as a back-up if another strip failed to establish properly. The environmental assessments found that buffer strip scores were largely similar for the different management categories within farms, which suggests that they are managed in a similar way across the farm. The flexibility of management outside of the scheme also gives the farmers the option to bring these areas back into production should commodity prices rise.
There was also evidence that on some farms, and particularly the larger farms, margins were being left wider than the cross-compliance strips and managed informally, in order to protect their SPS payments, which was viewed as an important source of income. Similarly, some larger farms were managing an extra 10% on their margins to ensure compliance with the scheme prescriptions in order to protect their AES payment.
139

Finally, in situations where farmers had not renewed their AES agreement, some had retained AES prescriptions for certain features, particularly margins and field corners. Frequently these features were then put forward as their contribution to CFE. In fact, this was often the reason why some farmers agreed to be interviewed to convey their view that they were still contributing to the environment, despite not renewing their AES agreement. Some were ‘between’ AES agreements, therefore, this management contributed only temporarily to informal environmental management, others intended to retain elements of their AES and consequently AES had made a permanent change in behaviour.
8.5 Key implications for Policy Makers
One of the purposes of this study is provide guidance for policy makers who are seeking to promote environmental management practices on farmland through their actions and initiatives. Key messages from the research are summarised below. Key drivers of environmental activity • The research showed that no single factor is responsible for driving farmers’ attitudes to
the environment, but this is based on a complex set of factors. Farmers are not solely driven by financial motivations, other factors play a part such as personal interest in environment, game shoots, a sense of social responsibility or farming self-image. The research suggests that the key to ensuring long term farmer behaviour change is to change farmers’ mindsets so that they are willing to adopt environmental management practices. This requires internalisation of the values underpinning environmental management activities and it would appear from the farmer interviews that there is an increased acceptance within the farming community of the need to demonstrate their environmental credentials. Farmers generally appear to have a much greater sense of social responsibility for the environment than previous generations, sometimes resulting in intergenerational divergence of opinion on the farm. Policy-makers should continue to encourage and reinforce a sense of civic responsibility for environmental management amongst the farming community, particularly given the emerging discourse about the need to maximise food production to counter the threats of food security. Policy-makers have a role to play in communicating that environmental management and productive agriculture are not mutually exclusive.
• Alongside the mainstreaming of environmental management/awareness, there is still a
small group of farmers who are resistant to the environmental message and who are not engaging with positive environmental practices. These farmers tended to hold strong views about maximising production from their land or are fearful of outside interference and loss of control of their management. Policy-makers should consider the cost-effectiveness of bringing these farmers into the agri-environmental fold. Further targeted advice and incentives may help change the attitudes of some of these resistant, “productivist” farmers. However, an increasing recognition of the need for a greater quality of agri-environmental management rather than simply an ever increasing quantity suggests that efforts might be best directed to those who have embraced the concept of agri-environmental management (for whatever reason).
• When discussing their personal interest in the environment, farmers referred to the
impacts on the higher species that are clearly visible on their farms, such as birds, hares, deer, butterflies. In promoting environmental activities, policy makers should focus on articulating the benefits to those species that resonate with farmers’ experiences. Also those farmers undertaking minimum tillage practices felt that they were benefitting the environment in ways that were not always recognised by policy-makers or AES.
140

• A number of factors were shown to restrict farmers’ ability to adopt environmental
management activities, raising equity issues. Small farms felt disadvantaged by AES as their options for achieving the required ELS points were more limited than larger farms and meant more land had to be taken out of production. Also it is easier for some farms to leave areas of unproductive land due to the location of existing features and nature of the farm type. Compare a fenland farm with straight boundaries and few environmental features to a mixed farm with woodlands. Policy-makers should consider a points system that accounts for small field sizes and farms with few existing environmental features.
Benefits of individual environmental management activities • Farmers particularly value game strips as an environmental activity, which were also felt
to benefit smaller wild birds. There was evidence of experimentation with seed mixes and a holistic approach to locating these strips across the farm. However, the wildlife benefits of these strips were often limited as they were only sown to maize. There is the potential for policy makers to capitalise on farmers’ enthusiasm for game strips by promoting more diverse seeds mixed for game strips and finding ways to link game strips to providing other wider wildlife benefits.
• Farmers contest some AES prescriptions, and particularly those relating to the rotational
cutting regimes for hedgerows. Some farmers undertaking positive environmental management practices on their farms strongly believed that the 2 to 3 year rotational cutting negatively impacted on hedge structure. This issue needs to be explored further as it is deterring some farmers from not only entering hedges as an option in AES, but also taking up the schemes.
• Difficulties experienced in establishing pollen and nectar strips meant that some farmers
were disillusioned with the option. Their experiences of implementation did not match their vision of margins filled with wildflowers. Policy-makers should provide additional advice and guidance to help achieve successful establishment of these strips.
• A distinct view emerged that environmental activities should take place at the periphery
of productive land and many farmers were in favour of environmental management on the margins of the farm where it would have least impact on agricultural production. For this reason many farmers, even those who have embraced agri-environmental management, remained resistant to the idea of in-field options. It might be argued that as few arable farmers are willing to undertake in-field options that funds and advisory efforts are best devoted elsewhere. By removing the need for in-field options, farmers may even embrace boundary and margin management more fully and enthusiastically. Conversely, it could be argued that whilst many farmers implement environmentally beneficial management of boundary and margin features on a voluntary basis, funded agri-environment schemes may be essential in persuading farmers to adopt more challenging in-field options which have been developed to benefit a different group of species, such as skylarks.
• Minimum tillage was one practice that was undertaken outside of any agri-environment
scheme and was viewed as providing significant environmental benefits. Concern was expressed that current AES options did not fully incorporate direct drilling practices. Consideration should be given to further integrating direct drilling practices into current AES options in order to achieve maximum environmental benefits.
141

• A strong view emerged that introducing livestock onto arable farms would significantly enhance the environmental value of the land to a much greater extent than trying to introduce individual environmental activities into arable fields. Policy makers should consider promoting more mixed farming in arable areas to improve environmental benefits.
Interaction between formal and informal • Reasons given for undertaking environmental activity outside of a scheme were mainly
agronomic. Margins, in particular, were undertaken informally as this offered greater flexibility in terms of locating the features around the farm and in terms of management, such as vehicular access. This finding suggests the need to promote environmental activities that also accommodate farm management practices.
• Whilst the CFE has raised the profile of the importance of informal activities in delivering
environmental benefits, the research identified very few new activities that were implemented in response to CFE. Much of what was recorded as CFE activity was either previously managed informally or was previously within an AES. Also there was little evidence that farmers in CFE were following the CFE guidelines and a general reluctance expressed to follow guidelines for activities that are managed informally. Of greater importance to farmers is the flexibility to manage the features to fit in with their farm management, such as vehicular access or flexible cutting times on margins. If a policy objective is to improve the quality of informally managed land, then alternative mechanisms, other than guidelines are required to disseminate this information.
• The evidence from the research points to widespread informal agri-environmental
management, some of which ultimately ends up being incorporated into formal schemes. This however, should not be taken as grounds for cutting agri-environmental spending based on the assumption that farmers will continue with informal management. Some would and some would not, but as the environmental assessment has shown it is likely that the quality of management would suffer with the withdrawal of the financial incentive for due care and attention. Also environmental management under AES offers some level of permanence in management, which cannot be guaranteed with informal management activities. Despite a general increase in environmental awareness that are still some farmers who would bring areas of informal activity back into production should commodity prices rise.
142
Appendix 1: Weighting the results of Countryside Maintenance and Management Activities module
Some of the farms classed as having not responded to the module, were in fact included in the observed sample population, but had not been surveyed due to not having any of the relevant features. The research officers therefore provided further information on the non-responses, categorising them as below:
• Intensive livestock system/not suitable; • Farmer unwilling/insufficient RO time; and • Farmer willing, but environmental practices undertaken as normal part of farming
system; no positive environmental management practised.
As farms in the first and third categories were in fact observed in order to determine that there was no relevant activity taking place on them they were included in the sub-sample population for reweighting purposes. E.g. weights were redistributed from the category farms where the farmer was unwilling/insufficient RO time only. As participation in an agri-environment scheme as well as the classification of a farm by farm type and farm size were significant factors in selection of a farm for the module, a new stratification was derived to take these factors into account for the re-allocation of the survey weights. (The core FBS survey design operates on farm type and size stratification). In addition, intensive farm types (specialist poultry, specialist pigs and horticulture) returned a similar probability of selection and so were classed together as one combined type. Within these strata weights we re-allocated from the category farmer unwilling/insufficient RO time to all other farms in the FBS target population.
143

Appendix 2: Face-to-face interview schedule Sample No (UID): Interviewee Name: Position in Farm Business: Time start: Time finish:
Section 1 You and your farm (20 mins) • What are the key features of the farm in terms of its business structure, enterprises and land
management? • What are the key factors (driving forces) which influence the management of the farm? • Why does the farmer manage the farm the way he/she does? • What is the farmer’s attitude to environmental management and how has this changed over the
period of farming?
Section 1A Farm structural characteristics Section 1A aims to provide a description of the farm as it is now and how it’s changed recently (Size, tenure, land use, farming system, enterprises, farm type, labour). The intention is to get an overall picture of the farm business and its enterprises with a view to understanding how this might influence attitudes to environmental management.
1. Tenure 1. What is the influence of tenure on farm and environmental management • What is the total area of the farm, how much is owned and how much rented.
Tenure Ha Owner-occupied Rented in - Tenanted (at least 1 year) Rented in - Short-term agreements (less than 1 year)
Rented out Contract / share farming Total area farmed
Prompts
• Make-up of your farm in terms of ownership and rental arrangements. • Reasons behind any changes in tenure and farm size. • Quality of relationship with landlord
144

2. Enterprises In the next set of questions we will be looking at main farm enterprises (arable and livestock).
2. What arable crops do you produce on the farm?
Crops Ha Description of rotation
3. Why do you grow these particular crops? • Any recent changes to crops grown
4. Do any of these crops produce any environmental benefits? 4b. Do you grow any spring crops? If spring crops grown are they undersown?
4c. Do you practice minimum tillage?
5. What livestock do you have on the farm? [describe types, systems, numbers]
Livestock system Livestock types Nos
• Reasons for adopting this type of livestock system and livestock type.
Narrative notes: Enterprise type and understanding how and why each enterprise is managed the way it is
6. Any recent changes in the balance between enterprises: • Stability, expansion, contraction, stop start (why?)
3. People working on the farm
145

7. Who is involved in the management and ownership of the farm business?
8. How long have you been in farming? How long have you been making decisions on the farm?
9. Including you, how many people are employed on this farm, are they full-time or part-time? Has this changed recently?
10. If contractors are used, for which tasks and what are the reasons for this.
11. What is the influence of contractors on farm and environmental management? 4. Economics of farm business and future plans
12. Probe to identify the importance of the farm to the household income Prompts • How important is it for the farm to make a profit? • Are there other sources of income? • Are there any on-farm diversification activities that are important? • If there are non-agricultural sources of income how important are they to the household income • If these are agri-environment schemes, how important are these payments to the farm income? • How important is Single Farm Payment to farm income
13. What are your future plans for the farm, over the next 5 years? (e.g. winding down,
build up certain enterprises, more emphasis on environmental payments, etc.)
14. Do you have a successor – does this influence your decisions?
Section 1B Farmer/family characteristics Section 1B aims to provide a description of the family and the farmers values and beliefs with a view to understanding how this might influence attitudes to environmental management.
146

15. Ask the farmer to describe himself? Eg ‘What sort of farmer are you?’ Prompt
• Smallholder, commercial farmer, hobby farmer, technical, efficient?
16. Ask the farmer to describe his/her overall approach towards farming? Prompt
• What is the main reason for being in farming/ his/her goals? • What are the priorities on the farm – profitable business or other • ‘Would you say you are progressive - embrace new practices quickly?’ • How do you sell your products?
17. Who makes the decision about environmental management on the farm? Prompt
• Who helps with day-to-day decisions? • Who is involved in more strategic decisions?
18. What about other farmers in the community? Prompt • How would he describe them? • How does the farmer think he is perceived? • Does he share the same sorts of ideals/goals? Does he see himself as part of the farming
community? Is there more value given to conservation now?
19. Does he feel that there are situations when environmental management is detrimental or beneficial to efficient agricultural activity?
147

2. Environmental scheme or policies affecting the farm (10 mins)
20. Environmental history Ask the farmer to describe the changes made on the farm that have benefited the environment since they started managing the farm. (Do not prompt at this stage in order to identify what they view as environmental activities)
21. What environmental interests do they have? Prompts • Are they any particular aspects of the environment/wildlife they are interested in? • Do they belong to any environmental organisations?
Prompt Card FWAG Leaf RSPB Wildlife Trust Game and Wildlife Conservation Trust Soil Association Woodland Trust ETC.... • Have you (or other family members) been involved in any training for environmental work (e.g.
hedge maintenance, constructing conservation areas, etc.? • Who would you go to for advice on environmental management?
22. What policies or schemes have affected the way that they manage the farm? Show the farmer the prompt card and ask them to identify which schemes or policies have impacted on the farm
148
Prompt card Agri-environment schemes Countryside Stewardship Scheme Environmentally Sensitive Areas Higher Level Environmental Stewardship Entry Level Environmental Stewardship Organic Entry Level Environmental Stewardship Wildlife Enhancement scheme Campaign for the Farmed Environment Regulations Cross-compliance Nitrate Vulnerable Zones SSSIs Accreditation programme Red Tractor Farm Assurance Combinable Crops & Sugar Beet scheme Supermarket protocols LEAF Organic – Soil Association

23. If the farmer is part of or has been part of any AES, probe for the following:
• Why did they go into the AES? • What difference has it made? • What have they learnt about the best ways of managing the farm to benefit the
environment? • To what extent is there transferability of skills from schemes to other projects/area of
farm work (i.e. do skills development within the scheme programme benefit work outside it?)Does the scheme reflect their priorities for what should be preserved and enhanced on their farm? If not, why not?
• How easy or difficult have they found it to fulfill the scheme requirements, and why?
24. Probe about the regulations (cross-compliance measures) that they have to comply with?
• Are there any cross compliance measures for which you do not understand the
rationale, what it is trying to accomplish? • Are there any environmental management activities that they would like to do better? • How easy or difficult have they found it to fulfill the regulatory requirements, and why? • Would you continue with the cross-compliance measures if they were no longer
available?
25. If they are part of an accreditation programme, producer protocols, probe for the following:
• What environmental activities they need to undertake • Why did they go into the accreditation scheme? • How easy or difficult have they found it to fulfill the programmes requirements, and why?
149

3. Individual Environmental Management Activities (20 mins) Show the farmers the map of the farm and explain that you would like them to identify the features and areas of land that they manage for the environment. Explain that you would like to ask about activities that are undertaken: • as part of an AES • as part of CFE • informally, not part of any prescriptions
Firstly, check that the farm boundaries shown on the map are correct.
26. Using a map ask the farmer to identify all margins on the farm that have been managed for the environment. Identify those managed under an AES in green pen, as part Campaign for Farmed Environment in blue pen and those done informally in a red pen. Also ask them to identify examples where these features are not managed for the environment and mark in black pen. Make a note of any activities that are done as part an accreditation programme or producer protocols.
• Buffer strips/grass field margins next to a watercourse (MW) • Buffer strips/grass field margins next to a hedge/fence (MH) (MF) • Field corners and other uncropped areas, including former set-aside (FC) • Game crops/wild bird seed mixes (GC) • Pollen/nectar mixtures and flower-rich margins (PM) • Uncropped cultivated margins (UM) • Conservation/unfertilised/unharvested headlands (CH) • Woodland type, Woodland edges and fences (WE) (WF) • Scrub (S) For each activity ask the farmer: • AES activities - the reasons for including in AES, were they doing this activity previously,
whether they would continue if AES funding was no longer available? • CFE and Informal activities - reasons for undertaking this activity, for how long, is CFE
influencing their decision to undertake this activity, are they specifically managing the activity according to the CFE guidelines?
27. Using another map ask the farmer to identify all in-field activities on the farm that have been managed for the environment. Identify those managed under an AES in green pen, as part Campaign for Farmed Environment in blue pen and those done informally in a red pen. Also ask them to identify examples where these features are not managed for the environment and mark in black pen. Make a note of any activities that are done as part an accreditation programme or producer protocols.
• In-field trees (IT) • SRC/Miscanthus (SRC) • Short-term fallow (F) • Arable reverted to grassland used for livestock (AR) • Beetle banks & in-field grass strips (BB) • In-crop fallow plots & skylark plots (IP) (SP)
150

• Spring crops, fodder crops (SC) • Stubbles and stubble management (S)
For each activity ask the farmer: • AES activities - the reasons for including in AES, were they doing this activity previously,
whether they would continue if AES funding was no longer available? • CFE and Informal activities - reasons for undertaking this activity, for how long, is CFE
influencing their decision to undertake this activity, are they specifically managing the activity according to the CFE guidelines?
28. For those in-field activities not undertaken probe for the following: • Why they have not taken up these options within their AES? • Do they think these options would be environmentally beneficial? • Are their financial risks involved? • What would family members or other farmers think if they took it up? • Do they have enough knowledge to make the management changes required? • Could they be persuaded to take them up, and if so, what would it require?
29. Using another map ask the farmer to identify all the boundary features on the farm that have been managed for the environment. Identify those managed under an AES in green pen, as part Campaign for Farmed Environment in blue pen and those done informally in a red pen. Also ask them to identify examples where these features are not managed for the environment and mark in black pen.
• Hedgerows (H) • Stone walls (SW) • Grass banks (GB) • Ditches (D) • Watercourse (W) For each activity ask the farmer: • AES activities - the reasons for including in AES, were they doing this activity previously,
whether they would continue if AES funding was no longer available? • CFE and Informal activities - reasons for undertaking this activity, for how long?
30. Please can you describe what happened to any former set-aside land?
151

4. Environmental Benefits Scoring (10 mins) The aim of this section is identify the farmer’s perception of the environmental benefits of the activities they have identified in the previous section. Please ask the farmer to score the environmental benefits, but also to explain the reasons for this score.
31. On a scale of 1 to 3 with 1 being Not Convinced Of Any Benefits, 2 A Few Benefits and 3 Significant Benefits, please provide a score for the environmental benefits you believe each activity has produced.
Go through each of the maps and record in the table the scores for each feature or management activity. As you are doing this ask the farmer for the reasons for giving this score. Environmental Activities AES
CFE
Informal
Not for environment
Other
Don’t know
Boundary features
Margins
152

Environmental Activities AES
CFE
Informal
Not for environment
Other
Don’t know
In-field activities
Thank you for your help. As I mentioned on the phone, during the next couple of months an ecologist would like to come out and undertake an environmental survey of some of the features you have mentioned as managing for environmental benefits. Is there any particular time that would be inconvenient and what is the best number to contact them on? Inconvenient time.... Best telephone number...... Many thanks for your help with this research your views and experiences will really help Defra to understand farmers’ attitudes to environmental management. This is a 2 year project that will not be completed until September 2012. In thanks for your participation we will ensure that you receive a summary of the research report.
153

Margins • Buffer strips/grass field margins next to a watercourse (MW) • Buffer strips/grass field margins next to a hedge/fence (MH) (MF) • Field corners and other uncropped areas, including former set-aside (FC) • Game crops/wild bird seed mixes (GC) • Pollen/nectar mixtures and flower-rich margins (PM) • Uncropped cultivated margins (UM) • Conservation/unfertilised/unharvested headlands (CH) • Woodland type, Woodland edges and fences (WE) (WF) • Scrub (S) In-field activities • In-field trees (IT) • SRC/Miscanthus (SRC) • Short-term fallow (F) • Arable reverted to grassland used for livestock (AR) • Beetle banks & in-field grass strips (BB) • In-crop fallow plots & skylark plots (IP) (SP) • Spring crops, fodder crops (SC) • Stubbles and stubble management (S) Boundary features • Hedgerows (H) • Stone walls (SW) • Grass banks (GB) • Ditches (D) • Watercourse (W)
154

Appendix 3: Methodology for field assessment and scoring of habitats and features of environmental value
8.6 Introduction
This report sets out the rationale behind the methodology used for assessing habitats and features of environmental value on arable and mixed farmland. It is divided into two main parts: a literature review that provides the basis for selecting attributes of importance in relation to the environmental benefits of interest, and a series of tables that define scoring criteria on a 0-3 scale for each of the habitats or features to be recorded.
1.1 THEMES
Habitats and features are assessed in relation to three themes: farmland birds, wider biodiversity and resource protection (soil and water). These have been chosen because they are the three themes used as a focus for the Campaign for the Farmed Environment, and also encompass those identified in the project specification (habitat quality for wider biodiversity or resource protection, plant diversity, flower resources, presence of BAP species or habitats etc.). They are also related to key Government environmental policy issues.
1.1.1 Farmland birds
Farmland birds require three types of resources: nesting habitat, summer foraging habitat and winter foraging habitat.
Nesting habitat varies between species from those that nest on open ground away from trees or boundary structures (e.g. skylarks, lapwings) to those that nest in tall hedges or trees (e.g. bullfinch, turtle dove), an intermediate group being species that favour tall marginal vegetation close to boundaries or at the base of hedges (e.g. yellowhammer, whitethroat). Some tree-nesting species use holes, such as the tree sparrow, while some species that typically use tall vegetation in field margins or by watercourses will also nest within crops (e.g. reed bunting).
Chicks of most species require invertebrate food, whereas many species of conservation concern are seed-eaters in winter. Availability of insect-rich feeding habitat is therefore important in spring and summer, but as well as having a high density of invertebrate prey, the habitat also needs to be accessible. If the vegetation is too dense, birds may find it difficult to forage in and not be able to take advantage of the food resources present.
Raptors and owls require healthy populations of vertebrate prey. For the two species of conservation concern that are typical of farmland, kestrel and barn owl, small mammals are the most important food source.
The assessments identified below are designed to address these issues. Direct measurement of insect and seed resources is too labour intensive to be carried out in most cases, so proxy vegetation-based measures are proposed instead. These can then be interpreted in terms of food resource availability on the basis of previous studies reported in the literature.
1.1.2 Wider biodiversity
Here we include plants, invertebrates and mammals. Most plants occurring on farmland are common species that are mainly of interest in terms of the habitat and food resources they provide for animals. However, a number of arable species are becoming increasingly rare and are targets for management prescriptions under agri-environmental schemes. Species-
155

rich grasslands are BAP habitats that may be found on mixed farms and contain species of conservation interest in their own right.
Invertebrates include a huge range of taxa. In assessing the impact of different types of management we concentrate on groups of conservation interest or that provide key ecosystem services, for which sufficient knowledge of habitat requirements exists, and with functional attributes that can be readily related to easily assessed habitat characteristics.
Mammals of particular interest on arable farmland include the brown hare (a BAP species dependent on open farmland); also voles and mice (often referred to, along with shrews, as ‘small mammals’) which these are an important food source for raptors, owls as well as predatory mammals.
As for birds, vegetation-based habitat condition measures are used as proxies for direct assessment of outcomes for wider biodiversity. However, the large literature on habitat value of different types of vegetation will allow interpretation of the results in terms of value for the taxa of interest.
1.1.3 Resource protection
Soil structure, erosion and water quality are the key elements of concern here. The Cross-Compliance Guidance for Soil Management is a useful source of reference on key issues, soil management and siting for buffer strips (RPA/Defra 2009).
156

2 GROUPS OF HABITATS FOR FIELD ASSESSMENT
Habitats and features to be assessed during field work are listed below. It is expected that only a subset will be present on each farm. Clearly some will be widespread while others will be rare, and probably only present as part of a scheme. More attention will be paid to habitats that occur frequently in the farmed landscape, as these offer more potential for comparison between farms. However, where less common habitats occur they will also be assessed, depending on their value for the themes identified above.
Major habitat categories These are the habitats and features that occur frequently on farms with arable cropping and are important for farmland birds, wider biodiversity characteristic of arable farmland and/or resource protection.
• Hedgerows & hedgerow trees • Ditches • Buffer strips/grass field margins • Field corners and other uncropped areas, including former set-aside • Short term – fallow • Game crops/wild bird seed mixes • Crop types and rotation (inc spring cropping, fodder crops etc.), cultivations and
management • Stubbles and stubble management • Grassland
Minor habitat categories These are habitats and features that occur less frequently and/or are of less significance in terms of environmental benefits in relation to the key themes.
• Other boundaries (stone walls, banks) • In-field trees • Woodland type, Woodland edges and fences • Scrub • SRC/Miscanthus • Arable reverted to grassland used for livestock • Beetle banks & in-field grass strips • Uncropped cultivated margins • Conservation/unfertilised/unharvested headlands • In-crop fallow plots & skylark plots • Pollen/nectar mixtures and flower-rich margins
The sections below consider the key aspects for each habitat and in relation to each environmental ‘theme’, to inform the assessments needed in each case. In section 3, scores are allocated on a 1-3 scale for several criteria relating to the management of each habitat category as a basis on which to assess the quality of management for formal and informal management of each habitat type. These scores can then be related to scores for farmer attitudes to environmental management in general and their views on the value of each habitat type.
157

2.1 MAJOR HABITAT CATEGORIES
2.1.1 Hedgerows
Hedgerows are key habitats for birds and wider biodiversity on farmland, and also provide some benefits in terms of resource protection. Ancient hedgerows in particular are a valuable resource as they support the greatest diversity of plants and animals. Over 600 plant species, 1,500 insects, 65 birds and 20 mammals have been recorded at some time living or feeding in hedgerows (The UK Biodiversity Steering Group, 1995).
Hedgerows are common and widely distributed on lowland farmland throughout England, with the exception of some low-lying areas where the farmland was created by draining wetlands, such as the Fens, Humberhead Levels and Somerset Levels, where ditches are the main type of field boundary encountered.
2.1.1.1 Farmland birds Hinsley & Bellamy (2000) reviewed the factors influencing the value of hedges as bird habitat. Hedges provide breeding habitat, roosting sites, shelter and food, particularly in winter in the form of berries. The yield of berries is linked to cutting frequency, with yield from uncut hedges exceeding annually cut hedges by a factor of 50 (Croxton & Sparks, 2002).
The two most important factors that were positively associated with species richness and abundance of birds were hedge size and the presence/abundance of trees. The presence of dead or decaying trees was valuable as a source of nesting holes, invertebrate food and perches. Adjacent ground cover and structural complexity were also important, and the overall habitat value was influenced by adjacent habitats and the surrounding landscape.
Birds vary in their preferences. Tall, wide hedges with trees tend to have higher bird numbers and species diversity, but some species (e.g. linnet, yellowhammer; Green et al. 1994) prefer shorter hedges with few trees, whilst open country species such as skylark and lapwing avoid hedges. Gaps are negative for hedge and woodland species but positive for open country species.
Hinsley & Bellamy (2000) made a number of recommendations for hedgerow management: (i) combining hedgerows with other semi-natural habitat such as ditches, grass verges, wild bird cover etc.; (ii) encouraging a mixture of hedgerow structural types, consistent with the overall landscape context (e.g. larger hedges with trees near woodland, shorter hedges in more open landscapes); (iii) trimming in rotation so that not all hedgerows are cut each year, and if possible leaving cutting till late winter; (iv) maintaining good cover in the hedge bottom; (v) considering bird species likely to benefit when restoring or creating hedges and designing the structure to suit.
Key attributes Interview: frequency and time of cutting Measurement: height; width; presence, number & size of trees; presence/absence of dead/decaying trees; adjacent habitat (type, structure, width); gaps
2.1.1.2 Wider biodiversity In a review of the ecology and conservation of hedgerow invertebrates, Maudsley (2000) identified as the main habitat factors that influence invertebrate diversity and abundance: botanical composition, structural diversity, provision of shelter and structure of the surrounding landscape. Botanical diversity both of the shrubby component and the herbaceous hedge-bottom vegetation are correlated with diversity of invertebrates. High structural diversity is also associated with high invertebrate diversity. The provision of
158

shelter from wind is important for a number of invertebrate groups, including butterflies (Dover & Sparks, 2000).
In terms of management, cutting frequency and timing is important. Overall abundance of invertebrates tends to be higher in uncut hedges, but some herbivorous groups were found to be more abundant on annually cut hedgerows (Maudsley et al., 2000). Maudsley et al. (2000) also found that cutting in February reduced the abundance of insect larvae more than cutting in September. This conflicts with advice normally given to cut in late winter, to allow birds and mammals to harvest berries during the winter period.
Laying appears to be beneficial to invertebrate diversity, but coppicing is detrimental, at least initially (Maudsley, 2000).
Insecticide drift into hedge bottoms may affect insect populations. Herbicide drift may also have impacts (e.g. Pollard, 1968), though these may only be temporary (Haughton et al., 2001)
Trees in hedges provide increased structural diversity and a specialised habitat for some insects such as flying Diptera (Peng et al., 1992, cited by Maudsley, 2000). Merckx et al. (2009b) highlighted the benefits of hedgerow trees for larger moths. The presence of hedgerow trees increased both abundance and diversity of the larger moths, but interestingly, the effect was only significant on farms that in areas targeted for encouragement to join Environmental Stewardship, suggesting a landscape-scale effect in addition to the local impact of the habitat itself. Further analysis suggested that hedgerow trees increased adult moth numbers because they provide shelter in exposed agricultural landscapes, rather than by providing larval food resources (Merckx et al., 2010)
Hedgerows are important habitats for small mammals, especially shrews and voles. Harvest mice use hedgerows as refuges in winter, but wood mice are less dependent on hedges in an arable landscape than other species, though they are used after harvest and during winter when little cover is available in fields (Tew, 1992).
Key attributes As for birds
2.1.1.3 Resource protection Hedges can reduce both wind and water-driven soil erosion. Skinner & Chambers (1996) examined nearly 400 fields for evidence of erosion in lowland England and Wales and they noted that erosion was marginally greater in fields where the hedges had been removed in the last 20 years. Conversely, Evans (2006) reports on a farm that has been monitored for decades where field boundaries were removed to create larger fields and erosion was common, but after a change of ownership, field boundaries of hedges and trees were replanted with the effect that water no longer moved from field to field, and connectivity with the surface water was broken. Fullen (1985) reported that field boundaries resulted in the deposition of the majority of wind-blown sediment from a light sandy soil, although very fine fractions could be deposited beyond the boundary. Owens et al., (2007) provide quantitative evidence of the ability of hedges bounded by grass margins to trap sediment (0.07 – 0.19 g/cm2) although in the same study, a hedge in another field, that contained a rill network, did not trap any sediment. This highlights the importance of preventing the initiation of soil erosion and rills (and the channelling of water down the line of the hedge), as simple mitigation methods such as hedges cannot be used in such circumstances.
The benefit of the hedge relates to retaining soil within the farmed land. The benefits will therefore be accrued on land downslope or downwind of the hedge, as the hedge will have little effect on preventing the initial removal of the sediment that it is subsequently retaining.
Key attributes
159

Measurement: Location in relation to slope and ditch (if any); presence/extent of gaps; presence/width of adjacent grass strip.
2.1.2 Ditches
2.1.2.1 Farmland birds Many farmland ditches are dry for much of the year, but wet ditches can support species such as reed and sedge warblers (Sparks et al., 1996) and ditch size was associated with seed-eaters, such as linnet, reed bunting and goldfinch, with insectivores such as blackbird, great tit, skylark, song thrush and wren, raptors, corvids and waders (Parish et al., 1995).
Key attributes: Interview: Frequency and timing of cutting bank vegetation; whether one or both sides cut at a time
Measurement: estimate width and depth of water (if present) and ditch banks
2.1.2.2 Wider biodiversity Biggs et al. (2007) compared the aquatic biodiversity of ditches, lakes, ponds, rivers and streams in five locations in Europe in three biogeographic zones. Ditches were the least species rich of these habitats, probably reflecting their small size and physically simple structure as well as their temporary nature and close proximity to agricultural land. However, they pointed out that previous studies had found ditches to be diverse and sometimes exceptionally so for both plants and macroinvertebrates, particularly in low-lying fen landscapes, which are generally deeper and more permanent than the ditches of the current study and often have considerable historic continuity with ancient natural wetlands and comparatively clean unpolluted water.
Milsom et al. (2004) investigated the response of plant communities in ditches bordering arable fields in the Fens of eastern England to bank mowing and dredging. The number of emergent aquatic and riparian species decreased to a greater extent over 4 years in less frequently cut areas and decreased most in uncut plots. In addition, more floating and submerged species colonised ditches mown twice a year than those cut in alternate years. The number of floating and submerged species per ditch tended to increase following dredging. They concluded that dredging at least every three years is necessary for the maintenance of diverse assemblages of floating and submerged aquatic species, and that annual mowing or at least once every 2 years, is needed to maintain diverse communities of emergent and riparian species on ditch banks. They also considered that mowing regimes for floating and submerged species should incorporate an annual spring cut.
Key attributes: Interview: Frequency and timing of cutting bank vegetation; whether one or both sides cut at a time; frequency and timing of dredging Measurement: Bankside vegetation type and diversity, presence of floating and emergent plants in water.
2.1.2.3 Resource protection Ditches are commonly found in low-lying, flat areas such as the Fens that can be susceptible to wind erosion. Encouraging the growth of bankside vegetation will serve to stabilise the bank reducing the potential for erosion and hence soil loss. The tall vegetation could also reduce the effect of wind erosion. Cleaning out the ditch is likely to be necessary at intervals, and returning the spoil to the field will reduce the potential for sediment and any associated pollutants to move further downstream, but will speed up water flow and therefore the rate of transfer of any remaining sediment and associated pollutants (or those
160

entering the ditch subsequently) to downstream watercourses. Implementation of measures such as buffer strips adjacent or uphill from the ditch will help to reduce erosion, runoff of nutrients and pollution by pesticides either through runoff or drift entering the ditch (see below under buffer strips).
Key attributes Interview: Frequency and timing of cutting bank vegetation; whether one or both sides cut at a time; frequency and timing of dredging Measurement: Location in relation to slope and ditch (if any); cover of bankside vegetation; presence/width of adjacent grass strip.
2.1.3 Buffer strips/grass field margins
2.1.3.1 Farmland birds Vickery et al. (2002) reviewed the value of different types of field margins as foraging habitats for birds. Grass margins provide habitat for invertebrates that are important in the diet of a number of bird species, including cirl bunting, corn bunting, grey partridge, yellowhammer and skylark (though skylarks are unlikely to feed in field margins where there is a field boundary structure such as a hedge). Grass seeds are also eaten by several species, including starling, dunnock, house sparrow, tree sparrow and yellowhammer. Field margins are a preferred foraging habitat for yellowhammers (Perkins et al., 2002), and alongside watercourses, if the vegetation is sufficiently tall and dense, may be used for nesting by species such as reed buntings and sedge warblers. However, increasing density of the sward as the season progresses may hamper foraging by birds unless the sward is opened up to improve access (Douglas et al., 2009).
Vickery et al. (2002) suggest that cutting in August or September will facilitate foraging by species such as thrushes that feed on ground-dwelling invertebrates, but may reduce the value of the margin for ground-nesting birds. Douglas et al. (2009) found that cutting patches in grass field margins within taller swards increased the use of the margins in late summer. However, The SAFFIE project found that other methods of opening up the sward, such as scarification and selective herbicide use, were more effective than cutting. Average bird densities were twice as high in scarified and graminicide-treated margins as in cut margins (Potts et al., 2007). The extent to which cutting of margins is beneficial to birds is not therefore clear. In practice, cutting some of the sward and leaving some uncut, is likely to maximise benefits for birds.
Key attributes Interview: (if sown): year of sowing, details of seed mixture (if available); frequency and time of cutting.
Measurement: strip width, vegetation type, cover and diversity
2.1.3.2 Wider biodiversity There has been a large amount of research carried out on the benefits of grassy field margins for a range of wildlife. Field margins provide habitats for butterflies (Feber et al., 1996; Pywell et al., 2004) moths (Merckx et al., 2009a) and other invertebrates (e.g. Asteraki et al., 2004; Woodcock et al., 2005). Field margins can act as ‘shelter habitats’ for a range of predatory taxa, including ground beetles (Carabidae), rove beetles (Staphylinidae), and spiders (Araneae), some of which can be important biocontrol agents for agricultural pests (Griffiths et al., 2008). Many species from these groups overwinter in field margins and migrate into the crop in spring. However, Holland et al. (2008) found in an empirical study that wide field margins provided little benefit for biocontrol because flying predators capable of moving between fields were as effective as all predators combined, giving 90+% control of aphids. Furthermore, they found no evidence that wide field margins increased natural
161

enemy abundance in fields, though other studies have demonstrated this (e.g. Lys et al., 1994; Dennis et al., 1994).
Marshall et al. (2006) found that numbers of bees were higher in boundaries with 6 m grass margin strips than in control boundaries, and were also higher in the centres of fields with 6 m margins than in control fields. The presence of grass margins also increased bee diversity. Also, abundance and species richness of Orthoptera (grasshoppers and crickets) was significantly higher in boundaries with grass margins. Clarke et al. (2007) found that a typical grass margin provided a good resource for those invertebrate species that are dependent on sward architectural complexity; but for phytophagous species, including pollinators such as bees and butterflies, grass mixtures containing forbs were better. Field margins enhanced with sown wildflower mixtures are discussed below. (section 2.2.11)
Grass margins also provide habitat for small mammals (Bence et al., 2003; Askew et al., 2007; MacDonald et al., 2007). Shore et al. (2005) compared small mammal abundance and biomass in spring and autumn on 3 m wide and 6 m wide grassy margins with that on conventionally managed field edges that had no margin and were intensively cultivated to the field edge. In autumn, bank vole and common shrew numbers were higher on the grassy margins than on conventional field edges, and margin width was positively associated with bank vole abundance. Total small mammal biomass increased between spring and autumn on the grassy margins, but decreased where there were no margins. Total biomass in autumn was three times higher on 6-m-wide margins compared with the conventional arable field edges. Although Shore et al. (2005) captured few field voles, probably because the margins were recently established, on more mature margins field vole abundance has been found to correlate positively with grass verge width, with voles generally absent on narrow (< 4 m wide) verges (Bellamy et al., 2000). Cutting the vegetation is likely to expose small mammals to greater risk of predation (Tew & MacDonald, 1993) and may also directly injure or kill adults and young in the nests.
For invertebrates, taxonomic groups differ in their response to cutting; tall grassland supports more species, individuals and a greater diversity than short swards, though some species prefer short grass (Morris, 2000). For invertebrates in general therefore, cutting is not likely to be beneficial. This was demonstrated by Smith et al. (1993), who found that mowing significantly reduced numbers of invertebrates, especially if carried out in summer. The effects were particularly severe for spiders and Auchenorrhyncha. They concluded that invertebrates were best conserved by avoiding summer mowing and by mowing once a year or less, preferably rotating the areas that are cut each year.
Key attributes Interview: (if sown): year of sowing, details of seed mixture (if available); frequency and time of cutting.
Measurement: strip width, vegetation type, cover and diversity; cover of nitrophilous species
2.1.3.3 Resource protection The primary benefit of buffer strips is that they limit direct losses to watercourses during application and prevent poaching and direct defecation, where applicable. Buffer strips play an important role in filtering sediment and associated phosphorus (P) and pesticides. There is strong evidence that buffer strips can reduce the quantity of pesticides reaching water (e.g. Zande et al., 2001; Porskamp et al., 1995), but buffers are not always effective at reducing leaching of nitrate (Muscutt et al., 1993; Sabater et al., 2003), weakly sorbing pesticides (Reichenberger et al., 2007), or soluble reactive P (Borin et al., 2005; Uusi-Kamppa et al., 2000) and their effectiveness is highly variable. It is the size and location of the buffer in relation to the risk that determines their effectiveness, thus a reduction in pollutants contained in runoff and throughflow is more likely to occur where they are appropriately sited. Moreover, buffer strips do require some management in order to remain
162

effective (e.g. by removing accumulated sediment) hence they should not be left undisturbed indefinitely. There is the potential for the accumulated nutrients to be released if there is a change in land use. Nevertheless, avoiding agro-chemical and manure inputs in the proximity of a watercourse is likely to be beneficial regardless of any other limitations. Buffer strips next to water courses will reduce pollution from pesticide drift (e.g. de Snoo & Wit, 1998; Zande et al., 2001), and there is evidence that the reduction in direct losses of pesticides to watercourses increases with increasing width of buffer.
Key attributes Interview: frequency and time of cutting, whether any accumulated sediment is removed at intervals.
Measurement: strip width, vegetation type and cover and evidence of compaction.
2.1.4 Field corners and other uncropped areas (including former set-aside)
2.1.4.1 Farmland birds Effects on birds are likely to be similar to the former set-aside regime. Boatman et al. (2009) found that set-aside has the potential to provide a range food plants for birds. However, the vegetation structure of mature set-aside is less well suited to foraging by birds than the more open structure of young or rotational set-aside. Field corners and areas near margins are likely to be used by birds that nest in hedgerows or herbaceous vegetation adjacent to hedgerows, e.g. yellowhammer and whitethroat (Stoate, 1999; Stoate et al., 1998), as well as for foraging (Perkins et al., 2002; Douglas et al., 2009). These species will be negatively affected by overall cutting. However, cutting patches may increase use of the strips for foraging, e.g. by Yellowhammers (Douglas et al., 2009). Vickery et al. (2002) propose leaving the part of the strip next to the hedge uncut, as this is likely to increase the attractiveness of the vegetation for these species.
Storage and/or application of organic manures will provide a substrate for invertebrates to feed and reproduce, and the enhanced invertebrate populations can attract insectivorous birds (Vickery et al., 2001; N. Boatman, pers. obs.)
Key attributes Interview: (if sown): year of sowing, details of seed mixture (if available); frequency and time of cutting, whether herbicides, other pesticides, fertilisers, manures etc. applied and if so, type and timing/frequency. Use of area for storage of manure.
Measurement: vegetation type and cover.
2.1.4.2 Wider biodiversity Effects on wider biodiversity are likely to be similar to the former set-aside regime. Boatman et al. (2008) concluded from the results of a survey of set-aside that “in areas dominated by intensive agriculture (including improved grassland), set-aside can potentially support a diverse plant and animal community that might otherwise be absent or restricted to any small areas where semi-natural vegetation persists. In addition, under certain conditions there is the potential for plant communities to develop which are of greater conservation value in their own right”. Boatman et al. (2009) found that set-aside has the potential to provide a range of food plants for widely distributed butterfly species, many of which have declined. However, sward height and density also need to be considered when assessing set-aside in terms of habitat suitability for these groups, and their use of set-aside is likely to depend on the preferences of individual species. In contrast, set-side was less likely to provide a high quality foraging habitat for bumblebees.
Where cutting is carried out, ideally the 2 m or so next to the hedge should be left uncut or only cut once a year where necessary to prevent scrub encroachment (e.g. when blackthorn
163

is present) to allow the development of a tall herb community. This is especially relevant where a species-rich tall herb or relict woodland flora is present adjacent to the hedgerow or wood edge. Leaving an uncut strip next to the hedge would also benefit those animals that require a complex vegetation architecture, such as spiders (Baines et al., 1998) and harvest mice (Bence et al., 2003).
Key attributes As for birds.
2.1.4.3 Resource protection Benefits are likely to be similar to those arising from set-aside. Chalmers et al. (2001) found that nitrate leaching risks for each year of non-rotational set-aside management were lower than from continuous cereal cropping, however ploughing out of both 3-year and 5-year covers increased soil N supply and potential over-winter nitrate leaching losses, compared with continuous arable cropping. Incidental losses may occur following the spreading of manure, however this issue is of less importance to resource protection when it is not spread in the proximity of a watercourse. Vegetation cover is the key determinant of erosion risk, leading to loss of sediments and bound phosphates and pesticide residues. Evans (1990) suggested that a vegetation cover of 25 to 30% was generally enough to protect the soil from erosion. Phosphate loss from set-aside land is likely to be lower than from cereal cropped land, especially where winter cereals are sown after early October and crop cover is low (Chambers et al., 2000).
There is the potential for some enhanced benefit through regular cutting and removal of vegetation (although this must be carefully managed to counteract the increase in frequency of traffic compared to set-aside). These areas could have additional benefit in reducing nitrate losses if they coincide with overland flow zones or footslope seepage zones (Blackwell et al., 1999), as these areas are effectively ‘in-field buffers’ rather than riparian buffers.
Key attributes Interview: As for birds.
Measurement: Location with respect to slope and any watercourses; vegetation type and cover and evidence of compaction.
2.1.5 Short term (<1 year) fallow
2.1.5.1 Farmland birds Land may be left uncropped for various reasons, for example if unfavourable weather prevented drilling or to allow clean-up of noxious weed infestations. Such land will be similar to former rotational set-aside. Rotational set-aside was used as a foraging and nesting habitat by birds. Defra project BD164015 reported densities of declining Farmland Bird Index (FBI) species ten times higher on set-aside than on winter cereals in summer, and almost 90 times higher in winter (rotational and non-rotational combined) (British Trust for Ornithology (BTO), 2008). Rotational set-aside was a particularly attractive breeding habitat for skylarks (Wilson et al., 1997; Chamberlain et al., 1999; Donald et al., 2001), and BD1640 reported an average number of 1.89 fledglings per breeding attempt on set-aside compared to 1.44 on conventional crops.
The benefits of fallow land in summer the benefits will be considerably greater, will depend on whether the vegetation is left undisturbed. It was common practice to apply herbicide 15http://randd.defra.gov.uk/Default.aspx?Menu=Menu&Module=More&Location=None&ProjectID=15950&FromSearch=Y&Publisher=1&SearchText=BD1640&SortString=ProjectCode&SortOrder=Asc&Paging=10#Description
164
(almost invariably glyphosate) to rotational set-aside to prevent seeding of annual weeds, usually in April or May. The resulting destruction of the vegetation cover exposed existing nests to greater predation risk, and curtailed further breeding attempts. Recent research has demonstrated increased skylark territory densities where spraying was delayed until June; in years when spraying was delayed until early June, set-aside supported the highest densities of breeding skylarks as well as foraging finches and buntings, and numbers of grey partridge (Henderson et al., 2009).
Key attributes Interview: frequency and time of cutting, whether herbicides, other pesticides, fertilisers, manures etc. applied and if so, type and timing/frequency. Use of area for storage of manure.
Measurement: vegetation type and cover.
2.1.5.2 Wider biodiversity Neve et al. (1996) suggested that rotational set-aside could represent an opportunity to conserve scarce arable plant species. However, Boatman et al. (2008) in a survey of 287 fields on 84 farms, found no rare arable species, though few fields were less than one year old. In a survey of 95 rotational fields, Firbank et al. (1998) reported only a single record of a nationally rare plant species (corn marigold Chrysanthemum segetum) which was present in an industrial rape crop. Thus the value of rotational set-aside for rare arable weeds is likely to be very limited unless targeted at areas where rare species are known to persist and management is tailored to the requirements of the species in question. However, in a targeted survey carried out in the south of England shortly after the present survey by Plantlife did identify some arable plant communities of high conservation value (Still, 2010).
Delaying the destruction of the green cover until the end of July would extend the period for which the habitat is suitable for non-avian fauna. It would also allow plant species to flower and set seed, thus providing an enhanced food resource for birds, small mammals and seed-eating invertebrates, at least until the land is ploughed and for longer if reduced cultivations are used (though ploughing is more likely to be used, in order to provide some measure of cultural control and reduce the weed burden in the following crop). The opportunity to set seed would be particularly advantageous where rare arable flora are present.
Key attributes As for birds
2.1.5.3 Resource protection This measure is likely to be similar to rotational set-aside in terms of impacts on resource protection. The level of nitrate leaching is likely to be lower than that from an arable crop, but Newell Price et al. (2008) estimated that net nitrate leaching losses would be higher during and in the first year following the ploughing of one-year rotational set-aside, compared with winter cereals. The level of protection from erosion will be dependent on the vegetation cover (see section 2.1.4.3).
Key attributes As for birds
2.1.6 Game crops/wild bird seed mixes
2.1.6.1 Farmland birds Wild bird seed mixtures can provide important sources of food for granivorous birds in winter, provided the right types of crop are sown (e.g. Boatman & Stoate, 2002; Henderson
165

et al., 2004; Stoate et al., 2003; 2004). However, many game crops are based on maize, which can form a dense canopy and provides little in the way of food resources for farmland wildlife (Stoate et al., 2004; Pywell et al., 2005).
Perkins et al. (2008) assessed the use of wild bird seed mixes supported by agri-environment schemes (termed ‘unharvested crops’) in Scotland in winter, compared to other seed-rich habitats. Unharvested crops and cereal stubbles (equivalent to rotational set-aside) were the most heavily used habitats. Nine species selected the unharvested crops in at least one winter, including reed bunting, tree sparrow and finches, whilst stubbles were selected by five species, including yellowhammer, skylark and grey partridge. Far fewer birds were recorded on non-rotational set-aside. The authors noted however that some ‘unharvested crops’ failed to establish and produced few seeds. Also, Parish & Sotherton (2004a) found 50% more species and far higher numbers of birds using game crops in winter in eastern Scotland than in set-aside and stubble.
Seed densities in well-established wild bird seed mixtures are likely to be much higher than in naturally regenerated set-aside following conventional crops. BD1640 estimated that 0.13 ha of wild bird seed mixture was equivalent to 1ha of naturally regenerated set-aside, based on densities of seed-eating birds in the two habitats (British Trust for Ornithology, 2008).
These crops can also provide food for birds in summer. Parish & Sotherton (2004b) found up to 80 times as many birds during the breeding season in game crops as in conventional crops in eastern Scotland.
Key attributes Interview:.Date of sowing, seed mix, fertiliser, herbicide, other pesticide application, rate and timing, intended date of destruction (if known)
Measurement:. Cover of each constituent, weeds and bare ground
2.1.6.2 Wider biodiversity In a comparison of a range of options, including stubble, spring fallow, undersown cereals, grass leys, wildlife seed mixtures, conservation headlands ±fertiliser, sown and naturally regenerated grass margins and uncropped cultivated margins, wildlife seed mixtures had the highest botanical diversity (Critchley et al., 2004). There was a higher diversity of annuals and broadleaved plants, which suggests a greater potential for the conservation of rare arable plants where these occur.
In addition to birds, seeds also provide food for small mammals (e.g. Tew et al., 2000) and invertebrates (e.g. Tooley & Brust, 2002). Pywell et al. (2007) found that activity of wood mice was greater in wild bird seed mix than the adjacent crop during winter.
Parish & Sotherton (2004b) found that butterflies and bumblebees were 15 and 40 times more abundant respectively in game crops (often similar to wild bird seed mixes) in Scotland than in conventional crops. Wildlife seed mixtures provided better foraging habitat for bumblebees than cereal field margins, conservation headlands, or naturally regenerated margins (Pywell et al., 2005). Pywell et al. (2007) found that there was a greater abundance and species richness of broad-leaved flowering plants, butterflies and bumblebees, and greater abundance and family richness of invertebrates in wild bird seed mixtures than cereal crops.
If fertilisers and seed treatments are used, this is likely to improve establishment of the seed crops, thus offering greater competition to wild plants, so the benefits for arable flora may be less than where these inputs are not used. Obviously any application of herbicides will be detrimental to the wild flora.
Key attributes Interview: as for birds
166

Measurement:.as for birds
2.1.6.3 Resource protection Retention of a vegetation cover over the winter will assist in reducing nitrate leaching and erosion (with loss of associated pollutants). It is likely that the wild bird seed mixture will provide a more substantial cover of vegetation than an autumn-sown crop, or stubble plus weed growth. This option could therefore have some benefit to resource protection, although there has been no research in order to quantify any benefits.
Key attributes As for birds
2.1.7 Crop types and rotation (inc spring cropping, fodder crops etc.), cultivation practices
2.1.7.1 Farmland birds Newton (2004) highlighted the change from spring-sown to autumn-sown cereal varieties, and the associated earlier ploughing of stubbles and earlier crop growth as one of four key changes in agriculture that have driven farmland bird declines (the others being weed control, land drainage and associated intensification of grassland, and increased stocking rates). The decrease in spring sowing and increase inh autumns sowing has led to the majority of cereal stubbles being ploughed soon after harvest, thus removing a major potential source of food in the form of spilled grain and weed seeds for seed-eating birds over winter. This reduction in the presence of winter-stubble is highly significant, as areas of winter-stubble positively influence national trends in breeding and population recovery of key farmland bird species such as skylark and yellowhammer (Gillings et al.,, 2005). Some species also feed on the spring-sown grain itself, which was an important food source at a time of year when other foods were scarce (e.g. corn bunting; Brickle & Harper, 2000).
Winter cropping has resulted in the loss of breeding habitat for ground-nesting birds such as lapwing (Sheldon et al., 2004) and skylark (Morris et al., 2003) which prefer the more open structure of spring-sown crops. Spring-sown cereal crops are also managed with less chemical input, and the use of herbicides is further curtailed where the crop is undersown, as this restricts the choice of selective herbicides to less broad-spectrum products. Undersowing enhances invertebrate species important in the diet of partridges (Potts, 1986) and buntings (Buckingham et al., 2010)
Other changes in cropping practices have also had detrimental effects on biodiversity. For example, the decline in cultivation of fodder crops such as turnips and other root crops (important because of weed growth; Hancock & Wilson (2003), and more recently, the increase in the growth of forage maize at the expense of barley in southern and western England, has not been beneficial to bird populations. Changes in cropping practices may not always have a negative impact upon all species however. For example, woodpigeons (Columba palumbus) declined as clover was no longer sown on winter stubble during the 1960s, but increased in numbers when an alternative winter food source became available: the young leaves of autumn sown oil-seed rape (Inglis et al., 1990).
Studies in North America have shown higher productivity by nesting passerines and higher densities of birds in minimally tilled land compared to conventionally cultivated crop land (Cunningham et al. (2004a). Few studies have been carried out in Europe, but Cunningham et al. (2005) found that, gamebirds, skylarks and granivorous passerines all occupied a greater proportion of fields established by non-inversion tillage than ploughing in the late winter period, though there were no differences early in the winter.
Key attributes
167
Interview: types and amounts of different crops grown, use of ploughing and/or minimum cultivations, whether undersown (spring cereals), use of insecticides, whether standard or reduced herbicide regime used, application of organic manures.
Measurement:.crop density, presence and cover of broad-leaved weeds
2.1.7.2 Wider biodiversity Cropping types also affect other biodiversity. A change to winter cereals from spring cereals leads to a reduction in weed density and species diversity, and in the UK, a change to autumn cultivation may have contributed to the decline of spring-germinating species such as cornflower (Centaurea cyanus), corn marigold and red hemp-nettle (Galeopsis angustifolia). Key differences in associated flora and fauna occur between winter-sown crops (cereals and oilseed rape) and spring-sown crops (potatoes, sugar, beet and maize); for example spring root crops have lower abundance of beetles and spiders (Holland et al., 2002; Holland, 2004a).
A loss of crop diversity is often cited as one of the key factors in the decline of the brown hare (Lepus europeaus) (Tapper & Barnes, 1986; Smith et al., 2005), although hares are still relatively common on arable farms (Vaughan et al., 2003)
The type of tillage employed can have significant effects on the soil biota (Holland, 2004b). Minimal tillage results in higher earthwork populations compared to ploughing, and rotary cultivation is particularly damaging. Responses of soil arthropods reported in the literature to the type of cultivation carried out are inconsistent and variable between species (Holland, 2004b), but tillage, particularly ploughing, can cause high mortality in populations of soil dwelling Diptera (two-winged flies) larvae (Frouz, 1999), and ploughing also has a strong negative impact on spiders (Marc et al., 1999; Holland & Reynolds, 2003), with autumn cultivation being damaging (Thomas & Jepson, 1997). Symphyta (sawfly) abundance has declined rapidly due to increase in autumn cultivation, which destroys over-wintering larvae (Aebischer, 1990).
The application of manure or slurry to fields to improve pasture is beneficial to earthworm abundance (Wilson et al., 1999).
Holland (2004b) concluded that the overall effects of soil management on soil arthropods were a result of a combination of factors including crop type, timing of cultivations and subsequent seedbed preparations, type and quantity of organic manures applied, disposal of crop residues and pesticide use.
Key attributes As for birds
2.1.7.3 Resource protection Crops that leave soil bare or with little ground cover will increase the potential for soil erosion; this is of particular relevance to winter-planted crops and Chambers & Garwood (2000) reported that in erosion-susceptible arable catchments in England and Wales, 80% of the erosion events were on land cropped to winter cereals. Fodder maize suffers from a poor yearly ground cover, as do hops; the latter having the additional stress of being trafficked in winter (Anon, 2002). Similarly, the late harvesting of maize, sugar beet and potatoes can contribute to soil erosion by disturbing the soil, and removing crop cover prior to the wetter period of the year.
The use of cover crops can lessen erosion by reducing runoff. The use of ryecorn and Italian ryegrass can reduce runoff by 12% and 61% respectively (Anon, 2001a). In the same study, white clover reduced runoff by over 80%, but maize yields were reduced by 40%. On light soils, a 15% crop cover may be sufficient to protect against erosion, and where this erosion
168

does occur it is largely contained within wheelings or tramlines (Chambers & Garwood, 2000).
Minimal tillage can improve soil structure and stability. This helps to reduce the risk of runoff and consequent pollution of watercourses by sediment, nutrients and pesticides (Holland, 2004b). Increased populations of soil organisms can also enhance nutrient cycling processes.
Key attributes Interview: types and amounts of different crops grown; use of ploughing and/or minimum cultivations; whether standard or reduced herbicide regime used; whether cover crops grown; application of organic manures.
Measurement:.crop density presence and cover of broad-leaved weeds in crop; evidence of soil compaction, flooding, erosion.
2.1.8 Stubbles and stubble management
2.1.8.1 Farmland birds A large number of studies have shown that stubbles are generally selected in preference to other farmland habitats by birds in winter (e.g. Wilson et al., 1996; Moorcroft et al., 2002; Gillings et al., 2005), but their usage is related to the density of seeds present (e.g. Moorcroft et al., 2002; Vickery et al., 2005). Gillings et al. (2005) showed that local population trends for species such as skylarks and yellowhammers were positively related to the amount of stubble recorded in Breeding Bird Survey sample squares.
Defra project BD161016 investigated the effects of different crop stubbles and straw disposal methods on wintering birds and arable plants (Vickery et al., 2005). Most stubble fields were found to support no birds at all. Most of the variation in the number of granivorous species using stubbles was explained by the seed densities of Chenopodiaceae and Polygonaceae, and the number of chemicals used on the previous crop. Recent work by McKenzie et al. (2010) confirms that reduced pesticide inputs were the major factor influencing stubble use by birds in a comparison of organic and conventional farms. The use of a post-harvest herbicide, is highly detrimental (Vickery et al., 2005).
Siriwardena et al. (2008) showed that for some species, including yellowhammer, reed bunting and chaffinch, peak use of supplementary food supplies occurred in late February and March, and suggested that current agri-environment prescriptions do not provide sufficient food at this time of year. Return of the stubble to cropping in mid February, as permitted under ELS and the CFE, will therefore reduce its value as foraging habitat compared to former set-aside where the cover was retained throughout the spring.
Stubble height appears to be an important attribute influencing foraging activity by birds. Whittingham et al. (2006) studied the use of stubbles by different birds after cutting or scarification to achieve different stubble heights. Granivorous passerines and invertebrate feeders preferred plots with shorter stubble, while the abundance of skylarks, partridges, pigeons and meadow pipits was higher on plots with taller stubble. The authors considered that these differences were probably the result of differing anti-predation strategies.
Key attributes
16http://randd.defra.gov.uk/Default.aspx?Menu=Menu&Module=More&Location=None&ProjectID=8410&FromSearch=Y&Publisher=1&SearchText=BD1610&SortString=ProjectCode&SortOrder=Asc&Paging=10#Description
169
Interview: Types of stubble left, whether pre-harvest desiccants (as distinct from normal selective herbicide application to crop) and/or post harvest herbicides are used, if so what types and proportion of fields treated. Intended ploughing dates.
Measurement:.Cover of crop volunteers, grass and broadleaved weeds, height of stubble
2.1.8.2 Wider biodiversity Where stubbles are not treated with pre-harvest or post-harvest herbicides (often used to control volunteers and/or pernicious grass weeds), arable plants that survive harvest will continue to flower and set seed into the autumn and winter.
Small mammals and granivorous invertebrates may benefit from stubbles, depending on the density of seed resources available. Disturbance of the soil is likely to be detrimental to most invertebrates (Holland, 2004b), so the longer the stubble remains uncultivated the greater the benefits are likely to be.
Key attributes Interview: as for birds
Measurement: Cover of crop volunteers, grass and broadleaved weeds
2.1.8.3 Resource protection Leaving stubbles over winter to be cultivated in spring reduces the risk of soil erosion. Nitrate leaching from stubbles will be affected by the vegetation cover (see section 2.1.4.3). Where compaction occurs, e.g. in tramlines, this may encourage runoff and losss of sediment and phosphorus if not removed by tine cultivation or subsoiling (Deasy et al., 2010).
Key attributes Interview: Whether pre-harvest desiccants (as distinct from normal selective herbicide application to crop) and/or post harvest herbicides are used, if so what types and proportion of fields treated. Measures taken to remove soil compaction (if any)
Measurement: Vegetation cover
2.1.9 Grassland
Although the project is mainly concerned with arable management, grassland can be an important component of many arable farms as well as mixed farms. It may be present as leys within an arable rotation (a key element of organic farming), or as permanent pasture on land not suited to arable cropping because of soil type, hydrology or location. It may be utilised by a commercial livestock enterprise or consist of extensively managed paddocks grazed by horses or other ‘hobby’ livestock. Either way it can make an important contribution to the habitat diversity on the farm. Only lowland grassland is considered here.
2.1.9.1 Farmland birds The effects of intensive grassland management upon bird populations in pastoral systems have not been as well studied as arable systems, and the impacts upon bird species are not as clearly identifiable. However, it is likely that intense grazing, fertilisation and re-seeding has had a detrimental impact upon birds’ food supply (both plants and insects) (Henderson et al., 2004; Vickery et al., 2001). A study of lowland grasslands indicated that such intensification may only affect specific insectivorous birds during the summer (for example buntings, skylark, whinchat and red-backed Shrike) and intensification may in fact be beneficial to several species in winter (such as carrion crow and jackdaw) because soil invertebrates are increased (Atkinson et al., 2005). Vickery et al. (2001) considered that there is a need for more research to fully understand how grassland management affects
170

bird population dynamics. In particular they considered that there was a need to explore the links between fertilizer inputs, predation rates, anti-helminithic treatments for livestock and bird habitat suitability in grasslands. Further research since their review has addressed some of these issues (see below).
Longer vegetation in grassland systems enhances food supplies of several farmland bird species (e.g. Tipulid larvae, McCracken et al., 1995), and are favoured by bird species that feed on sward-dwelling invertebrates or seeds, but shorter areas provide better access to birds that feed on soil-dwelling invertebrates (Buckingham & Peach, 2005; Buckingham et al., 2006). Buckingham & Peach (2005) considered that meeting the requirements of granivorous species presents the greatest challenge, while the needs species that feed on soil dwelling invertebrates are more easily met. Weed control and excessive defoliation associated with intensive grazing or mowing regimes are detrimental to granivorous species (Buckingham et al., 2006).
Mosaics of short and long vegetation may provide the optimum conditions for some species, such as lapwing, starling and barn owl (Whittingham & Evans (2004). Similar conclusions were reached in a modelling study of coastal grazing marshes, indicating that the heterogeneity of grass sward height was more important in determining species presence than mean sward height. Complexity of the grass sward and surface topography favoured the presence of ground nesting birds (Milsom et al.. 2000).
Buckingham et al. (2010) review recent work on the development of new conservation measures for birds on livestock farms. These include the extensification of cattle grazing systems to improve sward heterogeneity and the quality of grasslands as summer foraging habitat, management to improve the provision and availability of winter seed food through allowing silage swards to set seed, and adjustment of silage cutting regimes to improve their potential as nesting habitat. The potential for cereal–based whole-crop silage as a foraging habitat was also studied.
Establishment of grassland by undersowing can enhance the abundance of key invertebrate prey in undersown cereals, and benefit declining species such as grey partridge, yellowhammer, cirl bunting and corn bunting (Buckingham et al., 2010).
Detailed information on the management of grassland for different objectives is given by Crofts & Jefferson (1999), though further research as indicated above has been carried out since this handbook was published.
Key attributes Interview: Fertiliser application rates; grazing management (type of livestock, stocking rates, timing); cutting management (hay/silage, timing of cuts); time since re-sowing (if known); frequency and method of re-sowing (if applicable).
Measurement:. Average sward height and variability (grazed fields only); whether sward is improved, semi-improved or unimproved
2.1.9.2 Wider biodiversity Increased fertiliser use, often in conjunction with reseeding of grassland to ryegrass (Lolium perenne), which is more responsive than other species to fertiliser, has resulted in major losses of botanical diversity in the majority of lowland grasslands in the UK (Stevens et al., 2004). Slower growing plant species are suppressed by competition from high yielding species which are able to respond to added fertiliser (Mountford et al., 1993; Kirkham et al., 1996).
Grassland intensification is also detrimental to butterfly populations. Ploughing and re-seeding old pastures with rye-grass Lolium swards eliminates all known larval food plants of British butterflies (Woiwod & Stewart, 1990), and pasture improvement coupled with high
171

stocking levels destroys the structural and botanical diversity of swards which is needed to support a high diversity of butterfly species (Thomas, 1984).
Vegetation structure is a key factor influencing arthropod diversity (Morris, 2000). Sheep grazing produces shorter, more uniform swards than cattle grazing. Botanical diversity is greatest at intermediate grazing pressures and is reduced at very high or low pressures (Grime, 1979). Invertebrates vary in response to grazing, but in general high grazing pressure is detrimental because it reduces the structural complexity of the sward as well as the botanical diversity. Seasonal grazing encourages sward diversity, and hence insect diversity, compared to continuous grazing, and autumn grazing is generally less deleterious than spring grazing (Vickery et al., 2001). However, generalisations can be misleading; for example, ideal conditions for crane fly (Tipula spp.) oviposition and larval development are created by low grazing pressure in late summer and autumn, followed by heavy grazing in late winter and spring (Bignal & McCracken, 1993).
Management by cutting produces swards that are generally uniform in structure and species composition. This generally reduces the abundance and diversity of invertebrates in comparison with hay or grazing management, though different groups vary in their response (Morris, 2000). Timing of cutting also affects invertebrate communities, with summer cutting usually being more detrimental than late spring or autumn (Duffey et al., 1974; Baines et al., 1998; Morris, 2000). However, the reverse applies for botanical diversity: bringing forward traditional cutting dates from July/August to May on species-rich hay meadows can reduce botanical diversity (Kirkham & Tallowin, 1995), and cutting in September has also been found to be detrimental (Kirkham & Tallowin, 1995; Smith et al., 1996).
Spiders are particularly responsive to habitat structure. Large-scale surveys of spiders in different sites have indicated differences in relative abundance related to vegetation height and the intensity of grazing management (Rushton et al., 1989). Web-building spiders in particular are more abundant in taller and more structurally complex grassland. Thus grazing and silage cutting can seriously reduce spider abundance, and intensive grazing can lead to virtual extinction (Thomas & Jepsen, 1997).
Key attributes Interview: As for birds Measurement: As for birds
2.1.9.3 Resource protection Grassland is much less susceptible to erosion than arable land. Erosion rates from grassland were < 0.1 t/ha/yr (Fullen et al., 2006) which compares to levels from British arable fields of 1 – 2 t/ha/yr (Fullen & Booth, 2006) or 4 t/ha/yr (Chambers & Garwood, 2000). However, erosion can still occur where land is overstocked, or livestock congregate in certain areas. The influence of livestock type on soil erosion may less important than the stocking density, which in turn may be less important that soil condition; if the soil is wet, it is highly susceptible to erosion. Sediment losses from extensively grazed pasture have been shown to be lower than from compacted grassed areas (van Dijk & Kwaad, 1998) and runoff can be halved when overgrazed areas are subsequently only lightly grazed (Heathwaite et al., 1990). Bartley et al. (2010) reported a reduction in sediment load of ca. 70% when grazing regimes were improved, but, they noted that losses were not reduced where rills were present. The reduction in grazing intensity will also reduce the potential for nitrate leaching (Cuttle et al., 1998).
Moving feeding troughs can minimise localised erosion due to congregation at feeding stations. Livestock can also cause severe erosion where they have access to watercourses. Excluding livestock from riparian areas can reduce runoff, total N and improve soil condition (Miller et al., 2010), and riparian fencing can reduce sediment deposition (Collins et al., 2010).
172

Compaction of soil by livestock degrades the soil structure which then impacts on many processes. For example, Douglas et al. (1998) highlighted the complex interactions of soil condition and yield; grassland yields under typical levels of compaction were reduced by around 15% compared to zero compaction, but, in addition, losses from the system of applied fertiliser nitrogen were greater from the compacted soil – this was attributed to losses in runoff and denitrification in the more anaerobic, compacted soil.
Key attributes Interview: Fertiliser application rates; grazing management (type of livestock, stocking rates, timing); supplementary feeding (methods, timing, whether feeding points regularly relocated).
Measurement: Evidence of poaching and/or runoff associated with feeding and watering stations, access to watercourses
2.2 MINOR HABITAT CATEGORIES
2.2.1 Other boundaries (stone walls, banks)
Stone walls have archaeological and historic importance as well as being key landscape features, especially in the uplands. They also vary from region to region in aspects of their construction, thus adding to the local character of an area. They may provide shelter for small mammals, reptiles, amphibians and invertebrates and nesting sites for birds, and a growth substrate for lichens and mosses, but they do not have a high significance as habitats for biodiversity. They may help to reduce erosion in the same way as other boundaries, but are unlikely to occur in situations where there is a high erosion risk in the arable lowlands, where they are generally found in elevated areas with well drained soils such as the Cotswolds and Lincolnshire Wolds.
Key attributes Interview: Whether walls maintained, nature of maintenance work, how regularly carried out
Measurement: Proportion of gaps, proportion subject to bulging, slumping or bellying, proportion with topstones missing
2.2.2 In-field trees
In-field trees historic, cultural and landscape significance, especially if old, and also provide habitat for many invertebrates and birds. Dead trees can provide valuable habitats for including hole nesting bird species such as tree sparrow and those that feed on wood boring insects such as woodpeckers. Ancient or veteran trees are of particular importance for the conservation of saproxylic invertebrates (species dependent on dead wood). The conservation management of this, the most threatened group of invertebrates in Europe, was recently reviewed by Davies et al. (2006). They concluded that “The principal reason for the decline in the saproxylic invertebrate fauna is the removal and reduction in quality of dead and decaying wood within the landscape”, and recommended that management priorities should be to improve the diversity, quantity and continuity of dead and decaying wood on sites where these invertebrates occurred. The rarest saproxylic species are found in historic parklands and open pasture-woodland, but species of conservation importance could occur in trees in arable fields, especially where these were created by ploughing our old parkland.
Cultivation damages the roots of trees and their conservation is promoted by avoiding agricultural operations beneath the canopy and within 5m of its outer edge (Natural England, 1999).
173

Key attributes Interview:,.Cultivation, use of herbicides, other pesticides, fertilisers, manures or lime beneath canopy; removal of fallen timber from beneath canopy; removal of dead or dying branches from tree.
Measurement:.Distance from trunk to edge of canopy and edge of cultivation; evidence of removal of dead or dying branches from tree
2.2.3 Woodland type, Woodland edges and fences
Woodland management is a peripheral issue for this project, which is concerned with farmland management. However, farm woodlands provide environmental benefits on many farms, and there are options for woodland edge management and fencing under ELS and for creation, maintenance and restoration of small areas of woodland for environmental reasons where silviculture is not an objective. These are targeted at predominantly native, and particularly ancient, woodlands. The Forestry Commission’s Woodland Grant Scheme is the main source of grant aid for woodlands grown for timber production.
Significant losses of ancient woodland occurred during the 20th century, both through direct destruction and conversion to conifer plantations. Between around 1930 and around 1990, some 45% of ancient woodland was lost or severely damaged through these causes (Spencer & Kirby, 1992). Since 1985 changes in Government policies have led to better protection for ancient woodland and more planting of broadleaved woodland (Hopkins & Kirby, 2007). In spite of this however, many woodland species have continued to decline, as a result of changes in management leading to changes in structure and composition of woodland, and also due to other impacts such as pollution, climate change, no-native species, grazing and game management (Hopkins & Kirby, 2007). Abandonment of coppice management has affected several butterfly species (Asher et al., 2001), and species richness of the ground flora has declined as cover of woody species has increased (Hopkins & Kirby, 2007).
Grazing of woodland reduces the abundance of palatable species in the ground layer and shrub layer. Increased grazing by deer is an issue of increasing concern, and is thought to have contributed to the decline of several woodland bird species (Gill & Fuller, 2007).
Key attributes Detailed assessments of woodland management and condition are outwith the scope of this project. Woodland management will be recorded at interview, and basic records of woodland type and edge management made from adjacent farmland where possible. Interview:, Details of woodland planting and management (e.g. felling, coppicing, planting within established woodland, clearing of rides, grazing, fencing, management of woodland edges).
Measurement: Recording of woodland type (ancient, broadleaved plantation, mixed plantation, conifer plantation), fencing to exclude stock (where applicable), woodland edge (presence/absence of buffer with development of scrub and herbaceous vegetation).
2.2.4 Scrub
Scrub is a relatively rare habitat on farmland, and often considered to be detrimental, for example where it invades species-rich grassland or archaeological sites. However, it is important for several bird species characteristic of farmland, including whitethroats, linnets and yellowhammers, whilst it is strongly selected as a nesting habitat by turtle doves (Fuller et al., 2004). It is also valuable for some invertebrates, such as the brown and black hairstreaks, which are dependent on blackthorn in hedges, woodland and scrub that is
174

unmanaged or cut on rotation (Asher et al., 2001). Further information on the wildlife value of scrub can be found in Day et al. (2003).
The ideal management of scrub depends on its situation; where it is damaging archaeological or biodiversity interest, clearance may be the objective, but in many situations cutting of patches to maintain a mosaic of scrub and grassland may be more appropriate. Detailed information on the appropriate management in specific circumstances is provided by Day et al. (2003).
Key attributes Interview:, management approach to scrub (if present); management objectives.
Measurement: predominant species, extent, height, variation in height.
2.2.5 Perennial biomass energy crops (Short Rotation Coppice/Miscanthus)
Short rotation willow or (less commonly) poplar coppice (SRC) can increase avian diversity compared to arable crops, but is generally more suitable as a habitat for woodland, woodland edge or generalist bird species, though it is used by some farmland specialists when recently cut, e.g. skylark, lapwing (Sage et al., 2006). In addition, starlings and yellowhammers were found to be equally abundant in standing or cut SRC or arable land, and reed buntings occurred frequently (Sage et al., 2006). Little is known about how these species use SRC, but it is probable that plantations of SRC may provide some benefits for species that also used set-aside, though there are insufficient data to quantify this effect. However, species such as yellow wagtail, grey partridge and stone curlew are likely to be negatively affected (Cunningham et al., 2004; Sage et al., 2006).
In comparisons between SRC and arable crops, SRC contained more species of plants than the arable crops (Cunningham et al., 2004). Annuals dominated in recently established SRC, but perennials became more dominant with time, as also observed in non-rotational set-aside (Boatman et al., 2009).
Butterflies were restricted to headlands in both SRC and arable fields. SRC headlands contained more butterflies than arable headlands, and more than the SRC crop itself (Cunningham et al., 2004b, 2006; Haughton et al., 2009).
There has been little study of mammal use of SRC (Rowe et al., 2009). Coates & Say (1999) carried out some small mammal trapping at a number of SRC sites. Results suggest that SRC provides a more attractive habitat for small mammals than arable land, with older coppice being the most attractive. This in turn could make SRC an attractive foraging habitat for raptors, such as the kestrel.
There have been fewer studies of the impact of Miscanthus on biodiversity. However, Bellamy et al. (2009) reported that Miscanthus crops contained greater numbers and diversity of bird species than wheat crops. Insects were more abundant in Miscanthus, but this was a result of the higher populations of non-crop plants; the crop itself supported fewer insects than wheat. They considered that as experience of growing the crop increases, growing to maximise yield will reduce the abundance of non-crop species and its attractiveness for birds, unless management for wildlife is incorporated into the regime.
There has been relatively little work on the resource protection implications of biomass crops. However, the limited evidence available suggests that energy crops are beneficial to resource protection, compared to arable farming.
Most work has been done on nitrogen leaching. Aronsson et al. (2000) reported nitrogen losses to ground water of around 1.6kg/ha, considerably lower than average amounts leached from conventional arable crops (Rowe et al., 2009). Goodlass et al. (2007) concluded that in a normal life span of short rotation coppice (SRC) (15-30 years), the large nitrate losses on establishment and during ‘harvest’ would be offset by the small losses
175

during production compared to arable rotation. However, the Best Practice Guidelines: Planting and Growing Short Rotation Coppice state that harvest is commonly every 3 years. Goodlass et al. (2007) demonstrated larger peak losses of nitrate during establishment and harvesting of SRC compared to conventional arable cropping. However, Aronsson et al. (2000) reported that harvesting of SRC did not appear to affect groundwater nitrogen concentrations.
Soil disturbance during harvesting is a major threat to resource protection from producing perennial energy crops. Watts et al., (2005) reported that laden trailers during harvesting of SRC could cause significant soil damage, but they suggest that it may be possible to mitigate such damage by considering the lay out of the coppice.
Energy crops have a low demand for phosphorus, thus they do not require the same fertiliser inputs as conventional arable crops. However, this means that if organic manures are disposed of on energy crops, unless the manure is low in phosphorus, P can accumulate in the soil.
Willow short rotation coppice has a high water demand and it is estimated that the establishment of 100,000 ha of energy crops would result in a reduction of available water equivalent to 12% of annual freshwater abstractions (Anon, 2001b).
Energy crops could enhance soil organic matter by building up reserves of soil carbon (Smith et al., 2000) and they generally require much lower pesticide inputs than conventional arable crops or grassland.
From the evidence available, there is the danger that perennial energy crops could have negative impacts on resource protection where the land is at risk of erosion (as affected by soil type and/or slope) due to the potential for bare areas of land in winter when the crop is leafless. However, the review by Rowe et al. (2009) concludes that erosion risks are likely to be lower under SRC than for other crops.
Key attributes Interview:,. Timing and frequency of herbicide and insecticide use; type, timing and frequency of fertiliser and organic manure application; cutting frequency and whether blocks cut in rotation (SRC), size of blocks, width of margins and rides (if present).
Measurement:.confirm width of margins and rides in sample; vegetation type and ground cover in margins and rides; evidence of soil compaction.
2.2.6 Arable reverted to grassland used for livestock
This applies to arable land converted to grassland as a conservation measure, not simply arable sown with a conventional simple mixture of high yielding grass varieties to establish a ley or permanent pasture. It is not likely to be commonly encountered, and only where undertaken as part of an agri-environment agreement.
Re-creation of species-rich grasslands from arable land has been encouraged through agri-environment schemes to offset the loss of such grasslands in the past. A range of techniques are available for establishing swards. Experience has generally shown that sowing is usually necessary to achieve the desired result. Manchester et al. (1999) experimented with the use of hay bales compared to three seed mixtures and natural regeneration for the conversion of arable land to lowland wet grassland. The most successful results were achieved from the most complex seed mix, followed by the intermediate seed mix, hay bales, the basic seed mix and natural regeneration, in that order.
Success is usually greatest on soils with a low fertility, and measures to reduce soil fertility often improve the outcome. For example, Hopkins et al. (1999) investigated strip-seeding; or over-sowing after sward disturbance by light harrowing, partial rotary cultivation or turf removal, on six farm sites in England and Wales. The most successful treatment in terms of
176

increasing botanical diversity was turf removal; the least successful was light harrowing before sowing; and the others were intermediate. Successful establishment of introduced species was greatest on sites having a low soil nutrient status.
Pywell et al. (2002) experimented with shallow and deep cultivation in conjunction with species-poor and species-rich seed mixtures, with and without a nurse crop, in comparison with natural regeneration. Deep cultivation followed by sowing a species-rich seed mixture produced the most desirable species. The use of a nurse crop of Italian ryegrass (Lolium multiflorum) did not produce any long-term benefits.
Development into swards approaching semi-natural grassland in species composition and quality attributes can be a slow process. Kirkham et al. (2006) found that even after 12 years, grassland created from arable land had significantly lower plant species richness, forb cover and number of ‘high value’ species than semi-natural grassland comparisons. Davies et al. (2006) investigated management factors affecting the creation of species-rich grassland. The target was a sward approximating to MG5 grassland, achieved in most treatments by 2004, 11 years after sowing. Early cutting followed by aftermath grazing were initially most effective, provided cuttings were removed, but continuous sheep grazing produced the most diverse sward by 2004.
Wakeham-Dawson et al. (1998) found that skylarks were more abundant in summer on ex-arable land sown with a mixture of chalk grassland species on the Sussex Downs than where a mixture of agricultural grasses was used.
Conversion of arable to grassland will be beneficial in terms of resource protection. Grassland provides a year-round cover of vegetation, it allows organic matter to accumulate and it enhances infiltration reducing the potential for flooding. For example, Bucur et al. (2007) estimated from measured data over an 8-year period, that soil losses from maize were 2.57 t/ha compared to only 0.14 t/ha in perennial grass whereas Romkens et al., (1999) reported that the organic carbon content of an old maize field in the Netherlands increased from 1.6% to 1.8% after conversion to pasture in just 4 years. See also section 2.1.9.3.
Key attributes Interview:,.Year of creation; method of creation; seed mix; grazing management (type of livestock, stocking rates, timing); cutting management (hay/silage, timing of cuts);. fertiliser application rates (if used).
Measurement:. Average sward height and variability; whether sward is classified as ‘improved’, ‘semi-improved’ or ‘unimproved’
2.2.7 Beetle banks & in-field grass strips
Beetle banks are ridges created across the centres of arable fields and sown with tussock forming grasses, to provide additional overwintering sites for beneficial predatory arthropods; and reduce the distances these arthropods must disperse to when colonising fields in the spring (Thomas et al., 1991). Colllins et al. (2003a) found that predator densities over five years in a beetle bank were similar to or greater than those in conventional hedgebanks, but fluctuated more in the beetle bank than in the hedgebanks.
Thomas et al. (2002) found that beetle banks had lower plant species richness and diversity than field margins, but these increased with age of the bank, and beetle banks over a decade old had approximately equal botanical diversity to field margins. Collins et al. (2003b) found that the density and community composition of polyphagous predators differed significantly between different types of grass sown in replicated plots along a beetle bank, with false oat grass Arrhenatherum elatius and cocks-foot Dactylis glomerata supporting the highest predator densities and crested dogstail Cynosurus cristatus and naturally regenerated plots having the lowest.
177

Collins et al. (2002) showed that the impact of polyphagous predators on grain aphids Sitobion avenae decreased with increasing distance away from a beetle bank
Limited research has been done on benefits for other species, but Thomas et al. (2001) found that beetle banks can provide useful resources for game birds in the form of invertebrates important in the diet of their chicks, though abundance was not as high as in field margins.
Beetle banks could play a role as ‘in-field buffers’, intercepting eroding soil on sloping fields. The vast majority of buffer research relates to riparian buffers. There has been more limited research on the role of in-field buffers although interest in this area is growing (there is published research on contour grass strips, but these are often used in situations that are not relevant to the UK).
Blackwell et al. (1999) have demonstrated the benefits of appropriately-located (in the overland flow zone) in-field buffers installed further up the catchment in reducing nitrate concentrations. In-field buffers are particularly effective when positioned in valley bottoms. Chambers & Garwood (2000) proposed that valley features alone were responsible for 30% of soil erosion occurring. Ulen et al. (2008) found that when a section of an arable field was managed as permanent fallow (cut grass, but not grazed) within the field, nitrate, dissolved P, sediment and total organic carbon concentrations in leachate from the whole field were all significantly reduced.
Key attributes Interview:, Length of time since creation of bank or grass buffer, any management (e.g. cutting) and frequency
Measurement:.location of bank or buffer in relation to contours (including whether across/down slope or in valley bottom etc); approx. height of bank (if present), cover of bare ground, tussocky grasses, fine-leaved grasses and forbs.
2.2.8 Uncropped cultivated margins
Although the impacts on birds specifically have not been studied, this measure is likely to provide good foraging opportunities for species such as turtle dove (Browne & Aebischer, 2004) and corn bunting (Wilson et al., 2007). There is good evidence that many species of birds prefer to forage in open areas. Douglas et al. (2009) showed that foraging by birds in field margins was increased when patches were cut to improve access, and Potts et al. (2007) found that the number of birds foraging in margins was generally greater when they were scarified to open up the sward, compared to an annual cut in March. Stevens & Bradbury (2006) found that uncropped strips had a positive influence on the occurrence of Reed Buntings.
Rare arable plants are largely restricted to the edges of arable fields, and species diversity is also highest at field edges (Wilson & Aebischer, 1995; Walker et al., 2007), and this is therefore where conservation action is best targeted. Uncropped, cultivated margins (UCM) were identified as a key option for the conservation of rare arable flora by Still & Byfield (2007). Walker et al. (2007) evaluated four agri-environment scheme options for the conservation of arable plants: uncropped cultivated margins, spring fallow, and conservation headlands with or without fertiliser inputs. The highest species diversity was found in the UCM, followed by spring fallow and conservation headlands without fertiliser.
Critchley et al. (2004) carried out a survey of the botanical composition of a range of agri-environment options, including overwinter stubble retained until 15 July the following year (similar to rotational set-aside, but without application of non-selective herbicide) and uncropped cultivated margins. UCMs had higher overall plant species richness than any other prescription except for wildlife seed mixtures, and a higher species richness for annuals, a higher cover of broadleaved plants and a lower cover of grasses than the stubble.
178

Critchley et al. (2006) studied the effects of cultivation timing and depth on the resulting flora. Species responded differently and the authors concluded that a range of cultivation timings and depths could provide the optimum results, depending on the species present. Intervention might be necessary to control undesirable species over time.
Hassall et al. (1992) compared uncropped cultivated margins (uncropped wildlife strips, UWS), conservation headlands (CH) and conventionally managed (fully sprayed, FSH) headlands in the Breckland ESA in terms of their impacts on spiders, carabid beetles and Heteroptera. The total abundance of each group was highest in UWS, followed by CH, and least in fully sprayed headlands. Species diversity for spiders and Heteroptera, and species richness for all three groups, was higher in UWS and CH than FSH, and the management regimes also affected the community structure. ADAS (2001) also reported increases in abundance and species richness of plant bugs and sawflies compared to conventional cropping. Six metre wide uncropped field margins have been shown to support ten times as many foraging bumblebees as cropped margins (Kells et al., 2001).
Uncropped cultivated margins will provide less protection to water courses thangrass buffers. Any reduction in fertiliser or manure usage where the margin is located away from a water course is likely to have negligible overall impact on water quality. The margin would reduce the chance of overspray where it is next to a water course, which would be beneficial, although, if the farmer was following Good Agricultural Practice, this would not be occurring in the first place (Do not spread manure within 10m of watercourse; Avoid applying fertiliser to a watercourse). Consequently, there are probably very limited benefits to be gained arising from a reduction in fertiliser/manure use. However, any such benefits are likely to be outweighed by the disbenefits arising from the lack of vegetation cover during autumn and spring which would reduce nitrate uptake and could increase nitrate leaching during the wettest times of the year. The lack of vegetation could also increase the risk of soil erosion and runoff. The disbenefits of this measure will be more marked if the edge of the field is adjacent to a watercourse, especially where slope and/or soil type increase the risk of runoff. Thus this measure is best located on free draining soils, away from watercourses.
Key attributes Interview:.Length of time strip left in place, whether permanent or rotational; type and timing of cultivations, type and timing of any control measures for noxious weeds (including type of herbicide if used)
Measurement: Cover of ‘desirable’ and ‘undesirable’ species and bare ground; location in relation to any slope or watercourse
2.2.9 Conservation/unfertilised/unharvested headlands
Conservation headlands were originally developed by the Game Conservancy (now the Game and Wildlife Conservation Trust, GWCT) to provide brood-rearing habitat for grey partridge chicks, following research that showed that chick survival was limited by the availability of chick food insects in cereal crops (their preferred foraging habitat) (Sotherton, 1991). Benefits were also demonstrated for butterflies (Dover et al., 1990) and small mammals (Tew et al., 1992). Guidelines for management have developed over the years; currently those given on the GWCT website17 are as follows:
• Some herbicides and summer insecticides are not applied on cereal crops along a six to 24 metre strip along the field margin.
• Fungicides can be applied as normal.
17 http://www.gwct.org.uk/documents/factsheet3_broodrearing_cover_wildgp08.pdf, Accessed 12/03/2011
179

• Some selective autumn herbicides and grass weed-killers can be applied to combat cleavers, black grass and other noxious weeds.
• On heavy land reduce nitrogen levels.
Approved herbicides are those that selectively control grass weeds and cleavers Galium aparine without eliminating other dicotyledonous (broadleaved) species. Formerly, there was an ELS option with management guidelines similar to those promoted by the GWCT, but this prescription has now been amended to exclude the use of fertiliser, because this was found to be more beneficial for the arable flora (Walker et al. 2007). There is also an ELS option for unharvested cereal headlands, with similar management requirements, and a HLS option for unharvested, fertiliser-free headlands. The unharvested headlands provide food for seed-eating birds during the winter, i.e. have a similar objective to wild bird seed mixtures (see section 2.1.6).
Key attributes Interview: Time of sowing; seed rate (same as crop/reduced); use of N fertiliser (yes/no, rate if used - same as crop/reduced); herbicide regime, whether intention is to harvest or leave unharvested
Measurement: Width of headland, cover of ‘desirable’ and ‘undesirable’ weeds
2.2.10 In-crop fallow plots & skylark plots
The effect of including small undrilled patches (around 4x4m) , in winter wheat on plants, invertebrates and birds, was studied in the SAFFIE project (Morris et al. (2004; 2007). Where these were implemented, skylark territory densities were higher (particularly in the crucial late-season breeding period) and the number of skylark chicks reared was nearly 50% greater than in fields without undrilled patches. Territory densities were 0.91 in conventional crops, and 1.22 where undrilled patches were implemented (Morris et al., 2007).
In the SAFFIE project, there were often marked differences in vegetation cover, structure and seed production within undrilled patches compared to the surrounding crop, but in view of the relatively tiny area covered by the undrilled patches (around 0.3% of the field as a whole), differences were insignificant at a field scale (Clarke et al., 2007). The value of this measure for plants is therefore likely to be small.
Similarly, skylark plots are likely to have limited value for invertebrates. A few invertebrate species were more abundant in undrilled patches than in the surrounding cereal crop, but at a field scale, the patches did not consistently increase invertebrate numbers, and some species avoided the patches (Smith et al., 2009). The colonisation of patches depended on weed cover within the patches, and the invertebrate assemblage structure was particularly responsive to the cover of broadleaved weeds (Smith et al., 2009).
Where skylark plots become weedy, they could provide feeding areas for wood mice, however management generally aims to avoid weed infestations occurring in the plots. Some weed presence is considered beneficial however, and Gruar et al. (2010) recommended that where patches are established by spraying out the crop, this should be done no later than December to allow some weed colonisation of the plot.
Larger fallow plots, 2ha+ in area, are used to provide nesting habitat for lapwing and stone curlew. Chamberlain et al. (2009) found that lapwings nested in around 40% of fallow plots, but that this proportion could be increased by managing to promote a short broken sward, with plenty of bare ground; and placing the plots in open landscapes away from woods and vertical features. They also found that the skylark and yellow wagtail were frequently recorded in the plots.
180

Bare or sparsely vegetated areas are at greater risk of erosion. For example, Quinton & Catt (2004) noted over a 10 year period that runoff and soil erosion on experimental plots at Woburn were concentrated in periods with sparse vegetation cover, i.e. in winter after the late planting of cereals; in spring after the planting of beets; or when soils were bare after harvest, exemplifying the role of a vegetative cover in reducing erosion. The small size of skylark plots means that they are unlikely to have a significant impact, but the larger area of in-crop fallow plots (>2ha) could lead to erosion if inappropriately located (see also section 2.2.8).
Key attributes Interview:,.timing and method of creation, density (skylark plots)
Measurement:.cover of grass weeds, broadleaved weeds and bare ground in patches, distance from field margin, distance from woods, tall hedges and pylons; distance from any watercourse.
2.2.11 Pollen/nectar mixtures and flower-rich margins
Pollen and nectar mixtures are sown specifically to provide resources for bumble bees (Pywell et al. 2006) and other pollen and nectar feeders such as butterflies (Pywell et al., 2004). The mixtures are quick to establish and have been shown to provide resources for rare long-tongued bumblebees, as well as attracting higher numbers and a greater species diversity of bumblebees than other options (Carvell et al., 2007). However, the legumes may not persist, necessitating re-sowing after around three years (Carvell et al., 2007). Also, a diverse wildflower mix may provide greater continuity of resources throughout the season (see below)
Once established, there is likely to be little impact on resource protection. However, legumes fix nitrogen and so will increase the nitrogen content of the soil over time. If ploughed out, there is likely to be a flush of nitrate which leached from the soil if wet weather follows. The requirement for regular re-establishment could exacerbate this issue. However, legumes need to be established either in the spring or in late summer, thus the critical autumn/winter period, when soils are most prone to leaching, should be avoided.
The value of this measure for birds has not been specifically investigated. However it is likely to be insect-rich and provide good foraging habitat in summer provided the vegetation is not too dense.
Sowing a wildflower mix has been found to increase botanical diversity in comparison with a naturally regenerated sward (Smith et al., 1993) or a grass-only mixture (Potts et al., 2007). Smith et al. (1993) found that field margins sown with wild flowers support greater numbers of invertebrates than naturally regenerated swards. Feber et al. (1996) reported that sowing with a grass and wildflower mixture increased butterfly abundance compared to natural regeneration of field margin vegetation. Potts et al. (2007) concluded that a grass-only mix provides a good resource for invertebrates that are dependent on sward architectural complexity, but is poor for phytophagous species. A tussocky grass mixture including forbs was superior to a fine-leaved grass mixture with forbs. Inclusion of forbs in the seed mixture also resulted in a large increase in abundance and diversity of bumblebees and butterflies.
Pywell et al. (2006) noted that margins sown with mixtures of grasses and wildflowers provided the widest range of forage plants for bumblebees, but noted that without detailed guidance, habitat quality may be poor, and seed mixes are expensive, so simple pollen and nectar mixtures may be more cost-effective. Carvell et al. (2007) found that among several Environmental Stewardship options tested, a diverse mix of native wildflowers provided continuity of pollen and nectar resources throughout the season, and attracted more of the shorter-tongued species than legume-based mixtures, though the latter attracted the highest numbers and diversity of bumblebees, including rare long-tongued species.
181

182
Vickery et al. (2002) suggested that grass/wildflower strips are likely to provide food for birds over a longer period of the year than grass-only swards. In the SAFFIE project, over five years birds were more strongly associated with mixtures containing wildflowers than a grass-only mix, though the effect was not strong (Clarke et al., 2007).
Wildflower mixes are unlikely to have any significantly impact on resource protection than grass-only margins or buffer strips. Removal of cuttings will take nutrients out of the system, which can reduce soil mineral nitrogen (De Cauwer et al., 2006) and reduce the amount of nitrate in runoff (Bedard-Haughn et al., 2005). This research was based on cutting at least twice a year and the vegetation was grass, thus the impacts quantified may be greater than would occurs with a grass/wildflower mix. However, the studies were also short term (< 3 years) and if this option was maintained in the same place, soil fertility, and thus the potential for nutrient leaching could be reduced over time if the cuttings were continuously removed. However, whether the removal of cuttings is a benefit or not will depend on the subsequent fate of the cuttings; if they are moved to another part of the farm, the farm level nutrient loading remains unchanged. In addition, cutting the vegetation in late summer could reduce its efficiency to prevent the movement of sediment and its associated pollutants over the autumn/winter.
Key attributes Interview: month and year of sowing; seed mixture; timing and frequency of cutting, whether cuttings removed; any other management carried out (e.g. spraying, scarification) Measurement:.cover of grasses, forbs, undesirable species and bare ground; floral density (estimate)

3 SCORING CRITERIA.
Scores will be given for each of the criteria specified, and an average score calculated in each case. Where scores vary between individual features, years etc, intermediate scores may be awarded. Habitats under formal and informal management will be scored separately.
3.1 MAJOR HABITAT CATEGORIES
As these are likely to be encountered on most farms, and there is generally substantial information available on what constitutes good environmental management, a number of criteria are set for each habitat type. Information on these will be obtained through interview and/or field assessment as indicated in the preceding text.
183

Hedgerows18
Attribute Score
1 2 3
Height Average minimum height <1.5m Average minimum height 1.5m Average minimum height 2m
Width Min width 1m or less Average minimum width >1m Average minimum width 1.5m
Gappiness > 10% gaps and gap(s) > 5m wide
Either > 10% gaps or gap more than 5m wide (excluding access points and gates)
Less than 10% gaps and no gap more than 5m wide (excluding access points and gates)
Adjacent habitat Uncultivated strip does not fulfil cross-compliance requirements (narrower than 2m from centre of hedge)
Adjacent uncultivated strip at least fulfils cross-compliance requirements
Exceeds cross-compliance requirements (average width >2m from centre of hedge, min. 1m of herbaceous vegetation from trim line
Cutting frequency Annual No more than once every 2 years > once every 2 years
Cutting time Cut between 1 March to 31 August
Not cut between 1 March to 31 August
Cut late winter (after 1 January)
Nutrient enrichment 20% or more mean cover of cleavers, dock and nettles in herbaceous strip
<20% but >10% mean cover of cleavers, dock and nettles in herbaceous strip
10% or less mean cover of cleavers, dock and nettles in herbaceous strip
18 NB recently laid hedges qualify for category 3; recently coppiced hedges for category 2 under height and width categories
184

Ditches (must contain standing water to qualify)
Attribute Score
1 2 3
Bank cutting frequency Annual No more than once every 2 years > once every 2 years
Cutting time Cut between 28 February and 15 September
Not cut between 28 February and 15 September
Cut late winter (after 1 January)
One or both sides Both sides cut at the same time One or both sides cut Only one side cut at a time
Veg in ditch bottom Cut annually Cut no more than every 2 years Longer interval than 2 years
Dredging frequency < 3 years Between 3 and 5 years 5 years or longer
Water plants No floating or emergent vegetation
Floating or emergent plants present
Floating and emergent plants present
Adjacent habitat Uncultivated strip does not fulfil cross-compliance requirements (narrower than 2m from centre of ditch or 1m from top of bank)
Adjacent uncultivated strip at least fulfils cross-compliance requirements
Exceeds cross-compliance requirements (average width >2m from centre of ditch, > 1m of herbaceous vegetation from trim line
185

Buffer strips and grassy field margins
Attribute Score
1 2 3 Width (in addition to cross-compliance strip)
2-4m wide 4-6m wide >6m wide
Cutting time Cut between 1 May and 31 July Not cut between 1 May and 31 July Not cut between 1 April and 31 August
Cutting frequency Cut annually No more than once every 2 years 2-3m near boundary no more than once every 2 years, rest cut annually
Compaction Severe compaction, permanent track-way etc.
Evidence of occasional use as track
No compaction
Vegetation cover - birds19
Complete cover Cover ± complete but with some open ground e.g. bare strip between margin and crop, track
>20% bare ground or very short vegetation within margin to allow foraging access
Vegetation cover - RP20 > 25% bare ground Up to 25% bare ground Complete cover Seed mixture Sown with simple grass mix (1-2
spp) Naturally regenerated or sown with diverse grass mix ± 1-2 common forbs (e.g. clover)
Sown with diverse grass mix
Vegetation diversity Dominated by grasses and/or undesirable forbs21
1-3 desirable spp forbs/m2, <20% cover undesirable forbs.
Diverse species mix, >3 forb spp/m2 on average, <10% cover undesirable spp.
Nutrient enrichment 20% or more mean cover of cleavers, dock and nettles
<20% but >10% mean cover of cleavers, dock and nettles
10% or less mean cover of cleavers, dock and nettles
19 Appropriate next to hedges etc away from watercourses 20 RP = resource protection – appropriate for buffers next to watercourses. 21 Creeping thistle, nettles, cleavers, docks, ragwort, non-native spp.
186

Field corners and uncropped areas
Attribute Score
1 2 3 Cutting time Cut between 1 March and 31
August Not cut between 1 March and 31 August
Not cut between 1 March and 30 September
Cutting frequency Cut annually or more No more than once every 2 years No more than once every 5 years Compaction Severe compaction,
permanent trackway etc. Evidence of occasional vehicular access
No compaction
Vegetation cover - birds22
Complete cover <20% open ground or large areas with complete cover
>20% bare ground or very short vegetation over >50% of area
Vegetation cover - RP23 > 25% bare ground Up to 25% bare ground Complete cover Seed mixture Sown with simple grass mix (1-
2 spp) Naturally regenerated or sown with diverse grass mix ± 1-2 common forbs (e.g. clover)
Sown with diverse grass mix
Vegetation diversity Dominated by grasses and/or undesirable forbs24
1-3 desirable spp forbs/m2, <20% cover undesirable forbs.
Diverse species mix, >3 forb spp/m2 on average, <10% cover undesirable spp.
Storage of manure Manure heap in situation with risk of runoff to watercourse e.g. within 50m of watercourse, uphill from watercourse, on heavy soil
Manure heap in situation with low risk of runoff e.g. at least 50m from water course, not on slope above watercourse, on free draining soil
No manure storage
Use of herbicides Broad-spectrum herbicides used
Narrow-spectrum herbicides used or broad spectrum applied selectively (e.g. weed wipe)
No herbicides used
22 Appropriate away from watercourses 23 RP = resource protection – appropriate within 10m of watercourses. 24 Creeping thistle, nettles, cleavers, docks, ragwort, non-native spp.
187

Short term fallow
Attribute Score
1 2 3
Cutting time Cut between 1 March and 31 July
Not cut between 1 March and 31 July
Not cut between 1 March and 30 August
Cutting frequency Cut frequently Cut once only Not cut
Compaction Severe compaction, permanent trackway etc.
Evidence of occasional vehicular access
No compaction
Vegetation cover - birds25
Complete cover <20% open ground or large areas with complete cover
>20% bare ground or very short vegetation over >50% of area
Vegetation cover - RP26 > 25% bare ground Up to 25% bare ground Complete cover
Vegetation diversity Dominated by undesirable grasses and/or forbs27
1-3 desirable spp forbs28/m2, <25% cover undesirable species.
Diverse species mix, >3 forb spp/m2 on average, <10% cover undesirable spp.
Storage of manure Manure heap in situation with risk of runoff to watercourse e.g. within 50m of watercourse, uphill from watercourse, on heavy soil
Manure heap in situation with low risk of runoff e.g. at least 50m from water course, not on slope above watercourse, on free draining soil
No manure storage
Use of herbicides Broad-spectrum herbicides used
Narrow-spectrum herbicides used or broad spectrum applied selectively (e.g. weed wipe)
No herbicides used
25 Appropriate away from watercourses 26 RP = resource protection – appropriate within 10m of watercourses. 27 Black-grass, barren brome, wild oats, creeping thistle, , cleavers, docks, nettles, ragwort, non-native spp. 28 Including annual arable plants
188

Game crops/wild bird seed mix
Attribute Score
1 2 3
Seed mix Maize, giant sorghum or other non-seeding crop only
At least 50% seeding crop not maize per block
No maize, at least 2 different seeding crops
Crop cover <50% cover of sown crops 50% or more cover of sown crops >75% cover of sown crops
Weed cover Less than 10% cover of high value weed species29
10-20% cover of high value weed species
>20% cover of high value weed species
Destruction Destroyed before mid-February
Retained until at least 1 March Retained after 1 March
Herbicide Overall herbicide spray Spot-treated or weed-wiped No herbicide
Insecticide Sprayed with insecticide Insecticide seed treatment, no spray
No insecticide
29 Fat hen, chickweed, polygonums, annual meadow grass, charlock, fumitory
189

Crop type/rotation/cultivation
Attribute Score
1 2 3
Crop diversity 3 or fewer different crop types in rotation
At least 4 crop types in rotation 5 or more crop types in rotation
Crop types No spring-sown, fodder or root crops grown
At least one spring-sown, fodder crop (other than maize) or root crop grown in rotation
At least one spring cereal and one beet or fodder crop (other than maize) in rotation
Grass leys No grass leys Grass leys included in rotation Grass leys established by undersowing and/or with clover
Herbicide Objective maximum weed control
Objective economically optimum weed control
Organic, or selective/minimal herbicide regime on at least one crop in rotation
Weed populations Very few weeds in all crops (<2% cover on average)
Some weed presence, at least 3 species common at >2% combined cover in at least one crop type
>3 spp common at >2% combined cover in 2 or more crop types or > 10% in one crop type
Insecticide Prophylactic treatment Treatment only when pest above threshold
Avoids insecticide use as far as possible
Primary cultivation No minimal tillage – all inversion tillage
Minimal tillage used for all crops Balance of minimal tillage and ploughing in rotation
Organic manures Not used Applied occasionally (<1 year in 5) Applied regularly (>1 year in 5)
190

Stubbles/Stubble management
Attribute Score
1 2 3
Type of stubble left Maize only Wheat (± maize) only Barley, oilseed rape, linseed (± wheat &/or maize)
Herbicide Pre-harvest desiccant &/or post-harvest herbicide used
No pre-harvest desiccant &/or post-harvest herbicide used
Stubble following crop with selective/ minimal herbicide regime, or organic, or undersown
Weed/volunteer cover Low vegetation cover (<5%), few or no seeding weeds
Vegetation cover >5%, some seeding broad-leaved weeds present
Vegetation cover >10%, seeding broad-leaved weeds common
Intended date of destruction (average)
Before 15 February After 1 March Extended stubble, retained until following summer (or later)
Stubble height All or mostly >10cm All or mostly <10cm Mixture of heights < and > 10cm
Removal of compaction Not done Sometimes done Regularly done where required
191

Grassland
Attribute Score
1 2 3
Fertiliser application >100kg/ha N applied <100kg/ha total N as inorganic + organic manure.
No inorganic fertiliser, max 12.5 t/ha FYM
Grazing management Sheep only Cattle only Mixed livestock grazing
Cutting management Silage Early hay cut Late hay cut (after 1July)
Resowing policy Resown regularly (5 years or less) Resown occasionally, if required Not resown
Grassland establishment Direct sown Direct sown, with clover Undersown
Sward height (grazed) Uniformly short (<10cm) Uniform, longer than 10cm30 Sward height variable
Botanical diversity Improved Semi-improved Unimproved
Supplementary feeding Feeding stations moved rarely or not at all
Feeding stations moved regularly No supplementary feeding
Poaching and erosion Poaching/erosion associated with access to watercourse
Poaching/erosion away from watercourses (e.g. around feeders, drinking troughs)
No significant poaching or erosion31
30 Longer swards may be desirable for some conservation objectives, e.g. wet grassland for breeding waders 31 Some poaching around gateways or permanent water troughs for example is almost unavoidable, but should not be severe or widespread.
192

3.2 MINOR HABITAT CATEGORIES
These habitats are less common on arable or arable/mixed lowland farms. They comprise a mixed group consisting of (i) non-hedgerow boundaries; (ii) trees and habitats dominated by woody species; (iii) specialised management for specific environmental objectives. They are mostly of lower importance for environmental objectives related to arable/mixed farmland than the major habitat categories, or they are targeted at specific environmental objectives, thus the number of attributes listed for assessment is generally smaller
Other boundaries (stone walls etc.)
Attribute Score
1 2 3
Maintenance practice Not maintained Limited maintenance Regular maintenance
Gaps, bulging, slumping and bellying
Many walls derelict or becoming so (faults affecting >50% of wall length)
Most walls still substantially intact, but significant numbers of gaps, some bulging, slumping and bellying, some topstones may be missing (faults affecting <50% of wall length
Few or no gaps or other structural defects
Hedgebanks Significant gaps and/or other structural defects, not stockproof (unless by gap filling with foreign materials such as hurdles, wire, etc.
Mostly intact but signs of poor or lacking maintenance
Well maintained
193

In-field trees
Attribute Score
1 2 3
Cultivation Cultivation beneath tree canopy Cultivation does not extend beneath tree canopy
No cultivation within 2m of tree canopy
Dead wood Dead branches removed Dead branches left on tree but fallen branches removed
Dead branches left on tree; fallen branches left in situ
Livestock High stocking rate and evidence of livestock damage to tree or ground beneath. Includes supplementary feeding beneath or close to trees.
Little evidence of livestock damage; low or moderate stocking rate, any supplementary feed well away from trees
Positive management to limit livestock damage, e.g. fencing round tree, provision of alternative shelter
Woodland type, edges and fences
Attribute Score
1 2 3
Woodland type Conifer-dominated plantation Broadleaved or mixed (50%+ broadleaved) plantation
Woodland composed of native species, not apparently planted (trees not in rows)
Management Little or no management Some management but not mainly for environmental purposes (e.g. timber harvesting and replanting, maintenance of rides for shooting)
Active management for environmental conservation e.g. coppicing, fencing out livestock or deer, enhancement of woodland edges
194

Scrub The appropriate management approach for scrub is dependent on the situation and objectives, and can range from encouraging spread to eradication. In view of the wide range of possible objectives and management approaches, and the likelihood that few instances of scrub management are likely to be recorded on farms, it was decided not to attempt to score management of this habitat, but to record details of any occurrences of scrub management encountered, along with management objectives, in the report text.
Perennial biomass energy crops (SRC/Miscanthus)
Attribute Score
1 2 3
Margins and rides No margins or rides Present but <8m wide 8m or more wide
Block size >15ha <15ha but >3ha 3ha or less
Herbicides Applied annually Only at planting and after cutting (SRC) or at intervals>> 1 year
None or only at planting
Insecticides Used regularly Used occasionally if serious pest outbreak
Not used
Harvesting All at one time, whenever convenient
Rotational, timing when convenient Rotational, avoiding wet periods and not between 1 March and 31 July
Margin vegetation Dominated by grasses and/or undesirable forbs32
1-3 desirable spp forbs/m2, <20% cover undesirable forbs.
Diverse species mix, >3 forb spp/m2 on average, <10% cover undesirable spp.
Compaction Severe compaction, permanent trackway etc.
Evidence of occasional use as track
No compaction
32 Creeping thistle, nettles, cleavers, docks, ragwort, non-native spp.
195
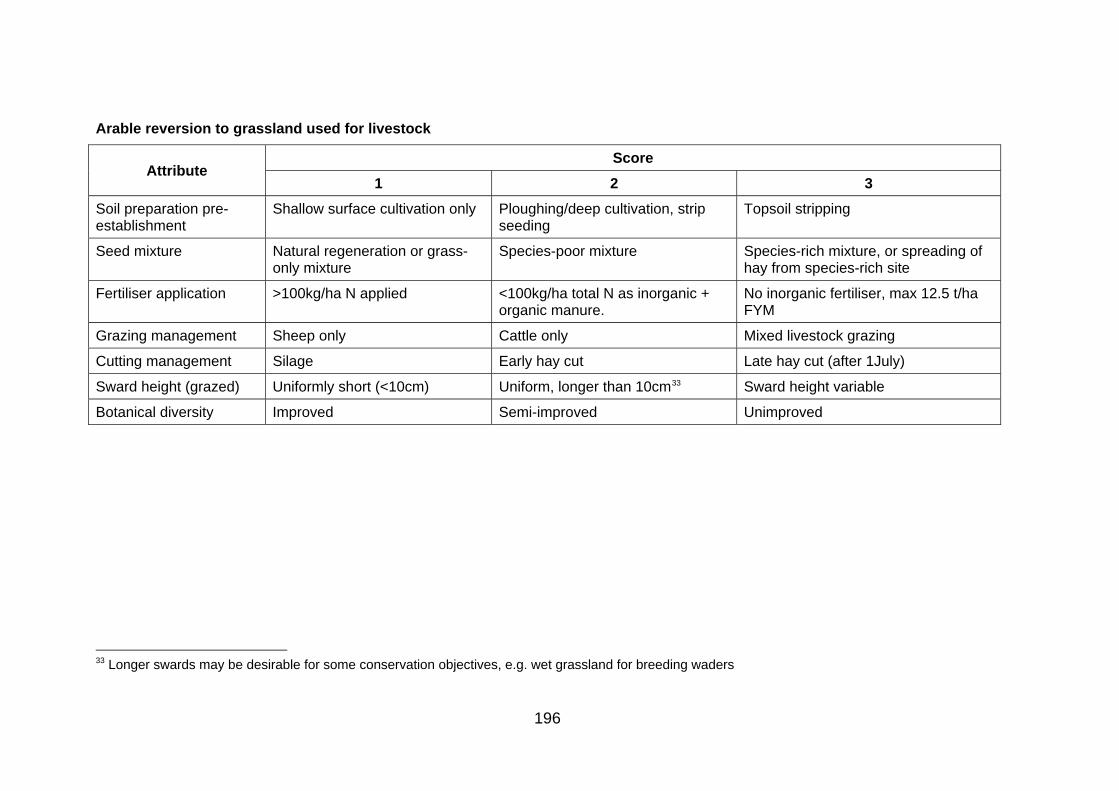
Arable reversion to grassland used for livestock
Attribute Score
1 2 3
Soil preparation pre-establishment
Shallow surface cultivation only Ploughing/deep cultivation, strip seeding
Topsoil stripping
Seed mixture Natural regeneration or grass-only mixture
Species-poor mixture Species-rich mixture, or spreading of hay from species-rich site
Fertiliser application >100kg/ha N applied <100kg/ha total N as inorganic + organic manure.
No inorganic fertiliser, max 12.5 t/ha FYM
Grazing management Sheep only Cattle only Mixed livestock grazing
Cutting management Silage Early hay cut Late hay cut (after 1July)
Sward height (grazed) Uniformly short (<10cm) Uniform, longer than 10cm33 Sward height variable
Botanical diversity Improved Semi-improved Unimproved
33 Longer swards may be desirable for some conservation objectives, e.g. wet grassland for breeding waders
196

Beetle banks and in-field grass strips
Attribute Score
1 2 3
Height of bank Flat Ground not flat but <0.5m above surrounding area
Bank >0.5m high
Vegetation cover > 10% bare ground Up to 10% bare ground Complete cover Vegetation composition Short, fine-leaved grasses/forbs
(<10% coarse/tussocky grasses)10-50% coarse/tussocky grasses >50% coarse/tussocky grasses
Location (RP) Bank running down slope or diagonally
Bank running across slope or flat field acting as insect refuge
Grass area in valley bottom
Uncropped cultivated margins
Attribute Score
1 2 3
Cultivation Less than annual Annual, same time and depth Annual, varying time (spring/autumn) ± varying depth
Control of pernicious weeds No control Varying time/depth of cultivation Herbicide application or rotating strip
Species composition Dominated by undesirable species (e.g. thistles, weed grasses)
<50% cover of undesirable species, annual forbs present
<20% cover of undesirable species, annual forbs abundant and diverse
197
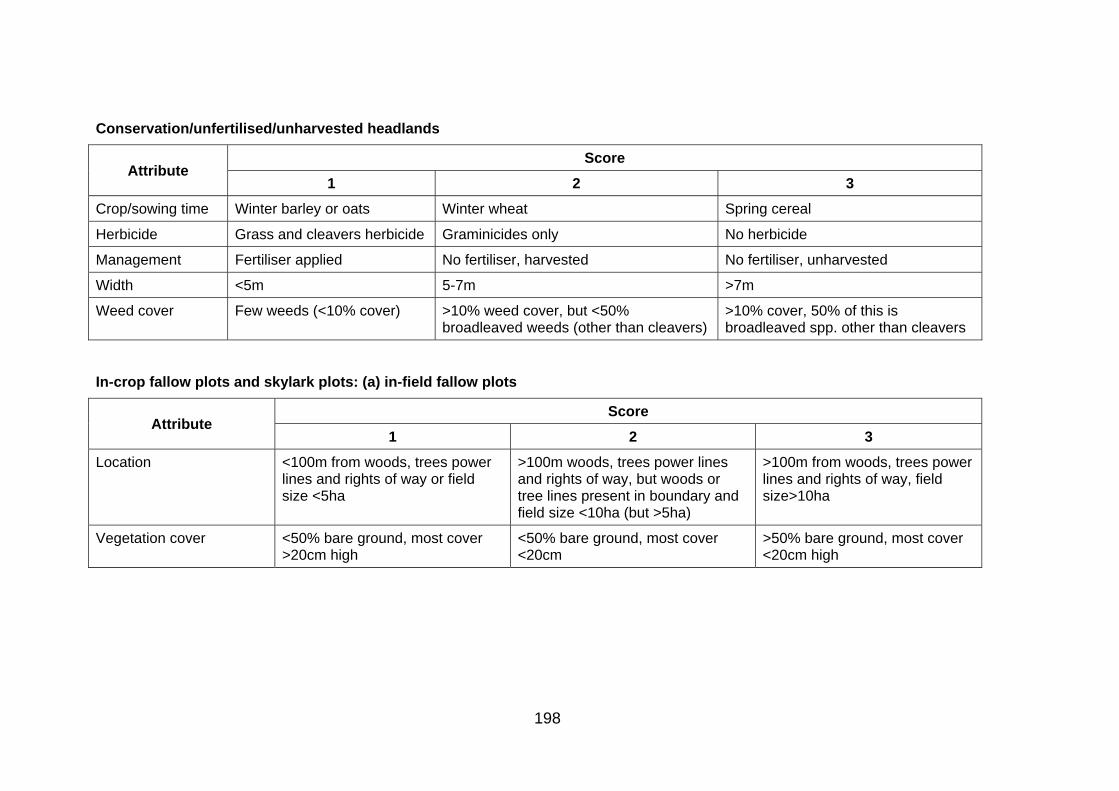
Conservation/unfertilised/unharvested headlands
Attribute Score
1 2 3
Crop/sowing time Winter barley or oats Winter wheat Spring cereal
Herbicide Grass and cleavers herbicide Graminicides only No herbicide
Management Fertiliser applied No fertiliser, harvested No fertiliser, unharvested
Width <5m 5-7m >7m
Weed cover Few weeds (<10% cover) >10% weed cover, but <50% broadleaved weeds (other than cleavers)
>10% cover, 50% of this is broadleaved spp. other than cleavers
In-crop fallow plots and skylark plots: (a) in-field fallow plots
Attribute Score
1 2 3
Location <100m from woods, trees power lines and rights of way or field size <5ha
>100m woods, trees power lines and rights of way, but woods or tree lines present in boundary and field size <10ha (but >5ha)
>100m from woods, trees power lines and rights of way, field size>10ha
Vegetation cover <50% bare ground, most cover >20cm high
<50% bare ground, most cover <20cm
>50% bare ground, most cover <20cm high
198

199
In-crop fallow plots and skylark plots: (b) skylark plots
Attribute Score
1 2 3
Timing/method of creation Sprayed out after December Sprayed out before end December Not drilled (drill lifted)
Density <2/ha At least 2/ha, some <50m from field edge
At least 2/ha, all >50m from field edge
Vegetation cover >60% vegetation cover <10% vegetation cover 10-60% vegetation cover
Pollen/nectar mixtures and flower rich margins
Attribute Score
1 2 3
Seed mixture <4 nectar-rich plant species At least 4 nectar-rich plants from ELS option list, or basic wildflower mix (common species)
Species-rich native wildflower mix
Cutting No cut Late summer/autumn cut, cuttings left in situ
Late summer and autumn cut, cuttings removed (or shredded)
Plant cover <10% cover desirable spp. &/or >25% cover undesirable sp.
>10% cover desirable spp; <25% undesirable spp
>25% cover desirable species, <10% cover undesirable spp.
Floral density34 Up to 3 flowers per 9 (i.e. 3x3) m2 >3 - 30 flowers per 9 m2 >30 flowers per 9 m2
34 Range derived from Carvell et al. (2004), converted from plots 300m2 (50x6m) as follows: 3 flowers/9 m2 = 100 flowers/300 m2 and log (flower no) = 2; 30 flowers//9 m2 = 1000/300 m2 and log (flower no) = 3 (see Fig 1 of Carvell et al., 2004))

REFERENCES
ADAS (2001). Ecological evaluation of the Arable Stewardship Pilot scheme, 1998-2000. ADAS/CLUWRR/EGI/GCT report to MAFF. ADAS, Wolverhampton.
Aebischer, N.J. (1990). Assessing pesticide effects on non-target invertebrates using long-term monitoring and time-series modelling. Functional Ecology 4: 369-373.
Anon. (2001a) Soil erosion control in maize. Project No. SP0404. Report to Defra.
Anon. (2001b) Review of the effects of energy crops on hydrology. Project No. NF0416. Report to Defra.
Anon. (2002) The Government's strategic review of diffuse water pollution from agriculture in England. Agriculture and Water: A diffuse pollution review. Defra Report.
Aronsson, P.G., Bergström, L.F., & Elowson, S.N.E. (2000) Long-term influence of intensively cultured short-rotation Willow Coppice on nitrogen concentrations in groundwater. Journal of Environmental Management, 58, 135-145.
Asher, J., Warren, M., Fox, R., Harding, P., Jefcoate, G. & Jeffcoate, S. (2001). The Millennium Atlas of Butterflies in Britain and Ireland. Oxford, Oxford University Press.
Askew, N.P., Searle, J. B. & Moore, N. P. (2007) Agri-environment schemes and foraging of barn owls Tyto alba. Agriculture, Ecosystems & Environment, 118, 109-114.
Asteraki, E.J., Hart, B.J., Ings, T.C., & Manley, W.J. (2004) Factors influencing the plant and invertebrate diversity of arable field margins. Agriculture , Ecosystems and Environment, 102, 219-231.
Atkinson, P.W., Fuller, R.J., Vickery, J.A., Conway, G.J., Tallowin, J.R., Smith, R.E.N., Haysom, K.A., Ings, T.C., Asteraki, E.J. & Brown, V.K. (2005). Influence of agricultural management, sward structure and food resources on grassland field use by birds in lowland England. Journal of Applied Ecology 42: 932-942.
Baines, M., Hambler, C., Johnson, P.J., Macdonald, D.W. & Smith, H. (1998). the effects of arable field margin management on the abundance and species richness of Araneae (spiders). Ecography 21: 74-86.
Bartley, R., Corfield, J. P., Abbott, B. N., Hawdon, A. A., Wilkinson, S. N. & Nelson, B. (2010). Impacts of improved grazing land management on sediment yields, Part 1: Hills lope processes. Journal of Hydrology, 389, 237-248.
Bedard-Haughn, A., Tate, K. W., & van Kessel, C. (2005). Quantifying the impact of regular cutting on vegetative buffer efficacy for nitrogen-15 sequestration. Journal of Environmental Quality, 34, 1651-1664.
Bellamy, P.E., Croxton, P.J., Heard, M.S., Hinsley, S.A., Hulmes, L., Hulmes, S., Nuttall, P., Pywell, R.F.& Rothery, P. (2009). The impact of growing miscanthus for biomass on farmland bird populations. Biomass and Bioenergy 33: 191-199.
Bellamy, P.E., Shore, R.F., Ardeshir, D., Treweek, J.R. & Sparks, T.H. (2000). Road verges as habitat for small mammals in Britain. Mammal Review 30: 131-139.
Bence, S.L., Stander, K. & Griffiths, M. (2003) Habitat characteristics of harvest mouse nests on arable farmland. Agriculture, Ecosystems & Environment, 99, 179-186.
Biggs, J., Williams, P., Whitfield, M., Nicolet, P., Brown, C., Hollis, J., Arnold, D. & Pepper, T. (2007). The freshwater biota of British agricultural landscapes and their sensitivity to pesticides. Agriculture, Ecosystems and Environment 122: 137-148.
Bignal, E. & McCracken, D. (1993). Nature conservation and pastoral farming in the British Uplands. British Wildlife, 4, 367-376.
Blackwell, M. S. A., Hogan, D. V., & Maltby, E. (1999). The use of conventionally and alternatively located buffer zones for the removal of nitrate from diffuse agricultural run-off. Water Science and Technology, 39, 157-164.
200

Borin, M., Vianello, M., Morari, F. & Zanin, G. (2005). Effectiveness of buffer strips in removing pollutants in runoff from a cultivated field in North-East Italy. Agriculture, Ecosystems & Environment, 105, 101-114.
Boatman, N., Conyers, S., Jones, N., & Pietravalle, S. (2009). Botanical field survey of set-aside and other uncropped land: further analysis. Final report, May 2009. The Food & Environment Research Agency. https://statistics.defra.gov.uk/esg/ace/research/pdf/Set-aside%20further%20analysis%20FINAL%20report%2022-5-09.pdf
Boatman, N., Jones, N., Conyers, S., & Pietravalle, S. (2008). Monitoring and evaluation of Zero rate set-aside in 2008 – assessing the botanical interest of set-aside and other uncropped land. Final report, August 2008. Central Science Laboratory. https://statistics.defra.gov.uk/esg/ace/research/pdf/CSL%20Set-aside%20Final%20Report%20Aug%202008.pdf
Boatman, N.D. & Stoate, C. (2002). Growing crops to provide food for seed-eating farmland birds in winter. Aspects of Applied Biology, 67, Birds and Agriculture, pp. 229-236.
Brickle, N. W. & D. G. C. Harper (2000). Habitat use by Corn Buntings Miliaria calandra in winter and summer. Ecology and Management of Lowland Farmland Birds. N. J. Aebischer, A. D. Evans, P. V. Grice and J. A. Vickery. Tring, British Ornithologists' Union: 156-164.
British Trust for Ornithology (2008). Zero rate of set-aside: evaluating the potential impact on farmland birds and the implications for requirements for ELS uptake and related measures. Final report to Defra, project BD1640
Browne, S.J.& Aebischer, N.J. (2004). Temporal changes in the breeding ecology of European Turtle Doves Streptopelia turtur in Britain, and implications for conservation. Ibis 146: 125-137.
Buckingham, D. L. & W. J. Peach (2005). The influence of livestock management on habitat quality for farmland birds. Animal Science 81: 199-203.
Buckingham, D. L., W. J. Peach & D. S. Fox (2006). Effects of agricultural management on the use of lowland grassland by foragging birds. Agriculture, Ecosystems and Environment 112: 21-40.
Buckingham, D. L., P. W. Atkinson, S. Peel & W. J. Peach (2010). New conservation measures for birds on grasslands and livestock farms. Lowland Farmland Birds III: delivering solutions in an uncertain world, Leicester, British Ornithologist's Union. http://www.bou.org.uk/bouproc-net/lfb3/buckingham-etal.pdf
Bucur, D., Jitareanu, G., Ailincai, C., Tsadilas, C., Ailincai, D. & Mercus, A. (2007). Influence of soil erosion on water, soil, humus and nutrient losses in different crop systems in the Moldavian Plateau, Romania. Journal of Food Agriculture & Environment, 5, 261-264.
Carvell, C., Meek, W.R., Pywell, R.F. & Nowakowski, M. (2004). The response of foraging bumblebees to successional change in newly created arable field margins. Biological Conservation 118: 327-339.
Carvell, C., Meek, W.R., Pywell, R.F., Goulson, D. & Nowakowski, M. (2007). Comparing the efficacy of agri-environment schemes to enhance bumble bee abundance and diversity on arable field margins. Journal of Applied Ecology 44: 29-40.
Chalmers, A.G., Bacon, E.T.G. & Clarke, J.H. (2001). Changes in soil mineral nitrogen during and after 3-year and 5-year set-aside and nitrate leaching losses after ploughing out the 5-year plant covers in the UK. Plant and Soil 228: 157-177.
Chamberlain, D., Gough, S., Anderson, G., MacDonald, M., Grice, P.& Vickery, J. (2009). Bird use of cultivated fallow 'Lapwing plots' within English agri-environment schemes. Bird Study 56: 289-297
Chamberlain, D.E., Wilson, A.M., Browne, S.J., & Vickery, J.A. (1999). Effects of habitat type and management on the abundance of skylarks in the breeding season. J. Appl. Ecol. 36: 856-870.
Chambers, B.J. & Garwood, T. W. D. (2000). Monitoring of water erosion on arable farms in England and Wales. 1990-94. Soil Use and Management, 16, 93-99.
Chambers, B.J., Garwood, T.W.D & Unwin, R.J. (2000). Controlling soil water erosion and phosphorus losses from arable land in England and Wales. Journal of Environmental Quality, 29, 1-150
201

Clarke, J.H., Cook, S.K., Harris, D., Wiltshire, J.J.J., Henderson, I.G., Jones, N.E., Boatman, N.D., Potts, S.G., Westbury, D.B., Woodcock, B.A., Ramsay, A.J., Pywell, R.F., Goldsworthy, P.E., Holland, J.M., Smith, B.M., Tipples, J., Morris, A.J., Chapman, P. & Edwards, P. (2007). The SAFFIE Project Report. ADAS, Boxworth, UK
Collins, A.L., Walling, D. E., McMellin, G. K., Zhang, Y. S., Gray, J., McGonigle, D. & Cherrington, R. (2010). A preliminary investigation of the efficacy of riparian fencing schemes for reducing contributions from eroding channel banks to the siltation of salmonid spawning gravels across the south west UK. Journal of Environmental Management, 91, 1341-1349.
Collins, K.L., Boatman, N.D., Wilcox, A.& Holland, J.M. (2003). A 5-year comparison of overwintering polyphagous predator densities within a beetle bank and two conventional hedgebanks. Annals of Applied Biology 143: 63-71.
Collins, K.L., Boatman, N.D., Wilcox, A., Holland, J.M.& Chaney, K. (2002). Influence of beetle banks on cereal aphid predation in winter wheat. Agriculture, Ecosystems and Environment 93: 337-350.
Critchley, C. N. R., Allen, D. S., Fowbert, J. A., Mole, A. C. & Gundrey, A. L. (2004) Habitat establishment on arable land: assessment of an agri-environment scheme in England, UK. Biological; Conservation 119, 429-442.
Critchley, C.N.R., Fowbert, J.A.& Sherwood, A. (2006). The effects of annual cultivation on plant community composition of uncropped arable field boundary strips. Agriculture, Ecosystems and Environment 113: 196-205.
Crofts, A. & Jefferson, R.G., Eds. (1999). The Lowland Grassland Management handbook, 2nd edition, English Nature/The Wildlife Trusts.
Croxton, P. J. & T. H. Sparks (2002). A farm-scale evaluation of the influnce of hedgerow cutting frequency on hawthorn (Crataegus monogyna) berry yields. Agriculture, Ecosystems and Environment 93: 437-439.
Cunningham, H.M., Bradbury, R.B., Chaney, K.& Wilcox, A. (2005). Effect of non-inversion tillage on field usage by UK farmland birds in winter. Bird Study 52: 173-179.
Cunningham, H.M., Chaney, K., Bradbury, R.B. & Wilcox, A. (2004). Non-inversion tillage and farmland birds: a review with special reference to the UK and Europe. Ibis 146, Supplement 2: 192-202.
Cunningham, M., Bishop, J.D., McKay, H.V. and Sage, R.B. (2004) The ecology of Short Rotation Coppice Crops – Arbre Monitoring. Report for DTI B/U1/00627/REP.
Cunningham, M., Bishop, J.D., Watola, G., McKay, H.V. and Sage, R.B. (2006) The effects on flora and fauna of converting grassland to short rotation coppice. Report for DTI B/W2/00738/00/00
Cuttle, S.P., Scurlock, R. V. & Davies, B. M. S. (1998). A 6-year comparison of nitrate leaching from grass/clover and N-fertilized grass pastures grazed by sheep. Journal of Agricultural Science, 131, 39-50.
Davies, Z.G., Tyler, C., Stewart, G.B. & Pullin, A.S. (2006). Are current management recommendations for conserving saproxylic invertebrates effective? Systematic Review No. 17. Collaboration for Environmental Evidence.
Day, J., Symes, N. & Robertson, P. (2003). The Scrub Management Handbook. Wetherby, The Forum for Application of Conservation Techniques (FACT) and English Nature.
De Cauwer, B., Reheul, D., Nijs, I. & Milbau, A. (2006). Effect of margin strips on soil mineral nitrogen and plant biodiversity. Agronomy for Sustainable Development, 26, 117-126.
De Snoo, G.R. & de Wit, P.J. (1998). Buffer zones for reducing pesticide drift to ditches and risks to aquatic organisms. Ecotoxicology and Environmental Safety 41: 112-118.
Deasy, C., J. N. Quinton, M. Silgram, A. P. Bailey, B. Jackson & C. J. Stevens (2010). Contributing understanding of mitigation options for phosphorus and sediment to a review of the efficacy of contemporary agricultural stewardship measures. Agricultural Systems 103: 105-109.
Dennis, P., Thomas, M.B. & Sotherton, N.W., (1994). Structural features of field boundaries which influence the overwintering densities of beneficial arthropod predators. Journal of Applied Ecology 31, 361–370.
202

Donald, P.F., Evans, A.D., Buckingham, D.L., Muirhead, L.B., & Wilson, J.D. (2001) Factors affecting the territory distribution of skylark Alauda arvensis breeding on lowland farmland. Bird Study, 48, 271-278.
Douglas, D.J.T., Vickery, J.A., & Benton, T.G. (2009). Improving the value of field margins as foraging habitat for farmland birds. Journal of Applied Ecology, 46, 353-362.
Douglas, J.T. & Crawford, C. E. (1998). Soil compaction effects on utilization of nitrogen from livestock slurry applied to grassland. Grass and Forage Science, 53, 31-40.
Dover, J.D., Sotherton, N.W. & Gobbett, K. (1990). Reduced pesticide inputs on cereal field margins: the effects on butterfly abundance. Ecological Entomology 15: 17-24.
Dover, J. & Sparks, T. (2000). A review of the ecology of butterflies in British hedgerows. Journal of Environmental Management 60: 51-63.
Duffey, E., M. G. Morris, J. Sheail, L. K. Ward, D. A. Wells & T. C. E. Wells (1974). Grassland ecology and wildlife management. London, UK, Chapman & Hall.
Evans, R. (1990). Water erosion in British farmers’ fields – some causes, impacts, predictions. Prog. Phys. Geog. 14: 199-219.
Evans, R. (2006). Curtailing water erosion of cultivated land: An example from north Norfolk, eastern England. Earth Surface Processes and Landforms, 31, 598-605.
Feber, R.E., Smith, H. & Macdonald, D.W. (1996). The effects on butterfly abundance of the management of uncropped edges of arable fields. Journal of Applied Ecology 33: 1191-1205.
Firbank, L.G. 1998. Agronomic and environmental evaluation of set-aside under the EC Arable Area Payments Scheme, vols 1-4. Institute of Terrestrial Ecology/Ministry of Agriculture, Fisheries and Food, London, UK.
Frouz, J. (1999). Use of soil-dwelling Diptera (Insecta, Diptera) as bioindicators: a review of ecological requirements and response to disturbance. Agriculture , Ecosystems and Environment 74: 167-186.
Fullen, M.A. (1985). Wind Erosion of Arable Soils in East Shropshire (England) During Spring 1983. CATENA, 12, 111-120.
Fullen, M.A. & Booth, C.A. (2006). Long term grass ley set aside on sandy soils: a case study. Journal of Soil and Water Conservation 61, 236-241
Fullen, M.A., Booth, C. A. & Brandsma, R. T. (2006). Long-term effects of grass ley set-aside on erosion rates and soil organic matter on sandy soils in east Shropshire, UK. Soil & Tillage Research, 89, 122-128.
Fuller, R.J., Hinsley, S.A.& Swetnam, R.D. (2004). The relevance of non-farmland habitats, uncropped areas and habitat diversity to the conservation of farmland birds. Ibis 146 (Supplement 2): 22-31.
Gill, R.M. & Fuller, R.J. (2007). The efects of deer browsing on woodland structure and songbirds in lowland Britain. Ibis 149 (Supplement 2): 53-63.
Gillings, S., Newson, S.E., Noble, D.G. & Vickery, J.A. (2005). Winter availability of cereal stubbles attracts declining farmland birds and positively influences breeding population trends. Proceedings of the Royal Society B 272: 733-739.
Goodlass, G., Green, M., Hilton, B. & McDonough, S. (2007). Nitrate leaching from short-rotation coppice. Soil Use and Management, 23, 178-184
Green, R.E., Osborne, P.E., & Sears, E.J. (1994). The distribution of passerine birds in hedgerows during the breeding season in relation to characteristics of the hedgerow and adjacent farmland. Journal of Applied Ecology 31: 677-692.
Griffiths, G.J.K., Holland, J.M., Bailey, A. & Thomas, M.B. (2008). Efficacy and economics of shelter habitats for conservation biological control. Biological Control 45: 200-209.
Grime, J.P. (1979). Plant strategies and vegetation processes. Chichester, John Wiley & Sons.
203

Hancock, M. H. & J. D. Wilson (2003). Winter habitat associations of seed-eating passerines on Scottish farmland. Bird Study 50: 116-130.
Hassall, M., Hawthorne, A., Maudsley, M., White, P.& Cardwell, C. (1992). Effects of headland management on invertebrate communities in cereal fields. Agriculture, Ecosystems & Environment 40: 155-178.
Haughton, A.J., Bell, J.R., Boatman, N.D & Wilcox, A. (2001) The effect of the herbicide glyphosate on non-target spiders: Part II. Indirect effects on Lepthyphantes tenuis in field margins. Pest Management Science 57, 1037-1042
Haughton, A.J., Bond, A.J., Lovett, A.A., Dockerty, T., Sünnenberg, G., Clark, S.J., Bohan, D.A., Sage, R.B., Mallott, M.D., Mallott, V.E., Cunningham, M.D., Riche, A.B., Shield, I.F., Finch, J.W., Turner, M.M.& Karp, A. (2009). a novel, integrated approach to assessing social, economic and environmental implications of changing rural land-use: a case study of perennial biomass crops. Journal of Applied Ecology 46: 315-322.
Henderson, I., Fuller, R. J., Conway, G. J. & Gough, S. (2004). Evidence for declines in populations of grassland-associated birds in marginal upland areas of Britain. Bird Study, 51, pp. 12-19.
Henderson, I.G., Ravenscroft, N., Smith, G., & Holloway, S. (2009). Effects of crop diversification and low pesticide iputs on bird populations on arable land. Agriculture , Ecosystems and Environment, 129, 149-156.
Henderson, I.G., Vickery, J.A. & Carter, N. (2004). The use of winter bird crops by farmland birds in lowland England. Biological Conservation, 118, 21-32.
Hinsley, S. A. & Bellamy, P. E. (2000). The influence of hedge structure, management and landscape context on the value of hedgerows to birds: a review. Journal of Environmental Management 60: 33-49.
Holland, J. M., S. Southway, J. A. Ewald, T. Birkett, M. Begbie, J. Hart, D. Parrott & J. Allcock (2002). Invertebrate chick food for farmland birds: spatial and temporal variation in different crops. Aspects of Applied Biology 67, Birds and Agriculture: 27-34.
Holland, J. M. (2004a). The impact of agriculture and some solutions for arthropods and birds. Insect and Bird Interactions. H. van Emden and M. Rothschild. Andover, Intercept: 51-71.
Holland, J.M. (2004b). The environmental consequences of adopting conservation tillage in Europe: reviewing the evidence. Agriculture, Ecosystems and Environment, 103, 1-25.
Holland, J.M., Oaten, H., Southway, S. & Moreby, S. (2008). The effectiveness of field margin enhancement for cereal aphid control by different natural enemy guilds. Biological Control 47(71-76).
Holland, J.M., & Reynolds, C.R., (2003). The impact of soil cultivation on arthropod (Coleoptera and Araneae) emergence on arable land. Pedobiologia 47, 181–191.
Hopkins, J.J. & Kirby, K.J. (2007). Ecological change in British broadleaved woodland since 1947. Ibis 149 (Supplement 2): 29-40.
Hopkins, A., Pywell, R.F., Peel, S., Johnson, R.H. & Bowling, P.J. (1999). Enhancement of botanical diversity of permanent grassland and impact on hay production in Environmentally Sensitive Areas in the UK. Grass and Forage Science, 54, 163–173.
Inglis, I.R., Isaacson, A.J., Thearle, R.J.P. & Westwood, N.J. (1990). The effects of changing agricultural practice upon Woodpigeon Columba palumbus numbers. Ibis 132: 262 272
Kells, A., Holland, J. & Goulson, D. (2001) The value of uncropped field margins for foraging bumblebees. Journal of Insect Conservation, 5, 283-291.
Kirkham, F. W., Davis, D., Fowbert, J. A., Hooke, D., Parkin, A. B. & Sherwood, A.J. (2006) Evaluation of arable reversion agreements in the Countryside Stewardship and Environmentally Sensitive Areas Schemes. Report to Defra, project MA01015/RMP 1982.
Kirkham, F. W., Mountford J. O. &. Wilkins R. J (1996). The effects of nitrogen, potassium and phosphorus addition on the vegetation of a Somerset peat moor under cutting management. Journal of Applied Ecology 33: 1013-1029.
204

Kirkham, F. W. & Tallowin, J. R. (1995). The influence of cutting date and previous fertilizer treatment on the productivity and botanical composition of species-rich hay meadows on the Somerset Levels. Grass and Forage Science 49: 152-162.
Lys, J.A., Zimmermann, & M., Nentwig, W., (1994). Increase in activity density and species number of carabid beetles in cereals as a result of strip-management. Entomologia Experimentalis et Applicata 73, 1–9.
Manchester, S. J., McNally, S., Treweek, J. R., Sparks, T. H. & Mountford, J. O. (1999). The cost and practicality of techniques for the reversion of arable land to lowland wet grassland - an experimental study and review. Journal of Environmental Management 55: 91-109.
Marc, P., A. Canard & Ysnel F. (1999). Spiders (Araneae) useful for pest limitation and bioindication. Agriculture , Ecosystems and Environment 74: 229-273.
Marshall, E.J.P., West, T.M. & Kleijn, D. (2006). Impacts of an agri-environment field margin prescription on the flora and fauna of arable farmland in different landscapes. Agriculture , Ecosystems and Environment 113: 36-44.
Maudsley, M. J. (2000). A review of the ecology and conservation of hedgerow invertebrates in Britain. Journal of Environmental Management 60: 65-76
Maudsley, M. J., T. M. West, H. R. Rowcliffe & E. J. P. Marshall (2000). The impacts of hedge management on wildlife: preliminary results for plants and insects. Aspects of Applied Biology 58, Vegetation Management in Changing Landscapes: 389-396.
MacDonald, D.W., Tattersall, F. H., Service, K. M., Firbank, L. G. & Feber, R. E. (2007) Mammals, agri-environment schemes and set-aside - what are the putative benefits? Mammal Review, 37, 259-277.
McCracken, D.I., Foster, G. N. & Kelly, A. (1995) Factors affecting the size of leatherjacket (Diptera: Tipulidae) populations in pastures in the west of Scotland. Applied Soil Ecology, 2, pp. 203-213.
McKenzie, A.J., Vickery, J.A., Leifert, C., Shotton, P.& Whittingham, M.J. (2011). Disentangling the effects of fertilisers and pesticides on winter stubble use by farmland birds. Basic and Applied Ecology 12: 80-88.
Merckx, T., Feber, R. E., Dulieu, R. L., Townsend, M. C., Parsons, M. A., Bourn, N. A. D., Riordan, P. & Macdonald, D. W. (2009a). Effect of field margins on moths depends on species mobility: field-based evidence for landscape-scale conservation. Agriculture, Ecosystems and Environment 129: 302-309.
Merckx, T., Feber, R. E., Riordan, P., Townsend, M. C., Bourn, N. A. D., Parsons, M. A. & Macdonald, D. W. (2009b). Optimizing the biodiversity gain from agri-environment schemes. Agriculture, Ecosystems and Environment 130: 177-182.
Merckx, T., Feber, R. E., Mclaughlan, C., Bourn, N. A. D., Parsons, M. A., Townsend, M. C., Riordan, P. & Macdonald, D. W. (2010). Shelter benefits less mobile moth species: the field-scale effect of hedgerow trees. Agriculture, Ecosystems and Environment 138: 147-151.
Miller, J., Chanasyk, D., Curtis, T., Entz, T. & Willms, W. (2010). Influence of streambank fencing with a cattle crossing on riparian health and water quality of the Lower Little Bow River in Southern Alberta, Canada. Agricultural Water Management, 97, 247-258.
Milsom, T. P., Langton, S. D., Parkin, C. S., Peel, S., Bishop, J. D., Hart, J. D. & Moore, N. P. (2000). Habitat models of bird species' distribution: an aid to the management of coastal grazing marshes. Journal of Applied Ecology 37: 706-727.
Milsom, T. P., Sherwood, A. J., Rose, S. C., Town, S. J. & Runham, S. R. (2004). Dynamics and management of plant communities in ditches bordering arable fenland in eastern England. Agriculture, Ecosystems and Environment 103: 85-89.
Morris, A. J., Holland, J. M., Smith, B. & Jones, N. E. (2004). Sustainable Arable Farming For an Improved Environment (SAFFIE): managing winter wheat sward structure for Skylarks Alauda arvensis. Ibis 146 (Supplement 2): 155-162.
205

Morris, A. J., Smith, B., Jones, N. E. & Cook, S. K. (2007). Chapter 4 - Experiment 1.1 - manipulate within crop agronomy to increase biodiversity: crop architecture. In: The SAFFIE Project Report, ADAS, Boxworth, UK.
Morris, M. G. (2000). The effects of structure and its dynamics on the ecology and conservation of arthropods in British grasslands. Biological Conservation 95: 129-142.
Mountford, J. O., K. H. Lakhani & F. W. Kirkham (1993). Experimental asessment of the effects of nitrogen addition under hay-cutting and aftermath grazing on the vegetation of meadows on a Somerset peat moor. Journal of Applied Ecology 30: 321-332.
Muscutt, A. D., Harris, G. L., Bailey, S. W. & Davies, D. B. (1993). Buffer zones to improve water-quality - A review of their potential use in UK agriculture. Agriculture, Ecosystems & Environment, 45, 59-77.
Natural England (1999). Veteran trees: a guide to good management. Natural England publication !N13.
Neve P, Mortimer AM & Putwain PD, (1996). Management options for the establishment of communities of rare arable weeds on set-aside land. Aspects of Applied Biology 44: 257–262.
Newell Price, P., Chambers, B., Twining, S., Lord, E. & Gooday, R. (2008). Assessing the resource protection impacts of a zero percent rate of set-aside. Final report, June 2008. ADAS. https://statistics.defra.gov.uk/esg/ace/research/pdf/ZeropercentSet_aside_%20FINAL%2026%20June%202008.pdf
Newton, I. (2004). The recent declines of farmland bird populations in Britain: an appraisal of causal factors and conservation actions. Ibis 146: 579-600.
Owens, P.N., Duzant, J. H., Deeks, L. K., Wood, G. A., Morgan, R. P. C. & Collins, A. J. (2007). Evaluation of contrasting buffer features within an agricultural landscape for reducing sediment and sediment-associated phosphorus delivery to surface waters. Soil Use and Management, 23, 165-175.
Parish, D.M.B.& Sotherton, N.W. (2004). Game crops and threatened farmland songbirds in Scotland: a step towards halting population declines? Bird Study 51: 97-106.
Parish, D.M.B. & Sotherton, N. W. (2004). Game crops as summer habitat for farmland songbirds in Scotland. Agriculture, Ecosystems & Environment, 104, 429-438.
Parish, T., Lakhani, K.H. & Sparks, T.H. (1995). Modelling the relationship between bird population variables and hedgerow, and other field margin attributes. II. Abundance of individual species and of groups of similar species. Journal of Applied Ecology 32: 362-371.
Perkins, A.J., Whittingham, M.J., Morris, A.J., & Bradbury, R.B. (2002). Use of field margins by foraging yellowhammers. Agriculture , Ecosystems and Environment, 93, 413-420.
Perkins, A.J., Maggs, H.E.& Wilson, J.D. (2008). Winter bird use of seed-rich habitats in agri-environment schemes. Agriculture, Ecosystems and Environment 126: 189-194.
Pollard, E. (1968). Hedges III. The effect of removal of the bottom flora of a hawthorn hedge on the Carabidae of the hedge bottom. Journal of Applied Ecology 5: 125-139.
Porskamp, H.A.J., Michielsen, J.M.G.P., Huijsmans, J.F.M. & Zande J.C. van de (1995). Emission-reducing pesticide application in potato growing. The effects of air-assistance, nozzle type and spray-free zone on the drift deposition outside the field. IMAG-DLO Reprt 95-19, Wageningen, The Netherlands.
Potts, G.R. (1986). The Partridge: Pesticides, Predation and Conservation. London, Collins.
Potts, S.G., Westbury, D.B., Woodcock, B.A., Ramsay, A.J., Harris, S.J., Springate, S., Pywell, R., Meek, B., Carvell, C., Hulmes, L., Warman, L., Sparks, T., Cook, S.K. & Henderson, I.G. (2007). Experiment 2 - management of the non-cropped margin structure to maximise biodiversity. In: Clarke, J.H. et al. (2007). The SAFFIE Project Report. ADAS, Boxworth, UK, pp. 268-523.
Pywell, R. F., Bullock, J. M., Hopkins, A., Walker, K. J., Sparks, T. H., Burke, M. J. W. & Peel, S. (2002). Restoration of species-rich grassland on arable land: assessing the limiting processes using a multi-site experiment. Journal of Applied Ecology 39: 294-309.
206

Pywell, R.F., Shaw, L., Meek, W., A, T., Shore, R.F., & Nowakowski, M. (2007) Do wild bird seed mixtures benefit other taxa? Aspects of Applied Biology 81, Delivering Arable Biodiversity, 69-76.
Pywell, R. F., E. A. Warman, C. Carvell, T. H. Sparks, L. V. Dicks, D. Bennett, A. Wright, C. N. R. Critchley & A. Sherwood (2005). Providing foraging resources for bumblebees in intensively farmed landscapes. Biological Conservation 121: 479-494.
Pywell, R.F., Warman, E.A., Hulmes, L., Hulmes, S., Nuttall, P., Sparks, T.H., Critchley, C.N.R. & Sherwood, A. (2006). Effectiveness of new agri-environment schemes in providing forating resources for bumblebees in intensively farmed landscapes. Biological Conservation 129: 192-206.
Pywell, R.F., Warman, E.A., Sparks, T.H., Greatorex-Davies, J.N., Walker, K.J., Meek, W.R., Carvell, C., Petit, S. & Firbank, L.G. (2004). Assessing habitat quality for butterflies on intensively managed aragle farmland. Biological Conservation 118: 313-325.
Quinton, J.N. & Catt, J. A. (2004). The effects of minimal tillage and contour cultivation on surface runoff, soil loss and crop yield in the long-term Woburn Erosion Reference Experiment on sandy soil at Woburn, England. Soil Use and Management, 20, 343-349.
Reichenberger, S., Bach, M., Skitschak, A. & Frede, H. G. (2007) Mitigation strategies to reduce pesticide inputs into ground- and surface water and their effectiveness; a review. Science of the Total Environment, 384, 1-35.
Romkens, P.F.A.M., van der Plicht, J. & Hassink, J. (1999). Soil organic matter dynamics after the conversion of arable land to pasture. Biology and Fertility of Soils, 28, 277-284.
Rowe, R.L., Street, N.R., & Taylor, G. (2009) Identifying potential environmental impacts of large-scale deployment of dedicated bioenergy crops in the UK. Renewable & Sustainable Energy Reviews, 13, 271-290.
Rushton, S.P., Luff, M.L. & Eyre, M.D. (1989). The effects of pasture improvement on the ground beetle and spider communities of upland grasslands. Journal of Applied Ecology, 26, 489-503.
Sabater, S., Butturini, A., Clement, J. C., Burt, T., Dowrick, D., Hefting, M., Maitre, V., Pinay, G., Postolache, C., Rzepecki, M. & Sabater, F. (2003). Nitrogen removal by riparian buffers along a European climatic gradient: Patterns and factors of variation. Ecosystems, 6, 20-30.
Sheldon, R., M. Bolton, et al. (2004). Conservation management of Northern Lapwing Vanellus vanellus on lowland arable farmland in the UK. Ibis 146, Supplement 2: 41-49.
Shore, R.F., Meek, W.R., Sparks, T.H., Pywell, R.F. & Nowakowski, M. (2005). Will Environmental Stewardhip enhance small mammal abundance on intensively managed farmland? Mammal Review 35: 277-284.
Siriwardena, G.M., Calbrade, N.A.& Vickery, J.A. (2008). Farmland birds and late winter food: does seed supply fail to meet demand? Ibis 150: 585-595.
Skinner, R.J. & Chambers, B.J. (1996). A survey to assess the extent of soil water erosion in lowland England and Wales. Soil Use and Management, 12, 214-220.
Smith, B., Holland, J., Jones, N., Moreby, S., Morris, A.J.& Southway, S. (2009). Enhancing invertebrate food resources for skylarks in cereal ecosystems: how useful are in-crop agri-environment scheme management options? Journal of Applied Ecology 46: 692-702.
Smith, H., Feber, R.E., Johnson, P.J., McCallum, K., Jensen, S.P., Younes, M., & Macdonald, D.W. (1993). The conservation management of arable field margins. English Nature Science Report no. 18. English Nature, Peterborough.
Smith,P., Powlson, D. S., Smith, J. U., Falloon, P. & Coleman, K. (2000) Meeting the UK's climate change commitments: options for carbon mitigation on agricultural land. Soil Use and Management 16, 1-11.
Smith, R. K., N. V. Jennings & S. Harris (2005). A quantitative analysis of the abundance and demography of European hares Lepus europaeus in relation to habitat type, intensity of agriculture and climate. Mammal Review 35: 1-24.
Smith, R. S., Corkhill, P., Shiel, R. S. & Millward, D. (1996). The conservation management of mesotrophic (meadow) grassland in Northern England 2. Effects of grazing, cutting date, fertiliser
207

and seed application on the vegetation of an agriculturally improved sward. Grass and Forage Science 51: 292-30
Sotherton, N.W. (1991). Conservation headlands: a practical combination of intensive cereal farming and conservation. The Ecology of Temperate Cereal Fields. L. G. Firbank, N. Carter, J. F. Darbyshire and G. R. Potts. Oxford, Blackwell Scientific Publications: 373-397.
Sparks, T.H., Parish, T. & Hinsley, S. (1996). Breeding birds in field boundaries in an agricultural landscape. Agriculture, Ecosystems and Environment 60: 1-8.
Spencer, J.W. & Kirby, K.J. (1992). An inventory of ancient woodland for England and Wales. Biological Conservation 62: 77-93.
Stevens, C.J., Dise, N.B., Mountford, J.O, Gowing, D.J., (2004). Impact of nitrogen deposition on the species richness of grasslands. Science 303, 1876–1879.
Stevens, D.K.& Bradbury, R.B. (2006). Effects of the Arable Stewardship Pilot Scheme on breeding birds at field and farm-scales. Agriculture, Ecosystems & Environment 112: 283-290
Still, K. (2010). Botanical evaluation and conservation of chalk grassland set-aside sites within the Kent Downs Area of Outstanding Natural Beauty. Plantlife, Salisbury.
Still, K.& Byfield, A. (2007). New priorities for arable plant conservation. Salisbury, Plantlife International.
Stoate, C. (1999). The influence of field boundary structure on breeding territory establishment of whitethroat Sylvia communis and yellowhammer Emberiza citrinella. Aspects of Applied Biology 54, Field margins and buffer zones: ecology, management and policy, 125-130.
Stoate, C., Henderson, I.G., & Parish, D.M.B. (2004). Development of an agri-environment scheme option: seed-bearing crops for farmland birds. Ibis, 146, Supplement 2, 203-209.
Stoate, C., Moreby, S.J., & Szczur, J. (1998). Breeding ecology of farmland yellowhammers Emberiza citrinella. Bird Study, 45, 109-121.
Stoate, C., Szczur, J., & Aebischer, N.J. (2003). Winter use of wild bird cover crops by passerines on farmland in northeast England. Bird Study 50: 15-21.
Tapper, S.C. & Barnes, R.F.W. (1986). Influence of farming practice on the ecology of the brown hare (Lepus europaeus). Journal of Applied Ecology, 23, 39-52.
Tew, T. (1992). Farmland hedgerows: habitat, corridors or irrelevant? A small mammal's perspective. Hedgerow Management and Nature Conservation. T. A. Watt and G. P. Buckley. Wye, Wye College Press: 80-94.
Tew, T.E. & Macdonald, D.W. (1993). The effects of harvest on arable wood mice Apodemus sylvaticus. Biological Conservation, 65, 279-283
Tew, T.E., Macdonald, D.W. and Rands, M.R.W. (1992). Herbicide application affects microhabitat use by arable wood mice (Apodemus sylvaticus). Journal of Applied Ecology 29: 532-539.
Tew, T.E., Todd, I.A. & Macdonald, D.W. (2000). Arable habitat use by wood mice (Apodemus sylvaticus). 2. Microhabitat. Journal of Zoology, 250, 305-311.
Tapper, S. C. & R. F. W. Barnes (1986). Influence of farming practice on the ecology of the brown hare (Lepus europaeus). Journal of Applied Ecology 23: 39-52.
Thomas, J. A. (1984). The conservation of butterflies in termperate countries: past efforts and lessons for the future. The biology of butterflies. P. Ackery and R. Vane-Wright. London, UK, Academic Press: 334-353.
Thomas, C.F.G. & Jepson, P.C. (1997). Field-scale effects of farming practices on linyphiid spider populations in grass and cereals. Entomologia Experimentalis Et Applicata, 84, 59-69.
Thomas, M.B., Wratten, S.D.& Sotherton, N.W. (1991). Creation of 'island' habitats in farmland to manipulate populations of beneficial arthropods: predator densities and emigration. Journal of Applied Ecology 28: 906-917.
Thomas, S.R., Goulson, D.& Holland, J.M. (2001). Resource provision for farmland gamebirds: the value of beetle banks. Annals of Applied Biology 139: 111-118.
208

Thomas, S.R., Noordhuis, R., Holland, J.M.& Goulson, D. (2002). Botanical diversity of beetle banks. effects of age and comparison with conventional arable field margins in southern UK. Agriculture, Ecosystems & Environment 93: 403-412.
The UK Biodiversity Steering Group (1995). Biodiversity: the UK Steering Group Report – Volume II: Action Plans. HMSO London.
Tooley, J. & Brust, G.E. (2002). Weed seed predation by carabid beetles. In: The ecology of carabid beetles (ed Holland, J.H.). Intercept, Andover.
Tucker, G.M., 1992. Effects of agricultural practices on field use by invertebrate-feeding birds in winter. Journal of Applied Ecology 29, 779–790.
UK Biodiversity Action Plan Steering Group (1995). Biodiversity: the UK Steering Group report, Tranche 1, Volume 2: Action Plans, pp. 243-245.
Ulen, B., Johansson, G. & Simonsson, M. (2008). Leaching of nutrients and major ions from an arable field with an unfertilized fallow as infield buffer zone. Acta Agriculturae Scandinavica Section B-Soil and Plant Science, 58, 51-59.
Uusi-Kamppa, J., Braskerud, B., Jansson, H., Syversen, N. & Uusitalo, R. (2000). Buffer zones and constructed wetlands as filters for agricultural phosphorus. Journal of Environmental Quality, 29, 151-158.
Van Dijk, P. M. & Kwaad, F. J. P. M. (1996). Runoff generation and soil erosion in small agricultural catchments with loess-derived soils. Hydrological Processes 10, 1049-1059.
Vaughan, N., E.-A. Lucas, S. Harris & P. C. L. White (2003). Habitat associations of European hares Lepus europaeus in England and Wales: implications for farmland management. Journal of Applied Ecology 40: 163-175.
Vickery, J.A., Atkinson, P.W., Marshall, J.M., West, T., Norris, K., Robinson, L.J., Gillings, S., Wilson, A. and Kirby, W. (2005) The effects of Different Crop Stubbles and Straw Disposal Methods on Wintering Birds and Arable Plants. BTO Research Report 402. BTO, Thetford.
Vickery, J.A., Carter, N. & Fuller, R.J. (2002). The potential value of managed cereal field margins as foraging habitats for farmland birds in the UK. Agriculture, Ecosystems and Environment, 89, 41-52.
Vickery, J. A., J. R. Tallowin, R. E. Feber, E. J. Asteraki, P. J. Atkinson, R. J. Fuller & V. K. Brown (2001). The management of lowland neutral grasslands in Britain: effects of agricultural practices on birds and their food resources. Journal of Applied Ecology 38: 647-664.
Wakeham-Dawson, A., Szoszkiewicz, K., Stern, K.& Aebischer, N.J. (1998). Breeding skylarks Alauda arvensis on Environmentally Sensitive Area arable reversion grass in southern England: survey-based and experimental determination of density. Journal of Applied Ecology 35: 635-648.
Walker, K.J., Critchley, C.N.R., Sherwood, A.J., Large, R., Nuttall, P., Hulmes, S., Rose, R.& Mountford, J.O. (2007). The conservation of arable plants on cereal field margins: an assessment of new agri-environment scheme options in England, UK. Biological Conservation 136: 260-270.
Watts,C.W., Clark, L. J., Chamen, W. C. T. & Whitmore, A. P. (2005) Adverse effects of simulated harvesting of short-rotation willow and poplar coppice on vertical pressures and rut depths. Soil & Tillage Research 84, 192-199.
Wilson, J.D., Evans, J., Browne, S. J. & King, J. R. (1997). Territory distribution and breeding success of skylarks Alauda arvensis on organic and intensive farmland in southern England. Journal of Applied Ecology, 34, 1462-1478.
Wilson, J.D., Morris, A. J., Arroyo, B. E., Clark, S. C. & Bradbury, R. B. (1999). A review of the abundance and diversity of invertebrate and plant foods of granivorous birds in northern Europe in relation to agricultural change. Agriculture, Ecosystems and Environment, 75, pp. 13-30.
Whittingham, M. J. & K. L. Evans (2004). The effects of habitat structure on predation risk of birds in agricultural landscapes. Ibis 146, Supplement 2: 210-220.
Whittingham, M. J., C. L. Devereux, A. D. Evans & R. B. Bradbury (2006). Altering perceived predation risk and food availability: management prescriptions to benefit farmland birds on stubble fields. Journal of Applied Ecology 43: 640-650.
209

Wilson, P.J.& Aebischer, N.J. (1995). The distribution of dicotyledonous arable weeds in relation to distance from the field edge. Journal of Applied Ecology 32: 295-310.
Woodcock, B.A., Westbury, D. B., Potts, S. G., Harris, S. J. & Brown, V. K. (2005). Establishing field margins to promote beetle conservation in arable farms. Agriculture, Ecosystems & Environment, 107, 255-266.
Woiwod, I. P. & A. J. A. Stewart (1990). Butterflies and moths - migration in the agricultural environment. Species dispersal in agricultural habitats. R. G. H. Bruce and D. C. Howard. London, UK, Belhaven Press: 189-202.
Zande, J. C. van de, Porskamp, H. A. J., Michielsen, J. M. G. P., Stallinga, H., Holterman, H. J., Jong, A. D. & Huijsmans, J. F. M. (2001) Drift measurements in the Netherlands as a basis for drift control strategies. http://www.iac.sp.gov.br/Centros/centro%20de%20engenharia%20e%20automa%C3%A7%C3%A3o/sintag/AVandezande.pdf
210

GROUPINGS OF ES & CFE OPTIONS
Options introduced in 2009 and 2010 are in italics.
Option groups Environmental
Stewardship option code CFE equivalents
ELS OELS HLS Hedgerows Hedgerow management (on both sides of hedge) EB1 OB1 Hedgerow management (on one side of hedge) EB2 OB2 Enhanced hedgerow management EB3 OB3 Hedgerows of very high environmental value (both sides) HB11
Hedgerows of very high environmental value (one side) HB12
Stone-faced hedgebanks Stone-faced hedgebank management on both sides EB4 OB4 Stone-faced hedgebank management on one side EB5 OB5 Ditches Ditch management EB6 OB6 Half ditch management EB7 OB7 Ditches of very high environmental value HB14 Hedges and ditches combined Combined hedge and ditch management (incorp. EB1 or EB2) EB8 OB8
Combined hedge and ditch management (incorporating EB2) EB9 OB9
Combined hedge and ditch management (incorporating EB3)
EB10 OB10
Stone walls Stone wall protection and maintenance EB1
1 OB11
Earth banks
Earth bank management on both sides EB12 OB12
Earth bank management on one side E B13 EB12
In-field trees Protection of in-field trees on arable/rotational land EC1 OC1 Ancient trees in arable fields HC5 Hedgerow trees
Establishment of hedgerow trees by tagging EC23 OC23
Hedgerow tree buffer strips on cultivated/rotational land
EC24 OC24
Woodland edges & fences Maintenance of woodland fences EC3 OC3 Management of woodland edges EC4 OC4 Scrub & SRC Maintenance, restoration or creation of successional areas and scrub HC15,
16, 17
Optional scrub management C3b Enhanced management of short rotation coppice C15 Archaeology under cultivated soils
211

Option groups Environmental
Stewardship option code CFE equivalents
ELS OELS HLS Reduce cultivation depth on land where there are archaeological features ED3 OD3
Crop establishment by direct drilling (non-rotational) HD6 Buffer strips 2 m buffer strips on cultivated/rotational land EE1 OE1 4 m buffer strips on cultivated/rotational land EE2 OE2 6 m buffer strips on cultivated/rotational land EE3 OE3 Floristically enhanced grass margin HE10 Buffering in-field ponds in arable/rotational land EE8 OE8 Sown wildflower headlands C13 6m buffer strips on cultivated/rotational land next to a watercourse EE9 OE9
12m buffer strips for watercourses on cultivated/rotational land EJ9 OJ9
Grass buffers alongside temporary and permanent watercourses C1
Field corners Field corner management in arable fields EF1 OF1 Beetle banks Beetle banks EF7 OF7 Seed mixtures sown for birds or insects Wild bird seed mixture EF2 OF2 C9 Enhanced wild bird seed mix plots (rotational or non-rotational) HF12
Game strips C10 Pollen and nectar flower mixture EF4 OF4 Pollen and nectar mixtures for arable or grassland areas C12a
Optional management for horticultural growers C12b Fallow plots for ground nesting birds Skylark plots EF8 OF8 C4 Uncropped cultivated areas for ground-nesting birds on arable land
EF13 OF13 C5
Uncropped cultivated margins/plots for arable flora
6m uncropped, cultivated margins on arable land EF11 OF11
Cultivated fallow plots or margins for arable flora (rotational or non-rotational) HF20
Uncropped, cultivated margins C8 Conservation headlands Unfertilised cereal headlands EF9
Unharvested cereal headlands EF10 HF14
GWCT unharvested haedlands C11 Cropping options with/without stubbles Reduced herbicide cereal crops followed by overwintered stubble
EF15
Selective use of spring herbicides C14 Low input spring cereal to retain or re-create an arable mosaic HG7
212

213
Option groups Environmental
Stewardship option code CFE equivalents
ELS OELS HLS Under sown spring cereals EG1 OG1 Over-wintered stubbles EF6 OF6 C7a
Extended overwintered stubble EF22
Overwintered stubbles followed by spring/summer fallow C6
Cereals for whole crop silage followed by over-wintered stubbles EG4 OG4
Brassica fodder crops followed by overwintered stubbles EG5 OG5 HG5
Fodder crop management to retain or recreate an arable mosaic HG6
Maize crops and resource protection Management of maize crops to reduce soil erosion EJ2 OJ2 Enhanced management of maize crops to reduce soil erosion and run-off
EJ10
Winter cover crops
Winter cover crops EJ13 OJ13 C7b
Arable to grassland Arable reversion to unfertilised grassland to prevent erosion or run-off HJ3
Arable reversion to grassland with low fertiliser input to prevent erosion or run-off HJ4
Reverted arable areas C3a Infield grass areas to prevent erosion or runoff EJ5 Grass areas to prevent erosion and runoff C2 Basic payment for organic management Basic payment for organic management OU1