Factors Predicting Exercise Behavior of Graduate Students
202
University of North Dakota University of North Dakota UND Scholarly Commons UND Scholarly Commons Theses and Dissertations Theses, Dissertations, and Senior Projects 8-2011 Factors Predicting Exercise Behavior of Graduate Students Factors Predicting Exercise Behavior of Graduate Students Bibha Gautam Follow this and additional works at: https://commons.und.edu/theses Part of the Psychiatric and Mental Health Nursing Commons Recommended Citation Recommended Citation Gautam, Bibha, "Factors Predicting Exercise Behavior of Graduate Students" (2011). Theses and Dissertations. 3351. https://commons.und.edu/theses/3351 This Dissertation is brought to you for free and open access by the Theses, Dissertations, and Senior Projects at UND Scholarly Commons. It has been accepted for inclusion in Theses and Dissertations by an authorized administrator of UND Scholarly Commons. For more information, please contact [email protected].
-
Upload
khangminh22 -
Category
Documents
-
view
0 -
download
0
Transcript of Factors Predicting Exercise Behavior of Graduate Students

University of North Dakota University of North Dakota
UND Scholarly Commons UND Scholarly Commons
Theses and Dissertations Theses, Dissertations, and Senior Projects
8-2011
Factors Predicting Exercise Behavior of Graduate Students Factors Predicting Exercise Behavior of Graduate Students
Bibha Gautam
Follow this and additional works at: https://commons.und.edu/theses
Part of the Psychiatric and Mental Health Nursing Commons
Recommended Citation Recommended Citation Gautam, Bibha, "Factors Predicting Exercise Behavior of Graduate Students" (2011). Theses and Dissertations. 3351. https://commons.und.edu/theses/3351
This Dissertation is brought to you for free and open access by the Theses, Dissertations, and Senior Projects at UND Scholarly Commons. It has been accepted for inclusion in Theses and Dissertations by an authorized administrator of UND Scholarly Commons. For more information, please contact [email protected].

FACTORS PREDICTING EXERCISE BEHAVIOR OF GRADUATE STUDENTS
by
Bibha Gautam
Bachelor of Education, Tribhuvan University, 1997 Bachelor of Science in Nursing, Tribhuvan University, 2003
A Dissertation
Submitted to the Graduate Faculty
ofthe
University of North Dakota
in partial fulfillment of the requirements
for the degree of
Doctor of Philosophy
Grand Forks, North Dakota August 2011

Copyright 2011
by Bibha Gautam
11

This dissertation, submitted by Bib ha Gautam in partial fulfillment of the requirements for the Degree of Doctor of Philosophy from the University of North Dakota, has been read by the Faculty Advisory Committee under whom the work has been done and is hereby approved.
Chairperson
fk:!a~ W=,t6'
£1:;, L, ~ Gv,J ftr~ f~
Member At-Large
This dissertation meets the standards for appearance, conforms to the style and format requirements of the Graduate Schools of the University ofNorth Dakota, and is hereby approved.
Date
lll

PERMISSION
Title Factors Predicting Exercise Behavior of Graduate Students
Department Nursing
Degree Doctor of Philosophy
In presenting this dissertation in partial fulfillment of the requirements for a Graduate degree from the University of North Dakota, I agree that the library of this university shall make it freely available for inspection. I further agree that permission for extensive copying for scholarly purposes may be granted by the professor who supervised my dissertation work, or in her absence, by the chairperson of the department or the dean of the Graduate School. It is understood that any copying or publication or other use of this dissertation or part of thereof for financial gain shall not be allowed without my written permission. It is also understood that due recognition shall be given to me and to the University of North Dakota in any scholarly use which may be made of any material in my dissertation.
IV
Signature
Date

TABLE OF CONTENTS
LIST OF FIGURES ............................................................................................................. x
LIST OF TABLES ............................................................................................................. xi
ACKNOWLEDGEMENTS ............................................................................................. xiv
ABSTRACT ..................................................................................................................... xvi
CHAPTER
I INTRODUCTION ...................................................................................... 1
Statement of the Problem ................................................................. 3
Study Purpose .................................................................................. 6
Theoretical Framework .................................................................... 6
Research Questions and Hypotheses ............................................... 7
Conceptual Definitions .................................................................... 9
Summary ........................................................................................ 15
II. REVIEWOFLITERATURE ................................................................... 17
Current Burden of Cardiovascular Diseases .................................. 17
Status of Cardiovascular Disease Risk among Young People ....... 19
General Risk Factors for Cardiovascular Diseases ........................ 22
Psychological Stress, Anxiety, and Depression as Risk Factors for CVD ............................................................................. 24
Psychological Stress within the Graduate Student Population ...... 27
Physical Activity and Cardiovascular Diseases ............................. 32
V

Student Populations and Physical Inactivity .................................. 34
Motivating and Demotivating Factors for Exercise and PA .......... 39
Exercise Related Self-efficacy ...................................................... .45
Summary of the Literature Review ............................................... .48
Theoretical Framework ................................................................. .48
Health Promotion Model.. ................................................. .49
Theory of Self-efficacy ..................................................... .51
Reciprocal Causation or Determinism ...................... 52
Self-efficacy .............................................................. 53
Combining Theories Together within the Study ............................ 55
III. METHODOLOGY .................................................................................... 57
Research Design ............................................................................. 57
Sampling ........................................................................................ 57
Setting/Target Population .................................................. 57
Sampling Method ............................................................... 57
Sample Size Deterermination ............................................ 58
Instrumentation .............................................................................. 59
Measures of Cardiovascular Disease Knowledge .......................... 62
Measures of Personal Health Behavior.. ........................................ 63
Smoking Behavior ............................................................. 63
Alcohol Consumption Behavior ........................................ 63
Sleeping Behavior .............................................................. 64
Consumption of Fruits and Vegetables .............................. 64
VI

Measures of Physical Activity and Exercise .................................. 65
Measures of Exercise Related Self-Efficacy .................................. 66
Measures of Motivating and De-motivating Factors ..................... 69
Personal/Demographic Information .............................................. 74
Procedure ....................................................................................... 7 4
Data Collection .................................................................. 74
Data Analysis ..................................................................... 75
Handling of Non Normally Distributed Data ..................... 76
Protection of Human Subjects ........................................... 79
Summary ........................................................................................ 79
IV. RESULTS .................................................................................................. 81
Description of Study Population Based on Socio-Demographic Independent Variables ................................................................... 81
Personal Health Behavior of the Participants ................................ 82
Physical Activity and Exercise .......................................... 84
Height, Weight, and Body Mass Index .............................. 87
Sleep and Rest .................................................................... 88
Smoking and Drinking Behavior.. ..................................... 89
Fruits and Vegetable Intake ............................................... 89
Results Related to Study Questions and Hypotheses .................... 90
Research Question 1 .......................................................... 90
Research Question 2 .......................................................... 96
Research Question 3 .......................................................... 97
Research Question 4 ........................................................ IO I
Vil

Research Question 5 ....................................................... .I 04
Research Question 6 ........................................................ 106
Research Question 7 ........................................................ 108
Research Question 8 ........................................................ 110
Research Question 9 ....................................................... .111
Summary .................................................................................... 113
V. DISCUSSION AND CONCLUSIONS .................................................. 115
Discussion of the Results/Findings ............................................ .115
Students' Self Reported Knowledge about CVD, CVD Risk Factors, and Prevention Practices .................. 115
Students' Personal Health Behavior and Body Mass Index (BMI) .................................................................... 117
Students' Perceived Motivating and De-Motivating Factors for Exercise and Physical Activity ..................... .124
Task, Coping, and Scheduling Self-Efficacy Related to Exercise and PA Perceived by the Students .................... 126
Predictors of Exercise Behaviors among the Graduate Student Population ........................................................... 128
Discussion of Theoretical Underpinnings .................................... 129
Limitations of the Study ............................................................... 13 l
Implications for Nursing Practice ................................................ 133
Recommendations for Future Nursing Research ......................... 134
APPENDICES ................................................................................................................. 137
A. University of North Dakota IRB Approval Letter ................................. 138
B. Survey Questionnaire .......................................................................... 141
vm

IC. Permission to Use Exercise Benefits and Barriers Scale ....................... 158
D. Permission to Use Multidimensional Self-efficacy Scale ...................... .159
REFERENCES ................................................................................................................... 160
IX

LIST OF FIGURES
Figure Page
1. Schematic Representation of Pender' s HPM ......................................................... 50
2. Reciprocal Determinism in Self-Efficacy .............................................................. 52
3. Schematic Representation of Theoretical Framework. ......................................... 56
4. Student Engagement in Physical Activity by IPAQ Categories ............................ 86
5. Gender Based Differences in Body Mass Index Categories .................................. 88
6. Students' Current Smoking Status ......................................................................... 89
7. Students' Current Alcohol Drinking Status ........................................................... 90
8. Differences in Percentage of Correct Responses Identified for Knowledge about Cardiovascular Disease Conditions ......................................... 94
9. Differences in Percentage of Correct Responses Identified for Knowledge about Cardiovascular Diseases Risk Factors ...................................... 95
10. Differences in Percentage of Correct Responses Identified for Knowledge about Cardiovascular Diseases Prevention Strategies ........................ 95
11. Percentages of Self Cardiovascular Diseases Risk Perception among All Participants ...................................................................................................... 96

LIST OF TABLES
Table Page
1. The Study Variables, Tools, Methods and Levels ofMeasurement.. .................... 60
2. Reliability oflnternational Physical Activity Questionnaire (IPAQ): Spearman's Correlation Coefficient based on Total MET-Minute per Week ....... 67
3. Eigenvalues and the Proportion of the Total Variance for the Multidimensional Self-efficacy Scale (9 items): Principal Components Analysis with V arimax Rotation ............................................................................ 68
4. Factor Loadings and Communalities for the Multidimensional Self-efficacy Scale (9 items): Principal Components Analysis with Varimax.Rotation ............ 69
5. Eigenvalues and the Proportion of the Total Variance Explained Derived from Principal Components Analysis of the Exercise Benefits Scale (29 items) ........... 71
6. Factor Loadings and Communalities Based on a Principal Components Analysis with V arimax Rotation for the Exercise Benefits Subscale (29 Items) .............................................................................................................. 72
7. Eigenvalues and the Proportion of the Total Variance Explained: Principal Components Analysis of Exercise Barriers Scale (14 items) ............... 73
8. Factor Loadings and Communalities for the Exercise Barriers Subscale (14 items): Principal Components Analysis with V arimax Rotation ..................... 73
9. Binary Coding Method used to Create Proxy Variables for Ethnicity .................. 78
10. Binary Coding Method used to Create Proxy Variables for Broader Study Area, Task Self-Efficacy, and Age ....................................................................... 78
11. Description of the Participants Based on Gender, Ethnicity, and Level of Study ........................................................................................................ 83
12. Description of the Participants Based on Academic Area, Marital Status, Employment Status, and Annual Household Income ................................ 83
XI
I,
I

13. Mean Scores and Standard Deviations for Days and Minutes of Self Reported VPA, MPA, and Walking ....................................................................... 85
14. Reported Days of Engagement in VPA, MPA and Walking Past 7 Days ............. 86
15. Student Engagement in PA by IPAQ Categories (VPA, MPA and Walking ........ 86
16. Calculated Body Mass Index (BM!) ...................................................................... 88
17. Personal Health Behavior (Smoking, Alcohol Consumption, and Sleep and Rest) ............................................................................................................... 90
18. Personal Health Behavior (Fruits, Vegetable Intake, and Physical Activity) ................................................................................................................. 91
19. Mean CVD knowledge Score for Entire Sample ................................................... 92
20. Percentages of Correct Response for Knowledge about Various CVDs ............... 93
21. Percentages of Correct Response for Knowledge about CVD Risk Factors ......... 93
22. Percentages of Correct Response for Knowledge about CVD Prevention Strategies ............................................................................................ 94
23. Result of Bivariate Regression Analysis Showing Correlation between CVD Knowledge and Physical Activity .......................................................................... 97
24. Results from Multiple Regression Analysis: Socio-Demographic Variables and CVD Knowledge ............................................................................. 98
25. Mean Differences in the Reported MET-Min per week Based on Socio-Demographic Variables ............................................................................... 99
26. Relationship between Students' Total Physical Activity Level and Socio-Demographic Variables: Multiple Regression Analysis ........................... 100
27. Motivating and De-Motivating Subscales for Exercise and PA: Means and Standard Deviations ............................................................................................. 102
28. Ten Most Frequently Reported Benefits for Physical Activity by Graduate Students ................................................................................................ 103
29. Top Four De-Motivating Factors for Physical Activity Reported by Students ... 104
30. Descriptive Statistics of Self-Efficacy Sub Scales: Mean Scores ........................ 105
XII

31. Comparison of Scores on Coping, Task, and Scheduling Self-Efficacy: Chi-Square for Goodness ofFit.. .................................................. 106
32. Motivators for Exercise and Three Types of Self-Efficacy: Zero Order and Partial Correlations after Controlling for Socio-Demographic Variables .......... .108
33. Relationship between Total PA and Exercise Benefits and Barriers Scores: Multivariate Regression .......................................................................... 109
34. Motivating Factors as Predictors of Total PA: Multivariate Regression Analysis ................................................................................................................ 109
35. De-motivating Factors as Predictors of Total PA: Multivariate Regression Analysis ................................................................................................................ 110
36. Three Types of Self-Efficacy as Predictors of Total PA: Multivariate Regression Analysis ...................................................................... 111
37. Socio-Demographic Variables, Motivating and De-Motivating Factors, and Task, Coping and Scheduling Self-Efficacy as Predictors of Total PA Level: Hierarchical Regression Analysis ............................................................. 114
Xlll

ACKNOWLEDGEMENTS
The experience of pursuing the dream of my life has been challenging but
rewarding. This pursuit of my dream would not have become a reality without the
tremendous support from several people involved in my personal and academic life.
First, my deepest gratitude is for my dissertation chair, Professor Bette Ide.
Without her support, my dissertation could not have been a reality. She was extremely
knowledgeable and very generous with her time and effort to make this dream come true.
Dr. lde's willingness, patience, and constant support helped me to overcome many
challenging situations while finishing my graduate studies. My genuine thanks go to my
dissertation committee members, Professor Chandice Covington, Professor Donna
Morris, Professor Darla Adams, and Professor Thomas Petros for sharing their expert
knowledge and being excellent at what they do.
A heartfelt appreciation goes to Dr. Chandice Covington for her guidance,
understanding, patience, friendship, and mentorship. Her mentorship was paramount in
providing me concrete experience for achieving long-term career goals. She encouraged
me to grow as an individual, a nurse, a faculty, a scholar, and a nurse researcher. Very
few graduate students are fortunate to have a "mentor-for-lifetime" like Dr. Covington
who is capable of making difference in a student's life.
Next, I am very grateful to all the graduate students who participated in this
research, without their cooperation, I could not have finished this work. I would also like
XIV

to acknowledge the University of North Dakota and College of Nursing for providing me
this opportunity to fulfill my dream under the UND name. Likewise, many friends and
faculty members at UND College of Nursing have helped me stay calm through these
difficult years. Their caring support helped me overcome setbacks and stay focused on
the task. I deeply appreciate their belief in me.
I am also grateful to Texas Tech University Health Sciences Center, School of
Nursing for providing me a home needed to realize an important goal of my life. Thank
you to all faculty and staff members for cheering me up. Special thanks go to "Rosie,"
our night time housekeeper who never forgot to ask me "are you almost done?" I always
said yes I am almost done. But now I am completely done. Thank you!!
Last but not the least; I would like to express my heartfelt gratitude to my beloved
husband, Surendra Gautam. His support, encouragement, patience, and unwavering love
have been the constant sources of strength for me all these years. I would like to give
appreciation to my two beautiful children-son Kshitiz and daughter Kritika-for their
presence, patience, and unconditional loves that kept me focused on the right track. All of
my family did a great job supporting me with hugs and words of encouragement. Thank
you!! We did it!!
xv

DEDICATION
I would like to dedicate this dissertation to the following members of my family
especially to my ........ .
Husband Surendra Gautam
Father Bishnu Prasad Joshi
Mother Narayani Joshi
Father-in-law Yuvraj Sharma Gautam
Late mother-in-law Shova Gautam
I 1,
f
I I I

ABSTRACT
Graduate school is often experienced as a time of increased demands/expectations
resulting in heightened levels of stress due to academic work, family responsibilities, job
demands, financial pressure, and other life related issues. Besides stress, graduate school
also brings about significant physical inactivity due to the shift of the immediate priority
to academic accomplishment. Reports of increasing prevalence of cardiovascular disease
(CVD) risk factors among students highlight that this group may have particular risk not
well-identified. Yet, relative risk can be reduced by lifestyle modifications, such as eating
well, exercising, and stress reduction. The majority of the risk factors, to a great extent,
can be controlled by recommended amounts of exercise and physical activity (PA) alone.
This descriptive, correlational study addressed nine research questions dedicated
to exploring students' existing CVD knowledgebase, determining their engagement in
PA, identifying the motivating and de-motivating factors for exercise, and examining the
levels of coping, task, and scheduling self-efficacy. Pender's Health Promotion Model
(HPM) along with Bandura's Social Cognitive Theory (SCT) guided this study. A sample
of349 full time graduate students with mean age of29.5 ± 8.36 completed an
electronically delivered survey. Data collection instruments that were included in this 6-
part survey included the following: CVD knowledge, personal health behavior,
International Physical Activity Questionnaire (IP AQ) Exercise Benefits and Barriers
Scale (EBBS), and Multidimensional Self-efficacy Scale (MSES). The contributions of
socio-demographic variables to the prediction of PA were also explored.
II 'I

The students had moderately high to very high levels of CVD knowledge.
According to the IP AQ, 11.2% were highly active (> 1500 MET-min/week), 67% were
moderately active ( 600-1500 MET-min/week), and 21.8% were inactive ( < 600 MET
min/week). Students were more highly motivated than de-motivated to engage in PA.
Physical performance, life enhancement, psychological outlook, and preventive health
were prominent motivators for PA. Physical exertion and time expenditure were relative
de-motivators. Level of study(~= -.134, p= .002) and marital status(~= -.171, p= .000),
exercise motivation(~= .133, p= .010), coping self-efficacy(~= .181, p= .001), and
scheduling efficacy W= .347, p= .000) were significant predictors of PA behavior.
The two theoretical models, SCT and HPM, were supported as explanations of PA
behavior. PA is an essential component of a healthy life-style. Exercise motivation and
self-efficacy are integrally connected with students' PA. Integrating wellness as part of
the university's mission may enhance the campus climate, making it more conducive to
engagement in PA by students.
XVII

CHAPTER I
INTRODUCTION
Graduate school is often experienced as a time of increased demands and
expectations resulting in a heightened level of stress due to academic work, family
responsibilities, job demands, financial pressure, and other life-related issues (Toews et
al., 1997). In addition to stress, graduate school also causes significant physical inactivity
due to the shift in the student's immediate priority to academic accomplishment. While
exercise and physical activity (PA) remain major cardiovascular disease (CVD)
prevention strategies, many studies have reported that student populations (graduate and
undergraduate) do not engage in adequate PA (Douglas et al., 1997).
In the face of rapidly rising obesity (30% among young adults between the ages of20 and
39 years; Ogden et al., 2006), Blair (2009) considers physical inactivity to be one of the
most important public health problems of the 21st century. In the United States (US),
physical inactivity is challenging tobacco use as the leading indirect cause of death
(Mokdad, Marks, Stroup, & Gerberding, 2004). Most adults in the US do not engage in
the recommended amount of PA (National Center for Health Statistics (NCHS), 2007). In
addition, there is strong epidemiological evidence that links increased psychological
stress and increased inactivity to the development of CVD. Yet exercise in terms of
moderate PA remains one of the most effective strategies to prevent chronic conditions
such as CVD, type 2 diabetes, cancer, and mental illness. Furthermore, exercise is

consistently associated with positive mood by increasing feelings of vigor and reducing
tension, fatigue, and confusion (Puetz, O'Connor, & Dishman, 2006). Due to the
important role of exercise in disease prevention, the US Department of Health and
Human Services released updated physical activity guidelines in 2008. The guidelines
recommend that all adults should engage in at least 150 minutes a week (30 minutes, 5
days a week) of moderate intensity or a minimum of75 minutes a week (25 minutes, 3
days a week) of vigorous-intensity aerobic PA for substantial health benefits. The amount
of PA should be increased to 300 minutes of moderate activity or 150 minutes of
vigorous activity per week to obtain more extensive health benefits (US Department of
Health and Human Services (USDHHS), 2008). The guidelines assure the public that the
recommended amount of PA can be achieved by engaging in moderate-intensity,
vigorous-intensity, or combinations of moderate-vigorous-intensity PA.
Various motivational theorists agree that exercise and other health-related
behaviors are motivational constructs that may vary among individuals based on
personal, social, and other demographic characteristics. These motivational constructs
could be influenced internally or externally and/or positively or negatively. Positive
motivation leads an individual to engage in healthy behavior while negative motivation
could serve as a demotivating factor preventing an individual from engaging in exercise
and physical activities. Qualitative and quantitative studies have frequently reported lack
of time, lack of self-efficacy, lack of social support, and lack of energy as the most
commonly reported demotivating factors for exercise and activity by the young student
population. Socialization and health benefits are the most frequently cited motivators for
exercise (Daskapan, Tuzun, & Eker, 2006).
2

From a health and well-being perspective, graduate students have been widely
studied for their mental well-being in the face of the amount of stress they have, but no
studies were readily located that have reported the prevalence of CVD among young,
educated adults such as graduate students. As the prevalence of CVD in the general
population is increasing, the high prevalence of CVD risk factors among student
populations-when combined with data about their negative personal health habits and
increased levels of stress-suggests that they may also have increased susceptibility to
CVD (Rozanski & Kubzansky, 2005; American College Health Association (ACHA),
2010). This makes it imperative to explore graduate students' existing CVD knowledge
base, determine how much of this knowledge is translated into everyday exercise
practices, and identify the motivating and demotivating factors that either help or prevent
them from engaging in recommended levels of exercise and physical activity.
Statement of the Problem
Currently in the US, more than 81 million people are living with some type of
CVD (American Heart Association (AHA), 2010). According to Center for Disease
Control and Prevention (CDC) statistics, one in every three Americans has one or more
type of CVD (Thom et al., 2006). Increasing prevalence of CVD among young adults is
reported and has now become a major public health concern requiring immediate
attention (Lenfant, 2001). Even though genetics account for 20% of the risk ofCVD
(Evans et al., 2003), the risk for CVD is multifactorial. Commonly reported risk factors
for CVD are tobacco use, increased cholesterol, elevated blood pressure, physical
inactivity, obesity, and diabetes. These behavioral risk factors account for about 80% of
all CVD (World Health Organization (WHO), 2009). Psychological stress and anxiety,
3

also additional risk factors, are known to increase the risk of CVD by increasing the
level of cortisol in the body. Chronic negative stressors increased over time may show
heightened cardiovascular reactivity that puts people at risk for subclinical
atherosclerosis (Low, Salomon, & Matthews, 2009).
Ample evidence exists that the relative risk of CVD can be reduced by lifestyle
modifications such as eating well, exercising, and stress reduction. More specifically,
the majority of CVD risk factors, to a great extent, are controlled by exercise and
activities alone, if carried out as recommended. Despite the strong evidence, a
significant proportion of US adults remains sedentary (Spiegel & Alving, 2005); this
may be reflected in the fact that less than one third of Americans meet the minimal
recommendations for activity as suggested by the CDC, ACSM, and an AHA expert
panel (Myers, 2003). During 2003-2004, it was assessed that 66.3% of adults above the
age of 20, 57.1 % between the ages of 20 to 39, 73.1 % between the ages of 40 to 59
years, and 71 % of people older than 60 years were overweight or obese based on body
mass index (BMI) criteria (Hedley et al., 2004).
It is believed that "Generally, younger, wealthier, better educated individuals
under low level of stress and high levels of social support are more likely to practice
health-enhancing behavior such as exercising, eating well, and avoiding smoking, and
higher level of stress and lower number of resources is associated with health
compromising behaviors" (Adler & Matthews, 1994). Studies have consistently indicated
that the prevalence of several major CVD risk factors such as hypertension, total
cholesterol, obesity, and smoking rates have been increasing among young adults such as
students emolled in universities (Hajjar & Kotchen, 2003; Ford, Mokdad, & Giles, 2005).
4

Further, it has been argued that knowledge is the prerequisite for an individual to
possess positive attitudes toward implementing certain health-related behavior such as
eating well, exercising, and being active (Homko et al., 2008; Jafary et al., 2005; Khan et
al., 2006). Further, CVD knowledge refers to a basic understanding of the disease process,
signs and symptoms, risk factors, and their preventive practices. Among CVD preventive
practices are regular exercise, being active, smoking cessation, eating well, regular
physical checkups, regular screenings for blood pressure and cholesterol, management of
diabetes, drinking alcohol in moderation, adequate sleep, and stress reduction. A limited
number of studies have examined the knowledge of college students regarding CVD-risk
and -prevention practices. Of those, results are varied (Makrides, Veino!, Richard,
McKee, & Gallivan, 1998; Almas, Hameed, & Sultan, 2008; Engler, Engler, Davidson &
Slaughter, 1992; McFall, Nonneman, Rogers, & Mukerji, 2009; Collins, Dantico,
Shearer, & Mossman, 2004). While knowledge is an important factor in motivating
individuals toward healthful behavior, other factors need to be taken into consideration.
In population-based studies, knowledge factor (Van Der Horst, Paw, Twisk, & Van
Machelen, 2007), time factors, social support, exercise self-efficacy, priorities, weather
conditions, family commitments, and job-related commitments (Booth, Bauman, Owen,
& Gore, 1997; Salmon, Owen, Crawford, & Bauman, 2003; Rhodes & de Bruijn, 2010)
are found to be the factors that either motivate or demotivate individuals to engage in
physical activity and exercise.
Exercise and moderate physical activity, at recommended levels, could serve as
the means to reduce the risk of coronary artery disease, stroke, type 2 diabetes, colon
cancer, and breast cancer (USDHHS, 2008). Regular physical activity and exercise also
5

render benefits beyond physical health by reducing mental stress and increasing an
overall sense of well-being (Penedo & Dahn, 2005). Activity and exercise also provide
cognitive benefits, including increased brain functioning (Sparling, Giuffrida, Piomelli,
Rosskopf, & Dietrich, 2003 ). Unfortunately, numerous studies have found that students
(graduate and undergraduate) do not engage in activity and exercise due to a number of
reasons such as lack of time, too much stress, competing demands, and financial
constraints. One could consider these issues as de-motivating factors that prohibit
students from exercising and being active. It is believed that a better understanding of
graduate students' current level of CVD knowledge, the degree to which they engage in
exercise and activity for CVD prevention, and the factors that motivate or de-motivate
exercise and activity will provide the basis for new and more effective health-promotion
activities for these students on US campuses.
Study Purpose
The purpose of this study was to examine the relationships between graduate
students' self-reported knowledge about CVDs and their prevention practices, the degree
to which the students engage in physical activity, socio-demographic and discipline
related factors, and motivating and de-motivating factors for exercise.
Theoretical Framework
Theory is a "conceptualization of the phenomenon of interest" (Kazdin, 2003, p.
124) that serves as a framework and guides the interpretation of relationships among
study variables. Kazdin states that the goal of research is to "understand" a process and
that theory provides the underpinnings necessary to bring together "multiple variables
and processes" (Kazdin, 2003, p. 129). Albert Bandura's Social Cognitive Theory along
6

with Nola Pender' s Health Promotion Model (HPM) provide the organizing framework
for this study. These two well-established theories are well suited for explaining
motivating and de-motivating factors because they are linked to an individual's
perception of self-efficacy. In tum, self-efficacy is highly associated with health
promoting behavior such as exercise and PA (McAuley & Mihalko, 1998; Sallis et al.,
1986). The HPM depicts the multidimensional nature and interaction of interpersonal,
intrapersonal, and physical environments as an individual pursuing health and adopting
health-promoting behavior such as PA and exercise (Pender, Murdaugh, & Parsons,
2005). Likewise, Self-efficacy Theory maintains that individuals with a high level of self
efficacy or confidence in their ability to perform a given task will be more likely to
engage in that task (Bandura, 1977).
Research Questions and Hypotheses
The following research questions and associated hypothesis guided this investigation:
Research Question l: What is the reported knowledge level of CVDs, CVD risk factors,
and CVD-prevention strategies among graduate students?
HI: There will be a moderate amount of knowledge concerning various CVDs, CVD risk
factors, and CVD-prevention strategies.
Research Question 2: How much CVD knowledge is translated into actual CVD
prevention practices in terms of physical activity?
H2: There will be no relationship between knowledge of CVD and engagement in CVD
prevention practices.
7

Research Question 3: What differences in students' CVD knowledge and physical
activity behavior exist according to socio-demographic factors and academic area of
studies?
H3: There will be no difference in knowledge about CVDs according to socio
demographic variables.
H4: There will be no difference in physical activity behavior according to socio
demographic variables.
Research Question 4: What motivating and de-motivating factors for exercise and PA are
perceived?
HS: There are physical, social, and psychological-cognitive factors that either motivate or
de-motivate engagement in exercise and PA.
Research Question 5: How much task, coping, and scheduling self-efficacy related to
exercise and PA are perceived?
H6: There will be moderate amounts of task, coping, and scheduling self-efficacy related
to exercise.
Research Question 6: What is the relationship between the levels of exercise self-efficacy
and perceived motivating factors?
H7: There will be no relationship between the level of motivating factors and exercise
self-efficacy after controlling for socio-demographic factors.
Research Question 7: What is the relationship between the level of perceived motivating
and de-motivating factors and the degree of engagement in exercise and PA?
8
I ii

H8: There will be no relationship between the level of perceived motivating factors and
the degree of engagement in exercise and PA.
H9: There will be no relationship between the level of perceived de-motivating factors
and the degree of engagement in exercise and PA.
Research Question 8: What is the relationship between the level of exercise self-efficacy
and the level of PA and exercise behavior?
HJ 0: There will be no relationship between the level of exercise self-efficacy and PA.
Research Question 9: What are the overall statistically significant predictors of PA?
Hl 1: There will be no significant relationship between PA according to socio
demographic factors, motivating and de-motivating factors, and exercise self-efficacy.
Conceptual Definitions
I. Exercise self-efficacy: Self-efficacy is defined as an individual's insight into his or her
ability to plan and execute actions needed to perform an activity. Such ability of an
individual is heavily influenced by past performance and accomplishments (Bandura,
1997). Theoretically, self-efficacy is a cognitive mechanism that mediates behavior
change, influences participation in various activities, and determines the amount of
effort and degree of persistence in pursuing the activity despite aversive stimuli
(LaPier, Cleary, & Kidd, 2009). However, in relation to this study, exercise self
efficacy is defined as graduate students' judgment of their capability to engage in
exercise and moderate PA as recommended while they pursue their graduate degree.
2. Physical activity: PA in this study is operationally defined as any type of body
movement produced by the contraction of skeletal muscle that increases energy
expenditure above the basal level calculated in terms of MET-minutes according to
9

the Internal PA Questionnaire (IPAQ) guidelines. The IPAQ suggests tlu·ee levels of
PA: inactivity, minimal activity, and health enhancing PA. Inactivity is the lowest
level of PA. Minimal activity is defined as: I) 3 or more days of vigorous PA for at
least 20 minutes per day; II) 5 or more days of moderate PA or walking at least 30
minutes per day; or III) 5 or more days of any combination of activity achieving at
least 600 MET-min per week. Health-enhancing PA (HEPA) is defined as I) vigorous
PA for at least three days a week accumulating 1500 MET-min/week or II) 7 or more
days of a combination of any PA achieving a minimum of 3000 MET-min/week.
Individuals who do not meet the criteria for minimal activity and health-enhancing
PA are considered inactive. The IP AQ has established median MET values for each
activity (walking=3.3 METs, moderate PA= 4.0 METs, and vigorous PA=8.0 METs)
(IPAQ, 2004). Hence, MET-min/week is computed by multiplying the medium MET
level for a specified activity by the minutes and days in a week that PA took place
(medium MET value*minutes*days). Forms of physical activities include walking,
cycling, gardening, swimming, dancing, playing, skating, cleaning house, and
climbing stairs.
3. Exercise: Exercise is defined as a subset of PA that is planned, structured, repetitive,
and purposeful in the sense that improvement or maintenance of physical fitness is
the objective (Caspersen, Powell, & Christenson, 1985). Physical fitness includes
cardio-respiratory fitness, muscle strength, body composition, and flexibility
comprising a set of attributes that people have or achieve that relates to the ability to
perform PA (Thompson et al., 2003). For the purpose of this study, exercise is
defined as intentional PA reported by participating students.
10
1

4. Motivating factors for exercise and PA: These multifaceted factors are the driving
forces to help individuals initiate, direct, and maintain exercise and PA. The most
common motivational factors for exercise reported in the literature include the desire
to maintain health, improve physical appearance, engage socially, and accumulate
psychological benefits. Enjoyment is another identified motivating factor (Ryan,
Fredrick, Lepes, Rubio, & Sheldon, 1997). Moreover, personal and demographic
factors-age, gender, marital status, academic area of study, and level of study-may
all influence an individual's perceptions of how exercising and being physically
active render benefits. Likewise, existing knowledge about CVD may also control an
individual's perception of benefits and barriers of exercising, thus acting as
motivating factors. In this study, however, these factors are considered: 1) life
enhancement, 2) physical performance, 3) psychological outlook, 4) social
interaction, and 5) preventive health as profound motivating factors. These factors
were believed to enhance students' exercise-related self-efficacy and eventually their
ability to engage in exercise and PA (Campbell, McAuley, McCrum, & Evans, 2001 ).
Below are particular motivating factors:
a. Life enhancement: Life enhancement includes a person's perceptions of positive
life-enhancing effects of PA and exercise. Specific aspects oflife enhancement
include: improved disposition, improved sleep patterns, decreased fatigue,
improved self-concept, increased mental alertness, enhanced ability to carry out
normal activities without being tired, improved quality of work, and improved
overall body functioning due to engagement in exercise and PA.
11
1 I j
I
b. Physical performance: Physical performance includes eight elements that
motivate people to engage in exercise and PA. These factors relate to the
individual's perception of the positive physical performance effects of exercise
and PA: improved muscle strength, increased physical fitness, improved muscle
tone, improved functioning of the cardiovascular system, increased stamina,
improved flexibility, improved physical endurance, and improved physical
appearance.
c. Psychological outlook: Psychological outlook describes the psychological aspects
of motivating factors for exercise and PA. The elements under this factor are
enjoyment, stress reduction, improvement in mental health, increase in sense of
accomplishment, feelings ofrelaxation, and sense of well-being.
d. Social interaction: This term includes four aspects of social interaction that have
been found to motivate people to engage in exercise and PA: a means to establish
contacts with friends and others, opportunities to meet to new people,
entertainment, and enhanced acceptance of self among others.
e. Preventive health: Preventive health-grouped factors motivate individuals to
exercise by enhancing the individual's perception of health-preventive benefits
such as exercise as a means to prevent heart attack and high blood pressure and as
a way to live longer.
5. De-motivating factors for exercise and physical activity: These multifaceted factors
prevent an individual from engaging in exercise and PA by increasing the perception
of barriers to PA and exercise. The most commonly reported de-motivational factors
for exercise are lack of time, increased family and academic responsibilities and lack
12
, '
'I
I I ii ii ii

of energy and self-efficacy. Inadequate resources and social support are other factors
rep011ed in some studies. Exercise milieu, time expenditure, physical exertion, and
family discouragement are considered four de-motivating factors in this study. These
profound de-motivators are thought to have an effect by altering perception of
benefits and barriers to exercise and PA. Below are particular demotivating factors:
a. Exercise milieu: Exercise milieu includes the following elements as perceived
barriers to exercise and PA: direct costs involved with exercise, remoteness,
inconvenient schedules, no available exercise facility, embarrassment to exercise
in front of other people, and to wear exercise clothing.
b. Time expenditure: Time expenditure refers to factors directly related to time taken
away from family, school, and other responsibilities.
c. Physical exertion: Physical exertion has been rated as one of the most significant
de-motivating factors for PA when compared to other factors in some studies
(Lovell, Ansari, & Parker, 2010). Physical exertion refers to tiredness, fatigue,
and the individual's perception of exercise as hard work.
d. Family encouragement: Family encouragement or lack of family encouragement
includes lack of support from spouse and other family members.
6. CVD knowledge: The Oxford English Dictionary defines knowledge as expertise and
skills acquired by a person through experience or education or the theoretical or
practical understanding of a subject matter (2003). For the purpose of this study, CVD
knowledge is operationally defined as a student's knowledge of CVD or conditions
that qualify as CVD, common CVD risk factors, and commonly utilized CVD
prevention strategies.
13

a. CVD knowledge refers to a specific understanding of the medical conditions
that come under the umbrella term "cardiovascular diseases," a range of
diseases that affect human heart and/or blood vessels such as stroke; heart
valve problems; arrhythmia or rhythm abnormality; myocardial infarction,
commonly referred to as heart attack; angina; peripheral vascular diseases;
heart failure; and aneurysms (AHA, 2004).
b. CVD risk factor knowledge refers to an understanding of common modifiable
risk factors that make an individual susceptible to various CVDs: tobacco
smoking, increased blood cholesterol, increased blood pressure, physical
inactivity, obesity/being overweight, diabetes mellitus, excessive alcohol
consumption, low daily fruit and vegetable intake, and excessive stress (Yusuf
et al., 2004).
c. CVD prevention practices: Based on scientific evidence, the WHO suggests
the following as the most effective CVD-prevention strategies: limit energy
intake from total fats and shift fat consumption away from saturated fats;
consume a diet high in fruits, vegetables, nuts, and whole grains and low in
refined grains; avoid excessively salty or sugary foods; engage in at least 30
minutes of regular moderate PA daily; avoid smoking and excessive alcohol
intake; and maintain a healthy weight (2007). For the purpose of this study,
CVD prevention practice refers specifically to engagement in moderate PA
and exercise on a regular basis as recommended by the USDHHS in 2008.
7. Academic area of studies: Academic areas of studies are defined as the fields of
study of graduate students for the purpose of pursuing higher degrees. These
14

academic areas of study include but are not limited to humanities, history, linguistics,
performing arts, religion, visual arts, social sciences, cultural and ethnic studies,
economics, geography, political science, psychology, sociology, space studies,
chemistry, physics, computer sciences, mathematics, statistics, business, engineering,
education, environmental studies, medicine, exercise physiology, nursing, journalism,
mass media and communication, law, and social work. They are grouped in health
sciences, arts and sciences, and education and human development.
Summary
The prevalence of CVD among the general population, including young adults, is
relatively increasing. Furthennore, the prevalence of several CVD risk factors
hypertension, dyslipidemia, obesity, stress, anxiety, and smoking rates-have risen
among university students (Hajjar & Kotchen, 2003; Ford, Mokdad, & Giles, 2005). To
date, PA remains one of the most effective CVD-prevention strategies available. Based
on available evidence, it is assumed that graduate student populations may collect
additional benefits from PA because of its influence of increased feelings of vigor and
reduced tension, fatigue, and confusion (Puetz et al., 2006). Thus, besides promoting
CVD-prevention benefits, PA may add to students' academic success. Despite reported
generalized and specific benefits of PA, studies often report that university students in
general do not engage in adequate PA (Douglas et al., 1997). Among these physically
inactive student populations, lack of energy, time, self-efficacy, and social support were
reported as de-motivating factors for PA.
While informed knowledge base is an important factor for motivating individuals
toward healthful behavior such as being active and eating well, other factors need to be
15

taken into consideration. In population-based studies, in addition to knowledge (Van Der
Horst et al., 2007), time factors, social support, exercise self-efficacy, changes in
priorities, weather conditions, family commitments, and job-related commitments (Booth,
Bauman, Owen, & Gore, 1997; Salmon et al., 2003; Rhodes & de Bruijn, 20!0) were all
reported as motivators or de-motivators for PA behaviors. Motivational theorists also
agree that PA and other health-related behaviors are motivational constructs that vary
among individuals based on personal, social, and demographic characteristics. These
motivational constructs could be influenced internally or externally and/or positively or
negatively.
The mental well-being of graduate students has been extensively studied. But,
based on a thorough review of the traditional and "gray" literature sources, no studies that
considered graduate studies CVD knowledge and PA were revealed .. Yet the increasing
prevalence of CVD risk factors among university students along with their negative
personal health habits and increased stress levels may increase their susceptibility to
CVD (Rozanski & Kubzansky, 2005; ACHA, 2010). Careful consideration of the
available evidence makes it imperative to examine graduate students' existing CVD
knowledge and determine how much of this knowledge translates into everyday PA
behavior. Further, it is critical to identify the motivating and de-motivating factors for
PA as perceived by these students.

CHAPTER II
REVIEW OF LITERATURE
This chapter presents a review of literature relevant to the phenomena of interest
identified in chapter one. The review focuses on nine major areas: the concept of the
burden of CVD, the status of cardiovascular disease among young people, the general
risk factors for cardiovascular disease, including psychological stress, anxiety, and
depression as risk factors, psychological stress in the graduate student population; PA and
its role in cardiovascular disease risk reduction, the student population and physical
inactivity; and motivating and de-motivating factors for exercise and activities. The
review concludes with the discussion of social cognitive theory and the health promotion
model as the guiding frameworks for this study.
Current Burden of Cardiovascular Diseases
The World Health Organization WHO (2010) defined CVD as a broad term that
includes coronary heart disease (CVD), stroke, inflammatory heart disease, rheumatic
heart disease, and hypertensive heart disease. The American Heart Association (AHA)
(2004) definition ofCVD includes the following parameters: coronary heart disease,
stroke, high blood pressure, and rheumatic heart disease.
In 2003, approximately 17 million deaths due to CVD were reported among all
deaths in the world (Mackay & Mensah, 2004). By the year 2020, it is estimated that
CVD will continue to rise and be the single, most common cause of death and disabilities
in the world (Critchley & Una!, 2004). In the United States, CVD prevalence among
17
I I

adults ages 20 years and older was 36.3% while the mortality data in 2005 showed CVD
to be the underlying cause of death accounting for 35.3% of all deaths (Rosamond et al.,
2007).
The prevalence of CVD clearly increases with advancing age with some
variations according to race, ethnic, geographic, and socio demographic characteristics of
the population groups. Despite the age hypothesis, the younger population has also felt
the impact of CVD; it remains on the top five causes of death amongst individuals
between 20 and 45 years of age (Centers for Disease Control (CDC), 2005). Moreover,
the prevalence rate is also associated with the income level, employment status, and
state/territory of residence (CDC, 2005).
Yet, by 2020, the American Heart Association (AHA) seeks to improve the
cardiovascular health (CV) of all Americans by 20% while reducing deaths from CVD
20% (Lloyd-Jones et al., 2010). In order to meet this broader goal of improving the CV
health, the AHA defines the ideal CV health as one of the following: 1) the simultaneous
presence of four favorable health behaviors (abstinence from smoking within the last
year, ideal body mass index, PA at goal, and consumption of a dietary pattern that
promotes cardiovascular health; 2) the simultaneous presence of four favorable health
factors (abstinence from smoking within the last year, untreated total cholesterol< 200
mg/dl, untreated blood pressure <120/<80 mm Hg, and absence of diabetes mellitus; 3)
the absence of clinical CVD (including CHD, stroke, heart failure, etc)." In order to
satisfy the requirement of ideal CV health, the AHA outlined seven health behaviors; 1)
currently not smoking or quit within 12 months, 2) BMI less than 25 kg!m2, 3) PA 2:150
min/wk moderate intensity or :0:75 min/wk vigorous intensity or 4) healthy diet; 5) total
18
l I I

cholesterol <200 mg/di, 6) blood pressure <120/<80 mm Hg, and 7) fasting plasma
glucose <JOO mg/di.
Status of Cardiovascular Disease Risk among Young People
The availability of published literature in the United States that reports the
prevalence of CVDs among young adults is limited despite the occurrence of CVDs
among young adults at an alarming rate. Thus far, published research on student
populations is even scarce. There are very few published studies that have pointed out
that university students have increased risks of having CVD due to elevated blood
pressure, increased cholesterol, prevalence of smoking, unhealthy food choices,
consumption of alcohol, inactivity, and/or lack of knowledge about CVD (Greenlee,
Castle, & Woolley, 1992; Spencer, 2002; Collins, Dantico, Shearer, & Mossman, 2004;
Frost, 1992).
Greenlee, Castle, and Woolley (1992) evaluated CVD risk status of freshman
medical students (n=89) in order to design educational interventions to change students'
behavior to modify their CVD risk status. Additionally, their objective was to improve
the students' knowledge and attitude toward preventive cardiology over four years of
medical training to assist them to adopt best CVD prevention practices for their patients
in the future. They used a one group, pretest posttest design and the sample consisted of
91 % white, 84% male and 53% married students. Of the 77 students completing initial
risk evaluation during freshmen year, 84% had some modifiable risk factor, almost 50%
had at least one major modifiable risk factor (smoking, high blood pressure, high
cholesterol), and almost one third of the students had one major modifiable risk factor in
addition to one minor modifiable risk factor (increased body fat, physical inactivity, and
19

increased stress). Surprisingly, when the students' risk evaluation was done again during
their senior year, 62% of the students still had at least one modifiable risk factor despite
statistically significant changes in the prevalence of CVD risk factors.
A more comprehensive study of CVD risk assessment within a student population
was conducted by Spencer in 2002. This study measured cardiovascular risk factors in
226, 18-26 year old traditional college students. The sample was comprised of 57%
female and 84% white students. The aim was to report the magnitude of the problem of
CVD risk factors among traditional college students. Results demonstrated that 29% of
these college students had undesirable total cholesterol level greater than 200mg/dl. An
HDL level of below 40 mg/dl was present in 18.7% of the students. Borderline measures
of blood pressure were set as 130 mm hg systolic and 85 mm hg diastolic; 21.3% had
high systolic and 15.6% high diastolic blood pressure. More than 50% of the participating
students acknowledged that at least one of their biological parents had high blood
pressure and/ or high cholesterol. More than 50% reported consuming a diet high in fat.
The number of students reporting to be engaged in binge drinking ( 5 or more drinks in
one sitting more than once a week) was 18%. More than 50% of the students also
reported that they experienced variable levels of stress, and 14% of the students identified
themselves as smokers. Out of 32 smokers, 57% reported smoking greater than 20
cigarettes in a week. Out of 220 students, 46% of the students reported exercising less
than twice a week. There were gender based differences in the prevalence CVD risk
factors with men being at greater risk. The author claimed that efforts are needed to
develop effective screening and education programs for behavior change in the areas of
alcohol, diet, tobacco use, stress and exercise among college students (Spencer, 2002).
I I

Some studies have published staggering statistics of the presence of health related
risk factors among college students. Between 2005 and 2009, Burke, Ruth, Reilly,
Morrell, and Lofgren (2009) conducted a cross-sectional study of 170 I students enrolled
in an introductory nutrition course at the University of New Hampshire. The sample was
comprised of 28% males and 72% females between 18 and 24 years of age. One third
(33%) were either obese or overweight, 53% had elevated LDL cholesterol, 47% elevated
systolic blood pressure, and 39% elevated diastolic blood pressure. Eight percent of the
male students had indicators of metabolic syndrome. Yet, 28% students reported being
engaged in less than 30 minutes of PA each day. Additionally, the majority of the
students reported eating a diet high in sodium. Yet only 5% identified themselves as
smokers. These finding reinforced the idea that problems of obesity and lack of PA
leading to increased vulnerability for chronic illnesses are significantly prevalent among
college students.
Collins, Dantico, Shearer, and Mossman (2004) conducted another large-scale
exploratory study of 1,481 students over the age of 18 years emolled in selected
undergraduate courses at Arizona State University. Their findings suggested that
students in general have both a low risk perception and low level of knowledge about
their risk of having CVD. There were ethnic variations in CVD knowledge, with cancer
identified as the number one health risk by 47% Caucasian, 35% Hispanic, and 42%
African American students. Over a third of Asian (34%) and Native American (39%)
students recognized heart disease as their greatest health risk. Caucasians were seen as
being at highest risk for developing CVD. Over three-quarters (77%) stated they did not
receive information about CVDs but 75% acknowledged receiving information about
21

other diseases such as cancers. These findings emphasized the importance of educational
interventions in increasing awareness of self perception regarding the risk ofCVD.
Frost reported different findings in 1992 from a cross-sectional survey of 1,503
four-year public liberal arts college students' knowledge, attitudes, and behaviors
regarding CVD risk. The study had a response rate of 60.4%, 56.2% seniors, I 0.3%
juniors, and 0.5% graduate students. High percentages were aware of high blood
pressure as a key risk factor for CVD (91 %) and identified smoking (90%), high
cholesterol 86. 7%) and physical inactivity (72%) as other risk factors. More than 72% of
the students believed that exercise has a significant effect in preventing CVD. Although
96% indicated their willingness to exercise as prescribed and 72.3% were confident in
their ability to exercise, only 33.5% reported that they exercised regularly during the
previous week. Frost noted discrepancies between knowledge and implementation of
CVD prevention practices. The above review of available literature on the CVD risk
factors among college students is alarming in its implications. The prevalence of
specific risk factors such as elevated blood pressure, dyslipidemia, and obesity when
combined with lack of adequate knowledge about CVD and the inclusion of behavioral
risk factors such as increased inactivity, nutritional imbalances, smoking, and alcohol
intake, in the equation warrant further investigation.
General Risk Factors for Cardiovascular Diseases
For the past few decades, the medical community has claimed that obesity has a
causal relationship toward the onset of CVD. The public gradually became aware that
their CV system could be negatively influenced by faulty lifestyle habits and genetic risk
factors. Consequently, the major health organizations started to suggest hypertension,
22

dyslipidemia, obesity/overweight, diabetes, smoking, physical inactivity, and heightened
stress level may all increase an individual's risk for developing CVD (AHA, 2006).
Hence, soeial contextual factors such as low soeioeeonomie status, adverse employment
conditions, family/marital life situation, caregiver role strains, and inadequate social
support may produce a great deal of stress among populations (Hoppmann & Klumb,
2006; Jacobs et al., 2007). An adverse relationship has been found to exist between these
stress situations and physiological/psychological demands on human body as manifested
by elevated blood pressure, increased cholesterol, increased heart rate, decreased job
satisfaction, and increased rates of health risk behaviors such as smoking and
consumption of alcohol (French & Caplan, 1972).
The most commonly reported CVDs are coronary heart disease (CHD), stroke,
peripheral vascular diseases and rheumatic heart disease (AHA, 2006; WHO, 2004).
Although there are different types of CVDs, their risk factors are roughly identical. For
example, the risk factors for high blood pressure include age, family history, obesity,
physical inactivity, smoking, high-sodium diet, excessive alcohol intake, and increased
stress level. Thus far, most of the CVDs are related to advancing age, family history,
obesity, physical inactivity, smoking, high blood cholesterol, high blood pressure, and
diabetes mellitus (AHA, 2005; WHO, 2004; National Heart, Lung, and Blood Institute,
2006). Furthermore, most CVDs and hypertension share psychological elements (stress,
depression) as their risk factors. Finally, age, personal and family history, high blood
pressure, smoking, diabetes mellitus, coronary heart disease, high blood cholesterol,
physical inactivity, and excessive alcohol have all been designated as risk factors for
stroke. Therefore, CVD has been considered as a group of diseases which includes
23
'

myocardial infarction, peripheral vascular diseases, hypertension, and stroke, that all
share common risk factors (AHA, 2006; NHLBI, 2006; WHO, 2004).
More specifically, the risk factors for CVD are categorized into two major groups;
modifiable and non-modifiable risk factors. Age, gender, race, and heredity are grouped
to form non-modifiable risk factors; major modifiable risk factors include high blood
pressure, dyslipidemia (high total cholesterol, LDL-C and triglyceride levels, and low
levels ofHDL-C), tobacco use, physical inactivity, obesity, unhealthy diets, and diabetes
mellitus. Additionally, minor modifiable risk factors include depression, psycho-social
stress, alcohol use, and use of certain medications. More recently, contextual factors have
also been added to the list (Appel, Harrell, & Deng, 2002; Le, Chongsuvivatwong, &
Geater, 2008).
Thus, a number of risk factors contributing to CVD morbidity and mortality have
been identified through epidemiological and sociological studies. The overall risk factors
identified are grouped into two major categories: modifiable risk factors and non
modifiable risk factors. Studies have further suggested that most of the risk factors for
CVD to some extent are modifiable through simple lifestyle choices.
Psychological Stress, Anxiety, and Depression as Risk Factors for CVD
Psychosocial stress commonly refers to interpersonal, social, familial, and societal
factors that are responsible for producing anxiety in an individual (Lazarus, 1966). A
substantial link between consistently elevated levels of stress, anxiety, and depression to
the development of CVD has been reported by multiple authors. In a review of more than
250 published works in psychological, social, and biomedical fields, Rozanski and
Kubzansky (2005) examined the association between psychosocial stress and coronary
24

artery disease (CAD) development. They defined psychosocial stress to include
depression, anxiety, personality factors, social isolation, and chronic life stresses. Their
findings strongly suggested that the psychosocial state of an individual may contribute to
a greater frequency of adverse health behaviors such as poor diet, low self esteem, and
smoking. Furthermore, psychosocial state was also found to have a strong association
with development and/or promotion of CAD through direct pathophysiological
mechanisms such as neuroendocrine and platelet activation. The psychosocial state of an
individual was found to contribute to CVD in three distinct ways: 1) directly promoting
the pathogenesis of atherosclerosis, 2) indirectly contributing to maintenance of
unhealthy lifestyle behaviors, such as smoking and poor dietary habit, and 3) indirectly
rendering an important barrier to successful modification of lifestyle behaviors in the
presence of coexisting psychosocial stresses once the clinical CAD is developed.
Other reviews have agreed with that of Rozanski and Kubzansky (2005). They
also demonstrated an association between stress, anxiety, depression, and CVD. Harner,
Molloy, & Starnatakis (2008) conducted a recent prospective study to estimate the extent
to which behavioral and pathophysiological risk factors account for the association
between psychological distress and incident cardiovascular events. Their sample
consisted of 6,576 healthy men and women with a mean age of 50.9. They measured
three domains ofCVD: participants' psychological factors (happiness, anxiety/depression
symptoms, and sleep disturbance), behavioral risk factors (smoking, alcohol, and PA),
and pathophysiological risk factors (C-reactive protein, fibrinogen, total and HDL
cholesterol, obesity, and hypertension) at baseline. The major CVD outcome measures in
the study were hospitalization related to nonfatal myocardial infarction, coronary artery
25
1 ii
11

bypass, angioplasty, stroke, heart failure, and related mortality. At baseline, 14.6% of
participants showed psychological distress; distressed subjects were more likely to have
poorer health behaviors, higher levels of inflammatory and haemostatic markers, greater
prevalence of hypertension. Psychological distress was significantly correlated with
cigarette smoking, physical inactivity, alcohol intake, CRP, and hypertension. A linear
relationship was found between psychological distress and CVD events as outcome
variables, indicating that psychologically distressed participants were at a higher risk of
having CVD events during follow-up. There were 223 incidents of CVD events over an
average follow-up period of 7.2 years. The study results strongly suggested that the risk
of CVD increases in the presence of psychological distress.
Additionally, an Expert Working Group (EWG) of the National Heart Foundation
of Australia published an account of systematic reviews of the evidence relating to
psychosocial risk factors and their relation to development or progression of CHD. Their
review was based on extensive search of databases such as Medline, Embase, and Psych
info. The final review included 15 case---control and prospective studies. The group
suggested that there may be an independent causal association between depression, social
isolation, and lack of social support and the causes as well as the prognosis ofCHD.
These psychosocial factors were noted to be equivalent to the conventional risk factors
for having CVD such as smoking, dyslipidemia, and hypertension. Yet the group denied
the equally strong association between CHD and psychosocial factors such as chronic life
events, work-related stressors, hostility, and anxiety disorders (Bunker et al., 2003).
Although associations between psychological factors and CVD risk have been
established, the exact pathophysiological mechanisms are still under rigorous
26
1 I
!I ii

investigation. One of the mechanisms frequently argued by numerous biomedical studies
is the cortisol mechanism. Biomedical evidence strongly suggests that a persistently high
level of psychological stress increases the level of cortisol in the body; this in tum is
positively correlated with adverse CV events such as elevated blood pressure, increased
insulin resistance, and increased plasma triglyceride concentration (Phillips et al., 1998;
Raison & Miller, 2003). A negative correlation also was found between cortisol and high
density lipoprotein. The nature of these correlations suggests an existence of correlations
between psychosocial stress, cortisol level, and adverse CV events.
This section reviewed the relevant literature concerning the association between
psychological stress, anxiety, and depression as general risk factors for CVDs. Although
many of these studies were conducted among populations other than college students, the
findings could clearly be translated into the occurrence of incidences of CVD events
among these young adults due to universal nature ofbio-physiological functioning of
human system.
Psychological Stress within the Graduate Student Population
Studies have shown that the increased stress of academia can have a negative
impact on a student's academic performance and can lead to anxiety, depression, and
decreased well being (Frazier & Schauben, 1994). Four key factors that often impact the
lives of students creating variable level of stresses are academic factors, demographic
factors, psychological factors, and human/cultural factors (Sigafus, 1998). Researchers
have reported that graduate school is often experienced as a time of increased demands
and expectations resulting in heightened level of stress produced from academic work,
family responsibilities, job demand, financial pressure, and other life related issues
27

(Toews et al., 1997; Silber et al., 1999). Graduate students frequently report their current
level of stress to be above average or in some instances the highest in their lives (Pfeifer,
Kranz, & Scoggin, 2008). Researchers have frequently remarked upon the importance of
supportive relationships between faculty and fellow students in academic life (Pauly,
Cunningham, & Toth, 2000). Pauly et al. (2000) further noted that a significant number
(40-50%) of the students enrolled in graduate degree program especially at doctoral level
do not graduate (Dorn & Papalewis, 1997). For doctoral students, the major reason for
not being able to graduate was the devastating effect of doctoral programs, which made
them depressed and often times suicidal (Lovitts, 20 I 0).
Similar results were found by other researchers. Some looked at overall stress
level among student populations while others looked at other components such as social
support or spiritual well being. Calicchia and Graham (2006) examined the relationship
between stress, spirituality, and social support in 56 graduate students (women= 41,
men= 15) pursuing a master's degree in counselor education in southeastern
Massachusetts. The majority of students was Caucasian and reported a median income of
$28,000. The results postulated that the students involved in rigorous academic and
clinical programs frequently experienced a high level of stress due to increased workload
and competing demands. These students were concerned that they did not have enough
time to engage in stress reduction activities in social and personal venues. The findings
provide an impression that the graduate students are at a greater risk of developing
physical and psychological health problems as a result of the increased stress and
inability to engage in stress reduction programs.
28

Hyun, Quinn, Madon, and Lustig (2007), conducted a cross sectional survey of
3,121 full-time domestic and international graduate students at a large western university.
The students completed an online survey with a response rate of33.8%. The mean age of
the sample was 28.8 years, females comprised 53.3% of the respondents, the majority
were doctoral students, and the greatest percentage of students ( 40 .4%) represented the
science and engineering disciplines. The remaining students were distributed among
professional schools (26.4%), social sciences (19.6%), the humanities (11.4%), and other
programs (2.1%). An emotional or stress related problem significantly affecting their
well-being and academic performance during the past year was report by 44% of the
international and 46% of the domestic graduate students. Furthermore, 58% of the
students also reported having a friend with stress-related problems. There were gender
differences, with only 39% of male students reported having these problems compared to
52% of females.
A nationwide survey of 404 graduate students commissioned by Grad Resources,
reported similar findings (Barna Research Group, 1999). The findings of this telephone
survey were in agreement that graduate school is a period of increased stress and anxiety
in students'life.The majority of the students in this study reported encountering a
constant struggle to achieve a balance in their lives, affecting their academic as well as
private lives The students were gravely concerned about their personal health Many
students noted that pressures of graduate school were taking an emotional toll on them.
Some of the challenges experienced by these students were; balance outside of school
(70%), personal health (59%), dealing with stress/burnout (55%), not being successful in
career (52%), financial pressures ( 46%), and peer relationships (40%).Some other
29

concerns were choosing the wrong career path, relationships with professors, failing
others' expectations, and feeling like an outsider. The demographics of the study
participants were not disclosed in the report.
A study of 53 doctoral students by Nelson, Dell'Oliver, Koch, and Buckler (2001)
also noted that the majority of the students reported scholastic coursework, dissertation
work, and financial situation as major sources of stressors in their academic life. The
study participants, evenly distributed between males and females, were students emolled
in clinical psychology coursework in a small university in the northwest. Students'
reported stress levels, psychological health, social support, and coping styles were
measured. Other stressors were internship expectation, practicum placement, hassles of
daily life, and time management. Besides academic performance, all of these factors
were often strongly linked to students' mental and physical health consequences.
Statistically significant differences in the stress level were found among males and
females with females reporting comparatively greater amount of stress related to time
management.
Stecker (2004) reported graduate/professional students to have symptoms of
depression, stress, and substance use at a very high rate. The study involved both
graduate and undergraduate students (n= 667) from across the disciplines including
nursing, medicine, dentistry, and pharmacy. An alarming number of students reported
symptoms of depression during the previous 4-week period. At least five symptoms of
depression were reported by 10% of students and suicidal thoughts were reported by
10%. McKinzie, Altamura, Burgoon, and Bishop, (2006), reported a high correlation
between stress, sleep patterns, and exercise habits, and negative mood state among
30
l I I !
11
Ii !1

psychology graduate students. They studied 65 students, 49 women and 16 men with a
mean age of 27 years, enrolled at one university in the New York City Metropolitan
area. The purpose of the study was to explore the con-elates and predictors of stress
among students at doctoral level. They found that students' stress level was significantly
con-elated with their sleeping patterns, exercise habits, and negative mood state. This
study disseminated a mixed message about graduate students' health related behaviors.
On one hand the students reported greater adverse mood states and sleep deprivation
with fewer hours of sleep. Yet students who were stressed reported engaging more in
exercise episodes. The study results may have been limited by the over sampling of
females (75%) and Caucasians (88%) and utilization of a positively skewed stress scale.
Graduate students have also been studied qualitatively. Johnson, Batia, and Haun
(20 I 0) examined perceived stress level among graduate students in regard to their roles,
responsibilities, and social support. Twelve graduate students provided responses
regarding personal and academic responsibilities, cun-ent stress levels, and coping
strategies they employ. The majority of the participants experienced role conflict
between academic and personal responsibilities and perceived difficulty in balancing
these responsibilities; the result was increased stress levels. These students
acknowledged that changes in graduate students' levels of social support upon entering
graduate school prevented them from using it as a means of coping with the stress. In
another qualitative study, Stratton, Mielke, Kirshenbaum, Goodrich, and McRae (2006)
addressed graduate students' quality of life and the types of support system they needed.
They used a heuristic approach to study 16 students cun-ently enrolled in the College of
Education. The participants were traditional graduate students in their twenties (n=l 1)
and nontraditional graduate students in their thirties, forties, and fifties (n=5). Eight were
pursuing master's degrees and eight doctoral degrees. Students rated their current level
oflife satisfaction,an average of 4.75 on a scale ranging from 1 (very low) to 6 (very
high). Although the students' current levels of stress were not measured, 100% of the
students expressed that they needed additional support from their family and friends to
achieve their academic goals due to increased stress level.
These studies reported varying level of stress and coping across the students based
on age, gender, level of study, and area of study. Studies have consistently found that
graduate students in general are more stressed and women experience higher levels of
stress than their male counterparts. Some studies compared the stress levels of students
based on academic field of study and found that students in some areas of study
experience more stress than others. Some studies additionally reported that graduate and
professional students may have symptoms of depression, stress, and substance abuse
(Stecker, 2004).
Physical Activity and Cardiovascular Diseases
Updated PA guidelines recommend that all adults should engage in at least 150
minutes a week (30 minutes, 5 days a week) of moderate intensity or a minimum of75
minutes a week (25 minutes, 3 days a week) of vigorous intensity aerobic PA for
substantial health benefits. The amount of PA should be increased significantly to obtain
more extensive health benefits (US Department of Health and Human Services,
(USDHHS), 2008). Numerous physical and mental benefits of exercise have been well
documented throughout the medical and sociological literature. The benefits of exercise
and activities include reduced risk of diabetes, heart disease, high blood pressure, bone
32
'
l i I i ii !~

loss, premature death, improvements in weight management, and increased overall fitness
level (Warburton, Nicol, & Bredin, 2006). In terms of CVD prevention, it is reported that
there is a 20%-35% relative risk reduction in all causes of mortality including CVD
among men and women (Warburton et al., 2006). The evidence also suggests that the
benefits of exercise extend beyond the primary prevention of chronic physical illnesses
and include improved mental well-being and enhanced quality of life (Rhodes,
Plotnikoff, & Courneya, 2008). Insufficient PA has been recently reported as an
emerging public health concern among adults and children in the United States and
globally (World Health Organization (WHO), 2009).
The major findings from two landmark studies rendered the basis for the PA
recommendations by USDHHS in 2008. First, in the health professionals' follow-up
study (Tanasescu et al., 2002), total PA, running, weight training, and rowing were
inversely associated with risk of CHD. Researchers followed 44,452 male health care
professionals between the ages of 40 to 75 years for 12 years. Additionally, PA was
associated with lower body mass index, lower intakes of total fat and saturated fat, higher
fiber intake, low consumption of alcohol, and lower prevalence of smoking, and
hypertension. Men who ran for an hour or more per week had a 42% reduction in the risk
ofCHD compared with men who did not. Similarly, men who trained with weights for 30
minutes or more per week had a 23% risk reduction compared with men who did not train
with weights. Rowing for one hour or more per week was associated with an 18%
reduction in CHD risk. Average exercise intensity was associated with reduced CHD risk
independent of the total volume of PA. Finally, a half-hour per day or more of brisk
33

walking was correlated with an 18% CHD risk reduction. The study was limited to only
middle aged males.
Second, the National Institutes of Health- AARP Diet and Health Study followed
253,000 women and men aged 50 to 71 years for an average of five years. Moderate
intensity PA for more than three hours per week predicted a 27% reduction in CVD
mortality risk when compared with no PA (Leitzmann et al., 2007). Likewise, engaging
in vigorous exercise for 20 minutes for three times or more in a week predicted a 32%
reduction in CVD mortality risk. Those engaged in some PA at less than recommended
level showed modest but significant reduction in mortality from any cause, CVD, and
cancer. Further studies have suggested that vigorous intensity PA is more beneficial than
moderate PA for CVD risk reduction (Swain & Franklin, 2006). Vigorous intensity PA
are those in which heart rate increases, breathing becomes heavier, and conversation is
harder (O'Donovan et al., 2010).
Student Populations and Physical Inactivity
American universities appear to have an environment that is conducive to PA.
But, the reports from national surveys and reviews have revealed some conflicting
findings. More than 50% of college students are noted to be insufficiently active in the
United States (Irwin, 2007). Yet, in the recent years, the student population or young
adult population general has not been the population of interest for researchers that are
conducting studies in CVD. Few studies have investigated risk factors for CVD among
university students' especially undergraduate students. No studies have reported the
prevalence of CVD among these populations. Thus, there are very few published reports
that examine risk factors, prevalence, and utilization of CVD prevention strategies among
34
1 I

graduate students. Some of the relevant publications and landmark studies are discussed
below.
Makrides, Veinot, Richard, McKee, and Gallivan ( 1998) carried out a needs
assessment of university students living in residences in Canada. Over 50% of their study
participants reported engaging in exercise fewer than 3 times a week. Lack of time was
most commonly reported as the barrier to PA by 77% of the students; this was followed
by lack of motivation or will power (53%). Eighty-two percent of the students reported
eating fewer than or equal to three servings of fruits and vegetables, 15% identified
themselves as smokers, and 56% reported their current stress level as high or very high.
Among students, 64% reported walking frequently. Significant correlations were found
between students perceived level ofCVD knowledge and students' level of PA (p <
0.001) and between students' perceived knowledge of nutrition and the consumption of
fruits and vegetables (p<0.001). Such associations between students' health related
knowledge and actual health practices signify the importance of knowledge in disease
prevention. In the study, no difference was found in PA based on gender but females ate
greater servings of fruits and vegetables than their male counterparts.
Despite those findings by Makrides et al. (1998), there is often a discrepancy
between what people know and what people do as dictated by many life related factors.
An example is the previously cited study by Frost (1992), in which 72% of the students
identified exercise as a key element of CVD prevention but on 33.5% reported that they
exercised regularly. Mazloomi, Hassan, and Ehrampoosh, (2005) in Iran also assessed the
level of exercise among health sciences students (n= 160) and their reasons for not
exercising. Forty-two percent (26% para-medical students, 31.4% dentistry students, and
35

35% students from other health sciences) repo11ed that they did not participate in exercise
at all. The major reasons provided were lack of time and disinterestedness. A
significantly greater significant percentage of the students in PhD programs (74%) were
knowledgeable about the benefits of exercise compared to 19% of those in associate
degree programs (p =0.005).
Irwin (2007) conducted a longitudinal study in Southern Ontario that assessed
students' PA maintenance at the level necessary for substantial health benefits over one
month. The participants were 392 undergraduate students recruited from two university
campuses, 147 males and 238 females with a mean age of23 years. Of the 199 students
(51%) placed under active student category at baseline, only 82 students remained under
this category at the end of one month. Only 35% of participants' maintained their PA for
one month at the level necessary to gain health benefits. Utilizing "PA Guidelines for
Health, P AGH" as a standard to measure PA, PA maintainers were more likely to be
emolled in a health-related academic discipline and be in their fourth year of study than
were the insufficiently active subjects (p < .05). The investigation was limited by very
low response rate and inclusion of students from only two universities, raising the
concerns about generalizability of the results beyond the study participants.
An international survey conducted among 19,298 university students aged 17 to
30 years from 23 countries (Haase, Steptoe, Sallis, and Wardle, 2004) discovered that
the majority of the students engaged in less than recommended levels of PA. The
researchers also evaluated the students' attitudes about benefits of PA and knowledge
about the role of PA in preventing chronic disease. The analyses were based on data
collected for the International Health and Behavior Survey (IHBS), a large scale cross-

sectional international study. Two items were used to measure leisure-time PA: I)
whether the individual had engaged in any exercise (sport, physically active pastime) in
the past 14 days, 2) number of PA episodes over that period. Leisure-time PA at
recommended levels was more common in men (28%) than women (19% ). The
prevalence of physical inactivity varied remarkably across countries, ranging from 11 %
in Belgium to 41 % in Portugal and South Africa among men and 15% in the US to 65%
in Portugal among women. However, 48% of the men and 52% of the women from the
US in the study were knowledgeable about the influence of PA on prevalence of CVDs.
PA among populations was shown to be dependent on the demographics of the
population (age, gender, marital status, and parenting status).
Sabourin and Irwin (2008) compared PA behavior among parent and non parent
graduate and undergraduate students using an adapted version of the Godin Leisure Time
Exercise Questionnaire. Out of 182 parents, only 16% (n=3) parents and 49.5% (n=90)
of non-parents met the CDC-ACSM guidelines for moderate PA. When the parent and
non parent groups were combined, out of245 students, 31% of men (n=9) and 49% of
women (n=84) women met CDC-AC SM guidelines for moderate PA. Physical inactivity
was prevalent among all students but 84% of parents did not meet CDC-ACSM
guidelines for moderate PA. Graduate students composed only 11 % of the sample, yet it
was representative of health sciences (18%), social sciences (40%), arts (10%), law
(2.9%), media/information technology (4%), and general sciences (25.4%). They
concluded that a significant proportion of the students who are parents may be at
increased risk for the negative health consequences associated with an inactive lifestyle.
37

A meta-analysis of studies on college students' PA behaviors by Keating, Guan,
Pinero, and Bridges reported that 30 to 50% of the college students are physically
inactive (2005). This range of physical inactivity was similar to what has been reported of
general population ( 40% ). The authors analyzed previously published studies into two
groups: 1) description of the students' PA pattern, stages of PA behavior changes, and
determinants of PA behaviors, 2) intervention programs for promoting PA among
students. The authors noted that none of the studies addressed the graduate student
populations in higher education. The analysis identified four general factors that
determine college students' PA: (1) personal, (2) social, (3) cognitive, and (4)
environmental factors. Specific factors associated with PA behaviors were age, gender,
ethnicity, perceived enjoyment of PA, and history of PA in the past. Furthermore,
minority students participated in Jess PA when compared to Caucasians, social support
was more important for female than male students for participation in PA, and students
were more active during weekdays than during weekends, a pattern differing than that in
the general population. This unique pattern of PA calls for unique strategies tailored to
encourage PA among the student population. The authors pointed out three problems
with current research in PA among student population; college students' PA has been
seriously neglected as a research topic, 2) there is a lack of multiple-level approaches to
promote PA among these populations, and, 3) measures of PA are subjective and
inconsistent, making comparisons of PA patterns difficult across studies. Finally, as
numerous studies indicate, health and PA professionals in higher education have not been
able to effectively increase students' PA behaviors in academic settings.

Motivating and Demotivating Factors for Exercise and PA
The Merriam-Webster Collegiate Dictionary (2003) defines motivation in two
ways; I) the act or process of motivating, the condition of being motivated 2) a
motivating force, stimulus, influence, incentive, or a drive. A more comprehensive
definition of motivation may be the interaction of cognitive, affective, behavioral, and
social processes contributing to purposeful, often goal directed behavior (DiNardo,
2005). It is clear that motivation is not a single entity or trait but rather a dynamic model
made up of many different elements. Motivation, as it pertains to exercise, is often
grouped into two categories; extrinsic and intrinsic motivation. Intrinsic motivation
comes internally from within an individual and compels one to do something desirable.
But, extrinsic motivation occurs when external factors compel the person to do
something; examples are encouragement and social support from peer, family, or a
healthcare provider (Deci & Ryan, 1991 ). Both the extrinsic and intrinsic factors involved
with exercise may be personal, social, or environmental. Specific intrinsic factors that
motivate an individual to become physically active may be his/her personal health status,
personal beliefs about exercise, knowledge of disease prevention, perception of
susceptibility, personal competence, self-determination, and personal stress and energy
level. Similarly, the examples of specific extrinsic factors that either motivate or de
motivate an individual to exercise are physical environment, availability of the resources,
and social support. In general, intrinsic motivators produce Jong term adherence to PA
among individuals (Deci & Ryan, 1991).
Early motivational theorists describe the deterministic aspects of motivating
factors for behaviors; instinctual drives (Freud, 1962), physiological drives (Hull, 1951,
1943), and environmental influences (Skinner, 1995). White (1959) argued that people
39
1 lj I, !!

are driven by a need to be effective in mastering the aspects of their environment. White
proposes that when people are successful in mastering the challenges of their
environment, they will have a feeling of efficacy. This feeling of efficacy in tum, serves
as intrinsic motivation that encourages continuation of behavior in the same direction.
Cognitive evaluation theory of intrinsic motivation further justifies that intrinsic
motivation is driven by the individual's innate desire for competence and self
determination in mastering one's surrounding (Frederick & Ryan, 1995). The rewards for
the behavior motivated by this desire are feelings of competence, promotion of
autonomy, and positive emotions such as enjoyment. The argument is that the reward
collected will assist people to maintain or perhaps increase a given behavior.
Motivational theories are in agreement with the fact that health related behaviors
are motivational constructs. These motivational constructs vary among individual to
individual based on personal, social and demographic characteristics. Buckworth and
Dishman (1999) have described five universal categories of variables that both serve as
motivating or de-motivating factors for PA and exercise across populations: cognitive,
demographic, behavior, social and physical environment. The authors believe that
knowledge, attitudes, and beliefs about CVD and benefits of PA are types of cognitive
factors that could be strong personal motivators. Similarly, the individuals are said to be
intrinsically motivated when they engage in an activity for the inherent satisfaction that
they derive from such activity ( e.g., "I exercise because it is fun"). Likewise, they are
said to be extrinsically motivated when they engage in an activity for outcomes that they
attain through the activity ( e.g., "I exercise because I enjoy meeting people while I
exercise'').
40

In regard to CVD prevention practice, positive or negative motivation to engage
in exercise could be either intrinsic, extrinsic or both. Positive motivators for the most
part lead an individual toward observation of healthy behaviors (Fluery, 1996). Some
examples of such intrinsic motivators are the individual's spiritual or religious beliefs
(Davis, 1998; Newlin, Knafl, & Melkus, 2002), perceived susceptibility to illnesses, and
existing knowledge about the disease and prevention practices (Plowden & Miller, 2000).
All of these factors could be powerful personal motivators which compel individuals to
engage in healthy behavior such as good eating, exercising, sleeping, and utilizing stress
reduction strategies (Fleury, 1996; Keller, 1993). Extrinsic or environmental motivators
in terms of prevention of CVD are the factors external to an individual and related to the
availability of resources, family, and social support (Nies, Vollman, & Cook, 1999).
Nonetheless, the growing body of evidence supports the notion that expectations of both
positive (e.g., motivation or benefits) and negative (e.g., demotivation or barriers)
behavioral outcomes are associated with PA among adults. Expectation of positive
outcomes or perceived benefits of PA has been consistently and positively associated
with PA among adults (Ali & Twibell 1995) and adherence to PA (Robertson & Keller
1992) and vice versa. Similarly, social support from family and friends has also
consistently and positively related to adult PA (Felton & Parsons 1994) and adherence to
PA. Moreover, socialization is another example of motivation for exercise (Daskapan,
Tuzun, & Eker, 2006).
In 2006, Daskpan et al. explored the barriers to PA as perceived by 303 Turkish
university students, 222 females and 81 males, with a mean age of 20.5 years. The
researchers assessed undergraduate students' current exercise habits and perceived
41
I I 'i !i· :j<

ban-iers to PA. Participants were asked to complete a self administered 12 item Likert
scale questionnaire to determine perceived ban-iers to PA, categorized into internal and
external ban-iers. Internal ban-iers were further grouped into three categories: I) lack of
energy, 2) lack of motivation, and 3) lack of self-efficacy. External ban-iers were also
categorized into three groups: I) lack ofresources, 2) lack of social support, and 3) lack
of time. Students perceived lack of time as most important internal ban-ier and lack of
energy as the most important internal ban-ier. Other important ban-iers that emerged in the
study were increased priority in academic success and increased responsibilities related to
family and social environment. The study was limited to participants from only one
private university and non inclusion of graduate students.
In a descriptive con-elational study of 147 undergraduate students, 82% male and
18% female with a mean age of 19.9 years, Grubbs and Carter (2002) examined
perceived benefits and perceived ban-iers to PA. The majority of the students perceived
benefits of the exercise as those related to physical performance and appearance.
Participants strongly agreed with the statement: "exercise increases my level of physical
fitness." Similarly, the second most agreed upon statement was "exercise improves the
way my body looks" and "my muscle tone is improved with exercise." The most
substantial ban-iers to regular exercise expressed by the students were physical and social
in nature. The barrier statements most students agreed with were: "exercise tires me,"
"exercise is hard work for me," "I am fatigued by exercise," "exercise takes too much of
my time," and "family members do not encourage me to exercise". The mean score of the
exercise benefits scale was 3.28 (SD= 0.38) for exercisers compared to 2.94 (SD= 0.36)
for non exercisers (p <.001). The mean score for the barriers scale also was significantly
42

higher for exercisers (83.18 [SD= 0.38]) than for non exercisers (2.80 [SD= 0.32])
(p<.001). The findings have indicated that the students who exercised regularly,
perceived significantly higher level of benefits than those who did not exercise. Higher
percentages (92%) of males than females (63%) were exercisers. The study was limited
to only undergraduate students.
A three phase study to develop a scale to measure PA benefits and barriers was
conducted by Brown, Huber, and Bergman (2006). Three different groups of
undergraduate students aged 18 to 24 years were the samples. During the first phase,
exploratory interviews were conducted followed by administration of newly developed
Physical Activity Benefits and Barriers Scales (PABBS). The second phase also measured
students' selfreported PA. During the third phase, a finalized version of newly developed
P ABBS was administered to a group of students during a one week interval. The P ABBS
explored students' perceived PA benefits and barriers in addition to those noted in the
prior studies. The PABBS has 26 potential benefits and 24 potential barriers measured on
a 6-point Likert scale. Analysis of 50 items yielded 10 factors: low motivation,
psychological improvement, social benefits, physical appearance, lack of peer interest,
inconvenience, feel productive, time constraints, identity improvement, and unfamiliar
with equipment. A 9-factor solution explained 59.79% of the variance. Nine of the 10
factors were significantly correlated with strenuous PA across both sexes (p <.01).
Students were motivated to engage in PA by benefits related to psychological, physical
performance, pleasure oriented, social, and image maintenance and de-motivated by lack
of social support, time constraints, low motivation/fatigue, environmental/facility
obstacles, and self-consciousness during PA. The findings alerted the experts in the field
43
ii ii ,, ii ,I ,,1
I iii
1:
I :

to the critical role of motivation for PA. Like others, the study was limited by the use of
female, young Caucasian, undergraduate students. Other researchers also explored the
relationship between motivation to exercise and PA in other populations. Frederick and
Ryan (1995) distinguished between enjoyment, competence, and body-related
motivations for exercise and PA. They compared PA among individuals with sport as a
primary aim for doing exercise to individuals who have behavior regulation as the
primary aim of PA. The people with sport participation as primary reason for exercising
had higher levels of enjoyment and competence-related motives, whereas those with
fitness as the reason for exercising had higher levels of body-related motive. In a
longitudinal study, Ryan, Frederick, Lepes, Rubio, & Sheldon, (1997) found that high
adherers and low adherers to exercise differed significantly according to the amount of
baseline enjoyment, competence, and social factors present as motivations. No difference
was noted based on participants' level of motivations related to fitness or weight
management.
Motivation and demotivation related to exercise and PA were studied qualitatively
by Greaney et al. (2009) via 16 on-line focus groups discussions among 115 students
with a mean age of 19. 7 from eight universities. The participating students acknowledged
intrapersonal, interpersonal, and environmental factors as enablers as well as barriers to
weight management activities such as eating well, walking, and exercising. Intrapersonal
factors were not engaging in exercise, not eating healthy food, and temptation and lack of
discipline, and being bored. Similarly, Interpersonal factors included social situations
( e.g., going out for dinner, social drinking). Environmental factors identified were time
constraints associated with being a student, unhealthful food served at university
44

cafeterias, universal availability of unhealthful food, and lack of access to healthful food.
These factors appear to be ones that are relevant for university students in terms of
maintaining a healthy lifestyle.
This section presented the findings of key studies conducted for the purpose of
determining the motivation and demotivation in the form of perceived benefits and
barriers to exercise and PA. The studies were conducted with different aims and used
diverse measurement instruments but reported perceived benefits and barriers to exercise
and PA separately and/or in combination. The most frequently reported benefits of the
exercise improvements in psychological health, physical performance, social benefits,
image maintenance, physical appearance, and self identity. Commonly reported barriers
to exercise were lack of energy, social support, self-efficacy, and time along with
additional responsibilities and change in priority to academic success. lntrapersonal,
interpersonal, and environmental factors, called enablers and barriers, were also seen as
both motivators and de-motivators for adhering to weight management programs. These
studies were limited with the use of undergraduate students only.
Exercise Related Self-efficacy
Self-efficacy is defined as "people's judgments of their capabilities to organize
and execute courses of action required for attaining designated performances" (Bandura,
1986, p. 391). Exercise related self-efficacy is defined as a person's confidence about
his/her ability to do specific PA or exercise under specific circumstances (D' Alonzo,
Stevenson, & Davis, 2004). In a 3-part study, Rodgers et al. (2008) examined three
behavioral domains of self-efficacy: task, scheduling, and coping. Task-efficacy was an
individual's confidence in performing elemental aspects of exercise, coping self-efficacy
45

the individual's confidence in exercising under challenging situations, and scheduling
self-efficacy the individual's confidence in exercising regularly in spite of other time
demands (Rodgers et al, 2008).
The role of self-efficacy in initiation and maintenance of exercise and PA has
long been a part of medical, sociological, and epidemiological literature, Self-efficacy has
been found to be the most important determinant of the aspects of the frequency,
intensity, and duration of PA (Coureya & McAuley, 1994). Evidence suggests that
perceived self-efficacy for exercise has significant impact on individual's affect, thought,
motivation, and actions. Self-efficacy's ability to predict exercise behavior have been
tested among young adults with diabetes (Jonhston-Brooks, Lewis, & Garg, 2002), young
adults without illnesses (Marquez & McAuley, 2006; Anderson, Wojcik, Winett, &
Williams, 2006), older adults with or without illnesses (Hays & Clark, 1999; Resnick et
al., 2000), and people with other health conditions (Jonhston-Brooks, Lewis, & Garg,
2002). The limited studies of exercise related self-efficacy in graduate students
consistently found self-efficacy to be a significant mediator of PA McAuley et al.,
(2007), reported that older adults with higher level of self-efficacy following a 6-month
exercise intervention program were more likely to report higher levels of PA Similarly,
among young adults, increased levels of self-efficacy and positive effects were predictive
of higher levels of PA These findings strongly indicate that self-efficacy plays a positive
role not only in initiation but also in maintenance of the behavior.
Garcia and King (1991), in a longitudinal study, found that self-efficacy to
overcome barriers was a strong predictor of short term (6 months) and long term (12
months) exercise adherence (r= 0.37, n=60, p<.01). A study of sedentary individuals also
46
-,
11 !

found that the level of self-efficacy was a key determinant for PA four months after
termination of a structured exercise program (McAuley, 1992). Similarly, another study
by McAuley (1993), found self-efficacy to be the only independent variable that could
significantly predict participants' adherence to exercise during a 9-month follow up.
In a quasi experimental study (D' Alonzo, Stevenson, & Davis, 2004), 44
minority female, undergraduate college students participated in a 16-week planned
exercise program aimed at increasing exercise self-efficacy through planned PA sessions.
The hypothesis was that participating women experiencing more exercise benefits of
exercise will have increased level of exercise self-efficacy and continue to exercise post
intervention. Statistically significant differences were found in exercise self-efficacy and
perceived benefits and barriers scores immediate post intervention and eight weeks post
intervention. Participants with higher levels of exercise attendance perceived more
benefits and had higher levels of exercise related self-efficacy. Conversely, the
participants who attended PA sessions intermittently perceived higher levels of barriers
and had lower exercise self-efficacy.
Lapier, Cleary, and Kidd (2009) also related exercise self-efficacy to participation
in exercise programs among 50 patients with a mean age of 65 with coronary heart
disease. The "Self-Efficacy for Exercise Behavior Scale, SEEBS" developed by Sallis,
Pinski, Grossman, Patterson, and Nader (1988) was used. Higher scores indicated higher
self-efficacy, with those less than 70% indicating lower self-efficacy. The mean score on
the SEEBS was less than 70%, indicating low self-efficacy and increased risk for
dropping out of exercise programs. This study supported a relationship between exercise
self-efficacy and participation in exercise programs across the lifespan.
47
I
Summary of the Literature Review
The burden of CVD is growing with the global increase in the prevalence of
physical inactivity. There is ample evidence that most of the modifiable risk factors for
CVD-dyslipidemia, excess weight, diabetes, smoking, inactivity, and increased levels of
stress may be minimized to some extent by recommended levels of exercise and PA
alone. This exhaustive review of literature revealed that graduate students have been
studied for their mental wellbeing in the face of their current stress level. Despite findings
concerning an increased level of stress among graduate students and prevalence of CVD
risk factors, no study has ever attempted to examine their knowledge about CVD and
how that relates to their CVD prevention practice. This dissertation focuses on an
examination of the PA behavior of graduate students, not just the risk factors for CVD.
Increased PA alone has been found to be associated with reducing CVD risk factors such
as obesity, diabetes, hypertension, and dyslipidemia and has also been linked to a
reduction in smoking behavior and reduced stress level.
Theoretical Framework
Theory is a "conceptualization of the phenomenon of interest" (Kazdin, 2003, p.
124). Theory serves as a framework and guides the interpretation of relationships among
the study variables. Kazdin states that the goal of research is to "understand" a process
and that theory provides the underpinnings necessary to bring together "multiple
variables and processes" (Kazdin, 2003, p. 129). Albert Bandura's Social Cognitive
Theory along with Nola Pender's Health Promotion Model, provided the organizing
framework for this study. These two well established theories are well suited for
explaining motivating and de-motivating factors as they are linked to individual's
perception of self-efficacy. Also, self-efficacy is highly associated with health promoting
48

behavior such as exercise and PA (Sallis et al., 1986). Bandura (1977) maintains that
individuals with high level of self-efficacy or confidence in their ability to perform a
given task will be more likely to engage in the task.
Health Promotion Model
The theoretical basis for the health promotion model (HPM) focuses on the
multidimensional nature of individual's existence in which there are interpersonal and
environmental circumstances and interactions that determine an individual's commitment
to health and health promoting behavior. The HPM, originally developed in the early
1980s by Pender (Pender, 1996; Pender et al., 2005), has been regarded as a unique
framework that serves as "a guide for exploration of the complex bio-psychosocial
processes that motivate individuals to engage in healthy behaviors directed toward the
enhancement of health" (Pender, 1996, p. 51). The multi-dimensional factors within the
health promotion model explain motivating and de-motivating factors that may impact
self-efficacy of an individual or group, enhancing the individual's ability to adequately
engage in exercise and PA. Furthermore, the corresponding 43 question research tool (the
exercise benefits and barriers scale) developed by Sechrist, Walker, and Pender (1987) is
theoretically and psychometrically sound. After extensive examination of the wellness or
health promotion literature, this model was decided to be one of the best theories in this
area. Likewise, the exercise benefits and barriers scale (EBBS) is an instrument that is
specifically designed to measure multi-dimensional components of health behavior. The
following four themes of the Health Promotion Model guide explanation and also
measurement of motivating and de-motivating factors for exercise and PA among
graduate students.
49
1

I. Perceived motivations to execute a given behavior increase the likelihood of
commitment to action and actual perf01mance of the behavior.
2. Perceived barriers ( de-motivating factors) can limit commitment to action.
3. Situational influences in the external environment can increase or decrease
commitment to health promoting behavior.
4. Interpersonal influences such as families, peers, and health care providers have been
shown to affect individuals' predisposition to engage in health promoting behaviors.
Individual Characteristics
Personal factors · •.Demographic. ~ Biological •. Psrch?logical ·
"'•<Soeii:iculturalt"l''1•
Behavior- Specific Cognitions & Affects
Knowledge of CVD • cardfo__;ascu1ar
Diseases • Risk Factors • Prevention Strategies
Perceived Benefits &
Situational.lnffoences ;•
Figure I. Schematic Representation of Pender's HPM.
Behavioral Outcome
Immediate Competiog · .•... Demands{i!.,.,Prefefep.ces,, ..
EXERCISE/ PHYSICAL. ACTIVITY
Pender' s HPM has been chosen because it explores the factors and relationships
contributing to health promoting behavior. The model has been used to guide the
50
1 I
,,
11·
II

exploration ofbio-psychosocial processes that influence one's decisions to engage in
health behaviors and as a framework to predict health promoting lifestyles as well
(McEwen & Wills, 2002). Additionally, the model integrates nursing and behavioral
science with factors that influence people's ability to engage in and/or change health
behaviors. Figure I describes Pender' s HPM theory in a schematic representation.
Theory of Self-efficacy
While multi-dimensional factors surrounding an individual explain motivating
and de-motivating factors that may impact self-efficacy leading to health related
behavior, Social Cognitive Theory explains self-efficacy. Albert Bandura's Social
Cognitive Theory (SCT) is utilized to explain the level of self-efficacy as it is either
enhanced or diminished by motivating factors and de-motivating factors explained by
Pender's HPM.
According to Bandura (2001), the core determinants of a given behavior such as
exercise and PA is perceived self-efficacy as enhanced by knowledge of health risks and
benefits of different health practices. In short, this is perceived self-efficacy that one can
exercise control over one's health habits. With the publication of Social Foundations of
Thought and Action: A Social Cognitive Theory in 1986, Albert Bandura proposed a
theory of human functioning that emphasizes the role of self-beliefs. In this social
cognitive perspective, individuals are viewed as self-organizing, proactive, self
reflecting, and self-regulating. Human thought and human action are viewed as the
product of a dynamic interplay of personal, behavioral, and environmental influences that
they have. The theory specifically proposes that a given behavior by an individual is
significantly affected by three key factors: personal factors, environmental influences,
51
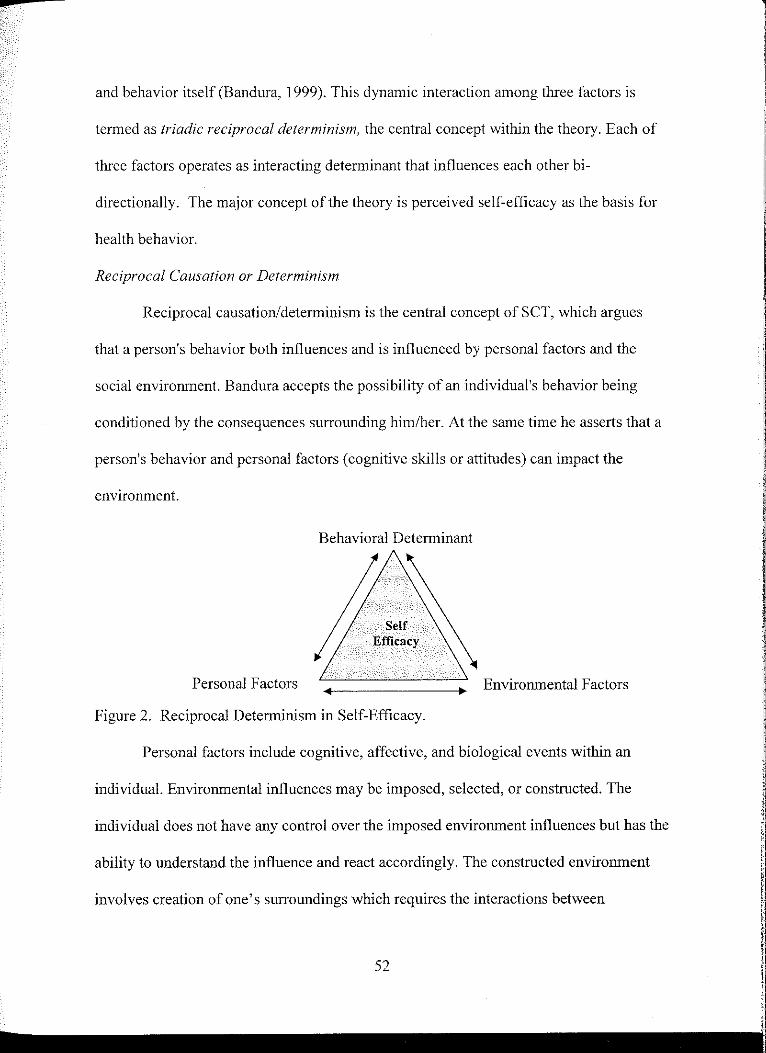
and behavior itself (Bandura, 1999). This dynamic interaction among three factors is
termed as triadic reciprocal determinism, the central concept within the theory. Each of
three factors operates as interacting determinant that influences each other bi
directionally. The major concept of the theory is perceived self-efficacy as the basis for
health behavior.
Reciprocal Causation or Determinism
Reciprocal causation/determinism is the central concept of SCT, which argues
that a person's behavior both influences and is influenced by personal factors and the
social environment. Bandura accepts the possibility of an individual's behavior being
conditioned by the consequences surrounding him/her. At the same time he asserts that a
person's behavior and personal factors (cognitive skills or attitudes) can impact the
environment.
Behavioral Determinant
Efficacy
Personal Factors Environmental Factors
Figure 2. Reciprocal Determinism in Self-Efficacy.
Personal factors include cognitive, affective, and biological events within an
individual. Environmental influences may be imposed, selected, or constructed. The
individual does not have any control over the imposed environment influences but has the
ability to understand the influence and react accordingly. The constructed environment
involves creation of one's surroundings which requires the interactions between
52

environment, behavior, and personal factors. Within this relationship, external influences
and internal change can alter behavior, which eventually may alter social structure.
Reciprocally, social structure, such as economics, socioeconomic status and family
dynamics, influences people indirectly by acting on internal self-regulatory factors
(Bandura, 1999).
Self-efficacy
Self-efficacy is defined as "people's judgments of their capabilities to organize
and execute courses of action required attaining designated types of performances" (p.
391). Self-efficacy is at the core of Social Cognitive Theory. The concept, "self-efficacy
beliefs", provides the foundation for human motivation, well-being, and personal
accomplishment. Perceived self-efficacy can have diverse effects on motivation, thought,
affect, and action. Bandura's (1997) key contention as regards the role of self-efficacy
beliefs in human functioning is that "people's level of motivation, affective states, and
actions are based more on what they believe than on what is objectively true" (p. 2). For
this reason, how people behave can often be predicted by the beliefs they hold about their
capabilities than by what they are actually capable of accomplishing.
Exercise self-efficacy is a reliable predictor of PA behavior and has been
described as a "critical variable for such behavior regardless of population." It is a
personal belief that one has the ability to engage in PA and exercise to produce change
through one's actions (Bandura, 2001). This ability of an individual depends on his/her
own agentic behaviors ( e.g., persistence), personal factors ( e.g., beliefs), and the external
environment (e.g., interactions with others). This network of behavior, personal factors,
and external environment represents a reciprocal process in which the three factors are all
53

interacting with one another to explain motivation, de-motivation, and behavior itself. In
order for an individual to succeed, the motivations (benefits) to engage in exercise
behavior need to outweigh the de-motivations (barriers).
For graduate students, multiple roles with increasing demands and competing
priorities may complicate this process ofreciprocal determinism. For example, the goals
related to career aspirations may have a negative impact on the goals to attend to physical
needs such as exercise and PA. Goals always exist in a hierarchy, wherein proximal goals
guide and motivate actions in the moment, and broader goals reflect personal values.
Proximal goals are necessary to achieve broader goals, whereas broader goals construct
proximal goals. According to Bandura (1999), mastery of proximal goals can result in
self-satisfaction in and of themselves, thereby becoming a source of self-motivation.
Bandura (1999) also notes that self-efficacy belief is influenced by motivation to
achieve a particular goal. Lower self-efficacy or lack of belief in one's capabilities will
result in non-achievement of goals; whereas, increased self-efficacy will bring about
more effort in order to achieve goals. Among graduate students with multiple roles, the
hierarchy of goals may be multifaceted. Due to increasing demands and conflicting
priorities, motivation to achieve a goal of engaging in regular PA may be mediated by
any effects the effort, time, and resources utilized may have on the achievement of goals.
Bandura (1977) believes that a person must value the outcomes or consequences that he
or she believes will occur as a result of performing a specific action. Outcomes
expectation of engaging in PA may be having immediate benefits ( e.g., feeling energized)
or long-term benefits ( e.g., experiencing improvements in CV health). Furthermore, those
with higher levels of self-efficacy tend to visualize success, whereas those with lower
54

levels tend to visualize failure, which can then impact motivation level (Bandura, 1999).
Thus, Bandura's self-efficacy construct has given researchers a meaningful way to
understand why some people do not participate in the recommended amount of exercise
and PA.
Combining Theories Together Within the Study
The concept of reciprocal determinism is highly significant in regard to the
graduate student population because of factors related to academics, career, family, social
norms, and finances. The perception of environmental structure may influence choices,
feelings of control, and the ultimate decision whether or not to become physically active.
Students that are able to construct their own environment will perceive the more control;
because create their choices, and probably balance multiple roles, academics and personal
health more effectively. Pender's HPM argues that the individual's ability to engage in
health promotion activity depends upon factors such as demographic characteristics and
behavior specific cognition (CVD knowledge). These two factors along with Bandura's
reciprocal determinism appear on the surface of the study framework (Figure 3) and are
connected with the motivating and de-motivating factors by unidirectional arrows.
The next level in the structure is perceived self-efficacy, which is connected by a
unidirectional arrow originating from the motivating/de-de-motivating factors. If a person
perceives high level of motivation (exercise benefits), he/she then will perceive a higher
level of self-efficacy. But, if a person perceives a higher level of demotivation ( exercise
barriers) then he/she will perceive a lower level of self-efficacy. In order for an individual
to perceive a high level of self-efficacy, perceived motivations must outweigh the de
motivation. At the core/center of the theoretical structure is PA or exercise, the major
55

outcome variable in the study. The structure communicates the philosophy that if a
person perceives a high level of self-efficacy, he/she will engage more in PA and
exercise. Conversely, if a person does not perceive high level self-efficacy due to
perception of a high level of de-motivating factors, then he/she will not engage in
exercise and PA as desired.
CVD Knowledge & SelfRisk Perception
Motivation De-motivation
Perceived Self-efficacy
Figure 3. Schematic Representation of Theoretical Framework
56
Individual Characteristics/ Demographics
l I '
I

CHAPTER III
METHODOLOGY
This chapter discusses the methodology of the study, including the design, setting,
sampling, instruments, data analysis plan, and protection of human subjects.
Research Design
Using a descriptive/correlational design, a total of9 research questions and related
hypotheses regarding graduate students' knowledge and behaviors about CVD and its
prevention were explored.
Sampling
Setting/Target Population
The target population consisted of 349 graduate degree level students enrolled in
various academic programs at the University of North Dakota, a medium size research
university in the upper Midwest.
Sampling Method
A purposive sampling technique was used to recruit full time graduate students
enrolled in various academic programs. They were recruited through an email blast sent
out by Office oflnstitutional Research of the University. An online version of the survey
was distributed to all 1,122 full time graduate students. Inclusion/exclusion criteria were
as follows:
1. Student enrolled in graduate degree programs.
2. Enrolled full time.
57

3. Able to read and understand English.
4. Willing to participate in the study.
The decision to recruit only full time graduate students was based on the fact that full
time and part time students differ in regard to their time management, academic work
load distribution, and financial responsibility.
Sample Size Determination
The sampling frame was the cohort of all full-time graduate students enrolled at
the University of North Dakota in January 2011. An appropriate sample for the study
was determined based on a commonly used approach called "N versus V" (number of
observations vs. number of variables). This approach is generally used when the sample
is not randomized and the study does not compare the group means. At least 10 subjects
per independent variable is strongly suggested for multivariate analyses. Because 21
independent variables were identified, following this statistical rule of thumb, this study
required a minimum sample size (NJ of210 (Knapp & Campbell-Heider, 1989; Munro &
Page, 1993; Nunnally & Bernstein, 1994).
An internet based sample size calculator available of the web was also used to
determine the sample size. With a sampling frame of 1,122, a confidence interval of .5,
and confidence level of 95% were entered into the calculator; a sample size (N) of 286
subjects was indicated (research info.com, 2010). The goal was to obtain a large enough
sample size to have a better chance of capturing statistically significant relationships at
all levels of variables. Based on the above calculations, a sample size of at least 300 was
set. Reminder emails were sent to the students after two and four weeks. The final
sample size was 349 students.
58
l
i I

Instrumentation
A customized survey packet consisting of six sections was developed. The six
sections were; 1) cardiovascular disease knowledge, 2) personal health behavior
information, 3) exercise and PA behavior, 4) perception of exercise self-efficacy, 5)
perceived motivation and demotivation for exercise and PA, and ( 6)
personal/demographic information section. Table 1 depicts the variables in the study,
methods of measurement, tools used on measurement, and the levels of measurement for
each variable.
Current knowledge about CVD was measured by a researcher-developed
questionnaire based on a review of literature and consultation with experts in the field.
Personal health behaviors related to smoking status, fruit and vegetable intake, alcohol
consumption, and overall sleeping behavior were measured by items modeled after those
used in the Behavioral Risk Factor Surveillance System (BRFSS) survey. Students'
current level of PA was measured with the short form (18 items) of"The International
Physical Activity Questionnaires (IPAQ). A 9-item 10-point Likert Multidimensional
Self efficacy Scale (MSES) measured three types of exercise related self-efiicacy; task,
coping, and scheduling (Rodgers et al. 2008). Perceived motivating and de-motivating
factors for exercise and PA were examined using the "Exercise Benefits and Barriers
Scale" (EBBS), a 42-item, 4-point Likert scale. The final section consisted of
personal/demographic information, including age, gender, ethnicity, marital status,
academic area of study, level of study, and employment status.
59
I Ii
: n " I" ,! !
i i I
I I
!i :r I' ii tf 11
I 11
'1 11 1,,
i1

°' 0
Table I. The Study Variables, Tools, Methods and Levels of Measurement.
Variables
CVD Knowledge
I. CVD knowledge
2. Knowledge ofCVD risk
factors.
3. Knowledge of prevention
practices
Exercise related self-efficacy
4. Task
5. Coping
6. Scheduling
Measurement Method
Researcher developed
CVD knowledge
questionnaire
Multidimensional Self
efficacy scale: Coping,
Scheduling, Task
Efficacy Scale
Motivating & De-motivating Exercise Benefits factors for exercise and physical /Barriers Scale (EBBS) activity. (revised for graduate 7. Exercise benefits student population. 8. Exercise barriers
Physical Activity and Exercise
9. VPA
10. MPA
11. Walking
The short-form of
International Physical
Activity Questionnaire
(IPAQ)
:a·---- --- c->. •-'•"' --,---,.--~=---,----~~
Measurement Tool
The questionnaire will ask participants to
choose 4 conditions that qualify to be CVD disease, 5 CVD risk factors, and 5 common
preventive strategies. Each correct answer wi!! be assigned 2 points. If participants select al!
correct answers, they will score highest score
and vice versa.
9 items. Measures the degree of confidence in
ability to exercise regularly rated on I 00 point
scale for each item.
42 items, 4-point Likert scale: Strongly agree
to strongly disagree
9 items, Estimates the time spent performing
physical activities (moderate to vigorous) and
inactivity (time spent sitting).
L -~- ,-=,,,a~ s,.:. --·
Scale of Measurement
Ratio scale measurement
Higher numbers indicate that
participants have higher knowledge on
CVD. It does have a fixed zero point
that means participants scoring O have
no knowledge.
Interval scale
Ordinal scale. The total scores for instrument (Benefits/Barriers
combined) range from 43 to 172. The
higher the score, the more positively
the individual perceives exercise
benefits and vice versa. Barrier Scale items are reverse-scored.
Ordinal scale. Computation of the final
score is done by summation of the
duration (in minutes) and frequency
{days) of walking, moderate-intensity and vigorous-intensity activities.
c~c~~ 4

°' -
Table I. Cont.
Personal Health Behavior
12. Smoking status
13. Alcohol behavior
14. Fruits & vegetable intake
Personal Health Behavior
15. Sleeping behavior
Demographic factors 16. Age
17. Gender
18. BM! 19. Marital status
20. Employment status
21. Ethnicity 22. Educational level
23. Academic area
Researcher developed
health behavior questionnaire
Researcher developed
health behavior
questionnaire
Researcher developed
demographic questionnaire
,, ,, "" ,, '., ... , ... __ .,,,,, ..... '"~.~ ........ "".="""·-·'''" ·-·"--~-"'"- --=~- -""
Items from BRFSS Smoking (nominal scale)
Smoking (cuffent, former, never~smoker) Alcohol intake (nominal & ratio)
Alcohol intake (current drinker, regular, drinks Fruits & vegetable intake (ratio) per week}
Fruits & vegetable (servings per day)
A single item derived from BRFSS. The
question asks the participants to choose a
range of numbers in response to the following
question.
During the past 30 days, for about how many
days have you felt you did not get enough rest
or sleep?
Demographic questionnaire
Ratio Scale Measurement
The respondents are required to
provide the actual number of days that
they did not get enough or felt did not
get enough sleep and rest
Age group (Ordinal scale)
Gender (Nominal scale)
Marital status (Nominal scale) Employment status (Nominal scale)
Race (Nominal scale)
Educational level (Nominal scale)
Academic area (Nominal scale)
Income level (Ordinal scale)
·1
. -··='-·==>Olli

Measures of Cardiovascular Disease Knowledge
As noted above, cardiovascular disease knowledge was assessed using a
researcher-developed questionnaire which consisted of four multiple-choice questions.
The first three addressed CVD knowledge; the fourth concerned the students' perception
of their risk for CVD. Participants were given choices in regard to various types of
CVD, general CVD risk factors, and general CVD prevention strategies. The choices
were based on the elements of CVD, risk factors, and prevention strategies such as
exercise and PA, weight management, nutrition, blood pressure control, smoking
cessation, diabetes control, and cholesterol management. Participants were required to
select at least four common CVD conditions, five common CVD risk factors, and five
commonly utilized CVD prevention strategies. Two points were assigned for each
correct answer selected and O for each wrong answer. Points for each area of CVD
knowledge were summed to obtain final CVD knowledge scores: 0- 8 for knowledge
about CVD, 0-10 for knowledge of CVD risk factors, and 0-10 for knowledge of CVD
prevention practices. Finally, an aggregate CVD score combined the scores for CVD,
CVD risk factors, and CVD prevention practices. A total CVD knowledge score was
obtained by summing across the categories, and mean scores were calculated. For the
measure of perception of risk for CVD, participants were asked to select high risk,
moderate risk, or low risk.
The CVD knowledge questionnaire was piloted in a sample of 50 graduate degree
students, and necessary modifications were made. Content validity of the questionnaire
62

was also tested via the expert opinions of a cardiologist, PhD prepared nurses, and a
statistician.
Measures of Personal Health Behavior
CVDs as the leading causes of death and disability are directly associated with
behavioral risk factors such as tobacco use, poor diet, inadequate sleep, inadequate PA,
and excessive alcohol consumption. Items to elicit participants' responses regarding the
prevalence of behavioral risk factors were modeled after the Behavioral Risk Factor
Surveillance System Survey (BRFSS). Specific questions were asked about participants'
smoking behavior, alcohol consumption behavior, and sleeping difficulties. A single item
was added to determine daily consumption of fruits and vegetable.
Smoking Behavior
Smoking is one of the six major risk factors for CVD. Smoking is known to be the
most important risk factor for young men and women under the age 50 (AHA, 2010). In
this study, two aspects of smoking behavior were measured. A single indicator variable
for smoking behavior was created for this study. Smoking status was coded 1 (current
smoker), 2 (never smoker), and 3 (ex-smoker).
Alcohol Consumption Behavior
Students were first asked if they consumed alcoholic beverages. If the students
answered yes, then they were asked to respond with the number of drink/s per
day/week/month. The actual number of drinks was the measure. According to the
BRFSS, one drink is equivalent to a 12-ounce beer, a 5-ounce glass of wine, or a drink
with one shot ofliquor. The participants' responses were also coded 1 for current drinker
and 2 for non drinker.
63
1 '
'
I
i\
11

Sleeping Behavior
Sleep deprivation is exceedingly common in today's society; data suggest
progressive reductions in sleep duration for North Americans. Although the
neurocognitive consequences of sleep deprivation are well established (Van Dongen,
Maislin, & Mullington, & Dinges, 2003), emerging data suggest major metabolic
(Spiegel,Tasali, Penev, & Van Cauter, 2004; Patel, Malhotra, White, Gottlieb, & Hu,
2006; Flier & Elmquist, 2004) and CV consequences to chronic partial sleep restriction
(Ayas et al., 2003). Graduate students often complain about poor sleep due to stressful
academic environment and the uncertainty of their success in obtaining their degree
(Pallos, Amada, Doi, & Okawa, 2004; Forquer, Camden, Gabriau, & Johuson, 2008).
Overall sleeping behavior was measured using a single item question derived from the
BRFSS. The participants were asked if, during the past 30 days, they felt that they did not
have enough rest or sleep; this was coded 1 (yes) or 2 (no). If they answered yes, they
were asked for about how many days they had felt that they did not get enough rest or
sleep. The responses were coded as 1(1-2 days), 2 (3-4 days), 3(5-6 days), and 4 (7 days
or more). They could skip the question if they did not feel they were having any sleep
problems.
Consumption of Fruits and Vegetables
Prospective cohort studies have suggested an association between increased fruit
and vegetable consumption and a reduced risk of CVD (Dauchet, Amouyel, Hercberg, &
Dallongeville, 2006; He, Nowson, MacGregor, 2006). This evidence has led to specific
recommendation for increased fruit and vegetable consumption from the American Heart
Association (Appel et al., 2006). A single item measured daily consumption of fruits and
64

vegetables by students: "How many servings of fruits and vegetables do you eat on a
daily basis?" The responses were coded as 1(0-1 servings), 2(2-3 servings), 3(4-5
servings), 4(6-7 servings), and 5 (8 servings or more).
Measures of Physical Activity and Exercise
PA and exercise levels were measured with the short form (7items) "International
Physical Activity Questionnaire (IPAQ). The IPAQ was developed in 2002 in order to
provide a standard instrument that could be used to obtain comparable estimates of PA
participation from surveillance system data nationally and internationally. The instrument
has been translated into at least 14 languages and modified to accommodate culturally
appropriate definitions of vigorous and moderate PA. The IP AQ shorter version was used
because the study's purpose was to estimate participants' level of PA without going
deeper into the five domains addressed by the 27-item longer version. The shorter
version summarizes the five domains, and both versions have been shown to yield similar
results in term of PA measurement (Craig et al., 2003). The short form IPAQ is a 7-item
scale assessing the total minutes spent in vigorous PA (VPA), moderate intensity PA
(MPA) and walking during the last 7 days (3 items). The days spent doing each level of
PA are assessed (3 items). Metabolic Equivalents (METs)-minutes is calculated by
multiplying the amount of minutes by 6 (vigorous), 4 (moderate), 3.3 (walking) (3 items).
The IPAQ is scored according to the guidelines for three categories oflevels of PA:
a. Category one. These participants do not meet the criteria for categories two or three.
They are considered inactive.
b. Category two. These people are minimally active. Participants meet the following
three criteria: three or more days of vigorous PA of at least 20 minutes per day; five
65
I 'I ,. [ I I i I
:J
I 'I i) 11 .,

or more days of moderate intensity PA or walking of at least 30 minutes per day; or
five or more days of any combination of walking, moderate-intensity or vigorous
intensity PA achieving a minimum of at least 600 MET-min/week.
c. Category three. This category of activity level qualifies as health enhancing
physical activity (HEP A). Individuals in this category engage in vigorous intensity
PA on at least 3 days and accumulating at least 1500 MET-minutes/week or 7 or
more days of any combination of walking, moderate intensity or vigorous intensity
PA achieving a minimum of 3000 MET-minutes/week.
The IP AQ has acceptable measurement properties; at least as good as other
established self-report instruments (IPAQ, 2005). A study of the reliability and validity of
the IPAQ in 12 countries found it to yield repeatable data with Spearman's Rho clustered
around 0.8. Criterion validity exhibited a median of about 0.30 to .60; this was
comparable to most other self-report validation studies (Craig et al., 2003).
In this study, scores for the three subscales, walking, moderate PA, and vigorous
PA were used to calculate the total IPAQ score. The standardized Cronbach's Alpha
score for these three items was 0.55. However, the IPAQ scores were not normally
distributed so nonparametric Spearman correlation coefficients (p) were calculated as the
primary measure ofreliability. The total reliability coefficient correlations scores were
.89 (p. = .000) for vigorous PA, .88 (p. = .000 for moderate PA, and .89 (p. = .000) for
walking (Table 2). These numbers are consistent with those reported by Craig et al.
(2003).
Measures of Exercise Related Self-Efficacy
66
l I
Ij
I I I I

Exercise related self-efficacy was measured by the Multidimensional Self-Efficacy
Scale (MSES Exercise self-efficacy is defined as participants' confidence in their ability
to exercise or become physically active regularly (most days of the week) under various
circumstances. The scale uses a 100% confidence scale ranging from 0% (no confidence)
to 100% (absolute confidence). Following the stem "How confident are you that you
can", three items measured task self-efficacy (e.g., "complete the exercise using proper
technique"), three items measured coping self-efficacy (e.g., "exercise when you lack
energy"), and a final three items measured scheduling self-efficacy (e.g., "arrange your
schedule to include regular exercise"). Responses for Likert items (9 items) on the MSES
were entered as the actual values between IO and I 00. For final analysis, the mean scores
for each of the three subscales, task, coping, and scheduling self-efficacy, were
calculated.
Table 2. Reliability oflnternational Physical Activity Questionnaire (IPAQ): Spearrnan's Correlation Coefficient Based on Total MET-Minute Per Week.
Correlations MET-Min MET-Min MET-Min for for VPA for MPA walking
Spearman's MET-Min Coefficient 1.000 .349 .079 rho forVPA Sig. (2-tailed) .000 .000 .141
N 349 349 349 MET-Min Coefficient .349" 1.000 .324"
for MPA Sig. (2-tailed) .000 .000 N 349 349 349
MET-Min Coefficient .079 .324" 1.000 for walking Sig. (2-tailed) .141 .000
N 349 349 349
** Correlation is significant at the 0.01 level (2-tailed). VPA~ vigorous physical activity, MPA~ moderate physical activity
The MSES has been found to have sound psychometric properties. In a series of
studies by Rodgers et al. (2008), self-efficacy was assessed using the same 9 items.
Cronbach's alpha ranged from .76 to .95 across all three measurement scales, scheduling,
67

task, and coping, reflecting acceptable internal consistency. These three dimensions of
self-efficacy have been validated together or in isolation in many other studies.
In this study, Cronbach alpha reliability estimates of the MSES were 0.91 for the
entire scale (9 items), 0.93 for the task efficacy subscale (3 items), 0.87 for coping
efficacy (3 items), and 0.93 for the scheduling efficacy sub scale (3 item). Principal
component analysis estimated the internal structure of the MSES. Two factors explained
76.09% of the total variance; the first factor explained 60.8% (EV= 5.47) and the second
factor 15.24% of the variance (EV= 1.37) (Table 3). The 2-factor solution using varimax
rotation with the factor loading matrix resulted in all nine items of the MSES correlating
at least 0.7 with at least one other item; this indicated reasonable factorability (Table 4).
The Kaiser-Meyer-Olkin measure of sampling adequacy was .87, above the commonly
recommended value of .6, and Bartlett's test of sphericity was significant (p= .000).
Table 3. Eigenvalues and the Proportion of the Total Variance for the Multidimensional Self-efficacy Scale (9 items): Principal Components Analysis with Varimax Rotation.
Total Variance Explained Extraction Sums of Sq. Rotation Sums of Sq.
Initial Eigenvalues Loadings Loadings Component Variance Cum. %of
Total % % Total Variance% Cum% Total Variance Cum%
5.476 60.844 60.844 5.476 60.844 60.844 3,881 43. 117 43.117
2 1.372 15.247 76.091 1.372 15.247 76.091 2.968 32.974 76.091
3 .920 10.217 86.308
4 .365 4.060 90.368
5 .216 2.399 92.767
6 .200 2.219 94.986
7 .179 l.986 96.972
8 .140 l.555 98.527
9 .133 1.473 100.000
Extraction Method: Principal Component Analysis
'ii
11
,f
I
I, ( 1:
, Ii
1:
I,
I
I 1,,
I
f I,
I I
I
I

Table 4. Factor Loadings and Communalities for the Multidimensional Self-efficacy Scale (9 items): Principal Components Analysis with Varimax Rotation.
Rotated Component Matrix
Items on the scale Component
How confident are you to exercise when you feel discomfort?
How confident are you to exercise when you lack energy?
How confident are you to exercise when you do not feel well?
How confident are you to complete your exercise using proper technique?
How confident are you to fo1low direction to complete exercise?
How confident are you to perform a11 the required movements?
How confident are you to include exercise in your daily routine?
How confident are you to consistently exercise 5 times a week?
How confident are you to arrange your schedule to include regular exercise?
1 .729
.847
.820
.289
.229
.272
.755
.776
.760
Extraction Method: Principal Component Analysis, Rotation Method: Varimax with Kaiser Nonnalization.
Measures of Motivating and De-motivating Factors
2 .308
.195
.060
.881
.908
.900
.421
.349
.349
Participants' perceptions of factors that motivate or de-motivate them towards
engagement in exercise and PA, are measured with the "Exercise Ben~fits and Barriers
Scale (EBBS)". This instrument was initially developed by Sechrist et al., in 1987.
Though the instrument uses the terms benefits and barriers to exercise, these two terms
"benefits" and "barriers" of exercise and activities were seen to be equivalent to
motivating and de-motivating factors for exercise and PA in this study.
The EBBS is a 43 item questionnaire with Likert items which have been found to
have the following internal reliabilities: overall scale, .89; benefits scale, .89; barriers
scale, . 77. Twenty-nine items address perceived benefits and 14 items address perceived
barriers to exercise. Previous research has yielded nine factors: life enhancement,
physical performance, psychological outlook, exercise milieu, social interaction, time
!!1·
!! ,,
Iii [i !!I
ii' ;;
Ii
II
I

expenditure, preventing health, physical exertion, and family encouragement (Schrist,
Walker, & Pender, 1987). In this study, the 29 Liker! items of the exercise benefits scale
(motivating factors) were coded 1 = strongly disagree, 2= disagree, 3= agree, and 4=
strongly agree. The 14 items on the exercise barriers scale (de-motivating factors) were
reverse coded 1 = strongly agree, 2= agree, 3= disagree, and 4= strongly disagree. The
total score is interpreted as greater exercise higher benefits and fewer barriers. For final
analysis, the scores on exercise benefits and barriers scales were summed and mean
scores were calculated for both exercise benefits and barriers (Sechrist et al., 1987).
The EBBS has been used to access perceived barriers and benefits of exercise
among a wide range of adult populations and shown to carry sound psychometrics. In the
current study, the Cronbach alpha reliability estimates for the EBBS were 0.93 for the
entire scale, 0.94 for the exercise benefits subscale, and 0.83 for the exercise barriers
subscale. Principal components analysis (PCA) estimated the internal structure of the
EBBS; this method identifies the composite benefits and barriers scores underlying the
EBBS. The first five components explained a cumulative variance of 62% (Table 5). The
initial Eigenvalues (EV) showed that the first component explaining 41 % of the variance
(EV = 11.9) was the strongest. The explained variance for the remainder of the
components ranged from 6.99% for the second component (EV= 2.03) to 4% for the fifth
component (EV= 1.17). As shown in Table 6, a 5-factor final solution based on a
varimax rotation of the factor loading matrix found that all 29 items in the exercise
benefits sub scale correlated at least .5 with at least one other item; this suggested
reasonable factorability. The Kaiser-Meyer-Olkin measure of sampling adequacy was
l iJ !, 'i ! I
, I
[' A I 'I
I

-.94, above commonly recommended value of .6, and Bartlett's test of sphericity was
significant.
Table 5. Eigenvalues and the Proportion of the Total Variance Explained Derived from Principal Components Analysis of the Exercise Benefits Scale (29 items).
Total Variance Explained Extraction Sums of Squared Rotation Sums of Squared
Component Initial Eigenvalues Loadings Loadings %of Cumulative %of Cumulative %of Cumulative
Total Variance % Total Variance % Total Variance %
11.928 41.132 41.132 11.928 41.132 41.132 6.496 22.400 22.400
2 2.030 6.999 48.131 2.030 6.999 48.131 3.866 13.330 35.730
3 1.482 5.109 53.240 1.482 5.109 53.240 2.948 10.167 45.896
4 1.361 4.695 57.935 1.361 4.695 57.935 2.761 9.520 55.416
5 1.176 4.055 61.990 1.176 4.055 61.990 1.906 6.574 61.990
6 .957 3.299 65.289
7 .886 3.055 68.345
8 .787 2.713 71.058
9 .686 2.365 73.423
10 .601 2.072 75.495
11 .568 1.957 77.452
12 .559 1.927 79.379
13 .538 1.857 81.235 14 .531 1.833 83.068 15 .485 1.674 84.742
16 .451 1.556 86.298
17 .439 1.513 87.810
18 .402 1.386 89.196 19 .381 1.315 90.511 20 .365 1.258 91.769 21 .357 1.232 93.002 22 .322 1.109 94.111
23 .296 1.021 95.132
24 .278 .958 96.090
25 .255 .878 96.968
26 .241 .831 97.799
27 .237 .817 98.616 28 .211 .726 99.342
29 .191 .658 100.000
Extraction Method: Principal Component Analysis.
PCA with varimax rotation was also conducted with the 14 items of the Exercise
Barriers subscale. Four factors explained 61.6% of the variance (Table 7). The first
component explained 31.81 % of the variance (EV = 4.45), the second component
explained 12.72% (EV= 1.78), and the third and fourth components explained 9.08% and
71
l I
i II
I
ll ,,
'I I
I I I
'
I

--8.00% of the total variance, respectively (EVs = 1.27 and 1.12). The final 4-factor
solution ofvarimax rotation of the factor loading matrix is depicted in Table 8. All 14
items in exercise barriers sub-scale correlated at least .6 with at least one other item,
suggesting reasonable factorability. The Kaiser-Meyer-Olkin measure of sampling
adequacy was .82, above the commonly recommended value of .6, and Bartlett's test of
sphericity was significant.
Table 6. Factor Loadings and Communalities Based on a Principal Components Analysis with V arimax Rotation for the Exercise Benefits Subscale (29 items).
Rotated Component Matrix
Component
2 3 4
My muscle tone is improved with exercise. .742 .187 .123
Exercise improves the way my body looks. .739 .157 .300
My physical endurance is improved by exercising. .738 .224 .286 .125
Exercising improves functioning ofmy CV system. .696 .197
Exercise increases my muscle strength .684 .313
Exercise increases my stamina. .646 .199 .315 .116
Exercising increases my level of physical fitness. .646 .358
Exercising improves my self-concept. .636 .233 .346 .146
Exercise improves overall body functioning for me. .591 .158 .334 .276
I will live longer if I exercise .572 .342 .134
Exercise gives me a sense of personal accomplishment .525 .357 .152 .157
My disposition is improved with exercise. .502 .367 .464 .163
Exercise decreases feelings of stress and tension for me. .307 .783 .144
I enjoy exercise. .144 .759 .285
Exercise improves my mental health. .383 .701 .170
Exercising makes me feel relaxed. .223 .578 .352 .286
I have improved feelings of well being from exercise .538 .543 .247
Exercise improves my flexibility. -.105 .632
Exercising helps me sleep better at night. .383 .259 .603 .166
Exercising increases my mental alertness. .420 .262 .601 .177
Exercise improves the quality of my work. .335 .298 .546 .400
Exercise allows me to carry out normal activities without becoming tired. .420 .119 .485 .405
Exercise helps me decrease fatigue. .246 .377 .438 .322
Exercising is a good way for me to meet new people .109 .224 .737
Exercising increases my acceptance by others. .189 .675
Ex. lets me have contact with friends & persons l enjoy .343 .615
Exercise is good entertainment for me. .155 .495 .129 .608
Exercising will keep me from having high BP. .182 .169 .130
I will prevent heart attacks by exercising .259 .129 .107
Extraction Method: Principal Component Analysis, Rotation Method: Varimax with Kaiser Nonnalization.
72
5
.143
.353
.219
.194
.113
.343
.180
.155
.104
.157
.169
.107
.134
.836
.802
I 'I
i
Ii.I
I 11
ti I: li I' ii ,I !1
II I
i! :'.

Table 7. Eigenvalues and the Proportion of the Total Variance Explained: Principal Components Analysis of Exercise Barriers Scale (14 items).
Fae Initial Eigenvalues Ext. Sums of Sq. Loadings Rotation Sums of Sq. loadings Total Variance% Cum. % Total Varinace Cum.% Total Variance Cum.%
% % 1 4.454 31.818 31.818 4.454 31.818 31.818 2.458 17.554 17.554 2 1.780 12.712 44.530 1.780 12.712 44.530 2.160 15.430 32.985 3 1.271 9.080 53.609 1.271 9.080 53.609 2.102 15.016 48.001 4 1.121 8.009 61.618 1. I 2 I 8.009 61.618 1.906 13.617 61.618 5 .850 6.072 67.690 6 .719 5.138 72.828 7 .694 4.960 77.789 8 .606 4.330 82.118 9 .543 3.882 86.000 10 .494 3.527 89.527 11 .461 3.289 92.816 12 .388 2.772 95.589 13 .344 2.454 98.043 14 .274 1.957 100.00
Extraction Method: Principal Component Analysis
Table 8. Factor Loadings and Communalities for the Exercise Barriers Subscale (14 items): Principal Components Analysis with Varimax Rotation.
Rotated Component Matrix
Component 2 3 4
Exercise facilities do not have convenient schedules for me .745 .147 There are too few places for me to exercise. .712 .127 .190 Places for me to exercise are too far away. .692 .218 .132 It costs too much to exercise. .663 .103 .153 .158 Exercise tires me. .847 I am fatigued by exercise. .835 Exercise is hard work for me. .122 .701 .127 .190 Exercise takes too much time from my family responsibilities. .168 .831 .208 Exercise takes too much time from family relationships. .194 .830 .213 Exercising takes too much of my time. .309 .340 .624 My spouse (or significant other) does not encourage exercising. .282 .807 My family members do not encourage me to exercise. .167 .334 .743 I think people in exercise clothes look funny .266 .196 .511 I am too embarrassed to exercise. .437 .264 .481
Extraction Method: PCA, Rotation Method: Varimax with Kaiser Normalization.
The 43-item Exercise Benefits and Barriers Scale (EBBS) demonstrated good
psychometric properties and was well suited to the study of motivation (perceived
73
l '!
. !
:i
ii I! ~
II
I

exercise benefits) and demotivation (perceived exercise barriers) for exercise and PA
among graduate students.
Personal/Demographic Information
Information was collected about participants' age, gender, race, marital status,
employment status, current educational level, academic area of study, and current
household income. "Level of study", "gender", and "marital status" were dichotomous
items. "'Level of study," was coded O =masters, 1 =doctorate", "gender as O = male, 1 =
female and "marital status" as 1 = married and O = not married/single/divorced.
Continuous variables such as age and BMI were calculated with actual numbers.
"Ethnicity" and "study area" were nominal variables. "Ethnicity" was coded as 1 =
Caucasian), 2 = Hispanic/Latino, 3 = African/African American, 4=American
Indian/ Alaskan native, and 5 = Asian/Pacific Islanders. "Study area" was coded as 1 =
Health sciences, 2 = Arts and sciences and 3 = Education and human development. For
the regression analyses, the nominal variables with greater than two categories were
dummy coded into dichotomous variables; the process is described later in this chapter.
Procedure
Data Collection
After permission to access students for the survey was obtained from the
Institutional Review Board of the University of North Dakota, a complete list of email
addresses of all the students enrolled full time in each of the graduate degree programs
was obtained from the Office oflnstitutional Research. The survey questionnaire was
then distributed via the Survey Monkey electronic survey system. Reminder emails were
sent at two and four weeks. Completion and submission of the survey was considered
74
/i m

the consent to participate. Upon receipt of the completed survey, the participant's email
was entered into the face page of the electronic survey; a statement was included that
assured participants that there were no known risks associated with their participation in
the study and no direct benefit from the participation was expected. Upon receipt of the
completed survey, the students' email addresses were entered in a drawing for a chance
to win one of two 4th Generation Apple iPod Touch.
Data were analyzed in order to determine the percentages of missing data in the
entire data set: there were no missing data or variables. Survey responses were entered
into an IBM SPSS Statistics Professional Edition, 2011 for analysis. The database was
stored on a secure dedicated research laptop computer. Data were backed up on a
research dedicated external storage device (USB memory stick). The original paper
based surveys are housed in a secure filing cabinet for three years prior to being
destroyed.
Data Analysis
The data were entered into Excel and IBM SPSS Statistics Professional Edition,
2011 for immediate analysis. Prior to analysis, the data were inspected and verified by a
doctorally prepared nurse researcher. After entering each set of data, it was reviewed and
validated for accuracy of input.
Descriptive analyses included summary tables, charts, percentages, and measures
of central tendencies (Mertler & Vannatta, 2007). Prior to conducting regression
analysis, the data were screened for any omissions and/or outliers. Several linear and
multiple regression analyses were utilized to check the correlations between independent
and dependent variables as stated in hypotheses. Due to the presence of multiple
75
l
I
I I

dependent and independent variables in the study, coJTelation matrices were created for
all the variables. Psychometrics of all three scales (EBBS, ESES, and IP AQ) were
verified by Cronbach alphas and exploratory factor analysis.
The Kolmogorov-Smirnov and Shapiro-Wilk tests were used to determine the
distribution pattern of the principal variables. The p-values for both the tests were less
than .05, indicating non- normal distribution of the data for age, BM!, all type ofCVD
knowledge score, exercise motivation, exercise-demotivation, all levels of physical
activity (VPA, MPA, & Walking), and all type of self efficacies (task, coping, and
scheduling).
Handling of Non-Normally Distributed Data
The seven socio-demographic variables were: age, gender, marital status,
employment status, ethnicity, level of study, and broader area of study. Age was a
continuous variable; gender, marital status, employment status, and level of study were
dichotomous variables with only two categories. Ethnicity and broader study areas were
categorical variables having more than 2 categories and thus needing transformation prior
to their use in regression analysis.
Ethnicity had five categories (Caucasian, Hispanic/Latino, African/ African
American, American Indian/Alaska Natives, and Asian/Pacific Islander). Ethnicity was
binary coded into four proxy variables commonly known as proxy variables (Table 9)
using either O or 1 (Kennedy, I 98 I). In all proxies created, a zero score was assigned to
"Caucasian" to be used as reference variable and either O or I was assigned to each of the
other categories. Broader study area had three categories (health sciences, art and
sciences, and education and human development); it was binary coded into two proxy
76
I
1:
1.111
I;
'I' :11
'I :1
'r

variables (Table 10). In both proxies, health sciences was assigned a zero. When the
study area was art and sciences, it was assigned 1 and education and human development
was assigned 0, and vice versa. In the analysis, "Health Sciences" was used as reference
category.
To avoid the violation of the assumptions ofnom1ality of the data distribution for
regression analysis, the Kolmogorov-Smimov and Shapiro-Wilk tests were used to
determine the data distribution pattern for the principal variables to be used in regression
analyses. These tests were statistically significant at p-value less than .05 for the majority
of the study variables tested. More specifically, age and total PA (MET-min) were
positively skewed with respective skew values of 1.557 and .809. Task self-efficacy
knowledge of CVD risk factors and knowledge of CVD prevention were significantly
negatively skewed with the values of -1.393, -3.662, and -1.017.
Total PA as total MET-min scores combined for VPA, MPA, and Walking were
transformed by replacing each measurement by its square root (Tabachnick & Fidell,
2007) resulting in a decrease in skew to .022 mimicking a normal or nearly normal
distribution. Age was substantially positively skewed, and necessary transformation
methods failed to achieve normality or near normality. This forced a decision to collapse
it into three groups; 1 (20 -34 years), 2 (35-44 years), and 3 (45 years and above). This
yielded three categories for age (Table I 0) which were binary coded into two proxy
variables with either O or I. A zero score was assigned to "group I" (20- 34 years) to use
as the reference category. After transformation of task self-efficacy scores, the
Kolmogorov-Smimov and Shapiro- Wilk tests were still statistically significant; this
indicated of these transformation methods to mathematically achieve normal distribution.
77
l I

As shown in Table 10, the task self-efficacy scores were collapsed into three groups (I=
low, 2= moderate, 3= high) as suggested by Tabachnick and Fidell (2007). Group 1, 2,
and 3 had task self~efficacy scores of 0-49, 50-79, and 80-79 respectively. The new task
self-efficacy variable was binary coded into two proxy variables called dummy variables.
In both proxies, a zero score was assigned to "high score group" to use as the reference
category.
Table 9. Binary Coding Method Used to Create Proxy Variables for Ethnicity.
Group Proxy Variable Proxy Variable Proxy Proxy I 2 Variable 3 Variable 4
Caucasian 0 0 0 0
Hispanic/Latino 0 0 0
African/ African American 0 0 0
American Indian/Alaska Natives 0 0 0
Asian/Pacific Islander 0 0 0
Reference ethnicity: Caucasian
Table 10. Binary Coding Method Used to Create Proxy Variables for Broader Study Area, Task Self-Efficacy, and Age.
Group Category Proxy Variable I Proxy Variable 2 Study Area
I Health Sciences O 0 I Art and sciences l 0 2 Education and human development O l
Task Self-Efficacy I Low (scores between 0-49) 0 I 2 Moderate (scores between 50-79) I 0 3 High (scores between 80-100) 0 0
Age l Ages between 20-34 0 0 2 Ages between 35-44 l 0 3 Ages between 45 and above O I
Reference group: Area of study (Health Sciences); Task self-efficacy (high); Age (20-34)
Final adjustment of the data was conducted for knowledge of CVD risk factors
and CVD prevention. Both variables were heavily negatively skewed with values greater
than negative one. Appropriate transformation methods failed to bring about a normal or
78
. '.1 i,j
''I ij

close to normal distribution. All the knowledge scores were summed to create a new
variable. Consequential adjustment in the scores was able to significantly reduce skew to
-.624 for the newly created knowledge variable (final CVD knowledge) with an
acceptable skew compared to -3.662 for knowledge ofCVD risk factors.
Protection of Human Subjects
To assure adequate protection of human subjects, Institutional Review Board
(IRB) approval was granted from the University of North Dakota, IRB. An information
letter describing the purpose of the survey and ensuring anonymity and confidentiality
was part of the on line survey. The statement assured that there were no anticipated
discomforts or risk associated with the study to the participating students. Students were
also informed that participating or not participating in the study would not prejudice any
future relations with the university and was completely voluntary. Confidentiality was
maintained throughout data collection and data entry process. Participants were not
asked to disclose any personal identifier ( date of birth, name, social security number,
address). The surveys were coded in order to remove any chance of participants being
identified. This database was stored on a secure dedicated research laptop computer and
USB memory-stick. The research laptop, memory-stick, and printouts are kept in a filing
cabinet in a locked area ( or building) and only accessible to the researcher and
dissertation chair. The original paper-based surveys are housed in a secure filing cabinet
for three years prior to being destroyed.
Summary
This chapter discussed the steps that were implemented to investigate the aims of
this dissertation study as previously planned. The chapter began with the presentation of
79
l

--the components of the research methodology including description of the research design,
population, and sampling plan. Description of the customized survey packet was
followed by the details of the data collection method and data analysis plan. Finally, the
section concluded with the explanation of the measures used to protect human rights and
confidentiality of the subjects during the course of this investigation.
80
t I I i

--
CHAPTER IV
RESULTS
Chapter IV presents the description of the population of the study (N=349)
followed by the results from the testing of the hypotheses. This will conclude with a
summary of results description of overall statistically significant predictors of PA. A
total of nine research questions related to graduate students' PA were addressed in this
study: 1) what is the reported knowledge level about CVD, CVD risk factors, and CVD
prevention strategies?, 2) How much knowledge about CVD is translated into actual
CVD prevention practices in terms of PA?, 3) What differences in CVD knowledge and
PA exist according to socio-demographic variables and academic area of studies?, 4)
What motivating and de-motivating factors for exercise and PA are perceived?, 5) How
much self-efficacy (task, coping, and scheduling) related to exercise and PA are
perceived?, 6) What is the relationship between the level of exercise self-efficacy and the
perceived motivating and de-motivating factors?, 7) What is the relationship between the
level of perceived motivating and de-motivating factors for exercise and the degree of
engagement in PA?, 8) What is the relationship between the levels of perceived exercise
related self-efficacy and PA behavior?, and 9) What are the overall statistically
significant predictors of PA?
Description of Study Population Based on Socio-Demographic Independent Variables
The descriptive characteristics of the entire sample (n=349) are presented in
Tables 11-12. Age of the student participants in this study ranged from 22 to 59 years
81

with a mean of29.5 (SD=&.36) years. The majority of the students (62.8%, n=219) were
female. Approximately 83% (n = 289) self-identified themselves as Caucasians with only
2% (n=7) identifying as Asians/Pacific Islanders. Over two-thirds (69.9%; n= 244) stated
they were enrolled in one of the master's degree programs; the remaining 105 (30.1 %)
were enrolled in various doctoral degree programs. Students enrollment in the arts and
sciences ( 42.1 %; n= 14 7) predominated, with health sciences enrollment second (38. 7%;
n=l 35) and only 19.2% (n=67) in education and human development related academic
programs. More than half of the participants (54.7%) were never married and 38.4% were
currently married: only 6.9% reported being divorced or separated. Nearly three-fourths
of the married students (n=134) currently lived with their family while in school (72.4%;
n=97). Eighty-two percent of the students (n=285) were currently employed.
"Employed" meant part time, full time jobs outside of the university and jobs available
within the university including graduate research assistant (GRA), graduate teaching
assistant (GTA), and graduate service assistants (GSA). The distribution for current
annual household income among these students was bimodal; 26.4% had between $10-
20,000 per year and 28.9% greater than $30,000 per year; 18.6% of students had no
mcome.
Personal Health Behavior of the Participants
Living unhealthy life styles increases the individual's likelihood of vulnerability
to actual or potential cardiovascular diseases. The more people engage in unhealthy
behaviors such as poor eating habits, lack of rest, insufficient physical activity, smoking,
and alcohol drinking, the greater the risk of them experiencing adverse health effects such
as increased rates of morbidity and/or mortality. The personal health behaviors reported
l

by the students are described below. This includes the frequency of physical activity
level, smoking, and drinking behavior, problems with sleep/rest, fruits/vegetable intake,
and their reported height/weight. Additionally, students' body mass index (BMI) as
calculated from their self reported height in inches and weight in pounds is repmied.
Table I I. Description of the Participants Based on Gender, Ethnicity, and Level of Study.
Characteristics Freguency (N) Percent(%) Gender(%)
Male 130 37.2 Female 219 62.8
Ethnicity Caucasian 289 83.0 Asian/Pacific Islander 30 8.6 Hispanic/Latino 10 3.0 African/ African American 13 3.7 American Indian Alaska Natives 7 2.0
Level of Education Masters 244 69.9 Doctorate 105 30.1
Academic Area of Study Health Sciences 135 38.7 Art & Sciences 147 42.1 Education & Human Develoement 67 19.2
Table 12. Description of the Participants Based on Academic Area, Marital Status, Employment Status, and Annual Household Income.
Characteristics Frequency (N) Percent(%) Marital Status
Married 134 38.4 Divorced/Separated 24 6.9 Never Married 191 54.7
If Married, Living with Family? Yes 97 72.4 No 37 27.6
Ctmently Employed Yes 285 81.7 No 64 18.3
Annual Household Income Less than $10,000 48 13.8 $10,000 - $20,000 92 26.4 $20,000 - $30,000 43 12.3 Greater than $30,000 I 01 28.9 No income 65 18.6
83
i I
11
I
I 'I 'i ii
ii 
Physical Activity and ·Exercise
Physical activity in this study, as conceptually defined and operationalized
through the Internal Physical Activity Questionnaire (IP AQ), is the type of body
movement produced by the contraction of skeletal muscle that increases energy
expenditure above the basal level calculated in terms of MET-minute. The IP AQ suggests
three levels of physical activity: inactivity, minimal activity, and health enhancing
physical activity. Inactivity is category one and the lowest level of physical activity.
Minimal activity or category two is classified by the following criteria: I) three or more
days of vigorous PA of at least 20 minutes per day or II) five or more days of moderate
PA or walking of at least 30 minutes per day or III) five or more days of any combination
of activity achieving at least 600 MET-min/week. MET-min/week is calculated by
multiplying the MET level by the minutes and days in a week that physical activity took
place (medium MET value*minutes*days ). The IP AQ has established median MET
values for each of the activities (walking=3.3 METs, moderate PA= 4.0 METs, and
vigorous PA=8.0 METs) (IPAQ, 2004). Category three is defined as I) vigorous PA on at
least three days accumulating 1500 MET-min/week or II) 7 or more days of combination
of any PA achieving a minimum of3000 MET-min/week. Individuals who do not meet
criteria for categories 2 or 3 are considered inactive.
Subjective exercise behavior in this study was measured using the IPAQ. The data
were collected for the number of minutes of MP A and VP A and walking. Calculated
mean duration of engagement in vigorous physical activity (VP A) by the entire sample
was 109.5 minutes (SD= 101.86) per week, that for moderate physical activity (MPA)
was 76.8 minutes (SD= 82.86) per week, and mean duration for walking per week was
84
l ii
I
ill.
ii ill
il1
ii i" I

--
124.26 (SD= 108) per minutes. The calculated mean MET, days, and minutes ofVPA,
MPA, walking, and total physical activity (vigorous, moderate, and walking combined)
are shown in Table 13.
Table 13. Mean Scores and Standard Deviations for Days and Minutes of Self Reported VPA, MPA, and Walking.
PA Parameters Frequency (N) Mean SD Days ofVPA 349 2.57 1.92 Minutes of VP A 349 31.48 20.74 Days ofMPA 349 2.35 1.80 Minutes of MP A 349 24.86 18.48 Days of Walking 349 3.96 1.99 Minutes of Walking 349 26.72 18.08
Minutes reflect time spent doing each of PA
Over the entire sample, 19.2% (n=67) students reported that they did not engage
in any VPA and 17.8% (n=62) did not engage in any MPA during the past 7 days.
Similarly, 8.3% (n=29) reported that they did not walk during past 7 days (Table 14). The
sample was divided into three groups based on the amount of total PA they engaged in:
high PA group (> 1500 MET-min/week), moderate PA group (600-1500 MET-min/week),
and low PA group ( < 600 MET-min/week). Based on this grouping, 11.2% (n=39)
students were found to be engaged in high level of PA, 67% (n=234) students in
moderate PA, and only 21.8% (n=76) in low level of PA (Table 15 and Figure 4).
l !
' I.

Students' Total Phvsical Activity Level
60.0%
"' a.) 40.0o/o
!J P-<
20.0%
High Moderate Low
Physical Activity Categories Based on IP AQ
Figure 4. Student Engagement in Physical Activity by IPAQ Categories.
Table 14. Reported Days of Engagement in VPA, MPA, and Walking Past Seven Days.
Categories Frequency (N) Percent(%)
Days Engaged in More than 5 days 31 8.9
VP A Past 7 days 5 days 37 10.6
4 days 48 13.8
3 days 58 16.6
2 days 52 14.9
1 days 56 16.0
NoVPA 67 19.2
Days Engaged in More than 5 days 31 8.9
MP A Past 7 days 4 days 29 8.3
3 days 64 18.3
2 days 79 22.6
1 day 63 18.1
NoMPA 62 17.8
Days Walked More than 5 days 117 33.5
Past 7 Days 5 Days 56 16.0
4Days 41 11.7
3 Days 50 14.3
2 Days 31 8.9
1 Day 25 7.2
No Walking 29 8.3
86
, 111 !, !.!

--
Table 15. Student Engagement in PA by IPAQ Categories (VPA, MPA, and Walking).
PA parameters
Highly active (total PA score c- 1500 MET-min/week)
Moderately active (total PA score c- 600 MET-min/week)
Inactive (total PA score <600 MET-min/week)
Frequency (N~ 349)
39
234
76
Height, Weight, and Body Mass Index
Percent(%)
11.2
67.0
21.8
The body mass index (BM!) is an established health screening tool that has been
used to identify overweight and obesity as the major contributors for CVD. These
parameters are classified as health threats known to increase population morbidity and
mortality from all causes (Sizer & Whitney, 2003). The negative consequences of obesity
on overall health, longevity, and quality-of-life have well been acknowledged (AHA,
2008).
Participants in this study were asked to provide their height in inches and weight
in pounds. The BM! value was then calculated based on the information provided. Table
16 shows that nearly half the students (47%; n=164) had healthy BM! values between
18.5 and 24.9 but 30.4% (n=106) of the students had values of25.0 to 29.9 (overweight),
and 20.3% (n=71) had values of30.0 or greater (obesity). This means that over 50% of
the students fell within the overweight or obesity BM! range. Only 2.3% (n=8) had BM!
values in the underweight BMI range. The mean BMI value among students was 26
(Range= 22-59; SD= 3.8) with a median BMI of25.01. The median BM! value was at
the lower end of the overweight BMI range, indicating that 50% of the students were
either overweight or obese. Figure 5 demonstrates that a greater percentage of female
(54.8%) than male students (33.8%) were classified as "healthy" BMI. However, the
87
.··1 i
J I

--percentage "overweight" was greater among males (43.8%) than females (22.4%). This
was also true for "obesity", with 22.3% males and 19.2% females being obese.
1"i 0) 0 ~ 0)
0...
60.0%
50.0%
40.0%
30.0%
20.0%
10.0%
0.0% Underweight (BMI <18:5)
Students' Body Mass Index
Healthy (BMI 18.5-24.9)
Overweight (BM! 25.0-29.9)
Bl\ll1 Category
GENDER
t]Male !HIil Female
Obese (BMl>30.0)
Figure 5. Gender Based Differences in Body Mass Index Categories.
Table 16. Calculated Body Mass Index (BM!).
Meao BM! 26.0 (Range 22-59; SD 8.36)
BM! Raoge
Underweight BM! range (<18.5)
Healthy BM! range (18.5-24.9)
Overweight BM! range (25.0-29.9)
Obese BM! range (>30.0)
Frequency (N)
8
164
106
71
Sleep and Rest
Percent(%)
2.3
47.0
30.4
20.3
Evidence suggests that sleep deprived individuals have increased vulnerability to
the development of CVD. Problems with sleep/rest were obtained by asking them
whether or not they felt that they did not get enough sleep or rest during the past 30 days.
As shown on Table 17, three-quarters (75.1 %; n=262) of the students' responded that
they had some problem sleeping or feeling rested. When asked to provide the specific
88

number of days that they did not have enough sleep or rest, out of the 262 indicating a
problem with sleep/rest, 34. 7% stated they did not feel like they had enough sleep or rest
for seven or more days during the past 30 days, another 22.7% for 5-6 days, 26.3% for 4-
5 days, and 16.4% for 1-2 days.
Smoking and Drinking Behavior
Over 80% (81.7%) of the students identified themselves as non smokers (never
smoked); 12.9% reported they were ex-smokers; and only 5.4% identified themselves as
current smokers (Figure 6). The majority (65.9%) indicated that they consumed alcoholic
beverages (Figure 7).
Fruits and Vegetable Intake
Intake of fruits and vegetables tended to be low, with 74.1 % reporting eating tiuee
servings or less daily; 20.1 % reporting 4-5 servings daily, and 3.7% eating 6-7 servings
daily: only 2% greater than eight servings daily (Table 18). Overall, only 25.8% of the
students reported eating 4-8 servings of fruits and vegetables daily.
100.0%
80.0°/o
" 60.0% " 8 " "" 40.0%
20.0%
0.0%
Students' Current Smoking Status
Current Smoker Never Smoker
Smoking Status
Figure 6. Students' Current Smoking Status.
89
Ex-Smoker
1 ,!

--
Students' CIBTent Alcohol Drinking Status
60.0%
~ 40.0%
~ p...
20.0%
0.0%,~--
Drinker Non Drinker
Drinking Status
Figure 7. Students' Current Alcohol Drinking Status.
Table 17. Personal Health Behavior (Smoking, Alcohol Consumption, and Sleep and Rest).
Characteristics Frequency (N) Percent(%)
Smoking Behavior Never Smoked 285 Current Smoker 19 Ex-smoker 45
Current Drinking Behavior Current Drinker 230 Non Drinker 119
Sleep and Rest Problem Yes 262 No 87
Days Had Sleep/Rest Problem 1-2 days 45 3-4 days 70 5-6 days 61
7 days or more 94
Results Related to Study Questions and Hypotheses
Research question 1
81.6 5.5
12.9
65.1 34.1
75.1 24.9
16.7 26.0 22.7 34.6
What is the reported knowledge level about CVDs, CVD risk.factors, and CVD prevention strategies?
90
l II

Hypothesis 1: Graduate students will have a moderate amount of knowledge
concerning various CVDs, CVD risk factors, and CVD prevention strategies.
Table 18. Personal Health Behavior (Fruits, Vegetable Intake, and Physical Activity).
Characteristics Frequency (N) Percent(%)
Reported Fruits & Vegetables Intake
0 - 1 serving 72 20.7
2 - 3 servings 186 53.4
4 - 5 servings 70 20.1
6 - 7 servings 13 3.7
8 servings or more 7 2.0
Physical Activity Level High (PA score 2: 1500 MET-min/week) 39 11.2
Moderate (PA score 2: 600 MET-min/week) 234 67.0
Low (PA score< 600 MET-min/week) 76 21.8
This hypothesis was tested by measuring participating students' CVD knowledge
in three distinct areas: I) knowledge of various cardiovascular diseases, 2) knowledge of
CVD risk factors, and 3) knowledge of CVD prevention strategies. The knowledge
questionnaire contained four multiple-choice questions. The first three questions
addressed CVD knowledge and the fourth question concerned students' knowledge of
their perception of CVD self-risk. The CVD knowledge questions included choices about
various types of cardiovascular diseases, general CVD risk factors, and general CVD
prevention strategies. The response choices were based on the elements of CVD, their
risk factors, and prevention strategies such as exercise and physical activity, weight
management, nutrition, blood pressure control, cholesterol control, and smoking.
Participants were required to select at least four common CVD conditions ( out of 8), five
common CVD risk factors ( out of I 0), and five commonly utilized CVD prevention
strategies (out of 10). They were also asked to select their own risk of having CVD; high
risk, moderate risk, or low risk based on the responses for knowledge questions. A
91
ii

summed score was calculated for each knowledge question. For the final correlational
analyses, a final score combining all three areas was calculated because CVD knowledge
scores were not normally distributed.
For the entire sample, the mean knowledge score for various CVDs was 5.56
(SD= 1.76) out ofa range ofO to 8, the mean score for CVD risk factors knowledge was
9.80 (SD= 0.69) out of a range of Oto IO and the mean knowledge score for CVD
prevention strategies was 8. 77 (SD= 1.55) out of a range of O to IO (Table 19). This
indicates a high level of knowledge among this sample in regard to various CVDs, CVD
risk factors and CVD prevention practices.
Table 19. Mean CVD Knowledge Scores for Entire Sample.
CVD Knowledge Area Frequency (N) Mean SD
Knowledge of various CVDs 349 5.56 1.768
Knowledge of CVD risk factors 349 9.80 0.691
Knowledge of CVD prevention strategies 349 8.77 1.557
Aggregate CVD knowledge 349 24.27 2.641
The correct percentages of responses concerning knowledge of specific CVD,
CVD risk factors, and CVD prevention strategies are shown in Tables 20-22. Over two
thirds (75%) of the students recognized heart attack and heart failure (71.3%) as types of
CVD, with lower percentages being cognizant of peripheral vascular disorders (52.0%),
heart rhythm disorders ( 46.1 %), and stroke (30.0% ). High percentages of the students
recognized elevated cholesterol (89.0%), high blood pressure (87.0%), overweight
(85.0%), and family history (79.0%) as major risk factors for CVD. Moderate
percentages recognized smoking (63.0%) and physical inactivity (50.0%) as risk factors,
and only 38.0% selected diabetes as a CVD risk factor.
l 1,
'
i'!'
'I 1:
I,

--Almost all (95.0%) of the students identified maintaining ideal body weight and
engaging in regular PA as CVD prevention strategies. Quitting smoking was identified as
such by 83 .0%. Other CVD prevention strategies identified by much lower percentages
of students were keeping one's cholesterol <200 mg/di (60.0%), controlling blood
pressure if it is elevated > 20 points ( 45.0% ), controlling blood glucose if diabetic
(40.0%), and controlling blood pressure ifit is elevated> 10 points (31.0%).
Table 20. Percentages of Correct Response for Knowledge about Various CVDs.
CommonCVDs Frequency (N) Percent(%)
Heart Attack 263 75.4 Heart Failure 249 71.3 Peripheral Vascular Disorders 182 52.l Heart Rhythm Disorder 161 46.1
Stroke 115 33.0
Table 21. Percentages of Correct Response for Knowledge about CVD Risk Factors.
Common CVD Risk Factors Frequency (N) Percent(%)
High Cholesterol 310 88.8
High Blood Pressure 304 87.J
Overweight 295 84.5
Family History of CVD 274 78.5
Smoking 218 62.5
Physical Inactivity 175 50.J
Diabetes 134 38.4
Figure 8 shows the cumulative knowledge scores about CVD conditions as the
differences in the percentages. The largest percentage of students (41.8%) identified
Three CVD conditions, 22.1 % were able to identify Four, and 28.4% identified only two
conditions. Only 7.7% identified one or no conditions. Knowledge ofCVD risk factors
was high (Figure 9), with 91.4% of the students able to identify all five risk factors listed.
Knowledge of CVD prevention strategies was moderate (Figure 10), with 55.0% able to
93
l 'I
I
ii I,
I.
ii
i ;[,
I 1:
'

identify all five CVD prevention strategies listed and 29 .8% able to identify four
strategies.
Students' Knowledge Various CVD
50.0%
40.0%
1:: 30.0% "' 2 " A..
20.0%
10.0%
2 4
Knowledge Score
Figure 8. Differences in Percentage of Correct Responses Identified for Knowledge about Cardiovascular Disease Conditions.
Table 22. Percentages of Correct Response for Knowledge about CVD Prevention Strategies.
Common CVD Prevention Strategies Frequency (N) Percentage(%)
Maintaining Ideal Body Weight 333 95.4
Regular Physical Activities 330 94.6
Quitting Smoking if Smoker 288 82.5
Keeping Cholesterol < 200 mg/di 209 59.9
Controlling BP if it is elevated> 20 points 156 44.7
Controlling Blood Glucose if Diabetic 138 39.5
Controlling BP if it is elevated> IO points 109 31.2
Slightly over half (51.3%) perceived themselves to be at lower risk, 41.8%
perceived themselves to be at moderate risk, and only 6.9% (n= 24) perceived themselves
to be at high risk of having CVD (Figure 11 ).
94
1

---
Students' Knowledge ofCVD Risk Factors
100.0%
80.0%
~
" 60.0% " u ~
" 0., 40.0%
20.0%
0.0% 6
Knowledge Score
Figure 9. Differences in Percentage of Correct Responses Identified for Knowledge about Cardiovascular Diseases Risk Factors.
Students' Knowledge ofCVD Prevention Practices
60.0%
50.0%
1:: 40.0%
" 8 30.0% "' "-,
20.0%
10.0%
0.0% 4 6 8
Knowledge Score
Figure 10. Differences in Percentage of Correct Responses Identified for Knowledge about Cardiovascular Diseases Prevention Strategies.
95

Students' Knowledge ofCVD SelfRisk Perception
60_0%
50.0%
40.0'%
"' "' " ~ 30.0% "' P-<
20.0%
10.0%
0.0%
Low Moderate
Perceived CVD Risk Level
High
Figure 11. Percentages of Self Cardiovascular Diseases Risk Perception among All Participants.
As hypothesized, this graduate student population was moderately high to very
high in their level of knowledgebase about CVDs, including risk factors and prevention
strategies. Nevertheless, only a very small percentage considered themselves at high risk
of developing CVDs.
Research Question 2
How much knowledge about CVD is translated into actual CVD prevention practices in terms of physical activity?
Hypothesis 2: There will be no relationship between knowledge about CVD and
their engagement in PA. For this analysis, engagement in actual CVD prevention
practices in terms of total PA was calculated as total MET-Minute per week combined for
vigorous, moderate PA, and walking. Total MET-Minutes per week was the dependent
variable. Final CVD knowledge scores based on three different types of knowledge was
the predictor variable. Simple bivariate regression analysis tested the hypothesis that
there was no relationship between the level of CVD knowledge and PA (Table 23). The
96
I I I,
;! I\ !I 111
1:1' i: I
I I

final CVD knowledge score was not found to be correlated with students total physical
activity measured in terms of total MET-min per week (P= .047, p = .379). Therefore,
the null hypothesis of no relationship between knowledge of CVD and actual engagement
in PA was accepted.
Table 23. Result of Bivariate Regression Analysis Showing Correlation between CVD Knowledge and Physical Activity.
Predictor Variable
CVD Knowledge combined for knowledge of various
CVDs, risk factors for CVD, and CVD prevention
strategies.
Model R = .002, F= .777, p= .379
Beta
.275
Research Question 3
f:l .047 .881
What are the differences in CVD knowledge and physical activity behavior according to socio-demographic factors and academic area of studies?
Hypothesis 3: There will be no difference in knowledge about CVDs according to
socio-demographic variables. A multiple regression analysis, with the five socio
demographic measures as independent variables, was used to test the third hypothesis
(H3). The socio-demographic factors used as "independent variables" were age, gender,
ethnicity, level of study, and area of study. "Final CVD Knowledge" was the dependent
variable.
"Level of Study" and "Broader area of Study" were significantly correlated with
the final CVD knowledge score. Students' enrolled in doctoral degree programs had a
higher level of CVD knowledge (P= .186, p= .000). Students enrolled in the arts and
sciences (P= -.217, p= .000) and education and human development (P= -.152, p= .008)
had significantly lower levels of CVD knowledge compared to students enrolled in any of
97
1 I
,I
!I
ji
iii
Ii

the health science programs. Age, gender, and ethnicity were not significantly correlated
with CVD knowledge.
The hypothesis was also tested by exploring partial correlation coefficient values
of the variables having significant correlation to the outcome variable after controlling for
all other socio-demographic variables. The semi partial correlation coefficient for level of
study was .192 (t= 2.60, p= .000), -.193 (t= -3.613, p= .000) for art and sciences, and -
.143 (t= -2.656, p= .008) for education and human development as academic areas of
study.
As shown in Table 24, the final regression model was statistically significant [R2=
.111 (] 0, 338) p= .000]; the five socio- demographic variables together explained 11 % of
the variance in CVD knowledge.
Table 24. Results from Multiple Regression Analysis: Socio-Demographic Variables and CVD Knowledge.
Demographic Variables Entered Beta p Semi Partial Correlation
Age Group 35-44 Y .578 .081 1.557 .084 45-Above .416 .044 .825 .045
Gender .091 .017 .318 .017 Ethnicity
Hispanic/Latino 1.432 .094 1.766 .096 African/ African American -.098 -.007 -.141 -.008 Al/AN -.339 -.019 -.361 -.020 Asian/Pacific ]slander .001 .000 .003 .000
Level of study 1.037 .186 3.602 .192** Broader study area
Art and Sciences -1.119 -.217 -3.613 -.193** Ed. & Human Dev. -.985 -.152 -2.656 -.143**
** Correlation is significant at p value <.01 Final model R2= .111, F= 4.219, p= .000
Hypothesis 4: There will be no difference in physical activity behavior according
to socio-demographic variables. The results for hypothesis 4 are presented in terms of
both descriptive and inferential statistics. Table 25 shows mean differences in MET level
98
ii II !,
'
1:
I
I [;

according to each of the socio-demographic variables. A multivariate analysis examined
the significant correlations between the students' "total physical activity" level and all
socio-demographic independent variables (Table 26).
The highest means (MET-min per week of 1600 or greater) were for Caucasians,
master's level students, students enrolled in health sciences programs, males, single
students, and unemployed students. The lowest means (1300 or less MET-min. per week)
were for those of other than Caucasian ethnicity.
Table 25. Mean Differences in the Reported MET-Min per Week Based on SocioDemographic Variables.
Demographic Variables N Mean (MET minutes per week)
Caucasians 289 1676 Hispanic/Latino 10 1455
Ethnicity African/African Americans 13 1245 American lndianl AN 7 1281 Asian/Pacific ]slanders 30 1076
Study Level Doctorate 105 1396 Masters 244 1679 Male 130 1719
Gender Female 219 1520 Health Sciences 135 1726
Study Area Art and Sciences 147 1499
Education and Human Dev. 67 1535 Marital Status Single 215 1744
Married 134 1352 Employment Employed 285 1527 Status Unemployed 64 1891
SD
1140 1034 1005 751 950
1332 1149 1216 1058 110 l 1149
1092 1182 974
1103 1162
The multiple regression analysis (Table 26) showed the following variables to be
significantly but negatively correlated with total PA: level of study(~= -.136, p= .010),
academic area(~= -.175, p= .007), and marital status(~= -.213, p= .000). Doctoral
students, despite having higher levels of CVD knowledge, engaged in significantly less
amount of actual physical activity compared to their masters' degree counterparts. This
was also true of those students enrolled in arts and sciences programs compared to those
99
1 II

--enrolled in the health sciences and married students compared to single students. Gender,
age, ethnicity, education and human development, and employment status were not
significantly related to total PA level.
Unique contributions of the variables that are significantly correlated with total
physical activity were also found to have contributed significantly to the total PA level
based on partial semi correlations coefficients as shown in Table 26. After controlling for
all socio-demographic variables, the semi partial correlation coefficient for level of study
was -.139 (t= -2.579, p= .01). The value was -.147 (t= -2.718, p= .007) for art and
sciences as an academic area of study and for marital status it was -.205 (t= -3.838, p=
.000).
Table 26. Relationship between Students' Total Physical Activity Level and SocioDemographic Variables: Multiple Regression Analysis.
Predictor Variables Beta p Semi Partial Correlation
Age Group 35-44 years .763 .018 .335 45 years and above -1.644 -.030 -.549
Gender -2.911 -.095 -1.723 Marital status -6.520 -.213 -3.838** Ethnicity
Hispanic/Latino -6.104 -.069 -1.280 African/ African Americans -4.193 -.053 -1.021 American Indians/Alaska Natives 6.627 .063 1.196 Asian/Pacific Islanders .032 .001 .0 I I
Level of study -4.401 -.136 -2.579** Broader study area
Art and Sciences -5.266 -. 176 -2.718** Education and Human Development -2.462 -.065 -1.109
Employment status -3.749 -.098 -1.765
** Correlation is significant at p value <.01, Final model R = .099, F= 3.067, p= .000 DV: Total MET-Min per week combined for VPA, MPA & Walking
Research Question 4
What motivating and de-motivating factors for exercise and physical activity are perceived?
100
.018 -.030 -.094 -.205
-.070 -.056 .065 .001
-.139
-.147 -.060 .078
1 i'

Hypothesis 5: There are no physical, social, and psychological cognitive factors
that either motivate or de- motivate engagement in exercise and physical activity.
Mean scores were calculated for the exercise benefits scale, the exercise barriers scale,
and the sub-scales for motivating factors or exercise benefits (life enhancement, physical
performance, psychological outlook, social interaction, and preventive health) and de
motivating factors or exercise barriers ( exercise milieu, time expenditure, physical
exertion, and family discouragement). Based on scoring guidelines for the Exercise
Benefits and Barriers Scale (EBBS), total scores ranged from 43 to 172, with higher
scores meaning greater motivation to engage in PA. The ranges for the exercise benefits
and exercise barriers scales were 67 to 116 (out of29-116) and 24 to 56 (out of 14-56),
respectively. A higher score on the benefits scale indicates greater perceived benefits, and
a lower score on the barriers scale indicates greater perceived barriers (Sechrist et al.,
1987).
The mean scores for exercise benefits (motivating factors) (93.81) and exercise
barriers (de-motivating factors) (41.54) were both high. This suggests that the graduate
students studied here were highly motivated than de-motivated to engage in exercise and
PA. In Table 27, the five factors in the exercise benefits subscale (29 items) and the four
factors in the barriers subscale (14 items) are placed under broader categories pertaining
to physical, social, and psychological elements of exercise benefits and barriers. The
exercise benefits sub scale (motivating factors) includes life enhancement, physical
performance, psychological outlook, social interaction, and preventive health. The
barriers sub scale ( de-motivating) consists of subscales for exercise milieu, time
expenditure, physical exertion, and family discouragement. Under exercise benefits,
101
i :I
:11
!ii i
11

--
physical performance had the highest mean score (3.46), followed by psychological
outlook (3.35), preventive health (3.31), and life enhancement (3.19). Under exercise
barriers, physical exertion (3 items) and time expenditure (3 items) had the lowest means,
2.39 and 2.87, respectively but exercise milieu and family discouragement had the
highest means, 3.24 and 3.13 respectively, showing their lack of importance as barriers
for engaging in PA.
Table 27. Motivating and De-Motivating Subscales for Exercise and PA: Means and Standard Deviations.
Motivating or De-motivating Subscales Mean SD
Motivating subscales (perceived benefits to exercise; 29 items) 3.23 0.39
Physical performance (8 items) 3.46 0.40
Psychological Outlook (6 items) 3.35 0.50
Preventive Health (3 items) 3.31 0.49
Life Enhancement (8 items) 3.19 0.76
Social Interaction ( 4 items) 2.61 0.58
De-motivating subscales (perceived barriers to exercise; 14 items) 2.96 0.41
Physical Exertion (3 items) 2.39 0.60
Time Expenditure (3 items) 2.87 0.60
Family Discouragement (2 items) 3.13 0.75
Exercise Milieu (6 items) 3.24 0.47
Table 28 shows the ten most frequently reported direct benefits of exercise: I)
exercising improves the way the body looks (mean= 3.87), 2) exercise increases my level
of physical fitness (mean= 3.66), 3) exercise improves functioning ofmy CV system
(mean= 3.56), 4) exercise increases my muscle strength (mean= 3.53), 5) exercise gives
me a sense of personal accomplishment (mean= 3.52), 6) exercise improves my mental
health (mean= 3.47), 7) my muscle tone is improved by exercise (mean= 3.47), 8)
exercise decreases feelings of stress & tension for me (mean= 3 .44 ), 9) I have improved
feelings of well being from exercise (mean= 3.41), and 10) I will live longer ifl exercise
102
1
' I I .I )
i
I i
1· It
I I I

---
(mean= 3.4). Over 60% strongly agreed that "exercise increased my level of physical
fitness;" while the lowest percent strongly agreed that "I live longer if I exercise." Five
out of the ten direct benefits were categorized under physical performance and four under
psychological outlook; this indicated the importance of those categories of benefits for
the graduate students.
Table 28 identifies the motivators for exercise with the corresponding subscale.
The item means Item means showed four subscales to be the major elements motivating
students to engage in exercise and PA: physical performance, psychological outlook, life
enhancement, and preventive health. Social interaction (mean= 2.61) was not found to
be an important motivating element.
Table 28. Ten Most Frequently Reported Benefits for Physical Activity by Graduate Students.
Agreement Motivators for Exercise Benefits Subscale Mean SA(%) SD
Improves the way the body looks Physical Performance 3.87 44.4 2.6
Increases my level of physical fitness. Physical Performance 3.66 66.2 0.3
Improves functioning of my CV system Physical Performance 3.56 57.6 0.2
Increases my muscle strength. Physical Performance 3.53 54.2 0.4
Gives me a sense of personal accomplishment Psychological Outlook 3.52 57.0 0.3
Improves my mental health Psychological Outlook 3.47 50.1 0.3
Muscle tone is improved Physical Performance 3.47 48.7 1.4
Decreases feelings of stress & tension for me. Psychological Outlook 3.44 51.0 0.9
Improved feelings of well being from exercise. Psychological Outlook 3.41 46.1 0.6
Live longer if I exercise Preventive Health 3.40 43.6 0.3
SA= 4, SD= I; higher the mean the higher the perceived benefits for exercise (motivating factor)
Table 29 shows the four specific barriers reported in terms of degree of agreement
(strongly agree=!) and mean calculation; I) exercise tires me (mean= 2.30), 2) exercise
is hard work for me (mean= 2.39), 3) I am fatigued by exercise (mean= 2.49), and 4)
103

--
exercising takes too much of my time (mean= 2.6). Three out of four items were
categorized as physical exertion and one item as time expenditure.
Table 29 shows that physical exertion and time expenditure were the major
potential de-motivators for physical exercise. Exercise milieu (mean= 3.24) and family
discouragement (mean= 3.13) were not seen to be important de-motivating factors.
Table 29. Top Four De-motivating Factors for Physical Activity Reported by Students.
Exercise Barriers Subscale Mean SA(%) SD(%)
Exercise tires me. Physical exertion 2.30 12.0 4.3
Exercise is hard work for me. Physical exertion 2.39 12.0 8.0
I am fatigued by exercise. Physical exertion 2.49 06.0 5.4
Exercising takes too much ofmy time. Time expenditure 2.60 18.0 7.4
SA= 1, SD= 4 Lower the mean the lower the perceived barriers for exercise
Overall, this sample perceived more benefits than barriers for PA. Physical
performance, life enhancement, psychological outlook, and preventive health were the
most prominent motivating factors for exercise, and physical exertion and time
expenditure were relatively strong de-motivating factors. Environmental elements such as
social interaction, exercise milieu and family discouragement were not seen as important
for engagement in PA.
Research Question 5
How much task, coping, and scheduling selfefficacy related to exercise and physical activity is perceived?
Hypothesis 6: Graduate students will perceive a moderate amount of task, coping,
and scheduling self-efficacy related to exercise.
Exercise self-efficacy was assessed with the 9-item, IO point Liker!
Multidimensional Self-efficacy Scale (Rodgers et al. 2008), which ranged from used 0%
104
'1 1,
11
'.I' i:

(no confidence) to 100% (absolute confidence). Table 30, compares the mean scores for
each of the subscales. The mean score for task self-efficacy (3 items) was 78.64, that of
coping self-efficacy was 51.44 (3 items), and for scheduling self-efficacy it was 61. 72.
Table 30. Descriptive Statistics of Self-Efficacy Sub-Scales: Mean Scores.
Subscale Mean SD Low (0-49) Moderate (50-79) High (80-100)
Percentage
Task self-efficacy 78.64 20.71 07.4 29.2 63.3
Coping self-efficacy 51.44 23.87 42.7 44.4 12.9
Scheduling self-efficacy 61.72 28.05 33.5 32.l 34.4
Table 31 shows the frequency distribution of each of the items on the coping, task,
and self-efficacy scales with their respective Pearson's chi-square values. The variation in
the scores for each item in the three self-efficacy scales is statistically significant. The
results indicated that 35% of the students were highly confident that they could exercise
even when they were uncomfortable. Yet, only 23% were fully confident they could
exercise when they lacked energy. More significantly, only 10% expressed absolute
confidence in their ability to exercise when not feeling well. On the other hand, students'
task self-efficacy levels were significantly high; 62% reported absolute confidence in
performing using the proper technique, 71 % confidence in following directions, and 67%
confidence in performing all of the required movements. A moderate amount of
scheduling self-efficacy was expressed; 43% were fully confident they could include
exercise in their daily routine, 33% could consistently exercise five times in a week, and
41 % saw themselves as able to arrange their schedule to include regular exercise.
105
l
1,

Table 31. Comparison of Scores on Coping, Task, and Scheduling Self-efficacy: ChiSquare for Goodness of Fit.
# Sub Scale How confident are you that you can ...... Score Range (%) Pearson's
0-49 50-79 80-100 x'
Coping You feel discomfort 27 38 35 63.926
2 Exercise when you lack energy 3 44 23 56.046
3 Exercise when don't feel well 55 34 JO 72.436
4 Task Complete exercise using proper technique 8 30 62 271.250
5 Follow directions to complete exercise 7 23 71 427.960
6 Perfonn all of the required movements 7 26 67 330.570
7 Scheduling Include exercise in daily routine 23 35 43 112.400
8 Consistently exercise five times in a week 35 32 33 43.060
9 Arrange schedule to include regular 27 33 41 75.020
exercise
All Chi Square values were significant at the .000 level.
In summary, the participants in this study had a moderate level of task self
efficacy (mean= 78.64). This implies that these students were moderately certain that
they could complete exercise using proper technique, follow directions to complete
exercise, and perform all of the required movements. On the contrary, they had a low to
moderately low level of perceived coping self-efficacy (mean= 51.44). This mean score
was at the lowest end of the "moderately can" category. Therefore, they were lacking
confidence to exercise while challenged by adverse situations such as feeling
uncomfortable, lacking energy, and not feeling well. Scheduling self-efficacy had a mean
score of 61.72, a value at the lower end of"moderately can." They were barely confident
that they would be able to include exercise in their daily routine, consistently exercise
five times per week, or arrange their schedule to include regular exercise.
Research Question 6
What is the relationship between the levels of exercise self-efficacy and perceived motivating factors?
106
1 !
i
1'11
!' I

Hypothesis 7: There will be no relationship between the level of motivating
factors and exercise self-efficacy after controlling for socio-demographic factors.
Controlling for the socio-demographic variables, partial correlations between the exercise
benefits ( exercise motivation) scores and the scores for the three types of self-efficacy
were conducted. The results are shown in Table 33. Exercise benefits/motivators were
significantly correlated with moderate task self-efficacy (r = -.156, p = .004), a zero-order
correlation of -.168 (p = .002). Controlling for the socio-demographics made little
difference. Low task self-efficacy also had a significantly negative partial correlation (r =
-.193, p. = .000) with exercise benefits/motivators. The zero order correlation was also
relatively unchanged (r = -.186, p. = -.186). The same pattern of relationships was
exhibited for the correlations between perceived motivation and coping and scheduling
self-efficacy. Scheduling self-efficacy was positively partially correlated with exercise
benefits (r= .425, p= .000) with a relatively similar zero order correlation (r= .438, p=
.000). Finally, coping self-efficacy was partially correlated with benefits score (r= .360,
p= .000) with similar zero order correlation (r= .372, p= .000). In all cases, the partial
correlation coefficients were smaller than zero-order correlations but continued to be
statistically significant.
The null hypothesis for the relationship between the three types of self-efficacy
and motivation was not accepted. Controlling for socio-demographic variables had
minimal effect on the statistically significant correlations between the exercise benefits
score and the various self-efficacy scores (Table 32).
107
l I
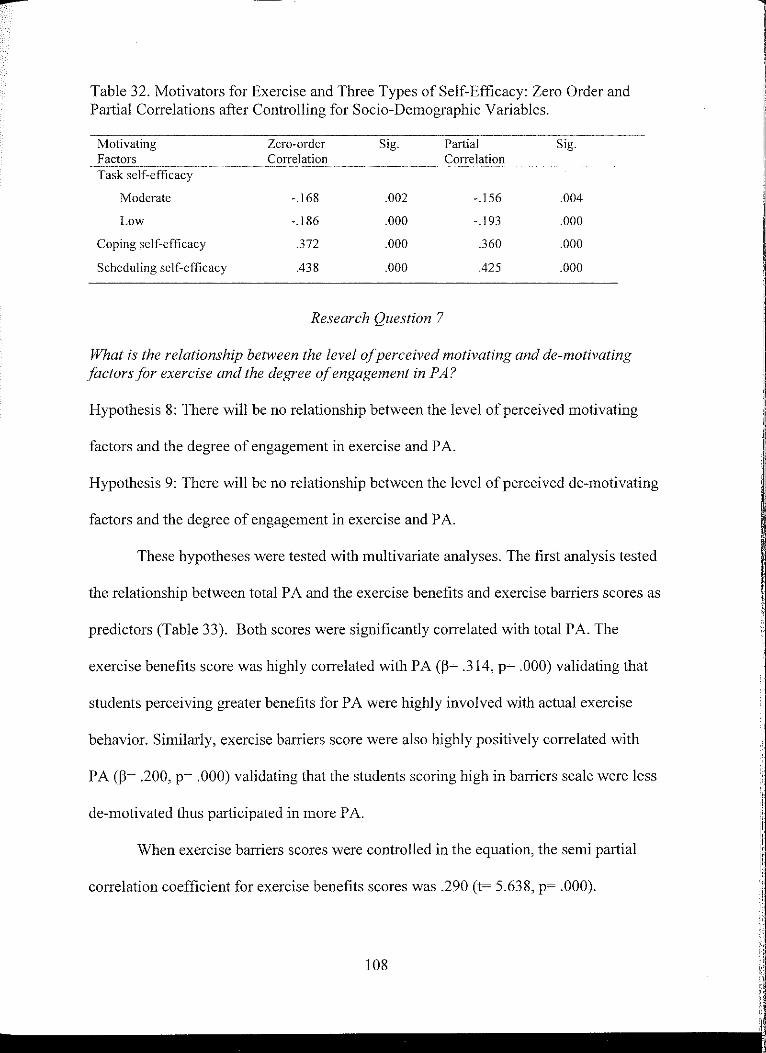
--Table 32. Motivators for Exercise and Three Types of Self-Efficacy: Zero Order and Partial Correlations after Controlling for Socio-Demographic Variables.
Motivating Factors Task self-efficacy
Moderate
Low
Coping self-efficacy
Scheduling self-efficacy
Zero-order Correlation
-.168
-.186
.372
.438
Sig.
.002
.000
.000
.000
Research Question 7
Partial Correlation
-.156
-.193
.360
.425
Sig.
.004
.000
.000
.000
What is the relationship between the level of perceived motivating and de-motivating factors for exercise and the degree of engagement in PA?
Hypothesis 8: There will be no relationship between the level of perceived motivating
factors and the degree of engagement in exercise and PA.
Hypothesis 9: There will be no relationship between the level of perceived de-motivating
factors and the degree of engagement in exercise and PA.
These hypotheses were tested with multivariate analyses. The first analysis tested
the relationship between total PA and the exercise benefits and exercise barriers scores as
predictors (Table 33). Both scores were significantly correlated with total PA. The
exercise benefits score was highly correlated with PA (13= .314, p= .000) validating that
students perceiving greater benefits for PA were highly involved with actual exercise
behavior. Similarly, exercise barriers score were also highly positively correlated with
PA (13= .200, p= .000) validating that the students scoring high in barriers scale were less
de-motivated thus participated in more PA.
When exercise barriers scores were controlled in the equation, the semi partial
correlation coefficient for exercise benefits scores was .290 (t= 5.638, p= .000).
1
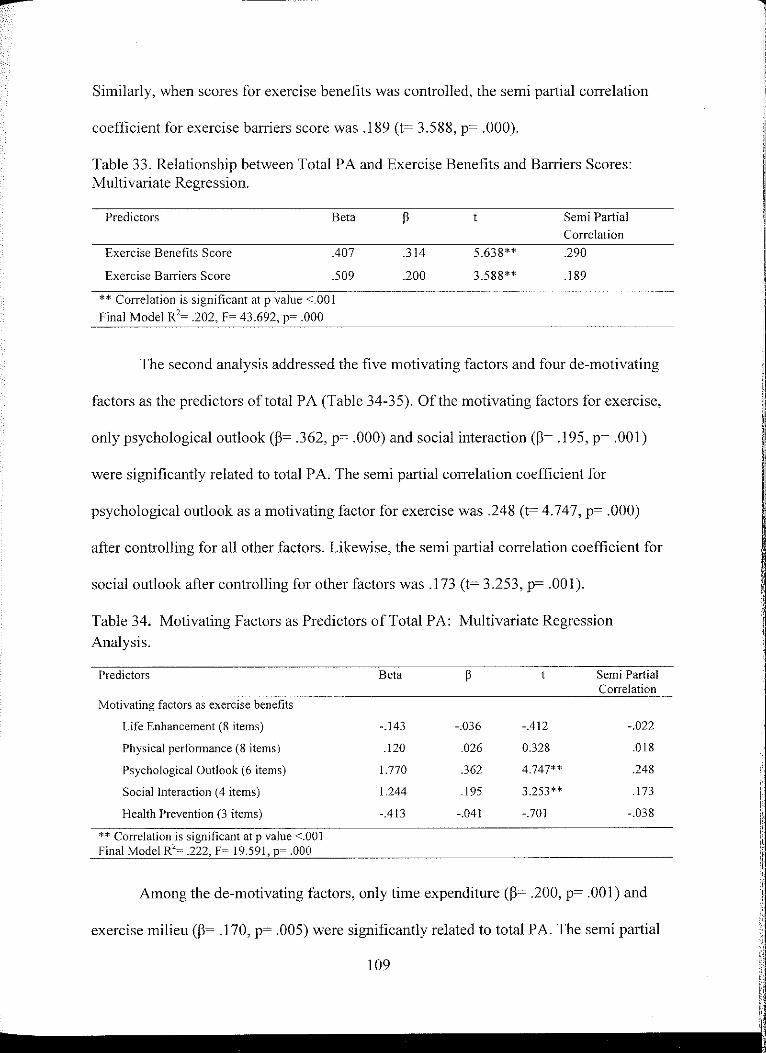
--Similarly, when scores for exercise benefits was controlled, the semi partial correlation
coefficient for exercise barriers score was .189 (t= 3.588, p= .000).
Table 33. Relationship between Total PA and Exercise Benefits and Barriers Scores: Multivariate Regression.
Predictors
Exercise Benefits Score
Exercise Barriers Score
Beta
.407
.509
** Correlation is significant at p value <.001
Final Model R2~ .202, F~ 43.692, p~ .000
.314
.200
5.638**
3.588**
Semi Partial Correlation
.290
.189
The second analysis addressed the five motivating factors and four de-motivating
factors as the predictors of total PA (Table 34-35). Of the motivating factors for exercise,
only psychological outlook(~= .362, p= .000) and social interaction(~= .195, p= .001)
were significantly related to total PA. The semi partial correlation coefficient for
psychological outlook as a motivating factor for exercise was .248 (t= 4.747, p= .000)
after controlling for all other factors. Likewise, the semi partial correlation coefficient for
social outlook after controlling for other factors was .173 (t= 3.253, p= .001).
Table 34. Motivating Factors as Predictors of Total PA: Multivariate Regression
Analysis.
Predictors
Motivating factors as exercise benefits
Life Enhancement (8 items)
Physical performance (8 items)
Psychological Outlook (6 items)
Social Interaction ( 4 items)
Health Prevention (3 items)
** Correlation is significant at p value <.001 Final Model R2
~ .222. F~ 19.591, p~ .000
Beta
-.143
.120
1.770
1.244
-.413
-.036
.026
.362
.195
-.041
Semi Partial Correlation
-.412 -.022
0.328 .018
4.747** .248
3.253** .173
-.701 -.038
Among the de-motivating factors, only time expenditure (~= .200, p= .001) and
exercise milieu(~= .170, p= .005) were significantly related to total PA. The semi partial
109
:1
ii; ii 111

----correlation coefficient for exercise milieu as de-motivating factor for exercise was .149
(t= 2.804, p= .005) after controlling for all other de-motivating factors. Likewise, the
semi partial correlation coefficient for time expenditure after controlling for other factors
was .177 (t= 3.335, p= .001). These values for semi partial correlation coefficients
demonstrate their unique contribution to total physical activity of the students while other
variables are controlled.
Therefore, the final equations demonstrated overall and semi partial correlations
between various motivating and de-motivating factors for exercise rejecting the null
hypothesis.
Table 35. De-motivating Factors as Predictors of Total PA: Multivariate Regression Analysis.
Predictors
De-motivating factors as exercise barriers Exercise Milieu (6 items) Time Expenditure (3 items) Physical Exertion (3 items) Family Discouragement (2 items)
** Correlation is significant at p value <.005 Final Model R2= .143, F= 14.354, p= .000
Beta
_885
1.633 _002 _987
Research Question 8
Semi Partial Correlation
.170 2.804** .149
.200 3.335** .177 _ooo 0_006 .000 .101 1.737 .093
What is the relationship between the levels of perceived exercise related self-efficacy and total PA?
Hypothesis 10: There will be no relationship between the levels of exercise self
efficacy and total PA
Multivariate regression analysis was used to test Hypothesis 10 (Table 35). Total
PA score was the dependent variable; the predictors were task, coping, and scheduling
self-efficacy. The regression model demonstrated a statistically significant correlation
110
l

between total PA and the predictors (36% explained variance, R2= .361, p= .000). Both
coping (P= .230, p= .000) and scheduling self~efficacy (P= .411, p= .000) had statistically
significant relationships to total PA. The semi partial correlations coefficient was .215 (t=
4.091, p= .000) for coping self-efficacy and .350 (t= 6.924, p= .000) for scheduling
efficacy indicating their unique and statistically significant contribution to PA when other
factors were controlled.
Therefore, coping and scheduling self-efficacy made significant contributions to the
regression equation in exception to task self-efficacy that was not related to total PA; the
null hypothesis was not accepted.
Table 36. Three Types of Self-Efficacy as Predictors of Total PA: Multivariate Regression Analysis.
Predictors
Task self-efficacy Low task self-efficacy Moderate task self-efficacy
Coping Self-efficacy
Scheduling self-efficacy
** Correlation is significant with p value <.00 I, Final Model R2
~ .361, F~ 48.496, p~ .000
Beta
-I.I 02
-.850
Research Question 9
-.019 -.026 .230
.41 l
What are the overall statistically significant predictors of PA?
t Semi Partial Correlation
-.391 -.021 -.542 -.029 4.09] ** .215
6.924** .350
Hypothesis 11: There will be no significant relationship between PA according
to socio-demographic factors, motivating and de-motivating factors, and exercise self
efficacy
Hierarchical linear regression was conducted to determine if socio-demographic
factors (age, gender, ethnicity, marital status, employment status, study area, study level,
CVD knowledge), motivating and de-motivating factors for exercise/physical activity,
111
11
,!1
;:I j!
i! i.
I

and three types of self-efficacies (task, coping, and scheduling) predicted the total PA
level. In order to hold socio-demographic variables constant, they were entered into the
model as the first step. Within the theoretical framework, these socio-demographic
variables were portrayed as impacting motivating and de-motivating factors, self
efficacy and ultimate PA levels. The outcome of this first step was significant (R2 =I 02,
F =2.921, p= .000) with level of study, study area (art and sciences), and marital status
predicting total PA. This equation explained 10% of the variance of PA.
Exercise motivators (benefits) and de-motivators (barriers) were then entered.
Approximately 27% of the variance in PA was explained by this equation; the results
were statistically significant (R2 = .267, F= 8.080, p = .000). There was more than a 2.5
fold increase in the amount of variance explained when motivating and de-motivating
factors were added. In this equation, besides art and sciences as study area, level of study,
and marital status, motivation score, and demotivation were observed to be the significant
predictors of total PA.
Finally, task, coping, and scheduling self-efficacy were entered into the equation.
The model was statistically significant (R2 = .449, F= 14.129, p= .000) The addition of
task, coping, and scheduling self-efficacy to the equation increased the amount of
variance explained from 26% to 45%. The level of study([)= -.134, p= .002), marital
status([)= -.171, p= .000), exercise motivation score([)= .133, p= .010), coping self
efficacy ([)= .181, p= .001), and scheduling self-efficacy([)= .347, p= .000) were
significantly correlated with total PA level. There were no significant correlations
between PA level and any other predictors. Therefore, being married and being a doctoral
student predicted lower levels of engagement in PA. Higher levels of exercise motivation,
112
1 ,,
I
I 'I
!I
Ir
ii i!
i
I; I
11
I

coping self-efficacy, and scheduling efficacy predicted higher levels of PA. All the
significant and non significant correlations between predictor variables and outcome
variables in each model are depicted in Table 37.
Summary
The physical activity level of 349 graduate students aged 26 to 59 was examined
using various statistical analytical tools. The quantitative analysis conducted within this
chapter involved using three established measures to collect primary data: The Exercise
Benefits and Barriers Scale (EBBS), Multidimensional Self-efficacy scale (MSES), and
International Physical Activity Questionnaire (IP AQ) measured the various constructs of
physical activity among this population. Physical activity was measured in terms of MET
level. The results indicated that the majority of the students engaged in a moderate level
of physical activity with a very small percentage engaging in vigorous PA. PA correlates
identified for this population included motivators perceived as exercise benefits, coping
and scheduling self-efficacy, level of study, and marital status. The results of this study
provided the preliminary data that could serve as needs assessment directed toward future
research studies designed to further explore the wellness needs of this segment of higher
education known as graduate students.
113
l
' ii [I
' ')'

--...
Table 37. Socio-Demographic Variables, Motivating and De-motivating Factors, and Task, Coping and Scheduling Self-efficacy as Predictors of Total PA Level: Hierarchical Regression Analysis.
Variables Model 1 Model 2 Model 3
~ Sig ~ Sig ~ Sig
Age 35-44 .013 .809 .009 .864 .009 .841 >45 -.032 .550 .006 .899 .036 .402 Gender -.096 .082 -.096 .056 -.073 .098
Ethnicity Hispanic -.074 .170 -.037 .447 -.D!O .817 African -.053 .312 -.061 .201 -.051 .219 American Indian .064 .224 .066 .167 .058 .165 Asian .001 .992 .018 .707 .012 .775
Broader study area Art and sciences -.162 .014 -.127 .034 -.078 .139 Ed. Human Dev. -.056 .344 -.017 .747 -.008 .863 Level of study -.147 .007 -. l 31 .008 -.134 .002
Marital status -.212 .000 -.017 .001 -.171 .000 Employment status -.098 .078 -.059 .238 -.079 .075
Exercise Motivation .299 .000 .133 .010
Exercise De-motivation .177 .002 .071 .165
Task self-efficacy Moderate -.012 .799 Low -.025 .605 Coping self-efficacy .181 .001
Scheduling self-efficacy .347 .000 Final Model ( R ~ .449, F~ 14.129, p~ .000)

---
CHAPTER V
DISCUSSION AND CONCLUSIONS
The focus of this study was PA behavior and related constructs in regard to
graduate students. Detailed results from the statistical analyses were presented in Chapter
IV. This discussion section focuses on how the independent variables included in this
study autonomously predicted PA behavior. This chapter presents the discussion of the
results within the perspective of previous research literature and theoretical frameworks.
The results are addressed in terms of the nine research questions grouped into seven
specific sections: CVD knowledge, personal health behavior, physical activity, exercise
related self-efficacy, motivating and de-motivating factors for exercise, predictors of PA
behavior, and theoretical framework. Limitations experienced during the research and
implications for nursing are presented. The chapter concludes with recommendations for
future research.
Discussion of the Results/Findings
Students' Self-reported Knowledge about CVD, CVD Risk Factors, and Prevention Practices
The graduate student participants had moderately high to very high levels of
knowledge about CVD. They were found to have more knowledge ofCVD risk factors
than of CVD prevention or various CVD conditions. These findings are somewhat
consistent with the documented CVD- knowledge level obtained from studies of
undergraduate students and young adult populations.
115
l II ' '
1: I ll If I, 'I '

--
Although no data is available on the graduate students' knowledge of CVD, as
reviewed previously in Chapter II, findings from Vale (2000), Frost (1990), and Romero
(2005) provide a useful comparison to the study results. Vale used a representative
sample of adolescents and young adults from 19 states in the US and measured their
knowledge of CVD risk factors. The sample included adolescents and adults between the
ages of 18 and 21. The present study's participants were more knowledgeable about high
blood pressure, high cholesterol, and physical inactivity as risk factors for CVD
compared to those in Vale's sample. Both groups were equally knowledgeable about
smoking as a risk factor. Surprisingly, family history as a risk factor was identified by the
majority of Vale's sample, but only a small portion of this current sample identified it as
a risk factor.
Frost (1990) also noted the presence of slightly different levels of knowledge of
CVD-prevention practices among a sample of university students compared to this
current study. Frost's participants were more cognizant about lowering blood pressure,
reducing smoking, and controlling cholesterol as CVD-prevention strategies than the
participants in this study. However, graduate students of this study were more likely than
those in Frost's and Vale's samples to recognize weight reduction and physical activity as
key CVD-prevention strategies.
Students' responses regarding their own risk perception of having CVD were
consistent with those of two samples of university undergraduates (Collins et al., 2004;
Romero, 2005). The majority of the students in the current study perceived themselves to
be at low risk of having CVD, with a very small percentage seeing themselves at high
116
I il "

risk. Romero (2005) and Collins et al. (2004) reported that the majority of the students in
their studies rated their risk of developing CVD as very unlikely.
The participants used and/or the findings revealed by Vale, Frost, Romero, and
Collins et al. are not directly comparable to those in this study due to several factors,
including age, education level, and year of study. The latter may reflect greater awareness
of exercise and weight reduction as CVD-prevention factors today than IO or more years
ago. It is possible that, across samples, the lack of seeing themselves at risk for
developing CVD might be related to their being highly cognizant of CVD-prevention
strategies and how those factors constitute risks.
Students' Personal Health Behavior and Body Mass Index (BMI)
Students' BMI
The mean BMI value among students was found to be 26±3.8. Although nearly
half the students had BM! values within the healthy range, over 50% were classified as
overweight or obese. A greater percentage of female students than male were within the
"healthy" BM! range, but the percentages classified as overweight and obese were similar
across genders. These rates of being overweight and obesity are consistent with national
trends and trends among university undergraduate students. Flegal, Carroll, Ogden, and
Curtin (2010) found the rate of obesity to be 27.5% (ages 20-39) and 34.3% (ages 40-59)
for men. Women had even higher rates of obesity, 34% (ages 20-39) and 38.2% (ages
40-59). In a cross-sectional study of 1,701 undergraduates, Burke et al. (2009) reported
that about one third of their subjects was either overweight or obese. Those students also
had subjective signs of metabolic syndrome. Lowry et al. (2000) also discovered that
35% ofa representative sample of undergraduates (N=4,609) was overweight or obese.
117
l [I ii II I
I !
.I 1)

---That the BM! levels for the graduate students in this study fell within the mid
range of previously reported BM! levels for college students is not unexpected in light of
increasing obesity rates over time in the general population. It is also consistent with
statements that the prevalence of risk factors for CVD is high among university students
and graduate students. Thus, the trend found in this sample is congruent with trends
within the population as a whole.
Students' Sleeping Behavior
Three quarters of the students had some problem with sleeping or feeling rested
during the 30 days prior to participation in this study. Of the students having problems, a
significant proportion reported having problem with sleep or rest for seven or more days
during that time.
This finding of lack of sleep/rest among graduate students is congruent with
previous studies. Some researchers have claimed that college students, including graduate
students, are one of the most sleep-deprived groups in the US (Central Michigan
University, 2008; Forquer, Camden, Gabriau, & Johnson, 2008; Pallos et al., 2004). This
lack of sleep/rest is known to increase students' vulnerability to sleep-related
consequences (Forquer et al., 2008). Furthermore, epidemiological studies have
demonstrated an association between chronic sleep deprivation and a significant increase
in the risk of CV events (Ayas et al., 2003; Liu & Tanaka, 2002). More specifically, a
buildup of sleep deprivation over several nights can significantly stress the heart of an
individual (Banks, 2007).
Previous studies have reported that as many as 60% of students could be
categorized as poor-quality sleepers based on the Pittsburg Sleep Quality Index (PSQI)
118

(Lm1d, Reider, Whiting, & Prichard, 2010). These authors reported that many students in
their study took prescription, over-the-counter, and recreational psychoactive drugs to
alter their sleep/wakefulness. Likewise, Brown et al. (2006) recently reported chronic
sleep difficulty to affect approximately 30% of students studied. Students over the age of
22 years were found to have more sleep difficulties than students who were younger than
22 years (Pagel & Kwiatkowski, 2010).
This current study did not explore type and the magnitude of sleep/rest difficulty
among study participants. Similarly, no information about student use of prescription or
over-the-counter sleep aids was collected. However, looking at the proportion of students
having sleep/rest problems, this piece of information seems worth mentioning and an
issue worth exploring in the future.
Student Smoking Behavior
Out of the entire sample, only a very small and similar percentage of male and
female students identified themselves as smokers; the majority said they were
nonsmokers. This percentage is almost identical with the smoking rate reported among
undergraduate students (Burke et al., 2009).
Although much lower smoking rates were reported by some (Frost, 1992;
Spencer, 2002), the difference may be attributable to the amount of time that has elapsed
since their studies. More recently, Berg et al. (2011) highlighted a smoking rate of only
8.3% among four-year college students. Others have reported variations in the rates based
on gender, race, and educational status. These age- and education-based findings are
congruent with those findings reported in the CDC and Prevention's report on smoking
(CDC, 2009). The report clearly identified differences in smoking rates based on
119
1

--
ethnicity and education level. The CDC claimed that the smoking rates among US adults
decreased with an increase in educational level; the rate for those with a graduate degree
was 5.6%. The smoking rates reported in the general population were 23.5% for men and
17.9% for women compared with 14.5% for Hispanics, 12% for Asians, 23.2% for
American Indians/ Alaska Natives, 21.3% for African/ African Americans, and 22.1 % for
Caucasians.
More significantly, the smoking rate among graduate students in this study is
much lower than the national health objectives for smoking of 12%. This obvious
difference could be due to the national tobacco reduction campaign. It also may be due to
the impact of higher educational levels of the population studied. It could be due to the
fact that the University of North Dakota became a tobacco-free campus in 2007,
prohibiting the use of tobacco on all university-owned properties. Such a policy can work
if students live, work, and recreate on college campuses (Hahn et al., 2010).
Students' Alcohol-Consumption Status
The majority of the students in this study consumed alcoholic beverages; yet less
than I% indicated that they drank two to three drinks daily. None of the students reported
drinking more than three drinks daily. This very low level of drinking is rather an unusual
finding for student populations based on the studies carried out among undergraduate
students. Binge drinking rates of between 18% and 65% have been noted among
university students (Dodds, Al-Nakeeb, Nevill, & Forshaw, 2010; Spencer, 2002). Other
than number of drinks per day, no other specific data concerning binge drinking was
collected in this study. This was beyond the focus of the study because binge drinking
behavior involves amount of drink each day as well as the duration. Older age and
120

increased awareness of the harm related to drinking may also underlie any difference
found between undergraduates and graduate students in drinking behavior.
Students' Fruits and Vegetable Intake Behavior
These graduate students had a lower intake of fruits and vegetables than student
populations in previous studies. Almost three quarters of participating students reported
eating fewer than three servings while approximately one quarter ate four to eight
servings daily. Dodd et al. (2010) reported that a small portion of their study participants
consumed five servings of fruits and vegetables every day. Makrides et al. (1998) noted
an even lower consumption of fruits and vegetable among their study of participants
living in university residences. A similar finding was reported by Debate in 2001.
Previous studies acknowledged differences in consumption based on gender and
ethnicity, with African American males and females consuming much lower servings
compared to Caucasians. No such differences were noted in this study.
National trends agree with findings from all of the studies including the current
one; young adults (18-24 years) consume the lowest amount of fruits and vegetables
(CDC, 2009). Social marketing studies suggest that food consumption is heavily affected
by taste, cost, and convenience (Drenowski & Levine, 2003). Therefore, various factors
may have played roles for graduate students' fruit and vegetable consumption behavior in
this study, with time constraints being the first factor. Time constraints due to academic
load and working and studying simultaneously may have impaired their ability to prepare
healthy meals, resulting in the consumption of more easy-to-prepare meals (Chou,
Grossman, & Saffer, 2004).
121 I; i I' ;

Students' Engagement in Physical Activity
A small fraction of the students engaged in high levels of PA (> 1500 MET
min/week), and a significant number of students' engaged in moderate PA (600-1500
MET-min/week). However, less than one quarter remained sedentary, engaging in very
low levels of PA ( < 600 MET-min/week). Only 11.2% of the students met the USDHHS
recommendation for VP A.
The percentage of university students exercising at this level is still higher than
reported PA levels for many undergraduate students because the majority of students in
previous studies did not engage or maintain PA at the level known to have health benefits
(Burke, Reilly, Morrell, & Lofgem, 2009; Irwin, 2007; Lowry, Galuska, Fulton,
Wechsler, Kann, & Collins, 2000; Spencer, 2002). Lowry et al. (2000) measured
vigorous PA as 20 minutes of designated PA 2: 3 days/week. They reported that 3 7 .6% of
their study participants engaged in VP A. According to IP AQ metabolic equivalent
criteria, they reported VP A ranges between 480 MET for three days of VP A engagement
and 1120 MET for seven days. The finding was well below the range of PA reported in
this study. Reported levels of PA have been found to be low for international students;
Mazloomi, Hassan, and Ehrampoosh (2005) noted that 35% of health sciences students
did not participate in exercise at all despite being knowledgeable about the benefits.
Thus, the relatively high level of PA reported by the graduate students in this study is not
congruent with reported levels of PA among other university students and young adults.
An exception is Leslie et al.'s (1999) study in Australia wherein nearly 60% of the
students were sufficiently physically active.
122
Ii I! ,,
I ,, I ,I
I,

Others have provided insights into discrepancies in the exercise behavior and total
PA levels found among a variety of populations. Studies have specifically linked
inconvenience and travel-related issues with people's nonexercising behavior. Sallis et al.
(1990) reported reduced travel time and traffic-related stresses when people used an
exercise facility close to their residence. Therefore, proximity to an exercise facility has
shown the potential to reduce psychological and physical barriers to exercise (Reed &
Phillips, 2005; Sallis et al., 1990). Convenient access to exercise facilities may encourage
"nearby residents to be physically active and support ecological models of PA behavior"
(Sallis & Owen, 1999, p. 126).
Congruent with Sallis and Owen's study findings, the relatively high level of
exercise behavior found in the present study may be explained by the presence of a well
equipped wellness center instituted in 2006 as part of the Healthy UND 2020 initiative.
The purpose of the Healthy UND 2020 initiative was to create a campus wide approach
to health and wellness issues among UND students. The presence of high levels of CVD
knowledge and greater levels of perceived benefits than barriers may have further
encouraged their PA behavior. Students' level of study significantly correlated with PA,
and the majority of the students enrolled in master's degree programs tended to be
younger and more likely to be single than the doctoral students, and thus they exercised
more. Finally, utilization of a convenience sampling method and the presence of a self
explanatory study title may have attracted students who were physically active.
Although the students were moderately physically active, they left room for
improvement because the majority did not meet the USDHHS guidelines of 150 min of
MPA, and 22% remained completely sedentary.
123
l
I'
Students' Perceived Motivating and De-motivating Factors for Exercise and Physical Activity
Graduate students in this study perceived a greater amount of benefits than
barriers to exercise and PA. Total PA was statistically correlated with both motivation
(exercise benefits) and demotivation (exercise barriers) scores. Students scoring highest
on the benefits scale were physically active; those scoring highest on the exercise barriers
scale had fewer barriers to exercise and also were physically active. The most important
motivators for exercise and PA were physical performance, life enhancement,
psychological outlook, and preventive health. These results were consistent with the
motivators for PA reported in previous studies. Most of those studies focused on
motivators and demotivators for PA among undergraduate students and adults outside of
academia (Grubbs & Carter, 2002; McArthur & Raedeke, 2005).
Grubbs and Carter (2002) reported that students' perceived motivators for PA
were related to physical performance and appearance. They strongly agreed with
statements such as: "Exercise increases my level of physical fitness," "Exercise improves
the way my body looks," and "My muscle tone is improved with exercise." These are
identical to the statements with which this study's participants strongly agreed.
Beliefs that PA contributes to health and general well-being, that is beliefs within
the preventive health domain, were reported as motivators for being active by Tai (1992)
and were motivators for PA in this study. Physical fitness, physical outlook,
psychological well-being, and preventive health were seen as the critical motivators for
PA by student populations globally and also by the participants in this study.
Several researchers have divided motivating factors into intrinsic and extrinsic
(McArthur and Raedeke, 2005; Egli, Bland, Melton, & Czech, 2011; Kamarudin &
124
I
ii ' ,!
ill I ,,
Omar-Fauzee, 2007). They postulate that demographic variations in the amount of
intrinsic and extrinsic motivators may be present. In a sample of 2,199 undergraduates,
Egli et al. (2011) stated that male students were highly motivated to exercise by intrinsic
factors (strength, competition, and challenge) and females were motivated by extrinsic
factors (weight management and physical appearance). No such differences in motivating
factors were found in this study.
Social interaction has been found to be an important and strong motivator for PA
among undergraduates (Brown, Huber, & Bergman, 2005; Buckworth & Dishman,
1999). It was not found to be an important motivator by the students in this study. Lovell,
Ansari, and Parker (2010) also stated that their nonexercising university female students
strongly disagreed with a statement related to social interaction that "Exercising increases
my acceptance by others." These attitudes may constitute an important difference related
to perceived motivating factors based on increased maturity between undergraduates and
graduate students.
Physical exertion and time expenditure were seen as demotivating factors for
exercise and PA. Lovell et al. (2010) also found physical exertion to be a barrier to
exercise; their nonexercising university students were largely concerned that exercise
made them tired and fatigued. Brown et al. (2005) reported that participants indicated
time constraints as one of the strongest de-motivators for exercise.
Exercise milieu and discouragement were not viewed as de-motivators by the
participants in this study. Lovell et al. (2010) also noted that family discouragement was
not perceived as a strong de-motivator (relatively low mean of 1.96 out of 4 ). But,
students felt exercise milieu to be one of the important de-motivators as they agreed with
125
1
the statement "Places for me to exercise are too far away." In this study however,
building of a wellness center as part of Healthy UND 2020 initiative could be the reason
why students did not perceive exercise milieu as a de-motivator; for these students well
equipped exercise facilities were readily accessible.
In summary, these graduate students perceived greater amounts of motivation
than demotivation for exercising but social interaction was not of critical importance as a
motivator. Exercise milieu and family discouragement were not seen as barriers to
engaging in exercise and PA. Statistically significant correlation between PA and
exercise benefits and barriers strongly supported the hypothesis that students who
perceived greater benefits and fewer barriers participated in more exercise and PA.
Task, Coping, and Scheduling Self-efficacy Related to Exercise and PA Perceived by the Students
Exercise-related self-efficacy has consistently and positively been associated with
being physically active and remaining active (McAuley et al., 2007). Findings from
previous studies support the premise that self-efficacy could be a strong predictor of
exercise adherence in university/college students (Sullum, Clark, & King, 2000) and in
the general population of varying age with or without illnesses (Jonhston-Brooks, Lewis,
& Garg, 2002; Marquez & McAuley, 2006; Anderson et al., 2006; Hays & Clark, 1999;
Resnick et al., 2000). Self-efficacy is believed to serve as a positive correlate of PA by
boosting people's perceived motivation to exercise.
Levels of coping self-efficacy were statistically correlated with perceived exercise
benefits. This supports the idea that increased ability to cope with the challenges in the
academic environment is strongly associated with increased perceived benefits and
barriers and vice versa. Levels of scheduling self-efficacy were also significantly
126
l ,1
II
II

corelated to both exercise benefits and barriers. Students with higher levels of confidence
in regard to dealing with scheduling issues had higher levels of exercise motivation (high
benefits score) and lower levels of demotivation (increased barriers score). Moderate and
low levels of task self-efficacy were negatively correlated with exercise, suggesting that
those with low to moderate confidence in being able to perform necessary exercise
related tasks were less likely to exercise.
Levels of self~efficacy not only predicted degrees of motivation but also predicted
PA behavior. A multivariate regression model demonstrated statistically significant
relationships between total PA and coping and scheduling self-efficacy, which predicted
36% of PA behavior. Task self-efficacy was not a significant predictor of total PA.
According to the SCT propositions, negative and positive correlations between
self-efficacy and PA indicate that individuals who perceive themselves as highly
efficacious entertain high levels of exercise benefits and perceive fewer barriers about the
behavior (Bandura, 1997). Congruent with SCT propositions, self-efficacy levels and
levels of leisure time PA positively correlated with PA among working individuals
(Rabinowitz, Melamed, Weisberg, Tal, & Ribak, 1992). Rabinowitz et al. measured self
efficacy levels with a six-point self-rating from very low to very high addressing
confidence to engage in leisure time PA. Chiu (2009) established strong positive
correlations with attitude, motivation, self-efficacy, and PA among undergraduates (N
=1,352). Associations between self-efficacy and exercise or any correlates of exercise
suggest that people with high levels of self-efficacy tend to engage in high levels of PA.
Most studies of exercise-related self-efficacy conclude that high levels of motivation
produce high levels of self-efficacy resulting in the confidence to exercise satisfactorily.
127
I !
i'

---
As suggested by previous studies and verified with cmTent study findings, self
efficacy is a strong predictor of PA motivation and PA itself. Although high levels of task
self-efficacy and moderate levels of scheduling efficacy were perceived, the confidence
to exercise under challenging situations (coping efficacy) was found to be lacking.
Enhancing students' self-efficacy is of critical importance due to its ability to minimize
stress and improve perceptions and interpretations of the ability to engage in PA behavior
as desired (Bandura, 1997). Schwarzer and Renner (2000) validate this by stating that
coping efficacy might be the most critical element of behavioral development.
In summary, to promote people's long-term wellness, it is imperative to develop
cognition and beliefs associated with successful behavior change. A university education
provides students with the opportunity to grow academically, but may also increase their
vulnerability to inactivity and related consequences. Thus, research and practices should
focus on the development of self-efficacy beliefs and attitudes.
Predictors of Exercise Behaviors among the Graduate Student Population
The final research question guiding this study addressed the overall statistically
significant predictors of PA. Hierarchical linear regression analysis was conducted with
socio-demographic variables (age, gender, ethnicity, education level, education area,
employment status, and marital status), CVD knowledge, motivation (exercise benefits),
demotivation ( exercise barriers) for exercise, and exercise-related tasks, coping, and
scheduling self-efficacy.
Five variables were significant predictors in the final regression model: level of
study, marital status, exercise motivations, coping self-efficacy, and scheduling self
efficacy. Married students had lower levels of PA than did single students, females were
128

--less active than males; perceived levels of exercise motivation, coping self-efficacy, and
scheduling self-efficacy predicted higher levels of PA. These findings agreed with those
from the previous bivariate and multivariate analyses.
The findings were also consistent with those from a review by Trost, Owen,
Bauman, Sallis, & Brown (2002). Their review of more than 300 published articles
summarized the major determinants of PA. The review suggested that participation in PA
by an adult may be influenced by a range of demographic factors such as age, gender, and
education levels, with cognitive/psychological factors such as perceived se!f:efficacy and
perceived benefits having the strongest correlations. Additionally, they found other
variables to be the determinants of PA that were not addressed in this study such as
socioeconomic status, overweight, obesity, attitudes, intentions, exercise schemata,
perceived behavioral control, normative believe psychological health, and stages of
changes.
Findings from this study did agree with Sallis and Owen that marital status, level
of study, high levels of motivating factors, and self-efficacy strongly predicted PA levels.
Knowledge was discounted as a predictor of PA by the Sallis and Owen review and this
study.
Discussion of Theoretical Underpinnings
Health Promotion Model and Social Cognitive Theory have been used
individually to predict PA behaviors among a range of populations. This study integrated
the major constructs of these two theories into a parsimonious model to examine the
factors predicting PA for graduate students. Two major factors influencing health-related
behavior (PA) derived from the HPM were studied: individual characteristics and
129
I !
I

behavior-specific cognition and affect ( e.g., perceived benefits to behavior, perceived
barriers to behavior, perceived self-efficacy). Pender's HPM argues that the individual's
ability to engage in health-promotion activity depends upon those factors along with
competing demands for each individual. Interpersonal influences described in the model
were measured with perceived benefits and barriers to exercise. The theory states that
these constructs ultimately lead to self-efficacy. The HPM and SCT theories both see
self-efficacy as the critical element leading to ultimate health-promoting behavior. The
health-promoting behavior of interest in this study was total PA. Various aspects of
theories were measured using some established and some newly developed measures.
Descriptive statistics for each variable within the theoretical model were
individually measured. Such variables included age, gender, ethnic identity, marital
status, area and levels of study, CVD knowledge, perceived benefits and barriers to
exercise, self-efficacy ( coping, task, scheduling), and total PA levels. Furthermore,
correlations among these variables were tested with several bivariate and multivariate
regression models. Finally, shared ability of all the variables studied to predict the
outcome variable was analyzed using hierarchical linear regression.
In accordance with the proposed model, personal factors did not predict behavior
specific cognition but factors within behavior-specific cognition (motivation and
demotivation factors and self-efficacy) were strongly intercorrelated. Levels of self
efficacy also predicted the final health-related behavior, PA. Nineteen variables in the
model (socio-demographic and cognitive/psychological) together explained a total of
45% of the variance for PA; this is significantly high for social research studies where
prediction of human behavior is rather a complex process.
130
,
I
ii II 1:
As postulated in the theoretical model, socio-demographic variables and cognitive
variables described by the HPM in accordance with Bandura's reciprocal determinism
were partially effective in predicting final PA behavior. Motivating and de-motivating
factors were found to predict perceived self-efficacy. As explained within the theoretical
framework, for an individual to perceive a high level of self-efficacy, perceived
motivations must outweigh de-motivations; this was predicted by the model. At the
center of the framework, PA was also the major outcome variable. The structure was able
to predict that if a student perceives a high level of self-efficacy, he/she will engage more
in PA and exercise. If a person does not perceive a high level of self-efficacy due to
perceptions of a high level of de-motivating factors, then he/she will not engage in
exercise and PA.
Limitations of the Study
Limitations for this research relate to the sample characteristics, instrumentation,
data-collection procedures, and dissemination plan. The research used a convenience
sample of 349 graduate students. The age of the students varied between 22 and 59 years.
The majority of the students were enrolled in masters' degree programs (70%); most
(83%) of them were Caucasians; and 63% were females. These sample characteristics
limited variability and generalizability of the findings. Consequently, the study findings
have limited generalizability to other graduate students. The inclusion of such a large
proportion of master's degree students suggests that age differences may be involved in
the finding that level of study was a significant predictor of PA. Finally, obtaining
subjects from a single university located in a specific geographic region may also affect
the generalizability of the findings (Polit & Beck, 2008). In addition, the University of
131

North Dakota houses a well-equipped wellness center, and student populations at other
institutions may not have access to such facilities.
All data in the study were generated with self-report measures, including
information about weight, height, and the amount and duration of each type of physical
activity the students engaged in during the seven days prior to participation in this study.
The use of self-report measures can lead to potential problems with data interpretation
and dissemination. The major problem reported with this approach is that study
participants could be influenced by social desirability and memory while they complete
the survey (Polit & Beck, 2008; Trochim & Donnelly, 2006; Adams et al., 2005). The
responses may be vulnerable to students' faking their answers in order to provide a
socially desirable response (Burns & Grove, 2005). This could not be controlled by the
researcher due to the online nature of the survey.
Physical activity levels in the study were measured using the psychometrically
sound International Physical Activity Questionnaire (IP AQ). As with other PA
questionnaires, the IP AQ has practical value for estimating the magnitude and patterns of
PA among populations (Shephard, 2003). Nevertheless, the use of such questionnaires as
a self-reported measure of PA has been reported to have a tendency to provide erroneous
estimations; Ramirez-Marrero et al. (2008) reported that levels were overestimated
among study participants. If feasible, more objective measures of PA could yield more
reliable and valid results. Examples of such objective measures are pedometers and/or
accelerometers or metabolic biomarkers.
Another limitation to this study involved the absolute Jack of reference data with
which to compare the findings. References would have been helpful for comparisons of
132

findings with past situations, in various geographic regions, gender and ethnicity, and
master's degree versus doctoral degree students. Most studies were conducted with
undergraduates, pediatric populations, or populations with specific illnesses. The results
from this study will serve as reference data to compare similar findings for future studies
of graduate students.
Implications for Nursing Practice
Nursing is not well informed about the problem of CVD or the prevalence of PA
behavior and correlates of PA among the brightest and highest educated citizens of our
society. These graduate students are the future leaders in their own communities or
professions. This lack of knowledge for the most part is due to lack of research studies
carried out among these students. Carper (1978) argued that "Nursing depends on the
scientific knowledge of human behavior in health and illness, the esthetic perception of
significant human experiences, and a personal understanding of the unique individuality
of the self and the capacity to make choices ..... " (p. 22). Yet, exploring any phenomenon
in isolation does not provide a comprehensive picture. This study explored the
phenomenon called PA in terms ofCVD knowledge, socio-demographic correlates of
PA, motivating and de-motivating factors for PA, and exercise-related coping, task, and
coping self-efficacy. The findings potentially provide a key research background for
promotion of an understanding of the phenomenon of PA in regard to graduate students
for nursing. Therefore, this study adds to knowledge development for nursing.
The findings from this dissertation study also highlight the importance of
motivating and de-motivating factors for exercise tested within an accepted theoretical
framework. This has the potential to promote the development of innovative strategies
133

designed to encourage PA among graduate students who are sedentary or relatively
inactive despite having a well-equipped wellness center within their reach. Multi
dimensional approaches are needed when designing PA-promoting strategies in order to
increase perceptions of benefits and decrease perceptions of barriers and to enhance
coping and scheduling self-efficacy. An example of one such strategy is a
nursing/wellness outreach program that reaches out to physically inactive students
beyond the boundary of the wellness center. These outreach programs could be organized
through interactive sessions on campus colleges. More opportunities and encouragement
need to be provided to married students and/or those enrolled in doctoral programs.
Specific strategies that focus on friends, family, and children need to be developed.
Exercise benefits scores strongly predicted self-efficacy and total PA, suggesting
that strategies to increase self-efficacy beliefs are imperative. The individualized needs of
students or groups need to be considered; each person should be helped to develop
realistic goals that fit his/her needs. Incremental steps in a PA plan for the absolutely
sedentary student and the development of family inclusion plans are important. A holistic
approach to deal with physical inactivity among these students includes the
implementation of time management, peer role modeling, continuous feedback, and
following strategies to promote self-efficacy (Allen, 2004; Hays & Clark, 1999).
Recommendations for Future Nursing Research
This study provides baseline data for evidence-based approaches to enhance
wellness issues among graduate students. Although the study findings were solely based
on self-estimates of health-related behavior, the correlates of PA were estimated
comprehensively. Limitations that affect generalizability of the findings suggest the need
134
I
I I
I ' ' '

for further studies that objectively delineate these findings. The study could be replicated
solely among non exercisers to address their demotivation for exercise and establish its
relationship with a specific type of self-efficacy. A similar approach can be used to study
only exercisers to measure their motivation to exercise and self-efficacy. The findings
then could be used to develop evidence-based intervention to promote PA.
This study's results distinctly demonstrated that, at least in this population, PA
levels are substantively influenced by one's belief in his/her ability to cope with
challenging academic situations and deal with scheduling issues. Exercise interventions
could focus on the actual/potential relationship between a change in self-efficacy and PA
level. Interventions may also be designed to determine a relationship between a change in
exercise motivation and PA level over time or during a particular season.
Additionally, the development of an instrument to measure motivating and de
motivating factors for exercise and PA may be desirable. An instrument customized to
the needs of the graduate student in the face of changing dynamics such as increasing
ethnic and age variations may be time relevant (Snyder, Dillow, & Hoffman, 2009).
To minimize the effects of self-report measures as noted by Ramirez-Marrero et
al. (2008), more objective measures of PA could be used in addition to questionnaires.
This would increase objectivity of the measurement and help establish concurrent validity
among the measurement methods used. Anthropometric measurements such as metabolic
biomarkers could also be paired with these subjective measures, providing researchers
with more comprehensive knowledge about the students' actual/potential risk of having
CVD so that more aggressive interventions could be implemented. Research about PA
behavior among students should progress to experimental designs in which interventional
135
i I

programs can be implemented to enhance students' health-promoting behavior. In
addition, a key area for further research is distinguishing between leisure and nonleisure
PA in this population.
136

APPENDICES

Appendix A
University Of North Dakota IRB Approval Letter
UNIVERSITY
December 29, 201 O
Blbha Gautam 4901 4" Street #98 Lubbock, TX 79416
Dear Bibha:
0 F ~ NORTH DAKOTA
JNSTiTtmONAL REVIEW BOARD (:}o Rt.SEARCH DEVELOPMENT AND COMPLIANCE
D!VJSJON Of R£SE.ARCH TWAMLEY HALL ROOM ! 06
264 CENTENNIAL DR.IVE. STOP 7134 GRAND FORKS ND 56102.-'ll 34
ao n n 1-4279 FAX (701/ 777-6708
WW,N. Und.edu/dept/1clcjreg1n::omm/lRB
We are pleased to infom1 you that your project titled, "Transfatfon of Cardiovascular Disease Knowledge into Exercise Behavior: Motivational Factors to Exercise Reported by Young Adults Enrolled in Graduate School'' (lRB-201012-172) has been reviewed and approved by the University of North Dakota Institutional Revlew Board (IRB). The expiration date of thls approval is November i5. 2011.
As principal investigator for a study involving human participants, you assume certain responsibilities to the University of North Dakota and the UND tRB. Specifically, any adverse events or departures from the protocol that occur must be reported to the IRB immediately. It is your obligation to inform the JRB in wrtting if you would !Ike to change aspects of your approved project, prior to implementing such changes.
When your research, including data analysts, is completed, you must submit a Research Project Termination form to the !RB office so your file can be closed_ A Termination form has been enclosed and is also available on the I RB webstte.
If you have any questions or concerns, please fee! free to call me at (701) 777 .4079 or e-mail [email protected].
Sincerely,
~:~\\~~'\ Mi:~·l. Bowles, M.P . .A. \\_ JRB Coordinator
MLB/jle
Enclosures
138
' i; I !
I
I I

REPORT OF ACTION: PROTOCOL CHANGE University of North Dakota lnstitutlonal Review Board
Date: 2i3/2011 Project Number: IRB-201012-172
Principal Investigator: Gau!am, Bibha
Department: Nursing
Project Title: Translation of Cardiovascular Disease Knowledge into Exercise Behavior: Motivational Factors to Ex~~~J_s_~_.B_:p~~E:9. by Youn~--~d_u_lt_~_ Enrolled in Graduate Sch~?I ---~---~
The abo. ' .. ·.e .. f.'');,e.r:,ced project wa·,··· '". v.iew···ed by a Designated Member for the University's Institutional Review Board on ___ .,.;;/ft...;-'&dLL_____ . _ and the following action was taken:
D Protocol Change approved. Expedited Review Category No. __ _
Next scheduled revlew must be before: "'-·--·-·--· .. ··-··--- .... ··-D Coples of the attached consent form with the !RB approval stamp dated , __ _
must be used in obtalnfng consent for this study.
rotocol Change approved Exempt Review Category No J!_, _ _ __ _ his approval 1s valid untJ! _ Nuvembec.._l5..,-2.()ll-~ _ as long as approved procedures are followed o periodic review scheduled unless so stated 1n the Remarks Section
D Copies of the attached consent fonn with the IRS approval stamp dated __ /l.._ / A must be used In obtaming consent for this study -~-r,
D Minor modifications required_ The required corrections/additions must be submitted to RDC for review and approval. This study may NOT be started UNTIL final IRB approval has been received. {See Remarks Section for further Information.)
D Protocol Change approval deferred. This study may not be started until final IRB approval has been received. (See Remarks Section for further Information.)
D Protocol Change disapproved. This study may not be started until final IRB approval has been received.
REMARKS: Any unanticipated problem or adverse occurrence in the course of the research project must be reported within 5 days to the IRB Chairperson or ROC by submitting an Unanticipated Problem/Adverse Event Form.
Any changes to the Protocol or Consent Forms must receive IRS approval prior to being implemented (except where necessary to eliminate apparent immediate hazards to the subjects or others).
PLEASE NOTE: Requested revisions for student proposals MUST include adviser's signature. All revisions MUST be highlighted.
' \ \Education Requirements Completed. (Pcoject cannot be stacled until IRS education cequirernents am mel)
oc: Dr. aette Ide
!fihe proposed proiect (clinical medical) is to be part of a research activity funded by a Federal Agency, a special assurance statement or a completed 31 O Form may be required. Contact ROG 10 obtain the r~uired documents_
(Revised 10/2006)
139

REPORT OF ACTION: EXEMPT/EXPEDITED REVIEW University of North Dakota Institutional Review Board
Date: 12/22/2010 Project Number: .-----l.RB...-:2.0.lOlZ:::llZ. -·--·----- ------·-----
Principal Investigator: Gautam, Bibha -----""""""""-""-·
Department: N_~sing
Project Title: Translation of Cardiovascular rnsease Knowledge into Exercise Behavior: Motivational Factors to ~xercise Repor~~?-~tX?~-~-~~9-~.1~--~-~_r_?!!ed in Graduate School
The abOV'}' >efr. e .. nqe.9' proJe·c· t·w···a···' ... r.ev. lewed by a designated member for the University's Institutional Review Board on ~fd-;_d.3f'dL21D _______ and the fo!Jowing action was taken:
D Project approved. Expedited Review Category No ________ _
Next scheduled revlew must be before: ____ _
D Coples of the attached consent form with the IRB approval stamp dated must be used In obtaining consent for this study.
,'.\(Project approved. Exempt Review Category No. _____________________________ ;2 ____ -c---,---~ ~his approval is valid until _______ Uo.v.embe.r_J.-5..,...-20 as Jong as approved procedures are followed No
periodic review scheduled unless so stated in the Remarks Section.
D Copies of the attached consent form with the IRB approval stamp dated must be used in obtaining consent for this study.
D Minor modif!cations requ!re<J. The required corrections/additions must be submitted to RDC for review and approval. This study may NOT be started UNTIL final !RB approval has been received,
D Project approval deferred. This study may not ba started until final IRB approval has been received. (See Remarks Section for further information.)
D Disapproved claim of exemption. This project requires Expedited or Full Board review. The Human Subjects Review Form must be fil(ed out and submitted to the !RB for review.
D Proposed project is not human subject research and does not require !RB review.
D Not Research D Not Human Subject
PLEASE NOTE: Requested revisions for student proposals MUST Include adviser's slgnahne. AJI revisions MUST be highlighted.
~ EducaUon Requirements Completed (Project cannot be started until tRB education requirements are met)
cc: Dr, Bette 1de ~ _;> /2 IE li_~a_
Date
lf the proposed project (clinical medical) is 10 be part of a research activity funded by a Federal Agency, a special assurance statement or a completed 310 Form may be required. Contact RDC to obtain lhe required documents<
(Revised 10/2006)

Appendix B
Survey Questionnaire
Translation of CVD Knowledge into Exercise Behavior: Motivational Factors
141

Ti:Je cf :he proie,ct: Tran.ss3:ic'1 cf CVQ Fr-owledg.e 1"1to £xercis.;;e 8eh.TJtor and Motivatton toward E'\e-rcis.e among Gr.aduat-= Stud-€nts_
'!cu are t:"8'1Q 1nv1te-d tc v-olv'1:arily part\:1pate in this rese,arch study bewuse yc,u axe 3 fu\H;'Tfe gr3duate s::udent at ::he ;Jrw:e."Sity of North Dakota_ The purpo~ of she- s:udy is :c -expicre :he re!afo-nships betvwc•en graduate .students-· self
""epor:ed know!edg,e :,;bout cardlovascvL;.r disease \GVD) 3rd th+ir preverrtion pr3-::ti<:>e-s.
1fyou. agr....e :c comp!~e tfos oohne surve-y Oy clicking the bi...~:m b€1ow. you win be re,qv1~ ,:o .1nswer quE-5~io.f1S ..:..OOu:
CVO k0owiedge. person.a' healih beh.l-.1u, physie.:il activ;,:Y b--e-K.:.~·tcr. ~rceived se-/f e:fficacy, yovr motv~"lticns and de-1\0-1:1'.'.:.':ions for physie.31 ac:ivi-:y, and demogr-3,ph;c ln.fom:-,;.t.cn_ You 3:l'e not re-qu,r'8:! to disclose any of y'J:vr p.H:S-Onal infom:.1:ion ir'e-:luding your n3n;~ Th~ answers you pro•,,ide W111 rern.1.in anonyn"CWS. As J resp00ding :grao\.Ja:e :st..1Mnt you will 0€' .assigne·d a urnq•.ie oode :h3t -3HOlh'S :he rese3rr.::h tt?.lm tc m..'ltch your 3J1SW€:'fS over cirr:e ·Milk: maintainin9 ,;monym-ity. The ro:Suf:s o'f tt'us study' wiH onty b€ reported ir,. gror.;ped format
There are no known risks associated with )'our part~-:JJ:"dticn in. this study .anri no direct b.?nef.rt frorr: y;:iur p-3r"J,:ipaton 1s expe,cted. There is no ros: to you exc.:,pt '15--20 minutes of ycur tirr:"'"- Up"°n re-ceipt of the -oornpteted suf'Ye'.y, if you ,::hoose. 'fOl.Z -em.ail addr-ess will be e~re-d in 3 dra--Ning for a chance to win ooe cf tl\'O 4th Gene-r3tion Ap_ole iPOO Touch
The ?rincip:3! ln-vestlga:o-r is 81bha GaU""1m. RN. a PhD nursing stu.:lent at the Univer:sf!y cf Nortfl. OaJl.ota_ Only Ms_
Gautam ~:il"Kl her aditisor will have aOY=ss to- !he information co11eci,::d ln order ro rr,alm.3in 'J'OUr ccnfidentia!cy, you wit! not t-e asked to V1trite your name an,::J or any cthfl:r p'?.rs.on.Jl id,enti5e-r Compteted surveys "hill be- kept in a iO{;ked cabinet in the Prs office and all et~ronfC <lata 'hill he kept in a passw!m:i-p-:mtected ccm,puteL
lf you need further informs ton about !his study, 1, the Prinapa! Investigator, ,;;an b<? contacted anytime durin-;i or afte. the study at 808-831-3515. You can aiso cont.act my Diss,ertati-on Proje-.:1 Chair. Dr. Biltte lde at 701-777-45'3-i with qw;,•s.tio:ns. lf you have- any question-.s .rorn....~ming your ri.ghts as a r.eso;;.arch sub_F-ct have ronc,,..Jns or -oomplalnts, a,-,d
wis-h w speak v.rth SOT~€' who is 1.m.affi:Jiat'?<l with :h~ r,ese,arch JXOJe-ct. you may ca!! the Universily of Nortll Dakotl
lnstitui:ional Re<,1iew Boa.rd at 701-777-4279. All c3Tis will remain oonti:demial.
By completing this surJey, you a:re ,giving permission tor the investi_gat:or to use your informabon tor research proposes in
a way that you will not be harmed.
* 1. Do you wish to participate in this study
0 Y:$, -I wt5n-"l.O p,;rtt::ip.11-\.? l1 trh, S<,"1,;rjy,
0 tlb. l 00 rtit ll$1 kl~))$:~ U1 trlf- s!UC'f
142

The fuH01;·;r1g four 1-4) que.stions wil! address your curr,:-n~ knowledge of mrdio>.•.:..scul3r dis.£,c<.5-/i' -(CVJi. common risk factors fur C\/0. commonly u:b!i:z;;.d prev>?ntion .:<ppmaches, .Jnd your pe-rceptitx'i of having CVD Piease do not look rt up b~u$,: :his i:s not a :estPJ,:;.ase- s>?!eoct eJ(.'lCt tHJm~·r cf re-s.ponse ..J'S asked in the qvesh::ins.
* 2, From the list l>elow, select four (4) conditions that you think are considered as
cardiovascular diseases (CVD),
D H!:-Jt":. :m:3Cl
0 Hfgn ch0Jes1;,.;o;
o 0130!:!~5
0 He-art fJlltri<
D Pen;mera; ra!ie"J:H ctsease
D H~r: rrl)!ll"r'c di>t(Ci,?t
D High CiOOl'l J'.f%&11?
:I
I I
ii,'' (
i;!'·

I
* 3. From the list below, select Five (5) commonly reponed risk factors for cardiovascular diseases (CVD),
D u'""'""9" On1gtit;:ooi:1~
D Eatig lelc '1':Uth s.Mll!lsh
D !.J'.}>A txonc pressl.IT'.
D rli@,.-1-ch:::iestero!
0 Th)roH1 dl&easi;
D LC* :cticies::~rei
D OV.erA',e;grrt
D Fa.'nlty l'i1~ or CVD
D PnJEcaf !nar.t:.r:y
0 Too mu::n .,:xl!',;::ti;e
D ~,0tm9
D M)' !type ~,c.;nc-er
144

* 4, From the list below, select five (5) commonly utilized specific strategies to prevent
cardiovascular diseases ( CVD).
D Mam:aui1ng ftlNJ w~1gr.;
D ccntro1nr>;i 010,:;cr: m-::itstetc! to lffP,,:'1 ""200 n;':tl
0 Cti'l!l'etLng y:iir ra'l"!ty his-torJ cr cvo
D Tatmg nv:M!3tr,:,;s r~J!3'.ly
D A·.-u,:i;i:g CJ:ffcwr,;i 1c, core "Jl\':a:thH
D Et\g,Jgt1g 1n r~;.1:u pi;y&tcai 3ct'>~ry ,;1rd e:i:ercis.e
D Cootto1L;g ti:@l prew.ire i1 tt is ~Ec¥Jiled 1c- pCf:lts :me,,~ r,-::1·m:;1
D OJ1tL"l_g S11'¥:ikJii9
D Cootro:lb;g t+OW: press.ura ir l1 ;s etevateci ::X:- pcc,ts at,::,;,e ncrnai
D Ortrklr:'9 ~~e 'Jial~ antt iwos
0 Controlllr9 bkXX'.f crso1e..tero! to :u,ep G .,.zro ng;'oJ
D Eati!'!!J ft.Jd hlgtl !!'I y;t:;;m\"1 C
D coocrolll'19 Olood:'gfu~ 1ryou 3t~ <:11a:ie:1c
D E-at!::'9 tl:let 11,;9,'I Ir. ca!t1urn Jt>1l' MMr m1n1ua1s

* 5. What do you think is your level of heart disease risk?
[Please select one (1) answe] r, (j LOW n;t
,-, \-) M~€Jt9:
* 6. Why did you choose this CVD risk level?
~-------------·--.. -----~ --------------------~
* 7, What is your current smoking status?
~-----------------""·-·--.... - ....... _ --- ~-----------------~
* 8, If you are a current smoker, how long have you been smoking?
(Please select the appropriate response from the list below)
o tesslfrlan {}$!
Q 1-3years
() Hy,ars
()1-1oyw,.
0 M~ 11\ll'!. ·rn )'-E3l'S
146

* 9. How mnny cigarettes do you smoke in a day?
~---------------------------------~-·--~·-
* 10, Do you currently consume alcoholic beverages?
() Ne
* 11, If you currently consume :,lcoholic beverages, what length of t.ime h:,ve you
consumed alcoholic beverages?
·O Le~i}""Jf
0 \-2)<Jn
3"-5~m
Q L-c:rgennar 5 JaJrs
* 12, If you currently consume alcoholic beverages, how often do you drink?
One (1) drink is equal 10:
• One (1) 12-aunce bottle of beer
• One (1) 4-aunce glass of wine
• One (1) ounce of 100 proof spirits(SO% alcohol) • 1,5 ounces of 80 proof spirits(40% alcohoQ
PLEASE SELECT ONLY ONE RESPONSE Oto1 dmk
0 0 0
0 0 0
4or~tirt'.lts
0 0 0
~--------------------"·--------- -------------
147
(I I
!ii !ii 'I, ::1

* 13. During the past 30 days. have you felt you did not get enough rest or sleep?
C) '!%
() ~Q
* 14. You felt that you did not get enough sleep or rest during past 30 days.
From the options below, please select the range of numbers that closely matches the
number of days that you felt you did not get enough sleep or rest.
() :s,...tn.srs
r1 S-6 ttav;s u '
() 7 !lays rx ~
* 1 S. How many servings of fruits and vegetables do you eat every day?
One serving size equals to:
• 1 medium-size fruit (slze of a baseball)
• 1 cup of raw leafy vegetables (about the size of a small fist)
• 112 cup frult or vegetable juice
• 112 cup of other vegetables
• 112 cup chopped, cooked or canned fruit
Select serving/servings of fruits and vegetable you consume in a day.
0 0-1&=:!\"ing
0 2-}5e(";1rg&
0 4. 5- ser.irgs-
() 6 • 7 ~.1'196
0 B se-,1Mgs or 100re
148
!'< ),'
I I!'<
).,;

* 16. Think about all the vigorous physical activities that you did in the last 7 days.
Vigorous physicnl activity refers to activities that tnke hard, physical effort and make
you breathe much harder than normal.
Think only about those physical activities that you did for at least 10 minutes at a time.
During the last 7 days, on how many days did you do vigorous physical activities?
VIGOROUS ACTIVITIES ARE:
Heavy lifting, digging, aerobic dance, aerobic exercise, fast bicycling, jump roping,
swimming, singles tennis, Soccer, field or ice hockey, basketball, cross-country skiing.
/~ l_) 2 cr3j'S
() '""' 0 '""' Q sea,~
Q Mi:«> Iron : d,3)'5
0 No Vigerous PhyMca! P.c!Nlty
* 17.11 you did vigorous physical activity, how much time did you usually spend doing
those physical activities on one of those days?
149
11
I

* 18. Think about all the moderate activities tho! you did in the last 7 days. Moderate
activities refer to activities that take moderate physical effort and make you breathe
somewhat harder than normal.
Think only about those physical activities that you did for at least 10 minutes at a time,
During the last 7 days, on how many days did you do moderate physical activitles?
MODERATE PHYSJCAL ACTIVITIES ARE:
Carrying light loads, bicycling at a regular pace, doubles tennis, lee-skating, roller
skating, horseback riding, playing Volleyball, badminton, and mowing the lawn,
DO NOT INCLUDE WALKING.
() ,1 $3}1>
Q 5:t.<ys
() Mrre than S days
0 NO ~el'at!!: ::,!',)$''::al a...'ih!ty
* 19. If you did moderate physical activities, how much lime did you usually spend doing
those physical activities on one of those days?
OJe-ase Sefe:ct One
j
150

* 20. Think about the time you spent walking in the last 7 days. This includes at work and
at home, walking to travel from place to place, and any other walk.ing that you might do
solely for recreation, sport, exercise, or leisure.
During the last 7 days, on how many days did you walk tor at least 1 o minutes at a time?
* 21, If you walked, how much time did you usually spend walking on one of those days?
This includes walking at work and at home, walking to travel from place to place, and
any other walking that you did solely for recreation, sport, exercise or leisure.
* 22, The last question is about the total time you spent sitting on weekdays during the
last 7 days. Include time spent at work, at home, while doing course work and du1ing
leisure time.
This may include time spent sitting at a desk, visiting friends, reading, or sitting or lying
down to watch television.
During the last 7 days, how much lime did you spend sitting on a week day?
~---------------------------~--------------~
151
l i I
:.1 .. ·11
'
ii\

A number c,{ srtuaticns .:;r..;. describB-d befa.v th.3it c..v, make l't hard to s:ticl; :o e:o:ercis-2 reguL.wfy On the ,'tJ:ms befcw. p1ease r3<€ yos;r roni'id;;;,rtv"'€' tiiat you can perfom; <:xe-rcise on a rEgu/.ar basrs (at least 5 days:. week). Please ratE> your ~gre-e of coniidenc,e by recording in ,each of 1:le blank spaO!?s a number from Oto ":DO using the sca\e OOlow.
0 10:. 2D . 30.. 40 "'Cannot rio at all 50 .. _ t}O ... 70 . , .. 80 00 = Mod~at'?ly C<?r.ain HJO = Gertan, c.:>n do
* 23. By checking a bubble corresponding to a number from O to 100, RA TE YOUR DEGREE OF CONFIDENCE to do the following:
Q :c ZJJ ,o "' 50 so 71:l BC 90
; . To -:xero~ \'litien yru f-aei oisco•,rtort () 0 r·, V '1 ,~ ()
(-, (-, r-, () -) 0 2. T~exBU.s:e ·vnen you i.act ell'E!!gy. ,j ,,._..! ,j ,, a. To e.arci&e ""'"'e, )OO oori:t tei':l ~11. () () r-1
'\._.?
4. T{;l csr:p;~te )our exeretse ll-SL"f9 ,p'pPB" 1edln:que. 0 0 0 r, n \..) ,..., 5-_ Tu f0l¢W dlri:!:ttorcS 10 ::ooiplai! exb'OSi!. 0 ,.--~
\.j () E. Tc ~rfotIT :ill or-ti'~ rqJlr?j mo•-ene'l~ 0 0 0 ~,
\.J C) c, cl 7. 10 lr,C~ ~i~e 1'1 y'OIS oany rouMe... n 0 ,r, r-, f-,
• I ,./ ,j ,j "-"
,S_ To OOt',Slsterty £we:rcis.e l!ir !Hr.a. pa .i.';?£1 0 r, n 0 0 0 ,,
\j '0 'v S. Tc ~ your W"l:Oute 1o ir:CttllE' r€9W.ar -axe.rclS:- ,~
'-) 0
U:Kl
C)
~----------------------~·----~---.... --·--·-------------~~
EXERCISE 8ENEF1TSl-8ARR1ERS SCALE Below are statements. that rel.;Jte to ld-=a:s a.bout exe-rcise. Please irxii,c.ate the degra-e to which you agse-e or dis.agree with the state-merits by circling SA for :strongly agre-e. A for .agree, D for dls.ag;~ or SD for strongly disagre.:: ..
* 24, The following factors related to everyday life encourage or discourages me to
engage in Moderate intensity exercise for 30 minutes at least 5 times a week
SA= Strongly Agree, A= Agree, D = Disagree, SD= Strongly Disagree 5A A D
fsl ~yexffctse .. 0 0 0 2. E).WQ:< ~ ~r,gs ~ Sirass ~ teroi'OJ'!,1.:ir .me. 0 0 0 !-.. Eter~ rnproves ~ emai heaith 0 0 0 4. Exert:w takes too rnueh r:t my time-. 0 0 0 5. I '41!f prevent he~ :at!JCU ID}'~. 0 0 0 a Ex&cise !ll'E£ m.a .. 0 0 0 7. Emc!S&~sesmy~~ 0 0 0 !L Exe,ro:Sl, g·ri$ me a &eJ:5e at p,ersorrn Eroff¥Jll&~t 0 0 0 9. Places !'or me to exemtse-aretootar ~- 0 0 0 i!l Ex:Erclstng maes rne-:eei rs.nm 0 0 0 1 t. Enrclsmg a me lllve -cootao: 1hith flien:is_ & pen,;nns l emoy 0 0 0 12. lam too e~;o exE!dse 0 0 0 13. ExetiSlng 'MH keep rn£o 1l'<Cm h:a'ilog ~ ~ prH,Wra, 0 0 0 '}.1, 11 COS:& too muctl ·to ei:~. 0 0 0 _________ " _____________
152
SD
0 0 0 0 0 () 0 0 0 0 0 0 0 0
l II
i'i ii ii [·!
i:i
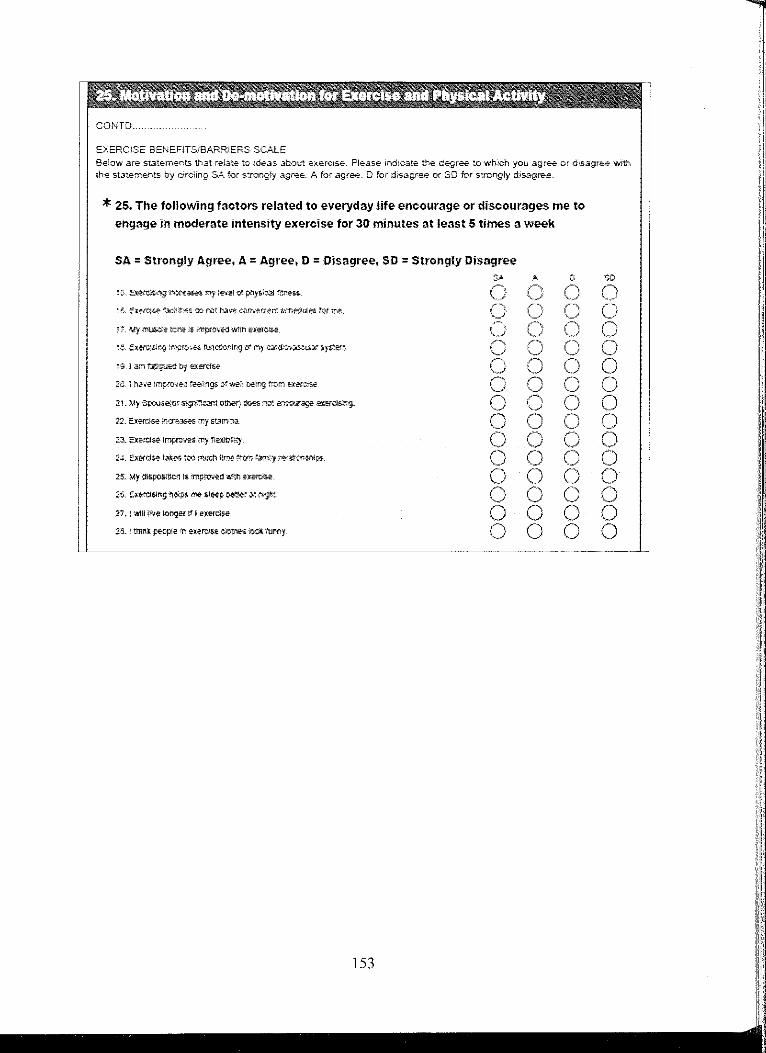
l ' 't ' ' . ' '' COt<iTD ..
E);ERC!SE BEhEFJTStBARR!ERS SCALE
Belaw are St.Jtements that relate to ideas ab:::iut e:-.ercise. Please indte".ate the degree .~o which you agre.e or dr.s,agr~ v.1th -::he st,:;:;ements by circling SA for s-:rongty agri;.e. A for .agree. D for di's.sgr~e e< SO for s:rongly disag~
* 25, The following factors related to everyday life encourage or discourages me to
engage in moderate intensity exercise for 30 minutes at least 5 times a week
SA= Strongly Agree, A= Agree, D = Disagree, SD= Strongly Disagree OA
ZJ. 5:~s.e lnpro..es my 'l\.&!Pllfy.
2.,!. ::Xffd~ tat:es too ~ tin.: rrcm r,;,rn 1 t,;Jatoost1lps ..
27. l 'cail! P'/re loogt!! tr I .erercise:.
25. 1 ttnrl'.t pe·cp!~ n el'.~r::l.~ c>Otlitt; »ot tu.my
( ,, j
0 0 0 0
CD
() 0 () 0 () 0 0 () 0 0 0 0 0 0
~----------------------------------~·---.. ··--··-.. --~~-
153
' ... ·•.· .. ·.·.1•.
:C,.'
·.' .. :1•. ' 1\
1i ',} ,,1,

•• 1'' ,, ;, I
COKTD ..
EXERCLSE BENEFITS.!BARRlERS SCALE Below are- stat~merots. that .relate- -to 1d;,;,as :it-O\.it exercise-. Pl;:.:.se- in:hc..3t~ !hE degree, io which you agre-: er d;:;.3g,e-e vtith th~ st.l.te-n;ents by circling SA for :s:rong]y agr-:e., A for agr*, D for dis-ag-r';!e Cf' SD for s:rongly disagr.H:'
* 26, The following factors related to everyday life encourage or discourages me to
engage in moderate intensity exercise for 30 minutes at least 5 times a week
SA= Strongly Agree, A = Agree, D = Disagree, SD = Strongly Disagree SA A D
2!( !:X~l: ~\:)S IP!?- ae-ctE31* tatlgJe. () n ,J C 3G. Exe-CiSirtg is a gooo way for rr-= to '11;?,:t r,e« P~C::i-!~. ('\
,j () {")
"·-" s1. MJ p1tys;CJ1 i?~ 1S i:rp~c ;nr~Td$1r:g C) 0 0 2'-2. ~~Sh9 l-'nprCv?S cry S$/f<O!l~p:. 0 () 33. My f.it.TJly ~t<tr&cto riol e!J.CO~ M!: to e~&e-
r, \j 0 ()
34. O:erclb"'1g !nct~~s my riert.31 aertru:ss. 0 () 35. exercise a:tows me 10 t.arry om noora1 a:::thnl!es-willl:Ju: MCOO"tng tr&l ('
'-/ n ,j
!ii. '5;:ffC.)51?, '.,'T'f,W.'5 tc'l€ quaitty ct my w«l C' j
-37. Eil:Hcise Uk.a ~00 mud'! tlm: 1r¢m my fainly te~Oftr"J..>~ 0 ,-, '0 0
::.s. Ex\:'i'ci$e ts grod ern~-u1t,;1:~t tor IN!. 0 ('\ ~, 0 39-.. E:a,;rcis;~ rncrea,w:s m)' ~';;ar.~ b'j" olt!m. 0 r,
\_/
4-0. Exercise ~ hara ,t,,Jrt ttsr m.t 0 0 :41, ~ 1mpw,-,eE; overa!! ®ll}' 1! .. mc!rormg mr me. 0 0 42:. Tow: are too1?wpl4tes ror l'l"i9: toe:tefl:$1?. 0 0 -43. El:at$se 1Pl)t1?ieb the W?f my Dcdy loots. 0
,,, \,.) 0
-:SD
0 (1 ,~ ~
\_) (1 '~ 0 0 0 r") '-0 0 0 0 0 0 0
O;lp~t K Si::chr,st, !L Vo'alkff, N.,, ~r. 1965. ~00 Wllhool: auth:lr;r;' ;!xp,"ES6 --.,.rn,;n ~ lS nci: ,peimttec.. PE!ltl'ilS&k:m to use m-sca1e ma, b\; OOUJne-O 1'ron: or. Ka:rrl'l. -Seehl'\st B>?!lln ~>S'!.Assodates, 18 Momtrgst?, lrvtn-e, CA '325C3'-3745; e-malt ~paebati.net
* 27, Here are additional ideas about exercise and physical activity that may apply to you as a graduate student.
Please indicate the degree to which you agree or disagree wilh the statements by
clicking the corresponding bubble.
SA = Strongly Agree, A= Agree, D = Disagree, SD= Strongly Disagree
()
154
A
0 0
0
0 0
00
0 0
·.'.1'· :''
iii I
''I ,, Ii·
·•.11
;I

' " '' * 28, What is your academic area of study that you are currently enrolled in?
1 > 1 ,; {·1 \
* 29. Your current level of study that you are enrolled in.
* 30, What is your age as or your last birth day?
LL--------------------------------
* 31, Your gender
I
II
l,, :!:I
.. , •. ·1 k ,, 1;,
ii
,, iii [!!
,!iii
t iii 'i I,· :i 11:, " 'i'

'' * 32. What is your ethnicity?
* 33. Wh:lt is your current Height?
* 34. What is your current weight in pounds?
For Example: if your current weight is 158 pounds then select 1 from hundredth row, S
from tenth row, and 8 from ones row. 0 I , J • ' ' 7 ' •
Hurdream. RON () 0 0 0 0 0 0 0 0 0 Te"lth Row
,,-,.·, 0' [\ 0 0 '--/ 0 0 0 C) 0 0
Ol'1es·RoW 0 0 0 0 0 0 0 0 0 n ,/ '" _________
156
l
!1''• :'1.··· ,, :,,I !.'i:

t; !
* 35. What is your tnarital status?
* 36. Are you currently living with family?
QYa;
No
l.~---~--·--·-·--~
* 37. What is your current employment status?
Employment includes personal business and part time employment, GTA, GSA, GRA.
E-trplO)'e,j
Q Unern;:-+o·f€0:
* 38, Your current household income?
0 LS1h.ln$10,0CO
0 S 10,t--00-20,0CO
() S ~.&J0-30,000
M«e ttl.31!, $30.1::00
. . . "} .
YOlJ HAVE COMPLETED THE SURVEY
tf you are ooe of the winners of 1'NO 4th Gieneraiion iPod To,cuh. you ~J be- notified via e,m.."lil by May 15, 20t 1 .
i1 j'' I I:; I•'
'

Appendix C Permission to Use Exercise Benefits and Barriers Scale
II BERL!'\" SECHRIST ASSOCIATES
Janu,uy ! L 2011
Bibha Gautam. Rl'\. BSX PhD Candidate College of:'Jursing University of North Dakota Grand Forks. :',ID
De.ar Bibha GatllanL
We receiwd your agreements regarding use of the E.xercise Benefits Barriers Scale (EBBS). You have our permission to use the EBBS in your dissertation research titled. Transiar/011 of Cardiovascular Disease Kno1vledge into E1.)2rcise Behavior: }ilottvationaljGctors ro Exercise Reporred ~- Young Ad11/ts Enrol/e.d in Graduate School. If you need to include a copy of the EBBS in an appendix in your dissertation you have our pennission to do so as long as the copyright statement appears at the bottom of the EBBS_
Sincerely.
Karen Rl Sechrist. PhD. RN for SechrisuW alker/Pender
158
iJ
I' I I iii ,i
I ill1 i'I
"-I ii
1,:_1,_
-1, ii
ll Ii l·i:
II I
ll
,11,,i,,_,_
i'

Appendix D Permission to Use Multidimensional Self-efficacy Scale
Subje-ct RE: Requesting a pe-nntSsi-On to use the "Multidimensional Self-Efficacy for Ex~ise Sc..Jle (MSES)"
To: 'Gav:am_Bibha'' <bibha:[email protected]"
Date'. OU07/1'i 04:03 PM
:=:rom: W.,;ndy Rodgers <w~'1dy.rndgers@ua\betv:.a>
HeEc - thank you for vour note. ! am •,;e.ry pleased th-at you wish to use the MSES ln your resean:::h. You do
not actuaily nee-d my penrission slnce the inst11Jment ts publ1shed in that RO.E) artide, but I Hke kno~ving that
peopiE are intere-sted in it r Best of Jvck with ycur re~earch
\Vendy R-:idgers
159
I
ti 11 !1 I
i

REFERENCES
Adams, S.A., Matthews, C.E., Ebbeling, C.B., Moore, C.G., Cwmingham, J.E., Fulton, J.,
& Hebert, J .R. (2005). The effect of social desirability and social approval on
self-reports of physical activity. American Journal of Epidemiology, 161,899.
Adler, N., & Matthews, K. (1994). Health psychology: Why do some people get sick and
some stay well? Annual Review of Psychology, 45, 229-59.
Ali, N.S., & Twibell, R.K. (1995). Health promotion and osteoporosis prevention among
postmenopausal women. Preventive Medicine, 24, 528-34.
Allen, N.A. (2004). Social cognitive theory in diabetes exercise research: An integrative
literature review. Diabetes Education, 30, 805-19.
Almas, A., Hameed, A., & Sultan, F.A. (2008). Knowledge of coronary artery disease
(CAD) risk factors and coronary intervention among university students. Journal
of Pakistan Medical Association, 58, 553-7.
American College Health Association. (2010). American College Health Association
National College Health Assessment II: Reference Group Data Report Fall 2009.
Baltimore: American College Health Association; 2010.
American College of Sports Medicine. (2006). ACSM's Guidelines for Exercise Testing
and Prescription (7th ed.). Baltimore, MD: Lippincott Williams & Wilkins, pp.
22, 27, 39-61.
160

American Heart Association, American College of Sports Medicine. (2007). Exercise and
acute cardiovascular events: Placing the risks into perspective. Medicine in
Science in Sports and Exercise, 39, 886-897.
American Heart Association. (2004). Heart Disease and Stroke Statistics--2004 Update.
Texas: American Heart Association.
American Heart Association. (2010). Heart disease and stroke statistics - 2010 update.
Dallas, Texas: American Heart Association; 2010.
American Heart Association. (2010). Risk Factors and Coronary Heart Disease.
Retrieved April 10, 2010, from
http://www.americanheart.org/presenter.jhtml?identifier=4726
Anderson, E.S., Wojcik, J.R., Winett, R.A. & Williams, D.M. (2006). Social-cognitive
determinants of physical activity: The influence of social support, self-efficacy,
outcome expectations, and self-regulation among participants in a church based
health promotion study. Health Psychology, 25, 510-520.
Appel, L.J., Brands, M.W., Daniels, S.R., Karanja, N., Elmer, P.J, & Sacks, F.M. (2006).
Dietary approaches to prevent and treat hypertension: A scientific statement from
the American Heart Association. Hypertension, 47, 296-308.
Appel, S.J., Harrell, J.S., & Deng, S. (2002). Racial and socioeconomic differences in
risk factors for cardiovascular disease among Southern rural women. Nursing
Research, 51, 140-147.
Ayas, N.T., White, D.P., Manson, J.E., Stampfer, M.J., Speizer, F.E., Malhotra, A., &
Hu, F.B. (2003). A prospective study of sleep duration and coronary heart disease
in women. Archives of Internal Medicine, 163, 205-9.
161
' I
! I
"
I :1
'

Bandura, A. (1977). Self-efficacy: Toward a unifying theory of behavioral change.
Psychological Review, 84, 191-215.
Bandura, A. (1997). Self-efficacy: The Exercise of Control. New Yorkm NY: W.H.
Freeman and Company.
Bandura, A. (1999). A social cognitive theory of personality. In L. Pervin & John, 0. P.
(Ed.), Handbook of personality: Theory and research (2nd ed.). New York:
Guilford Publications.
Bandura, A. (2001 ). Social cognitive theory: An agentic perspective. Annual Review of
Psychology, 52, 1-26.
Barna, G. (2000). Understanding graduate students: Their values, beliefs, and
motivations. Electronic document Retrieved on April 18, 2010 from
http://www.gradresources.org/articles/student profile.shtml
Berg, CJ., An, L.C., Thomas, J.L., Lust, K.A., Sanem, J.R., Swan, D.W., & Ahluwalia,
J.S. (2011). Smoking patterns, attitudes and motives: Unique characteristics
among 2-year versus 4-year college students. Health Education Research, in
press. Epub ahead of print.
Blair, S.N. (2009). Physical inactivity: The biggest public health problem of the 21st
century. British Journal of Sports Medicine, 43, 1-2.
Booth, M.L., Bauman, A., Owen, N., & Gore, CJ. (1997). Physical activity preferences,
preferred sources of assistance, and perceived barriers to increased activity among
physically inactive Australians. Preventive Medicine, 26, 131-7.
doi: I 0.1006/pmed.1996.9982
162
l

Brown, S.A., Huber, D., & Bergman, A. (2006). A perceived Benefits and Barriers Scale
for strenuous physical activity in college students. American Journal of Health
Promotion, 21, 137-40.
Buckworth, J., & Dishman, R.K. (1999). Determinants of physical activity; research to
application. In: Lifestyle medicine. Eds: Rippe, J. and Malden, M.A. Williston
Blackwell Science.
Bunker, S.J., Colquhoun, D.M., Esler, M.D., Hickie, l.B., Hunt, D., & Jelinek, V.M., ...
Tonkin, A.M. (2003). Stress and coronary heart disease: Psychosocial risk factors.
The Medical Journal of Australia, 178, 272-6.
Burke, J.D., Reilly, R.A., Morrell, J.S., & Lofgren, I.E. (2009). The University ofNew
Hampshire's young adult health risk screening initiative. Journal of American
Dietetic Association, 109, 1751-8.
Bums, N., & Grove, S. K. (2005). The practice of nursing research: Conduct, critique,
and utilization (5th ed.). St. Louis, MO: Elsevier.
Calicchia, J.A., & Graham, L.B. (2006). Assessing the relationship between spirituality,
life stressors, and social resources: Buffers of stress in graduate students. North
American Journal of Psychology, 8, 307-320.
Campbell, P.G., MacAuley, D., McCrum, E. & Evans, A. (2001). Age differences in the
motivating factors for exercise. Journal of Sport and Exercise Psychology, 23,
191-199.
Carper B.A. (1978). Fundamental patterns of knowing in nursing. Advances in Nursing
Science, 1, 13-23.
Caspersen, C.J., Powell, K.E., & Christenson, G.M. (1985). Physical activity, exercise,
and physical fitness: Definitions and distinctions for health-related research.
Public Health Reports, 100, 126-31.
Centers for Disease Control and Prevention. (2010). State-Specific Trends in Fruit and
Vegetable Consumption Among Adults - United States, 2000-2009. Morbidity
and Mortality Weekly Review, 59, 1125-62.
Centers for Disease Control and Prevention. (20 I 0). Vital Signs: Current cigarette
smoking among adults aged 2:18 years---United States, 2009. Morbidity and
Mortality Weekly Review, 59, 1135-40.
Centers for Disease Control and Prevention. (2005). Racial/ethnic and socioeconomic
disparities in multiple risk factors for heart disease and stroke: United States,
2003. Morbidity and Mortality Weekly Report, 54, 113-7.
Central Michigan University (2008). College student sleep patterns could be detrimental.
Science Daily. Retrieved June 8, 2011, from http://www.sciencedaily.com-
/releases/2008/05/080512145 824 .htm
Chiu, L.K. (2009). University students' attitude, self-efficacy and motivation regarding
leisure time physical participation. Journal Pendidik dan Pendelikon, 24, 1-15.
Chou, S.Y., Grossman, M., & Saffer, H. (2004). An economic analysis of adult obesity:
Results from the Behavioral Risk Factor Surveillance System. Journal of Health
Economics, 23, 565-87.
Collins, K.M., Dantico, M., Shearer, N.B., & Mossman, K.L. (2004). Heart disease
awareness among college students . .Journal a/Community Health, 29, 405-20
164

Craig, C.L., Marshall, A.L., Sjostrom, M., Bauman, A.E., Booth, M.L., Ainsworth,
B.E., ... Oja, P. (2003). International physical activity questionnaire: 12-country
reliability and validity. Medicine and Science in Sports and Exercise,35, 1381-95.
Critchley, J.A. & Una!, B. (2004). Is smokeless tobacco a risk factor for coronary heart
disease? A systematic review of epidemiological studies. European Journal of
Cardiovascular Prevention and Rehabilitation; 11(2):101-12.
D' Alonzo, K. T., Stevenson, J. S., & Davis, S. E. (2004). Outcomes of a program to
enhance exercise self-efficacy and improve fitness in Black and Hispanic college
age women. Research in Nursing and Health, 27, 357-369.
Daskapan, A., Tuzun, E.H., & Eker, L. (2006). Perceived barriers to physical activity in
university students. Journal of Sports Science and Medicine, 55, 615-620.
Dauchet, L., Arnouyel, P., Hercberg, S., & Dallongeville, J. (2006). Fruit and vegetable
consumption and risk of coronary heart disease: A meta-analysis of cohort
studies. Journal of Nutrition; 136, 2588-93.
Debate, R.D., Topping, M., & Sargent, R.G. (2001). Racial and gender differences in
weight status and dietary practices among college students. Adolescence, 3 6, 819-
33.
Deci, E.L. & Ryan, R.M. (1991 ). Intrinsic motivation and self-determination in human
behavior. In Steers, R.M. & Porter, L.W. (Eds.) Motivation and Work Behavior,
5th Edition. New York: McGraw-Hill, Inc., pp. 44-58.
DiNardo, S. (2005). Intrinisic vs. extrinsic motivation and exercise adherence. Vertex
fitness Newsletter. Retrieved August 1, 2009, from
http://www. vertexfit. corn/ arti cl es/Intrin vsExtrin Moti v. pdf
165
Dodd, L.J., Al-Nakeeb, Y., Nevill, A., & Forshaw, M.J. (2010). Lifestyle risk factors of
students: A cluster analytical approach. Preventive Medicine, 51, 73-7.
Dorn, S.M., & Papalewis, R. (1997). Improving Doctoral StudentRretention. Paper
presented at the Annual Meeting of the American Educational Research
Association. (ERIC No. 406894).
Douglas, K.A., Collins, J.L., Warren, C., Kann, L., Gold, R., Clayton, S., .... (1997).
Results from the 1995 National College Health Risk Behavior Survey. Journal of
American College Health, 46, 55-66.
Drewnowski, A., & Levine, A.S. (2003). Sugar and fat--from genes to culture. Journal of
Nutrition, 133, 829S-830S.
Egli, T., Bland, H.W., Melton, B.F., & Czech, D.R. (2011). Influence of age, sex, and
race on college students' exercise motivation of physical activity. Journal of
American College Health, 59, 399-406.
Engler, M.M., Engler, M.B., Davidson, D.M., Slaughter, R.E. (1992). Cardiovascular
disease prevention: Knowledge and attitudes of graduate nursing students.
Journal of Advanced Nursing, 17, 1220-5.
Evans, A., VanBaal, G.C., McCarron, P., DeLange, M., Soerensen, T.I., De Geus,
E.J., .... Boomsma, D.I. (2003). The genetics of coronary heart disease: The
contribution of twin studies; Twin Research, 6, 432-441.
Fagard, R.H. (2001 ). Exercise characteristics and the blood pressure response to dynamic
physical training. Medicine and Science in Sports and Exercise, 33 (6 Suppl),
S484-S492.
166
11
II I

Flegal, K.M., Carroll, M.D., Ogden, C.L., & Curtin, L.R. (2010). Prevalence and trends
in obesity among US adults, 1999-2008. Journal of American Medical
Association, 303, 235-41.
Fleury, J. (1996). Wellness motivation theory: An exploration of theoretical relevance.
Nursing Research, 45, 277-283.
Flier, J.S., & Elmquist, J.K. (2004). A good night's sleep: Future antidote to the obesity
epidemic? Annals of Internal Medicine, 141, 885-6.
Ford, E.S., Giles, W.H., & Mokdad, A.H. (2005). Family history of diabetes or
cardiovascular disease and C-reactive protein concentration: findings from the
National Health and Nutrition Examination Survey, 1999-2000. American Journal
of Preventive Medicine; 29, 57-62.
Forquer, L.M., Camden, A.E., Gabriau, K.M., & Johnson, C.M. (2008). Sleep patterns of
college students at a public university. Journal of American College Health, 56,
563-5.
Frazier, P.A., & Schauben, L. (1994). Causal attributions and recovery from rape and
other stressful life events. Journal of Social and Clinical Psychology, 13, 1-14.
Frederick, C. M., & Ryan, R. M. (1995). Self-determination in sport: A review using
cognitive evaluation theory. International Journal of Sport Psychology, 26, 5-23.
French, J. R., & Caplan, R. D. (1972). Occupational Stress and Individual Strain. In:
Marrow, A. J. (Ed.). The failure of success, organizational stress and individual
strain. In New York: Amacom.
Freud, S. (1962). The ego and the id. New York: Norton.
167

Frost, R. (1992).Cardiovascular risk modification in the college student: Knowledge,
attitudes, and behaviors. Journal General Internal Medicine, 7, 317-320.
Garcia, A. W., & King, A.C. (1991 ). Predicting long-term adherence to aerobic exercise:
A comparison of two models. Journal of Sport and Exercise Psychology, 13, 394-
410.
Greaney, M.L., Less, F.D., White, A.A., Dayton, S.F., Riebe, D., & Blissmer,
B., .... Greene, G.W. (2009). College students' barriers and enablers for healthful
weight management: a qualitative study. Journal Nutrition Education and
Behavior, 41, 281-6.
Greenlee, P., Castle, C.H., & Woolley, F.R. (1992). Successful modification of medical
students' cardiovascular risk factors. American Journal of Preventive Medicine, 8,
43-52.
Grubbs, L., & Carter J. (2002). The relationship of perceived benefits and barriers to
reported exercise behaviors in college undergraduates. Family Community Health,
25, 76-84.
Haase, A., Steptoe, A., Sallis, J.F., & Wardle, J. (2004). Leisure-time physical activity in
university students from 23 countries: Associations with health beliefs, risk
awareness, and national economic development. Preventive medicine, 39, 182-90.
Hahn, E.J., Rayens, M.K., Ridner, S.L., Butler, K.M., Zhang, M., & Staten, R.R. (2010).
Smoke-free laws and smoking and drinking among college students. Journal of
Community Health, 35, 503-11.
168

Hajjar, I., & Kotchen, T.A. (2003). Trends in prevalence, awareness, treatment, and
control of hypertension in the United States, 1988-2000. Journal of American
Medical Association, 290, 199-206.
Hamer, M., Molloy, G.J., & Stamatakis, E. (2008). Psychological distress as a risk factor
for cardiovascular events: Pathophysiological and behavioral mechanisms.
Journal of American College of Cardiology, 52, 2156-62.
He, F.J., Nowson, C.A., & MacGregor, G.A. (2006). Fruit and vegetable consumption
and stroke: Meta-analysis of cohort studies. Lancet, 367, 320-6.
Hedley, A.A., Ogden, C.L., Johnson, C.L., Carroll, M.D., Curtin, L.R., & Flegal, K.M.
(2004). Prevalence of overweight and obesity among US children, adolescents,
and adults, 1999-2002. Journal of American Medical Association, 291, 2847-50.
Homko, C.J., Santamore, W.P., Zamora, L., Shirk, G., Gaughan, J., Cross, R., .... Bove,
A.A. (2008). Cardiovascular disease knowledge and risk perception among
underserved individuals at increased risk of cardiovascular disease. Journal of
Cardiovascular Nursing, 2 3, 3 3 2-7.
Hoppmann, C.A., & Klumb, P .L. (2006). Daily goal pursuits predict cortisol secretion
and mood states in employed parents with preschool children. Psychosomatic
Medicine, 68, 887-94.
Hull, C. (1951). Essentials of Behavior. Yale University Press, New Haven.
Hull, C.L. (1943). Principles of Behavior. New York: Appleton-Century-Crofts.
Hyun, J., Quinn, B., Madon, T., & Lustig, S. (2007). Mental health need, awareness, and
use of counseling services among international graduate students. Journal of
American College Health, 56, 109-18.
169

Irwin, J.D. (2004). Prevalence of university students' sufficient physical activity: A
systematic review. Perceptual and Motor Skills, 98, 927~943.
Irwin, J.D. (2007). The prevalence of physical activity maintenance in a sample of
university students: A longitudinal study. Journal of American College Health,
56, 37-41.
Jacobs, N., Myin-Germeys, I., Derom, C., Delespaul, P., van Os, J., & Nicolson, N.A.
(2007). A momentary assessment study of the relationship between affective and
adrenocortical stress responses in daily life. Biological Psychology, 74, 60-6.
Jafary, F.H., Aslam, F., Mahmud, H., Waheed, A., Shakir, M., Afzal, A., .... Haque, 1.U.
(2005). Cardiovascular health knowledge and behavior in patient attendants at
four tertiary care hospitals in Pakistan--a cause for concern. BMC Public Health,
25, 5-124.
Johnson, B., Batia, A.S., & Haun, J. (2008). Perceived stress among graduate students:
Roles, responsibilities, & social support. Virginia Association for Health,
Physical Education and Dance Journal. Retrieved on May 4, 20 IO from
http://findarticles.com/p/articles/mi 7093/is 3 29/ai n28539315/
Johnston-Brooks, C.H., Lewis, M.A., Garg, S. (2002). Self-efficacy impacts self-care and
HbAlc in young adults with Type I diabetes. Psychosomatic Medicine, 64, 43-51.
Kazdin, A. (2003). Research design in clinical psychology (4th ed.). Boston: Allyn &
Bacon.
Keating, X.D., Guan, J., Pinero, J.C., & Bridges, D.M. (2005). A Meta-Analysis of
college students' physical activity behaviors. Journal of American College
Health, 54, 116-25.
170

Keller, C. (1993). Developing and sustaining valued health behaviors in young African
American women health values. Journal of Nursing Measurement, 17. 49-56.
Khan, M.S., Jafary, F.H., Jafar, T.H., Faruqui, A.M., Rasool, S.I., Hatcher, J., &
Chaturvedi, N. (2006). Knowledge of modifiable risk factors of heart disease
among patients with acute myocardial infarction in Karachi, Pakistan: a cross
sectional study. BMC Cardiovascular Disorders, 6, 18. doi:1 O. l l 86/1471-2261-6-
18.
Knapp, T.R. & Campbell-Heider, N. (1989). Numbers of observations and variables in
multivariate analyses. Western Journal of Nursing Research, 11, 634-41.
Lapier, T.K., Cleary, K., & Kidd, J. (2009). Exercise self-efficacy, habitual physical
activity, and fear of falling in patients with coronary heart disease.
Cardiopulmonary Physical Therapy Journal, 20, 5-11.
Lazarus, R.S. (1966). Psychological Stress and the Coping Process. New York:
McGraw-Hill.
Le, C., Chongsuvivatwong, V., & Geater, A. (2007). Contextual socioeconomic
determinants of cardiovascular risk factors in rural south-west China: A multilevel
analysis. BMC Public Health, 5, 7-72.
Lee, L.L., Arthur, A., & Avis, M. (2008). Using self-efficacy theory to develop
interventions that help older people overcome psychological barriers to physical
activity: A discussion paper. international Journal of Nursing Studies, 45, 1690-9.
Leitzmann, M.F., Park, Y., Blair, A., Ballard-Barbash, R., Mouw, T., & Hollenbeck,
A.R., & Schatzkin, A. (2007). Physical activity recommendations and decreased
risk of mortality. Archives of internal Medicine, 167, 2453-60.
171
I
',
I!
! ,:!
I''
'.1,.I·.·
:,
1: I I

Lenfant, C. (2001 ). Cardiovascular research: A look into tomorrow. Circulation
Research, 88, 253-5.
Leslie, E., Owen, N., & Sallis, J. (1999). Inactive Australian college students preferred
activities, sources of assistance, and motivators. American Journal of Health
Promotion, 13, 197-199.
Liu, Y. & Tanaka, H. (2002). Overtime work, insufficient sleep, and risk of non-fatal
acute myocardial infarction in Japanese men. Journal of Occupational and
Environmental Medicine, 59, 447-51.
Lloyd-Jones, D., Hong, Y., Labarthe, D., Mozaffarian, D., Appel, L.J., & Hom, L.V.,
.... Rosamond, W.D. (2010). Defining and setting national goals for
cardiovascular health promotion and disease reduction: The American Heart
Association's strategic Impact goal through 2020 and beyond. Circulation, 121,
586-613.
Lovell, G.P., El Ansari, W., & Parker, J.K. (2010). Perceived exercise benefits and
barriers of non-exercising female university students in the United Kingdom.
International Journal of Environmental Research and Public Health, 7, 784-98.
Lovitts, B.E. (2001). Leaving the Ivory Tower: The Causes and Consequences of
Departure from Doctoral Study. Lanham, UK: Rowman & Littlefield Publishers,
Inc.
Low, C.A., Salomon, K., & Matthews, K.A. (2009). Chronic life stress, cardiovascular
reactivity, and subclinical cardiovascular disease in adolescents. Psychosomatic
Medicine, 71, 927-31.
172
.I

Lowry, R., Galuska, D.A., Fulton, J.E., Wechsler, H., Kann, L., & Collins, J.L. (2000).
Physical activity, food choice, and weight management goals and practices among
US college students. American Journal of Preventive Medicine, 18, 18-26.
Lund, H.G., Reider, B.D., Whiting, A.B., & Prichard, J.R. (2010). Sleep patterns and
predictors of disturbed sleep in a large population of college students. Journal of
Adolescent Health, 46, 124-32.
Mackay, J., & Mensah, G. (2004). The Atlas of Heart Disease and Stroke. Geneva: World
Health Organization.
Makrides, L., Veinot, P., Richard, J., McKee, E., & Gallivan, T. (1998). A cardiovascular
health needs assessment of university students living in residence. Canadian
Journal of Public Health, 89, 171-5.
Marcus, B.H., Lewis, B.A., Hogan, J., King, T.K., Albrecht, A.E., Bock, B., .... Abrams,
D.B. (2005). The efficacy of moderate-intensity exercise as an aid for smoking
cessation in women: a randomized controlled trial. Nicotine and Tobacco
Research, 7, 871-80.
Marquez, D., & McAuley, E. (2006). Social cognitive of leisure time physical activity
among Latinos. Journal of Behavioral Medicine, 29, 281-289.
Mazloomi, S.S., Hassan, M.M., & Ehrampoosh, M.H. (2005). Viewpoints, knowledge
and practice in exercise: A survey in the university students. Pakistani Journal of
Biological Science, 8, 918-920.
McArthur, L.H., & Raedeke, T.D. (2009). Race and sex differences in college student
physical activity correlates. American Journal of Health Behavior, 33, 80-90.
173

McAuley, E. (1992). The role of efficacy cognitions in the prediction of exercise
behavior in middle-aged adults. Journal of Behavioral Medicine, 15, 65-88.
McAuley, E., Morris, K.S., Motl, R.W., Hu, L., Konopack, J.F., & Elavsky, S. (2007).
Long-term follow-up of physical activity behavior in older adults. Health
Psychology, 26, 375-80.
McEwen, M. & Wills, E.M. (2010). Theoretical Basis for Nursing. Philadelphia, PA:
Lippincott Williams & Wilkins.
McFall, M., Nonneman, R., Rogers, L.Q., & Mukerji, V. (2009). Health care student
attitudes toward the prevention of cardiovascular disease. Nursing Education
Perspectives, 30, 285-9.
McKinzie, C., Altamura, V., Burgoon, E., & Bishop, C. (2006). Exploring the effect of
stress on mood, self-esteem, and daily habits with psychology graduate students.
Psychological reports, 88, 759-67.
Merriam-Webster's Collegiate Dictionary (11th ed.). (2003). Springfield, MA: Merriam
Webster.
Mertler, C. A. & Vannatta, R. A. (2010). Advanced and multivariate statistical methods:
Practical application and interpretation (4th ed.). Los Angeles: Pyrczak.
Milani, R.V. & Lavie, C.J. (2009). Reducing psychosocial stress: A novel mechanism of
improving survival from exercise training. American Journal of Medicine; 122,
931-8.
Mokdad, A.H., Marks, J.S., Stroup, D.F., & Gerberding, J.L. (2004). Actual causes of
death in the United States, 2000. Journal of American Medical Association; 291,
1238-45.
174

Munro, B.H. (2004). Statistical methods for health care research (5th ed.). Philadelphia:
Lippincott.
Myers, J. (2003). Exercise and Cardiovascular Health. Circulation, 107, e2-e5. DOI:
I0.1161/01.CIR.0000048890.59383.8D.
National Center for Health Statistics. (2007). Health, United States, 2007: With chart
book on trends in the health of Americans. Hyattsville (MD): National Center for
Health Statistics (US); Report No.: 2007-1232.
National Heart Lung and Blood Institute. (2006). Heart and vascular diseases. Retrieved
April 22, 2010, from http://www.nhlbi.nih.gov/health/public/heart/index.htm
Nelson, N.G., Dell'Oliver, C., Koch, C., & Buckler, R. (2001). Stress, coping, and
success among graduate students in clinical psychology. Psychological Reports,
88, 759-767.
Newlin, K., Knafl, K., & Melkus, G.D. (2002). African-American spirituality: A concept
analysis. Advances in Nursing Sciences, 25, 57-70.
Nies, M.A., Vollman, M., & Cook ,T. (1999). African American women's experiences
with physical activity in their daily lives. Public Health Nursing, 16, 23-31.
Nunnally, J.C., & Bernstein, I.H. (1994). Psychometric theory (3'd ed.). New York:
McGraw-Hill.
O'Donovan, G., Blazevich, A.J., Boreham, C., Cooper, A.R., Crank, H., Ekelund,
U., .... Stamatakis, E. (2010). The ABC of physical activity for health: A
consensus statement from the British Association of Sport and Exercise Sciences.
Journal a/Sports Sciences, 28, 573-91.
175

Ogden, C.L., Carroll, M.D., Curtin, L.R., McDowell, M.A., Tabak, CJ., Flegal, K.M.
(2006). Prevalence of overweight and obesity in the United States, i'999-2004.
Journal of American Medical Association, 295, 1549-55.
Pagel, J.F., & Kwiatkowski, C.F. (2010). Sleep complaints affecting school performance
at different educational levels. Frontiers in Neurology, 16, 1-125.
Pallos, H., Yamada, N., Doi, Y., & Okawa, M. (2004). Sleep habits, prevalence and
burden of sleep disturbances among Japanese graduate students. Sleep and
Biological Rhythms, 2, 37--42.
Patel, S.R., Malhotra, A., White, D.P., Gottlieb, D.J., & Hu, F.B. (2006). Association
between reduced sleep and weight gain in women. American Journal of
Epidemiology, 164, 947-54.
Pauly, R., Cunningham, M. & Toth, P. (2000). Doctoral Student Attrition and Retention:
A Study ofNon-Traditional ED.D. Program. Journal of College Student
Retention: Research, Theory and Practice, 1, 225- 238.
Pender, N. J. (1996). Health promotion in nursing practice (3rd ed.). Stamford, CT:
Appleton & Lange.
Pender, N.J., Murdaugh, C.L., & Parsons, M.A. (2005). Health promotion in nursing
practice (5th ed.). Upper Saddle River, NJ: Prentice Hall.
Penedo, F.J. & Dahn, J.R. (2005). Exercise and well-being: A review of mental and
physical health benefits associated with physical activity. Current Opinion in
Psychiatry, 18, 189-93.
Pfeifer, T.A., Kranz, P.L., & Scoggin, A.E. (2008).Perceived stress in occupational
therapy students. Occupational Therapy International, 15, 221-31.
176

Phillips, D.I., Barker, D.J., Fall, C.H., Seek!, J.R., Whorwood, C.B., & Wood, P.J., &
Walker, B.R. (1998). Elevated plasma cortisol concentrations: A link between low
birth weight and the insulin resistance syndrome? Journal of Clinical
Endocrinology and Metabolism, 83, 757-60.
Plowden, K.O., & Miller, J.L. (2000). Motivators of health seeking behavior in urban
African-American men: An exploration of triggers and barriers. Journal of
National Black Nurses Association, 11, 15-20.
Polit, D. F., & Beck, C. T. (2008). Nursing research: Generating and assessing evidence
for nursing practice, (8th ed.). New York: J.B. Lippincott.
Puetz, T.W., O'Connor, P.J., & Dishman, R.K. (2006). Effects of chronic exercise on
feelings of energy and fatigue: A quantitative synthesis. Psychological Bulletin,
132, 866-879.
Rabinowitz, S., Melamed, S., Weisberg, E., Tai, D., & Ribak, J. (1992). Personal
determinants ofleisure-time exercise activities. Perceptual and motor skills, 75,
779-84.
Raison, C.L., & Miller, A.H. (2003). When not enough is too much: The role of
insufficient glucocorticoid signaling in the pathophysiology of stress-related
disorders. American Journal of Psychiatry, 160, 1554-65.
Ramirez-Marrero, F.A., Rivera-Brown, A.M., Nazario, C.M., Rodriguez-Orengo, J.F.,
Smit, E., & Smith, B.A. (2008). Self-reported physical activity in Hispanic adults
living with HIV: Comparison with accelerometer and pedometer. Journal of the
Association of Nurses in AIDS Care, 19, 283-94.
177

Reed, J.A., & Phillips, D.A. (2005). Relationships between physical activity and the
proximity of exercise facilities and home exercise equipment used by
undergraduate university students. Journal of American College Health, 53, 285-
90.
Resnick, B., & Spellbring, A.M. (2000). Understanding what motivates older adults to
exercise. Journal of Gerontological Nursing, 26, 34-42.
Rhodes, R.E., & de Bruijn, G.J. (2010). Automatic and motivational correlates of
physical activity: Does intensity moderate the relationship? Behavioral Medicine,
36, 44-52.
Rhodes, R.E., Plotnikoff, R.C., & Courneya, K.S. (2008). Predicting the physical activity
intention-behavior profiles of adopters and maintainers using three social
cognition models. Annals of Behavioral Medicine, 36, 244-52.
Robertson, D., & Keller, C. (1992). Relationships among health beliefs, self-efficacy, and
exercise adherence in patients with coronary artery disease. Heart Lung, 21, 56-
63.
Rodgers, W.M., Wilson, P.M., Hall, C.R., Fraser, S.N., & Murray, T.C. (2008). Evidence
for a multidimensional self-efficacy for exercise scale. Research Quarterly for
Exercise and Sports, 79, 222-34.
Rosamond, W., Flegal, K., Friday, G., Furie, K., Go, A., Greenlund, K., .... Hong, Y.
(2007). Heart disease and stroke statistics- 2007 update: A report from the
American Heart Association Statistics Committee and Stroke Statistics
Subcommittee. Circulation, 115, e69-e171.
178

Rozanski, A., & Kubzansky, L.D. (2005). Psychologic functioning and physical health: A
paradigm of flexibility. Psychosomatic Medicine, 67 (Suppl 1), S47-53.
Ryan, R. M., Frederick, C. M., Lepes, D., Rubio, N., & Sheldon, K. M. (1997). Intrinsic
motivation and exercise adherence. International Journal of Sport Psychology,
28, 335-354.
Sabourin, S., & Irwin, J. (2008). Prevalence of sufficient physical activity among parents
attending a university. Journal of American College Health, 56, 680-5.
Sallis, J.F, Hovell, M.F., Hofstetter, C.R., Elder, J.P., Hackley, M., & Caspersen, C.J., &
Powell, K.E. (1990). Distance between homes and exercise facilities related to
frequency of exercise among San Diego residents. Public Health Reports, 2, 179-
185.
Sallis, J.F., Grossman, R.M., Pinski, R.B., Patterson, T.L., & Nader, P.R. (1987). The
development of scales to measure social support for diet and exercise behaviors.
Preventive Medicine, I 6, 825-36.
Sallis, J.F., Haskell, W.L., Fortmann, S.P., Vranizan, K.M., Taylor, C.B., & Solomon,
D.S. (1986). Predictors of adoption and maintenance of physical activity in a
community sample. Preventive Medicine; 15, 331-41.
Salmon, J., Owen, N., Crawford, D., Bauman, A., & Sallis, J.F. (2003). Physical activity
and sedentary behavior: a population-based study of barriers, enjoyment, and
preference. Health Psychology, 22, 178-88.
Schwarzer, R., & Renner, B. (2000). Social-cognitive predictors of health behavior:
Action self-efficacy and coping self-efficacy. Health Psychology, 19, 487-95.
179
I
'I

Sechrist, K.R., Walker, S.N. & Pender, NJ. (1987). Development and Psychometric
Evaluation of the Exercise Benefits Barriers Scale. Research in Nursing and
Health, 10, 357-365.
Shephard, R. J. (2003). Limits to the measurement of habitual physical activity by
questionnaires. British Journal of Sports Medicine, 37, 197-206.
Sigafus, B. (1998). The creation of ABDs: A turning point in educational doctoral
programs? Paper presented at the Annual Meeting of the American Educational
Research Association. (ERIC No. 424650).
Silber, E., Robert L., Backus, V. Eddy, H.P., Liptzin, M.B., Notman, M.T., .... Wenger,
R.E. (1999). Helping students adapt to graduate school: Making the grade.
Journal of College Student Psychotherapy, 14, 1-110.
Skinner, E. A. (1995). Perceived control, motivation, and coping. Thousand Oaks, CA:
Sage Publications.
Snyder, T., Dillow, S., and Hoffman, C. (2009). Digest of Education Statistics 2008.
Washington, DC: National Center for Education Statistics, Institute of Education
Sciences, U.S. Department of Education.
Sparling, P.B., Giuffrida, A., Piomelli, D., Rosskopf, L., & Dietrich, A. (2003). Exercise
activates the endocannabinoid system. Neuroreport, 14, 2209-11.
Spencer, L. (2002). Results of a heart disease risk-factor screening among traditional
college students. Journal of American College Health, 50, 291-296.
Spiegel, A.M., & Alving, B.M. (2005). Executive summary of the Strategic Plan for
National Institutes of Health Obesity Research. American Journal of Clinical
Nutrition, 82 (I Suppl), l lS-214S.
180

Spiegel, K., Tasali, E., Penev, P., & Van Canter, E. (2004). Brief communication: Sleep
curtailment in healthy young men is associated with decreased leptin levels,
elevated ghrelin levels, and increased hunger and appetite. Annals of Internal
Medicine, 141, 846-50
Stecker, T. (2004). Well-being in an academic envirornnent. Medical Education, 38, 465-
78.
Stratton, J.S., Mielke, A., Kirshenbaurn, S., Goodrich, A., & McRae, C. (2006). Finding a
balanced life: Factors that contribute to life satisfaction in graduate students.
Journal of College and Character, 7, 1-10.
Sullurn, J., Clark, M.M., & King, T.K. (2000). Predictors of exercise relapse in a college
population. Journal of American College Health, 48, 175-80.
Tabachnick, B. G., & Fidell, L. S. (2007). Using Multivariate Statistics (5th ed.). Boston:
Allyn and Bacon.
Tanasescu, M., Leitzrnann, M.F., Rimm, E.B., Willett, W.C., Starnpfer, M.J., & Hu, F.B.
(2002). Exercise type and intensity in relation to coronary heart disease in men.
Journal of American Medical Association, 288, 1994-2000.
Thorn, T., Haase, N., Rosamond, W., Howard, V.J., Rurnsfeld, J, Manolio, T., .... Wolf, P.
(2006). American Heart Association Statistics Committee and Stroke Statistics
Subcommittee. Heart disease and stroke statistics--2006 update: A report from the
American Heart Association Statistics Committee and Stroke Statistics
Subcommittee. Circulation, 113, e85- l 5 l.
1 81

Toews, J.A., Lockyer, J.M., Dobson, D.J., Simpson, E., Brownell, A.K., & Brenneis,
F., .... Cohen, G.S. (1997). Analysis of stress levels among medical students,
residents, and graduate students at four Canadian schools of medicine. Academic
Medicine, 72, 997-1002.
Trochim, W., & Donnelly, J.P. (2006). The Research Methods Knowledge Base (3d ed.).
Atomic Dog Publishing, Cincinnati, OH.
Trost, S.G., Owen, N., Bauman, A.E, Sallis, J.F., & Brown, W. (2002). Correlates of
adults' participation in physical activity: Review and update. Medicine and
Sciences in Sports and Exercise, 34, 1996-2001
United States Department of Health and Human Services. (2008). 2008 Physical Activity
Guidelines for Americans. Washington, DC. ODPHP Publication #U0036 2008:1-
76.
University of New Hampshire. (2007). College students face obesity, high blood
pressure, metabolic syndrome. Science Daily. Retrieved May 3, 2010, from
http://www.sciencedaily.com/releases/2007 /06/07061411331 O.htm
Vale A. (2000). Heart disease and young adults: is prevention important? Journal of
Community Health Nursing, 17, 225-33.
Van Der Horst, K., Paw, M.J., Twisk, J.W., & Van Mechelen, W. (2007). A brief review
on correlates of physical activity and sedentariness in youth. Medicine and
Science in Sports and Exercise, 39, 1241-50.
182

Van Dongen, H.P., Maislin, G., Mullington, J.M., & Dinges, D.F. (2003). The cumulative
cost of additional wakefulness: Dose response effects on neurobehavioral
functions and sleep physiology from chronic sleep restriction and total sleep
deprivation. Sleep, 26, 117-26.
Warburton, D.E., Nicol, C.W., & Bredin, S.S. (2006). Health benefits of physical
activity: The evidence. Canadian Medical Association Journal, 174, 801-9.
White, R.W. (1959). Motivation reconsidered: The concept of competence. Psychological
Review, 66, 297-333.
World Health Organization. (2007). Prevention of Cardiovascular Disease: Guidelines for
assessment and management of cardiovascular risk. Geneva, 2007. Retrieved Sep
12, 2010 from
http://www.who.int/cardiovascular diseases/guidelines/PocketGL.ENGLISH.AF
R-D-E.revl .pdf
World Health Organization. (2010). The Atlas of Heart Disease and Stroke. Retrieved
April, 28, 2010 from
http://www.who.int/cardiovascular diseases/resources/atlas/en/print.html
Yusuf, S., Hawken, S., Ounpuu, S., Dans, T., Avezum, A., Lanas, F., .... Lisheng, L.
(2004). Effect of potentially modifiable risk factors associated with myocardial
infarction in 52 countries (the INTERHEART study): Case-control study. Lancet;
364, 937-52.
183