Factors influencing Highway Retailer Satisfaction in FMCG ...
20
Factors influencing Highway Retailer Satisfaction in FMCG industry Dr. Kunal Gaurav Area Chair – Research & Consultancy Siva Sivani Institute of Management, Secunderabad, India Kommuru Venkatnaga Raju Student of PGDM (2018-20) ICBM - School of Business Excellence, Hyderabad, India Abstract FMCG retailers are growing in India, the retailers these days having a great awareness of products and services offered by each of the FMCG company in India. The retailer satisfaction is a key to success for every company as in the current scenario retailers not only meant for distributing the goods provided by the company to customers but also the value and the relationship, they maintain with the customers will reflect on the company’s overall market value. Therefore, the study aims at studying the factors influencing highway retailer satisfaction. Also, the study aims to know the overall satisfaction of the retailers concerning some of the FMCG companies. This study will certainly help the companies to create strategies for the highway outlets. The company’s focus on the loyalty of the retailers to distribute their products and retailer satisfaction is the basis for the loyalty of every retail outlet owner. The size of the sample considered in the study is 200 respondents. The collected data is analysed with a statistical method called exploratory factor analysis by using the IBM SPSS 20.0 software Keywords: Highway retailer, Retailer satisfaction, FMCG, Factor Analysis, Exploratory factor analysis, Satisfaction. INTRODUCTION Besides the highest population in India there is a growing awareness and education of customers and, change under the lifestyle of buyers. Thus, most of the FMCG firms started focusing on customer satisfaction. Now near the 22nd century, we could see that various firms in FMCG sector remain growing moreover increasing their market share rapidly through fulfilling the needs of every customer and also, the companies do present many coupons, toys, and gifts, etc. for free to make the customer happy and satisfied. The products which are offered by the company for the customers, they use retailers as their gap fillers. As well as, every retailer tries to satisfy the customer utmost. Therefore, for the satisfaction of customers, the retailer plays a major role and also, in the supply chain, retailers play a vital role. Anyhow, the retailers have a very little or less recognition by the companies and which may result in dissatisfaction of the retailer. To overcome the situation, these days, the satisfaction of the retailer is considered as a primary task by most of the FMCG companies in India. Their Mukt Shabd Journal Volume IX, Issue IV, APRIL/2020 ISSN NO : 2347-3150 Page No : 1297
-
Upload
khangminh22 -
Category
Documents
-
view
1 -
download
0
Transcript of Factors influencing Highway Retailer Satisfaction in FMCG ...
Factors influencing Highway Retailer Satisfaction in FMCG industry
Dr. Kunal Gaurav
Area Chair – Research & Consultancy
Siva Sivani Institute of Management, Secunderabad, India
Kommuru Venkatnaga Raju
Student of PGDM (2018-20)
ICBM - School of Business Excellence, Hyderabad, India
Abstract
FMCG retailers are growing in India, the retailers these days having a great awareness of
products and services offered by each of the FMCG company in India. The retailer satisfaction
is a key to success for every company as in the current scenario retailers not only meant for
distributing the goods provided by the company to customers but also the value and the
relationship, they maintain with the customers will reflect on the company’s overall market
value. Therefore, the study aims at studying the factors influencing highway retailer
satisfaction. Also, the study aims to know the overall satisfaction of the retailers concerning
some of the FMCG companies.
This study will certainly help the companies to create strategies for the highway outlets. The
company’s focus on the loyalty of the retailers to distribute their products and retailer
satisfaction is the basis for the loyalty of every retail outlet owner. The size of the sample
considered in the study is 200 respondents. The collected data is analysed with a statistical
method called exploratory factor analysis by using the IBM SPSS 20.0 software
Keywords: Highway retailer, Retailer satisfaction, FMCG, Factor Analysis, Exploratory factor
analysis, Satisfaction.
INTRODUCTION
Besides the highest population in India there is a growing awareness and education of
customers and, change under the lifestyle of buyers. Thus, most of the FMCG firms started
focusing on customer satisfaction. Now near the 22nd century, we could see that various firms
in FMCG sector remain growing moreover increasing their market share rapidly through
fulfilling the needs of every customer and also, the companies do present many coupons, toys,
and gifts, etc. for free to make the customer happy and satisfied. The products which are offered
by the company for the customers, they use retailers as their gap fillers. As well as, every
retailer tries to satisfy the customer utmost. Therefore, for the satisfaction of customers, the
retailer plays a major role and also, in the supply chain, retailers play a vital role. Anyhow, the
retailers have a very little or less recognition by the companies and which may result in
dissatisfaction of the retailer. To overcome the situation, these days, the satisfaction of the
retailer is considered as a primary task by most of the FMCG companies in India. Their
Mukt Shabd Journal
Volume IX, Issue IV, APRIL/2020
ISSN NO : 2347-3150
Page No : 1297

satisfaction is foremost important function hence, all the companies in the FMCG industry,
based upon their channel of distribution, they have a special focus towards the retailer and their
satisfaction. However, the factors which will help the companies to satisfy the retailers are
studied in this.
Retailer’s loyalty also depends on the satisfaction of retailers (Davis, Cornelia, Mentzer and
Myers, 2009). The Indian FMCG companies have been untouched for measuring retailer
satisfaction. There is very little or not much focus on studying retailer satisfaction by both
companies and researchers.
FMCG industries in India are expected to grow at a Compound Annual Growth Rate of 27.9%
by 2020. Retailer satisfaction has become a primary and most important task for all the FMCG
companies in India. A retailer is an outlet where a large quantity of goods is purchased directly
from the manufacturers or the wholesalers/distributors (Adhirai, and Surulivel, 2017). A retail
outlet may be a DHABA/tiffin centre, stationery, bakery, grocery store and other small outlets
like pan shop and juice centre. A retailer has a direct touch with the customers, thus having an
effective interaction and keeping the retailer satisfaction at ace will always result in sustaining
for a longer period of time in the market. Manufacturers truly believe that without the support
of the retailers the brand building cannot happen, and it all depends upon the relationship
satisfaction (Poddar, Donthu and Parvatiyar, 2013).
As per the study of Ali and Dubey (2013) retailers are the mediators between the manufacturers
and the customers. Thus, many companies work hard to maintain the retailer satisfaction and
make sure the retailer is satisfied and retailer satisfies the customer. Also, in return the
companies congratulating the retailers with numerous recognitions and prestigious industry
awards. The retailer is a part of channel i.e. distribution system, retailer’s satisfaction will help
in customer satisfaction and also build a strong relationship between the company and retailer.
Thus, satisfaction plays an important subject of the relationship between the supplier and
retailer. There are many factors which may satisfy the retailer out of which the major factor is
that the retail outlet should have consistent contact with the salesperson. This is considered as
one of the top factors of retailer satisfaction (Schellhase, Hardock and Ohlwein, 2000).
According to Poddar, Donthu, and Parvatiyar (2013) the retailers also helps the manufacturers
in trade promotions, retailers prefer trade promotions that provide short-term economic
benefits; the manufacturer prefers trade promotions that provide long-term, franchise-building
benefits.
Therefore, the study focuses on understanding retailers’ satisfaction in the FMCG industry and
on appreciating the factors which influence the retailers’ satisfaction. The present study is
intended to extract the factors which are essential for a manufacturer to keep an eye on those
factors and make the retailer satisfy. This study aims to study the factors influencing the
highway retailer satisfaction in FMCG industry. At the same time, the efforts made to know
the overall satisfaction of the retailers towards the services provided by the FMCG companies.
Mukt Shabd Journal
Volume IX, Issue IV, APRIL/2020
ISSN NO : 2347-3150
Page No : 1298

REVIEW OF LITERATURE
Adhirai and Surulivel (2017) say marketing is all about identifying and satisfying customer
need. In order to satisfy customer needs, companies indulge in some of the activities like
promotion, distribution, advertising, with all of these aside companies also focus on retailer
satisfaction, which is a major concern for all the FMCG companies in India.
Sramek, Droge, Mentzer and Myers (2009) tries to fill a gap between the supplier-retailer
loyalty by understanding the order fulfilment service quality through two dimensions: technical
dimensions and relational dimensions. First dimension, the Technical Dimensions relate to the
operational part like delivering the right products on time and responsible, and second
dimension, the Relational Dimensions relate to moments of truth by the personnel and
responsiveness of the contact personnel.
Runyan, Sternquist and Chung (2010) say that channel relationship is fully mediated with one
or more constructs including trust, commitment, relationship satisfaction, and quality.
Ali and Dubey (2013) state that satisfaction is the most important concept in marketing and has
a great impact on researchers to write papers on it. They are many kinds of literature on
customer satisfaction whereas there is a strong relationship between customer satisfaction and
economic performance.
Ruekert and Churchill (1984) state that the construct of satisfaction is of fundamental
importance in understanding channel relationships, the construct of channel member
satisfaction so important in both theoretically and managerially to measure the satisfaction.
Retailers help to bridge the gap between the manufacturers and the customers and another
major factor a retailer should consider is quality of service, as every customer want a unique
experience (Bawa, Gupta and Sharma, 2013).
The satisfaction of retailers is core determinant of success, there is always a lack of clarity in
considering a particular construct of dimensions which produce the satisfaction of retailer
(Schellhase, Hardock and Ohlwein, 2000).
The unorganized retailers’ opportunities are growing the middle class, India's booming
economy, a large number of educational institutions and increase in spending with earnings
Mittal and Prashar (2011).
According to Poddar, Donthu and Parvatiyar (2013) trade promotions are done by the retailer
for some incentives provided by the vendor as a brand building activity taken on behalf of the
vendor.
With long-term orientation, it also builds the trust, economic dependence, functionality of
conflict, satisfaction, and trust has a positive impact on the relationship of retailer-supplier
Chung, Sternquist and Chen (2006).
Mukt Shabd Journal
Volume IX, Issue IV, APRIL/2020
ISSN NO : 2347-3150
Page No : 1299
The model two strategies have compared one is exchange of product (innovation, design,
quality, or customisation) and another one is exchange of process (services before, during, and
after a sale) i.e. what is offered is the product and how it is offered is the services. The study
also focuses on the loyalty and its effect based on the satisfaction of retailers Lopez and Boluda
(2017).
Andaleeb (1996) examines the effects of trust and dependence on satisfaction and commitment
to the long-term relationship of channel members. Each member establishes a relationship with
another channel member because it needs the other member to achieve desired goals so having
a dependence on each is a central part of the channel member satisfaction.
Satisfactions of the retailer is one of the key factors in channel relationship. The satisfaction
helps in performance in the distribution channel and channel members probably perform better
(Kavak, Sertoglu and Tektaş, 2016).
Somashekhar and Patil (2014) focuses on the necessity of knowing the retailer satisfaction by
the companies and the retailers have only option to differentiate in the market is the service
what they provide. Retailers are no more just a supplier of good to customer but also
responsible for creating a bridge between the company and customer.
According to Beura and Jena (2018), the customer's preference towards the biscuits is changing
from glucose biscuits to premium biscuits. The biscuit industry has several categories like
economy (glucose), middle, premium, and super premium biscuits. They attempted towards
the empirical study of factors influencing retailer’s behaviour towards the glucose biscuit
segment in the Odisha state.
Satisfaction is positively correlated with the cooperation and inversely correlated with conflict.
Under channel member behaviour the satisfaction plays an important role in decision making
and satisfaction is a multidimensional construct (Michie and Sibley, 1985)
The relation between the trust, commitment and supply chain efficiency of the food sector in
Greek is focused in this study. Through improved use of information technology in distribution
this led to an increased bargaining power for the retailers (Vlachos and Bourlakis, 2006).
RESEARCH METHODOLOGY
Research Design
Descriptive research has been used in the study, which is majorly used in social science,
psychology, and education research. In the study survey method is used for collecting the data,
a survey method can be directly interacting with the group or through a questionnaire or
through interviews. The study attempts to know the factors which influence the retailer
satisfaction.
Mukt Shabd Journal
Volume IX, Issue IV, APRIL/2020
ISSN NO : 2347-3150
Page No : 1300

Sampling Plan and Size
The sampling method followed is Convenience Sampling technique and it is a non-probability
sampling method where the sample is considered from a group of people easy to reach. As the
sample in the study are the retailers situated in the Highways from Shadnagar to Penukonda
highway (NH 44). The size of the sample considered in the study is 200 respondents.
Data Type and Data Source
Both primary and secondary sources are used in the study for collecting the data. A structured
questionnaire was developed, and direct interviews were made to collect the primary data. The
research databases like EBSCO, Google Scholar, Emerald, and Elsevier are used to collect the
secondary data.
Questionnaire Development
The structured questionnaire is prepared which contains three sections in it. First, the
demographic questions, second, measuring the retailer satisfaction variables and at last,
measuring the overall satisfaction of retailers with FMCG companies. After studying various
research papers on retailer satisfaction, 35 variables have been considered in the study for
measuring the factors, which influence the retailer satisfaction. These 35 listed variables
responses taken on the measurement scale of the 5-point Likert scale were 1 is Highly
Unimportant and 5 is Highly Important.
Data Analysis Method
The collected data is analysed with a statistical method called exploratory factor analysis by
using the IBM SPSS 20.0 software. Reliability test is also considered in the study. For
identifying and defining the factors varimax rotation is used. Also, varimax is used for stabling
the data. A rotation tool is used to create the simple structure, if it's achieved through rotation
then it will be easy to interpret so that we can make sense of the factor loadings. Also, KMO-
Bartlett’s test of sphericity, Communalities, total variance explained are considered.
Descriptive analysis is also considered in the present study for the demographic section, with
the help of frequencies.
DATA ANALYSIS
The data analysis part is divided into four sections namely Reliability, Factor Analysis,
Satisfaction Analysis and Descriptive Analysis. There are 35 variables which are considered in
the study, for these variables the respondents were asked to mark their answer with 5-point
Likert scale where 1 is highly unimportant and 5 is highly important. The varimax technique
was used in the analysis of stabling the data.
Mukt Shabd Journal
Volume IX, Issue IV, APRIL/2020
ISSN NO : 2347-3150
Page No : 1301

Factor analysis one of the statistical tools to reduce the number of variables into a specific
number of Factors. The 35 different variables included to know the factor influencing the
highway retailer satisfaction of FMCG industry, considered in the survey are below:
S.No Variables S.No Variable
1 Margins 19 Return policy
2 On time delivery 20 Expired products policy
3 POP ads 21 Quality of products
4 Relationship with company 22 Accessibility of distributor
5 Reference with sales person 23 Responsible sales person
6 On time order taking 24 Communication about New products
7 Frequency of sales person visit 25 Numbers of variants and flavors
8 Schemes and Discounts 26 Packaging
9 Credit Facility 27 Labelling
10 Display racks 28 Replacement of old stock
11 Shelf Space 29 Promotional activities
12 Emergency order capturing 30 Advertisements
13 Availability of SKU 31 Customer Demand
14 Distribution Network 32 Registration Procedure
15 Service Norms 33 Virtual Payment Option
16 SKU recommendation by sales
person
34 Advice of sales person
17 Scope of feedback 35 Brand Image of product
18 Complaints handling
Also, descriptive analysis is used in the study for analysing the demographic section in the
questionnaire and the last section in the questionnaire i.e. the overall satisfaction of the retailers
with the services provided by the seven FMCG companies. The responses were collected with
a 5-point Likert scale, where 1 is highly dissatisfied and 5 is highly satisfied. The seven
companies considered in the study are:
S.No Company Name S.No Company Name
1 ITC 5 Haldiram’s
2 HUL 6 PepsiCo
3 Parle 7 Procter and Gamble
4 Britannia
Section 1 – Reliability Test
Reliability
The scale considered for the variables is 5-point Likert Scale (1 is Highly Unimportant and 5
is Highly Important) is tested. The reliability test is tested with Coefficient Alpha and it is also
known as the Cronbach’s Alpha. It is one of the most commonly used tests to estimate the
Mukt Shabd Journal
Volume IX, Issue IV, APRIL/2020
ISSN NO : 2347-3150
Page No : 1302

reliability of an instrument i.e. variables in a questionnaire. Cronbach’s Alpha is simply
estimating internal consistency reliability. The total respondents were 200, as the resulted
Cronbach’s Alpha value is 0.875 which is good. The Cronbach’s Alpha is supposed to be higher
than 0.70 and the Cronbach’s Alpha should be between 0.35 – 0.70 for acceptable, yet the value
below 0.35 should not be considered (Somashekhar and Patil, 2014).
Table 1 – Reliability Statistics
Cronbach’s
Alpha
N of Items
.875 35
Section 2 – Factor Analysis
The data analysis tool used in the study is exploratory factor analysis with the help of IBM
SPSS 20.0 software.
KMO and Bartlett’s Test
KMO is a measure of sampling fairness, which helps to check the adequacy of the sample for
the variables which are considered in the study. The Kaiser-Meyer-Olkin Measure of Sampling
Adequacy value resulted in 0.763. Commonly anything above the 0.5 is acceptable, however,
a value above 0.6 is most preferred. Under Bartlett’s Test of Sphericity, the P-value i.e.
significance value is 0.000, which is recorded as below the 0.05 and it states that it is
statistically significant value. A test which has a significance value indicates that there are some
relations between the variables.
Table 2 – KMO and Bartlett’s Test
Kaiser-Meyer-Olkin Measure of Sampling
Adequacy. .763
Bartlett’s Test of
Sphericity
Approx. Chi-Square 2725.823
Df 595
Sig. .000
Communalities
Communalities explain the amount of variance that each variable is accounting for. In the
principal component extraction, it is observed that all the values in the column of initial are
1.0, this is because for the correlation analysis. In the extractions column, we can see it has
resulted in different values because each value is the extraction estimates and the variance of
each component. Through the below table we can observe all the extraction values are above
0.5.
Mukt Shabd Journal
Volume IX, Issue IV, APRIL/2020
ISSN NO : 2347-3150
Page No : 1303
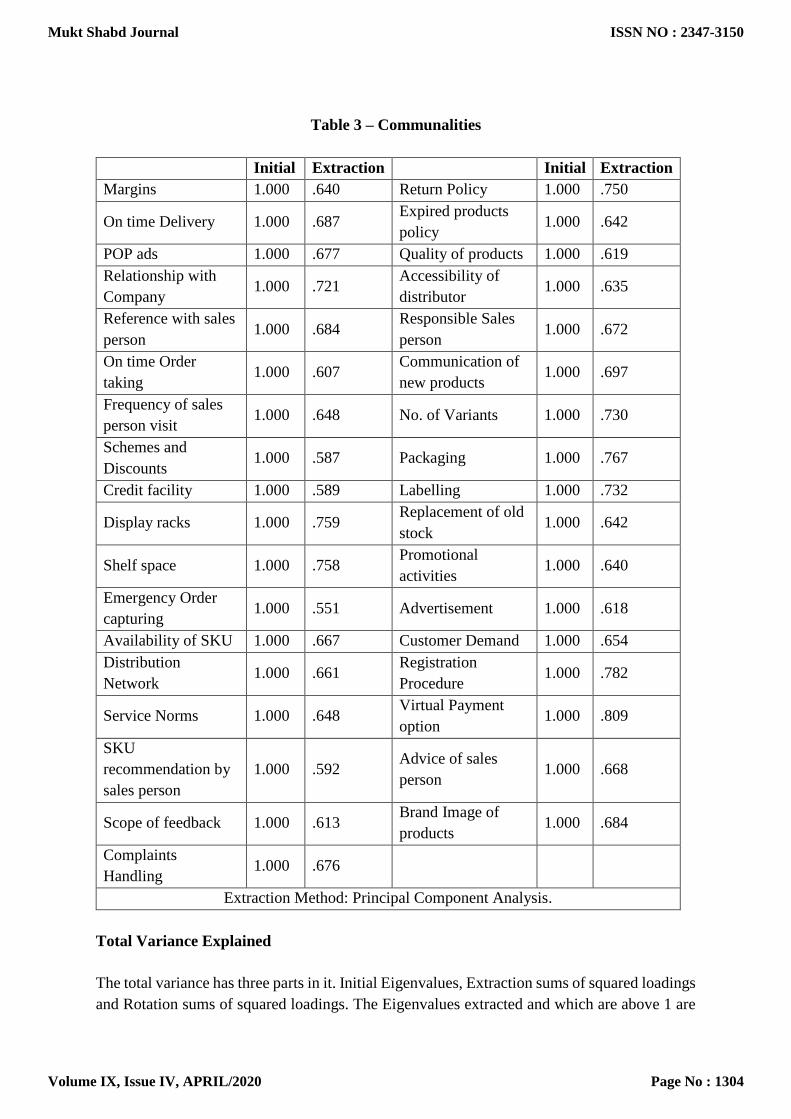
Table 3 – Communalities
Initial Extraction Initial Extraction
Margins 1.000 .640 Return Policy 1.000 .750
On time Delivery 1.000 .687 Expired products
policy 1.000 .642
POP ads 1.000 .677 Quality of products 1.000 .619
Relationship with
Company 1.000 .721
Accessibility of
distributor 1.000 .635
Reference with sales
person 1.000 .684
Responsible Sales
person 1.000 .672
On time Order
taking 1.000 .607
Communication of
new products 1.000 .697
Frequency of sales
person visit 1.000 .648 No. of Variants 1.000 .730
Schemes and
Discounts 1.000 .587 Packaging 1.000 .767
Credit facility 1.000 .589 Labelling 1.000 .732
Display racks 1.000 .759 Replacement of old
stock 1.000 .642
Shelf space 1.000 .758 Promotional
activities 1.000 .640
Emergency Order
capturing 1.000 .551 Advertisement 1.000 .618
Availability of SKU 1.000 .667 Customer Demand 1.000 .654
Distribution
Network 1.000 .661
Registration
Procedure 1.000 .782
Service Norms 1.000 .648 Virtual Payment
option 1.000 .809
SKU
recommendation by
sales person
1.000 .592 Advice of sales
person 1.000 .668
Scope of feedback 1.000 .613 Brand Image of
products 1.000 .684
Complaints
Handling 1.000 .676
Extraction Method: Principal Component Analysis.
Total Variance Explained
The total variance has three parts in it. Initial Eigenvalues, Extraction sums of squared loadings
and Rotation sums of squared loadings. The Eigenvalues extracted and which are above 1 are
Mukt Shabd Journal
Volume IX, Issue IV, APRIL/2020
ISSN NO : 2347-3150
Page No : 1304

the number of factors should be taken in the study. Each Eigenvalue represents the variance
related to the particular component. Always it is clear that those factors whose amount of
variance is high that is factor 1 and remaining components above 1 Eigenvalue are the
remaining factors. The Eigenvalues are again showed in the columns named Extraction sums
of squared loadings, wherein the values which are below Eigenvalue 1 are discarded. In the
final part of the table Rotation sums of squared loadings, the total values of 11 factors are
cumulated as the variance considered. The total cumulative variance considered in the study is
67.150 percentage.
Table 4 – Total Variance Explained
Co
mp
one
nt
Initial Eigenvalues Extraction Sums of Squared
Loadings
Rotation Sums of Squared
Loadings
Total % of
Varian
ce
Cumulativ
e %
Total % of
Variance
Cumulativ
e %
Total % of
Varian
ce
Cumulati
ve %
1 7.550 21.573 21.573 7.550 21.573 21.573 2.708 7.738 7.738
2 2.382 6.805 28.377 2.382 6.805 28.377 2.600 7.428 15.166
3 2.106 6.017 34.395 2.106 6.017 34.395 2.513 7.181 22.348
4 1.984 5.668 40.063 1.984 5.668 40.063 2.395 6.843 29.191
5 1.761 5.031 45.094 1.761 5.031 45.094 2.358 6.737 35.927
6 1.657 4.733 49.827 1.657 4.733 49.827 1.961 5.603 41.530
7 1.419 4.055 53.882 1.419 4.055 53.882 1.909 5.454 46.984
8 1.264 3.613 57.495 1.264 3.613 57.495 1.897 5.419 52.403
9 1.211 3.459 60.954 1.211 3.459 60.954 1.889 5.398 57.801
10 1.094 3.125 64.078 1.094 3.125 64.078 1.796 5.130 62.931
11 1.075 3.071 67.150 1.075 3.071 67.150 1.476 4.218 67.150
12 .970 2.772 69.922
13 .877 2.506 72.427
14 .820 2.341 74.769
15 .745 2.129 76.897
16 .703 2.010 78.907
17 .677 1.934 80.841
18 .625 1.786 82.627
19 .618 1.767 84.394
20 .576 1.646 86.040
21 .555 1.587 87.627
22 .499 1.426 89.053
23 .464 1.325 90.378
24 .432 1.234 91.612
25 .382 1.092 92.704
26 .373 1.066 93.769
27 .332 .948 94.718
Mukt Shabd Journal
Volume IX, Issue IV, APRIL/2020
ISSN NO : 2347-3150
Page No : 1305

28 .325 .929 95.647
29 .314 .898 96.545
30 .258 .736 97.281
31 .240 .687 97.968
32 .231 .660 98.628
33 .214 .611 99.239
34 .135 .385 99.624
35 .132 .376 100.000
Extraction Method: Principal Component Analysis.
Figure 1: Showing Scree Plot
The above figure explains the factors which are above Eigenvalue more than 1. The graph
infers that after factor 1 there has been a sharp change in the curve which indicates each
successive factor are accounting for smaller variations.
Rotated Component Matrix
Rotation is a mathematical procedure that rotates the factor axis to produce the results that are
more interpretable, and it helps in identifying and defining the factors. It makes the loading
patterns clear & easier to identify. The whole purpose of the rotation is to create the simple
structure, if it's achieved through rotation then it will be easy to interpret so that we can make
sense of the factor loadings. The factor loading is suppressed to 0.4, which means all the
loadings which are above 0.4 are considered for the analysis. This helps in filtering the weak
components and considering them. Varimax rotation method, explain the variables as the
cluster to a particular group. The items with the highest loading are sorted in the rotated
component matrix which will help to combine the variables into a variable.
Mukt Shabd Journal
Volume IX, Issue IV, APRIL/2020
ISSN NO : 2347-3150
Page No : 1306

Table 5 - Rotated Component Matrix
Component
1 2 3 4 5 6 7 8 9 10 11
Responsible
Sales person .716
Accessibility of
distributor .708
Communication
of new products .653
Quality of
products .617
No. of Variants .526
Return Policy .785
Complaints
Handling .719
Expired
products policy .690
Scope of
feedback .689
Shelf space .770
Display racks .747
Emergency
Order capturing .623
Service Norms .773
Distribution
Network .757
Availability of
SKU .690
SKU
recommendatio
n by sales
person
.651
Packaging .766
labelling .749
Replacement of
old stock .533
Reference with
sales person .779
Relationship
with Company .753
On time Order
taking .616
Mukt Shabd Journal
Volume IX, Issue IV, APRIL/2020
ISSN NO : 2347-3150
Page No : 1307

Schemes and
Discounts .671
Frequency of
sales person
visit
.638
Credit facility .636
Margins .753
On time
Delivery .702
POP ads .476
Customer
Demand .705
advertisements .690
Promotional
activities .664
Virtual
Payment option .886
Registration
Procedure .825
Brand Image of
products .700
Advice of sales
person .700
Extraction Method: Principal Component Analysis.
Rotation Method: Varimax with Kaiser Normalization.
a. Rotation converged in 9 iterations.
Consolidated Factor Analysis
The consolidated factor analysis is framed with the loaded factors which are having the value
of more than 0.4 of 35 variables. The 11 factors which are extracted from the rotated component
matrix are named in the consolidated factor analysis i.e. Table 10. For each factor, the reliability
test is also taken. Cronbach’s Alpha is more than 0.5 for all the factors in the study. Most of
the factor is also having the reliability of 0.7 which is high.
Table 6 - Consolidated factor analysis
Factor Name Variable Name Loading
value
Cronbach’s
Alpha
Total
Variance
Explained
Responsible Sales person .716
Accessibility of distributor .708
Mukt Shabd Journal
Volume IX, Issue IV, APRIL/2020
ISSN NO : 2347-3150
Page No : 1308

Product Communication of new products .653 .795 7.738
Quality of products .617
No. of Variants .526
Post Purchase
Facilities
Return Policy .785
.761
7.428 Complaints Handling .719
Expired products policy .690
Scope of feedback .689
Instore
Advertisement
Shelf space .770
.775
7.181 Display racks .747
Emergency Order capturing .623
Distribution
with
availability
Service Norms .773
.739
6.843 Distribution Network .757
Availability of SKU .690
SKU recommendation by sales
person .651
Wrapping
Packaging .766
.746
6.737 labelling .749
Replacement of old stock .533
Relationship
Reference with sales person .779
.657
5.603 Relationship with Company .753
On time Order taking .616
Frequency of
salesperson
visit
Schemes and Discounts .671
.585
5.454 Frequency of sales person visit .638
Credit facility .636
Profitability
Margins .753
.635
5.419 On time Delivery .702
POP ads .476
Customer
Demand
Customer Demand .705
.635
5.398 Advertisements .690
Promotional activities .664
Payment mode Virtual Payment option .886
.793
5.130 Registration Procedure .825
Brand Image
Brand Image of products .700
.529
4.218 Advice of sales person .700
Mukt Shabd Journal
Volume IX, Issue IV, APRIL/2020
ISSN NO : 2347-3150
Page No : 1309

Factor Description
Product
The factor is named as the Product because the variables in the first factor are related to product
dimensions Hence, the factor is named as Product. The factor has the highest number of
variables i.e. out of 35, five variables are loaded. Product factor explains the highest total
variance percentage which is 7.738. The resulted Cronbach’s Alpha of the factor is 0.795 which
is acceptable. Product dimensions include the quality of the product, communication of new
product and number of variants. Hence, retailers preferred product as a highly important factor
for the satisfaction of retailers.
Post Purchase Facilities
Through Factor analysis, the Post Purchase Facilities dimensions resulted in the second factor.
The factor is named as the Post Purchase Facilities, as the variables loaded in the factor are
related to the post-purchase. The factor includes the four variables out of 35 variables. The
second factor has the total variance percentage of 7.428, which represents that Post Purchase
Facilities explains 6.805 percent of the total variance. The resulted Cronbach’s Alpha of the
factor is 0.761 which is acceptable. Many retailers face the problem of outdated stock and
returning of damaged products. The factor has to be considered by the companies while serving
the retailers as we can see it is the second most important factor to satisfy the retailers.
Instore advertisement
The factor is named as the Instore advertisement, seeing that the variables loaded to the factor
are related to it. Three variables are loaded in the factor out of 35 variables. Instore
advertisement factor has a total variance percentage of 7.181. The reliability of the factor
resulted in Cronbach’s Alpha is 0.775, which is acceptable. Instore advertisement dimensions
include variables like display racks and shelf space. The variable emergency order capturing
by the distributor is also loaded in the factor, which is also very much important to satisfy the
retailer. Still, the Instore advertisement is a highly important factor for the satisfaction of the
retailer. As the shelf space in the outlet is very low, retailer demand for the racks as well as the
company needs to provide display racks to keep their respective products.
Distribution with availability
The fourth factor resulted in four variables out of 35 variables. The factor is named as the
Distribution with availability which means that the variables in the factor loaded are related to
the availability of a particular product with the distributors. The factor explains the total
variance of 6.843 percentage. The resulted Cronbach’s Alpha is 0.739, which is acceptable.
Distribution with availability dimension explains the variables like availability of SKU,
distribution network, service norms and SKU recommendation by the salesperson. The retailer
asks for particular SKU for the distributor, as the retailer has belief and scope that he/she can
Mukt Shabd Journal
Volume IX, Issue IV, APRIL/2020
ISSN NO : 2347-3150
Page No : 1310

sell that. If the distributor couldn’t supply the particular SKU then the retailer will not be happy.
Therefore, Distribution with availability is one of the important factors for retailer satisfaction.
Wrapping
Factor analysis resulted that the fifth factor with just three variables out of 35 variables. The
factor is named as Wrapping as most of the variables resemble it. Wrapping has explained the
total variance of 6.737 percentage. Cronbach’s Alpha resulted in 0.746, hence the reliability of
the factor is acceptable. Wrapping dimensions include variables like packaging and labelling.
The quality of the package is almost very important as the retailer keep the stock until the
product is sold or the date of expiry, here, we can also observe that labelling part. Most of the
products in the FMCG sector are of the limited period thus, the date of expiry and another
related content labelling on the package is major. The wrapping factor also an important factor
for the satisfaction of the retailer.
Relationship
Relationship factor is named for the sixth factor, where the relationship with the salesperson
and the company is one of the most important parts of every retailer. There are three variables
loaded in Relationship factor out of 35 variables. Relationship factor explains the total variance
of 5.603 percentage. The reliability test of Cronbach’s Alpha resulted in 0.657, which is
acceptable. Relationship dimension simply can be defined as the channel relationship too. The
variables are the relationship with the company and the reference with the salesperson. As these
two also the part of the distribution channel. The retailer’s feel satisfied while they have a good
relationship with the company as well as the salesperson. The third variable is on time order
taking when you have a good relationship the timely order will continue.
Frequency of salesperson visit
Factor analysis loaded the seventh factor with three variables out of 35 variables in the study.
The factor is named as the Frequency of sales person visit. The greater number of times a
salesperson visits the outlet, the retailers need not keep a high amount of stock and retailers
need not worry. Frequency of salesperson visit factor explains the total variance of 5.454
percentage. The resulted Cronbach’s Alpha is 0.585, which is acceptable as it is more than 0.5.
The variables Credit facility and schemes & discounts are loaded in the factor. The credit
facility is an important variable for the satisfaction of retailer still most of the retailers don’t
choose to have it. The schemes & discounts provided by the companies, the retailers feel it as
just added advantage, even though the retailer purchase the same amount of goods. Thus, for
the satisfaction of the retailer Frequency of salesperson visit is one of the important factors.
Profitability
Most of the companies feel that the factor for retailer satisfaction is foremost is margin.
Whereas we can see that the factor analysis loaded the margin as the eighth factor of retailer
Mukt Shabd Journal
Volume IX, Issue IV, APRIL/2020
ISSN NO : 2347-3150
Page No : 1311

satisfaction. The factor is named as the Profitability. There are three variables which are loaded
in the factor out of 35 variables. The total variance explained by the factor is 5.419 percentage.
The resulted Cronbach’s Alpha is 0.635, which is more than 0.5 i.e. accepted. Profitability
dimension is margins, where most of the retailers feel that margin will just important factor in
satisfaction but it is not highly important. The variable on time delivery is loaded, even if a
retailer gets the high margin if the goods are not supplying on time then it is no use. The third
variable in the factor is POP ads where the retailer feel it is just ok to keep those ads but which
will not satisfy them utmost. Therefore, Profitability is an important factor for the satisfaction
of retailers.
Customer Demand
Every sale of the product will start with purchasing of the product by the customer. If the
customer demand is not there then the sale of the particular product will not happen then retailer
satisfaction will also be in negative. Here, the ninth factor is named as Customer Demand, as
the variables loaded in ninth factor is related to it. Customer Demand factor explains the total
variance of 5.398 percentage. The reliability test of Cronbach’s Alpha resulted in 0.635, which
is acceptable. The variables like promotional activities and advertisements are loaded in the
factor which as the lowest loading value. Retailers feel that the advertisements by the
companies will have less important in their satisfaction as it has loaded in the ninth factor. The
customer demand is very important but for the satisfaction of the retailer, the retailer is not
feeling customer demand as the foremost factor for their satisfaction.
Payment Mode
The tenth factor is named as Payment Mode, the variables in the factor loaded are related to
Payment Mode. The factor loaded only two variables out of 35 variables in the study. The
factor explains the tenth most total variance of 5.130 percentage. Cronbach’s Alpha has
resulted in 0.793, which is more than 0.5 and it is acceptable. The variable registration
procedure is also loaded in the Payment Mode factor where the retailers feel that registration
of themselves with the company is not very much important variable for their satisfaction.
Payment Mode factor variable is virtual payment option, we can see in the highway retailers
most of them are not tech savvy and not very much used for these virtual payment modes thus
it really very less important for their satisfaction.
Brand Image
Brand image is one of the aspects where the retailers accept the product to keep in their outlet.
Here, the two variables are loaded out of 35 variables in the eleventh factor. The factor is named
as Brand Image. The total variance explained by the factor is 4.218 percentage. The resulted
Cronbach’s Alpha is 0.529 which is very much near to 0.5 little poor variables but acceptable.
The variable Brand image of the company is not highly important for the retailer’s satisfaction
as it is loaded in the eleventh factor. Another variable advice from the salesperson has also
loaded which retailers see as less important. The retailer feels they know the amount of stock
Mukt Shabd Journal
Volume IX, Issue IV, APRIL/2020
ISSN NO : 2347-3150
Page No : 1312

to be taken and advice from salesperson really may not satisfy them. Brand image factor is
important in the satisfaction of the retailers but in the last part.
Section 3 – Satisfaction Analysis
Table 7 - Overall Satisfaction Score of the Highway Retailers
S.no Company Name Overall Satisfaction Score Position
1 ITC 4.04 1
2 PepsiCo 3.54 2
3 Haldiram’s 3.52 3
4 Britannia 3.47 4
5 Parle 3.43 5
6 HUL 3.17 6
7 Procter and Gamble 3.03 7
Figure 2: Showing Overall Satisfaction Score
Highway market in India is very different from the other markets. The FMCG companies in
India are majorly focused on rural and urban market. The highway market is related to the rural
market. Where in the highway market (Table 9) we can observe that 44.5 % of the respondents
are Dhaba’s. Which clearly define that the products like personal care and household are not
much focused on these outlets. The companies listed in Table 07 are some of the top FMCG
companies in India. The respondents were asked to rate their response from Highly dissatisfied
to Highly satisfied with a 5-point Likert scale. The outlets in the highway market are majorly
focused on two to three product categories one is biscuits and another one is snacks as well as
the confectionery.
ITC has the highest overall satisfaction score when compared to other companies. The scores
show that ITC having the overall satisfaction score of 4.04 whereas PepsiCo tops second with
4.04
3.54 3.52 3.47 3.433.17 3.03
0
0.5
1
1.5
2
2.5
3
3.5
4
4.5
ITC PepsiCo Haldiram’s Britannia Parle HUL Procter andGamble
Overall Satisfaction Score
Overall Satisfaction Score
Mukt Shabd Journal
Volume IX, Issue IV, APRIL/2020
ISSN NO : 2347-3150
Page No : 1313

a score of 3.54. ITC has Bingo! Mom’s Magic, and Candyman, etc. which made ITC serve
each of the outlet in the highway market including the pan shop and a tea shop. On the other
hand, the market leader in the snack market Lays is also having a distinct position in serving
the highway retailers through their beverages distribution system.
Overall satisfaction of the retailers towards Haldiram’s scored is 3.52 which near to the above
the neutral and retailers are nearly satisfied with the Haldiram’s company. Both HUL and
Procter & Gamble are not in biscuits and snacks part and thus, it resulted in 3.17 and 3.03
respectively, these two companies’ services are neither satisfied nor dissatisfied by the retailers.
The two companies Britannia and Parle scores are 3.47 and 3.43 respectively. Hence, the
retailer’s overall satisfaction is neutral towards these two companies.
CONCLUSION
The objectives of this study are to know the factor which will influence the highway retailer
satisfaction and also know to the overall satisfaction of the highway retailers towards the
FMCG companies. The statistical tool exploratory factor analysis resulted in eleven
independent sets of underlying factors influencing the highway retailer satisfaction they are:
Product, Post Purchase Facilities, Instore Advertisement, Distribution with Availability,
Wrapping, Relationship, Frequency of Sales Person Visit, Profitability, Customer Demand,
Payment Mode, Brand Image. These eleven constructs which will influence the highway
retailer satisfaction. Thus, companies have to focus on these factors while serving the retailer
to make them satisfy.
The study resulted in eleven factors which is almost a very big number, however, for the
satisfaction of the retailer, the study justifies these factors that they influence the retailer
satisfaction. Each of the factors has a Cronbach’s Alpha value more than 0.5 which is
acceptable. The results are more suitable to the retailers situated on the highway and also, we
can observe that Virtual Payment Option has resulted as the tenth factor of influencing the
retailer satisfaction which may not be same in case of city or town retailers.
The overall satisfaction of the retailers with respect to some of the FMCG companies are
considered in the study. ITC has the highest score and the next highest score is PepsiCo. Thus,
retailers feel their satisfaction towards ITC and PepsiCo is satisfactory.
Mukt Shabd Journal
Volume IX, Issue IV, APRIL/2020
ISSN NO : 2347-3150
Page No : 1314

References
Adhirai, B., & Surulivel, D. (2017). Analysis of retailer satisfaction towards the
products of lion dates impex pvt ltd with special reference to thanjavur
region. International Journal of Innovative Research in Management Studies
(IJIRMS), 2(3), 8-14.
Bawa, P., Gupta, B., & Sharma, B. (2013). Retail Service Quality’s Impact on Value
Delivery & Customer Satisfaction in a Retail Store Environment. Journal of
Marketing & Communication, 9(1), 37-44.
Beura, D., & Jena, A. (2018). An empirical study on factors influencing retailer’s
behaviour towards glucose biscuit segment.: International Journal of Research in
Business Management, 6(5), 1-16.
Chris Lin, J., & Chang, Y. (2012). Retailers’ new product acceptance decisions:
incorporating the buyer-supplier relationship perspective. Journal of Business &
Industrial Marketing, 27(2), 89-99.
Chung, J., Sternquist, B., & Chen, Z. (2006). Retailer–buyer supplier relationships:
The Japanese difference. Journal of Retailing, 82(4), 349–355.
Dart, J. (1988). Power, Conflict and Satisfaction: Perceptions of Shopping Center
Based Small Retailers. American Journal of Small Business, 12(3), 35-44.
Davis-Sramek, B., Droge, C., Mentzer, J., & Myers, M. (2009). Creating
commitment and loyalty behavior among retailers: what are the roles of service
quality and satisfaction? J. Of the Acad. Mark. Sci., 37, 440-454.
Jaswal, M., & Gupta, M. (2015). Factors Affecting Growth of Organised Retailing
in India- Challenges and Opportunities. Biz and Bytes, 8(1), 224-229.
J. Skinnner, S., B. Gannenheimer, J., & W, Kelley, S. (2019). Cooperation in
Supplier-Dealer Relations. Journal of Retailing, 68(2), 174-193.
Kavak, B., Sertoğlu, A., & Tektaş, Ö. (2016). The Moderating Effect of Knowledge
Transfer on Satisfaction-Performance Relationship. International Journal of
Business and Social Research, 6(5) 22-38.
Michie, D., & Sibley, S. (1985). Channel Member Satisfaction: Controversy
Resolved. Academy of Marketing Science, Journal of The Academy of Marketing
Science, 13(2), 188-205.
Mittal, D., & Parashar, A. (2011). A field Study on Opportunities and Challenges
Faced by Organized Retailers in Tri-City. Synergy, 9(1), 69-78.
Nair, S., & Chandrachoodan Nair, D. (2018). Key drivers & factors influencing
organized retail sector in Kerala. International Journal of Mechanical Engineering
and Technology (IJMET), 9(6), 680-684.
Poddar, a., Donthu, n., & Parvatiyar, a. (2013). Drivers of trade promotion
receptiveness: The role of relationship and trade promotion satisfaction. Journal of
Marketing Theory and Practice, 21(1), 45-56.
Runyan, R., Sternquist, B., & Chung, J. (2010). Channel relationship factors in
cross-cultural contexts: Antecedents of satisfaction in a retail setting. Journal of
Business Research, 63, 1186–1195.
Mukt Shabd Journal
Volume IX, Issue IV, APRIL/2020
ISSN NO : 2347-3150
Page No : 1315

Saad Andaleeb, S. (1996). An Experimental Investigation of Satisfaction and
Commitment in Marketing Channels: The Role of Trust and Dependence. Journal
of Retailing, 72(1), 79-93.
Samar Ali, S., & Ahmad, F. (2010). Flexible approach to satisfaction index: an
Indian case study of health drink sector. Int. J. Indian Culture and Business
Management, 3(3), 260-284.
Samar Ali, S., & Dubey, R. (2014). Redefining retailer’s satisfaction index: A case
of FMCG market in India. Procedia - Social and Behavioural Sciences, 133, 279 –
290.
Sabura, F., Vijayakumar, D., & Hameed, A. (2012). Retailers attitude towards
Britannia biscuits (a study with special reference to rural areas of
Tirunelveli). International Journal of Business Economics & Management
Research, 2(5), 57-82.
Schellhase, R., Hardock, P., & Ohlwein, M. (2000). Customer satisfaction in
business-to-business marketing: The case of retail organizations and their
suppliers. JOURNAL OF BUSINESS & INDUSTRIAL MARKETING, 15(2/3), 106-
121.
Somashekhar, M., & Patil, D. (2014). “Horizontal expansion: a case study on
Retailer Satisfaction”. National Conference on Contemporary Issues, Challenges
and Advances in Emerging Markets, (ISBN: 978-93-83241-55-2).
Srivastava, R. (2008). Changing retail scene in India. International Journal of
Retail & Distribution Management, 36(9), 714 - 721.
Vila-Lopez, N., & Kuster-Boluda, I. (2017). Excellent products or servitisation?
Analysing retailers’ preference before and after a loyalty programme. Total Quality
Management, 28(12), 1378–1392.
Mukt Shabd Journal
Volume IX, Issue IV, APRIL/2020
ISSN NO : 2347-3150
Page No : 1316