Factors influencing genetic evaluations of linebred Hereford cattle in diverse environments
14
W. M. Snelling, M. D. MacNeil, D. D. Kress, D. C. Anderson and M. W. Tess environments Factors influencing genetic evaluations of linebred Hereford cattle in diverse 1996, 74:1499-1510. J ANIM SCI http://jas.fass.org/content/74/7/1499 the World Wide Web at: The online version of this article, along with updated information and services, is located on www.asas.org by guest on July 13, 2011 jas.fass.org Downloaded from
-
Upload
independent -
Category
Documents
-
view
1 -
download
0
Transcript of Factors influencing genetic evaluations of linebred Hereford cattle in diverse environments

W. M. Snelling, M. D. MacNeil, D. D. Kress, D. C. Anderson and M. W. Tessenvironments
Factors influencing genetic evaluations of linebred Hereford cattle in diverse
1996, 74:1499-1510.J ANIM SCI
http://jas.fass.org/content/74/7/1499the World Wide Web at:
The online version of this article, along with updated information and services, is located on
www.asas.org
by guest on July 13, 2011jas.fass.orgDownloaded from

1499
1This research was conducted under a cooperative agreementbetween USDA, ARS, and the Montana Agric. Exp. Sta. and ispublished as contribution no. J-4030 from the Montana Agric. Exp.Sta.
2Present address: Beefbooster Management Ltd., #22G, 193532nd Avenue NE, Calgary, Alberta T2E 7C8.
3To whom correspondence should be addressed: Rt. 1, Box 2021.Received August 21, 1995.Accepted February 20, 1996.
Factors Influencing Genetic Evaluations of Linebred HerefordCattle in Diverse Environments1
W. M. Snelling*,2, M. D. MacNeil*,3, D. D. Kress†, D. C. Anderson‡,and M. W. Tess†
*Ft. Keogh LARRL, ARS, USDA, Miles City, MT 59301;†Department of Animal Science, Montana State University, Bozeman 59717;
and ‡Northern Agric. Research Center, Havre, MT 59501
ABSTRACT: Data from four closely related Line 1Hereford herds were used to estimate variance compo-nents and predict EPD for birth weight (BWT),weaning weight (WWT), and postweaning gain(PWG). Herds were located in diverse environmentsand differed in level of phenotypic performance.Within-herd BWT analyses considered effects of in-breeding of calf and dam, sex, age of dam (AOD), andcontemporary group as fixed and direct and maternaladditive genetic effects and permanent environmentaleffects due to dam as random. The model for WWTincluded these effects and age of calf. The model forPWG included inbreeding of calf, contemporary group,and direct additive genetic effects. Across-herd ana-lyses were conducted with additional models. The firstconsidered herd-specific inbreeding, sex, and AOD
effects. A second model pooled these effects acrossherds, and a third included pooled sex and AOD effectsbut ignored inbreeding. Across-herd EPD, includingand ignoring inbreeding, were predicted for WWTpreadjusted with standard adjustments for Herefordcattle. Within-herd analyses indicated potential forheterogenous genetic and environmental variancesacross herds. Across-herd variance component esti-mates were consistent, regardless of the model.Estimates of genetic trends indicated potential for biasin genetic evaluations resulting from choice of model.Differences in magnitude of fixed effects betweenherds were observed. Genetic evaluations were differ-ent when pooled or herd-specific fixed effects wereused. Allowance for individual herd differences infixed effects in across-herd evaluations is suggested.
Key Words: Beef Cattle, Genetic Analysis, Linear Models
J. Anim. Sci. 1996. 74:1499–1510
Introduction
Expected progeny differences from national cattleevaluations ( NCE) that use BLUP methodology(Henderson, 1973) are generally accepted as the mostreliable predictions of genetic merit available. Thesepredictions are made with statistical models that maynot adequately address peculiarities of individualherds. The assumption of homogeneous (co)variancesacross herds and use of a priori correction for somefixed effects may affect evaluation of individuals insome herds.
Within-herd evaluation (Quaas and Pollak, 1980)may improve genetic evaluations relative to NCE byaccounting for atypical conditions peculiar to a givenherd. Bias may be reduced with models specified toexplain factors unique to a herd and by using fixed-effect corrections and variance components based oninformation from that herd. Evaluations restricted toa single herd, however, ignore performance of relatedanimals in other herds and result in herd-specificdefinitions of the base. Thus, the value of within-herdpredictions may be limited when selecting animals foruse in other herds.
To provide insight on the relative merit of within-herd and across-herd evaluations of animals in aunique population, data from four herds based onMiles City Line 1 Hereford breeding were analyzed to1) compare estimates of genetic and environmentalvariance and predictions of genetic merit from within-herd, across-herd and national cattle evaluations, and2) assess the influence of different methods to accountfor effects of inbreeding, sex, and age of dam onpredictions of genetic merit.
by guest on July 13, 2011jas.fass.orgDownloaded from

SNELLING ET AL.1500
Table 1. Description of performance records used in within- andacross-herd analyses
aFK = Fort Keogh Livestock and Range Research Laboratory, Miles City, MT; HV = MontanaAgricultural Experiment Station, Havre; CH = Cooper Hereford Ranch, Willow Creek, MT; HH = HoldenHerefords, Valier, MT.
Trait Herda Mean (SD) n Years
Birth weight, kgFK 35.8 (4.9) 5,346 1935−1991HV 36.6 (4.9) 1,648 1964−1991CH 41.1 (4.2) 1,166 1978−1991HH 40.0 (4.0) 1,428 1979−1991
Weaning weight, kgFK 183.9 (31.1) 4,998 1935−1991HV 205.2 (33.1) 1,494 1964−1991CH 272.2 (44.2) 2,208 1974−1991HH 264.6 (41.8) 2,655 1967−1991
Postweaning gain, kgFK 114.4 (65.6) 4,025 1935−1990HV 128.3 (38.6) 990 1976−1990CH 163.4 (61.3) 1,811 1974−1990HH 138.7 (55.1) 1,642 1967−1990
Materials and Methods
Data. The American Hereford Association ( AHA)provided pedigree and performance records from fourclosely related herds. These herds were the originalMiles City Line 1 herd at Fort Keogh ( FK) Livestockand Range Research Laboratory, Miles City, MT, theMontana Agricultural Experiment Station herd atHavre ( HV) , and the seedstock herds of CooperHereford Ranch ( CH) and Holden Herefords ( HH) .Records available from these herds are summarized inTable 1.
The FK herd was closed in 1934 and has beenprimarily selected for postweaning growth. History ofthe cattle, environment, management, and selectionhas been documented (Knapp et al., 1951; Brinks etal., 1965; Urick et al., 1966; MacNeil et al., 1992). TheHV herd was established in 1962 by transfer of cattlefrom Miles City to Havre. Until 1975, selection wasbased on 365-d weight for HV males and18-mo weight for HV females (Brinks and Knapp,1975). Since 1975, HV based selection on the index ofbirth weight and yearling weight suggested by Dicker-son et al. (1974). The HV herd was opened to outsideHereford sires in the 1988 through 1991 breedingseasons. Management and selection of the HV herdare described by Anderson et al. (1985, 1991).
Both CH and HH obtained breeding stock from theFK herd in the late 1940s and have periodicallypurchased FK bulls. Animals have also been ex-changed between these two herds. Cooper HerefordRanch, Willow Creek, MT, grazed irrigated andimproved dryland pastures. Cows and heifers werewintered together and were provided hay beforecalving. At calving, from mid-January through Febru-ary, first calf heifers were separated from the oldercows and provided additional feed. Protein supplemen-
tation was provided before the April and May breedingseason. The 60-d natural mating season occurred ondryland pastures. Single-sire pastures were used, withheifers separated from cows with calves. In July, bullcalves and their dams were moved to irrigatedpastures where they remained until weaning. Heifercalves and their dams were sometimes moved toirrigated pastures several weeks after the bulls. Afterweaning in October, bull calves were placed on afeedlot test with a grain and silage diet to allowapproximately 1.3 kg/d gain. Heifer calves were placedon dryland pasture with supplemental feed to allowapproximately .9 kg/d gain until the start of thebreeding season.
Holden Herefords, Valier, MT, was dependent onirrigated and subirrigated pastures as sources ofgrazed forage. The HH calving, breeding, and weaningschedule was similar to that of CH. Other features ofmanagement were similar, although HH used subir-rigated pastures rather than dryland. The move fromsubirrigated to more productive irrigated pasturesoccurred in August, with bulls and heifers moved atthe same time. The bull test diet included concentrateand ad libitum access to hay.
Pedigrees of cattle with performance records weretraced up to five generations before the 1934 estab-lishment of Line 1 (MacNeil et al., 1992). Thepedigrees used in analyses represented 14,336animals, with 12,252 having performance records. Allparents and all but three grandparents of animalswith performance records were known. This pedigreeinformation was used in all within- and across-herdanalyses. Due to relationships and movements ofanimals among these herds, potentially importantpedigree ties may have been eliminated by alterationof pedigree information specifically for within-herdanalyses.
by guest on July 13, 2011jas.fass.orgDownloaded from

GENETIC EVALUATIONS OF LINEBRED CATTLE 1501
Performance records were edited to eliminate obser-vations from all twin-born calves and observationswith questionable weaning or yearling weigh datesand ages. Records on file were used to resolveirregularities in a small number of American HerefordAssociation pedigree and performance records. Allacceptable performance records were used in across-herd analyses. Each within-herd analysis consideredperformance records only from that herd.
Analyses. To quantify the degree of relationshipamong the four herds, estimates of the geneticrelationships among herds were derived by calculatingwhat the average inbreeding coefficient would havebeen among hypothetical progeny resulting fromdrawing a random sample of 500 individuals from oneherd randomly mated to a similarly drawn samplefrom another herd. This random sampling and matingprocess was repeated for each pair of herds.
Birth weight ( BWT) , weaning weight ( WWT) andadjusted 160-d postweaning gain ( PWG) were consi-dered in separate within- and across-herd analyses toestimate genetic and environmental variances andpredict individual breeding values. Variations of thefollowing model were used:
y = Xb + Zdud + Zmum + Zpeupe + e
with an assumed (co)variance structure of:
Var =
udumupee
Asd2
Asdm00
AsdmAsm
2
00
00Ipespe
2
0
,
000Iese
2
where y is a vector of observations, X is a matrixrelating a vector of fixed effects ( b) to y, Zd is anincidence matrix relating random direct additivegenetic effects ( ud) to y, Zm relates random maternaladditive genetic effects ( um) to y, Zpe relates randommaternal permanent environmental ( upe) effects to y,and e is a vector of random residual effects; A is thenumerator relationship matrix among individuals, Ipe
and Ie are identity matrices; and are,sd2 ,sm
2 ,spe2 se
2
direct additive genetic, maternal additive genetic,maternal permanent environmental, and residualvariances, respectively; and is the covariancesdmbetween direct and maternal additive genetic effects.The model for PWG did not include terms for maternaladditive or permanent environmental effects. Previousanalysis of Line 1 data indicated that maternaladditive and permanent environmental effects onPWG were not important (Tess and MacNeil, 1994).
The set of fixed effects considered in within-herdBWT analyses contained class effects of sex, age ofdam, and contemporary group ( CG) and linear effectsof inbreeding of calf (Fc) and dam (Fd) . Within-herdWWT analyses included these effects as well as thelinear effect of age of calf. Fixed effects in within-herd
PWG analyses were Fc and CG. Birth weight CG weredefined by birth year, WWT CG by birth year andweaning weigh date, and PWG CG by sex, birth year,weaning weigh date, and yearling weigh date. Age ofdam classes were 2, 3, 4, 5 to 9, and greater than 9 yr.
Variations of these sets of fixed effects wereconsidered in across-herd BWT, WWT, and PWGanalyses. Model 1 included within-herd effects of sex,age of dam, age of calf, Fc and Fd. Model 2 consideredsex, age of dam, age of calf, and inbreeding effectspooled across herds. To determine the importance ofaccounting for effects of inbreeding in these geneticevaluations (Casanova et al., 1991), Model 3 alsoconsidered pooled sex, age of dam, and age of calf butignored inbreeding. In these across-herd analyses,herd was included in definition of CG.
Two additional models were evaluated in across-herd analyses of adjusted weaning weight ( AWW) ,with a priori adjustments for sex, age of calf, and ageof dam (American Hereford Association, 1992) ap-plied to weaning weight observations. Fixed effects forModel 4 AWW analysis were CG, Fc, and Fd. Model 5AWW analysis included CG as the only fixed effect.Contemporary groups for AWW analyses were herd,birth year, weaning weigh date, and sex combinations.Effects considered by these models are listed in Table2.
Estimates of genetic and environmental variancewere computed using MTDFREML (Boldman et al.,1993). Variance components for BWT, WWT, andPWG were estimated in within-herd analyses of eachherd. Across-herd variance component analyses ofBWT, WWT, and PWG were conducted with Models 1,2, and 3. Likelihood ratio tests (e.g., Visscher et al.,1991) were conducted to test for differences betweeneach set of within-herd parameter estimates and theacross-herd set of parameters estimated with Model 1.These tests compared log-likelihoods of within-herdanalyses using within-herd parameter estimates withwithin-herd analyses using Model 1 parameter esti-mates. Variance components were not estimated withModels 4 or 5, used to analyze AWW.
Predictions of individual genetic merit were com-puted using the Animal Breeder’s Toolkit (ABTK;Golden et al., 1992) to assemble and solve mixedmodel equations (Henderson, 1973). These within-and across-herd analyses used variance componentestimates from the corresponding REML analyses.The Model 4 AWW analysis, with inbreeding regres-sions, used Model 2 WWT variance component esti-mates, and the Model 5 AWW analysis, withoutinbreeding, used the Model 3 WWT estimates. Ex-pected progeny differences computed in these analyseswere compared with EPD from the fall 1994 AHANCE. Comparisons were based on product-momentcorrelations between sets of within-herd, across-herd,and NCE EPD and genetic trends predicted by thesesets of EPD. The NCE used records of animalsenrolled in the AHA Total Performance Records
by guest on July 13, 2011jas.fass.orgDownloaded from

SNELLING ET AL.1502
Table 2. Effectsa included in models used for within- and across-herd analyses
aFc = inbreeding of calf; Fd = inbreeding of dam; AOD = age of dam (yr classes); CG = contemporary group (defined in text); ud = additivedirect effect; um = additive maternal effect; upe = permanent environmental effect; AOC = age of calf (d) .
bWeaning weight adjusted for AOC and sex × AOD according to American Hereford Association (1992) procedures.
Model Linear effects Class effects Random effects
Within-herdBirth weight Fc, Fd Sex, AOD, CG ud, um, upeWeaning weight Fc, Fd, AOC Sex, AOD, CG ud, um, upePostweaning gain Fc CG ud
Across-herdModel 1
Birth weight Herd × (Fc, Fd) Herd × (sex, AOD), CG ud, um, upeWeaning weight Herd × (Fc, Fd, AOC) Herd × (sex, AOD), CG ud, um, upePostweaning gain Herd × Fc CG ud
Model 2Birth weight Fc, Fd Sex, AOD, CG ud, um, upeWeaning weight Fc, Fd, AOC Sex, AOD, CG ud, um, upePostweaning gain Fc CG ud
Model 3Birth weight Sex, AOD, CG ud, um, upeWeaning weight AOC Sex, AOD, CG ud, um, upePostweaning gain CG ud
Model 4Adjusted weaning weightb Fc, Fd CG ud, um, upe
Model 5Adjusted weaning weightb CG ud, um, upe
program since 1973 with EPD calculated using areduced animal model (Quaas and Pollak, 1980).
Comparisons of EPD were made with animalsjointly represented in national, within-herd, andacross-herd evaluations. This excluded animals bornbefore 1973 not represented in the NCE and thoseborn since 1991 not included in within- and across-herd evaluations. For a specific herd, comparisons ofwithin-herd, across-herd, and NCE EPD included onlyanimals registered to that herd. The EPD comparisonsincluded direct BWT, direct and maternal WWT, andPWG.
Results and Discussion
The four herds considered in this study differed inraw means for BWT, WWT, and PWG (Figure 1) andlevel of inbreeding (Figure 2). Birth weights in FKand HV were similar until the late 1980s and wereless than in HH and CH. In the last years of data thefour herds became more distinct, with FK having thelightest BWT, followed by HV, HH, and CH. A similarpattern was observed with WWT, although ranks ofCH and HH were reversed. Phenotypic PWG trendsshowed less distinction among the herds, although HVconsistently had the lowest mean PWG.
After formation of Line 1, inbreeding in FKaccumulated rapidly due to mating close relatives(MacNeil et al., 1992). Since 1945, inbreeding in FKincreased at a rate of .21%/yr. Inbreeding in the FKand HV herds was similar until the start of an
outcrossing experiment at HV. The average inbreedingcoefficient of HV calves was reduced to a level similarto that of HH and CH by the introduction of outsidesires. Inbreeding levels in HH and CH remained about15% less than in FK.
Estimates of the mean genetic relationship betweenherds (Table 3) ranged from .24 (CH and HH) to .44(FK and HV). These between-herd relationshipsimply inbreeding levels of 12 to 22% would result fromrandom mating of animals from the separate herds.Considering that these herds originated from essen-tially the same genetic stock and that pseudo-cross-herd matings indicate a relatively high degree ofrelationship among these herds, the herds might beconsidered four environmentally distinct instances ofthe same genetic population. As such, homogeneity ofgenetic (co)variances might be anticipated with anypotential heterogeneity of variance arising due toenvironmental differences.
Variance Components. Within-herd variance compo-nent and parameter estimates were not the sameacross herds and did not seem related to level ofphenotypic performance (Table 4). Likelihood ratiotests comparing each set of within-herd parameterestimates with Model 1 parameter estimates indicateddifferences in sets of parameters. Except for BWT inHV and PWG in FK, all sets of within-herd parameterestimates were different from across-herd Model 1parameter estimates ( P < .05). Given the apparentlack of relationship between phenotypic performanceand variance component estimates, procedures toaccount for heterogenous phenotypic variances
by guest on July 13, 2011jas.fass.orgDownloaded from

GENETIC EVALUATIONS OF LINEBRED CATTLE 1503
Table 3. Estimates of mean genetic relationships among randomly selectedindividuals from different herds
aFK = Fort Keogh Livestock and Range Research Laboratory, Miles City, MT; HV = MontanaAgricultural Experiment Station, Havre; CH = Cooper Hereford Ranch, Willow Creek, MT; HH = HoldenHerefords, Valier, MT.
Herd
Herda n HV CH HH
FK 5,391 .438 ± .082 .313 ± .073 .265 ± .092HV 1,660 .321 ± .070 .278 ± .102CH 2,416 .236 ± .076HH 2,785
Table 4. Variance component and parameter estimates from within-herd, across-herd andAmerican Hereford Association national cattle evaluations (NCE)
a = direct additive genetic variance; = maternal additive genetic variance; = covariance of direct and maternal additive,kg2 sd2 sm
2 sdm
genetic effects; = permanent environmental variance due to dams; and = residual variance.spe2 se
2
b = + + + + = = = =sp2 sd
2 sm2 sdm spe
2 ;se2 h2 / ;sd
2 sp2 m2 / ;sm
2 sp2 rdm / ; andsdm √sd
2sm2 c2 / .spe
2 sp2
cAcross-herd analysis with herd-specific sex, age of dam and inbreeding effects.dAcross-herd analysis with sex, age of dam and inbreeding effects pooled across herds.eAcross-herd analysis with sex and age of dam effects pooled across herds and inbreeding ignored by model.*−2 (difference in log-likelihood) of within-herd analysis using within-herd parameter estimates and within-herd analysis using across-
herd (Model 1) parameter estimates significant at P < .05.
(Co)variance componentsa Parameter estimatesb
Trait Herd sd2 sm
2 sdm spe2 se
2h2 m2 rdm c2
Birth weightFK* 6.3 2.9 .6 .2 11.1 .30 .14 .13 .01HV 11.6 2.8 .2 .7 7.4 .51 .12 .04 .03CH* 8.9 .4 −.3 1.5 5.6 .55 .03 −.14 .09HH* 8.1 2.2 .1 .3 5.3 .50 .14 .03 .02M1c 7.0 2.4 .4 .5 9.4 .36 .12 .09 .03M2d 6.7 2.5 .5 .5 9.5 .34 .13 .12 .02M3e 7.0 2.5 .4 .5 9.5 .35 .12 .10 .03NCE 6.3 2.3 −1.1 .5 5.2 .49 .18 −.27 .04
Weaning weightFK* 85.5 113.3 −7.8 68.5 231.3 .17 .23 −.08 .14HV* 103.7 56.7 10.1 137.7 216.9 .20 .11 .13 .26CH* 124.2 110.8 −26.3 64.8 395.2 .19 .17 −.22 .10HH* 160.3 111.5 −25.2 113.2 174.1 .30 .21 −.19 .21M1 133.6 103.6 −16.5 89.7 238.5 .24 .19 −.14 .16M2 136.5 115.2 −19.4 83.8 294.9 .22 .19 −.15 .14M3 113.0 118.7 −20.7 85.6 297.7 .22 .19 −.16 .14
NCE 123.5 119.8 −34.1 11.8 288.3 .24 .23 −.28 .02
Postweaning gainFK 77.7 — — — 241.4 .24 — — —
HV* 176.2 — — — 190.1 .48 — — —CH* 125.5 — — — 257.0 .33 — — —HH* 94.8 — — — 196.6 .33 — — —M1 99.1 — — — 232.8 .30 — — —M2 98.1 — — — 233.5 .30 — — —M3 97.0 — — — 235.6 .29 — — —
NCE 85.6 — — — 276.6 .24 — — —
(Brotherstone and Hill, 1986; Visscher et al., 1991;Weigel and Gianola, 1993) or heterogenous geneticand environmental variances due to scaling (Quaas etal., 1989) may not be adequate. Application of morecomputationally intense methods to allow heter-ogenous variances (Gianola et al., 1992; Weigel and
Gianola, 1992; San Cristobal et al., 1993) may bewarranted, but feasibility of these methods with largedata sets and multi-component models is limited. Also,reliability of simultaneously estimated within-herdvariance components is restricted by limited data(Winkelman and Schaeffer, 1988).
by guest on July 13, 2011jas.fass.orgDownloaded from

SNELLING ET AL.1504
Figure 1. Means by birth year for birth weight,weaning weight, and postweaning gain for four MilesCity Line 1 Hereford herds.
Figure 2. Mean inbreeding coefficients by birth yearof four Miles City Line 1 Hereford herds.
Variance components estimated from the across-herd analyses with Models 1, 2, and 3 were similar.Model 1, with herd-specific class effects and linearregressions, resulted in the numerically smallestestimates of and rdm estimates closest to zero. The,se
2
slight differences among estimates obtained with thedifferent models are not likely to be important.
There was general agreement between across-herdand NCE estimates of direct and maternal additive
genetic variances, although some discrepancy in esti-mates of direct-maternal covariances, maternal per-manent environmental variances, and environmentalvariance were found (Table 4). The most notabledifferences between across-herd Model 3 estimatesand NCE estimates were for BWT sdm (.4 vs −1.1kg2) , BWT (9.5 vs 5.2 kg2) , and WWT (85.6 vsse
2 spe2
11.8 kg2) .Fixed effects. Best linear unbiased estimates
( BLUE) of inbreeding, sex, and age of dam effectsobtained with Model 2 for within-herd and across-herdanalyses are presented in Table 5. Adjustment factorscalculated from AHA (1992) regression equations arealso presented for comparison. Herd-specific effectsestimated with Model 1 for across-herd analyses wereessentially the same as from within-herd analyses.Pooled estimates of sex, age of dam, and age of calfeffects were not influenced by ignoring inbreeding inModel 3. For all herds but CH, BWT analyses indicateinbreeding depression due to Fc ( P < .05) but not Fd.This is consistent with results of MacNeil et al.(1992), who used a subset of the FK data included inthis study. In contrast to MacNeil et al. (1992), whofound an insignificant regression for Fc on preweaningdaily gain, both Fc and Fd regressions for WWT weresignificant in FK ( P < .01). This study included 571WWT records of calves in a subline selected forincreased YWT with below-average BWT that werenot used by MacNeil et al. (1992). Also, MacNeil et al.(1992) reported results for preweaning daily gain,which did not include BWT, whereas WWT includesBWT and preweaning gain. Brinks and Knapp (1975)also reported significant Fc and Fd effects on WWT ofFK male calves, with the magnitude of the Fdregression greater than that for Fc. Regressions of Fcon WWT were important in all herds and in thecombined analysis, but Fd regressions were important
by guest on July 13, 2011jas.fass.orgDownloaded from
GENETIC EVALUATIONS OF LINEBRED CATTLE 1505
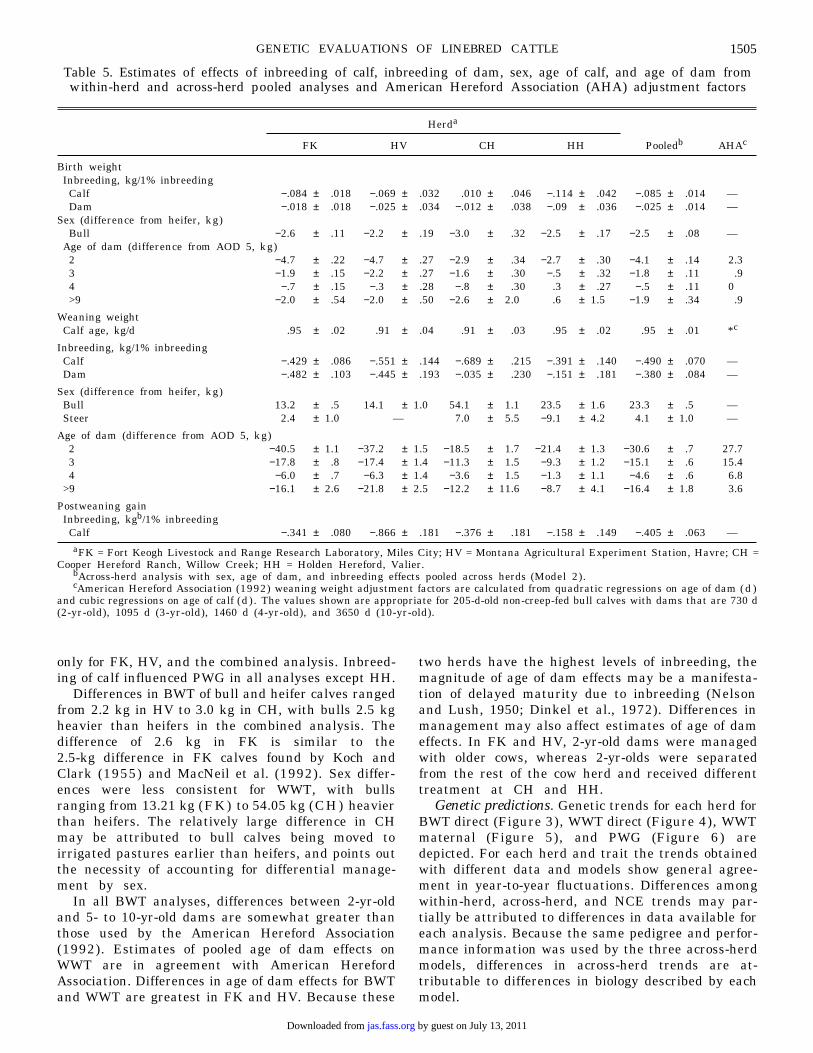
Table 5. Estimates of effects of inbreeding of calf, inbreeding of dam, sex, age of calf, and age of dam fromwithin-herd and across-herd pooled analyses and American Hereford Association (AHA) adjustment factors
aFK = Fort Keogh Livestock and Range Research Laboratory, Miles City; HV = Montana Agricultural Experiment Station, Havre; CH =Cooper Hereford Ranch, Willow Creek; HH = Holden Hereford, Valier.
bAcross-herd analysis with sex, age of dam, and inbreeding effects pooled across herds (Model 2).cAmerican Hereford Association (1992) weaning weight adjustment factors are calculated from quadratic regressions on age of dam ( d )
and cubic regressions on age of calf (d) . The values shown are appropriate for 205-d-old non-creep-fed bull calves with dams that are 730 d(2-yr-old), 1095 d (3-yr-old), 1460 d (4-yr-old), and 3650 d (10-yr-old).
Herda
FK HV CH HH Pooledb AHAc
Birth weightInbreeding, kg/1% inbreeding
Calf −.084 ± .018 −.069 ± .032 .010 ± .046 −.114 ± .042 −.085 ± .014 —Dam −.018 ± .018 −.025 ± .034 −.012 ± .038 −.09 ± .036 −.025 ± .014 —
Sex (difference from heifer, kg)Bull −2.6 ± .11 −2.2 ± .19 −3.0 ± .32 −2.5 ± .17 −2.5 ± .08 —
Age of dam (difference from AOD 5, kg)2 −4.7 ± .22 −4.7 ± .27 −2.9 ± .34 −2.7 ± .30 −4.1 ± .14 2.33 −1.9 ± .15 −2.2 ± .27 −1.6 ± .30 −.5 ± .32 −1.8 ± .11 .94 −.7 ± .15 −.3 ± .28 −.8 ± .30 .3 ± .27 −.5 ± .11 0>9 −2.0 ± .54 −2.0 ± .50 −2.6 ± 2.0 .6 ± 1.5 −1.9 ± .34 .9
Weaning weightCalf age, kg/d .95 ± .02 .91 ± .04 .91 ± .03 .95 ± .02 .95 ± .01 *c
Inbreeding, kg/1% inbreedingCalf −.429 ± .086 −.551 ± .144 −.689 ± .215 −.391 ± .140 −.490 ± .070 —Dam −.482 ± .103 −.445 ± .193 −.035 ± .230 −.151 ± .181 −.380 ± .084 —
Sex (difference from heifer, kg)Bull 13.2 ± .5 14.1 ± 1.0 54.1 ± 1.1 23.5 ± 1.6 23.3 ± .5 —Steer 2.4 ± 1.0 — 7.0 ± 5.5 −9.1 ± 4.2 4.1 ± 1.0 —
Age of dam (difference from AOD 5, kg)2 −40.5 ± 1.1 −37.2 ± 1.5 −18.5 ± 1.7 −21.4 ± 1.3 −30.6 ± .7 27.73 −17.8 ± .8 −17.4 ± 1.4 −11.3 ± 1.5 −9.3 ± 1.2 −15.1 ± .6 15.44 −6.0 ± .7 −6.3 ± 1.4 −3.6 ± 1.5 −1.3 ± 1.1 −4.6 ± .6 6.8
>9 −16.1 ± 2.6 −21.8 ± 2.5 −12.2 ± 11.6 −8.7 ± 4.1 −16.4 ± 1.8 3.6
Postweaning gainInbreeding, kgb/1% inbreedingCalf −.341 ± .080 −.866 ± .181 −.376 ± .181 −.158 ± .149 −.405 ± .063 —
only for FK, HV, and the combined analysis. Inbreed-ing of calf influenced PWG in all analyses except HH.
Differences in BWT of bull and heifer calves rangedfrom 2.2 kg in HV to 3.0 kg in CH, with bulls 2.5 kgheavier than heifers in the combined analysis. Thedifference of 2.6 kg in FK is similar to the2.5-kg difference in FK calves found by Koch andClark (1955) and MacNeil et al. (1992). Sex differ-ences were less consistent for WWT, with bullsranging from 13.21 kg (FK) to 54.05 kg (CH) heavierthan heifers. The relatively large difference in CHmay be attributed to bull calves being moved toirrigated pastures earlier than heifers, and points outthe necessity of accounting for differential manage-ment by sex.
In all BWT analyses, differences between 2-yr-oldand 5- to 10-yr-old dams are somewhat greater thanthose used by the American Hereford Association(1992). Estimates of pooled age of dam effects onWWT are in agreement with American HerefordAssociation. Differences in age of dam effects for BWTand WWT are greatest in FK and HV. Because these
two herds have the highest levels of inbreeding, themagnitude of age of dam effects may be a manifesta-tion of delayed maturity due to inbreeding (Nelsonand Lush, 1950; Dinkel et al., 1972). Differences inmanagement may also affect estimates of age of dameffects. In FK and HV, 2-yr-old dams were managedwith older cows, whereas 2-yr-olds were separatedfrom the rest of the cow herd and received differenttreatment at CH and HH.
Genetic predictions. Genetic trends for each herd forBWT direct (Figure 3), WWT direct (Figure 4), WWTmaternal (Figure 5), and PWG (Figure 6) aredepicted. For each herd and trait the trends obtainedwith different data and models show general agree-ment in year-to-year fluctuations. Differences amongwithin-herd, across-herd, and NCE trends may par-tially be attributed to differences in data available foreach analysis. Because the same pedigree and perfor-mance information was used by the three across-herdmodels, differences in across-herd trends are at-tributable to differences in biology described by eachmodel.
by guest on July 13, 2011jas.fass.orgDownloaded from

SNELLING ET AL.1506
Figure 3. Genetic trends for birth weight for four Miles City Line 1 Hereford herds estimated from within-herd,across-herd, and national cattle evaluations.
Table 6. Correlations among across-herd and national cattle evaluation direct andmaternal weaning weight expected progeny difference
aM1 = across-herd analysis with herd-specific sex, age of dam and inbreeding effects; M2 = across-herdanalysis with sex, age of dam and inbreeding effects pooled across herds; M3 = across-herd analysis withsex and age of dam effects pooled across herds and inbreeding ignored; M4 = across-herd analysis withAHA-recommended a priori adjustments to weaning weight and inbreeding included in model; M5 =across-herd analysis with AHA-recommended a priori adjustments to weaning weight and inbreedingignored.
Analysis
Effect Analysisa M2 M3 M4 M5 NCE
Weaning weight direct effectM1 .936 .864 .963 .859 .671M2 .958 .945 .872 .660M3 .894 .932 .682M4 .924 .700M5 .725
Weaning weight maternal effectM1 .952 .915 .923 .870 .684M2 .967 .946 .899 .690M3 .892 .953 .743M4 .915 .692M5 .781
by guest on July 13, 2011jas.fass.orgDownloaded from

GENETIC EVALUATIONS OF LINEBRED CATTLE 1507
Figure 4. Direct genetic trends for weaning weight for four Miles City Line 1 Hereford herds estimated fromwithin-herd, across-herd, and national cattle evaluations.
Comparison of across-herd trends suggests adjust-ment for inbreeding affects genetic evaluations. Fordirect and maternal WWT and PWG, rates of increasein genetic trends estimated from evaluations thatdisregarded inbreeding (Model 3) were less thanincreases estimated from Model 2, which includedinbreeding. Consideration of pooled or herd-specificfixed effects had no influence on PWG trends but didaffect estimated gains in direct BWT and direct andmaternal WWT trends. Analysis with fixed effectspooled across herds resulted in faster estimated ratesof increase in direct and maternal WWT for FK andHV, but slower estimated change in direct andmaternal WWT for CH and HH.
Product-moment correlations between Model 1 andwithin-herd EPD ranged from .89 for maternal WWTat HH to .99 for direct BWT at FK. In contrast,correlations between Model 1 and NCE EPD rangedfrom .67 for direct WWT to .79 for direct BWT. Model3 EPD, with pooled fixed effects and inbreedingignored, were more highly correlated with NCE EPD
than across-herd EPD obtained with inbreeding ac-counted for by direct and maternal regressions.
For weaning weight, correspondence of within-herdto across-herd evaluations was consistently greatestwith Model 1, which included herd-specific fixedeffects. As indicated by Table 6, EPD from models thatincluded inbreeding (Models 2 and 4) showed greateragreement with the herd-specific model (Model 1)than corresponding models that ignored inbreeding(Models 3 and 5). Correlations between NCE EPDand across-herd direct and maternal EPD for WWT(Models 1, 2, and 3) or AWW (Models 4 and 5)increased with resemblance of analytical procedures toNCE procedures. Predictions from models that ignoredinbreeding (Models 3 and 5) agreed most with NCEEPD, with the most pronounced differences observedin maternal EPD. The highest correlations with NCEEPD were obtained with Model 5, which was mostsimilar to NCE procedures due to omission of inbreed-ing effects and use of a priori AHA adjustments toweaning weight. These correlations suggest that if
by guest on July 13, 2011jas.fass.orgDownloaded from

SNELLING ET AL.1508
Figure 5. Maternal genetic trends for weaning weight for four Miles City Line 1 Hereford herds estimated fromwithin-herd, across-herd, and national cattle evaluations.
predictions from the herd-specific model (Model 1)most accurately represent true breeding values,predictions from less highly specified models will beless accurate. Genetic progress with selection based onthe less accurate predictions, including NCE EPD,may be slower than that possible using more accuratepredictions from models with more highly specifiedfixed effects.
General discussion. Results of this study suggestimportant herd differences in effects of common fixedfactors and the possibility of heterogenous genetic andenvironmental variances, even with high geneticrelationships between herds. Methods used to dealwith these differences have a substantial impact onpredictions of genetic merit. Within-herd evaluation isfeasible to allow a high degree of detail in specificationof fixed effects and variance components, but utilitymay be limited to selection of replacement animalsfrom within that herd. Without information from othersources, within-herd evaluations have little value tocompare and select animals from different herds.
Across-herd evaluations, particularly NCE, providebasis for selection among different herds. Methodscurrently used by NCE may not adequately addressadjustments for management and environmental fac-tors unique to an individual herd. This may result inunfair evaluations of animals in some herds, relativeto other herds. A priori adjustments do not considerinteractions with environment, and procedures used toobtain data from breeders may limit the ability ofNCE to address some management factors. Manage-ment codes on reporting forms may not be sufficientlyflexible to allow formation of appropriate contem-porary groups. Even when designation of calvesmanaged alike is possible, breeders may overlook or beunaware of the need to specify appropriate manage-ment groups. The effects of inbreeding on animalperformance should also be considered in geneticevaluation, especially in NCE of breeds with levels ofinbreeding that might result from extensive use oflinebreeding by some breeders.
Because fully addressing differences in individualherds with NCE is not likely to become feasible,
by guest on July 13, 2011jas.fass.orgDownloaded from

GENETIC EVALUATIONS OF LINEBRED CATTLE 1509
Figure 6. Genetic trends for postweaning gain for four Miles City Line 1 Hereford herds estimated from within-herd, across-herd, and national cattle evaluations.
exploration of within-herd analysis methods thatincorporate information from outside sources is sug-gested. Henderson (1975) and Slanger et al. (1976)described an approach to incorporate AI sire evalua-tions into intraherd genetic predictions for dairy cows.Analagous methodology may be useful with beef cattleto incorporate NCE results into within-herd analysesto more reliably predict progeny performance subjectto the unique management and environment ofindividual herds.
Implications
Even with the inability of current national cattleevaluation to address uniqueness of individual herds,those expected progeny differences are the mostreliable tool available to compare and select animalsfrom different herds. National cattle evaluations maybe improved by allowing for within-herd differences ineffects of factors such as sex, age of dam, andinbreeding. Within-herd genetic evaluations do not
include enough information to be reliable for selectionoutside that herd. Further research to developmethods that incorporate results of national cattleevaluation into within-herd analyses to obtain ex-pected progeny differences that are more applicable tothat herd is suggested.
Literature Cited
American Hereford Association. 1992. Total performance recordshandbook. American Hereford Association, Kansas City, MO.
Anderson, D. C., D. D. Kress, and D. E. Doornbos. 1991. Genetictrend in Herefords using estimated progeny difference. Proc.W. Sec. Am. Soc. Anim. Sci. 42:98.
Anderson, D. C., D. D. Kress, D. E. Doornbos, K. J. Hanford, and A.C. Linton. 1985. Genetic trend beef cattle selected for greateryearling weight and moderate birth weight. Proc. W. Sec. Am.Soc. Anim. Sci. 36:43.
Boldman, K. G., L. A. Kriese, L. D. Van Vleck, and S. D. Kachman.1993. A manual for use of MTDFREML. A set of programs toobtain estimates of variances and covariances [Draft]. ARS,USDA.
Brinks, J. S., R. T. Clark, and N. M. Kieffer. 1965. Evaluation ofresponse to selection and inbreeding in a closed line of Herefordcattle. Tech. Bull. 1323. ARS, USDA, Washington, DC.
by guest on July 13, 2011jas.fass.orgDownloaded from

SNELLING ET AL.1510
Brinks, J. S., and B. W. Knapp. 1975. Effects of inbreeding onperformance traits of beef cattle in the western region. Tech.Bull. 123. Colorado State Univ. Exp. Sta., Fort Collins.
Brotherstone, S., and W. G. Hill. 1986. Heterogeneity of varianceamongst herds for milk production. Anim. Prod. 42:297.
Casanova, L., C. Hagger, N. Kuenzi, and M. Schneeberger. 1991.Inbreeding in Swiss Braunveih and its influence on breedingvalues predicted from a repeatability animal model. J. DairySci. 75:1119.
Dickerson, G. E., N. Kunzi, L. V. Cundiff, R. M. Koch, V. H.Arthaud, and K. E. Gregory. 1974. Selection criteria for effi-cient beef production. J. Anim. Sci. 39:659.
Dinkel, C. A., L. M. Anderson, W. R. Parker, and W. R. Trevillyan.1972. Effects of inbreeding on fertility and livability in beefcattle. J. Anim. Sci. 35:725.
Gianola, D., J. L. Foulley, R. L. Fernando, C. R. Henderson, and K.A. Weigel. 1992. Estimation of heterogenous variances usingempirical Bayes methods: Theoretical considerations. J. DairySci. 75:2805.
Golden, B. L., W. M. Snelling, and C. H. Mallinckrodt. 1992. AnimalBreeders’ Tool Kit User’s Guide and Reference Manual.Colorado State Univ. Agric. Exp. Sta. Tech. Bull. LTB92-2, FortCollins.
Henderson, C. R. 1973. Sire evaluation and genetic trends. In: Proc.of the Anim. Breed. and Genet. Symp. in Honor of Dr. J. L.Lush. p 10. ASAS and ADSA, Champaign, IL.
Henderson, C. R. 1975. Use of all relatives in intraherd prediction ofbreeding values and producing abilities. J. Dairy Sci. 58:1910.
Knapp, B., R. C. Church, and A. E. Flower. 1951. Genetic history ofLine 1 Hereford cattle at the United States Range LivestockExperiment Station, Miles City Montana. Bull. 479. MontanaState College, Agric. Exp. Sta., Bozeman.
Koch, R. M., and R. T. Clark. 1955. Influence of sex, season of birthand age of dam on economic traits in range beef cattle. J. Anim.Sci. 14:386.
MacNeil, M. D., J. J. Urick, S. Newman, and B. W. Knapp. 1992.Selection for postweaning growth in inbred Hereford Cattle:The Fort Keogh, Montana Line 1 example. J. Anim. Sci. 70:723.
Nelson, R. H., and J. L. Lush. 1950. The effects of mild inbreedingon a herd of Holstein-Friesan cattle. J. Dairy Sci. 33:186.
Quaas, R. L., D. J. Garrick, and W. H. McElhenney. 1989. Multipletrait prediction for a type of model with heterogenous geneticand residual covariance structures. J. Anim. Sci. 67:2529.
Quaas, R. L., and E. J. Pollak. 1980. Mixed model methodology forfarm and ranch beef cattle testing programs. J. Anim. Sci. 51:1277.
San Cristobal, M., J. L. Foulley, and E. Manfredi. 1993. Inferenceabout multiplicative heteroscedastic components of variance ina mixed linear Gaussian model with an application to beefcattle breeding. Genet. Sel. Evol. 25:3.
Slanger, W. D., E. L. Jensen, R. W. Everett, and C. R. Henderson.1976. Programming cow evaluation. J. Dairy Sci. 59:1589.
Tess, M. W., and M. D. MacNeil. 1994. Evaluation of cytoplasmicgenetic effects in Miles City Line 1 Hereford cattle. J. Anim.Sci. 72:851.
Urick, J. J., J. S. Brinks, R. T. Clark, O. F. Pahnish, and F. S.Willson. 1966. History and performance of inbred lines ofHereford cattle developed at the U. S. Range Livestock Experi-ment Station. Bull. 602. Montana Agric. Exp. Sta., Bozeman.
Visscher, P. M., R. Thompson, and W. G. Hill. 1991. Estimation ofgenetic and environmental variances for fat yield in individualherds and an investigation into heterogeneity of variance be-tween herds. Livest. Prod. Sci. 28:273.
Weigel, K. A., and D. Gianola. 1992. Estimation of heterogenouswithin-herd variance components using empirical Bayesmethods: A simulation study. J. Dairy Sci. 75:2824.
Weigel, K. A., and D. Gianola. 1993. A computationally simpleBayesian method for estimation of heterogenous within-herdphenotypic variances. J. Dairy Sci. 76:1455.
Winkelman, A., and L. R. Schaeffer. 1988. Effect of heterogeneity ofvariance in dairy sire evaluation. J. Dairy Sci. 71:3033.
by guest on July 13, 2011jas.fass.orgDownloaded from

Citationshttp://jas.fass.org/content/74/7/1499#otherarticlesThis article has been cited by 3 HighWire-hosted articles:
by guest on July 13, 2011jas.fass.orgDownloaded from