Factors associated with low water intake among South Korean adolescents - Korea National Health and...
7
Factors Associated with Low Water Intake among US High School Students—National Youth Physical Activity and Nutrition Study, 2010 Sohyun Park, PhD; Heidi M. Blanck, PhD; Bettylou Sherry, PhD; Nancy Brener, PhD; Terrence O’Toole, PhD S UGAR-SWEETENED BEVERAGES (SSBs) ARE THE largest source of added sugar and an important contributor of energy in the diet of US youth. 1 Consumption of SSBs has been associated with obesity, 2-5 dental caries, 6 type 2 diabetes, 7 poor mental health, 8,9 poor academic grades, 10 and displacement of nutrient-rich foods. 11,12 In contrast, drinking plain water instead of SSBs is one approach for indi- viduals trying to reduce dietary energy intake and thereby possibly benefit obesity prevention and control. 13-15 Hence, consuming water as part of a healthy diet (eg, one that con- tains fruits, vegetables, whole grains, low-fat/reduced fat dairy, and lean meats) can aid weight management 13-16 and, if substituted for SSB consumption, also possibly avert the ad- verse consequences associated with SSB intake such as dental caries, 6 and avoid risks from high levels of SSBs such as devel- oping obesity 2-5 and type 2 diabetes. 7 One approach for promoting water intake is to make free potable drinking water widely accessible in public facilities, including schools. For example, previous school-based inter- vention studies have shown that increasing access to drinking water in schools increased water intake among students 13,17 and in one study decreased their risk for obesity among stu- dents. 13 In fact, the US Department of Agriculture requires schools participating in the National School Lunch Program as of fall 2011 to make free potable water available to students where meals are served. 18 The adequate intake (AI) level for water in any form (water, beverages other than water, and solid foods) was established by the Institute of Medicine as a guide for preventing adverse effects of dehydration rather than for decreasing risks for chronic diseases. 19 Specific AI levels vary by sex and age. For boys aged 14 to 18 years, the AI levels for total water are 3.3 L/day including 2.6 L (11 c) as beverages. For girls aged 14 to 18 years, the AI levels for total water are 2.3 L/day including 1.8 L (8 c) as beverages. People who are physically active or living in hot climates require even more water. 19 Based on the 2005-2008 National Health and Nutrition Examination Sur- vey (NHANES), mean plain water intake (tap and bottled) among US youth (aged 12 to 19 years) was 3.6 c for boys and 3.1 c for girls. 20 Another study reported that plain water was most commonly consumed beverage among US high school students and 72.4% reported drinking a bottle/glass of water at least one time per day. 21 Despite the importance of drinking water as a healthful al- ternative for SSBs, plain water intake has received little re- search attention as an approach to improve diet quality. One ABSTRACT Drinking plain water instead of sugar-sweetened beverages is one approach for reducing energy intake. Only a few studies have examined characteristics associated with plain water intake among US youth. The purpose of our cross-sectional study was to examine associations of demographic characteristics, weight status, dietary habits, and other behavior-related factors with plain water intake among a nationally representative sample of US high school students. The 2010 National Youth Physical Activity and Nu- trition Study data for 11,049 students in grades 9 through 12 were used. Multivariable logistic regression analysis was used to calculate adjusted odds ratios (ORs) and 95% CIs for variables associated with low water intake (3 times/day). Nationwide, 54% of high school students reported drinking water 3 times/day. Variables significantly associ- ated with a greater odds for low water intake were age 15 years (OR 1.1), consuming 2 glasses/day of milk (OR 1.5), nondiet soda 1 time/day (OR 1.6), other sugar-sweet- ened beverages 1 time/day (OR 1.4), fruits and 100% fruit juice 2 times/day (OR 1.7), vegetables 3 times/day (OR 2.3), eating at fast-food restaurants 1 to 2 days/week and 3 days/week (OR 1.3 and OR 1.4, respectively), and being physically active 60 min- utes/day on 5 days/week (OR 1.6). Being obese was significantly associated with re- duced odds for low water intake (OR 0.7). The findings of these significant associations of low water intake with poor diet quality, frequent fast-food restaurant use, and physical inactivity may be used to tailor intervention efforts to increase plain water intake as a substitute for sugar-sweetened beverages and to promote healthy lifestyles. J Acad Nutr Diet. 2012;112:1421-1427. ARTICLE INFORMATION Article history: Accepted 6 April 2012 Available online 28 June 2012 Keywords: Drinking water Dietary intake Adolescents Sugar-sweetened beverages Television Published by Elsevier Inc. on behalf of the Academy of Nutrition and Dietetics. 2212-2672/$0.00 doi: 10.1016/j.jand.2012.04.014 RESEARCH Research and Professional Briefs JOURNAL OF THE ACADEMY OF NUTRITION AND DIETETICS 1421
-
Upload
independent -
Category
Documents
-
view
0 -
download
0
Transcript of Factors associated with low water intake among South Korean adolescents - Korea National Health and...

RESEARCHResearch and Professional Briefs
Factors Associated with Low Water Intake amongUS High School Students—National Youth PhysicalActivity and Nutrition Study, 2010Sohyun Park, PhD; Heidi M. Blanck, PhD; Bettylou Sherry, PhD; Nancy Brener, PhD; Terrence O’Toole, PhD
ABSTRACTDrinkingplainwater insteadof sugar-sweetenedbeverages is one approach for reducingenergy intake. Only a few studies have examined characteristics associated with plainwater intake among US youth. The purpose of our cross-sectional study was to examineassociations of demographic characteristics, weight status, dietary habits, and otherbehavior-related factors with plain water intake among a nationally representativesample of US high school students. The 2010 National Youth Physical Activity and Nu-trition Study data for 11,049 students in grades 9 through 12 were used. Multivariablelogistic regression analysis was used to calculate adjusted odds ratios (ORs) and 95% CIsfor variables associated with low water intake (�3 times/day). Nationwide, 54% of highschool students reported drinking water �3 times/day. Variables significantly associ-ated with a greater odds for low water intake were age �15 years (OR 1.1), consuming�2 glasses/day of milk (OR 1.5), nondiet soda �1 time/day (OR 1.6), other sugar-sweet-ened beverages �1 time/day (OR 1.4), fruits and 100% fruit juice �2 times/day (OR 1.7),vegetables �3 times/day (OR 2.3), eating at fast-food restaurants 1 to 2 days/week and�3 days/week (OR 1.3 and OR 1.4, respectively), and being physically active �60 min-utes/day on �5 days/week (OR 1.6). Being obese was significantly associated with re-duced odds for lowwater intake (OR0.7). The findings of these significant associations oflowwater intake with poor diet quality, frequent fast-food restaurant use, and physicalinactivity may be used to tailor intervention efforts to increase plain water intake as asubstitute for sugar-sweetened beverages and to promote healthy lifestyles.
ARTICLE INFORMATION
Article history:Accepted 6 April 2012Available online 28 June 2012
Keywords:Drinking waterDietary intakeAdolescentsSugar-sweetened beveragesTelevision
Published by Elsevier Inc. on behalf of theAcademy of Nutrition and Dietetics.2212-2672/$0.00doi: 10.1016/j.jand.2012.04.014
J Acad Nutr Diet. 2012;112:1421-1427.
SUGAR-SWEETENED BEVERAGES (SSBs) ARE THElargestsourceofaddedsugarandanimportantcontributorof energy in the diet of US youth.1 Consumption of SSBshasbeenassociatedwithobesity,2-5 dental caries,6 type
2 diabetes,7 poor mental health,8,9 poor academic grades,10
and displacement of nutrient-rich foods.11,12 In contrast,drinking plain water instead of SSBs is one approach for indi-viduals trying to reduce dietary energy intake and therebypossibly benefit obesity prevention and control.13-15 Hence,consuming water as part of a healthy diet (eg, one that con-tains fruits, vegetables, whole grains, low-fat/reduced fatdairy, and leanmeats) can aidweightmanagement13-16 and, ifsubstituted for SSB consumption, also possibly avert the ad-verse consequences associatedwith SSB intake such as dentalcaries,6 and avoid risks from high levels of SSBs such as devel-oping obesity2-5 and type 2 diabetes.7
One approach for promoting water intake is to make freepotable drinking water widely accessible in public facilities,including schools. For example, previous school-based inter-vention studies have shown that increasing access to drinkingwater in schools increased water intake among students13,17
and in one study decreased their risk for obesity among stu-
dents.13 In fact, the US Department of Agriculture requiresJO
schools participating in theNational School Lunch Program asof fall 2011 to make free potable water available to studentswhere meals are served.18
The adequate intake (AI) level for water in any form (water,beverages other than water, and solid foods) was establishedby the Institute of Medicine as a guide for preventing adverseeffects of dehydration rather than for decreasing risks forchronic diseases.19 Specific AI levels vary by sex and age. Forboys aged 14 to 18 years, the AI levels for total water are 3.3L/day including 2.6 L (�11 c) as beverages. For girls aged 14 to18 years, the AI levels for total water are 2.3 L/day including1.8 L (�8 c) as beverages. People who are physically active orliving in hot climates require evenmorewater.19 Based on the2005-2008 National Health and Nutrition Examination Sur-vey (NHANES), mean plain water intake (tap and bottled)among US youth (aged 12 to 19 years) was 3.6 c for boys and3.1 c for girls.20 Another study reported that plain water wasmost commonly consumed beverage among US high schoolstudents and 72.4% reported drinking a bottle/glass of waterat least one time per day.21
Despite the importance of drinking water as a healthful al-ternative for SSBs, plain water intake has received little re-
search attention as an approach to improve diet quality. OneURNAL OF THE ACADEMY OF NUTRITION AND DIETETICS 1421
RESEARCH
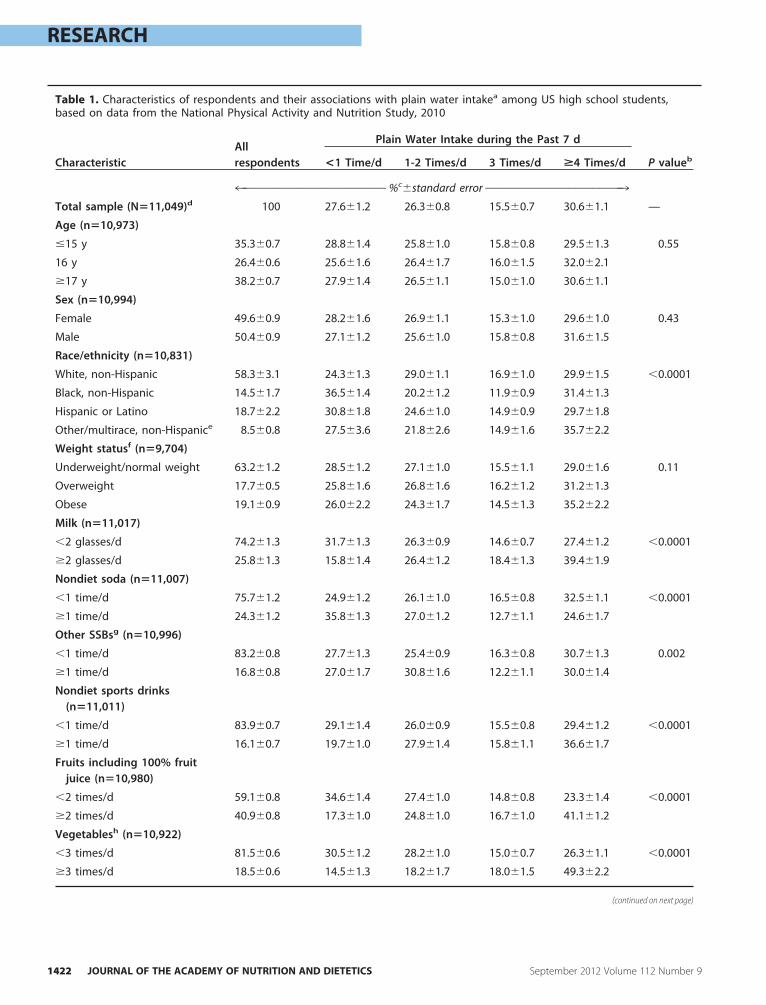
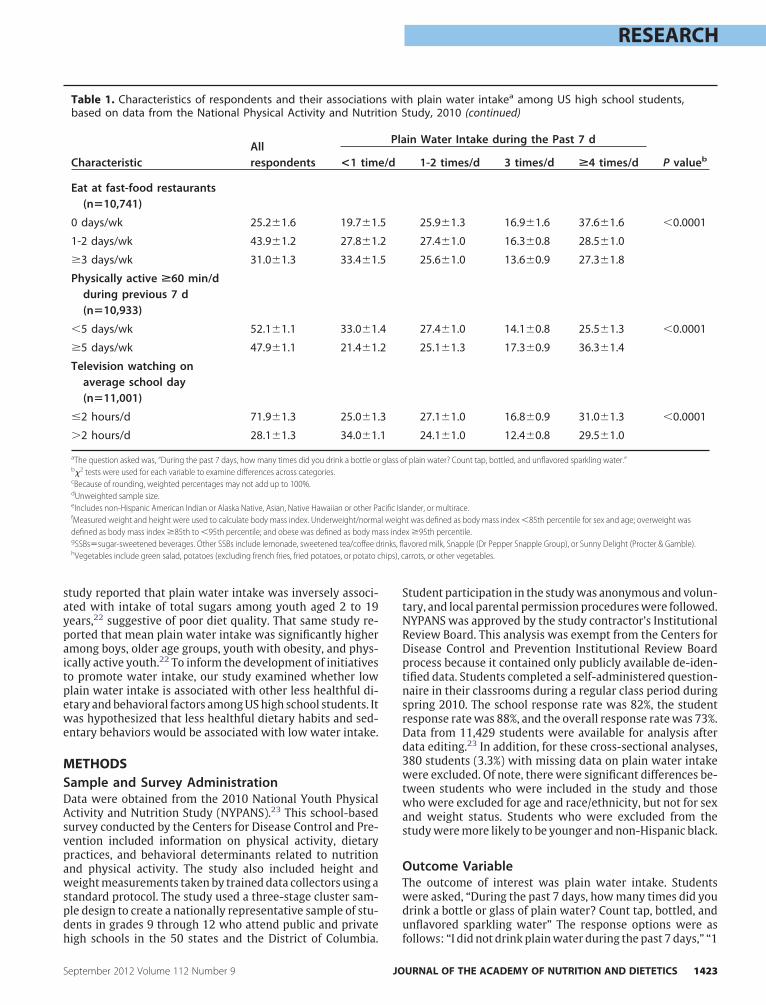
Table 1. Characteristics of respondents and their associations with plain water intakea among US high school students,based on data from the National Physical Activity and Nutrition Study, 2010
CharacteristicAllrespondents
Plain Water Intake during the Past 7 d
P valueb<1 Time/d 1-2 Times/d 3 Times/d >4 Times/d
4™™™™™™™™™™™™™™™™™™™™™™™™%c�standard error ™™™™™™™™™™™™™™™™™™™™™™™3
Total sample (N�11,049)d 100 27.6�1.2 26.3�0.8 15.5�0.7 30.6�1.1 —
Age (n�10,973)
�15 y 35.3�0.7 28.8�1.4 25.8�1.0 15.8�0.8 29.5�1.3 0.55
16 y 26.4�0.6 25.6�1.6 26.4�1.7 16.0�1.5 32.0�2.1
�17 y 38.2�0.7 27.9�1.4 26.5�1.1 15.0�1.0 30.6�1.1
Sex (n�10,994)
Female 49.6�0.9 28.2�1.6 26.9�1.1 15.3�1.0 29.6�1.0 0.43
Male 50.4�0.9 27.1�1.2 25.6�1.0 15.8�0.8 31.6�1.5
Race/ethnicity (n�10,831)
White, non-Hispanic 58.3�3.1 24.3�1.3 29.0�1.1 16.9�1.0 29.9�1.5 �0.0001
Black, non-Hispanic 14.5�1.7 36.5�1.4 20.2�1.2 11.9�0.9 31.4�1.3
Hispanic or Latino 18.7�2.2 30.8�1.8 24.6�1.0 14.9�0.9 29.7�1.8
Other/multirace, non-Hispanice 8.5�0.8 27.5�3.6 21.8�2.6 14.9�1.6 35.7�2.2
Weight statusf (n�9,704)
Underweight/normal weight 63.2�1.2 28.5�1.2 27.1�1.0 15.5�1.1 29.0�1.6 0.11
Overweight 17.7�0.5 25.8�1.6 26.8�1.6 16.2�1.2 31.2�1.3
Obese 19.1�0.9 26.0�2.2 24.3�1.7 14.5�1.3 35.2�2.2
Milk (n�11,017)
�2 glasses/d 74.2�1.3 31.7�1.3 26.3�0.9 14.6�0.7 27.4�1.2 �0.0001
�2 glasses/d 25.8�1.3 15.8�1.4 26.4�1.2 18.4�1.3 39.4�1.9
Nondiet soda (n�11,007)
�1 time/d 75.7�1.2 24.9�1.2 26.1�1.0 16.5�0.8 32.5�1.1 �0.0001
�1 time/d 24.3�1.2 35.8�1.3 27.0�1.2 12.7�1.1 24.6�1.7
Other SSBsg (n�10,996)
�1 time/d 83.2�0.8 27.7�1.3 25.4�0.9 16.3�0.8 30.7�1.3 0.002
�1 time/d 16.8�0.8 27.0�1.7 30.8�1.6 12.2�1.1 30.0�1.4
Nondiet sports drinks(n�11,011)
�1 time/d 83.9�0.7 29.1�1.4 26.0�0.9 15.5�0.8 29.4�1.2 �0.0001
�1 time/d 16.1�0.7 19.7�1.0 27.9�1.4 15.8�1.1 36.6�1.7
Fruits including 100% fruitjuice (n�10,980)
�2 times/d 59.1�0.8 34.6�1.4 27.4�1.0 14.8�0.8 23.3�1.4 �0.0001
�2 times/d 40.9�0.8 17.3�1.0 24.8�1.0 16.7�1.0 41.1�1.2
Vegetablesh (n�10,922)
�3 times/d 81.5�0.6 30.5�1.2 28.2�1.0 15.0�0.7 26.3�1.1 �0.0001
�3 times/d 18.5�0.6 14.5�1.3 18.2�1.7 18.0�1.5 49.3�2.2
(continued on next page)
1422 JOURNAL OF THE ACADEMY OF NUTRITION AND DIETETICS September 2012 Volume 112 Number 9
rinks, flhips), c
RESEARCH
study reported that plain water intake was inversely associ-ated with intake of total sugars among youth aged 2 to 19years,22 suggestive of poor diet quality. That same study re-ported that mean plain water intake was significantly higheramong boys, older age groups, youth with obesity, and phys-ically active youth.22 To inform the development of initiativesto promote water intake, our study examined whether lowplain water intake is associated with other less healthful di-etary andbehavioral factors amongUShigh school students. Itwas hypothesized that less healthful dietary habits and sed-entary behaviors would be associated with low water intake.
METHODSSample and Survey AdministrationData were obtained from the 2010 National Youth PhysicalActivity and Nutrition Study (NYPANS).23 This school-basedsurvey conducted by the Centers for Disease Control and Pre-vention included information on physical activity, dietarypractices, and behavioral determinants related to nutritionand physical activity. The study also included height andweightmeasurements takenby traineddata collectors using astandard protocol. The study used a three-stage cluster sam-ple design to create a nationally representative sample of stu-dents in grades 9 through 12 who attend public and private
Table 1. Characteristics of respondents and their associationbased on data from the National Physical Activity and Nutrit
CharacteristicAllrespondents <1 tim
Eat at fast-food restaurants(n�10,741)
0 days/wk 25.2�1.6 19.7�1.
1-2 days/wk 43.9�1.2 27.8�1.
�3 days/wk 31.0�1.3 33.4�1.
Physically active >60 min/dduring previous 7 d(n�10,933)
�5 days/wk 52.1�1.1 33.0�1.
�5 days/wk 47.9�1.1 21.4�1.
Television watching onaverage school day(n�11,001)
�2 hours/d 71.9�1.3 25.0�1.
�2 hours/d 28.1�1.3 34.0�1.
aThe question asked was, “During the past 7 days, how many times did you drink a bottle orb�2 tests were used for each variable to examine differences across categories.cBecause of rounding, weighted percentages may not add up to 100%.dUnweighted sample size.eIncludes non-Hispanic American Indian or Alaska Native, Asian, Native Hawaiian or other PafMeasured weight and height were used to calculate body mass index. Underweight/normadefined as body mass index �85th to �95th percentile; and obese was defined as body mgSSBs�sugar-sweetened beverages. Other SSBs include lemonade, sweetened tea/coffee dhVegetables include green salad, potatoes (excluding french fries, fried potatoes, or potato c
high schools in the 50 states and the District of Columbia.
September 2012 Volume 112 Number 9 JO
Student participation in the studywas anonymous and volun-tary, and local parental permissionprocedureswere followed.NYPANS was approved by the study contractor’s InstitutionalReview Board. This analysis was exempt from the Centers forDisease Control and Prevention Institutional Review Boardprocess because it contained only publicly available de-iden-tified data. Students completed a self-administered question-naire in their classrooms during a regular class period duringspring 2010. The school response rate was 82%, the studentresponse ratewas 88%, and the overall response ratewas 73%.Data from 11,429 students were available for analysis afterdata editing.23 In addition, for these cross-sectional analyses,380 students (3.3%) with missing data on plain water intakewere excluded. Of note, there were significant differences be-tween students who were included in the study and thosewhowere excluded for age and race/ethnicity, but not for sexand weight status. Students who were excluded from thestudyweremore likely to be younger and non-Hispanic black.
Outcome VariableThe outcome of interest was plain water intake. Studentswere asked, “During the past 7 days, howmany times did youdrink a bottle or glass of plain water? Count tap, bottled, andunflavored sparkling water” The response options were as
th plain water intakea among US high school students,tudy, 2010 (continued)
in Water Intake during the Past 7 d
P valueb1-2 times/d 3 times/d >4 times/d
25.9�1.3 16.9�1.6 37.6�1.6 �0.0001
27.4�1.0 16.3�0.8 28.5�1.0
25.6�1.0 13.6�0.9 27.3�1.8
27.4�1.0 14.1�0.8 25.5�1.3 �0.0001
25.1�1.3 17.3�0.9 36.3�1.4
27.1�1.0 16.8�0.9 31.0�1.3 �0.0001
24.1�1.0 12.4�0.8 29.5�1.0
f plain water? Count tap, bottled, and unflavored sparkling water.”
lander, or multirace.t was defined as body mass index �85th percentile for sex and age; overweight wasx �95th percentile.avored milk, Snapple (Dr Pepper Snapple Group), or Sunny Delight (Procter & Gamble).arrots, or other vegetables.
s wiion S
Pla
e/d
5
2
5
4
2
3
1
glass o
cific Isl weighass inde
follows: “I did not drink plainwater during the past 7 days,” “1
URNAL OF THE ACADEMY OF NUTRITION AND DIETETICS 1423

RESEARCH
to 3 times during the past 7 days,” “4 to 6 times during the past7 days,” “1 time/day,” “2 times/day,” “3 times/day,” and “4 ormore times/day.” For �2 tests, four mutually exclusive waterintake categorieswere created;�1 time/day, 1 to 2 times/day,3 times/day, and �4 times/day based on the data distribution.For logistic regression analysis, plain water intake was cate-gorized as �3 times/day vs �3 times/day, based on previousstudies conducted in youth.20,22,24 For the purpose of ourstudy, lowwater intakewas defined as drinking a bottle/glassof plain water �3 times/day, which is lower than mean plainwater intake (�3.4 c) reported based on NHANES data foradolescents.20,22
Exposure VariablesMutually exclusive response categories were created for eachexposure variable. Demographic variables included were age(�15, 16, and �17 years), sex, and race/ethnicity (non-His-panic white, non-Hispanic black, Hispanic, and non-Hispanicother/multirace). Body mass index was calculated frommea-sured weight and height and was categorized as under-weight/normalweight (�85th percentile for bodymass indexby age and sex), overweight (�85th to �95th percentile), andobese (�95th percentile) based on sex- and age-specific ref-erence data from the 2000 growth charts.25 Because a smallpercent of students were classified as underweight, thesewere combined with normal weight students. Dietary intakevariables (reported consumption during the past 7 days) in-cluded were milk (�2 and �2 glasses/day), nondiet soda (�1and �1 time/day), other SSBs such as lemonade, sweetenedtea/coffee drinks, flavored milk, Snapple (Dr Pepper SnappleGroup), or Sunny Delight (Procter & Gamble) (�1 and �1time/day), nondiet sports drinks (�1 and �1 time/day), fruitsincluding 100% fruit juice (�2 and �2 time/day), vegetables(�3 and �3 time/day), and eating at fast-food restaurants (0,1 to 2, and �3 days/week). Vegetable intakewas derived fromquestions about eating green salad, potatoes (excludingfrench fries, fried potatoes, or potato chips), carrots, and othervegetables. Behavioral variables included were being physi-cally active at least 60minutes/day during the past 7 days (�5and �5 days/week) and watching television on an averageschool day (�2 and �2 hours/day). Cutpoints of aforemen-tioned variables were chosen based on previous stud-ies.10,21,26 For television viewing cutpoint, the AmericanAcademy of Pediatrics guidelinewas used.27 Unknown valuesor missing data regarding exposure variables ranged from0.3% to 12% (weight status variable) and were excluded fromanalyses when the variable was used.
Statistical AnalysisTheunadjusted associationof previously described character-istics with plain water intake was examined by �2 tests, andP�0.05 was used for statistical significance. Multivariable lo-gistic regressionmodels were used to estimate adjusted oddsratios (ORs) and 95% CIs for variables associated with lowplain water intake (�3 times/day). All variables were in-cluded in the multivariable logistic regression model. This lo-gistic regression model included data on 9,077 students whohad complete information on all variables studied. Of note,there were no significant differences in age, sex, race/ethnic-ity, or weight status between students who were included in
the logistic regression model and those who were not in-1424 JOURNAL OF THE ACADEMY OF NUTRITION AND DIETETICS
cluded in the logistic regression model. Sample weights wereapplied to all analyses to adjust for nonresponse. All statisticalanalyses were performed using Statistical Analysis Software(version 9.2, 2009, SAS Institute Inc) and incorporating appro-priate procedures to account for the complex sample design.
RESULTS AND DISCUSSIONThe final analytic samplewas 11,049 students. Overall, 54% ofstudents reported drinking a bottle or glass of plain water �3times/day during the past 7 days. Based on �2 tests, plain wa-ter intake significantly differed by race/ethnicity, and all ofthe dietary habits andbehavioral factors examined. For exam-ple, increased water intake was associated with increased in-take of milk, sports drink, fruits, vegetables, physical activity,and decreased intake of nondiet soda, fast foods, and televi-sion watching (Table 1).Based on multivariable logistic regression analysis, factors
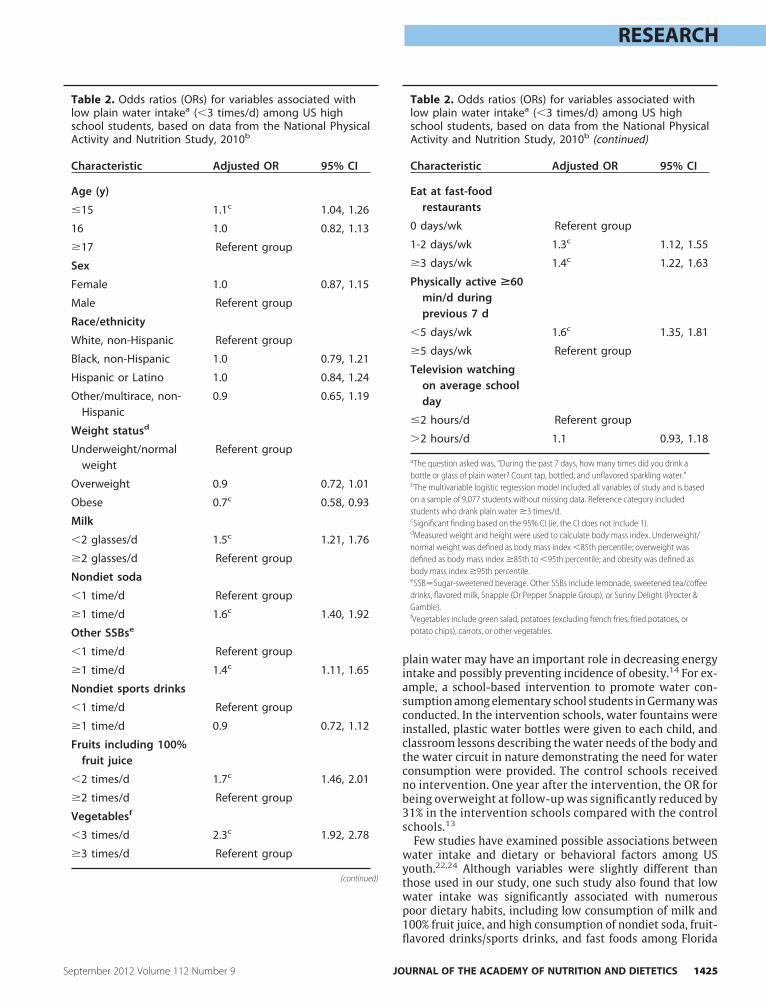
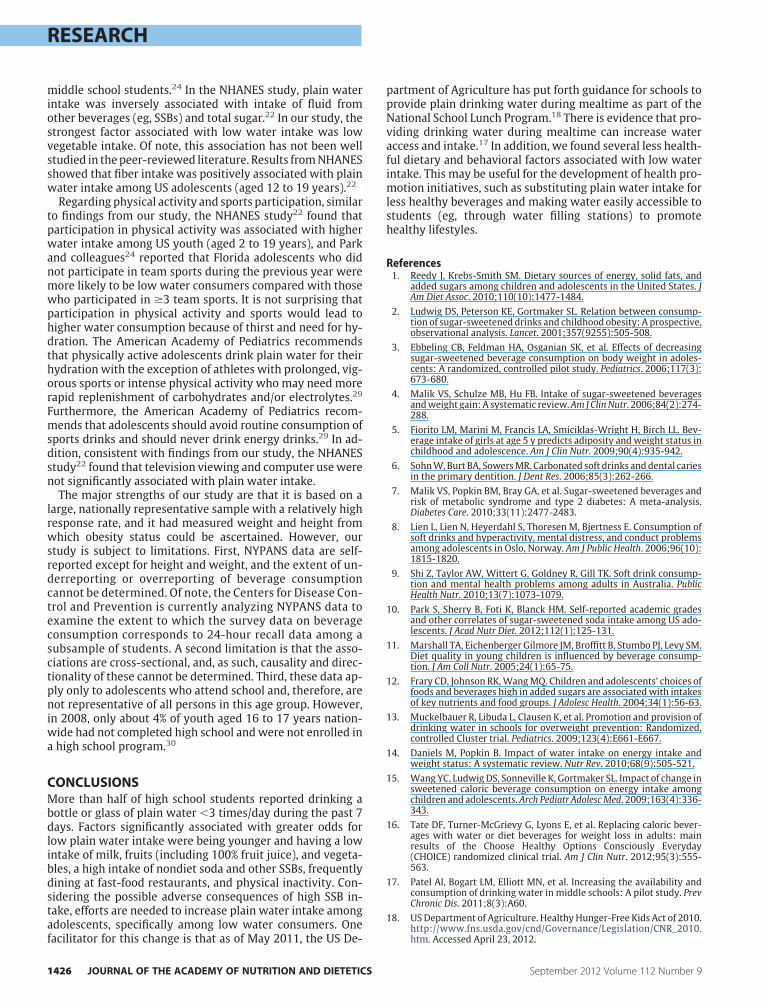
significantly associated with greater odds for low water in-take were age �15 years (OR 1.1), consuming �2 glasses/daymilk (OR 1.5), nondiet soda �1 time/day (OR 1.6), other SSBs�1 time/day (OR 1.4), fruits and 100% fruit juice�2 times/day(OR 1.7), vegetables�3 times/day (OR 2.3), eating at fast-foodrestaurants 1 to 2 days/week and �3 days/week (OR 1.3 andOR 1.4, respectively), and being physically active �60 min-utes/day on �5 days/week (OR 1.6). Being obese was signifi-cantly associated with reduced odds for lowwater intake (OR0.7) (Table 2).The prevalence of lowwater intake among adolescents was
lower in our study (54%) compared with a previous study24
that showed that 64% of Floridamiddle school students drank�3 glasses/day plain water. Discrepancies between studiescould be due to differences in the populations studied, includ-ing the age of respondents. That is, our study used a nationallyrepresentative sample of high school students, whereas theFlorida study used a state representative sample of middleschool students.In our study, race/ethnicity was significantly associated
with plain water intake based on �2 tests, but was not signif-icant based on the multivariable logistic regression analysisusing non-Hispanic whites as the referent group and adjust-ing for the other variables. A study using NHANES data re-ported that there was no association between plain waterintake and race/ethnicity amongyouth aged2 to 19 years.22 Incontrast, the study among Florida middle school studentsfound that Hispanics were significantly less likely to have lowwater intake than non-Hispanic whites.24
Although our study is cross-sectional and thus cannot ad-dress causality or directionality of association, the findings ofa significant association between low water intake and highSSB intakemay suggest that there is an opportunity to substi-tute plain water for SSBs. Consistent with the NHANES studycited above,22 students with obesity in our study were 30%less likely to be lowwater consumers comparedwith normal/underweight students. Adolescents with obesity might try tolimit energy intake from beverages by substituting plain wa-ter for SSBs. This tactic is supported by evidence from twostudies that found that comparedwith studentswhowere nottrying to do anything about their weight, those who weretrying to lose weight were less likely to drink SSBs.10,28 Al-though there is limited evidence regarding whether water
intake might facilitate weight management among youth,September 2012 Volume 112 Number 9
(continued)
RESEARCH
September 2012 Volume 112 Number 9 JO
plain water may have an important role in decreasing energyintake and possibly preventing incidence of obesity.14 For ex-ample, a school-based intervention to promote water con-sumption amongelementary school students inGermanywasconducted. In the intervention schools, water fountains wereinstalled, plastic water bottles were given to each child, andclassroom lessons describing thewater needs of the body andthe water circuit in nature demonstrating the need for waterconsumption were provided. The control schools receivedno intervention. One year after the intervention, the OR forbeing overweight at follow-upwas significantly reduced by31% in the intervention schools compared with the controlschools.13
Few studies have examined possible associations betweenwater intake and dietary or behavioral factors among USyouth.22,24 Although variables were slightly different thanthose used in our study, one such study also found that lowwater intake was significantly associated with numerouspoor dietary habits, including low consumption of milk and100% fruit juice, and high consumption of nondiet soda, fruit-
Table 2. Odds ratios (ORs) for variables associated withlow plain water intakea (�3 times/d) among US highschool students, based on data from the National PhysicalActivity and Nutrition Study, 2010b (continued)
Characteristic Adjusted OR 95% CI
Eat at fast-foodrestaurants
0 days/wk Referent group
1-2 days/wk 1.3c 1.12, 1.55
�3 days/wk 1.4c 1.22, 1.63
Physically active >60min/d duringprevious 7 d
�5 days/wk 1.6c 1.35, 1.81
�5 days/wk Referent group
Television watchingon average schoolday
�2 hours/d Referent group
�2 hours/d 1.1 0.93, 1.18
aThe question asked was, “During the past 7 days, how many times did you drink abottle or glass of plain water? Count tap, bottled, and unflavored sparkling water.”bThe multivariable logistic regression model included all variables of study and is basedon a sample of 9,077 students without missing data. Reference category includedstudents who drank plain water �3 times/d.cSignificant finding based on the 95% CI (ie, the CI does not include 1).dMeasured weight and height were used to calculate body mass index. Underweight/normal weight was defined as body mass index �85th percentile; overweight wasdefined as body mass index �85th to �95th percentile; and obesity was defined asbody mass index �95th percentile.eSSB�Sugar-sweetened beverage. Other SSBs include lemonade, sweetened tea/coffeedrinks, flavored milk, Snapple (Dr Pepper Snapple Group), or Sunny Delight (Procter &Gamble).fVegetables include green salad, potatoes (excluding french fries, fried potatoes, orpotato chips), carrots, or other vegetables.
Table 2. Odds ratios (ORs) for variables associated withlow plain water intakea (�3 times/d) among US highschool students, based on data from the National PhysicalActivity and Nutrition Study, 2010b
Characteristic Adjusted OR 95% CI
Age (y)
�15 1.1c 1.04, 1.26
16 1.0 0.82, 1.13
�17 Referent group
Sex
Female 1.0 0.87, 1.15
Male Referent group
Race/ethnicity
White, non-Hispanic Referent group
Black, non-Hispanic 1.0 0.79, 1.21
Hispanic or Latino 1.0 0.84, 1.24
Other/multirace, non-Hispanic
0.9 0.65, 1.19
Weight statusd
Underweight/normalweight
Referent group
Overweight 0.9 0.72, 1.01
Obese 0.7c 0.58, 0.93
Milk
�2 glasses/d 1.5c 1.21, 1.76
�2 glasses/d Referent group
Nondiet soda
�1 time/d Referent group
�1 time/d 1.6c 1.40, 1.92
Other SSBse
�1 time/d Referent group
�1 time/d 1.4c 1.11, 1.65
Nondiet sports drinks
�1 time/d Referent group
�1 time/d 0.9 0.72, 1.12
Fruits including 100%fruit juice
�2 times/d 1.7c 1.46, 2.01
�2 times/d Referent group
Vegetablesf
�3 times/d 2.3c 1.92, 2.78
�3 times/d Referent group
flavored drinks/sports drinks, and fast foods among Florida
URNAL OF THE ACADEMY OF NUTRITION AND DIETETICS 1425
RESEARCH
middle school students.24 In the NHANES study, plain waterintake was inversely associated with intake of fluid fromother beverages (eg, SSBs) and total sugar.22 In our study, thestrongest factor associated with low water intake was lowvegetable intake. Of note, this association has not been wellstudied in the peer-reviewed literature. Results fromNHANESshowed that fiber intake was positively associated with plainwater intake among US adolescents (aged 12 to 19 years).22
Regarding physical activity and sports participation, similarto findings from our study, the NHANES study22 found thatparticipation in physical activity was associated with higherwater intake among US youth (aged 2 to 19 years), and Parkand colleagues24 reported that Florida adolescents who didnot participate in team sports during the previous year weremore likely to be low water consumers compared with thosewho participated in �3 team sports. It is not surprising thatparticipation in physical activity and sports would lead tohigher water consumption because of thirst and need for hy-dration. The American Academy of Pediatrics recommendsthat physically active adolescents drink plain water for theirhydration with the exception of athletes with prolonged, vig-orous sports or intense physical activity who may need morerapid replenishment of carbohydrates and/or electrolytes.29
Furthermore, the American Academy of Pediatrics recom-mends that adolescents should avoid routine consumption ofsports drinks and should never drink energy drinks.29 In ad-dition, consistent with findings from our study, the NHANESstudy22 found that television viewing and computer usewerenot significantly associated with plain water intake.The major strengths of our study are that it is based on a
large, nationally representative sample with a relatively highresponse rate, and it had measured weight and height fromwhich obesity status could be ascertained. However, ourstudy is subject to limitations. First, NYPANS data are self-reported except for height and weight, and the extent of un-derreporting or overreporting of beverage consumptioncannot be determined. Of note, the Centers for Disease Con-trol and Prevention is currently analyzing NYPANS data toexamine the extent to which the survey data on beverageconsumption corresponds to 24-hour recall data among asubsample of students. A second limitation is that the asso-ciations are cross-sectional, and, as such, causality and direc-tionality of these cannot be determined. Third, these data ap-ply only to adolescents who attend school and, therefore, arenot representative of all persons in this age group. However,in 2008, only about 4% of youth aged 16 to 17 years nation-wide had not completed high school andwere not enrolled ina high school program.30
CONCLUSIONSMore than half of high school students reported drinking abottle or glass of plain water �3 times/day during the past 7days. Factors significantly associated with greater odds forlow plain water intake were being younger and having a lowintake of milk, fruits (including 100% fruit juice), and vegeta-bles, a high intake of nondiet soda and other SSBs, frequentlydining at fast-food restaurants, and physical inactivity. Con-sidering the possible adverse consequences of high SSB in-take, efforts are needed to increase plain water intake amongadolescents, specifically among low water consumers. One
facilitator for this change is that as of May 2011, the US De-1426 JOURNAL OF THE ACADEMY OF NUTRITION AND DIETETICS
partment of Agriculture has put forth guidance for schools toprovide plain drinking water during mealtime as part of theNational School Lunch Program.18 There is evidence that pro-viding drinking water during mealtime can increase wateraccess and intake.17 In addition, we found several less health-ful dietary and behavioral factors associated with low waterintake. This may be useful for the development of health pro-motion initiatives, such as substituting plain water intake forless healthy beverages and making water easily accessible tostudents (eg, through water filling stations) to promotehealthy lifestyles.
References1. Reedy J, Krebs-Smith SM. Dietary sources of energy, solid fats, and
added sugars among children and adolescents in the United States. JAm Diet Assoc. 2010;110(10):1477-1484.
2. Ludwig DS, Peterson KE, Gortmaker SL. Relation between consump-tion of sugar-sweetened drinks and childhood obesity: A prospective,observational analysis. Lancet. 2001;357(9255):505-508.
3. Ebbeling CB, Feldman HA, Osganian SK, et al. Effects of decreasingsugar-sweetened beverage consumption on body weight in adoles-cents: A randomized, controlled pilot study. Pediatrics. 2006;117(3):673-680.
4. Malik VS, Schulze MB, Hu FB. Intake of sugar-sweetened beveragesandweight gain: A systematic review.Am J ClinNutr. 2006;84(2):274-288.
5. Fiorito LM, Marini M, Francis LA, Smiciklas-Wright H, Birch LL. Bev-erage intake of girls at age 5 y predicts adiposity and weight status inchildhood and adolescence. Am J Clin Nutr. 2009;90(4):935-942.
6. SohnW,Burt BA, SowersMR. Carbonated soft drinks anddental cariesin the primary dentition. J Dent Res. 2006;85(3):262-266.
7. Malik VS, Popkin BM, Bray GA, et al. Sugar-sweetened beverages andrisk of metabolic syndrome and type 2 diabetes: A meta-analysis.Diabetes Care. 2010;33(11):2477-2483.
8. Lien L, Lien N, Heyerdahl S, Thoresen M, Bjertness E. Consumption ofsoft drinks and hyperactivity, mental distress, and conduct problemsamong adolescents in Oslo, Norway. Am J Public Health. 2006;96(10):1815-1820.
9. Shi Z, Taylor AW, Wittert G, Goldney R, Gill TK. Soft drink consump-tion and mental health problems among adults in Australia. PublicHealth Nutr. 2010;13(7):1073-1079.
10. Park S, Sherry B, Foti K, Blanck HM. Self-reported academic gradesand other correlates of sugar-sweetened soda intake among US ado-lescents. J Acad Nutr Diet. 2012;112(1):125-131.
11. Marshall TA, Eichenberger Gilmore JM, Broffitt B, Stumbo PJ, Levy SM.Diet quality in young children is influenced by beverage consump-tion. J Am Coll Nutr. 2005;24(1):65-75.
12. Frary CD, Johnson RK,WangMQ. Children and adolescents’ choices offoods and beverages high in added sugars are associatedwith intakesof key nutrients and food groups. J Adolesc Health. 2004;34(1):56-63.
13. Muckelbauer R, Libuda L, Clausen K, et al. Promotion and provision ofdrinking water in schools for overweight prevention: Randomized,controlled Cluster trial. Pediatrics. 2009;123(4):E661-E667.
14. Daniels M, Popkin B. Impact of water intake on energy intake andweight status: A systematic review. Nutr Rev. 2010;68(9):505-521.
15. Wang YC, LudwigDS, Sonneville K, Gortmaker SL. Impact of change insweetened caloric beverage consumption on energy intake amongchildren and adolescents. Arch Pediatr AdolescMed. 2009;163(4):336-343.
16. Tate DF, Turner-McGrievy G, Lyons E, et al. Replacing caloric bever-ages with water or diet beverages for weight loss in adults: mainresults of the Choose Healthy Options Consciously Everyday(CHOICE) randomized clinical trial. Am J Clin Nutr. 2012;95(3):555-563.
17. Patel AI, Bogart LM, Elliott MN, et al. Increasing the availability andconsumption of drinking water in middle schools: A pilot study. PrevChronic Dis. 2011;8(3):A60.
18. US Department of Agriculture. Healthy Hunger-Free Kids Act of 2010.
http://www.fns.usda.gov/cnd/Governance/Legislation/CNR_2010.htm. Accessed April 23, 2012.September 2012 Volume 112 Number 9

RESEARCH
19. Institute of Medicine. Dietary Reference Intakes for Water, Potassium,Sodium, Chloride, and Sulfate. Institute of Medicine Panel on DietaryReference Intakes for Electrolytes andWater.Washington, DC: NationalAcademies Press; 2005.
20. US Department of Agriculture Agricultural Research Service, BeltsvilleHumanNutritionResearchCenter, FoodSurveysResearchGroup.Drink-ing water intake in the U.S.: What We Eat In America, NHANES 2005-2008. FoodSurveysResearchGroupDietaryDataBriefNumber7. http://ars.usda.gov/Services/docs.htm?docid�19476. Accessed April 23, 2012.
21. Brener N, Merlo C, Eaton D, et al. Beverage consumption among highschool students—United States, 2010. MMWR Morbid Mortal WklyRep. 2011;60(23):778-780.
22. Kant AK, Graubard BI. Contributors of water intake in US children andadolescents: Associations with dietary andmeal characteristics—Na-tional Health and Nutrition Examination Survey 2005-2006. Am J ClinNutr. 2010;92(4):887-896.
23. Centers for Disease Control and Prevention. TheNational Youth Phys-ical Activity and Nutrition Study. http://www.cdc.gov/healthyyouth/yrbs/nypans.htm. Accessed April 23, 2012.
24. Park S, Sherry B, O’Toole T, Huang Y. Factors associated with lowdrinkingwater intake among adolescents: The Florida Youth Physical
September 2012 Volume 112 Number 9 JO
Activity and Nutrition Survey, 2007. J Am Diet Assoc.2011;111(8):1211-1217.
25. Kuczmarski RJ, Ogden CL, Grummer-Strawn LM, et al. CDC growthcharts: United States. Adv Data. 2000(314):1-27.
26. Park S, Blanck HM, Sherry B, Brener N, O’Toole T. Factors associatedwith sugar-sweetened beverage intake among United States highschool students. J Nutr. 2012;142(2):306-312.
27. American Academy of Pediatrics. Children, adolescents, and televi-sion. Pediatrics. 2001;107(2):423-426.
28. Isasi C, Soroudi N, Wylie-Rosett J. Youth WAVE Screener: Addressingweight-related behaviors with school-age children. Diabetes Educ.2006;32(3):415-422.
29. American Academy of Pediatrics, Committee on Nutrition and theCouncil on Sports Medicine and Fitness. Clinical Report—Sportsdrinks and energy drinks for children and adolescents: Are they ap-propriate? Pediatrics. 2011;127:1182-1189.
30. Chapman C, Laird J, Kewal-Ramani A. Trends in High School Dropoutand Completion Rates in the United States: 1972–2008. Washington,
DC: US Department of Education, National Center for Education Sta-tistics. 2010. Publication No. NCES 2011-012.AUTHOR INFORMATIONS. Park is an epidemiologist, H. M. Blanck is a branch chief, B. Sherry is a lead epidemiologist, and T. O’Toole is a public health analyst, Divisionof Nutrition, Physical Activity and Obesity, National Center for Chronic Disease Prevention and Health Promotion, and N. Brener is a lead healthscientist, Division of Adolescent and School Health, National Center for HIV/AIDS, Viral Hepatitis, STD, and TB Prevention, all at the Centers forDisease Control and Prevention, Atlanta, GA.
Address correspondence to: Sohyun Park, PhD, Division of Nutrition, Physical Activity, and Obesity, National Center for Chronic DiseasePrevention and Health Promotion, Centers for Disease Control and Prevention, 4770 Buford Hwy, NE, Mailstop K26, Atlanta, GA 30341. E-mail:[email protected]
STATEMENT OF POTENTIAL CONFLICT OF INTERESTNo potential conflict of interest was reported by the authors.
FUNDING/SUPPORTThere is no funding to disclose.
ACKNOWLEDGEMENTSThe findings and conclusions in this report are those of the authors and do not necessarily represent the official position of the Centers forDisease Control and Prevention.
URNAL OF THE ACADEMY OF NUTRITION AND DIETETICS 1427