Factors affecting the status of food safety management systems in the global fresh produce chain
40
Accepted Manuscript Factors affecting the status of food safety management systems in the global fresh produce chain Klementina Kirezieva, Pieternel A. Luning, Liesbeth Jacxsens, Ana Allende, Gro S. Johannessen, Eduardo César Tondo, Andreja Rajkovic, Mieke Uyttendaele, Martinus A.J.S. van Boekel PII: S0956-7135(14)00720-8 DOI: 10.1016/j.foodcont.2014.12.030 Reference: JFCO 4229 To appear in: Food Control Received Date: 5 November 2014 Revised Date: 22 December 2014 Accepted Date: 23 December 2014 Please cite this article as: Kirezieva K., Luning P.A., Jacxsens L., Allende A., Johannessen G.S., Tondo E.C., Rajkovic A., Uyttendaele M. & van Boekel M.A.J.S, Factors affecting the status of food safety management systems in the global fresh produce chain, Food Control (2015), doi: 10.1016/ j.foodcont.2014.12.030. This is a PDF file of an unedited manuscript that has been accepted for publication. As a service to our customers we are providing this early version of the manuscript. The manuscript will undergo copyediting, typesetting, and review of the resulting proof before it is published in its final form. Please note that during the production process errors may be discovered which could affect the content, and all legal disclaimers that apply to the journal pertain.
-
Upload
independent -
Category
Documents
-
view
1 -
download
0
Transcript of Factors affecting the status of food safety management systems in the global fresh produce chain
Accepted Manuscript
Factors affecting the status of food safety management systems in the global freshproduce chain
Klementina Kirezieva, Pieternel A. Luning, Liesbeth Jacxsens, Ana Allende, Gro S.Johannessen, Eduardo César Tondo, Andreja Rajkovic, Mieke Uyttendaele, MartinusA.J.S. van Boekel
PII: S0956-7135(14)00720-8
DOI: 10.1016/j.foodcont.2014.12.030
Reference: JFCO 4229
To appear in: Food Control
Received Date: 5 November 2014
Revised Date: 22 December 2014
Accepted Date: 23 December 2014
Please cite this article as: Kirezieva K., Luning P.A., Jacxsens L., Allende A., Johannessen G.S.,Tondo E.C., Rajkovic A., Uyttendaele M. & van Boekel M.A.J.S, Factors affecting the status of foodsafety management systems in the global fresh produce chain, Food Control (2015), doi: 10.1016/j.foodcont.2014.12.030.
This is a PDF file of an unedited manuscript that has been accepted for publication. As a service toour customers we are providing this early version of the manuscript. The manuscript will undergocopyediting, typesetting, and review of the resulting proof before it is published in its final form. Pleasenote that during the production process errors may be discovered which could affect the content, and alllegal disclaimers that apply to the journal pertain.

MANUSCRIP
T
ACCEPTED
ACCEPTED MANUSCRIPT
1
Factors affecting the status of food safety management systems in the global fresh 1
produce chain 2
Klementina Kirezievaa, Pieternel A. Luning a*, Liesbeth Jacxsensb, Ana Allendec, Gro S. 3
Johannessend, Eduardo César Tondoe, Andreja Rajkovicbf, Mieke Uyttendaeleb, Martinus 4
A.J.S van Boekela 5
6
a Food Quality and Design Group, Department of Agrotechnology and Food Sciences, Wageningen University, 7
P.O. Box 17, 6700AA Wageningen, The Netherlands 8
b Department of Food Safety and Food Quality, Laboratory of Food Preservation and Food Microbiology, 9
Faculty of Bioscience Engineering, University of Ghent, Coupure Links, 653, 9000 Ghent, Belgium 10
c Research Group on Quality, Safety and Bioactivity of Plant Foods, Department of Food Science and 11
Technology, CEBAS-CSIC, 30100 Murcia, Spain 12
d National Veterinary Institute, P.O.Box 750 Sentrum, 0033 Oslo, Norway 13
e Laboratório de Microbiologia e Controle de Alimentos, Instituto de Ciências e Tecnologia de Alimentos, 14
Universidade Federal do Rio Grande do Sul (ICTA/UFRGS), Av. Bento Gonçalves, 9500, prédio 43212, Campus 15
do Vale, Agronomia, Cep. 91501-970 Porto Alegre/RS, Brazil 16
f Department of Food Safety and Quality Management, University of Belgrade, Faculty of Agriculture, 17
Nemanjina 6, 11080 Belgrade-Zemun, Serbia 18
19
*Corresponding author. Mailing address: Food Quality and Design Group, Department of Agrotechnology 20
and Food Sciences, Wageningen University, P.O. Box 17, 6700AA Wageningen, The Netherlands, 21
Phone:+317482087. Fax: +317483669 Electronic mail address: [email protected] 22
23
Keywords: fresh produce; food safety management; Europe; emerging and developing 24
countries 25

MANUSCRIP
T
ACCEPTED
ACCEPTED MANUSCRIPT
2
Abstract 26
Increase in global trade raised questions regarding status of food safety management systems 27
in fresh produce companies, especially from developing and emerging countries. The aim of 28
this study was to investigate the status of food safety management systems (FSMSs) 29
implemented at primary production companies of fresh produce, to examine the potential 30
differences between companies operating in European Union (EU) and non-EU (developing 31
and emerging) countries, and to explore the underlying factors. Primary production 32
companies (n=118), located in the EU and in international cooperation partner countries 33
exporting to the EU, were assessed by using a diagnostic tool. The results from the study 34
indicated that several factors have a dominating effect on the status of FSMSs in the global 35
fresh produce chain. International export supply chains promote capacity building within 36
companies in the chain, to answer the stringent requirements of private brand standards. This 37
was shown to be an important factor in emerging and developing countries, where local 38
institutional environments often fail to support companies in setting and implementing their 39
FSMSs. Moreover, the legislative framework in these countries still requires improvements in 40
the establishment and enforcement. All this has negative consequences for the FSMSs in 41
companies supplying the local markets. In companies located in the EU, sector and other 42
produce organisations facilitate the sampling for pesticide residues and collaboration in the 43
sector. Overall, farmers showed less knowledge and overall awareness regarding 44
microbiological hazards, which is related to the less attention paid to these in the current 45
legislation and standards. Furthermore, standards are an important tool to trigger the 46
maturation of the systems as companies that were lacking any pressure to comply to standards 47
operated at a very basic level - with only few activities implemented. The insights from this 48
study indicate the need of stratified measures and policies to support companies in the fresh 49

MANUSCRIP
T
ACCEPTED
ACCEPTED MANUSCRIPT
3
produce chain in designing and operating their FSMSs according to the institutional 50
environment in which they operate. 51

MANUSCRIP
T
ACCEPTED
ACCEPTED MANUSCRIPT
4
1. Introduction 52
The world production of fresh produce raised by 38% in the last decade (FAOSTAT, 2013). 53
The demand for seasonal and exotic fruits and vegetables has also increased and trade with 54
fresh produce is more and more international (Diop & Jaffee, 2005). Simultaneously, food 55
safety problems linked to fresh produce have been repeatedly reported, for instance, recent 56
outbreaks with pathogenic microorganisms such as EHEC in sprouted seeds in Germany and 57
France, Listeria monocytogenes in melons in USA, and norovirus in berries in Nothern 58
Europe (EFSA, 2011; Laksanalamai, et al., 2012; Fründt, et al., 2013; Bernard, et al., 2014). 59
Moreover, breach of pesticide residue limits is a common problem (RASFF, 2012; Winter, 60
2012). Some of these food safety scares involved multiple sources and countries of 61
consumption, making it difficult to trace back the (single) point source of contamination in 62
the country of origin (Lynch, Tauxe, & Hedberg, 2009; EFSA, 2014). Fresh produce is often 63
imported from warmer climates located in developing and emerging economies, and these 64
were frequently associated with the problems (RASFF, 2012). 65
To address food safety, every company in the global food chain needs to implement a food 66
safety management system (FSMS) (CAC, 2009, 2010a). Each FSMS is company specific 67
because it is a result of the implementation of various quality assurance and legal 68
requirements into a company’s unique production, organisation and environment (Jacxsens, 69
Luning, et al., 2011). FSMSs implemented in companies at primary production are based on 70
good agricultural and good hygiene practices, by following national and international, public 71
and private standards and guidelines (CAC, 2010a; GlobalGAP, 2012). These are put into 72
place to assure product quality and safety across countries and regions. Certain countries and 73
regions however (e.g. the European Union) have put more stringent requirements about food 74
safety, which are difficult to reach by some companies in less developed countries (Unnevehr, 75

MANUSCRIP
T
ACCEPTED
ACCEPTED MANUSCRIPT
5
2000; Kussaga, Jacxsens, Tiisekwa, & Luning, 2014; Kussaga, Luning, Tiisekwa, & Jacxsens, 76
2014; Sawe, Onyango, & Njage, 2014). 77
Studies on the implementation status of FSMSs across industries of animal-derived products 78
in different countries and sectors highlighted that small and medium companies can also 79
demonstrate advanced systems (Djekic, et al., 2013; Luning, et al., 2015). A body of research 80
investigated the adoption of quality assurance standards in developing and emerging 81
economies as driven by export supply chains, and their role as barriers and facilitators to 82
economic growth (e.g. Jaffee & Henson, 2004; Henson, 2008; Henson & Humphrey, 2010; 83
Herzfeld, Drescher, & Grebitus, 2011). However, safety is still considered as less important 84
than price, quality and delivery conditions during the selection of suppliers (Voss, Closs, 85
Calantone, Helferich, & Speier, 2009). To address these issues, extra controls are established 86
in the EU for import products of non-animal origin with a history of safety problems, and 87
these include a number of products from emerging and developing countries (EC, 2009, 88
2010). Moreover, scientific evidence suggested that FSMSs implemented in fresh produce 89
companies in developing and emerging economies are not sufficiently addressing the food 90
safety risks (de Quadros Rodrigues, et al., 2014; Sawe, et al., 2014; Uyttendaele, Moneim, 91
Ceuppens, & El Tahan, 2014). However, deeper understanding is needed about the actual 92
status of FSMSs in different world countries involved in fresh produce trade. Moreover, 93
insight is lacking about the factors determining differences in the FSMS status, for instance 94
between companies in the EU and in (importing) developing and emerging countries. 95
The objective of this study was to investigate the status of FSMSs implemented at primary 96
production companies of fresh produce, to examine the potential differences between 97
companies operating in EU and non-EU (developing and emerging) countries exporting to the 98
EU, and to explore the explaining factors. 99
100

MANUSCRIP
T
ACCEPTED
ACCEPTED MANUSCRIPT
6
2. Materials and methods 101
2.1.Diagnostic tool for assessing the status of FSMSs in the fresh produce chain 102
The data for the study was collected with a recently developed diagnostic tool that allows 103
assessment of the status of FSMSs in the fresh produce chain, independently from type of 104
product and production, location, standards and guidelines used for the development of the 105
system (Kirezieva, Jacxsens, Uyttendaele, Van Boekel, & Luning, 2013; Kirezieva, 106
Nanyunja, et al., 2013). An FSMS is this part of the quality management system of a company 107
that is specifically addressing food safety (Luning, et al., 2009). The diagnostic tool allows 108
assessment of the core control and assurance activities in an FSMS (Kirezieva, Jacxsens, et 109
al., 2013), and the context factors (product, production, organisational and chain 110
characteristics) affecting design and operation of activities in the FSMS (Kirezieva, 111
Nanyunja, et al., 2013). Finally, the tool allows to measure the system output and the insight a 112
company has on its performance (e.g. results of external inspections or audits, results of 113
sampling) (Kirezieva, Jacxsens, et al., 2013). The diagnostic allows for assessment throughout 114
the FSMSs applied in the supply chain. In this work the diagnostic tool for farm level is 115
applied, including activities as part of the good agricultural practices or any other 116
implemented standards and guidelines. Indicators and grids with stereotypical situations are 117
defined for each indicator of the context, FSMS activities and FSMS output (Table 1). The 118
overall assumption behind the assessment is that high context riskiness requires an advanced 119
level of activities to achieve good output. 120
121
2.2.Data collection 122
Hundred and eighteen (118) companies from twelve (12) countries participated in the study 123
on voluntary ad-hoc basis. The data was collected within case studies, which were selected by 124
following the criteria of: vulnerability to food safety hazards (microbiological, pesticide 125

MANUSCRIP
T
ACCEPTED
ACCEPTED MANUSCRIPT
7
residues), economic relevance, vulnerability to climate change and consumption patterns and 126
trends (Jacxsens, Van Boxstael, & Uyttendaele, 2011). Companies involved were from 127
countries in the European Union (EU): Belgium (leafy greens and strawberries), the 128
Netherlands (leafy greens, strawberries and tomatoes), Spain (leafy greens); and the European 129
Economic Area: Norway (leafy greens and strawberries). The companies in this group of 130
countries were operating under the general food law of the European Union (EC, 2002). A 131
second group of companies were from international cooperation partner countries (ICPC): 132
Brazil (leafy greens), China (apples), Egypt (leafy greens and strawberries), India (mangoes), 133
Serbia (raspberries), Kenya (green beans), South Africa (leafy greens and fruits), and Uganda 134
(hot peppers). The companies in these countries operated under their own legal framework. 135
Data was collected with the diagnostic tool by interviewing the quality assurance manager or 136
farm owner for about one hour and a half by an on-farm visit by the researchers. In several 137
countries (the Netherlands, Spain, South Africa) workshops were organised to fill in the 138
diagnostic tool with help by the researchers. Part of the assessments were paired with visits 139
and microbiological sampling, which will be presented in other manuscripts. Definitive 140
conclusions about the actual food safety levels, however, should be made with caution, 141
because we could compare only with a limited number of companies. In India, China and 142
Egypt, data was collected via interviews with experts in the particular production sector. 143
These were people from national agencies, involved in the establishment of FSMSs at farm 144
level. The study cannot be conclusive for the countries involved, as the sample was not 145
representative for all sectors and supply chains. Contacts with companies were established via 146
the researchers in the countries involved, and based on voluntary participation. 147
148
2.3.Data analysis 149

MANUSCRIP
T
ACCEPTED
ACCEPTED MANUSCRIPT
8
A database was designed in Microsoft Excel 2010 with numbers given (1, 2, 3 and 4) to 150
represent companies’ situation for each of the 69 indicators. Descriptive statistics was 151
performed to determine frequencies and median scores for the companies operating under and 152
outside of the EU general food law. These were also compared statistically by using Mann-153
Whitney U nonparametric test, with significance of results established at p < 0.05. 154
Hierarchical cluster analysis of z-scores was performed by using the furthest neighbour 155
method. Further on, principal component analysis (PCA) with direct Oblimin method and 6 156
retained factors, was used to investigate the principal factors that explain the variation 157
between the companies and to explore which indicators are differentiating the three clusters. 158
Modes were calculated to plot the results in spider web diagrams. All statistical tests were 159
performed by using software package SPSS Statistics 21 for Windows. 160
161
3. Results 162
3.1.Overall status of FSMSs in companies under and outside the EU food law 163
Table 2A displays frequency distributions and median scores for indicators of FSMS 164
activities for the companies operating under and outside the EU food law. Significant 165
differences were reported in the design of several core preventive measures such as, storage 166
facilities, incoming materials control, water control, supplier control, pesticide program, 167
maintenance and calibration program, and irrigation method. The majority of EU companies 168
were following standards and guidelines (median score 3 for 9 out of 12 indicators), and using 169
best available tools and equipment, whereas the non-EU companies showed larger variation 170
and common basis for the activities was the use of own knowledge and experience (median 171
score 2 for 7 out of 12 indicators). Monitoring activities were mostly lacking in the non-EU 172
companies (all indicators with median score 1), but they were also not implemented in many 173
EU companies (Table 2A). This was especially the case with microbiological sampling 174

MANUSCRIP
T
ACCEPTED
ACCEPTED MANUSCRIPT
9
(frequency 32/69). Still, EU companies had better insights into actual operation of control 175
measures as indicators for availability and compliance to procedures and performance of 176
measuring equipment scored at average (3) and advanced level (4). Most companies, both in 177
and outside the EU, had limited information about actual hygienic performance of equipment 178
(1). Assurance activities in the majority of the EU companies were set up according to 179
standards and guidelines (median score 3 for 6 out of 9 indicators), while for the non-EU 180
companies they were missing (1) or at basic level (2). The exception was documentation 181
which scored 3 for companies in both EU and non-EU countries. 182
Table 2B presents the frequency distributions of the indicators scores of FSMS output for the 183
companies operating under and outside the EU general food law. All indicators scored 184
significantly different between companies in EU and non-EU countries, except for the 185
indicators of microbiological sampling and judgement criteria. Most companies did not have 186
information for these, as product sampling for microbiological analysis was not performed. 187
The majority of EU companies were audited by two and more third parties, while half of non-188
EU companies were not audited at all, and half - by only one-third party. Most EU companies 189
had a complaints management system and few customers’ complaints, whereas a smaller 190
percentage of the non-EU companies demonstrated the same results. Similarly, pesticide 191
sampling on a sector or company level was common in the EU, but not in the companies 192
outside of the EU. 193
Table 2C presents the frequency distributions and median of the results for context indicators 194
for the companies operating under and outside the general food law of the EU. Product 195
characteristics exhibited medium (2) to high-risk (3) scores, due to the nature of the 196
commodities included in this study, such as leafy vegetables and berries. Moreover, final 197
products are mostly eaten raw and possibilities for removal of both microbiological and 198
chemical contamination are limited. The features of the production system were also assessed 199

MANUSCRIP
T
ACCEPTED
ACCEPTED MANUSCRIPT
10
as high risk (3), as most companies were operating open field where contamination can occur 200
from people and environment (e.g. wild life). Climate conditions and water supply were 201
assessed mostly at moderate risk (score 2) for the companies in the EU, because they typically 202
operate in moderate climate zones and use underground water sources. The risk was high (3) 203
for the companies operating outside of Europe, as many were located in tropical and sub-204
tropical countries and were commonly using surface water. For all companies organisational 205
characteristics were mostly at moderate (2) and high risk (3), which represent technical staff 206
with limited knowledge on safety, use of seasonal workers with low competences and 207
involvement, and general quality/safety policy as e.g. introduced by the retailer. The majority 208
of EU companies operated in moderate riskiness (2) of context due to more formalization and 209
supporting information system. Bigger differences were observed between EU and non-EU 210
companies for the chain characteristics. Most EU companies showed lower risk of chain 211
context (5 indicators at score 2, and 3 at score 1) compared to the non-EU companies (5 212
indicators at score 4, and 3 indicators at score 2). This was because of the regular information 213
exchange, local supply, sophisticated logistic facilities, supportive food safety authority, 214
external support (such as sector organisations) and legal framework. However, they had to 215
answer stricter stakeholder requirements, compared to their non-EU counterparts. Common 216
for all companies was the moderate risk (2) of stakeholder requirements. 217
218
3.2.Clusters of companies differing in FSMS status 219
A hierarchical cluster analysis was performed to further explore how companies group 220
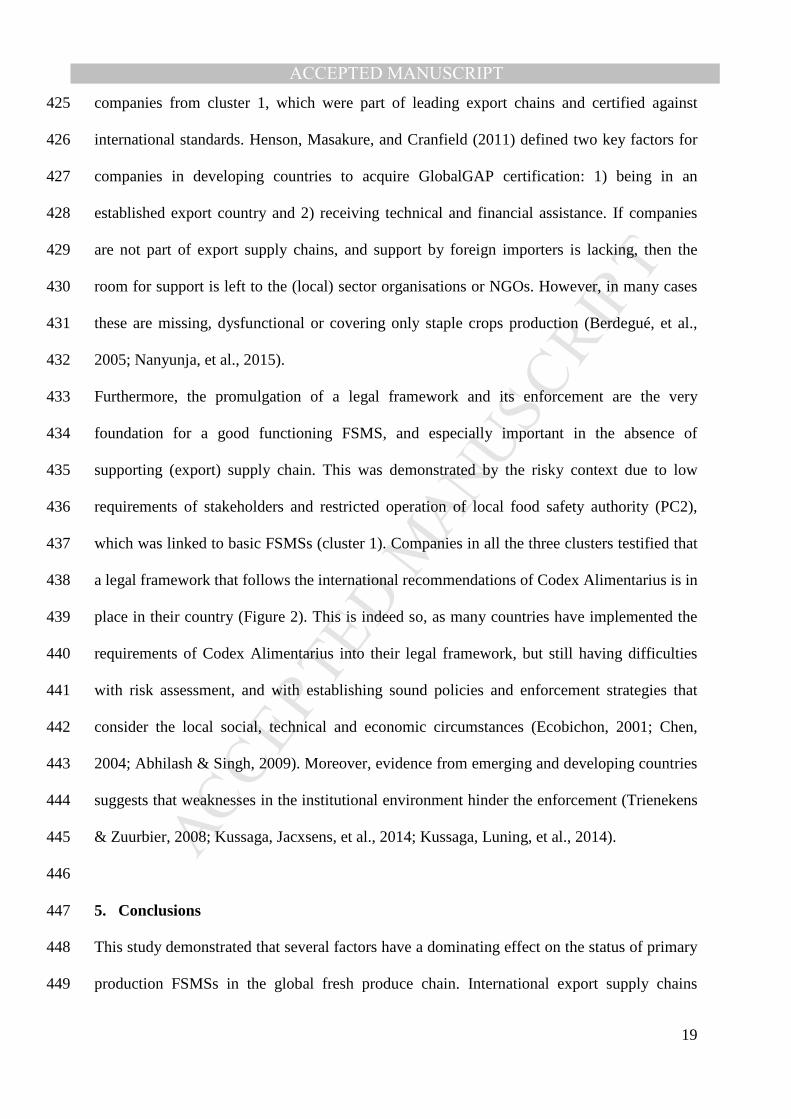
according to their FSMS status and adaptation of FSMSs to the riskiness of the context, which 221
resulted in three clusters (Figure 1). Table 3 is showing the distribution of the companies in 222
the clusters according to type of product, size, and certifications. Cluster 1 consists of forty-223
seven companies located in both EU and non-EU countries. These companies have 224

MANUSCRIP
T
ACCEPTED
ACCEPTED MANUSCRIPT
11
implemented and were certified against several voluntary private standards, such as 225
GlobalGAP, BRC, ISO, and private brand standards. In cluster 2 forty-two companies were 226
grouped from both EU and non-EU countries. However, these were certified only against 227
national standards and GlobalGAP, and no other private standards were included. In the last 228
cluster 3 twenty-nine companies were grouped, that were small and from non-EU countries. 229
These companies were not certified against any standard. 230
Figure 2 presents the median score results for the context, FSMS activities and output 231
indicators. Product and process characteristics scored similar for cluster 1 and 2 companies. 232
However, the lower score (1) for the indicator ‘microbial risk of initial materials’ was due to 233
treatments of seeds and seedlings (UV, chemical disinfection). Climate conditions and water 234
source scored 3 (high risk) for the companies in cluster 3, which was related to tropical and 235
sub-tropical conditions, and the use of uncontrolled surface water sources (see also Table 2C). 236
A similar pattern was observed for the indicators of organisational and chain characteristics, 237
as cluster 1 demonstrated least risky (scores 1 and 2), and cluster 3 - most risky profile 238
(mostly scores 3). The latter showed lack of organisational (i.e. lack of technical staff, low 239
competences of workers, lack of management commitment and workers’ involvement), and 240
supply chain support (i.e. lack of power in supply chain and information exchange, lack of 241
logistic facilities and support from authorities and other organisations). Still, low risk scores 242
(1) were given to the indicators of ‘variability of workers’, ‘severity of stakeholder 243
requirements’ and ‘specificity of food safety legal framework’. These scores can be explained 244
by the fact that cluster 3 contained small family farms, oriented mainly towards local markets 245
and ethnical shops in the EU countries. 246
FSMS activities of the companies in cluster 1 were mostly at level 3, design according to the 247
standards and using standard equipment and methods. Even more advanced level 4 was given 248
for storage facilities, fertilisation program, pesticide management, and sampling for pesticide 249

MANUSCRIP
T
ACCEPTED
ACCEPTED MANUSCRIPT
12
residues and microorganisms. Level 4 is attributed when activities are adapted to fit-for-250
purpose and tested for specific farm/company situation. Companies in cluster 2 scored mostly 251
at 3 (average level), but several activities such as hygienic design of equipment, material 252
control and irrigation method demonstrated even lower level (2). This score was given to 253
activities designed according to historical knowledge and own experience. Companies in 254
cluster 3 had basic control activities. Only few activities (these are, maintenance program, 255
personal hygiene requirements, and pesticide program) were actually implemented in these 256
companies. 257
Companies in cluster 1 had also average level (3) for the indicators about actual operation of 258
control activities, and even advanced level (4) for actual storage capacity and performance of 259
analytical equipment. Companies in cluster 2 did not have information about many of the 260
activities. Still, procedures were available, updated ad-hoc and mostly complied to. No 261
information about actual operation was available in the companies from cluster 3. 262
Assurance activities in companies of cluster 1 were at average level (3), meaning that 263
companies were actively following the changes, regularly updating the system, validating via 264
external experts, regularly verifying the activities internally, and systematically documenting. 265
Most of the activities were at basic level (2) in the companies in cluster 2, and validation was 266
not done (1). Still, systematic documentation and record-keeping were at place (3). Validation 267
activities were lacking completely for the companies in cluster 3. 268
Regarding the information for the system output, companies in cluster 1 were regularly 269
audited by several third parties for their multiple standards (3), had few remarks and 270
complaints from customers (4). These companies were taking systematic samples for 271
pesticide residues and even a sampling plan for microorganisms was present (3). Companies 272
in cluster 2 showed similar results for FSMS evaluation, complain registration and pesticide 273
sampling. However, they were lacking sampling plans microorganisms (1), and non-274

MANUSCRIP
T
ACCEPTED
ACCEPTED MANUSCRIPT
13
conformities registration (1). Again, companies in cluster 3 did not have any information 275
about their output (1). 276
277
3.3. Exploring the main factors behind differences between the clusters 278
A Principle Component Analysis (PCA) was performed to investigate the main factors 279
explaining the variation and differentiation between clusters of companies. Four indicators 280
were excluded because the Kaiser-Meyer-Olkin measure of sampling adequacy was below 281
0.5; namely ‘microbial risk of initial materials’, ‘risk of initial materials to pesticide residues’, 282
‘microbial risk of final product’, ‘risk of final product to pesticide residues’ and ‘variability of 283
workers’. Figure 3 presents the loading plots for the first three principle components. The first 284
component (PC1) explains 36.9%, the second component (PC2) - 7.3%, and the third 285
component (PC3) - 5.1% of variation (49.3% of the total variation). The next three 286
components explain below 5% of the variance, 4.1% (PC4), 3.6% (PC5) and 3.2 (PC6), and 287
they were not further investigated. 288
When riskiness of organisational and chain characteristics load negatively on PC1 (lower 289
risk), then design of several core control activities (these were, sanitation program, 290
maintenance program, supplier control, material control), actual operation of control activities 291
(availability of procedures and hygienic performance), and all assurance activities load 292
positively, with more advanced levels (Figure 3). This principle component may be linked to 293
availability of specific, scientific based information within the company and the supply chain 294
to support control and assurance activities. When requirements from stakeholders load as low 295
risk and support from authorities load as high risk on PC2, then adequacy of analytical 296
equipment for pesticide residues loads low (lower level), and packaging and partial 297
intervention load positively (higher levels). This principle component can be linked to the 298
support of public and private organisations in monitoring (of pesticide residues), providing 299

MANUSCRIP
T
ACCEPTED
ACCEPTED MANUSCRIPT
14
information about post-harvest intervention strategies and the factors affecting their 300
effectiveness. Storage loads positively on PC3, together with irrigation method, personal 301
hygiene and hazard analysis. This could be linked to companies that invest in storage and 302
related main control measures (e.g. export oriented). 303
PCA score plots were constructed with a total variance of 49.3% (PC1 and PC2; Figure 4A 304
and 4B) to demonstrate the differentiation between clusters. Cluster 1 was separated from 305
cluster 3 by PC1, while cluster 2 was somewhere in between and most companies were split 306
by PC2. However, eleven companies loaded positively on PC2 and ten of them were from 307
Norway. From Figure 4A it can be derived that cluster 1 companies were mostly separated 308
from the rest by PC1. Cluster 2 companies were fragmented by both PC1 and PC2. Figure 4B 309
shows that cluster 3 was split from cluster 1 by PC3, while companies in cluster 2 were again 310
scattered. 311
312
4. Discussion 313
• Status of FSMSs in view of context riskiness 314
The data was collected with the diagnostic tool, which allows assessment of the core control 315
and assurance activities in an FSMS, the system output (Kirezieva, Jacxsens, et al., 2013), and 316
the context factors affecting design and operation of activities in the FSMS (Kirezieva, 317
Nanyunja, et al., 2013). The general assumption behind the diagnostic tool used for data 318
collection is that companies working in high-risk context need advanced level of activities to 319
achieve a good system output (Luning, et al., 2011). The combination of high risk-context 320
characteristics and simple (basic level) FSMS imply a higher risk of food safety problems (de 321
Quadros Rodrigues, et al., 2014; Uyttendaele, et al., 2014). 322
All companies in this study were dealing with risky product linked to type of cultivated 323
produce, open field production and potential microbiological or chemical contamination of 324

MANUSCRIP
T
ACCEPTED
ACCEPTED MANUSCRIPT
15
fresh produce, and high risk organisational characteristics, such as high turnover of workers 325
with low involvement and competences. These are typical issues that fresh produce farms face 326
(Ahumada & Villalobos, 2011). However, most EU companies were working in a lower or 327
moderate risk of production and supply chain context, compared to the non-EU companies 328
(Table 2C). This was due to the use of controlled water sources, protected cultivation, 329
sophisticated infrastructure, and collaborative supply chain. Protected cultivation and 330
controlled water sources are used to increase yields, control abiotic factors and promote pest 331
management in integrated fresh-cut and other added-valued supply chains (Nicola, et al., 332
2009). 333
Many non-EU companies had simple FSMS based on own knowledge and experience, which 334
in combination with their high-risk context characteristics induce a higher risk on safety 335
problems (Table 2A). Previous studies discuss shortcomings in FSMSs leading to food safety 336
problems (Kussaga, Jacxsens, et al., 2014; Uyttendaele, et al., 2014). In comparison, most 337
companies within the EU had control activities based on standards, using expert knowledge 338
and standard equipment (Table 2A). Studies done in developing and emerging countries were 339
discussing the lack of knowledge and competences in the companies, particularly 340
smallholders (García Martinez & Poole, 2004; Trienekens & Zuurbier, 2008; Kussaga, 341
Jacxsens, et al., 2014; Sawe, et al., 2014). Assurance activities were following similar trend 342
with the exception of validation of monitoring systems and verification of people, which were 343
mostly ad-hoc in the EU companies and lacking in many non-EU companies. A study in the 344
meat and dairy sectors in Europe showed similar difficulties in setting verification and other 345
assurance activities (Sampers, Toyofuku, Luning, Uyttendaele, & Jacxsens, 2012; Jacxsens, et 346
al., 2015; Luning, et al., 2015). It was stressed before that verification is crucial for assuring 347
effectiveness of activities, but requires knowledge and resources (Nguyen, Wilcock, & Aung, 348
2004; Luning, et al., 2009). 349

MANUSCRIP
T
ACCEPTED
ACCEPTED MANUSCRIPT
16
Following the basic assumption behind the diagnostic tool, the EU companies showed better 350
system output, and generally more information about it was available to them (Table 2B). 351
They were audited by two and more third parties, which was not done or only by one in the 352
non-EU companies. This could be explained by the fact that audits in developing countries are 353
commonly done by the importers (retailers) only in companies aimed at exporting (Jaffee & 354
Masakure, 2005; Henson & Jaffee, 2008). Multinational retail chains have a dominating role 355
in imposing quality and safety standards and in many situations the role of the local 356
institutions is still weak (Berdegué, Balsevich, Flores, & Reardon, 2005). 357
In general, EU companies had also more information about the output of their FSMSs due to 358
company sampling and sector monitoring for pesticide residues. In developing countries that 359
was mainly done in the export farms, as local governments and organisations lack 360
infrastructure, capacity and resources to conduct monitoring (Jaffee & Henson, 2005; 361
Abhilash & Singh, 2009). Pesticide residues have been regulated in the EU (EC, 2005), and 362
by Codex Alimentarius Commission (CAC, 2010b) for some years now. Companies have put 363
lots of efforts in the management of pesticides, and this was evident also from our study as 93 364
(out of 118) companies demonstrated average (3) and advanced levels (4) (Table 2A). In 365
comparison, microbiological hazards only recently received some attention in (international) 366
recommendations, as a reaction to outbreaks e.g. sprouted seeds - EU 2011 (Soon, Seaman, & 367
Baines, 2013), spinach - USA 2006 (CFERT, 2007), and Jalapeño peppers - USA 2008 368
(Barton Behravesh, et al., 2011). Moreover, guidelines and standards for core control 369
activities to prevent microbiological contamination such as control of irrigation water quality 370
exist only in several regions and there is no internationally accepted recommendation for the 371
quality of water (Pachepsky, et al., 2011). Still most companies do not have enough 372
knowledge and awareness about microbiological hazards, and few of the companies in this 373
study performed sampling (score 1). 374

MANUSCRIP
T
ACCEPTED
ACCEPTED MANUSCRIPT
17
However, not all non-EU companies were facing the hurdles discussed above. A group 375
(clusters 1 and 2; Table 3) of non-EU companies also demonstrated average to advanced 376
FSMSs (Figure 2). Actually, non-EU companies were present in all the three clusters of 377
companies with differing FSMS status. After the cluster analysis typical profiles of companies 378
irrespective of their location and legislation followed (EU or not) were distinguished, and 379
several main factors that define these profiles were defined. 380
• The role of supply chains and private standards 381
From the study it became clear that collaborative/supportive supply chains (PC1; figure 3 and 382
4) contribute to more advanced FSMS and good system output (cluster 1; figure 2), as 383
companies demonstrated advanced knowledge and expertise about safety and quality 384
management. The results were independent from company size (micro, small, medium or 385
big), and location (EU or non-EU). However, the companies in this cluster were part of 386
leading fresh produce supply chains (in Spain, the Netherlands, Kenya, and South Africa). 387
Moreover, these companies had several certifications (Table 3), including many strict private 388
standards. Studies reported that some exporters have invested in infrastructure, quality 389
management and even own product-testing laboratories in order to meet strict requirements of 390
the (EU) markets (Jaffee & Masakure, 2005; Okello & Swinton, 2007; Henson, 2008). In 391
contrast, the companies in cluster 3 did not have any standards implemented and were 392
operating in less demanding chains supplying the local market or ethnic grocery shops in the 393
EU. They had only few control activities implemented scoring at basic level, which means 394
that they were following own knowledge and experience. No assurance activities and no 395
information about the system output were available. These results were linked to the lack of 396
information and expertise within companies and supply chains. Similarly, Trienekens & 397
Zuurbier (2008) report difficulties in the implementation of GAP and GHP in least developed 398
countries, and strive for implementation of international standards in emerging export 399

MANUSCRIP
T
ACCEPTED
ACCEPTED MANUSCRIPT
18
countries. Moreover, our findings are in line with studies demonstrating the lower levels of 400
safety and quality of horticultural products sold at wet markets and local supermarkets in 401
developing countries (e.g. Ponniah, et al., 2010; Gorton, Sauer, & Supatpongkul, 2011). 402
All companies in cluster 2 were following national standards or GlobalGAP, which is in line 403
with empirical evidence showing that prescriptive national standards lead to average levels of 404
FSMS activities, but companies still experience difficulties to tailor to their specific 405
circumstances (Aggelogiannopoulos, Drosinos, & Athanasopoulos, 2007; Sampers, et al., 406
2012). Interestingly this was the case also with the companies that were only GlobalGAP 407
certified, indicating the baseline status of this standard. Baseline standards put minimum 408
requirements, focusing on core activities from a public health perspective (Fearne & Garcia 409
Martinez, 2005). 410
411
• The role of the institutional environment 412
Sector organisations and non-governmental organisations (NGOs) that support companies 413
were another important factor affecting the status of FSMSs, especially in the case of small 414
and medium companies. These were largely represented in clusters 2 and 3. In both clusters 415
activities, such as, hygienic design of equipment, initial material control, and monitoring, 416
were not implemented. Even basic activities were lacking in cluster 3, and there was no or 417
only ad-hoc information about actual operation of control activities in both clusters. 418
Companies in cluster 2 and 3 had limited insights about the output of their systems (Table 2B) 419
due to e.g. shortcomings in monitoring of pesticide residues. In some EU countries these 420
activities are done or coordinated by sector organisations, but improvements are possible in 421
the structure and scientific base of the, e.g., sampling activities (Kirezieva, et al., 2015). 422
Coordinated sampling for pesticide residues was not done in many of the companies located 423
in emerging countries in clusters 2 and 3 (Figure 2). They were well established in the 424
MANUSCRIP
T
ACCEPTED
ACCEPTED MANUSCRIPT
19
companies from cluster 1, which were part of leading export chains and certified against 425
international standards. Henson, Masakure, and Cranfield (2011) defined two key factors for 426
companies in developing countries to acquire GlobalGAP certification: 1) being in an 427
established export country and 2) receiving technical and financial assistance. If companies 428
are not part of export supply chains, and support by foreign importers is lacking, then the 429
room for support is left to the (local) sector organisations or NGOs. However, in many cases 430
these are missing, dysfunctional or covering only staple crops production (Berdegué, et al., 431
2005; Nanyunja, et al., 2015). 432
Furthermore, the promulgation of a legal framework and its enforcement are the very 433
foundation for a good functioning FSMS, and especially important in the absence of 434
supporting (export) supply chain. This was demonstrated by the risky context due to low 435
requirements of stakeholders and restricted operation of local food safety authority (PC2), 436
which was linked to basic FSMSs (cluster 1). Companies in all the three clusters testified that 437
a legal framework that follows the international recommendations of Codex Alimentarius is in 438
place in their country (Figure 2). This is indeed so, as many countries have implemented the 439
requirements of Codex Alimentarius into their legal framework, but still having difficulties 440
with risk assessment, and with establishing sound policies and enforcement strategies that 441
consider the local social, technical and economic circumstances (Ecobichon, 2001; Chen, 442
2004; Abhilash & Singh, 2009). Moreover, evidence from emerging and developing countries 443
suggests that weaknesses in the institutional environment hinder the enforcement (Trienekens 444
& Zuurbier, 2008; Kussaga, Jacxsens, et al., 2014; Kussaga, Luning, et al., 2014). 445
446
5. Conclusions 447
This study demonstrated that several factors have a dominating effect on the status of primary 448
production FSMSs in the global fresh produce chain. International export supply chains 449

MANUSCRIP
T
ACCEPTED
ACCEPTED MANUSCRIPT
20
promote capacity building within companies in the chain, to answer the stringent 450
requirements of private brand standards. This is especially an important factor in emerging 451
and developing countries where local institutional environments often fail to support 452
companies in setting and implementing their FSMSs. Moreover, the legislative framework in 453
these countries still requires improvements in the set-up and enforcement. All this has 454
negative consequences for the FSMSs in companies supplying the local markets. 455
In companies located in the EU, sector and other produce organisations facilitate the sampling 456
for pesticide residues and collaboration in the sector. However, farmers showed less 457
knowledge and overall awareness regarding microbiological hazards, which is related to the 458
less attention paid to these in the current legislation and standards. Furthermore, standards are 459
an important tool to trigger the maturation of the systems as companies that were lacking any 460
operated at a very basic level - with only few activities implemented. 461
The insights from this study indicate the need of stratified measures and policies to support 462
companies in the fresh produce chain in designing and operating their FSMSs according to the 463
institutional environment in which they operate. This study was a first attempt to provide 464
evidence about major factors affecting the status of FSMSs in the fresh produce chain based 465
on semi-quantitative data analysis. More in-depth case studies into supporting contexts could 466
provide understanding about best strategies and practices to improve the status of FSMSs. 467
468
Acknowledgements 469
This research has received funding from the European Community’s Seventh Framework 470
Program (FP7) under grant agreement no 244994 (project Veg-i-Trade ‘Impact of Climate 471
Change and Globalization on Safety of Fresh Produce – Governing a Supply Chain of 472
Uncompromised Food Sovereignty’ www.veg-i-trade.org). We would like to thank the 473
experts and the companies that participated in the study. 474

MANUSCRIP
T
ACCEPTED
ACCEPTED MANUSCRIPT
21
References 475
Abhilash, P. C., & Singh, N. (2009). Pesticide use and application: An Indian scenario. Journal of 476 Hazardous Materials, 165(1–3), 1-12. 477
Aggelogiannopoulos, D., Drosinos, E. H., & Athanasopoulos, P. (2007). Implementation of a quality 478 management system (QMS) according to the ISO 9000 family in a Greek small-sized winery: 479 A case study. Food Control, 18(9), 1077-1085. 480
Ahumada, O., & Villalobos, J. R. (2011). A tactical model for planning the production and distribution 481 of fresh produce. Annals of Operations Research, 190(1), 339-358. 482
Barton Behravesh, C., Mody, R. K., Jungk, J., Gaul, L., Redd, J. T., Chen, S., Cosgrove, S., Hedican, 483 E., Sweat, D., Chávez-Hauser, L., Snow, S. L., Hanson, H., Nguyen, T.-A., Sodha, S. V., 484 Boore, A. L., Russo, E., Mikoleit, M., Theobald, L., Gerner-Smidt, P., Hoekstra, R. M., 485 Angulo, F. J., Swerdlow, D. L., Tauxe, R. V., Griffin, P. M., & Williams, I. T. (2011). 2008 486 Outbreak of Salmonella Saintpaul Infections Associated with Raw Produce. New England 487 Journal of Medicine, 364(10), 918-927. 488
Berdegué, J. A., Balsevich, F., Flores, L., & Reardon, T. (2005). Central American supermarkets’ 489 private standards of quality and safety in procurement of fresh fruits and vegetables. Food 490 Policy, 30(3), 254-269. 491
Bernard, H., Faber, M., Wilking, H., Haller, S., Höhle, M., Schielke, A., Ducomble, T., Siffczyk, C., 492 Merbecks, S. S., Fricke, G., Hamouda, O., Stark, K., Werber, D., & Team, o. b. o. t. O. I. 493 (2014). Large multistate outbreak of norovirus gastroenteritis associated with frozen 494 strawberries, Germany, 2012 Euro surveillance : bulletin europeen sur les maladies 495 transmissibles = European communicable disease bulletin, 19(8), 1-9. 496
CAC. (2009). Food hygiene. Basic texts. . In (Fourth Edition ed.). Rome, Italy: World Health 497 Organization, Food and Agriculture Organization of the United Nations. 498
CAC. (2010a). Code of hygienic practice for fresh fruits and vegetables. CAC/RCP 53-2003. In: 499 Codex Alimentarius Commission. 500
CAC. (2010b). Codex Pesticides Residues in Food Online Database. In: FAO/WHO Food Standards 501 Codex Alimentarius. Accessed on: 18 September 2014. 502
CFERT. (2007). Investigation of an Escherichia coli O157:H7 outbreak associated with Dole pre-503 packaged spinach. In: California Food Emergency Response Team. 504
Chen, J. (2004). Challenges to developing countries after joining WTO: risk assessment of chemicals 505 in food. Toxicology, 198(1–3), 3-7. 506
de Quadros Rodrigues, R., Loiko, M. R., Minéia Daniel de Paula, C., Hessel, C. T., Jacxsens, L., 507 Uyttendaele, M., Bender, R. J., & Tondo, E. C. (2014). Microbiological contamination linked 508 to implementation of good agricultural practices in the production of organic lettuce in 509 Southern Brazil. Food Control, 42(0), 152-164. 510
Diop, N., & Jaffee, S. (2005). Chapter 13. Fruits and vegetables: Global trade and competition in fresh 511 and processed produc markets. In M. A. Aksoy & J. C. Beghin (Eds.), Global Agricultural 512 Trade and Developing Countries (pp. 237-257): The International Bank for Reconstruction 513 and Development / The World Bank. 514
Djekic, I., Tomic, N., Smigic, N., Tomasevic, I., Radovanovic, R., & Rajkovic, A. (2013). Quality 515 management effects in certified Serbian companies producing food of animal origin. Total 516 Quality Management & Business Excellence, 25(3-4), 383-396. 517
EC. (2002). Regulation (EC) No 178/2002 of the European Parliament and of the Council of 28 518 January 2002 laying down the general principles and requirements of food law, establishing 519 the European Food Safety Authority and laying down procedures in matters of food safety. 520 Official Journal of the European Union, L 31, 1–24 521
EC. (2005). Regulation (EC) No 396/2005 of the European Parliament and of the Council of 23 522 February 2005 on maximum residue levels of pesticides in or on food and feed of plant and 523 animal origin and amending Council Directive 91/414/EEC (Text with EEA relevance) 524 Official Journal of the European Union, L 070 0001 - 0016. 525
EC. (2009). Commission Regulation No.669/2009 of 24 July 2009 implementing Regulation (EC) No 526 882/2004 of the European Parliament and of the Council as regards the increased level of 527
MANUSCRIP
T
ACCEPTED
ACCEPTED MANUSCRIPT
22
official controls on imports of certain feed and food of non-animal origin and amending 528 Decision 2006/504/EC. In E. Commission (Ed.). 529
EC. (2010). Commission Regulation No.1099/2010 of 26 November 2010 amending Annex I to 530 Regulation (EC) No 669/2009 implementing Regulation (EC) No 882/2004 of the European 531 Parliament and of the Council as regards the increased level of official controls on imports of 532 certain feed and food of non-animal origin. In E. Commission (Ed.). 533
Ecobichon, D. J. (2001). Pesticide use in developing countries. Toxicology, 160(1–3), 27-33. 534 EFSA. (2011). Tracing seeds, in particular fenugreek (Trigonella foenum-graecum) seeds, in relation 535
to the Shiga toxin-producing E. coli (STEC) O104:H4 2011 Outbreaks in Germany and 536 France. In Report of: European Food Safety Authority. 537
EFSA. (2014). Tracing of food items in connection to the multinational hepatitis A virus outbreak in 538 Europe EFSA Journal, 12(9), 186pp. 539
FAOSTAT. (2013). Food and Agriculture Organization Corporate Statistical Database. In 540 http://faostat3.fao.org/home/index.html#HOME. 541
Fearne, A., & Garcia Martinez, M. (2005). Opportunities for the coregulation of food safety: Insights 542 from the United Kingdom. Choices: The Magazine of Food, Farm, and Resource Issues, 543 20(2), 109-116. 544
Fründt, T. W., Höpker, W. W., Hagel, C., Sperhake, J. P., Isenberg, A. H., Lüth, S., Lohse, A. W., 545 Sauter, G., Glatzel, M., & Püschel, K. (2013). EHEC-O104:H4-Ausbruch im Sommer 2011. 546 23(5), 374-382. 547
García Martinez, M., & Poole, N. (2004). The development of private fresh produce safety standards: 548 implications for developing Mediterranean exporting countries. Food Policy, 29(3), 229-255. 549
GlobalGAP. (2012). Integrated Farm Assurance (IFA) Standard Version 4 550 Gorton, M., Sauer, J., & Supatpongkul, P. (2011). Wet Markets, Supermarkets and the “Big Middle” 551
for Food Retailing in Developing Countries: Evidence from Thailand. World Development, 552 39(9), 1624-1637. 553
Henson, S. (2008). The role of public and private standards in regulating international food markets. 554 Journal of international Agricultural Trade and Development, 4(1), 63-81. 555
Henson, S., & Humphrey, J. (2010). Understanding the Complexities of Private Standards in Global 556 Agri-Food Chains as They Impact Developing Countries. The Journal of Development 557 Studies, 46(9), 1628-1646. 558
Henson, S., & Jaffee, S. (2008). Understanding Developing Country Strategic Responses to the 559 Enhancement of Food Safety Standards. World Economy, 31(4), 548-568. 560
Henson, S., Masakure, O., & Cranfield, J. (2011). Do Fresh Produce Exporters in Sub-Saharan Africa 561 Benefit from GlobalGAP Certification? World Development, 39(3), 375-386. 562
Herzfeld, T., Drescher, L. S., & Grebitus, C. (2011). Cross-national adoption of private food quality 563 standards. Food Policy, 36(3), 401-411. 564
Jacxsens, L., Kirezieva, K., Luning, P. A., Ingelrham, J., Diricks, H., & Uyttendaele, M. (2015). 565 Measuring microbial food safety output and comparing self-checking systems of food 566 business operators in Belgium. Food Control, 49(0), 59-69. 567
Jacxsens, L., Luning, P. A., Marcelis, W. J., van Boekel, T., Rovira, J., Oses, S., Kousta, M., Drosinos, 568 E., Jasson, V., & Uyttendaele, M. (2011). Tools for the performance assessment and 569 improvement of food safety management systems. Trends in Food Science & Technology, 22, 570 Supplement 1(0), S80-S89. 571
Jacxsens, L., Uyttendaele, M., Devlieghere, F., Rovira, J., Gomez, S. O., & Luning, P. A. (2010). Food 572 safety performance indicators to benchmark food safety output of food safety management 573 systems. International Journal of Food Microbiology, 141, Supplement(0), S180-S187. 574
Jacxsens, L., Van Boxstael, S., & Uyttendaele, M. (2011). Selection of case studies based on the 575 vulnerability of fresh produce to food safety hazards and climate change in a globalized world. 576 In European Symposium of International Association of Food Protection. Ede, the 577 Netherlands. 578
Jaffee, S., & Henson, S. (2004). Standards and Agro-Food Exports from Developing Countries: 579 Rebalancing the Debate. World Bank Policy Research Working Paper, 3348. 580
Jaffee, S., & Henson, S. (2005). Chapter 6. Agro-food exports from developing countries: The 581 challenges posed by standards. In M. A. Aksoy & J. C. Beghin (Eds.), Global Agricultural 582
MANUSCRIP
T
ACCEPTED
ACCEPTED MANUSCRIPT
23
Trade and Developing Countries (pp. 91-114): The International Bank for Reconstruction and 583 Development / The World Bank. 584
Jaffee, S., & Masakure, O. (2005). Strategic use of private standards to enhance international 585 competitiveness: Vegetable exports from Kenya and elsewhere. Food Policy, 30(3), 316-333. 586
Kirezieva, K., Jacxsens, L., Hagelaar, G., van Boekel, M. A. J. S., Uyettendaele, M., & Luning, P. A. 587 (2015). Exploring the influence of context on food safety management: Case studies of leafy 588 greens production in Europe. Food Policy, under review. 589
Kirezieva, K., Jacxsens, L., Uyttendaele, M., Van Boekel, M. A. J. S., & Luning, P. A. (2013). 590 Assessment of Food Safety Management Systems in the global fresh produce chain. Food 591 Research International, 52(1), 230-242. 592
Kirezieva, K., Nanyunja, J., Jacxsens, L., van der Vorst, J. G. A. J., Uyttendaele, M., & Luning, P. A. 593 (2013). Context factors affecting design and operation of food safety management systems in 594 the fresh produce chain. Trends in Food Science & Technology, 32(2), 108-127. 595
Kussaga, J. B., Jacxsens, L., Tiisekwa, B. P. M., & Luning, P. A. (2014). Food safety management 596 systems performance in African food processing companies: a review of deficiencies and 597 possible improvement strategies. Journal of the Science of Food and Agriculture, n/a-n/a. 598
Kussaga, J. B., Luning, P. A., Tiisekwa, B. P. M., & Jacxsens, L. (2014). Challenges in Performance 599 of Food Safety Management Systems: A Case of Fish Processing Companies in Tanzania. 600 Journal of Food Protection, 77(4), 621-630. 601
Laksanalamai, P., Joseph, L. A., Silk, B. J., Burall, L. S., L. Tarr, C., Gerner-Smidt, P., & Datta, A. R. 602 (2012). Genomic Characterization of Listeria monocytogenes Strains Involved in a Multistate 603 Listeriosis Outbreak Associated with Cantaloupe in US. PLoS ONE, 7(7), e42448. 604
Luning, P. A., Bango, L., Kussaga, J., Rovira, J., & Marcelis, W. J. (2008). Comprehensive analysis 605 and differentiated assessment of food safety control systems: a diagnostic instrument. Trends 606 in Food Science & Technology, 19(10), 522-534. 607
Luning, P. A., Kirezieva, K., Hagelaar, G., Rovira, J., Uyttendaele, M., & Jacxsens, L. (2015). 608 Performance assessment of food safety management systems in animal-based food companies 609 in view of their context characteristics: A European study. Food Control, 49, 11-22. 610
Luning, P. A., Marcelis, W. J., Rovira, J., van Boekel, M. A. J. S., Uyttendaele, M., & Jacxsens, L. 611 (2011). A tool to diagnose context riskiness in view of food safety activities and 612 microbiological safety output. Trends in Food Science &Technology, 22, Supplement 1(0), 613 S67-S79. 614
Luning, P. A., Marcelis, W. J., Rovira, J., Van der Spiegel, M., Uyttendaele, M., & Jacxsens, L. 615 (2009). Systematic assessment of core assurance activities in a company specific food safety 616 management system. Trends in Food Science & Technology, 20(6-7), 300-312. 617
Lynch, M. F., Tauxe, R. V., & Hedberg, C. W. (2009). The growing burden of foodborne outbreaks 618 due to contaminated fresh produce: risks and opportunities. Epidemiology and Infection, 619 137(Special Issue 03), 307-315. 620
Nanyunja, J., Jacxsens, L., Kirezieva, K., Kaaya, A. N., Luning, P. A., Rademaker, M., & Uyttendaele, 621 M. (2015). Benchmarking food safety management systems for fresh produce in East Africa: 622 A case study of green bean farms in Kenya versus hot pepper farms in Uganda. Journal of 623 Food Protection, under review. 624
Nguyen, T., Wilcock, A., & Aung, M. (2004). Food safety and quality systems in Canada: An 625 exploratory study. International Journal of Quality & Reliability Management, 21(6), 655-626 671. 627
Nicola, S., Tibaldi, G., Fontana, E., Wojciech, J. F., Robert, L. S., Bernhard, B., & Prussia, S. E. 628 (2009). Chapter 10 - Fresh-cut Produce Quality: Implications for a Systems Approach. In 629 Postharvest Handling (Second Edition) (pp. 247-282). San Diego: Academic Press. 630
Okello, J. J., & Swinton, S. M. (2007). Compliance with International Food Safety Standards in 631 Kenya's Green Bean Industry: Comparison of a Small- and a Large-scale Farm Producing for 632 Export. Applied Economic Perspectives and Policy, 29(2), 269-285. 633
Pachepsky, Y., Shelton, D. R., McLain, J. E. T., Patel, J., Mandrell, R. E., & Donald, L. S. (2011). 634 Chapter two - Irrigation Waters as a Source of Pathogenic Microorganisms in Produce: A 635 Review. In Advances in Agronomy (Vol. Volume 113, pp. 73-138): Academic Press. 636

MANUSCRIP
T
ACCEPTED
ACCEPTED MANUSCRIPT
24
Ponniah, J., Robin, T., Paie, M. S., Radu, S., Ghazali, F. M., Kqueen, C. Y., Nishibuchi, M., 637 Nakaguchi, Y., & Malakar, P. K. (2010). Listeria monocytogenes in raw salad vegetables sold 638 at retail level in Malaysia. Food Control, 21(5), 774-778. 639
RASFF. (2012). The Rapid Alert System for Food and Feed: Annual Report 2012. In. Luxembourg: 640 RASFF. 641
Sampers, I., Toyofuku, H., Luning, P. A., Uyttendaele, M., & Jacxsens, L. (2012). Semi-quantitative 642 study to evaluate the performance of a HACCP-based food safety management system in 643 Japanese milk processing plants. Food Control, 23(1), 227-233. 644
Sawe, C. T., Onyango, C. M., & Njage, P. M. K. (2014). Current food safety management systems in 645 fresh produce exporting industry are associated with lower performance due to context 646 riskiness: Case study. Food Control, 40(0), 335-343. 647
Soon, J. M., Seaman, P., & Baines, R. N. (2013). Escherichia coli O104: H4 outbreak from sprouted 648 seeds. International Journal of Hygiene and Environmental Health, 216(3), 346-354. 649
Trienekens, J., & Zuurbier, P. (2008). Quality and safety standards in the food industry, developments 650 and challenges. International Journal of Production Economics, 113(1), 107-122. 651
Unnevehr, L. J. (2000). Food safety issues and fresh food product exports from LDCs. Agricultural 652 Economics, 23(3), 231-240. 653
Uyttendaele, M., Moneim, A. A., Ceuppens, S., & El Tahan, F. (2014). Microbiological safety of 654 strawberries and lettuce for domestic consumption in Egypt. Journal of Food Processing & 655 Technology, 5-3. 656
Voss, M. D., Closs, D. J., Calantone, R. J., Helferich, O. K., & Speier, C. (2009). The role of security 657 in the food supplier selection decision. Journal of Business Logistics, 30(1), 127-155. 658
Winter, C. K. (2012). Pesticide Residues in Imported, Organic, and “Suspect” Fruits and Vegetables. 659 Journal of Agricultural and Food Chemistry, 60(18), 4425-4429. 660
661

MANUSCRIP
T
ACCEPTED
ACCEPTED MANUSCRIPT
Table 1: Mutual characteristics of the different situations and levels in the diagnostic tool
Context factora Low risk (score 1)b Moderate risk (score 2) High risk (score 3) Product and production characteristics
Low chance of microbial or chemical contamination, growth or survival of pathogens and undesired microorganisms
Potential chance of microbial or chemical contamination, growth or survival of pathogens and undesired microorganisms
High chance of microbial or chemical contamination, growth or survival of pathogens and undesired microorganisms
Organisational characteristics
Supportive administrative conditions for appropriate decision-making.
Constrained (restricted) administrative conditions for appropriate decision-making
Lack of administrative conditions for appropriate decision-making
Chain characteristics Low vulnerability or dependability on other chain actors
Restricted vulnerability or dependability on other chain actors
High vulnerability or dependability on other chain actors
Food safety managementc Basic level (score 2) Moderate level (score 3) Advanced level (score 4) Control activities Standard equipment, unknown capability,
use of own experience/general knowledge, incomplete methods, restricted information, lack of critical analysis, and non-procedure-driven activities, regular unexpected problems, unstable
Based on expert (supplier) knowledge, use of (sector, governmental) guidelines, best practices, standardised, sometimes problems, causes known
Use of specific information, scientific knowledge, critical analysis, procedural methods, adapted and tested in the specific production circumstances, stable, robust
Assurance activities Problem driven, only checking, scarcely reported, not independent positions
Active translation of requirements, additional analysis, regular reporting, and expert support
Pro-active translation of requirements, actual observations and testing, independent positions, scientifically underpinned, and systematic
System outputd Poor output (score 2) Moderate output (score 3) Good output (score 4) Ad-hoc sampling, minimal criteria used for
evaluation, and having various food safety problems
Regular sampling, several criteria used for evaluation, and having restricted food safety problems mainly due to one (restricted) type of problem
Systematic evaluation, using specific tailored criteria, and having no safety problems
a Based on Luning et al. (2011) and (Kirezieva, Nanyunja, et al., 2013) b For all control and assurance activities and the system output, a level 1 is included to address situation when the activity is not applied (low level), or no information is available about the system output. c Based on Luning et al. (2008; 2009) and (Kirezieva, Jacxsens, et al., 2013) d Based on Jacxsens et al. (2010) and (Kirezieva, Jacxsens, et al., 2013)

MANUSCRIP
T
ACCEPTED
ACCEPTED MANUSCRIPT
Table 2A: Frequency of the individual scores and median for the FSMS activities for EU and non-EU companies (The scores represent 1 – low level, 2 – basic level, 3 - average level, and 4 – advanced level), most frequent score indicated in bold.
FSMS activities EU (n=69) Non-EU (n=49) EU Non-EU
1a 2 3 4 1 2 3 4 median Preventive measures design Sophistication of hygienic design of equipment & facilities 19 15 29 6 41 7 1 3 1 Specificity of maintenance program* 4 9 43 13 8 24 7 10 3 2 Adequacy of storage facilities* 9 4 36 20 29 12 4 4 3 1 Specificity of sanitation program 12 18 28 11 18 13 14 4 3 2 Extent of personal hygiene requirements* 17 37 15 9 26 12 2 3 2 Sophistication of incoming materials control* 6 34 21 8 24 12 11 2 2 2 Adequacy of packaging 47 4 10 8 34 5 7 3 1 1 Sophistication of supplier control* 6 20 39 4 15 15 15 4 3 1 Specificity of fertilizer program 35 4 15 15 15 19 13 2 1 2 Specificity of pesticide program* 3 4 25 37 5 13 24 7 3 2 Sophistication of water control* 5 8 33 23 24 10 13 2 3 3 Adequacy of irrigation method* 24 39 6 15 21 12 1 3 2 Intervention method design Adequacy of partial physical intervention (e.g. disinfection) 40 9 15 5 25 16 6 2 1 1 Monitoring system design Appropriateness of hazard analysis* 14 11 38 6 29 8 10 2 3 1 Adequacy analytical methods for microbiological hazards 41 1 2 25 39 4 6 1 1 Adequacy of analytical methods for pesticide residues* 15 2 52 30 5 14 4 1 Specificity of microbiological sampling plan* 32 9 14 14 35 3 10 1 2 1 Specificity of pesticides' sampling plan* 21 6 30 12 37 3 9 3 1 Adequacy of measuring equipment* 12 3 28 26 41 1 7 3 1 Extent of corrective actions* 10 19 24 16 32 1 13 3 3 1 Actual operation of control activities Availability of procedures* 5 9 30 25 20 9 14 6 3 2 Compliance to procedures* 4 8 41 16 13 18 15 3 3 2 Actual hygienic performance of equipment & facilities 33 3 19 14 32 4 8 5 2 1

MANUSCRIP
T
ACCEPTED
ACCEPTED MANUSCRIPT
Actual cooling and storage capacity* 19 9 18 23 36 1 5 7 3 1 Actual capability of partial intervention 51 2 10 6 42 1 6 1 1 Actual capability of packaging 51 4 7 7 37 1 5 6 1 1 Actual measuring equipment performance* 12 3 28 26 37 1 7 4 3 1 Actual analytical equipment performance* 25 1 1 42 39 2 2 6 4 1 Assurance activities Sophistication translating external requirements* 2 18 32 17 17 14 12 6 3 2 Extent of systematic use of feedback information* 7 20 28 14 21 17 6 5 3 2 Sophistication validating preventive measures* 15 18 32 4 24 12 11 2 3 2 Sophistication validating intervention strategies 39 10 17 3 31 7 9 2 1 1 Sophistication validating monitoring system 26 14 27 2 28 11 9 1 2 1 Extent verifying people related performance* 5 34 16 14 31 8 9 1 2 1 Extent verifying equipment & methods performance* 4 30 25 10 25 10 11 3 3 1 Appropriateness documentation* 2 11 43 13 19 5 21 4 3 2 Appropriateness record-keeping system* 1 12 48 8 16 11 19 3 3 2
a Situations 1, 2, 3, and 4 for control and assurance activities correspond to: low level (1) → absent, not applicable, unknown; basic level (2) → lack of scientific evidence, use of company experience/history, variable, unknown, unpredictable, based on common materials/equipment; average level (3) → best practice knowledge/equipment, sometimes variable, not always predictable, based on generic information/guidelines for the product sector; advanced level (4) → scientifically underpinned (accurate, complete), stable, predictable, and tailored for the specific food production situation. * Significant differences (p<0.05) between scores of EU and non-EU companies

MANUSCRIP
T
ACCEPTED
ACCEPTED MANUSCRIPT
Table 2B: Frequency of the individual scores and median for the FSMS output for EU and non-EU companies (The scores represent 1 – no information, 2 – poor output, 3 - moderate output, and 4 – good output), most frequent score indicated in bold.
FSMS activities EU (n=69) Non-EU (n=49) EU Non-EU 1a 2 3 4 1 2 3 4 median
Comprehensiveness external evaluation* 3 9 28 29 25 21 3 3 1 Seriousness of remarks* 3 1 6 59 27 4 8 9 4 1 Type of microbiological complaints* 21 3 8 37 23 8 8 10 4 2 Type of chemical food safety complaints* 8 1 21 39 21 7 13 8 4 2 Type of visual quality complaints* 6 13 41 9 16 14 13 6 3 2 Advancedness of microbiological sampling* 39 5 9 16 36 8 5 1 1 Comprehensiveness of judgement criteria for microbial FS 38 5 15 11 34 8 6 1 1 1 Advancedness of pesticides sampling* 14 5 39 14 34 4 7 4 3 1 Comprehensiveness of judgement criteria for chemical FS* 14 10 19 26 31 7 7 4 3 1 Type of non-conformities* 20 3 28 18 29 3 13 4 3 1
a Situations 1, 2, 3, and 4 for system output correspond to: no information (1) → absent, not applied, unknown; poor output (2) → ad-hoc sampling, minimal criteria used for evaluation, various food safety problems due to different problems in the activities; moderate output (3) → regular sampling, several criteria used for evaluation, restricted food safety problems mainly due to one (restricted) type of problem in the activities; good output (4) → systematic evaluation, using specific criteria, no safety problems. * Significant differences (p<0.05) between scores of EU and non-EU companies

MANUSCRIP
T
ACCEPTED
ACCEPTED MANUSCRIPT
Table 2C: Frequency of the individual scores and median for the contextual factors for EU and non-EU companies (The scores represent 1 – low risk, 2 – moderate risk, and 3 - high risk), most frequent score indicated in bold.
Context factors EU (n=69) Non-EU (n=49) EU Non-EU
1a 2 3 1 2 3 median Product characteristics Microbiological risk of initial materials* 11 19 39 10 26 13 3 2 Risk of initial materials to pesticide residues 18 60 1 6 33 10 2 2 Risk of initial materials due to mycotoxins* 1 33 35 20 22 7 3 2 Microbiological risk of final product* 1 7 61 1 15 33 3 3 Risk of final product to pesticide residues 4 12 53 5 2 42 3 3 Production characteristics Susceptibility of production system* 17 17 35 1 48 3 3 Risk climate conditions of production environment* 9 51 9 11 38 2 3 Susceptibility of water supply* 10 45 14 8 12 29 2 3 Organisational characteristics Presence of technological staff 15 30 24 5 17 27 2 3 Variability of workforce composition* 22 38 9 14 19 16 2 2 Sufficiency competences of operators 5 32 32 2 19 28 2 3 Extent of management commitment* 14 44 11 8 16 25 2 3 Degree of employee involvement 12 34 23 5 17 27 2 3 Level of formalization* 16 45 8 7 13 29 2 3 Sufficiency of supporting information system* 10 49 10 10 10 29 2 3 Chain characteristics Severity of stakeholder requirements* 10 45 14 21 24 4 2 2 Extent of power in supplier relationships* 10 44 15 5 19 25 2 3 Degree of information exchange in supply chain* 21 38 10 10 11 28 2 3 Sophistication of logistic facilities* 33 27 9 4 20 25 2 3 Supportiveness of food safety authority* 31 26 12 12 10 27 2 3 Degree of globalization of supply* 44 20 5 13 21 15 1 2 Specificity of external support* 60 7 2 13 7 29 1 3 Specificity of food safety legal framework* 69 24 11 14 1 2

MANUSCRIP
T
ACCEPTED
ACCEPTED MANUSCRIPT
a Low (1), medium (2) and high (3) risk situations for product and process characteristics correspond to low, potential and high chance of microbiological or chemical contamination. Ffor organizational and chain characteristics they correspond to supportive, constrained and lacking administrative chain conditions or low, restricted and high dependence on other chain actors. * Significant differences (p<0.05) between scores of EU and non-EU companies

MANUSCRIP
T
ACCEPTED
ACCEPTED MANUSCRIPT
Table 3: Distribution of the companies in the clusters
Country Product Sizea Standard
Leafy greens
Berries Fruits Other Micro Small Medium Large National Global GAP
BRC ISO Other
Cluster 1 (n=47) EU – Belgium (1) 1 1 1 1 – Netherlands (17) 3 6 1 7 4 4 9 15 2 4 – Spain (16) 13 3 1 4 12 3 16 5 7 7 Non-EU – Kenya (9) 9 4 5 5 9 1 5 – South Africa (4) 3 1 1 3 4 5 3
Cluster 2 (n=42) EU – Belgium (14) 6 8 8 5 1 14 14 – Netherlands (8) 4 3 1 4 4 8 – Norway (10) 6 4 1 5 4 10 1 – Spain (1) 1 1 1 1 Non-EU – Serbia (3) 3 2 1 3 – South Africa (6) 1 5 1 2 3 6 Cluster 3 (n=29) Non-EU – Brazil (6) 6 6 – China (2) 2 2 – Egypt (1) 1 1 – India (1) 1 1 – Kenya (1) – Serbia (6) 6 1 5 – Uganda (10) 10 10
TOTAL 41 37 10 27 20 49 27 20 34 78 7 10 16
a Size of companies is defined according to Commission recommendation of 6 May 2003 concerning the definition of micro, small and medium-sized enterprises (2003/361/EC).

MANUSCRIP
T
ACCEPTED
ACCEPTED MANUSCRIPT
Cluster 3
Cluster 2
Cluster 1

MANUSCRIP
T
ACCEPTED
ACCEPTED MANUSCRIPTFigure 1: Dendrogram analysis of individual scores of 118 companies and identification of three clusters

MANUSCRIP
T
ACCEPTED
ACCEPTED MANUSCRIPT
Product and process characteristicsa Organisational and chain characteristicsb Control activities designc
Clu
ster
1 (
n=46
)
Clu
ster
2 (
n=42
)
Clu
ster
3 (
n=29
)

MANUSCRIP
T
ACCEPTED
ACCEPTED MANUSCRIPT
Control activities operation Assurance activities System outputd
Clu
ster
1 (
n=46
)
Clu
ster
2 (
n=42
)
Clu
ster
3 (
n=29
)
Figure 2: Median score results for the indicators in the diagnostic instrument for the three identified clusters of farms active in fresh produce production

MANUSCRIP
T
ACCEPTED
ACCEPTED MANUSCRIPT
a Low (1), medium (2) and high (3) risk situations for product and process characteristics correspond to low, potential and high chance of microbiological or chemical contamination. b Low (1), medium (2) and high (3) risk situations for organizational and chain characteristics they correspond to supportive, constrained and lacking administrative chain conditions or low, restricted and high dependence on other chain actors. c Situations 1, 2, 3, and 4 for control and assurance activities correspond to: low level (1) → absent, not applicable, unknown; basic level (2) → lack of scientific
evidence, use of company experience/history, variable, unknown, unpredictable, based on common materials/equipment; average level (3) → best practice knowledge/equipment, sometimes variable, not always predictable, based on generic information/guidelines for the product sector; advanced level (4) → scientifically underpinned (accurate, complete), stable, predictable, and tailored for the specific food production situation. d Situations 1, 2, 3, and 4 for system output correspond to: no information (1) → absent, not applied, unknown; poor output (2) → ad-hoc sampling, minimal criteria used for evaluation, various food safety problems due to different problems in the activities; moderate output (3) → regular sampling, several criteria used for evaluation, restricted food safety problems mainly due to one (restricted) type of problem in the activities; good output (4) → systematic evaluation, using specific criteria, no safety problems.

MANUSCRIP
T
ACCEPTED
ACCEPTED MANUSCRIPT
-1.0 -0.8 -0.6 -0.4 -0.2 0.0 0.2 0.4 0.6 0.8 1.0
Specificity sanitation program
Specificity maintenance program
Sophistication supplier control
Sophistication material control
Availability procedures
Hygienic performance
Sophistication translation requirements
Extent feedback info use
Sophisticaion validation of preventive measures
Sophisticaion validation of monitoring system
Sophisticaion validation of intervention measures
Extent verification people
Extent verification equipment
Appropriateness documentation
Appropriateness record keeping
Presence technical staff
Sufficiency workers' competences
Degree workers' involvement
Level of formalization
Sufficiency information system
Power in supplier relationships
Degree information exchange
Specificity external support
Specificity legal framework
Adequacy packaging equipment
Adequacy partial intervention
Packaging capability
Capability partial intervention
Adequacy analytical equipment pesticides
Sophisticaion validation of intervention measures
Severity stakeholder requirements
Sufficiency authorities
Extent personal hygiene requirements
Adequacy storage facilities
Adequacy irrigation method
Appropriateness hazard analysis
Storage capacity
Measuring equipment performance
Packaging capacity
PC1 (36.9%)
PC2 (7.3%)
PC3 (5.1%)
Figure 3: Loading plots of the first three principle components explaining 49.3% of variance
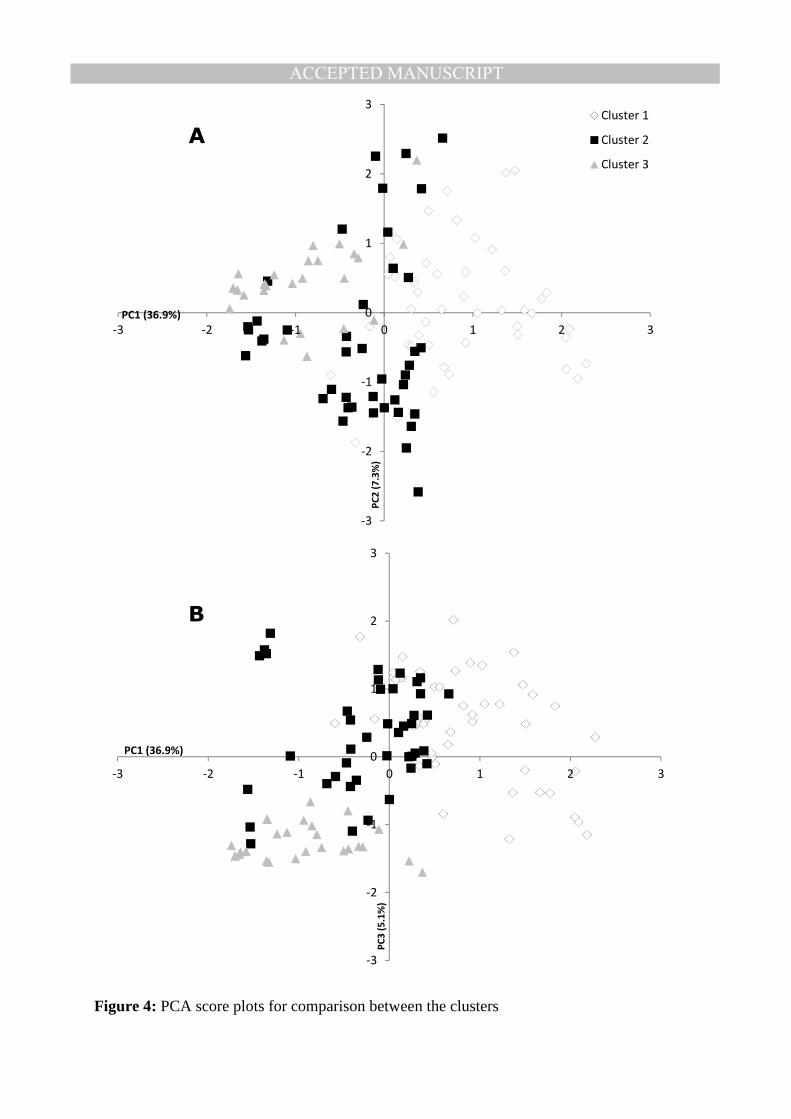
MANUSCRIP
T
ACCEPTED
ACCEPTED MANUSCRIPT
Figure 4: PCA score plots for comparison between the clusters
-3
-2
-1
0
1
2
3
-3 -2 -1 0 1 2 3
PC
2 (
7.3
%)
Cluster 1
Cluster 2
Cluster 3
-3
-2
-1
0
1
2
3
-3 -2 -1 0 1 2 3
PC
3 (
5.1
%)
PC1 (36.9%)
PC1 (36.9%)
A
B

MANUSCRIP
T
ACCEPTED
ACCEPTED MANUSCRIPTHighlights:
• Assessment of safety management systems at primary production of fresh produce • 118 companies located in the European Union, emerging and developing countries
• Status of FSMS is affected by few main factors independent of location • International export supply chains promote capacity building
• Standards trigger maturation of FSMS


![[FRESH (FOR ADMISSION) - CIVIL CASES]](https://static.fdokumen.com/doc/165x107/6327cffe5c2c3bbfa8045c6c/fresh-for-admission-civil-cases.jpg)