factors affecting the effective management of budget in
96
0 FACTORS AFFECTING THE EFFECTIVE MANAGEMENT OF BUDGET IN SELECTED COUNTY GOVERNMENTS IN KENYA (MAKUENI, NAIROBI, NAROK AND KAKAMEGA COUNTIES). BY MICHAEL M MUSYOKA 13/01557 A DISSERTATION SUBMITTED IN PARTIAL FULFILLMENT OF THE REQUIREMENTS FOR THE AWARD OF MASTER OF SCIENCE IN COMMERCE DEGREE (FINANCE ANDACCOUNTING) IN THE SCHOOL OF BUSINESS AT KCA UNIVERSITY NOVEMBER, 2017
-
Upload
khangminh22 -
Category
Documents
-
view
2 -
download
0
Transcript of factors affecting the effective management of budget in

0
FACTORS AFFECTING THE EFFECTIVE MANAGEMENT OF BUDGET IN
SELECTED COUNTY GOVERNMENTS IN KENYA (MAKUENI, NAIROBI,
NAROK AND KAKAMEGA COUNTIES).
BY
MICHAEL M MUSYOKA
13/01557
A DISSERTATION SUBMITTED IN PARTIAL FULFILLMENT OF THE
REQUIREMENTS FOR THE AWARD OF MASTER OF SCIENCE IN COMMERCE
DEGREE (FINANCE ANDACCOUNTING) IN THE SCHOOL OF BUSINESS AT
KCA UNIVERSITY
NOVEMBER, 2017

ii
DECLARATION
I declare that this dissertation is my original work and has not been previously published or
submitted elsewhere for award of a degree. I also declare that this contains no material
written or published by other people except where due reference is made and author duly
acknowledged.
Sign……………………………………….Reg.No 13/01557
Date………………………………………
I do hereby confirm that i have examined the masters’ dissertation of
MICHAEL MUANGE MUSYOKA
And have certified that all revisions that the dissertation panel and examiners recommended
have been adequately addressed.
Sign: …………………………………………. Date: ……………………………………
DR. PETER NJUGUNA
DISSERTATION SUPERVISOR
iii
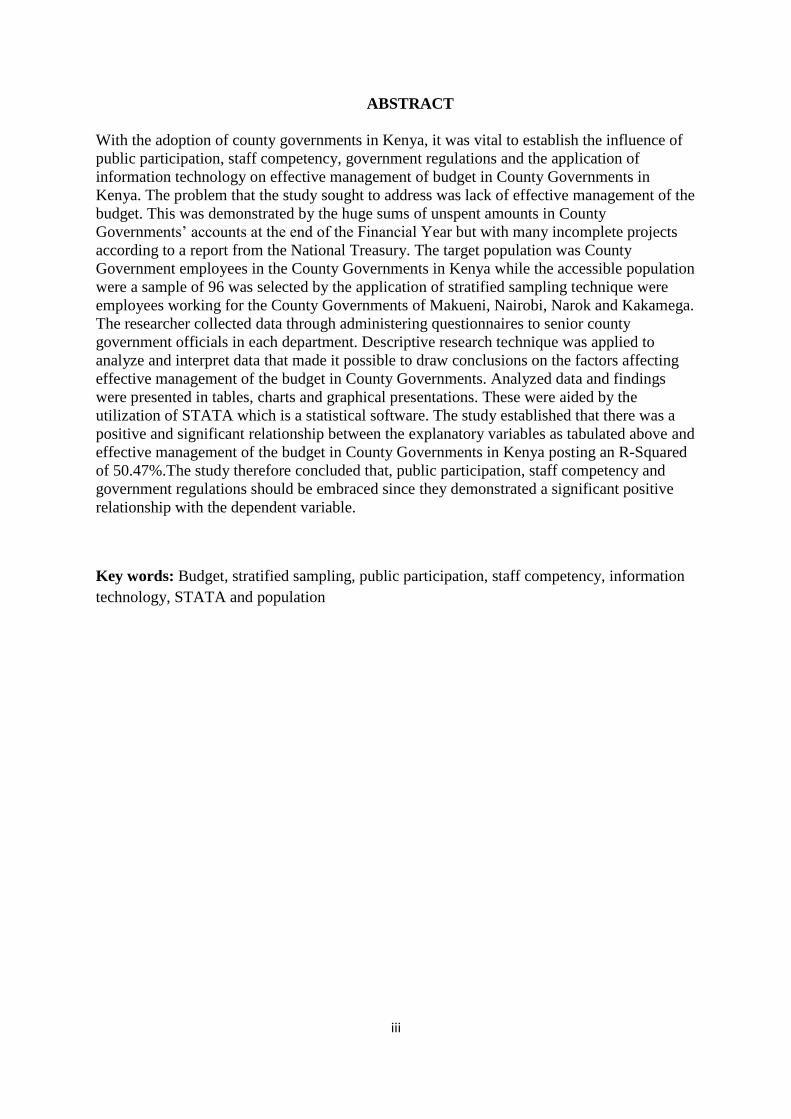
ABSTRACT
With the adoption of county governments in Kenya, it was vital to establish the influence of
public participation, staff competency, government regulations and the application of
information technology on effective management of budget in County Governments in
Kenya. The problem that the study sought to address was lack of effective management of the
budget. This was demonstrated by the huge sums of unspent amounts in County
Governments’ accounts at the end of the Financial Year but with many incomplete projects
according to a report from the National Treasury. The target population was County
Government employees in the County Governments in Kenya while the accessible population
were a sample of 96 was selected by the application of stratified sampling technique were
employees working for the County Governments of Makueni, Nairobi, Narok and Kakamega.
The researcher collected data through administering questionnaires to senior county
government officials in each department. Descriptive research technique was applied to
analyze and interpret data that made it possible to draw conclusions on the factors affecting
effective management of the budget in County Governments. Analyzed data and findings
were presented in tables, charts and graphical presentations. These were aided by the
utilization of STATA which is a statistical software. The study established that there was a
positive and significant relationship between the explanatory variables as tabulated above and
effective management of the budget in County Governments in Kenya posting an R-Squared
of 50.47%.The study therefore concluded that, public participation, staff competency and
government regulations should be embraced since they demonstrated a significant positive
relationship with the dependent variable.
Key words: Budget, stratified sampling, public participation, staff competency, information
technology, STATA and population

iv
ACKNOWLEDGEMENT
I acknowledge the assistance i received from my supervisor Dr. Peter Njuguna. I also
acknowledge the support from my family and employer. I can also not fail to recognize my
classmates whom we consulted during the writing of the dissertation.
v
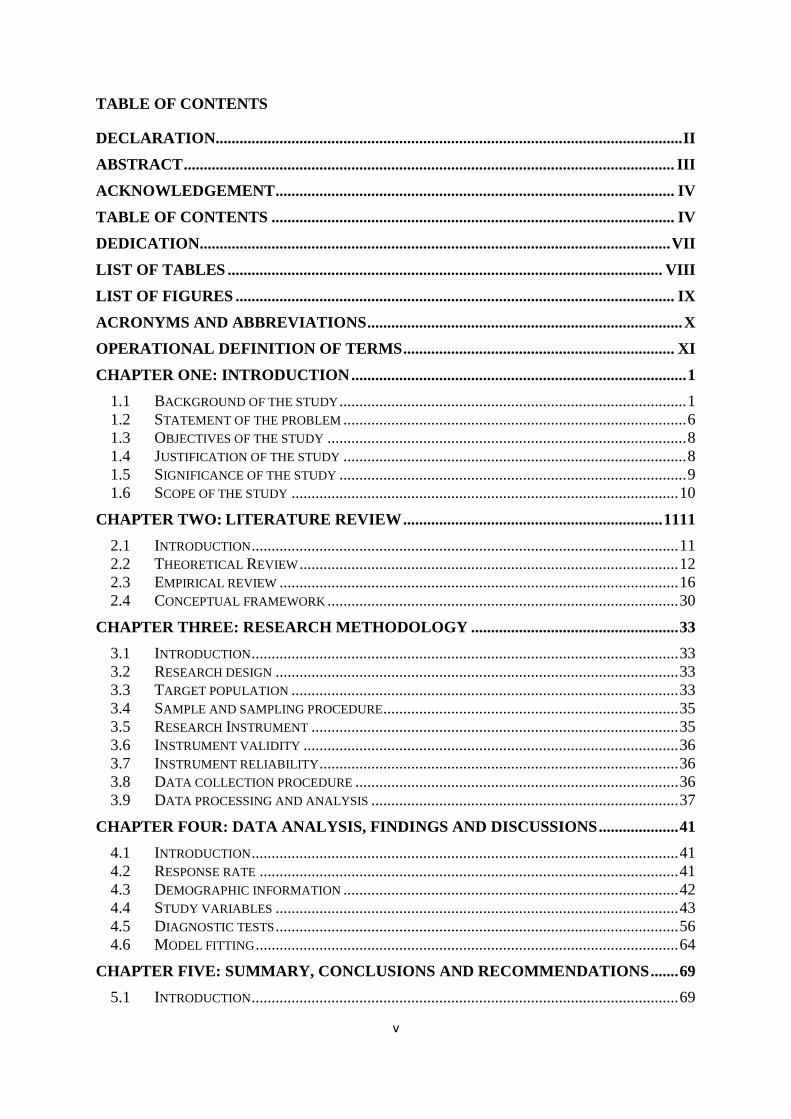
TABLE OF CONTENTS
DECLARATION..................................................................................................................... II
ABSTRACT ........................................................................................................................... III
ACKNOWLEDGEMENT .................................................................................................... IV
TABLE OF CONTENTS ..................................................................................................... IV
DEDICATION...................................................................................................................... VII
LIST OF TABLES ............................................................................................................. VIII
LIST OF FIGURES .............................................................................................................. IX
ACRONYMS AND ABBREVIATIONS ............................................................................... X
OPERATIONAL DEFINITION OF TERMS .................................................................... XI
CHAPTER ONE: INTRODUCTION .................................................................................... 1
1.1 BACKGROUND OF THE STUDY ....................................................................................... 1
1.2 STATEMENT OF THE PROBLEM ...................................................................................... 6 1.3 OBJECTIVES OF THE STUDY .......................................................................................... 8
1.4 JUSTIFICATION OF THE STUDY ...................................................................................... 8 1.5 SIGNIFICANCE OF THE STUDY ....................................................................................... 9
1.6 SCOPE OF THE STUDY ................................................................................................. 10
CHAPTER TWO: LITERATURE REVIEW ................................................................. 1111
2.1 INTRODUCTION ........................................................................................................... 11
2.2 THEORETICAL REVIEW ............................................................................................... 12 2.3 EMPIRICAL REVIEW .................................................................................................... 16
2.4 CONCEPTUAL FRAMEWORK ........................................................................................ 30
CHAPTER THREE: RESEARCH METHODOLOGY .................................................... 33
3.1 INTRODUCTION ........................................................................................................... 33 3.2 RESEARCH DESIGN ..................................................................................................... 33
3.3 TARGET POPULATION ................................................................................................. 33 3.4 SAMPLE AND SAMPLING PROCEDURE .......................................................................... 35 3.5 RESEARCH INSTRUMENT ............................................................................................ 35
3.6 INSTRUMENT VALIDITY .............................................................................................. 36 3.7 INSTRUMENT RELIABILITY .......................................................................................... 36
3.8 DATA COLLECTION PROCEDURE ................................................................................. 36 3.9 DATA PROCESSING AND ANALYSIS ............................................................................. 37
CHAPTER FOUR: DATA ANALYSIS, FINDINGS AND DISCUSSIONS .................... 41
4.1 INTRODUCTION ........................................................................................................... 41 4.2 RESPONSE RATE ......................................................................................................... 41
4.3 DEMOGRAPHIC INFORMATION .................................................................................... 42 4.4 STUDY VARIABLES ..................................................................................................... 43
4.5 DIAGNOSTIC TESTS ..................................................................................................... 56 4.6 MODEL FITTING .......................................................................................................... 64
CHAPTER FIVE: SUMMARY, CONCLUSIONS AND RECOMMENDATIONS ....... 69
5.1 INTRODUCTION ........................................................................................................... 69

vi
5.2 SUMMARY .................................................................................................................. 69
5.3 CONCLUSIONS ............................................................................................................ 72 5.4 RECOMMENDATIONS .................................................................................................. 73 5.5 RECOMMENDATIONS FOR FUTURE RESEARCH ............................................................ 74 5.6 LIMITATIONS OF THE STUDY ...................................................................................... 74
REFERENCES ....................................................................................................................... 75
APPENDIX A: QUESTIONNAIRE ..................................................................................... 78
APPENDIX B: TIME SCHEDULE FOR RESEARCH..................................................... 83
APPENDIX C: BUDGET ...................................................................................................... 84

vii
DEDICATION
I dedicate this research study to KCA University. This would be for the purpose of enhancing
research at the university with the main reason being forming a basis for future research.
viii
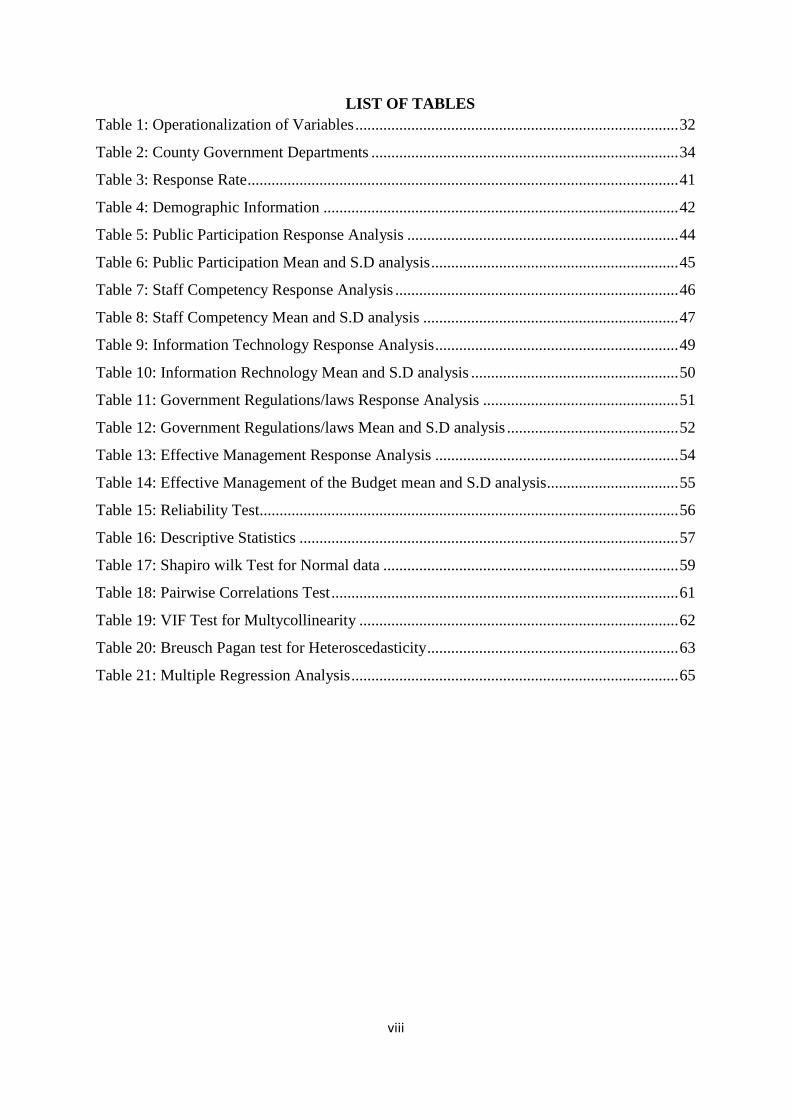
LIST OF TABLES
Table 1: Operationalization of Variables ................................................................................. 32
Table 2: County Government Departments ............................................................................. 34
Table 3: Response Rate ............................................................................................................ 41
Table 4: Demographic Information ......................................................................................... 42
Table 5: Public Participation Response Analysis .................................................................... 44
Table 6: Public Participation Mean and S.D analysis .............................................................. 45
Table 7: Staff Competency Response Analysis ....................................................................... 46
Table 8: Staff Competency Mean and S.D analysis ................................................................ 47
Table 9: Information Technology Response Analysis ............................................................. 49
Table 10: Information Rechnology Mean and S.D analysis .................................................... 50
Table 11: Government Regulations/laws Response Analysis ................................................. 51
Table 12: Government Regulations/laws Mean and S.D analysis ........................................... 52
Table 13: Effective Management Response Analysis ............................................................. 54
Table 14: Effective Management of the Budget mean and S.D analysis ................................. 55
Table 15: Reliability Test......................................................................................................... 56
Table 16: Descriptive Statistics ............................................................................................... 57
Table 17: Shapiro wilk Test for Normal data .......................................................................... 59
Table 18: Pairwise Correlations Test ....................................................................................... 61
Table 19: VIF Test for Multycollinearity ................................................................................ 62
Table 20: Breusch Pagan test for Heteroscedasticity ............................................................... 63
Table 21: Multiple Regression Analysis .................................................................................. 65

ix
LIST OF FIGURES
Figure 1: Study Variables ........................................................................................................ 31
Figure 2: Box Plot .................................................................................................................... 58
Figure 3: Histogram Test for Normality .................................................................................. 60
Figure 4: Visual Test for Heteroscedasticity - RVF PLOT ..................................................... 64

x
ACRONYMS AND ABBREVIATIONS
OCOB - Office of the Controller of Budget
CSOs - Civil Society Organizations
FMIS - Financial Management and Information System
CBEF - County Budget and Economic Forum
PFM - Public Finance Management Act
MTEF - Medium Term Expenditure Framework
GDP - Gross Domestic Product
USA - United States of America
NSA - National Security Agency
IFMIS - Integrated Financial Management and Information System
LG - Local Government
PEMS - Public Expenditure Management Systems
KCAU - Kenya College of Accountancy University
PHD - Doctor of Philosophy
PB - Participatory Budgeting
FGD - Focus Group Discussions

xi
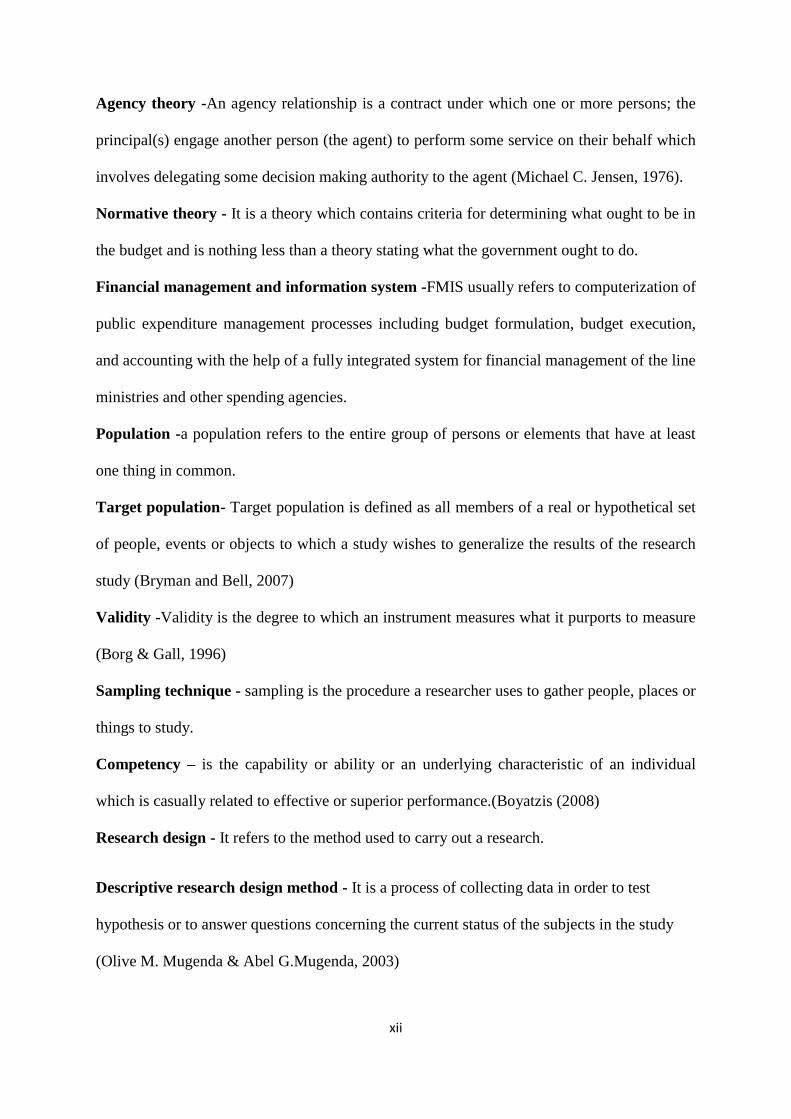
OPERATIONAL DEFINITION OF TERMS
Effective budget management - Effective budget management is the ability of an
organization to formulate, adopt and execute a budget and also put in place control measures
to ensure achievement of both long term and short term goals and obligations of the
organization (Hashem, 2014)
Public participation - Budgetary participation is the level of involvement and influence of
individuals in the preparation of the budget (Muammar et al 2015)
The budgetary process - The budget process is defined as the process through which
government expenditures are determined or allocated. Normally a budget process is
composed of four main stages: formulation, adoption, execution, and control.(Hashem, 2014)
Budget implementation - Budget implementation is the actual functioning, performance and
execution of a specific revenue and expenditure estimation. Budget implementation has been
very low in most less developed countries including Nigeria.(Oketa, 2013)
Devolution - Devolution is the statutory delegation of powers from the Central Government
of a sovereign state to govern at a subnational level, such as a regional or local level. It is a
form of administrative decentralization. Devolved territories have the power to make
legislation relevant to the area.(Wikimedia Foundation, 2016)
Budget -A budget refers to a comprehensive plan in writing, stated in monetary terms that
outline the expected financial consequences of management’s plans and strategies for
accomplishing the organization’s mission for the coming period. (Abdullah., 2008)
Budgeting -Budgeting refers to the process of preparation, implementation and operation of
budgets decisions into specific projected financial plans. (Abdullah., 2008)
Budgetary control -It refers to any management approach that involves setting some kind of
targets, regularly measuring variances between the original targets and actual outcomes, and
motivating people to reduce those variances. (Abdullah., 2008)
xii
Agency theory -An agency relationship is a contract under which one or more persons; the
principal(s) engage another person (the agent) to perform some service on their behalf which
involves delegating some decision making authority to the agent (Michael C. Jensen, 1976).
Normative theory - It is a theory which contains criteria for determining what ought to be in
the budget and is nothing less than a theory stating what the government ought to do.
Financial management and information system -FMIS usually refers to computerization of
public expenditure management processes including budget formulation, budget execution,
and accounting with the help of a fully integrated system for financial management of the line
ministries and other spending agencies.
Population -a population refers to the entire group of persons or elements that have at least
one thing in common.
Target population- Target population is defined as all members of a real or hypothetical set
of people, events or objects to which a study wishes to generalize the results of the research
study (Bryman and Bell, 2007)
Validity -Validity is the degree to which an instrument measures what it purports to measure
(Borg & Gall, 1996)
Sampling technique - sampling is the procedure a researcher uses to gather people, places or
things to study.
Competency – is the capability or ability or an underlying characteristic of an individual
which is casually related to effective or superior performance.(Boyatzis (2008)
Research design - It refers to the method used to carry out a research.
Descriptive research design method - It is a process of collecting data in order to test
hypothesis or to answer questions concerning the current status of the subjects in the study
(Olive M. Mugenda & Abel G.Mugenda, 2003)

1
CHAPTER ONE
1 INTRODUCTION
1.1 Background of the study
Effective budget management is the ability of an organization to formulate, adopt and execute
a budget and also put in place control measures to ensure achievement of both long term and
short term goals and obligations of the organization (Hashem, 2014)
Budget is an important component in County Government planning and decision making.
Almost every organization, regardless of size, complexity or sector, relies heavily on budgets
and budgetary systems to achieve strategic goals (Oketa, 2013). In practice, budgets are
rarely effectively managed. This can be for legitimate reasons, such as adjustments in policies
in response to changes in economic conditions, or for negative reasons, including
mismanagement, poor budgetary process, unauthorized expenditures, inefficiency, or fraud
(Nebraska, 2015)
Lack of effective management of Budget was not only a Kenyan challenge but a
global challenge. Budgeting has succeeded in many countries including New Zealand,
Australia, Singapore, Netherlands, Norway, Sweden, USA, Canada, Mauritius, Rwanda and
South Africa but also failed in others like Sri Lanka and Thailand as measured by poverty
index and GDP (World Bank Group, 2017)
In Kenya, the budgeting process in the Government Ministries was with a lot
challenges. In the year 2011/2012 budget, over Kshs.100 Billion was returned back to the
Treasury having not been utilized. Such amount of funds returned affects project
implementation process as well as realization of goals. Counties returned to treasury a lot of
unspent funds may be due to poor timeliness or allocation. In the 2016/2017 budget and as at
18th January 2017, county governments had collectively accumulated cash balances in
various CBK accounts amounting to KSH 33 billion which is equivalent to 11.8 percent of

2
their equitable share allocation. (National Treasury, 2017) Perennial delay of the
disbursement of funds from the National Treasury and frequent breakdowns of the Integrated
Financial Management and Information system also continued to hamper development and
was a major cause of pecuniary embarrassment to the county governments. (Ochieng, 2017)
Inspite of the several attempts at reforming the budgetary process including
implementation and control, the county budget in Kenya has remained an unsatisfactory
instrument of achieving county policies because of poor budget management. The high
percentage of under-utilization of the budget has a negative effect to the citizens of a country
in regard to achieving the desired goals and objectives. It was with this in mind that the
researcher sought to establish and analyze the factors that are likely to affect the effective
management of budgets in county government in Kenya.
1.1.1 Effective management of the budget
An effective budget is a budget that leads an organization to meet both its short-term and
long-term goals and obligations. An effective Budget Preparation Life Cycle includes;
determining needs of community being served, to set up program/project goals and
objectives, to decide strategy to accomplish the goals, to translate strategy into dollars, to
prepare the budget, to set up Budget Control process, to compare budget to actual and to
modify the budget for a realistic scenario. (Nebraska, 2015)
Effective management of the Budget is one of the critical aspects in determining the
success of a government, a government unit, an organization and even County Government.
(Nebraska, 2015) The qualities of an effective budget are; it should be realistic, consistent
with organizational objectives, cost effective and flexible (Nebraska, 2015) In practice,
budgets are rarely effectively managed. This can be for legitimate reasons, such as
adjustments in policies in response to changes in economic conditions, or for negative

3
reasons, including mismanagement, poor budgetary process, unauthorized expenditures,
inefficiency, or fraud (Nebraska, 2015)
Lack of effective management of the Budget was not only a Kenyan challenge but a
global challenge. Budgeting has succeeded in many countries including New Zealand,
Australia, Singapore, Netherlands, Norway, Sweden, USA, Canada, Mauritius, Rwanda and
South Africa but also failed in others like Sri Lanka and Thailand as measured by poverty
index and GDP (World Bank Group, 2017)
The United States of America realized that of all of the functional areas of finance, the
one most in need of guidance was government budgeting. These culminated to the release by
the National Advisory Council on State and Local Budgeting of a set of recommended
practices representing a milestone in budgeting. In one document, governments had a
comprehensive set of processes and procedures that defined an accepted budget process and
budget. The practices advocated for a goal-driven approach to budgeting that covered the
planning, development, adoption, and execution phases of the budget. (Government Finance
Officers Association, 1998). As a result of the evolving nature of good budgeting practice,
the developed budgeting practices served as a blueprint for governments to make
improvements to their budget processes. Implementation of these practices was expected to
spur economic development over the years. (Government Finance Officers Association,
1998)
In Nigeria, Local Government has historically provided services of importance to its
citizens in rural and urban areas which include provision of basic services like water, roads,
health services, education, etc. Of late, the role of local government in providing these
services has attracted public concern. Furthermore, it has generated a national crisis as a
result of increasing rate of poverty among the rural people. Some scholars view this
development to poor budgeting and implementation while others associate it to the federal

4
and state government’s interference. Whatever may be the reason; there is considerable
emphasis, possibly an over-emphasis on budgeting in the federal government against the
under emphasis on budgeting practices and procedures in state and local governments in
Nigeria (Ukpere et al., 2009)
1.1.2 County governments in Kenya
The road to devolution in Kenya was long and tortuous. As a matter of priority, the
immediate post-colonial government addressed the grievances aired during the independence
struggle. Through “sessional paper No.10 of 1965 on African Socialism and its application to
planning in Kenya, the government laid down development policies aimed at correcting
regional imbalances and eradicating poverty, ignorance and disease. But this was not to be, as
many years down the line, poverty has not been eradicated. (Ochieng, 2017)
Kenya’s decentralization was among the most rapid and ambitious devolution
processes going on in the world, with new governance challenges and opportunities as the
country builds a new set of County Governments from scratch. (The World Bank Group,
2016)
Economic conditions faced by the Kenyan Government currently requires County
Governments' ability to survive and thrive, this capability depends on how County
Governments take appropriate decisions. Budget is an important component in County
Government planning and decision making. Almost every organization, regardless of size,
complexity or sector, relies heavily on budgets and budgetary systems to achieve strategic
goals (Oketa, 2013). Effective management of the budget in county governments was
measured by establishing the Percentage number of complete projects, Percentage number of
ongoing projects, budget absorption rate for each department per annum and the achieved
percentage of the annual work plan for each department. Questionnaires were developed and

5
administered to county government employees heading departments of the county
government of Makueni, Narok, Nairobi and Kakamega.
1.1.3 The budgetary process
The budget process is in this context was defined as the process through which government
expenditures are determined or allocated. Normally a budget process is composed of four
main stages: formulation, adoption, execution, and control (Hashem, 2014). Considering that
a budget is a list of all planned expenses and revenues. A budget according to
macroeconomic analysis and objectives of a country is the core of Public Finance in revenue
generation and public expenditure (Oketa, 2013)
The Budget undergoes some processes before it becomes both a law and an economic
tool. Budgetary process involves all centres, programmes and administrative units of an entity
in the development of periodic budget. It refers to the totality of the processes a budget passes
through before it finally becomes a document. It involves all the executive and legislative
processes, that is, collection of estimates from the various government departments to the
defense before the various committees of the legislature and debates in the floor of the
Houses, the passage into law and the final implementation and monitoring (Ukpere etal,
2009) While each of Kenya’s 47 counties were required to produce and publish their own
quarterly budget implementation reports, in practice most had failed to do so. This made the
OCOB reports all the more useful as a source of implementation data (Lakin, 2015)
1.1.4 Budget implementation
Budget implementation is the actual functioning, performance and execution of a specific
revenue and expenditure estimation. Budget implementation has been very low in most less
developed countries including Nigeria (Oketa, 2013)
In practice, budgets are rarely implemented exactly as approved. This can be for
legitimate reasons, such as adjustments in policies in response to changes in economic

6
conditions, or for negative reasons, including mismanagement, unauthorized expenditures,
inefficiency, or fraud. CSOs can use analysis during and after budgets are implemented to
identify problems in execution and use this information to strengthen their advocacy efforts
to increase accountability, improve programs, and inform future budget debates (Lakin, 2015)
The importance of a realistic budget cannot far fetch from its implementation such
that; a realistic budget is implemented with few significant deviations from plan; Low level
of corruption in public expenditure; high transparency in public finance; public funds spent
for authorized public purposes; reported expenditure corresponding to actual expenditure;
reliable external and/or internal controls and where spending units have reasonable certainty
as to the funds that will be available (Oketa, 2013)
1.2 Statement of the problem
Lack of effective management of the budget was not only a Kenyan challenge but a global
challenge. In Nigeria, Local Government has historically provided services of importance to
its citizens in rural and urban areas which include provision of basic services like water,
roads, health services, education, etc. Of late, the role of local government in providing these
services had attracted public concern. Some scholars view this development to poor
budgeting and implementation while others associate it to the federal and state government’s
interference. (Ukpere et al., 2009)
Budgeting has succeeded in many countries including New Zealand, Australia,
Singapore, Netherlands, Norway, Sweden, USA, Canada, Mauritius, Rwanda and South
Africa but also failed in others like Sri Lanka and Thailand as measured by poverty index and
GDP (World Bank Group, 2017). The problem that the study sought to address was lack of
proper management of the budget and the budgetary process that culminated to a low pace of
development which was contrary to what was anticipated after the promulgation of the new
constitution in 2010.

7
The budgeting process in the Government Ministries and county governments in
Kenya continued been with lot challenges therefore posing a difficulty in achieving the
anticipated development. In the year 2011/2012 budget, over Kshs.100 Billion was returned
back to the Treasury having not been utilized. Such amount of funds returned affected project
implementation process as well as realization of goals. Counties returned to treasury huge
amounts of unspent funds may be due to poor timeliness or allocation. In the 2016/2017
budget and as at 18th January 2017, county governments had collectively accumulated cash
balances in various CBK accounts amounting to KSH 33 billion which was equivalent to 11.8
percent of their equitable share allocation as at 31st December 2016. (National Treasury,
2017).
While there are various empirical evidences on the effectiveness of the budget such
as, Moolchand Raghunandan et al (2012) Behavioral Aspects of Budgeting with particular
emphasis on Public Sector/Service Budgets and Pandeya (2015) who sought to answer the
following question. Does citizen participation in local government decision-making
contribute to strengthening local planning and accountability systems? “An empirical
assessment of the stakeholders’ perceptions in Nepal” there was limited research that was
carried out to determine exactly why devolved units were not able to achieve their budgetary
objectives.
Inspite of the several attempts at reforming the budgetary process including
implementation and control, the county budget in Kenya remained an unsatisfactory
instrument of achieving county policies because of poor budget management. The high
percentage of under-utilization of the budget had negative effect to the citizens of the country
in regard to achieving the desired goals and objectives. It was with this in mind that the
researcher sought to establish and analyze the factors that were likely to affect the effective
management of budgets in county government in Kenya.

8
1.3 Objectives of the study
1.3.1 General objective
The main objective of the study was to establish the factors affecting effective management
of the budget in County Governments in Kenya.
1.3.2 Specific objectives
1. To establish the impact of public participation on the effective management of
budgets in County Governments in Kenya
2. To establish the impact of staff competency in County Government Departments on
the effective management of budgets in County Governments in Kenya
3. To investigate how the application of information technology impacts on the effective
management of budgets in County Governments in Kenya
4. To establish how government regulations and laws impacts on the effective
management of budgets in County Governments in Kenya
1.3.3 Research questions
1. What effect does public participation have on the effective management of budget in
County Governments?
2. What effect does the competency of staff in County Governments departments have
on the effective management of budget in County Governments?
3. What effect does the application of information technology have on the effective
management of budget in County Governments?
4. What effect does the application government regulations and laws have on the
effective management of budget in County Governments?
1.4 Justification of the study
There was an outcry from the public that County Governments were unable to effectively
implement budgets. These was demonstrated by a consistent trend that indicated very low

9
absorption rates of funds allocated to the County Governments (Auditor General, 2016)
Perennial delay of the disbursement of funds from the National Treasury and frequent
breakdowns of the Integrated Financial Management and Information system continued to
hamper development and was a major cause of pecuniary embarrassment to the county
governments (Ochieng, 2017)
The study on the factors affecting effective management of budget in selected County
Governments was conducted in Makueni, Nairobi, Narok and Kakamega Counties. In
selection of the counties, several factors were considered which included geographical
position of the county, size of the county in terms of population and the level of funding from
the National Government. The decision to carry out the study was also informed by the fact
that budgeting in County’s was at its infancy stage because it was a new concept. The study
would also after establishing the factors affecting the effective management of budgets in
County Governments make recommendations on how to achieve effectiveness on the same.
It was anticipated that the research would be of much benefit to county governments
in Kenya and also the national governments since the principles of budgeting are the same.
The study was also expected to form a basis of further research in the same field and also to
other related areas which may not have been adequately researched.
1.5 Significance of the study
The study had a lot of benefits to the general public and all the stake holders involved in the
budgeting process. It contributed to the body of knowledge in the academic field.
To the general public, the study explained the budgeting process and the role of the citizens
in the budgeting process. The study also sensitized the citizens on their rights with regard to
the budget making process. To the county government and the central government; the study
explained why effective management of budgets had not been achieved as anticipated. It
provided reference information for purposes of implementing budgets effectively. The

10
findings also provided insights to the regulatory bodies and the government at large on the
factors affecting the effective management of budgets and also reasons for poor
implementation of budgets. This would enable County Governments to make appropriate
interventions when things tend to move outside the plan.
To other researchers, the study provided useful basis upon which further studies on
effective management of budgets would be conducted. The study made a contribution to the
academic literature and therefore contributed to the body of knowledge in budgetary issues
and the related fields. The researcher strongly believed that after the conclusion of the study,
if the recommendations made will be implemented to the letter, the matter of ineffective
budget management shall be addressed adequately.
1.6 Scope of the study
The scope of this study was to identify the factors affecting effective management of budgets
in County Governments in Kenya and the various possible ways of addressing them. This
study on the factors affecting effective management of budgets in County Governments was
conducted in Makueni, Nairobi, Narok and Kakamega counties. In selection of the counties,
several factors were considered which included geographical position of the county, size of
the county in terms of population and the level of funding from the National Government.
The data collection was conducted by applying stratified sampling technique in departments
within Counties. Data for the study was collected by the use of questionnaires. The target
population was chief officers, budget officers, and other resourceful officers working in
different departments of the specified County Governments. The researcher was confident
that the selected population provided an adequate base upon which a sample was drawn that
was able to provide reliable results after the analysis. The reliable results generated led to
good recommendations that if implemented would lead to solving the problem of ineffective
budget management in County Governments.

11
CHAPTER TWO
2 LITERATURE REVIEW
2.1 Introduction
The purpose of literature review is to help the researcher develop a thorough understanding
and insight in to previous works and trends that have been recorded pertaining to the research
problem. It will also highlight the gap and put across justifications of the study (Oso & Onen,
2009) The purpose of this chapter also shall be to help the researcher develop a thorough
understanding of and an insight in to previous works and trends that have been done
regarding the same or related research problem (Mugenda, 2003)
First, a theoretical review was conducted focusing on the issues related to the factors
affecting the effective management of the budget and budget making process in devolved
units in detail. Secondly, the empirical review of the studies that were conducted on the
effective management of budgets was presented.
The chapter presented the literature review on issues related to budgeting and the
factors affecting effective management of budgets including implementation and specifically
focused on the County Governments budgets and the budgeting process. This was literature
about the effective management of budgets and the budgeting process and any other literature
related to the budgeting cycle. The specific area covered in this chapter was to identify and
read literature that was related to factors affecting the effective management of budgets and
budget implementation in Government or Government units.
The main focus was to review literature that would enable the researcher to be able to
establish the impact of public participation on the effective management of budgets, establish
the impact of staff competency in County Government Departments on the effective
management of budgets, investigate how the application of information technology impacts
on the effective management of budgets and finally establish how government regulations

12
impacted on the effective management of budgets. Finally, all the literature reviewed was
analyzed and the research gap demonstrated.
2.2 Theoretical Review
Public budgeting, as a field of study, has grown tremendously in recent years both in form
and substance. With such growth comes a need to have a coherent theory or body of theories
that allows one to understand the field, its essential core that guides its development, and its
scope for dealing with real world problems (Forrester, 2002).
2.2.1 Agency theory
An agency relationship is a contract under which one or more persons; the principal(s)
engage another person (the agent) to perform some service on their behalf which involves
delegating some decision making authority to the agent (Michael C. Jensen, 1976)
The objective in agency theory is to structure the contractual relationship between
these groups so that agents take actions to maximize the welfare of principals. At the heart of
public budgeting are relationships among those who provide agency services and those who
allocate resources to service providers. Schick (1988) as cited by (Forrester, 2002) has
referred to these individuals as claimants and conservers, respectively. Others have entitled
them more generally as agents and principals, respectively (Demski, 1998; Baiman, 1982;
Holstrom, 1979) as cited by (Forrester, 2002). In other words, those who make claims on
governmental resources are agents and those who allocate and ration the resources are
principals. In this relationship, the principals contract with agents to provide services to the
public, and the main focus for all those involved is the contract (i.e., the budget) itself. Two
key questions for both participants are; “What can be done to draw up the most effective
contract possible?” and “How can the contract be upheld?” (Forrester, 2002)
The budgeting process is conducted or steered by public servants who undertake that
function on behalf of the citizens of a country or a county. Both the agent and the principals

13
have divergent interests and hence the agents do not necessarily act in the best interest of the
principals. Agency theory therefore describes the conflict arising between self-interested
managers (agents) and the owners (principals). The principals must try to reduce the agent’s
actions in advancing their interest through establishment of appropriate incentives for the
agent and by incurring monitoring costs designed to limit their self-benefiting activities
(Michael C. Jensen, 1976). It was also important to point out that currently, the information
asymmetry between the principals and agents in counties are being addressed by increased
recognition of the role of county assemblies, civic budget groups and the general public in the
budget formulation process. (Mutuma, 2016)
Financial accountability asserted that the implementation of public budgets was based
on the interests of the people, as who provide the mandate to the government to plan and
implement the budget. Budget in favor of the people is the budget not only in terms of
expenditure, which meets the allocation of public services as expected, but also from the
revenue side. The Office of controller of budget (COB) in liaison with national treasury
exercise financial control in all counties and is required to serve the public interest. County
governments can be seen as agents of the people (the principal) because they are required to
produce a certain level of public output including the quality of county government
expenditure returns in exchange for taxes paid by the people. The objective of COB is to
oversee the county government in implementing public expenditure programs and projects.
(Mutuma, 2016)
In view of the above explanation of the agency relationship, failure of the agent to act
in the best interest of the principal could be one of the reasons of not attaining effective
management of the budget. Public participation and strict adherence to government
regulations should be applied to ensure that the agents act in the best interest of the principals
who are the citizens. This will ensure an effective management of the budget. The staff

14
should also be capacity built to a high competence level of understanding the law in regard to
budgetary provisions.
2.2.2 Stewardship theory
Agency theory argues that shareholder interests require protection by separation of
incumbency of roles of board chair and CEO. Stewardship theory argues shareholder interests
are maximized by shared incumbency of these roles. Results of an empirical test fail to
support agency theory and provide some support for stewardship theory (Donaldson, 1991)
These theoretical considerations argue a view of managerial motivation alternative to
agency theory and which may be termed stewardship theory (Donaldson 1990a, 1990b;
Barney 1990). The executive manager, under this theory, far from being an opportunistic
shirker, essentially wants to do a good job, to be a good steward of the corporate assets. Thus,
stewardship theory holds that there is no inherent, general problem of executive motivation.
Given the absence of an inner motivational problem among executives, there is the question
of how far executives can achieve the good corporate performance to which they aspire.
Thus, stewardship theory holds that performance variations arise from whether the structural
situation in which the executive is located facilitates effective action by the executive.
(Donaldson, 1991)
The issue becomes whether or not the organization structure helps the executive to
formulate and implement plans for high corporate performance (Donaldson 1985). Structures
will be facilitative of this goal to the extent that they provide clear, consistent role
expectations and authorize and empower senior management. Specifically, as regards the role
of the CEO, structures will assist those to attain superior performance by their corporations to
the extent that the CEO exercises complete authority over the corporation and that their role
is unambiguous and unchallenged. This situation is attained more readily where the CEO is
also chair of the board. Power and authority are concentrated in one person. There is no room

15
for doubt as to who has authority or responsibility over a particular matter. Similarly, the
expectations about corporate leadership will be clearer and more consistent both for
subordinate managers and for other members of the corporate board. (Donaldson, 1991) The
organization will enjoy the classic benefits of unity of direction and of strong command and
control. Thus, stewardship theory focuses not on motivation of the CEO but rather
facilitative, empowering structures, and holds that fusion of the incumbency of the roles of
chair and CEO will enhance effectiveness and produce, as a result, superior returns to
shareholders than separation of the roles of chair and CEO (Donaldson, 1991)
In the context of the study, the CEO manages the organization on behalf of the other
stakeholders. For the county governments, they manage resources on behalf of the national
government and for the interest of the citizens. The governor been the CEO of the county
should execute the interests of the citizens through a budget. To ensure effective management
of the budget, public participation should be done according to the Constitution of Kenya
2010 sect.35 (1) in the Bill of Rights and PFM Act 2012 about financial legislations to ensure
there is accountability and transparency. Public participation and strict adherence to
government regulations should be applied to ensure that the agents act in the best interest of
the principals who are the citizens. The staff should also be capacity built to a high
competence level of understanding the law in regard to budgetary provisions.
2.2.3 Public interest theory.
Public interest theory is an economic theory that holds that regulation is supplied in response
to the demand of the public for the correction of inefficient or inequitable market practices
(Christensen, 2010). It is believed that the regulations are prepared in the public interest when
they are demanded by the public for correcting inefficient practices. Regulations are
understood to do good to the whole society rather than any individual’s interest. Regulation is
one of the state’s core functions. It is also one of its classical functions. In a historical

16
perspective the state engaged in regulation long before government also took upon it to
provide welfare services to its citizens. Regulation defines the border between state and
society, government and market. Therefore, regulation represents government’s attempt to set
limits to the scope of private activities (Christensen, 2010)
Public interest theory in this study reflect what is enshrined in the Constitution of
Kenya 2010 sect.35 (1) in the Bill of Rights and PFM Act 2012 about financial legislations to
ensure there is accountability and transparency which will add value to environment
protection and public participation. In relation to the study, the employees in the county
governments should be in a position to understand the law and government regulations which
clearly outline the functions of government that will eventually determine what should be in
the budget. This demonstrates that application of public interest theory would lead to
effective management of the budget. Application of the public interest theory also would
ensure that the budget would be implemented according to the laid down regulations.
2.3 Empirical review
In this part, studies conducted in respect of effectiveness of budgets in Governments were
reviewed. The review adopted a funnel approach where global, regional, and local studies
were reviewed.
2.3.1 Public participation and effective management of budgets
Citizen participation in local government is usually considered to be an important mechanism
for achieving development gains, strengthening local accountability, and empowering
citizens (Kelly, 2007). Nearly two-thirds of projects are unsuccessful due to difficulties
experienced in trying to control project deliverables, schedules and budget and therefore the
need to manage and control scope is vital to give the project manager a chance of meeting the
approved objectives and achieving successful projects. Studies have shown that there are
various influences of stakeholder participation on the public budgeting process. Some of

17
these include the efficiency of the process, the effectiveness of the process and equity in the
allocation of funds. (Kelly, 2007)
A study was conducted in the United Kingdom by Muammar et al (2015) on the effect
of budget participation and budget adequacy on individual performance with job satisfaction
as an intervening variable. The study applied the following methodology; the study used
purposive sampling technique, so that the sampling would be done by a logical
representation. The sample in the study were the officers involved in the preparation of the
budget comprising of 16 heads of agencies, 48 heads of sub-divisions and 46 head of
divisions involved in the budgeting process at the government institution of Aceh Utara
district. Research data required is the primary data. Muammar et al (2015) came up with the
following findings. “The results of the study indicated that budgetary participation
significantly affected individuals’ performance. Budgetary participation affects job
satisfaction. Budget adequacy significantly affects budget satisfaction; budget adequacy
significantly affects individual performance.
He finally came up with the following conclusion “Budgetary participation and
budget adequacy significantly effected on performance through job satisfaction” the
findings in this study do not address the topic at hand but address similar issues that are also
important to the County Governments’ budgetary process” The researcher was of the view
that purposive sampling technique that was applied in identifying the sample was not the
appropriate method; the census method though expensive could have produced a sample that
would have been a better true representative of the population.
Pandeya (2015) also conducted a study which sought to answer the following
question. Does citizen participation in local government decision-making contribute to
strengthening local planning and accountability systems? “An empirical assessment of the
stakeholders’ perceptions in Nepal”
18
The study used exploratory interviews with 35 people who have had at least five
years of experience and expertise in the field of local governance and citizen participation.
The interviewees, selected through purposive and snowball sampling, were 17 mid-level and
high-ranking LG officers (local development officers, joint secretaries and under-secretaries),
eight practitioners working in participatory projects, five participation experts, and five
activists working for non-governmental organizations (NGOs). (Pandeya, 2015)
Pandeya (2015) came up with the following finding. “The lack of elected
representatives, a condition that existed for more than a decade, appeared to be a major
stumbling block toward promoting effective participation in Nepal. Many respondents felt
that a long-term political vacuum, which is, in fact, a major obstacle to building local
democracy and governance, was one of the major detrimental factors that discouraged many
citizens from participation. This vacuum also limited the scope of effective communication
between citizens and LG officials. These findings were not relevant in the Kenyan context
because elections were mandatory as stipulated in the Kenyan constitution
Pandeya (2015) came up with the following conclusion. The results drawn from an
examination of factors associated with citizen participation in LG decision-making show that
institutional and policy frameworks and participation mechanisms are favorable, or at least
pose no hindrance, to the promotion of effective participation in Nepal. The researcher was of
the view that exploratory interviews technique that was applied in identifying the sample was
not the appropriate method; purposive sampling method could have produced a sample that
would have been a better true representative of the population.
Since the early 1980s, many scholars have increasingly focused on citizen
participation in administrative decision-making. For example, in the beginning of
participatory government, Kweit and Kweit (1981) argued that “participation in government
improved public service delivery and increased the trust of citizens in government. However,

19
the outcomes of citizen participation depended on: the characteristics of participation
mechanisms; the characteristics of the target organization, especially its capacity, structure,
and commitment to the process; and environmental characteristics, such as the size of the
community, and the forms of government involved. This argument may be valid for certain
contexts but it may not apply to all contexts” as cited by (Pandeya, 2015)
Consistent with the findings of Kweit and Kweit (1981), King, Feltey, and Susel
(1998) argued in a study based on interviews and focus group discussions (FGDs) conducted
in Ohio State that there are three major sets of factors relevant to effective participation:
participation policies and mechanisms; types of administrative systems and practices; and the
nature of contemporary society, such as the characteristics of the citizens and community
organizations involved, and the prevailing political culture. However, because this research
was done in a developed country, the findings may not be applicable to other contexts as
cited by (Pandeya, 2015). From the literature reviewed, the researcher was able to conclude
that there was a positive relationship between public participation and effective management
of the budget.
2.3.2 Staff competency and effective management of budgets
Boyatzis (2008), as cited by (Apiyo and Mburu,2014) define competency as “a capability,
ability or an underlying characteristic of an individual which is casually related to effective or
superior performance. It is a set of related but a different set of behavior organized around an
underlying construct, which we call the “intent”. The behaviors are alternate manifestations
of the intent, as appropriate in various situations or times”. Competence is a cluster of related
abilities, commitments, knowledge, and skills that enable a person (or an organization) to act
efficiently in a job or situation. Competencies indicate sufficiency of knowledge and skills
that enable someone to act in a wide variety of situations (Aketch and Karanja, 2013) as cited
in (Apiyo and Mburu,2014)

20
The budget process is a technical process that requires people with expertise and
experience to execute. It would first involve setting realistic goals, planning on how to
execute the goals and also conducting budgetary review. This process requires a lot of
accuracy in estimations and serious accountability at execution. These states of affairs clearly
demonstrate that highly trained personnel are required to execute the budget. (Aketch and
Karanja, 2013) as cited in (Apiyo and Mburu,2014)
Moolchand Raghunandan et al (2012) conducted a study where they examined the
Behavioral Aspects of Budgeting with particular emphasis on Public Sector/Service Budgets.
The study applied simple random sampling technique to come up with the data for analysis.
This was done by administering questionnaires to government employees in various
departments.
The researcher came up with the following findings; Management accountants must
recognize that accounting techniques and human relations bound with each other. The
behavior aspects of budgeting are significant and the management accountant has a
responsibility to minimize the behavioral problems within the accounting systems for control.
It follows that management accountants should work more closely with behavioral scientists
to gain an understanding of the essential role that human behavior plays in successful budget
use. The researcher came to the conclusion that Budgeting is a complex process, and the best
results can only be achieved when a mix of factors is taken into account. The personalities of
the participants, the type of budget being set (revenue or expense), the approach to
performance reporting and the degree of uncertainty present are all important factors that
cannot be overlooked.
The researcher was of the view that simple random sampling technique that was
applied in identifying the sample was not the appropriate method; purposive sampling
21
method could have produced a sample that would have been a better true representative of the
population.
A study was conducted by Apiyo and Mburu (2014) to explore the factors that affect
procurement planning in County Governments in Kenya. This study concluded that there was
a positive relationship between staff competence and the procurement planning. The study
adopted a descriptive case study design; which enabled the researcher to keep track of the
research activities and helped to ensure that the ultimate research objectives are achieved.
This method is preferred because it allowed for in-depth study of the case
From the findings, a unit increase in staff competence led to a 0.252 increase in the
procurement planning. It also concluded that, there was a positive relationship between
management support and the procurement planning. From the findings, a unit increase in
management support led to a 0.786 increase in the procurement planning. From the literature
reviewed; the researcher was able to conclude that there was a positive relationship between
public participation and effective management of the budget.
2.3.3 Information technology and effective management of budget
In terms of terminology, a FMIS usually refers to computerization of public expenditure
management processes including budget formulation, budget execution, and accounting with
the help of a fully integrated system for financial management of the line ministries and other
spending agencies. The full system should also secure integration and communication with
other relevant information systems. Because of the integration requirement, the FMIS is
commonly characterized as an integrated financial management information system (IFMIS).
(Diamond and Khemani, 2006)
The consequent lack of reliable and timely revenue and expenditure data for budget
planning, monitoring, expenditure control, and reporting has negatively impacted budget
management. The results have been a poorly controlled commitment of government
22
resources, often resulting in a large buildup of arrears; excessive borrowing, pushing up
interest rates and crowding out private sector investment; and misallocation of resources,
undermining the effectiveness and efficiency of service delivery. Further, governments have
found it difficult to provide an accurate, complete, and transparent account of their financial
position to Parliament or to other interested parties, including donors and the general public. .
(Diamond and Khemani, 2006)
The lack of information hindered transparency and the enforcement of accountability
in government, and only contributed to the perceived governance problems in many of the
countries. In light of these adverse developments, it was perhaps not surprising that many
developing countries pressed for, or have been pressed into, adopting financial management
information system (FMIS) projects to strengthen their PEM systems. (Diamond and
Khemani, 2006) The establishment of a FMIS has consequently become an important
benchmark for the country’s budget reform agenda, often regarded as a precondition for
achieving effective management of the budgetary resources. Although it is not a panacea, the
benefits of an FMIS could be argued to be profound. (Diamond and Khemani, 2006)
In the study conducted by Diamond and Khemani (2006); on Introducing Financial
Management and Information Systems in developing countries. They conducted the study
after realizing that financial information systems in developing countries continued to fail.
This article investigates the reason for almost universal failure to implement and sustain
FMISs in developing countries. The study used the following methodology; it started with a
review of the “received wisdom” in implementing these projects, and then analyzed problems
in its application in the developing country context to identify key factors to explain why
FMIS projects have been so problematic. Based on the identified negative factors,
suggestions for addressing them were offered in the hope of improving success rates.
23
The study came up with the following findings; first, the improved recording and
processing of government financial transactions also allowed prompt and efficient access to
reliable financial data. This supported enhanced transparency and accountability of the
executive to Parliament, the general public, and other external agencies. Second, an FMIS
strengthened financial controls, facilitating a full and updated picture of commitments and
expenditure on a continuous basis. Once a commitment was made, the system was able to
trace all the stages of the transaction processing from budget releases, commitment, purchase,
payment request, reconciliation of bank statements, and accounting of expenditure. This
allows a comprehensive picture of budget execution. Third, it provided the information to
ensure improved efficiency and effectiveness of government financial management.
Generally, increased availability of comprehensive control, accounting, and audit and
reporting. Financial information on current and past performance assists budgetary control
and improved economic forecasting, planning, and budgeting. (Diamond and Khemani, 2006)
After the study they came up with the following conclusion; The FMIS should include
functionality for preparation of annual budgets. This module should be able to exchange data
with separate applications for macroeconomic analysis and projections, and facilitate the top-
down and bottom-up approach for the formulation of budget estimates. ( Diamond and
Khemani, 2006) this finding demonstrates that there is a positive relationship between
information technology and effectiveness of the budget
Hence, a separate budget preparation system with an interface to the FMIS should
assist in the evaluation of the budget proposals. This system should be able to access and
generate data from the previous years. While time series and compatibility of codes and
classifications are vital features, the budget planning system should also be supplemented
with tools for assessing the actual performance of ongoing projects, evaluations, and cost-
benefit analysis for new proposals. (Diamond and Khemani, 2006)

24
Another study was conducted by Mutuma (2016) on challenges of budget
implementation in the public sector: a case of Meru County in Kenya. IFMIS and public
sector performance have drawn much attention among scholars and researchers. Gallagher
(2007) in his study on building fiscal infrastructure in post-conflict societies found that lack
of high level commitment, ineffective project coordination; loose project design and planning
were the hindrances. Jack and Khemani (2005) argued that over ten years of implementation,
this system has still not been able to fully provide the expected benefits of integrated
financial planning, implementation and control of public expenditure due to staff resistance,
management commitment, System complexity and capacity and skills of users. The capacity
and technical knowhow was found to be low due to lack of training and the hurried
implementation of the system.
The controller of budget in her review report for county budget implementation for
half year 2013/14 cites slow operationalization of the IFMIS and in FY 2014/2015 Meru
County made little progress in embracing the use of IFMIS to process financial transactions
and especially in end to end procurement process (Mutuma, 2016) The study adopted a
descriptive design and was limited to the public sector with the main emphasis being
government employees in Meru County. According to Meru County Government database
2016, there were 80 members of staff who were in management positions in the thirteen (13)
departments of Meru County and within the executive arm. A sample was drawn from these
targeted 80 employees in the county. Data was collected using self-administered structured
questionnaires. In this study, ten (10) County Executive committee members (CECM) ten
(10) Chief Officers (CO) and twenty (20) Directors of all the Meru County departments were
used to respond to the research instrument thus comprising a sample size of 40. The data was
analyzed using multiple regressions and presented using charts, bar graphs, frequency tables
(Mutuma, 2016)
25
The findings were, the variables for the study were institutional constraints, performance in
revenue collection, use of IFMIS and effective oversight and audit function. The output of the
multiple regressions indicated the significance of each of the predictor variables.
The conclusion of the study was that institutional constraints, use of IFMIS and
effective oversight and audit function had significant influence on budget implementation
(Mutuma, 2016). The researcher was of the view that a bigger sample selected by the
application of stratified random sampling could have produced a more representative result.
2.3.4 Government regulations/laws and effective management of the budget
The drafters of the constitution ensured that an adequate legal framework governing budgets
and the budgetary process in the devolved units was put in place. This was put in place to
ensure an effective management of the budgetary process. But with the adequate legal
framework stipulated in the constitution, Kenyan counties have been unable to effectively
manage the budget.
Constitution of Kenya 2010, County Governments Act, No. 17 of 2012, Public
Finance Management Act, No. 18 of 2012, Intergovernmental Relations Act, and No. 2 of
2012.(National Council for Law Reporting, 2016) Chapter 11 of the constitution section 190
(1) stipulates that parliament shall by legislation ensure that County Governments have
adequate support to enable them to perform their functions. (2) County Governments shall
operate financial management systems that comply with any requirements prescribed by
national legislations.(Uraia Trust, 2012)
Chapter 12 of the constitution section 201 sub-section (a) stipulates that there shall be
openness and accountability, including public participation in financial matters. Section 220
(1) stipulates that budgets of the National and County Governments shall contain (a)
estimates of revenue and expenditure, differentiating between recurrent and development
expenditure.(Uraia Trust, 2012)

26
The public finance and management Act 2012 section 104 (1) stipulates that subject
to the constitution, a county treasury shall monitor, evaluate and oversee the management of
public finances and economic affairs of the county government including – (a) Developing
and implementing financial and economic policies in the county; (b) Preparing the annual
budget for the county and co-coordinating the preparation of estimates of revenue and
expenditure of the county government (c) Co-coordinating the implementation of the budget
of the county government. (Uraia Trust, 2012)
Kenya’s 2010 Constitution and subsequent legislation, such as the County
Governments Act and the Public Finance Management Act, require public participation in
matters of public finance. While there are numerous references to public participation in these
laws, most are vague and contain no further guidance. There is one major exception to this,
however, which is the very specific requirement that every county set up a County Budget
and Economic Forum (CBEF). The CBEF is mandated by the Public Finance Management
(PFM) Act. The Act states that counties shall create these forums in order to “provide a
means for consultation by the county government on: preparation of county plans, the
County Fiscal Strategy Paper, and the Budget Review and Outlook Paper for the county; and
matters relating to budgeting, the economy and financial management at the county level.”
(International budget Patnerships, 2016)
2.3.5 Summary of literature
Budgeting is one of the fundamental decision making processes in organizations. During
budget formulation and implementation, the responsible officials determine the portion of the
organizations resources to be allocated to each unit. Budgets establish performance goals
among other functions.
Pandeya (2015) conducted a study which sought to answer the following question.
Does citizen participation in local government decision-making contribute to strengthening
27
local planning and accountability systems? “An empirical assessment of the stakeholders’
perceptions in Nepal” He came up with the following findings. “Lack of elected
representatives, a condition that existed for more than a decade, appeared to be a major
stumbling block toward promoting effective participation in Nepal” the researcher established
that the study by Pandeya addressed a narrow perspective of the budget and therefore did not
adequately establish the factors affecting the effectiveness of the budget; it was also noted
that the sample size was not adequate to be a true representative of the population.
In the study conducted by Diamond and Khemani (2006); on Introducing Financial
Management and Information Systems in developing countries. They conducted the study
after realizing that financial information systems in developing countries continued to fail.
This article investigates the reason for almost universal failure to implement and sustain
FMISs in developing countries. It starts with a review of the “received wisdom” in
implementing these projects, and then analyses problems in its application in the developing
country context to identify key factors to explain why FMIS projects have been so
problematic. The researcher established that the study by Diamond and Khemani (2006
addressed a narrow perspective of the budget and therefore did not adequately establish the
factors affecting the effectiveness of the budget; it was also noted that the study was
conducted in different environment from Kenya and therefore could not be adequately
applied in the Kenyan perspective.
A study was conducted in the United Kingdom by Muammar et al (2015) on the effect
of budget participation and budget adequacy on individual performance with job satisfaction
as an intervening variable. He came up with the following findings. “The results of the study
indicated that budgetary participation significantly affects individuals’ performance.
Budgetary participation affects job satisfaction. Budget adequacy significantly affects budget
satisfaction; budget adequacy significantly affects individual performance. Budgetary

28
participation and budget adequacy significantly effect on performance through job
satisfaction” the findings in this study do not address the topic at hand but address similar
issues that are also important to the County Governments’ budgetary process.
Moolchand Raghunandan et al (2012) conducted a study where they examined the
Behavioral Aspects of Budgeting with particular emphasis on Public Sector/Service Budgets.
The study applied simple random sampling technique to come up with the data for
analysis. This was done by administering questionnaires to government employees in various
departments. The researchers came up with the following findings; Management accountants
must recognize that accounting techniques and human relations are inextricable bound with
each other. The behavior aspects of budgeting were significant and the management
accountant has a responsibility to minimize the behavioral problems within the accounting
systems for control. It follows that management accountants should work more closely with
behavioral scientists to gain an understanding of the essential role that human behavior plays
in successful budget use. He came to the conclusion that Budgeting is a complex process, and
the best results can only be achieved when a mix of factors is taken into account. The
personalities of the participants, the type of budget being set (revenue or expense), the
approach to performance reporting and the degree of uncertainty present are all important
factors that cannot be overlooked.
The researcher was of the view that simple random sampling technique that was
applied in identifying the sample was not the appropriate method; purposive sampling
method could have produced a sample that would have been a better true representative of the
population.
A study was conducted by Apiyo and Mburu (2014) to explore the factors that affect
procurement planning in County Governments in Kenya. This study concluded that there was
a positive relationship between staff competence and the procurement planning.

29
The study adopted a descriptive case study design; which enabled the researcher to
keep track of the research activities and helped to ensure that the ultimate research objectives
were achieved. This method was preferred because it allowed for in-depth study of the case.
In this study, a census method was adopted where all the 103 staff in procurement department
was issued with questionnaires. From the findings, a unit increase in staff competence will
lead to a 0.252 increase in the procurement planning. It also concluded that, there was a
positive relationship between management support and the procurement planning. From the
findings, a unit increase in management support led to a 0.786 increase in the procurement
planning.
The researcher was of the view that the census technique that was applied in
identifying the sample was not the appropriate method; purposive sampling method could
have produced a sample that would have been a true representative of the population and that
which would have taken a shorter period to be collected.
2.3.6 Research gap
The review carried out above clearly demonstrated that the impact of public participation,
staff competency, adoption of information technology and the application of government
regulations on the effective management of the budget in county governments in Kenya had
not been exhaustive enough particularly due to the fact that devolution was only introduced in
Kenya three years ago (2013) after the adoption of the current constitution. It is therefore this
gap that the current study sought to address with the hope that the views and findings of the
study will be incorporated in the county budget management process to ensure the process is
more beneficial to both the county government and the citizens in the various counties in the
Kenya.
The researcher further noted that there was no specific study conducted on the factors
affecting the effective management of budgets not only in Kenya but also in other developing

30
countries owing to the fact that devolution was a new concept in Africa. The studies in the
literature review were mainly confined to foreign countries and not much evidence was
availed on the effective management of budgets in Kenya or even in the devolved units.
Inspite of the several attempts at reforming the budgetary process including implementation
and control, the county budget in Kenya remained an unsatisfactory instrument of achieving
county policies because of poor budget management.
The budgeting process in the Government Ministries and county governments in
Kenya continued been with lot of challenges therefore posing a difficulty in achieving the
anticipated development. In the 2016/2017 budget and as at 18th January 2017, county
governments had collectively accumulated cash balances in various CBK accounts amounting
to KSH 33 billion which was equivalent to 11.8 percent of their equitable share allocation as
at 31st December 2016. Such amount of funds returned affected project implementation
process as well as realization of goals (National Treasury, 2017)
It was with these shortcomings in mind that the researcher sought to carry out a study
that would establish the factors affecting the effective management of the budget in county
governments in Kenya. This decision was also informed by the fact that budgeting in
County’s was at its infancy stage because it was a new concept. The study would also after
establishing the factors affecting the effective management of budgets in County
Governments made recommendations on how to achieve effective management on the same.
2.4 Conceptual framework
Conceptual Framework as outlined in figure 1; the independent variables included public
participation, competency of staff, information technology and government regulations while
dependent variable was the effective management of budgets in the County Government. It
was presumed that the independent variable affected effective management of budgets in the
county governments in Kenya.
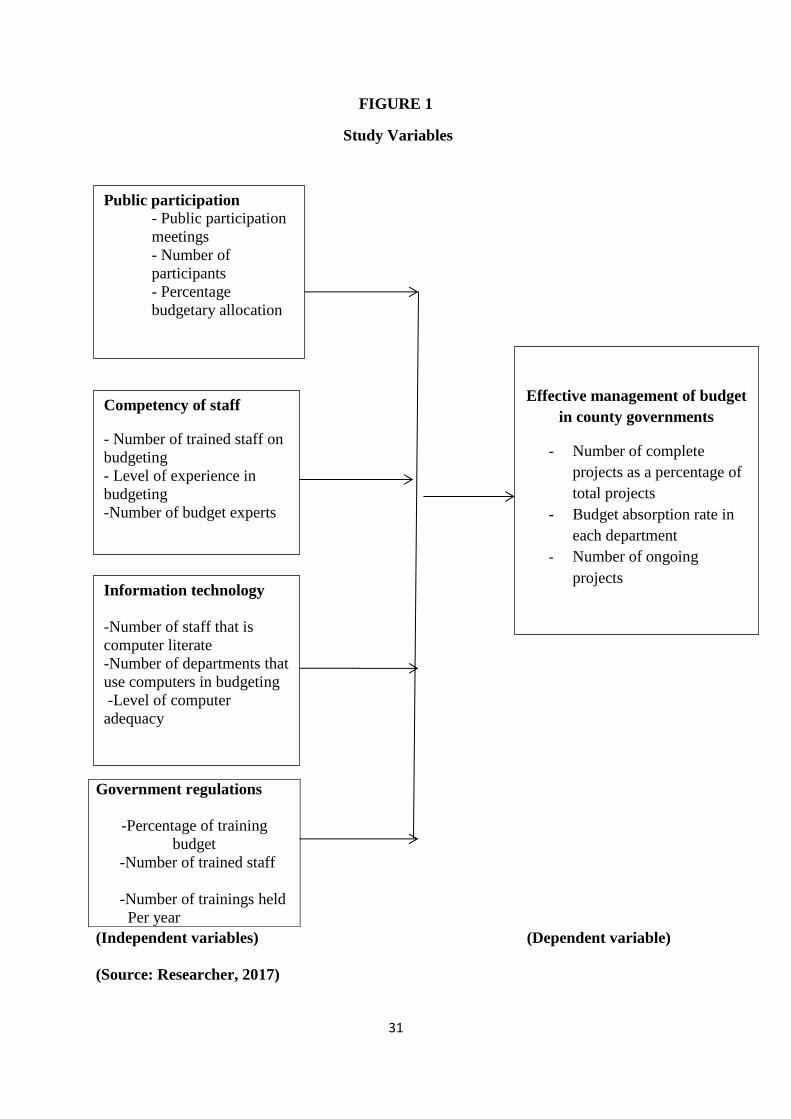
31
FIGURE 1
Study Variables
(Independent variables) (Dependent variable)
(Source: Researcher, 2017)
Government regulations
-Percentage of training
budget
-Number of trained staff
-Number of trainings held
Per year
Public participation
- Public participation
meetings
- Number of
participants
- Percentage
budgetary allocation
Competency of staff
- Number of trained staff on
budgeting
- Level of experience in
budgeting
-Number of budget experts
Information technology
-Number of staff that is
computer literate
-Number of departments that
use computers in budgeting
-Level of computer
adequacy
Effective management of budget
in county governments
- Number of complete
projects as a percentage of
total projects
- Budget absorption rate in
each department
- Number of ongoing
projects

32
TABLE 1
Operationalization of Variables
CATEGORY VARIABLE MEASUREME
NT SCALE
MEASUREMENT
Independent
variable
Public
participation
Ordinal -Number of public participation meetings
held per year
-Number of participants per meeting
-Percentage budgetary allocation for
capacity building on public participation
per year
Independent
variable
Staff
competency
Ordinal - Percentage of staff supported in
continuous education on budgeting
-Level of employee experience on
budgetary issues in years
- Level of education of staff (certificate,
diploma, degree, masters, PHD)
- Percentage of the budgetary allocation
for funding continuous education for
staff in each department-budgeting
-number of budget experts
Independent
variable
Information
technology
Ordinal -level of computer adequacy
-Number of staff who are computer
literate
- number of seminars on budget
management
-Number of departments aided by
computers in budgeting
-Percentage budgetary allocation for
information technology
Independent
variable
Government
regulations/
laws
Ordinal -Percentage training budget on
government regulations per year
-Number of trained staff
-Number of trainings held in the year
Dependent
variable
Effective
management
of the budget
Ordinal -Number of complete projects as a
percentage of the total in the year
-Budget absorption rate for each
department
-Number of ongoing projects
(Source: Researcher, 2017)
33
CHAPTER THREE
3 RESEARCH METHODOLOGY 3.1 Introduction
This chapter sets out various stages and phases that were followed in conducting the study. It
is a chapter that discussed the methods that were applied in carrying out the study and
included the following sub-topics; research design, target population, Sample and sampling
procedure, instrumentation, Instrument validity, Instrument reliability, data collection
procedure and data processing and analysis.
3.2 Research design
Research design refers to the method used to carry out a research. The study used descriptive
research design method. It is a process of collecting data in order to test hypothesis or to
answer questions concerning the current status of the subjects in the study (Olive M.
Mugenda & Abel G.Mugenda, 2003).
Olive M. Mugenda & Abel G.Mugenda (2003) points out that descriptive research
methods are only restricted to fact finding but may often result in the formulation of
important principles of knowledge and solutions of significant problems.
The researcher preferred this method because it allowed for in-depth study of the case
that would lead to establishing a solution to the problem at hand. It is a technique that utilizes
quantitative techniques to establish relationship between independent and dependent
variables. It is also the best method to analyze cross sectional data.
3.3 Target population
According to Kombo et al (2006) as cited by (Apiyo and Mburu,2014) a population refers to
the entire group of persons or elements that have at least one thing in common. Target
population is defined as all members of a real or hypothetical set of people, events or objects
to which a study wishes to generalize the results of the research study (Bryman and Bell,

34
2007) as cited in Apiyo and Mburu,2014). The population comprised of county government
employees working in the county governments in Kenya. The target population was senior
employees working in departments of Makueni, Narok, Nairobi and Kakamega County
Governments where a sample of 96 was drawn and the unit of analysis was the four county
governments.
TABLE 2
County Government Departments
NO DEPARTMENT CADRE OF
EMPLOYEE
ADMINISTERED
WITH
QUESTIONNAIRE
NUMBER
PER
COUNTY
TOTAL-
FOUR
COUNTIES
1. Water, irrigation and
environmental services
Chief officer 1 4
Director 1 4
2. Agriculture, livestock and
fisheries
Chief officer 1 4
director 1 4
3. Devolution and public
service
Chief officer 1 4
Director 1 4
4. Education and ICT Chief officer 1 4
Director 1 4
5. Finance and social
economic planning
Chief officer 1 4
Director - finance 1 4
Director - procurement 1 4
Director - Internal audit 1 4
Director-Budget and
planning
1 4
6. Health services
Chief officer 1 4
Director 1 4
7. Land, mining and physical
planning
Chief officer 1 4
Director 1 4
8. Roads, transport and
infrastructure
Chief officer 1 4
Director 1 4
9. Trade, industry, tourism
and co-operatives
Chief officer 1 4
director 1 4
10. Youth, gender, sports and
social services
Chief officer 1 4
Director 1 4
11 County assembly Administrative officer 1 4
TOTAL 24 96
(Source: Makueni County, 2017)

35
3.4 Sample and sampling procedure
Sampling is a means of selecting a given number of subjects from a defined population as
representative of that population. Orodho and Kombo (2002) define sampling as the
procedure a researcher uses to gather people, places or things to study. Any statements made
about the sample should also be true of the population. It is however agreed that the larger
the sample the smaller the sampling error.
The sample consisted of 96 employees working in the departments of Makueni,
Narok, Nairobi and Kakamega Counties and the study applied stratified random sampling
technique to select the sample. The researcher considered the sample size to be adequate
because it was selected from all the departments of the county and also in consideration of the
relevant staff. This is a sampling technique that allows the researcher to select subjects in
such a way that the existing groups in the population are more or less reproduced in the
sample. This means the sample will consist of two or more sub-groups with respect to the
objectives of the study. (Olive M. Mugenda & Abel G.Mugenda, 2003).This method was
appropriate because the researcher knew the specific cadres of staff who are involved in the
budgetary process.
3.5 Research Instrument
Questionnaires were used for the study. Structured questionnaires are more efficient in that
they require less time, they are less expensive and permits collection of data from a wide
population (Orodho, 2005). The researcher used questionnaires as the main tool for collecting
data. The selection of this tool was guided by the nature of the data to be collected, the time
available as well as the objectives of the study.
Such information could only be best collected through the use of structured
questionnaires. Questionnaires will be used since the study is concerned with variables that

36
would not be directly observed such as views, and opinions. The target population is also
largely literate and is unlikely to have difficulties responding to questionnaires.
3.6 Instrument validity
Validity is the degree to which an instrument measures what it purports to measure (Borg &
Gall, 1996) as cited by (Musyoka, 2015). To determine validity of an instrument, a pretest
was carried out in Machakos County which helped the researcher to evaluate the validity,
clarity of the questionnaires, suitability of language used in the instrument and feasibility of
study. The questionnaire was structured in such a way that it captured respondents’ profile
and data pertinent to study objectives. The researcher also sought for Expert advice from the
supervisors who assisted in making corrections and modifications on the items in the
instrument.
3.7 Instrument reliability
To be reliable an instrument must be consistent in such a way that it was considered stable
and can be depended on to yield similar test results under similar circumstances (Borg &
Gall, 1996) as cited by (Musyoka, 2015). The researcher computed a reliability coefficient to
indicate how reliable the data and questionnaire were. This was done by conducting several
tests repeatedly during the pilot study to try and establish the consistency of results.
According to Field (2005) a Cronbach’s α > 0.7 implies the instrument is relatively good
measurement tool therefore reliable. After the pilot test, the results posted a Cronbach ‘s
Alpha of (0.9343 ) on all independent variables and (0.7349) on dependent variable showing
high internal consistency of the instrument and therefore considered reliable for the analysis.
3.8 Data collection procedure
The study used primary data. Prior to data collection, requisite permission and consent was
sought from both from the school of business and public management (KCAU) and the
County Governments of Makueni, Narok, Nairobi and Kakamega from where respondents
37
were drawn. The questionnaires were then administered to the respondents through the
respective County Departments heads and collected after approximately five working days
which the researcher deemed to be adequate period for filling.
3.9 Data processing and analysis
The researcher collected data through administering questionnaires to senior county
government officials in each department. The collected data was first cleaned and edited as a
measure of dealing with extreme outliers. Thereafter, the researcher applied descriptive
statistics to establish the influence of the independent variables on effective management of
the budget in county governments. The descriptive statistics here was the application of
measures of central tendency (mean, mode and median), measures of variability (range,
variance and standard deviation) percentages, frequency distribution tables, standard
deviations and also data was presented in the form of tables, bar charts and pie charts.
Correlation coefficient, chi square test, regression analysis was also calculated to establish the
nature of relationships between the dependent and the independent variables. The data was
also tested whether it meets the assumptions of the classical linear regression model.
Data was then analyzed using STATA Version 13 software and findings obtained
were summarized in frequencies and percentages and presented in tables and charts. Both
descriptive and regression analysis were performed. For background information, descriptive
statistical analysis was used and analyzed to provide a profile of respondents. Quantitative
analysis was done based on Pearson correlation coefficient (r) to determine the level of
significance. A correlation is significant if the probability value is below 0.05 (P ≤ 0.05). The
study used multiple regression analysis to determine the impact of the independent variables
on effective management of the budget in county governments in Kenya. Multiple regression
analysis was applied to determine the impact of the four independent variables on the
dependent variable which was guided by the following regression model:
38
Y = β0 + β1X1 + β2X2 + β3X3 + β4X4 + e
3.9.1 Diagnostic Tests
Test for data outliers. The researcher ran the data in STATA and commanded for the
generation of a BOX PLOT. The box plot was applied to identify if there were variables in
the data set that were outside the normal range. All variables outside the normal range were
removed from the analysis because they could have led to biased estimates.
Test for the normality of the error term. This was determined by considering the differences
between the observed dependent variable and the estimated dependent variable. After the data
was input in to STATA software, the researcher commanded for the generation of a
histogram/density PLOT. The histogram was normally distributed demonstrating normality of
errors. Shapiro Wilk test for normality was also used to test the normality of residuals.
Shapiro-Wilk test is anon graphical test whereby if the test results are insignificant (above
0.05) it implies that data being used follows a normal distribution. However, when the p-
value for the variables is less or equal to 0.05 (significant) then it implies that data is not good
for OLS analysis.
Test for Heteroscedasticity. If the errors do not have a constant variance, we say that they
are heteroscedastic and leads to biased Ordinary Least Square (OLS) results. To detect
heteroscedasticity, visual inspection technique was applied. This was done through the
generation of RVFPLOT where the residuals were plotted against the fitted values. The
RVFPLOT did not demonstrate any pattern which was an indication of no heteroscedasticity.
To also minimize the Heteroscedasticity problem, residuals were subjected to both graphical
non-graphical Breusch-Pagan tests after regression test. The Breusch Pagan tests the null
hypothesis that error variances are constant throughout the observations unless the results
prove otherwise. After Conducting the Breusch-Pagan test, the result didn’t demonstrate the
presence of heteroscedasticity as indicated by the (P-value 0.4529) which was above 0.05
39
which is the rule of thumb. Based on this result, the null hypothesis was accepted and the
alternative hypothesis that the variance was not homogenous was rejected.
Test for Multycollinearity. This is a problem that occurs when independent variables are very
highly correlated with each other. Correlation between the independent variables should be
less than 0.8. The method that is usually applied to measure the extent of multycollinearity is
to look at the matrix of correlations between the individual variables. According to Gujarat
(2003), explanatory variables should not exhibit high correlation with each other because that
may cause unrealistic results during regression. In order to avoid that problem, explanatory
variables will be tested for Multycollinearity using pairwise correlation technique.
The VIF PLOT was also used to detect multycollinearity. A mean VIF of 1.36 was
demonstrated which was below the rule of thumb that variance inflation Factors shouldn’t
exceed 10 demonstrating that there was no multycollinearity in the independent variables.
Calculations of summary statistics. After importing the data in to STATA, summary
statistics were generated; which included coefficients of the independent variables, standard
errors, t-values, number of observations, R-squared, Adj R-squared, means and standard
deviations. The figures generated were fitted in the model below as shown in chapter 4.
Y = β0 + β1X1 + β2X2 + β3X3 + β4X4 + e
Y = Dependent variable (Effective management of budget in county governments)
X1 = Independent variable 1 (Public participation)
X2 = Independent variable 2 (Competency of staff)
X3 = Independent variable 3 (Information technology)
X4 = Independent variable 4 (Government regulations)
β0 = Constant
β1 = Coefficient of X1

40
β2 = Coefficient of X2
β3 = Coefficient of X3
β4 = Coefficient of X4
e = Error term
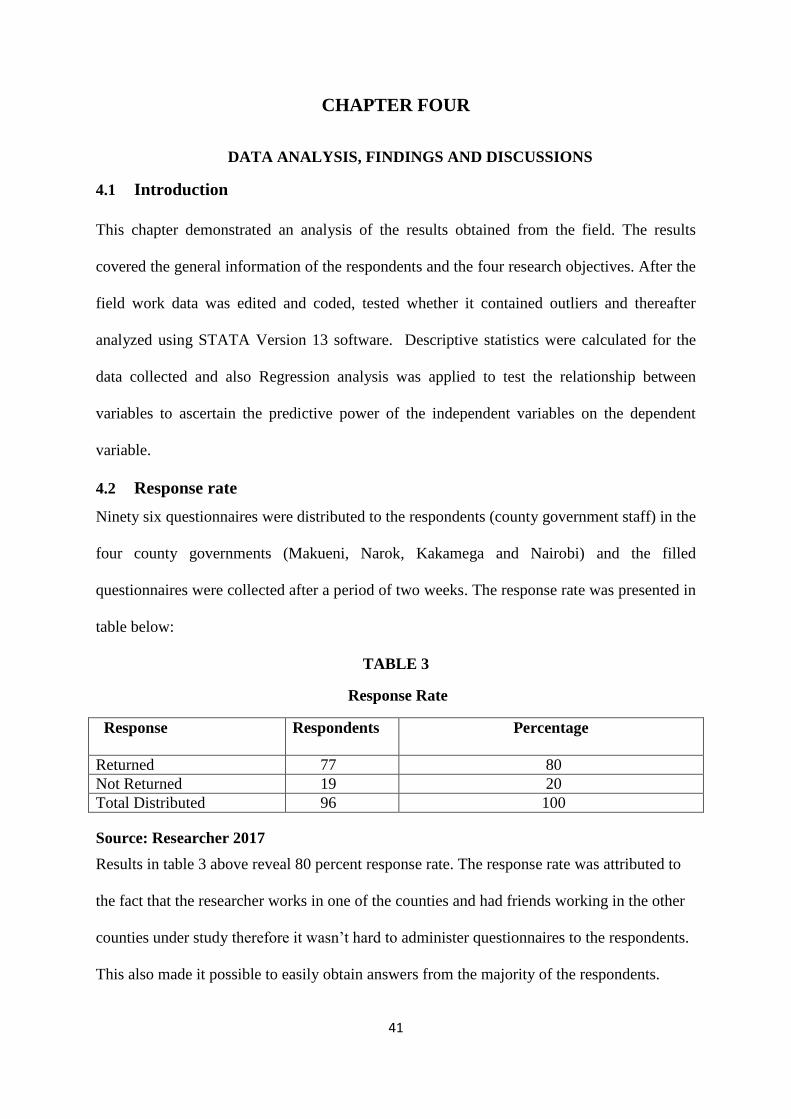
41
CHAPTER FOUR
4 DATA ANALYSIS, FINDINGS AND DISCUSSIONS
4.1 Introduction
This chapter demonstrated an analysis of the results obtained from the field. The results
covered the general information of the respondents and the four research objectives. After the
field work data was edited and coded, tested whether it contained outliers and thereafter
analyzed using STATA Version 13 software. Descriptive statistics were calculated for the
data collected and also Regression analysis was applied to test the relationship between
variables to ascertain the predictive power of the independent variables on the dependent
variable.
4.2 Response rate
Ninety six questionnaires were distributed to the respondents (county government staff) in the
four county governments (Makueni, Narok, Kakamega and Nairobi) and the filled
questionnaires were collected after a period of two weeks. The response rate was presented in
table below:
TABLE 3
Response Rate
Response Respondents Percentage
Returned 77 80
Not Returned 19 20
Total Distributed 96 100
Source: Researcher 2017
Results in table 3 above reveal 80 percent response rate. The response rate was attributed to
the fact that the researcher works in one of the counties and had friends working in the other
counties under study therefore it wasn’t hard to administer questionnaires to the respondents.
This also made it possible to easily obtain answers from the majority of the respondents.

42
4.3 Demographic information
In this section, the respondents’ background information was presented. It covered age,
gender, education level, nature of employment and work experience in their respective county
departments. While this information may not be used in the analysis, it helps the study to
ascertain whether data obtained was normally distributed. The results obtained were
presented in table 4 below.
TABLE 4
Demographic Information
No. Item Description Frequency Percent %
1
Gender
Male 53 69
Female
24
31
Total 77 100
2
Age of Respondents 20-30 10 13
31-40 22 29
41-50 32 42
50 and above 13 16
Total 77 100
3 Education Diploma 1 2
Undergraduate 51 66
Post Graduate
25
32
Total 77 100
4 Nature of
employment
Permanent 33 43
Contract 44 57
Casual 0 0
Total 77 100
5
Experience 0-5 17 22
6-10 24 31
11-15 21 27
15 and above 15 19
Total 77 100
Source: Researcher 2017

43
On demographic information, results in Table 4 revealed that (69%) of the respondents were
male while (31%) were female which means that majority of the people employed by the
counties as heads of departments were male. In addition, majority of the managers were
between the age of 41-50 years bracket at (42%) followed by the 31-40 years bracket at
(29%), 50 years and above at 16% whereas 13% were in the 20-30 bracket. This meant that,
majority of the managers were in the middle level age bracket. With regard to their education
qualification, the results showed that 66% had an undergraduate degree, 32% had a
postgraduate degree whereas 2% had a diploma level qualification. This signified that
majority of the respondents were well educated based on their responsibilities. On the mode
of employment, 57 % were on contract while 43 % were permanent. On the respondents’
level of job experience, it was revealed that (31%) of respondents had over between 6-10
years’ experience (27%) were in the (11-15 years) bracket, 22 % were in (0-5) years bracket
whereas 19% had over fifteen years’ experience.
4.4 Study variables
This section presented the results obtained for every variable involved in the study (public
participation, staff competency, government regulations/laws and information technology).
The results were based on the five point Likert scale where 1= strongly disagree, 2= disagree,
3= neither agree nor disagree, 4 = agree and 5 = strongly agree.
4.4.1 Public participation
The study sought to establish the impact of public participation on effective management of
the budget in county governments in Kenya. Five statements were presented to the
respondents and their views sampled based on five point Likert scale. The results obtained
were summarized and presented in the table below.
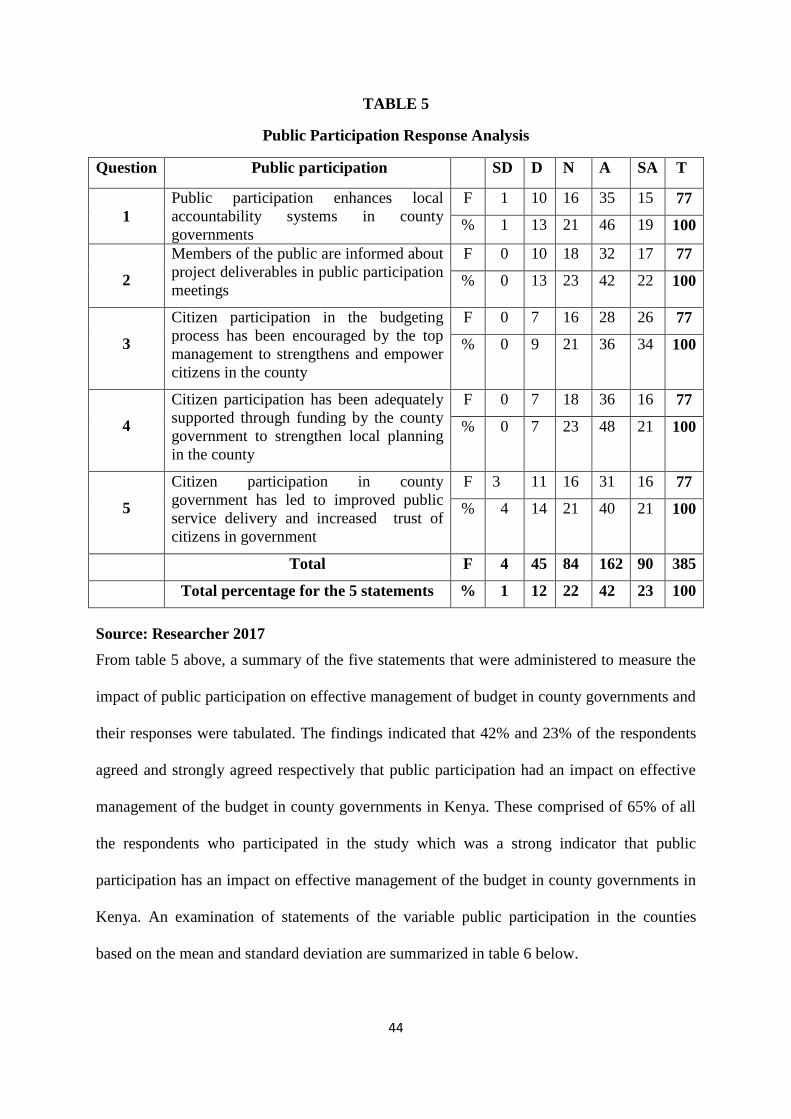
44
TABLE 5
Public Participation Response Analysis
Question Public participation SD D N A SA T
1
Public participation enhances local
accountability systems in county
governments
F 1 10 16 35 15 77
% 1 13 21 46 19 100
2
Members of the public are informed about
project deliverables in public participation
meetings
F 0 10 18 32 17 77
% 0 13 23 42 22 100
3
Citizen participation in the budgeting
process has been encouraged by the top
management to strengthens and empower
citizens in the county
F 0 7 16 28 26 77
% 0 9 21 36 34 100
4
Citizen participation has been adequately
supported through funding by the county
government to strengthen local planning
in the county
F 0 7 18 36 16 77
% 0 7 23 48 21 100
5
Citizen participation in county
government has led to improved public
service delivery and increased trust of
citizens in government
F 3 11 16 31 16 77
% 4 14 21 40 21 100
Total F 4 45 84 162 90 385
Total percentage for the 5 statements % 1 12 22 42 23 100
Source: Researcher 2017
From table 5 above, a summary of the five statements that were administered to measure the
impact of public participation on effective management of budget in county governments and
their responses were tabulated. The findings indicated that 42% and 23% of the respondents
agreed and strongly agreed respectively that public participation had an impact on effective
management of the budget in county governments in Kenya. These comprised of 65% of all
the respondents who participated in the study which was a strong indicator that public
participation has an impact on effective management of the budget in county governments in
Kenya. An examination of statements of the variable public participation in the counties
based on the mean and standard deviation are summarized in table 6 below.

45
TABLE 6
Public Participation Mean and S.D analysis
Statement OBS Mean Std. Deviation
1
Public participation enhances local
accountability systems in county
governments
77
3.688312
0.9768335
2
Members of the public are
informed about project
deliverables in public participation
meetings
77
3.727273
0.9547163
3
Citizen participation in the
budgeting process has been
encouraged by the top
management to strengthens and
empower citizens in the county
77
3.948052
0.9582894
4
Citizen participation has been
adequately supported through
funding by the county government
to strengthen local planning in the
county
77
3.792208
0.8786602
5
Citizen participation has been
adequately supported through
funding by the county government
to strengthen local planning in the
county
77
3.597403
1.09135
Source: Researcher 2017
From Table 6 above, it was demonstrated that the mean score for the five statements set to
measure the impact of public participation on the effective management of the budget ranged
between 3.597403 and 3.948052 with the third statement ‘Citizen participation in the
budgeting process has been encouraged by the top management to strengthens and empower
citizens in the county’ contributing the highest mean of (mean score =3.948052,
SD=0.9582894) while ‘Citizen participation has been adequately supported through funding
by the county government to strengthen local planning in the county posting the lowest score
(mean score =3.597403, SD= 1.09135). This implied that public participation had been fairly
embraced in the counties but policies should be put in place to improve on its application
because it was demonstrated that it had a positive and significant impact on effective
management of the budget.
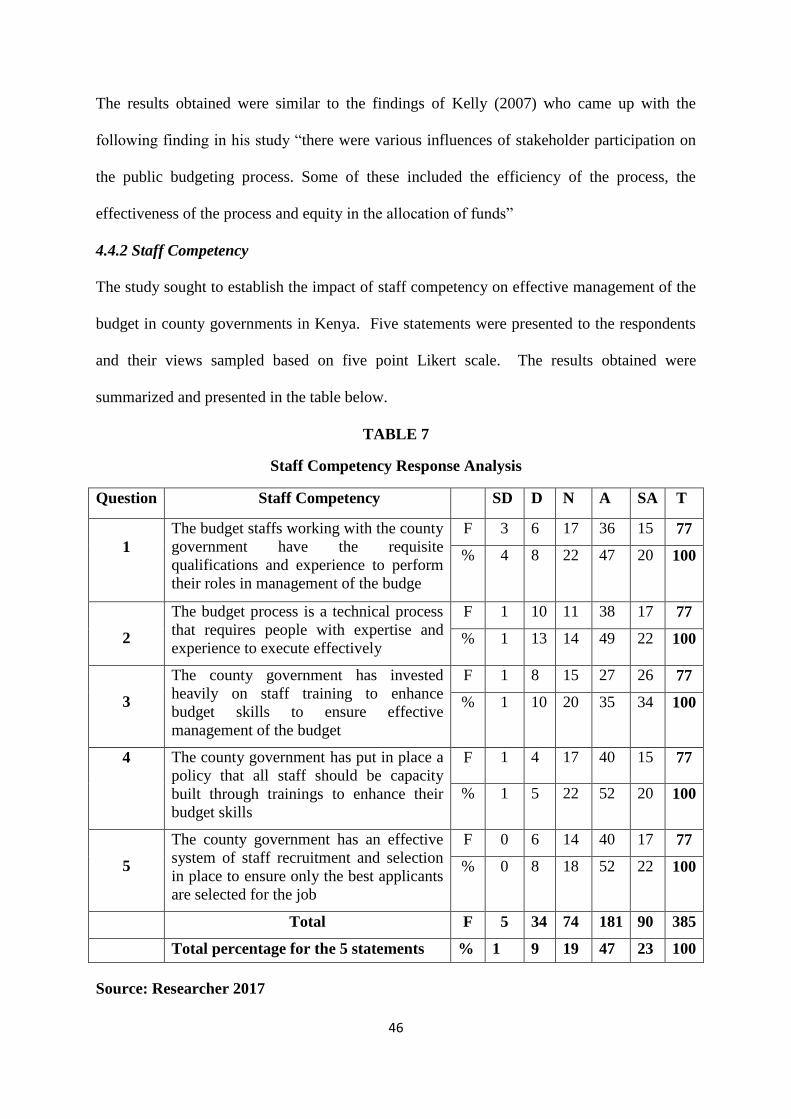
46
The results obtained were similar to the findings of Kelly (2007) who came up with the
following finding in his study “there were various influences of stakeholder participation on
the public budgeting process. Some of these included the efficiency of the process, the
effectiveness of the process and equity in the allocation of funds”
4.4.2 Staff Competency
The study sought to establish the impact of staff competency on effective management of the
budget in county governments in Kenya. Five statements were presented to the respondents
and their views sampled based on five point Likert scale. The results obtained were
summarized and presented in the table below.
TABLE 7
Staff Competency Response Analysis
Question Staff Competency SD D N A SA T
1
The budget staffs working with the county
government have the requisite
qualifications and experience to perform
their roles in management of the budge
F 3 6 17 36 15 77
% 4 8 22 47 20 100
2
The budget process is a technical process
that requires people with expertise and
experience to execute effectively
F 1 10 11 38 17 77
% 1 13 14 49 22 100
3
The county government has invested
heavily on staff training to enhance
budget skills to ensure effective
management of the budget
F 1 8 15 27 26 77
% 1 10 20 35 34 100
4 The county government has put in place a
policy that all staff should be capacity
built through trainings to enhance their
budget skills
F 1 4 17 40 15 77
% 1 5 22 52 20 100
5
The county government has an effective
system of staff recruitment and selection
in place to ensure only the best applicants
are selected for the job
F 0 6 14 40 17 77
% 0 8 18 52 22 100
Total F 5 34 74 181 90 385
Total percentage for the 5 statements % 1 9 19 47 23 100
Source: Researcher 2017

47
From table 7 above, a summary of the five statements that were administered to measure the
impact of staff competency on effective management of budget in county governments and
their responses were tabulated. The findings indicated that 47% and 23% of the respondents
agreed and strongly agreed respectively that staff competency had an impact on effective
management of the budget in county governments in Kenya. These comprised of 70% of all
the respondents who participated in the study which was a strong indicator that staff
competency has an impact on effective management of the budget in county governments in
Kenya. An examination of statements of the variable staff competency in the selected
counties based on the mean and standard deviation were summarized in table 8 below.
TABLE 8
Staff Competency Mean and S.D analysis
Statement OBS Mean Std. Deviation
1
The budget staffs working with the
county government have the
requisite qualifications and
experience to perform their roles
in management of the budge
77
3.701299
1.000854
2
The budget process is a technical
process that requires people with
expertise and experience to
execute effectively
77
3.779221
0.9817194
3
The county government has
invested heavily on staff training
to enhance budget skills to ensure
effective management of the
budget.
77
3.896104
1.033446
4
The county government has put in
place a policy that all staff should
be capacity built through trainings
to enhance their budget skills
77
3.831169
0.8491884
5
The county government has an
effective system of staff
recruitment and selection in place
to ensure only the best applicants
are selected for the job
77
3.883117
0.8425217
Source: Researcher 2017
48
From Table 8 above, it was demonstrated that the mean score for the five statements set to
measure the impact of staff competency on effective management of the budget ranged
between 3.701299 and 3.883117 with the statement ‘The county government has an effective
system of staff recruitment and selection in place to ensure only the best applicants are
selected for the job’ contributing the highest mean (mean score =3.883117, SD=0.8425217)
while ‘The budget staffs working with the county government have the requisite
qualifications and experience to perform their roles in management of the budget posting the
lowest score (mean score =3.701299, SD= 1.000854). This implied that for effective
management of the budget to be achieved, staff competency should be put in to consideration
while hiring staff because a positive and significant relationship was demonstrated.
The findings were in line with the findings of Aketch and Karanja (2013) as cited in
Apiyo and Mburu (2014) who concluded in there study that the budget process was a
technical process that required people with expertise and experience to execute. It would first
involve setting realistic goals, planning on how to execute the goals and also conducting
budgetary review. This process required a lot of accuracy in estimations and serious
accountability at execution. These states of affairs clearly demonstrated that highly trained
personnel were required to execute the budget.
4.4.3 Information technology
The study sought to establish the impact of information technology on effective management
of the budget in selected five county governments in Kenya. Five statements were presented
to the respondents and their views sampled based on five point Likert scale. The results
obtained were summarized and presented in the table below.

49
TABLE 9
Information Technology Response Analysis
Question Information technology SD D N A SA T
1
The county government has invested in
computerization to be able to adopt
financial management and information
systems in budget formulation, execution
and accounting
F 0 11 19 36 11 77
% 0 14 25 47 14 100
2
County Departments have enhanced
budgetary support in training staff on the
application of financial management and
information systems
F 2 14 19 33 9 77
% 1 18 25 43 12 100
3
The county government has put in place a
policy that all staff should be capacity
built through trainings to enhance their IT
skills
F 1 10 18 37 11 77
% 1 13 23 48 14 100
4
The National Treasury, IFMIS
department, provides adequate technical
support to enable effective use of IFMIS
system in the county
F 1 8 20 36 12 77
% 1 10 26 47 15 100
5
The county government prepares and
executes the budget by utilizing the
IFMIS system
F 5 12 9 30 21 77
% 7 16 12 39 27 100
Total F 9 55 85 172 64 385
Total percentage for the 5 statements % 2 14 22 45 17 100
Source: Researcher 2017
From table 9 above, a summary of the five statements that were administered to measure the
impact of information technology on effective management of budget in county governments
and their responses were tabulated. The findings indicated that 45% and 17% of the
respondents agreed and strongly agreed respectively that information technology had an
impact on effective management of the budget in county governments in Kenya. These
comprised of 62% of all the respondents who participated in the study which was a strong
indicator that information technology has an impact on effective management of the budget
in county governments in Kenya. An examination of statements of the variable information

50
technology in the selected counties based on the mean and standard deviation were
summarized in table 10.
TABLE 10
Information Technology Mean and S.D analysis
Statement OBS Mean Std. Deviation
1
The county government has invested
in computerization to be able to adopt
financial management and
information systems in budget
formulation, execution and
accounting
77
3.61039
0.9054781
2
County Departments have enhanced
budgetary support in training staff on
the application of financial
management and information systems
77
3.428571
1.005623
3
The county government has put in
place a policy that all staff should be
capacity built through trainings to
enhance their IT skills
77
3.61039
0.934089
4
The National Treasury, IFMIS
department, provides adequate
technical support to enable effective
use of IFMIS system in the county
77
3.649351
0.9143049
5
The county government prepares and
executes the budget by utilizing the
IFMIS system
77
3.649351
1.222231
Source: Researcher 2017
From Table 10 above, it was demonstrated that the mean score for the five statements set to
measure the impact of information technology on effective management of budget ranged
between 3.61039 and 3.649351 with the statement ‘The county government prepares and
executes the budget by utilizing the IFMIS system’ recording the highest mean and standard
deviation of (mean =3.649351, SD= 1.222231) while ‘The county government has invested
in computerization to be able to adopt financial management and information systems in
budget formulation, execution and accounting having the lowest score (mean score
=3.61039, SD= 0.9054781). This implied that county governments have embraced

51
information technology in most of their functions including budgeting. However there was
still room for improvement since the score according to the mean was moderate.
The findings obtained were similar to the findings of Mutuma (2016) who from his research
concluded that institutional constraints, use of IFMIS and effective oversight and audit
function had significant influence on budget implementation.
4.4.4 Government regulations/laws
The study sought to establish the impact of government regulations/laws on effective
management of the budget in selected five county governments in Kenya. Five statements
were presented to the respondents and their views sampled based on five point Likert scale.
The results obtained were summarized and presented in the table below.
TABLE 11
Government Regulations/laws Response Analysis
Question Government regulations/laws SD D N A SA T
1
The county government manages the
budget according to the constitution and
the supporting regulations
F 2 11 15 33 16 77
% 1 14 20 43 21 100
2
The county government makes a
provision in the budget for training staff
on the application of the law in the
budget making process.
F 1 10 14 30 22 77
% 1 13 18 39 29 100
3
The county government ensures that each
officer engaged in the budgeting process
participates in trainings on effective
management of the budget and in
accordance to the law.
F 1 10 14 25 27 77
% 1 13 18 33 35 100
4
The budgeting staffs understand the PFM
Regulations relating to county
government budgeting
F 0 6 17 35 19 77
% 0 8 22 46 25 100
5
The top management in the county
government supports and understands the
importance of effective management of
the budget and in accordance with the law
F 1 11 12 34 19 77
% 1 14 16 44 25 100
Total F 5 48 72 157 103 385
Total percentage for the 5 statements % 1 13 19 41 27 100
Source: Researcher 2017

52
From table 11 above, a summary of the five statements that were administered to measure the
impact of government regulations/laws on effective management of budget in county
governments and their responses were tabulated. The findings indicated that 41% and 27% of
the respondents agreed and strongly agreed respectively that government regulations/laws
had an impact on effective management of the budget in county governments in Kenya.
These comprised of 68% of all the respondents who participated in the study which was a
strong indicator that government regulations/laws have an impact on effective management
of the budget in county governments in Kenya. An examination of statements of the variable
government regulations/laws in the selected counties based on the mean and standard
deviation were summarized in table 12 below.
TABLE 12
Government Regulations/laws Mean and S.D analysis
Statement OBS Mean Std. Deviation
1
The county government manages
the budget according to the
constitution and the supporting
regulations
77
3.649351
1.048385
2
The county government makes a
provision in the budget for
training staff on the application of
the law in the budget making
process.
77
3.805195
1.039217
3
The county government ensures
that each officer engaged in the
budgeting process participates in
trainings on effective management
of the budget and in accordance to
the law.
77
3.87013
1.080334
4
The budgeting staffs understand
the PFM Regulations relating to
county government budgeting
77
3.87013
0.8788547
5
The top management in the county
government supports and understands
the importance of effective
management of the budget and in
accordance with the law
77
3.766234
1.024645
Source: Researcher 2017

53
From Table 12 above, it was demonstrated that the mean score for the five statements set to
measure the impact of government regulations on effective management of the budget ranged
between 3.649351 and 3.87013 with the statement ‘The county government ensures that each
officer engaged in the budgeting process participates in trainings on effective management of
the budget and in accordance to the law. ’ contributing the highest mean (mean score
=3.87013, SD=1.080334 while ‘the county government manages the budget according to the
constitution and the supporting regulations recording the lowest score (mean score
=3.649351, SD = 1.048385). This Implies that majority of the staff are conversant and adhere
to government regulations with regard to budgeting and the budgeting process and also other
financial management matters.
The results obtained were in line with the findings of the International budget
Patnerships (2016) who after realizing from there study the importance of government
regulations came up with an Act to guide budgeting. The Act stated that counties shall create
forums in order to “provide a means for consultation by the county government on:
preparation of county plans, the County Fiscal Strategy Paper, and the Budget Review and
Outlook Paper for the county; and matters relating to budgeting, the economy and financial
management at the county level.
4.4.5 Effective management of the budget
The study sought to measure effective management of the budget in county governments in
Kenya. Five statements were presented to the respondents based five point Likert scale and
results obtained were presented in the table below.
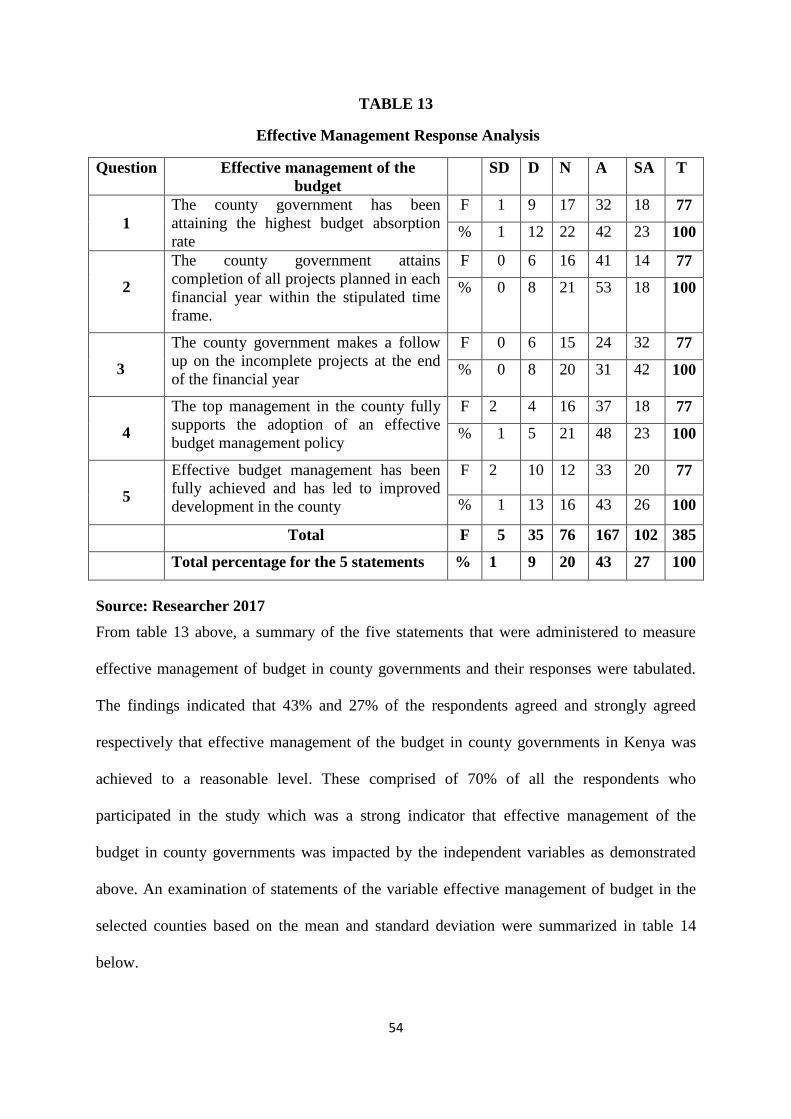
54
TABLE 13
Effective Management Response Analysis
Question Effective management of the
budget
SD D N A SA T
1
The county government has been
attaining the highest budget absorption
rate
F 1 9 17 32 18 77
% 1 12 22 42 23 100
2
The county government attains
completion of all projects planned in each
financial year within the stipulated time
frame.
F 0 6 16 41 14 77
% 0 8 21 53 18 100
3
The county government makes a follow
up on the incomplete projects at the end
of the financial year
F 0 6 15 24 32 77
% 0 8 20 31 42 100
4
The top management in the county fully
supports the adoption of an effective
budget management policy
F 2 4 16 37 18 77
% 1 5 21 48 23 100
5
Effective budget management has been
fully achieved and has led to improved
development in the county
F 2 10 12 33 20 77
% 1 13 16 43 26 100
Total F 5 35 76 167 102 385
Total percentage for the 5 statements % 1 9 20 43 27 100
Source: Researcher 2017
From table 13 above, a summary of the five statements that were administered to measure
effective management of budget in county governments and their responses were tabulated.
The findings indicated that 43% and 27% of the respondents agreed and strongly agreed
respectively that effective management of the budget in county governments in Kenya was
achieved to a reasonable level. These comprised of 70% of all the respondents who
participated in the study which was a strong indicator that effective management of the
budget in county governments was impacted by the independent variables as demonstrated
above. An examination of statements of the variable effective management of budget in the
selected counties based on the mean and standard deviation were summarized in table 14
below.

55
TABLE 14
Effective Management of the Budget Mean and S.D analysis
Statement OBS Mean Std. Deviation
1
The county government has been
attaining the highest budget
absorption rate
77
3.74026
0.9921083
2
The county government attains
completion of all projects planned
in each financial year within the
stipulated time frame.
77
3.818182
0.8228204
3
The county government makes a
follow up on the incomplete
projects at the end of the financial
year
77
4.064935
0.9643332
4
The top management in the county
fully supports the adoption of an
effective budget management
policy
77
3.844156
0.9328075
5
Effective budget management has
been fully achieved and has led to
improved development in the
county
77
3.766234
1.062471
Source: Researcher 2017
From Table 14 above, it was demonstrated that the mean score for the five statements set to
measure effective management of the budget ranged between 3.74026 and 4.064935with the
statement ‘The county government makes a follow up on the incomplete projects at the end
of the financial year’ contributing the highest mean (mean score =4.064935, SD=0.9643332)
while ‘The county government has been attaining the highest budget absorption rate
recording the lowest score (mean score =3.74026, SD= 0.9921083). This implied that
effective management of the budget had been fairly achieved.
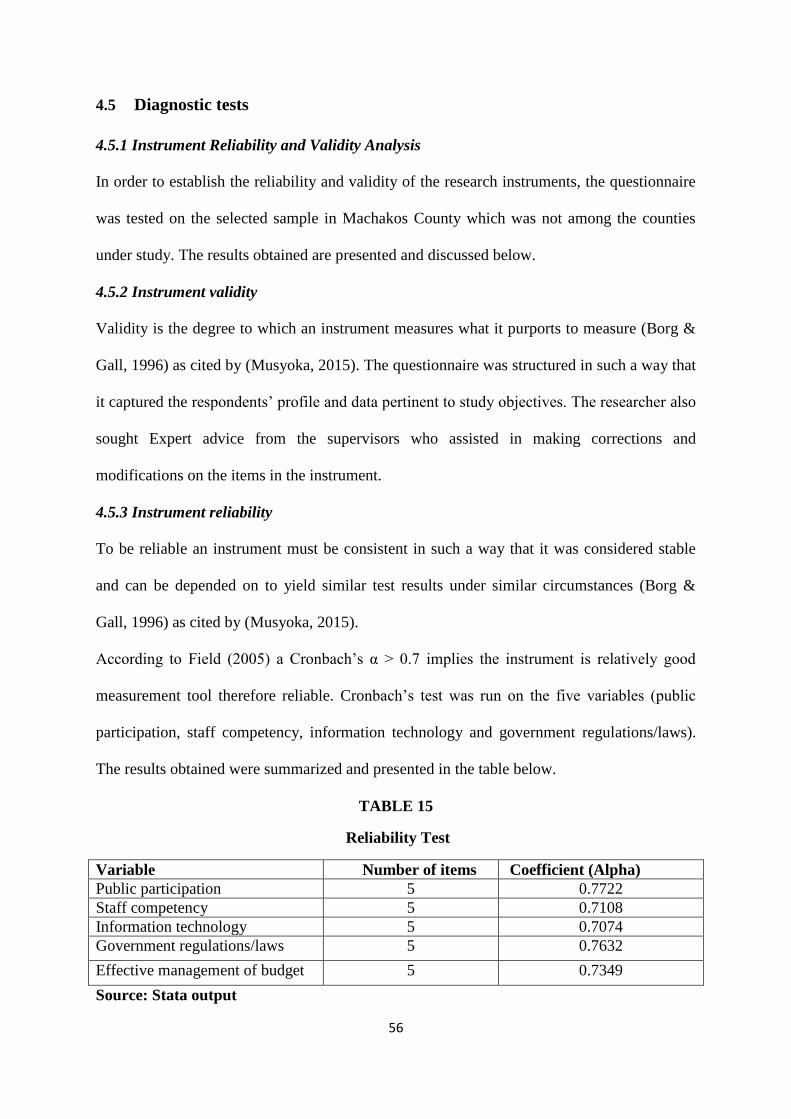
56
4.5 Diagnostic tests
4.5.1 Instrument Reliability and Validity Analysis
In order to establish the reliability and validity of the research instruments, the questionnaire
was tested on the selected sample in Machakos County which was not among the counties
under study. The results obtained are presented and discussed below.
4.5.2 Instrument validity
Validity is the degree to which an instrument measures what it purports to measure (Borg &
Gall, 1996) as cited by (Musyoka, 2015). The questionnaire was structured in such a way that
it captured the respondents’ profile and data pertinent to study objectives. The researcher also
sought Expert advice from the supervisors who assisted in making corrections and
modifications on the items in the instrument.
4.5.3 Instrument reliability
To be reliable an instrument must be consistent in such a way that it was considered stable
and can be depended on to yield similar test results under similar circumstances (Borg &
Gall, 1996) as cited by (Musyoka, 2015).
According to Field (2005) a Cronbach’s α > 0.7 implies the instrument is relatively good
measurement tool therefore reliable. Cronbach’s test was run on the five variables (public
participation, staff competency, information technology and government regulations/laws).
The results obtained were summarized and presented in the table below.
TABLE 15
Reliability Test
Variable Number of items Coefficient (Alpha)
Public participation 5 0.7722
Staff competency 5 0.7108
Information technology 5 0.7074
Government regulations/laws 5 0.7632
Effective management of budget 5 0.7349
Source: Stata output

57
Based on the results in table 15 above, all the five variables posted an Alpha of above 0.7
which implied that the instrument posted consistent results and therefore was acceptable.
Before carrying out regression analysis using Ordinary Least Square (OLS) method, the
researcher checked that data conforms to the Classical Linear Regression assumptions.
4.5.4 Descriptive statistics
These tests include the generation of number of observations, means, standard deviations, the
lowest and the highest figures in each variable. The use of this output is to primarily find out
if the data need any transformation to reduce variance; and if the data has any outliers or
mistakes. This is conducted by running the data on STATA
TABLE 16
Descriptive Statistics
VARIABLE OBS MEAN
STD. DEV
MIN MAX
PUBLIC PARTICIPATION 77 3.750649 0.593966 2.6 4.8
STAFF COMPETENCY 77 3.818182 0.5759951 2.4 5
INFORMATION TECHNOLOGY 77 3.58961 0.5646574 2.4 4.8
GOVERNMENT REGULATIONS 77 3.792208 0.6116772 2.4 5
EFFECTIVE BUDGET MANAGEMENT 77 3.846753 0.5128826 2.8 5
Source: stata output
The output in table 16 above demonstrated the combined means and standard deviations for
each variable. Staff competency shows the highest mean of 3.818182 while information
technology shows the lowest mean of 3.58961. The interpretation was that most of the
respondents felt that staff competency had a higher impact on effective management of the
budget followed by government regulations and public participation respectively.
4.5.5 Test for outliers using the box plot
This test entails running the data on STATA for all the variables and then issue command for
the generation of box plot. Only drop extreme outliers and change the functional form of the
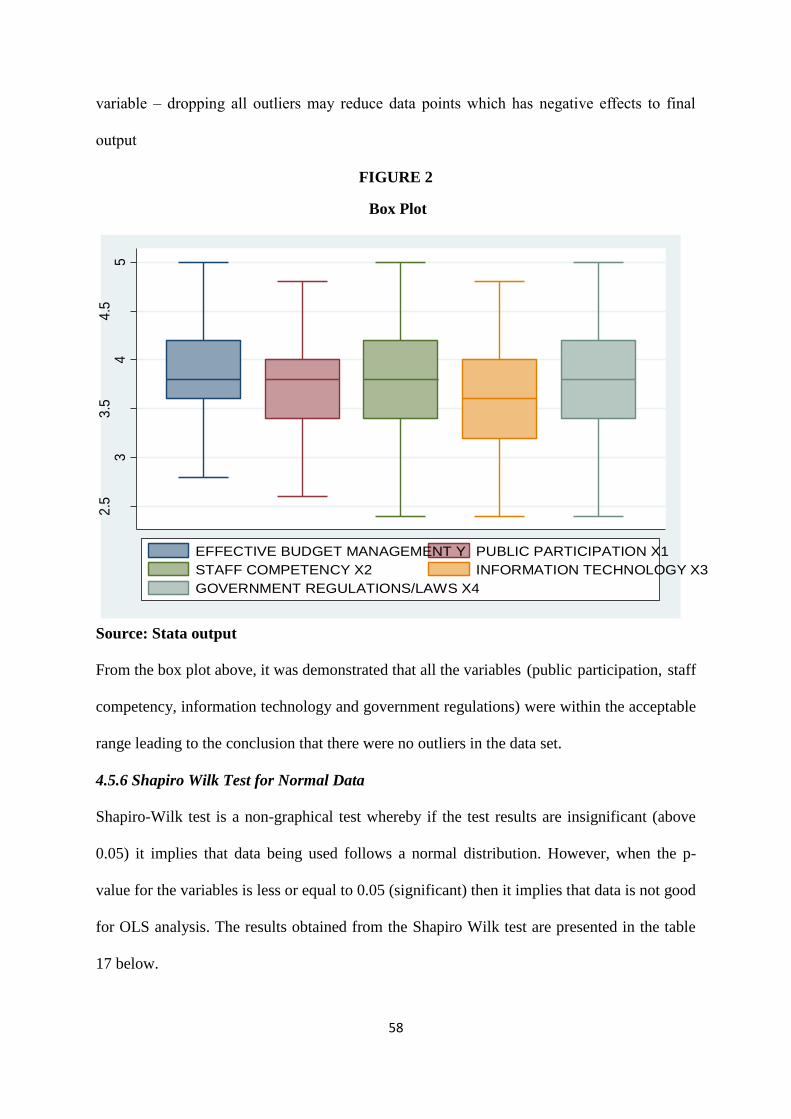
58
variable – dropping all outliers may reduce data points which has negative effects to final
output
FIGURE 2
Box Plot
Source: Stata output
From the box plot above, it was demonstrated that all the variables (public participation, staff
competency, information technology and government regulations) were within the acceptable
range leading to the conclusion that there were no outliers in the data set.
4.5.6 Shapiro Wilk Test for Normal Data
Shapiro-Wilk test is a non-graphical test whereby if the test results are insignificant (above
0.05) it implies that data being used follows a normal distribution. However, when the p-
value for the variables is less or equal to 0.05 (significant) then it implies that data is not good
for OLS analysis. The results obtained from the Shapiro Wilk test are presented in the table
17 below.
2.5
33
.54
4.5
5
EFFECTIVE BUDGET MANAGEMENT Y PUBLIC PARTICIPATION X1
STAFF COMPETENCY X2 INFORMATION TECHNOLOGY X3
GOVERNMENT REGULATIONS/LAWS X4
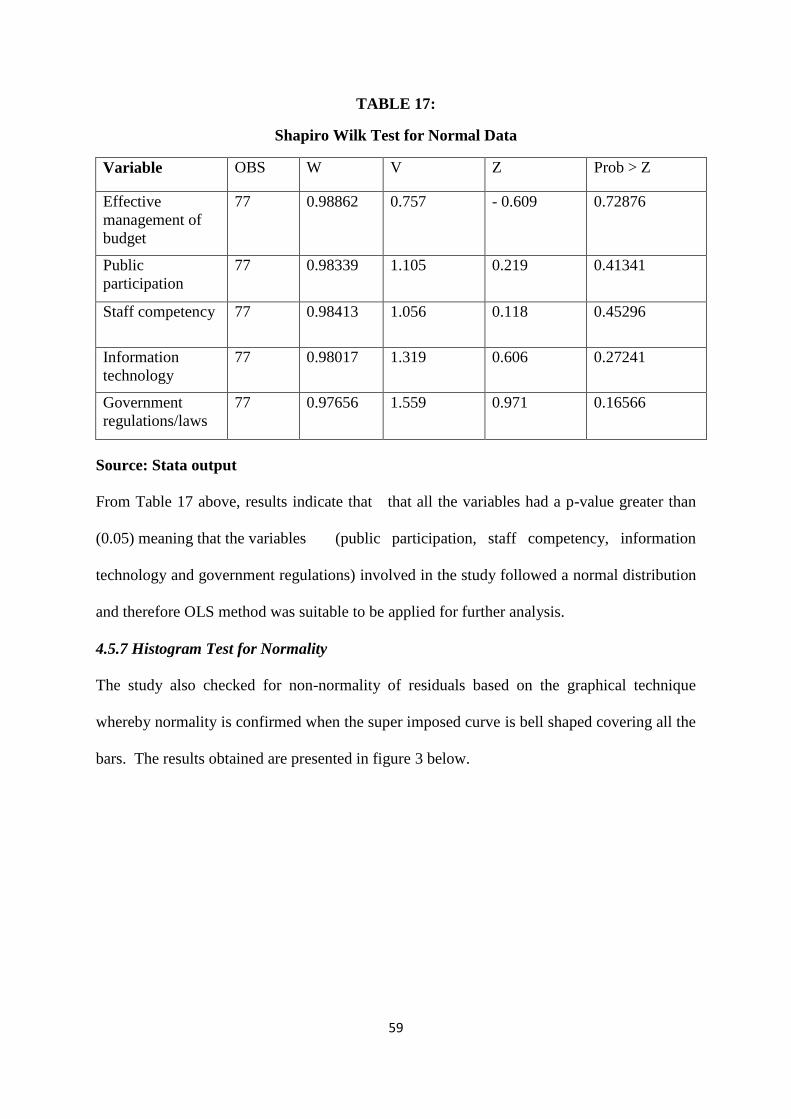
59
TABLE 17:
Shapiro Wilk Test for Normal Data
Variable OBS W V Z Prob > Z
Effective
management of
budget
77 0.98862 0.757 - 0.609 0.72876
Public
participation
77 0.98339 1.105 0.219 0.41341
Staff competency 77 0.98413 1.056 0.118 0.45296
Information
technology
77 0.98017
1.319 0.606 0.27241
Government
regulations/laws
77 0.97656 1.559 0.971 0.16566
Source: Stata output
From Table 17 above, results indicate that that all the variables had a p-value greater than
(0.05) meaning that the variables (public participation, staff competency, information
technology and government regulations) involved in the study followed a normal distribution
and therefore OLS method was suitable to be applied for further analysis.
4.5.7 Histogram Test for Normality
The study also checked for non-normality of residuals based on the graphical technique
whereby normality is confirmed when the super imposed curve is bell shaped covering all the
bars. The results obtained are presented in figure 3 below.

60
FIGURE 3
Histogram Test for Normality
Source: Stata output
The histogram in figure 3 above revealed that the bell shaped imposed curve covered all
the bars of the histogram and therefore further confirmed the Shapiro Wilk test in the pre-
test that data used in the study was normally distributed and therefore considered fit to apply
OLS technique in the entire analysis. The analysis entails determining the impact of public
participation, staff competency, information technology and the application of government
regulations/laws on effective management of budget in county governments in Kenya.
4.5.8 Pairwise Correlation Test for Multycollinearity
According to Gujarat (2003), explanatory variables should not exhibit high correlation with
each other because that may cause unrealistic results during regression. In order to avoid that
problem, explanatory variables were tested for Multycollinearity using pairwise correlation
technique and the results are presented in the table below
0.5
11
.5
Den
sity
-1 -.5 0 .5 1Residuals

61
TABLE 18
Pairwise Correlations Test
Variable Effective
management
of budget
Public
participation
Staff
competency
Information
technology
Government
regulations/
laws
Effective
management of
budget
1.0000
Public
participation
0.5916 1.0000
Staff competency 0.1717 - 0.0973 1.0000
Information
technology
0.0399 0.1711 - 0.1515
1.0000
Government
regulations/laws
0.6035 0.5958 0.0034 0.3137 1.0000
Source: Stata output
Results from Table 18 above indicated that the four explanatory variables (public
participation, staff competency, information technology and government regulations) were
moderately correlated with each other and none of them had surpassed the rule of the thumb
where correlations above 0.8 may lead to spurious results. Therefore OLS technique was
appropriate in determining the effect of the independent variables on effective management
of budget in county governments in Kenya.
4.5.9 VIF Test for multycollinearity
While the pairwise correlation carried earlier indicated that the explanatory variables were
not highly correlated, the VIF test was carried out immediately after regression to confirm the
authenticity of the pre-test indicated in (table18) and the results are presented in Table 19
below.

62
TABLE 19
VIF Test for Multycollinearity
Variable VIF 1/VIF
Government regulations/laws 1.69 0.590381
Public participation 1.58 0.634093
Information technology 1.14 0.876815
Staff competency 1.04 0.958016
Mean VIF 1.36
Source: Stata output
Results in Table 19 above demonstrated a mean VIF of 1.36 which was less than the set
threshold of 10 when variables are perfectly collinear hence confirms the pre-test done on the
data that there was no multycollinearity problem in the data used. Tolerances (1/VIF) were
between 0.59 and 0.96. This meant that for government regulations/laws, 59% of the
variance was not explained by the other independent variables. For public participation, 63%
of the variance was not explained by the other independent variables. For information
technology, 88% of the variance was not explained by the other independent variables and
finally for staff competency, 96% of the variance was not explained by the other independent
variables. All the variables demonstrated a high tolerance and a low VIF value indicating a
low degree of multycollinearity, if any.
4.5.10 Breusch pagan test for heteroscedasticity
Typically, a formal test is designed to test the null hypothesis of homoscedasticity (equal
error variance between parameters) versus an alternative hypothesis of heteroscedasticity.
Breusch pagan test was applied to detect heteroscedasticity. According to Kelly, (2007) the
common test for heteroscedasticity is the Breusch pagan test. The results demonstrated below
posted a p-value of 0.4529 at 95% confidence level hence the study failed to reject the null
hypothesis that errors are homogeneous and therefore concluded that there was no possible
presence of Heteroscedasticity in the model.

63
Table 20 below demonstrates the result after the data was ran on the stata software.
TABLE 20
Breusch Pagan Test for Heteroscedasticity
Source: Stata output
After Conducting the Breusch-Pagan test, the result didn’t demonstrate the presence of
heteroscedasticity as indicated by the (P-value 0.4529) which was above 0.05 which is the
rule of thumb. Based on this result, the null hypothesis was accepted and the alternative
hypothesis that the variance was not homogenous was rejected.
Prob > chi2 = 0.4529
chi2(1) = 0.56
Variables: fitted values of EFFECTIVEBUDGETMANAGEMENTY
Ho: Constant variance
Breusch-Pagan / Cook-Weisberg test for heteroskedasticity

64
FIGURE 4
Visual Test for Heteroscedasticity - RVF PLOT
Source: Stata output
From Figure 5 above, the graph shows the residual by fitted (predicted) value. The
RVFPLOT did not demonstrate any pattern suggesting that the data set was okay to apply
CLR technique. The variability of the residuals for fitted values did not demonstrate any
pattern. This observation indicated that there was no heteroscedasticity.it was therefore
concluded that the independent variables (public participation, staff competency,
information technology and government regulations) can be relied upon to determine their
impact on effective management of budget by applying regression analysis.
4.6 Model fitting
To determine the relationship between the independent and dependent variable, multiple
linear regressions was performed based on the model below.
Y = β0 + β1X1 + β2X2 + β3X3 + β4X4 + e
-1-.
50
.51
Resid
uals
3 3.5 4 4.5Fitted values
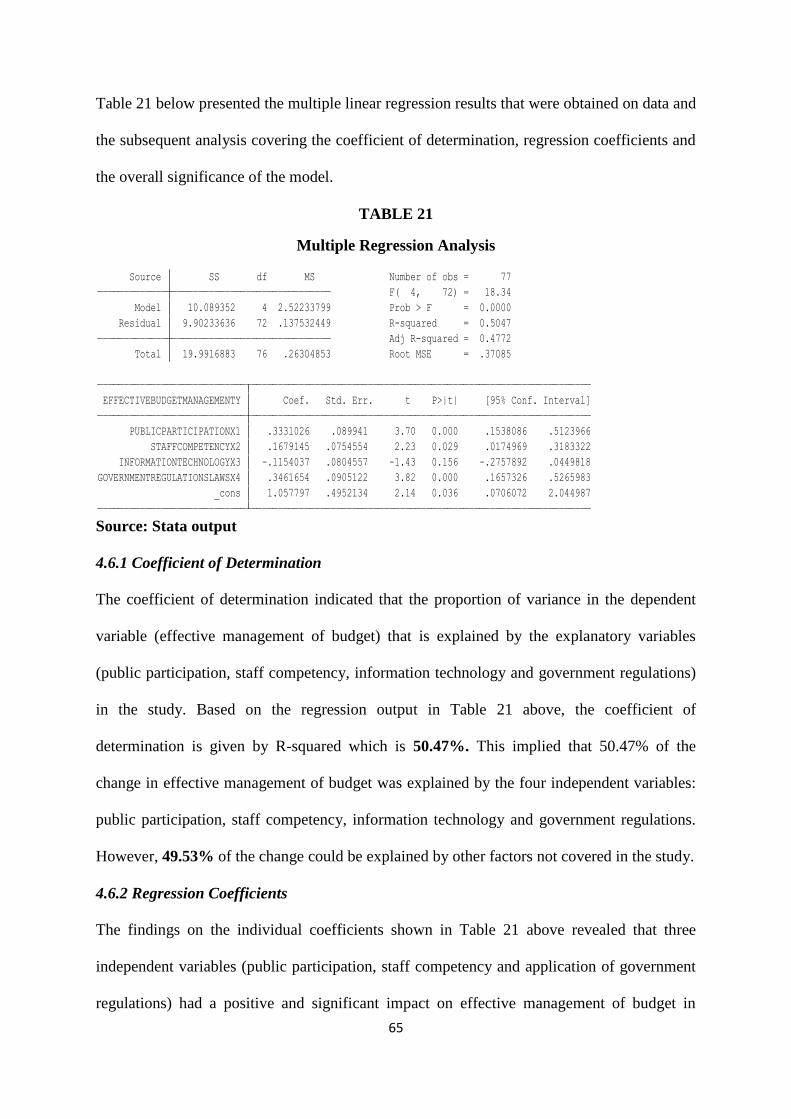
65
Table 21 below presented the multiple linear regression results that were obtained on data and
the subsequent analysis covering the coefficient of determination, regression coefficients and
the overall significance of the model.
TABLE 21
Multiple Regression Analysis
Source: Stata output
4.6.1 Coefficient of Determination
The coefficient of determination indicated that the proportion of variance in the dependent
variable (effective management of budget) that is explained by the explanatory variables
(public participation, staff competency, information technology and government regulations)
in the study. Based on the regression output in Table 21 above, the coefficient of
determination is given by R-squared which is 50.47%. This implied that 50.47% of the
change in effective management of budget was explained by the four independent variables:
public participation, staff competency, information technology and government regulations.
However, 49.53% of the change could be explained by other factors not covered in the study.
4.6.2 Regression Coefficients
The findings on the individual coefficients shown in Table 21 above revealed that three
independent variables (public participation, staff competency and application of government
regulations) had a positive and significant impact on effective management of budget in
_cons 1.057797 .4952134 2.14 0.036 .0706072 2.044987
GOVERNMENTREGULATIONSLAWSX4 .3461654 .0905122 3.82 0.000 .1657326 .5265983
INFORMATIONTECHNOLOGYX3 -.1154037 .0804557 -1.43 0.156 -.2757892 .0449818
STAFFCOMPETENCYX2 .1679145 .0754554 2.23 0.029 .0174969 .3183322
PUBLICPARTICIPATIONX1 .3331026 .089941 3.70 0.000 .1538086 .5123966
EFFECTIVEBUDGETMANAGEMENTY Coef. Std. Err. t P>|t| [95% Conf. Interval]
Total 19.9916883 76 .26304853 Root MSE = .37085
Adj R-squared = 0.4772
Residual 9.90233636 72 .137532449 R-squared = 0.5047
Model 10.089352 4 2.52233799 Prob > F = 0.0000
F( 4, 72) = 18.34
Source SS df MS Number of obs = 77

66
county governments while information technology had a fairly small negative impact on
effective management of budget in county governments which was not significant.
The results obtained on individual coefficients indicated that public participation had
a positive and significant relationship on effective management of the budget in county
governments in Kenya with a coefficient of correlation (0.3331, P= 0.000) at 5% significance
level. This implied that public participation contributed about 33.3% towards effective
management of the budget in the four counties under study. Staff competency had a positive
and significant relationship on effective management of the budget in county governments in
Kenya with a coefficient of correlation (0.1679, PV=0.029) at 5% significance level. This
implied that staff competency contributed about 16.7% towards effective management of
the budget in the four counties under study.
Application of information technology had a fairly low negative relationship on
effective management of the budget in county governments in Kenya with a coefficient
correlation of (- 0.1154, PV=0.156) at 5% significance level. This implied that application
of information technology contributed negatively to about -11.5% towards effective
management of the budget in the four counties under study. While the application of
government regulations/laws had a positive and significant relationship on effective
management of the budget in county governments in Kenya with a coefficient of correlation
(0.3462, PV=0.000) at 5% significance level. This implied that staff competency
contributed about 34.6% towards effective management of the budget in the four counties
under study.
4.6.3 Overall Significance of the Model.
The results in Table 21 above further revealed that the overall model had a p-value of 0.000
(significant) implied that the model was a good fit that was significant and can be used to
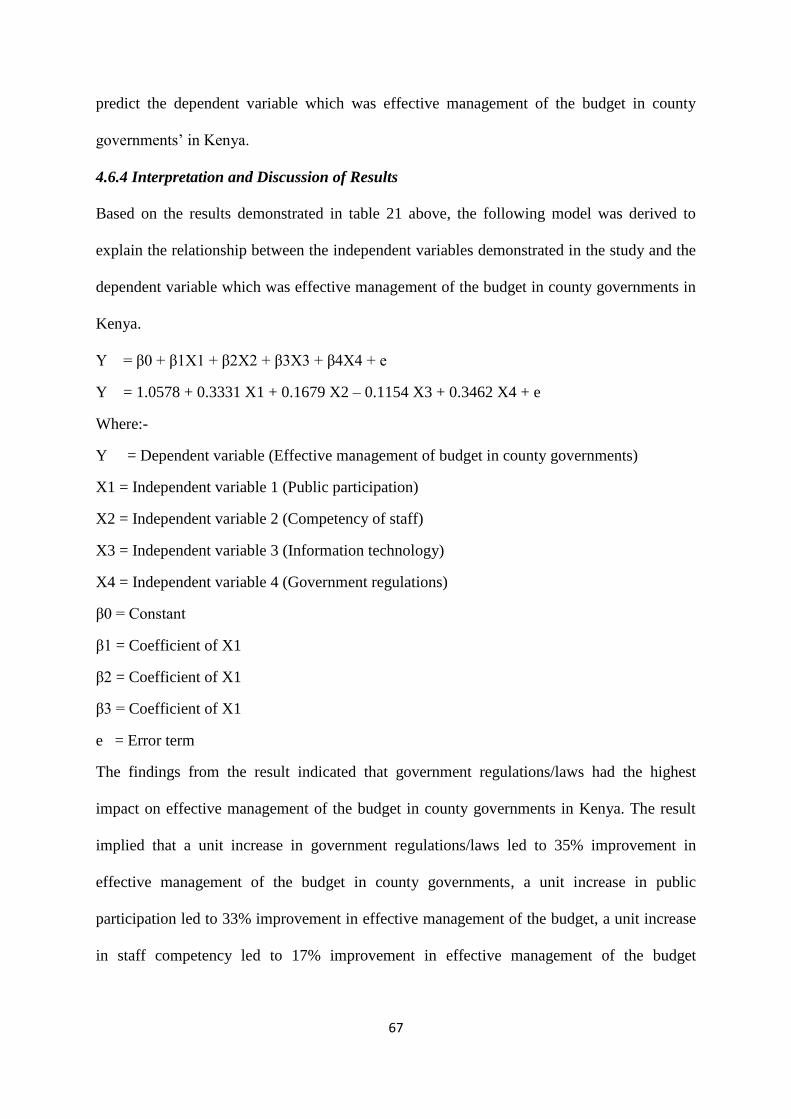
67
predict the dependent variable which was effective management of the budget in county
governments’ in Kenya.
4.6.4 Interpretation and Discussion of Results
Based on the results demonstrated in table 21 above, the following model was derived to
explain the relationship between the independent variables demonstrated in the study and the
dependent variable which was effective management of the budget in county governments in
Kenya.
Y = β0 + β1X1 + β2X2 + β3X3 + β4X4 + e
Y = 1.0578 + 0.3331 X1 + 0.1679 X2 – 0.1154 X3 + 0.3462 X4 + e
Where:-
Y = Dependent variable (Effective management of budget in county governments)
X1 = Independent variable 1 (Public participation)
X2 = Independent variable 2 (Competency of staff)
X3 = Independent variable 3 (Information technology)
X4 = Independent variable 4 (Government regulations)
β0 = Constant
β1 = Coefficient of X1
β2 = Coefficient of X1
β3 = Coefficient of X1
e = Error term
The findings from the result indicated that government regulations/laws had the highest
impact on effective management of the budget in county governments in Kenya. The result
implied that a unit increase in government regulations/laws led to 35% improvement in
effective management of the budget in county governments, a unit increase in public
participation led to 33% improvement in effective management of the budget, a unit increase
in staff competency led to 17% improvement in effective management of the budget

68
respectively. The results indicated information technology as having a negative impact on
effective management of the budget.
69
CHAPTER FIVE
5 SUMMARY, CONCLUSIONS AND RECOMMENDATIONS
5.1 Introduction
The main objective of the study was to establish the factors affecting effective management
of the budget in County Governments in Kenya. This chapter presents the summary of
findings, conclusion, recommendations, and recommendations for further research.
5.2 Summary
From the general objective of the study, the study aimed at establishing the factors affecting
effective management of the budget in county governments in Kenya. The study established
that there was a significant positive relationship between the factors identified (independent
variables) that were public participation, staff competency, application of information
technology, government regulations and the dependent variable.
Based on the regression output in Table 21, the coefficient of determination as
demonstrated by R-squared was 50.47%. This implied that 50.47% of the change in
effective management of budget was explained by the four independent variables: public
participation, staff competency, application of information technology and government
regulations. However, 49.53% of the change could be explained by other factors not covered
in the study. Findings on each of the four objectives forming the independent variables are
briefly discussed below.
5.2.1 Impact of public participation on effective management of budget
The study sought to establish the impact of public participation on effective management of
budgets in County Governments in Kenya. From the analysis in Table 6, it was demonstrated
that the mean score for the five statements set to measure the impact of public participation
on the effective management of the budget ranged between 3.597403 and 3.948052. This was
an indication that citizen participation had an impact on effective management of budget in

70
county governments in Kenya with the third statement ‘participation of Citizen budgeting
process has been encouraged by the top management to strengthens and empower citizens in
the county’ contributing the highest mean; while ‘Citizen participation has been adequately
supported through funding by the county government to strengthen local planning in the
county’ posting the lowest mean score.
From the analysis in table 5, a summary of the five statements that were administered
to measure the impact of public participation on effective management of budget in county
governments and their responses were tabulated. The findings indicated that majority of the
respondents agreed and strongly agreed that public participation had an impact on effective
management of the budget in county governments in Kenya. The results obtained on
individual coefficients indicated that public participation had a positive and significant
relationship on effective management of the budget in county governments in Kenya.
5.2.2 Impact of staff competency on effective management of budget
The study sought to establish the impact of staff competency on effective management of
budget in County Governments in Kenya. From the analysis in Table 8, it was demonstrated
that the mean score for the five statements set to measure the impact of staff competency on
the effective management of the budget was on the higher side. This was an indication that
staff competency had an impact on effective management of budget in county governments in
Kenya with the third statement ‘The county government has an effective system of staff
recruitment and selection in place to ensure only the best applicants are selected for the job’
contributing the highest mean; while ‘The budget staffs working with the county government
have the requisite qualifications and experience to perform their roles in management of the
budget’ posting the lowest mean score.
From the analysis in table 7, a summary of the five statements that were administered
to measure the impact of staff competence on effective management of budget in county

71
governments and their responses were tabulated. The findings indicated that majority of the
respondents agreed and strongly agreed that staff competency had an impact on effective
management of the budget in county governments in Kenya. The results obtained on
individual coefficients indicated that staff competency had a positive and significant
relationship on effective management of the budget in county governments in Kenya.
5.2.3 Impact of information technology on effective management of budget
The study sought to establish the impact of the application of information technology on the
effective management of budget in County Governments in Kenya. From the analysis in
Table 10, it was demonstrated that the mean score for the five statements set to measure the
impact of the application of information technology on the effective management of the
budget was on the higher side. This was an indication that the application of information
technology had an impact on effective management of budget in county governments in
Kenya with the third statement ‘The county government prepares and executes the budget by
utilizing the IFMIS system’ contributing the highest mean; while ‘The county government
has invested in computerization to be able to adopt financial management and information
systems in budget formulation, execution and accounting’ posting the lowest mean score.
From the analysis in table 9, a summary of the five statements that were administered
to measure the impact of the application of information technology on effective management
of budget in county governments and their responses were tabulated. The findings indicated
that majority of the respondents agreed and strongly agreed that the application of
information technology had an impact on effective management of the budget in county
governments in Kenya. The results obtained on individual coefficients indicated that the
application of information technology had a negative and insignificant relationship on
effective management of the budget in county governments in Kenya.
72
5.2.4 Impact of government regulations/laws on effective management of budget
The study sought to establish the impact of government regulations/laws on effective
management of budget in County Governments in Kenya. From the analysis in Table 12, it
was demonstrated that the mean scores for the five statements that were set to measure the
impact of government regulations/laws on the effective management of the budget was on the
higher side. This was an indication that government regulations had an impact on effective
management of budget in county governments in Kenya with the statement ‘The county
government ensures that each officer engaged in the budgeting process participates in
trainings on effective management of the budget and in accordance to the law’ contributing
the highest mean; while ‘the county government manages the budget according to the
constitution and the supporting regulations’ posting the lowest mean score.
From the analysis in table 11, a summary of the five statements that were
administered to measure the impact of government regulations/laws on effective management
of budget in county governments and their responses were tabulated. The findings indicated
that majority of the respondents agreed and strongly agreed that government regulations/laws
had an impact on effective management of the budget in county governments in Kenya. The
results obtained on individual coefficients indicated that application of government
regulations/laws had a positive and significant relationship on effective management of the
budget in county governments in Kenya with.
5.3 Conclusions
Based on the findings above, the researcher concluded that there exists a positive and
significant relationship between three of the independent variables, public participation, staff
competency and the application of government regulations/laws on effective management of
the budget in county governments in Kenya. The application of government regulations/laws
contributed the highest percentage, followed by public participation and staff competency

73
respectively. Information technology demonstrated a fairly low negative and insignificant
relationship which did not affect the study. Further, the study demonstrated that the overall
model was statistically significant in the prediction of the dependent variable and therefore
the researcher recommends to county governments to give the three factors priority when
developing there operational policies. These findings agree with the findings of earlier
researchers in the area of study such as (Muammar et al 2015, Oketa, 2013, Mutuma, 2016)
who obtained similar results in their studies.
From the result analyzed in this study, it was demonstrated that the factors considered
in the research have a moderate influence of 50.47% on effective management of the budget
in county governments in Kenya. Effective management of the budget in a country is a key
component in realizing economic growth that would eventually transform the lives of people.
Many developing countries have challenges in achieving effectiveness in the management of
budget due to lack of accountability, transparency and lack of qualified personnel in the
public sector. Based on this study, it was concluded that staff competency, adoption of public
participation and strict adherence to government laws and regulations would ensure success
in county governments in Kenya only it’s fully adopted.
According to the findings in this study, the variables considered had a moderate
positive impact on effective management of the budget. However to achieve success in
effective management of budget in county governments in Kenya; county management
should be advised to enhance the application of the variables under this study.
5.4 Recommendations
1. The study recommends that the government should carry out civic education to
promote the participation of citizens in the county budgeting process. This is because
the study has demonstrated a significant positive relationship between public
participation and effective management of the budget

74
2. The study also recommends that there is need for the county government to follow up
on the enforcement of the regulations of stakeholder participation in the county
budgeting process since this will ensure better management of county funds and
successful implementation of various projects. This is because the study has
demonstrated a significant positive relationship between application of government
regulations and effective management of the budget
3. The study also recommends that stakeholders should make it their responsibility to
participate in the county budgeting process since it is their democratic right provided
for by the constitution.
4. The study also recommends that county governments should adopt a policy of hiring
competent staff. This is because the study demonstrated a significant positive
relationship between staff competency and effective management of the budget
5.5 Recommendations for Future Research
This study recommends that there is need to carry out further studies using regression
analysis in order to establish other variables that could have an impact on effective
management of the budget in county governments in Kenya.
The study also recommended that this study should be replicated on a wider geographical
scope to cover the whole country as this will help understand the issues affecting each
county.
5.6 Limitations of the Study
Some respondents due to their busy schedules were not able to participate in the study
making it difficult to achieve a 100% response rate
Time and resources that were available to conduct the research were limited hence making it
difficult to conduct a comprehensive and thorough research.

75
REFERENCES
Abdullah., N. (2008). Budget: Planning, Control and Organizational Performance Among
Public-Listed Companies in Malaysia. In N. Abdullah., Introduction to Budget –
Planning and Control (pp. 8-22). Axzo Press on Budgeting.
Antoniadis I., L. T. (2008). The impact of Agency Problem in Firm value and the Greek
Stock Exchange Market Financial Crisis. International Conference on Applied
Economics – ICOAE 2008 .
Apiyo, R. O. (2014). Factors affecting Procurement Planning in County Governments in
Kenya: A Case Study of Nairobi City County.International Journal of Economics,
Commerce and Management, 7 & 8.
Auditor General. (2016). Report of the auditor general on the financial statements of county
government of makueni for the year ended 30th june 2015. Nairobi: The Office of the
Auditor General.
Donaldson, .. J. (1991). Stewardship Theory or Agency Theory:CEO Governance and
Shareholder Returns. Australian Journal of Management, 16, 1, June 1991, ã The
University of New South Wales, 50-52.
Forrester, J. (2002). The Principal-Agent Model and. In Budget Theory in the Public Sector
(p. 124). Westport, Connecticut London: Greenwood Publishing Group, Inc.
Government of makueni county. (2017, january 01). www.makueni.go.ke. Retrieved january
02, 2017, from www.makueni.go.ke/programmes
Hashem, E. A. ( 2014). The Effects of Corruption on Government Expenditures: Arab
countries experience. Journal of Economics and Sustainable Development, Vol.5,
No.4,120.
Isaksen, U. A.-C. (2005). The budget process and corruption. DFID (UK), Norad (Norway),
Sida (Sweden), Gtz (Germany), Cida.
Khemani, J. D. (2006). Introducing Financial Management Information Systems in
developing countries. OECD Journalon Budgeting, 98-100.
Kombo, A. &. (2003). Techniques of writing research Proposals. Nairobi: Masola ublishers.
Lakin, J. (2015). International Budget Partnerships. Retrieved December 09, 2016, from
Understanding County Budgets: http://www.internationalbudget.org/
McCue, G. A. (2002). Budget Theory for Public Budget Theory for Public Adminstrators.
Westport, Connecticut London: Greenwood Publishing Group.
Meyers, R. T. (2002). Is there a key to the normative budgeting lock? Policy Sciences, 174.
76
Michael C. Jensen, W. H. (1976). Theory of the firm: managerial behavior, agency costs and
ownership structure. Journal of Financial Economics 3, 305–360.
Mishkov, A. (2015, january). The Black Budget - A Conspiracy Theory turned out to be true.
Retrieved december 28, 2016, from documentary tube.com: IMG-
R:http://images.sodahead.com/profiles/0/0/0/9/2/9/7/7/5/Budget-63186689071.jpeg;
Mutuma, A. N. (2016). CHALLENGES OF BUDGET IMPLEMENTATION IN THE
PUBLIC SECTOR: A CASE OF MERU COUNTY IN KENYA. International
Journal of Economics, Commerce and Management, 528-529.
Moolchand Raghunandan., N. R. (2012). Examining the Behavioural Aspects of Budgeting
with particular emphasis on Public Sector/Service Budgets. International Journal of
Business and Social Science, Vol. 3 No. 14.
Muammar Khaddafi, .. R. (2015). The effect of Budgetary Participation and Budget
Adequacy on individual on individual performance with job satisfaction as an
intervening variable. International Journal of Economics, Commerce and
Management, 1.
Musyoka, M. M. (2015, april). the effect ofhealth insurance financing on the financial
perfomance of health facilities in kenya. Research project. nairobi.
National Council for Law Reporting. (2016). Kenya Law where Legal information is Public
Knowledge. Retrieved November 26, 2016, from
http://www.kenyalaw.org/kl/index.php?id=3979
National Treasury. (2017). Public statement o the Status of Fiscal Transfers to County
Governments. Sunday Nation. Nairobi: Nation Media Group.
Nebraska, O. (2015). Effective Budget Preparation. Retrieved January 2, 2017, from
http://www.serve.nebraska.gov/:
www.serve.nebraska.gov/pdf/grantee/.../Effective%20Budget%20Preparation.pdf
Oketa, D. (2013, june). Examine critically the problems of Budget Implementation inNigeria?
Retrieved december 1, 2016, from https://www.scribd.com:
https://www.scribd.com/doc/49588598/
Olive M. Mugenda & Abel G.Mugenda. (2003). Reaserch Methods: Quantitative and
Qualitative Approaches. Nairobi: African Centre for Technology Studies (ACTS).
Oso, W. &. (2009). A general guide to writing a research proposal and report. Nairobi: Komo
Kenyatta Foundation.
Pandeya, G. P. (2015). Does Citizen Participation in Local Government does citizen
participation in local government planning and accountability systems? International
Public Management Review, 68.

77
The World Bank Group. (2016). Kenyas devolution. Retrieved November 26, 2016, from The
World Bank and Devolution in Kenya:
http://www.worldbank.org/en/country/kenya/brief/kenyas-devolution
Ukpere, S. C. ( 2009 ). Problems and prospects of budgeting and budget implementation in
Local Government System in Nigeria . African Journal of Business Management
Vol.3 (12), , pp. 836-846,.
Uraia Trust. (2012). Devolved Government. Devolved Government. Kenya: The National
Council for law Reporting.
Wikimedia Foundation, I. (2016, September 16). The Free Encyclopedia. Retrieved
November 26, 2016, from Wikipedia: https://en.wikipedia.org/wiki

78
APPENDIX A: QUESTIONNAIRE Dear respondent,
I am a researcher from K.C.A University focusing to establish the factors affecting the
effective management of the budget in selected county governments in Kenya. The research
is meant for academic purposes only; therefore you are kindly requested to participate in the
study by providing all appropriate information in the spaces provided honestly and precisely.
Responses to these questions will be treated as confidential.
The Questionnaire will be based on the following Specific objectives.
1 To establish the impact of public participation on the effective management of budget
in County Governments in Kenya
2 To establish the impact of staff competency in County Government Departments on
the effective management of budget in County Governments in Kenya
3 To investigate how the application of information technology impacts on the effective
management of budget in County Governments in Kenya
4 What effect does the application of government regulations/laws have on the effective
management of budget in County Governments?
TOPIC OF THE STUDY
Factors affecting the effective management of budget in selected county governments in
Kenya. (Makueni, Nairobi, Narok and Kakamega Counties)
Please note that the required information is for the financial year 2016/2017

79
QUESTIONNAIRE
SECTION A: BACKDROUND INFORMATION
This section is concerned with individual information as shown below. You are therefore
kindly requested to fill by putting an appropriate tick based on the choices provided.
NAME OF YOUR
COUNTY……………………………………………………………………………………….
.
1. Gender: Male Female
2. Your Age : 20 - 30 31- 40 41- 50 Over 50
3. Your level of education: College Diploma Undergraduate Post Graduate
4. Nature of employment Permanent Contract Casual
5. Employment Experience (years) 0 - 5 06 -10 11-15 Over 15
Years
SECTION B: PUBLIC PARTICIPATION AND EFFECTIVE MANAGEMENT OF
THE BUDGET
Please indicate to what extent you agree or disagree with the following statements on the
impact of public participation on effective management of the budget in your department by
putting a tick against the options provided below.
1 = strongly disagree (SD) 2 = Disagree (D) 3 = Neutral (N) 4 = Agree (A) 5 = Strongly
Agree (SA)
PUBLIC PARTICIPATION SD D N A SA
NO STATEMENT 1 2 3 4 5
6. Public participation enhances local accountability systems in
county governments
7. Members of the public are informed about project deliverables
in public participation meetings
8. participation of Citizens in the budgeting process has been
encouraged by the top management to strengthens and
empower citizens in the county
9. Citizen participation has been adequately supported through
funding by the county government to strengthen local planning
in the county
10. Citizen participation in county government has led to
improved public service delivery and increased trust of
citizens in government

80
SECTION C: COMPETENCY OF STAFF IN AND EFFECTIVE MANAGEMENT
OF THE BUDGET
Indicate to what extent you agree or disagree with the following statements on the impact of
staff competency on effective management of the budget in your department by putting a tick
against the options provided below.
1 = strongly disagree (SD) 2 = Disagree (D) 3 = Neural (N) 4 = Agree (A) 5 = Strongly
Agree (SA)
COMPETENCY OF STAFF SD D N A SA
NO STATEMENT 1 2 3 4 5
11. The budget staffs working with the county government have
the requisite qualifications and experience to perform their
roles in management of the budget
12. The budget process is a technical process that requires people
with expertise and experience to execute effectively
13. The county government has invested heavily on staff training
to enhance budget skills to ensure effective management of the
budget.
14. The county government has put in place a policy that all staff
should be capacity built through trainings to enhance their
budget skills
15. The county government has an effective system of staff
recruitment and selection in place to ensure only the best
applicants are selected for the job
SECTION D: INFORMATION TECHNOLOGY AND EFFECTIVE MANAGEMENT
OF THE BUDGET
Please indicate to what extent you agree or disagree with the statements provided on the
impact of information technology on effective management of the budget by putting a tick
against the options provided:
1 = strongly disagree (SD) 2 = Disagree (D) 3 = Neutral (N) 4 = Agree (A) 5 = Strongly
Agree (SA)
INFORMATION TECHNOLOGY SD D N A SA
NO STATEMENT 1 2 3 4 5
16 The county government has invested in computerization to be
able to adopt financial management and information systems
in budget formulation, execution and accounting
17 County Departments have enhanced budgetary support in
training staff on the application of financial management and
information systems
18 The county government has put in place a policy that all staff
should be capacity built through trainings to enhance their IT

81
skills
19 The National Treasury, IFMIS department, provides adequate
technical support to enable effective use of IFMIS system in
the county
20 The county government prepares and executes the budget by
utilizing the IFMIS system
SECTION E: GOVERNMENT REGULATIONS/LAWS AND EFFECTIVE
MANAGEMENT OF THE BUDGET
Please indicate to what extent you agree or disagree with the statements provided on the
impact of government regulations/laws on effective management of the budget by putting a
tick against the options provided below.
1 = strongly disagree (SD) 2 = Disagree (D) 3 = Neutral (N) 4 = Agree (A) 5= Strongly
Agree (SA
GOVERNMENT REGULATIONS/LAWS SD D N A SA
NO STATEMENT 1 2 3 4 5
21 The county government manages the budget according to the
constitution and the supporting regulations
22 The county government makes a provision in the budget for
training staff on the application of the law in the budget
making process.
23 The county government ensures that each officer engaged in
the budgeting process participates in trainings on effective
management of the budget and in accordance to the law.
24 The budgeting staffs understand the PFM Regulations relating
to county government budgeting
25 The top management in the county government supports and
understands the importance of effective management of the
budget and in accordance with the law
SECTION E: EFFECTIVE MANAGEMENT OF THE BUDGET
Please indicate to what extent you agree or disagree with the statements provided on effective
management of the budget by putting a tick against the options provided below.
1 = strongly disagree (SD) 2 = Disagree (D) 3 = Neutral (N) 4 = Agree (A) 5 = Strongly
Agree (SA)
EFFECTIVE MANAGEMENT OF THE BUDGET SD D N A SA
NO STATEMENT 1 2 3 4 5
26 The county government has been attaining the highest budget
absorption rate
27 The county government attains completion of all projects
planned in each financial year within the stipulated time frame.

82
28 The county government makes a follow up on the incomplete
projects at the end of the financial year
29 The top management in the county fully supports the adoption
of an effective budget management policy
30 Effective budget management has been fully achieved and has
led to improved development in the county
End of questionnaire and thank you for participating in the exercise

83
APPENDIX B: TIME SCHEDULE FOR RESEARCH
The project schedule will cover the following activities.
NO ACTIVITY DURATION IN WEEKS
1. Development of the project 2
2. Definition of project objectives and stating the
research questions.
2
3. Identification of the research population and
determination of the sample.
2
4. Conducting literature review 4
5. Development of data collection tools 2
6. Data collection 6
7. Data analyses, interpretation and presentation. 2
8. Report writing, highlighting conclusions and
recommendations
4
TOTAL TIME PERIOD 24

84
APPENDIX C: BUDGET
NO EXPENDITURE ITEM COST (KES)
1. Transport 8,000
2. Data collection 6,000
3. Typing, printing and binding 6,000
20,000