
Factbook - 2022 - Iberdrola
192
Factbook 2022
-
Upload
khangminh22 -
Category
Documents
-
view
4 -
download
0
Transcript of Factbook - 2022 - Iberdrola
Factbook2022
2
LEGAL NOTICE
DISCLAIMER
This document has been prepared by Iberdrola, S.A. ("IBERDROLA") and contains information relating to IBERDROLA and the group of companies of which IBERDROLA is the
controlling entity, within the meaning established by law. and it is issued solely for its incorporation in Factbook 2021 data base for information purposes. This document does not
constitute an offer, recommendation or advice, or an invitation to purchase, sale, hold or exchange, nor a request for an offer of purchase, sale, hold or exchange of shares or securities,
nor to execute any transaction whatsoever. It should not be treated as giving investment advice, nor is it intended to provide the basis for any valuation of securities.
It is strictly forbidden to publish, disclose, use or reproduce by any means the information herein, either partially or completely, without the express and prior written consent of
IBERDROLA.
The information and any opinions or statements made in this document have not been verified by independent third parties; therefore, no express or implied representation or warranty is
made as to the impartiality, accuracy, completeness or correctness of the information or the opinions or statements expressed herein, and no reliance should be placed on for any
purpose whatsoever. Likewise, some of the information presented herein is based on statements by third parties.
IBERDROLA undertakes no obligation to publicly update or revise any information on this document or to provide the recipient with access to any additional information or to update this
documentation or any information or to correct any inaccuracies in any such information.
Neither IBERDROLA nor any companies of the Iberdrola Group assume liability of any kind, whether for negligence or any other reason, for any loss or damage whatsoever and
howsoever arising as a result of your use of or reliance on the information contained in this document.
Neither this document nor any part of it constitutes a contract, nor may it be used for incorporation into or construction of any contract, agreement or any other type of commitment.
Certain numerical data relating the profits of IBERDROLA in this document have been rounded according to established commercial standards. As a result, the aggregate amounts (sum
totals or interim totals or differences or if numbers are put in relation) in this document may not correspond in all cases to the amounts contained in the underlying (unrounded) figures
appearing in the consolidated financial statements.
IMPORTANT INFORMATION
This document does not constitute an offer or invitation to purchase or subscribe shares, in accordance with the provisions of: (i) the restated text of the Securities Market Law approved
by Royal Legislative Decree 4/2015, of 23 October; (ii) Regulation (EU) 2017/1129 of the European Parliament and of the Council, of 14 June 2017, on the prospectus to be published when
securities are offered to the public or admitted to trading on a regulated market, and repealing Directive 2003/71/EC; (iii) Royal Decree-Law 5/2005, of 11 March; (iv) Royal Decree
1310/2005, of 4 November; and (v) their implementing regulations.
In addition, this document does not constitute an offer of purchase, sale or exchange, nor a request for an offer of purchase, sale or exchange of securities, nor a request for any vote or
approval in any other jurisdiction.
The shares of IBERDROLA may not be offered or sold in the United States of America except pursuant to an effective registration statement under the Securities Act of 1933 or pursuant
to a valid exemption from registration. The shares of IBERDROLA may not be offered or sold in Brazil except under the registration of IBERDROLA as a foreign issuer of listed securities,
and a registration of a public offering of depositary receipts of its shares, pursuant to the Capital Markets Act of 1976 (Federal Law No. 6,385 of December 7, 1976, as further amended), or
pursuant to a valid exemption from registration of the offering.
This document includes certain Alternative Performance Measures (“APMs”) for the purposes of Commission Delegated Regulation (EU) 2019/979, of March 14, 2019 and as defined in the
Guidelines on Alternative Performance Measures issued by the European Securities and Markets Authority on 5 October 2015 (ESMA/2015/1415es). The APMs are performance measures
that have been calculated using the financial information from IBERDROLA and the companies within its group, but that are not defined or detailed in the applicable financial information
framework. These APMs are being used to allow for a better understanding of the financial performance of IBERDROLA but should be considered only as additional information and in no
case as a substitute of the financial information prepared under International Financial Reporting Standards (“IFRS”). Moreover, the way IBERDROLA defines and calculates these APMs
may differ from the way these are calculated by other companies that use similar measures, and therefore they may not be comparable. Finally, please consider that certain of the APMs
used in this presentation have not been audited. Please refer to this presentation and to the corporate website (www.iberdrola.com) for further details of these matters, including their
definition or a reconciliation between any applicable management indicators.
This document does not contain, and the information presented herein does not constitute, an earnings release or statement of earnings of Avangrid, Inc. (“Avangrid”) or Avangrid's
financial results. Neither Avangrid nor its subsidiaries assume responsibility for the information presented herein.
This document does not contain, and the information presented herein does not constitute, an earnings release or statement of earnings of Neoenergia S.A. (“Neoenergia”) or
Neoenergia's financial results. Neither Neoenergia nor its subsidiaries assume responsibility for the information presented herein.
3
FORWARD-LOOKING STATEMENTS
This document contains forward-looking information and statements about IBERDROLA, including financial projections and estimates and their underlying
assumptions, statements regarding plans, objectives and expectations with respect to future operations, capital expenditures, synergies, products and services, and
statements regarding future performance. Forward-looking statements are statements that are not historical facts and are generally identified by the words “expects,”
“anticipates,” “believes,” “intends,” “estimates” and similar expressions.
Although IBERDROLA believes that the expectations reflected in such forward-looking statements are reasonable, investors and holders of IBERDROLA shares are
cautioned that forward-looking information and statements are subject to various risks and uncertainties, many of which are difficult to predict and generally beyond
the control of IBERDROLA, that could cause actual results and developments to differ materially from those expressed in, or implied or projected by, the forward-
looking information and statements. These risks and uncertainties include those discussed or identified in the documents sent by IBERDROLA to the Spanish
Comisión Nacional del Mercado de Valores, which are accessible to the public.
Forward-looking statements are not guarantees of future performance. They have not been reviewed by the auditors of IBERDROLA. You are cautioned not to place
undue reliance on the forward-looking statements, which speak only as of the date they were made. All subsequent oral or written forward-looking statements
attributable to IBERDROLA or any of its members, directors, officers, employees or any persons acting on its behalf are expressly qualified in their entirety by the
cautionary statement above. All forward-looking statements included herein are based on information available to IBERDROLA on the date hereof. Except as required
by applicable law, IBERDROLA does not undertake any obligation to publicly update or revise any forward-looking statements, whether as a result of new
information, future events or otherwise.
LEGAL NOTICE
4
IBERDROLA CORPORATE PURPOSE
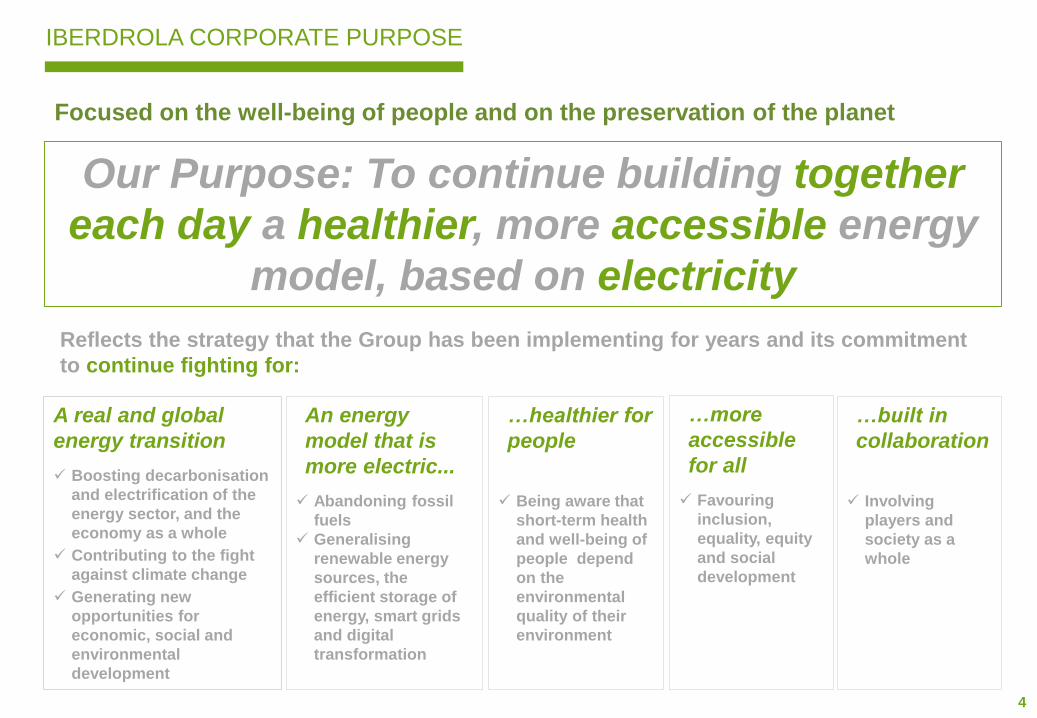
Focused on the well-being of people and on the preservation of the planet
Our Purpose: To continue building together
each day a healthier, more accessible energy
model, based on electricity
Reflects the strategy that the Group has been implementing for years and its commitment
to continue fighting for:
…healthier for
people
✓ Being aware that
short-term health
and well-being of
people depend
on the
environmental
quality of their
environment
A real and global
energy transition
✓ Boosting decarbonisation
and electrification of the
energy sector, and the
economy as a whole
✓ Contributing to the fight
against climate change
✓ Generating new
opportunities for
economic, social and
environmental
development
An energy
model that is
more electric...
✓ Abandoning fossil
fuels
✓ Generalising
renewable energy
sources, the
efficient storage of
energy, smart grids
and digital
transformation
…more
accessible
for all
✓ Favouring
inclusion,
equality, equity
and social
development
…built in
collaboration
✓ Involving
players and
society as a
whole
5
1. Iberdrola Today (page 5)
2. Networks (page 16)
3. Renewables (page 46)
4. Generation & Retail (page 101)
5. Financing (page 135)
6. ESG (page 148)
AGENDA
6
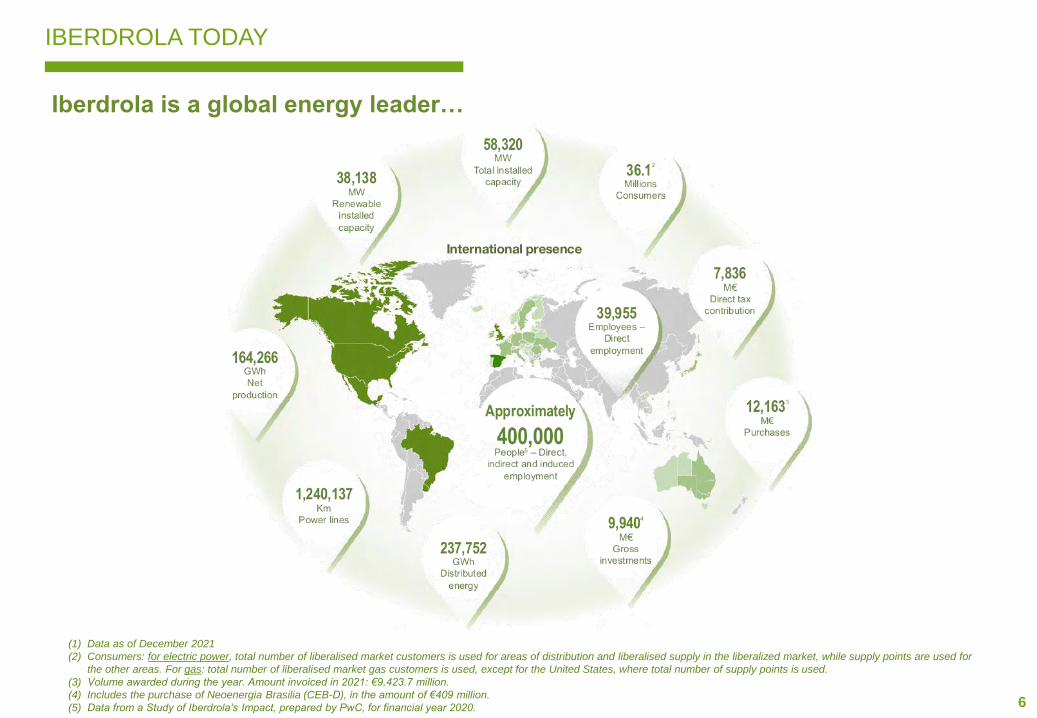
Iberdrola is a global energy leader…
(1) Data as of December 2021
(2) Consumers: for electric power, total number of liberalised market customers is used for areas of distribution and liberalised supply in the liberalized market, while supply points are used for
the other areas. For gas: total number of liberalised market gas customers is used, except for the United States, where total number of supply points is used.
(3) Volume awarded during the year. Amount invoiced in 2021: €9,423.7 million.
(4) Includes the purchase of Neoenergia Brasilia (CEB-D), in the amount of €409 million.
(5) Data from a Study of Iberdrola’s Impact, prepared by PwC, for financial year 2020.
IBERDROLA TODAY
7
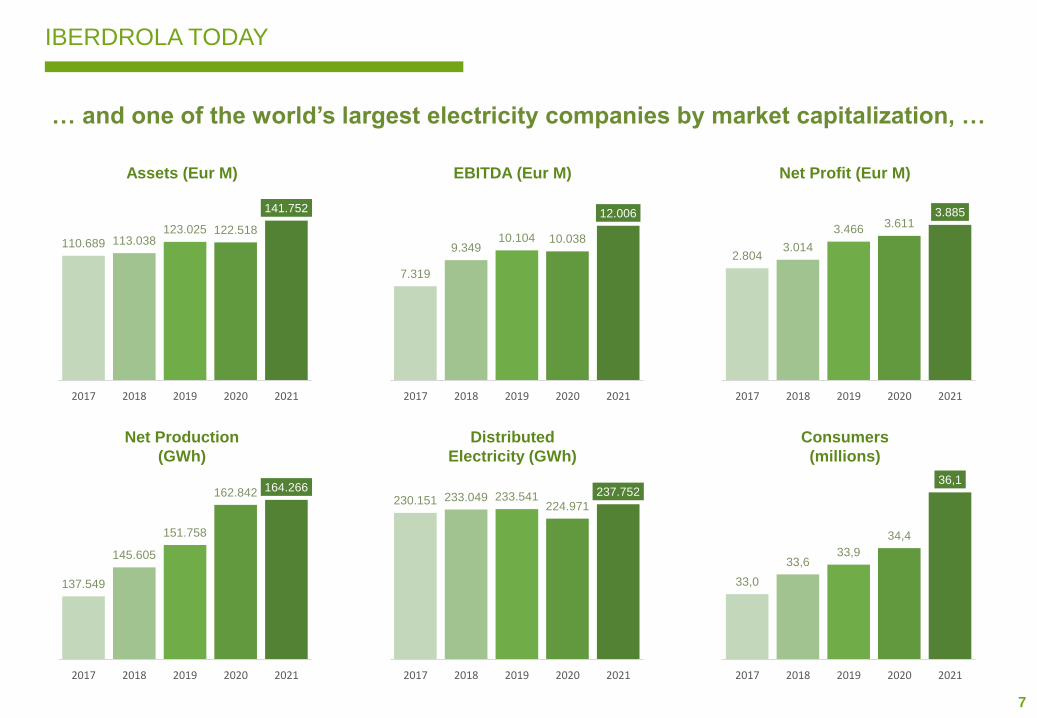
… and one of the world’s largest electricity companies by market capitalization, …
IBERDROLA TODAY
110.689 113.038123.025 122.518
141.752
2017 2018 2019 2020 2021
7.319
9.34910.104 10.038
12.006
2017 2018 2019 2020 2021
2.8043.014
3.4663.611
3.885
2017 2018 2019 2020 2021
137.549
145.605
151.758
162.842 164.266
2017 2018 2019 2020 2021
230.151 233.049 233.541224.971
237.752
2017 2018 2019 2020 2021
Assets (Eur M) EBITDA (Eur M) Net Profit (Eur M)
33,0
33,633,9
34,4
36,1
2017 2018 2019 2020 2021
Net Production
(GWh)
Distributed
Electricity (GWh)
Consumers
(millions)
8
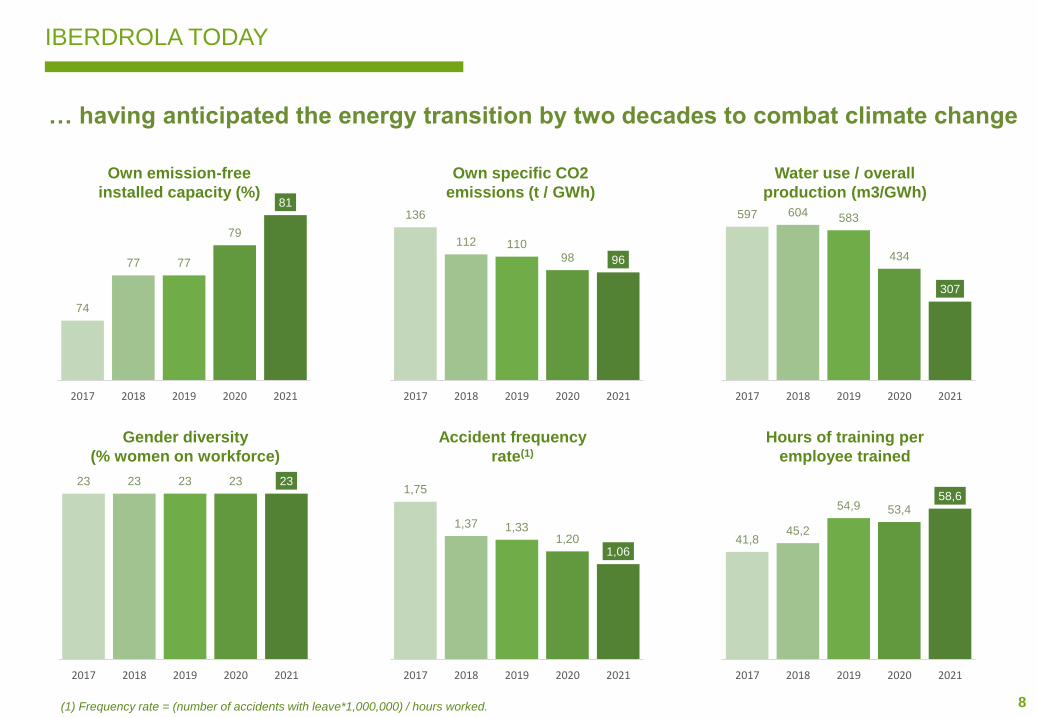
74
77 77
79
81
2017 2018 2019 2020 2021
136
112 11098 96
2017 2018 2019 2020 2021
597 604 583
434
307
2017 2018 2019 2020 2021
23 23 23 23 23
2017 2018 2019 2020 2021
1,75
1,37 1,331,20
1,06
2017 2018 2019 2020 2021
41,845,2
54,9 53,458,6
2017 2018 2019 2020 2021
… having anticipated the energy transition by two decades to combat climate change
IBERDROLA TODAY
Own emission-free
installed capacity (%)
Own specific CO2
emissions (t / GWh)
Water use / overall
production (m3/GWh)
Gender diversity
(% women on workforce)
Accident frequency
rate(1)
Hours of training per
employee trained
(1) Frequency rate = (number of accidents with leave*1,000,000) / hours worked.
9
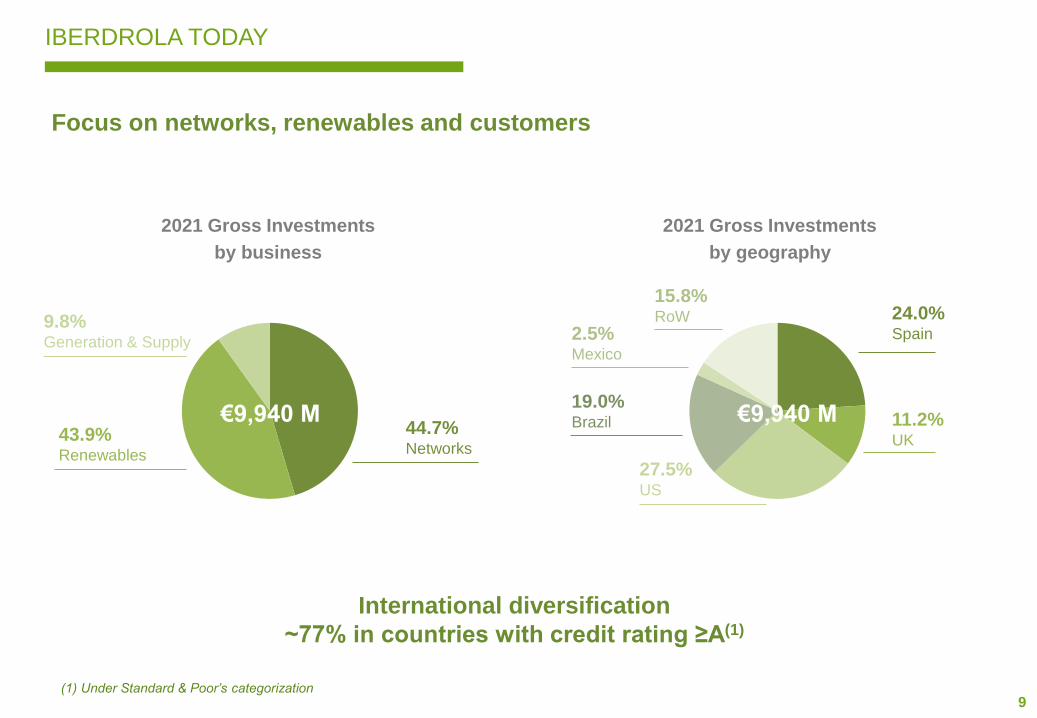
€9,940 M€9,940 M
Focus on networks, renewables and customers
(1) Under Standard & Poor’s categorization
IBERDROLA TODAY
2021 Gross Investments
by business
2021 Gross Investments
by geography
24.0%Spain
11.2%UK
44.7%Networks
43.9%Renewables
9.8%Generation & Supply
27.5%US
19.0%Brazil
2.5%Mexico
15.8%RoW
International diversification
~77% in countries with credit rating ≥A(1)
10
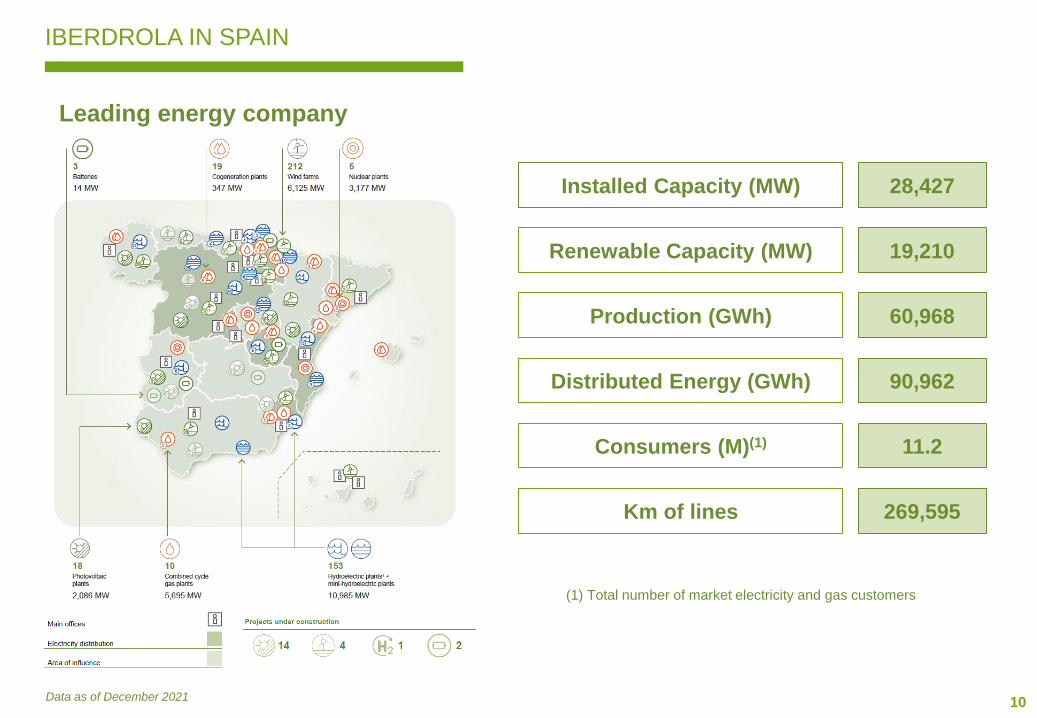
IBERDROLA IN SPAIN
Leading energy company
Installed Capacity (MW)
Renewable Capacity (MW)
Production (GWh)
Consumers (M)(1)
Km of lines
28,427
19,210
60,968
11.2
269,595
Distributed Energy (GWh) 90,962
Data as of December 2021
(1) Total number of market electricity and gas customers
11
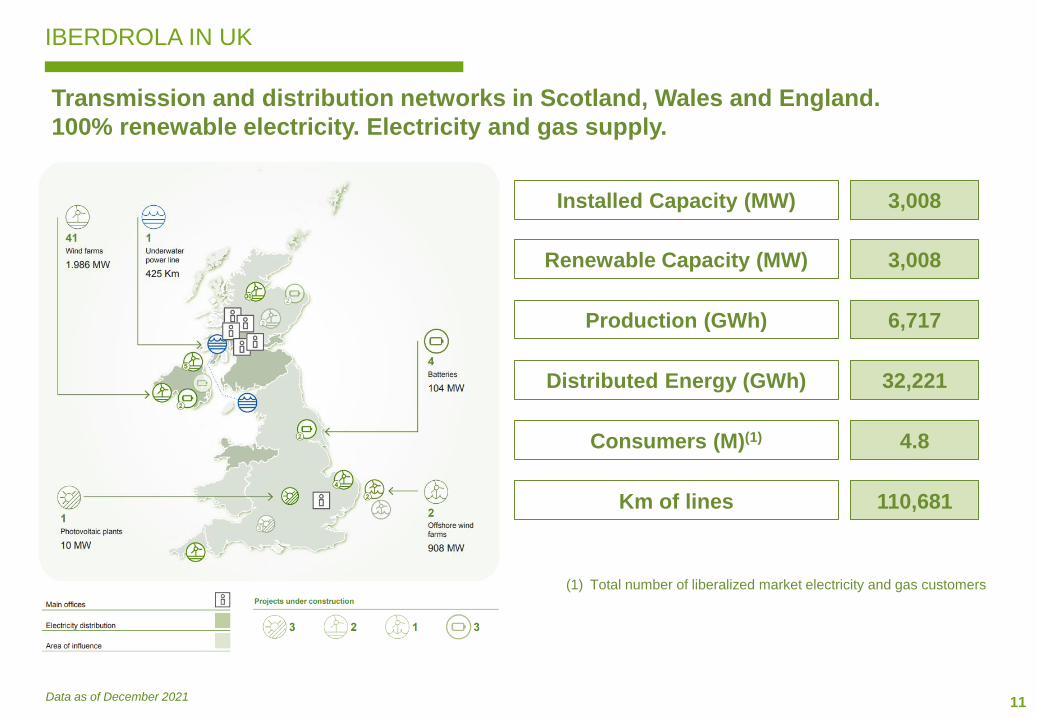
Transmission and distribution networks in Scotland, Wales and England.
100% renewable electricity. Electricity and gas supply.
Installed Capacity (MW)
Renewable Capacity (MW)
Production (GWh)
Consumers (M)(1)
Km of lines
3,008
3,008
6,717
4.8
110,681
Distributed Energy (GWh) 32,221
IBERDROLA IN UK
(1) Total number of liberalized market electricity and gas customers
Data as of December 2021
12
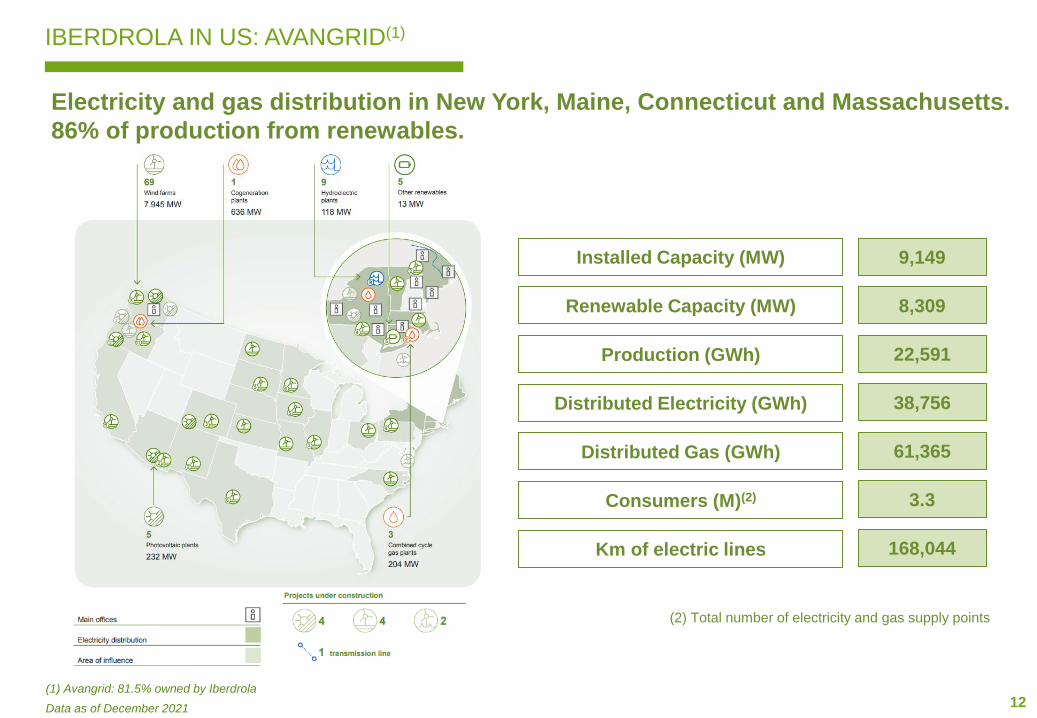
Electricity and gas distribution in New York, Maine, Connecticut and Massachusetts.
86% of production from renewables.
Installed Capacity (MW)
Production (GWh)
Consumers (M)(2)
9,149
8,309
22,591
3.3
Renewable Capacity (MW)
Distributed Electricity (GWh) 38,756
Km of electric lines 168,044
Distributed Gas (GWh) 61,365
IBERDROLA IN US: AVANGRID(1)
(1) Avangrid: 81.5% owned by Iberdrola
(2) Total number of electricity and gas supply points
Data as of December 2021
13
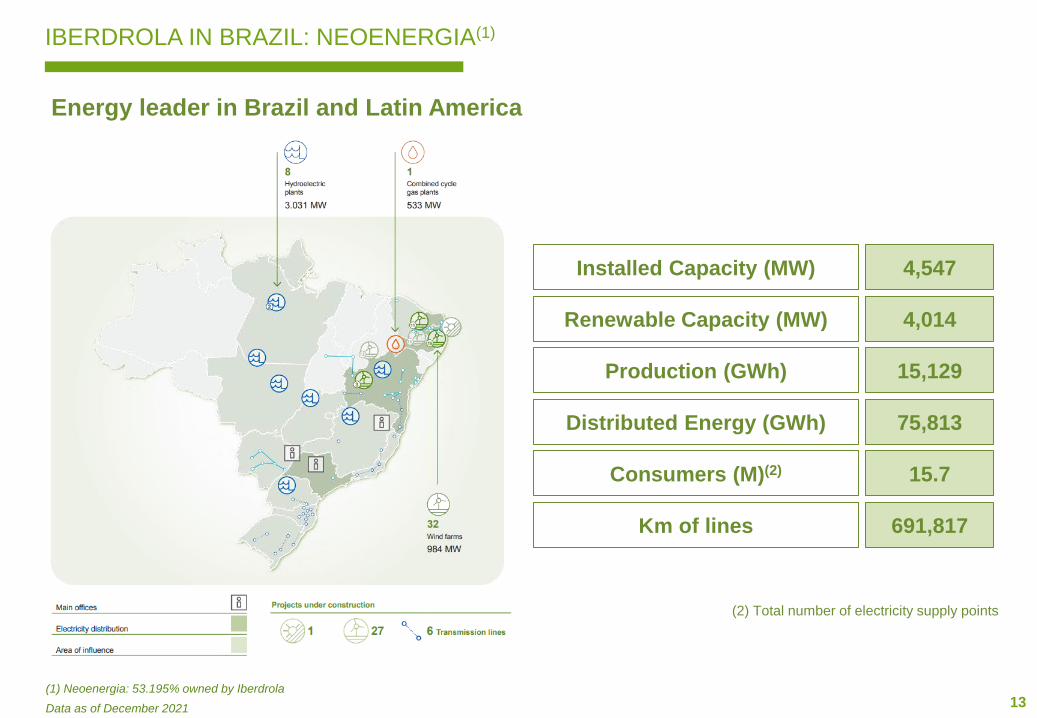
Energy leader in Brazil and Latin America
Installed Capacity (MW) 4,547
4,014
Production (GWh) 15,129
Consumers (M)(2) 15.7
Km of lines 691,817
Renewable Capacity (MW)
Distributed Energy (GWh) 75,813
IBERDROLA IN BRAZIL: NEOENERGIA(1)
(2) Total number of electricity supply points
(1) Neoenergia: 53.195% owned by Iberdrola
Data as of December 2021
14
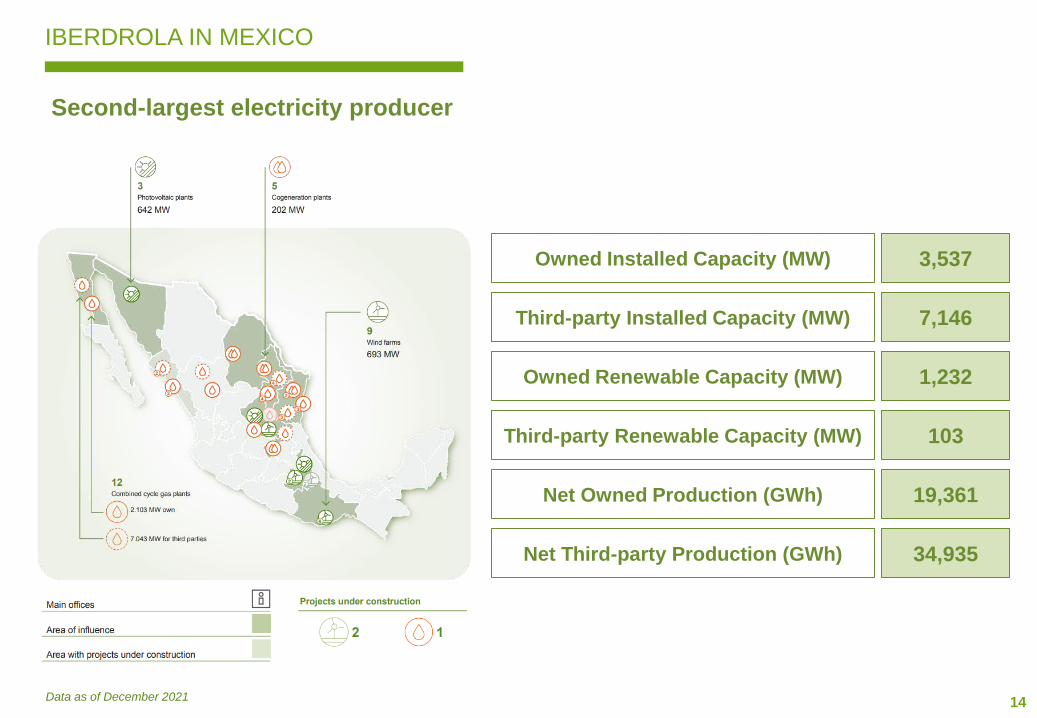
3,537Owned Installed Capacity (MW)
Second-largest electricity producer
Net Owned Production (GWh) 19,361
IBERDROLA IN MEXICO
Data as of December 2021
1,232Owned Renewable Capacity (MW)
7,146Third-party Installed Capacity (MW)
103Third-party Renewable Capacity (MW)
Net Third-party Production (GWh) 34,935

15
Renewable Capacity (MW) 2,262
Production (GWh) 4,565
Expanding our international platform in renewables and customers
IBERDROLA IN THE REST OF THE WORLD
Data as of December 2021
Consumers (M)(1) 1.1
(1) Total number of electricity and gas customers
Installed Capacity (MW) 2,505
16
AGENDA
1. Iberdrola Today (page 5)
2. Networks (page 16)
3. Renewables (page 46)
4. Generation & Retail (page 101)
5. Financing (page 135)
6. ESG (page 148)
17
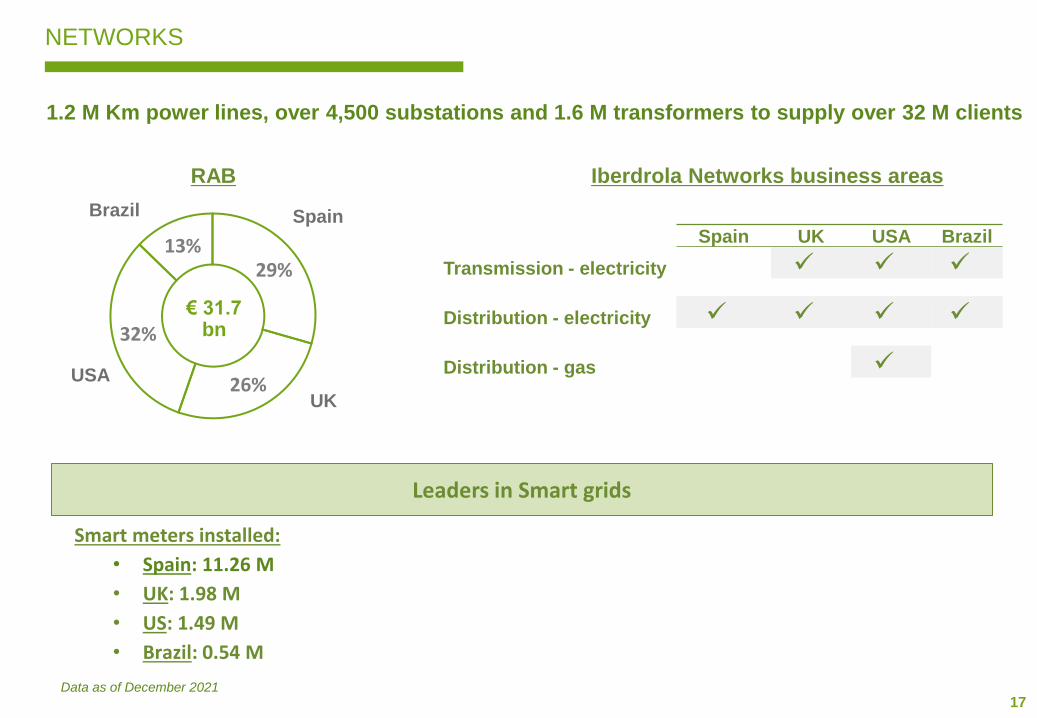
1.2 M Km power lines, over 4,500 substations and 1.6 M transformers to supply over 32 M clients
NETWORKS
Leaders in Smart grids
RAB
Data as of December 2021
Spain UK USA Brazil
Transmission - electricity ✓ ✓ ✓
Distribution - electricity ✓ ✓ ✓ ✓
Distribution - gas ✓
Iberdrola Networks business areas
Smart meters installed:
• Spain: 11.26 M
• UK: 1.98 M
• US: 1.49 M
• Brazil: 0.54 M
29%
26%
32%
13%
€ 31.7 bn
Spain
UK
Brazil
USA
18
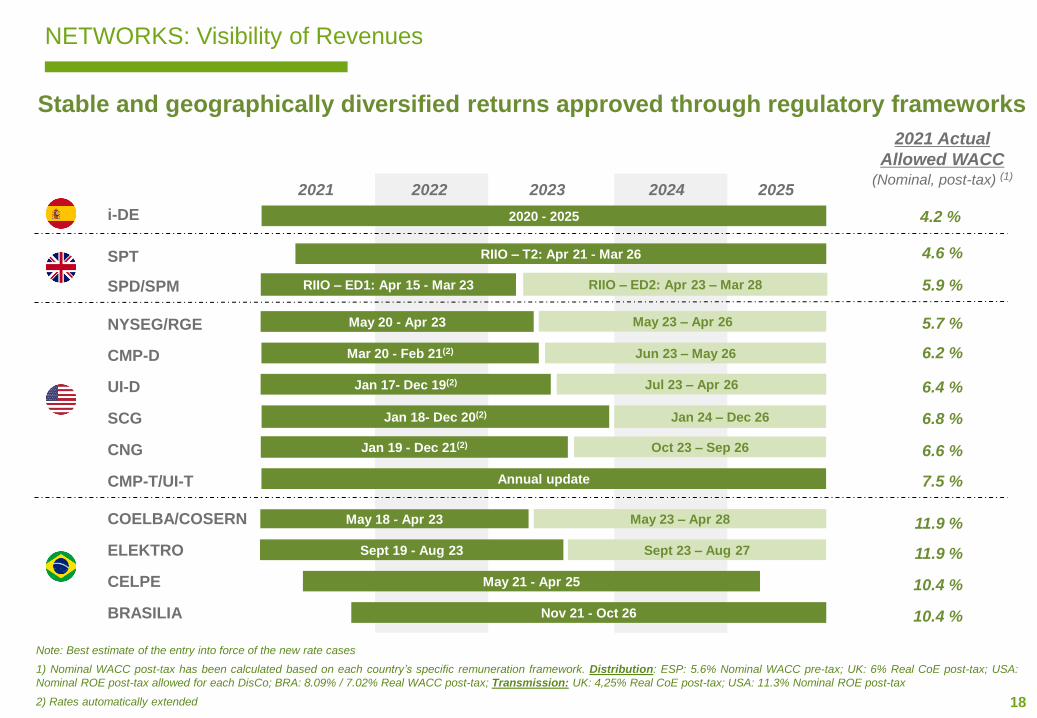
Stable and geographically diversified returns approved through regulatory frameworks
NETWORKS: Visibility of Revenues
i-DE
CMP-T/UI-T
SPT
COELBA/COSERN
ELEKTRO
CELPE
BRASILIA
RIIO – T2: Apr 21 - Mar 26
RIIO – ED1: Apr 15 - Mar 23
May 20 - Apr 23
2020 - 2025
Mar 20 - Feb 21(2) Jun 23 – May 26
Jan 17- Dec 19(2)
May 18 - Apr 23
Annual update
Sept 19 - Aug 23
May 21 - Apr 25
Jan 19 - Dec 21(2)
Jan 18- Dec 20(2)
SPD/SPM
NYSEG/RGE
CMP-D
UI-D
SCG
CNG
RIIO – ED2: Apr 23 – Mar 28
May 23 – Apr 26
May 23 – Apr 28
Jul 23 – Apr 26
Jan 24 – Dec 26
Oct 23 – Sep 26
2021 2022 2023 2024 2025
Sept 23 – Aug 27
Nov 21 - Oct 26
2021 Actual
Allowed WACC(Nominal, post-tax) (1)
4.2 %
5.7 %
5.9 %
11.9 %
4.6 %
7.5 %
6.2 %
6.4 %
6.8 %
6.6 %
10.4 %
11.9 %
Note: Best estimate of the entry into force of the new rate cases
1) Nominal WACC post-tax has been calculated based on each country’s specific remuneration framework. Distribution: ESP: 5.6% Nominal WACC pre-tax; UK: 6% Real CoE post-tax; USA:
Nominal ROE post-tax allowed for each DisCo; BRA: 8.09% / 7.02% Real WACC post-tax; Transmission: UK: 4,25% Real CoE post-tax; USA: 11.3% Nominal ROE post-tax
2) Rates automatically extended
10.4 %

19
NETWORKS: SPAIN
2021
RAV (Eur Bn) 9.3
Distributed energy (GWh) 90,962
Points of supply (M) 11.3
Kms of lines 270,129
Data as of December 2021
As of December 2021, ~11.3 M smart meters installed
and digitisation of ~100,000 transformers
20
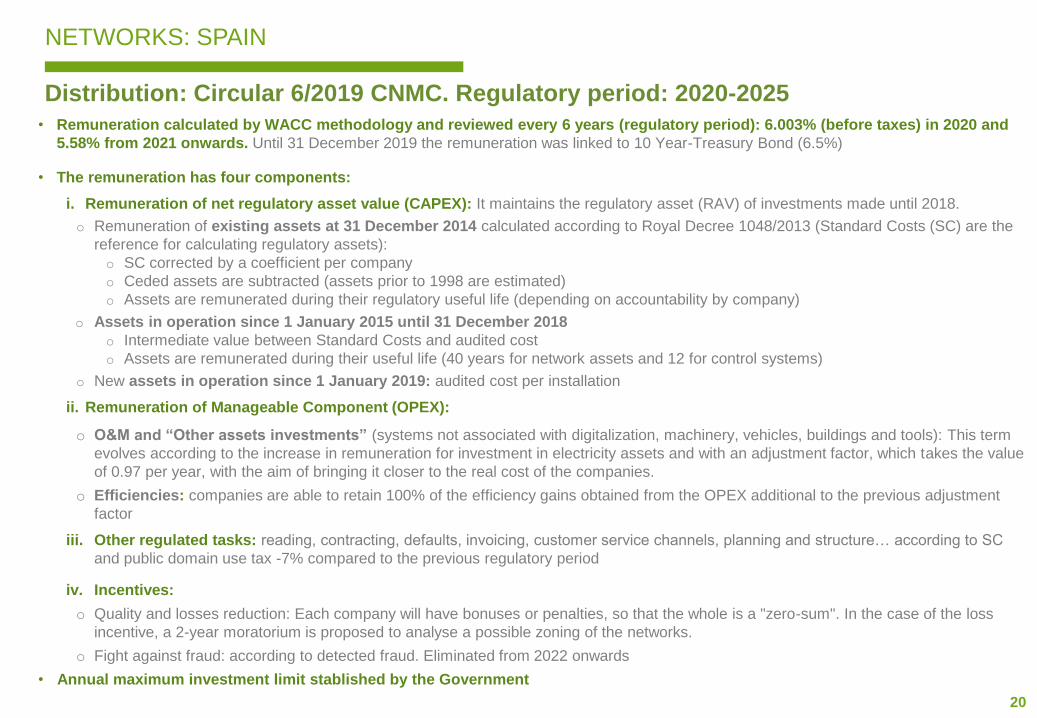
Distribution: Circular 6/2019 CNMC. Regulatory period: 2020-2025
NETWORKS: SPAIN
• Remuneration calculated by WACC methodology and reviewed every 6 years (regulatory period): 6.003% (before taxes) in 2020 and
5.58% from 2021 onwards. Until 31 December 2019 the remuneration was linked to 10 Year-Treasury Bond (6.5%)
• The remuneration has four components:
i. Remuneration of net regulatory asset value (CAPEX): It maintains the regulatory asset (RAV) of investments made until 2018.
o Remuneration of existing assets at 31 December 2014 calculated according to Royal Decree 1048/2013 (Standard Costs (SC) are the
reference for calculating regulatory assets):
o SC corrected by a coefficient per company
o Ceded assets are subtracted (assets prior to 1998 are estimated)
o Assets are remunerated during their regulatory useful life (depending on accountability by company)
o Assets in operation since 1 January 2015 until 31 December 2018
o Intermediate value between Standard Costs and audited cost
o Assets are remunerated during their useful life (40 years for network assets and 12 for control systems)
o New assets in operation since 1 January 2019: audited cost per installation
ii. Remuneration of Manageable Component (OPEX):
o O&M and “Other assets investments” (systems not associated with digitalization, machinery, vehicles, buildings and tools): This term
evolves according to the increase in remuneration for investment in electricity assets and with an adjustment factor, which takes the value
of 0.97 per year, with the aim of bringing it closer to the real cost of the companies.
o Efficiencies: companies are able to retain 100% of the efficiency gains obtained from the OPEX additional to the previous adjustment
factor
iii. Other regulated tasks: reading, contracting, defaults, invoicing, customer service channels, planning and structure… according to SC
and public domain use tax -7% compared to the previous regulatory period
iv. Incentives:
o Quality and losses reduction: Each company will have bonuses or penalties, so that the whole is a "zero-sum". In the case of the loss
incentive, a 2-year moratorium is proposed to analyse a possible zoning of the networks.
o Fight against fraud: according to detected fraud. Eliminated from 2022 onwards
• Annual maximum investment limit stablished by the Government

21
NETWORKS: SPAIN
Distribution: annual maximum investment limit
• Royal Decree Law 23/2020 increases the investment annual limit for distribution and also recognizes the role of electrification
and the need to maintain the financial balance of the sector:
i. Investments in grids. Increasing the annual limit for the 2020-2022 period from 0.13% to 0.14% of GDP for distribution.
ii. Financial balance of the sector. It addresses the economic sustainability of the sector by allowing the use of the historic surplus of
the 2019 and 2020 settlements to cover the sector’s costs.
• RD 1125/2021 allows to extend above the limits established in the investment plans all those investments in digitalization that
are financed by Recovery, Transformation and Resilience Plan.
i. RD 1125/2021 establishes that the funding intensity for the application of funds from the Recovery, Transformation and Resilience
Plan will amount to 50% of the actual annual investment volume executed and put into service in eligible assets (digitalization), the
remainder being reimbursed from the electricity system tolls. Therefore, distribution companies will be able to see their limit on the
volume of investment extended for the investments in digitalization of type 2 during the years 2021, 2022 and 2023
ii. Investments in digital that are within this framework can accounted to a maximum of 454 millions in 2021, 296 millions in 2022 and
300 millions in 2023 (50% of these amounts coming from EU NextGen transfers).
22
NETWORKS: SPAIN
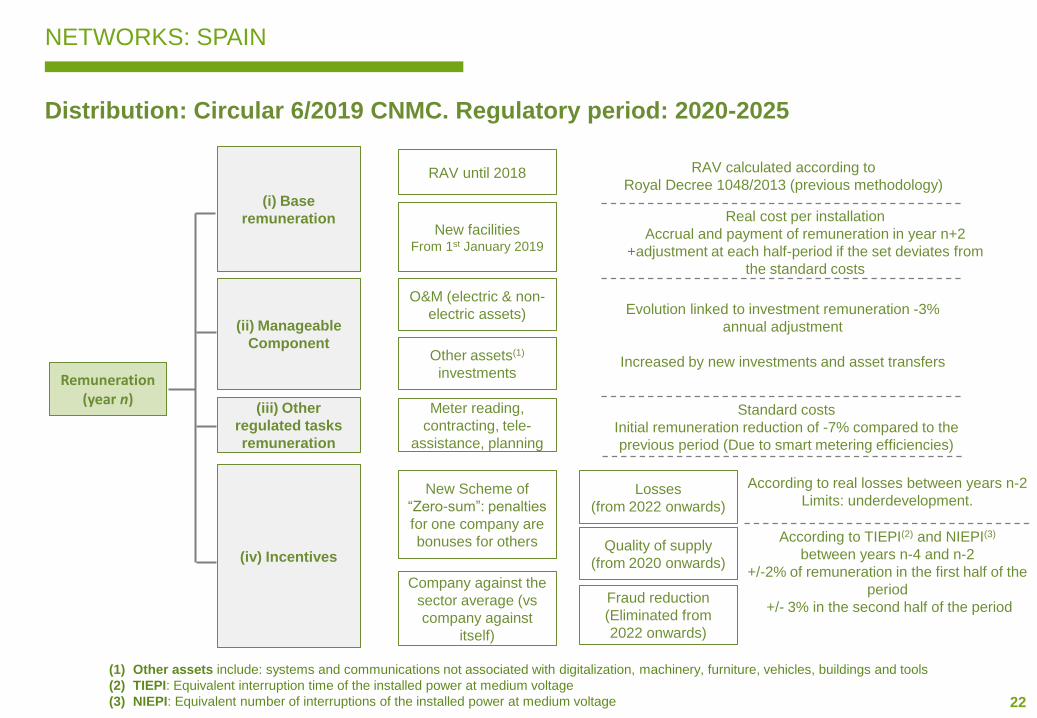
Distribution: Circular 6/2019 CNMC. Regulatory period: 2020-2025
(i) Base
remuneration
Remuneration(year n)
(iii) Other
regulated tasks
remuneration
(iv) Incentives
RAV until 2018
O&M (electric & non-
electric assets)
Other assets(1)
investments
Meter reading,
contracting, tele-
assistance, planning
Losses
(from 2022 onwards)
Quality of supply
(from 2020 onwards)
Fraud reduction
(Eliminated from
2022 onwards)
RAV calculated according to
Royal Decree 1048/2013 (previous methodology)
Real cost per installation
Accrual and payment of remuneration in year n+2
+adjustment at each half-period if the set deviates from
the standard costs
Evolution linked to investment remuneration -3%
annual adjustment
Increased by new investments and asset transfers
Standard costs
Initial remuneration reduction of -7% compared to the
previous period (Due to smart metering efficiencies)
According to real losses between years n-2
Limits: underdevelopment.
According to TIEPI(2) and NIEPI(3)
between years n-4 and n-2
+/-2% of remuneration in the first half of the
period
+/- 3% in the second half of the period
(1) Other assets include: systems and communications not associated with digitalization, machinery, furniture, vehicles, buildings and tools
(2) TIEPI: Equivalent interruption time of the installed power at medium voltage
(3) NIEPI: Equivalent number of interruptions of the installed power at medium voltage
(ii) Manageable
Component
New facilitiesFrom 1st January 2019
New Scheme of
“Zero-sum”: penalties
for one company are
bonuses for others
Company against the
sector average (vs
company against
itself)
23
NETWORKS: SPAIN
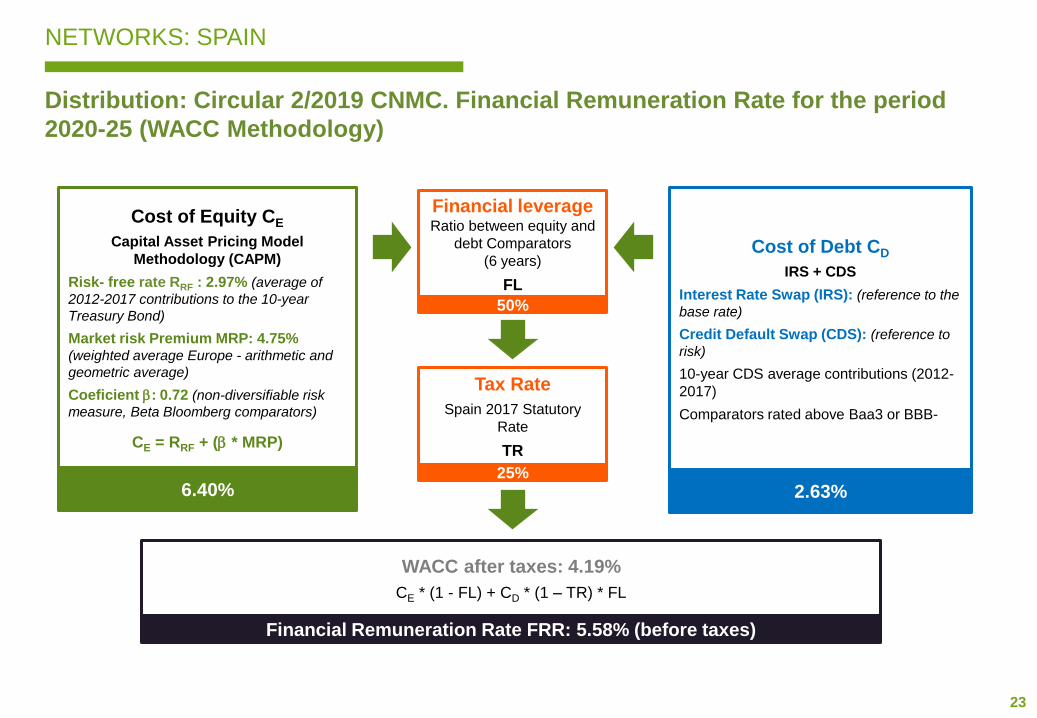
Distribution: Circular 2/2019 CNMC. Financial Remuneration Rate for the period
2020-25 (WACC Methodology)
Cost of Equity CE
Capital Asset Pricing Model
Methodology (CAPM)
Risk- free rate RRF : 2.97% (average of
2012-2017 contributions to the 10-year
Treasury Bond)
Market risk Premium MRP: 4.75% (weighted average Europe - arithmetic and
geometric average)
Coeficient : 0.72 (non-diversifiable risk
measure, Beta Bloomberg comparators)
CE = RRF + ( * MRP)
6.40%
Cost of Debt CD
IRS + CDS
Interest Rate Swap (IRS): (reference to the
base rate)
Credit Default Swap (CDS): (reference to
risk)
10-year CDS average contributions (2012-
2017)
Comparators rated above Baa3 or BBB-
2.63%
Financial leverageRatio between equity and
debt Comparators
(6 years)
FL
50%
WACC after taxes: 4.19%
CE * (1 - FL) + CD * (1 – TR) * FL
Financial Remuneration Rate FRR: 5.58% (before taxes)
Tax Rate
Spain 2017 Statutory
Rate
TR
25%

24
NETWORKS: UK
One of the largest Distribution companies and one of the 3 companies with
Transmission licenses in the country
Data as of December 2021
2021
RAB (GBP Bn) 7.1
Scottish Power Distribution 29%
Scottish Power Manweb 32%
Scottish Power Transmission 40%
Distributed energy (GWh) 32,221
Scottish Power Distribution 54%
Scottish Power Manweb 46%
Points of supply (M) 3.6
Scottish Power Distribution 57%
Scottish Power Manweb 43%
Kms of lines 110,681
Scottish Power Distribution 53%
Scottish Power Manweb 43%
Scottish Power Transmission 4%
25
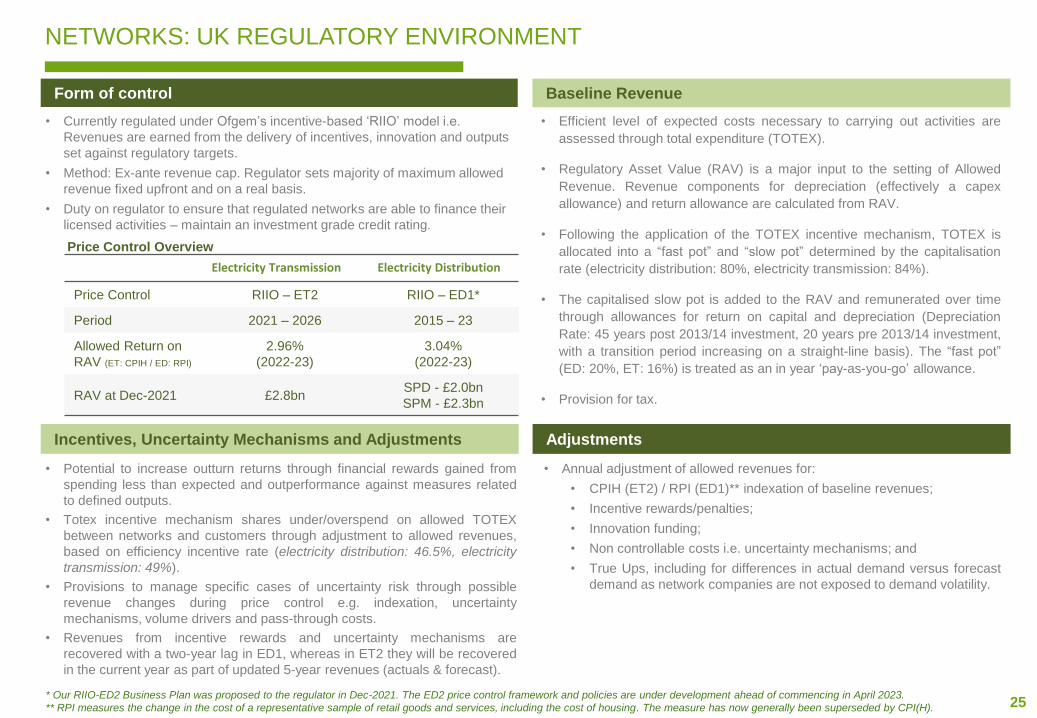
NETWORKS: UK REGULATORY ENVIRONMENT
• Currently regulated under Ofgem’s incentive-based ‘RIIO’ model i.e.
Revenues are earned from the delivery of incentives, innovation and outputs
set against regulatory targets.
• Method: Ex-ante revenue cap. Regulator sets majority of maximum allowed
revenue fixed upfront and on a real basis.
• Duty on regulator to ensure that regulated networks are able to finance their
licensed activities – maintain an investment grade credit rating.
Price Control Overview
• Potential to increase outturn returns through financial rewards gained from
spending less than expected and outperformance against measures related
to defined outputs.
• Totex incentive mechanism shares under/overspend on allowed TOTEX
between networks and customers through adjustment to allowed revenues,
based on efficiency incentive rate (electricity distribution: 46.5%, electricity
transmission: 49%).
• Provisions to manage specific cases of uncertainty risk through possible
revenue changes during price control e.g. indexation, uncertainty
mechanisms, volume drivers and pass-through costs.
• Revenues from incentive rewards and uncertainty mechanisms are
recovered with a two-year lag in ED1, whereas in ET2 they will be recovered
in the current year as part of updated 5-year revenues (actuals & forecast).
• Efficient level of expected costs necessary to carrying out activities are
assessed through total expenditure (TOTEX).
• Regulatory Asset Value (RAV) is a major input to the setting of Allowed
Revenue. Revenue components for depreciation (effectively a capex
allowance) and return allowance are calculated from RAV.
• Following the application of the TOTEX incentive mechanism, TOTEX is
allocated into a “fast pot” and “slow pot” determined by the capitalisation
rate (electricity distribution: 80%, electricity transmission: 84%).
• The capitalised slow pot is added to the RAV and remunerated over time
through allowances for return on capital and depreciation (Depreciation
Rate: 45 years post 2013/14 investment, 20 years pre 2013/14 investment,
with a transition period increasing on a straight-line basis). The “fast pot”
(ED: 20%, ET: 16%) is treated as an in year ‘pay-as-you-go’ allowance.
• Provision for tax.
• Annual adjustment of allowed revenues for:
• CPIH (ET2) / RPI (ED1)** indexation of baseline revenues;
• Incentive rewards/penalties;
• Innovation funding;
• Non controllable costs i.e. uncertainty mechanisms; and
• True Ups, including for differences in actual demand versus forecast
demand as network companies are not exposed to demand volatility.
Form of control Baseline Revenue
Incentives, Uncertainty Mechanisms and Adjustments Adjustments
Electricity Transmission Electricity Distribution
Price Control RIIO – ET2 RIIO – ED1*
Period 2021 – 2026 2015 – 23
Allowed Return on
RAV (ET: CPIH / ED: RPI)
2.96%
(2022-23)
3.04%
(2022-23)
RAV at Dec-2021 £2.8bnSPD - £2.0bn
SPM - £2.3bn
* Our RIIO-ED2 Business Plan was proposed to the regulator in Dec-2021. The ED2 price control framework and policies are under development ahead of commencing in April 2023.
** RPI measures the change in the cost of a representative sample of retail goods and services, including the cost of housing. The measure has now generally been superseded by CPI(H).
26
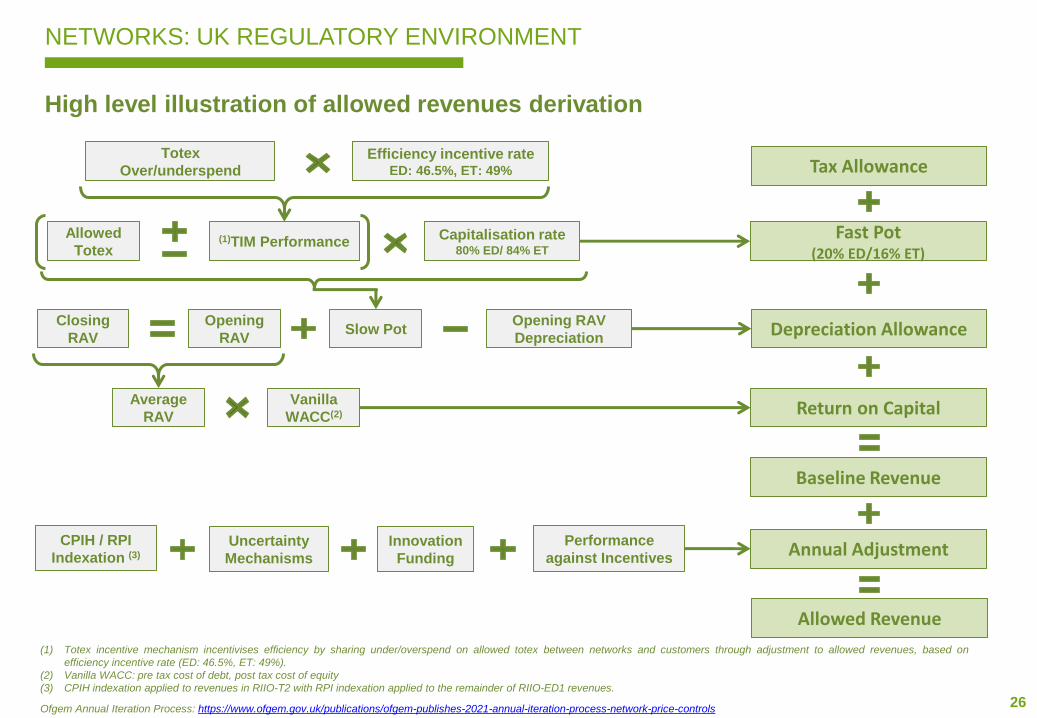
NETWORKS: UK REGULATORY ENVIRONMENT
Totex
Over/underspend
Performance
against Incentives
Efficiency incentive rateED: 46.5%, ET: 49%
Allowed
Totex
Uncertainty
Mechanisms
(1)TIM PerformanceCapitalisation rate
80% ED/ 84% ET
Closing
RAV
Opening
RAVSlow Pot
Opening RAV
Depreciation
Average
RAV
Vanilla
WACC(2)
Tax Allowance
Fast Pot (20% ED/16% ET)
Depreciation Allowance
Return on Capital
Baseline Revenue
Annual Adjustment
Allowed Revenue
CPIH / RPI
Indexation (3)
Innovation
Funding
(1) Totex incentive mechanism incentivises efficiency by sharing under/overspend on allowed totex between networks and customers through adjustment to allowed revenues, based on
efficiency incentive rate (ED: 46.5%, ET: 49%).
(2) Vanilla WACC: pre tax cost of debt, post tax cost of equity
(3) CPIH indexation applied to revenues in RIIO-T2 with RPI indexation applied to the remainder of RIIO-ED1 revenues.
Ofgem Annual Iteration Process: https://www.ofgem.gov.uk/publications/ofgem-publishes-2021-annual-iteration-process-network-price-controls
High level illustration of allowed revenues derivation
27
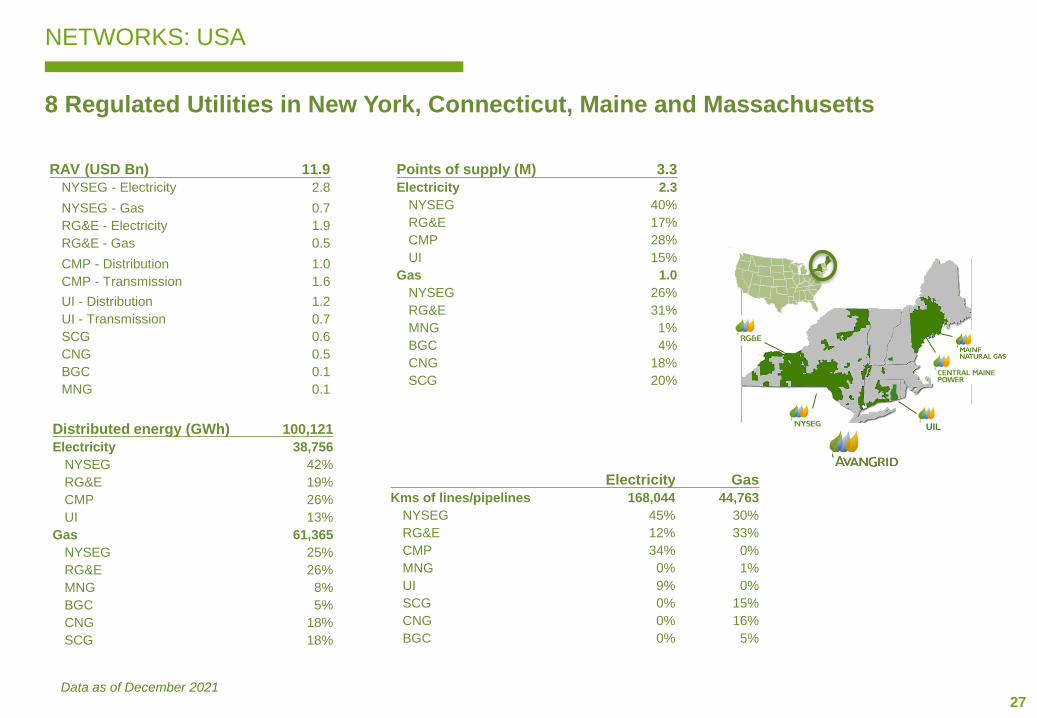
NETWORKS: USA
8 Regulated Utilities in New York, Connecticut, Maine and Massachusetts
FUIL
RAV (USD Bn) 11.9
NYSEG - Electricity 2.8
NYSEG - Gas 0.7
RG&E - Electricity 1.9
RG&E - Gas 0.5
CMP - Distribution 1.0
CMP - Transmission 1.6
UI - Distribution 1.2
UI - Transmission 0.7
SCG 0.6
CNG 0.5
BGC 0.1
MNG 0.1
Distributed energy (GWh) 100,121
Electricity 38,756
NYSEG 42%
RG&E 19%
CMP 26%
UI 13%
Gas 61,365
NYSEG 25%
RG&E 26%
MNG 8%
BGC 5%
CNG 18%
SCG 18%
Points of supply (M) 3.3
Electricity 2.3
NYSEG 40%
RG&E 17%
CMP 28%
UI 15%
Gas 1.0
NYSEG 26%
RG&E 31%
MNG 1%
BGC 4%
CNG 18%
SCG 20%
Electricity Gas
Kms of lines/pipelines 168,044 44,763
NYSEG 45% 30%
RG&E 12% 33%
CMP 34% 0%
MNG 0% 1%
UI 9% 0%
SCG 0% 15%
CNG 0% 16%
BGC 0% 5%
Data as of December 2021
28
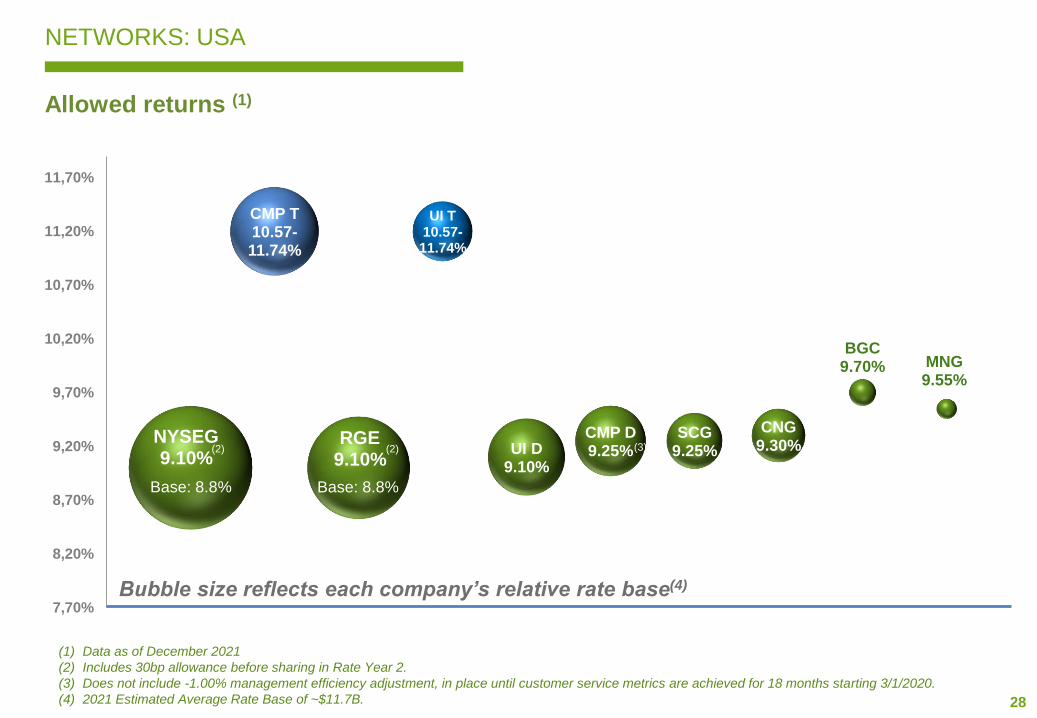
NETWORKS: USA
Allowed returns (1)
(1) Data as of December 2021
(2) Includes 30bp allowance before sharing in Rate Year 2.
(3) Does not include -1.00% management efficiency adjustment, in place until customer service metrics are achieved for 18 months starting 3/1/2020.
(4) 2021 Estimated Average Rate Base of ~$11.7B.
NYSEG9.10%
CMP T10.57-11.74%
RGE9.10%
UI T10.57-11.74%
UI D9.10%
CMP D9.25%
SCG9.25%
CNG9.30%
BGC9.70% MNG
9.55%
7,70%
8,20%
8,70%
9,20%
9,70%
10,20%
10,70%
11,20%
11,70%
Base: 8.8% Base: 8.8%
(2)
Bubble size reflects each company’s relative rate base(4)
(2) (3)
29
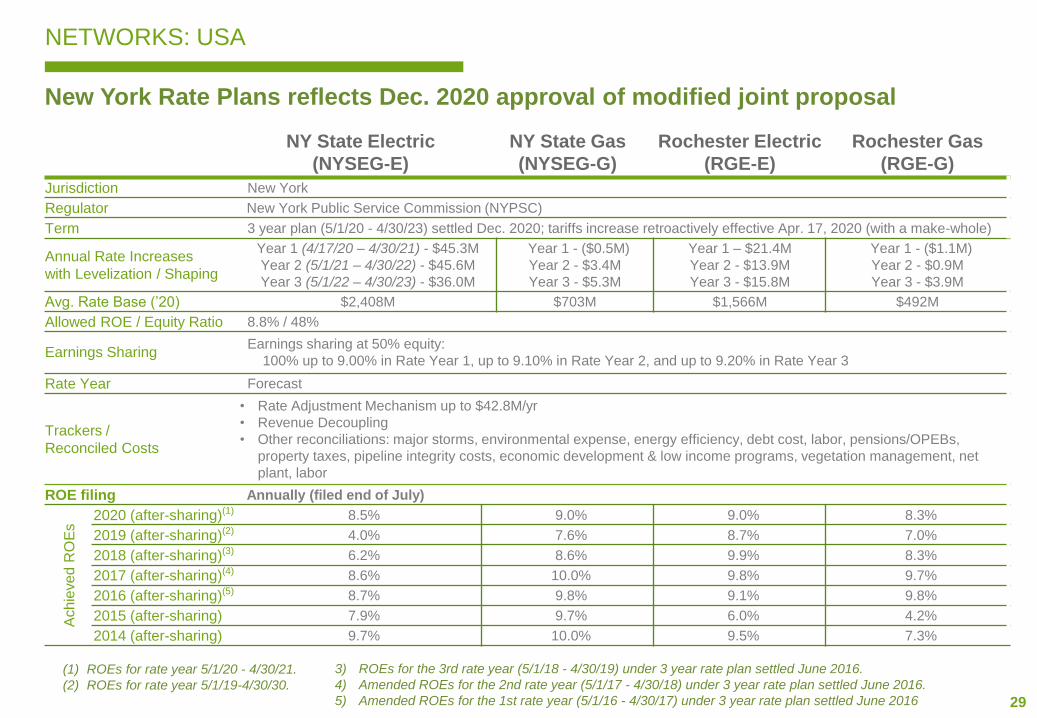
NETWORKS: USA
New York Rate Plans reflects Dec. 2020 approval of modified joint proposal
(2)
(3)
(1) ROEs for rate year 5/1/20 - 4/30/21.
(2) ROEs for rate year 5/1/19-4/30/30.
NY State Electric
(NYSEG-E)
NY State Gas
(NYSEG-G)
Rochester Electric
(RGE-E)
Rochester Gas
(RGE-G)
Jurisdiction New York
Regulator New York Public Service Commission (NYPSC)
Term 3 year plan (5/1/20 - 4/30/23) settled Dec. 2020; tariffs increase retroactively effective Apr. 17, 2020 (with a make-whole)
Annual Rate Increases
with Levelization / Shaping
Year 1 (4/17/20 – 4/30/21) - $45.3M
Year 2 (5/1/21 – 4/30/22) - $45.6M
Year 3 (5/1/22 – 4/30/23) - $36.0M
Year 1 - ($0.5M)
Year 2 - $3.4M
Year 3 - $5.3M
Year 1 – $21.4M
Year 2 - $13.9M
Year 3 - $15.8M
Year 1 - ($1.1M)
Year 2 - $0.9M
Year 3 - $3.9M
Avg. Rate Base (’20) $2,408M $703M $1,566M $492M
Allowed ROE / Equity Ratio 8.8% / 48%
Earnings SharingEarnings sharing at 50% equity:
100% up to 9.00% in Rate Year 1, up to 9.10% in Rate Year 2, and up to 9.20% in Rate Year 3
Rate Year Forecast
Trackers /
Reconciled Costs
• Rate Adjustment Mechanism up to $42.8M/yr
• Revenue Decoupling
• Other reconciliations: major storms, environmental expense, energy efficiency, debt cost, labor, pensions/OPEBs,
property taxes, pipeline integrity costs, economic development & low income programs, vegetation management, net
plant, labor
ROE filing Annually (filed end of July)
Ach
ieve
d R
OE
s
2020 (after-sharing)(1) 8.5% 9.0% 9.0% 8.3%
2019 (after-sharing)(2) 4.0% 7.6% 8.7% 7.0%
2018 (after-sharing)(3) 6.2% 8.6% 9.9% 8.3%
2017 (after-sharing)(4) 8.6% 10.0% 9.8% 9.7%
2016 (after-sharing)(5) 8.7% 9.8% 9.1% 9.8%
2015 (after-sharing) 7.9% 9.7% 6.0% 4.2%
2014 (after-sharing) 9.7% 10.0% 9.5% 7.3%
3) ROEs for the 3rd rate year (5/1/18 - 4/30/19) under 3 year rate plan settled June 2016.
4) Amended ROEs for the 2nd rate year (5/1/17 - 4/30/18) under 3 year rate plan settled June 2016.
5) Amended ROEs for the 1st rate year (5/1/16 - 4/30/17) under 3 year rate plan settled June 2016
30
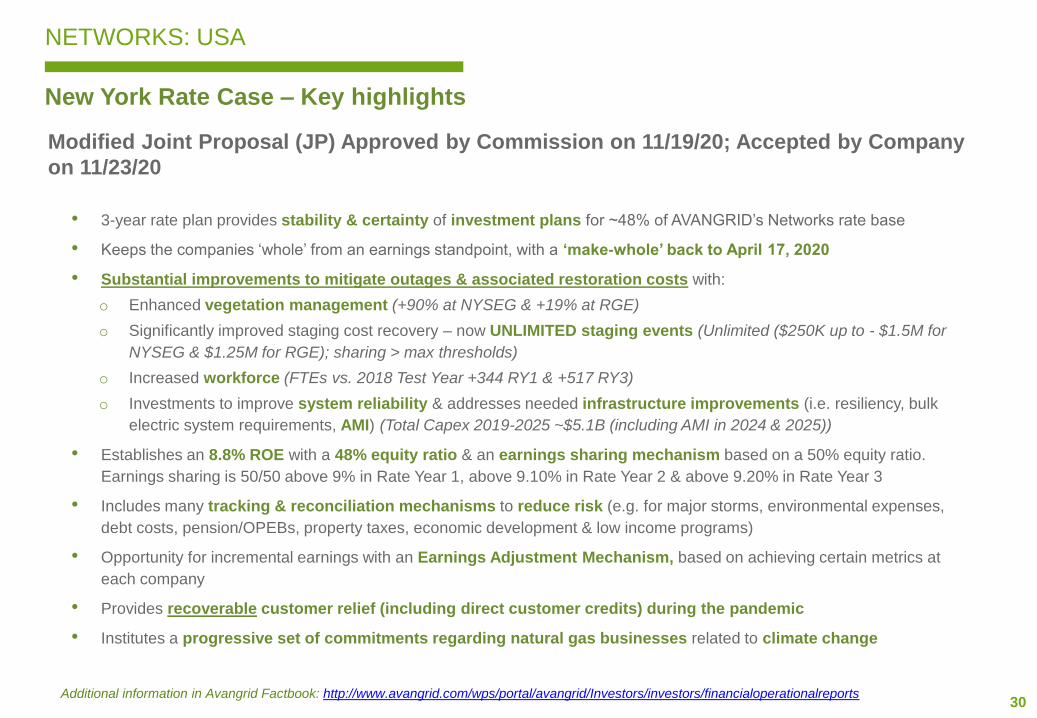
NETWORKS: USA
New York Rate Case – Key highlights
Modified Joint Proposal (JP) Approved by Commission on 11/19/20; Accepted by Company
on 11/23/20
Additional information in Avangrid Factbook: http://www.avangrid.com/wps/portal/avangrid/Investors/investors/financialoperationalreports
• 3-year rate plan provides stability & certainty of investment plans for ~48% of AVANGRID’s Networks rate base
• Keeps the companies ‘whole’ from an earnings standpoint, with a ‘make-whole’ back to April 17, 2020
• Substantial improvements to mitigate outages & associated restoration costs with:
o Enhanced vegetation management (+90% at NYSEG & +19% at RGE)
o Significantly improved staging cost recovery – now UNLIMITED staging events (Unlimited ($250K up to - $1.5M for
NYSEG & $1.25M for RGE); sharing > max thresholds)
o Increased workforce (FTEs vs. 2018 Test Year +344 RY1 & +517 RY3)
o Investments to improve system reliability & addresses needed infrastructure improvements (i.e. resiliency, bulk
electric system requirements, AMI) (Total Capex 2019-2025 ~$5.1B (including AMI in 2024 & 2025))
• Establishes an 8.8% ROE with a 48% equity ratio & an earnings sharing mechanism based on a 50% equity ratio.
Earnings sharing is 50/50 above 9% in Rate Year 1, above 9.10% in Rate Year 2 & above 9.20% in Rate Year 3
• Includes many tracking & reconciliation mechanisms to reduce risk (e.g. for major storms, environmental expenses,
debt costs, pension/OPEBs, property taxes, economic development & low income programs)
• Opportunity for incremental earnings with an Earnings Adjustment Mechanism, based on achieving certain metrics at
each company
• Provides recoverable customer relief (including direct customer credits) during the pandemic
• Institutes a progressive set of commitments regarding natural gas businesses related to climate change
31
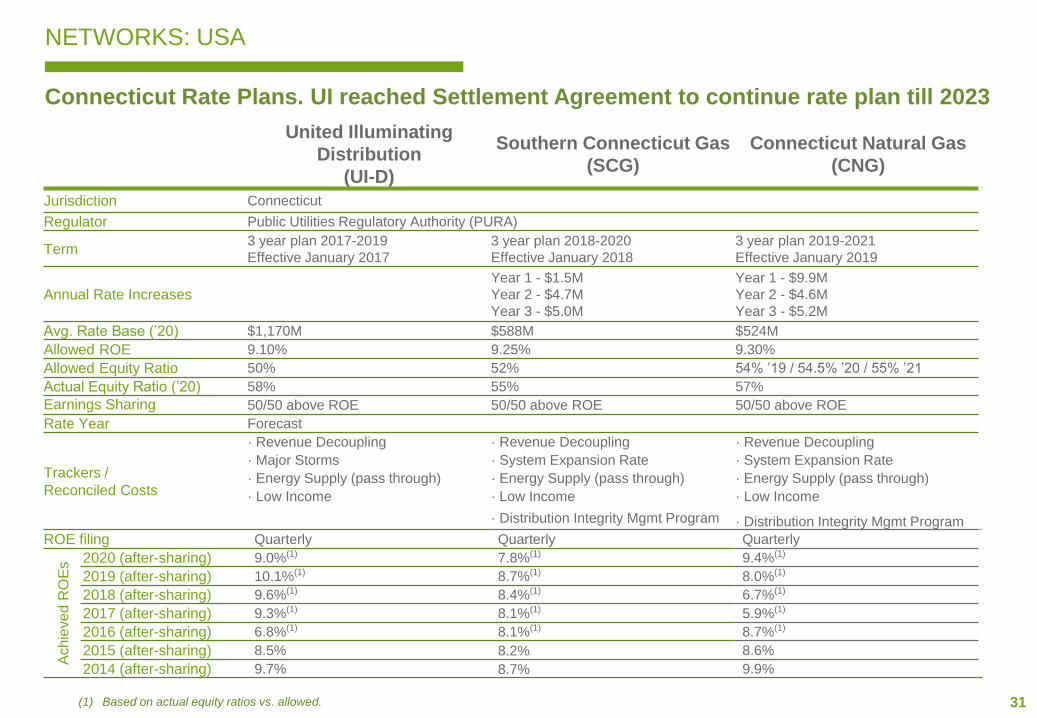
NETWORKS: USA
Connecticut Rate Plans. UI reached Settlement Agreement to continue rate plan till 2023
(1) Based on actual equity ratios vs. allowed.
United Illuminating
Distribution
(UI-D)
Southern Connecticut Gas
(SCG)
Connecticut Natural Gas
(CNG)
Jurisdiction Connecticut
Regulator Public Utilities Regulatory Authority (PURA)
Term3 year plan 2017-2019
Effective January 2017
3 year plan 2018-2020
Effective January 2018
3 year plan 2019-2021
Effective January 2019
Annual Rate IncreasesYear 1 - $1.5M
Year 2 - $4.7M
Year 3 - $5.0M
Year 1 - $9.9M
Year 2 - $4.6M
Year 3 - $5.2M
Avg. Rate Base (’20) $1,170M $588M $524M
Allowed ROE 9.10% 9.25% 9.30%
Allowed Equity Ratio 50% 52% 54% ’19 / 54.5% ’20 / 55% ’21
Actual Equity Ratio (’20) 58% 55% 57%
Earnings Sharing 50/50 above ROE 50/50 above ROE 50/50 above ROE
Rate Year Forecast
Trackers /
Reconciled Costs
· Revenue Decoupling · Revenue Decoupling · Revenue Decoupling
· Major Storms · System Expansion Rate · System Expansion Rate
· Energy Supply (pass through) · Energy Supply (pass through) · Energy Supply (pass through)
· Low Income · Low Income · Low Income
· Distribution Integrity Mgmt Program · Distribution Integrity Mgmt Program
ROE filing Quarterly Quarterly Quarterly
Ach
ieve
d R
OE
s 2020 (after-sharing) 9.0%(1) 7.8%(1) 9.4%(1)
2019 (after-sharing) 10.1%(1) 8.7%(1) 8.0%(1)
2018 (after-sharing) 9.6%(1) 8.4%(1) 6.7%(1)
2017 (after-sharing) 9.3%(1) 8.1%(1) 5.9%(1)
2016 (after-sharing) 6.8%(1) 8.1%(1) 8.7%(1)
2015 (after-sharing) 8.5% 8.2% 8.6%
2014 (after-sharing) 9.7% 8.7% 9.9%
32
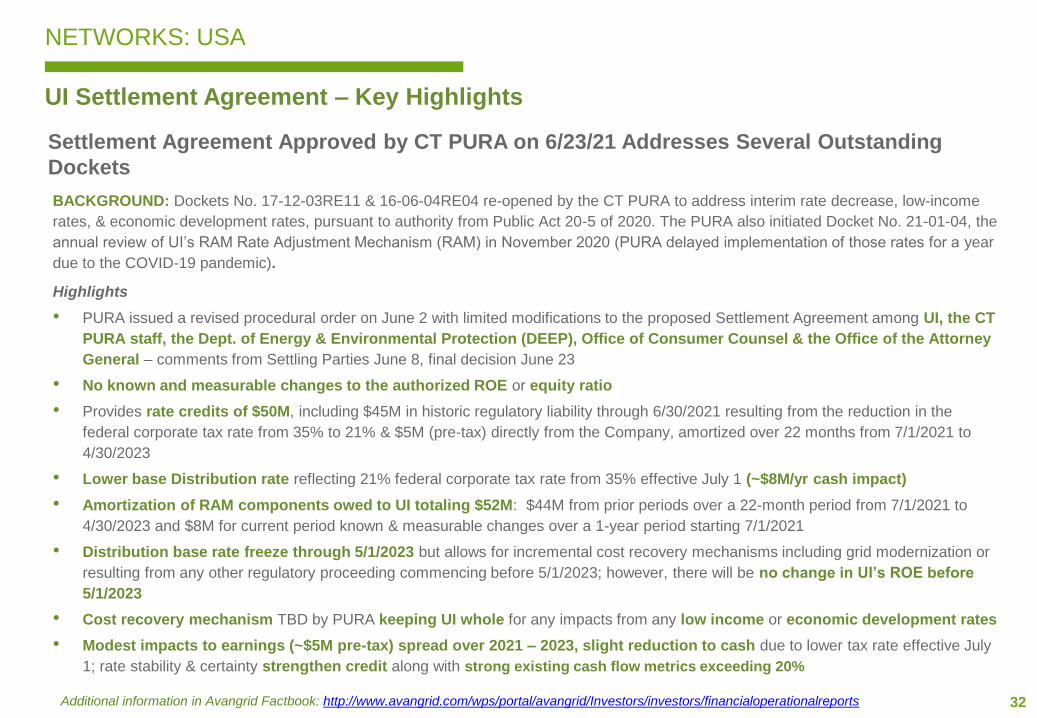
NETWORKS: USA
UI Settlement Agreement – Key Highlights
Settlement Agreement Approved by CT PURA on 6/23/21 Addresses Several Outstanding
Dockets
Additional information in Avangrid Factbook: http://www.avangrid.com/wps/portal/avangrid/Investors/investors/financialoperationalreports
BACKGROUND: Dockets No. 17-12-03RE11 & 16-06-04RE04 re-opened by the CT PURA to address interim rate decrease, low-income
rates, & economic development rates, pursuant to authority from Public Act 20-5 of 2020. The PURA also initiated Docket No. 21-01-04, the
annual review of UI’s RAM Rate Adjustment Mechanism (RAM) in November 2020 (PURA delayed implementation of those rates for a year
due to the COVID-19 pandemic).
Highlights
• PURA issued a revised procedural order on June 2 with limited modifications to the proposed Settlement Agreement among UI, the CT
PURA staff, the Dept. of Energy & Environmental Protection (DEEP), Office of Consumer Counsel & the Office of the Attorney
General – comments from Settling Parties June 8, final decision June 23
• No known and measurable changes to the authorized ROE or equity ratio
• Provides rate credits of $50M, including $45M in historic regulatory liability through 6/30/2021 resulting from the reduction in the
federal corporate tax rate from 35% to 21% & $5M (pre-tax) directly from the Company, amortized over 22 months from 7/1/2021 to
4/30/2023
• Lower base Distribution rate reflecting 21% federal corporate tax rate from 35% effective July 1 (~$8M/yr cash impact)
• Amortization of RAM components owed to UI totaling $52M: $44M from prior periods over a 22-month period from 7/1/2021 to
4/30/2023 and $8M for current period known & measurable changes over a 1-year period starting 7/1/2021
• Distribution base rate freeze through 5/1/2023 but allows for incremental cost recovery mechanisms including grid modernization or
resulting from any other regulatory proceeding commencing before 5/1/2023; however, there will be no change in UI’s ROE before
5/1/2023
• Cost recovery mechanism TBD by PURA keeping UI whole for any impacts from any low income or economic development rates
• Modest impacts to earnings (~$5M pre-tax) spread over 2021 – 2023, slight reduction to cash due to lower tax rate effective July
1; rate stability & certainty strengthen credit along with strong existing cash flow metrics exceeding 20%
33
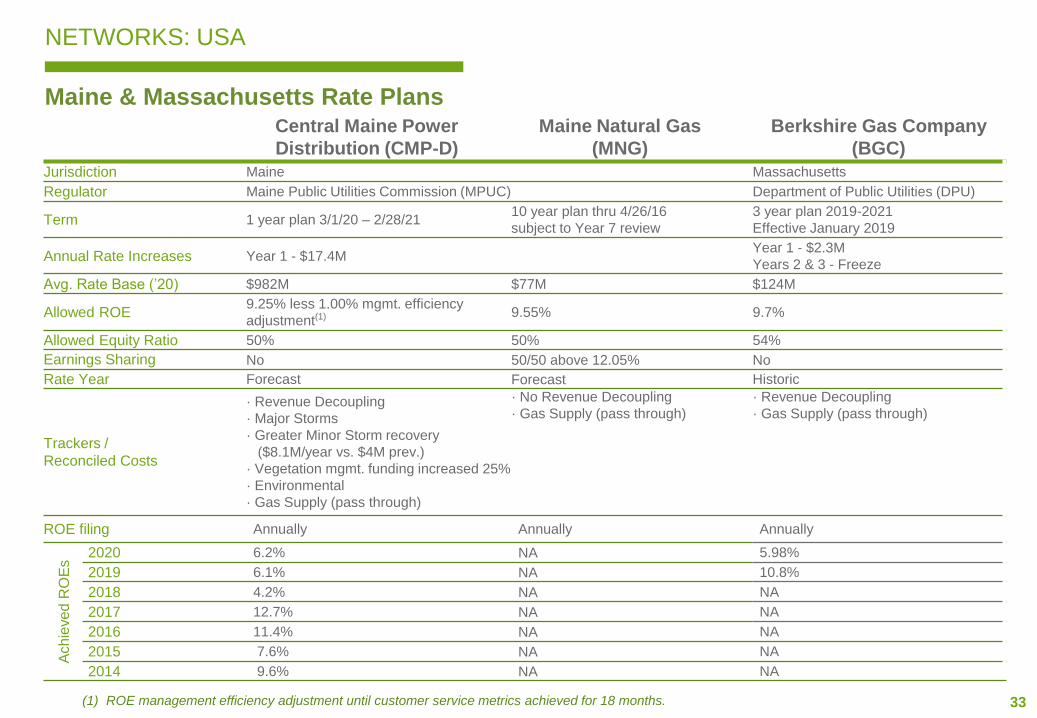
NETWORKS: USA
Maine & Massachusetts Rate Plans
(1) ROE management efficiency adjustment until customer service metrics achieved for 18 months.
Central Maine Power
Distribution (CMP-D)
Maine Natural Gas
(MNG)
Berkshire Gas Company
(BGC)
Jurisdiction Maine Massachusetts
Regulator Maine Public Utilities Commission (MPUC) Department of Public Utilities (DPU)
Term 1 year plan 3/1/20 – 2/28/2110 year plan thru 4/26/16
subject to Year 7 review
3 year plan 2019-2021
Effective January 2019
Annual Rate Increases Year 1 - $17.4MYear 1 - $2.3M
Years 2 & 3 - Freeze
Avg. Rate Base (’20) $982M $77M $124M
Allowed ROE9.25% less 1.00% mgmt. efficiency
adjustment(1) 9.55% 9.7%
Allowed Equity Ratio 50% 50% 54%
Earnings Sharing No 50/50 above 12.05% No
Rate Year Forecast Forecast Historic
Trackers /
Reconciled Costs
· Revenue Decoupling
· Major Storms
· Greater Minor Storm recovery
($8.1M/year vs. $4M prev.)
· Vegetation mgmt. funding increased 25%
· Environmental
· Gas Supply (pass through)
· No Revenue Decoupling
· Gas Supply (pass through)
· Revenue Decoupling
· Gas Supply (pass through)
ROE filing Annually Annually Annually
Ach
ieve
d R
OE
s
2020 6.2% NA 5.98%
2019 6.1% NA 10.8%
2018 4.2% NA NA
2017 12.7% NA NA
2016 11.4% NA NA
2015 7.6% NA NA
2014 9.6% NA NA
34
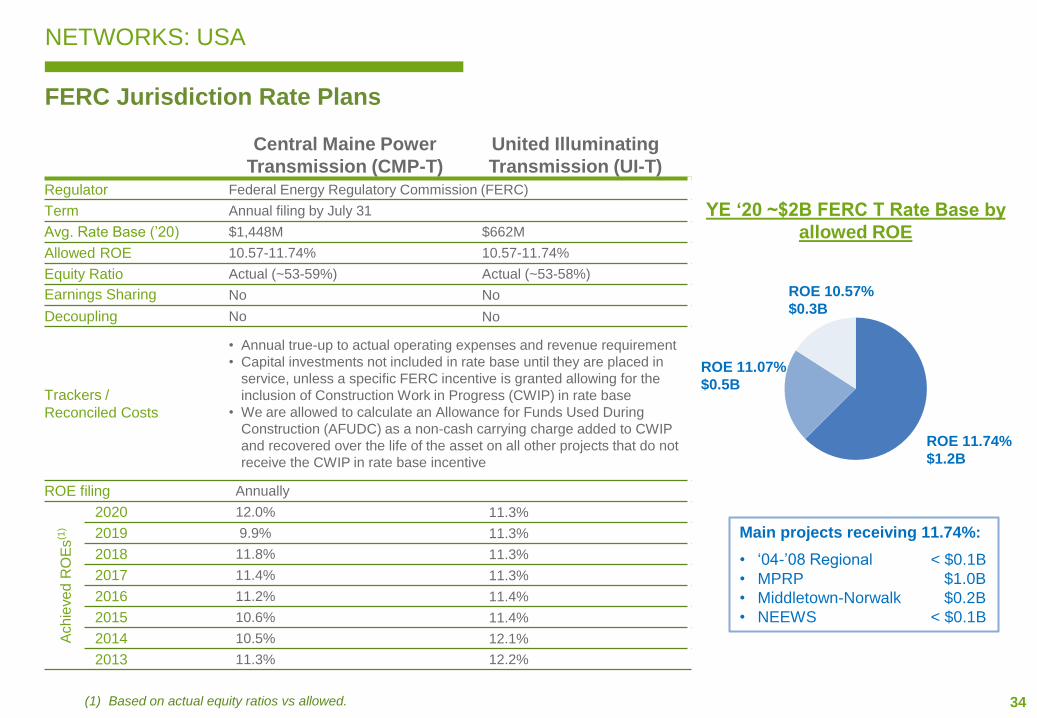
NETWORKS: USA
FERC Jurisdiction Rate Plans
(1) Based on actual equity ratios vs allowed.
Main projects receiving 11.74%:
• ‘04-’08 Regional < $0.1B
• MPRP $1.0B
• Middletown-Norwalk $0.2B
• NEEWS < $0.1B
Central Maine Power
Transmission (CMP-T)
United Illuminating
Transmission (UI-T)
Regulator Federal Energy Regulatory Commission (FERC)
Term Annual filing by July 31
Avg. Rate Base (’20) $1,448M $662M
Allowed ROE 10.57-11.74% 10.57-11.74%
Equity Ratio Actual (~53-59%) Actual (~53-58%)
Earnings Sharing No No
Decoupling No No
Trackers /
Reconciled Costs
• Annual true-up to actual operating expenses and revenue requirement
• Capital investments not included in rate base until they are placed in
service, unless a specific FERC incentive is granted allowing for the
inclusion of Construction Work in Progress (CWIP) in rate base
• We are allowed to calculate an Allowance for Funds Used During
Construction (AFUDC) as a non-cash carrying charge added to CWIP
and recovered over the life of the asset on all other projects that do not
receive the CWIP in rate base incentive
ROE filing Annually
Ach
ieve
d R
OE
s(1
)
2020 12.0% 11.3%
2019 9.9% 11.3%
2018 11.8% 11.3%
2017 11.4% 11.3%
2016 11.2% 11.4%
2015 10.6% 11.4%
2014 10.5% 12.1%
2013 11.3% 12.2%
ROE 11.74%
$1.2B
ROE 10.57%
$0.3B
ROE 11.07%
$0.5B
YE ‘20 ~$2B FERC T Rate Base by
allowed ROE
35
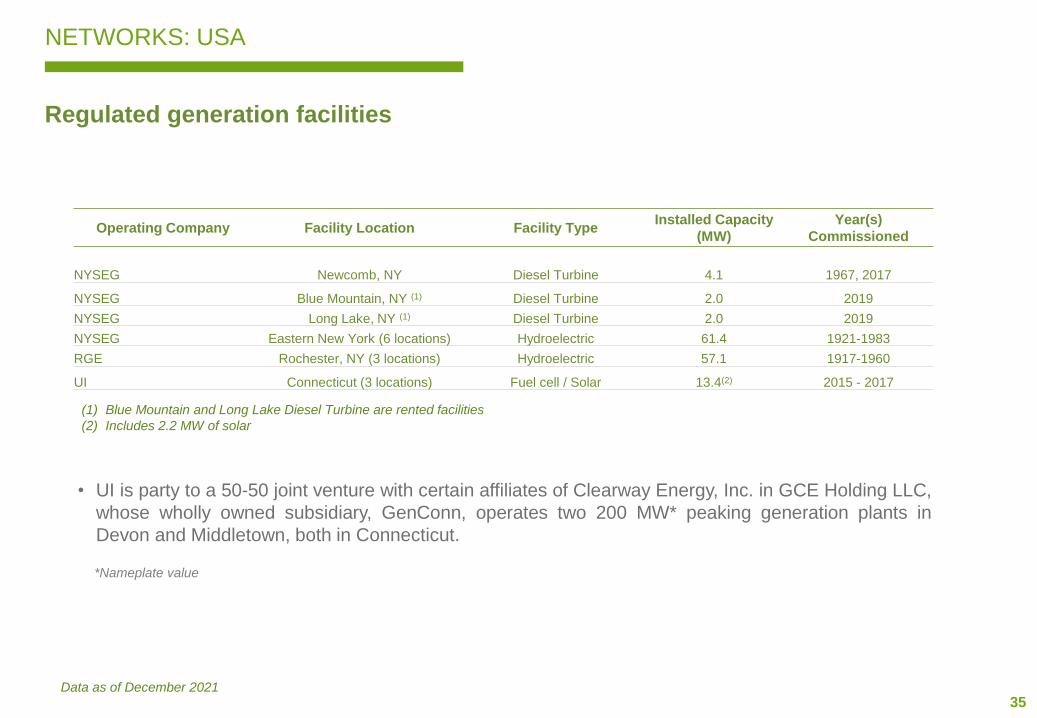
NETWORKS: USA
Regulated generation facilities
Operating Company Facility Location Facility TypeInstalled Capacity
(MW)
Year(s)
Commissioned
NYSEG Newcomb, NY Diesel Turbine 4.1 1967, 2017
NYSEG Blue Mountain, NY (1) Diesel Turbine 2.0 2019
NYSEG Long Lake, NY (1) Diesel Turbine 2.0 2019
NYSEG Eastern New York (6 locations) Hydroelectric 61.4 1921-1983
RGE Rochester, NY (3 locations) Hydroelectric 57.1 1917-1960
UI Connecticut (3 locations) Fuel cell / Solar 13.4(2) 2015 - 2017
(1) Blue Mountain and Long Lake Diesel Turbine are rented facilities
(2) Includes 2.2 MW of solar
• UI is party to a 50-50 joint venture with certain affiliates of Clearway Energy, Inc. in GCE Holding LLC,
whose wholly owned subsidiary, GenConn, operates two 200 MW* peaking generation plants in
Devon and Middletown, both in Connecticut.
Data as of December 2021
*Nameplate value
36
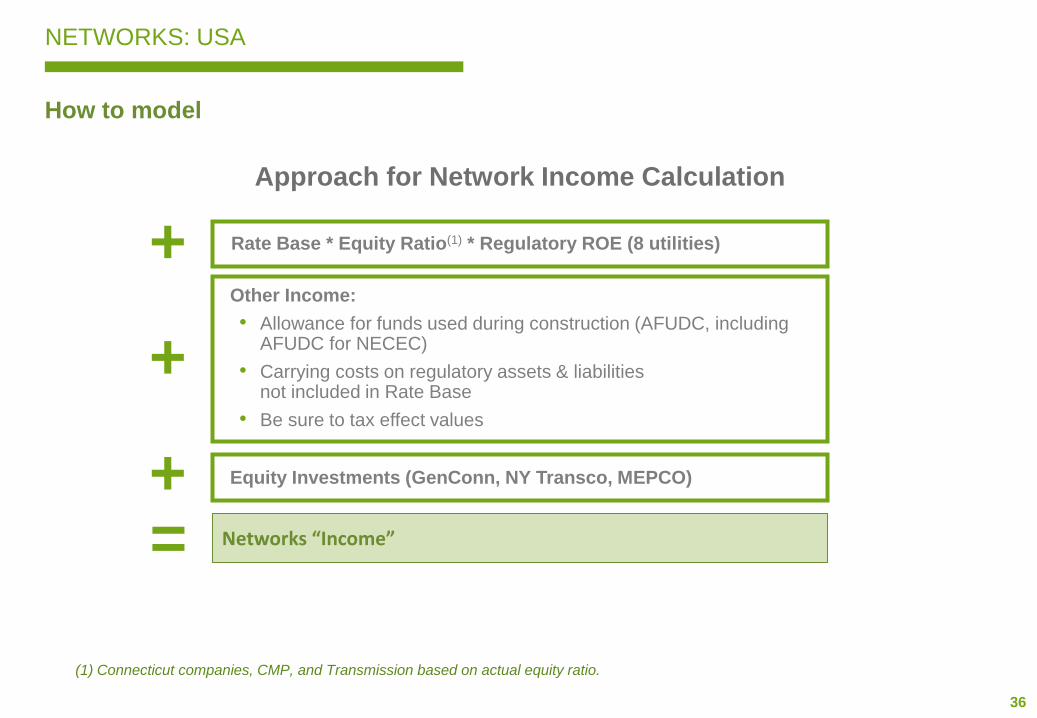
NETWORKS: USA
How to model
Rate Base * Equity Ratio(1) * Regulatory ROE (8 utilities)
Other Income:
• Allowance for funds used during construction (AFUDC, including AFUDC for NECEC)
• Carrying costs on regulatory assets & liabilities not included in Rate Base
• Be sure to tax effect values
Equity Investments (GenConn, NY Transco, MEPCO) +
+
+
Approach for Network Income Calculation
Networks “Income”
(1) Connecticut companies, CMP, and Transmission based on actual equity ratio.
=
37
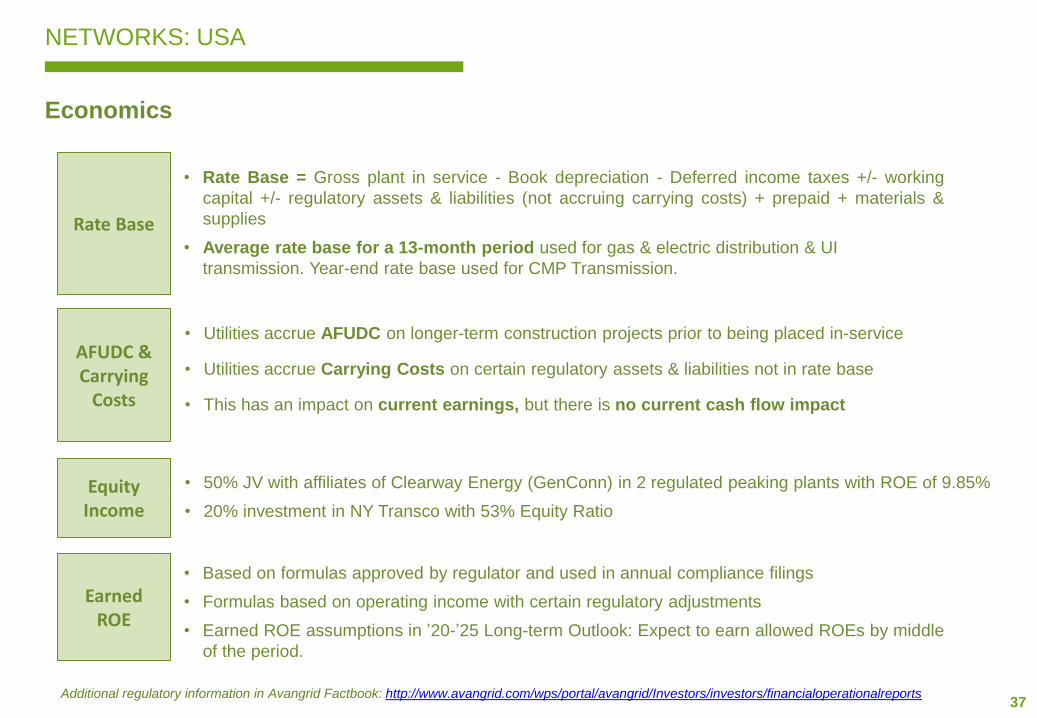
NETWORKS: USA
Economics
• Utilities accrue AFUDC on longer-term construction projects prior to being placed in-service
• Utilities accrue Carrying Costs on certain regulatory assets & liabilities not in rate base
• This has an impact on current earnings, but there is no current cash flow impact
AFUDC & Carrying
Costs
Earned ROE
• Based on formulas approved by regulator and used in annual compliance filings
• Formulas based on operating income with certain regulatory adjustments
• Earned ROE assumptions in ’20-’25 Long-term Outlook: Expect to earn allowed ROEs by middle
of the period.
Equity Income
• 50% JV with affiliates of Clearway Energy (GenConn) in 2 regulated peaking plants with ROE of 9.85%
• 20% investment in NY Transco with 53% Equity Ratio
Rate Base
• Rate Base = Gross plant in service - Book depreciation - Deferred income taxes +/- working
capital +/- regulatory assets & liabilities (not accruing carrying costs) + prepaid + materials &
supplies
• Average rate base for a 13-month period used for gas & electric distribution & UI
transmission. Year-end rate base used for CMP Transmission.
Additional regulatory information in Avangrid Factbook: http://www.avangrid.com/wps/portal/avangrid/Investors/investors/financialoperationalreports
38
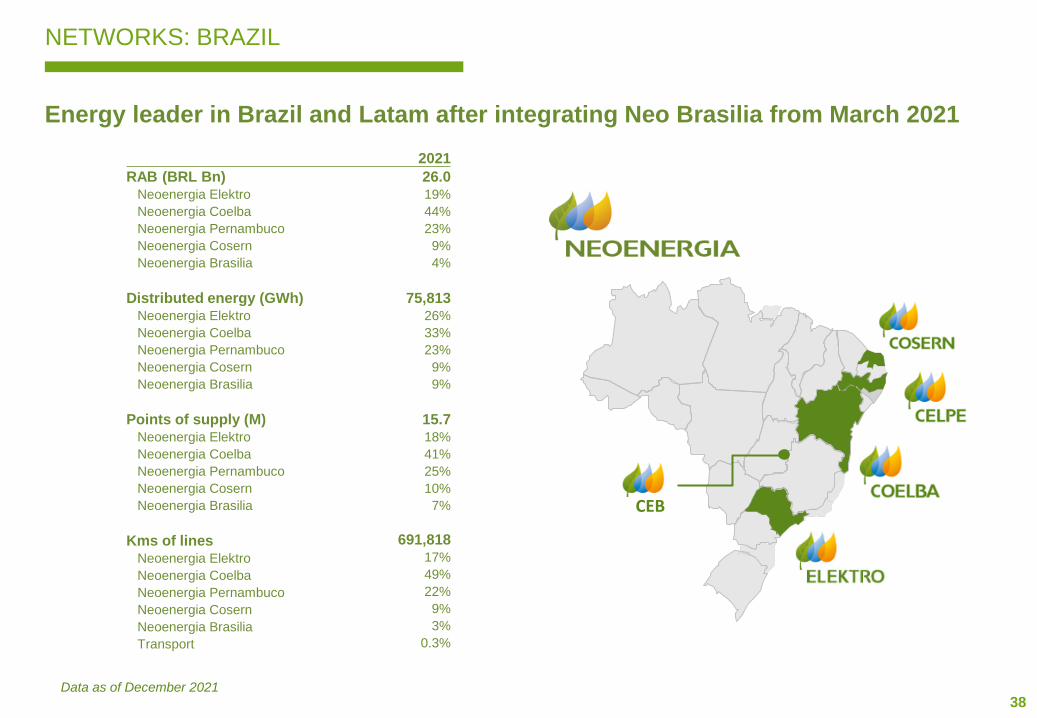
NETWORKS: BRAZIL
Energy leader in Brazil and Latam after integrating Neo Brasilia from March 2021
Data as of December 2021
CEB
2021
RAB (BRL Bn) 26.0Neoenergia Elektro 19%
Neoenergia Coelba 44%
Neoenergia Pernambuco 23%
Neoenergia Cosern 9%
Neoenergia Brasilia 4%
Distributed energy (GWh) 75,813Neoenergia Elektro 26%
Neoenergia Coelba 33%
Neoenergia Pernambuco 23%
Neoenergia Cosern 9%
Neoenergia Brasilia 9%
Points of supply (M) 15.7Neoenergia Elektro 18%
Neoenergia Coelba 41%
Neoenergia Pernambuco 25%
Neoenergia Cosern 10%
Neoenergia Brasilia 7%
Kms of lines 691,818
Neoenergia Elektro 17%
Neoenergia Coelba 49%
Neoenergia Pernambuco 22%
Neoenergia Cosern 9%
Neoenergia Brasilia 3%
Transport 0.3%
39
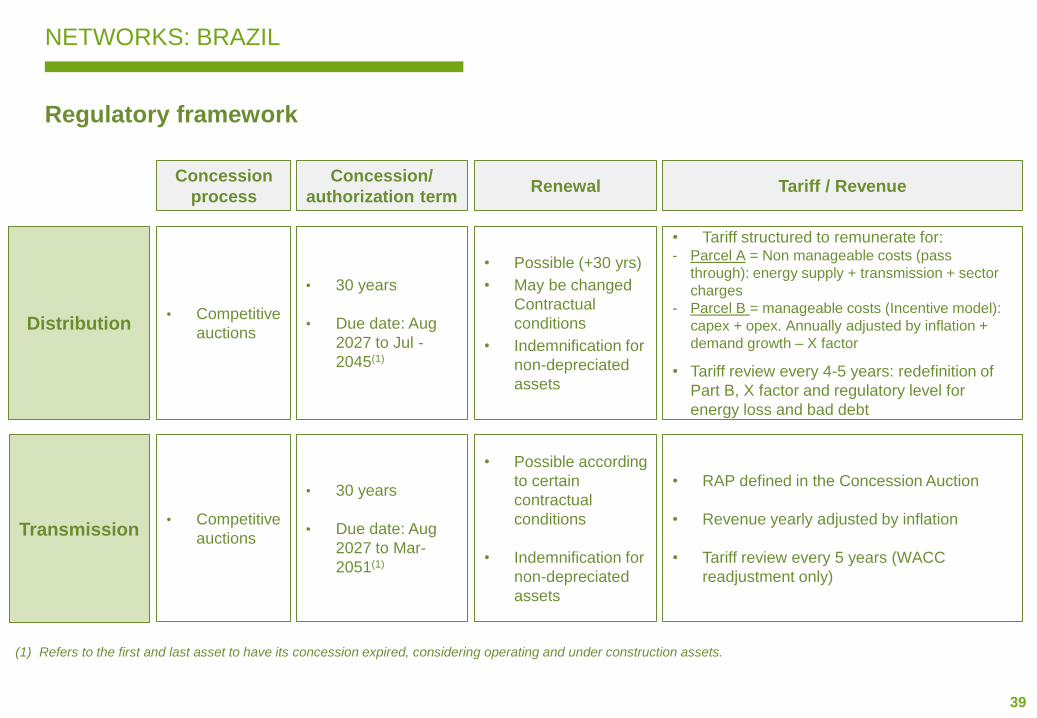
NETWORKS: BRAZIL
Regulatory framework
Concession
process
Distribution
Transmission
Concession/
authorization termRenewal Tariff / Revenue
• Competitive
auctions
• 30 years
• Due date: Aug
2027 to Jul -
2045(1)
• Possible (+30 yrs)
• May be changed
Contractual
conditions
• Indemnification for
non-depreciated
assets
• Tariff structured to remunerate for:- Parcel A = Non manageable costs (pass
through): energy supply + transmission + sector
charges
- Parcel B = manageable costs (Incentive model):
capex + opex. Annually adjusted by inflation +
demand growth – X factor
• Tariff review every 4-5 years: redefinition of
Part B, X factor and regulatory level for
energy loss and bad debt
• Competitive
auctions
• 30 years
• Due date: Aug
2027 to Mar-
2051(1)
• Possible according
to certain
contractual
conditions
• Indemnification for
non-depreciated
assets
• RAP defined in the Concession Auction
• Revenue yearly adjusted by inflation
• Tariff review every 5 years (WACC
readjustment only)
(1) Refers to the first and last asset to have its concession expired, considering operating and under construction assets.
40
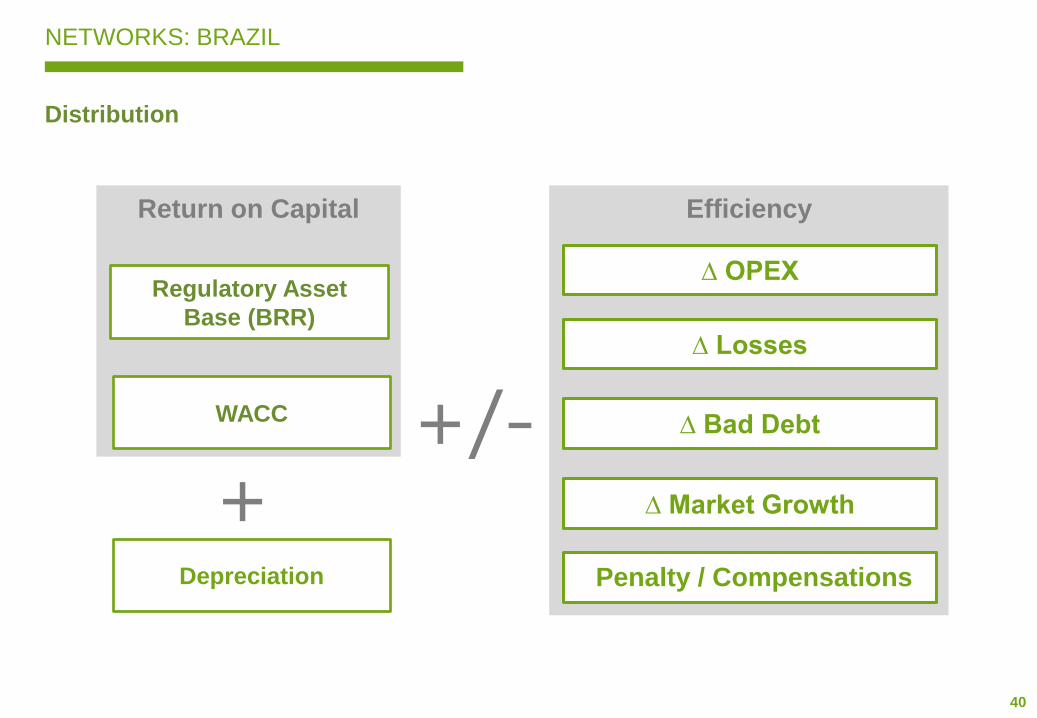
NETWORKS: BRAZIL
Distribution
EfficiencyReturn on Capital
Regulatory Asset
Base (BRR)
WACC
Depreciation
++/-
∆ OPEX
∆ Losses
∆ Bad Debt
∆ Market Growth
Penalty / Compensations
41
NETWORKS: BRAZIL
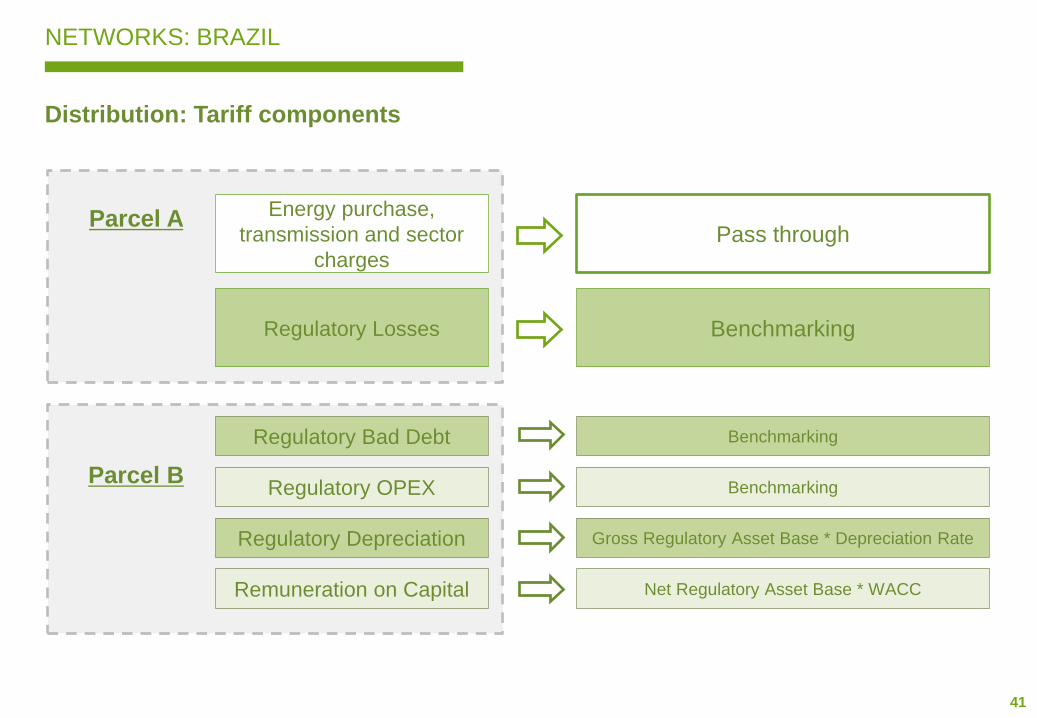
Distribution: Tariff components
Energy purchase,
transmission and sector
charges
Regulatory Bad Debt
Regulatory Losses
Regulatory OPEX
Regulatory Depreciation
Remuneration on Capital
Pass through
Benchmarking
Benchmarking
Benchmarking
Gross Regulatory Asset Base * Depreciation Rate
Net Regulatory Asset Base * WACC
Parcel A
Parcel B
42
NETWORKS: BRAZIL
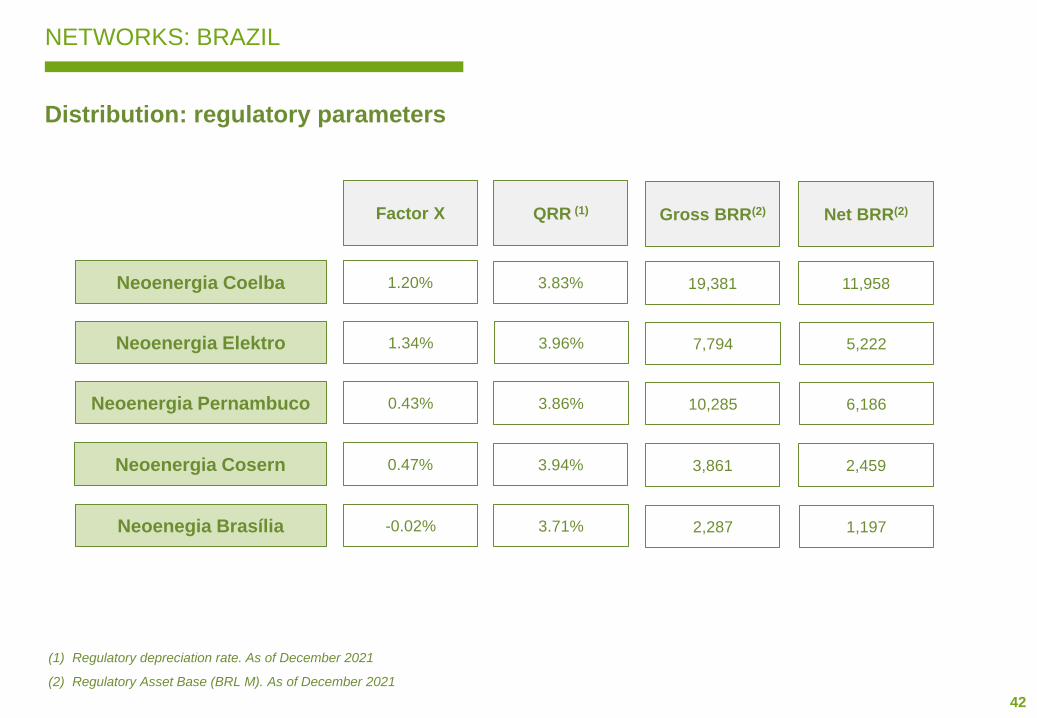
Distribution: regulatory parameters
(1) Regulatory depreciation rate. As of December 2021
(2) Regulatory Asset Base (BRL M). As of December 2021
Factor X
Neoenergia Coelba 1.20%
Neoenergia Elektro 1.34%
Neoenergia Pernambuco 0.43%
Neoenergia Cosern 0.47%
Neoenegia Brasília -0.02%
QRR (1)
3.83%
3.96%
3.86%
3.94%
3.71%
Gross BRR(2)
19,381
7,794
10,285
3,861
2,287
Net BRR(2)
11,958
5,222
6,186
2,459
1,197
43
NETWORKS: BRAZIL
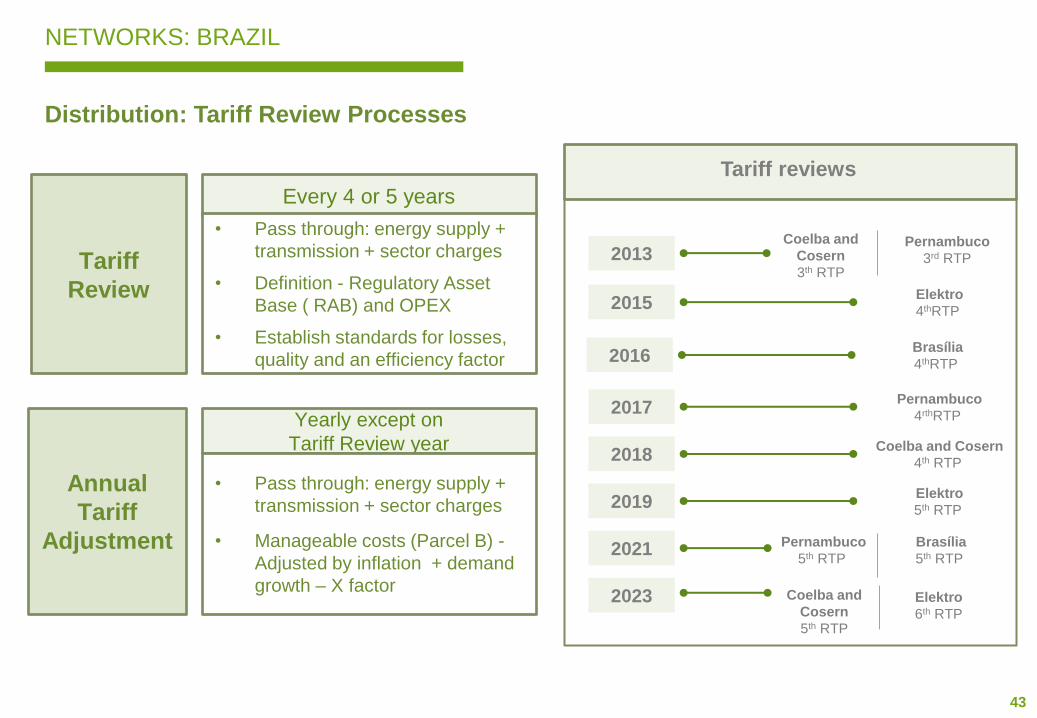
Distribution: Tariff Review Processes
Tariff
Review
Every 4 or 5 years
• Pass through: energy supply +
transmission + sector charges
• Definition - Regulatory Asset
Base ( RAB) and OPEX
• Establish standards for losses,
quality and an efficiency factor
Annual
Tariff
Adjustment
Yearly except on
Tariff Review year
• Pass through: energy supply +
transmission + sector charges
• Manageable costs (Parcel B) -
Adjusted by inflation + demand
growth – X factor
Tariff reviews
2013
2015Elektro
4thRTP
2017Pernambuco
4rthRTP
2018Coelba and Cosern
4th RTP
2019Elektro
5th RTP
2021 Pernambuco
5th RTP
2023 Coelba and
Cosern
5th RTP
Pernambuco
3rd RTP
2016Brasília
4thRTP
Brasília
5th RTP
Elektro
6th RTP
Coelba and
Cosern
3th RTP
44
Tariff Reset
2021
Tariff Review
2021
NETWORKS: BRAZIL
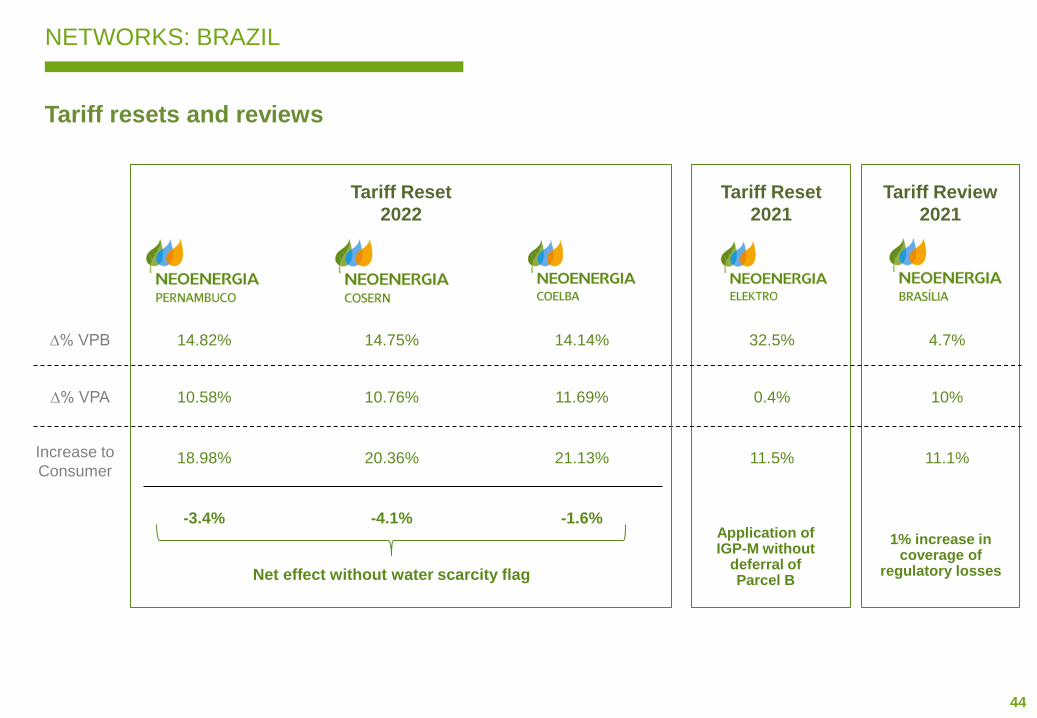
Tariff resets and reviews
∆% VPA 10.58% 10.76% 11.69% 0.4% 10%
∆% VPB 14.82% 14.75% 14.14% 32.5% 4.7%
18.98% 20.36% 21.13% 11.5% 11.1%
Application of IGP-M without
deferral of Parcel B
Increase to
Consumer
1% increase in coverage of
regulatory losses
-3.4% -4.1% -1.6%
Net effect without water scarcity flag
Tariff Reset
2022
45
NETWORKS: BRAZIL
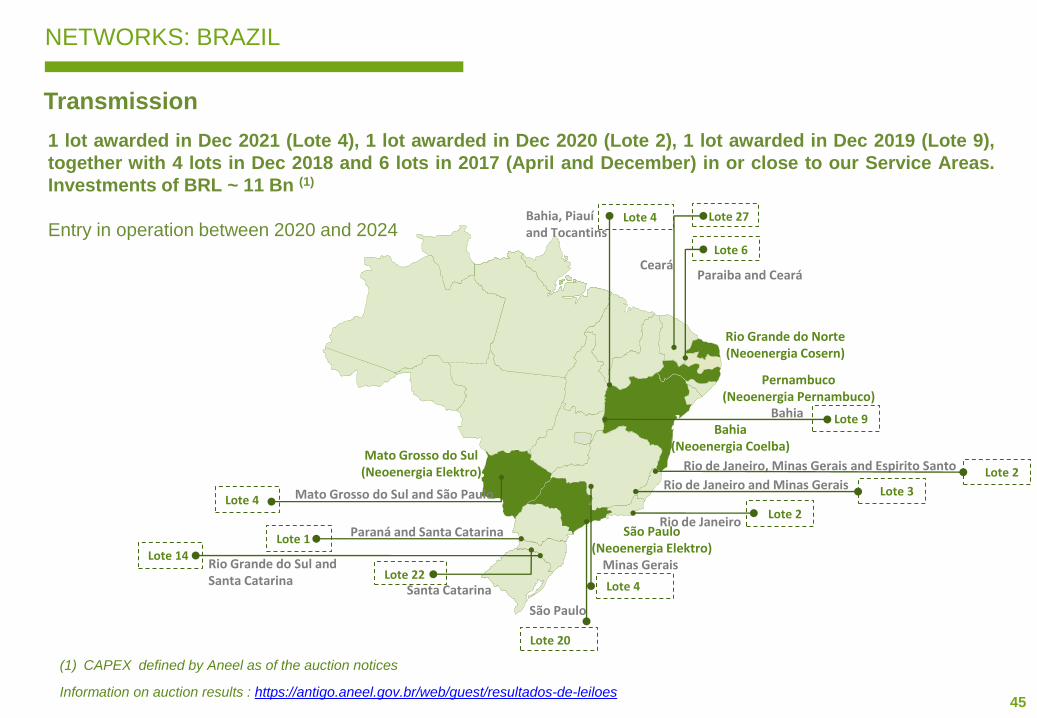
Transmission
1 lot awarded in Dec 2021 (Lote 4), 1 lot awarded in Dec 2020 (Lote 2), 1 lot awarded in Dec 2019 (Lote 9),
together with 4 lots in Dec 2018 and 6 lots in 2017 (April and December) in or close to our Service Areas.
Investments of BRL ~ 11 Bn (1)
Entry in operation between 2020 and 2024
(1) CAPEX defined by Aneel as of the auction notices
Information on auction results : https://antigo.aneel.gov.br/web/guest/resultados-de-leiloes
Rio de Janeiro
Lote 22
Mato Grosso do Sul and São Paulo
Bahia, Piauí and Tocantins
Lote 4
Lote 6
Lote 4 Lote 27
Lote 20
Santa Catarina
CearáParaiba and Ceará
São Paulo
Bahia(Neoenergia Coelba)
Pernambuco(Neoenergia Pernambuco)
Rio Grande do Norte (Neoenergia Cosern)
Mato Grosso do Sul (Neoenergia Elektro)
São Paulo(Neoenergia Elektro)
Paraná and Santa CatarinaLote 1
Lote 2
Lote 3Rio de Janeiro and Minas Gerais
Lote 14Rio Grande do Sul and Santa Catarina
Lote 9
Lote 2Rio de Janeiro, Minas Gerais and Espirito Santo
Bahia
Lote 4
Minas Gerais
46
AGENDA
1. Iberdrola Today (page 5)
2. Networks (page 16)
3. Renewables (page 46)
4. Generation & Retail (page 101)
5. Financing (page 135)
6. ESG (page 148)
47
RENEWABLES
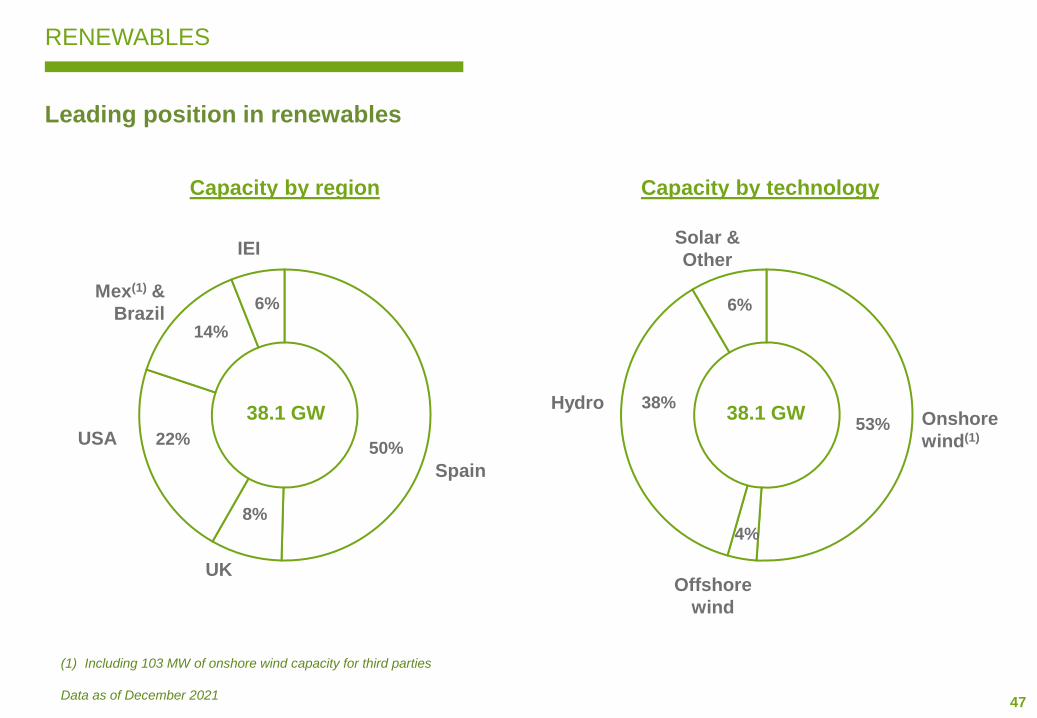
Leading position in renewables
IEI
50%
UK
8%
USA 22%
Spain
Mex(1) &
Brazil6%
Capacity by region
14%
38.1 GWHydro
53%
Offshore
wind
4%
Solar &
Other
6%
Onshore
wind(1)
38%
Capacity by technology
(1) Including 103 MW of onshore wind capacity for third parties
Data as of December 2021
38.1 GW
48
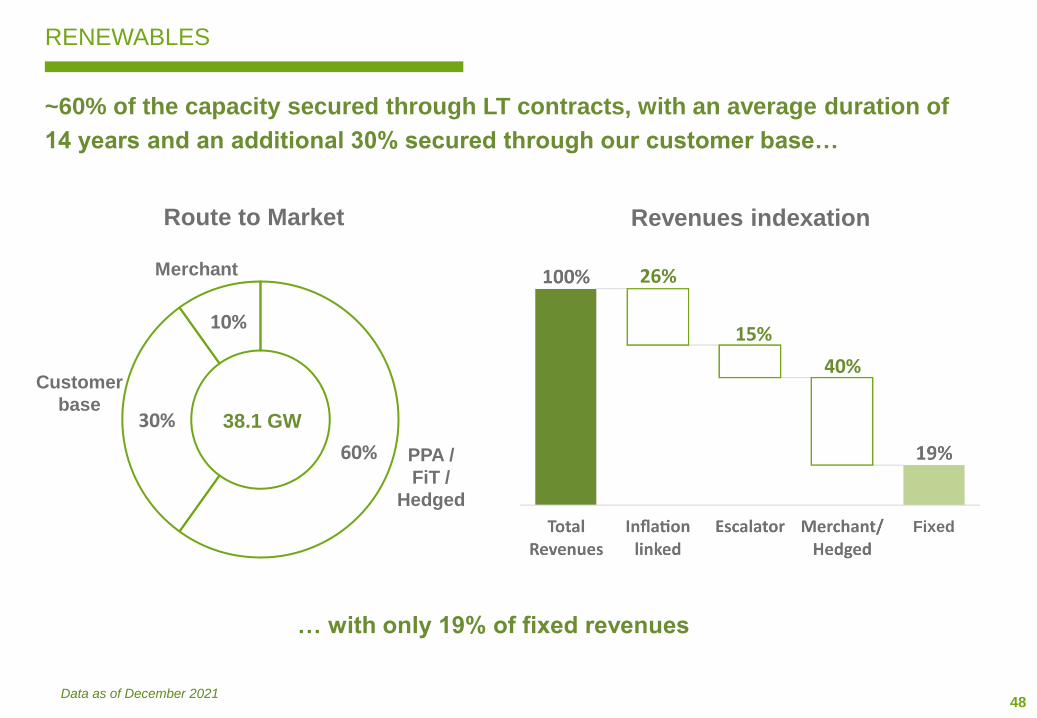
RENEWABLES
~60% of the capacity secured through LT contracts, with an average duration of
14 years and an additional 30% secured through our customer base…
Data as of December 2021
… with only 19% of fixed revenues
60%
30%
10%
PPA /
FiT /
Hedged
Merchant
Customer
base
26%
15%
40%
Route to Market Revenues indexation
38.1 GW
Fixed
49
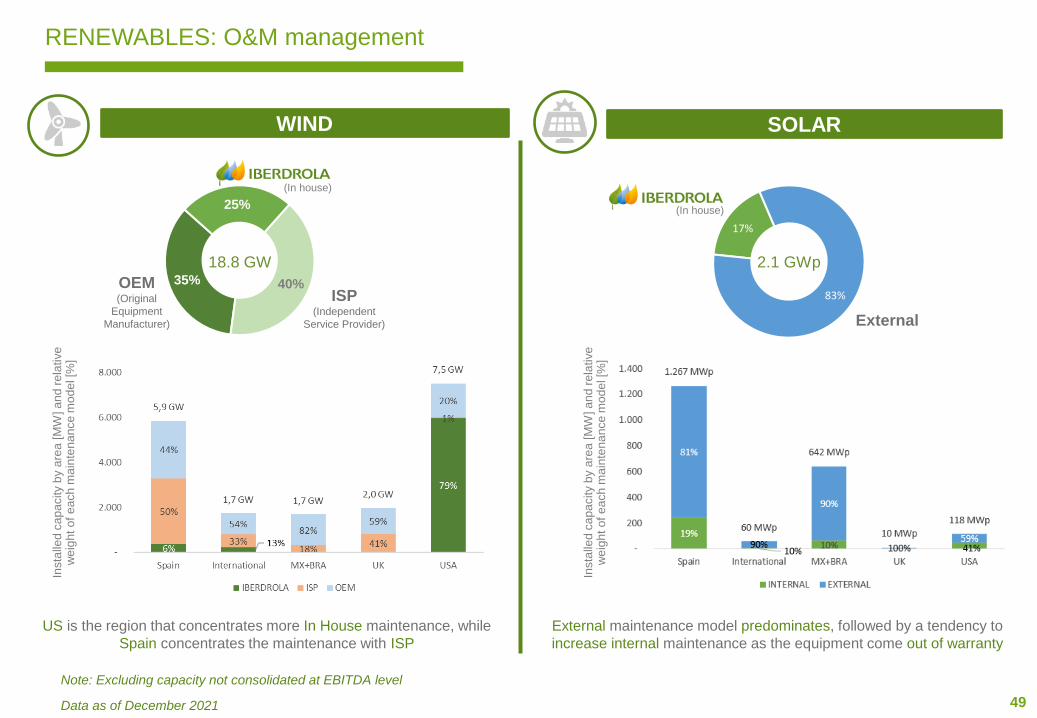
RENEWABLES: O&M management
WIND
17%
83%
SOLAR
2.1 GWp
US is the region that concentrates more In House maintenance, while
Spain concentrates the maintenance with ISP
External maintenance model predominates, followed by a tendency to
increase internal maintenance as the equipment come out of warranty
Insta
lled
ca
pa
city b
y a
rea
[M
W] a
nd
re
lative
w
eig
ht o
f e
ach
ma
inte
na
nce m
od
el [%
]
(In house)
Insta
lled
ca
pa
city b
y a
rea
[M
W] a
nd
re
lative
w
eig
ht o
f e
ach
ma
inte
na
nce m
od
el [%
]
35%
25%
40%
18.8 GW
Note: Excluding capacity not consolidated at EBITDA level
Data as of December 2021
(In house)
OEM(Original
Equipment
Manufacturer)
ISP (Independent
Service Provider) External
50
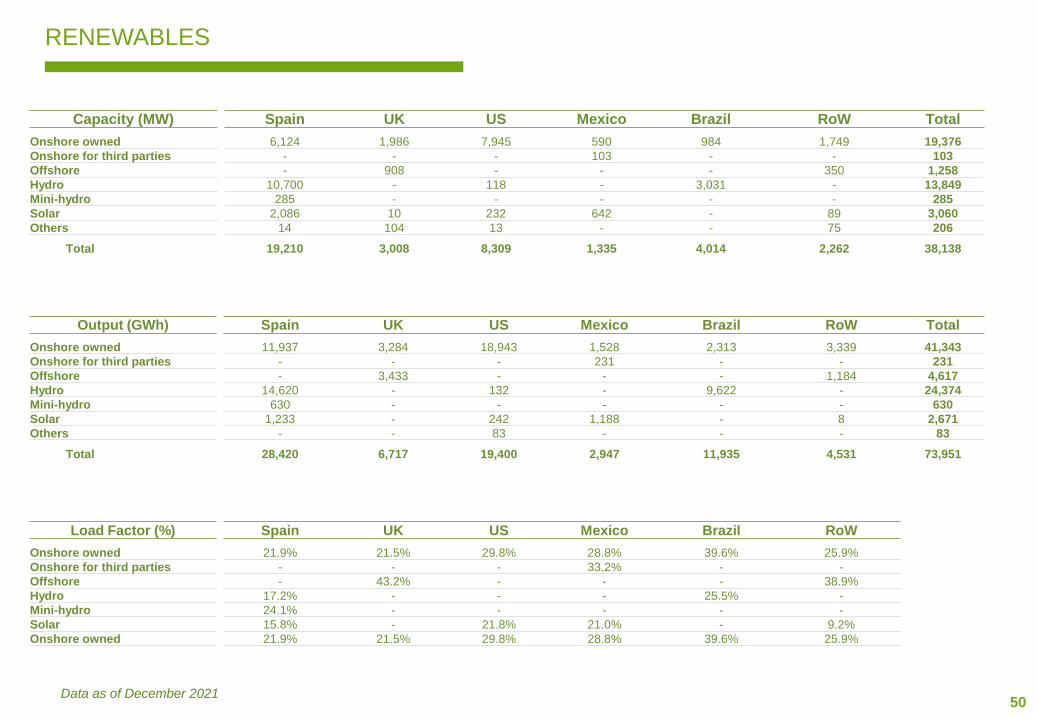
RENEWABLES
Data as of December 2021
Capacity (MW) Spain UK US Mexico Brazil RoW Total
Onshore owned 6,124 1,986 7,945 590 984 1,749 19,376
Onshore for third parties - - - 103 - - 103
Offshore - 908 - - - 350 1,258
Hydro 10,700 - 118 - 3,031 - 13,849
Mini-hydro 285 - - - - - 285
Solar 2,086 10 232 642 - 89 3,060
Others 14 104 13 - - 75 206
Total 19,210 3,008 8,309 1,335 4,014 2,262 38,138
Output (GWh) Spain UK US Mexico Brazil RoW Total
Onshore owned 11,937 3,284 18,943 1,528 2,313 3,339 41,343
Onshore for third parties - - - 231 - - 231
Offshore - 3,433 - - - 1,184 4,617
Hydro 14,620 - 132 - 9,622 - 24,374
Mini-hydro 630 - - - - - 630
Solar 1,233 - 242 1,188 - 8 2,671
Others - - 83 - - - 83
Total 28,420 6,717 19,400 2,947 11,935 4,531 73,951
Load Factor (%) Spain UK US Mexico Brazil RoW
Onshore owned 21.9% 21.5% 29.8% 28.8% 39.6% 25.9%
Onshore for third parties - - - 33.2% - -
Offshore - 43.2% - - - 38.9%
Hydro 17.2% - - - 25.5% -
Mini-hydro 24.1% - - - - -
Solar 15.8% - 21.8% 21.0% - 9.2%
Onshore owned 21.9% 21.5% 29.8% 28.8% 39.6% 25.9%
51
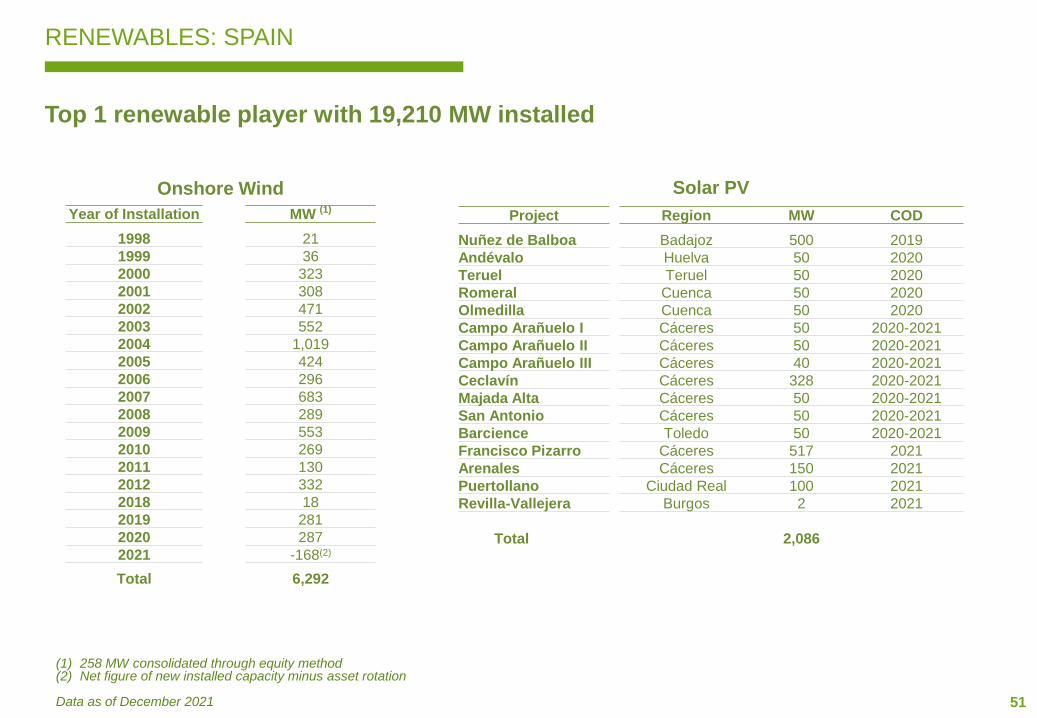
RENEWABLES: SPAIN
Top 1 renewable player with 19,210 MW installed
(1) 258 MW consolidated through equity method(2) Net figure of new installed capacity minus asset rotation
Data as of December 2021
Onshore Wind
Year of Installation MW (1)
1998 21
1999 36
2000 323
2001 308
2002 471
2003 552
2004 1,019
2005 424
2006 296
2007 683
2008 289
2009 553
2010 269
2011 130
2012 332
2018 18
2019 281
2020 287
2021 -168(2)
Total 6,292
Solar PV
Project Region MW COD
Nuñez de Balboa Badajoz 500 2019
Andévalo Huelva 50 2020
Teruel Teruel 50 2020
Romeral Cuenca 50 2020
Olmedilla Cuenca 50 2020
Campo Arañuelo I Cáceres 50 2020-2021
Campo Arañuelo II Cáceres 50 2020-2021
Campo Arañuelo III Cáceres 40 2020-2021
Ceclavín Cáceres 328 2020-2021
Majada Alta Cáceres 50 2020-2021
San Antonio Cáceres 50 2020-2021
Barcience Toledo 50 2020-2021
Francisco Pizarro Cáceres 517 2021
Arenales Cáceres 150 2021
Puertollano Ciudad Real 100 2021
Revilla-Vallejera Burgos 2 2021
Total 2,086
52
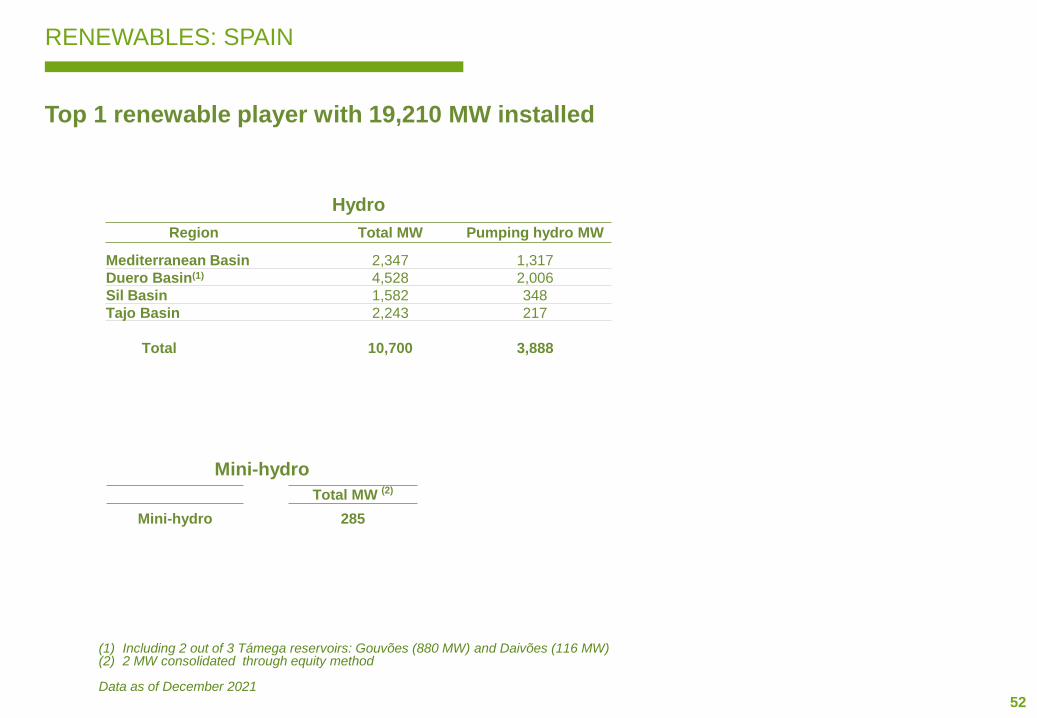
RENEWABLES: SPAIN
Top 1 renewable player with 19,210 MW installed
(1) Including 2 out of 3 Támega reservoirs: Gouvões (880 MW) and Daivões (116 MW)(2) 2 MW consolidated through equity method
Data as of December 2021
Hydro
Region Total MW Pumping hydro MW
Mediterranean Basin 2,347 1,317
Duero Basin(1) 4,528 2,006
Sil Basin 1,582 348
Tajo Basin 2,243 217
Total 10,700 3,888
Mini-hydro
Total MW (2)
Mini-hydro 285
53
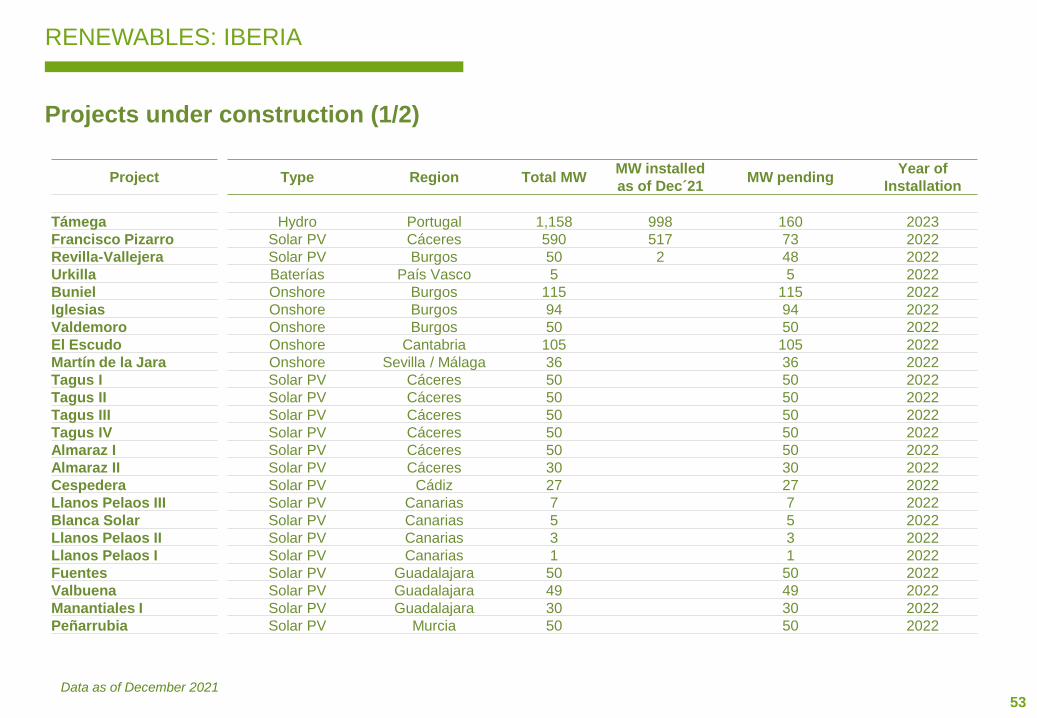
RENEWABLES: IBERIA
Projects under construction (1/2)
Data as of December 2021
Project Type Region Total MWMW installed
as of Dec´21MW pending
Year of
Installation
Támega Hydro Portugal 1,158 998 160 2023
Francisco Pizarro Solar PV Cáceres 590 517 73 2022
Revilla-Vallejera Solar PV Burgos 50 2 48 2022
Urkilla Baterías País Vasco 5 5 2022
Buniel Onshore Burgos 115 115 2022
Iglesias Onshore Burgos 94 94 2022
Valdemoro Onshore Burgos 50 50 2022
El Escudo Onshore Cantabria 105 105 2022
Martín de la Jara Onshore Sevilla / Málaga 36 36 2022
Tagus I Solar PV Cáceres 50 50 2022
Tagus II Solar PV Cáceres 50 50 2022
Tagus III Solar PV Cáceres 50 50 2022
Tagus IV Solar PV Cáceres 50 50 2022
Almaraz I Solar PV Cáceres 50 50 2022
Almaraz II Solar PV Cáceres 30 30 2022
Cespedera Solar PV Cádiz 27 27 2022
Llanos Pelaos III Solar PV Canarias 7 7 2022
Blanca Solar Solar PV Canarias 5 5 2022
Llanos Pelaos II Solar PV Canarias 3 3 2022
Llanos Pelaos I Solar PV Canarias 1 1 2022
Fuentes Solar PV Guadalajara 50 50 2022
Valbuena Solar PV Guadalajara 49 49 2022
Manantiales I Solar PV Guadalajara 30 30 2022
Peñarrubia Solar PV Murcia 50 50 2022
54
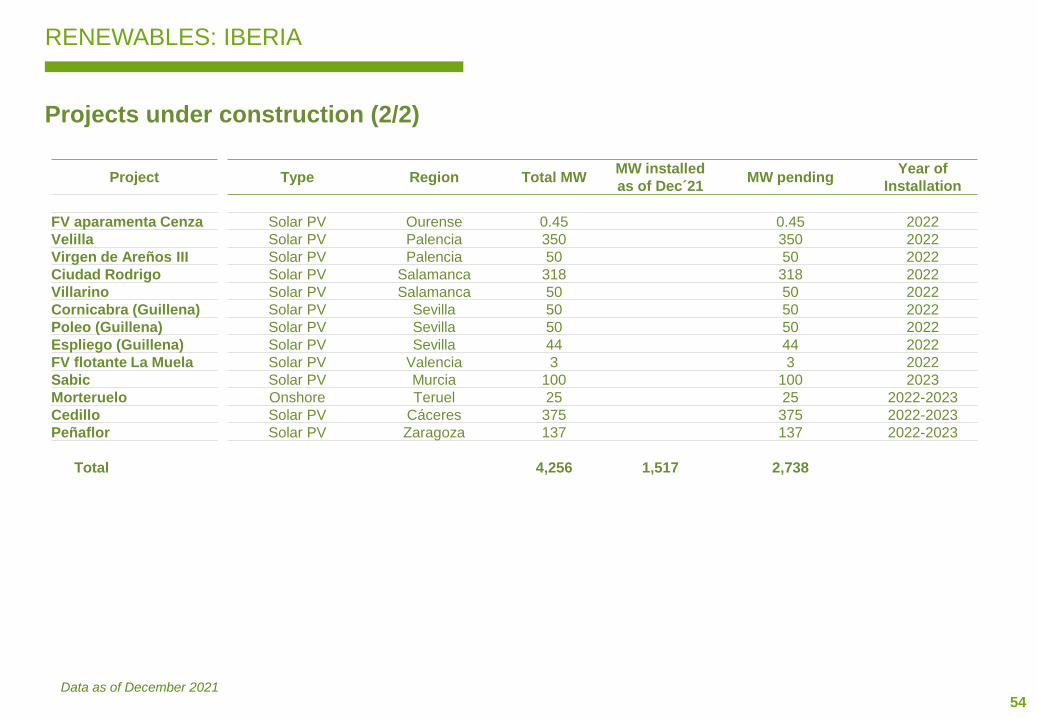
RENEWABLES: IBERIA
Projects under construction (2/2)
Data as of December 2021
Project Type Region Total MWMW installed
as of Dec´21MW pending
Year of
Installation
FV aparamenta Cenza Solar PV Ourense 0.45 0.45 2022
Velilla Solar PV Palencia 350 350 2022
Virgen de Areños III Solar PV Palencia 50 50 2022
Ciudad Rodrigo Solar PV Salamanca 318 318 2022
Villarino Solar PV Salamanca 50 50 2022
Cornicabra (Guillena) Solar PV Sevilla 50 50 2022
Poleo (Guillena) Solar PV Sevilla 50 50 2022
Espliego (Guillena) Solar PV Sevilla 44 44 2022
FV flotante La Muela Solar PV Valencia 3 3 2022
Sabic Solar PV Murcia 100 100 2023
Morteruelo Onshore Teruel 25 25 2022-2023
Cedillo Solar PV Cáceres 375 375 2022-2023
Peñaflor Solar PV Zaragoza 137 137 2022-2023
Total 4,256 1,517 2,738
55
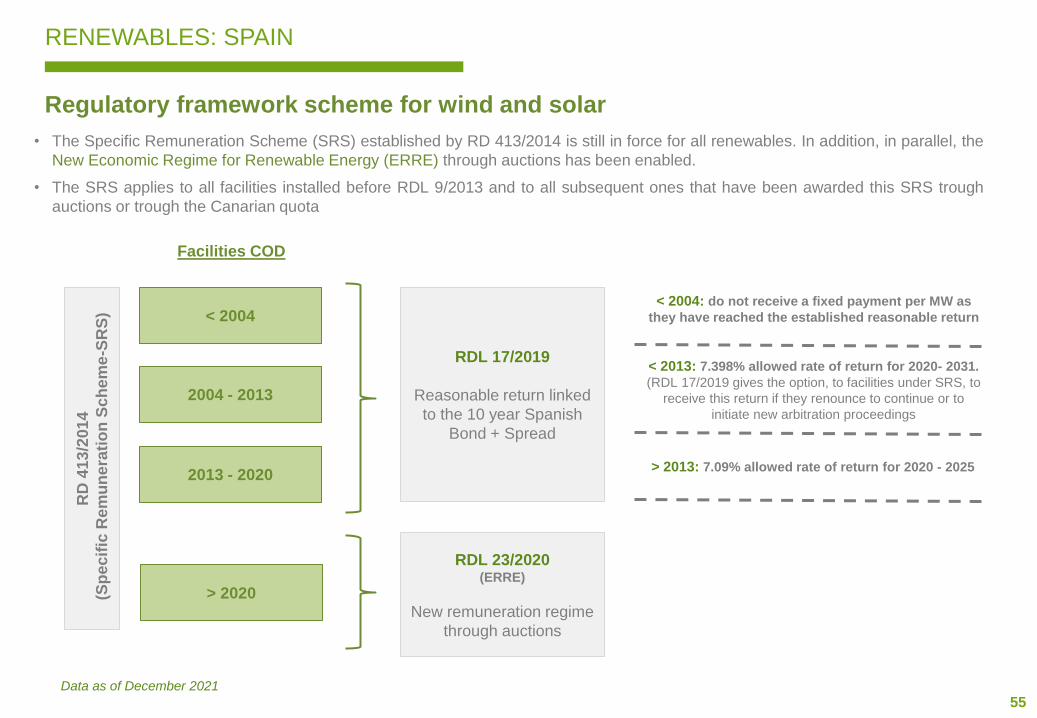
RENEWABLES: SPAIN
Regulatory framework scheme for wind and solar
< 2004
2004 - 2013
Facilities COD
RDL 17/2019
Reasonable return linked
to the 10 year Spanish
Bond + Spread
< 2004: do not receive a fixed payment per MW as
they have reached the established reasonable return
2013 - 2020
> 2020
Data as of December 2021
< 2013: 7.398% allowed rate of return for 2020- 2031.
(RDL 17/2019 gives the option, to facilities under SRS, to
receive this return if they renounce to continue or to
initiate new arbitration proceedings
> 2013: 7.09% allowed rate of return for 2020 - 2025
RDL 23/2020(ERRE)
New remuneration regime
through auctions
• The Specific Remuneration Scheme (SRS) established by RD 413/2014 is still in force for all renewables. In addition, in parallel, the
New Economic Regime for Renewable Energy (ERRE) through auctions has been enabled.
• The SRS applies to all facilities installed before RDL 9/2013 and to all subsequent ones that have been awarded this SRS trough
auctions or trough the Canarian quota
RD
41
3/2
014
(Sp
ec
ific
Rem
un
era
tio
n S
ch
em
e-S
RS
)
56
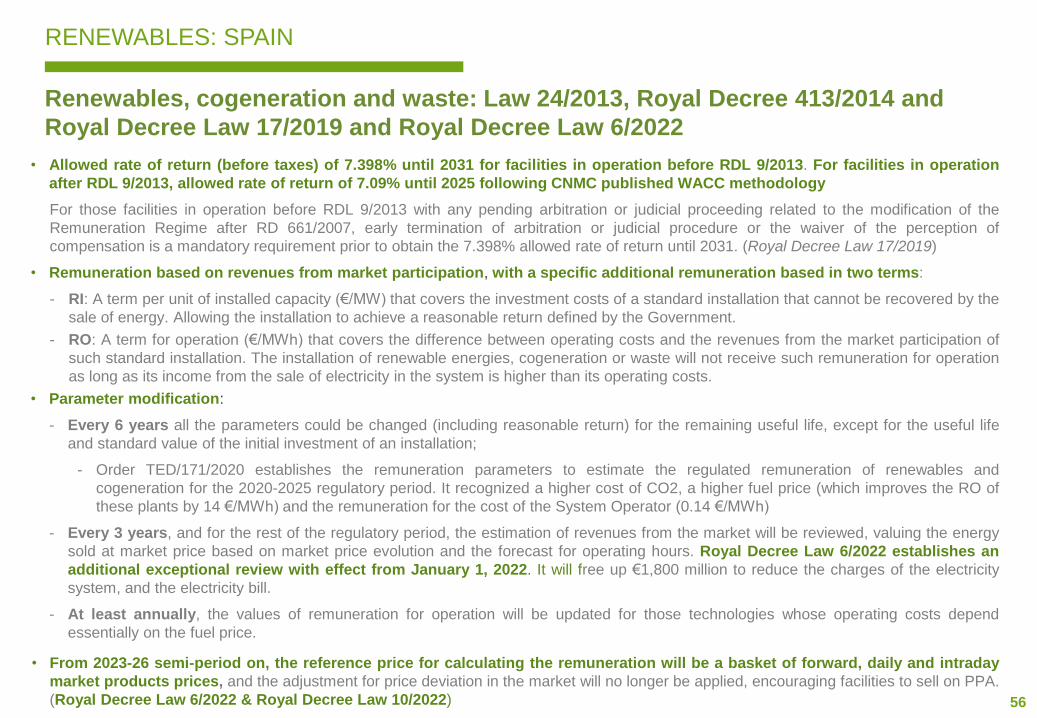
RENEWABLES: SPAIN
Renewables, cogeneration and waste: Law 24/2013, Royal Decree 413/2014 and
Royal Decree Law 17/2019 and Royal Decree Law 6/2022
• Allowed rate of return (before taxes) of 7.398% until 2031 for facilities in operation before RDL 9/2013. For facilities in operation
after RDL 9/2013, allowed rate of return of 7.09% until 2025 following CNMC published WACC methodology
For those facilities in operation before RDL 9/2013 with any pending arbitration or judicial proceeding related to the modification of the
Remuneration Regime after RD 661/2007, early termination of arbitration or judicial procedure or the waiver of the perception of
compensation is a mandatory requirement prior to obtain the 7.398% allowed rate of return until 2031. (Royal Decree Law 17/2019)
• Remuneration based on revenues from market participation, with a specific additional remuneration based in two terms:
- RI: A term per unit of installed capacity (€/MW) that covers the investment costs of a standard installation that cannot be recovered by the
sale of energy. Allowing the installation to achieve a reasonable return defined by the Government.
- RO: A term for operation (€/MWh) that covers the difference between operating costs and the revenues from the market participation of
such standard installation. The installation of renewable energies, cogeneration or waste will not receive such remuneration for operation
as long as its income from the sale of electricity in the system is higher than its operating costs.
• Parameter modification:
- Every 6 years all the parameters could be changed (including reasonable return) for the remaining useful life, except for the useful life
and standard value of the initial investment of an installation;
- Order TED/171/2020 establishes the remuneration parameters to estimate the regulated remuneration of renewables and
cogeneration for the 2020-2025 regulatory period. It recognized a higher cost of CO2, a higher fuel price (which improves the RO of
these plants by 14 €/MWh) and the remuneration for the cost of the System Operator (0.14 €/MWh)
- Every 3 years, and for the rest of the regulatory period, the estimation of revenues from the market will be reviewed, valuing the energy
sold at market price based on market price evolution and the forecast for operating hours. Royal Decree Law 6/2022 establishes an
additional exceptional review with effect from January 1, 2022. It will free up €1,800 million to reduce the charges of the electricity
system, and the electricity bill.
- At least annually, the values of remuneration for operation will be updated for those technologies whose operating costs depend
essentially on the fuel price.
• From 2023-26 semi-period on, the reference price for calculating the remuneration will be a basket of forward, daily and intraday
market products prices, and the adjustment for price deviation in the market will no longer be applied, encouraging facilities to sell on PPA.
(Royal Decree Law 6/2022 & Royal Decree Law 10/2022)
57
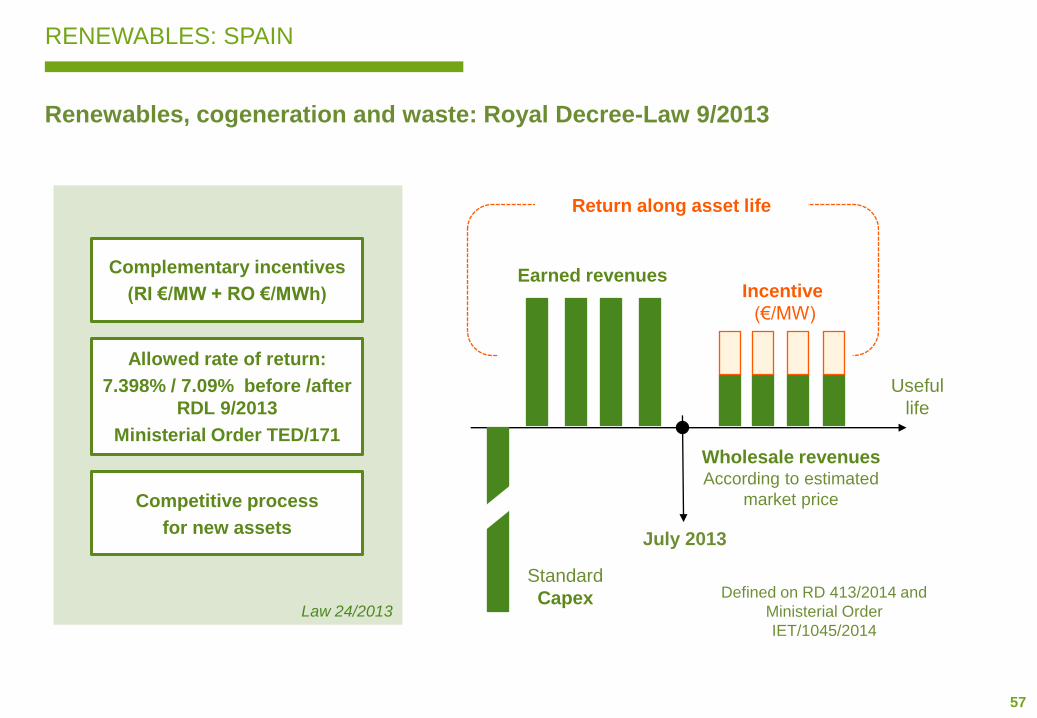
Renewables, cogeneration and waste: Royal Decree-Law 9/2013
RENEWABLES: SPAIN
Return along asset life
Law 24/2013
Complementary incentives
(RI €/MW + RO €/MWh)
Competitive process
for new assets
Allowed rate of return:
7.398% / 7.09% before /after
RDL 9/2013
Ministerial Order TED/171
Earned revenues
Wholesale revenuesAccording to estimated
market price
Standard
Capex
Useful
life
Incentive
(€/MW)
July 2013
Defined on RD 413/2014 and
Ministerial Order
IET/1045/2014
58
RENEWABLES: SPAIN
New Economic Regime for Renewable Energy (ERRE) through auctions
• Royal Decree Law 23/2020 (24th June 2020) gave the Government the mandate to develop a new remuneration regime
In addition to the remuneration scheme established in RD-L 9/2013, the Government will develop another remuneration framework
based on recognizing a long-term price for energy produced by new electricity production facilities, through auctions.
• Royal Decree 960/2020 (4th November 2020) describes the new support system
This RD sets up a very flexible system to be concreted in various Ministerial Orders and Call Resolutions
- Product to be auctioned: power (MW), energy (MWh) or a combination of both of them
- Variable to offer: participants will bid a long-term price for energy in €/MWh (10-15 years)
- Awarded price can be corrected by an exposition to the market price percentage
[price received (h) = price awarded + % exposition * (Daily Market Price (h) + Price Awarded)]
- Pay as bid auction with a maximum price and a possible risk price
- Participants must provide guarantees to participate
- Winners can install more capacity than the amount awarded in the auction
• Ministerial Order TED/1161
- An indicative calendar (to be updated at least annually) for the next five years is published. Almost 20 GW will be auctioned in
the period 2020 – 2025.
- Remuneration parameters are set per technology (min. and max. yearly equivalent hours)
- Auctioned product: installed power (kW)
- Facilities with storage: if they want to participate can not charge buying electricity from the market.
- Only new facilities can participate (the earliest from start of works or first firm commitment to order equipment).
- Participation guarantees amount 60 €/kW (to be partially released if certain milestones are met)
- 50% of auctioned volume is the maximum quantity to be awarded to one company
• There will be one Ministerial Order and Call Resolutions for each auction
- They will establish the volume to be auctioned for each technology. During 2021 two auctions have taken place:
1) 26th January 2021: 3.043 MW awarded at the average price of 24,75 €/MWh
2) 20th October 2021: 3.123 MW awarded at the average price of 30,58 €/MWh
59
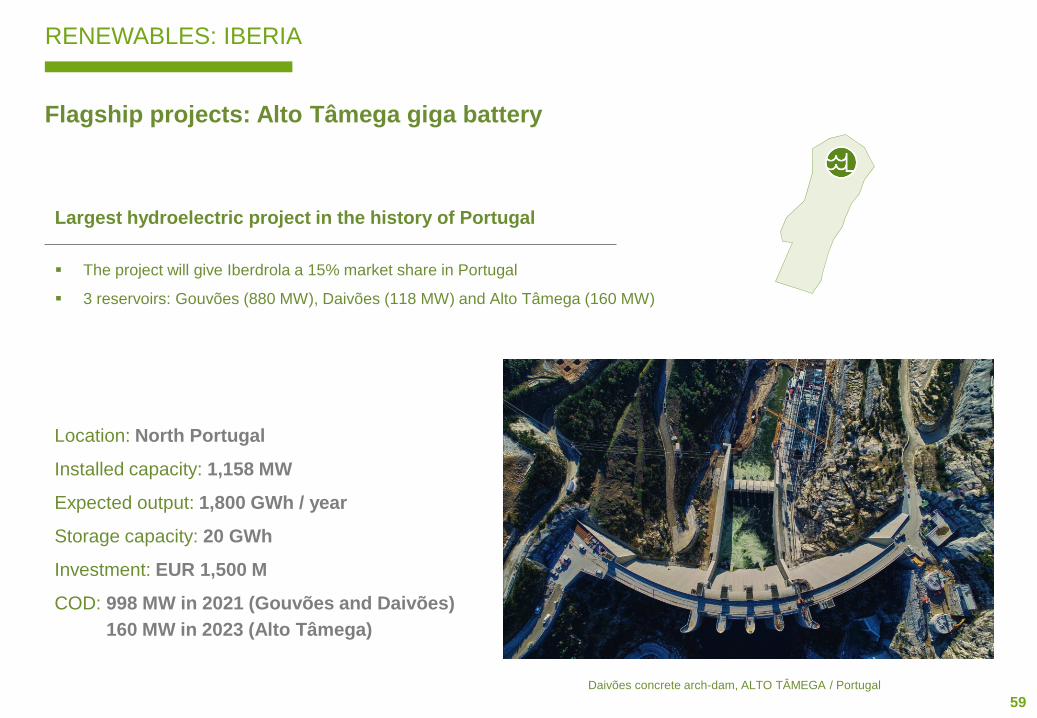
Flagship projects: Alto Tâmega giga battery
RENEWABLES: IBERIA
Largest hydroelectric project in the history of Portugal
▪ The project will give Iberdrola a 15% market share in Portugal
▪ 3 reservoirs: Gouvões (880 MW), Daivões (118 MW) and Alto Tâmega (160 MW)
Daivões concrete arch-dam, ALTO TÂMEGA / Portugal
Location: North Portugal
Installed capacity: 1,158 MW
Expected output: 1,800 GWh / year
Storage capacity: 20 GWh
Investment: EUR 1,500 M
COD: 998 MW in 2021 (Gouvões and Daivões)
160 MW in 2023 (Alto Tâmega)
60
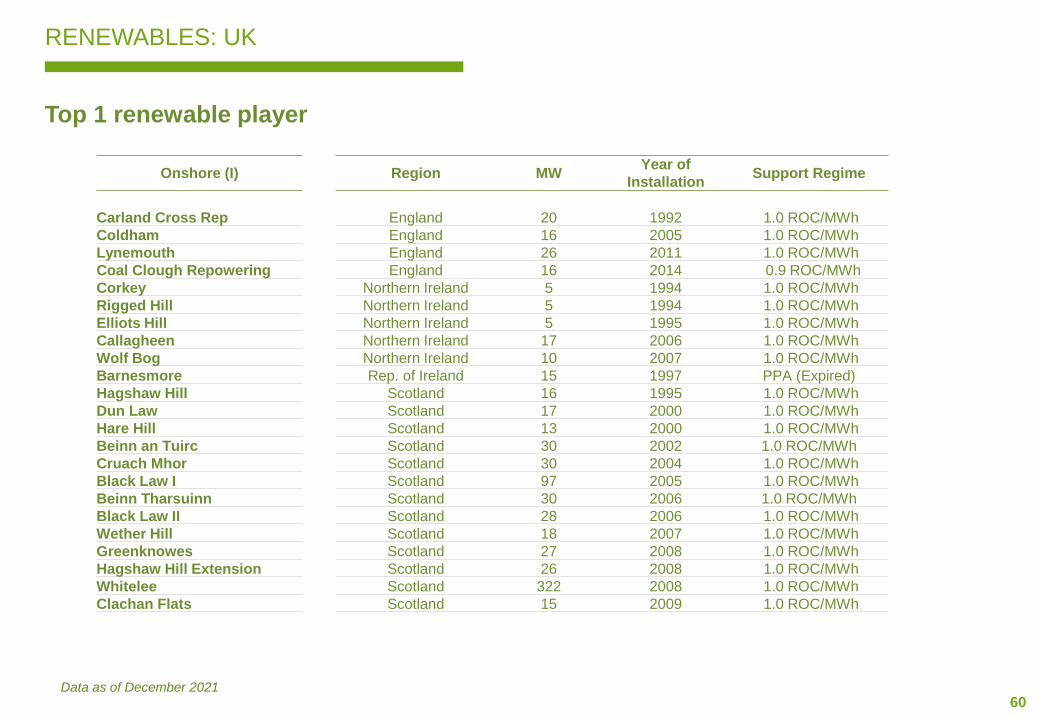
Top 1 renewable player
RENEWABLES: UK
Onshore (I) Region MWYear of
InstallationSupport Regime
Carland Cross Rep England 20 1992 1.0 ROC/MWh
Coldham England 16 2005 1.0 ROC/MWh
Lynemouth England 26 2011 1.0 ROC/MWh
Coal Clough Repowering England 16 2014 0.9 ROC/MWh
Corkey Northern Ireland 5 1994 1.0 ROC/MWh
Rigged Hill Northern Ireland 5 1994 1.0 ROC/MWh
Elliots Hill Northern Ireland 5 1995 1.0 ROC/MWh
Callagheen Northern Ireland 17 2006 1.0 ROC/MWh
Wolf Bog Northern Ireland 10 2007 1.0 ROC/MWh
Barnesmore Rep. of Ireland 15 1997 PPA (Expired)
Hagshaw Hill Scotland 16 1995 1.0 ROC/MWh
Dun Law Scotland 17 2000 1.0 ROC/MWh
Hare Hill Scotland 13 2000 1.0 ROC/MWh
Beinn an Tuirc Scotland 30 2002 1.0 ROC/MWh
Cruach Mhor Scotland 30 2004 1.0 ROC/MWh
Black Law I Scotland 97 2005 1.0 ROC/MWh
Beinn Tharsuinn Scotland 30 2006 1.0 ROC/MWh
Black Law II Scotland 28 2006 1.0 ROC/MWh
Wether Hill Scotland 18 2007 1.0 ROC/MWh
Greenknowes Scotland 27 2008 1.0 ROC/MWh
Hagshaw Hill Extension Scotland 26 2008 1.0 ROC/MWh
Whitelee Scotland 322 2008 1.0 ROC/MWh
Clachan Flats Scotland 15 2009 1.0 ROC/MWh
Data as of December 2021
61
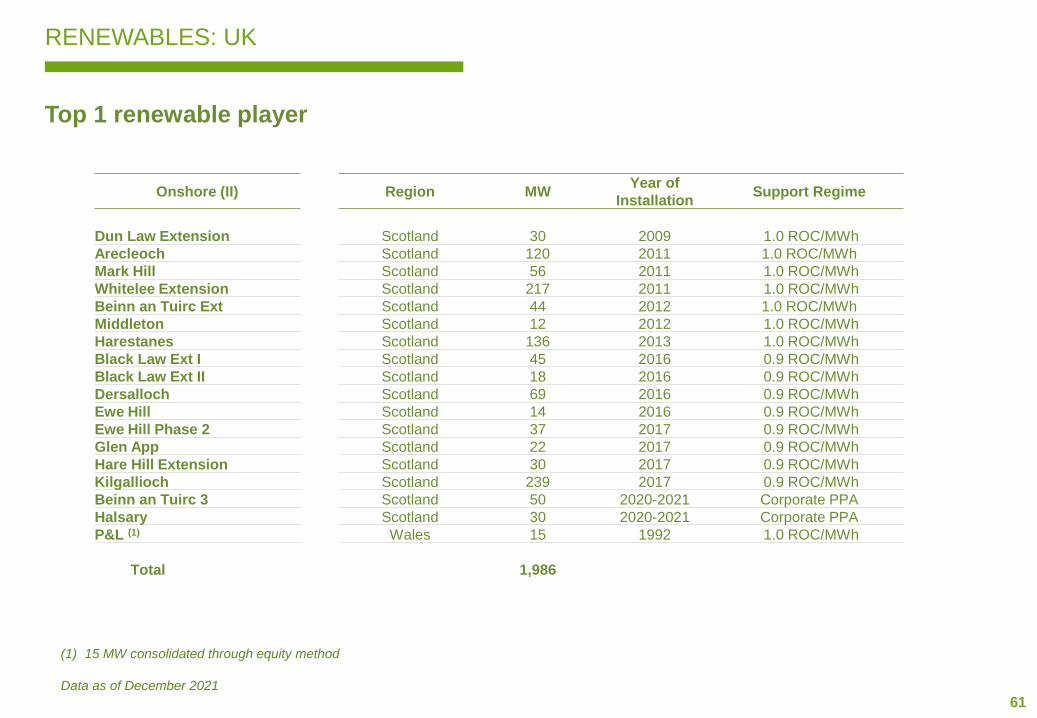
RENEWABLES: UK
(1) 15 MW consolidated through equity method
Data as of December 2021
Onshore (II) Region MWYear of
InstallationSupport Regime
Dun Law Extension Scotland 30 2009 1.0 ROC/MWh
Arecleoch Scotland 120 2011 1.0 ROC/MWh
Mark Hill Scotland 56 2011 1.0 ROC/MWh
Whitelee Extension Scotland 217 2011 1.0 ROC/MWh
Beinn an Tuirc Ext Scotland 44 2012 1.0 ROC/MWh
Middleton Scotland 12 2012 1.0 ROC/MWh
Harestanes Scotland 136 2013 1.0 ROC/MWh
Black Law Ext I Scotland 45 2016 0.9 ROC/MWh
Black Law Ext II Scotland 18 2016 0.9 ROC/MWh
Dersalloch Scotland 69 2016 0.9 ROC/MWh
Ewe Hill Scotland 14 2016 0.9 ROC/MWh
Ewe Hill Phase 2 Scotland 37 2017 0.9 ROC/MWh
Glen App Scotland 22 2017 0.9 ROC/MWh
Hare Hill Extension Scotland 30 2017 0.9 ROC/MWh
Kilgallioch Scotland 239 2017 0.9 ROC/MWh
Beinn an Tuirc 3 Scotland 50 2020-2021 Corporate PPA
Halsary Scotland 30 2020-2021 Corporate PPA
P&L (1) Wales 15 1992 1.0 ROC/MWh
Total 1,986
Top 1 renewable player
62
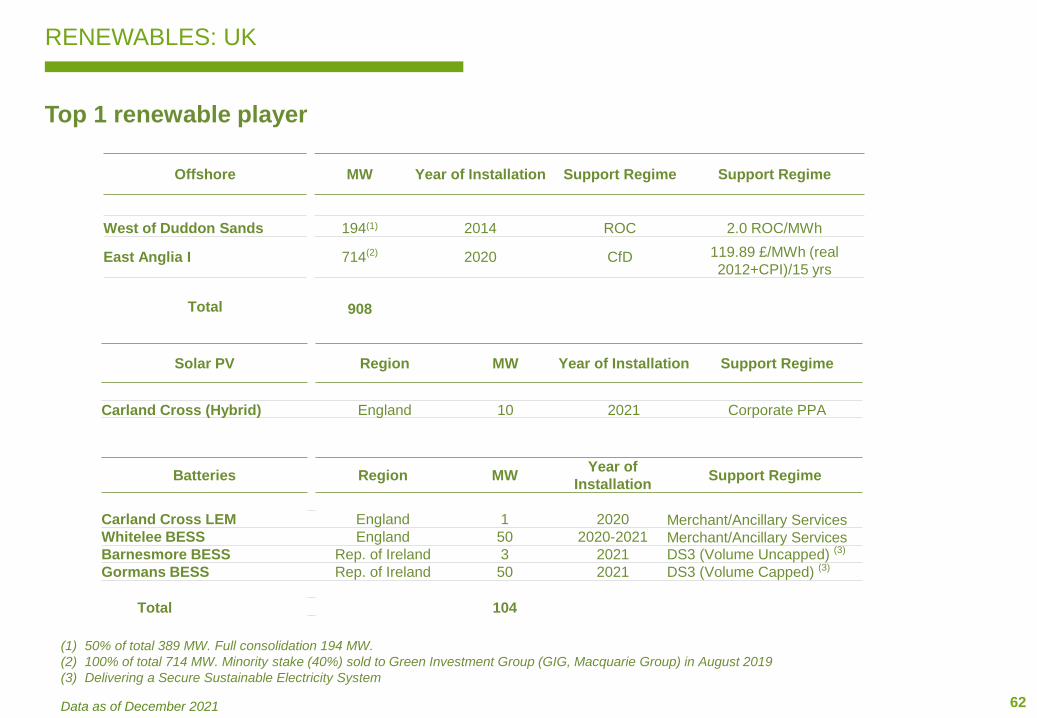
RENEWABLES: UK
(1) 50% of total 389 MW. Full consolidation 194 MW.
(2) 100% of total 714 MW. Minority stake (40%) sold to Green Investment Group (GIG, Macquarie Group) in August 2019
(3) Delivering a Secure Sustainable Electricity System
Data as of December 2021
Offshore MW Year of Installation Support Regime Support Regime
West of Duddon Sands 194(1) 2014 ROC 2.0 ROC/MWh
East Anglia I 714(2) 2020 CfD 119.89 £/MWh (real
2012+CPI)/15 yrs
Total 908
Solar PV Region MW Year of Installation Support Regime
Carland Cross (Hybrid) England 10 2021 Corporate PPA
Batteries Region MWYear of
InstallationSupport Regime
Carland Cross LEM England 1 2020 Merchant/Ancillary ServicesWhitelee BESS England 50 2020-2021 Merchant/Ancillary ServicesBarnesmore BESS Rep. of Ireland 3 2021 DS3 (Volume Uncapped) (3)
Gormans BESS Rep. of Ireland 50 2021 DS3 (Volume Capped) (3)
Total 104
Top 1 renewable player
63
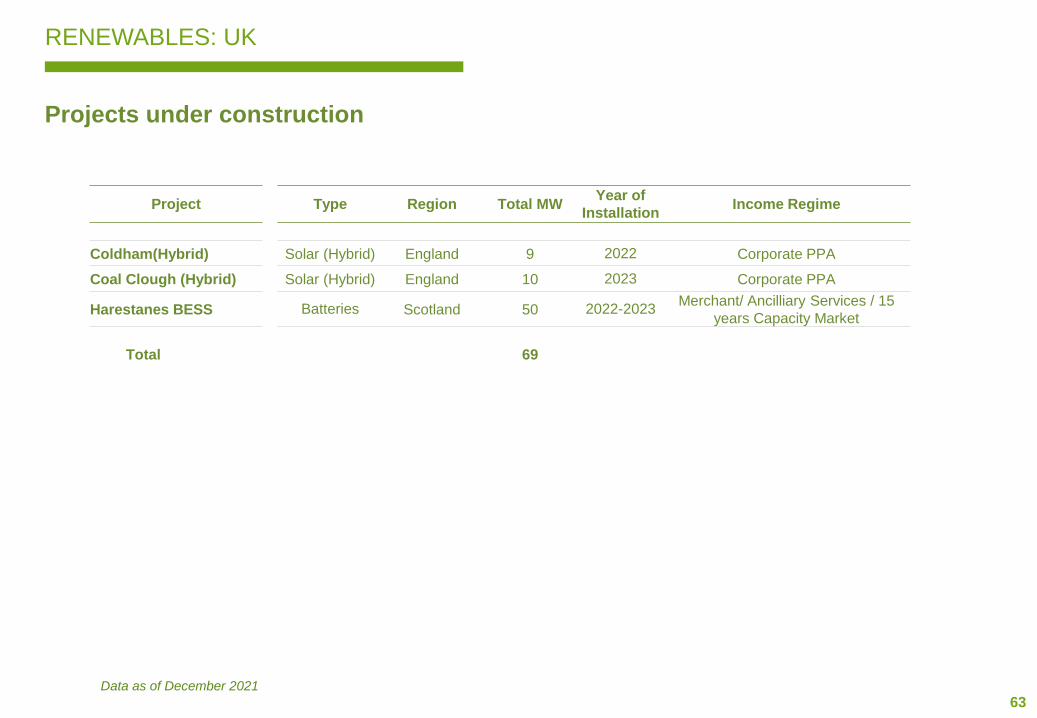
RENEWABLES: UK
Projects under construction
Data as of December 2021
Project Type Region Total MWYear of
InstallationIncome Regime
Coldham(Hybrid) Solar (Hybrid) England 9 2022 Corporate PPA
Coal Clough (Hybrid) Solar (Hybrid) England 10 2023 Corporate PPA
Harestanes BESS Batteries Scotland 50 2022-2023Merchant/ Ancilliary Services / 15
years Capacity Market
Total 69
64
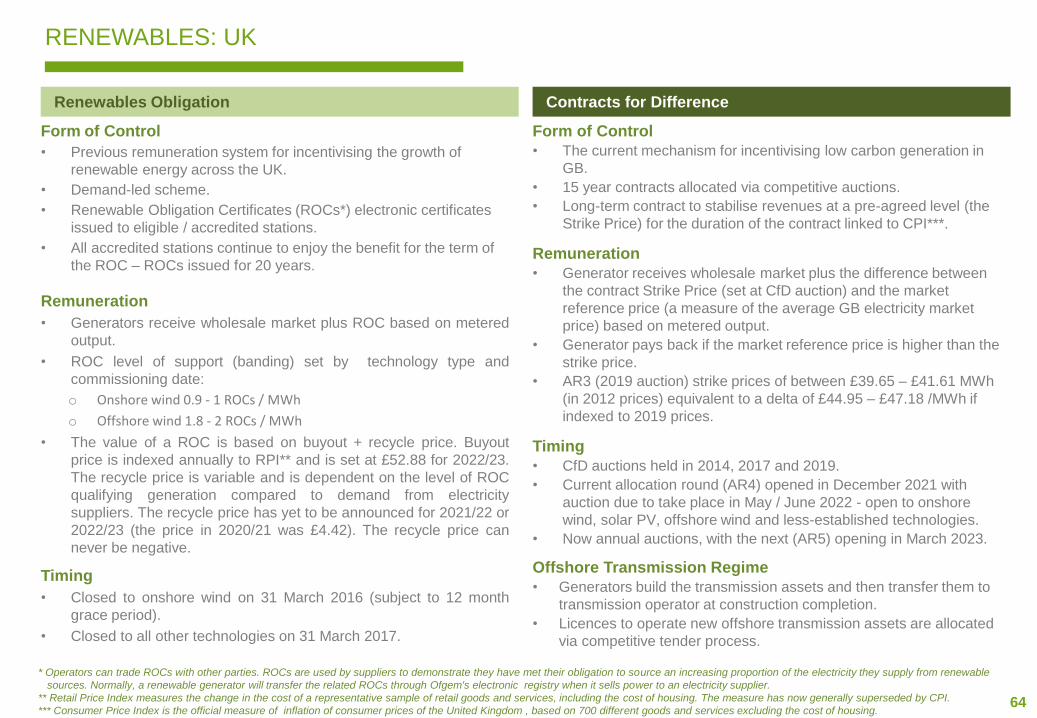
Form of Control
• Previous remuneration system for incentivising the growth of
renewable energy across the UK.
• Demand-led scheme.
• Renewable Obligation Certificates (ROCs*) electronic certificates
issued to eligible / accredited stations.
• All accredited stations continue to enjoy the benefit for the term of
the ROC – ROCs issued for 20 years.
Remuneration
• Generators receive wholesale market plus ROC based on metered
output.
• ROC level of support (banding) set by technology type and
commissioning date:
o Onshore wind 0.9 - 1 ROCs / MWh
o Offshore wind 1.8 - 2 ROCs / MWh
• The value of a ROC is based on buyout + recycle price. Buyout
price is indexed annually to RPI** and is set at £52.88 for 2022/23.
The recycle price is variable and is dependent on the level of ROC
qualifying generation compared to demand from electricity
suppliers. The recycle price has yet to be announced for 2021/22 or
2022/23 (the price in 2020/21 was £4.42). The recycle price can
never be negative.
Timing
• Closed to onshore wind on 31 March 2016 (subject to 12 month
grace period).
• Closed to all other technologies on 31 March 2017.
Form of Control
• The current mechanism for incentivising low carbon generation in
GB.
• 15 year contracts allocated via competitive auctions.
• Long-term contract to stabilise revenues at a pre-agreed level (the
Strike Price) for the duration of the contract linked to CPI***.
Remuneration
• Generator receives wholesale market plus the difference between
the contract Strike Price (set at CfD auction) and the market
reference price (a measure of the average GB electricity market
price) based on metered output.
• Generator pays back if the market reference price is higher than the
strike price.
• AR3 (2019 auction) strike prices of between £39.65 – £41.61 MWh
(in 2012 prices) equivalent to a delta of £44.95 – £47.18 /MWh if
indexed to 2019 prices.
Timing
• CfD auctions held in 2014, 2017 and 2019.
• Current allocation round (AR4) opened in December 2021 with
auction due to take place in May / June 2022 - open to onshore
wind, solar PV, offshore wind and less-established technologies.
• Now annual auctions, with the next (AR5) opening in March 2023.
Offshore Transmission Regime
• Generators build the transmission assets and then transfer them to
transmission operator at construction completion.
• Licences to operate new offshore transmission assets are allocated
via competitive tender process.
Renewables Obligation Contracts for Difference
* Operators can trade ROCs with other parties. ROCs are used by suppliers to demonstrate they have met their obligation to source an increasing proportion of the electricity they supply from renewable
sources. Normally, a renewable generator will transfer the related ROCs through Ofgem's electronic registry when it sells power to an electricity supplier.
** Retail Price Index measures the change in the cost of a representative sample of retail goods and services, including the cost of housing. The measure has now generally superseded by CPI.
*** Consumer Price Index is the official measure of inflation of consumer prices of the United Kingdom , based on 700 different goods and services excluding the cost of housing.
RENEWABLES: UK

65
RENEWABLES: UK
Form of Control
• National Grid Electricity System Operator (NGESO) is the System Operator (SO) for the electricity transmission network in Great Britain. It
is responsible (overseen by the regulator, Ofgem) for the day to day operation of the system, including system stability and balancing.
• The UK power markets are bilaterally traded markets. If a market participant generates or consumes more or less electricity than they
have contracted for, they are exposed to the imbalance price, or ‘cash-out’, for the difference.
Renewables Participate in the Following Mechanisms to Manage Grid Stability and Security of Supply
• Balancing Market: Market participants can provide offers and bids to the SO to help balance the system at very short notice. The
balancing market is settled on a pay-as-bid basis.
• Ancillary Service Markets: Ancillary services are competitively tendered by the SO to support the continuous stable flow of electricity.
The SO will contract a variety of services that are required to maintain grid stability and security, including fast frequency response, short
term operating reserve and black start.
• Capacity Market: The Capacity Market is a market-wide pay-as-clear (£/kW/year) capacity auction. Auctions are held ahead of delivery
(T-1 years and T-4 years) to procure sufficient capacity (interconnection, demand side response, generation) to meet a reliability standard
of 3 hrs loss of load expectation per year. For the T-4 auctions only, the clearing price is adjusted annually for CPI until the delivery year.
The target volume procured for the T-1 auction held in February 2022 was 5.361GW (delivery year 2022/23) and cleared at £75/kW/year.
The target volume procured for the T-4 auction also held in February 2022 was 42.1GW (delivery year 2025/26) and cleared at
£30.39/kW/year.
• The cost of carbon impacts on wholesale price of energy and therefore the achieved price of the renewables assets that receive
Renewable Obligation Certificates.
• With effect from 1 January 2021, the UK Emissions Trading Scheme (“UK ETS”) replaced the UK's participation in the equivalent EU
Emissions Trading Scheme (“EU ETS”).
• The cap for Phase 1 of the UK ETS was initially set at 5% below the UK’s expected notional share of the EU ETS cap for Phase IV of the
EU ETS (2021-2030). Over time, the cap will be reduced so the total emissions from each industry will fall.
• Participants buy and sell emissions allowances through auctions or secondary markets. The first auction was held on 19 May 2021 and
has since traded at an average of £52.7/tCO2.
Electricity System Operation
Cost of Carbon
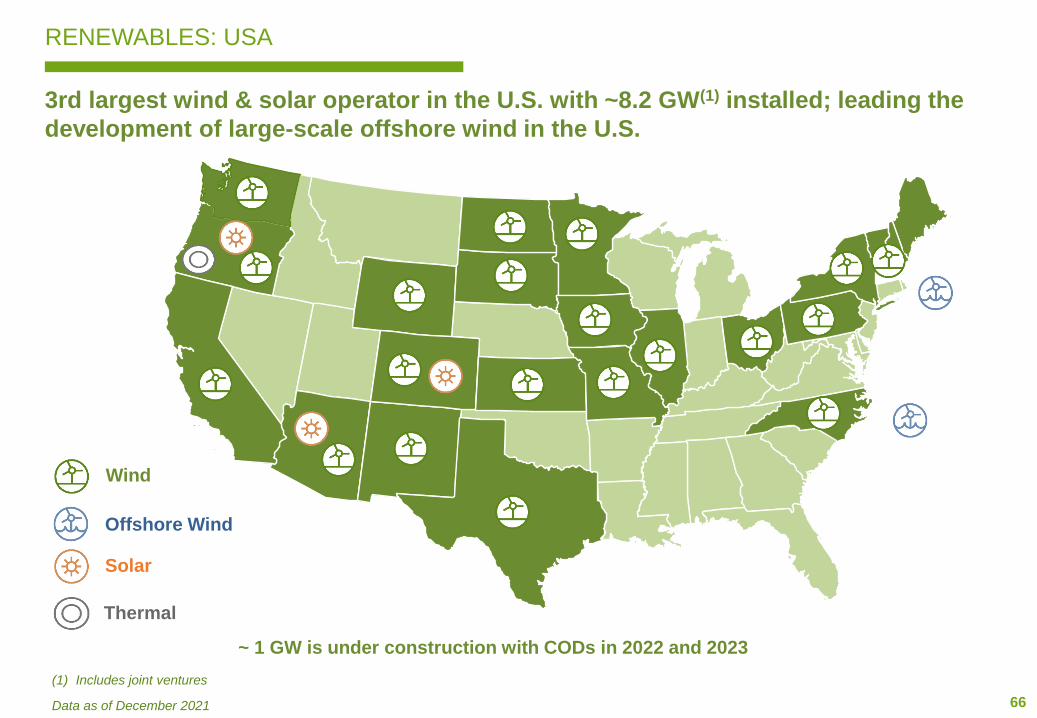
66
RENEWABLES: USA
3rd largest wind & solar operator in the U.S. with ~8.2 GW(1) installed; leading the
development of large-scale offshore wind in the U.S.
(1) Includes joint ventures
Data as of December 2021
Wind
Solar
Thermal
Offshore Wind
~ 1 GW is under construction with CODs in 2022 and 2023
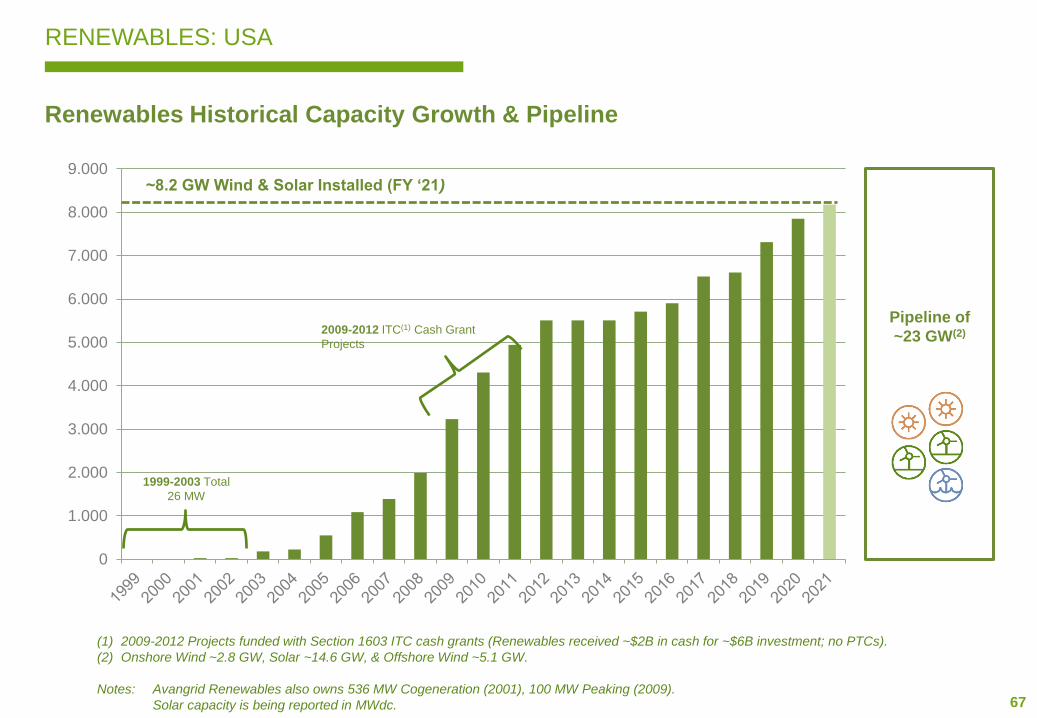
67
RENEWABLES: USA
Renewables Historical Capacity Growth & Pipeline
(1) 2009-2012 Projects funded with Section 1603 ITC cash grants (Renewables received ~$2B in cash for ~$6B investment; no PTCs).
(2) Onshore Wind ~2.8 GW, Solar ~14.6 GW, & Offshore Wind ~5.1 GW.
Notes: Avangrid Renewables also owns 536 MW Cogeneration (2001), 100 MW Peaking (2009).
Solar capacity is being reported in MWdc.
0
1.000
2.000
3.000
4.000
5.000
6.000
7.000
8.000
9.000
2009-2012 ITC(1) Cash Grant
Projects
1999-2003 Total
26 MW
~8.2 GW Wind & Solar Installed (FY ‘21)
Pipeline of
~23 GW(2)
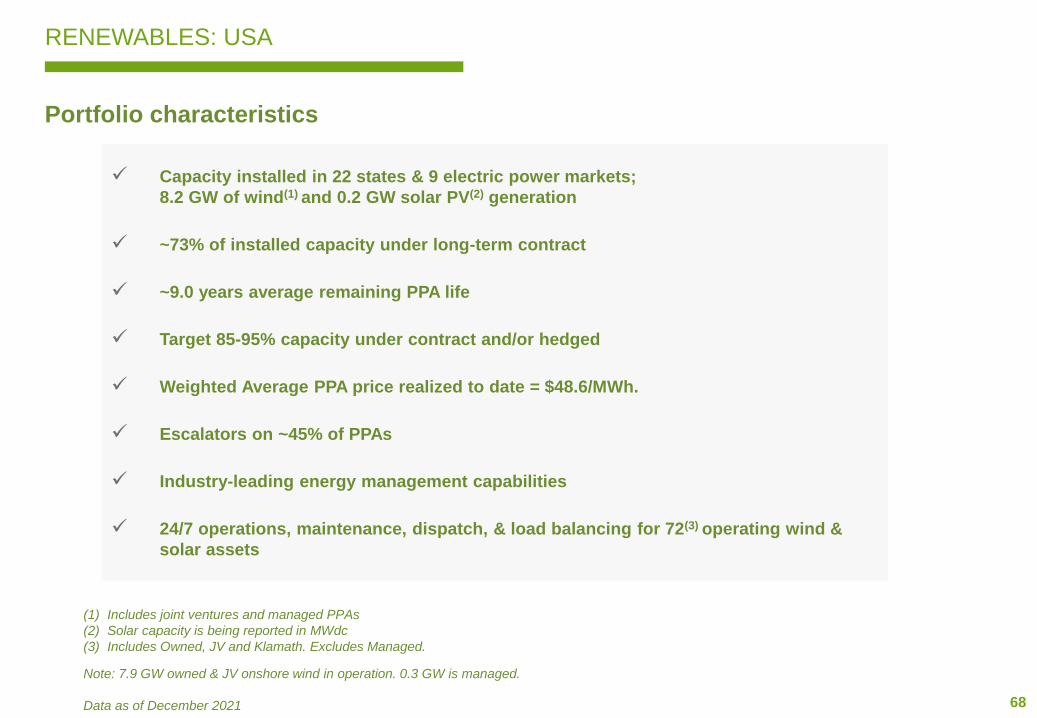
68
RENEWABLES: USA
Portfolio characteristics
(1) Includes joint ventures and managed PPAs
(2) Solar capacity is being reported in MWdc
(3) Includes Owned, JV and Klamath. Excludes Managed.
Note: 7.9 GW owned & JV onshore wind in operation. 0.3 GW is managed.
Data as of December 2021
✓ Capacity installed in 22 states & 9 electric power markets;
8.2 GW of wind(1) and 0.2 GW solar PV(2) generation
✓ ~73% of installed capacity under long-term contract
✓ ~9.0 years average remaining PPA life
✓ Target 85-95% capacity under contract and/or hedged
✓ Weighted Average PPA price realized to date = $48.6/MWh.
✓ Escalators on ~45% of PPAs
✓ Industry-leading energy management capabilities
✓ 24/7 operations, maintenance, dispatch, & load balancing for 72(3) operating wind &
solar assets
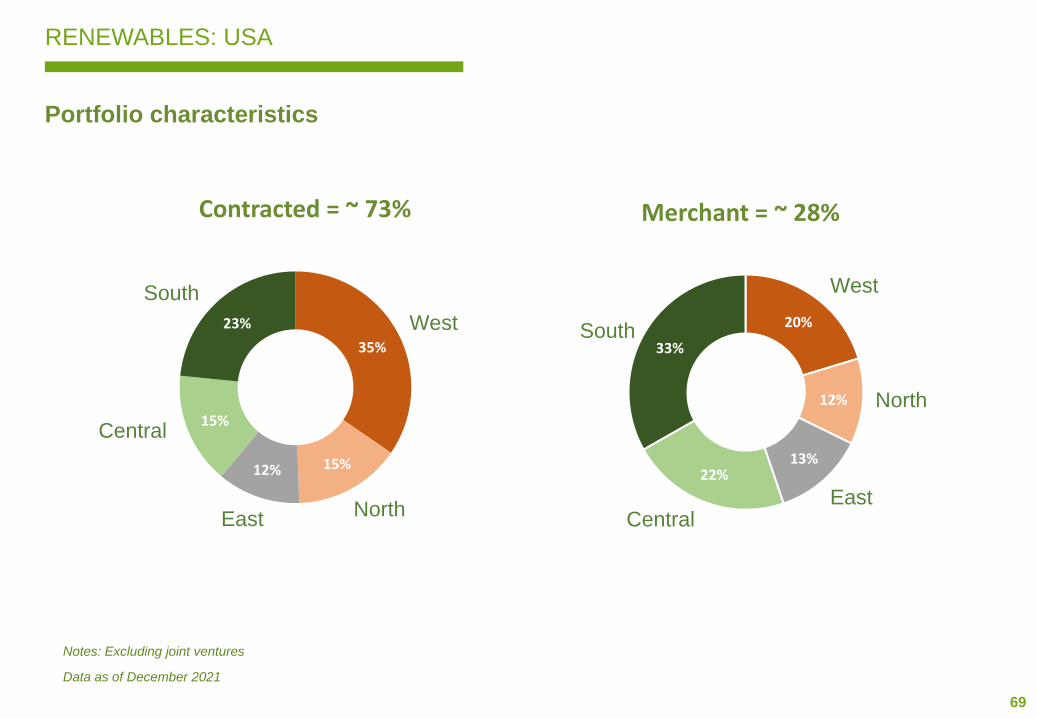
69
RENEWABLES: USA
Portfolio characteristics
Notes: Excluding joint ventures
Data as of December 2021
35%
15%12%
15%
23%
Contracted = ~ 73%
West
NorthEast
Central
South
20%
12%
13%22%
33%
Merchant = ~ 28%
West
North
EastCentral
South
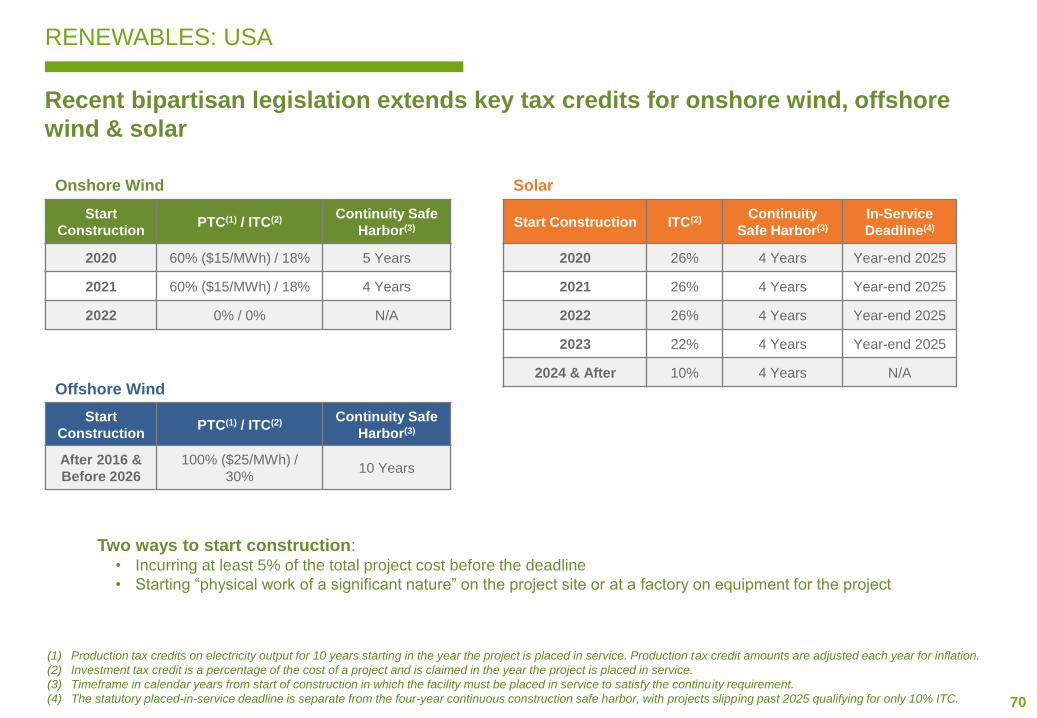
70
RENEWABLES: USA
Recent bipartisan legislation extends key tax credits for onshore wind, offshore
wind & solar
Two ways to start construction:• Incurring at least 5% of the total project cost before the deadline
• Starting “physical work of a significant nature” on the project site or at a factory on equipment for the project
(1) Production tax credits on electricity output for 10 years starting in the year the project is placed in service. Production tax credit amounts are adjusted each year for inflation.
(2) Investment tax credit is a percentage of the cost of a project and is claimed in the year the project is placed in service.
(3) Timeframe in calendar years from start of construction in which the facility must be placed in service to satisfy the continuity requirement.
(4) The statutory placed-in-service deadline is separate from the four-year continuous construction safe harbor, with projects slipping past 2025 qualifying for only 10% ITC.
Start
ConstructionPTC(1) / ITC(2) Continuity Safe
Harbor(3)
2020 60% ($15/MWh) / 18% 5 Years
2021 60% ($15/MWh) / 18% 4 Years
2022 0% / 0% N/A
Onshore Wind
Start Construction ITC(2) Continuity
Safe Harbor(3)
In-Service
Deadline(4)
2020 26% 4 Years Year-end 2025
2021 26% 4 Years Year-end 2025
2022 26% 4 Years Year-end 2025
2023 22% 4 Years Year-end 2025
2024 & After 10% 4 Years N/A
Solar
Start
ConstructionPTC(1) / ITC(2) Continuity Safe
Harbor(3)
After 2016 &
Before 2026
100% ($25/MWh) /
30%10 Years
Offshore Wind
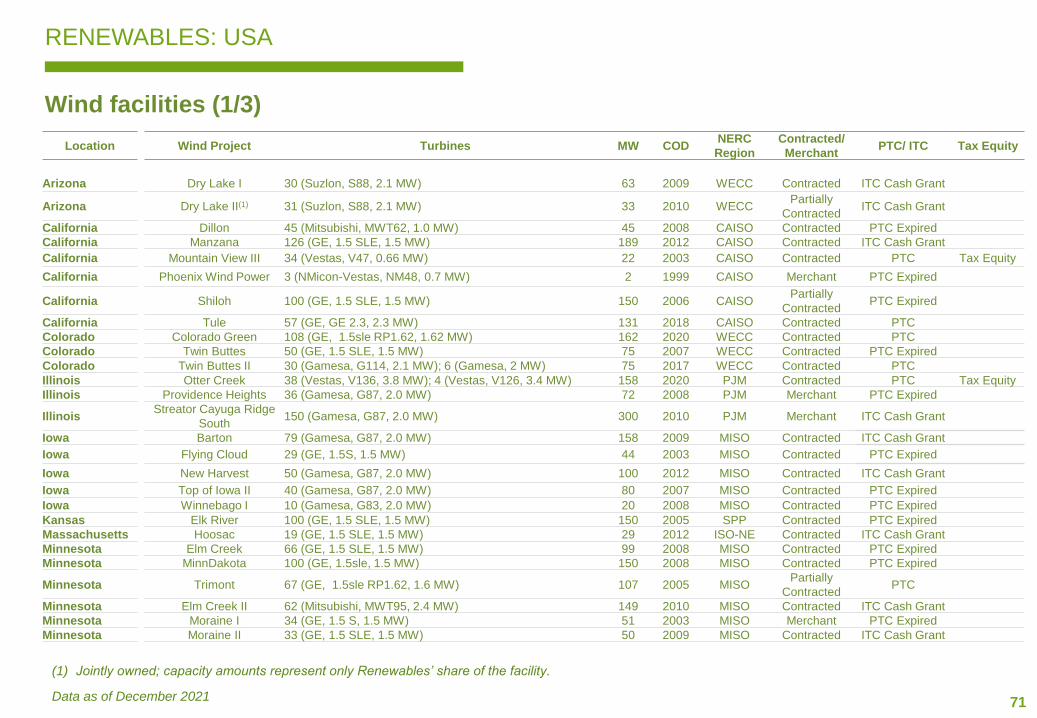
71
RENEWABLES: USA
Wind facilities (1/3)
(1) Jointly owned; capacity amounts represent only Renewables’ share of the facility.
Data as of December 2021
Location Wind Project Turbines MW CODNERC
Region
Contracted/
MerchantPTC/ ITC Tax Equity
Arizona Dry Lake I 30 (Suzlon, S88, 2.1 MW) 63 2009 WECC Contracted ITC Cash Grant
Arizona Dry Lake II(1) 31 (Suzlon, S88, 2.1 MW) 33 2010 WECCPartially
ContractedITC Cash Grant
California Dillon 45 (Mitsubishi, MWT62, 1.0 MW) 45 2008 CAISO Contracted PTC Expired
California Manzana 126 (GE, 1.5 SLE, 1.5 MW) 189 2012 CAISO Contracted ITC Cash Grant
California Mountain View III 34 (Vestas, V47, 0.66 MW) 22 2003 CAISO Contracted PTC Tax Equity
California Phoenix Wind Power 3 (NMicon-Vestas, NM48, 0.7 MW) 2 1999 CAISO Merchant PTC Expired
California Shiloh 100 (GE, 1.5 SLE, 1.5 MW) 150 2006 CAISOPartially
ContractedPTC Expired
California Tule 57 (GE, GE 2.3, 2.3 MW) 131 2018 CAISO Contracted PTC
Colorado Colorado Green 108 (GE, 1.5sle RP1.62, 1.62 MW) 162 2020 WECC Contracted PTC
Colorado Twin Buttes 50 (GE, 1.5 SLE, 1.5 MW) 75 2007 WECC Contracted PTC Expired
Colorado Twin Buttes II 30 (Gamesa, G114, 2.1 MW); 6 (Gamesa, 2 MW) 75 2017 WECC Contracted PTC
Illinois Otter Creek 38 (Vestas, V136, 3.8 MW); 4 (Vestas, V126, 3.4 MW) 158 2020 PJM Contracted PTC Tax Equity
Illinois Providence Heights 36 (Gamesa, G87, 2.0 MW) 72 2008 PJM Merchant PTC Expired
IllinoisStreator Cayuga Ridge
South150 (Gamesa, G87, 2.0 MW) 300 2010 PJM Merchant ITC Cash Grant
Iowa Barton 79 (Gamesa, G87, 2.0 MW) 158 2009 MISO Contracted ITC Cash Grant
Iowa Flying Cloud 29 (GE, 1.5S, 1.5 MW) 44 2003 MISO Contracted PTC Expired
Iowa New Harvest 50 (Gamesa, G87, 2.0 MW) 100 2012 MISO Contracted ITC Cash Grant
Iowa Top of Iowa II 40 (Gamesa, G87, 2.0 MW) 80 2007 MISO Contracted PTC Expired
Iowa Winnebago I 10 (Gamesa, G83, 2.0 MW) 20 2008 MISO Contracted PTC Expired
Kansas Elk River 100 (GE, 1.5 SLE, 1.5 MW) 150 2005 SPP Contracted PTC Expired
Massachusetts Hoosac 19 (GE, 1.5 SLE, 1.5 MW) 29 2012 ISO-NE Contracted ITC Cash Grant
Minnesota Elm Creek 66 (GE, 1.5 SLE, 1.5 MW) 99 2008 MISO Contracted PTC Expired
Minnesota MinnDakota 100 (GE, 1.5sle, 1.5 MW) 150 2008 MISO Contracted PTC Expired
Minnesota Trimont 67 (GE, 1.5sle RP1.62, 1.6 MW) 107 2005 MISOPartially
ContractedPTC
Minnesota Elm Creek II 62 (Mitsubishi, MWT95, 2.4 MW) 149 2010 MISO Contracted ITC Cash Grant
Minnesota Moraine I 34 (GE, 1.5 S, 1.5 MW) 51 2003 MISO Merchant PTC Expired
Minnesota Moraine II 33 (GE, 1.5 SLE, 1.5 MW) 50 2009 MISO Contracted ITC Cash Grant
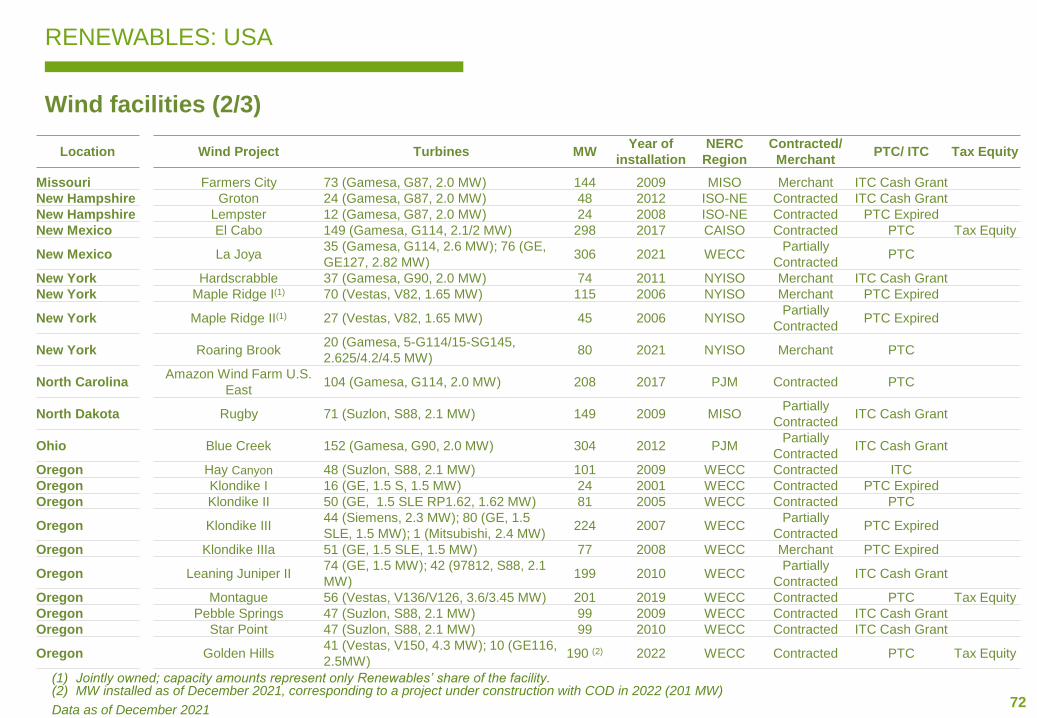
72
RENEWABLES: USA
Wind facilities (2/3)
Location Wind Project Turbines MWYear of
installation
NERC
Region
Contracted/
MerchantPTC/ ITC Tax Equity
Missouri Farmers City 73 (Gamesa, G87, 2.0 MW) 144 2009 MISO Merchant ITC Cash Grant
New Hampshire Groton 24 (Gamesa, G87, 2.0 MW) 48 2012 ISO-NE Contracted ITC Cash Grant
New Hampshire Lempster 12 (Gamesa, G87, 2.0 MW) 24 2008 ISO-NE Contracted PTC Expired
New Mexico El Cabo 149 (Gamesa, G114, 2.1/2 MW) 298 2017 CAISO Contracted PTC Tax Equity
New Mexico La Joya35 (Gamesa, G114, 2.6 MW); 76 (GE,
GE127, 2.82 MW)306 2021 WECC
Partially
ContractedPTC
New York Hardscrabble 37 (Gamesa, G90, 2.0 MW) 74 2011 NYISO Merchant ITC Cash Grant
New York Maple Ridge I(1) 70 (Vestas, V82, 1.65 MW) 115 2006 NYISO Merchant PTC Expired
New York Maple Ridge II(1) 27 (Vestas, V82, 1.65 MW) 45 2006 NYISOPartially
ContractedPTC Expired
New York Roaring Brook20 (Gamesa, 5-G114/15-SG145,
2.625/4.2/4.5 MW)80 2021 NYISO Merchant PTC
North CarolinaAmazon Wind Farm U.S.
East104 (Gamesa, G114, 2.0 MW) 208 2017 PJM Contracted PTC
North Dakota Rugby 71 (Suzlon, S88, 2.1 MW) 149 2009 MISOPartially
ContractedITC Cash Grant
Ohio Blue Creek 152 (Gamesa, G90, 2.0 MW) 304 2012 PJMPartially
ContractedITC Cash Grant
Oregon Hay Canyon 48 (Suzlon, S88, 2.1 MW) 101 2009 WECC Contracted ITC
Oregon Klondike I 16 (GE, 1.5 S, 1.5 MW) 24 2001 WECC Contracted PTC Expired
Oregon Klondike II 50 (GE, 1.5 SLE RP1.62, 1.62 MW) 81 2005 WECC Contracted PTC
Oregon Klondike III44 (Siemens, 2.3 MW); 80 (GE, 1.5
SLE, 1.5 MW); 1 (Mitsubishi, 2.4 MW)224 2007 WECC
Partially
ContractedPTC Expired
Oregon Klondike IIIa 51 (GE, 1.5 SLE, 1.5 MW) 77 2008 WECC Merchant PTC Expired
Oregon Leaning Juniper II74 (GE, 1.5 MW); 42 (97812, S88, 2.1
MW)199 2010 WECC
Partially
ContractedITC Cash Grant
Oregon Montague 56 (Vestas, V136/V126, 3.6/3.45 MW) 201 2019 WECC Contracted PTC Tax Equity
Oregon Pebble Springs 47 (Suzlon, S88, 2.1 MW) 99 2009 WECC Contracted ITC Cash Grant
Oregon Star Point 47 (Suzlon, S88, 2.1 MW) 99 2010 WECC Contracted ITC Cash Grant
Oregon Golden Hills41 (Vestas, V150, 4.3 MW); 10 (GE116,
2.5MW)190 (2) 2022 WECC Contracted PTC Tax Equity
(1) Jointly owned; capacity amounts represent only Renewables’ share of the facility.(2) MW installed as of December 2021, corresponding to a project under construction with COD in 2022 (201 MW)
Data as of December 2021
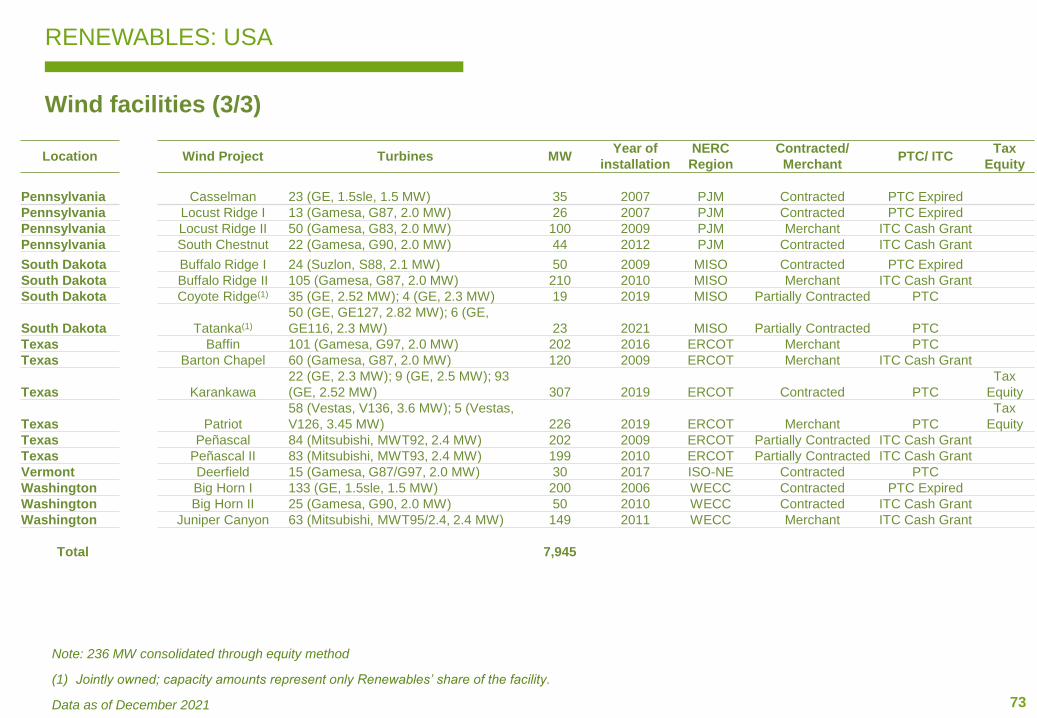
73
RENEWABLES: USA
Wind facilities (3/3)
Location Wind Project Turbines MWYear of
installation
NERC
Region
Contracted/
MerchantPTC/ ITC
Tax
Equity
Pennsylvania Casselman 23 (GE, 1.5sle, 1.5 MW) 35 2007 PJM Contracted PTC Expired
Pennsylvania Locust Ridge I 13 (Gamesa, G87, 2.0 MW) 26 2007 PJM Contracted PTC Expired
Pennsylvania Locust Ridge II 50 (Gamesa, G83, 2.0 MW) 100 2009 PJM Merchant ITC Cash Grant
Pennsylvania South Chestnut 22 (Gamesa, G90, 2.0 MW) 44 2012 PJM Contracted ITC Cash Grant
South Dakota Buffalo Ridge I 24 (Suzlon, S88, 2.1 MW) 50 2009 MISO Contracted PTC Expired
South Dakota Buffalo Ridge II 105 (Gamesa, G87, 2.0 MW) 210 2010 MISO Merchant ITC Cash Grant
South Dakota Coyote Ridge(1) 35 (GE, 2.52 MW); 4 (GE, 2.3 MW) 19 2019 MISO Partially Contracted PTC
South Dakota Tatanka(1)
50 (GE, GE127, 2.82 MW); 6 (GE,
GE116, 2.3 MW) 23 2021 MISO Partially Contracted PTC
Texas Baffin 101 (Gamesa, G97, 2.0 MW) 202 2016 ERCOT Merchant PTC
Texas Barton Chapel 60 (Gamesa, G87, 2.0 MW) 120 2009 ERCOT Merchant ITC Cash Grant
Texas Karankawa
22 (GE, 2.3 MW); 9 (GE, 2.5 MW); 93
(GE, 2.52 MW) 307 2019 ERCOT Contracted PTC
Tax
Equity
Texas Patriot
58 (Vestas, V136, 3.6 MW); 5 (Vestas,
V126, 3.45 MW) 226 2019 ERCOT Merchant PTC
Tax
Equity
Texas Peñascal 84 (Mitsubishi, MWT92, 2.4 MW) 202 2009 ERCOT Partially Contracted ITC Cash Grant
Texas Peñascal II 83 (Mitsubishi, MWT93, 2.4 MW) 199 2010 ERCOT Partially Contracted ITC Cash Grant
Vermont Deerfield 15 (Gamesa, G87/G97, 2.0 MW) 30 2017 ISO-NE Contracted PTC
Washington Big Horn I 133 (GE, 1.5sle, 1.5 MW) 200 2006 WECC Contracted PTC Expired
Washington Big Horn II 25 (Gamesa, G90, 2.0 MW) 50 2010 WECC Contracted ITC Cash Grant
Washington Juniper Canyon 63 (Mitsubishi, MWT95/2.4, 2.4 MW) 149 2011 WECC Merchant ITC Cash Grant
Total 7,945
Note: 236 MW consolidated through equity method
(1) Jointly owned; capacity amounts represent only Renewables’ share of the facility.
Data as of December 2021
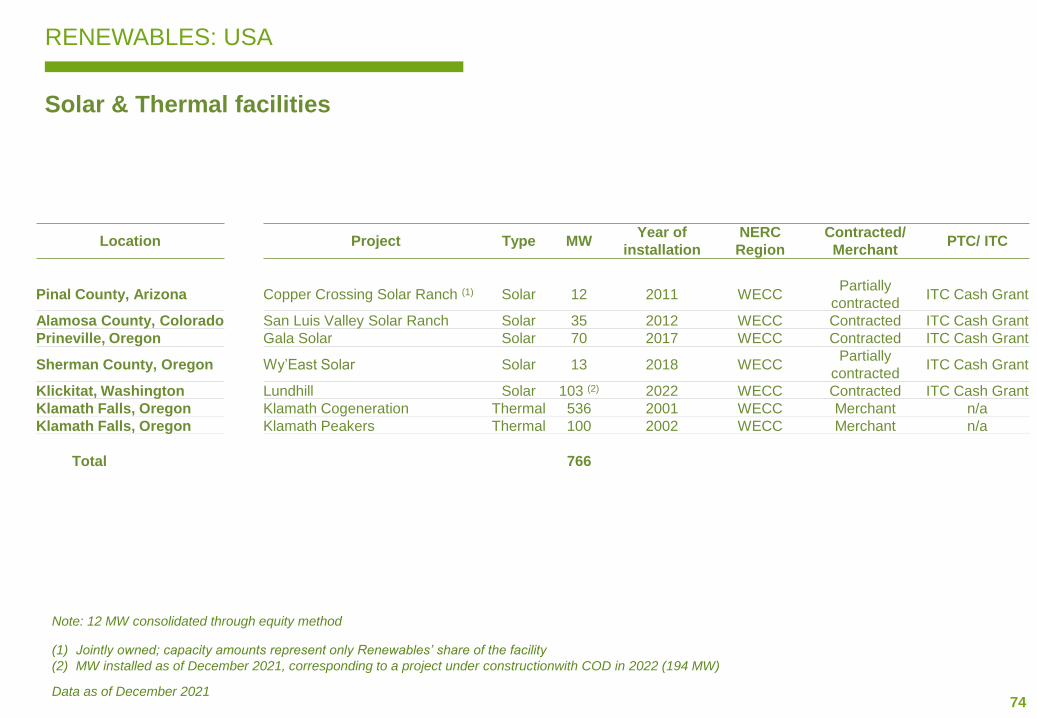
74
RENEWABLES: USA
Solar & Thermal facilities
Location Project Type MWYear of
installation
NERC
Region
Contracted/
MerchantPTC/ ITC
Pinal County, Arizona Copper Crossing Solar Ranch (1) Solar 12 2011 WECCPartially
contractedITC Cash Grant
Alamosa County, Colorado San Luis Valley Solar Ranch Solar 35 2012 WECC Contracted ITC Cash Grant
Prineville, Oregon Gala Solar Solar 70 2017 WECC Contracted ITC Cash Grant
Sherman County, Oregon Wy’East Solar Solar 13 2018 WECCPartially
contractedITC Cash Grant
Klickitat, Washington Lundhill Solar 103 (2) 2022 WECC Contracted ITC Cash Grant
Klamath Falls, Oregon Klamath Cogeneration Thermal 536 2001 WECC Merchant n/a
Klamath Falls, Oregon Klamath Peakers Thermal 100 2002 WECC Merchant n/a
Total 766
Note: 12 MW consolidated through equity method
(1) Jointly owned; capacity amounts represent only Renewables’ share of the facility
(2) MW installed as of December 2021, corresponding to a project under constructionwith COD in 2022 (194 MW)
Data as of December 2021
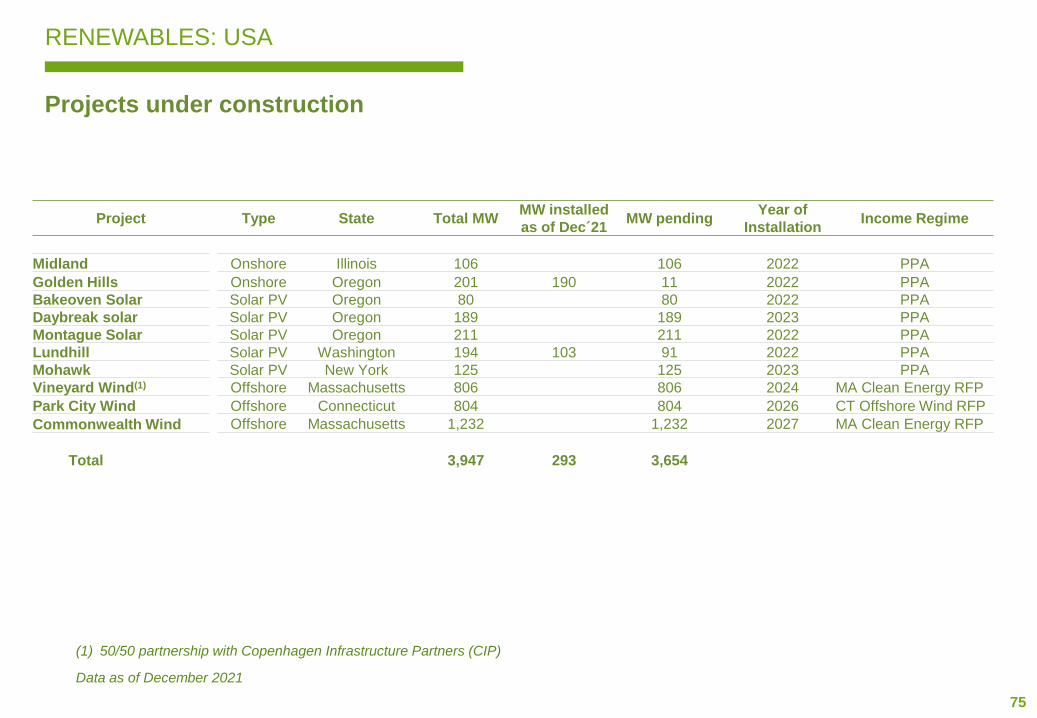
75
RENEWABLES: USA
Projects under construction
(1) 50/50 partnership with Copenhagen Infrastructure Partners (CIP)
Data as of December 2021
Project Type State Total MWMW installed
as of Dec´21MW pending
Year of
InstallationIncome Regime
Midland Onshore Illinois 106 106 2022 PPA
Golden Hills Onshore Oregon 201 190 11 2022 PPA
Bakeoven Solar Solar PV Oregon 80 80 2022 PPA
Daybreak solar Solar PV Oregon 189 189 2023 PPA
Montague Solar Solar PV Oregon 211 211 2022 PPA
Lundhill Solar PV Washington 194 103 91 2022 PPA
Mohawk Solar PV New York 125 125 2023 PPA
Vineyard Wind(1) Offshore Massachusetts 806 806 2024 MA Clean Energy RFP
Park City Wind Offshore Connecticut 804 804 2026 CT Offshore Wind RFP
Commonwealth Wind Offshore Massachusetts 1,232 1,232 2027 MA Clean Energy RFP
Total 3,947 293 3,654
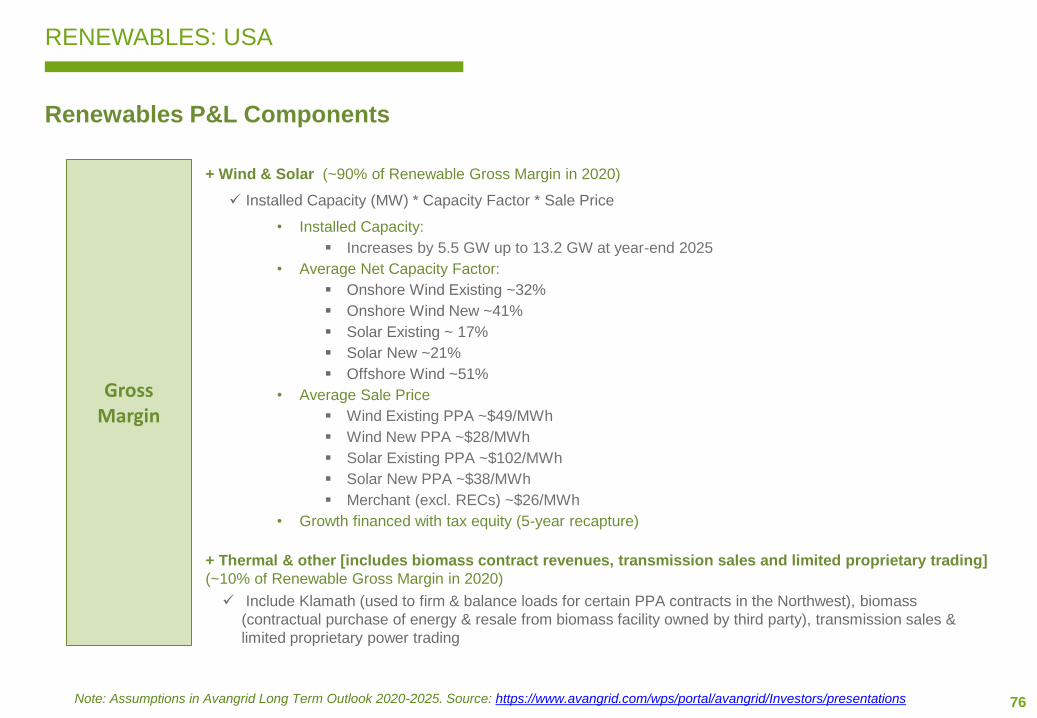
76
RENEWABLES: USA
Renewables P&L Components
Gross Margin
Note: Assumptions in Avangrid Long Term Outlook 2020-2025. Source: https://www.avangrid.com/wps/portal/avangrid/Investors/presentations
+ Wind & Solar (~90% of Renewable Gross Margin in 2020)
✓ Installed Capacity (MW) * Capacity Factor * Sale Price
• Installed Capacity:
▪ Increases by 5.5 GW up to 13.2 GW at year-end 2025
• Average Net Capacity Factor:
▪ Onshore Wind Existing ~32%
▪ Onshore Wind New ~41%
▪ Solar Existing ~ 17%
▪ Solar New ~21%
▪ Offshore Wind ~51%
• Average Sale Price
▪ Wind Existing PPA ~$49/MWh
▪ Wind New PPA ~$28/MWh
▪ Solar Existing PPA ~$102/MWh
▪ Solar New PPA ~$38/MWh
▪ Merchant (excl. RECs) ~$26/MWh
• Growth financed with tax equity (5-year recapture)
+ Thermal & other [includes biomass contract revenues, transmission sales and limited proprietary trading]
(~10% of Renewable Gross Margin in 2020)
✓ Include Klamath (used to firm & balance loads for certain PPA contracts in the Northwest), biomass
(contractual purchase of energy & resale from biomass facility owned by third party), transmission sales &
limited proprietary power trading
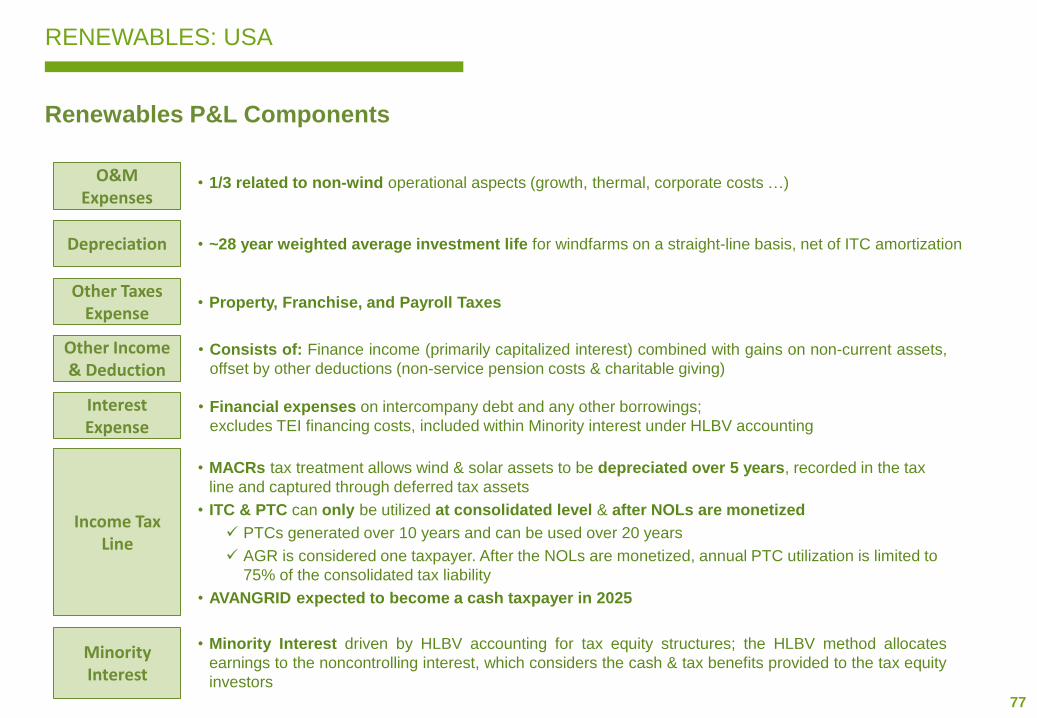
77
RENEWABLES: USA
Renewables P&L Components
Depreciation
Other Taxes Expense
Minority Interest
• ~28 year weighted average investment life for windfarms on a straight-line basis, net of ITC amortization
• Property, Franchise, and Payroll Taxes
• Minority Interest driven by HLBV accounting for tax equity structures; the HLBV method allocates
earnings to the noncontrolling interest, which considers the cash & tax benefits provided to the tax equity
investors
Income Tax Line
• MACRs tax treatment allows wind & solar assets to be depreciated over 5 years, recorded in the tax
line and captured through deferred tax assets
• ITC & PTC can only be utilized at consolidated level & after NOLs are monetized
✓ PTCs generated over 10 years and can be used over 20 years
✓ AGR is considered one taxpayer. After the NOLs are monetized, annual PTC utilization is limited to
75% of the consolidated tax liability
• AVANGRID expected to become a cash taxpayer in 2025
O&M Expenses
• 1/3 related to non-wind operational aspects (growth, thermal, corporate costs …)
Other Income & Deduction
• Consists of: Finance income (primarily capitalized interest) combined with gains on non-current assets,
offset by other deductions (non-service pension costs & charitable giving)
Interest Expense
• Financial expenses on intercompany debt and any other borrowings;
excludes TEI financing costs, included within Minority interest under HLBV accounting
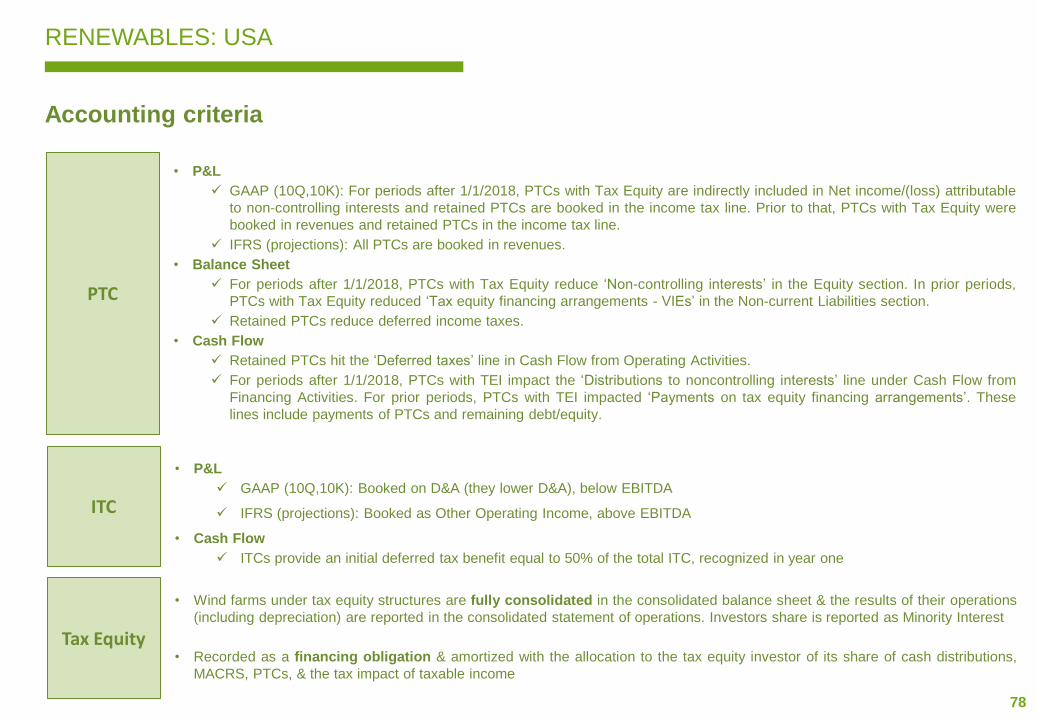
78
RENEWABLES: USA
Accounting criteria
• P&L
✓ GAAP (10Q,10K): For periods after 1/1/2018, PTCs with Tax Equity are indirectly included in Net income/(loss) attributable
to non-controlling interests and retained PTCs are booked in the income tax line. Prior to that, PTCs with Tax Equity were
booked in revenues and retained PTCs in the income tax line.
✓ IFRS (projections): All PTCs are booked in revenues.
• Balance Sheet
✓ For periods after 1/1/2018, PTCs with Tax Equity reduce ‘Non-controlling interests’ in the Equity section. In prior periods,
PTCs with Tax Equity reduced ‘Tax equity financing arrangements - VIEs’ in the Non-current Liabilities section.
✓ Retained PTCs reduce deferred income taxes.
• Cash Flow
✓ Retained PTCs hit the ‘Deferred taxes’ line in Cash Flow from Operating Activities.
✓ For periods after 1/1/2018, PTCs with TEI impact the ‘Distributions to noncontrolling interests’ line under Cash Flow from
Financing Activities. For prior periods, PTCs with TEI impacted ‘Payments on tax equity financing arrangements’. These
lines include payments of PTCs and remaining debt/equity.
PTC
• P&L
✓ GAAP (10Q,10K): Booked on D&A (they lower D&A), below EBITDA
✓ IFRS (projections): Booked as Other Operating Income, above EBITDA
• Cash Flow
✓ ITCs provide an initial deferred tax benefit equal to 50% of the total ITC, recognized in year one
ITC
• Wind farms under tax equity structures are fully consolidated in the consolidated balance sheet & the results of their operations
(including depreciation) are reported in the consolidated statement of operations. Investors share is reported as Minority Interest
• Recorded as a financing obligation & amortized with the allocation to the tax equity investor of its share of cash distributions,
MACRS, PTCs, & the tax impact of taxable income
Tax Equity

79
RENEWABLES: MEXICO
Facilities
(1) Including capacity for third parties of 103 MW
Data as of December 2021
Onshore(1) State MW Year of Installation Income Regime
La Ventosa Oaxaca 80 2008 Commercial PPA (Self-supply)
Bee Ni Stipa Oaxaca 26 2010 Commercial PPA (Self-supply)
La Venta III Oaxaca 103 2011 PPA (Independent Power Producer)
La Ventosa (ampliación) Oaxaca 22 2013 Commercial PPA (Self-supply)
Dos Arbolitos Oaxaca 70 2015 Commercial PPA (Self-supply)
Pier II Puebla 66 2015 Commercial PPA (Self-supply)
Santiago Eólico Guanajuato 105 2021 Commercial PPA (Self-supply)
Pier Puebla 221 2021 Commercial PPA (Self-supply)
Total 693
Solar PV State MW Year of Installation Income Regime
Santiago San Luis de Potosí 232 2018 Commercial PPA
Hermosillo Sonora 137 2018 Commercial PPA
Cuyoaco Puebla 274 2020 Commercial PPA
Total 642

80
RENEWABLES: MEXICO
Applicable laws
Ley de Servicio Público de
Energía Eléctrica (LSPEE)
Regulatory bodies
Sustainability and
renewable generation
According to this law, reformed in 1992, private companies were allowed to participate in the
following ways:
• Independent Power Production (sale to CFE through PPAs)
• Small production, self-supply (autoabasto) and cogeneration (sale to private customers)
The Energy Regulatory Commission (CRE) is the authority that grants permits for electricity
generation.
The Law for the Use of Renewable Energies and the Financing of Energy Transition, which allows
the participation of renewables and efficient cogeneration through the mechanism of self-supply.
Generation Transmission Distribution Supply Users
CFE
Private Generators
Independent Energy Producer
Self Supply
Cogeneration
Exports
Imports
Vertically integrated entity
with public service monopoly
+
Private generation for self supply
or supply to CFE
Dispatch
Regulatory framework: before the Energy Reform of 2013
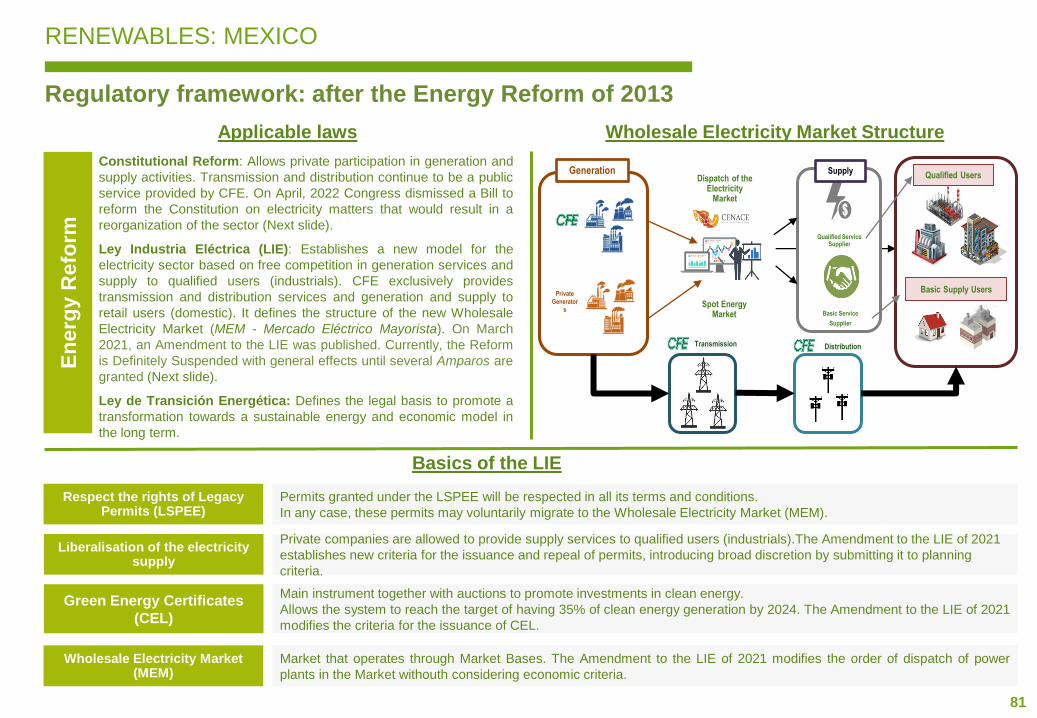
81
Liberalisation of the electricity supply
Private companies are allowed to provide supply services to qualified users (industrials).The Amendment to the LIE of 2021
establishes new criteria for the issuance and repeal of permits, introducing broad discretion by submitting it to planning
criteria.
Respect the rights of Legacy Permits (LSPEE)
Permits granted under the LSPEE will be respected in all its terms and conditions.
In any case, these permits may voluntarily migrate to the Wholesale Electricity Market (MEM).
Green Energy Certificates
(CEL)
Main instrument together with auctions to promote investments in clean energy.
Allows the system to reach the target of having 35% of clean energy generation by 2024. The Amendment to the LIE of 2021
modifies the criteria for the issuance of CEL.
Wholesale Electricity Market(MEM)
Market that operates through Market Bases. The Amendment to the LIE of 2021 modifies the order of dispatch of power
plants in the Market withouth considering economic criteria.
Basics of the LIE
Applicable laws Wholesale Electricity Market Structure
En
erg
yR
efo
rm
Constitutional Reform: Allows private participation in generation and
supply activities. Transmission and distribution continue to be a public
service provided by CFE. On April, 2022 Congress dismissed a Bill to
reform the Constitution on electricity matters that would result in a
reorganization of the sector (Next slide).
Ley Industria Eléctrica (LIE): Establishes a new model for the
electricity sector based on free competition in generation services and
supply to qualified users (industrials). CFE exclusively provides
transmission and distribution services and generation and supply to
retail users (domestic). It defines the structure of the new Wholesale
Electricity Market (MEM - Mercado Eléctrico Mayorista). On March
2021, an Amendment to the LIE was published. Currently, the Reform
is Definitely Suspended with general effects until several Amparos are
granted (Next slide).
Ley de Transición Energética: Defines the legal basis to promote a
transformation towards a sustainable energy and economic model in
the long term.
Private
Generator
s
Transmission Distribution
GenerationDispatch of the
Electricity Market
Basic Supply Users
Qualified UsersSupply
Qualified Service Supplier
Basic Service
Supplier
Spot Energy Market
Regulatory framework: after the Energy Reform of 2013
RENEWABLES: MEXICO
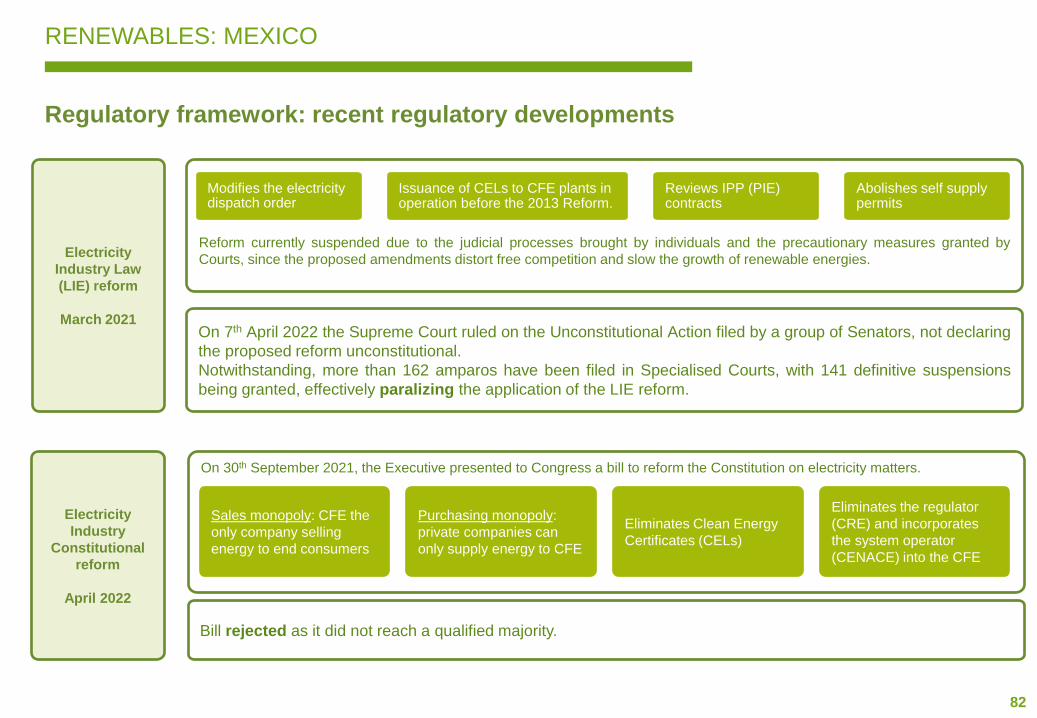
82
RENEWABLES: MEXICO
Regulatory framework: recent regulatory developments
Electricity
Industry
Constitutional
reform
April 2022
On 30th September 2021, the Executive presented to Congress a bill to reform the Constitution on electricity matters.
Electricity
Industry Law
(LIE) reform
March 2021
Reform currently suspended due to the judicial processes brought by individuals and the precautionary measures granted by
Courts, since the proposed amendments distort free competition and slow the growth of renewable energies.
On 7th April 2022 the Supreme Court ruled on the Unconstitutional Action filed by a group of Senators, not declaring
the proposed reform unconstitutional.
Notwithstanding, more than 162 amparos have been filed in Specialised Courts, with 141 definitive suspensions
being granted, effectively paralizing the application of the LIE reform.
Bill rejected as it did not reach a qualified majority.
Modifies the electricitydispatch order
Reviews IPP (PIE) contracts
Abolishes self supplypermits
Sales monopoly: CFE the
only company selling
energy to end consumers
Purchasing monopoly:
private companies can
only supply energy to CFE
Eliminates the regulator
(CRE) and incorporates
the system operator
(CENACE) into the CFE
Issuance of CELs to CFE plants in operation before the 2013 Reform.
Eliminates Clean Energy
Certificates (CELs)

83
RENEWABLES: MEXICO
Regulatory framework: recent regulatory developments
New
regulation for
the granting
of electricity
generation
permits
March 2022
Establishes new requirements for issuing permits:
Requires confidential
financial, corporate and
technical information
Limits obtaining new
permits to not being
previously fined.
Links interconnection
procedures with
obtaining the permit.
Establishes new
obligations on the
construction plan of
the plant.
Adds new barriers to permitting process, possibility to present an appeal (‘amparo’) in Courts to obtain
precautionary measures.
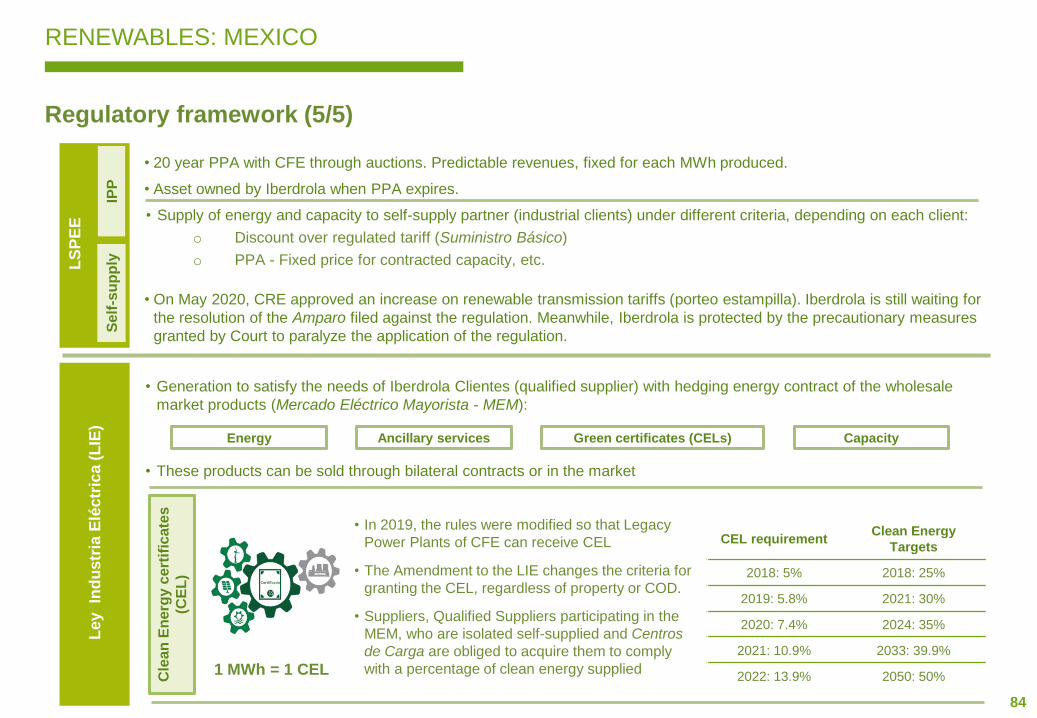
84
RENEWABLES: MEXICO
Regulatory framework (5/5)
• 20 year PPA with CFE through auctions. Predictable revenues, fixed for each MWh produced.
• Asset owned by Iberdrola when PPA expires.
LS
PE
E
IPP
Se
lf-s
up
ply
Le
y
Ind
us
tria
Elé
ctr
ica
(L
IE)
• Generation to satisfy the needs of Iberdrola Clientes (qualified supplier) with hedging energy contract of the wholesale
market products (Mercado Eléctrico Mayorista - MEM):
• These products can be sold through bilateral contracts or in the market
Energy Ancillary services CapacityGreen certificates (CELs)
• Supply of energy and capacity to self-supply partner (industrial clients) under different criteria, depending on each client:
o Discount over regulated tariff (Suministro Básico)
o PPA - Fixed price for contracted capacity, etc.
• In 2019, the rules were modified so that Legacy
Power Plants of CFE can receive CEL
• The Amendment to the LIE changes the criteria for
granting the CEL, regardless of property or COD.
• Suppliers, Qualified Suppliers participating in the
MEM, who are isolated self-supplied and Centros
de Carga are obliged to acquire them to comply
with a percentage of clean energy supplied1 MWh = 1 CEL
Cle
an
En
erg
ycert
ific
ate
s
(CE
L)
CEL requirementClean Energy
Targets
2018: 5% 2018: 25%
2019: 5.8% 2021: 30%
2020: 7.4% 2024: 35%
2021: 10.9% 2033: 39.9%
2022: 13.9% 2050: 50%
• On May 2020, CRE approved an increase on renewable transmission tariffs (porteo estampilla). Iberdrola is still waiting for
the resolution of the Amparo filed against the regulation. Meanwhile, Iberdrola is protected by the precautionary measures
granted by Court to paralyze the application of the regulation.
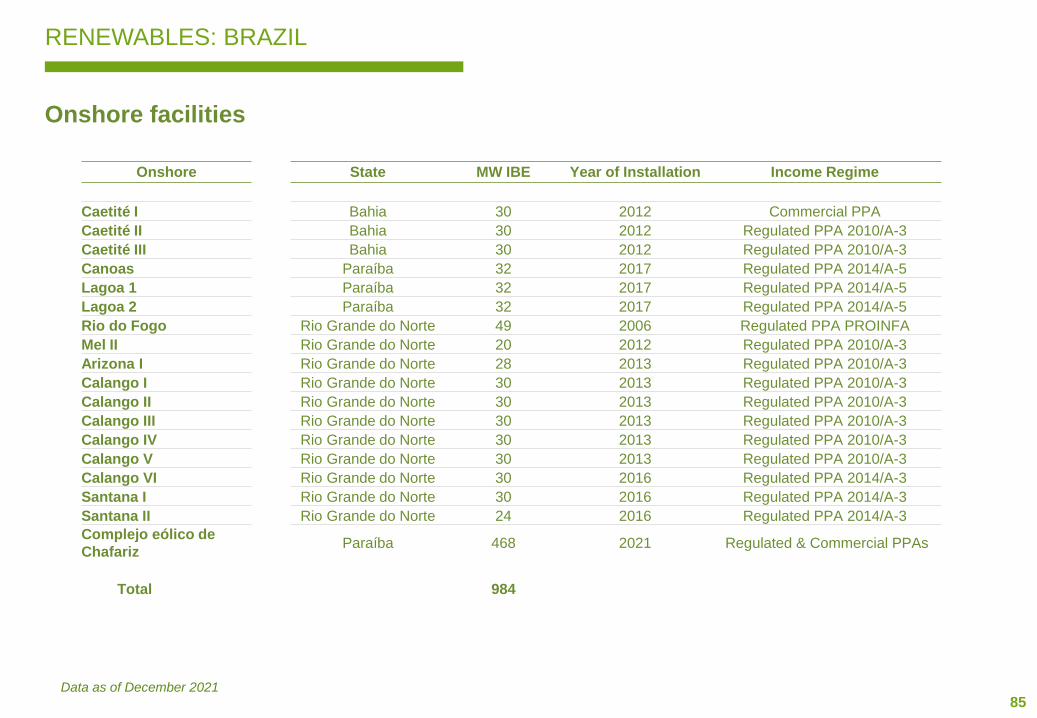
85
RENEWABLES: BRAZIL
Onshore facilities
Onshore State MW IBE Year of Installation Income Regime
Caetité I Bahia 30 2012 Commercial PPA
Caetité II Bahia 30 2012 Regulated PPA 2010/A-3
Caetité III Bahia 30 2012 Regulated PPA 2010/A-3
Canoas Paraíba 32 2017 Regulated PPA 2014/A-5
Lagoa 1 Paraíba 32 2017 Regulated PPA 2014/A-5
Lagoa 2 Paraíba 32 2017 Regulated PPA 2014/A-5
Rio do Fogo Rio Grande do Norte 49 2006 Regulated PPA PROINFA
Mel II Rio Grande do Norte 20 2012 Regulated PPA 2010/A-3
Arizona I Rio Grande do Norte 28 2013 Regulated PPA 2010/A-3
Calango I Rio Grande do Norte 30 2013 Regulated PPA 2010/A-3
Calango II Rio Grande do Norte 30 2013 Regulated PPA 2010/A-3
Calango III Rio Grande do Norte 30 2013 Regulated PPA 2010/A-3
Calango IV Rio Grande do Norte 30 2013 Regulated PPA 2010/A-3
Calango V Rio Grande do Norte 30 2013 Regulated PPA 2010/A-3
Calango VI Rio Grande do Norte 30 2016 Regulated PPA 2014/A-3
Santana I Rio Grande do Norte 30 2016 Regulated PPA 2014/A-3
Santana II Rio Grande do Norte 24 2016 Regulated PPA 2014/A-3
Complejo eólico de
Chafariz Paraíba 468 2021 Regulated & Commercial PPAs
Total 984
Data as of December 2021
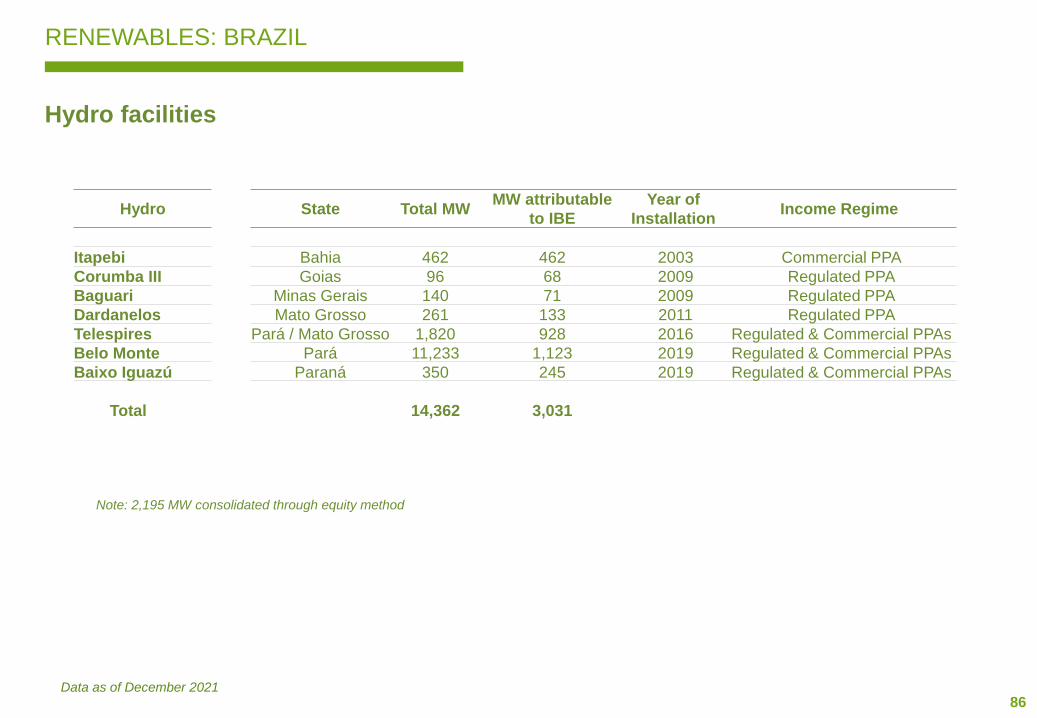
86
RENEWABLES: BRAZIL
Hydro facilities
Hydro State Total MWMW attributable
to IBE
Year of
InstallationIncome Regime
Itapebi Bahia 462 462 2003 Commercial PPA
Corumba III Goias 96 68 2009 Regulated PPA
Baguari Minas Gerais 140 71 2009 Regulated PPA
Dardanelos Mato Grosso 261 133 2011 Regulated PPA
Telespires Pará / Mato Grosso 1,820 928 2016 Regulated & Commercial PPAs
Belo Monte Pará 11,233 1,123 2019 Regulated & Commercial PPAs
Baixo Iguazú Paraná 350 245 2019 Regulated & Commercial PPAs
Total 14,362 3,031
Note: 2,195 MW consolidated through equity method
Data as of December 2021
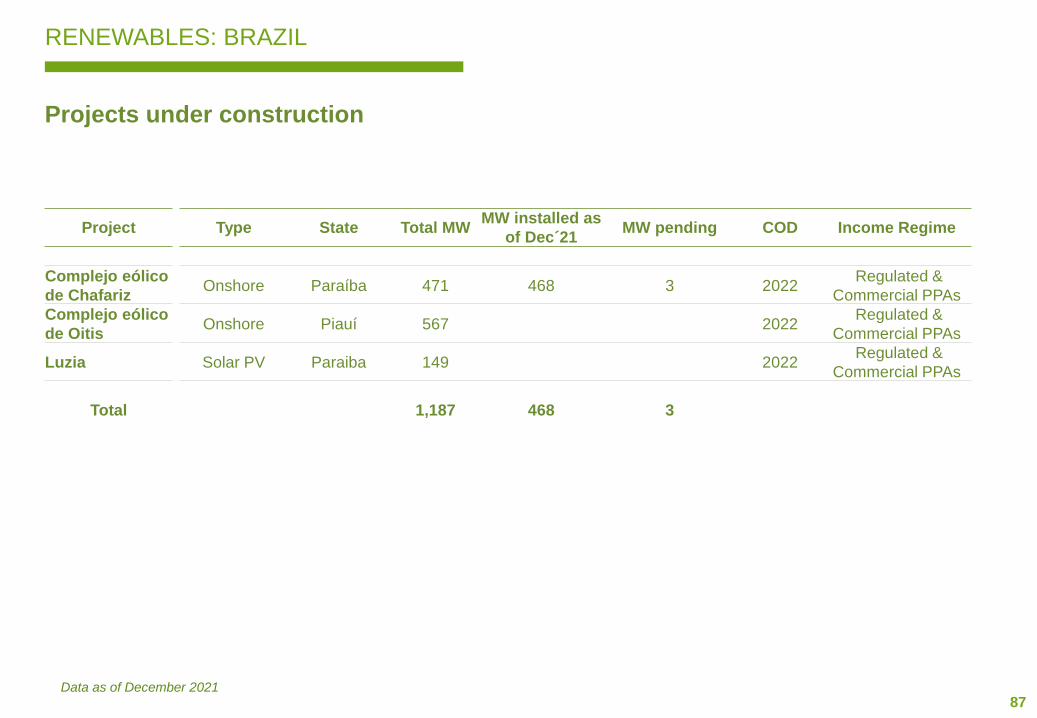
87
RENEWABLES: BRAZIL
Projects under construction
Data as of December 2021
Project Type State Total MWMW installed as
of Dec´21MW pending COD Income Regime
Complejo eólico
de Chafariz Onshore Paraíba 471 468 3 2022
Regulated &
Commercial PPAs
Complejo eólico
de OitisOnshore Piauí 567 2022
Regulated &
Commercial PPAs
Luzia Solar PV Paraiba 149 2022Regulated &
Commercial PPAs
Total 1,187 468 3
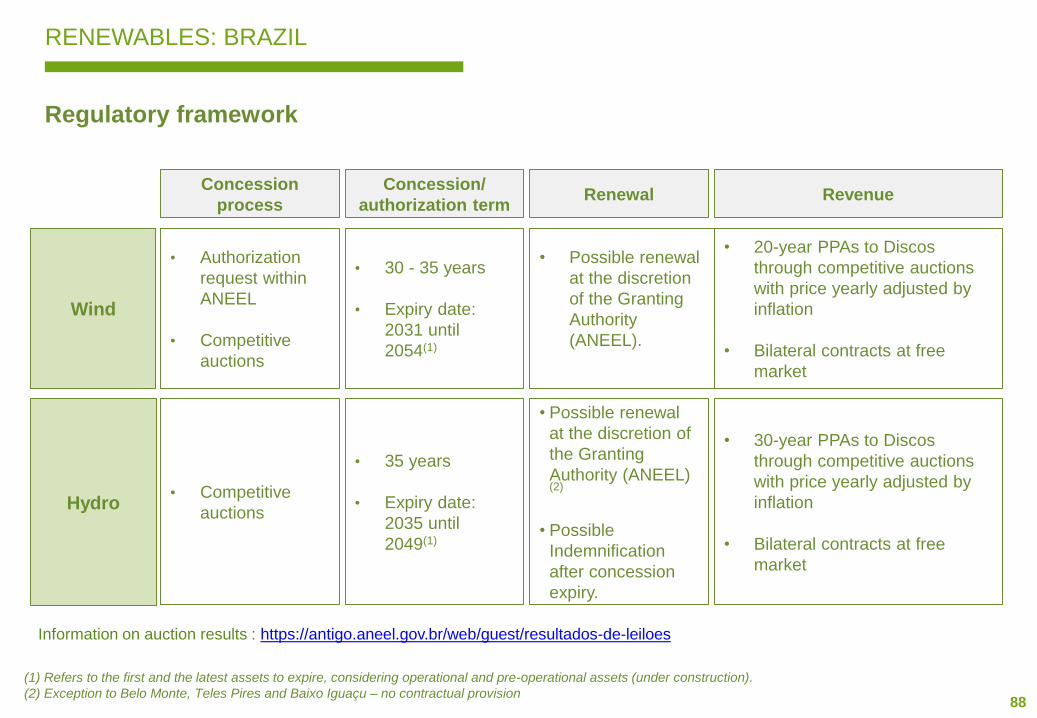
88
RENEWABLES: BRAZIL
Regulatory framework
(1) Refers to the first and the latest assets to expire, considering operational and pre-operational assets (under construction).
(2) Exception to Belo Monte, Teles Pires and Baixo Iguaçu – no contractual provision
Information on auction results : https://antigo.aneel.gov.br/web/guest/resultados-de-leiloes
Concession
process
Concession/
authorization termRenewal Revenue
Wind
Hydro
• Authorization
request within
ANEEL
• Competitive
auctions
• 30 - 35 years
• Expiry date:
2031 until
2054(1)
• Possible renewal
at the discretion
of the Granting
Authority
(ANEEL).
• 20-year PPAs to Discos
through competitive auctions
with price yearly adjusted by
inflation
• Bilateral contracts at free
market
• Competitive
auctions
• 35 years
• Expiry date:
2035 until
2049(1)
• Possible renewal
at the discretion of
the Granting
Authority (ANEEL) (2)
• Possible
Indemnification
after concession
expiry.
• 30-year PPAs to Discos
through competitive auctions
with price yearly adjusted by
inflation
• Bilateral contracts at free
market
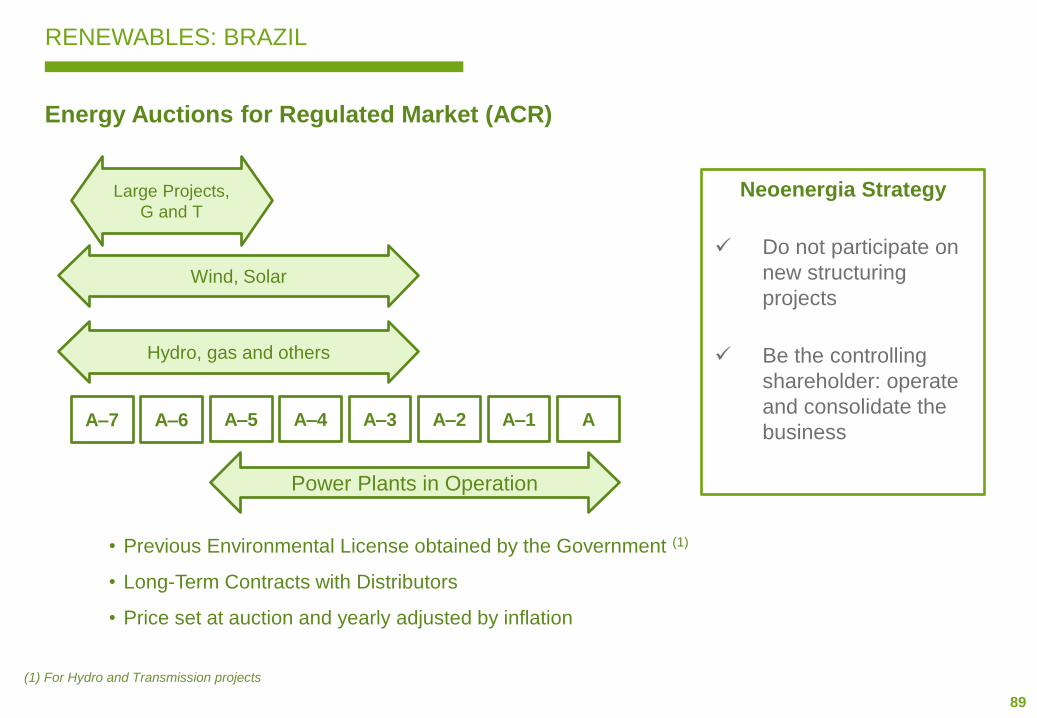
89
RENEWABLES: BRAZIL
Energy Auctions for Regulated Market (ACR)
• Previous Environmental License obtained by the Government (1)
• Long-Term Contracts with Distributors
• Price set at auction and yearly adjusted by inflation
A–5 A–4 A–3 A–2 A–1 AA–6A–7
Hydro, gas and others
Power Plants in Operation
Wind, Solar
Large Projects,
G and T
Neoenergia Strategy
✓ Do not participate on
new structuring
projects
✓ Be the controlling
shareholder: operate
and consolidate the
business
(1) For Hydro and Transmission projects
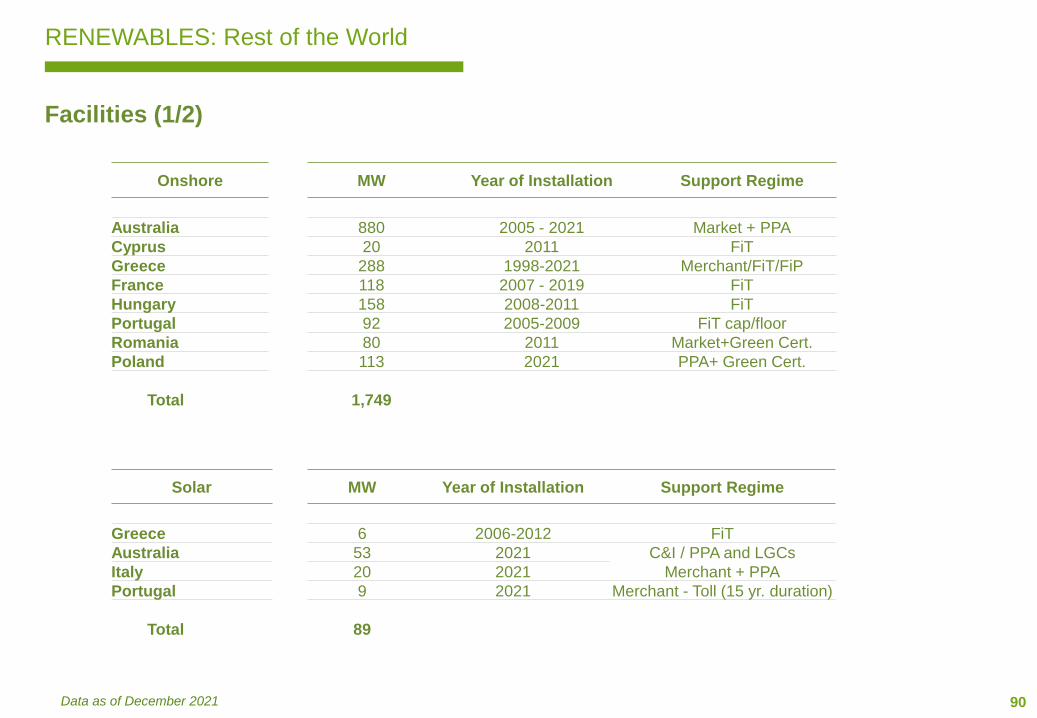
90
RENEWABLES: Rest of the World
Facilities (1/2)
Onshore MW Year of Installation Support Regime
Australia 880 2005 - 2021 Market + PPA
Cyprus 20 2011 FiT
Greece 288 1998-2021 Merchant/FiT/FiP
France 118 2007 - 2019 FiT
Hungary 158 2008-2011 FiT
Portugal 92 2005-2009 FiT cap/floor
Romania 80 2011 Market+Green Cert.
Poland 113 2021 PPA+ Green Cert.
Total 1,749
Data as of December 2021
Solar MW Year of Installation Support Regime
Greece 6 2006-2012 FiT
Australia 53 2021 C&I / PPA and LGCs
Italy 20 2021 Merchant + PPA
Portugal 9 2021 Merchant - Toll (15 yr. duration)
Total 89
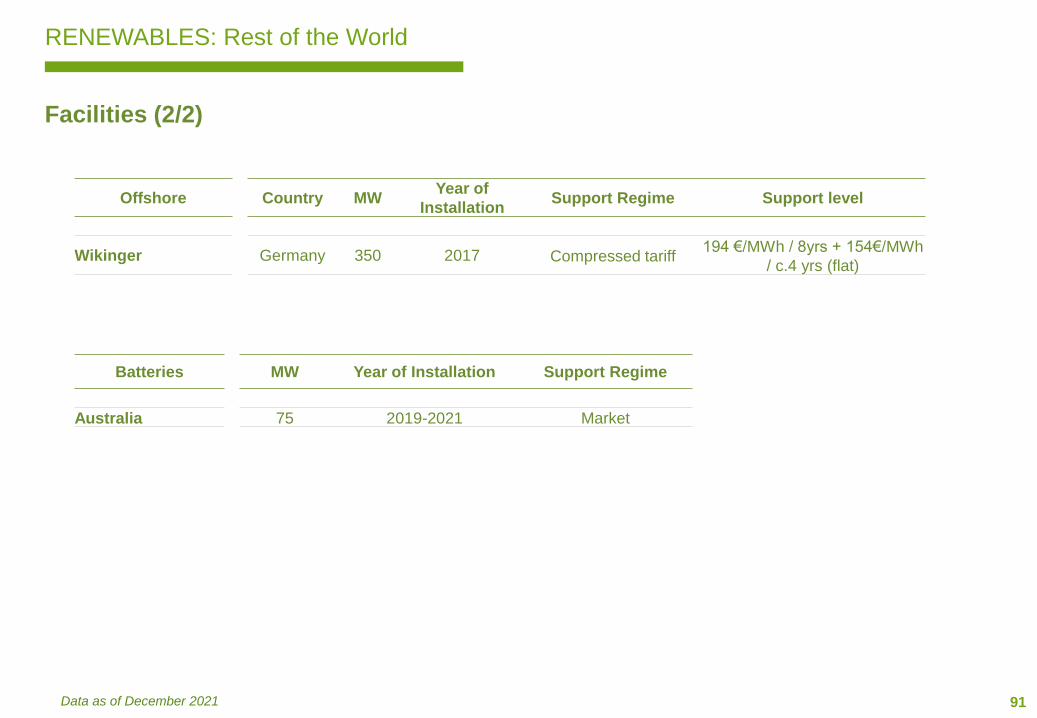
91
RENEWABLES: Rest of the World
Facilities (2/2)
Offshore Country MWYear of
InstallationSupport Regime Support level
Wikinger Germany 350 2017 Compressed tariff194 €/MWh / 8yrs + 154€/MWh
/ c.4 yrs (flat)
Data as of December 2021
Batteries MW Year of Installation Support Regime
Australia 75 2019-2021 Market
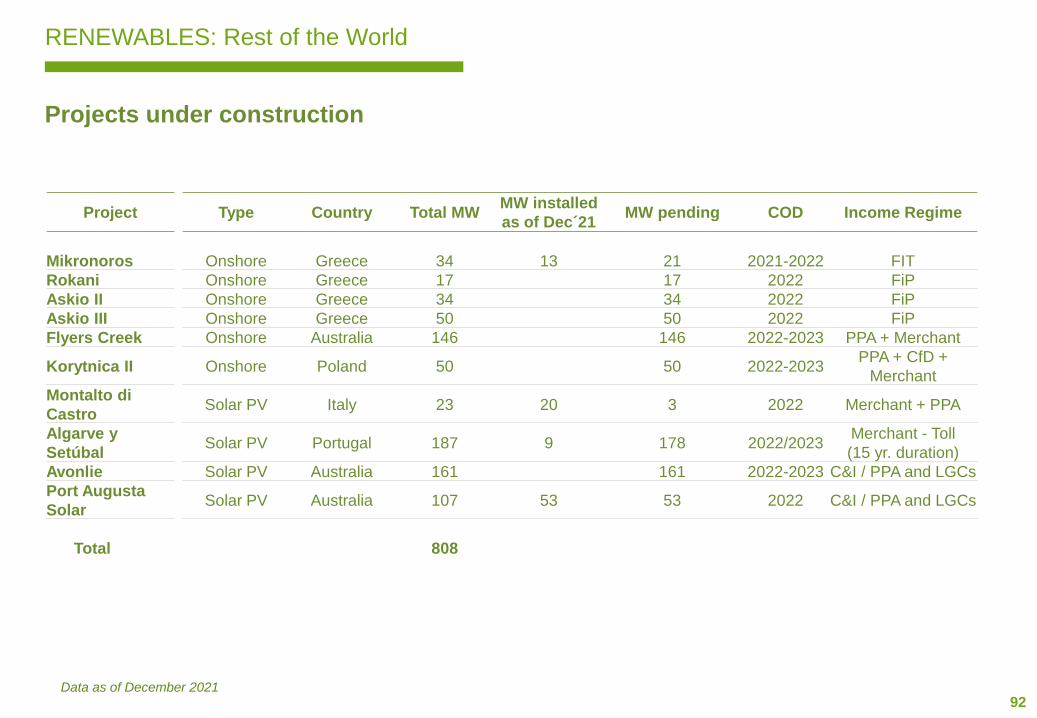
92
RENEWABLES: Rest of the World
Projects under construction
Data as of December 2021
Project Type Country Total MWMW installed
as of Dec´21MW pending COD Income Regime
Mikronoros Onshore Greece 34 13 21 2021-2022 FIT
Rokani Onshore Greece 17 17 2022 FiP
Askio II Onshore Greece 34 34 2022 FiP
Askio III Onshore Greece 50 50 2022 FiP
Flyers Creek Onshore Australia 146 146 2022-2023 PPA + Merchant
Korytnica II Onshore Poland 50 50 2022-2023PPA + CfD +
Merchant
Montalto di
CastroSolar PV Italy 23 20 3 2022 Merchant + PPA
Algarve y
SetúbalSolar PV Portugal 187 9 178 2022/2023
Merchant - Toll
(15 yr. duration)
Avonlie Solar PV Australia 161 161 2022-2023 C&I / PPA and LGCs
Port Augusta
SolarSolar PV Australia 107 53 53 2022 C&I / PPA and LGCs
Total 808
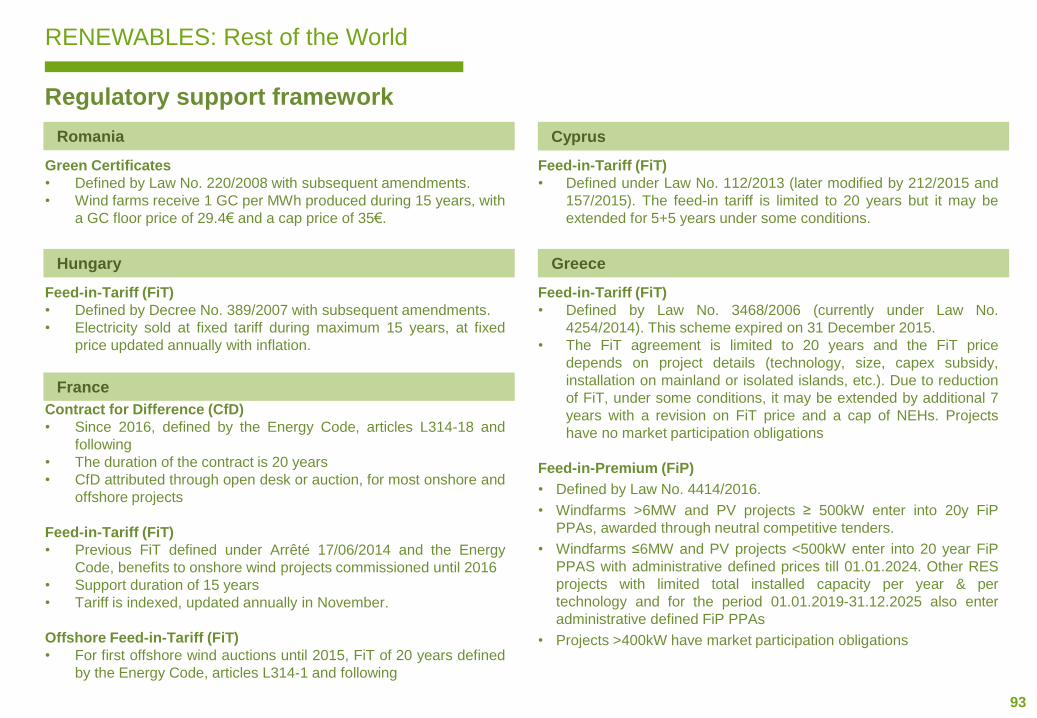
93
RENEWABLES: Rest of the World
Regulatory support framework
Feed-in-Tariff (FiT)
• Defined by Law No. 3468/2006 (currently under Law No.
4254/2014). This scheme expired on 31 December 2015.
• The FiT agreement is limited to 20 years and the FiT price
depends on project details (technology, size, capex subsidy,
installation on mainland or isolated islands, etc.). Due to reduction
of FiT, under some conditions, it may be extended by additional 7
years with a revision on FiT price and a cap of NEHs. Projects
have no market participation obligations
Feed-in-Premium (FiP)
• Defined by Law No. 4414/2016.
• Windfarms >6MW and PV projects ≥ 500kW enter into 20y FiP
PPAs, awarded through neutral competitive tenders.
• Windfarms ≤6MW and PV projects <500kW enter into 20 year FiP
PPAS with administrative defined prices till 01.01.2024. Other RES
projects with limited total installed capacity per year & per
technology and for the period 01.01.2019-31.12.2025 also enter
administrative defined FiP PPAs
• Projects >400kW have market participation obligations
Greece
Green Certificates
• Defined by Law No. 220/2008 with subsequent amendments.
• Wind farms receive 1 GC per MWh produced during 15 years, with
a GC floor price of 29.4€ and a cap price of 35€.
Romania
Feed-in-Tariff (FiT)
• Defined under Law No. 112/2013 (later modified by 212/2015 and
157/2015). The feed-in tariff is limited to 20 years but it may be
extended for 5+5 years under some conditions.
Feed-in-Tariff (FiT)
• Defined by Decree No. 389/2007 with subsequent amendments.
• Electricity sold at fixed tariff during maximum 15 years, at fixed
price updated annually with inflation.
Hungary
France
Contract for Difference (CfD)
• Since 2016, defined by the Energy Code, articles L314-18 and
following
• The duration of the contract is 20 years
• CfD attributed through open desk or auction, for most onshore and
offshore projects
Feed-in-Tariff (FiT)
• Previous FiT defined under Arrêté 17/06/2014 and the Energy
Code, benefits to onshore wind projects commissioned until 2016
• Support duration of 15 years
• Tariff is indexed, updated annually in November.
Offshore Feed-in-Tariff (FiT)
• For first offshore wind auctions until 2015, FiT of 20 years defined
by the Energy Code, articles L314-1 and following
Cyprus
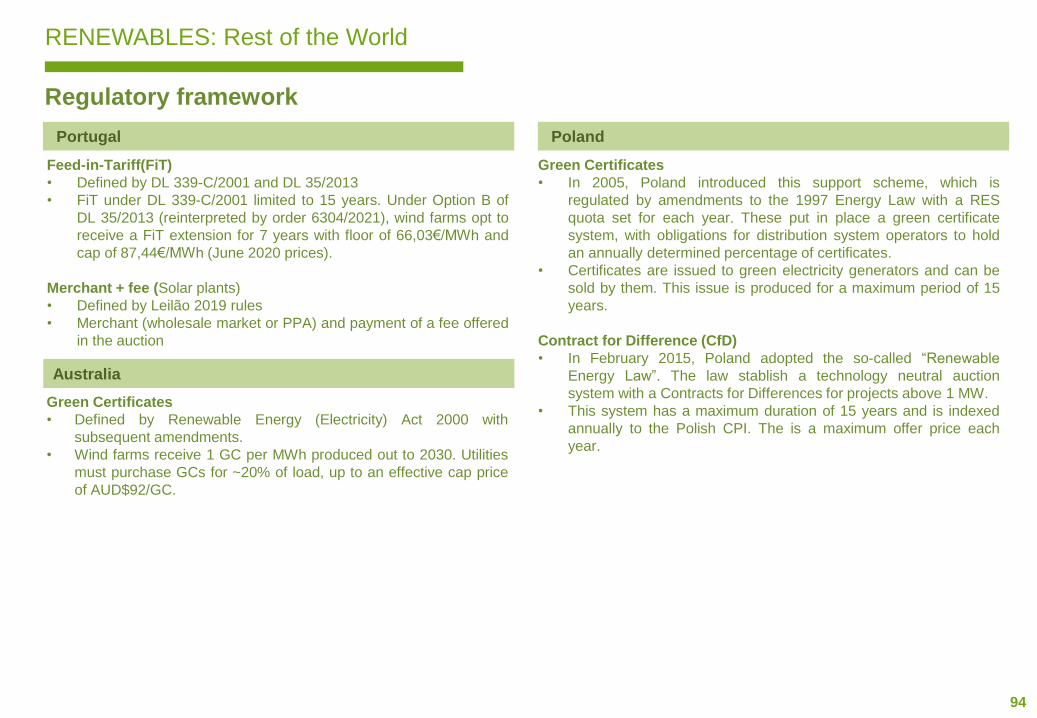
94
RENEWABLES: Rest of the World
Regulatory framework
Green Certificates
• In 2005, Poland introduced this support scheme, which is
regulated by amendments to the 1997 Energy Law with a RES
quota set for each year. These put in place a green certificate
system, with obligations for distribution system operators to hold
an annually determined percentage of certificates.
• Certificates are issued to green electricity generators and can be
sold by them. This issue is produced for a maximum period of 15
years.
Contract for Difference (CfD)
• In February 2015, Poland adopted the so-called “Renewable
Energy Law”. The law stablish a technology neutral auction
system with a Contracts for Differences for projects above 1 MW.
• This system has a maximum duration of 15 years and is indexed
annually to the Polish CPI. The is a maximum offer price each
year.
Poland
Australia
Green Certificates
• Defined by Renewable Energy (Electricity) Act 2000 with
subsequent amendments.
• Wind farms receive 1 GC per MWh produced out to 2030. Utilities
must purchase GCs for ~20% of load, up to an effective cap price
of AUD$92/GC.
Feed-in-Tariff(FiT)
• Defined by DL 339-C/2001 and DL 35/2013
• FiT under DL 339-C/2001 limited to 15 years. Under Option B of
DL 35/2013 (reinterpreted by order 6304/2021), wind farms opt to
receive a FiT extension for 7 years with floor of 66,03€/MWh and
cap of 87,44€/MWh (June 2020 prices).
Merchant + fee (Solar plants)
• Defined by Leilão 2019 rules
• Merchant (wholesale market or PPA) and payment of a fee offered
in the auction
Portugal
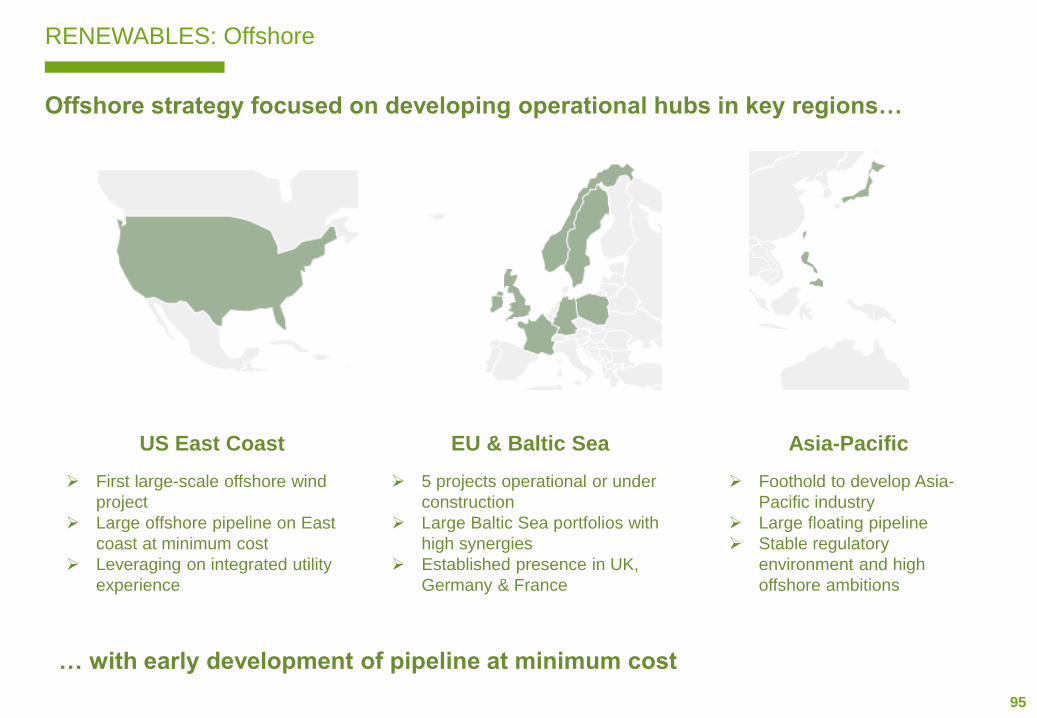
95
RENEWABLES: Offshore
Offshore strategy focused on developing operational hubs in key regions…
… with early development of pipeline at minimum cost
➢ First large-scale offshore wind
project
➢ Large offshore pipeline on East
coast at minimum cost
➢ Leveraging on integrated utility
experience
➢ 5 projects operational or under
construction
➢ Large Baltic Sea portfolios with
high synergies
➢ Established presence in UK,
Germany & France
➢ Foothold to develop Asia-
Pacific industry
➢ Large floating pipeline
➢ Stable regulatory
environment and high
offshore ambitions
US East Coast EU & Baltic Sea Asia-Pacific
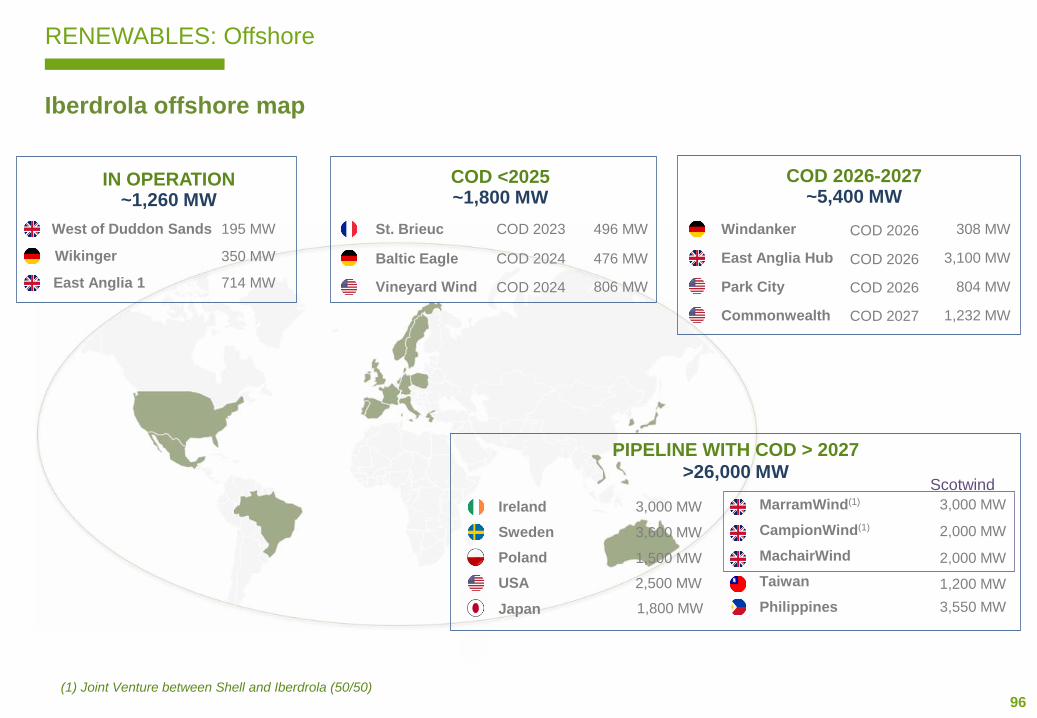
96
RENEWABLES: Offshore
Iberdrola offshore map
Wikinger 350 MW
St. Brieuc 496 MW
IN OPERATION
West of Duddon Sands 195 MW
Baltic Eagle 476 MW
East Anglia 1 714 MW
~1,260 MW
COD <2025 ~1,800 MW
Vineyard Wind 806 MW
COD 2026-2027~5,400 MW
Park City 804 MW
Windanker 308 MW
Commonwealth 1,232 MW
PIPELINE WITH COD > 2027
MarramWind(1) 3,000 MW
MachairWind 2,000 MW
>26,000 MW
CampionWind(1) 2,000 MW
USA 2,500 MW
Philippines 3,550 MW
Ireland 3,000 MW
COD 2023
COD 2024
COD 2024 COD 2026
COD 2026
COD 2027
Sweden 3,600 MW
Poland 1,500 MW
Japan 1,800 MW
Taiwan 1,200 MW
Scotwind
East Anglia Hub 3,100 MWCOD 2026
(1) Joint Venture between Shell and Iberdrola (50/50)
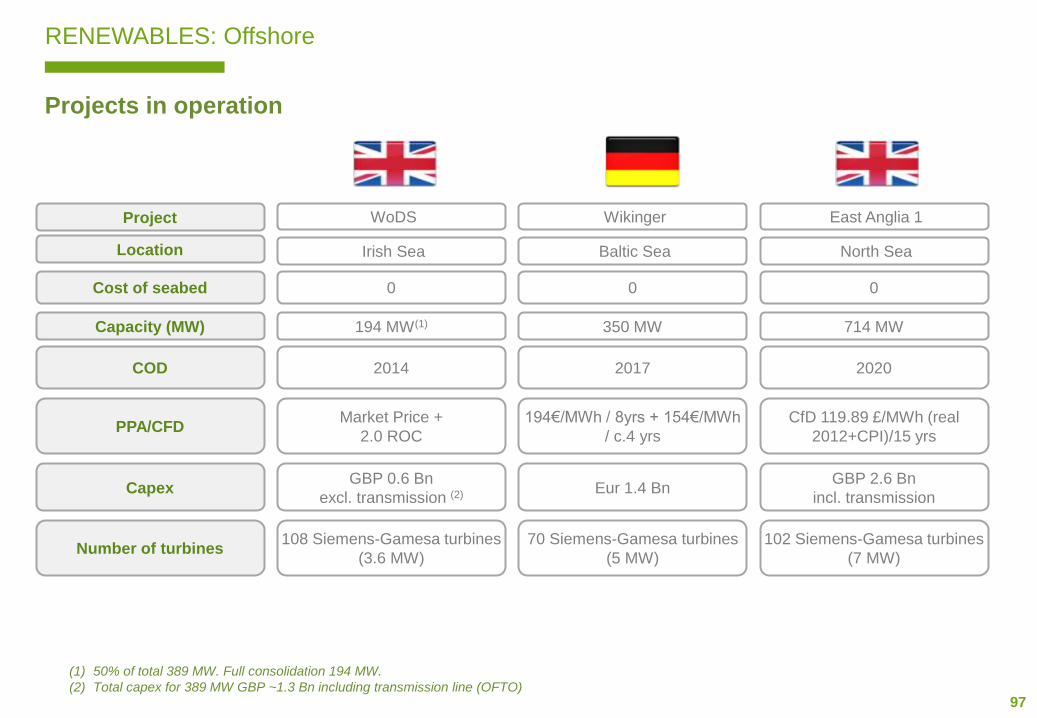
97
RENEWABLES: Offshore
Projects in operation
Capacity (MW)
COD
PPA/CFD
Location
Cost of seabed
Project
Capex
Number of turbines
194 MW(1)
2014
Market Price +
2.0 ROC
Irish Sea
0
WoDS
GBP 0.6 Bn
excl. transmission (2)
108 Siemens-Gamesa turbines
(3.6 MW)
350 MW
2017
194€/MWh / 8yrs + 154€/MWh
/ c.4 yrs
Baltic Sea
0
Wikinger
Eur 1.4 Bn
70 Siemens-Gamesa turbines
(5 MW)
714 MW
2020
CfD 119.89 £/MWh (real
2012+CPI)/15 yrs
North Sea
0
East Anglia 1
GBP 2.6 Bn
incl. transmission
102 Siemens-Gamesa turbines
(7 MW)
(1) 50% of total 389 MW. Full consolidation 194 MW.
(2) Total capex for 389 MW GBP ~1.3 Bn including transmission line (OFTO)
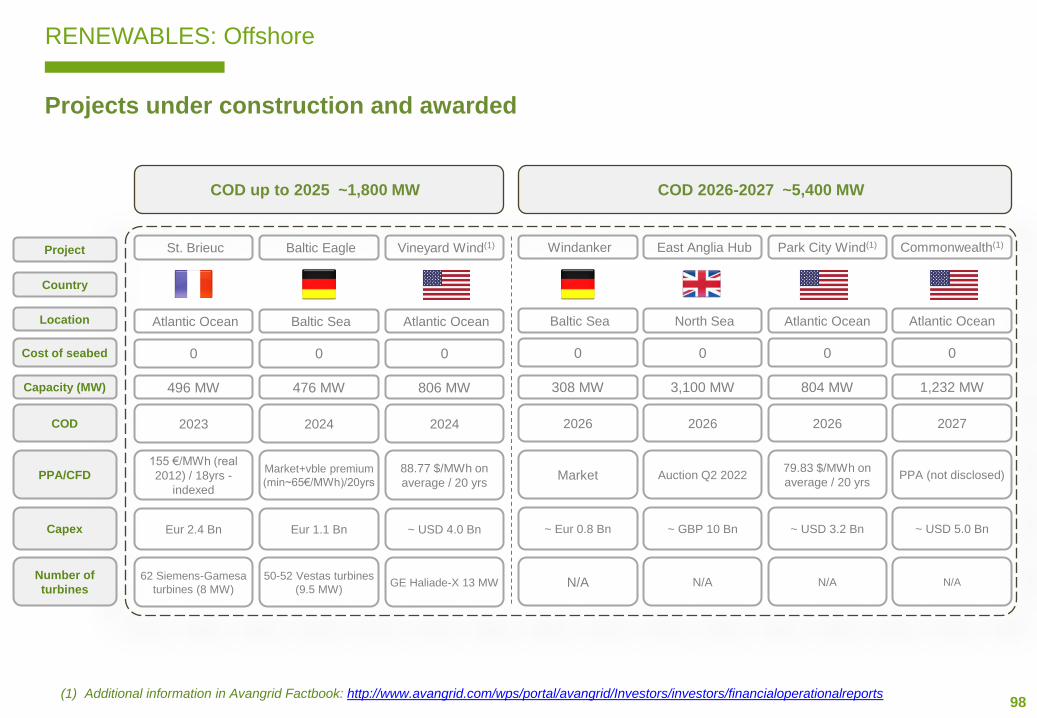
98
RENEWABLES: Offshore
Projects under construction and awarded
Capacity (MW)
COD
PPA/CFD
Location
Country
Cost of seabed
Project
Capex
Number of
turbines
496 MW
2023
155 €/MWh (real
2012) / 18yrs -
indexed
Atlantic Ocean
0
St. Brieuc
Eur 2.4 Bn
62 Siemens-Gamesa
turbines (8 MW)
476 MW
2024
Market+vble premium
(min~65€/MWh)/20yrs
Baltic Sea
0
Baltic Eagle
Eur 1.1 Bn
50-52 Vestas turbines
(9.5 MW)
806 MW
2024
88.77 $/MWh on
average / 20 yrs
Atlantic Ocean
0
Vineyard Wind(1)
~ USD 4.0 Bn
GE Haliade-X 13 MW
804 MW
2026
79.83 $/MWh on
average / 20 yrs
Atlantic Ocean
0
Park City Wind(1)
~ USD 3.2 Bn
N/A
COD up to 2025 ~1,800 MW
(1) Additional information in Avangrid Factbook: http://www.avangrid.com/wps/portal/avangrid/Investors/investors/financialoperationalreports
308 MW 3,100 MW
2026 2026
Market Auction Q2 2022
Baltic Sea North Sea
0 0
Windanker East Anglia Hub
~ Eur 0.8 Bn ~ GBP 10 Bn
N/A N/A
1,232 MW
2027
PPA (not disclosed)
Atlantic Ocean
0
Commonwealth(1)
~ USD 5.0 Bn
N/A
COD 2026-2027 ~5,400 MW
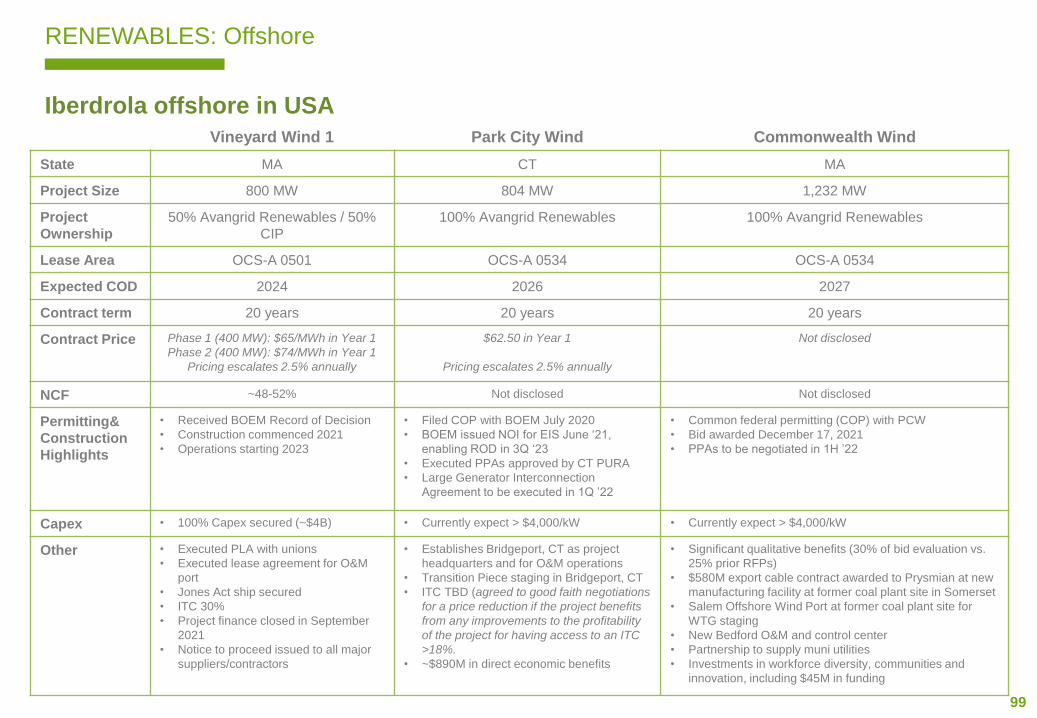
99
RENEWABLES: Offshore
Iberdrola offshore in USA
Vineyard Wind 1 Park City Wind Commonwealth Wind
State MA CT MA
Project Size 800 MW 804 MW 1,232 MW
Project
Ownership
50% Avangrid Renewables / 50%
CIP
100% Avangrid Renewables 100% Avangrid Renewables
Lease Area OCS-A 0501 OCS-A 0534 OCS-A 0534
Expected COD 2024 2026 2027
Contract term 20 years 20 years 20 years
Contract Price Phase 1 (400 MW): $65/MWh in Year 1
Phase 2 (400 MW): $74/MWh in Year 1
Pricing escalates 2.5% annually
$62.50 in Year 1
Pricing escalates 2.5% annually
Not disclosed
NCF ~48-52% Not disclosed Not disclosed
Permitting&
Construction
Highlights
• Received BOEM Record of Decision
• Construction commenced 2021
• Operations starting 2023
• Filed COP with BOEM July 2020
• BOEM issued NOI for EIS June ‘21,
enabling ROD in 3Q ‘23
• Executed PPAs approved by CT PURA
• Large Generator Interconnection
Agreement to be executed in 1Q ’22
• Common federal permitting (COP) with PCW
• Bid awarded December 17, 2021
• PPAs to be negotiated in 1H ’22
Capex • 100% Capex secured (~$4B) • Currently expect > $4,000/kW • Currently expect > $4,000/kW
Other • Executed PLA with unions
• Executed lease agreement for O&M
port
• Jones Act ship secured
• ITC 30%
• Project finance closed in September
2021
• Notice to proceed issued to all major
suppliers/contractors
• Establishes Bridgeport, CT as project
headquarters and for O&M operations
• Transition Piece staging in Bridgeport, CT
• ITC TBD (agreed to good faith negotiations
for a price reduction if the project benefits
from any improvements to the profitability
of the project for having access to an ITC
>18%.
• ~$890M in direct economic benefits
• Significant qualitative benefits (30% of bid evaluation vs.
25% prior RFPs)
• $580M export cable contract awarded to Prysmian at new
manufacturing facility at former coal plant site in Somerset
• Salem Offshore Wind Port at former coal plant site for
WTG staging
• New Bedford O&M and control center
• Partnership to supply muni utilities
• Investments in workforce diversity, communities and
innovation, including $45M in funding
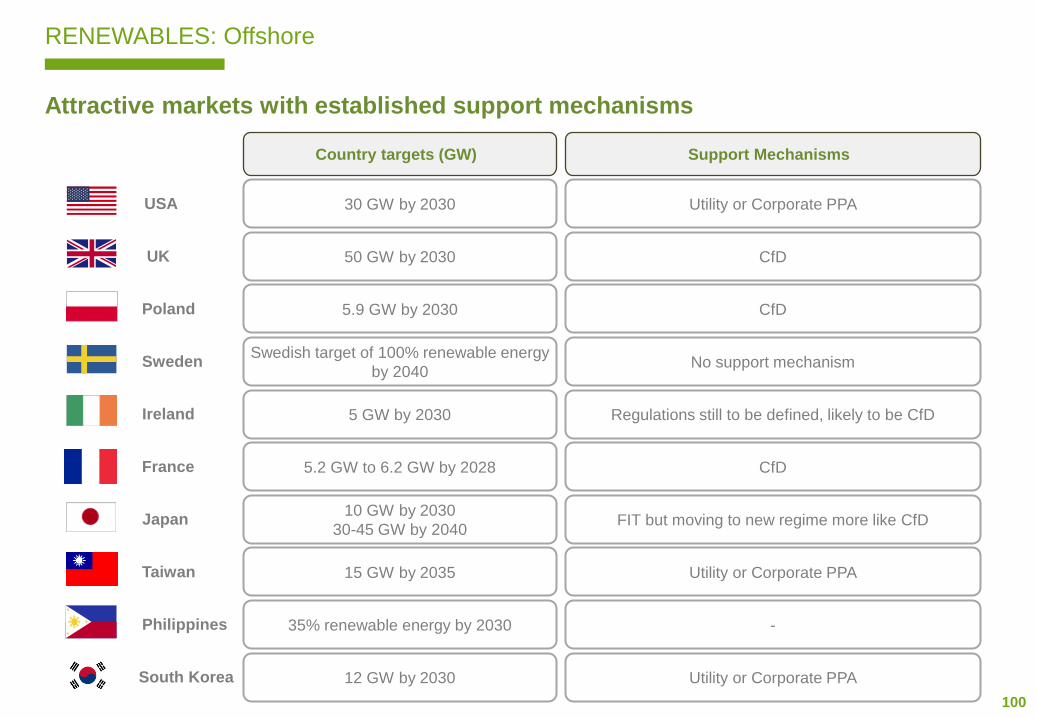
100
RENEWABLES: Offshore
Attractive markets with established support mechanisms
Country targets (GW)
Poland
Sweden
Ireland
Japan
Taiwan
Philippines
USA
UK
France
South Korea
Support Mechanisms
30 GW by 2030 Utility or Corporate PPA
50 GW by 2030 CfD
Swedish target of 100% renewable energy
by 2040No support mechanism
5.9 GW by 2030 CfD
5 GW by 2030 Regulations still to be defined, likely to be CfD
5.2 GW to 6.2 GW by 2028 CfD
10 GW by 2030
30-45 GW by 2040FIT but moving to new regime more like CfD
15 GW by 2035 Utility or Corporate PPA
35% renewable energy by 2030 -
12 GW by 2030 Utility or Corporate PPA
101
AGENDA
1. Iberdrola Today (page 5)
2. Networks (page 16)
3. Renewables (page 46)
4. Generation & Retail (page 101)
5. Financing (page 135)
6. ESG (page 148)
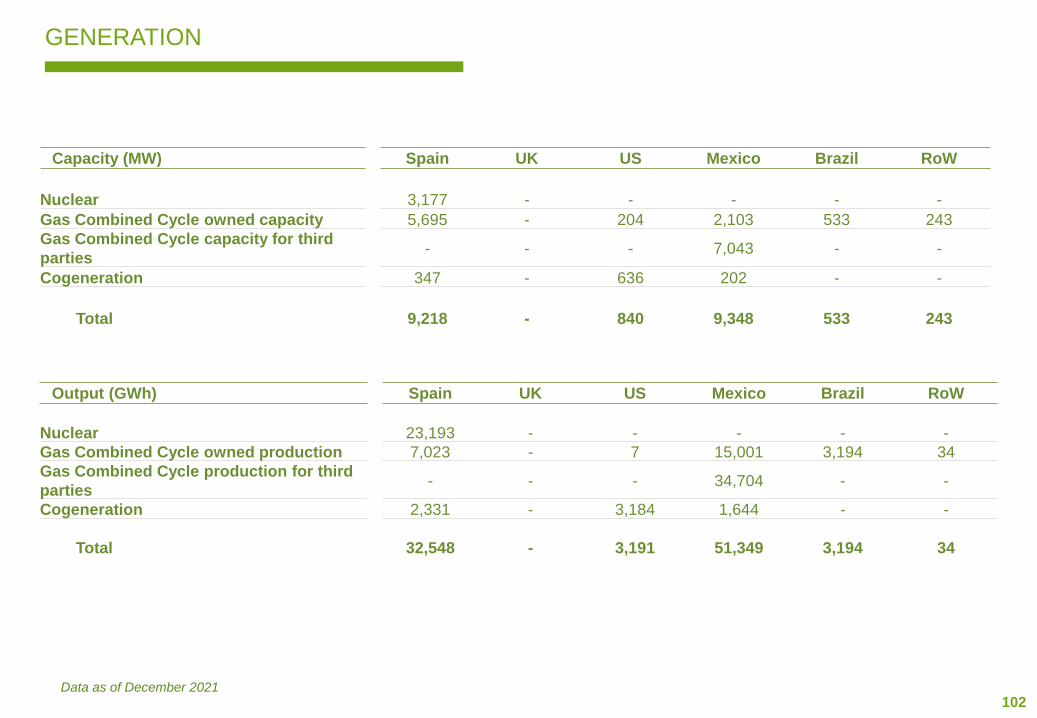
102
GENERATION
Capacity (MW) Spain UK US Mexico Brazil RoW
Nuclear 3,177 - - - - -
Gas Combined Cycle owned capacity 5,695 - 204 2,103 533 243
Gas Combined Cycle capacity for third
parties- - - 7,043 - -
Cogeneration 347 - 636 202 - -
Total 9,218 - 840 9,348 533 243
Output (GWh) Spain UK US Mexico Brazil RoW
Nuclear 23,193 - - - - -
Gas Combined Cycle owned production 7,023 - 7 15,001 3,194 34
Gas Combined Cycle production for third
parties- - - 34,704 - -
Cogeneration 2,331 - 3,184 1,644 - -
Total 32,548 - 3,191 51,349 3,194 34
Data as of December 2021
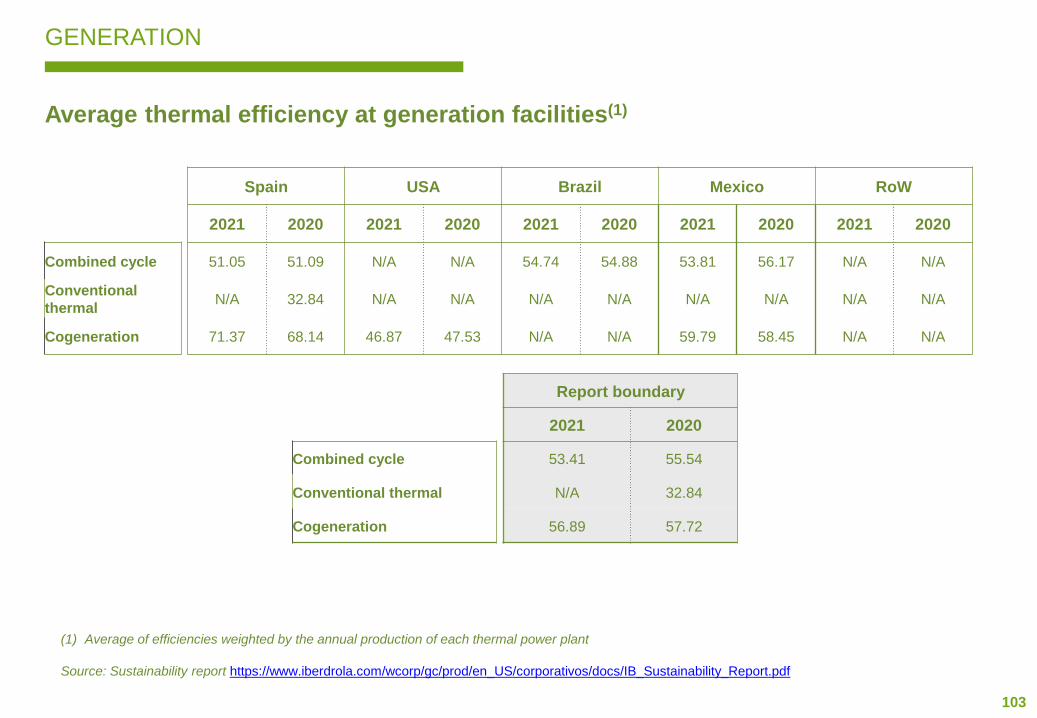
103
GENERATION
Average thermal efficiency at generation facilities(1)
(1) Average of efficiencies weighted by the annual production of each thermal power plant
Source: Sustainability report https://www.iberdrola.com/wcorp/gc/prod/en_US/corporativos/docs/IB_Sustainability_Report.pdf
Spain USA Brazil Mexico RoW
2021 2020 2021 2020 2021 2020 2021 2020 2021 2020
Combined cycle 51.05 51.09 N/A N/A 54.74 54.88 53.81 56.17 N/A N/A
Conventional
thermalN/A 32.84 N/A N/A N/A N/A N/A N/A N/A N/A
Cogeneration 71.37 68.14 46.87 47.53 N/A N/A 59.79 58.45 N/A N/A
Report boundary
2021 2020
Combined cycle 53.41 55.54
Conventional thermal N/A 32.84
Cogeneration 56.89 57.72
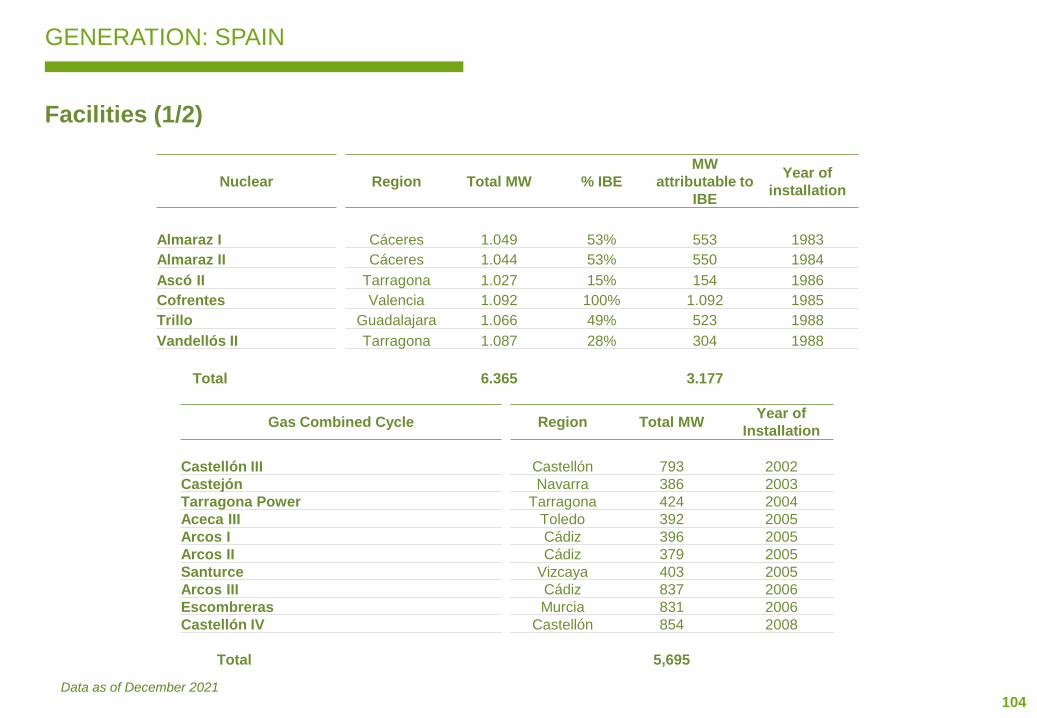
104
GENERATION: SPAIN
Facilities (1/2)
Data as of December 2021
Nuclear Region Total MW % IBE
MW
attributable to
IBE
Year of
installation
Almaraz I Cáceres 1.049 53% 553 1983
Almaraz II Cáceres 1.044 53% 550 1984
Ascó II Tarragona 1.027 15% 154 1986
Cofrentes Valencia 1.092 100% 1.092 1985
Trillo Guadalajara 1.066 49% 523 1988
Vandellós II Tarragona 1.087 28% 304 1988
Total 6.365 3.177
Gas Combined Cycle Region Total MWYear of
Installation
Castellón III Castellón 793 2002
Castejón Navarra 386 2003
Tarragona Power Tarragona 424 2004
Aceca III Toledo 392 2005
Arcos I Cádiz 396 2005
Arcos II Cádiz 379 2005
Santurce Vizcaya 403 2005
Arcos III Cádiz 837 2006
Escombreras Murcia 831 2006
Castellón IV Castellón 854 2008
Total 5,695

105
GENERATION: SPAIN
Facilities (2/2)
Cogeneration Region Total MWMW attributable
to IBE
Year of
Installation
Energyworks Villarrobledo Albacete 18 18 1995
Energyworks Carballo La Coruña 13 13 1998
Peninsular Cogeneración SA Madrid 39 19 2001
Energyworks Cartagena Murcia 95 95 2002
Investee companies n.a. 69 38 1990-2006
Energyworks Michelin (Vitoria, Valladolid y Aranda) n.a. 126 126 2001-2002
Pig slurry treatment plants (4 plants) n.a. 37 37 2003-2007
Total 397 347
Data as of December 2021
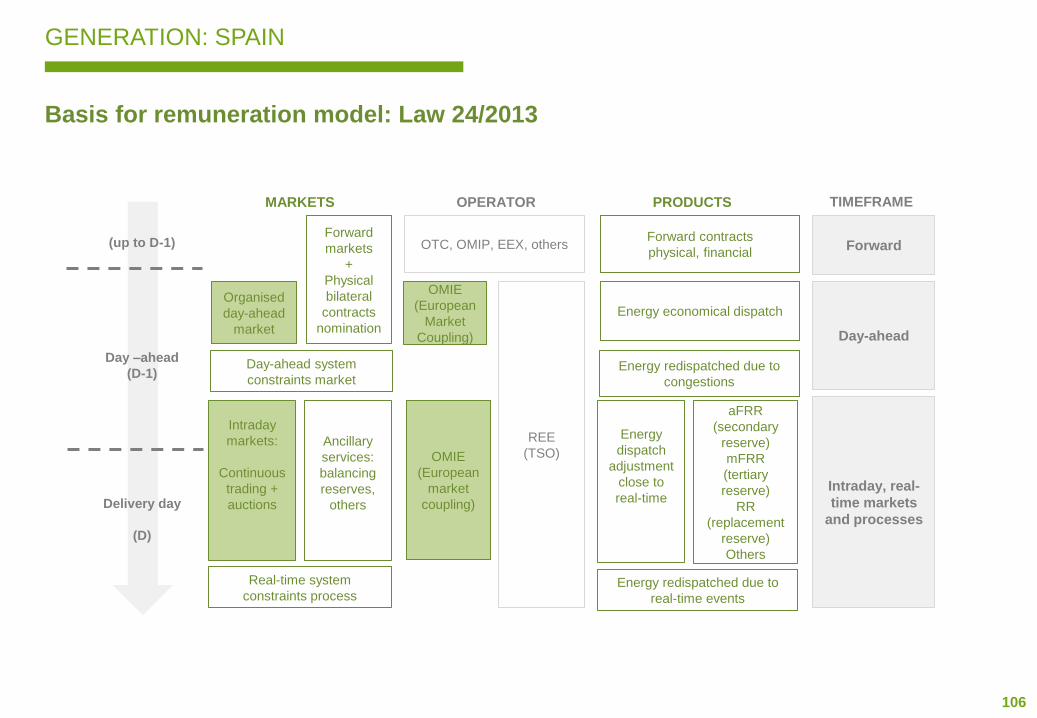
106
Basis for remuneration model: Law 24/2013
GENERATION: SPAIN
Forward
markets
+
Physical
bilateral
contracts
nomination
Organised
day-ahead
market
Day-ahead system
constraints market
Intraday
markets:
Continuous
trading +
auctions
MARKETS
OTC, OMIP, EEX, others
REE
(TSO)OMIE
(European
market
coupling)
OPERATOR
Forward contracts
physical, financial
PRODUCTS
Forward
Day-ahead
Intraday, real-
time markets
and processes
(up to D-1)
Day –ahead
(D-1)
Delivery day
(D)
Real-time system
constraints process
Ancillary
services:
balancing
reserves,
others
OMIE
(European
Market
Coupling)
Energy economical dispatch
Energy redispatched due to
congestions
Energy
dispatch
adjustment
close to
real-time
Energy redispatched due to
real-time events
aFRR
(secondary
reserve)
mFRR
(tertiary
reserve)
RR
(replacement
reserve)
Others
TIMEFRAME

107
GENERATION: SPAIN
Gas Clawback
Summary:
• Temporary measure in place until 30th June 2022.
• Revenues from energy sold at spot price are reduced by 90% of the excess in the gas price above €20/MWh (RDL 17/2021).
Revenues from energy contracted at fixed price are exempted (RDL 23/2021).
• Revenues from energy sold at fixed price in long term contracts signed after 31st of March 2022 are subject to a 90% reduction of
the electricity price over €67/MWh, except for integrated companies, in which the price for final customers will be considered:
€67/MWh + losses + average supply margin of the last 5 years published by the CNMC (RDL 6/2022).
Royal Decree Law details:
• Royal Decree Law 17/2021: Regulates urgent measures to mitigate the impact of the increase in natural gas prices in the retail
gas and electricity markets:
- Decrease the remuneration of non-emitting plants (nuclear, hydro & merchant exposed renewables) for an amount equivalent to
the excess in the gas price above €20/MWh until March 30th, 2022
- State Budget contribution from CO2 auctions increases in €0.9 billion (from €1.1 billion to €2.0 billion).
- Extraordinary reduction of charges (96%) until 31st December 2022.
• Royal Decree Law 23/2021: Reviews the scope of application of the reduction for gas prices included in RDL 17/2021, exempting
from the reduction the energy sold by non-emitting installations on a fixed-term basis.
• Royal Decree Law 6/2022:
- Remuneration decrease of non-emitting plants extended until 30th June 2022.
- Energy contracted at a fixed price above €67/MWh included in the clawback. In the case of hedges between companies of the
same Group, the final price applied will be as follows:
€67/MWh + losses + average marketing margin of the last 5 years published by the CNMC
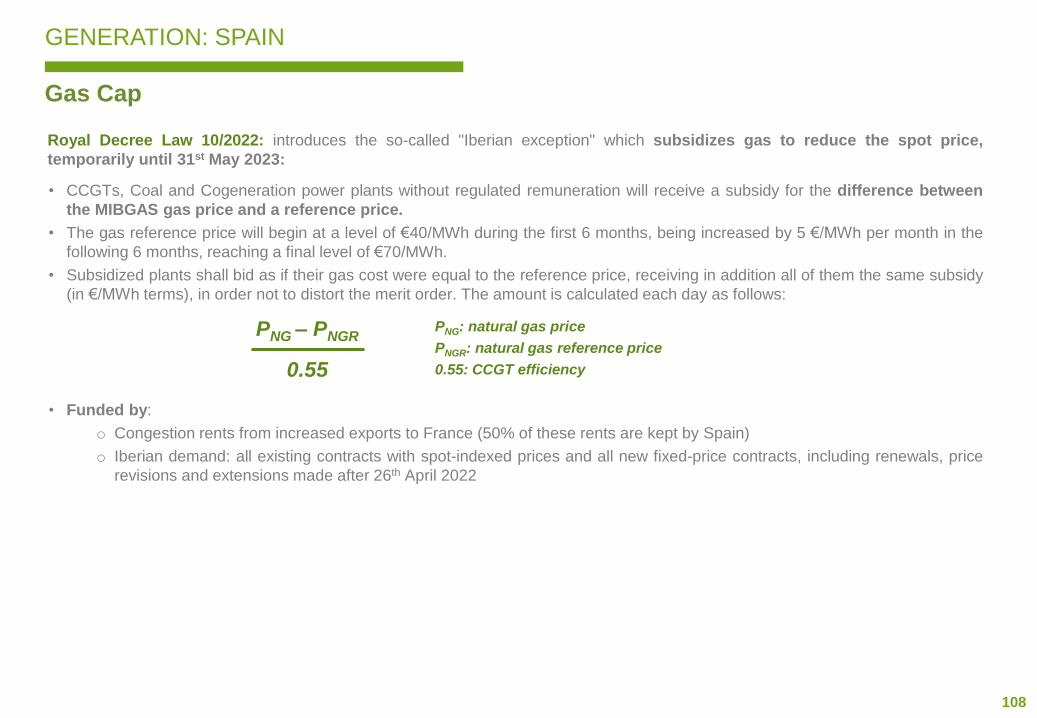
108
GENERATION: SPAIN
Gas Cap
Royal Decree Law 10/2022: introduces the so-called "Iberian exception" which subsidizes gas to reduce the spot price,
temporarily until 31st May 2023:
• CCGTs, Coal and Cogeneration power plants without regulated remuneration will receive a subsidy for the difference between
the MIBGAS gas price and a reference price.
• The gas reference price will begin at a level of €40/MWh during the first 6 months, being increased by 5 €/MWh per month in the
following 6 months, reaching a final level of €70/MWh.
• Subsidized plants shall bid as if their gas cost were equal to the reference price, receiving in addition all of them the same subsidy
(in €/MWh terms), in order not to distort the merit order. The amount is calculated each day as follows:
• Funded by:
o Congestion rents from increased exports to France (50% of these rents are kept by Spain)
o Iberian demand: all existing contracts with spot-indexed prices and all new fixed-price contracts, including renewals, price
revisions and extensions made after 26th April 2022
PNG: natural gas price
PNGR: natural gas reference price
0.55: CCGT efficiency
PNG – PNGR
0.55
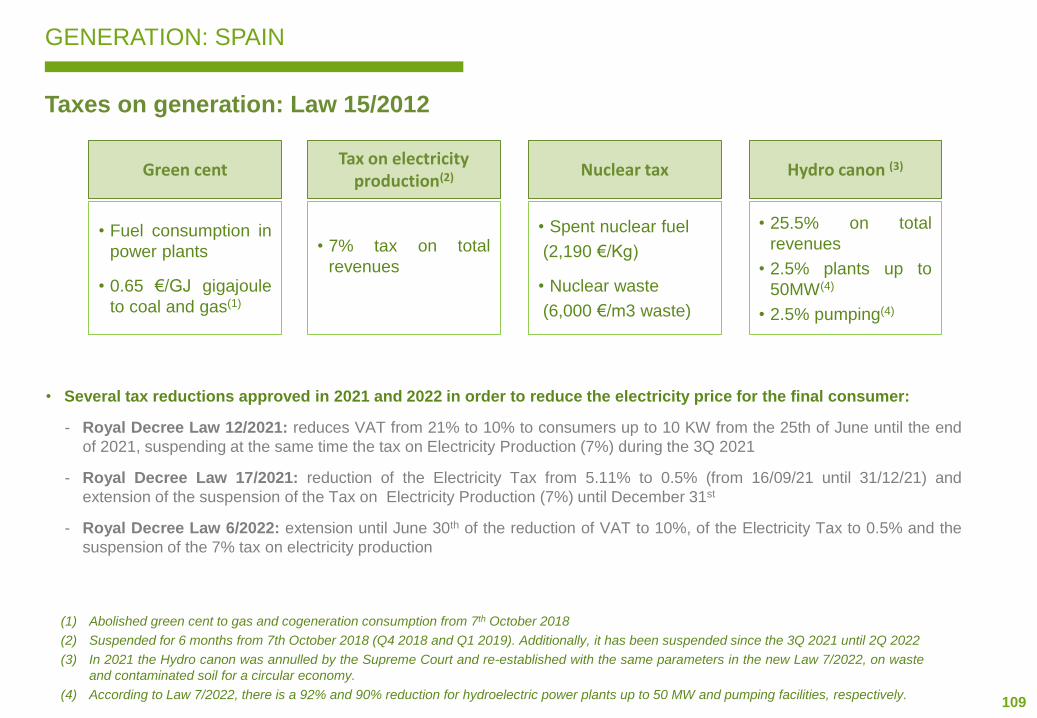
109
GENERATION: SPAIN
Taxes on generation: Law 15/2012
Green cent
• Fuel consumption in
power plants
• 0.65 €/GJ gigajoule
to coal and gas(1)
(1) Abolished green cent to gas and cogeneration consumption from 7th October 2018
(2) Suspended for 6 months from 7th October 2018 (Q4 2018 and Q1 2019). Additionally, it has been suspended since the 3Q 2021 until 2Q 2022
(3) In 2021 the Hydro canon was annulled by the Supreme Court and re-established with the same parameters in the new Law 7/2022, on waste
and contaminated soil for a circular economy.
(4) According to Law 7/2022, there is a 92% and 90% reduction for hydroelectric power plants up to 50 MW and pumping facilities, respectively.
Tax on electricity production(2)
• 7% tax on total
revenues
Nuclear tax
• Spent nuclear fuel
(2,190 €/Kg)
• Nuclear waste
(6,000 €/m3 waste)
Hydro canon (3)
• 25.5% on total
revenues
• 2.5% plants up to
50MW(4)
• 2.5% pumping(4)
• Several tax reductions approved in 2021 and 2022 in order to reduce the electricity price for the final consumer:
- Royal Decree Law 12/2021: reduces VAT from 21% to 10% to consumers up to 10 KW from the 25th of June until the end
of 2021, suspending at the same time the tax on Electricity Production (7%) during the 3Q 2021
- Royal Decree Law 17/2021: reduction of the Electricity Tax from 5.11% to 0.5% (from 16/09/21 until 31/12/21) and
extension of the suspension of the Tax on Electricity Production (7%) until December 31st
- Royal Decree Law 6/2022: extension until June 30th of the reduction of VAT to 10%, of the Electricity Tax to 0.5% and the
suspension of the 7% tax on electricity production

110
GENERATION: SPAIN
CNMC Circular 3/2020
• Electricity network tax is only applied to final consumption and to own generation consumption:
- The generation activity does not pay electricity network tax since January 2019 (previously 0.5 €/MWh)
- Generators will have to pay electricity network tax only for the net energy they consume from the network
- Energy stored in pumping or in batteries will not pay any electricity network tax
Capacity payments
• Investment incentive: € 10,000/ MW per year during 20 years
- For installations built from 1998 to 2015, which did not have any subsidized regime.
- Received by generation facilities under the ordinary regime of the peninsular system with installed power capacity greater
than or equal to 50 MW.
- Initially it was established as a payment of € 20,000 /MW per year during the first 10 years of the plant life, but it was
modified under the Royal Decree-Law 9/2013 that determined the current parameters. Under this new regulation, the
remaining number of years entitled to receive this capacity payment were calculated for each installation, doubling the
period and reducing the amount to the above mentioned €10,000. For this reason, the end of the incentive depends on the
outstanding years from 2013 on. Moreover, the Royal Decree-Law 9/2013 limited the right of awarding the incentive for
new plants with Commercial Operation Date up to 1 January 2016.
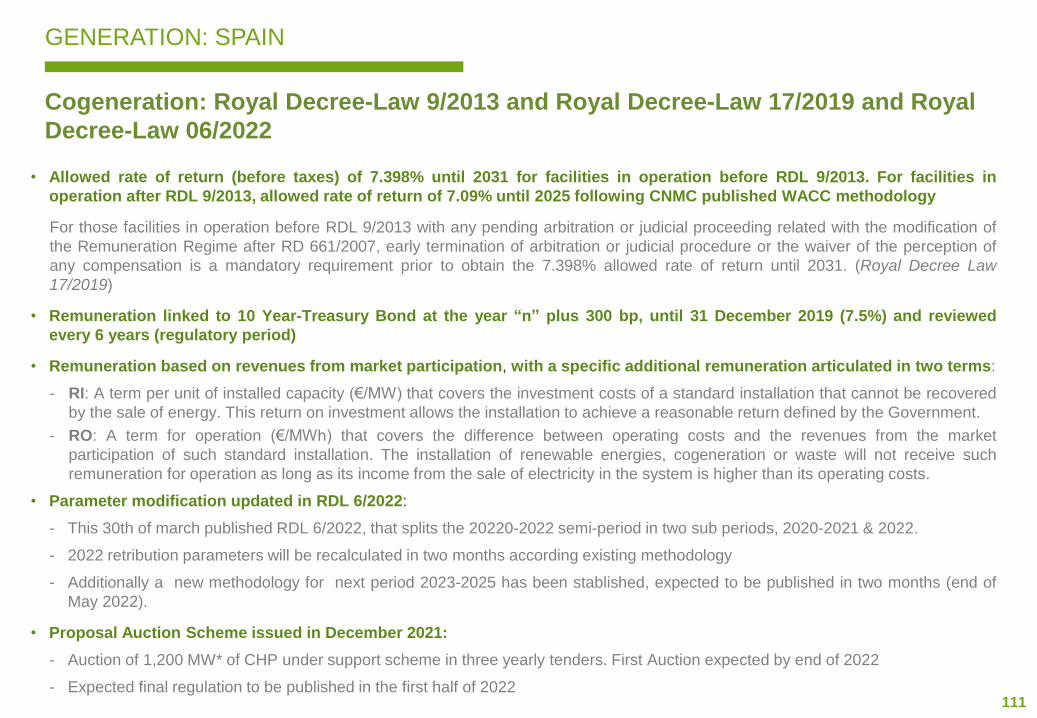
111
GENERATION: SPAIN
Cogeneration: Royal Decree-Law 9/2013 and Royal Decree-Law 17/2019 and Royal
Decree-Law 06/2022
• Allowed rate of return (before taxes) of 7.398% until 2031 for facilities in operation before RDL 9/2013. For facilities in
operation after RDL 9/2013, allowed rate of return of 7.09% until 2025 following CNMC published WACC methodology
For those facilities in operation before RDL 9/2013 with any pending arbitration or judicial proceeding related with the modification of
the Remuneration Regime after RD 661/2007, early termination of arbitration or judicial procedure or the waiver of the perception of
any compensation is a mandatory requirement prior to obtain the 7.398% allowed rate of return until 2031. (Royal Decree Law
17/2019)
• Remuneration linked to 10 Year-Treasury Bond at the year “n” plus 300 bp, until 31 December 2019 (7.5%) and reviewed
every 6 years (regulatory period)
• Remuneration based on revenues from market participation, with a specific additional remuneration articulated in two terms:
- RI: A term per unit of installed capacity (€/MW) that covers the investment costs of a standard installation that cannot be recovered
by the sale of energy. This return on investment allows the installation to achieve a reasonable return defined by the Government.
- RO: A term for operation (€/MWh) that covers the difference between operating costs and the revenues from the market
participation of such standard installation. The installation of renewable energies, cogeneration or waste will not receive such
remuneration for operation as long as its income from the sale of electricity in the system is higher than its operating costs.
• Parameter modification updated in RDL 6/2022:
- This 30th of march published RDL 6/2022, that splits the 20220-2022 semi-period in two sub periods, 2020-2021 & 2022.
- 2022 retribution parameters will be recalculated in two months according existing methodology
- Additionally a new methodology for next period 2023-2025 has been stablished, expected to be published in two months (end of
May 2022).
• Proposal Auction Scheme issued in December 2021:
- Auction of 1,200 MW* of CHP under support scheme in three yearly tenders. First Auction expected by end of 2022
- Expected final regulation to be published in the first half of 2022
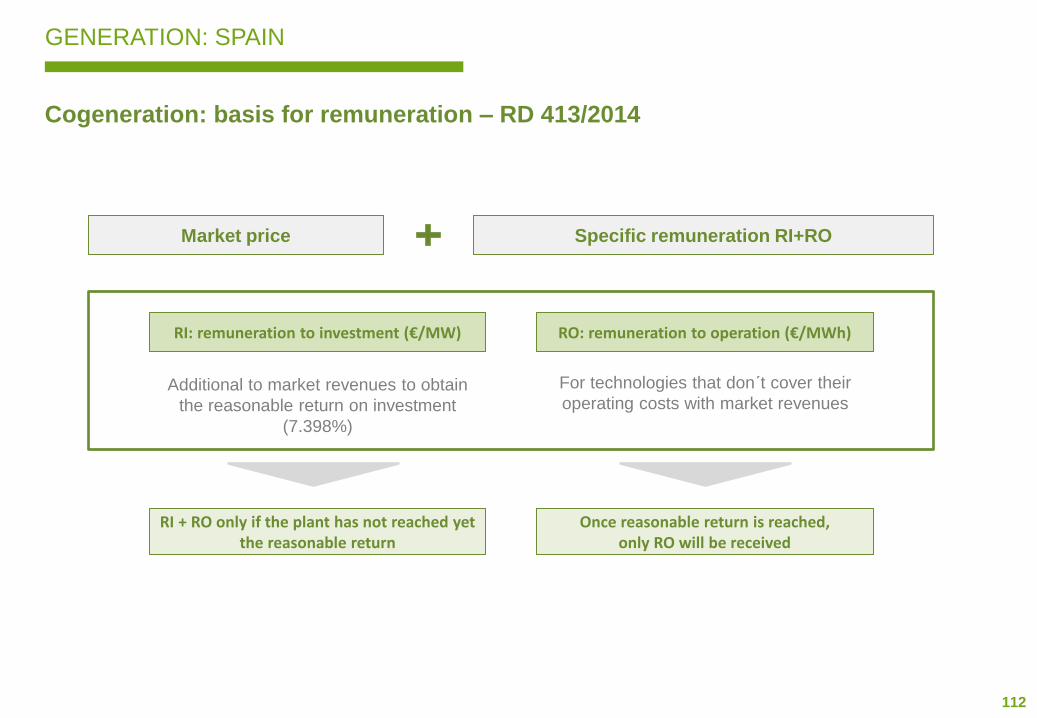
112
GENERATION: SPAIN
Cogeneration: basis for remuneration – RD 413/2014
Market price Specific remuneration RI+RO
RI: remuneration to investment (€/MW) RO: remuneration to operation (€/MWh)
Additional to market revenues to obtain
the reasonable return on investment
(7.398%)
For technologies that don´t cover their
operating costs with market revenues
RI + RO only if the plant has not reached yet the reasonable return
Once reasonable return is reached, only RO will be received

113
GENERATION: SPAIN
Nuclear
Note: The dismantling and management of radioactive waste is an essential public service, whose management is entrusted by law
to the State-owned company Enresa (Empresa Nacional de Residuos Radiactivos, S.A.)
• The Spanish National Energy and Climate Plan (PNIEC) considers that 4,200 MW of nuclear generation plants will shut down in the
period 2025 – 2030.
• The nuclear operators, together with ENRESA, has agreed on a schedule for closure of Spanish nuclear power plants. This closure
schedule complies with all safety, technical, ageing, waste and decommissioning resources criteria.
• Almaraz I&II, Vandellós II, Cofrentes and Asco I&II nuclear power plants have already obtained the approval for Operating License
Renewal (up to the closing dates agreed in the protocol signed with ENRESA for all plants except Vandellos II (until 26th July 2030)
and Ascó II (until 1st October 2031).
• Royal Decree 750/2019 has risen the waste fee charged by ENRESA to 7.98 €/MWh as of 1st January 2020 (+ 19% vs. previous
rate of € 6.69 / MWh).
Closing schedule
Almaraz I nov-27 44.2 years
Almaraz II oct-28 44.3 years
Ascó I oct-30 45.8 years
Cofrentes nov-30 45.6 years
Ascó II sep-32 46.4 years
Vandellós II feb-35 46.9 years
Trillo may-35 46.7 years
Average life 45.7 years
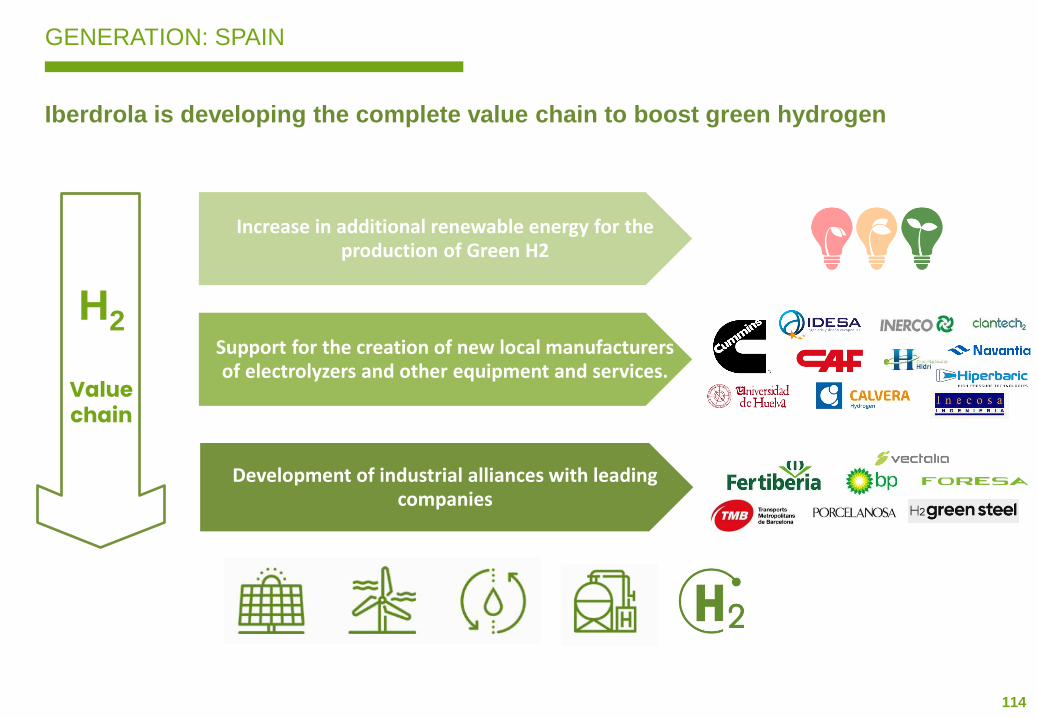
114
GENERATION: SPAIN
Iberdrola is developing the complete value chain to boost green hydrogen
Increase in additional renewable energy for the production of Green H2
Support for the creation of new local manufacturers of electrolyzers and other equipment and services.
Development of industrial alliances with leading companies
H2
Value chain
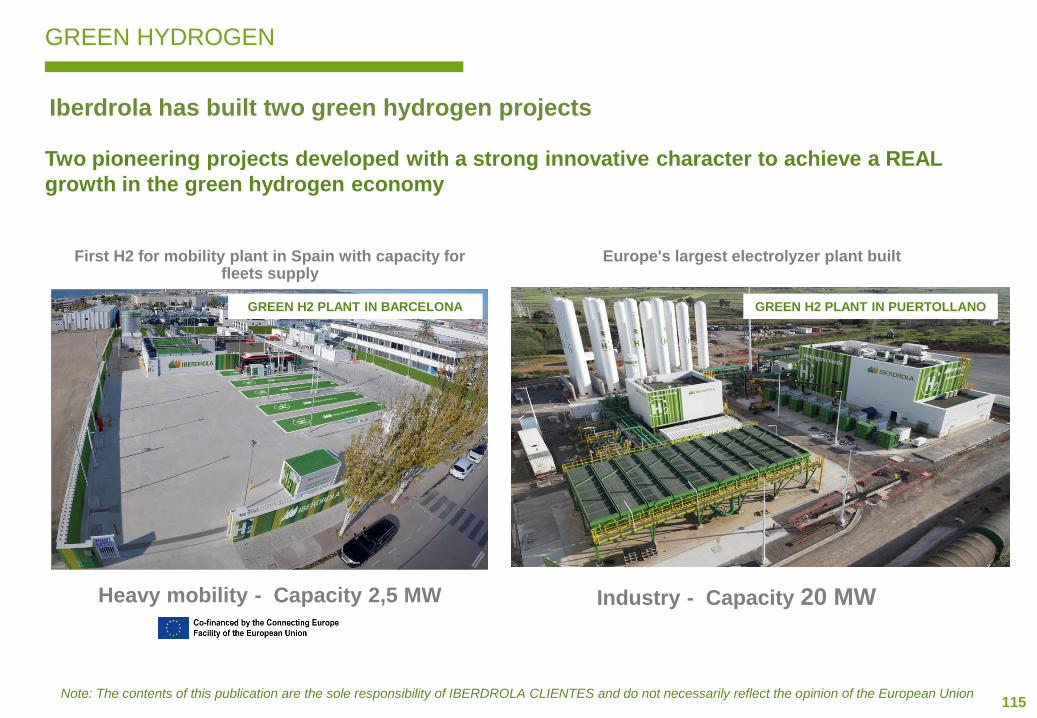
115
GREEN HYDROGEN
Iberdrola has built two green hydrogen projects
Two pioneering projects developed with a strong innovative character to achieve a REAL
growth in the green hydrogen economy
First H2 for mobility plant in Spain with capacity for fleets supply
Heavy mobility - Capacity 2,5 MW
Europe's largest electrolyzer plant built
GREEN H2 PLANT IN BARCELONA GREEN H2 PLANT IN PUERTOLLANO
Industry - Capacity 20 MW
Note: The contents of this publication are the sole responsibility of IBERDROLA CLIENTES and do not necessarily reflect the opinion of the European Union
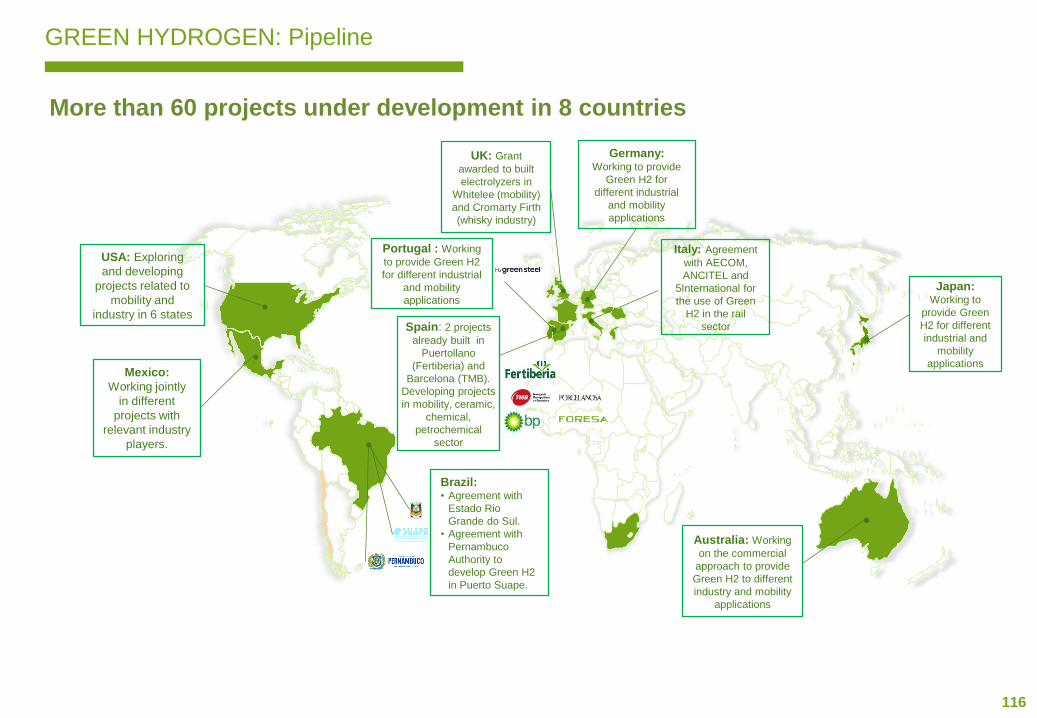
116
Spain: 2 projects
already built in
Puertollano
(Fertiberia) and
Barcelona (TMB).
Developing projects
in mobility, ceramic,
chemical,
petrochemical
sector
UK: Grant
awarded to built
electrolyzers in
Whitelee (mobility)
and Cromarty Firth
(whisky industry)
Italy: Agreement
with AECOM,
ANCITEL and
5International for
the use of Green
H2 in the rail
sector
Australia: Working
on the commercial
approach to provide
Green H2 to different
industry and mobility
applications
Brazil: • Agreement with
Estado Rio
Grande do Sul.
• Agreement with
Pernambuco
Authority to
develop Green H2
in Puerto Suape.
Mexico:
Working jointly
in different
projects with
relevant industry
players.
USA: Exploring
and developing
projects related to
mobility and
industry in 6 states
Portugal : Working
to provide Green H2
for different industrial
and mobility
applications
Germany: Working to provide
Green H2 for
different industrial
and mobility
applications
Japan: Working to
provide Green
H2 for different
industrial and
mobility
applications
GREEN HYDROGEN: Pipeline
More than 60 projects under development in 8 countries
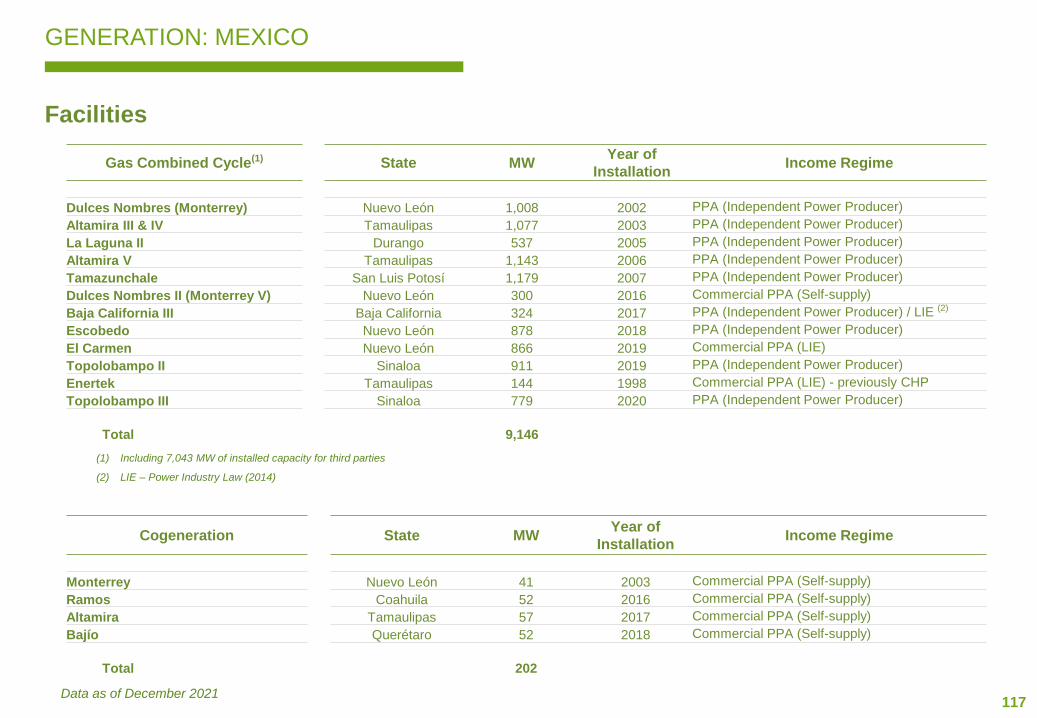
117
GENERATION: MEXICO
Facilities
Data as of December 2021
Cogeneration State MWYear of
InstallationIncome Regime
Monterrey Nuevo León 41 2003 Commercial PPA (Self-supply)
Ramos Coahuila 52 2016 Commercial PPA (Self-supply)
Altamira Tamaulipas 57 2017 Commercial PPA (Self-supply)
Bajío Querétaro 52 2018 Commercial PPA (Self-supply)
Total 202
(1) Including 7,043 MW of installed capacity for third parties
(2) LIE – Power Industry Law (2014)
Gas Combined Cycle(1) State MWYear of
InstallationIncome Regime
Dulces Nombres (Monterrey) Nuevo León 1,008 2002 PPA (Independent Power Producer)
Altamira III & IV Tamaulipas 1,077 2003 PPA (Independent Power Producer)
La Laguna II Durango 537 2005 PPA (Independent Power Producer)
Altamira V Tamaulipas 1,143 2006 PPA (Independent Power Producer)
Tamazunchale San Luis Potosí 1,179 2007 PPA (Independent Power Producer)
Dulces Nombres II (Monterrey V) Nuevo León 300 2016 Commercial PPA (Self-supply)
Baja California III Baja California 324 2017 PPA (Independent Power Producer) / LIE (2)
Escobedo Nuevo León 878 2018 PPA (Independent Power Producer)
El Carmen Nuevo León 866 2019 Commercial PPA (LIE)
Topolobampo II Sinaloa 911 2019 PPA (Independent Power Producer)
Enertek Tamaulipas 144 1998 Commercial PPA (LIE) - previously CHP
Topolobampo III Sinaloa 779 2020 PPA (Independent Power Producer)
Total 9,146
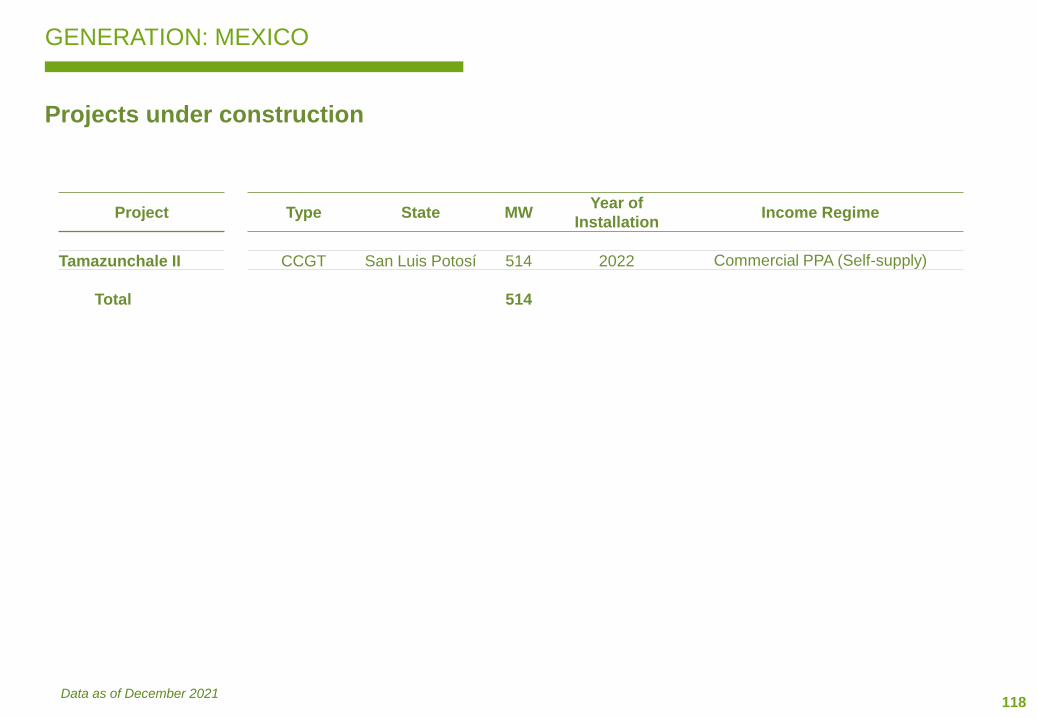
118
GENERATION: MEXICO
Projects under construction
Project Type State MWYear of
InstallationIncome Regime
Tamazunchale II CCGT San Luis Potosí 514 2022 Commercial PPA (Self-supply)
Total 514
Data as of December 2021
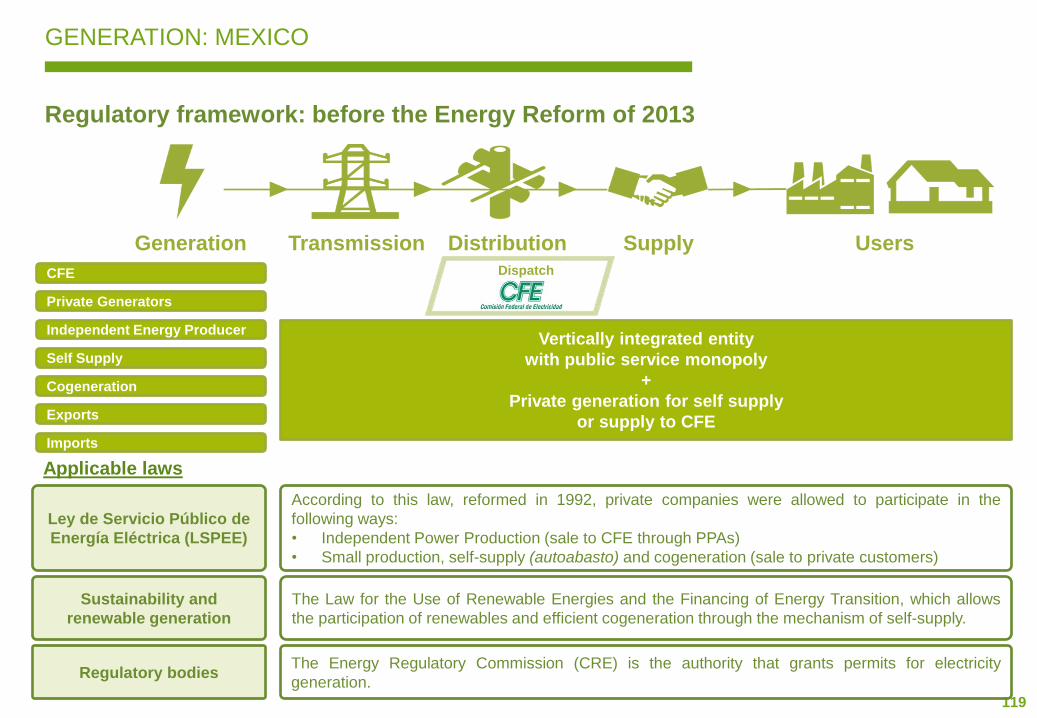
119
Applicable laws
Ley de Servicio Público de
Energía Eléctrica (LSPEE)
Regulatory bodies
Sustainability and
renewable generation
According to this law, reformed in 1992, private companies were allowed to participate in the
following ways:
• Independent Power Production (sale to CFE through PPAs)
• Small production, self-supply (autoabasto) and cogeneration (sale to private customers)
The Energy Regulatory Commission (CRE) is the authority that grants permits for electricity
generation.
The Law for the Use of Renewable Energies and the Financing of Energy Transition, which allows
the participation of renewables and efficient cogeneration through the mechanism of self-supply.
Generation Transmission Distribution Supply Users
CFE
Private Generators
Independent Energy Producer
Self Supply
Cogeneration
Exports
Imports
Vertically integrated entity
with public service monopoly
+
Private generation for self supply
or supply to CFE
Dispatch
Regulatory framework: before the Energy Reform of 2013
GENERATION: MEXICO
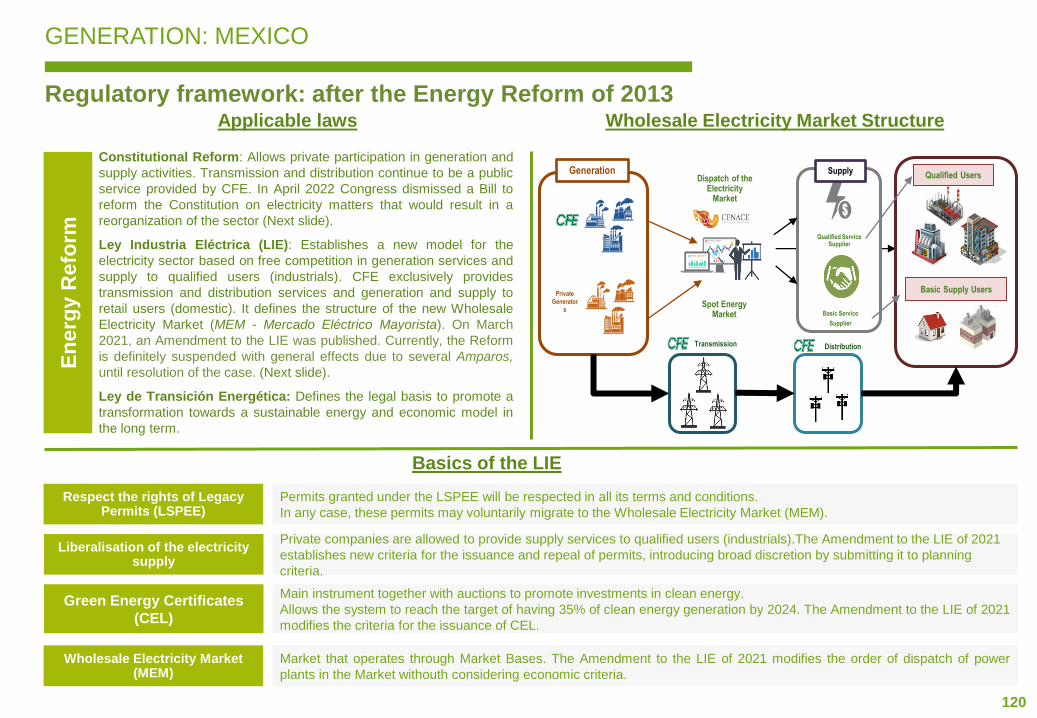
120
Liberalisation of the electricity supply
Respect the rights of Legacy Permits (LSPEE)
Green Energy Certificates
(CEL)
Wholesale Electricity Market(MEM)
Basics of the LIE
Applicable laws Wholesale Electricity Market Structure
En
erg
yR
efo
rm
Constitutional Reform: Allows private participation in generation and
supply activities. Transmission and distribution continue to be a public
service provided by CFE. In April 2022 Congress dismissed a Bill to
reform the Constitution on electricity matters that would result in a
reorganization of the sector (Next slide).
Ley Industria Eléctrica (LIE): Establishes a new model for the
electricity sector based on free competition in generation services and
supply to qualified users (industrials). CFE exclusively provides
transmission and distribution services and generation and supply to
retail users (domestic). It defines the structure of the new Wholesale
Electricity Market (MEM - Mercado Eléctrico Mayorista). On March
2021, an Amendment to the LIE was published. Currently, the Reform
is definitely suspended with general effects due to several Amparos,
until resolution of the case. (Next slide).
Ley de Transición Energética: Defines the legal basis to promote a
transformation towards a sustainable energy and economic model in
the long term.
Private
Generator
s
Transmission Distribution
GenerationDispatch of the
Electricity Market
Basic Supply Users
Qualified UsersSupply
Qualified Service Supplier
Basic Service
Supplier
Spot Energy Market
Regulatory framework: after the Energy Reform of 2013
GENERATION: MEXICO
Private companies are allowed to provide supply services to qualified users (industrials).The Amendment to the LIE of 2021
establishes new criteria for the issuance and repeal of permits, introducing broad discretion by submitting it to planning
criteria.
Permits granted under the LSPEE will be respected in all its terms and conditions.
In any case, these permits may voluntarily migrate to the Wholesale Electricity Market (MEM).
Main instrument together with auctions to promote investments in clean energy.
Allows the system to reach the target of having 35% of clean energy generation by 2024. The Amendment to the LIE of 2021
modifies the criteria for the issuance of CEL.
Market that operates through Market Bases. The Amendment to the LIE of 2021 modifies the order of dispatch of power
plants in the Market withouth considering economic criteria.
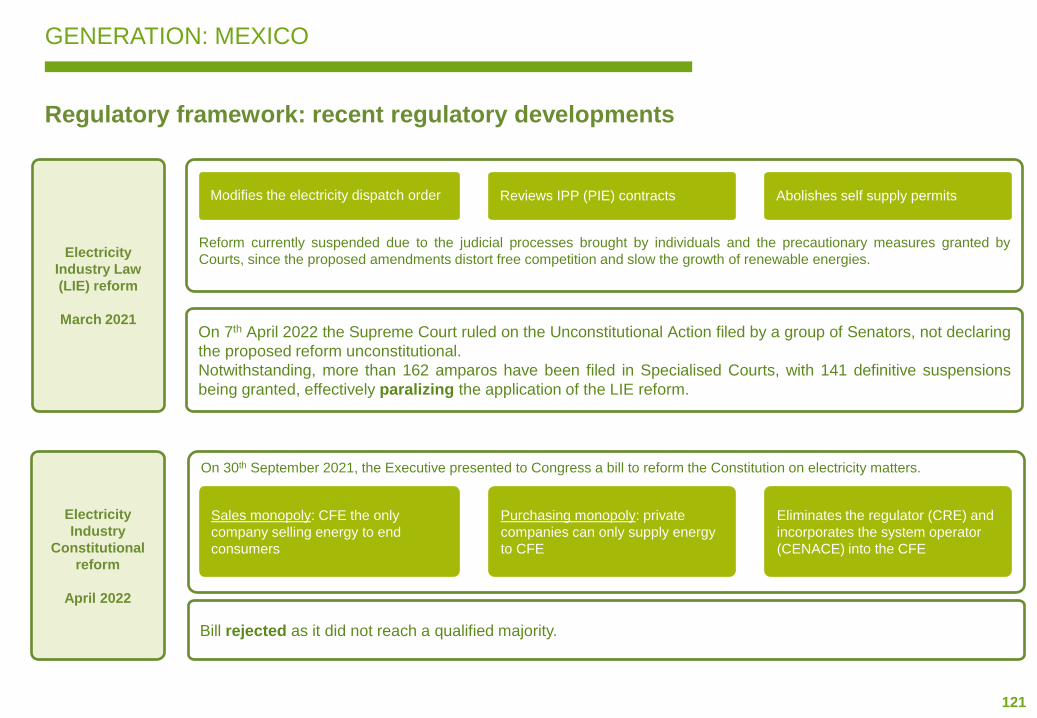
121
GENERATION: MEXICO
Regulatory framework: recent regulatory developments
Electricity
Industry
Constitutional
reform
April 2022
On 30th September 2021, the Executive presented to Congress a bill to reform the Constitution on electricity matters.
Electricity
Industry Law
(LIE) reform
March 2021
Reform currently suspended due to the judicial processes brought by individuals and the precautionary measures granted by
Courts, since the proposed amendments distort free competition and slow the growth of renewable energies.
On 7th April 2022 the Supreme Court ruled on the Unconstitutional Action filed by a group of Senators, not declaring
the proposed reform unconstitutional.
Notwithstanding, more than 162 amparos have been filed in Specialised Courts, with 141 definitive suspensions
being granted, effectively paralizing the application of the LIE reform.
Bill rejected as it did not reach a qualified majority.
Modifies the electricity dispatch order Reviews IPP (PIE) contracts Abolishes self supply permits
Sales monopoly: CFE the only
company selling energy to end
consumers
Purchasing monopoly: private
companies can only supply energy
to CFE
Eliminates the regulator (CRE) and
incorporates the system operator
(CENACE) into the CFE
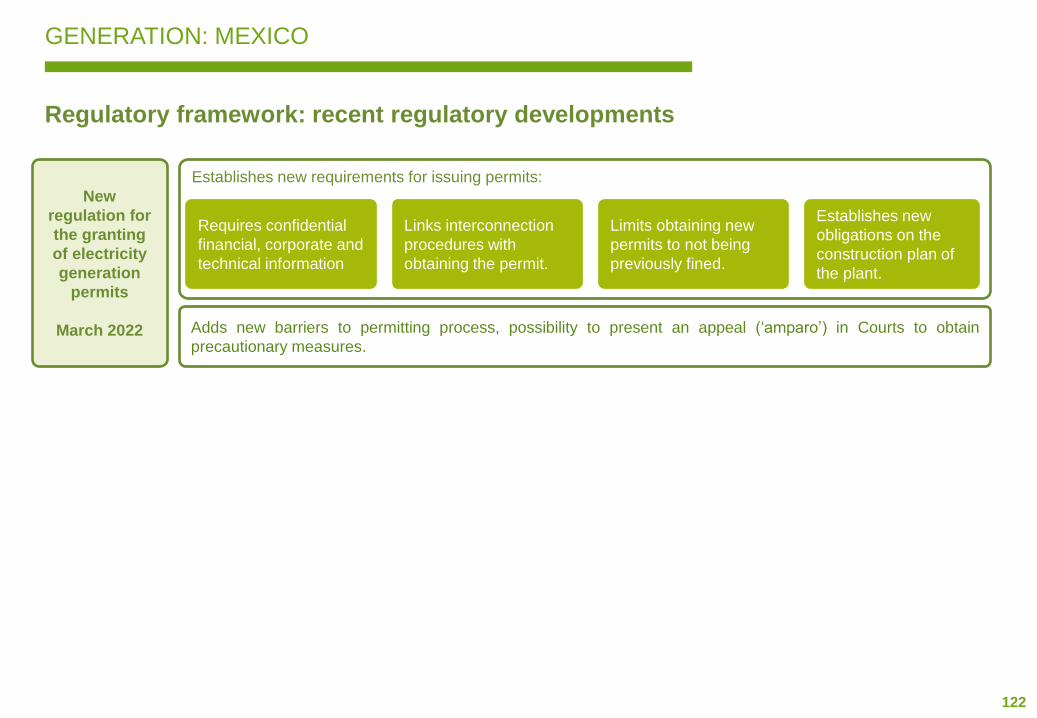
122
GENERATION: MEXICO
Regulatory framework: recent regulatory developments
New
regulation for
the granting
of electricity
generation
permits
March 2022
Establishes new requirements for issuing permits:
Requires confidential
financial, corporate and
technical information
Limits obtaining new
permits to not being
previously fined.
Links interconnection
procedures with
obtaining the permit.
Establishes new
obligations on the
construction plan of
the plant.
Adds new barriers to permitting process, possibility to present an appeal (‘amparo’) in Courts to obtain
precautionary measures.
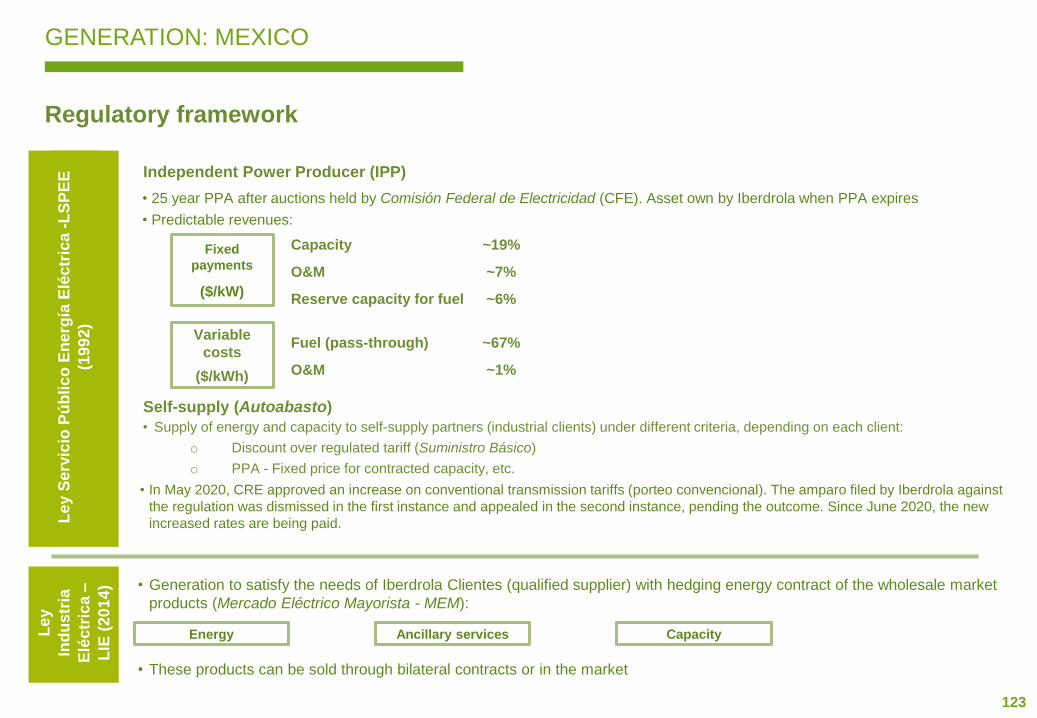
123
GENERATION: MEXICO
• 25 year PPA after auctions held by Comisión Federal de Electricidad (CFE). Asset own by Iberdrola when PPA expires
• Predictable revenues:
Le
y S
erv
icio
Pú
bli
co
En
erg
ía E
léc
tric
a -
LS
PE
E (
19
92
)
• Supply of energy and capacity to self-supply partners (industrial clients) under different criteria, depending on each client:
o Discount over regulated tariff (Suministro Básico)
o PPA - Fixed price for contracted capacity, etc.
Capacity ~19%
O&M ~7%
Reserve capacity for fuel ~6%
Fixed
payments
($/kW)
Variable
costs
($/kWh)
Fuel (pass-through) ~67%
O&M ~1%
Independent Power Producer (IPP)
Self-supply (Autoabasto)
• Generation to satisfy the needs of Iberdrola Clientes (qualified supplier) with hedging energy contract of the wholesale market
products (Mercado Eléctrico Mayorista - MEM):
• These products can be sold through bilateral contracts or in the market
Energy Ancillary services Capacity
Le
y S
erv
icio
Pú
blic
o E
ne
rgía
Elé
ctr
ica
-L
SP
EE
(19
92
)
Le
y
Ind
us
tria
Elé
ctr
ica
–
LIE
(2
01
4)
• In May 2020, CRE approved an increase on conventional transmission tariffs (porteo convencional). The amparo filed by Iberdrola against
the regulation was dismissed in the first instance and appealed in the second instance, pending the outcome. Since June 2020, the new
increased rates are being paid.
Regulatory framework
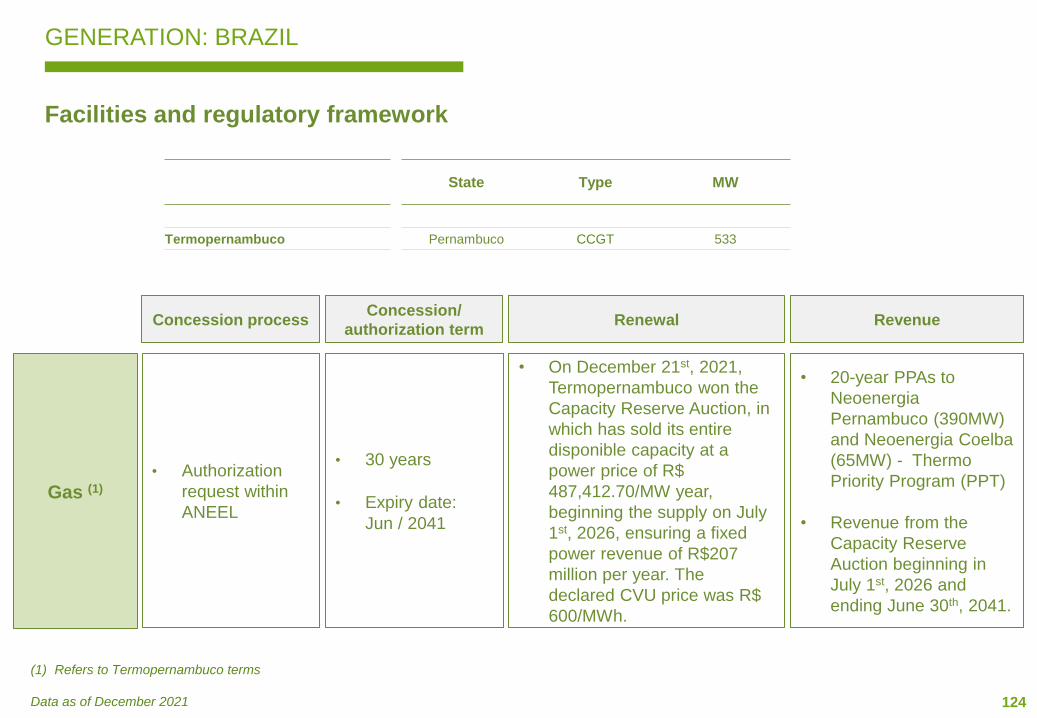
124
GENERATION: BRAZIL
Facilities and regulatory framework
State Type MW
Termopernambuco Pernambuco CCGT 533
Concession processConcession/
authorization termRenewal Revenue
Gas (1)
• Authorization
request within
ANEEL
• 30 years
• Expiry date:
Jun / 2041
• On December 21st, 2021,
Termopernambuco won the
Capacity Reserve Auction, in
which has sold its entire
disponible capacity at a
power price of R$
487,412.70/MW year,
beginning the supply on July
1st, 2026, ensuring a fixed
power revenue of R$207
million per year. The
declared CVU price was R$
600/MWh.
• 20-year PPAs to
Neoenergia
Pernambuco (390MW)
and Neoenergia Coelba
(65MW) - Thermo
Priority Program (PPT)
• Revenue from the
Capacity Reserve
Auction beginning in
July 1st, 2026 and
ending June 30th, 2041.
(1) Refers to Termopernambuco terms
Data as of December 2021
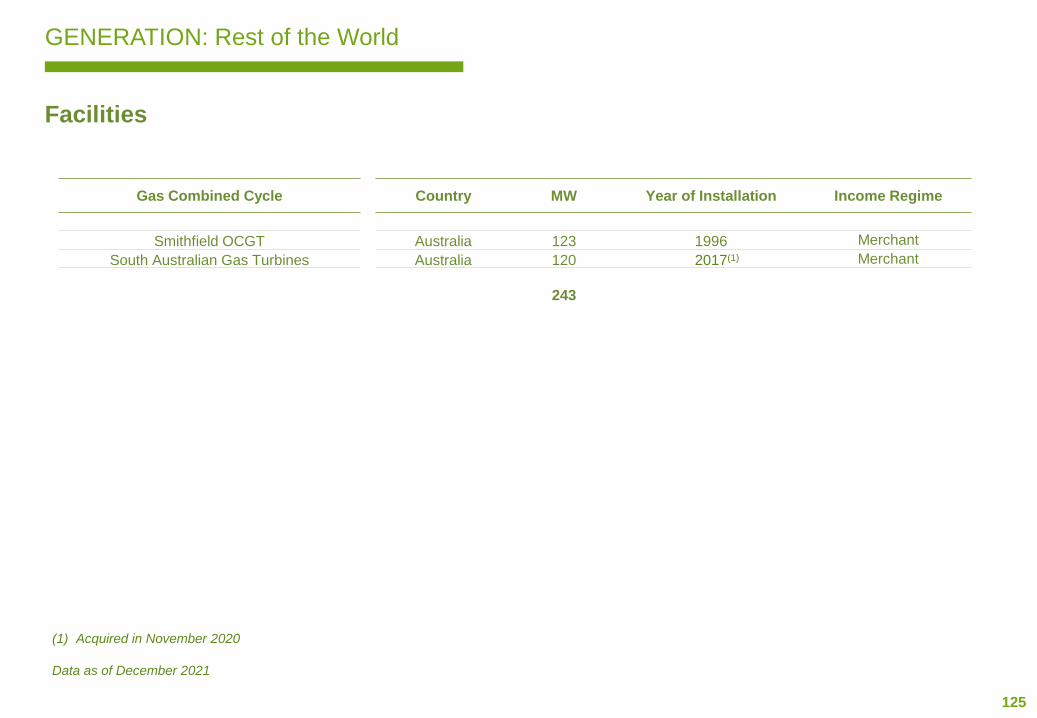
125
GENERATION: Rest of the World
Facilities
(1) Acquired in November 2020
Data as of December 2021
Gas Combined Cycle Country MW Year of Installation Income Regime
Smithfield OCGT Australia 123 1996 Merchant
South Australian Gas Turbines Australia 120 2017(1) Merchant
243
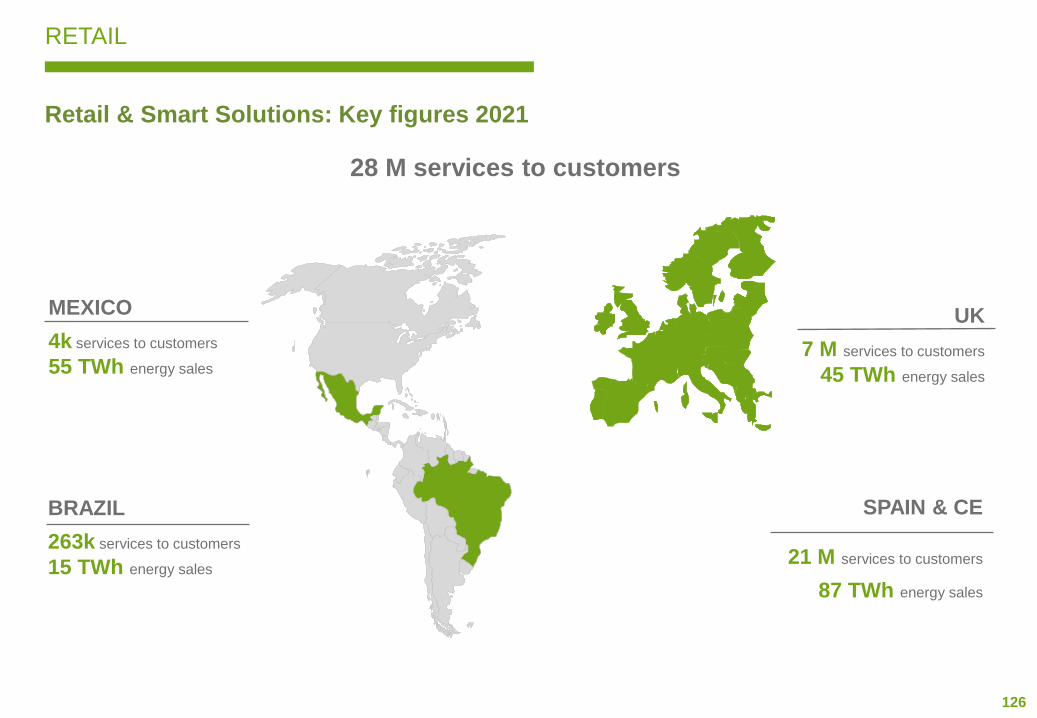
126
RETAIL
UK
7 M services to customers
45 TWh energy sales
BRAZIL
263k services to customers
15 TWh energy sales
MEXICO
4k services to customers
55 TWh energy sales
SPAIN & CE
21 M services to customers
87 TWh energy sales
28 M services to customers
Retail & Smart Solutions: Key figures 2021
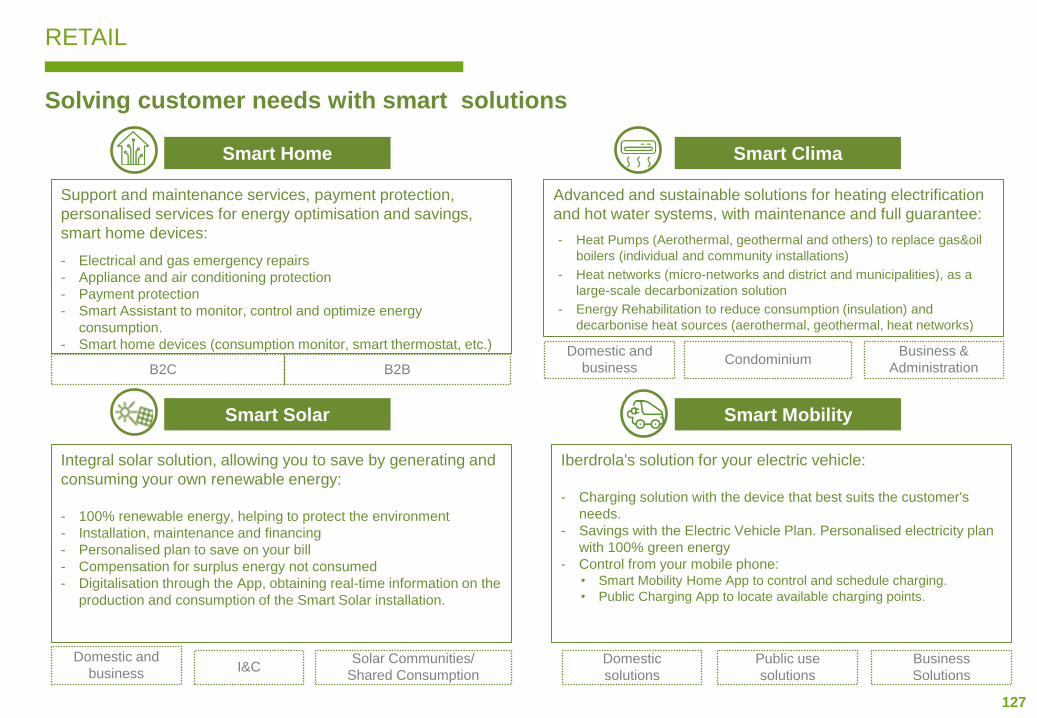
127
RETAIL
Solving customer needs with smart solutions
Smart Home
Smart MobilitySmart Solar
Smart Clima
Support and maintenance services, payment protection,
personalised services for energy optimisation and savings,
smart home devices:
- Electrical and gas emergency repairs
- Appliance and air conditioning protection
- Payment protection
- Smart Assistant to monitor, control and optimize energy
consumption.
- Smart home devices (consumption monitor, smart thermostat, etc.)
Advanced and sustainable solutions for heating electrification
and hot water systems, with maintenance and full guarantee:
- Heat Pumps (Aerothermal, geothermal and others) to replace gas&oil
boilers (individual and community installations)
- Heat networks (micro-networks and district and municipalities), as a
large-scale decarbonization solution
- Energy Rehabilitation to reduce consumption (insulation) and
decarbonise heat sources (aerothermal, geothermal, heat networks)
I&C
Integral solar solution, allowing you to save by generating and
consuming your own renewable energy:
- 100% renewable energy, helping to protect the environment
- Installation, maintenance and financing
- Personalised plan to save on your bill
- Compensation for surplus energy not consumed
- Digitalisation through the App, obtaining real-time information on the
production and consumption of the Smart Solar installation.
Solar Communities/
Shared Consumption
Iberdrola's solution for your electric vehicle:
- Charging solution with the device that best suits the customer's
needs.
- Savings with the Electric Vehicle Plan. Personalised electricity plan
with 100% green energy
- Control from your mobile phone:• Smart Mobility Home App to control and schedule charging.
• Public Charging App to locate available charging points.
Public use
solutions
Domestic
solutions
Business
Solutions
CondominiumDomestic and
business
Business &
Administration
Domestic and
business
B2BB2C

128
RETAIL
Services to customers: >28 M contracts
Data as of December 2021
Thousand contracts 2021 2020 Var. (%)
Spain & CE 20,813 19,206 8.4%Liberalised 17,629 15,740 12.0%
Electricity 7,580 7,290 4.0%
Gas 1,437 1,361 5.6%
Smart solutions 8,612 7,089 21.5%
Last resort tariff 3,184 3,466 -8.1%
UK 6,990 6,815 2.6%Electricity 2,844 2,827 0.6%
Gas 1,923 1,912 0.6%
Smart Solutions 363 360 0.7%
Smart Meters 1,859 1,716 8.4%
Mexico 4 4 27.0%
Brazil 263 153 72.4%Electricity 0.8 0.5 57.6%
Smart Solutions 262 152 72.4%
TOTAL 28,070.0 26,177.4 7.2%

129
RETAIL: SPAIN
Regulated tariff (PVPC) and Electricity Prices
PVPC – RD 216/2014
• Regulated tariff. Entitled consumers with capacity contracted < 10 kW
• Components:
- Hourly prices in wholesale market, published by Red Eléctrica
- Access tariff and fees, published in the Official Spanish Gazette (BOE)
- Supply margin, published in the Official Spanish Gazette (BOE)
- Taxes (VAT – 21% / Electricity tax – around 5%)
High electricity prices in 2021 and 2022
2021 has been characterized by high prices and volatility in gas and CO2 prices, especially during the second half of the year,
increasing prices in daily wholesale electricity markets throughout Europe. In Spain, this effect has been aggravated by the existence
of the mentioned regulated tariff for households (PVPC), linked to the spot market price. The Government has taken different palliative
and consumer protection measures.
Different extensions of the protection measures of the social shield have been carried out, which include the prohibition of cutting off
the supply of electricity and natural gas for vulnerable consumers. This measures were in force until 28th February 2022 and were
regulated through different Royal Decree Laws (RD-Law 8/2021, RD-Law 16/2021 and RD-Law 21/2021)
Additionally, RD-Law 17/2021 created the “minimum vital supply”. Also, it extended the number of months (to a total of six) that must
elapse from the moment of the first non-payment of the electricity bill, until the retail company can request the electricity distributor to
cut off the supply. During these 6 months the maximum power will be limited to 3.5 kW
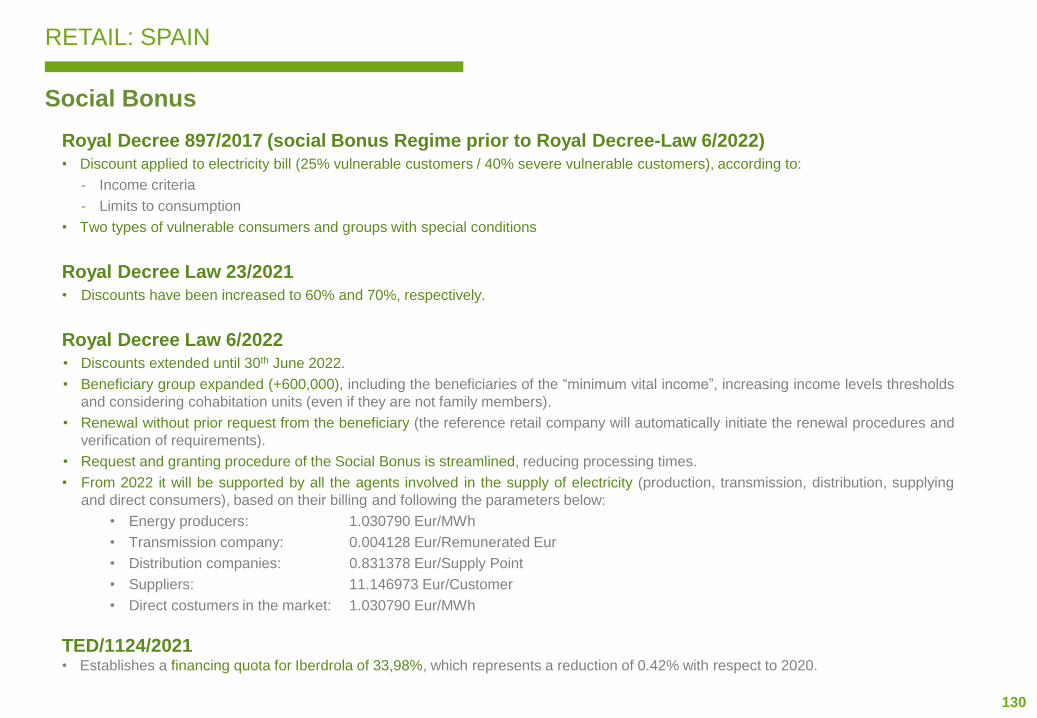
130
RETAIL: SPAIN
Social Bonus
Royal Decree 897/2017 (social Bonus Regime prior to Royal Decree-Law 6/2022)
• Discount applied to electricity bill (25% vulnerable customers / 40% severe vulnerable customers), according to:
- Income criteria
- Limits to consumption
• Two types of vulnerable consumers and groups with special conditions
Royal Decree Law 23/2021
• Discounts have been increased to 60% and 70%, respectively.
Royal Decree Law 6/2022
• Discounts extended until 30th June 2022.
• Beneficiary group expanded (+600,000), including the beneficiaries of the “minimum vital income”, increasing income levels thresholds
and considering cohabitation units (even if they are not family members).
• Renewal without prior request from the beneficiary (the reference retail company will automatically initiate the renewal procedures and
verification of requirements).
• Request and granting procedure of the Social Bonus is streamlined, reducing processing times.
• From 2022 it will be supported by all the agents involved in the supply of electricity (production, transmission, distribution, supplying
and direct consumers), based on their billing and following the parameters below:
• Energy producers: 1.030790 Eur/MWh
• Transmission company: 0.004128 Eur/Remunerated Eur
• Distribution companies: 0.831378 Eur/Supply Point
• Suppliers: 11.146973 Eur/Customer
• Direct costumers in the market: 1.030790 Eur/MWh
TED/1124/2021• Establishes a financing quota for Iberdrola of 33,98%, which represents a reduction of 0.42% with respect to 2020.
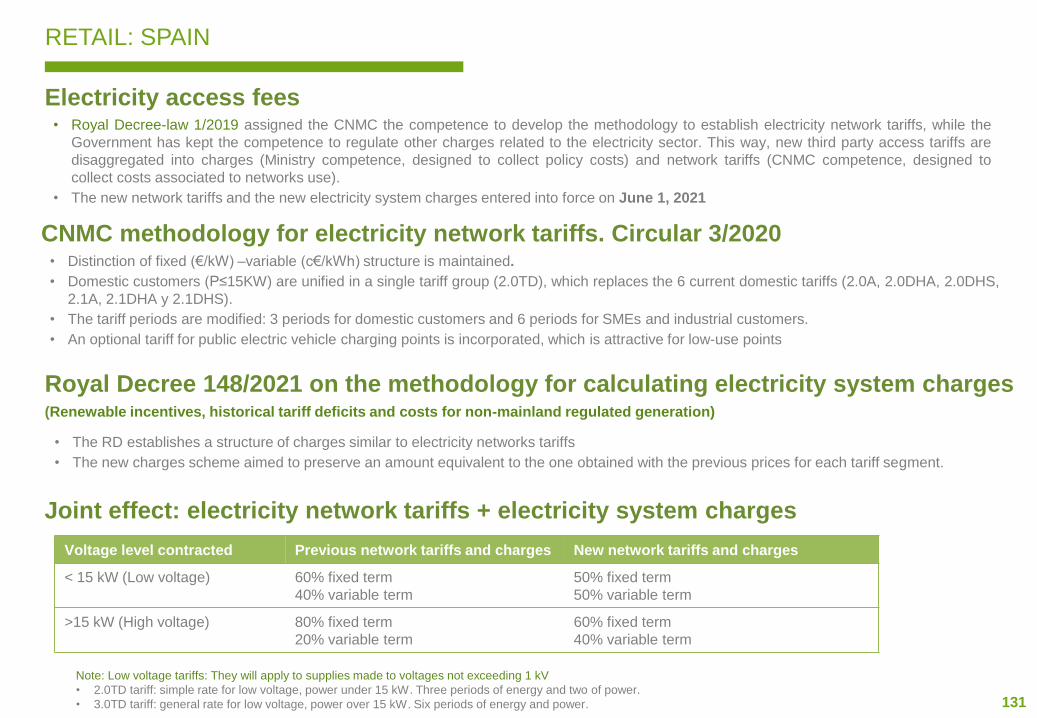
131
RETAIL: SPAIN
Electricity access fees • Royal Decree-law 1/2019 assigned the CNMC the competence to develop the methodology to establish electricity network tariffs, while the
Government has kept the competence to regulate other charges related to the electricity sector. This way, new third party access tariffs are
disaggregated into charges (Ministry competence, designed to collect policy costs) and network tariffs (CNMC competence, designed to
collect costs associated to networks use).
• The new network tariffs and the new electricity system charges entered into force on June 1, 2021
Note: Low voltage tariffs: They will apply to supplies made to voltages not exceeding 1 kV
• 2.0TD tariff: simple rate for low voltage, power under 15 kW. Three periods of energy and two of power.
• 3.0TD tariff: general rate for low voltage, power over 15 kW. Six periods of energy and power.
Royal Decree 148/2021 on the methodology for calculating electricity system charges(Renewable incentives, historical tariff deficits and costs for non-mainland regulated generation)
• The RD establishes a structure of charges similar to electricity networks tariffs
• The new charges scheme aimed to preserve an amount equivalent to the one obtained with the previous prices for each tariff segment.
CNMC methodology for electricity network tariffs. Circular 3/2020• Distinction of fixed (€/kW) –variable (c€/kWh) structure is maintained.
• Domestic customers (P≤15KW) are unified in a single tariff group (2.0TD), which replaces the 6 current domestic tariffs (2.0A, 2.0DHA, 2.0DHS,
2.1A, 2.1DHA y 2.1DHS).
• The tariff periods are modified: 3 periods for domestic customers and 6 periods for SMEs and industrial customers.
• An optional tariff for public electric vehicle charging points is incorporated, which is attractive for low-use points
Joint effect: electricity network tariffs + electricity system charges
Voltage level contracted Previous network tariffs and charges New network tariffs and charges
< 15 kW (Low voltage) 60% fixed term
40% variable term
50% fixed term
50% variable term
>15 kW (High voltage) 80% fixed term
20% variable term
60% fixed term
40% variable term
132
RETAIL: UK REGULATORY ENVIRONMENT
Form of Control
• Operates in the liberalised UK energy market for gas and electricity under the energy regulator Ofgem with a regulatory framework of
both prescriptive and principles based obligations.
• As of April 2021, the UK domestic energy market consists of approximately 23.8m gas and 28.8m electricity accounts.*
Supplier Exits
• Since January 2021, 30 suppliers have exited the market through the Ofgem Supplier of Last Resort (SoLR) process, while Bulb Energy
entered energy supply company administration under a Special Administration Regime, leaving ~21 supplier in the UK market.
Price Regulation
• Price regulation exists for certain customer groups on default tariffs (including standard variable tariffs) through the Default Tariff Cap,
which came into effect 1 January 2019 and was extended to include prepayment meter customers from 1 January 2021, following the
expiry of the prepayment meter cap (which was in force from April 2017).
• Ofgem estimates that the default tariff impacts around 22 million households - significantly higher than in previous years with increased
wholesale price volatility resulting in more customers defaulting to the cap rather than choosing a new competitive tariff.
• The level of the default tariff is reviewed every 6 months. However, due to recent market volatility Ofgem is consulting on a number of
potential changes to the cap, including proposals for more frequent updates to the cap levels. Under current legislation, it may be
extended annually until 2023 if Ofgem believe conditions are not in place for effective competition. Moreover, plans have recently been
announced to enable the cap to be extended beyond 2023.
Obligated support for low income and fuel poor customers
• Warm Home Discount is a government scheme aimed at addressing fuel poverty and takes the form of a one-off discount on energy bills
which, in the year to 31 March 2021, was paid to over 2.26 million customers. The scheme will be continued until at least March 2026
with some amendments to the structure of the scheme being implemented.
• Energy Company Obligation Scheme is a government scheme to help reduce carbon emissions and tackle fuel poverty. The scheme
requires suppliers to invest in energy efficient measures with the obligation based on customer numbers and supply volumes.
• As part of its reaction to the current cost of living crisis, Government has announced its Energy Bills Support Scheme, which provides
£200 towards energy bills from October 2022 with an equivalent amount being recovered over five subsequent years (£40 per year).
* As there is no updated Ofgem State of the Market Report since Oct 2019, figures sourced from Cornwall Insights Domestic Market Share Survey, Q2 2021.
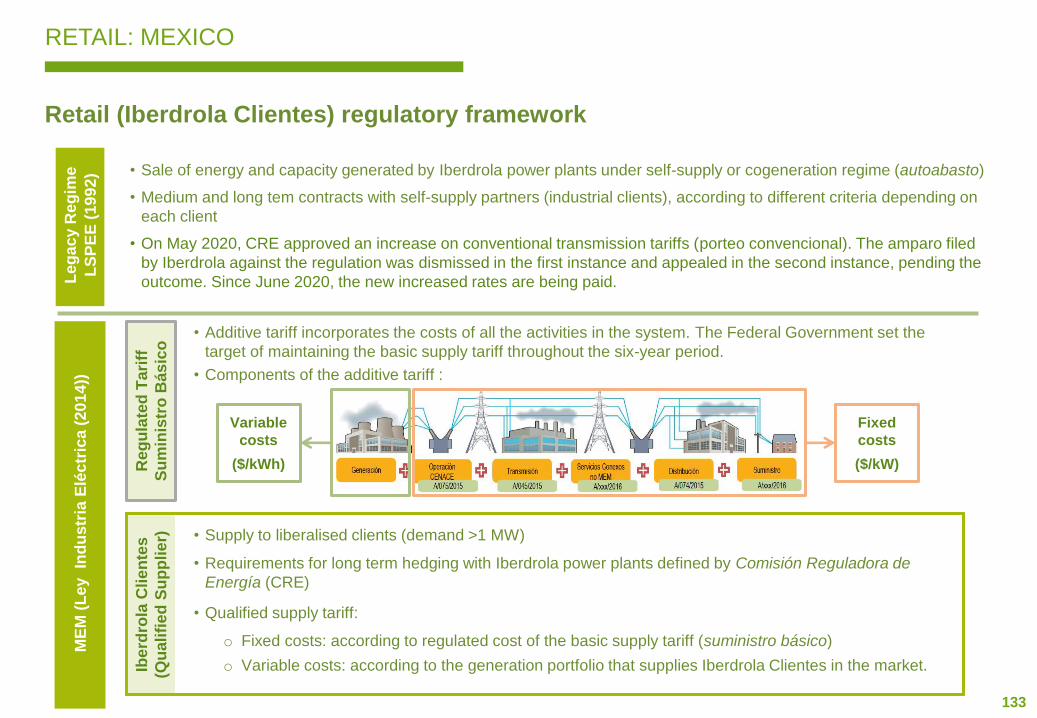
133
RETAIL: MEXICO
Ibe
rdro
la C
lie
nte
s
(Qu
ali
fie
d S
up
plie
r)
Le
ga
cy R
eg
ime
LS
PE
E (
19
92
) • Sale of energy and capacity generated by Iberdrola power plants under self-supply or cogeneration regime (autoabasto)
• Medium and long tem contracts with self-supply partners (industrial clients), according to different criteria depending on
each client
• On May 2020, CRE approved an increase on conventional transmission tariffs (porteo convencional). The amparo filed
by Iberdrola against the regulation was dismissed in the first instance and appealed in the second instance, pending the
outcome. Since June 2020, the new increased rates are being paid.
Reg
ula
ted
Ta
riff
Su
min
istr
oB
ás
ico
• Additive tariff incorporates the costs of all the activities in the system. The Federal Government set the
target of maintaining the basic supply tariff throughout the six-year period.
• Components of the additive tariff :
Fixed
costs
($/kW)
Variable
costs
($/kWh)
ME
M (
Ley
Ind
us
tria
Elé
ctr
ica
(20
14
))
• Supply to liberalised clients (demand >1 MW)
• Requirements for long term hedging with Iberdrola power plants defined by Comisión Reguladora de
Energía (CRE)
• Qualified supply tariff:
o Fixed costs: according to regulated cost of the basic supply tariff (suministro básico)
o Variable costs: according to the generation portfolio that supplies Iberdrola Clientes in the market.Ibe
rdro
la C
lie
nte
s
(Qu
ali
fie
d S
up
plie
r)
Ibe
rdro
la C
lie
nte
s
(Qu
ali
fie
d S
up
plie
r)
Retail (Iberdrola Clientes) regulatory framework

134
AGENDA
1. Iberdrola Today (page 5)
2. Networks (page 16)
3. Renewables (page 46)
4. Generation & Retail (page 101)
5. Financing (page 135)
6. ESG (page 148)
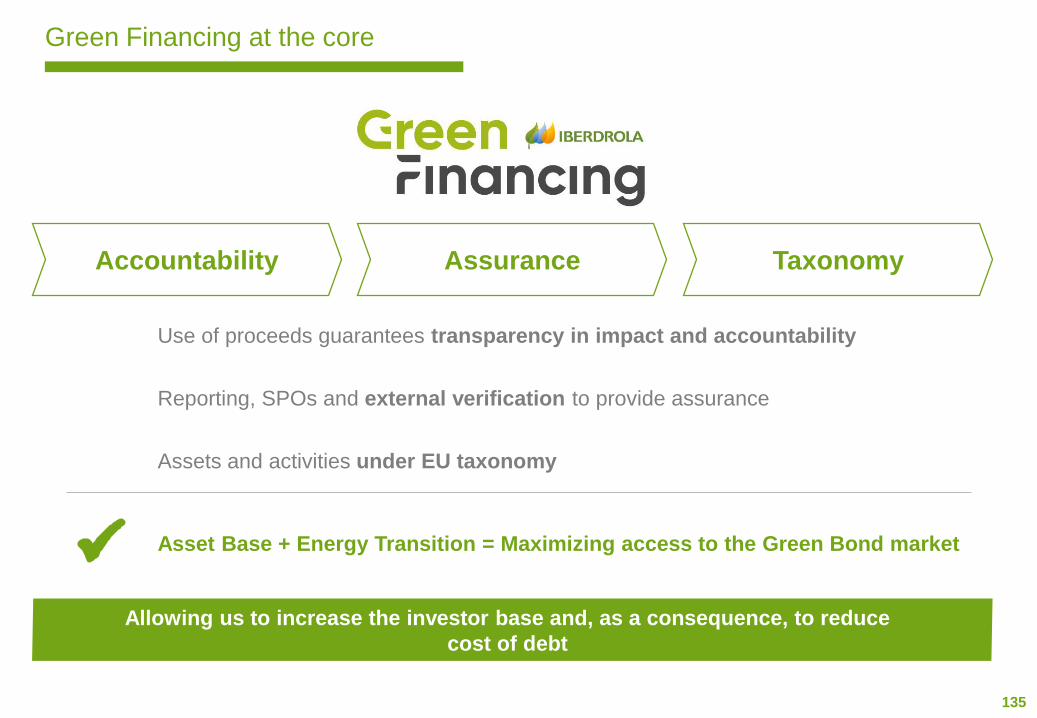
135
Green Financing at the core
Accountability Assurance
Allowing us to increase the investor base and, as a consequence, to reduce
cost of debt
Use of proceeds guarantees transparency in impact and accountability
Reporting, SPOs and external verification to provide assurance
Assets and activities under EU taxonomy
Taxonomy
Asset Base + Energy Transition = Maximizing access to the Green Bond market

136
Green / Sustainable financing
Information related to Green Bonds: https://www.iberdrola.com/shareholders-investors/investors/fixed-income/information-related-to-green-bonds c
Iberdrola is the world leading group in green bonds issued
In 2021 Iberdrola signed EUR 8.8 bn of new sustainable transactions and EUR 7.1 bn of new
green financing for a total of EUR 38.8 bn in ESG financing
SUSTAINABLE FINANCING : EUR 17,836 MGREEN FINANCING: EUR 20,922 M
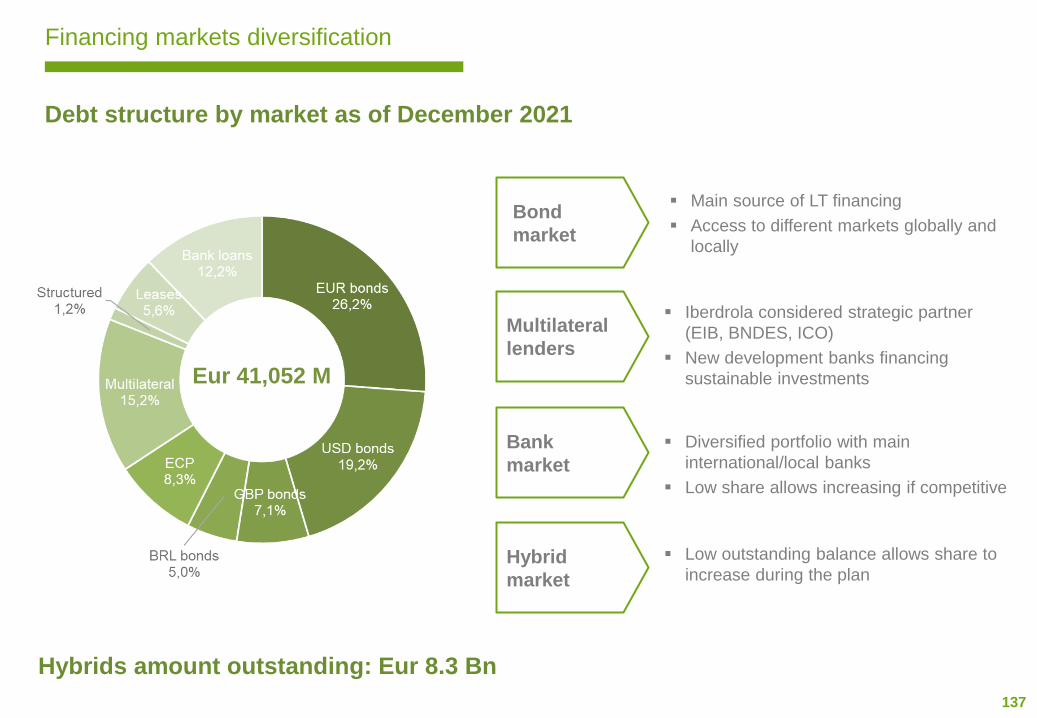
137
Financing markets diversification
▪ Main source of LT financing
▪ Access to different markets globally and
locally
Bond
market
▪ Iberdrola considered strategic partner
(EIB, BNDES, ICO)
▪ New development banks financing
sustainable investments
Multilateral
lenders
▪ Diversified portfolio with main
international/local banks
▪ Low share allows increasing if competitive
Bank
market
▪ Low outstanding balance allows share to
increase during the planHybrid
market
Eur 41,052 M
Hybrids amount outstanding: Eur 8.3 Bn
Debt structure by market as of December 2021
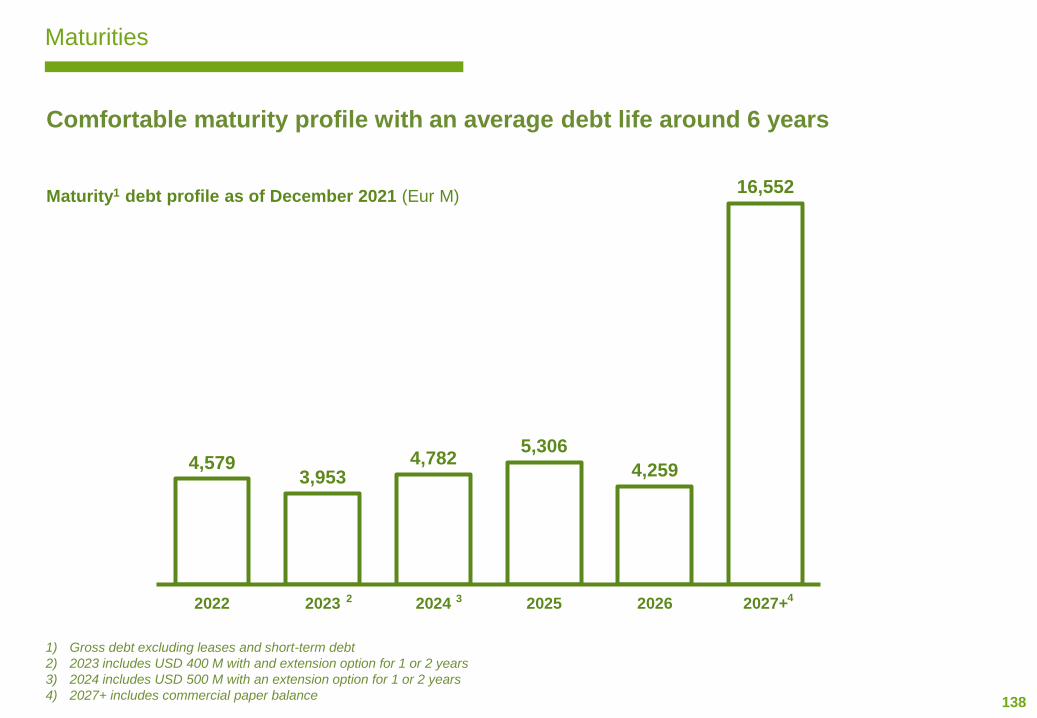
138
4,5793,953
4,7825,306
4,259
16,552
2022 2023 2024 2025 2026 2027+
Comfortable maturity profile with an average debt life around 6 years
Maturities
Maturity1 debt profile as of December 2021 (Eur M)
1) Gross debt excluding leases and short-term debt
2) 2023 includes USD 400 M with and extension option for 1 or 2 years
3) 2024 includes USD 500 M with an extension option for 1 or 2 years
4) 2027+ includes commercial paper balance
3 42
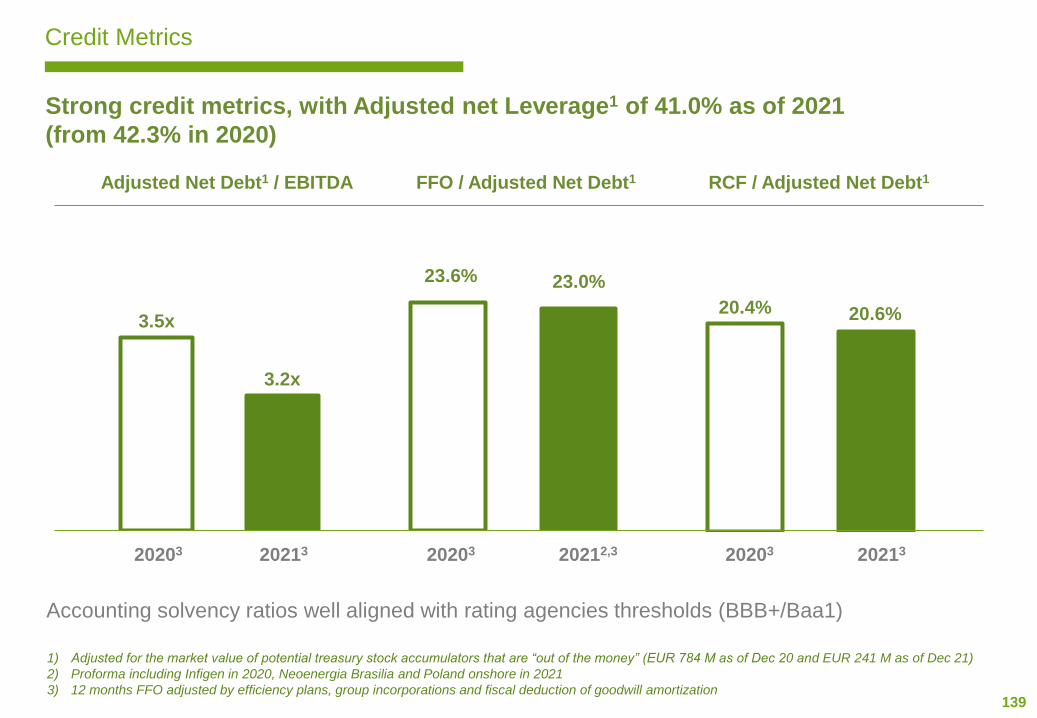
139
Credit Metrics
Adjusted Net Debt1 / EBITDA FFO / Adjusted Net Debt1 RCF / Adjusted Net Debt1
23.6% 23.0%
3.5x
3.2x
20.4% 20.6%
20203 20213 20203 20212,3 20203 20213
Strong credit metrics, with Adjusted net Leverage1 of 41.0% as of 2021
(from 42.3% in 2020)
Accounting solvency ratios well aligned with rating agencies thresholds (BBB+/Baa1)
1) Adjusted for the market value of potential treasury stock accumulators that are “out of the money” (EUR 784 M as of Dec 20 and EUR 241 M as of Dec 21)
2) Proforma including Infigen in 2020, Neoenergia Brasilia and Poland onshore in 2021
3) 12 months FFO adjusted by efficiency plans, group incorporations and fiscal deduction of goodwill amortization

140
Credit Ratings
Data as of December 2021
Rating Outlook
BBB+ Stable
BBB+ Stable
BBB+ Stable
BB- Stable
March 2021
December 2020
March 2021
October 2021
Date
Rating Outlook
Baa1 Stable
Baa2 Stable
Baa1 Stable
July 2021
July 2021
June 2021
Date
Rating Outlook
BBB+ Stable
BBB+ Negative
October 2021
May 2021
Date
BBB+ Stable
May 2021
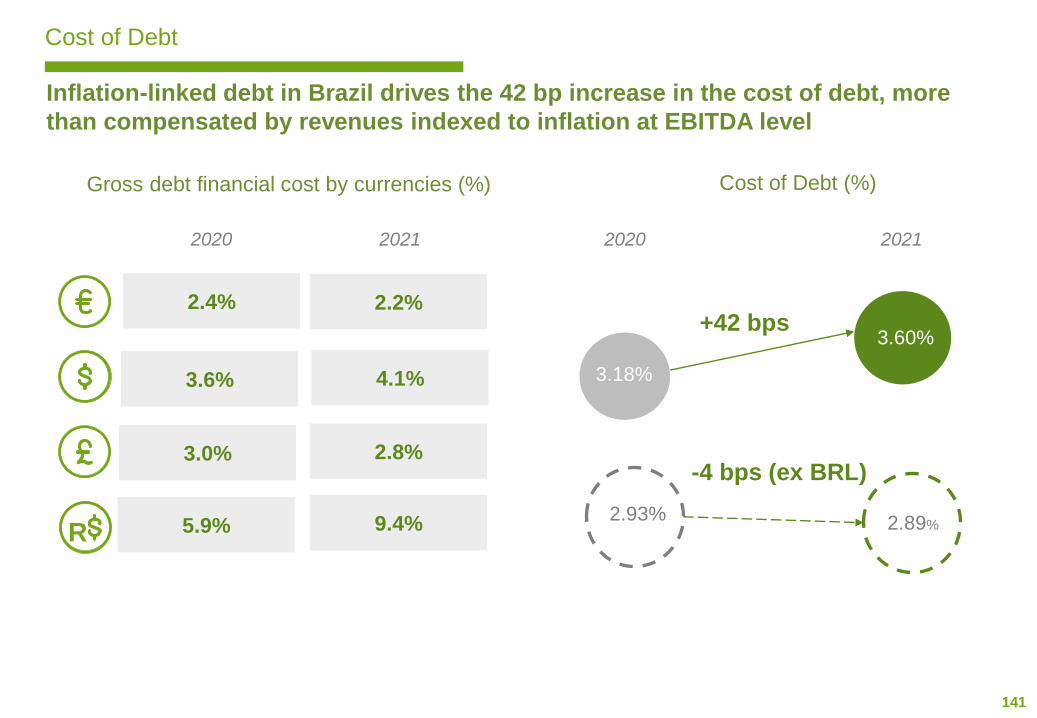
141
Cost of Debt
Inflation-linked debt in Brazil drives the 42 bp increase in the cost of debt, more
than compensated by revenues indexed to inflation at EBITDA level
Gross debt financial cost by currencies (%)
2020 2021
R
3.0%
3.6%
2.4%
5.9% 9.4%
2.8%
4.1%
2.2%
Cost of Debt (%)
2020 2021
3.18%
3.60%+42 bps
-4 bps (ex BRL)
2.93% 2.89%

142
Structural Subordination
Our model is based on financing the Group needs from the Holding
1) Including 50% of hybrids and excluding Neoenergia ( Eur 6.0 bn in Dec-21)
2021
Subordination ratio below 30% in 2021 in line
with financial policy and historical levels
Direct access to cash flows from unlevered
and fully owned subsidiaries (large part of
Group´s EBITDA ~ 70%)
High visibility of centralized cash flows
(regulated and long term contracted)
Centralized treasury and very strong liquidity
at Holding
% of gross debt1 at holding
71.4%
5.9%
18.9%
2.4%
Other 1.5%
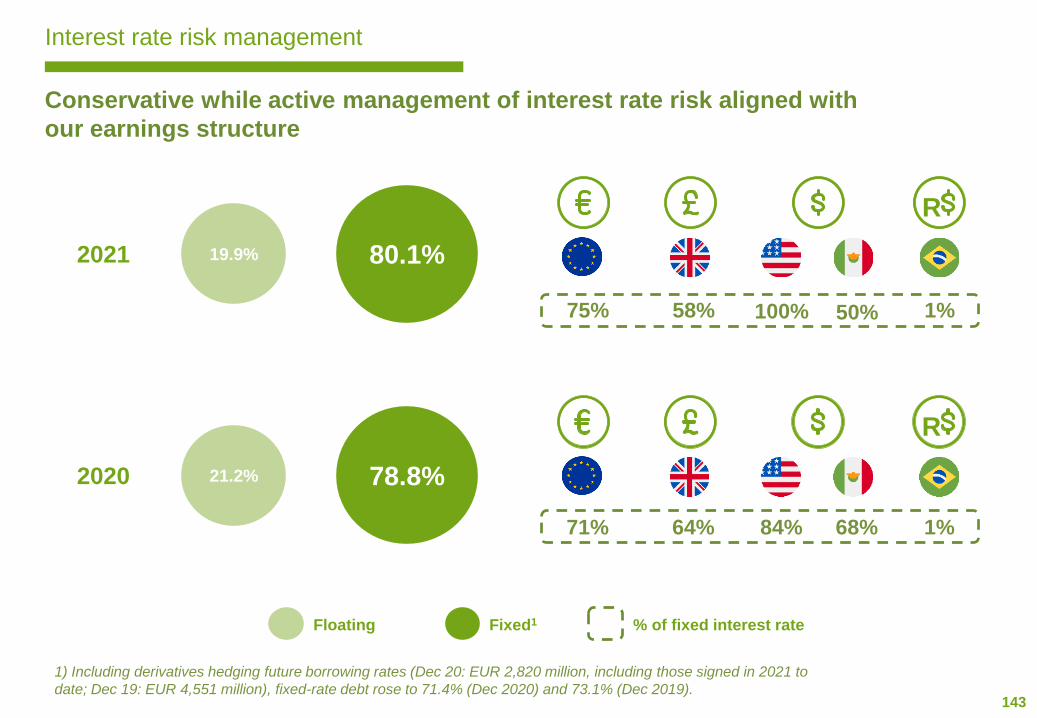
143
Conservative while active management of interest rate risk aligned with
our earnings structure
Interest rate risk management
1) Including derivatives hedging future borrowing rates (Dec 20: EUR 2,820 million, including those signed in 2021 to
date; Dec 19: EUR 4,551 million), fixed-rate debt rose to 71.4% (Dec 2020) and 73.1% (Dec 2019).
2020 21.2% 78.8%
2021 19.9% 80.1%
Floating Fixed1
R
75% 58% 100% 1%50%
R
71% 64% 84% 1%68%
% of fixed interest rate
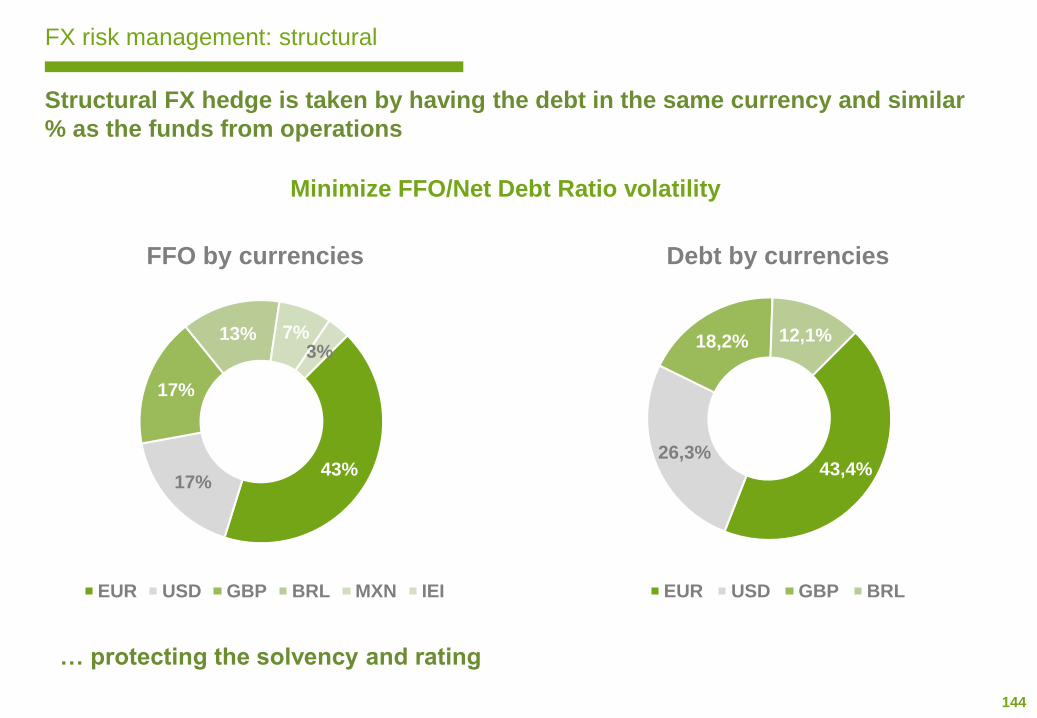
144
Structural FX hedge is taken by having the debt in the same currency and similar
% as the funds from operations
FX risk management: structural
Minimize FFO/Net Debt Ratio volatility
… protecting the solvency and rating
43%17%
17%
13% 7%3%
FFO by currencies
EUR USD GBP BRL MXN IEI
43,4%26,3%
18,2% 12,1%
Debt by currencies
EUR USD GBP BRL

145
FX risk management: annually
FX risk in the Profit & Loss account is hedged through derivatives
Hedging Net Income FX exposure in currencies against the Euro
Net Income FX risk is managed on a yearly basis
Long term FX management not possible as it would generate huge P&L volatility

146
Debt reconciliation
Eur 8.3 Bn of Hybrids1 not included in net debt calculations as they are accounted as equity
1) Outstanding figure as of Dec-21
Note 21 of Iberdrola Consolidated Annual Report 2021
Thousand euros 31/12/2021
Bank borrowings, bonds and other marketable securities (Note 28) 41,163
Derivative liability instruments 760
Leases 2,411
Gross financial Debt 44,334
Derivatives of treasury stock with physical settlement that at this date are not expected to be executed 241
Adjusted net financial debt 44,093
Non-current financial deposits (Note 15.b) 65
Derivative asset instruments 763
CSA derivatives security deposits (Note 15.b) 101
Current financial investments (between 3 and 12 months) (Note 15.b) 247
Cash and cash equivalents (Note 20) 12
Total treasury assets 4,033
Adjusted net financial debt 39,119
Iberdrola Consolidated Annual Financial Report 2021:
https://www.iberdrola.com/documents/20125/1606413/gsm22_FinancialStatements_AuditorsReport_Consolidated2021.pdf
147
AGENDA
1. Iberdrola Today (page 5)
2. Networks (page 16)
3. Renewables (page 46)
4. Generation & Retail (page 101)
5. Financing (page 135)
6. ESG (page 148)
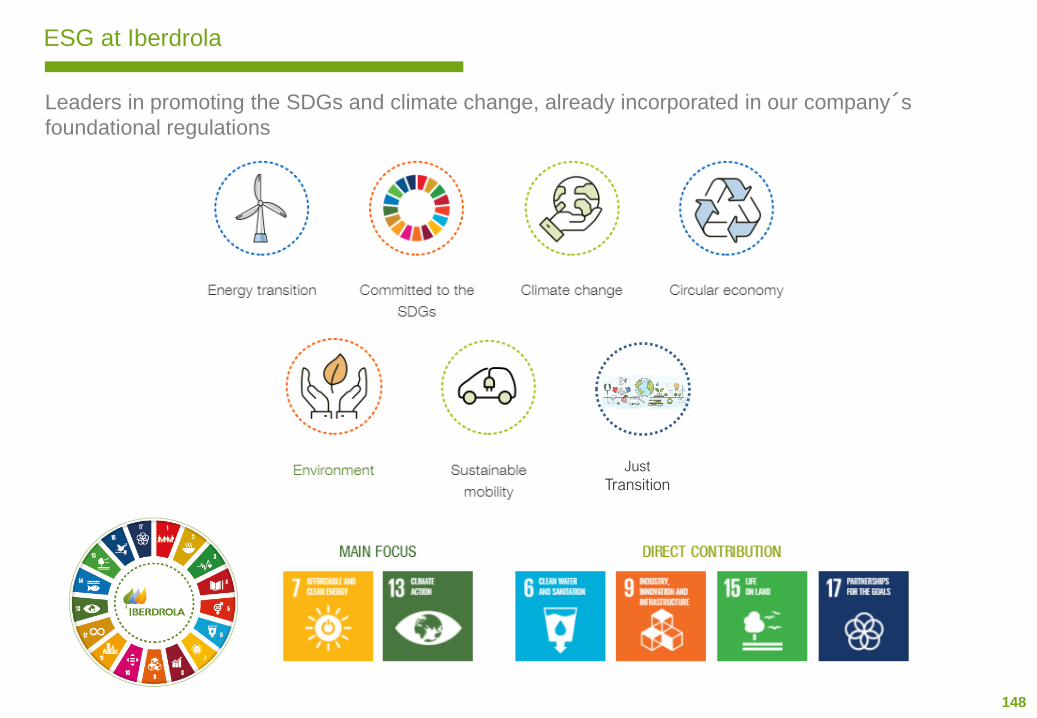
148
ESG at Iberdrola
Leaders in promoting the SDGs and climate change, already incorporated in our company´s
foundational regulations
Just
Transition

149
SDGs as part of Iberdrola group's business strategy
Iberdrola contributes to the sustainable development goals, with focus on SDG 7 and 13 but
with direct contribution to 4 additional SDGs
Main Focus Direct contribution
• 120 Eur bn
invested to lead
energy transition
• World leader in wind
power with 20.7 GW
installed
• 82 Mt of CO2
emissions avoided
over the last three
years
• Iberdrola has brought
electricity to 9.6
million people with
Electricity for all
program since
2014
• Leaders in Green
Bonds issued: 21
Eur bn as of today
• Carbon neutral
company in Europe
in 2030, enabling it to
reduce its CO2
intensity emissions
globally up to
50g/kWh, before the
end of the decade
• 81% of the group's
installed capacity
comes from
emissions-free
sources
• Iberdrola has
decommissioned all
of its coal-fired
power plants
• Objective to plant 20
million trees
by 2030, capturing
c.6 million tonnes
of CO2 over 30 years
• One of the utilities
with the best
water productivity
(sales/water used),
according to the
Global 100
classification
• Reduce the
intensity of water
use/production
by 50% in 2030
compared
to 2019
• In 2020, Iberdrola
returned 97% of
the water extracted
to the environment,
saving 1,500 hm3
• Iberdrola is a part of
the United Nations'
CEO Water Mandate
• Vector for
employment and
growth investing:
75 Eur bn
between 2020
and 2025
• Investments and
purchases of goods
will help to support
around 500,000
jobs around the
world by 2025
• Leading private
utility in Europe and
the second in the
world by investment
in R&D with
337 Eur M/year
in 2021 and
400 Eur M/year
by 2025
• More than 700
actions to
protect
biodiversity
per year
• Iberdrola promote
the planting of 20
million trees by
2030, focusing on
ecosystem
restoration
• Iberdrola has
received the first
AENOR
certificate for
Corporate
Environmental
Footprint
• Iberdrola is part of
UN Global
Compact (since
2002), World
Business
Council for
Sustainable
Development1
and We Mean
Business2
• We support
different SDG
Partnerships key
to achieve the
fulfillment of the
17 goals included
in the 2030 Agenda
• Selected as a leading
company in the
OpenODS Index
• Iberdrola is a
member of several
sustainable finance
associations1 World Business Council for Sustainable Development: https://www.wbcsd.org/Overview/Our-members2 We Mean Business: https://www.wemeanbusinesscoalition.org/3 According to the model of the World Health Organisation (WHO)
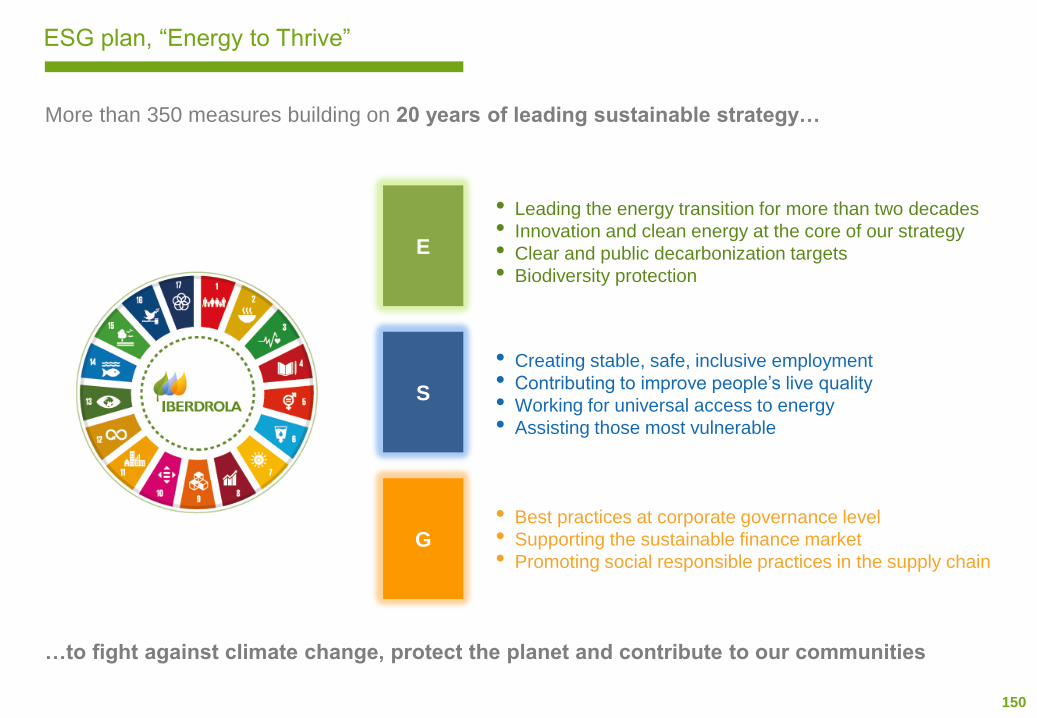
150
ESG plan, “Energy to Thrive”
More than 350 measures building on 20 years of leading sustainable strategy…
• Leading the energy transition for more than two decades
• Innovation and clean energy at the core of our strategy
• Clear and public decarbonization targets
• Biodiversity protection
• Creating stable, safe, inclusive employment
• Contributing to improve people’s live quality
• Working for universal access to energy
• Assisting those most vulnerable
• Best practices at corporate governance level
• Supporting the sustainable finance market
• Promoting social responsible practices in the supply chain
E
S
G
…to fight against climate change, protect the planet and contribute to our communities
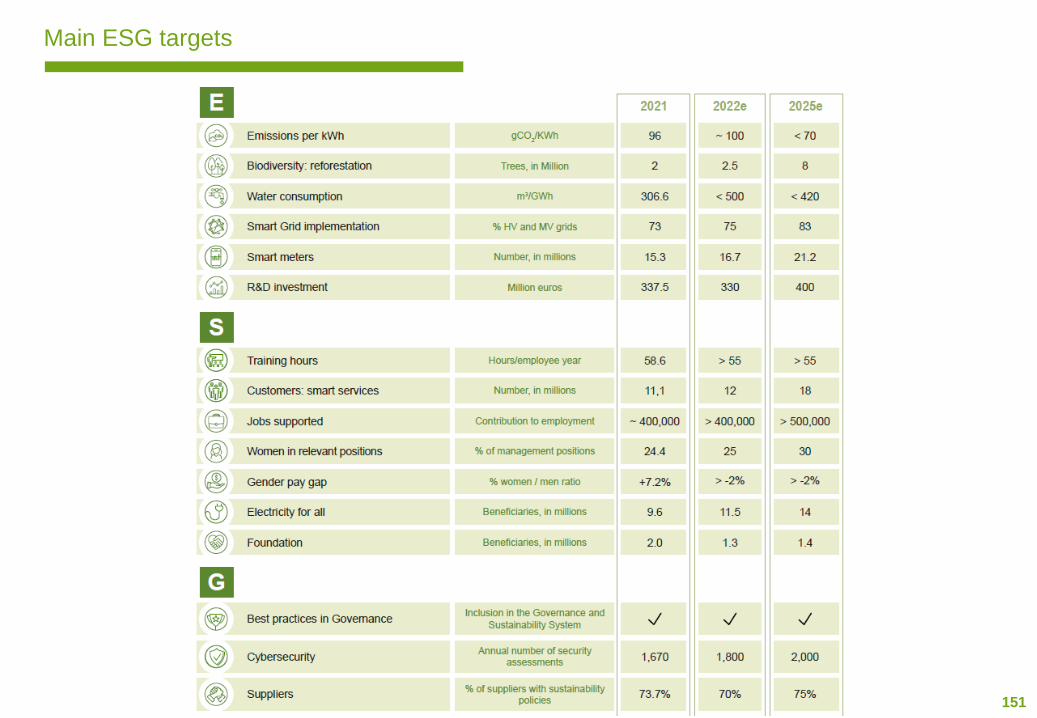
151
Main ESG targets

Environment
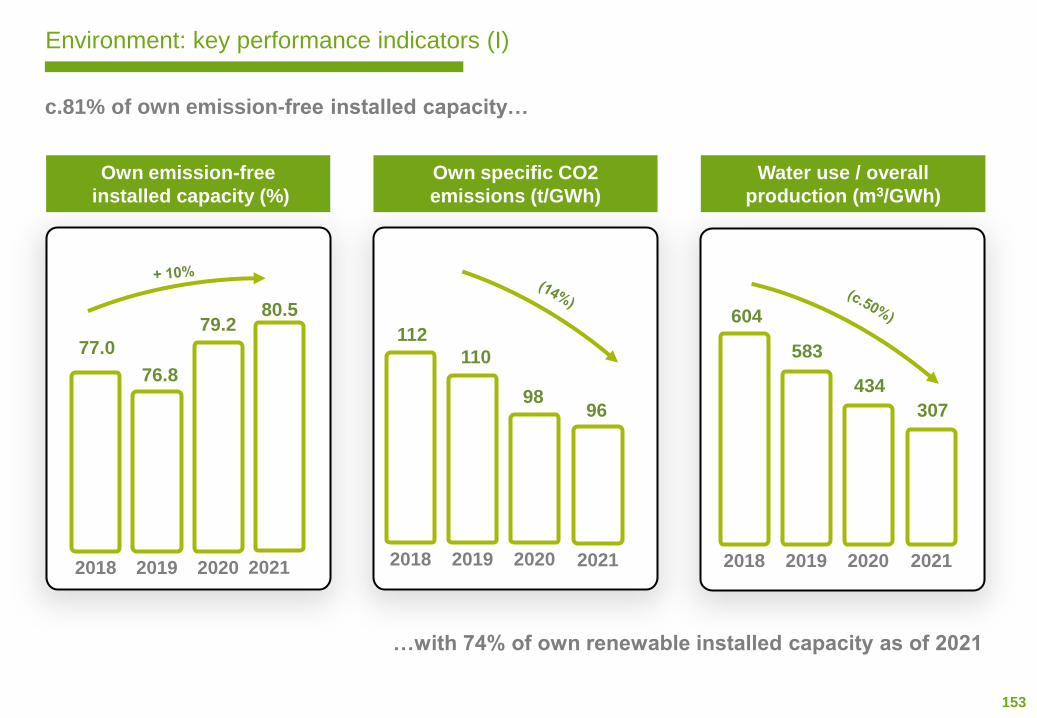
153
Environment: key performance indicators (I)
c.81% of own emission-free installed capacity…
Own emission-free
installed capacity (%)
2018 2019 2020
77.0
76.8
79.2
Own specific CO2
emissions (t/GWh)
2018 2019 2020
112
110
98
Water use / overall
production (m3/GWh)
2018 2019 2020
604
583
434
…with 74% of own renewable installed capacity as of 2021
2021
80.5
2021
96 307
2021
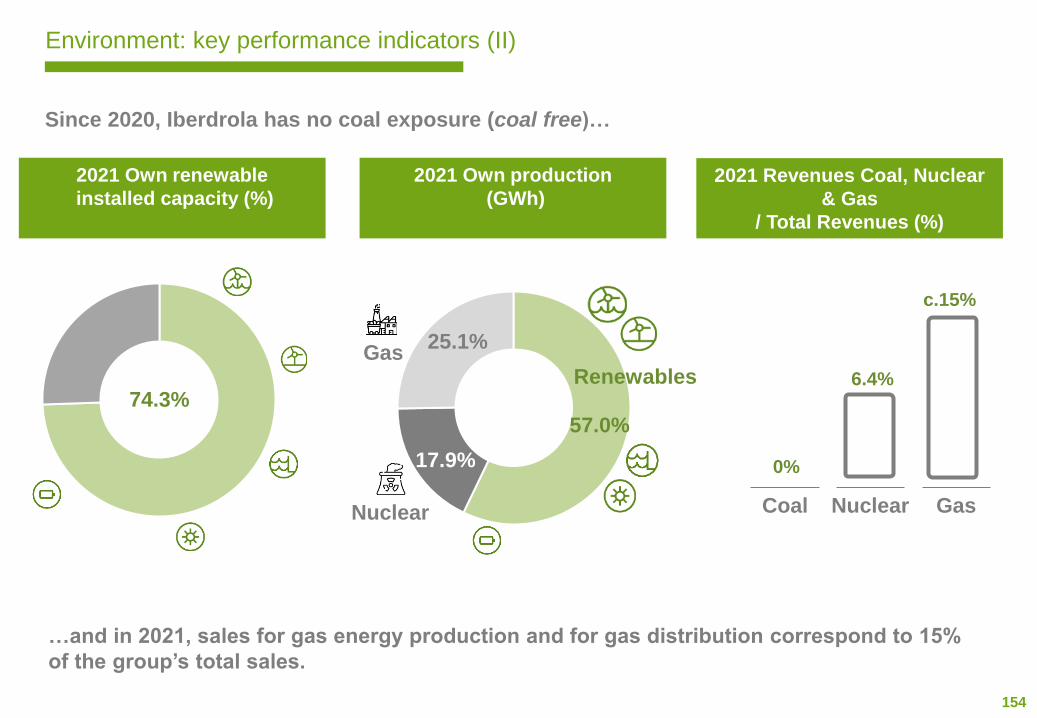
154
Environment: key performance indicators (II)
Since 2020, Iberdrola has no coal exposure (coal free)…
2021 Own renewable
installed capacity (%)
74.3%
2021 Own production
(GWh)
Renewables
57.0%
17.9%
25.1%Gas
Nuclear
2021 Revenues Coal, Nuclear
& Gas
/ Total Revenues (%)
0%
6.4%
Coal Nuclear
…and in 2021, sales for gas energy production and for gas distribution correspond to 15%
of the group’s total sales.
Gas
c.15%
155
Environment: six main drivers
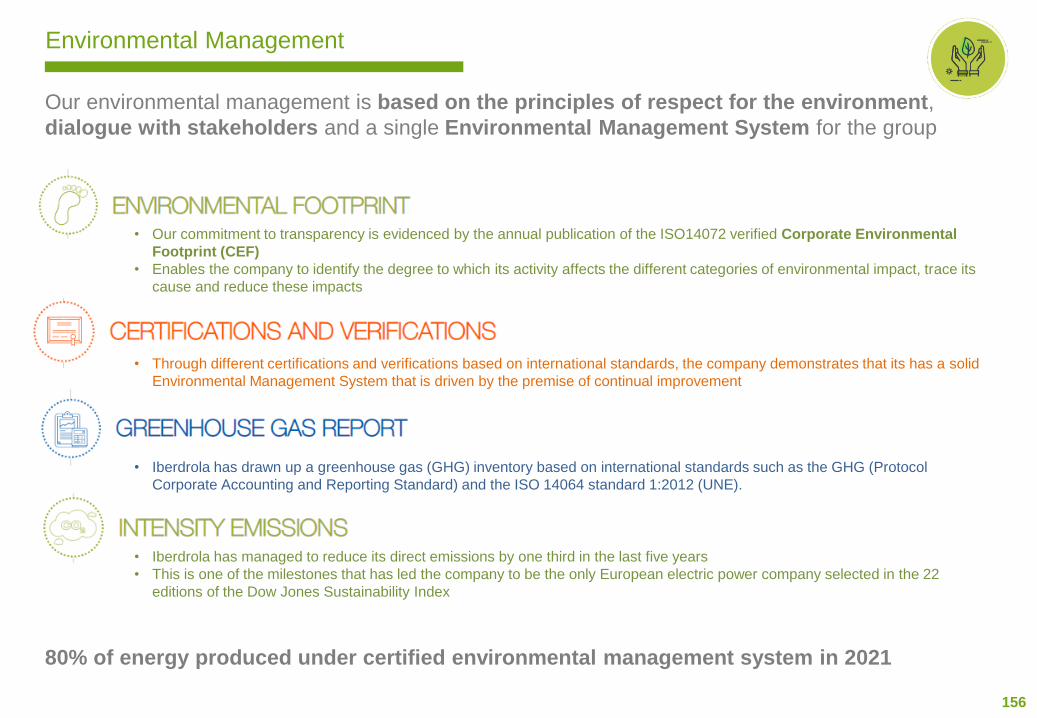
156
Environmental Management
Our environmental management is based on the principles of respect for the environment,
dialogue with stakeholders and a single Environmental Management System for the group
80% of energy produced under certified environmental management system in 2021
• Our commitment to transparency is evidenced by the annual publication of the ISO14072 verified Corporate Environmental
Footprint (CEF)
• Enables the company to identify the degree to which its activity affects the different categories of environmental impact, trace its
cause and reduce these impacts
• Through different certifications and verifications based on international standards, the company demonstrates that its has a solid
Environmental Management System that is driven by the premise of continual improvement
• Iberdrola has drawn up a greenhouse gas (GHG) inventory based on international standards such as the GHG (Protocol
Corporate Accounting and Reporting Standard) and the ISO 14064 standard 1:2012 (UNE).
• Iberdrola has managed to reduce its direct emissions by one third in the last five years
• This is one of the milestones that has led the company to be the only European electric power company selected in the 22
editions of the Dow Jones Sustainability Index
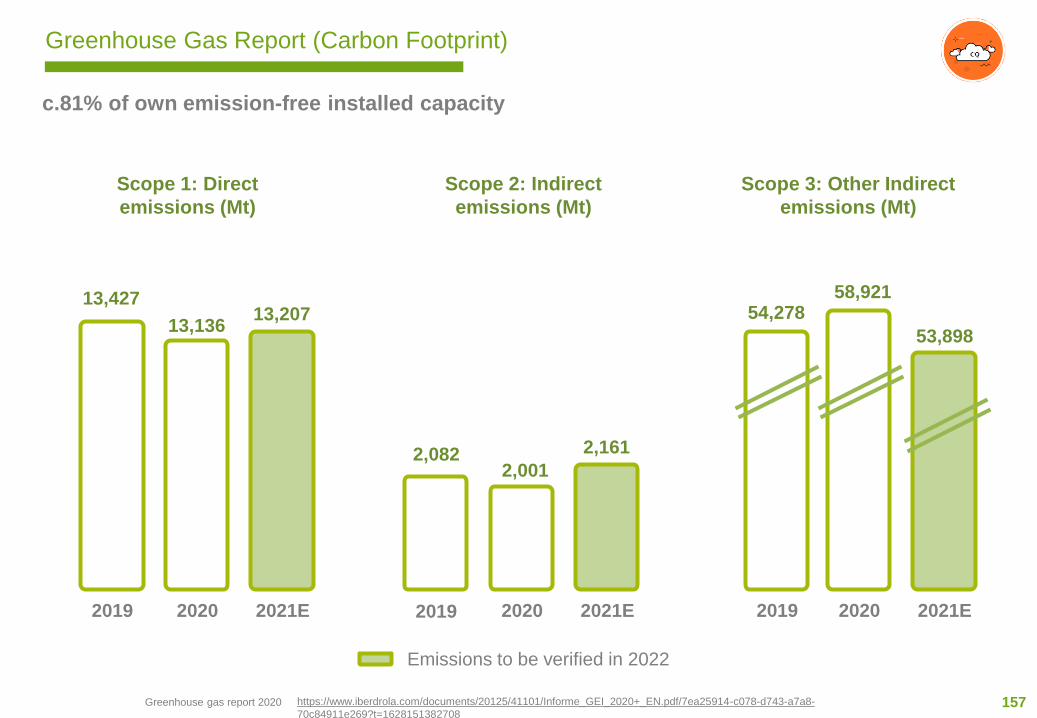
157
Greenhouse Gas Report (Carbon Footprint)
c.81% of own emission-free installed capacity
Emissions to be verified in 2022
Greenhouse gas report 2020
Scope 1: Direct
emissions (Mt)
Scope 2: Indirect
emissions (Mt)
Scope 3: Other Indirect
emissions (Mt)
2021E
13,207
2020
13,136
2021E
2,161
2020
2,001
2021E2020
58,92113,427
2019 2019
2,082
2019
54,278
53,898
https://www.iberdrola.com/documents/20125/41101/Informe_GEI_2020+_EN.pdf/7ea25914-c078-d743-a7a8-
70c84911e269?t=1628151382708
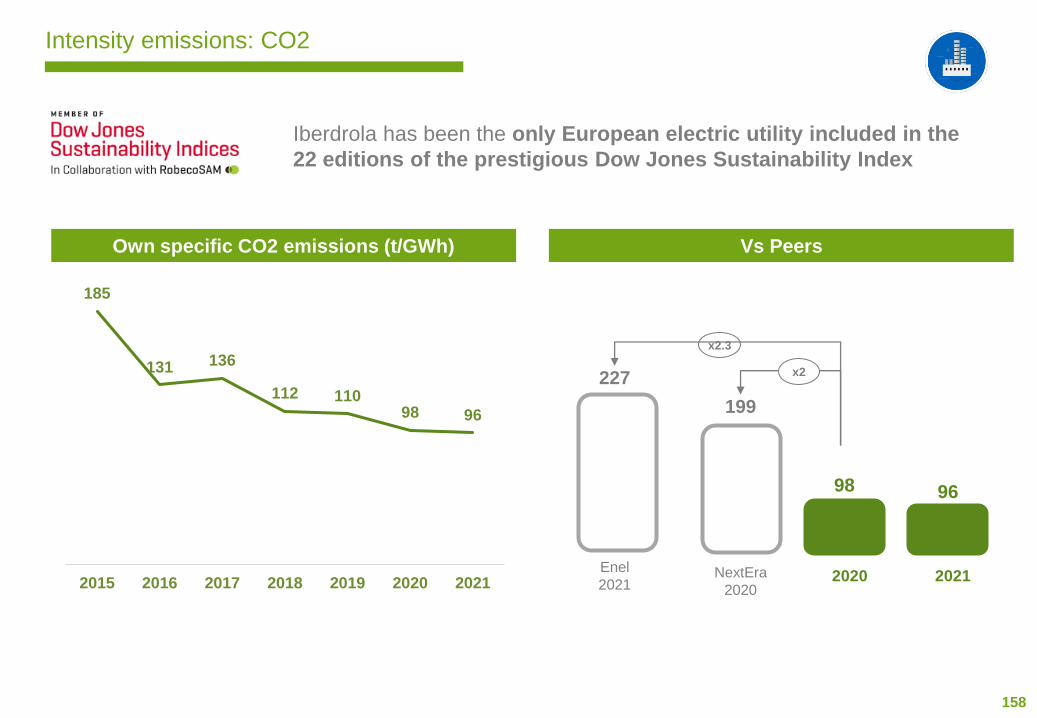
158
Intensity emissions: CO2
Iberdrola has been the only European electric utility included in the
22 editions of the prestigious Dow Jones Sustainability Index
185
131 136
112 11098 96
2015 2016 2017 2018 2019 2020 2021
Own specific CO2 emissions (t/GWh) Vs Peers
227
199
NextEra
2020
Enel
2021
x2.3
x2
2021
96
2020
98
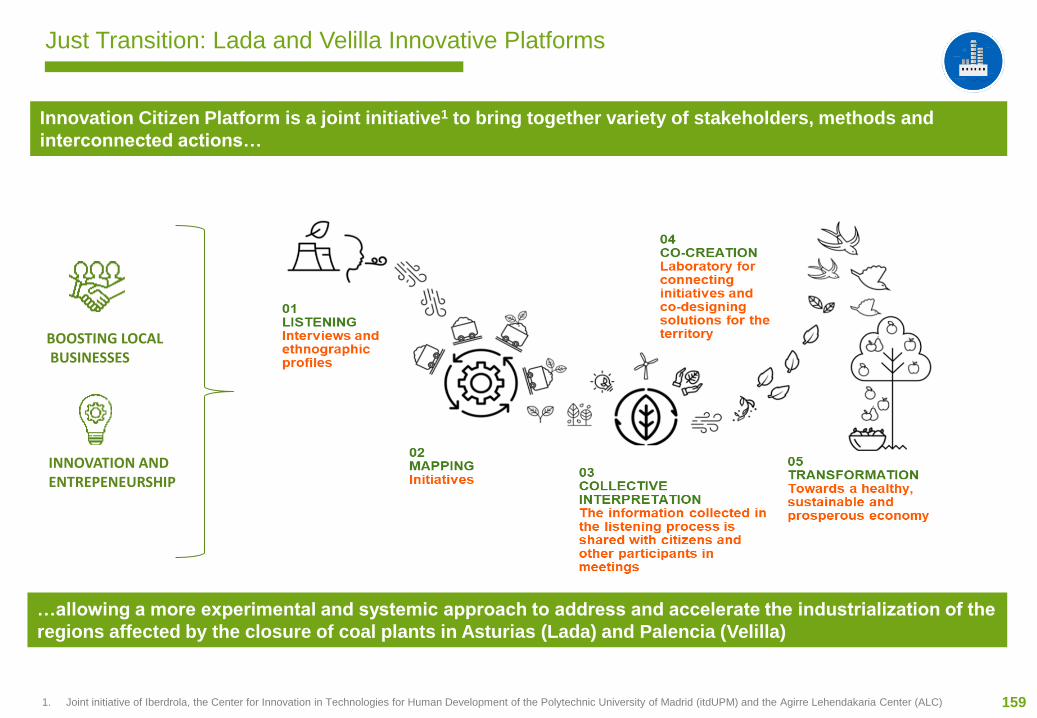
159
Just Transition: Lada and Velilla Innovative Platforms
Innovation Citizen Platform is a joint initiative1 to bring together variety of stakeholders, methods and
interconnected actions…
BOOSTING LOCALBUSINESSES
INNOVATION AND ENTREPENEURSHIP
1. Joint initiative of Iberdrola, the Center for Innovation in Technologies for Human Development of the Polytechnic University of Madrid (itdUPM) and the Agirre Lehendakaria Center (ALC)
…allowing a more experimental and systemic approach to address and accelerate the industrialization of the
regions affected by the closure of coal plants in Asturias (Lada) and Palencia (Velilla)

160
Biodiversity
https://www.iberdrola.com/wcorp/gc/prod/en_US/sostenibilidad/docs/Biodiversity_Report_2018_2019.pdfBiodiversity Report 2018-2019
2030 objective of “No Net Loss” on biodiversity
• Biodiversity Policy
since 2007,which is
part of governance and
sustainability System
and applies to all
business units and
regions where the
company operates.
• The Policy establishes a
reference framework for
integrating the protection
and promotion of
biodiversity into the
Group’s strategy, and to
define the principles of
conduct for the
development of a
business model that is
sustainable and positive
with nature
• Biodiversity Policy
• Biodiversity Plan
• Environmental
monitoring and
control plans
• Positive
conservation
management
• Iberdrola works to
avoid, minimise,
restore and offset the
impact on natural
capital and biodiversity.
• Prior to initiating the
administrative process,
Iberdrola consults the
various Stakeholders
about new projects
• Incorporates good
building practices that
go beyond the applicable
legal requirements
• After the administrative
process and during
construction Iberdrola
continues to work with
Stakeholders to avoid
environmental effects
• Protect biodiversity,
applying a mitigation
hierarchy throughout the
project life cycle
• Understand and
conserve biodiversity,
by applying the principle
of precaution to avoid or
minimize their impact and
foster conservation
• Collaborate with
Stakeholders, in order to
integrate them into action
plans and participate in
research projects
• A commitment to raise
awareness of the
importance of biodiversity
and communicate
internally
• 11% of our
facilities are in
designated areas
In most of them
the protection
came after the
operation of the
facilities
• Environmental
Management
Plans are
implemented at
theses sites
• We promote the
planting of 20 million
trees by 2030
• Iberdrola identifies the
threatened species
included in the IUCN
Red List and in national
and regional lists with
habitats in the areas
where it operates to
prevent any impact
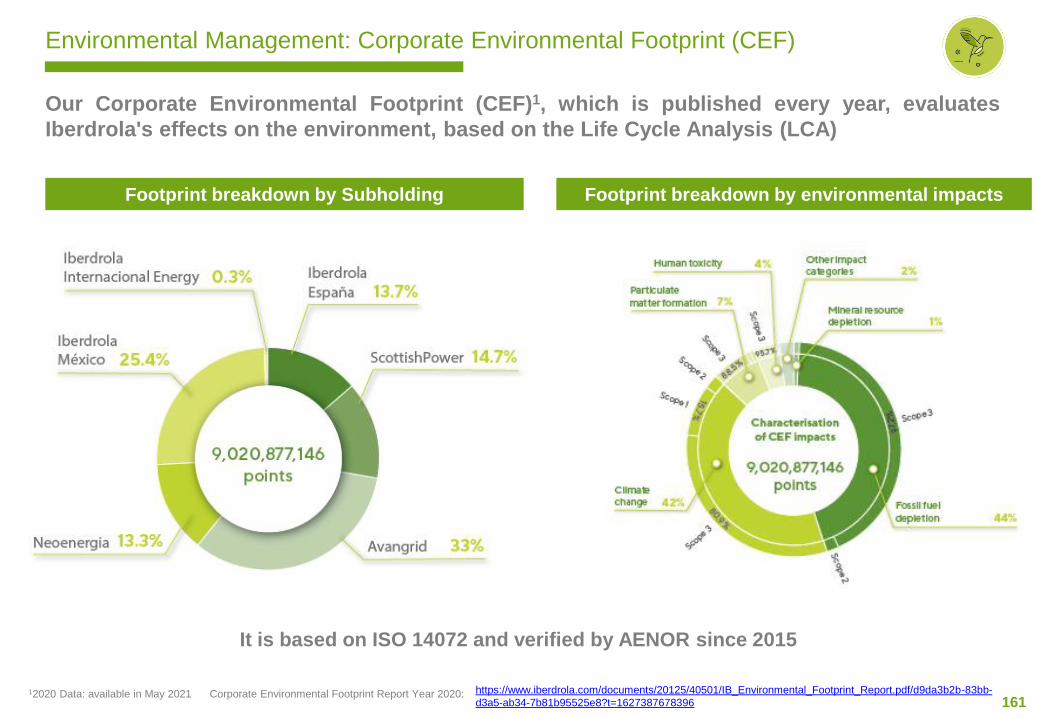
161
Environmental Management: Corporate Environmental Footprint (CEF)
https://www.iberdrola.com/documents/20125/40501/IB_Environmental_Footprint_Report.pdf/d9da3b2b-83bb-
d3a5-ab34-7b81b95525e8?t=1627387678396Corporate Environmental Footprint Report Year 2020:
Our Corporate Environmental Footprint (CEF)1, which is published every year, evaluates
Iberdrola's effects on the environment, based on the Life Cycle Analysis (LCA)
12020 Data: available in May 2021
It is based on ISO 14072 and verified by AENOR since 2015
Footprint breakdown by Subholding Footprint breakdown by environmental impacts
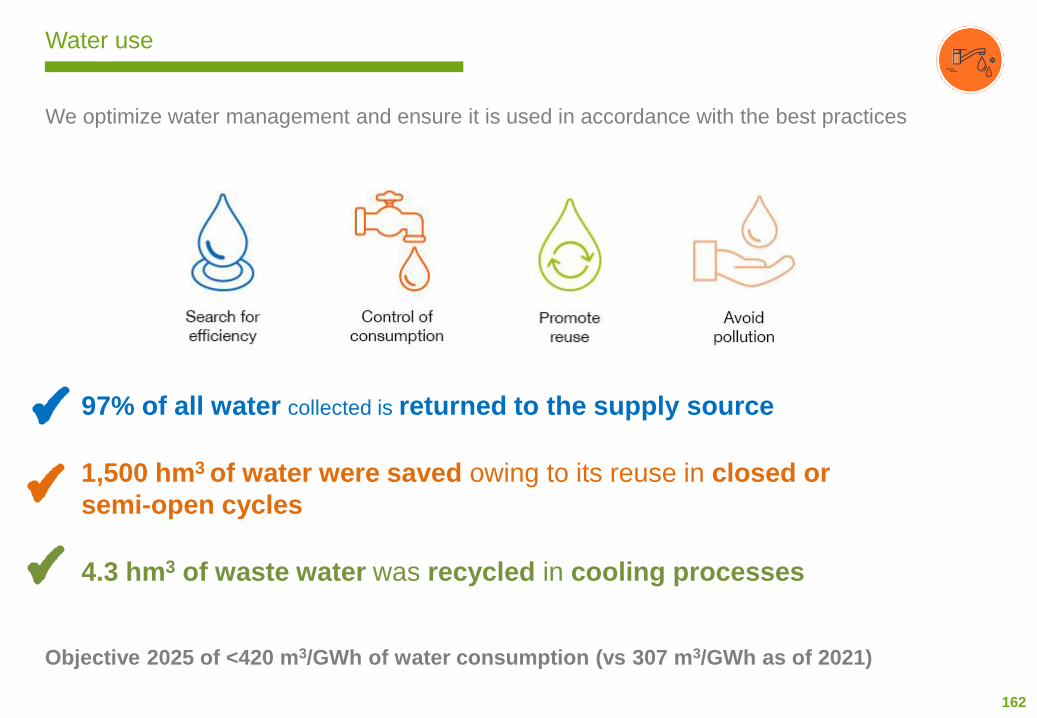
162
Water use
We optimize water management and ensure it is used in accordance with the best practices
97% of all water collected is returned to the supply source
1,500 hm3 of water were saved owing to its reuse in closed or
semi-open cycles
4.3 hm3 of waste water was recycled in cooling processes
Objective 2025 of <420 m3/GWh of water consumption (vs 307 m3/GWh as of 2021)
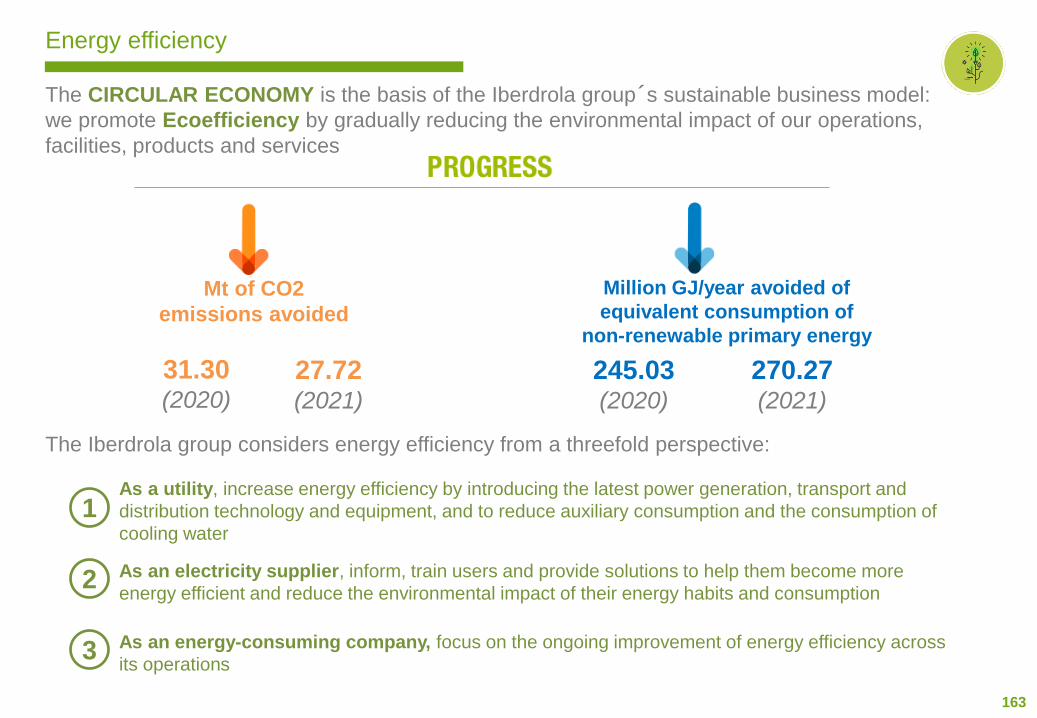
163
Energy efficiency
The CIRCULAR ECONOMY is the basis of the Iberdrola group´s sustainable business model:
we promote Ecoefficiency by gradually reducing the environmental impact of our operations,
facilities, products and services
The Iberdrola group considers energy efficiency from a threefold perspective:
As a utility, increase energy efficiency by introducing the latest power generation, transport and
distribution technology and equipment, and to reduce auxiliary consumption and the consumption of
cooling water
As an electricity supplier, inform, train users and provide solutions to help them become more
energy efficient and reduce the environmental impact of their energy habits and consumption
As an energy-consuming company, focus on the ongoing improvement of energy efficiency across
its operations
1
2
3
27.72(2021)
Mt of CO2
emissions avoided
270.27(2021)
Million GJ/year avoided of
equivalent consumption of
non-renewable primary energy
31.30(2020)
245.03(2020)
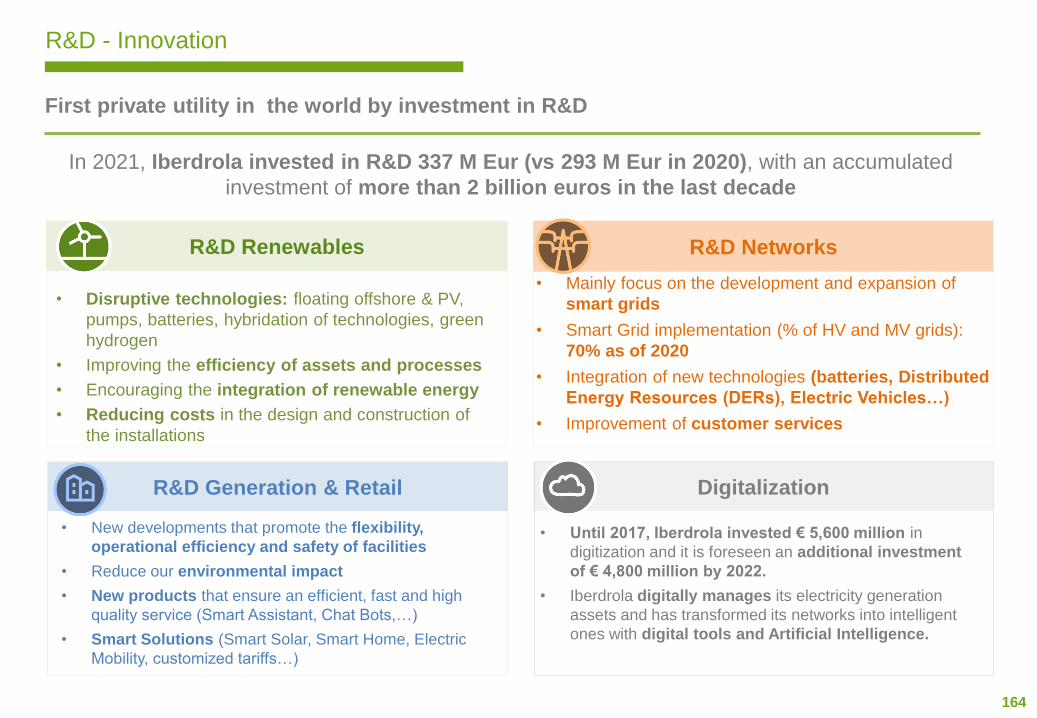
164
• Disruptive technologies: floating offshore & PV,
pumps, batteries, hybridation of technologies, green
hydrogen
• Improving the efficiency of assets and processes
• Encouraging the integration of renewable energy
• Reducing costs in the design and construction of
the installations
R&D - Innovation
First private utility in the world by investment in R&D
In 2021, Iberdrola invested in R&D 337 M Eur (vs 293 M Eur in 2020), with an accumulated
investment of more than 2 billion euros in the last decade
R&D Renewables R&D Networks
R&D Generation & Retail Digitalization
• Mainly focus on the development and expansion of
smart grids
• Smart Grid implementation (% of HV and MV grids):
70% as of 2020
• Integration of new technologies (batteries, Distributed
Energy Resources (DERs), Electric Vehicles…)
• Improvement of customer services
• New developments that promote the flexibility,
operational efficiency and safety of facilities
• Reduce our environmental impact
• New products that ensure an efficient, fast and high
quality service (Smart Assistant, Chat Bots,…)
• Smart Solutions (Smart Solar, Smart Home, Electric
Mobility, customized tariffs…)
• Until 2017, Iberdrola invested € 5,600 million in
digitization and it is foreseen an additional investment
of € 4,800 million by 2022.
• Iberdrola digitally manages its electricity generation
assets and has transformed its networks into intelligent
ones with digital tools and Artificial Intelligence.

165
R&D - Open Innovation and Partnership*
Our open innovation model allows us to collaborate with employees, technology suppliers, universities,
industrial organisations and public institutions through our programs and technology centers
Global Smart Grids Innovation HubWorld Center for Smart Grid Innovation (Bizkaia)
Iberdrola Innovation Middle East, QatarWorld-leading innovation center to tackle the digitalization of
the energy sector
Iberdrola U- Iberdrola University Program
New model of relationship with 8 prestigious universities, connecting over
290,000 members, including students, teachers and scholarship holders to
develop different initiatives:
* https://www.iberdrola.com/innovation
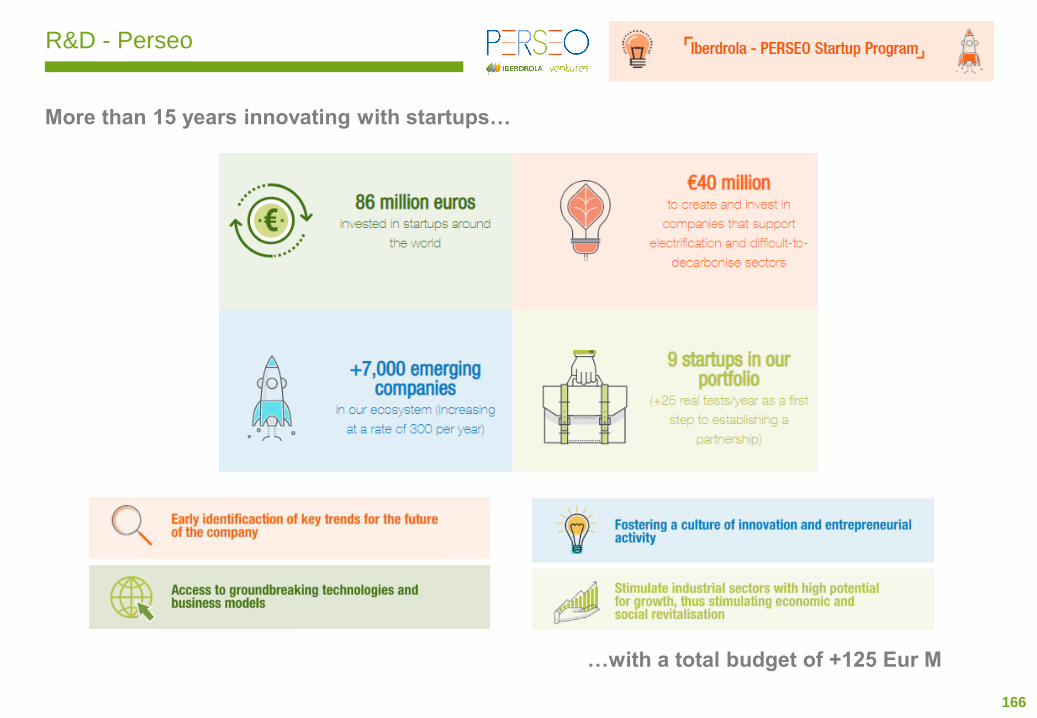
166
R&D - Perseo
More than 15 years innovating with startups…
…with a total budget of +125 Eur M
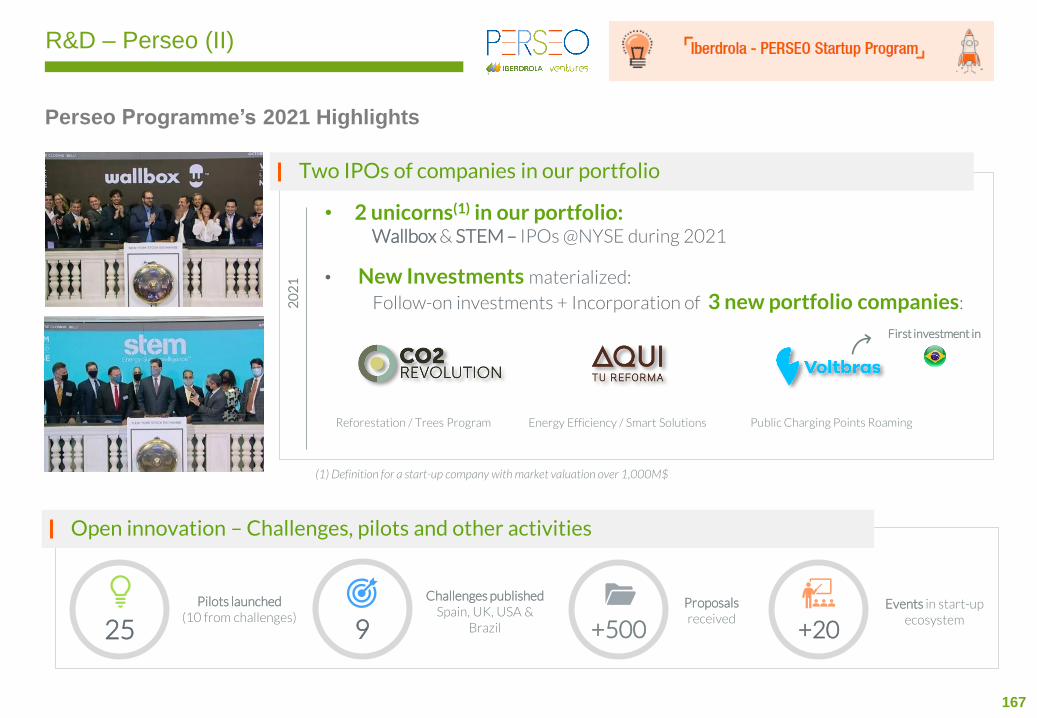
167
R&D – Perseo (II)
Perseo Programme’s 2021 Highlights
• 2 unicorns(1) in our portfolio: Wallbox & STEM – IPOs @NYSE during 2021
• New Investments materialized:
Follow-on investments + Incorporation of 3 new portfolio companies:
Two IPOs of companies in our portfolio
Reforestation / Trees Program Energy Efficiency / Smart Solutions Public Charging Points Roaming
20
21
First investment in
Open innovation – Challenges, pilots and other activities
25Pilots launched
(10 from challenges)
9
Challenges published Spain, UK, USA &
Brazil
Proposalsreceived
Events in start-upecosystem
+20+500
(1) Definition for a start-up company with market valuation over 1,000M$
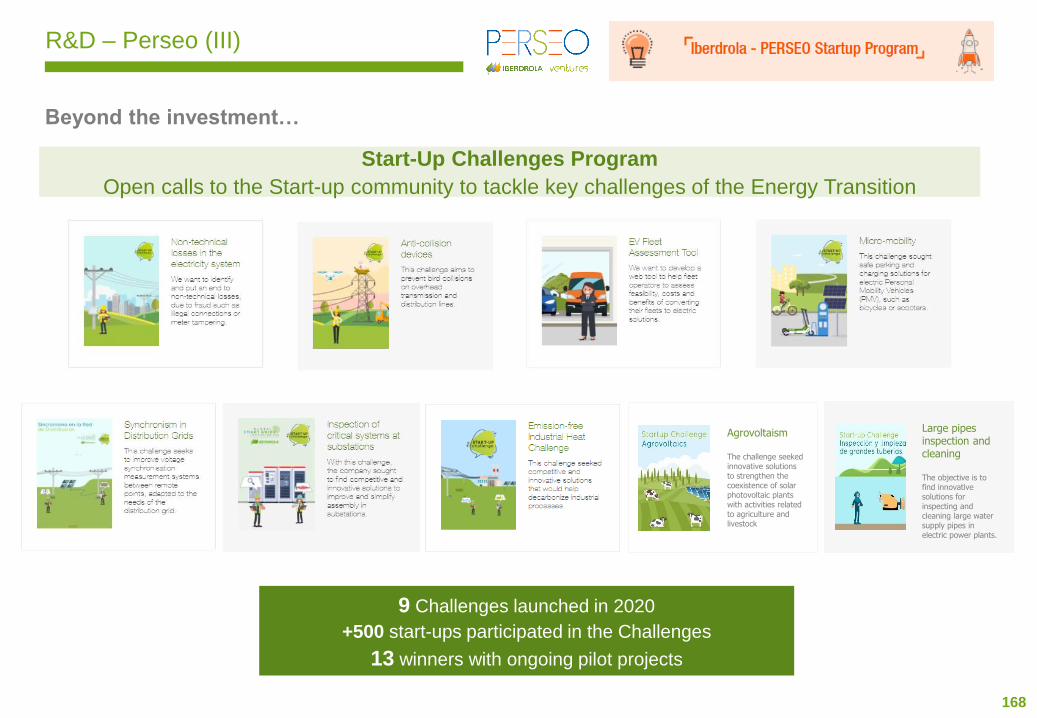
168
R&D – Perseo (III)
Beyond the investment…
Start-Up Challenges Program
Open calls to the Start-up community to tackle key challenges of the Energy Transition
9 Challenges launched in 2020
+500 start-ups participated in the Challenges
13 winners with ongoing pilot projects
Agrovoltaism
The challenge seeked innovative solutions to strengthen the coexistence of solar photovoltaic plants with activities related to agriculture and livestock
Large pipes inspection and cleaning
The objective is to find innovative solutions for inspecting and cleaning large water supply pipes in electric power plants.

Social
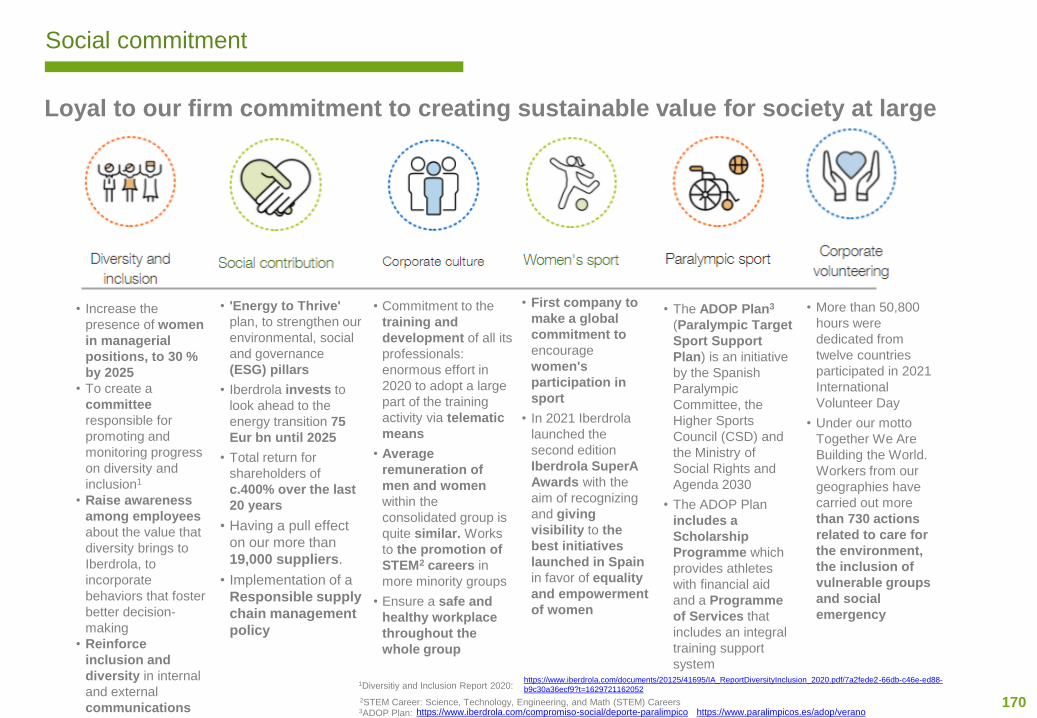
170
• Commitment to the
training and
development of all its
professionals:
enormous effort in
2020 to adopt a large
part of the training
activity via telematic
means
• Average
remuneration of
men and women
within the
consolidated group is
quite similar. Works
to the promotion of
STEM2 careers in
more minority groups
• Ensure a safe and
healthy workplace
throughout the
whole group
Social commitment
Loyal to our firm commitment to creating sustainable value for society at large
• Increase the
presence of women
in managerial
positions, to 30 %
by 2025
• To create a
committee
responsible for
promoting and
monitoring progress
on diversity and
inclusion1
• Raise awareness
among employees
about the value that
diversity brings to
Iberdrola, to
incorporate
behaviors that foster
better decision-
making
• Reinforce
inclusion and
diversity in internal
and external
communications
• 'Energy to Thrive'
plan, to strengthen our
environmental, social
and governance
(ESG) pillars
• Iberdrola invests to
look ahead to the
energy transition 75
Eur bn until 2025
• Total return for
shareholders of
c.400% over the last
20 years
• Having a pull effect
on our more than
19,000 suppliers.
• Implementation of a
Responsible supply
chain management
policy
• First company to
make a global
commitment to
encourage
women's
participation in
sport
• In 2021 Iberdrola
launched the
second edition
Iberdrola SuperA
Awards with the
aim of recognizing
and giving
visibility to the
best initiatives
launched in Spain
in favor of equality
and empowerment
of women
• The ADOP Plan3
(Paralympic Target
Sport Support
Plan) is an initiative
by the Spanish
Paralympic
Committee, the
Higher Sports
Council (CSD) and
the Ministry of
Social Rights and
Agenda 2030
• The ADOP Plan
includes a
Scholarship
Programme which
provides athletes
with financial aid
and a Programme
of Services that
includes an integral
training support
system
• More than 50,800
hours were
dedicated from
twelve countries
participated in 2021
International
Volunteer Day
• Under our motto
Together We Are
Building the World.
Workers from our
geographies have
carried out more
than 730 actions
related to care for
the environment,
the inclusion of
vulnerable groups
and social
emergency
https://www.iberdrola.com/compromiso-social/deporte-paralimpico https://www.paralimpicos.es/adop/verano3ADOP Plan:
https://www.iberdrola.com/documents/20125/41695/IA_ReportDiversityInclusion_2020.pdf/7a2fede2-66db-c46e-ed88-
b9c30a36ecf9?t=16297211620521Diversitiy and Inclusion Report 2020:
2STEM Career: Science, Technology, Engineering, and Math (STEM) Careers
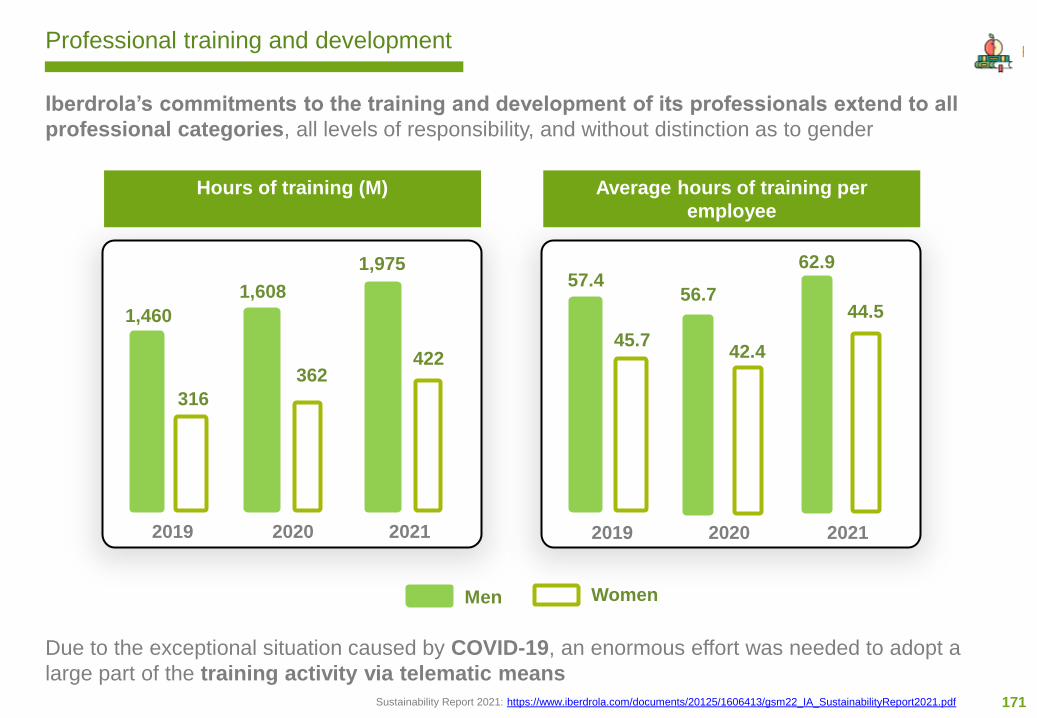
171
Professional training and development
Iberdrola’s commitments to the training and development of its professionals extend to all
professional categories, all levels of responsibility, and without distinction as to gender
2019 2020
Hours of training (M) Average hours of training per
employee
Men Women
316
1,460
422
1,608
2019 2021
45.7
57.462.9
44.5
Due to the exceptional situation caused by COVID-19, an enormous effort was needed to adopt a
large part of the training activity via telematic means
Sustainability Report 2021: https://www.iberdrola.com/documents/20125/1606413/gsm22_IA_SustainabilityReport2021.pdf
362
1,975
2021 2020
56.7
42.4
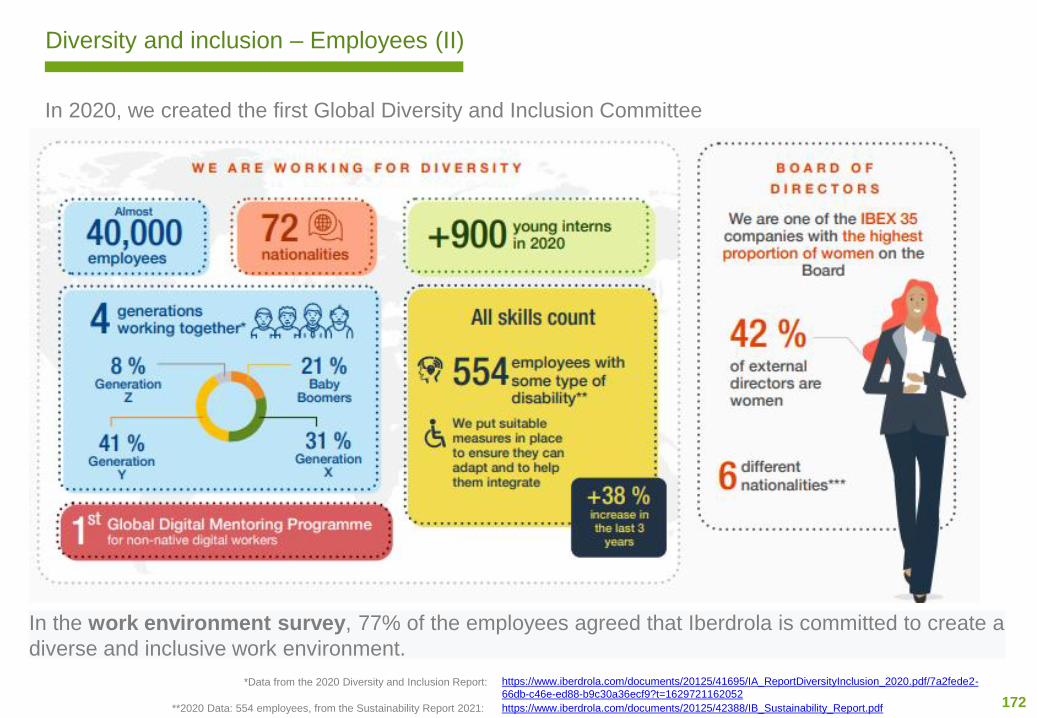
172
Diversity and inclusion – Employees (II)
https://www.iberdrola.com/documents/20125/41695/IA_ReportDiversityInclusion_2020.pdf/7a2fede2-
66db-c46e-ed88-b9c30a36ecf9?t=1629721162052*Data from the 2020 Diversity and Inclusion Report:
https://www.iberdrola.com/documents/20125/42388/IB_Sustainability_Report.pdf**2020 Data: 554 employees, from the Sustainability Report 2021:
In 2020, we created the first Global Diversity and Inclusion Committee
In the work environment survey, 77% of the employees agreed that Iberdrola is committed to create a
diverse and inclusive work environment.

173
Diversity and inclusion – Customers and suppliers
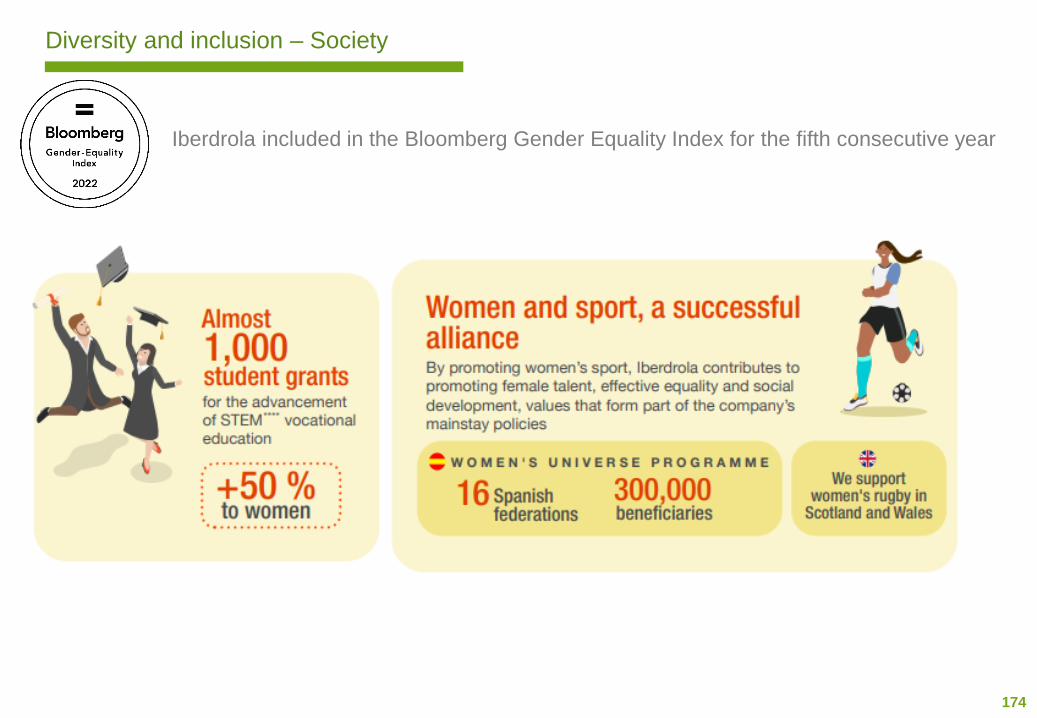
174
Diversity and inclusion – Society
Iberdrola included in the Bloomberg Gender Equality Index for the fifth consecutive year
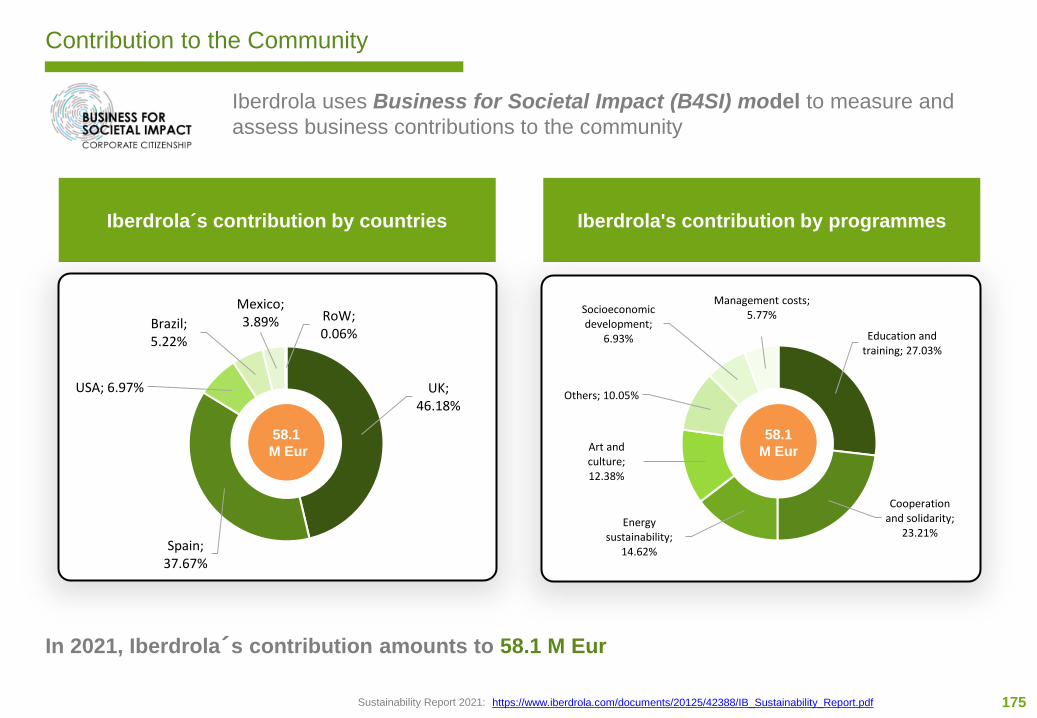
175
UK; 46.18%
Spain; 37.67%
USA; 6.97%
Brazil; 5.22%
Mexico; 3.89% RoW;
0.06%
58.1
M Eur
Contribution to the Community
Iberdrola uses Business for Societal Impact (B4SI) model to measure and
assess business contributions to the community
Iberdrola´s contribution by countries Iberdrola's contribution by programmes
In 2021, Iberdrola´s contribution amounts to 58.1 M Eur
Education and training; 27.03%
Cooperation and solidarity;
23.21%Energy
sustainability; 14.62%
Art and culture; 12.38%
Others; 10.05%
Socioeconomic development;
6.93%
Management costs; 5.77%
58.1
M Eur
https://www.iberdrola.com/documents/20125/42388/IB_Sustainability_Report.pdfSustainability Report 2021:
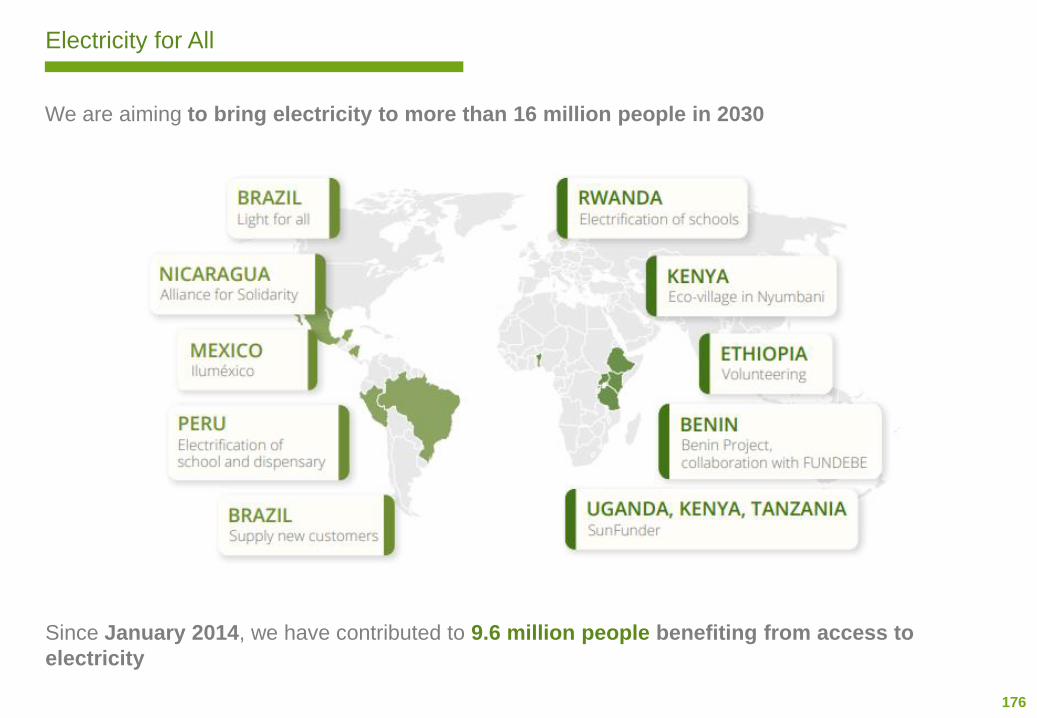
176
Electricity for All
We are aiming to bring electricity to more than 16 million people in 2030
Since January 2014, we have contributed to 9.6 million people benefiting from access to
electricity
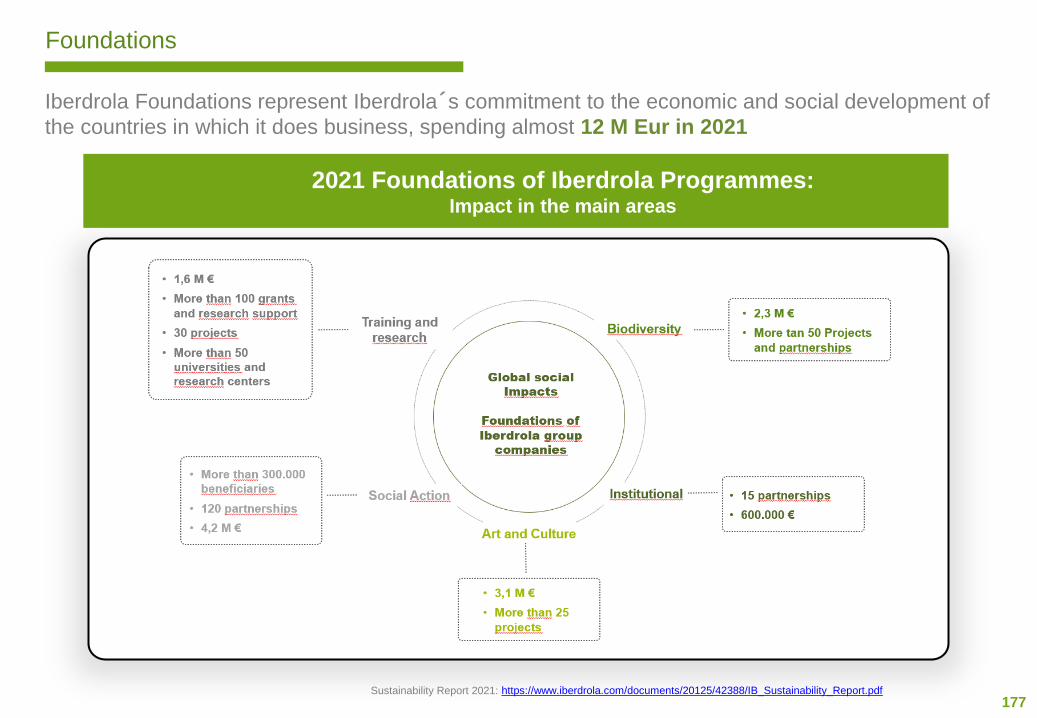
177
Foundations
Iberdrola Foundations represent Iberdrola´s commitment to the economic and social development of
the countries in which it does business, spending almost 12 M Eur in 2021
2021 Foundations of Iberdrola Programmes:Impact in the main areas
https://www.iberdrola.com/documents/20125/42388/IB_Sustainability_Report.pdfSustainability Report 2021:
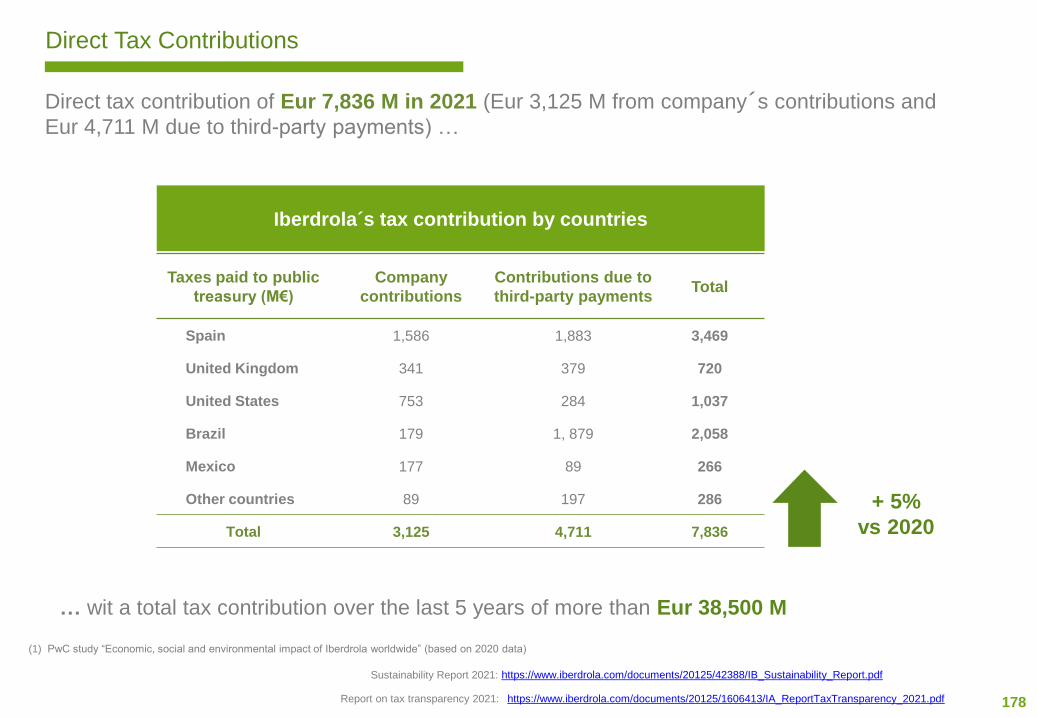
178
Direct Tax Contributions
Direct tax contribution of Eur 7,836 M in 2021 (Eur 3,125 M from company´s contributions and
Eur 4,711 M due to third-party payments) …
Iberdrola´s tax contribution by countries
… wit a total tax contribution over the last 5 years of more than Eur 38,500 M
https://www.iberdrola.com/documents/20125/42388/IB_Sustainability_Report.pdfSustainability Report 2021:
Taxes paid to public
treasury (M€)
Company
contributions
Contributions due to
third-party paymentsTotal
Spain 1,586 1,883 3,469
United Kingdom 341 379 720
United States 753 284 1,037
Brazil 179 1, 879 2,058
Mexico 177 89 266
Other countries 89 197 286
Total 3,125 4,711 7,836
https://www.iberdrola.com/documents/20125/1606413/IA_ReportTaxTransparency_2021.pdfReport on tax transparency 2021:
(1) PwC study “Economic, social and environmental impact of Iberdrola worldwide” (based on 2020 data)
+ 5%
vs 2020
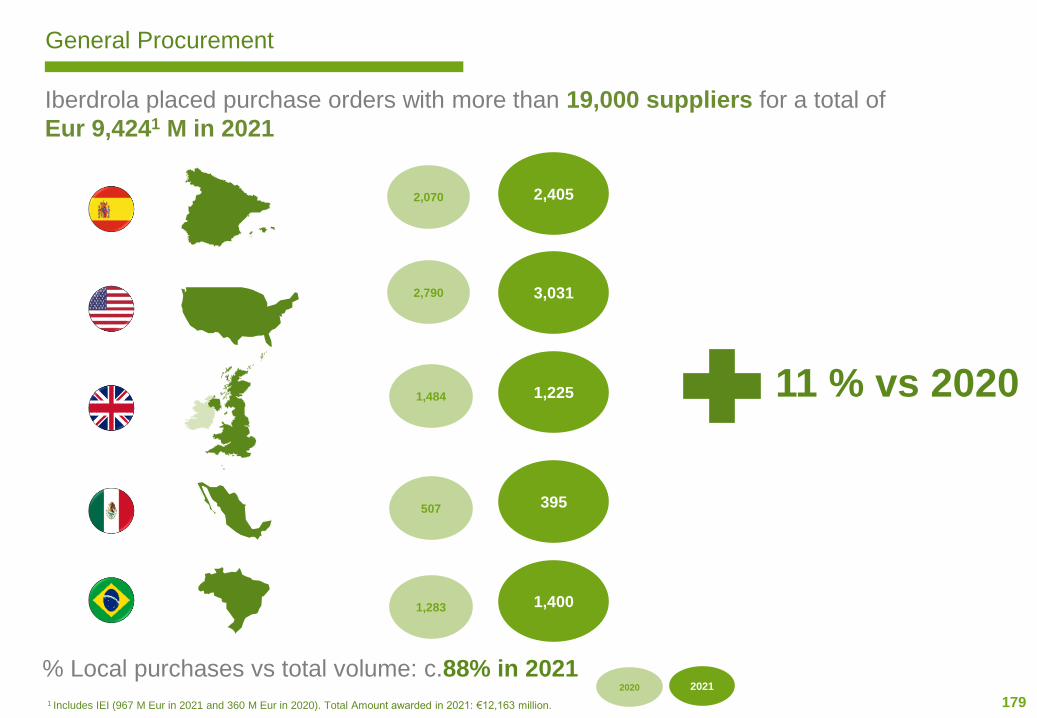
179
% Local purchases vs total volume: c.88% in 2021
2,070 2,405
2020 2021
3,031
1,225
395
1,400
2,790
1,484
507
1,283
Iberdrola placed purchase orders with more than 19,000 suppliers for a total of
Eur 9,4241 M in 2021
General Procurement
1 Includes IEI (967 M Eur in 2021 and 360 M Eur in 2020). Total Amount awarded in 2021: €12,163 million.
11 % vs 2020

Governance
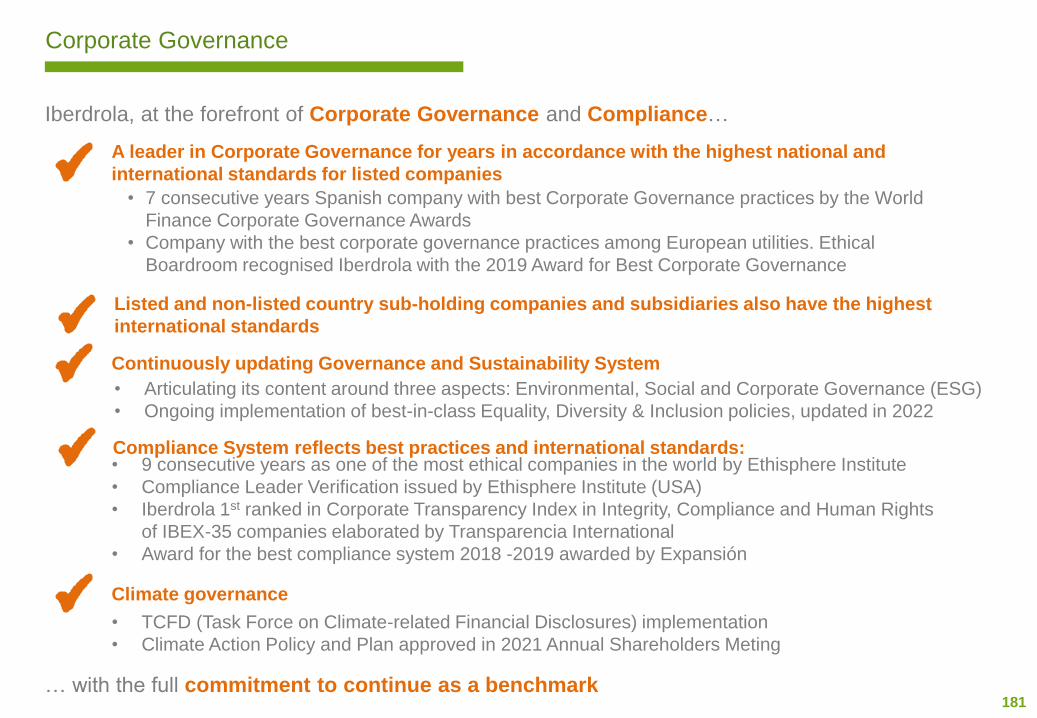
181
Corporate Governance
Iberdrola, at the forefront of Corporate Governance and Compliance…
… with the full commitment to continue as a benchmark
A leader in Corporate Governance for years in accordance with the highest national and
international standards for listed companies
• 7 consecutive years Spanish company with best Corporate Governance practices by the World
Finance Corporate Governance Awards
• Company with the best corporate governance practices among European utilities. Ethical
Boardroom recognised Iberdrola with the 2019 Award for Best Corporate Governance
Listed and non-listed country sub-holding companies and subsidiaries also have the highest
international standards
Continuously updating Governance and Sustainability System
• Articulating its content around three aspects: Environmental, Social and Corporate Governance (ESG)
• Ongoing implementation of best-in-class Equality, Diversity & Inclusion policies, updated in 2022
Compliance System reflects best practices and international standards:• 9 consecutive years as one of the most ethical companies in the world by Ethisphere Institute
• Compliance Leader Verification issued by Ethisphere Institute (USA)
• Iberdrola 1st ranked in Corporate Transparency Index in Integrity, Compliance and Human Rights
of IBEX-35 companies elaborated by Transparencia International
• Award for the best compliance system 2018 -2019 awarded by Expansión
Climate governance
• TCFD (Task Force on Climate-related Financial Disclosures) implementation
• Climate Action Policy and Plan approved in 2021 Annual Shareholders Meting
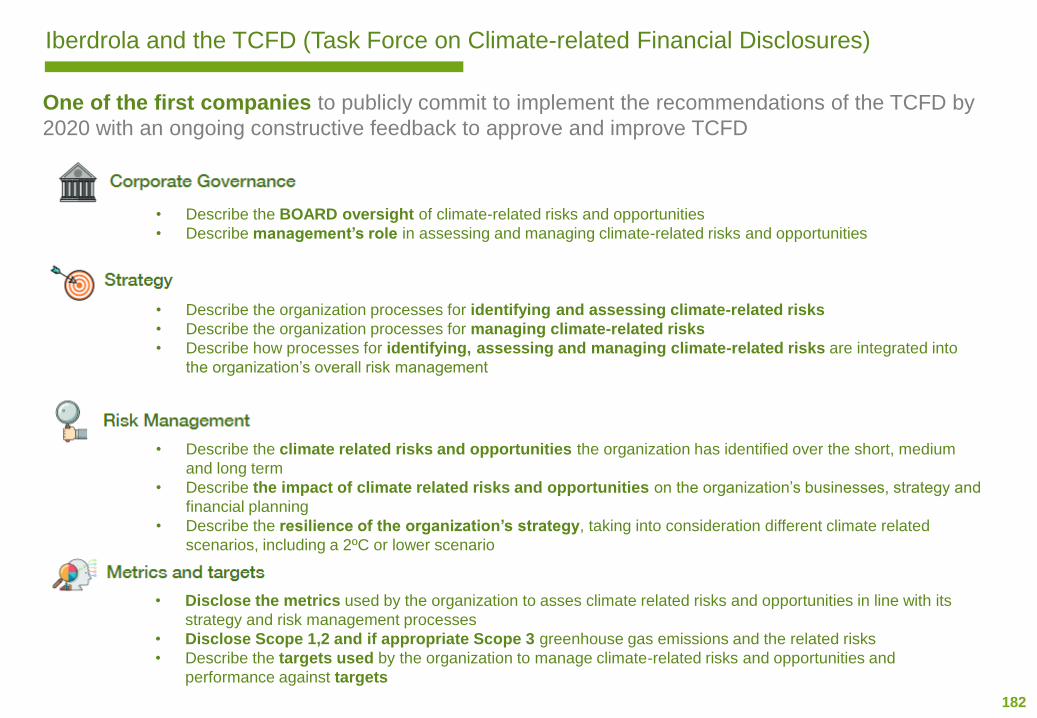
182
Iberdrola and the TCFD (Task Force on Climate-related Financial Disclosures)
One of the first companies to publicly commit to implement the recommendations of the TCFD by
2020 with an ongoing constructive feedback to approve and improve TCFD
• Describe the BOARD oversight of climate-related risks and opportunities
• Describe management’s role in assessing and managing climate-related risks and opportunities
• Describe the organization processes for identifying and assessing climate-related risks
• Describe the organization processes for managing climate-related risks
• Describe how processes for identifying, assessing and managing climate-related risks are integrated into
the organization’s overall risk management
• Describe the climate related risks and opportunities the organization has identified over the short, medium
and long term
• Describe the impact of climate related risks and opportunities on the organization’s businesses, strategy and
financial planning
• Describe the resilience of the organization’s strategy, taking into consideration different climate related
scenarios, including a 2ºC or lower scenario
• Disclose the metrics used by the organization to asses climate related risks and opportunities in line with its
strategy and risk management processes
• Disclose Scope 1,2 and if appropriate Scope 3 greenhouse gas emissions and the related risks
• Describe the targets used by the organization to manage climate-related risks and opportunities and
performance against targets
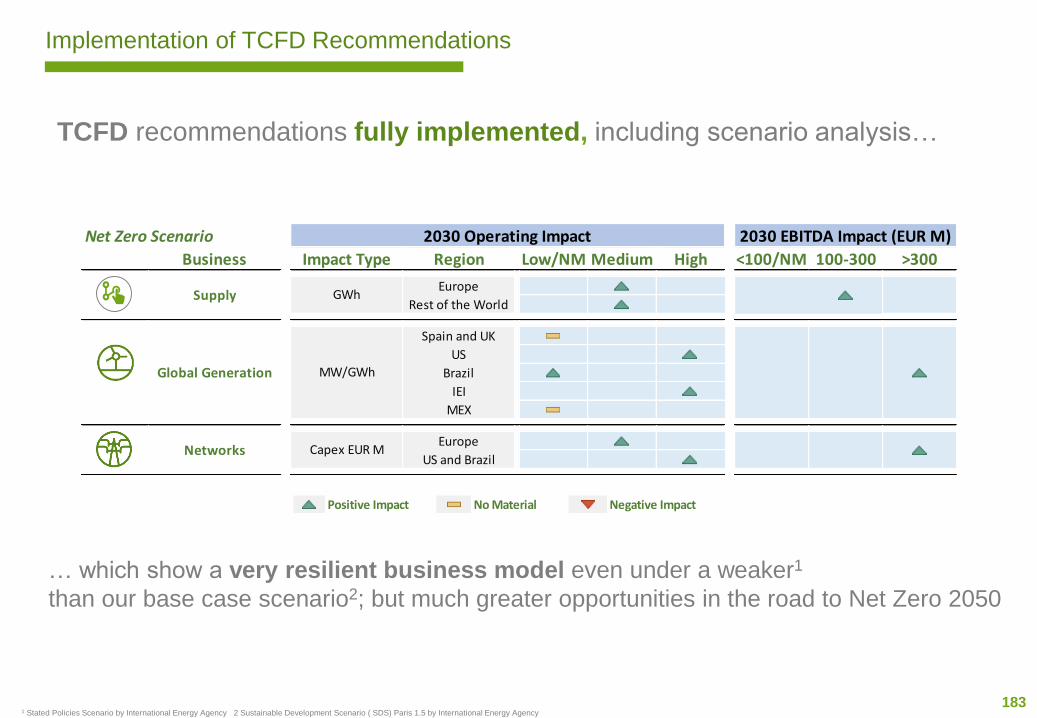
183
Implementation of TCFD Recommendations
TCFD recommendations fully implemented, including scenario analysis…
… which show a very resilient business model even under a weaker1
than our base case scenario2; but much greater opportunities in the road to Net Zero 2050
Positive Impact No Material Negative Impact
Net Zero Scenario
Business Impact Type Region Low/NM Medium High <100/NM 100-300 >300
Europe
Rest of the World
Spain and UK
US
Brazil
IEI
MEX
Europe
US and Brazil
2030 EBITDA Impact (EUR M)2030 Operating Impact
GWh
Capex EUR M
MW/GWh
Supply
Global Generation
Networks
1 Stated Policies Scenario by International Energy Agency 2 Sustainable Development Scenario ( SDS) Paris 1.5 by International Energy Agency
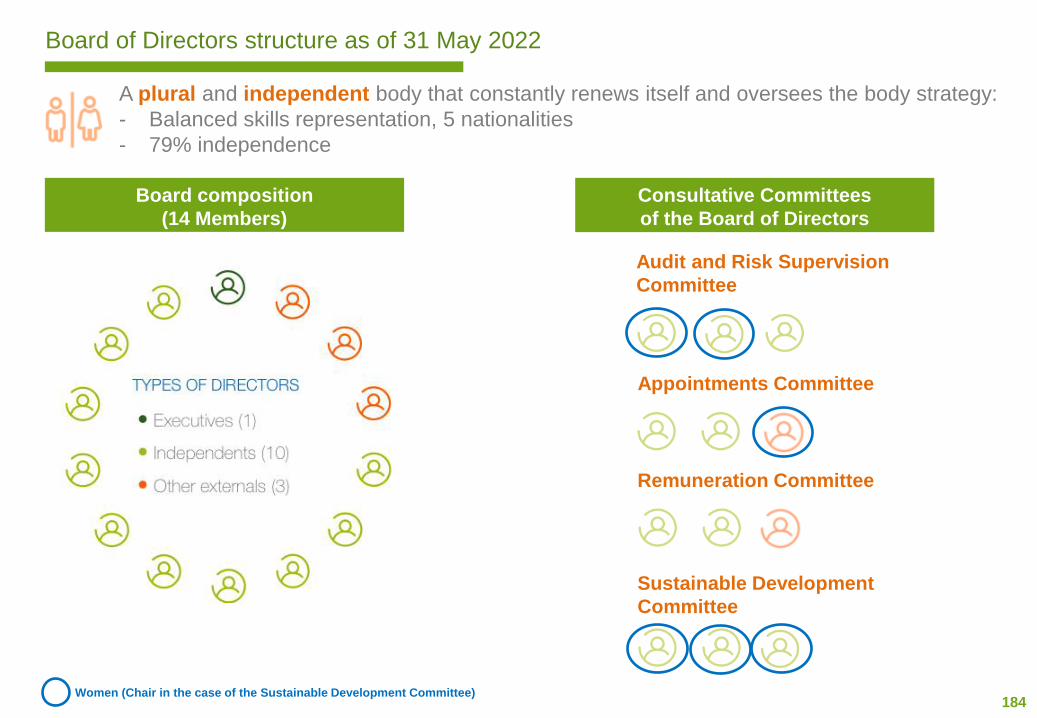
184
Board of Directors structure as of 31 May 2022
A plural and independent body that constantly renews itself and oversees the body strategy:
- Balanced skills representation, 5 nationalities
- 79% independence
Board composition
(14 Members)
Consultative Committees
of the Board of Directors
Audit and Risk Supervision
Committee
Appointments Committee
Remuneration Committee
Sustainable Development
Committee
Women (Chair in the case of the Sustainable Development Committee)
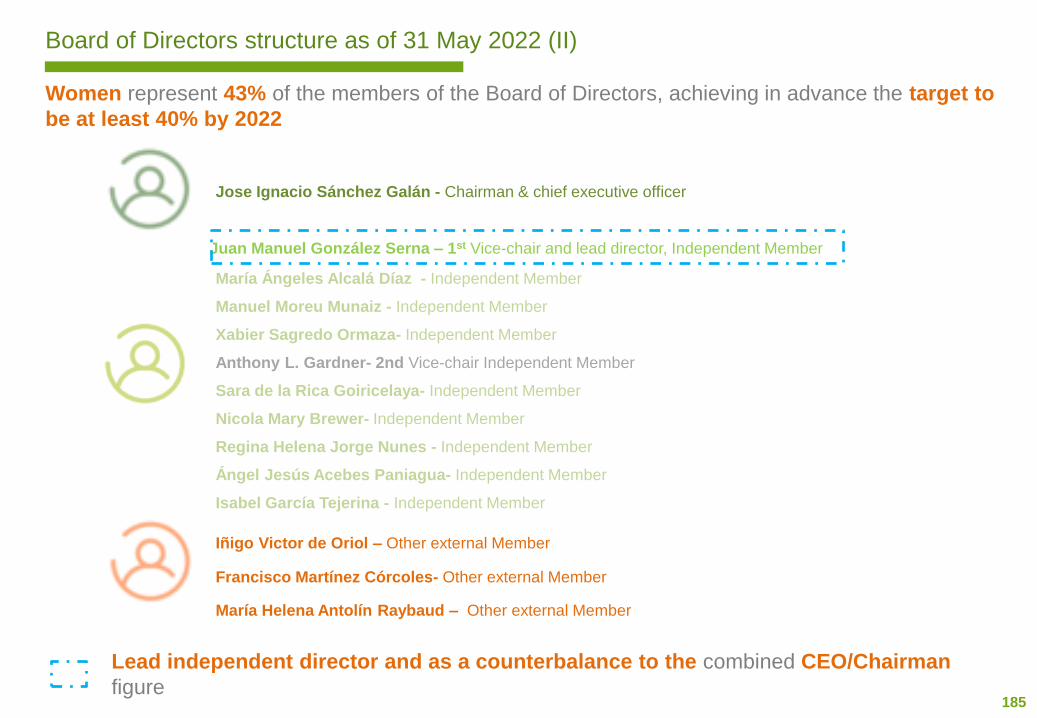
185
Board of Directors structure as of 31 May 2022 (II)
Women represent 43% of the members of the Board of Directors, achieving in advance the target to
be at least 40% by 2022
Jose Ignacio Sánchez Galán - Chairman & chief executive officer
Juan Manuel González Serna – 1st Vice-chair and lead director, Independent Member
Iñigo Victor de Oriol – Other external Member
Francisco Martínez Córcoles- Other external Member
María Helena Antolín Raybaud – Other external Member
María Ángeles Alcalá Díaz - Independent Member
Manuel Moreu Munaiz - Independent Member
Xabier Sagredo Ormaza- Independent Member
Anthony L. Gardner- 2nd Vice-chair Independent Member
Sara de la Rica Goiricelaya- Independent Member
Nicola Mary Brewer- Independent Member
Regina Helena Jorge Nunes - Independent Member
Ángel Jesús Acebes Paniagua- Independent Member
Lead independent director and as a counterbalance to the combined CEO/Chairman
figure
Isabel García Tejerina - Independent Member
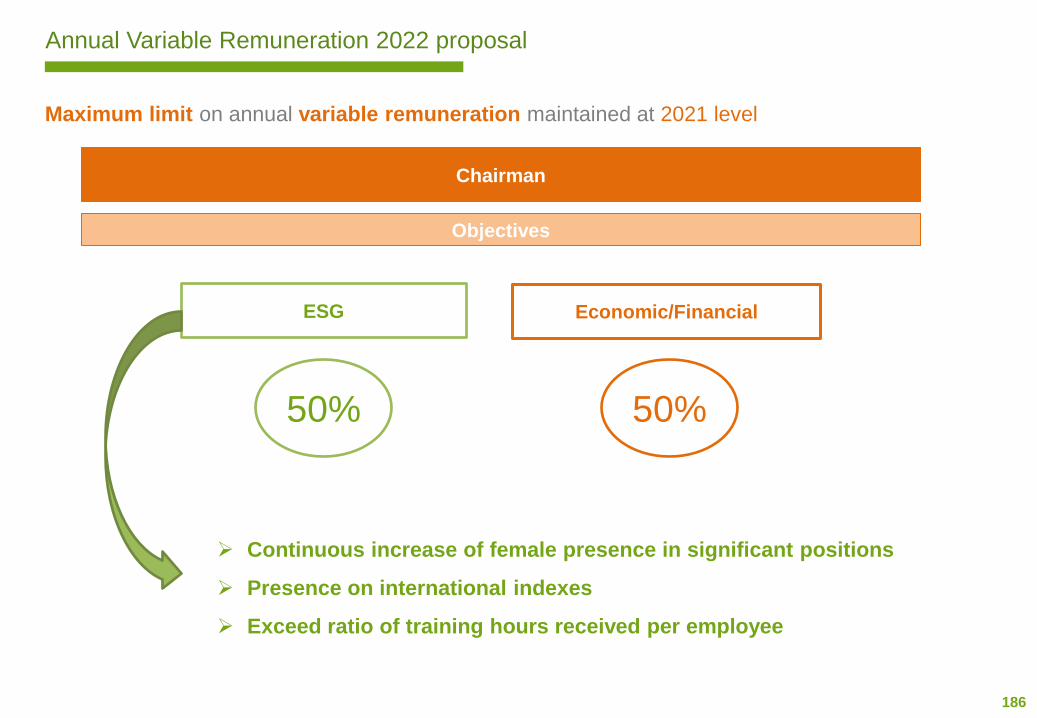
186
Annual Variable Remuneration 2022 proposal
Chairman
Economic/Financial ESG
50%50%
Maximum limit on annual variable remuneration maintained at 2021 level
➢ Continuous increase of female presence in significant positions
➢ Presence on international indexes
➢ Exceed ratio of training hours received per employee
Objectives

187
Strategic Bonus (LTIP) 2020-2022 proposal
30% weight of ESG criteria factors in the management LT remuneration
Economic/
Financial
30%Net profit growth, 2022 target range of [Eur 3.7 bn – Eur 4.2 bn]
MarketTSR performance vs Eurostoxx Utilities Index, target range of
[-5% - +5%]
Financial strength, 2022 FFO/Net Debt target range of
[2019 FFO/Net Debt – 22%]20%
20%
ESG
2020-2022 CO2 average emission range of [2017-2019 CO2
average emission - 105 g CO2/kWh]
Most relevant providers adoption of sustainable practices:
[30% - 70%]
Gender salary gap ratio women/men salary: [2% max gap]
10%
10%
10%
3-year evaluation period 2020-2021 and payment period 2023-2025
30%
70%
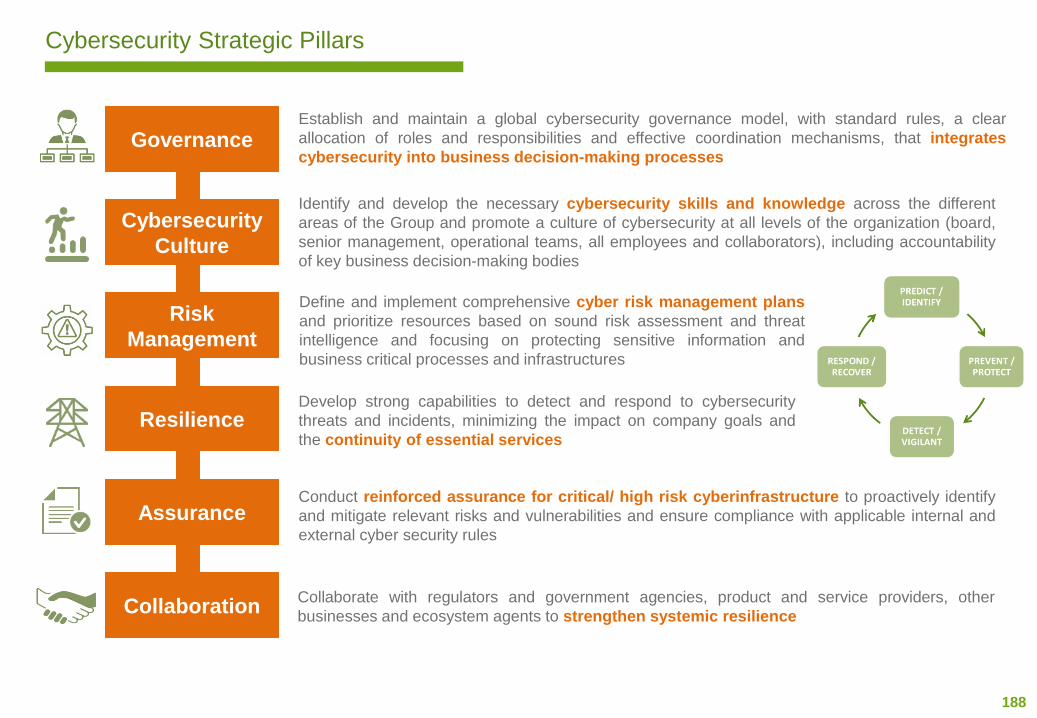
188
Cybersecurity Strategic Pillars
Governance
Cybersecurity
Culture
Risk
Management
Resilience
Assurance
Collaboration
Establish and maintain a global cybersecurity governance model, with standard rules, a clear
allocation of roles and responsibilities and effective coordination mechanisms, that integrates
cybersecurity into business decision-making processes
Identify and develop the necessary cybersecurity skills and knowledge across the different
areas of the Group and promote a culture of cybersecurity at all levels of the organization (board,
senior management, operational teams, all employees and collaborators), including accountability
of key business decision-making bodies
Define and implement comprehensive cyber risk management plans
and prioritize resources based on sound risk assessment and threat
intelligence and focusing on protecting sensitive information and
business critical processes and infrastructures
Conduct reinforced assurance for critical/ high risk cyberinfrastructure to proactively identify
and mitigate relevant risks and vulnerabilities and ensure compliance with applicable internal and
external cyber security rules
Develop strong capabilities to detect and respond to cybersecurity
threats and incidents, minimizing the impact on company goals and
the continuity of essential services
Collaborate with regulators and government agencies, product and service providers, other
businesses and ecosystem agents to strengthen systemic resilience
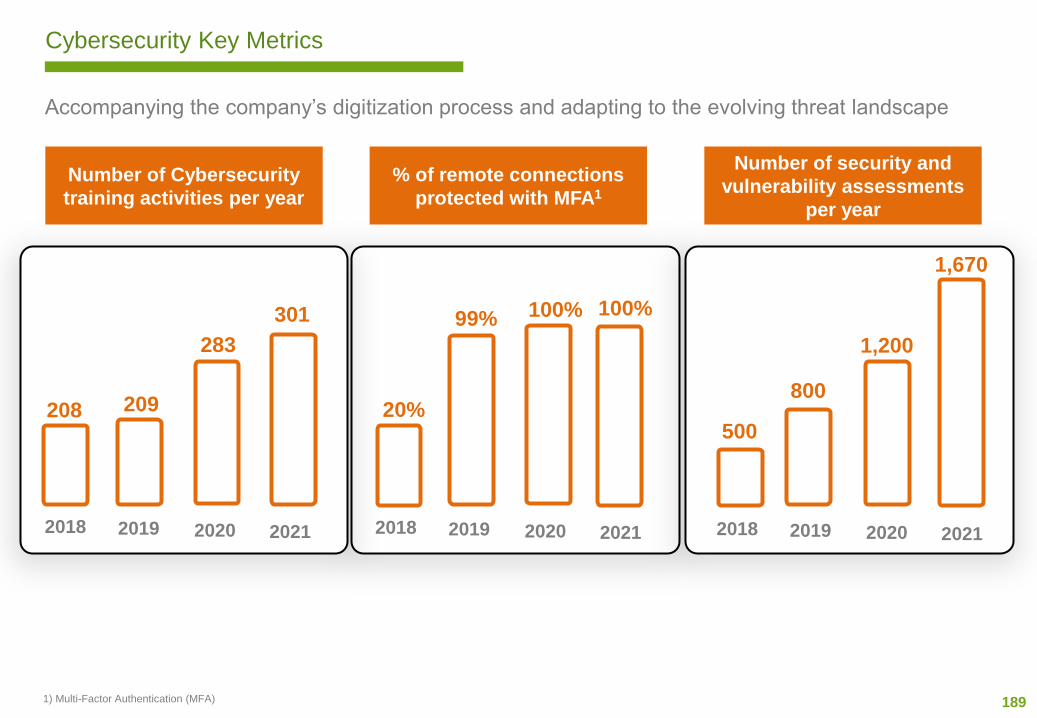
189
Cybersecurity Key Metrics
Number of Cybersecurity
training activities per year
2018 2019 2020
208 209
283
% of remote connections
protected with MFA1
20%
99%100%
1) Multi-Factor Authentication (MFA)
Number of security and
vulnerability assessments
per year
500
800
1,200
Accompanying the company’s digitization process and adapting to the evolving threat landscape
2021 2018 2019 2020 2021 2018 2019 2020 2021
100%
1,670
301
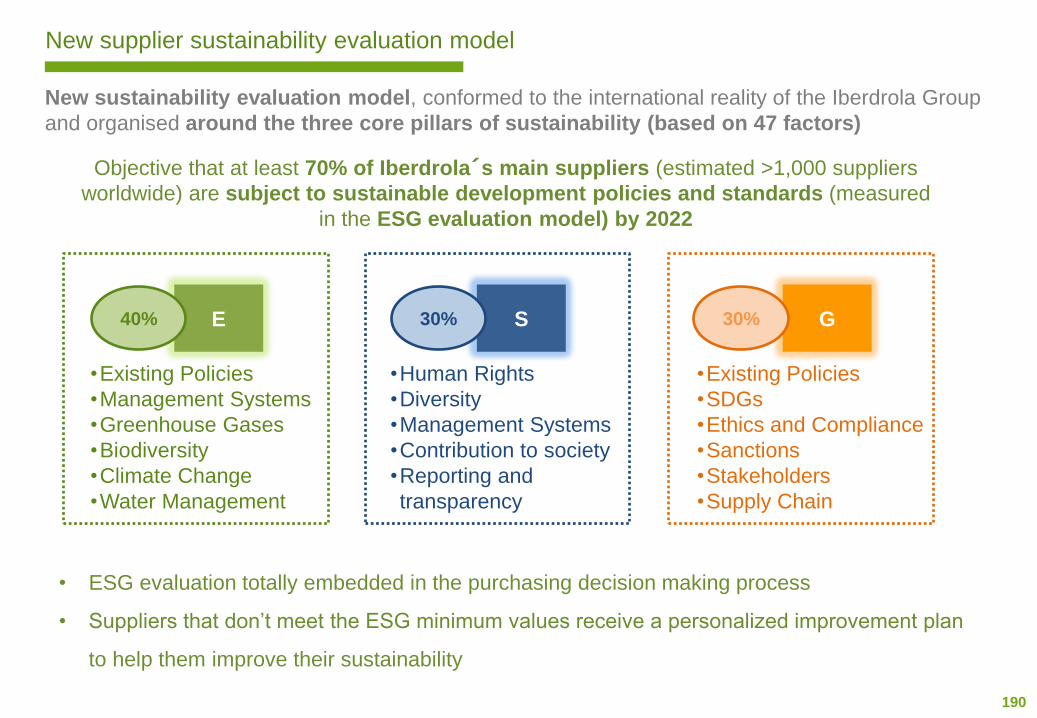
190
New supplier sustainability evaluation model
New sustainability evaluation model, conformed to the international reality of the Iberdrola Group
and organised around the three core pillars of sustainability (based on 47 factors)
E40% S30% G30%
•Existing Policies
•Management Systems
•Greenhouse Gases
•Biodiversity
•Climate Change
•Water Management
•Human Rights
•Diversity
•Management Systems
•Contribution to society
•Reporting and
transparency
•Existing Policies
•SDGs
•Ethics and Compliance
•Sanctions
•Stakeholders
•Supply Chain
Objective that at least 70% of Iberdrola´s main suppliers (estimated >1,000 suppliers
worldwide) are subject to sustainable development policies and standards (measured
in the ESG evaluation model) by 2022
• ESG evaluation totally embedded in the purchasing decision making process
• Suppliers that don’t meet the ESG minimum values receive a personalized improvement plan
to help them improve their sustainability
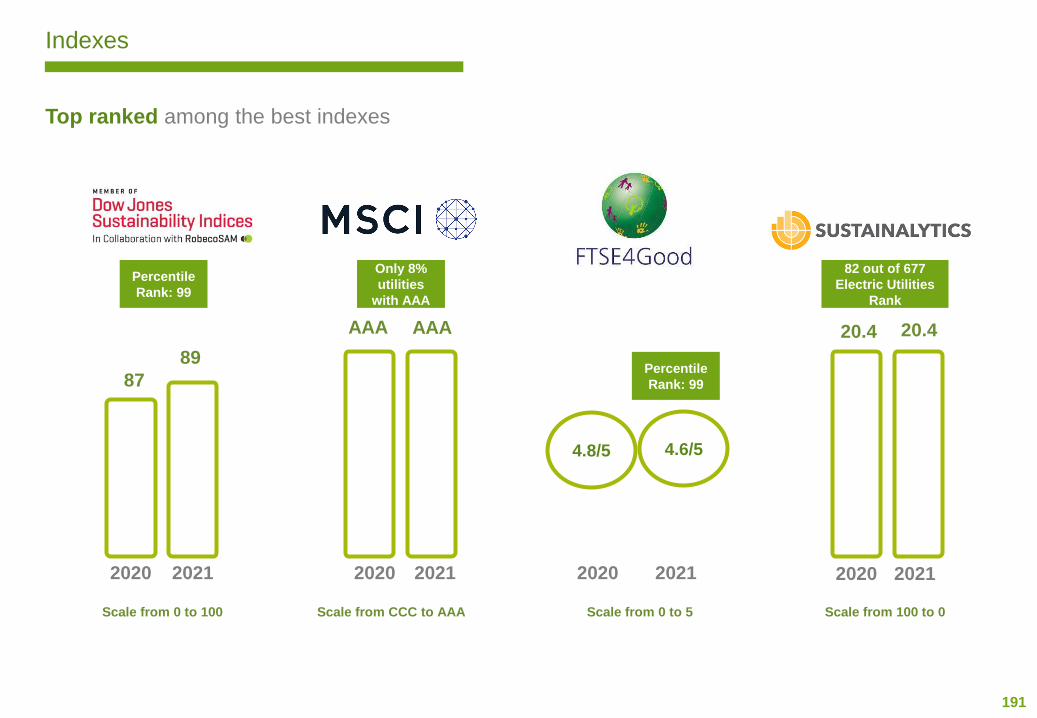
191
Indexes
2020 2021
87
89
2020 2021
AAA AAA
2020 2021
4.8/5 4.6/5
Percentile
Rank: 99
Percentile
Rank: 99
2020 2021
20.4 20.4
82 out of 677
Electric Utilities
Rank
Top ranked among the best indexes
Scale from 0 to 100 Scale from CCC to AAA Scale from 100 to 0Scale from 0 to 5
Only 8%
utilities
with AAA
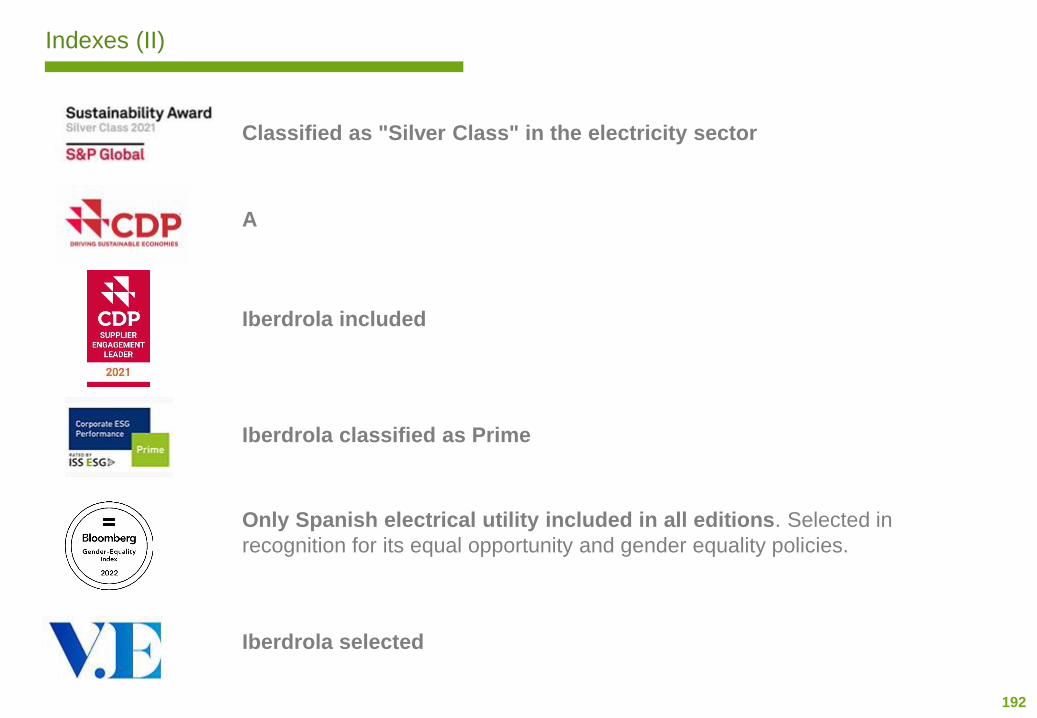
192
Indexes (II)
Classified as "Silver Class" in the electricity sector
A
Iberdrola included
Iberdrola classified as Prime
Only Spanish electrical utility included in all editions. Selected in
recognition for its equal opportunity and gender equality policies.
Iberdrola selected