F. No. 3-1/ 2019-20-CFCC-ES
12
F. No. 3-1/ 2019-20-CFCC-ES GOVERNMENT OF INDIA MINISTRY OF AGRICULTURE AND FARMERS WELFARE DEPARTMENT OF AGRICULTURE, COOPERATION AND FARMERS WELFARE (CROP FORECAST COORDINATION CENTRE) Room No. 443 Krishi Bhawan, New Delhi Dated: 25.02.2020 SUBJECT: MINUTES OF THE MEETING OF THE CROP WEATHER WATCH GROUP HELD ON 21.02.2020. Summary observations of the Group on Agenda Items The All-India level rainfall during the week i.e. 13 th February to 19 th February, 2020 has been 92% lower than Long Period Average (LPA). Rainfall in the four broad geographical divisions of the country during the above period have been lower by 100% in Central India, by 98% in South Peninsula, by 94% in North West India and by 77% in East & North East India . The cumulative rainfall in the country during the winter season i.e. 1 st January, 2020 to 19 th February, 2020 has been by 1% lower than Long Period Average (LPA). Rainfall in the four broad geographical divisions of the country during the above period have been higher than LPA by 62% in Central India but lower than LPA by 27% in South Peninsula, by 17% in East & North East India and by 7% in North West India. For winter season 1 st January, 2020 to 19 th February, 2020 out of 36 met sub-divisions, 10 met sub-divisions constituting 30% of the total area of the country has received large excess/excess rainfall, 08 met sub-divisions constituting 30% of the total area of the country has received normal rainfall, 15 met sub-divisions constituting 36% of the total area of the country has received deficient/large deficient rainfall and 03 met sub-divisions constituting 4% of the total area of the country has received no rainfall. Central Water Commission monitors 123 major reservoirs in the country which have total live capacity of 171.09 Billion Cubic Meter (BCM) at Full Reservoir Level (FRL). Out of these, 99 reservoirs with FRL capacity of 126.45 BCM have irrigation potential. Live storage in 123 major reservoirs as on 20 th February, 2020 has been 105.56 BCM as against 68.60 BCM on 20.02.2019 (last year) and 72.10 BCM of normal (average of the last 10 years) storage. Current year’s storage is 154% of last year’s storage and 146% of average of last 10 year’s storage. As per 2 nd Advance Estimates 2019-20, around 99% of the normal area under Rabi crops has been sown. Total area sown under Rabi crops in the country has been reported to be 625.23 lakh hectares as compared to 595.33 lakh hectares during 2018-19 (Final Estimates). This year’s area coverage so far is higher by 29.9 lakh ha. than the area coverage during the corresponding period of last year. The All Commodities inflation rate based on Wholesale Price Index (WPI) on a point to point basis for the month of January, 2020 increased to 3.10% from the level of 2.59% in the month of December, 2019. The inflation rate was 2.76% during the corresponding period of last year.
-
Upload
khangminh22 -
Category
Documents
-
view
0 -
download
0
Transcript of F. No. 3-1/ 2019-20-CFCC-ES
F. No. 3-1/ 2019-20-CFCC-ES
GOVERNMENT OF INDIA
MINISTRY OF AGRICULTURE AND FARMERS WELFARE
DEPARTMENT OF AGRICULTURE, COOPERATION AND FARMERS WELFARE
(CROP FORECAST COORDINATION CENTRE)
Room No. 443
Krishi Bhawan, New Delhi
Dated: 25.02.2020
SUBJECT: MINUTES OF THE MEETING OF THE CROP WEATHER WATCH GROUP
HELD ON 21.02.2020.
Summary observations of the Group on Agenda Items
The All-India level rainfall during the week i.e. 13th February to 19th February, 2020 has been
92% lower than Long Period Average (LPA). Rainfall in the four broad geographical divisions
of the country during the above period have been lower by 100% in Central India, by 98% in
South Peninsula, by 94% in North West India and by 77% in East & North East India .
The cumulative rainfall in the country during the winter season i.e. 1st January, 2020 to 19th
February, 2020 has been by 1% lower than Long Period Average (LPA). Rainfall in the four
broad geographical divisions of the country during the above period have been higher than LPA
by 62% in Central India but lower than LPA by 27% in South Peninsula, by 17% in East &
North East India and by 7% in North West India.
For winter season 1st January, 2020 to 19th February, 2020 out of 36 met sub-divisions, 10 met
sub-divisions constituting 30% of the total area of the country has received large excess/excess
rainfall, 08 met sub-divisions constituting 30% of the total area of the country has received
normal rainfall, 15 met sub-divisions constituting 36% of the total area of the country has
received deficient/large deficient rainfall and 03 met sub-divisions constituting 4% of the total
area of the country has received no rainfall.
Central Water Commission monitors 123 major reservoirs in the country which have total live
capacity of 171.09 Billion Cubic Meter (BCM) at Full Reservoir Level (FRL). Out of these, 99
reservoirs with FRL capacity of 126.45 BCM have irrigation potential. Live storage in 123 major
reservoirs as on 20th February, 2020 has been 105.56 BCM as against 68.60 BCM on 20.02.2019
(last year) and 72.10 BCM of normal (average of the last 10 years) storage. Current year’s
storage is 154% of last year’s storage and 146% of average of last 10 year’s storage.
As per 2nd Advance Estimates 2019-20, around 99% of the normal area under Rabi crops
has been sown. Total area sown under Rabi crops in the country has been reported to be
625.23 lakh hectares as compared to 595.33 lakh hectares during 2018-19 (Final Estimates).
This year’s area coverage so far is higher by 29.9 lakh ha. than the area coverage during the
corresponding period of last year.
The All Commodities inflation rate based on Wholesale Price Index (WPI) on a point to point
basis for the month of January, 2020 increased to 3.10% from the level of 2.59% in the month
of December, 2019. The inflation rate was 2.76% during the corresponding period of last year.
The Primary Articles inflation rate based on Wholesale Price Index (WPI) on a point to point
basis for the month of January, 2020 decreased to 10.01% from the level of 11.46% in the
month of December, 2019. The inflation rate was 3.00% during the corresponding period of last
year.
The wholesale price index for food items decreased to 11.51% from the previous month level of
13.24% and non-food items decreased to 7.05% from the previous month’s level of 7.72%.
Among the foodgrains, inflation as per wholesale price index of Wheat has increased to 8.91%
from the previous month’s level of 8.44% and Paddy to 4.17% from the previous month’s level
of 4.05% The inflation for Pulses has decreased to 12.81% from the previous month’s level of
13.11% and Cereals to 7.73% from the previous month’s level of 7.74%.
All-India progressive procurement of Rice as on 21.02.2020 for Kharif Marketing Season
(KMS) 2019-20 is 375.19 lakh tonnes against the procurement of 349.17 lakh tonnes in the
corresponding period of last year.

1. Winter Season (Jan. – Feb.) during the week ending 19th February, 2020
Sub-Division wise Weekly Rainfall Forecast is shown in Table-1.1
Rainfall during the week (13th February to 19th February, 2020) Rainfall was deficient/large
deficient in 10 sub-divisions and no rain in 26 met sub-division out of 36 meteorological sub-
divisions.
Cumulative rainfall (01st January, 2020 to 19th February, 2020) Rainfall was large excess/excess
in 10 met sub-divisions, normal in 08 met sub-divisions, deficient/large deficient in 15 sub-divisions
and no rain in 03 met sub-division out of 36 meteorological sub-divisions.
Table - 1.2: Weekly and Cumulative Rainfall in four regions of the country1
LE: Large Excess, E: Excess, N: Normal, D: Deficient, LD: Large Deficient, NR: No Rain.
Source: India Meteorological Department, New Delhi
Table -1.3: Category wise comparative distribution of Sub-division (cumulative rainfall) and All-
India Percentage Rainfall Departure for the last five years since: 1st Jan., 2020 to 19th Feb, 2020
Source: IMD
Sub-division-wise 5 days rainfall forecast from 21st Feb., 2020 to 25th Feb., 2020 is shown in Table 1.4.
Forecast for next two weeks at Annex-I.
1. North-west India - Uttar Pradesh, Rajasthan, Haryana, Chandigarh and Delhi, Punjab, Uttarakhand, Himachal Pradesh, and Jammu and Kashmir.
Central India - Madhya Pradesh, Chhattisgarh, Maharashtra, Odisha, Goa and Gujarat.
South Peninsula - Andhra Pradesh & Telangana, Karnataka, Tamil Nadu & Puducherry, Kerala, A & N islands and Lakshadweep . East & North East India - Bihar, Jharkhand , West Bengal, Sikkim, Assam, Arunachal Pradesh, Meghalaya, Nagaland, Manipur, Mizoram and Tripura.
Region Week Ending (19.02.2020) Cumulative (01.01.20 to 19.02.20)
(in mm) Devi-
ation
(%)
Cate-
gory
(in mm) Devi-
ation
(%)
Cate-
gory Actual Normal Actual Normal
North-West India 0.8 13.8 -94 LD 58.9 63.1 -7 N
Central India 0.0 2.3 -100 NR 21.6 13.3 62 LE
South Peninsular India 0.1 2.4 -98 LD 9.7 13.3 -27 D
East & North-East India 2.0 8.7 -77 LD 32.9 39.6 -17 N
Country as a whole 0.6 6.9 -92 LD 32.5 32.8 -1 N
No. of Sub-Divisions with
rainfall
For the period from 1st October to
18 FEB
2015
17 FEB
2016
22 FEB
2017
21 FEB
2018
20 FEB
2019
19 FEB
2020
Large Excess
Excess Normal
Total
-
13 04
17
-
03 01
04
03
03 04
10
01
02 03
06
08
03 05
16
05
05 08
18
Deficient
Large Deficient
Scanty No rain
Total
12
-
07 00
19
11
-
16 05
32
08
12
- 06
26
07
21
- 02
30
09
07
- 04
20
07
08
- 03
18
Data Inadequate 00 00 00 00 00 00
TOTAL 36 36 36 36 36 36
All-India % Rainfall Deviation (-) 21% (-) 63% 5% (-) 64% 16% (-)1%
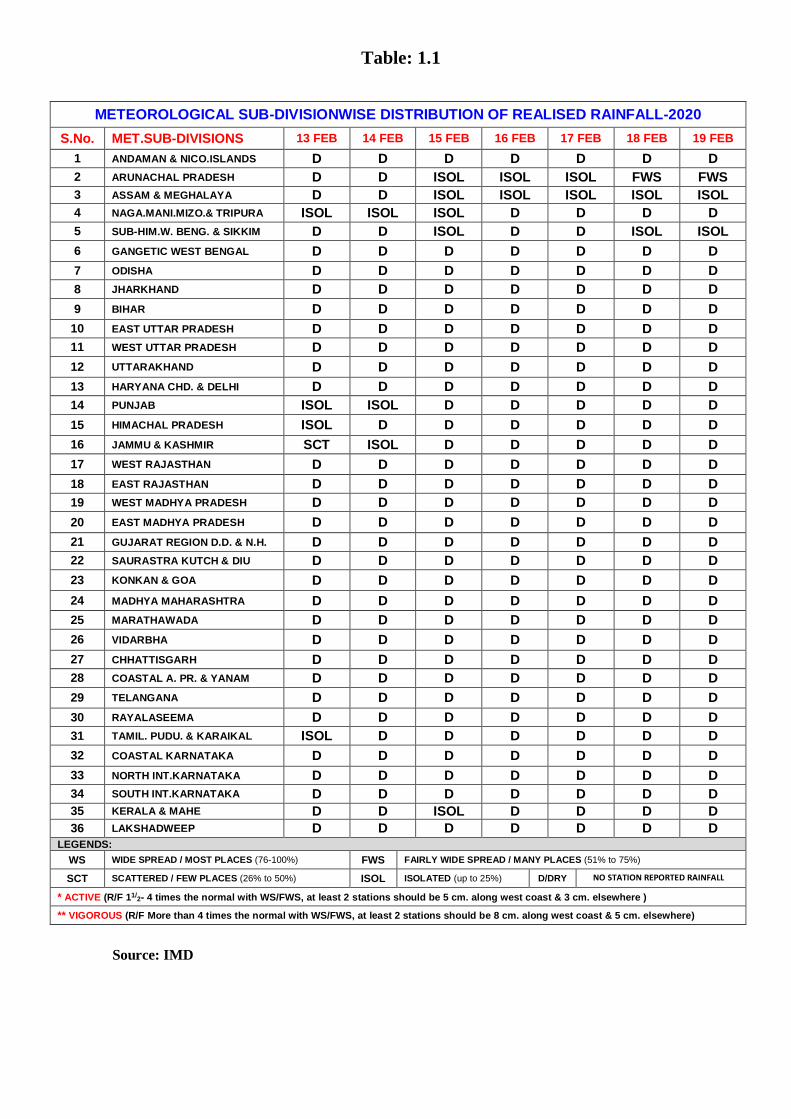
Table: 1.1
Source: IMD
METEOROLOGICAL SUB-DIVISIONWISE DISTRIBUTION OF REALISED RAINFALL-2020
S.No. MET.SUB-DIVISIONS 13 FEB 14 FEB 15 FEB 16 FEB 17 FEB 18 FEB 19 FEB
1 ANDAMAN & NICO.ISLANDS D D D D D D D
2 ARUNACHAL PRADESH D D ISOL ISOL ISOL FWS FWS
3 ASSAM & MEGHALAYA D D ISOL ISOL ISOL ISOL ISOL
4 NAGA.MANI.MIZO.& TRIPURA ISOL ISOL ISOL D D D D
5 SUB-HIM.W. BENG. & SIKKIM D D ISOL D D ISOL ISOL
6 GANGETIC WEST BENGAL D D D D D D D
7 ODISHA D D D D D D D
8 JHARKHAND D D D D D D D
9 BIHAR D D D D D D D
10 EAST UTTAR PRADESH D D D D D D D
11 WEST UTTAR PRADESH D D D D D D D
12 UTTARAKHAND D D D D D D D
13 HARYANA CHD. & DELHI D D D D D D D
14 PUNJAB ISOL ISOL D D D D D
15 HIMACHAL PRADESH ISOL D D D D D D
16 JAMMU & KASHMIR SCT ISOL D D D D D
17 WEST RAJASTHAN D D D D D D D
18 EAST RAJASTHAN D D D D D D D
19 WEST MADHYA PRADESH D D D D D D D
20 EAST MADHYA PRADESH D D D D D D D
21 GUJARAT REGION D.D. & N.H. D D D D D D D
22 SAURASTRA KUTCH & DIU D D D D D D D
23 KONKAN & GOA D D D D D D D
24 MADHYA MAHARASHTRA D D D D D D D
25 MARATHAWADA D D D D D D D
26 VIDARBHA D D D D D D D
27 CHHATTISGARH D D D D D D D
28 COASTAL A. PR. & YANAM D D D D D D D
29 TELANGANA D D D D D D D
30 RAYALASEEMA D D D D D D D
31 TAMIL. PUDU. & KARAIKAL ISOL D D D D D D
32 COASTAL KARNATAKA D D D D D D D
33 NORTH INT.KARNATAKA D D D D D D D
34 SOUTH INT.KARNATAKA D D D D D D D
35 KERALA & MAHE D D ISOL D D D D
36 LAKSHADWEEP D D D D D D D LEGENDS:
WS WIDE SPREAD / MOST PLACES (76-100%) FWS FAIRLY WIDE SPREAD / MANY PLACES (51% to 75%)
SCT SCATTERED / FEW PLACES (26% to 50%) ISOL ISOLATED (up to 25%) D/DRY NO STATION REPORTED RAINFALL
* ACTIVE (R/F 11/2- 4 times the normal with WS/FWS, at least 2 stations should be 5 cm. along west coast & 3 cm. elsewhere )
** VIGOROUS (R/F More than 4 times the normal with WS/FWS, at least 2 stations should be 8 cm. along west coast & 5 cm. elsewhere)

Table: 1.4
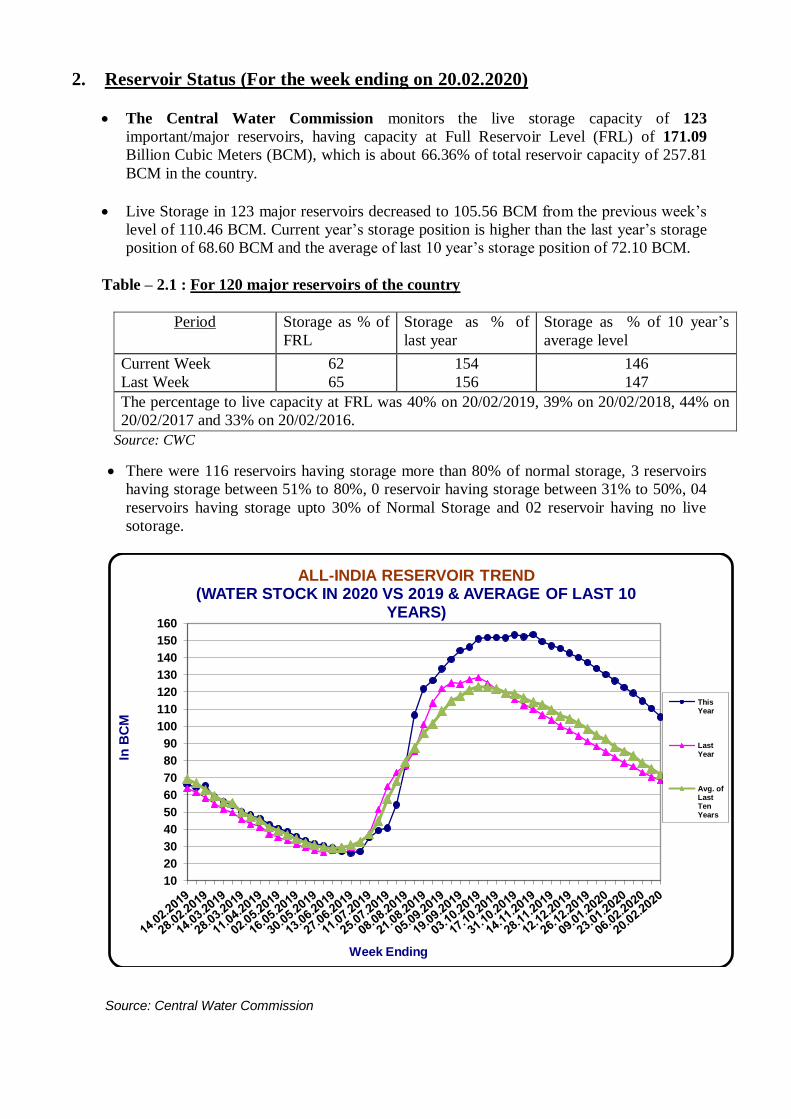
2. Reservoir Status (For the week ending on 20.02.2020)
The Central Water Commission monitors the live storage capacity of 123
important/major reservoirs, having capacity at Full Reservoir Level (FRL) of 171.09
Billion Cubic Meters (BCM), which is about 66.36% of total reservoir capacity of 257.81
BCM in the country.
Live Storage in 123 major reservoirs decreased to 105.56 BCM from the previous week’s
level of 110.46 BCM. Current year’s storage position is higher than the last year’s storage
position of 68.60 BCM and the average of last 10 year’s storage position of 72.10 BCM.
Table – 2.1 : For 120 major reservoirs of the country
Period Storage as % of
FRL
Storage as % of
last year
Storage as % of 10 year’s
average level
Current Week
Last Week
62
65
154
156
146
147
The percentage to live capacity at FRL was 40% on 20/02/2019, 39% on 20/02/2018, 44% on
20/02/2017 and 33% on 20/02/2016.
Source: CWC
There were 116 reservoirs having storage more than 80% of normal storage, 3 reservoirs
having storage between 51% to 80%, 0 reservoir having storage between 31% to 50%, 04
reservoirs having storage upto 30% of Normal Storage and 02 reservoir having no live
sotorage.
Source: Central Water Commission
10
20
30
40
50
60
70
80
90
100
110
120
130
140
150
160
In B
CM
ALL-INDIA RESERVOIR TREND(WATER STOCK IN 2020 VS 2019 & AVERAGE OF LAST 10
YEARS)
ThisYear
LastYear
Avg. ofLastTenYears
Week Ending

3. Fertilizer Position:
Table – 3.1: Requirement, Receipt, Availability, Sales and Stock position of Major Fertilizers
UREA, DAP, MOP, Complex and SSP during Rabi 2019-20 (As on 21.02.2020)
(in ‘000 tonnes)
Availability/Sale/Closing Stock Urea DAP MOP Complex SSP
Opening Stock as on 01.10.2019 365 1377 377 1269 140
Requirement for Oct,2019 to March, 2020 17904 5208 1773 5186 2567
Estimated Requirement during Feb, 2020 1943 415 231 741 320
Cumulative Receipt upto 21.02.2020 15145 4015 928 4112 1629
Cumulative Availability upto 21.02.2020 15510 5392 1305 5381 1769
Cumulative Sales upto 21.02.2020 14809 3881 933 3977 1567
Closing Stock as on 21.02.2020 701 1511 372 1404 202
Source: Fertilizer Division (DAC&FW) / Deptt. of Fertilizer
4. Pest & Diseases:
Overall intensity of pests and diseases remained below Economic Threshold Level (ETL).
Fall Army Worm reported at low to moderate intensity in 15 hectare area on Rabi Maize in Munger
district of Bihar.
Late blight reported at low to moderate intensity in 180 hectare area on Potato crop in Agra, Mathura and Firozabad districts of Uttar Pradesh.
5. Availability position of seeds and fertilizers has been found satisfactory.
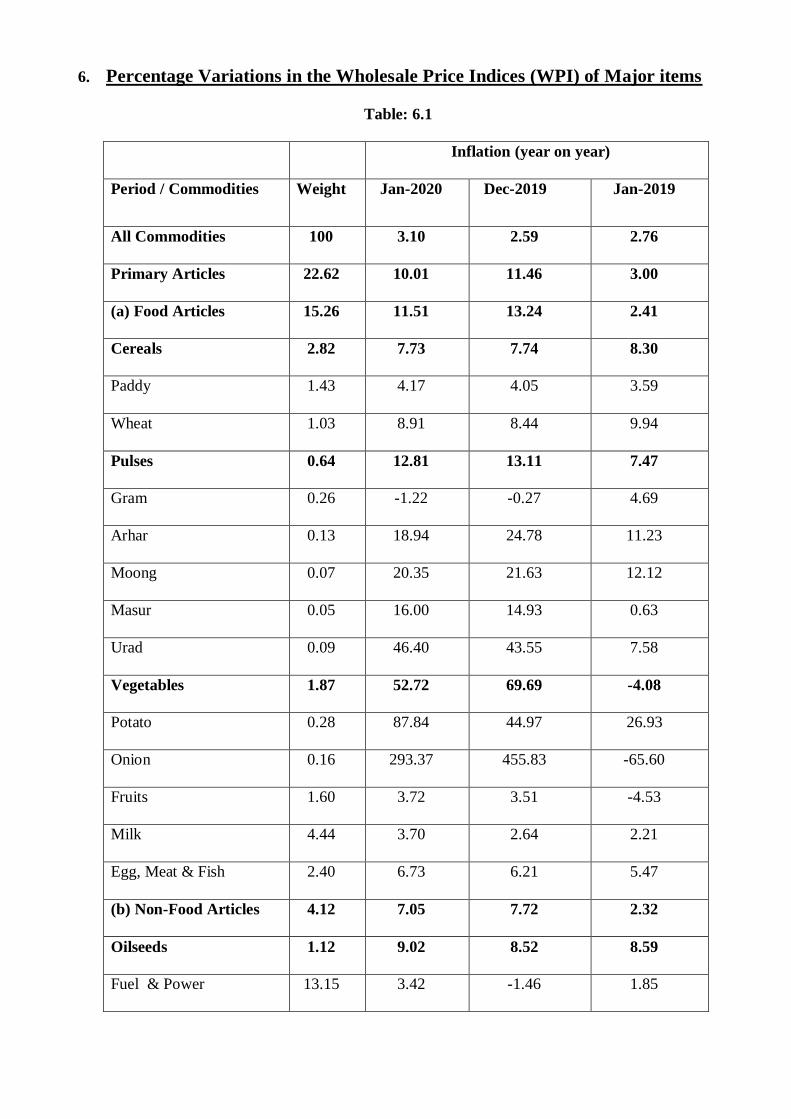
6. Percentage Variations in the Wholesale Price Indices (WPI) of Major items
Table: 6.1
Inflation (year on year)
Period / Commodities Weight Jan-2020 Dec-2019 Jan-2019
All Commodities
100 3.10 2.59 2.76
Primary Articles 22.62 10.01 11.46 3.00
(a) Food Articles 15.26 11.51 13.24 2.41
Cereals 2.82 7.73 7.74 8.30
Paddy 1.43 4.17 4.05 3.59
Wheat 1.03 8.91 8.44 9.94
Pulses 0.64 12.81 13.11 7.47
Gram 0.26 -1.22 -0.27 4.69
Arhar 0.13 18.94 24.78 11.23
Moong 0.07 20.35 21.63 12.12
Masur 0.05 16.00 14.93 0.63
Urad 0.09 46.40 43.55 7.58
Vegetables 1.87 52.72 69.69 -4.08
Potato 0.28 87.84 44.97 26.93
Onion 0.16 293.37 455.83 -65.60
Fruits 1.60 3.72 3.51 -4.53
Milk 4.44 3.70 2.64 2.21
Egg, Meat & Fish 2.40 6.73 6.21 5.47
(b) Non-Food Articles 4.12 7.05 7.72 2.32
Oilseeds
1.12 9.02 8.52 8.59
Fuel & Power
13.15 3.42 -1.46 1.85
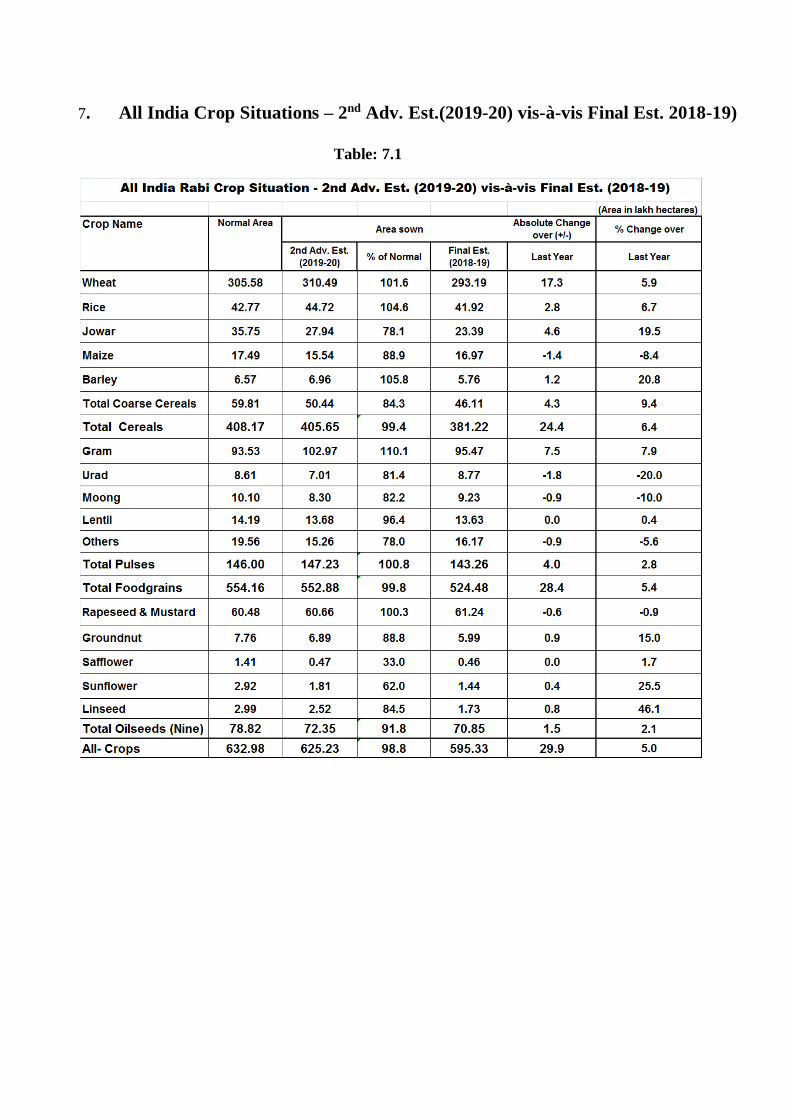
7. All India Crop Situations – 2nd Adv. Est.(2019-20) vis-à-vis Final Est. 2018-19)
Table: 7.1
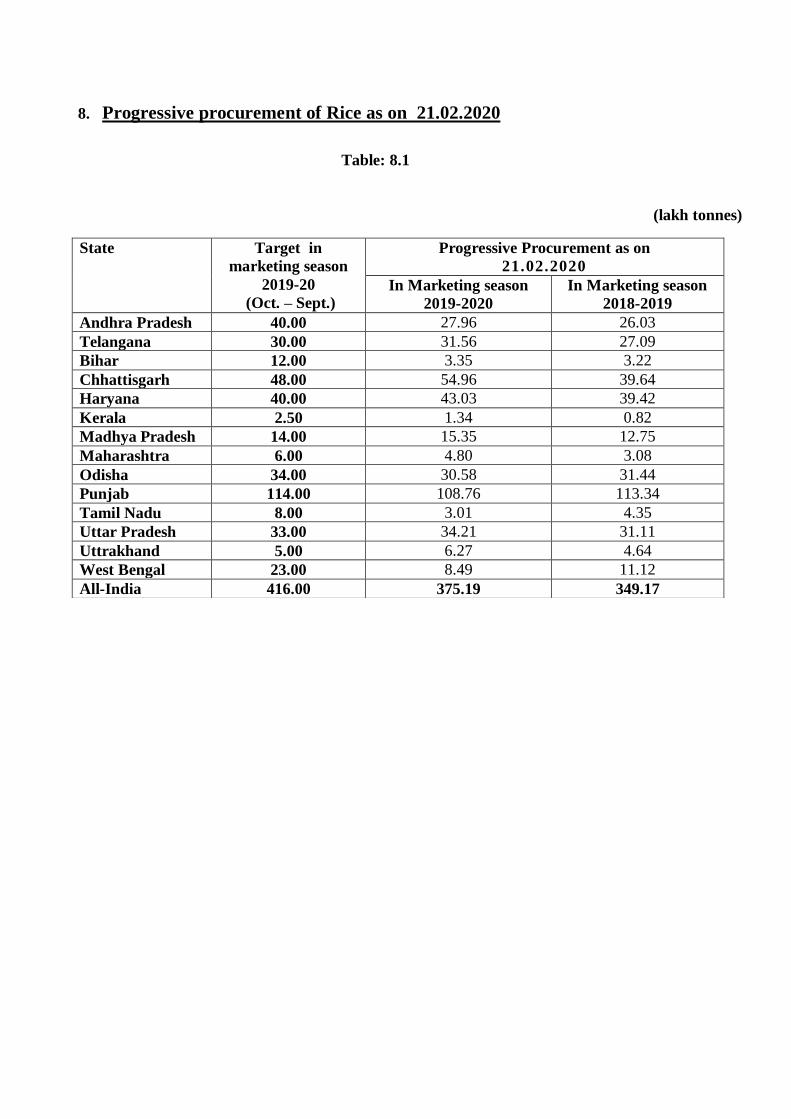
8. Progressive procurement of Rice as on 21.02.2020
Table: 8.1
(lakh tonnes)
State Target in
marketing season
2019-20
(Oct. – Sept.)
Progressive Procurement as on
21.02.2020
In Marketing season
2019-2020
In Marketing season
2018-2019
Andhra Pradesh 40.00 27.96 26.03
Telangana 30.00 31.56 27.09
Bihar 12.00 3.35 3.22
Chhattisgarh 48.00 54.96 39.64
Haryana 40.00 43.03 39.42
Kerala 2.50 1.34 0.82
Madhya Pradesh 14.00 15.35 12.75
Maharashtra 6.00 4.80 3.08
Odisha 34.00 30.58 31.44
Punjab 114.00 108.76 113.34
Tamil Nadu 8.00 3.01 4.35
Uttar Pradesh 33.00 34.21 31.11
Uttrakhand 5.00 6.27 4.64
West Bengal 23.00 8.49 11.12
All-India 416.00 375.19 349.17
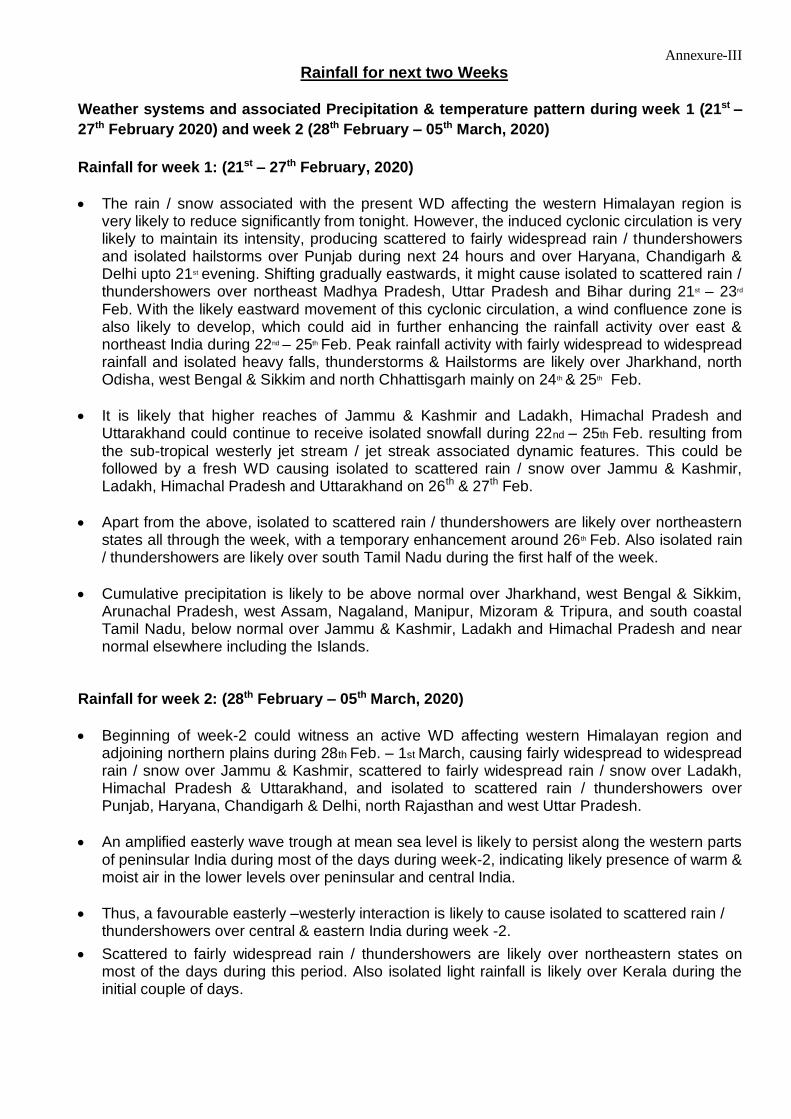
Annexure-III
Rainfall for next two Weeks
Weather systems and associated Precipitation & temperature pattern during week 1 (21st –
27th February 2020) and week 2 (28th February – 05th March, 2020)
Rainfall for week 1: (21st – 27th February, 2020)
The rain / snow associated with the present WD affecting the western Himalayan region is very likely to reduce significantly from tonight. However, the induced cyclonic circulation is very likely to maintain its intensity, producing scattered to fairly widespread rain / thundershowers and isolated hailstorms over Punjab during next 24 hours and over Haryana, Chandigarh & Delhi upto 21st evening. Shifting gradually eastwards, it might cause isolated to scattered rain / thundershowers over northeast Madhya Pradesh, Uttar Pradesh and Bihar during 21st – 23rd
Feb. With the likely eastward movement of this cyclonic circulation, a wind confluence zone is also likely to develop, which could aid in further enhancing the rainfall activity over east & northeast India during 22nd – 25th Feb. Peak rainfall activity with fairly widespread to widespread rainfall and isolated heavy falls, thunderstorms & Hailstorms are likely over Jharkhand, north Odisha, west Bengal & Sikkim and north Chhattisgarh mainly on 24th & 25th Feb.
It is likely that higher reaches of Jammu & Kashmir and Ladakh, Himachal Pradesh and Uttarakhand could continue to receive isolated snowfall during 22nd – 25th Feb. resulting from the sub-tropical westerly jet stream / jet streak associated dynamic features. This could be followed by a fresh WD causing isolated to scattered rain / snow over Jammu & Kashmir, Ladakh, Himachal Pradesh and Uttarakhand on 26th & 27th Feb.
Apart from the above, isolated to scattered rain / thundershowers are likely over northeastern states all through the week, with a temporary enhancement around 26 th Feb. Also isolated rain / thundershowers are likely over south Tamil Nadu during the first half of the week.
Cumulative precipitation is likely to be above normal over Jharkhand, west Bengal & Sikkim, Arunachal Pradesh, west Assam, Nagaland, Manipur, Mizoram & Tripura, and south coastal Tamil Nadu, below normal over Jammu & Kashmir, Ladakh and Himachal Pradesh and near normal elsewhere including the Islands.
Rainfall for week 2: (28th February – 05th March, 2020)
Beginning of week-2 could witness an active WD affecting western Himalayan region and adjoining northern plains during 28th Feb. – 1st March, causing fairly widespread to widespread rain / snow over Jammu & Kashmir, scattered to fairly widespread rain / snow over Ladakh, Himachal Pradesh & Uttarakhand, and isolated to scattered rain / thundershowers over Punjab, Haryana, Chandigarh & Delhi, north Rajasthan and west Uttar Pradesh.
An amplified easterly wave trough at mean sea level is likely to persist along the western parts of peninsular India during most of the days during week-2, indicating likely presence of warm & moist air in the lower levels over peninsular and central India.
Thus, a favourable easterly –westerly interaction is likely to cause isolated to scattered rain / thundershowers over central & eastern India during week -2.
Scattered to fairly widespread rain / thundershowers are likely over northeastern states on most of the days during this period. Also isolated light rainfall is likely over Kerala during the initial couple of days.

Cumulatively, above normal rainfall is likely over Haryana, Chandigarh & Delhi, west Uttar Pradesh, northeast Rajasthan, south Madhya Pradesh, south Bihar, northeast Jharkhand, west Bengal & Sikkim, Arunachal Pradesh, west Assam and Tripura, below normal over Jammu & Kashmir, Ladakh, Kerala, south Tamil Nadu and Nicobar Islands and near normal elsewhere.
Minimum Temperatures for week 1: (21st – 27th February, 2020)
Night minimum temperatures, in general are likely to remain above normal over Jammu, Punjab, Haryana, Chandigarh & Delhi, Uttar Pradesh, Bihar, south Rajasthan, Gujarat, north Madhya Maharashtra, coastal & south interior Karnataka, south Assam, Meghalaya and Nagaland, Manipur, Mizoram & Tripura and near normal to slightly below normal (by 2-3ºC) over the rest of the mainland.
Minimum Temperatures for week 2: (28th February – 05th March, 2020)
In general, above normal Night minimum temperatures are likely to prevail over Jammu, Ladakh, Punjab, Haryana, Chandigarh & Delhi, Uttar Pradesh, east Rajasthan, north Madhya Pradesh, Bihar Gujarat, north Madhya Maharashtra, south Assam, Meghalaya, Nagaland, Manipur, Mizoram, Tripura and coastal and south interior Karnataka and near normal to slightly below normal (by 2-3ºC) over the rest of the mainland.
Maximum Temperatures for week 1: (21st – 27th February, 2020)
In general, above normal day maximum temperatures are likely over Jammu & Kashmir, Ladakh, Himachal Pradesh, Punjab, Haryana, Chandigarh & Delhi, major parts of Rajasthan, north Gujarat, Konkan & Goa, south Uttar Pradesh, northern most Madhya Pradesh, north Chhattisgarh, Odisha, coastal & south interior Karnataka, below normal over remaining pats of India outside Arunachal Pradesh, east Assam, north coastal Andhra Pradesh, south Gujarat, Tamil Nadu, Puducherry, Karaikal and Kerala where near normal to slightly above normal day temperatures are likely to prevail.
Maximum Temperatures for week 2: (28th February – 05th March, 2020)
Above normal day maximum temperatures, in general are likely over Jammu & Kashmir, Ladakh, Himachal Pradesh, Punjab, Haryana, Chandigarh & Delhi, Rajasthan, north Gujarat, Konkan & Goa, Uttar Pradesh and adjoining Bihar, north Madhya Pradesh, parts of Chhattisgarh, Odisha, Arunachal Pradesh, east Assam, coastal & south interior Karnataka and normal to slightly below normal over the rest of the mainland.